Embed Size (px)
Citation preview

Centre for Sustainable Employmentcse.azimpremjiuniversity.edu.in
The Size Structure of India's Enterprises: Not Just the Middle is Missing
Santosh Mehrotra and Tuhinsubhra Giri
CSE Working Paper#25
December 2019

P a g e | 1
The Size Structure of India’s Enterprises: Not just the middle is missing
Santosh Mehrotra1 and Tuhinsubhra Giri2
AbstractDue to the predominance of tiny enterprises and informality in the industrial sector, it is tough toharness the economies of scale, adopt new technologies and regular upgradation. There are manystudies of a missing middle situation in developing economies. One of the essential characteristics offirm size distribution patterns in developing countries is a bimodal distribution with ‘missing middle,’which is widely accepted in development economics (Krueger, 2013). The idea of the missing middleis that there are a large number of small firms, some large firms, but very few medium-sized firms.Here we examine both Formal and informal sector enterprises of India in this paper. Here, weanalyze data from the Annual Survey of Industries (ASI), National Sample Survey (NSS) andEconomic Census(EC) to assess the size structure of the whole industrial sector. Data sources anddefinition related complexities in the size structure of Indian firms have been discussed in detail inthis paper. Informality abounds in India both for workers and firms, which is a well-known fact. Aswell as what even alarming is among all micro enterprises, 84.2 percent are OAEs. Tiny microenterprises’ ability to expand is minimal. Together with units that employ 1-5 workers, OAEs have analmost 97 percent share. We have used ASI and NSS data sources both to demonstrate that there is notonly a missing middle but a missing small category as well. India’s policy regime is also guilty ofworsening the situation. Policy structure should always include all types of firms. This paper tried toexplain those.
Introduction Most international development economics and industrial organization literature emphasizesthe importance of SMEs (small and medium enterprises) as essential to output, but especiallyto employment generation. Countries have different definitions of SMEs. In India, theMSMEs (micro, small and medium enterprises) are defined in terms of investment in plantand machinery or equipment. The MSME Ministry (Annual Report, Government of India2017–18) stated that the sector accounts for 45% of the manufacturing output and 40% of thetotal exports of the country; also, that MSMEs accounted for 30.74% of GDP in 2014–15.Not surprisingly, MSMEs are considered a driving force of the economy.
Due to the predominance of tiny enterprises and informality in the industrial sector, it ischallenging to harness the economies of scale, adopt new technologies and regularupgradation. It is often found that the main challenge for many SMEs is to cultivate the rightskills and management practices for establishing and integrating knowledge created byexternal partners with in-house practices and innovation processes (OECD 2013). Given thateconomies of scale go hand in hand with higher productivity, the predominance of micro-
1 Professor of Economics and Chairperson, Centre for Informal Sector and Labour Studies, JNU, New Delhi; Email Id: [email protected] Ph.D. Scholar, Centre for Informal Sector and Labour Studies, JNU, New Delhi; Email Id: [email protected]

P a g e | 2
enterprises in any economy can prove to be a barrier to growth. There is a body of literatureon firm size distribution in developing countries, which mostly depicts that the ‘missingmiddle’ phenomenon is persistent for firms size distribution in the non-agriculture sector.
There are many studies of a missing middle situation in developing economies. One of theessential characteristics of firm size distribution patterns in developing countries is a bimodaldistribution with ‘missing middle,’ which is widely accepted in development economics(Krueger, 2013). The idea of the missing middle is that there are a large number of smallfirms, some large firms, but very few medium-sized firms.
Dhar and Lydall (1961) were the first to observe missing middle in the data, the thin share ofemployment size class 50 to 499 in Indian manufacturing employment.
Tybout (2000) also finds that a large portion of the small-sized and middle category ismissing in poor countries, and then argues that strict business regulation could be a reason fortoo many small firms. Hsieh and Olken (2014) explained that this is a misconception, andquestioned Tybout’s conclusion. However, Tybout (2014) revisited his study and justified theexistence of a ‘missing middle’ by comparing the size categories of firms. He argued that theshare of medium-sized firms compared to small or large firms is smaller than the share onewould observe in an undistorted economy. The literature on firm size distribution suggests itis reasonable to approximate the undistorted cumulative size distribution as Pareto optimal.Tybout (2014) analyzed the same data of Hsieh and Olken (2014) to understand the sizedistribution of firms. Then, the general tendency toward small scale production in poorcountries can be crudely controlled by allowing the shape parameter k to vary acrosscountries, with a larger value for k implying a smaller size distribution. The value of k in hispaper appeared 1.43 for India, 1.08 for China and US both. That means there is no missingmiddle in China and USA. But India’s medium category is less populated.
Mazumdar (2003) and Mazumdar and Sarkar (2008) also find that the size distribution ofIndian firms is characterized by a dense concentration of tiny enterprises, i.e., micro and a‘missing middle.’ Mazumdar and Sarkar (2013), in their recent comparative study aboutmanufacturing firms in Asia, shows that the size group of 6-49 workers accounts for morethan 55 percent of total non-household manufacturing in 2005. The share of large firms withmore than 500 workers was close to 20 percent, and the remaining 25 percent is the share ofsize group with 50-499 workers in the same year. Another study also estimated that around 85percent of people are employed in enterprises with less than 50 workers including OAEs intotal manufacturing employment pictures (Hasan and Jandoc, 2013). This dualistic sizestructure in manufacturing has remained unchanged over the last two decades. Labourregulation is one of the factors which can affect firm size and distribution pattern. Moreflexible labour regulation tend to go hand in hand with larger sized firms for mostly labor-intensive industries.
However, Nagaraj (2018) has argued that there is no missing middle in India. He only drawsupon organized sector firms’, using data from the Annual Survey of Industries (ASI). We
P a g e | 3
believe it is necessary to take a holistic approach to see the accurate picture of different firmsize categories, both organized as well as unorganized.
The India Wage Report (ILO, 2018) shows that low pay and wage inequality remain a seriouschallenge to India’s path to achieving inclusive growth. Nearly half of the workforce is self-employed in India, which is a source of low earnings. However, stable wage employment(rather than self-employment) is a doorway to the middle class (Banerjee and Duflo 2008).
In this paper, we merged the data of all organized and unorganized firms of India fromdifferent data sources to figure out the exact size of the MSME sector (number of firms by thesize of employment). That will give us a clear idea about the size distribution (micro, small,medium and large) according to the definition of MSMED Act 2006 (provided by theMinistry of MSME). We argue that it’s not only the middle which is missing. Small firms arealso missing from the Indian industrial sector.
The paper is organized as follows. Section 1 spells out the definitions and data sources. Thensection 2 depicts the picture of the size distribution of India’s non-agricultural enterprisestructure -formal and informal both. After that, section 3 presents a discussion about themissing small and medium-sized enterprises and policy issues. Lastly, section 4 offers someconcluding remarks.
1. Data Sources and definitions
We examine both Formal and informal sector enterprises in this paper. To assess the sizestructure of the whole industrial sector, it is necessary to analyze ASI data, Economic Census(EC) data and National Sample Survey (NSS) data. Hence, the data sources for this paper arethe ASI, EC and NSSO unit-level data for the organized and unorganized sector respectively.We use a combined data set that includes formal and informal firms in India. The AnnualSurvey of Industries conducted by the Central Statistical Organisation, Ministry of Statisticsand Programme Implementation (ASI) gathers information on “registered,” or formal sectorfirms that are covered by (Sections 2m(i) and 2m(ii) of) the 1948 Factories Act and firmsregistered in the 1966 Bidi and Cigar Workers Act—particularly (i) those firms that useelectricity and hire more than 10 workers; and (ii) those that do not use electricity butnevertheless employ 20 or more workers. It also covers specific utility industries such aspower, water supply, cold storage, and the like. Units with 100 or more workers are allcounted, and a census of such enterprises is captured in the ASI, as they are entirelyenumerated, while the rest (<100 workers) are sampled. Their survey is based on apredetermined sampling design.
The ASI does not cover unorganized or informal sector firms. NSSO Survey of UnorganisedManufacturing Enterprises includes those, and hence two rounds (2010-11 and 2015-16) havebeen used for our analysis. NSS unorganized surveys are follow-ups to the differentEconomic Censuses. NSS used Economic Census as their sampling frame.
P a g e | 4
When we talked about non-agri enterprises, the construction sector has to be considered aswell. In the last decade, the construction sector jumped high with respect to others. To add upconstruction sector data with above two data sources, EC data will be retrieved for formal andinformal construction enterprises. Construction enterprises are not covered by ASI or NSSunincorporated non-agri enterprise round.
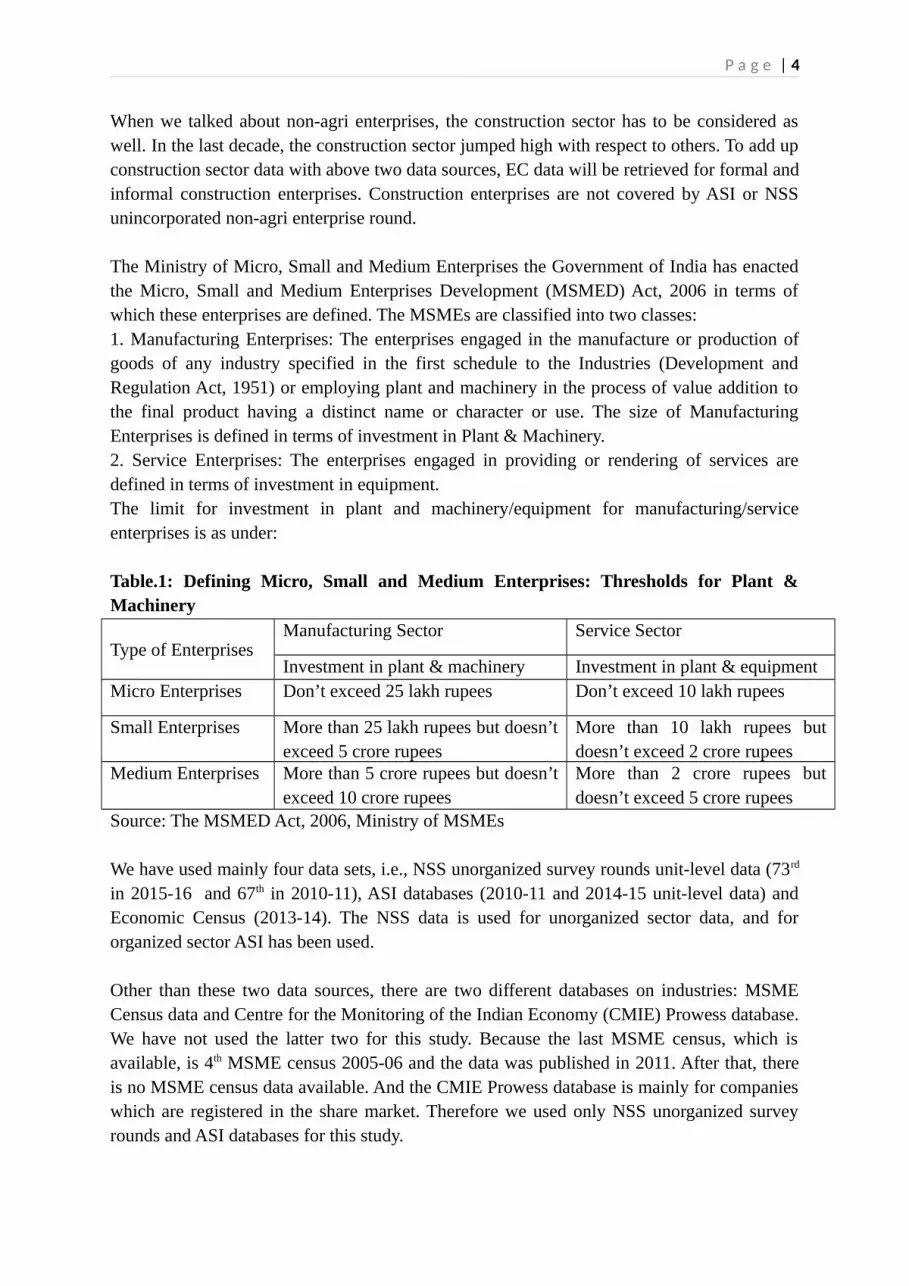
The Ministry of Micro, Small and Medium Enterprises the Government of India has enactedthe Micro, Small and Medium Enterprises Development (MSMED) Act, 2006 in terms ofwhich these enterprises are defined. The MSMEs are classified into two classes:1. Manufacturing Enterprises: The enterprises engaged in the manufacture or production ofgoods of any industry specified in the first schedule to the Industries (Development andRegulation Act, 1951) or employing plant and machinery in the process of value addition tothe final product having a distinct name or character or use. The size of ManufacturingEnterprises is defined in terms of investment in Plant & Machinery.2. Service Enterprises: The enterprises engaged in providing or rendering of services aredefined in terms of investment in equipment.The limit for investment in plant and machinery/equipment for manufacturing/serviceenterprises is as under:
Table.1: Defining Micro, Small and Medium Enterprises: Thresholds for Plant &Machinery
Type of EnterprisesManufacturing Sector Service Sector
Investment in plant & machinery Investment in plant & equipmentMicro Enterprises Don’t exceed 25 lakh rupees Don’t exceed 10 lakh rupees
Small Enterprises More than 25 lakh rupees but doesn’texceed 5 crore rupees
More than 10 lakh rupees butdoesn’t exceed 2 crore rupees
Medium Enterprises More than 5 crore rupees but doesn’texceed 10 crore rupees
More than 2 crore rupees butdoesn’t exceed 5 crore rupees
Source: The MSMED Act, 2006, Ministry of MSMEs
We have used mainly four data sets, i.e., NSS unorganized survey rounds unit-level data (73rd
in 2015-16 and 67th in 2010-11), ASI databases (2010-11 and 2014-15 unit-level data) andEconomic Census (2013-14). The NSS data is used for unorganized sector data, and fororganized sector ASI has been used.
Other than these two data sources, there are two different databases on industries: MSMECensus data and Centre for the Monitoring of the Indian Economy (CMIE) Prowess database.We have not used the latter two for this study. Because the last MSME census, which isavailable, is 4th MSME census 2005-06 and the data was published in 2011. After that, thereis no MSME census data available. And the CMIE Prowess database is mainly for companieswhich are registered in the share market. Therefore we used only NSS unorganized surveyrounds and ASI databases for this study.

P a g e | 5
Sometimes there is confusion about enterprises under formal/registered sector andinformal/unorganized sector. We should clarify that the Unorganised sector is not entirelyoverlapping with what is called the unregistered sector. In the NSS unorganized surveyrounds, some enterprises can be small registered enterprises under the Shops andEstablishment Act, or the Municipal corporation/Panchayat/local body, VAT/sales tax,Employee Provident Fund Act, the Employees State Insurance Corp. Act, and/or registeredwith SEBI/stock exchanges and any other specific act or authorities. So, the unorganizedsector consists of mostly unregistered enterprises and some registered enterprises under someparticular act or authorities other than Factories Act (which are being captured under theASI). Firms captured under the ASI, on the other hand, are all registered/formal firms underSections 2m(i) and 2m(ii) of the 1948 Factories Act and firms registered in the 1966 Bidi andCigar Workers Act—particularly (i) those firms that use electricity and hire more than 10workers; and (ii) those that do not use electricity but nevertheless employ 20 or moreworkers. Therefore, it is evident that there is no overlapping or double counting between NSSand ASI datasets.
The National Sample Survey Rounds on the Unorganized SectorWe use two different rounds of the NSS specific survey that examines the unorganized sector.The specifics of these two rounds are explained in Table 2.
Table 2: NSS unorganized sector rounds: 73rd (2015-16) and 67th (2010-11) NSS rounds Brief data handling remarks 73rd unorganized enterprise round 2015-16 Total number of enterprises 63 million
In this round, NSS provided data on
investment in plant & machinery and did itfor each of the MSME categories in thedataset for the first time.
67th unorganized enterprise round 2010-11 The total number of enterprises is 57 million. MSME categorization is not given in the
database To enable us to analyze trends about the size
structure of enterprises between 2011 and2016, we had to categorize the enterprises.So we have used the investment in plant andmachinery variables for both manufacturingand services sector firms.
Though according to MSME definition for
manufacturing firms, plant and machineryshould be considered and for services firms,plant and equipment should be considered.However, plant and equipment variables arenot available in the dataset of 2010-11, so wehave used plant & machinery for all themanufacturing and services enterprises.
P a g e | 6
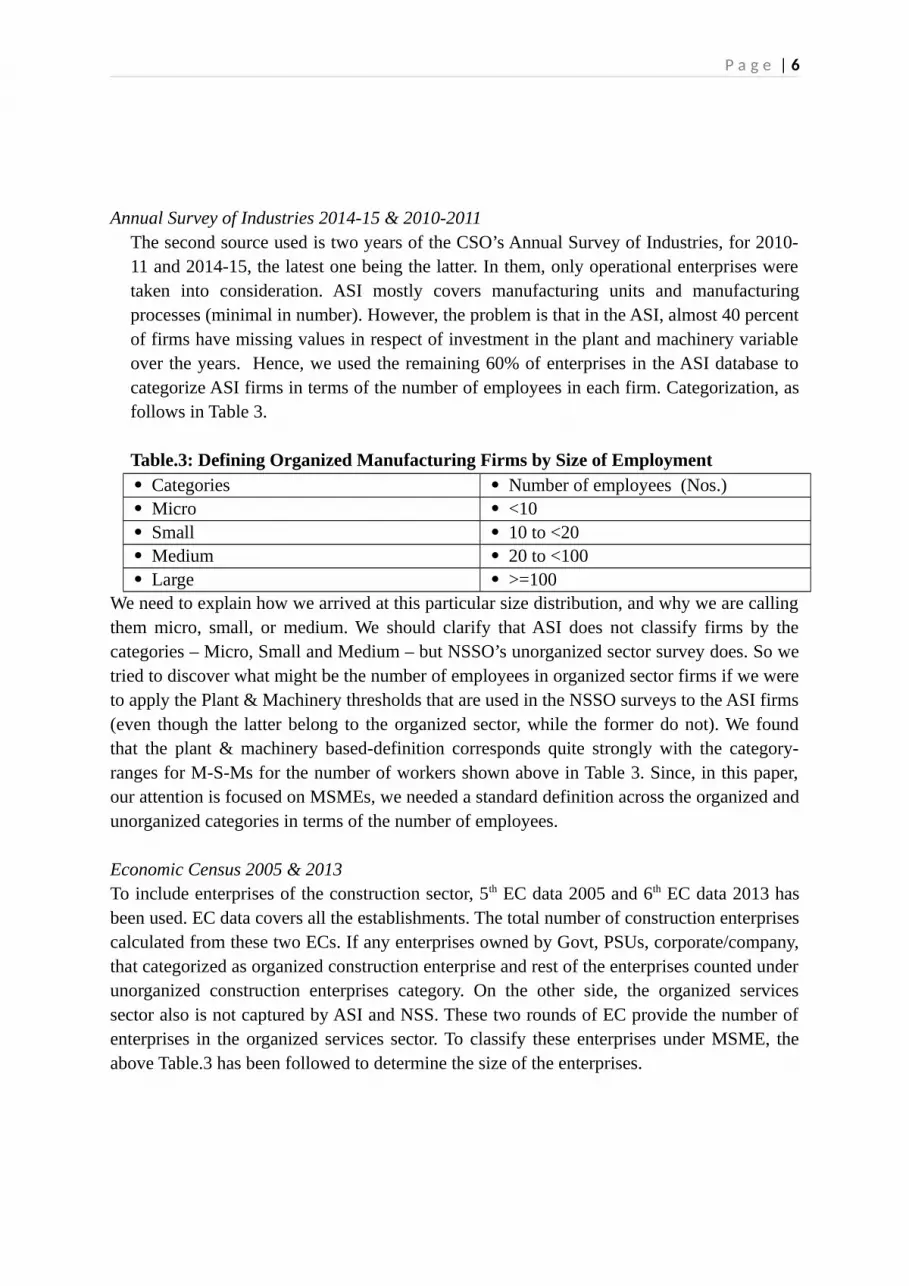
Annual Survey of Industries 2014-15 & 2010-2011The second source used is two years of the CSO’s Annual Survey of Industries, for 2010-11 and 2014-15, the latest one being the latter. In them, only operational enterprises weretaken into consideration. ASI mostly covers manufacturing units and manufacturingprocesses (minimal in number). However, the problem is that in the ASI, almost 40 percentof firms have missing values in respect of investment in the plant and machinery variableover the years. Hence, we used the remaining 60% of enterprises in the ASI database tocategorize ASI firms in terms of the number of employees in each firm. Categorization, asfollows in Table 3.
Table.3: Defining Organized Manufacturing Firms by Size of Employment Categories Number of employees (Nos.) Micro <10 Small 10 to <20 Medium 20 to <100 Large >=100
We need to explain how we arrived at this particular size distribution, and why we are callingthem micro, small, or medium. We should clarify that ASI does not classify firms by thecategories – Micro, Small and Medium – but NSSO’s unorganized sector survey does. So wetried to discover what might be the number of employees in organized sector firms if we wereto apply the Plant & Machinery thresholds that are used in the NSSO surveys to the ASI firms(even though the latter belong to the organized sector, while the former do not). We foundthat the plant & machinery based-definition corresponds quite strongly with the category-ranges for M-S-Ms for the number of workers shown above in Table 3. Since, in this paper,our attention is focused on MSMEs, we needed a standard definition across the organized andunorganized categories in terms of the number of employees.
Economic Census 2005 & 2013To include enterprises of the construction sector, 5th EC data 2005 and 6th EC data 2013 hasbeen used. EC data covers all the establishments. The total number of construction enterprisescalculated from these two ECs. If any enterprises owned by Govt, PSUs, corporate/company,that categorized as organized construction enterprise and rest of the enterprises counted underunorganized construction enterprises category. On the other side, the organized servicessector also is not captured by ASI and NSS. These two rounds of EC provide the number ofenterprises in the organized services sector. To classify these enterprises under MSME, theabove Table.3 has been followed to determine the size of the enterprises.

P a g e | 7
2. India’s Non-agricultural Enterprise Structure:Formal & Informal MSMEs
Over 1950 to 1980, slow GDP growth pace was accompanied by a growth strategy dependentupon heavy-industry first, combined with reservation of products for small firms to generateemployment. The set of products reserved for small enterprises had grown and consisted ofmore than 1200 products at the beginning of reform in 1991. Over the years the number ofreserved products was reduced to 500 by 2005, but it took more than fifty years to end this.This has led to the emergence of underdeveloped informal firms and employing informalworkers, all operating in a low-level equilibrium trap of low wages –low-technology-lowproductivity (Mehrotra, 2020). On the other side, too many labour laws for organized orformal sector firms did not help; hardly any rules applied to the unorganized sector. This kindof phenomenon lowered the demand for workers in the formal sector.
Labour laws and regulations of India are very complicated for firms. When any firms go fromsix workers to seven workers, the Trade Workers Act kicks in. When this number goes fromnine to ten, the Factories Act is to be implemented. When firms go from 19 to 20 workers, theEmployees Provident Fund Act kicks in, and if the firm adds one more worker after 99 andgoes to 100 workers, the Industrial Disputes Act gets triggered. The Industrial Disputes Actsays that if you are a manufacturing firm with 100 workers or more, you cannot dismiss anyof them under any circumstances unless you get prior approval from the state government.This is rarely given and it applies even if you go bankrupt, in which case the firm still has topay the workers. This is an additional reason why Indian firms have remained so small onaverage (Panagariya, 2013).
In this study, we tried to capture the whole picture of the formal and informal sectors. Table4 presents the total universe of India’s non-agricultural enterprises. In Indian parlance,enterprises that employ less than 10 workers are considered as unorganized sector units. Andthose employing more than 10 workers are regarded as organized. What jumps out at thereader is the scale of informality among India’s enterprise structure. India has 63.56 mnenterprises, informal (unorganized) and formal (organized) taken together in the non-agricultural economy. Around 30 percent of enterprises are registered in both years (2015-16and 2010-11) under any act or authority. There is no change in the share of registeredenterprises in the informal sector over the years.
Another finding from Table 4 is that 96.1 & 96.7 percent of enterprises are in theunorganized sector in 2010-11 and 2015-16, respectively. The share of unorganizedenterprises in 2015-16 shows a slight increase in number, which may not a very promisingpicture. Of these two-thirds are not registered anywhere – which is a severe problem from theperspective of the policymaker, since that makes it challenging to extend services to them ifthe state was desirous to do so.
What is most notable is how small is the total number of organized / formal sector firms: only3.86 percent and 3.34 percent only in 2010-11 and 2015-16, respectively. The well-known

P a g e | 8
fact is that the informal sector is much bigger than the registered sector. Therefore, this studylater on focuses mainly on the informal sector size distribution of MSMEs. One could arguethat India’s informal sector is the backbone of the economy after agriculture. Table.4: Total Number of Enterprises in the organised and unorganized sector in 2010-11 & 2015-16
Sectors Number of Enterprises
(Nos.)Share (%)
2010-11 2015-16 2010-11 2015-16
UnorganizedManufacturing,
Services (NSS) &Construction
(EC)
Registered under any act/authority
1,68,26,639
1,95,92,554
28.86 30.30
Not registered under any act/ authority
4,08,46,606
4,37,99,421
70.05 67.73
Construction (EC) 634466 1276862 1.09 1.97
Total5,83,07,71
16,46,68,83
7100 100
Organized
Manufacturing: Registered under Factories act, companies act or other (ASI)*/ Formal
159957 1,65,632 6.84 7.41
Services (EC) 2173193 2061310 92.87 92.18Construction (EC) 7010 9244 0.30 0.41Total 23,40,160 22,36,186 100 100
Total Unorganised 96.1 96.7Total Organised 3.86 3.34Total Unorganised & Organised
6,06,47,871
6,69,05,023
100 100
Source: Annual Survey of Industry Unit level data of 2014-15, Annual survey of Industry Unit level data of2010-11, 73rd round NSSO Unincorporated Non-Agricultural Enterprises (Excluding Construction) Survey2015-16 unit-level data & 67th NSS Unincorporated Non-Agricultural Enterprises (Excluding Construction)survey 2010-11 unit level data and 5th Economic Census 2005 & 6th Economic Census 2013
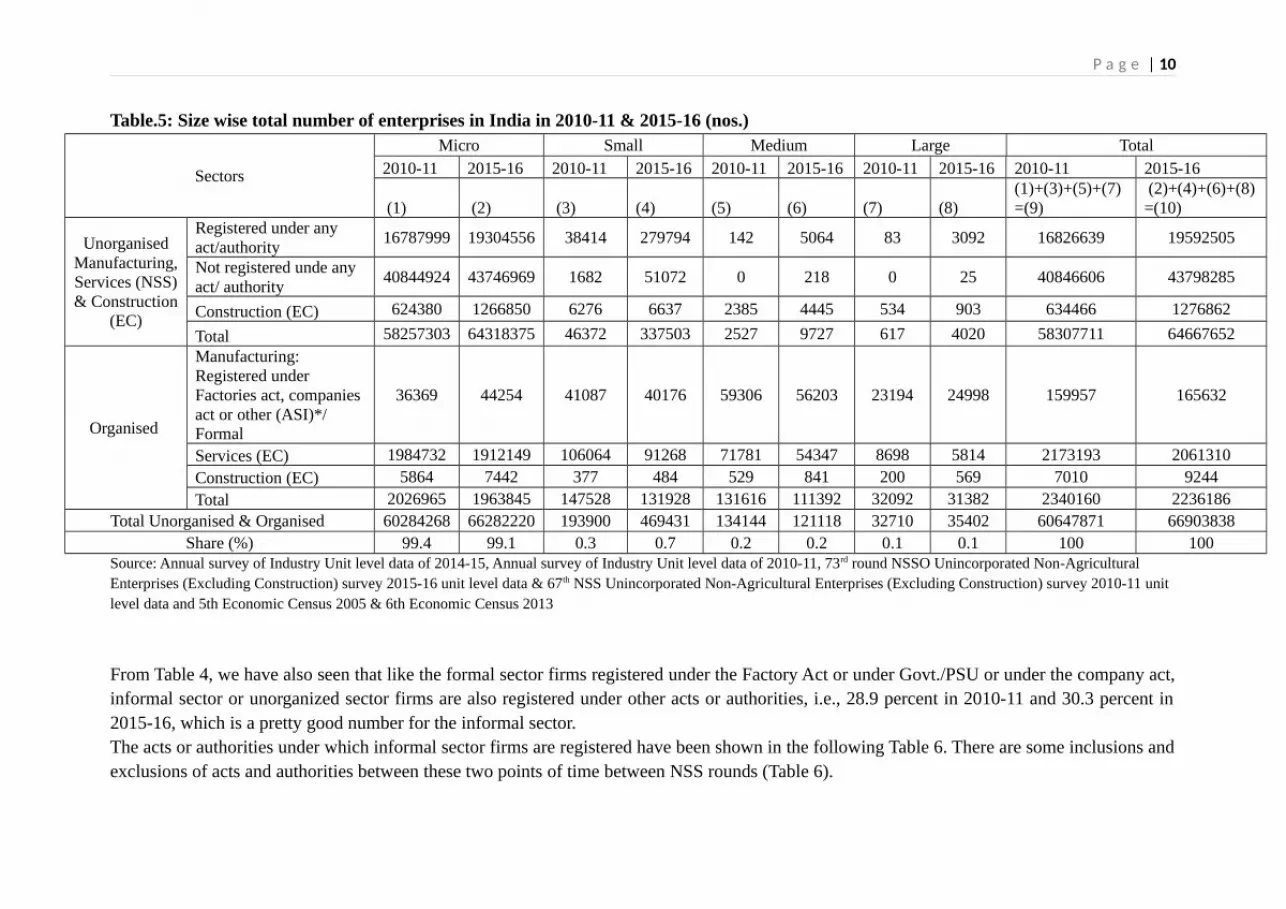
Table 5 shows the size of the formal and informal sectors according to MSME categories.The micro enterprises share and numbers are overwhelmingly large. What we do know(though not shown in the table) is that 84% of the micro-enterprises are own-accountenterprises (OAEs), without hired labour, or let us say household enterprises. An estimated93% of the micro-enterprises have less than 5 employees.
There is a nearly 8x increase in the number of small enterprises in the unorganized units(Table 5). Within unorganized units, the number of small enterprises in 2010-11 and 2015-16does increase quite sharply in absolute terms, both among the registered as well as theunregistered in the unorganized manufacturing and services sector. At the same time, thenumber of unorganized construction enterprises shows us a negligible increase between thisperiod. But their share is still marginal in 2015-16, as it was in 2010-11: from 0.3 to0.7percent of all enterprises.
P a g e | 9
Of the 66.9 mn MSMEs, barely 0.59 mn are small and medium. Naturally, their contributionwould be very limited in the growth story. What is notable is that between 2010-11 and 2015-16, the number of registered (under Factories Act) manufacturing units and services unitsare small have shrunk slightly, as have medium-sized enterprises. While the number oforganized construction enterprises exhibits a marginal increase.However, the small firmsamong the unregistered unorganized sector just exploded in numbers, from 1682 to 51072over the same period. But at the same time, the small unorganized units which are registeredunder any Act/authority also increased from 38414 to 279794. The increase in number overjust five years is too significant to be explicable. So, we found, on careful examination, thatthe number of acts under which registration was permitted had increased between 2010-11and the 2015-16 NSS Surveys. This is what explains the unprecedented rise in the registeredcategory (see Table 6 for Acts, and Annex 1 table for the list of additional Acts under whichregistration is permitted), though not in the case of unregistered category. This sharp riseneeds further investigation before it can be explained.
Medium enterprises have also seen a rise, but that rise seems reasonable, even though it ishighly likely that the sharp increase among small enterprises that we see between the twoperiods in the ‘registered’ category is also massive. This too is likely to have happened due tonew acts being included. It is notable that for registered enterprises under the Factories Act(based on data from the Annual Survey of Industries), there is a fall in the number ofenterprises. But, there is a surge in the number of unorganized and organized constructionenterprises. If we examine the registered manufacturing firms under the Factories Act, there is somegrowth. However, here too, the increase in the number of firms is accounted for by microfirms, not the small or medium categories. Organized services units show us some reducednumber of enterprises in 2015-16 than in 2010-11. But the number of construction enterprisesincreased over the years for all MSME categories. If anything, small and medium firmsshrink in number over those five years. The number of large firms grows only a little. Table 4 depicts the whole picture of the size distribution of MSMEs, both formal andinformal sectors. The size distribution of formal sector firms is nearly normally distributed.In contrast, informal sector size distribution is distinctly skewed to the left, with aconcentration of micro firms. In 2015-16, the share of registered organised sector firms fromTable 4 was only 3.34 percent and informal sector firms account for 96.7 percent share of allfirms. The registered formal sector firms have been analyzed in several studies, but informalfirms have been overlooked. Informal firms’ size distribution should be analyzed moreclosely.
P a g e | 10
Table.5: Size wise total number of enterprises in India in 2010-11 & 2015-16 (nos.)
Sectors
Micro Small Medium Large Total2010-11 2015-16 2010-11 2015-16 2010-11 2015-16 2010-11 2015-16 2010-11 2015-16
(1) (2) (3) (4) (5) (6) (7) (8) (1)+(3)+(5)+(7)=(9)
(2)+(4)+(6)+(8)=(10)
UnorganisedManufacturing,Services (NSS)& Construction
(EC)
Registered under any act/authority
16787999 19304556 38414 279794 142 5064 83 3092 16826639 19592505
Not registered unde any act/ authority
40844924 43746969 1682 51072 0 218 0 25 40846606 43798285
Construction (EC) 624380 1266850 6276 6637 2385 4445 534 903 634466 1276862
Total 58257303 64318375 46372 337503 2527 9727 617 4020 58307711 64667652
Organised
Manufacturing: Registered under Factories act, companies act or other (ASI)*/ Formal
36369 44254 41087 40176 59306 56203 23194 24998 159957 165632
Services (EC) 1984732 1912149 106064 91268 71781 54347 8698 5814 2173193 2061310Construction (EC) 5864 7442 377 484 529 841 200 569 7010 9244Total 2026965 1963845 147528 131928 131616 111392 32092 31382 2340160 2236186
Total Unorganised & Organised 60284268 66282220 193900 469431 134144 121118 32710 35402 60647871 66903838Share (%) 99.4 99.1 0.3 0.7 0.2 0.2 0.1 0.1 100 100
Source: Annual survey of Industry Unit level data of 2014-15, Annual survey of Industry Unit level data of 2010-11, 73rd round NSSO Unincorporated Non-Agricultural Enterprises (Excluding Construction) survey 2015-16 unit level data & 67th NSS Unincorporated Non-Agricultural Enterprises (Excluding Construction) survey 2010-11 unit level data and 5th Economic Census 2005 & 6th Economic Census 2013
From Table 4, we have also seen that like the formal sector firms registered under the Factory Act or under Govt./PSU or under the company act,informal sector or unorganized sector firms are also registered under other acts or authorities, i.e., 28.9 percent in 2010-11 and 30.3 percent in2015-16, which is a pretty good number for the informal sector. The acts or authorities under which informal sector firms are registered have been shown in the following Table 6. There are some inclusions andexclusions of acts and authorities between these two points of time between NSS rounds (Table 6).

P a g e | 11
Table.6: Registration Act/ authorities of unorganized firms
Particulars Number of Enterprises
2010-11 2015-16Shops and Establishment Act 3772223 4270136Municipal Corporation/Panchayats/ Local Body 9904106 12678481Vat /Sales Tax Act 1830626 2383199Provident Fund Act 72974 91159Employees State Insurance Corporation Act 64720 61390Registered with SEBI/ Stock Exchange? 13039any other industry-specific Act/ Authority 1181990 95150Total registered 16826639 19592554Total unregistered 40846606 43799421Total 57673245 63391974Source: 73rd round NSSO Unincorporated Non-Agricultural Enterprises (Excluding Construction) survey 2015-16 unit-level data & 67th NSS Unincorporated Non-Agricultural Enterprises (Excluding Construction) survey 2010-11 unit-level data*Any other industry-specific Act/ Authorities are depicted in Annexure Table
Registration under these acts or authorities of informal sector firms is a mere formality, not particularly useful. It is also not synonymous withformalization. These acts or bodies only register about 30 percent of the unorganized firms. Formalization under Factory Act registration tends toassure social security benefits and other benefits in the firms. But registration under these other acts or authorities is only for a simpleregistration, but the firms remain the same as before such registration. Some small incentives for any State/ Central Government exhibitions orfairs, early access of benefits from any government schemes and availing credit from banks can be gained by these types of registration ofinformal firms (a subject we return to in the last section).
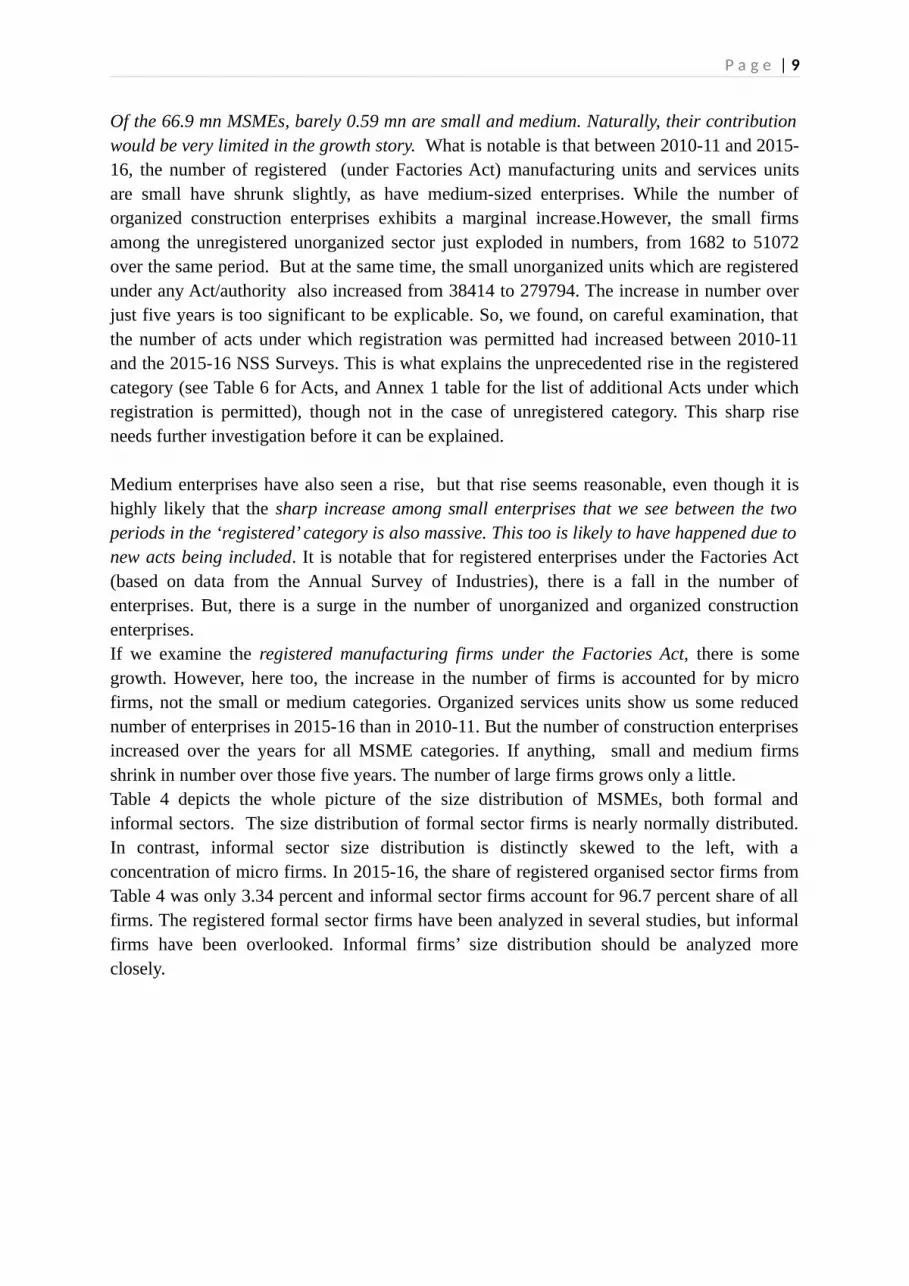
Rather than considering about bimodal distribution of missing middle from earlier literature, it is better to measure the share of the small andmedium-sized firms as opposed to micro and large firms. The following figure 1 depicts several hypothetical plant size distributions that showthe notion of missing small and middle. The solid line indicates an undistorted ideal firm size distribution of developing economies and thedotted line exhibits the missing small and medium-sized firms in India. The dotted line depicts the preponderance of micro firms, but it can beseen that small and medium categories are missing from the picture.

P a g e | 12
Figure.1: A hypothetical illustration of missing small and medium-sized firms in the distribution
Missing Small and Medium Sized Firms
Ideal Firm Distribution India's Firm Distribution
x
f(x)
Productivity of firms: registered versus unorganized
There are significant productivity differences between small and large establishments. Technical change and returns to scale can be the factorsfor productivity differentials between these two (Taymaz, 2002). Productivity is one of the leading indicators of performance. In Table 7, we cansee that formal sector firms have higher productivity compared to informal ones. Micro formal firms have higher productivity than informalones. The larger the firm, the higher is the productivity.
Table.7: Average productivity of organised and unorganised firms in 2010-11 & 2015-16 (in Rupees per worker)

P a g e | 13
Type of Firms Average Productivity
Formal (ASI) Informal (NSS)2014-15 2010-11 2015-16 2010-11
Micro 517046 423692 86700 60544Small 363091 322278 237617 227340Medium 515499 390445 302148 204050Large 664897 610926 308089 275503Total 540007 411811 91728 61091Source: Annual Survey of Industries, Unit level data of 2014-15 and 2010-11, 67th and 73rd round NSSO Unincorporated Non-Agricultural Enterprises (Excluding Construction) survey 2015-16 unit-level data Note:- Productivity calculated as GVA divided by the number of workers. GVA and productivity calculations have been done after deflating the figures with WPI values (2011-12=100 as the base)
What is noticeable is that formal micro firms have higher productivity than the larger firms in the formal sector. This needs an explanation. Onepossible reason is that micro firms are particularly inclined to understate the number of their workers. They are unlikely to be inspected oraudited, given how numerous they are. So the reported numbers in micro firms listed in the ASI might be much smaller than the actual numberof employees working in the enterprise.
2.1. Own Account Enterprises and Other Categories
Own account Enterprises (OAEs) comprise of tiny firms which are not even hiring one worker. A significant portion of unorganized/informalsector firms is OAEs. The share of OAEs is vital since it can guide policies on employment generation and industrial development. It can alsohelp to determine whether the emphasis of policy should be on micro-enterprises grow or on the hurdles to operating larger enterprises (Mel,McKenzie, and Woodruff, 2008).
In Table 8, we find that in urban areas, OAEs are 76.8 percent of all firms in 2010-11 and 76.6 percent of firms in 2015-16, while the OAEs are91.4% of all rural firms. No change was seen as just over 84.6 percent in 2015-16 are OAEs. This predominance of OAEs in rural and urban isthe underlying symptom of, and a reason for, the widespread poverty in the country.

P a g e | 14
Table.8: Unorganized/ informal sector: Share of Own account enterprises (OAE) in total enterprises by rural and urban location, 2010-11 & 2015-16
SectorsOAE (nos.) Total (nos.) Share (%)
2010-11 2015-16 2010-11 2015-16 2010-11 2015-16
Rural28,245,99
829,695,86
130,891,07
432,489,67
0 91.4 91.4
Urban 20,564,42
823,663,44
626,782,17
130,902,30
5 76.8 76.6
Total48,810,42
653,359,30
857,673,24
563,391,97
4 84.6 84.2Source: 67th and 73rd round NSSO Unincorporated Non-Agricultural Enterprises (Excluding Construction) survey 2015-16 unit-level data
OAE’s high share led us to examine the sector according to the number of workers. We have categorized the unorganized sector firms into fourcategories, i.e., OAEs, firms having 1-5 workers (non-directory establishment), firms having 6-9 workers (directory establishment) and firmshaving 10 & more workers. Other than OAEs, firms are found mostly in the category that employs 1-5 workers, i.e., 12.6 & 13.3 percent in2010-11 & 2015-16, respectively. A slight increase is seen in the type of firms having 1-5 workers.
The above table is prepared with the given definition of the Ministry of MSME. NSS also earlier gave these two groups in the dataset, i.e., non-directory establishment and directory establishment. So Table 9 has been computed in terms of the size of the employment. But there is not muchdifference in the picture as the share of firms in these categories has not changed much between 2010-11 to 2015-16. A slight increase in theshare of OAEs and enterprises having 1-5 workers has been seen over the period.
Table.9: Non-Agricultural enterprises in Unorganized sector: Size distribution by Number of firms, 2010-11 and 2015-16
Firm categories2010-11 2015-16
No. of firms (nos.) Share % No. of firms (nos.) Share %OAE 48985940 84.0 54710295 84.61-5 workers 7572679 13.0 8740210 13.56-9 workers 1069437 1.8 1122717 1.710 & more workers 556739 1.0 561692 0.9

P a g e | 15
Total 58307711 100 64668836 100Source: 67th and 73rd round NSSO Unincorporated Non-Agricultural Enterprises (Excluding Construction) survey, 2010-11 and 2015-16 unit-level data, and 5th Economic Census 2005 & 6th Economic Census 2013Notes: Units that employ more than 10 workers but not use electricity and are not registered under the Factories Act 1948 are still regarded as unorganized firms.
The phenomenon of missing small and medium-sized firms can be seen from Table 10 also. The 69.9 million OAEs in 2010-11 and 70.5 millionOAEs in 2015-16 account for 63.8 percent in 2010-11 and 61.8 percent share of workers in 2015-16. Firms in the 10 & more workers and 6-9workers category account for only 15 percent of the total employment of the unorganized non-agriculture sector. It is quite evident from Table 10that OAEs and non-directory firms employed nearly 85 percent of the total employed persons in the non-agriculture unorganized sector. Missingsmall and medium firms is one of the reasons for this kind of asymmetry. In India, the self-employed/ OAEs have formed the majority of theworkforce and are the most prominent of the informally employed. Given the ease of entry into such activities and the unavailability of formalemployment, it is not surprising that self-employment was the most prevalent economic activity.
Table.10: Non-agricultural enterprises in Unorganized sector: Size distribution of firms by Number of workers, 2010-11 & 2015-16
Firm categories2010-11 2015-16
No. of workers (nos.) Share % No. of workers (nos.) Share %OAE 69975514 63.8 70450987 61.81-5 workers 21775489 19.9 25043218 22.06-9 workers 7565950 6.9 7872639 6.910 & more workers 10218965 9.3 11072178 9.7Total 109674741 100 113936871 100Source: 67th and 73rd round NSSO Unincorporated Non-Agricultural Enterprises (Excluding Construction) survey, 2010-11 and 2015-16 unit-level data, and 5th Economic Census 2005 & 6th Economic Census 2013
2.2. Wages and Earnings of the Workers in Different Categories of Enterprises

P a g e | 16
The most exciting aspect of trends in informal employment is the gradual growth in enterprise-based informality. Almost 80 percent of jobscreated between 1999-2000 and 2011-12 were generated by unorganized enterprises and the majority of jobs were informal. Informalemployment in the formal sector was also rising over the period (Rosa, 2016 ).
The increase in informal employment is as much a cause as it is a symptom of how the benefits of economic growth in India have bypassed themajority of its population. This is unlike the experience of China where economic growth has been accompanied by an increase in medium andlarge scale units that provide formal employment to its workers (Ghose, 2014; Majid, 2015). India’s high chronic informality in labour marketsince the 1980s created more temporary workers, contract workers, subcontracting practices (Goldar, 2010) and self-employed jobs.
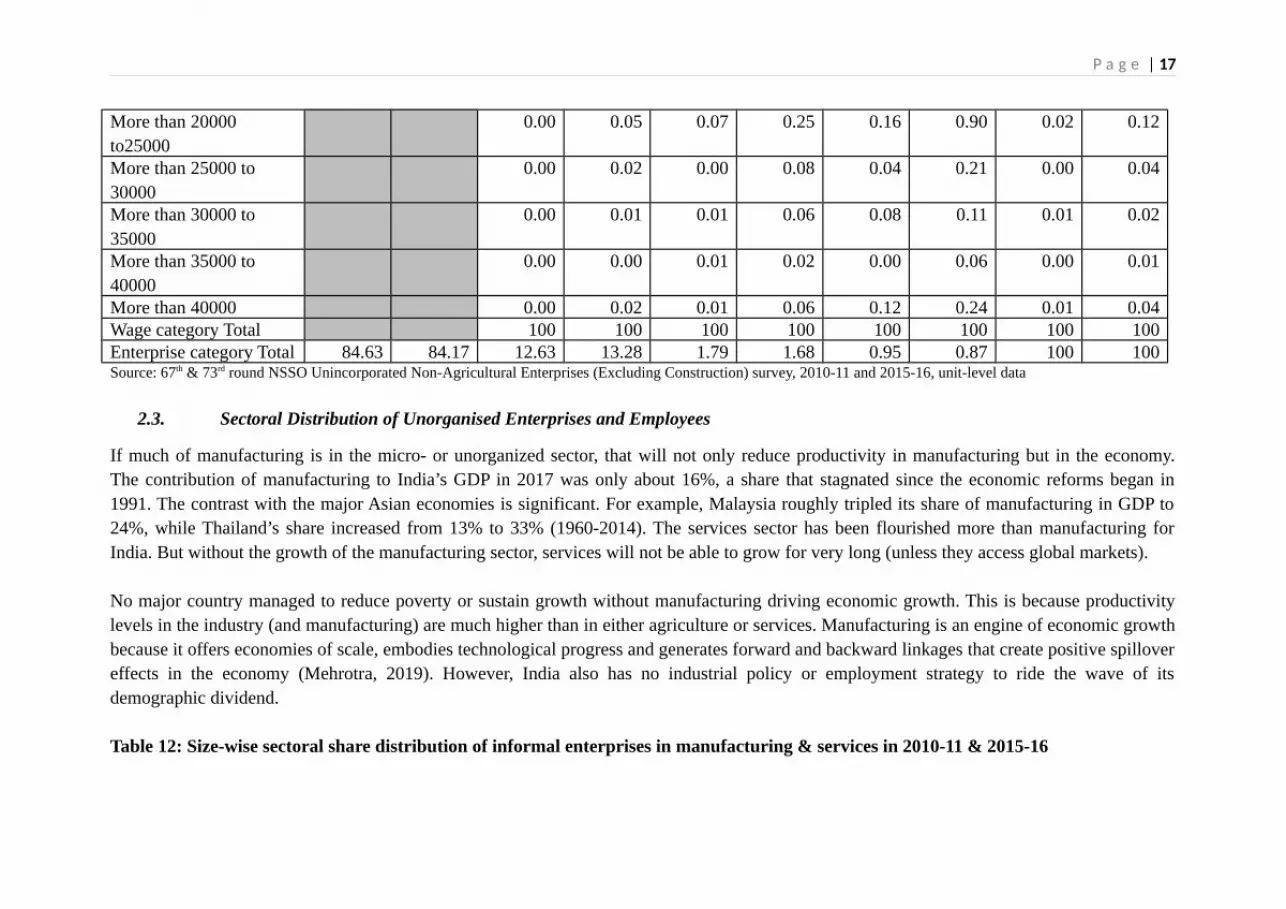
Low and stagnant wage is also one of the main reasons for this situation. In Table 11, we can observe that first, the majority of units earn lessthan Rs 5000 per month. Second, there are hardly any units in the >10 workers category where workers earn more than Rs 10 000 per month.Non-directory establishment(1-5 workers), directory establishments (6-9 workers) and 10 & more workers are mostly receiving monthly averagewage upto 5000 rupees in 2010-11. Third, by 2015-16 the scenario has changed significantly. The share of unorganized forms where earnings areas low as Rs 5000 or less falls sharply to 80% from 96%. Fourth, the percentage of those earning Rs 5000 to 10 000 pm rises from 4 to 18%. Ifsmall and medium-sized firms are in goods numbers, they can play the role of the savior by hiring more and giving higher wages.
Table.11: Unorganized Sector: Monthly average wages & allowances per worker, by the size distribution of enterprises, 2010-11 & 2015-16 Monthly average wage,
salaries & otherallowances per worker
(Rs.)
OAE (ownearnings)
1-5 workers 6-9 workers 10 & more workers Total
2010-11 2015-16 2010-11 2015-16 2010-11 2015-16 2010-11 2015-16 2010-11 2015-16
Upto 5000 98.11 84.76 87.46 56.32 81.49 45.66 95.85 79.60More than 5000 to 10000 1.80 14.08 11.28 36.56 16.27 43.11 3.80 18.06More than 10000 to 15000
0.06 0.89 0.92 5.76 1.45 7.79 0.25 1.79
More than 15000 to 20000
0.02 0.16 0.24 0.89 0.38 1.92 0.07 0.33
P a g e | 17
More than 20000 to25000
0.00 0.05 0.07 0.25 0.16 0.90 0.02 0.12
More than 25000 to 30000
0.00 0.02 0.00 0.08 0.04 0.21 0.00 0.04
More than 30000 to 35000
0.00 0.01 0.01 0.06 0.08 0.11 0.01 0.02
More than 35000 to 40000
0.00 0.00 0.01 0.02 0.00 0.06 0.00 0.01
More than 40000 0.00 0.02 0.01 0.06 0.12 0.24 0.01 0.04Wage category Total 100 100 100 100 100 100 100 100Enterprise category Total 84.63 84.17 12.63 13.28 1.79 1.68 0.95 0.87 100 100Source: 67th & 73rd round NSSO Unincorporated Non-Agricultural Enterprises (Excluding Construction) survey, 2010-11 and 2015-16, unit-level data
2.3. Sectoral Distribution of Unorganised Enterprises and Employees
If much of manufacturing is in the micro- or unorganized sector, that will not only reduce productivity in manufacturing but in the economy.The contribution of manufacturing to India’s GDP in 2017 was only about 16%, a share that stagnated since the economic reforms began in1991. The contrast with the major Asian economies is significant. For example, Malaysia roughly tripled its share of manufacturing in GDP to24%, while Thailand’s share increased from 13% to 33% (1960-2014). The services sector has been flourished more than manufacturing forIndia. But without the growth of the manufacturing sector, services will not be able to grow for very long (unless they access global markets).
No major country managed to reduce poverty or sustain growth without manufacturing driving economic growth. This is because productivitylevels in the industry (and manufacturing) are much higher than in either agriculture or services. Manufacturing is an engine of economic growthbecause it offers economies of scale, embodies technological progress and generates forward and backward linkages that create positive spillovereffects in the economy (Mehrotra, 2019). However, India also has no industrial policy or employment strategy to ride the wave of itsdemographic dividend.
Table 12: Size-wise sectoral share distribution of informal enterprises in manufacturing & services in 2010-11 & 2015-16
P a g e | 18
Source: 67th and 73rd round NSSO Unincorporated Non-Agricultural Enterprises (Excluding Construction) survey, 2010-11 and 2015-16. Estimated from unit level data
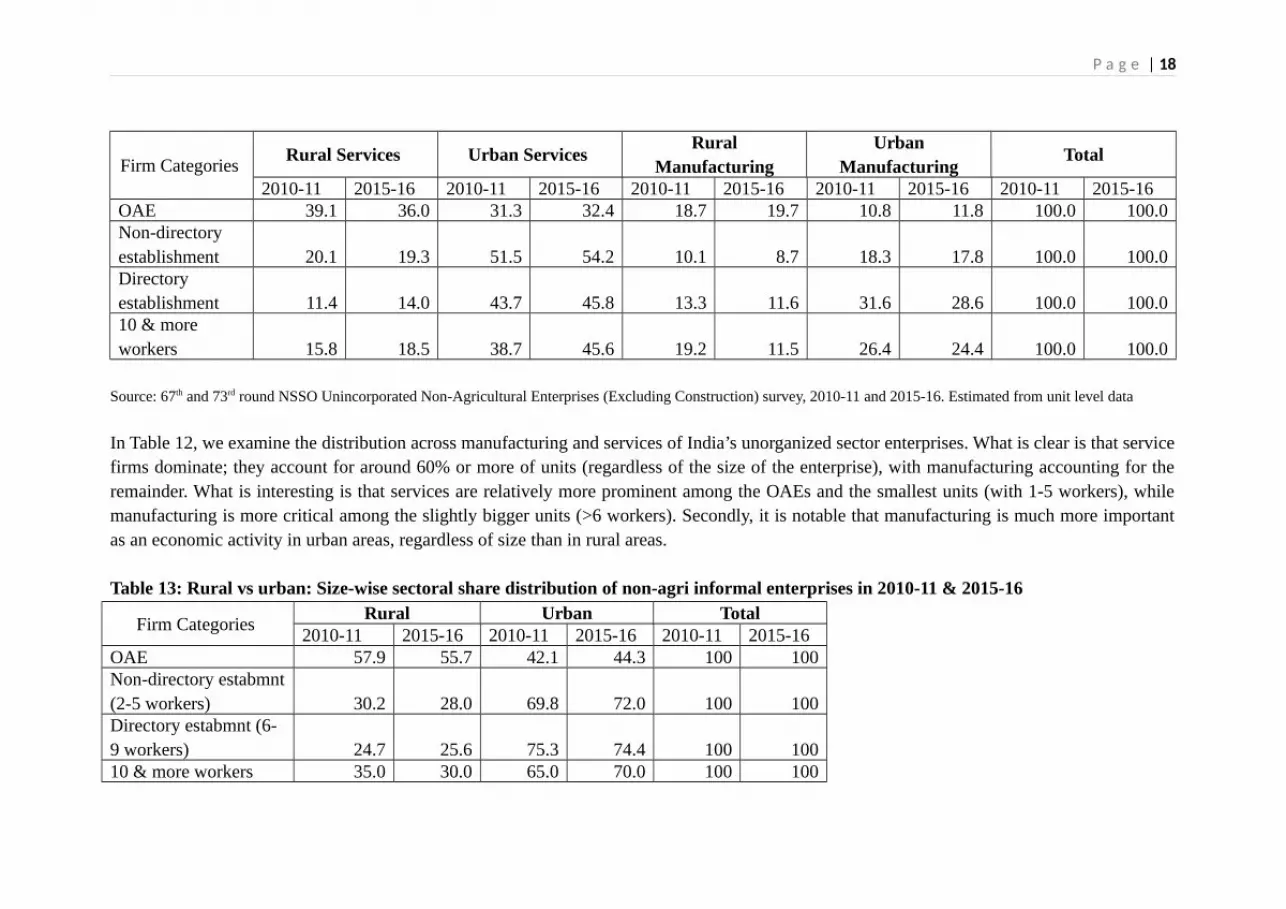
In Table 12, we examine the distribution across manufacturing and services of India’s unorganized sector enterprises. What is clear is that servicefirms dominate; they account for around 60% or more of units (regardless of the size of the enterprise), with manufacturing accounting for theremainder. What is interesting is that services are relatively more prominent among the OAEs and the smallest units (with 1-5 workers), whilemanufacturing is more critical among the slightly bigger units (>6 workers). Secondly, it is notable that manufacturing is much more importantas an economic activity in urban areas, regardless of size than in rural areas.
Table 13: Rural vs urban: Size-wise sectoral share distribution of non-agri informal enterprises in 2010-11 & 2015-16
Firm Categories Rural Urban Total
2010-11 2015-16 2010-11 2015-16 2010-11 2015-16OAE 57.9 55.7 42.1 44.3 100 100Non-directory estabmnt(2-5 workers) 30.2 28.0 69.8 72.0 100 100Directory estabmnt (6-9 workers) 24.7 25.6 75.3 74.4 100 10010 & more workers 35.0 30.0 65.0 70.0 100 100
Firm Categories Rural Services Urban Services
RuralManufacturing
UrbanManufacturing
Total
2010-11 2015-16 2010-11 2015-16 2010-11 2015-16 2010-11 2015-16 2010-11 2015-16OAE 39.1 36.0 31.3 32.4 18.7 19.7 10.8 11.8 100.0 100.0Non-directory establishment 20.1 19.3 51.5 54.2 10.1 8.7 18.3 17.8 100.0 100.0Directory establishment 11.4 14.0 43.7 45.8 13.3 11.6 31.6 28.6 100.0 100.010 & more workers 15.8 18.5 38.7 45.6 19.2 11.5 26.4 24.4 100.0 100.0
P a g e | 19
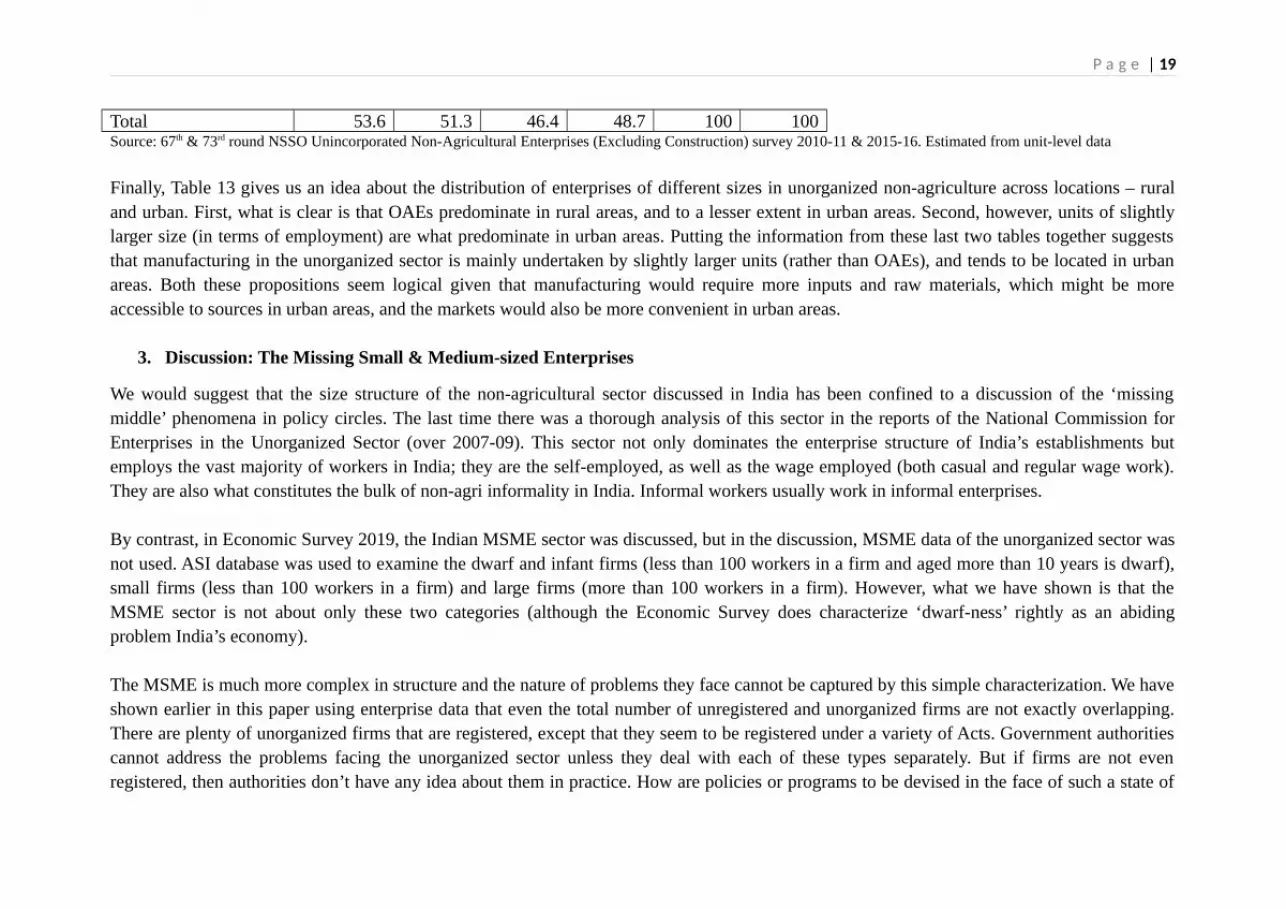
Total 53.6 51.3 46.4 48.7 100 100Source: 67th & 73rd round NSSO Unincorporated Non-Agricultural Enterprises (Excluding Construction) survey 2010-11 & 2015-16. Estimated from unit-level data
Finally, Table 13 gives us an idea about the distribution of enterprises of different sizes in unorganized non-agriculture across locations – ruraland urban. First, what is clear is that OAEs predominate in rural areas, and to a lesser extent in urban areas. Second, however, units of slightlylarger size (in terms of employment) are what predominate in urban areas. Putting the information from these last two tables together suggeststhat manufacturing in the unorganized sector is mainly undertaken by slightly larger units (rather than OAEs), and tends to be located in urbanareas. Both these propositions seem logical given that manufacturing would require more inputs and raw materials, which might be moreaccessible to sources in urban areas, and the markets would also be more convenient in urban areas.
3. Discussion: The Missing Small & Medium-sized Enterprises
We would suggest that the size structure of the non-agricultural sector discussed in India has been confined to a discussion of the ‘missingmiddle’ phenomena in policy circles. The last time there was a thorough analysis of this sector in the reports of the National Commission forEnterprises in the Unorganized Sector (over 2007-09). This sector not only dominates the enterprise structure of India’s establishments butemploys the vast majority of workers in India; they are the self-employed, as well as the wage employed (both casual and regular wage work).They are also what constitutes the bulk of non-agri informality in India. Informal workers usually work in informal enterprises.
By contrast, in Economic Survey 2019, the Indian MSME sector was discussed, but in the discussion, MSME data of the unorganized sector wasnot used. ASI database was used to examine the dwarf and infant firms (less than 100 workers in a firm and aged more than 10 years is dwarf),small firms (less than 100 workers in a firm) and large firms (more than 100 workers in a firm). However, what we have shown is that theMSME sector is not about only these two categories (although the Economic Survey does characterize ‘dwarf-ness’ rightly as an abidingproblem India’s economy).
The MSME is much more complex in structure and the nature of problems they face cannot be captured by this simple characterization. We haveshown earlier in this paper using enterprise data that even the total number of unregistered and unorganized firms are not exactly overlapping.There are plenty of unorganized firms that are registered, except that they seem to be registered under a variety of Acts. Government authoritiescannot address the problems facing the unorganized sector unless they deal with each of these types separately. But if firms are not evenregistered, then authorities don’t have any idea about them in practice. How are policies or programs to be devised in the face of such a state of
P a g e | 20
ignorance? Second, although 31% of unorganized firms are registered, they happen to be registered under Acts that are so numerous and diversein nature, that there is likely to be little or no consolidated information anywhere in government or any other agency (private or autonomous) thatmight help a well-meaning government even to begin to support such units.
Thirdly, we have noted that the total registered enterprises are less than one percent compared to all enterprises (organized and unorganized).Fourth, we have found that the presence of small and medium-sized enterprises is almost negligible. Fifth, there is a vast sea of own accountenterprises, accounting for the vast majority of enterprises in India.
Yet, the policy discourse in the country is confined merely to the ‘missing middle.’ What we have found is that while there may not be a missingmiddle if you only examine the organized sector firms (using ASI data), if you combine the ASI data with the NSSO data on an unorganizedsector, you discover not only a missing middle but also a missing small. The micro-segment of the MSME sector of non-agri enterprises is vastand is highly differentiated. The OAEs predominate, which could be called nano-enterprises, and they practically don’t figure in the policydiscourse (except as potential members of self-help groups). Moreover, the small-sized enterprises may be numerous in sheer absolute number,but they hardly account for a negligible proportion of all enterprises.
What all this implies is the following. Firms start tiny, as a means of survival, and also rarely grow to become significant. This kind of structureowes its origins to the reservation of products for small scale industries that began with the Industrial Policy Resolution of 1956 and lasted tillwell beyond the 21st century, until the end of the first decade of the millennium. In other words, this distorted the size structure of India’senterprises over half a century. The policymakers’ challenge now is how to correct for entrenched structure, caught in a low-level equilibrium, apoverty trap.
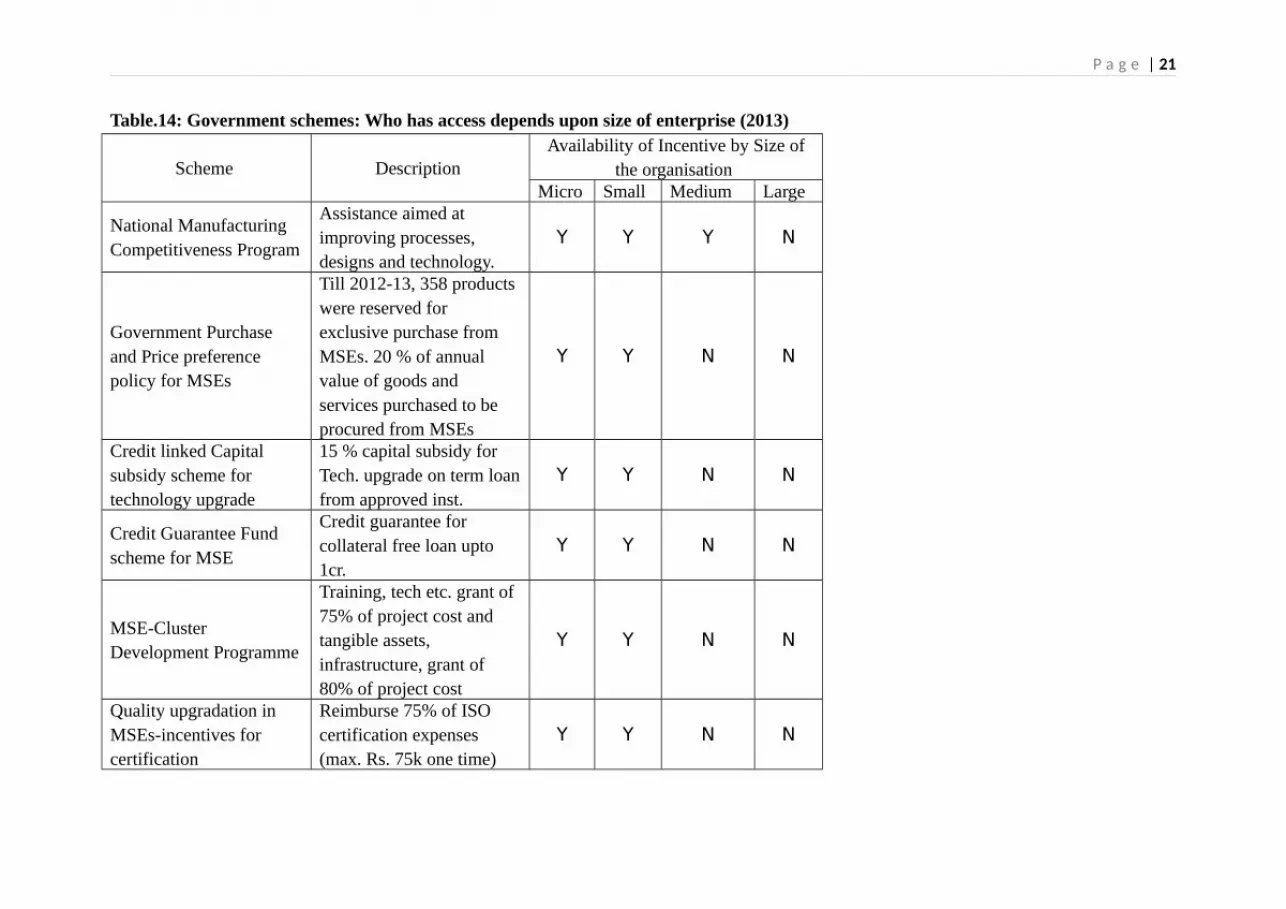
As though that was not bad enough, the policy regime has tended to encourage the sub-optimal size of enterprises well into the very recent past.Government schemes and incentives are holding back micro or small firms from expansion to some extent. The following table shows the nameof schemes for micro, small, medium and large and who can avail the incentives-
P a g e | 21
Table.14: Government schemes: Who has access depends upon size of enterprise (2013)
Scheme Description Availability of Incentive by Size of
the organisation Micro Small Medium Large
National Manufacturing Competitiveness Program
Assistance aimed at improving processes, designs and technology.
Y Y Y N
Government Purchase and Price preference policy for MSEs
Till 2012-13, 358 products were reserved for exclusive purchase from MSEs. 20 % of annual value of goods and services purchased to be procured from MSEs
Y Y N N
Credit linked Capital subsidy scheme for technology upgrade
15 % capital subsidy for Tech. upgrade on term loanfrom approved inst.
Y Y N N
Credit Guarantee Fund scheme for MSE
Credit guarantee for collateral free loan upto 1cr.
Y Y N N
MSE-Cluster Development Programme
Training, tech etc. grant of 75% of project cost and tangible assets, infrastructure, grant of 80% of project cost
Y Y N N
Quality upgradation in MSEs-incentives for certification
Reimburse 75% of ISO certification expenses (max. Rs. 75k one time)
Y Y N N
P a g e | 22
Micro Finance Programme
SIDBI supporting NGO/micro finance institutions in providing loans
Y N N N
Source: Economic Survey 2012-13
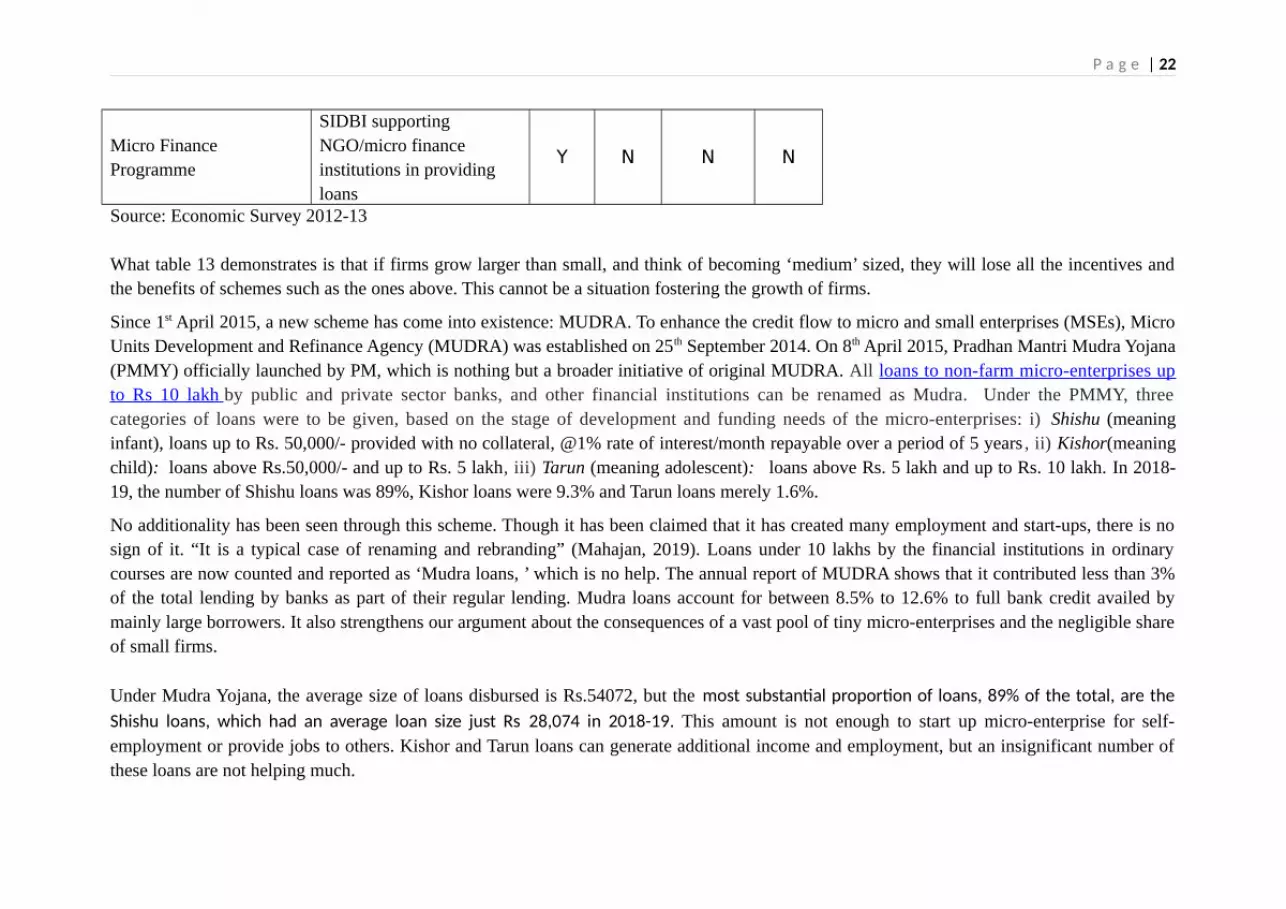
What table 13 demonstrates is that if firms grow larger than small, and think of becoming ‘medium’ sized, they will lose all the incentives andthe benefits of schemes such as the ones above. This cannot be a situation fostering the growth of firms.
Since 1st April 2015, a new scheme has come into existence: MUDRA. To enhance the credit flow to micro and small enterprises (MSEs), MicroUnits Development and Refinance Agency (MUDRA) was established on 25th September 2014. On 8th April 2015, Pradhan Mantri Mudra Yojana(PMMY) officially launched by PM, which is nothing but a broader initiative of original MUDRA. All loans to non-farm micro-enterprises upto Rs 10 lakh by public and private sector banks, and other financial institutions can be renamed as Mudra. Under the PMMY, threecategories of loans were to be given, based on the stage of development and funding needs of the micro-enterprises: i) Shishu (meaninginfant), loans up to Rs. 50,000/- provided with no collateral, @1% rate of interest/month repayable over a period of 5 years , ii) Kishor(meaningchild): loans above Rs.50,000/- and up to Rs. 5 lakh, iii) Tarun (meaning adolescent): loans above Rs. 5 lakh and up to Rs. 10 lakh. In 2018-19, the number of Shishu loans was 89%, Kishor loans were 9.3% and Tarun loans merely 1.6%.
No additionality has been seen through this scheme. Though it has been claimed that it has created many employment and start-ups, there is nosign of it. “It is a typical case of renaming and rebranding” (Mahajan, 2019). Loans under 10 lakhs by the financial institutions in ordinarycourses are now counted and reported as ‘Mudra loans, ’ which is no help. The annual report of MUDRA shows that it contributed less than 3%of the total lending by banks as part of their regular lending. Mudra loans account for between 8.5% to 12.6% to full bank credit availed bymainly large borrowers. It also strengthens our argument about the consequences of a vast pool of tiny micro-enterprises and the negligible shareof small firms.
Under Mudra Yojana, the average size of loans disbursed is Rs.54072, but the most substantial proportion of loans, 89% of the total, are theShishu loans, which had an average loan size just Rs 28,074 in 2018-19. This amount is not enough to start up micro-enterprise for self-employment or provide jobs to others. Kishor and Tarun loans can generate additional income and employment, but an insignificant number ofthese loans are not helping much.

P a g e | 23
Mudra loans are flawed as a financial product - these are structured as term loans with a tenor of three years, with periodic repayments ofprincipal and interest, whereas 90% or more of the amount is used for working capital, which is needed as long as the microenterprise runs. If theloan is repaid, the unit will not have working capital. These loans should have been offered as cash credit overdraft limits. That would also havereduced the interest burden on the borrowers.
Mudra loans risk a default because debt for new enterprises is the wrong financial product. In debt financing, the entrepreneur has to maintainthe fixed installment repayment and this leads to the loan becoming an NPA. Catching up on older installments becomes tougher. Had theMudra financing been done using the micro-equity framework, the build-up of NPAs would have been avoided (already 4-5%, but growing,since it is early days yet). An RBI expert must examine alternatives to MUDRA retail loans.
Currently, the risk of default is tried to be obviated through credit guarantees from the Credit Guarantee Trust for MSMEs (CGT-MSME). But noguaranteed mechanism can sustainably deal with failure rates as high as 70-80% among new enterprises, which are typical for nano-enterprisesrun by individual entrepreneurs (Mahajan, 2019). Only a micro-equity fund mechanism can handle this. While many enterprises would go underor would be marginally profitable, returns from the surviving and thriving enterprises would have been enough to offset the investment losses
Missing middle is not new and researchers have been talking about this long time. There is an expectation that some formalization isoccurring after the introduction of the goods and services tax (GST) system in July 2017. There is a slight change in the share of informal firms.Existing unorganized sector units have registered if they have an annual turnover 20 lakhs, because GST return has to be submitted. On accountof this 93 percent of informal workers in India comes down to 90 percent (Mehrotra and Parida, 2019). Some of the firms do indeed registerunder GST, but the percentage of this kind of cases is small. This missing part (small and medium-sized firms) needs further detailed research todetermine their constraints, size-wise, in detail.
4. Concluding remarksThe MSME sector is the second-largest employer and an essential driver of the economy. But the literature about the ‘missing middle’ rightlyidentifies this gap in the size structure of enterprises in developing economies as a severe problem. Though some researchers deny such aproblem exists. Hsieh and Olken (2014) wrote about no missing middle in Indonesia, Mexico and India by considering plant size distribution asbimodal. Nagraj (2018) also concluded that no missing middle exists, but based on an analysis of only the organized sector. However, Tybout(2014) argued quite differently.
P a g e | 24
It is well known that informality abounds in India, both for workers as well as for firms. We have used ASI and NSS data sources both todemonstrate that not only is there a missing middle but a missing small scale sector as well. Even worse, of all micro enterprises 84.2 percent areOAEs. Tiny micro enterprises’ ability to expand is minimal. Together with units that employ 1-5 workers, OAEs have an almost 97 percentshare.
These units have remained outside the policymakers’ frame of reference. Such policies that have been adopted (which we examined briefly),have barely made a dent on the problem. There is a case for a new policy framework that takes these units as the main focus of their attention, asopposed to clubbing together all MSMEs into one catch-all category.
BibliographyAbraham, R. (2016). Informal Employment in India: An Analysis of Forms and Determinants (ISEC Working Paper. 363). Bangalore: Institute for Social and Economic Change.Banerjee, A., & Duflo, E. (2008). What is Middle Class about the Middle Classes Around the World? Journal of Economic Perspectives, 22(2),
3-28.
Bernard, A., Jensen, J., Redding, S., & Schott, P. (2012). The Empirics of Firm Heterogeneity and International Trade. Annual Review of Economics, 4(1), 283-313.
Bernard, A., Jensen, J., Redding, S., & Schott, P. (2007). Firms in international trade. Journal of Economic Perspectives, 21(3), 105-130.Chatterjee, U., & Kanbur, R.(2015). Non-compliance with India’s Factories Act: Magnitude and patterns. International Labour Review, 154(3), 393-412.Chong, S., Hoekstra, R. H., Lemmers, O., Beveren, I. V., Berg, M. V., Wal, R. V., & Verbiest, P. (n.d.).(2019). The role of small- and medium-
sized enterprises in the Dutch economy: an analysis using an extended supply and use Table Journal of Economic Structures, 8(1).De Mel, S., McKenzie, D., & Woodruff, C. (2010). Who are the microenterprise owners? Evidence from Sri Lanka on Tokman versus De Soto. In: Lerner, J., & Schoar, A. (Eds.) International Differences in Entrepreneurship (pp. 63-87). Chicago, IL:
P a g e | 25
University of Chicago Press.Dhar, P., & Lydall, H. F. (1961). The Role of Small Enterprises in Indian Economic. Bombay: Asia Publishing House.Ghose, J. (2014). The Curious Case of the Jobs that did not Appear: Structural Change, Employment and Social Patterns in India. Indian Journal of Labour Economics, 57 (1).Goldar, B. (2010). Informalisation of Industrial Labour in India: Are Labour Market Rigidities and Growing Import Competition to Blame?. Working Paper No. id:3125, eSocialSciences. Retrieved from https://ideas.repec.org/p/ess/wpaper/id3125.htmlGovernment of India. (2017-18). Annual Report . New Delhi: Ministry of Micro, Small and Medium Enterprises.Government of India. (2018-19). Economic Survey. New Delhi: Ministry of Finance.
Hasan, R., and K. Jandoc. (2013). Labor Regulations and the Firm Size Distribution in Indian Manufacturing. in J. Bhagwati and A.Panagariya, eds. Reforms and Economic Transformation in India, Delhi: Oxford University Press. Hsieh, C.-T., & Olken, B. (2014). The Missing 'Missing Middle'. Journal of Economic Perspectives, 28(3), 89-98.Krueger, Anne O. (2013). The Missing Middle. in Economic Reform in India: Challenges, Prospects, and Lessons edited by Nicholas C. Hope, Anjini Kochar, Roger Noll, and T. N. Srinivasan, Cambridge University Press.Mahajan, V. (2019), Employment in MSMEs- Challenges with MUDRA and thePMMY: A Way Forward, Rajiv Gandhi Centre for Contemporary Studies, New Delhi, mimeo.Mazumdar, D. (2003). Small and Medium Enterprise Development in Equitable Growth and Poverty Alleviation. In C. M. Edmonds, ed., Reducing Poverty in Asia; Emerging Issues in Growth,Targeting and Measurement. Chaltenham: Edward Elgar for the Asian Development BankMazumdar, D., and S. Sarkar. 2008. Globalization, Labor Markets and Inequality in India. London and New York: Routledge

P a g e | 26
Mazumdar, D., and S. Sarkar. (2013). Manufacturing Enterprise in Asia: Size Structure and Economic Growth, London and New York: Routledge and IDRC,Canada
Mehrotra, S. (2019). 'Manufacturing: The Cornerstone of Planning for a 21st Century India', in Mehrotra, S. and S. Guichard (Eds.) Planning in the 20th CEntury and Beyond: India's Planning Commission and NITI, Cambridge University Press, 2020.Mehrotra, S.(2016). Seizing the Demographic Dividend. Policies to Achieve Inclusive Growth in India, Cambridge University PRess.
Mehrotra, S. (2020), Informal Employment Trends in the Indian Economy: Persistent informality, but growing positive development, ILO Working Paper, Geneva.
Mehrotra, S. and J. Parida (2019), A JObs Crisis: Rising Education Levels and Falling Non- agri Job Growth, State of Working India Working Paper, Azim Premji University, Bangalore.(https://cse.azimpremjiuniversity.edu.in › wp-content › uploads › 2019)Nagaraj, R. (2018). Of Missing Middle and Size-based Regulation: A New Frontier in the Labour Market Flexibility Debate. CSE Working Paper # 2018-7.OECD . (2013). Skills Development and Training in SMEs. Paris : OECD Publishing .
Panagariya, A. (2013): Why growth matters: How India’s growth acceleration has reduced poverty, Ramaswamy, K.V.(2013). Understanding the ‘missing middle’ in Indian Manufacturing: The Role of Size-Dependent Labour Regulations and Fiscal Incentives. (V.R.F Series, No.480). Institute of Developing Economies, Japan External Trade Organisation. Taymaz, E. (2002). Are Small Firms Really Less Productive? An Analysis of Productivity Differentials and Firm Dynamics, presented at 9th Annual Conference of Economic Research Forum (ERF).Tybout, J. (2000). Manufacturing Firms in Developing Countries: How Well Do They Do, and Why? Journal of Economic Literature, 38(1), 11–
44.Tybout, J. (2014). The Missing Middle, Revisited. Retrieved from https://assets.aeaweb.org/

P a g e | 27
asset-server/articles-attachments/jep/app/2804/28040235_app.pdf
Annexure Industry-specific acts/ authorities under which enterprises registered in 2010-11 & 2015-16
Sl.No. 2010-11 2015-16
1 State directorate of industries State directorate of industries
2Khadi and Village Industries Commission/Board
Khadi and Village Industries Commission/ Board
3Development Commissioner of Handicraft/ handloom
Development Commissioner of Handicraft /handloom
4 Coir BoardCommodity boards (Coir board, Silk Board, Jute commissioner, etc.)
5 Directorate of education /AICTE/NCTE Directorate of education /AICTE/NCTE 6 Silk Board Pollution Control Board
7 Jute CommissionerDirectorate General of Foreign Trade/ other export promotion agencies
8 Pollution Control Board
State Financial Corporation/Industrial Cooperative Banks/Industrial Development Banks/ SIDBI
9Directorate General of Foreign Trade/ other export promotion agencies Food safety and Standards Act, 2006
10
State Financial Corporation/Industrial Cooperative Banks/Industrial Development Banks District Supply and Marketing Society
11
Technical Consultancy Services Organisations/Council for Technological Upgradation
Technical Consultancy Services Organisations/Council for Technological Upgradation

P a g e | 28
12Small Industries Development Bank of India (SIDBI) Sale tax
13Small Industries Services Institutes/ othersmall industries registration agencies Indian Charitable Act
14 District Supply and Marketing Society Cinematograph act
15State Trading Corporation of India Limited (STC)
Money lender’s Act (including the State variants)
16 Indian Charitable ActSocieties Registration Act, 1860 (including the State variants)
17 Cinematograph actIndian Trust Act/Public Trust Act (including the State variants)
18 Money lender’s ActEmployees Provident Fund Organisation (EPFO)
19Societies Registration Act, 1860 (including the State variants) Others
20 Public Trust Act 21 Others
Source: 73rd round NSSO Unincorporated Non-Agricultural Enterprises (Excluding Construction) survey 2015-16 unit level data & 67th NSS Unincorporated Non-Agricultural Enterprises (Excluding Construction) survey 2010-11 unit level data