Embed Size (px)
Citation preview

Mapping India’s Energy Policy 2022:Aligning support and revenues with a net-zero future
© 2022 The International Institute for Sustainable Development and the Council on Energy, Environment and Water

© 2022 The International Institute for Sustainable Development and the Council on Energy, Environment and WaterPublished by the International Institute for Sustainable Development.This publication is licensed under a Creative Commons Attribution-Non-Commercial-ShareAlike 4.0 International License.
International Institute for Sustainable DevelopmentThe International Institute for Sustainable Development (IISD) is an award-winning independent think tank working to accelerate solutions for a stable climate, sustainable resource management, and fair economies. Our work inspires better decisions and sparks meaningful action to help people and the planet thrive. We shine a light on what can be achieved when governments, businesses, non-profits, and communities come together. IISD’s staff of more than 120 people, plus over 150 associates and consultants, come from across the globe and from many disciplines. With offices in Winnipeg, Geneva, Ottawa, and Toronto, our work affects lives in nearly 100 countries.
IISD is a registered charitable organization in Canada and has 501(c)(3) status in the United States. IISD receives core operating support from the Province of Manitoba and project funding from governments inside and outside Canada, United Nations agencies, foundations, the private sector, and individuals.
About GSIThe IISD Global Subsidies Initiative (GSI) supports international processes, national governments and civil society organizations to align subsidies with sustainable development. GSI does this by promoting transparency on the nature and size of subsidies; evaluating the economic, social, and environmental impacts of subsidies; and, where necessary, advising on how inefficient and wasteful subsidies can best be reformed. GSI is headquartered in Geneva, Switzerland, and works with partners located around the world. Its principal funders have included the governments of Denmark, Finland, New Zealand, Norway, Sweden, Switzerland, and the United Kingdom, as well as the KR Foundation.
Council on Energy, Environment and WaterThe Council on Energy, Environment and Water (CEEW) is one of Asia’s leading not-for-profit policy research institutions. The Council uses data, integrated analysis, and strategic outreach to explain – and change – the use, reuse, and misuse of resources. It prides itself on the independence of its high-quality research, develops partnerships with public and private institutions, and engages with the wider public. In 2021, CEEW once again featured extensively across ten categories in the 2020 Global Go To Think Tank Index Report. The Council has also been consistently ranked among the world’s top climate change think tanks. CEEW is certified as a Great Place To Work®. Follow us on Twitter @CEEWIndia for the latest updates.
Mapping India’s Energy Policy 2022: Aligning support and revenues with a net-zero future
May 2022
Written by Prateek Aggarwal, Siddharth Goel, Tara Laan, Tarun Mehta, Aditya Pant, Swasti Raizada, Balasubramanian Viswanathan, Anjali Viswamohanan, Christopher Beaton, and Karthik Ganesan.
Head Office
111 Lombard Avenue, Suite 325 Winnipeg, Manitoba Canada R3B 0T4
Tel: +1 (204) 958-7700 Website: www.iisd.org Twitter: @IISD_news
Global Subsidies Initiative
International Environment House 2, 9 chemin de Balexert 1219 Châtelaine Geneva, Switzerland Canada R3B 0T4
Tel: +1 (204) 958-7700 Website: www.iisd.org/gsi Twitter: @globalsubsidies
Council on Energy, Environment and Water (CEEW)
ISID Complex 4 Vasant Kunj Institutional Area, New Delhi 110070, India
Tel: +91 11 40733300 Website: www.ceew.in Twitter: @CEEWIndia

IISD.org/gsi iii
Acknowledgements
The authors are indebted to previous collaboration between the International Institute for Sustainable Development (IISD), ICF India, the Overseas Development Institute, and the Council on Energy, Environment and Water (CEEW) for establishing the subsidy database that underlies this publication. For this update, the majority of new data and revisions to previous data on energy subsidies were prepared by co-authors Prateek Aggarwal, Tarun Mehta, and Danwant Narayanaswamy (formerly) from CEEW, and Balasubramanian Viswanathan and Anjali Viswamohanan from IISD. Additionally, the chapter on subsidies was principally drafted by Prateek Aggarwal and Tarun Mehta from CEEW, while the section on public sector undertakings was principally drafted by Balasubramanian Viswanathan from IISD with support from Aziza Dossybayeva, Vilma Beqa, and Timur Naushirvanov from Central European University. The new section on public finance was principally drafted by Anjali Viswamohanan and Swasti Raizada from IISD. Further, the chapter on energy revenues and externalities was drafted by Tara Laan and Siddharth Goel from IISD along with independent consultant Aditya Pant. They would like to thank Prayas Energy Group for the papers Energy Transition: Need for Fundamental Rethink of Taxation Policy and Energy: Taxes and Transition in India, which provided guidance on how to structure our own analysis, and for the expert inputs from the authors, Ashwin Gambhir and Ashok Sreenivas, on technical questions on various tax measures in India. Christopher Beaton from IISD and Karthik Ganesan from CEEW provided guidance on the analytical approach, outline, and conclusions, as well as overall editorial comments.
The authors would also like to thank the following individuals and institutions for the valuable comments and recommendations that they provided as peer reviewers:
• Abhinav Jindal, Indian Institute of Management, Indore
• Aditya Lolla, Ember
• Anish Sugathan, Indian Institute of Management, Ahmedabad
• Anuj Hemant Xess, GIZ India
• Aniruddha Ketkar, Ashok Sreenivas and Ashwin Gambhir, Prayas Energy Group
• Ashish Fernandes, Climate Risk Horizons
• Bharat Jairaj, World Resources Institute
• Chido Muzondo, Lourdes Sanchez, Lucile Dufour, Vibhuti Garg, IISD
• Florian Weiler, Central European University
• Kanika Chawla, United Nations Energy, Sustainable Energy for All
• Kartikeya Singh, Center for Strategic and International Studies
• Kavita Rao, National Institute of Public Finance and Policy
• Prasanth V Regy, NITI Aayog
• Runa Sarkar, Indian Institute of Management, Calcutta
• Miquel Munoz Cabre and Stefan Bößner, Stockholm Environment Institute
• Nate Vernon, International Monetary Fund
• Nisheeth Srivastava, KfW
• Saon Ray, Indian Council for Research on International Economic Relations
• Siddharth Singh, International Energy Agency
• Ujjwal Kumar, CUTS International
We would also like to thank the governments of Denmark, Norway, and Sweden for their generous support of this publication. The opinions expressed and the arguments employed in this update do not necessarily reflect those of peer reviewers and funders, nor should they be attributed to them.

iv
Mapping India's Energy Policy 2022
Executive SummaryEnergy is critical for many objectives of the Government of India, including economic recovery from COVID-19; universal access to clean and modern energy for human development imperatives; reducing severe levels of outdoor and indoor air pollution; and climate change mitigation. In 2021, at global climate negotiations, the government established a new commitment to reach net-zero greenhouse gas emissions by the year 2070. It also reaffirmed its aim to install 500 GW of non-fossil power capacity by 2030. This is up from 159 GW of non-fossil capacity as of February 2022 (Central Electricity Authority [CEA], 2022).
To support India’s ambitions, this report provides an updated assessment of public resources that support fossil fuels, renewables, and electric vehicles. We quantify trends in support levels in recent years and identify major areas where budgeting can be better aligned with stated policy objectives. Next, to explore the revenue implications of the energy transition, we identify the revenues raised from fossil and clean energy.1 To ensure that revenue benefits are considered in the context of full costs, we also estimate externalities associated with the various sources of energy that India relies on. This results in two key themes: “support” and “revenue and externalities,” as illustrated in Figure ES1.
Figure ES1. Framework used to assess India’s energy policy budgeting
1 “Clean energy” in this report includes renewable energy, EVs, and energy-efficiency measures but excludes large hydro; nuclear; palm oil; first-generation biofuels, and the capture, utilization, and storage of carbon; and any fossil fuels.
REVENUE & EXTERNALITIES
Revenue raised from different types of energy and the extent to which this is aligned with social costs. This includes taxes, and non-tax instruments, such as royalties and rents. Externalities include the climate impacts of greenhouse gas emissions, air-pollution-related mortality and morbidity, and road-related externalities.
India’sEnergyPolicy
SUPPORT
Government support that is provided to different types of energy and how well this is aligned with government policy objectives. Support can come in many forms. We examine subsidies, investments by public sector undertakings and lending by public finance institutions.
Coal Oil and Gas Electricity RenewableEnergy
ElectricVehicles
IISD.org/gsi v
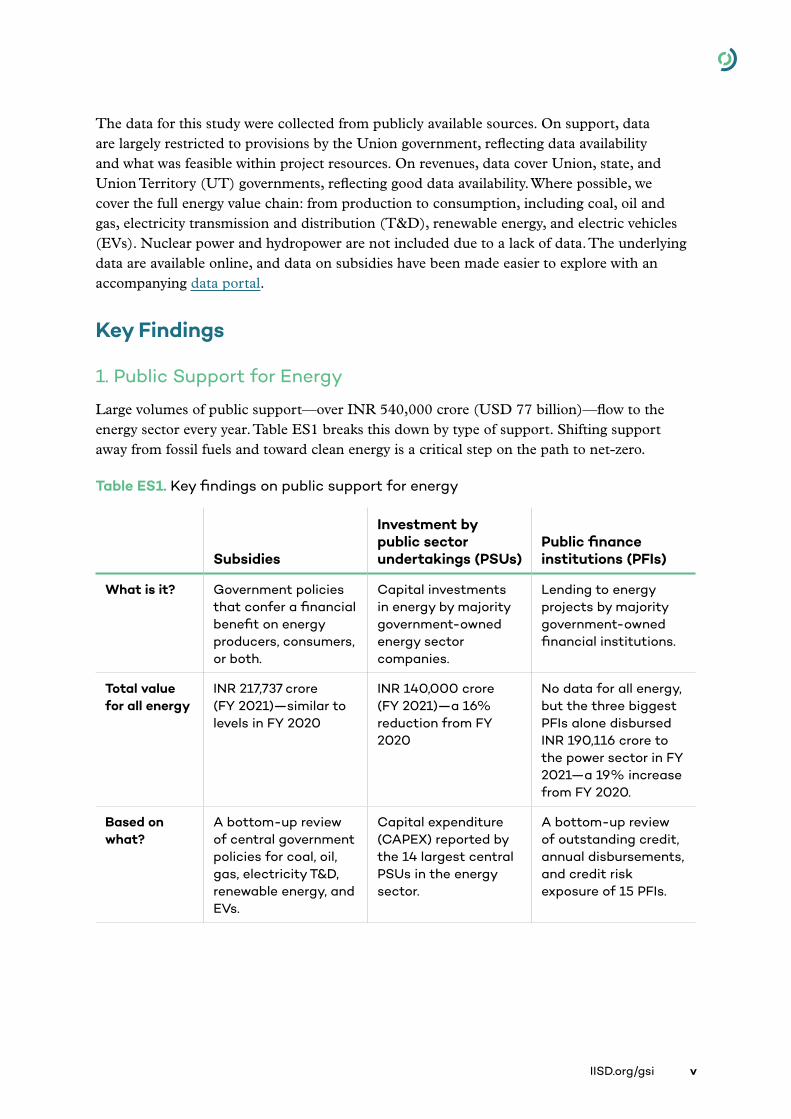
The data for this study were collected from publicly available sources. On support, data are largely restricted to provisions by the Union government, reflecting data availability and what was feasible within project resources. On revenues, data cover Union, state, and Union Territory (UT) governments, reflecting good data availability. Where possible, we cover the full energy value chain: from production to consumption, including coal, oil and gas, electricity transmission and distribution (T&D), renewable energy, and electric vehicles (EVs). Nuclear power and hydropower are not included due to a lack of data. The underlying data are available online, and data on subsidies have been made easier to explore with an accompanying data portal.
Key Findings
1. Public Support for Energy
Large volumes of public support—over INR 540,000 crore (USD 77 billion)—flow to the energy sector every year. Table ES1 breaks this down by type of support. Shifting support away from fossil fuels and toward clean energy is a critical step on the path to net-zero.
Table ES1. Key findings on public support for energy
Subsidies
Investment by public sector undertakings (PSUs)
Public finance institutions (PFIs)
What is it? Government policies that confer a financial benefit on energy producers, consumers, or both.
Capital investments in energy by majority government-owned energy sector companies.
Lending to energy projects by majority government-owned financial institutions.
Total value for all energy
INR 217,737 crore (FY 2021)—similar to levels in FY 2020
INR 140,000 crore (FY 2021)—a 16% reduction from FY 2020
No data for all energy, but the three biggest PFIs alone disbursed INR 190,116 crore to the power sector in FY 2021—a 19% increase from FY 2020.
Based on what?
A bottom-up review of central government policies for coal, oil, gas, electricity T&D, renewable energy, and EVs.
Capital expenditure (CAPEX) reported by the 14 largest central PSUs in the energy sector.
A bottom-up review of outstanding credit, annual disbursements, and credit risk exposure of 15 PFIs.

vi
Mapping India's Energy Policy 2022
Subsidies
Investment by public sector undertakings (PSUs)
Public finance institutions (PFIs)
Support for fossil vs. clean energy
In FY 2021, nine times more subsidies for coal, oil, and gas than for clean energy. However, overall, fossil fuel subsidies have fallen 72% since 2014.
In FY 2021, India’s seven Maharatna PSUs invested 11 times more in fossil projects than RE.
For FY 2021, annual disbursements by PFIs were three times higher for fossil generation than RE.
Other key findings
• For remaining fossil subsidies, priorities for reform are coal, oil and gas.
• Direct Benefit Transfer of LPG (DBTL) subsidies were removed in late 2020 and reintroduced in May 2022 exclusively for Pradhan Mantri Ujjawla Yojana (PMUY) beneficiaries.
• Low-priced electricity makes up ~62% of all subsidies. It is not well targeted and impairs distribution company (DISCOM) finances.
• For renewable energy, subsidies have fallen 59% since FY 2017, while for EVs they have grown 205%. Support remains low compared to ambition.
• In the last year, several PSUs announced new clean energy partnerships and targets, but most have not set clear targets for levels of investments.
• State-owned energy firms risk lagging behind their private sector counterparts, who are announcing bold plans to capture a share of future clean energy markets. In the last year, Reliance New Energy Solar Limited (RNESL) and Adani Green Energy Limited (AGEL) have announced aims to invest INR 595,000 crore and over INR 370,000 crore (USD 80 billion and USD 50 billion), respectively, in clean energy.
• Non-banking financial companies (NBFCs) are playing a major role in shifting public finance away from fossil fuels.
• The Centre for Financial Accountability and Climate Trends (2021) suggest that private sector banks have stopped financing coal power. Reserve Bank of India (RBI) data also suggest that private sector banks are providing a larger share of finance to clean energy.
• No PFIs have established plans on phasing out finance for fossil fuels despite risks of large-scale asset stranding.
Transparency Data exists for only some policies. Reporting is not always consistent. No formal government report aggregates support.
PSUs report total CAPEX but not by energy type. Good reporting on project-level investments, but not updated since FY 2020.
Almost no voluntary reporting on public sector banks’ annual finance by fossil fuel and clean energy, making it difficult to map trends.

IISD.org/gsi vii
2. Energy-Related Revenues and Externalities
Energy is an important source of revenue for central and state governments. In FY 2020, the total energy revenue for the centre, states, and UTs was estimated to be INR 699,565 crore (USD 94 billion), around 17% of all government revenue. The majority of energy revenues (83%) are from oil and gas (see Figure ES2), with most coming from just two taxes: the central fuel excise and state-level VAT. Coal and electricity together comprise ~16% and renewables less than 1%.
Figure ES2. Revenues from key energy products and services (FY 2020)
Note: Natural gas revenues were included with oil because they were not disaggregated in government budget sources.
Source: Author’s calculations. See accompanying data sheets for details and underlying sources.
In the medium term, revenues arising from fossil fuels will likely increase, largely because India’s oil product consumption is expected to grow considerably. However, significant volatility is associated with this revenue. Assuming the same average level of taxation as 2019, and considering consumption, production and price forecasts by the International Energy Agency (2021), we estimate fossil energy revenue could grow by an additional INR 30,000 to INR 340,000 crore (USD 4 to USD 48 billion) by 2030. The large range reflects the uncertainty in the pace of policy shifts to clean energy and how much progress is made toward India’s net-zero target. Beyond 2030, as fossil fuel use begins to peak and decline, revenues would ultimately fall significantly. This dynamic suggests the need to diversify revenue sources while investing revenue from fossil-fuel sources to augment the supply of clean energy and incentivize its demand. The synergy between social protection schemes and the consumption of clean energy must be factored in as the country deliberates a new investment paradigm.
Energy is not just a source of revenue, but also costs. Most benefits and costs are captured in market prices: sellers ensure costs of supply are covered, while consumers will only pay in proportion to the benefits they receive. Costs not captured in prices are considered “external” and should be acknowledged alongside public revenues. For FY 2020, we took a
Centre State and UTs
0
50,000
100,000
150,000
200,000
250,000
300,000
350,000
400,000
Oil and gas Coal Renewables Electricity
INR
cro
re

viii
Mapping India's Energy Policy 2022
conservative approach (see Box ES 1) to illustrate this dynamic. For fossil fuels, we estimated externalities at between INR 1,441,464 crore (USD 203 billion) and INR 3,543,108 crore (USD 500 billion), up to five times revenues (Figure ES3). For solar photovoltaic (PV) and wind power, the quantified externalities totalled only INR 12,933 crore (USD 1.8 billion) to INR 17,872 crore (USD 2.5 billion), up to four times greater than revenues. This is a high-level assessment, but even so, it is enough to illustrate that the full costs of fossil energy far outweigh any revenue benefits. While no level of taxation would make critical externality costs acceptable, such as deaths and illness, the results do suggest scope for increasing taxation. This can help stimulate the transition efficiently, but it would also require stronger social protection systems to manage the impacts on the cost of living.
Figure ES3. Revenues and externalities from key energy sources (FY 2020)
Notes: 1. Revenues include central, state, and UT revenues. 2. Externalities were calculated using India-specific sources where possible. See full report for details. 3. The “less-conservative estimate” is not considered to be an upper bound due to the large number of externalities that were not assessed, as summarized in the diagram. 4. Externalities not included: extraction and mining; land and water impacts; fugitive methane emissions; medical expenses; decommissioning and remediation; and biodiversity impacts.
INR
1,0
00
k cr
ore
-2.5
-1.5
-0.5
0.5
-2
-1
0
1
Rev
enue
sEx
tern
alit
ies
Coal Oil & Gas RE
Less conservative estimate
LCA GHG emissions
Integration costs
Traffic accidents
Congestion
Road damage
Climate changeClimate change
Air pollutionmortality Air pollution
mortalityAir pollutionmorbidity
Air pollutionmorbidity

IISD.org/gsi ix
Box ES1. Quantifying externalities in the energy system
There is considerable uncertainty inherent in the quantification of externalities. Our approach was conservative. Based on lower-end estimates from expert literature, we quantified only a limited number of external costs: morbidity and mortality from air pollution; an aggregate estimate of losses from climate change; losses from road damage, traffic accidents and congestion; and the costs of integrating renewables into the power system. To illustrate uncertainty, we also provide a higher estimate based on less-conservative but equally valid data.
Many negative externalities remain unquantified (see list in Figure ES3). Our assessment includes two externalities that often give rise to questions and warrant additional explanation. (1) Road damage, congestion, and traffic accidents are proportional to the amount driven, which is related to fuel consumption. Ideally, driving (including by EVs) would be taxed per kilometre of travel, with surcharges for congested areas, weight (road damage), and noise pollution. Until that is feasible, fuel prices should reflect these costs, and failure to do so creates an externality. (2) The variable and unpredictable nature of renewable electricity imposes costs (primarily for flexible generation and storage) that are typically not reflected in prices paid by consumers.
Recommendations
1Align support with 2030 targets and net-zero
• Continue to phase out support for fossil fuels in a socially responsible way.
• Introduce new support as needed to meet clean energy targets and ensure a just transition.
• Establish a body to coordinate actions across support, taxation, and pricing for energy, with relevant ministries, departments, and expert agencies.
2Shift subsidies
• Establish a National Electricity Council as a platform on power sector issues and mandate it to lead dialogue between the centre and states on electricity subsidy reform, including targeting subsidies to low-income consumers and swapping subsidies for sustainable agricultural practices.
• Ensure that any subsidies for LPG are targeted and combined with support to incubate non-fossil cooking technologies.
• Develop a strategy and timeline to reform coal subsidies responsibly—for example, shifting subsidies away from the input (coal) and toward the service (affordable electricity).
• Identify how much support is required to achieve clean energy targets, particularly for new and emerging technologies—and provide it.
x
Mapping India's Energy Policy 2022
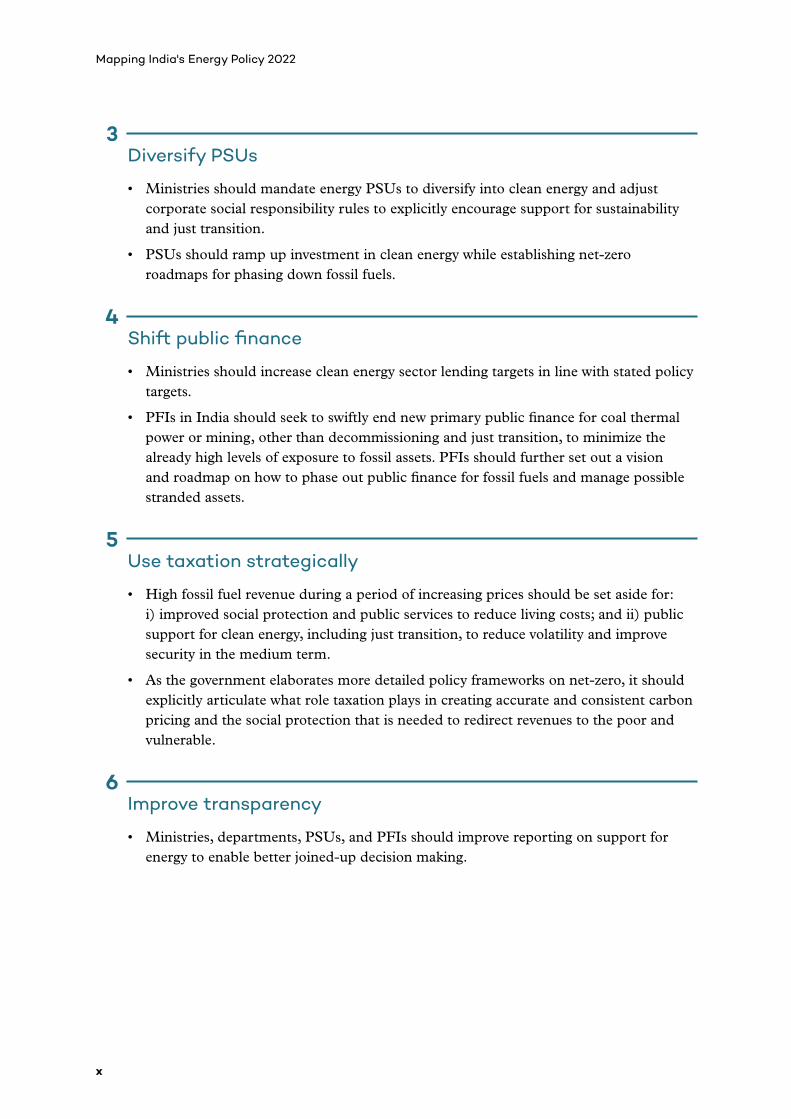
3Diversify PSUs
• Ministries should mandate energy PSUs to diversify into clean energy and adjust corporate social responsibility rules to explicitly encourage support for sustainability and just transition.
• PSUs should ramp up investment in clean energy while establishing net-zero roadmaps for phasing down fossil fuels.
4Shift public finance
• Ministries should increase clean energy sector lending targets in line with stated policy targets.
• PFIs in India should seek to swiftly end new primary public finance for coal thermal power or mining, other than decommissioning and just transition, to minimize the already high levels of exposure to fossil assets. PFIs should further set out a vision and roadmap on how to phase out public finance for fossil fuels and manage possible stranded assets.
5Use taxation strategically
• High fossil fuel revenue during a period of increasing prices should be set aside for: i) improved social protection and public services to reduce living costs; and ii) public support for clean energy, including just transition, to reduce volatility and improve security in the medium term.
• As the government elaborates more detailed policy frameworks on net-zero, it should explicitly articulate what role taxation plays in creating accurate and consistent carbon pricing and the social protection that is needed to redirect revenues to the poor and vulnerable.
6Improve transparency
• Ministries, departments, PSUs, and PFIs should improve reporting on support for energy to enable better joined-up decision making.
IISD.org/gsi xi
Contents
1.0 Introduction ................................................................................................................................................................... 1
2.0 Context: Ambition and the Path to Net-Zero ..............................................................................................2
India’s Renewed Ambition at COP26 ..................................................................................................................................3
Other Ambitions on Clean Energy ........................................................................................................................................3
The Long Path to Net-Zero ........................................................................................................................................................ 4
Recent Developments .................................................................................................................................................................... 4
3.0 Approach .........................................................................................................................................................................6
Subsidies ................................................................................................................................................................................................... 7
Public Sector Undertakings ...................................................................................................................................................... 7
Public Finance Institutions ......................................................................................................................................................... 7
Tax and Non-Tax Revenues ........................................................................................................................................................ 8
Energy Externalities ......................................................................................................................................................................... 8
4.0 Government Support for Energy ......................................................................................................................10
4.1 Energy Subsidies ...................................................................................................................................................................... 12
4.2 The Role of Public Sector Undertakings in India’s Energy Transition ............................................25
4.3 Role of Public Finance Institutions in India’s Energy Transition .......................................................32
5.0 Energy Revenues and Externalities ................................................................................................................. 42
5.1 Energy Revenues ..................................................................................................................................................................... 43
5.2 Energy Externalities in India ......................................................................................................................................... 49
5.3 Comparison of Revenues and Externalities .......................................................................................................53
6.0 Recommendations ................................................................................................................................................... 55
References ...........................................................................................................................................................................57
Appendix A. Subsidy Methods and Calculations ..............................................................................................75
Appendix B. Further Notes on New Subsidies ...................................................................................................76
Appendix C. List of Public Finance Institutions ................................................................................................ 77
Appendix D. Methods, Calculations and Sources for Externalities ........................................................ 78

xii
Mapping India's Energy Policy 2022
List of Figures
Figure ES1. Framework used to assess India’s energy policy budgeting ........................................................v
Figure ES2. Revenues from key energy products and services (FY 2020) ................................................viii
Figure ES3. Revenues and externalities from key energy sources (FY 2020) ............................................ ix
Figure 1. Total quantified energy subsidies, FY 2014–FY 2021 ........................................................................... 13
Figure 2. Total coal subsidies in India, FY 2014–FY 2021 .........................................................................................14
Figure 3. Total oil and gas subsidies in India, FY 2014–FY 2021 ..........................................................................17
Figure 4. Annual DBTL disbursals: PPAC vs. MoPNG .................................................................................................... 19
Figure 5. Total T&D Subsidies in India, FY 2014–FY 2021 ........................................................................................20
Figure 6. Total renewable subsidies in India, FY 2014–FY 2021 ........................................................................... 21
Figure 7. Total subsidies to EVs in India, FY 2014–FY 2021 .....................................................................................25
Figure 8. Demand for ethanol by PSUs under EBP, ESY 2017 to ESY 2021 .................................................26
Figure 9. CAPEX trends of seven major PSUs in India, FY 2014 to FY 2021 ................................................27
Figure 10. PFIs’ gross credit risk exposure to energy infrastructure (INR crore) ...................................35
Figure 11. PFIs’ gross credit risk exposure to coal mining projects (INR crore) .......................................36
Figure 12. NPAs in the coal mining sector (INR crore) .................................................................................................36
Figure 13. Thermal capacity target and actual addition in India from FY 2018 to present ...........37
Figure 14. Credit outstanding to clean energy as of March 2021......................................................................38
Figure 15. Credit outstanding to clean energy, as % of total energy-related credit, by category ....................................................................................................................................................................................................39
Figure 16. Annual NBFC disbursements to the renewable energy sector in India (INR crore) ....39
Figure 17. Tax and non-tax revenue by energy type and jurisdiction, FY 2020 ...................................... 43
Figure 18. Energy revenues by jurisdiction as a share (%) of total revenues, FY 2020 ..................44
Figure 19. Central and state oil and gas revenues, FY 2020 (as a % of total) ...................................... 45
Figure 20. Scenarios for government revenue from fossil fuel products, 2019–2050 .....................46
Figure 21. Central and state coal revenues, FY 2020 (as a % of total) ........................................................ 47
Figure 22. Comparison of revenues and externalities by energy sources, FY 2020 (INR crore) 54

IISD.org/gsi xiii
List of Tables
Table ES1. Key findings on public support for energy................................................................................................... vi
Table 1. Updated ambition assessment framework for major energy sector PSUs ............................29
Table 2. Literature review of existing data for fossil fuels and clean energy ...........................................33
Table 3. Quantified central government revenues from renewable energy (INR crore), 2019–2020 ....................................................................................................................................................................................................48
Table 4. Externalities of fossil fuels in India, 2020 .........................................................................................................51
Table 5. Externalities of renewable energy in India, 2020 ........................................................................................53
Table B1. New subsidies—added retrospectively ............................................................................................................ 76
Table C1. List of public finance institutions .........................................................................................................................77
Table D1. Estimates used for climate change ..................................................................................................................78
Table D2. Estimates used for morbidity from air pollution .....................................................................................79
Table D3. Estimates used for mortality from air pollution and value of a statistical life ..............80
Table D4. Estimates used for grid integration ...................................................................................................................81
List of Boxes
Box ES1. Quantifying externalities in the energy system ...........................................................................................x
Box 1. Key highlights on government support for energy ......................................................................................... 11
Box 2. Thermal decommissioning in India ..............................................................................................................................15
Box 3. State-level fisheries fuel subsidies ............................................................................................................................16
Box 4. Case for LPG affordability and Ujjwala 2.0 .........................................................................................................18
Box 5. Maximizing impact from PLI schemes .....................................................................................................................23
Box 6. Biofuel subsidies ........................................................................................................................................................................26
Box 7. Case study: Lessons from India’s leading private-sector energy companies ..........................31
Box 8. Right-to-information requests on PFI lending ................................................................................................ 34
Box 9. Public risks of financing coal ............................................................................................................................................37
Box 10. What about data on finance for coal power and oil and gas? .........................................................38
Box 11. Regulator’s role in directing finance toward the energy transition ................................................41
Box 12. Natural gas pricing .............................................................................................................................................................. 45
Box 13. Investing fuel tax super profits in clean energy and just transition ............................................46
Box 14. Earmarking effectively for clean energy ...........................................................................................................48
Box 15. Traffic accidents and congestion .............................................................................................................................52
xiv
Mapping India's Energy Policy 2022
List of AbbreviationsACC Advanced chemistry cell
AGEL Adani Green Energy Limited
BCD basic customs duty
BPCL Bharat Petroleum Corporation Limited
BSR basic statistical return
CAPEX capital expenditure
CEA Central Electricity Authority
CEEW Council on Energy, Environment and Water
CIL Coal India Limited
CSR corporate social responsibility
DBTL Direct Benefit Transfer of LPG
DFI Development financial institutions
DISCOM distribution company
DMF District Mineral Foundation
DREs decentralized renewables
EBP Ethanol Blended Petrol
EVs electric vehicles
FY fiscal year
GAIL Gas Authority of India Limited
GHG greenhouse gas
GoI Government of India
GST goods and service tax
HPCL Hindustan Petroleum Corporation Limited
IEA International Energy Agency
IISD International Institute for Sustainable Development
IMF International Monetary Fund
IREDA Indian Renewable Energy Development Agency
IOCL Indian Oil Corporation Ltd.
ISTS Inter-State Transmission System
KPI Key performance indicators
LPG liquefied petroleum gas
MoF Ministry of Finance
MoP Ministry of Power
MoPNG Ministry of Petroleum and Natural Gas
MoU Memorandums of understanding
MSME micro, small and medium-sized enterprises
NBP National Balancing Point
NBFCs non-banking financial companies
NCEEF National Clean Energy and Environment Fund
NGFS Network for Greening the Financial System
NPA non-performing asset
ODI Overseas Development Institute
OECD Organisation for Economic Co-operation and Development
OEM Original Equipment Manufacturers
OMC Oil marketing companies
ONGC Oil and Natural Gas Corporation Limited
PAHAL Pratyaksh Hanstantrit Labh
PDS Public Distribution System
PFC Power Finance Corporation
PFI public finance institutions
PIB Press Information Bureau

IISD.org/gsi xv
PLI production-linked incentive
PM-KUSUM Pradhan Mantri Kisan Urja Suraksha evam Utthaan Mahaabhiyan
PMUY Pradhan Mantri Ujjwala Yojana
PNB Punjab National Bank
PPA power purchase agreements
PSA Power sale agreement
PSB public sector banks
PSL Priority sector lending
PSU public sector undertakings
PPAC Petroleum Planning & Analysis Cell
PV photovoltaic
RBI Reserve Bank of India
R&D research and development
RNESL Reliance New Energy Solar Limited
SBI State Bank of India
SGB Sovereign Green Bonds
SDG Sustainable Development Goal
SECI Solar Energy Corporation of India
SOE state-owned Enterprises
SGST State Goods and Services tax
T&D transmission and distribution
TERI The Energy and Resource Institute
TPP thermal power plant
UDAY Ujjwal DISCOM Assurance Yojana
UTs Union Territories
VAT value-added tax
WDL Working days lost
WTO World Trade Organization
WTP willing to pay
VSL value of a statistical life

IISD.org/gsi 1
1.0 IntroductionIn 2021, India ratcheted up its climate ambition and established a new target: to reach net-zero greenhouse gas (GHG) emissions by the year 2070. It also reaffirmed its aim to install 500 GW of non-fossil power capacity by 2030. This is up from 159 GW of non-fossil capacity as of February 2022 (Central Electricity Authority [CEA], 2022). Energy is also critical for many other government objectives, including economic recovery from COVID-19; universal access to clean and modern energy; reducing severe levels of outdoor and indoor air pollution; and energy security.
This study explores the ways that government budgeting is linked to these targets, looking into two key questions. First, what support is provided to different energy sources and is it aligned with objectives? Second, what public revenue is raised from different energy sources, how does it compare with the full external costs of energy, and what does that mean for transition?
Support influences how the energy sector develops and at what speed. It can come in many forms, including subsidies, the investments made by state-owned energy companies (or public sector undertakings [PSUs]) and the lending provided by public financial institutions (PFIs). Well-designed support can help consumers access affordable energy, incentivize producers to invest in reliable, clean energy, and compensate vulnerable groups as part of a just transition. However, badly designed support can slow down change and expose public institutions unnecessarily to the risk of stranded assets, particularly when it is propping up increasingly uncompetitive fossil energy.
Public revenue is raised whenever the government, through measures like taxes and royalties, takes a share of the value generated by energy consumption and production. As the energy transition gathers pace, the share of revenues gathered from fossil energy will fall, requiring strategies to diversify sources of revenue. For maximum economic efficiency, energy prices should reflect the full costs of energy, sending signals that influence consumers and producers. Taxation is one tool that can help bring prices in line with costs. Given the large externalities associated with fossil fuels, no country today fully internalizes the external costs of fossil energy—but acknowledging externalities is important for any assessment of energy’s revenue benefits.
This report gathers the best available data on both energy-related public support and revenues in India. In its first half, on support, it examines energy subsidies, PSU investments, and public finance. In its second half, on public revenue, it examines tax and non-tax revenue-raising instruments and estimates the externalities associated with the different kinds of energy.
It is the latest in a series of reviews of India’s energy subsidies—most recently in Mapping India’s Energy Subsidies 2021 (Viswanathan et al., 2021). All underlying data are available in accompanying spreadsheets, and the latest data on subsidies have been integrated into our accompanying data portal. We aim to provide a useful resource for the Government of India (GoI) and others as national and international processes go forward on shifting government support away from fossil fuels and toward clean energy, including commitments to fossil fuel subsidy reform under the G20, Sustainable Development Goal (SDG) 12.c1, and climate negotiations.

2
Mapping India's Energy Policy 2022
2.0 Context: Ambition and the Path to Net-Zero

IISD.org/gsi 3
India’s Renewed Ambition at COP26At the United Nations Framework Convention on Climate Change’s 26th Conference of Parties (COP 26), the Indian government updated its climate commitments as follows (Ministry of External Affairs, 2021l):
“1. India will take its non-fossil energy capacity to 500 GW by 2030.
2. India will meet 50 percent of its energy2 requirements from renewable energy by 2030.
3. India will reduce the total projected carbon emissions by one billion tonnes from now onwards till 2030.
4. By 2030, India will reduce the carbon intensity of its economy by more than 45 percent.
5. By the year 2070, India will achieve the target of Net Zero.”
The net-zero commitment was hailed by many experts as a significant step forward for efforts to mitigate climate change (Narain, 2021), and the other targets reiterated and ratcheted up India’s longstanding goals. A breakdown by technology of the 500 GW target is not currently stated, but it is likely to follow the broad outlines of analysis by the CEA (2020b), which found that an optimal FY 2030 generation mix would consist of: 280 GW of solar power; 140 GW of wind power; 61 GW of large hydropower; 10 GW of biomass; and 5 GW of small hydropower.
Other Ambitions on Clean EnergyThis adds to a growing list of stated ambitions in the energy sector linked to clean energy, including:
As of early 2022, India has no formal commitments involving the role of PSUs and PFIs in the domestic energy sector.
2 While the announcement stated “energy,” it has since been widely interpreted to mean “electricity.” We therefore refer to a target for 50% of “electricity” requirements to come from clean energy throughout this study.
Becoming “energy independent” by 2047, through a mix of electric mobility and hydrogen.
Enabling universal access to affordable, modern, clean energy as part of SDG 7.
Reducing indoor and outdoor air pollution to safe levels for human health.
Phasing out inefficient fossil fuel subsidies, as part of G20, SDG 12, and Glasgow Climate Pact commitments.
Ending international public finance for unabated coal power abroad as part of G20 commitments.
Making 30% of all new vehicle sales electric by 2030.

4
Mapping India's Energy Policy 2022
The Long Path to Net-ZeroIndia’s path to net-zero is not an easy one. As of the end of February 2022, India has 51 GW of solar PV and 40 GW of wind power, making up 23% of all power capacity (CEA, 2022). A 2030 target of 280 GW and 140 GW, respectively, implies average annual deployment of ~25 GW of solar PV and ~11 GW of wind per year—a steep change in pace and requiring storage solutions to manage variable supply. The pace would continue to ramp up as the transition deepens. It is estimated that 1,689 GW of solar power will be needed by 2050 (Chaturvedi & Malyan, 2021), implying average annual deployment of over 55 GW.
Planning is complicated by a lack of targets for fossil fuel peak, decline, and phase out. Fossil fuels make up the lion’s share of energy supply, around 73% in 2020 (International Energy Agency [IEA], 2021b). Policies continue to support coal, with plans to expand production and build new coal power plants—despite grid-scale solar and wind being cheaper (IEA, 2020a, 2020b; PIB, 2021). CEA’s analysis suggests that coal power capacity will increase to 267 GW by FY 2030, from 204 GW as of the end of February 2022 (CEA, 2020, 2022). The government has also stated intentions for India to become a “natural gas-based economy,” increasing its share in the energy mix from 7.6% to 15% by 2030 (Ministry of Statistics and Programme Implementation, 2021; Press Information Bureau [PIB], 2020). According to Chaturvedi & Malyan, (2021), USD 60 billion of investments are planned in gas infrastructure by 2024.
Officials have suggested that India’s emissions will peak by 2040–2045 (Singh & Lacqua, 2021), but this has not been formalized. For some fuels, peaking could come even sooner, as the target for energy independence by 2047 would imply early efforts to phase out oil products and natural gas. Chaturvedi & Malyan (2021) estimate that coal power capacity must peak by 2040 and decline as much as 99% between 2040 and 2060 to reach net-zero by 2070, while the Institute for Energy Economics and Financial Analysis (2021) suggests that coal capacity might peak as early as 2025. There is also growing consensus on the need for data, policies, and processes to ensure a just transition for workers and communities, which may look very different depending on the sector and local context (Bhushan et al., 2020; Pai, 2021).
A recent Council on Energy, Environment and Water (CEEW) study estimates that reaching peak emissions by 2040 and net-zero by 2070 in India would require investments of USD 10 trillion, at an average of USD 202 billion per year (Singh & Sidhu, 2021). The study further estimates that there is currently a total investment gap of USD 71 billion per year, which could be closed by providing USD 28 billion per year in investment support.
Recent DevelopmentsEnergy policy also continues to be driven by shorter-term developments. In the last year, this includes:
• Efforts to recover from COVID-19. India is estimated to have committed at least USD 150 billion to energy since the pandemic began, with at least USD 44.3 billion for fossil fuels and USD 37.0 billion for clean energy (IISD, n.d.).

IISD.org/gsi 5
• In February 2021, the Minister of Finance announced the launch of a National Hydrogen Mission to generate hydrogen from green sources (PIB, 2021d).
• In August 2021, India achieved a landmark 100 GW of renewable power capacity, excluding large hydro, one of only four nations to achieve this (PIB, 2021g). Record auctions resulted in low tariffs for renewables, including vanilla solar, round-the-clock renewable energy, and solar–wind hybrid projects.
• Late 2021 saw a power crisis, as power demand rebounded from COVID shocks, but thermal power producers failed to stockpile adequate supplies before the monsoon (Garg, 2021).

6
Mapping India's Energy Policy 2022
3.0 Approach

IISD.org/gsi 7
This report is split into two main sections. The first section covers government support for energy, which we define as energy-related subsidies, spending by PSUs, and lending by PFIs. The second section analyzes energy revenues and externalities, which include tax revenues, non-tax revenues, and externalities. “Clean energy” in this publication is defined as renewable energy, EVs, and energy-efficiency measures. It excludes large hydro; nuclear power; palm oil; first-generation biofuels; the capture, utilization, and storage of carbon; and any fossil fuels. The term “clean energy transition” is the process of switching energy systems from high-carbon fossil fuels to clean energy.
Below, we provide a concise summary of the scope and approach that have been used for different areas. In all cases, further detail can be found in the appendices of this report.
SubsidiesOur review of subsidies follows (Garg et al., 2017), using a definition of “subsidy” agreed by all 164 World Trade Organization (WTO) members. It includes direct and indirect transfers, foregone revenue, provision of goods or services below market value and income and price support through regulations. We aim to identify and quantify all central government subsidies in five areas, covering the full chain of production and consumption: coal; oil and gas; electricity transmission and distribution (T&D); renewable energy; and electric vehicles (EVs). The one state-level subsidy in our database is underpriced electricity, which we include because it exists in almost all states and is very large, so its exclusion would be a serious misrepresentation of the energy subsidy landscape in India. Nuclear and large hydropower are excluded due to a lack of data. Wherever possible, estimates are based on official government data. Some subsidies are identified but “non-quantified” due to a lack of data.
Public Sector Undertakings Our review of PSUs follows the approach in Viswanathan et al. (2021), covering 14 central-level energy PSUs and the seven energy Maharatnas (Department of Public Enterprises, 2020). Wholly owned subsidiaries of the PSUs are included, but joint ventures are not considered. PSUs that primarily operate as investors are classified as PFIs. Capital expenditure (CAPEX) data are taken from the Expenditure Budget provided by the Ministry of Finance (MoF) (MoF, 2021b). Due to data unavailability, it has not been possible to update data on project expenditure for FY 2021. The table on ambition gaps was developed by amalgamating publicly reported documents such as press releases, annual reports, and news reports.
Public Finance InstitutionsOur review of PFIs focuses on central government-owned entities (with more than 51% government shareholding) that are engaged in direct lending to energy projects in India, collectively referred to as “central PFIs.” This includes 12 scheduled public sector banks (PSBs) (as classified by the Reserve Bank of India (RBI) [n.d.-a] and three other public companies and non-banking financial companies [NBFCs]) (see Appendix C for full list). Data on their lending are drawn from annual reports, investor presentations, and a review of Basel III framework disclosures, in the case of PSBs. Due to low reporting on lending, we also

8
Mapping India's Energy Policy 2022
refer extensively to data on energy financing in India that have been collected by Oil Change International and Friends of the Earth US, (2021), the Centre for Financial Accountability & Climate Trends (2021), and Fair Finance India (Sreedhar Ramamurthy & Singh, 2019).
Tax and Non-Tax RevenuesOur discussion of taxes follows the Organisation for Economic Co-operation and Development (OECD), which defines them as unrequited payments to the general government budget enforced through legislation (OECD, 2001). “Unrequited” means that the benefits provided by the government to taxpayers are not normally in proportion to their tax payments (OECD, 2001). Compulsory payments, duties, and statutory levies are also considered taxes. Non-tax revenues are all other government revenues not classified as taxes, such as royalties and rents from fossil fuel extraction. The data include revenues from the consumption and production of fossil fuels, renewable energy and electricity, including corporate income tax, tax on dividends, and the goods and services (GST) tax. It does not include spillover benefits from the fossil value chain, such as Indian Railways’ high freight charges on coal that are used to cross-subsidize other rail services.
Given data constraints, for renewables it was only possible to account for revenue related to capital installation of equipment (wind farms and grid-scale solar PV), while fossil revenue covers fuel production and consumption, but not CAPEX. We believe the review nonetheless captures the largest share of revenue linked to each type of energy: CAPEX makes up the largest share of generation costs from renewables (60%–70%) and fuel is the main generation cost (around 75%) for coal-fired generation (Solar Bay, 2020; Soman et al., 2019).
Publications by domestic and international organizations active on tax issues in India were also reviewed. These organizations included: IISD (Garg & Geddes, 2019; Gerasimchuk et al., 2019), the International Monetary Fund (IMF) (Coady, 2019), and the OECD (OECD, 2020a, 2020b). In particular, analysis by Prayas (Energy Group) (2021) was of great assistance, being a pioneering review of India’s fossil fuel revenues and sources.
Energy ExternalitiesExternalities occur when the production or consumption of goods and services imposes costs or benefits on others that are not reflected in the prices charged (OECD, n.d.). Pricing an externality is the most economically efficient way to incentivize behavioural change to avert or lessen damage. The valuation of externalities can help determine the right level of intervention to correct prices (Helbling, 2020). Estimating externalities is challenging because they arise throughout the value chain, and quantification requires assigning financial values to non-financial impacts. Given this complexity, we quantify only a limited number of energy externalities, as follows:
• Petroleum products: Climate change impacts, air pollution (mortality and morbidity), and traffic congestion, deaths, injuries, and vehicle damage.
• Natural gas: Climate change impacts.
• Coal: Climate change impacts, air pollution (mortality and morbidity).
IISD.org/gsi 9
• Solar PV and wind: Climate change impacts and grid balancing costs.
Most externalities were estimated using a two-step process. First, we reviewed literature for estimates of impacts (such as deaths or GHG emissions) caused by each energy type. Second, we reviewed literature to identify an average cost for a unit of each impact, drawing on conservative values. Preference was given to Indian data and sources. The two data points were then multiplied to estimate an externality. To illustrate uncertainty, we also provide a higher estimate based on less conservative but equally valid data. The “less-conservative estimate” is not an upper bound, due to the large number of externalities that were not assessed. The underlying data were collected across a range of years, with 2020 preferences where available, and taken as a proxy for FY 2020.
10
Mapping India's Energy Policy 2022
4.0 Government Support for Energy

IISD.org/gsi 11
Box 1. Key highlights on government support for energy
• Total quantified subsidies in FY 2021 were approximately the same as last year, at INR 2,17,737 crore (USD 29.3 billion). This aggregate has stagnated since FY 2019 and settled at around two thirds of the levels seen in FY 2014.
• Despite good progress on reform, fossil fuel subsidies remain nine times larger than subsidies for renewables and EVs. Due to a fall in year-on-year installations and grid-scale renewables reaching cost parity, support for renewables declined by over INR 9,500 crore (USD 1.3 billion) since FY 2017. However, several existing policies and new commitments suggest subsidies will increase in areas such as manufacturing, decentralized renewables, and green hydrogen.
• At INR 1.4 lakh crore (18.8 USD billion) in FY 2021, CAPEX of PSUs has fallen 16% since FY 2020, due to lockdowns delaying projects—particularly for oil marketing companies (OMCs) and electricity utility NTPC, though it increased for some upstream producers. It is expected to increase as the economy recovers. There has been no update to reporting on PSU projects, making it impossible to assess the exact balance between fossil and clean energy projects in FY 2021. The latest available data show that in FY 2020, the seven Maharatna-level PSUs invested over 11 times more in fossil projects than clean energy.
• PSUs have increased ambition in a number of areas, including some new clean energy targets and partnerships, and commitments to net-zero in operations. However, big ambition gaps remain, including clarity on how to adapt to net-zero and address the risks of fossil-intensive asset portfolios. The private sector provides useful examples for PSUs on transition, on acquiring technology capacity for emerging markets, and business structures to unlock green finance.
• Among PFIs, no data could be identified on annual lending for fossil fuel and clean energy due to a lack of data transparency. For power, the three biggest PFIs alone disbursed INR 190,116 crore in FY 2021. Among financial institutions, PSBs had the lowest outstanding credit for clean energy at only 4.3% of all energy-related outstanding credit. NBFCs are increasingly playing a major role in shifting public finance away from fossil fuels, but no PFIs have established clear plans on phasing out finance for fossil fuels, despite the risks of large-scale asset stranding.
• The government should continue shifting public support away from fossil fuels and toward clean energy in a socially responsible way. PSUs, PFIs, and the ministries who manage them should prepare roadmaps and scenarios on net-zero, identifying short-term actions to contribute to energy transition, including strategies on stranded asset risk, compliance with emerging environmental, social, and governance norms, phasing out finance for fossil fuels, and increasing investment and lending for clean energy to crowd in private investments.
• The Reserve Bank of India (RBI) should focus on enhancing transparency and uniformity in PFI reporting. Considering the global climate urgency, banks and other PFIs should make full information on lending available to all stakeholders. All PFIs should provide transparent and comprehensive transaction-level data on energy financing to increase accountability.

12
Mapping India's Energy Policy 2022
4.1 Energy SubsidiesIn FY 2021, the total quantified subsidies to all energy sources amounted to INR 2,17,737 crore (USD 29.3 billion), approximately the same as last year (see Figure 1). Total subsidies have stagnated since FY 2019 and settled at around two thirds of the levels seen in FY 2014. Notable developments include:
• Coal subsidies declined around 17% in real terms compared to last year, worth INR 12,976 crore (USD 1.7 billion) in FY 2021. The decline can be attributed to an amendment to the Environment Protection Act, where, in previous years, the non-enforcement of a mandate of coal washing had been defined as a subsidy. The FY 2021 amendment removed the coal washing mandate, making it impossible for non-enforcement to exist. It does not, however, amount to a reform—rather, it is simply the removal of a norm intended to reduce air pollution from coal combustion.
• Oil and gas subsidies saw a marginal fall from INR 57,813 crore (USD 7.8 billion) in FY 2020 to INR 55,250 crore (USD 7.4 billion) in FY 2021. This does not yet reflect the withdrawal of DBTL subsidies, suspended since September 2020 (Viswanathan et al., 2021). Actual disbursals for DBTL fell by more than INR 19,000 crore (USD 2.6 billion) in FY 2021. We believe that this is not reflected in our data due to a time lag of around 1 year between disbursals and budgetary allocation.
• Electricity T&D subsidies have grown over 144% in real terms since FY 2014, except for a slight fall in FY 2020. In FY 2021, they reached an all-time high of INR 1,41,895 crore (USD 19.1 billion). Nearly 94% of this—INR 1,33,991 crore (USD 18.0 billion)—are transfers from state governments to enable low-priced electricity, primarily for residential and agriculture consumers.
• In real terms, renewable energy subsidies continued to fall after their peak in FY 2017. In FY 2021, they stood at INR 6,767 crore (USD 0.9 billion). Schemes for the development of solar parks along with off-grid and decentralized solar applications witnessed an aggregate fall in subsidies by INR 385 crore (USD 0.05 billion). This was largely due to falling year-on-year installations and benchmark costs, as well as gradual declines in accelerated depreciation benefits as assets age.
• Total EV subsidies for FY 2021 stood at INR 849 crore (USD 0.1 billion). These are still in nascent stages and represent less than 1% of the total support provided across the five energy types.

IISD.org/gsi 13
Figure 1. Total quantified energy subsidies, FY 2014–FY 2021
Source: Authors’ calculations. Note that a number of subsidy policies have been identified but cannot be quantified due to a lack of transparently available data. See subsequent discussion and accompanying spreadsheets for more details.
4.1.1 Coal
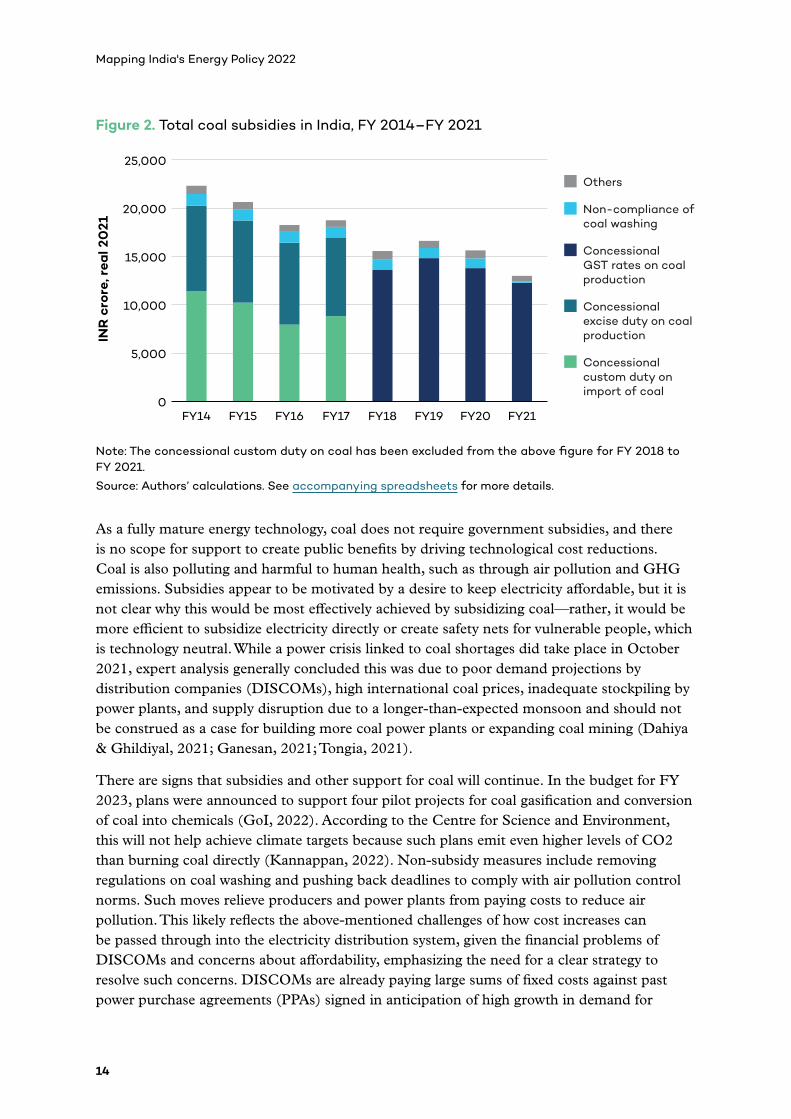
Quantified coal subsidies have steadily declined from INR 22,327 crore (USD 3.0 billion) in FY 2014 to INR 12,976 crore (USD 1.7 billion) in FY 2021. As shown in Figure 2, major subsidies in FY 2021 were:
• A concessional 5% GST rate, against a benchmark of 18% applied to other minerals, which reduces input costs for coal power generation, worth INR 12,268 crore (USD 1.7 billion).
• Earmarks for detailed drilling in non-Coal India Limited [CIL] mining blocks to assess the availability of coal and aid prospective investment decisions, amounting to INR 385 crore (USD 0.05 billion).
• The first months of non-compliance with coal-washing regulation—intended to reduce air pollution—worth INR 132 crore (USD 0.02 billion) until regulation was removed in May 2020.
Other smaller policies cover a range of objectives, including regional exploration, conservation and safety of coal mines, exploration in difficult areas, and special benefits to employees.
INR
cro
re, r
eal 2
021
Renewableenergy
Electricvehicles
Transmissionand distribution
Oil and gas
Coal
0
50,000
100,000
150,000
200,000
250,000
300,000
350,000
FY14 FY15 FY16 FY17 FY18 FY19 FY20 FY21
14
Mapping India's Energy Policy 2022
Figure 2. Total coal subsidies in India, FY 2014–FY 2021
Note: The concessional custom duty on coal has been excluded from the above figure for FY 2018 to FY 2021.
Source: Authors’ calculations. See accompanying spreadsheets for more details.
As a fully mature energy technology, coal does not require government subsidies, and there is no scope for support to create public benefits by driving technological cost reductions. Coal is also polluting and harmful to human health, such as through air pollution and GHG emissions. Subsidies appear to be motivated by a desire to keep electricity affordable, but it is not clear why this would be most effectively achieved by subsidizing coal—rather, it would be more efficient to subsidize electricity directly or create safety nets for vulnerable people, which is technology neutral. While a power crisis linked to coal shortages did take place in October 2021, expert analysis generally concluded this was due to poor demand projections by distribution companies (DISCOMs), high international coal prices, inadequate stockpiling by power plants, and supply disruption due to a longer-than-expected monsoon and should not be construed as a case for building more coal power plants or expanding coal mining (Dahiya & Ghildiyal, 2021; Ganesan, 2021; Tongia, 2021).
There are signs that subsidies and other support for coal will continue. In the budget for FY 2023, plans were announced to support four pilot projects for coal gasification and conversion of coal into chemicals (GoI, 2022). According to the Centre for Science and Environment, this will not help achieve climate targets because such plans emit even higher levels of CO2 than burning coal directly (Kannappan, 2022). Non-subsidy measures include removing regulations on coal washing and pushing back deadlines to comply with air pollution control norms. Such moves relieve producers and power plants from paying costs to reduce air pollution. This likely reflects the above-mentioned challenges of how cost increases can be passed through into the electricity distribution system, given the financial problems of DISCOMs and concerns about affordability, emphasizing the need for a clear strategy to resolve such concerns. DISCOMs are already paying large sums of fixed costs against past power purchase agreements (PPAs) signed in anticipation of high growth in demand for
Concessionalcustom duty onimport of coal
Concessionalexcise duty on coalproduction
ConcessionalGST rates on coalproduction
Non-compliance ofcoal washing
Others
0
5,000
10,000
15,000
20,000
25,000
FY14 FY15 FY16 FY17 FY18 FY19 FY20 FY21
INR
cro
re, r
eal 2
021

IISD.org/gsi 15
power that did not actually materialize. Box 2 provides a case for early retirement of old and inefficient coal power plants to reduce financial burdens on DISCOMs and allow space for more renewable energy.
Box 2. Thermal decommissioning in India
Slow retirement of old and inefficient thermal assets, combined with low demand growth in 2019 and 2020 and improving economics of renewables, has resulted in a buildup of inefficient plants (Singh & Sharma, 2021), which have been able to persist due to protection from competition through long-term PPAs and access to cheap coal. To improve efficiency and accommodate transition, India can retire early (decommission) some of its excess coal capacity.
According to Ganesan and Narayanaswamy (2021), an accelerated decommissioning of 30 GW worth of surplus capacity, identified on the basis of thermal efficiency, can result in annual savings of INR 8,944 crore (USD 1.2 billion) to DISCOMs (Ganesan & Narayanaswamy, 2021). It would also result in a one-time saving of INR 10,200 crore (USD 1.4 billion) in avoided pollution-control retrofits (Ganesan & Narayanaswamy, 2021). Annual savings correspond to a meagre 1%–2% of DISCOMs’ annual power procurement costs. However, by clearing out the stock of inefficient assets, we can create fresh breathing room and make a case for more investment in the sector—in clean energy, storage, and system upgrades, among others. Prayas (Chirayil & Sreenivas, 2021) has argued for market-based mechanisms, such as merit order dispatch and an inefficiency adder, to penalize inefficient plants, which could achieve similar objectives as decommissioning but at a lower cost.
Any attempts toward decommissioning, therefore, should be preceded by development of key performance indicators that would help identify units for retirement (Ganesan & Narayanaswamy, 2021). These should be further complemented by analyzing the impacts of decommissioning and other strategies on technical operations of the grid and future supply adequacy as well as socio-economic impacts.
An appropriate decommissioning strategy would be one that is acceptable to the ratepayers, investors, and workers. Workers dependent on coal for employment are anxious that they will bear the brunt of the transition. Therefore, a three-pronged approach should be adopted, involving: (1) refinancing investment in thermal capacity to fund coal transition, (2) creating incentives for channelling the unlocked funds into renewable energy initiatives and (3) developing transitional funding support for coal-dependent workers and communities (Bodnar et al., 2020). Further, the development and enforcement of post-decommissioning remediation and redevelopment guidelines for coal-mining regions should be made an integral part of the retirement process.

16
Mapping India's Energy Policy 2022
4.1.2 Oil and Gas
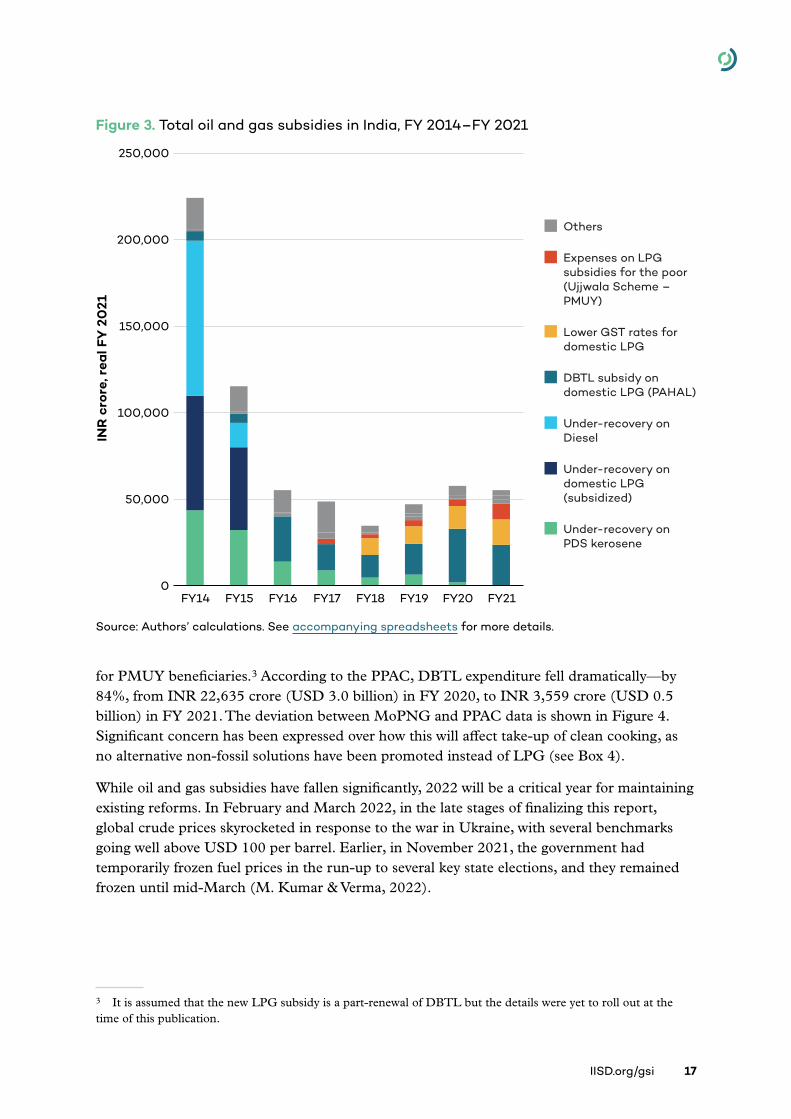
In real terms, quantified oil and gas subsidies have fallen from INR 224,199 crore (USD 30.2 billion) in FY 2014 to INR 55,250 crore (USD 7.4 billion) in FY 2021. This is partly due to variation in international crude prices since FY 2014 but also meaningful progress on fossil fuel subsidy reform, including the removal of diesel and kerosene subsidies. As shown in Figure 3, major subsidies for FY 2021 are:
• Lower GST rate of 5% for domestic LPG, against the benchmark rate of 18%, worth INR 14,721 crore (USD 2.0 billion).
• LPG connection subsidies to PMUY beneficiaries worth INR 9,235 crore (USD 1.2 billion).
• The DBTL (or Pratyaksh Hanstantrit Labh) scheme, worth INR 23,667 crore (USD 3.2 billion), which transfers cash to LPG consumers to improve affordability of refills. Notably, this was suspended from September 2020 to May 2022. For accounting reasons, we expect changes in expenditure to show up in reporting in FY 2022.
• Capital outlay on petroleum for exploration, strategic investment, and infrastructure development, worth INR 2,313 crore (USD 0.3 billion).
• Phulpur Dhamra Haldia natural gas pipeline project, worth INR 728 crore (USD 0.1 billion).
Our data include only central-level oil and gas subsidies. Some significant subsidies also exist at the state level, such as fuel subsidies for fishers (see Box 3) and farmers who use diesel pumps for irrigation.
Box 3. State-level fisheries fuel subsidies
Several states offer fuel subsidies on diesel and kerosene to marine fishers. A recent IISD report estimates that these have grown from INR 304 crore (USD 0.05 billion) in FY 2016 to INR 736 crore (USD 0.1 billion) in FY 2019, a growth of 142% (Sharma, Bellmann, et al., 2021), based on reporting by eight coastal states and UTs in India’s WTO notification—Andhra Pradesh, Daman & Diu, Goa, Gujarat, Karnataka, Kerala, Puducherry, and Tamil Nadu. The highest fuel subsidies are offered for diesel and are often conferred through reimbursement or exemption from sales tax. Subsidized kerosene is sold at low prices through specific retail outlets accessible to fishers only.
Following the crude oil price crash, it became clear in September 2020 that the central government had withdrawn DBTL price support for LPG consumers. This move should have resulted in reduced LPG subsidy outlay. However, these are not reflected in our estimates for FY 2021, which are drawn from the Ministry of Petroleum and Natural Gas (MoPNG). While this is the most official source of data, there appears to be a time lag between the disbursal of subsidies to beneficiaries by the Petroleum Production and Analysis Cell (PPAC), and subsequent payments from MoPNG to PPAC. From the perspective of beneficiaries, the DBTL has been suspended since September 2020 but reintroduced in May 2022 exclusively
IISD.org/gsi 17
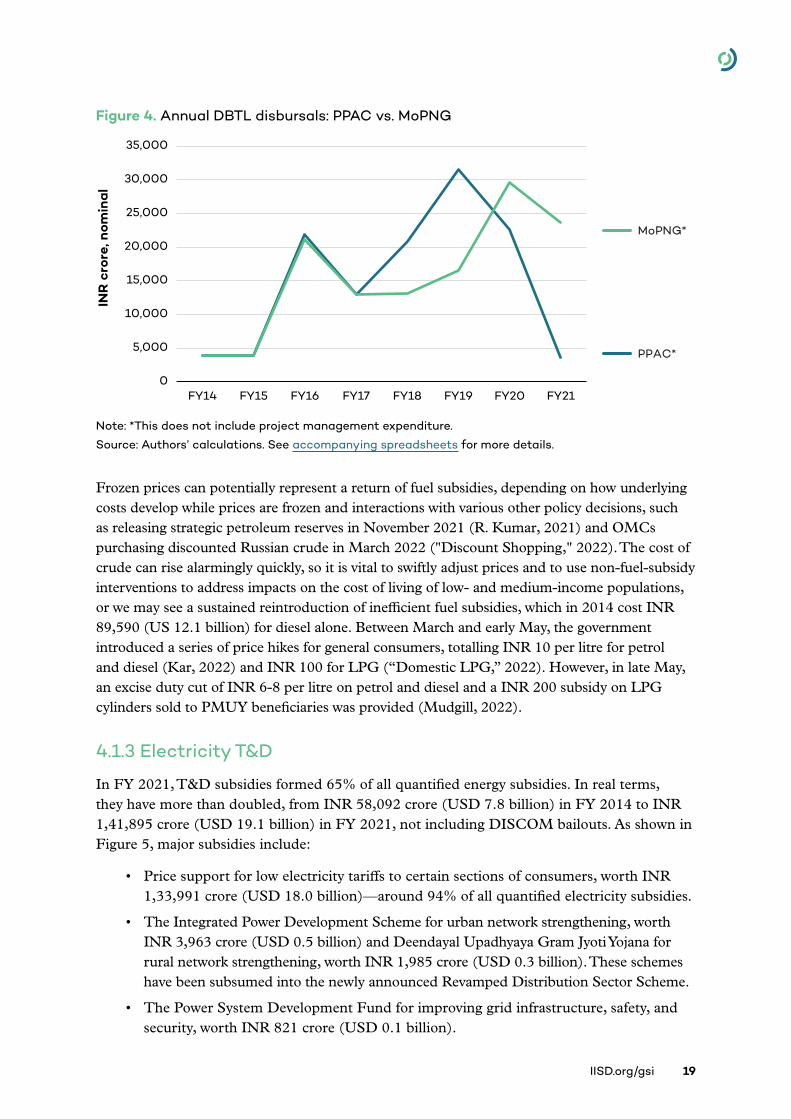
for PMUY beneficiaries.3 According to the PPAC, DBTL expenditure fell dramatically—by 84%, from INR 22,635 crore (USD 3.0 billion) in FY 2020, to INR 3,559 crore (USD 0.5 billion) in FY 2021. The deviation between MoPNG and PPAC data is shown in Figure 4. Significant concern has been expressed over how this will affect take-up of clean cooking, as no alternative non-fossil solutions have been promoted instead of LPG (see Box 4).
While oil and gas subsidies have fallen significantly, 2022 will be a critical year for maintaining existing reforms. In February and March 2022, in the late stages of finalizing this report, global crude prices skyrocketed in response to the war in Ukraine, with several benchmarks going well above USD 100 per barrel. Earlier, in November 2021, the government had temporarily frozen fuel prices in the run-up to several key state elections, and they remained frozen until mid-March (M. Kumar & Verma, 2022).
3 It is assumed that the new LPG subsidy is a part-renewal of DBTL but the details were yet to roll out at the time of this publication.
Figure 3. Total oil and gas subsidies in India, FY 2014–FY 2021
Source: Authors’ calculations. See accompanying spreadsheets for more details.
Under-recovery onPDS kerosene
Under-recovery ondomestic LPG(subsidized)
Under-recovery onDiesel
DBTL subsidy ondomestic LPG (PAHAL)
Lower GST rates fordomestic LPG
Expenses on LPGsubsidies for the poor(Ujjwala Scheme – PMUY)
Others
0
50,000
100,000
150,000
200,000
250,000
FY14 FY15 FY16 FY17 FY18 FY19 FY20 FY21
INR
cro
re, r
eal F
Y 2
021

18
Mapping India's Energy Policy 2022
Box 4. Case for LPG affordability and Ujjwala 2.0
In August 2021, the Ujjwala 2.0 scheme was launched to help households convert from traditional cooking to LPG, with a deposit-free LPG connection, a free hot plate, and first full refill (14.2 kg). It aims to increase LPG access to 90% of households, up from 85% in 2020 (Mani et al., 2021; MoPNG, n.d.). Concerns, however, have been raised that the suspension of the DBTL—subsidies for refills—will hurt sustained uptake, especially in rural areas. Mani et al. (2021) estimate that a market price of INR 800 (USD 10.8) per refill would require the poorest rural households to increase cooking energy expenditure threefold. Given the income shocks from COVID-19, the reform is expected to push households toward firewood—resulting in indoor air pollution and associated health hazards. Mani et al. (2021) estimate that a price of INR 450 (USD 6.1) per refill would be needed for the majority of households to make an exclusive shift to LPG.
At the same time, there are major unresolved questions about the effectiveness of LPG consumer subsidies. The subsidies appear to be badly targeted: survey research in Jharkhand found that over 50% of benefits were captured by the top two wealth quintiles, while less than 30% went to the bottom two quintiles (Sharma, Moerenhout, et al., 2021). And, even with the DBTL in place, 2018 surveys in a range of states found many households using biomass fuel alongside LPG due to high costs and limited availability:
• 73% of rural households in Bihar, Madhya Pradesh, Rajasthan, and Uttar Pradesh reported using a traditional chulha stove to cook some or all foods (Gupta et al., 2019).
• 55% of LPG-using urban and rural households in Jharkhand and Chhattisgarh reported using LPG as well as traditional biomass fuel for cooking (Sharma et al., 2019).
• 55% of PMUY households in Bihar, Jharkhand, Madhya Pradesh, Odisha, Uttar Pradesh, and West Bengal states reported stacking LPG with biomass fuel, though only 27% of non-PMUY households engaged in stacking, suggesting that stacking may decrease in the years after LPG is first used (Jain et al., 2018).
In the short term, targeting subsidies seems to be the best approach, along with efforts to improve distribution and create opportunities for women in LPG value chains (Patnaik & Mani, 2019; Sharma et al., 2021). To that end, the move to provide INR 200 subsidy on LPG cylinders in May 2022 exclusively to PMUY beneficiaries is a welcome move. In the medium term, India needs a roadmap for clean cooking that includes the incubation of non-fossil cooking solutions—such as electric pressure cookers, insulated electric frying pans, and hot plates—and a pathway for shifting support to such alternatives. Subsidies for non-LPG cooking technologies could be funded through savings from LPG subsidy targeting, and LPG subsidies could ultimately be phased out as alternative solutions become feasible at scale.
IISD.org/gsi 19
Figure 4. Annual DBTL disbursals: PPAC vs. MoPNG
Note: *This does not include project management expenditure.
Source: Authors’ calculations. See accompanying spreadsheets for more details.
Frozen prices can potentially represent a return of fuel subsidies, depending on how underlying costs develop while prices are frozen and interactions with various other policy decisions, such as releasing strategic petroleum reserves in November 2021 (R. Kumar, 2021) and OMCs purchasing discounted Russian crude in March 2022 ("Discount Shopping," 2022). The cost of crude can rise alarmingly quickly, so it is vital to swiftly adjust prices and to use non-fuel-subsidy interventions to address impacts on the cost of living of low- and medium-income populations, or we may see a sustained reintroduction of inefficient fuel subsidies, which in 2014 cost INR 89,590 (US 12.1 billion) for diesel alone. Between March and early May, the government introduced a series of price hikes for general consumers, totalling INR 10 per litre for petrol and diesel (Kar, 2022) and INR 100 for LPG (“Domestic LPG,” 2022). However, in late May, an excise duty cut of INR 6-8 per litre on petrol and diesel and a INR 200 subsidy on LPG cylinders sold to PMUY beneficiaries was provided (Mudgill, 2022).
4.1.3 Electricity T&D
In FY 2021, T&D subsidies formed 65% of all quantified energy subsidies. In real terms, they have more than doubled, from INR 58,092 crore (USD 7.8 billion) in FY 2014 to INR 1,41,895 crore (USD 19.1 billion) in FY 2021, not including DISCOM bailouts. As shown in Figure 5, major subsidies include:
• Price support for low electricity tariffs to certain sections of consumers, worth INR 1,33,991 crore (USD 18.0 billion)—around 94% of all quantified electricity subsidies.
• The Integrated Power Development Scheme for urban network strengthening, worth INR 3,963 crore (USD 0.5 billion) and Deendayal Upadhyaya Gram Jyoti Yojana for rural network strengthening, worth INR 1,985 crore (USD 0.3 billion). These schemes have been subsumed into the newly announced Revamped Distribution Sector Scheme.
• The Power System Development Fund for improving grid infrastructure, safety, and security, worth INR 821 crore (USD 0.1 billion).
0
5,000
10,000
15,000
20,000
25,000
30,000
35,000
FY14 FY15 FY16 FY17 FY18 FY19 FY20 FY21
INR
cro
re, n
omin
al
PPAC*
MoPNG*
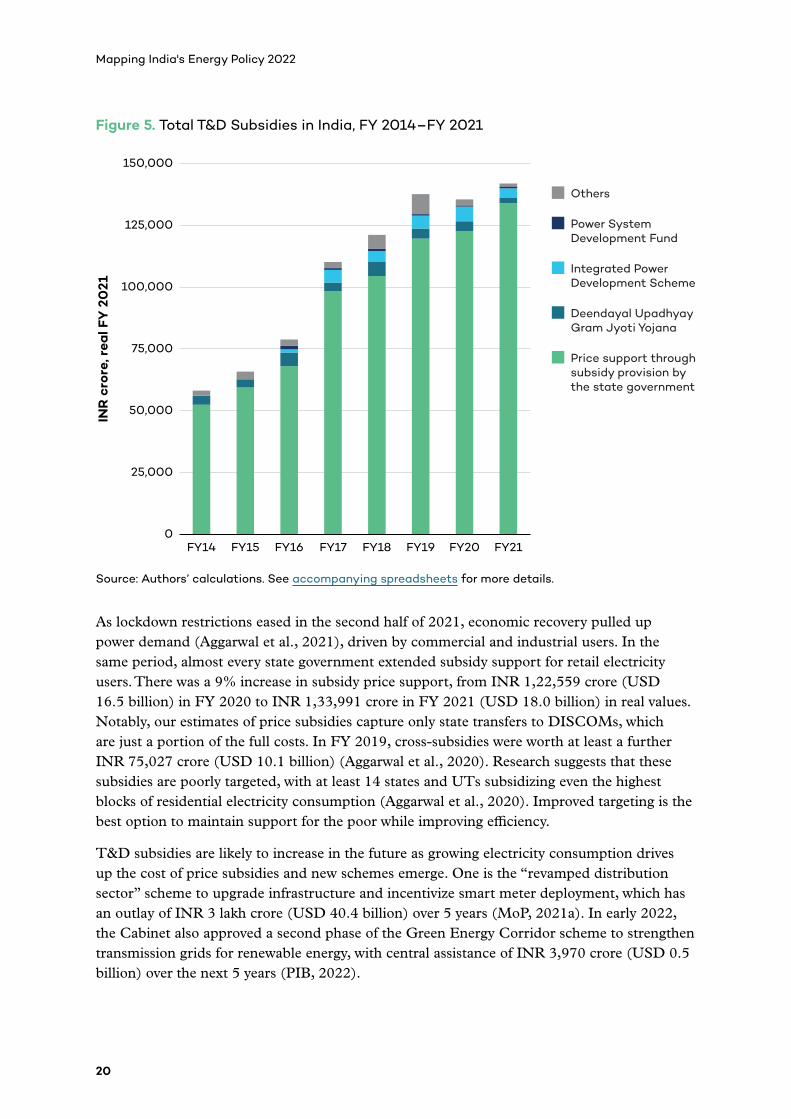
20
Mapping India's Energy Policy 2022
Figure 5. Total T&D Subsidies in India, FY 2014–FY 2021
Source: Authors’ calculations. See accompanying spreadsheets for more details.
As lockdown restrictions eased in the second half of 2021, economic recovery pulled up power demand (Aggarwal et al., 2021), driven by commercial and industrial users. In the same period, almost every state government extended subsidy support for retail electricity users. There was a 9% increase in subsidy price support, from INR 1,22,559 crore (USD 16.5 billion) in FY 2020 to INR 1,33,991 crore in FY 2021 (USD 18.0 billion) in real values. Notably, our estimates of price subsidies capture only state transfers to DISCOMs, which are just a portion of the full costs. In FY 2019, cross-subsidies were worth at least a further INR 75,027 crore (USD 10.1 billion) (Aggarwal et al., 2020). Research suggests that these subsidies are poorly targeted, with at least 14 states and UTs subsidizing even the highest blocks of residential electricity consumption (Aggarwal et al., 2020). Improved targeting is the best option to maintain support for the poor while improving efficiency.
T&D subsidies are likely to increase in the future as growing electricity consumption drives up the cost of price subsidies and new schemes emerge. One is the “revamped distribution sector” scheme to upgrade infrastructure and incentivize smart meter deployment, which has an outlay of INR 3 lakh crore (USD 40.4 billion) over 5 years (MoP, 2021a). In early 2022, the Cabinet also approved a second phase of the Green Energy Corridor scheme to strengthen transmission grids for renewable energy, with central assistance of INR 3,970 crore (USD 0.5 billion) over the next 5 years (PIB, 2022).
Others
Power SystemDevelopment Fund
Integrated PowerDevelopment Scheme
Deendayal UpadhyayGram Jyoti Yojana
Price support throughsubsidy provision bythe state government
0
25,000
50,000
75,000
100,000
125,000
150,000
FY14 FY15 FY16 FY17 FY18 FY19 FY20 FY21
INR
cro
re, r
eal F
Y 2
021

IISD.org/gsi 21
4.1.4 Renewable Energy
In real terms, renewable energy subsidies have risen from INR 4,463 crore (USD 0.6 billion) in FY 2014 to INR 6,767 crore (USD 0.9 billion) in FY 2021. However, after peaking in FY 2017, they have fallen by 59%, largely due to a fall in year-on-year installations and grid-scale solar PV and wind reaching cost parity. As shown in Figure 6, the major quantified subsidies in FY 2021 for renewable energy were:
• Accelerated depreciation for wind and solar, worth INR 1,562 crore (USD 0.2 billion).
• Generation-based incentive for wind and solar, worth INR 1,067 crore (USD 0.1 billion).
• Lower GST and customs duty for wind power, worth INR 899 crore (USD 0.1 billion).
• Waiver of interstate transmission system (ISTS) charges for solar and wind power, at INR 1,043 crore (USD 0.1 billion). Due to an increase in renewable energy generation in FY 2021, ISTS charges increased more than twofold since last year at INR 451 crore (USD 0.06 billion). The Ministry of Power has extended the waiver until June 30, 2025 (MoP, 2021b).
Figure 6. Total renewable subsidies in India, FY 2014–FY 2021
Source: Authors’ calculations. See accompanying spreadsheets for more details.
In August 2021, India surpassed 100 GW of installed renewable energy capacity (excluding large hydro), becoming the fourth nation to achieve the feat (PIB, 2021g). On-grid solar and wind projects formed the majority of this at around 40 GW each, while rooftop solar and biomass generation contributed a further 6 GW and 9.5 GW, respectively (Ministry of New and Renewable Energy, 2022). Record low tariffs were discovered for various auction
Others
Financing and non-financing schemes
Generation BasedIncentive (GBI)
Tax breaks on exciseand custom duty: Solar
Tax breaks on exciseand custom duty: Wind
Accelerateddepreciation0
2,000
4,000
6,000
8,000
10,000
12,000
14,000
16,000
18,000
FY14 FY15 FY16 FY17 FY18 FY19 FY20 FY21
INR
cro
re, r
eal F
Y 2
021

22
Mapping India's Energy Policy 2022
formats, including conventional solar PV, round-the-clock renewable energy and solar–wind hybrid projects. Success has also given rise to challenges: several state DISCOMS have been expecting further low tariffs and have refrained from signing new PPAs, reneged on past PPAs, or started renegotiating past tariffs (Financial Express, 2021; Garg, Gulia, et al., 2021a; Joshi, 2021). Investor confidence has also been influenced by the curtailment of power purchases from renewable energy generators in states like Andhra Pradesh and Tamil Nadu, despite their must-run status. Going forward, it will be important to ensure contract sanctity for continued investment, as in the March 2022 decision by Andhra Pradesh’s high court to uphold PPAs agreed with the wind and solar independent power producers (“Discount Shopping,” 2022).
Further, there is a large gap between current trends and 2030 targets, for which India will need to deploy on average 25 GW of solar PV and 11 GW of wind power per year. The Standing Committee on Energy (2022) estimates that this will require INR 1.5 to 2 lakh crore (USD 20.1 to 27.0 billion) of investment per year, compared to around INR 75,000 crore (USD 10.1 billion) today. Increased support may be needed to leverage such investment, by ensuring the provision of the right infrastructure in generation, integration, transmission, and distribution. For mature technologies, it may be natural for subsidies to decline, and for public support to shift toward other forms, such as PFI lending—see the review of PFIs for information on equity infusions in FY 2022. Recent policy decisions suggest that subsidy support will grow for some less-mature activities and technologies—in particular, manufacturing, decentralized energy, and green hydrogen.
To support manufacturing, two production-linked incentive (PLI) schemes were announced in FY 2021: one on high-efficiency solar PV modules and one on advanced chemistry cell (ACC) battery storage. The government is prioritizing manufacturing because clean energy targets will create massive demand, which cannot currently be met by domestic production. Today, nearly 80%–90% of needs for solar PV and all needs for ACC batteries are met through imports (Mishra & Ghosh, 2020; PIB, 2021b). The new schemes aim for capacity of 10 GW for integrated solar PV manufacturing plants, 50 gigawatt-hours (GWh) for ACC batteries, and 5 GWh for niche ACC batteries (PIB, 2021a, 2021b) by incentivizing backward integration and local value addition, thereby enhancing energy security and catalyzing job creation. This will result in increased subsidy expenditure, with a cumulative budgeted outlay of INR 22,600 crore (USD 3 billion) over 5 years (PIB, 2021a, 2021b). In the short run, however, they are unlikely to be sufficient unless well-coordinated with other mechanisms (see Box 5).
For decentralized renewables (DREs), several schemes already exist that should see subsidy support rise in future years. To date, however, there have been big differences between expenditure and budgets. As reported in Garg et al. (2020), the PM-KUSUM scheme on solar irrigation and Phase II of the Grid Connected Rooftop Solar Programme were approved in FY 2019, together budgeted at INR 58,000 crore (USD 7.8 billion) over 3 years. The schemes aim to build 25 GW and 40 GW of capacity, respectively. No expenditure was reported under the KUSUM scheme until FY 2021. However, according to the MoF (2022), this is planned to increase to INR 690 crore (USD 0.1 billion) in FY 2022 and INR 1,716 crore (USD 0.2 billion) in FY 2023. For rooftop solar, expenditure of INR 262 crore (USD 0.04 billion) was reported for FY 2020 and INR 297 crore (USD 0.04 billion) for FY 2021.

IISD.org/gsi 23
Box 5. Maximizing impact from PLI schemes
In the past, policy uncertainty has hampered the success and uptake of PLI schemes. The basic customs duty (BCD) on solar cells was introduced to support domestic manufacturers but has come under criticism for depressing deployment in the short-term while failing to provide adequate long-term certainty for investments in manufacturing (Viswanathan et al., 2021). This uncertainty has continued: the BCD was suspended from July 2021 onwards and would be reintroduced starting April 2022, to a level of 40% on solar modules and 25% on solar cells (Prasad & Bhaskar, 2021). It can also be noted that incentives under the PLI schemes relate to actual sales and, hence, would only be paid post-commissioning. This does not resolve the challenge of sourcing high upfront finance for manufacturing facilities, with long gestation periods, from domestic banks at competitive rates, particularly for new entrants. Such challenges may be further compounded by the risk of delays in disbursal of funds as observed under the Special Incentive Package Scheme and Modified Special Incentive Package Scheme (Garg et al., 2020).
Going forward, it will be important to harmonize measures on manufacturing. In the long run, the PLI should be supported with research and development incentives to stir innovation, and a clear direction on how medium, small, and micro-sized enterprises can be involved in developing a self-sustained manufacturing ecosystem. In the short run, the PLI should be supported by medium-term certainty on issues such as tax rebates, the BCD, and domestic content requirements, with clearly defined sunset clauses. State governments can also play a crucial role by providing conducive environments through faster land clearance and supportive regulation (Garg, Gulia, et al., 2021b).
In part, this likely reflects the huge challenges that DRE faced in FY 2021, as COVID-19 created new complications for deployment and reduced consumer buying power, as well as the time taken to translate state allocations into capacity on the ground and the extent to which DRE is still some years behind the maturity of large-scale on-grid solar PV and wind. It also conforms to a general trend over the past years of actual expenditure on clean energy being lower than budgeted. Further efforts may be required to address regulatory barriers and capacity challenges for DRE stakeholders—both implementing agencies and beneficiaries—to unlock DRE’s full potential. It may also be necessary to address linkages between support for grid-scale renewables and DRE. The extension of the waiver on interstate transmission charges until June 2025 (MoP, 2021b) will reduce the cost of balancing grid-scale renewables—but, unintentionally, it undermines the economic case for DRE, where lower T&D costs are a key contribution to overall reduced power system costs (Rahman et al., 2021).
For green hydrogen, the government announced a Green Hydrogen Mission in August 2021, intended to help scale up production and use (PIB, 2021h). This is intended to help decouple emissions from growth in hard-to-abate industries such as steel, refineries, fertilizers, and heavy-duty transport (Biswas et al., 2020; PIB, 2021) while boosting demand for renewable energy generation and reducing import dependence on liquefied natural gas, which presently stands at approximately INR 67,383 crore in FY 2020 (MoPNG, 2021). According to the

24
Mapping India's Energy Policy 2022
MoF (2022), however, no budget was allocated to this mission in FY 2022, and only a nominal placeholder amount appears to have been allocated in FY 2023.
Currently, green hydrogen costs around twice as much as hydrogen from fossil sources (Council on Energy, Environment and Water Centre for Energy Finance [CEF], 2021). Additionally, it requires huge investments, to the tune of USD 44 billion by 2030, for setting up distribution infrastructure (Ghosh, 2021). Under the recently published Green Hydrogen Policy, the central government has announced a waiver of ISTS charges, prompt approval of open access applications, and a banking facility for renewable energy used to make green hydrogen or ammonia (PIB, 2022). In future years, these incentives are likely to be supported through a PLI scheme for setting up electrolyzer manufacturing facilities, creating use-obligations for refinery and fertilizer industries, and viability gap funding for heavy-duty fuel-cell EVs. PSUs and private investors have already announced a slew of investments, with the Solar Energy Corporation of India (SECI) (2021) announcing a tender to set up a 25 kW green hydrogen power plant. The government can also promote low-cost renewables for decentralized hydrogen production through end-to-end electrolyzer manufacturing facilities and creating a dedicated research and development fund for improving the commercial viability of green hydrogen (Biswas & Ganesan, 2021; Biswas et al., 2020; CEEW CEF, 2021).
4.1.5 Electric Vehicles and Alternative Motor Fuels
EV subsidies in FY 2021 were worth INR 849 crore (USD 114 million). They have tripled since FY 2017 but still only constitute 0.4% of total quantified energy subsidies. As shown in Figure 7, the major subsidies in FY21 were:
• The Faster Adoption and Manufacturing of Hybrid and Electric Vehicles scheme, worth INR 318 crore (USD 0.04 billion).
• A concessional GST rate on electric two- and three-wheelers worth INR 331 crore (USD 0.05 billion).
• A concessional GST rate on electric buses worth INR 108 crore (USD 0.01 billion).
Nearly 1,33,800 EV sales were registered in India during FY 2021 (CEEW CEF, n.d.), most two- and three-wheelers. CEEW-CEF analysis suggests that annual EV sales across all categories could reach 23.6 million by FY 2030, representing a USD 180 billion (INR 133 lakh crore) investment opportunity in vehicle production (including two-wheelers, three-wheelers, as well as private and commercial cars) and charging infrastructure from FY 2021–2030 (Singh et al., 2020). To support these ambitions, the central government has announced a PLI scheme to augment domestic manufacturing, with a budget of INR 26,058 crore (PIB, 2021i) (USD 3.5 billion), extended the Faster Adoption and Manufacturing of Hybrid and Electric Vehicles scheme for 2 years after March 31, 2022 (PIB, 2021), and increased the incentive for two-wheelers by 50% (PIB, 2021). Through a Vehicle Scrappage Policy, it also intends to nudge owners to discard old and polluting vehicles, and take advantage of incentives on new ones (PIB, 2021j). Alongside state policies, this will boost demand and prompt legacy manufacturers to invest in advanced automotive technology.

IISD.org/gsi 25
Box 6. Biofuel subsidies
Biofuels are produced from biomass and used instead of (or blended with) conventional fuels, such as petrol and diesel. India’s National Policy on Biofuels, 2018 differentiates between first-generation and advanced biofuels (GoI, 2018). First-generation biofuels are primarily produced from food crops such as grains, maize, and sugarcane. They have frequently evoked concerns about the competing use of agricultural land for food crops or energy—i.e., “food vs. fuel”—and poor life-cycle emissions, including from indirect land-use change. MoPNG (2018) defines advanced biofuels as fuels that are produced from agriculture and forest residues, provide a significant reduction in GHG emissions, and do not compete for land. To create demand, an Ethanol Blended Petrol (EBP) program was introduced in 2003 (MoPNG, n.d.-b). It requires a certain share of gasoline to be blended with ethanol, specified from time to time. Figure 8 summarizes actual production and blending rates since FY 2017. Originally, ethanol could only be produced from non-food feedstocks, but, since 2018, this has been expanded to include sugarcane juice, damaged food grains, surplus rice, and maize (GoI, 2018), raising concerns that the policy is promoting first-generation biofuels. More recently, the government has announced a roadmap targeting 20% blending by 2025 (PIB, 2021c) and an INR 2 per litre reduction in excise duty for blended fuel (GoI, 2022).
Biofuel blending mandates are commonly defined as subsidies because they require private consumers to transfer financial benefits to biofuel producers whenever they purchase fuel, and typically the regulation exists because doing so is not economically competitive on its own terms. It has not been possible to estimate the possible financial value of the EBP in our database this year, but we plan to quantify the extent of subsidy support in future years. Other subsidies include interest subvention schemes for augmentation of production capacity, reduction in the GST on ethanol, and promotion of advanced biofuels projects under the Pradhan Mantri Ji-Van Yojana. Independent estimates suggest that the EBP alone resulted in foregone gasoline taxation of INR 10,950 crore (USD 1.4 billion) in Ethanol Supply Year (ESY) 2020–21 (Rakesh Sarwal et al., 2021)—over 12 times the value of all support provided for EVs.
Figure 8. Demand for ethanol by PSUs under EBP, ESY 2017 to ESY 2021
Note: The blending mandate during the same period was 10%. *Provisional: From December 1, 2020 to May 31, 2021.
0
2
4
6
8
10
0
50
100
150
200
2016–17
2017–18
2018–19
2019–20
2020–21*
2016–17
2017–18
2018–19
2019–20
2020–21*
Ethanol received by PSUs (cr. ltr) Actual blending rate (%)

26
Mapping India's Energy Policy 2022
Figure 7. Total subsidies to EVs in India, FY 2014–FY 2021
Source: Authors’ calculations. See accompanying spreadsheets for more details.
Shrimali (2020) suggests that e-two-wheelers, e-three-wheelers, four-wheeler taxis, and buses are already cost competitive with conventional vehicles based on lifetime costs. Innovative financing instruments, such as annualization, could help incentivize early adoption. Annualization helps owners spread the total cost of an EV over its useful life. EV roaming—where drivers can pay for charging anywhere, regardless of the network operator—can help address range concerns, increasing the discoverability, access, and convenience of charging, reducing barriers to entry, and providing operational flexibility (CEEW CEF, 2020). Such measures can be aided by a strong regulatory push on annual targets for compliance and strengthening existing corporate average fuel economy standards for Indian automobile manufacturers (Kaur, 2021).
4.2 The Role of Public Sector Undertakings in India’s Energy TransitionIndia’s state-owned enterprises, nationally known as public sector undertakings (PSUs), play a major role in the energy sector. They account for over 50% of power generation, 90% of electricity distribution, 90% of coal mining, 57% of crude oil refining, and almost 100% of the distribution of petroleum products (Viswanathan et al., 2021). We examine how major energy-related PSUs have invested from FY 2014 to FY 2021 and how ambition has evolved since our last review.
Concession of exciseduty on EVs
Concessional GSTon EV buses
Concessional GSTon EV cars
Concessional GSTon EV 2w and 3w
Faster adoption andmanufacturing of(hybrid and) electricvehicles
0
250
500
750
1,000
1,250
FY14 FY15 FY16 FY17 FY18 FY19 FY20 FY21
INR
cro
re, r
eal F
Y 2
021

IISD.org/gsi 27
4.2.2 Investment Trends of PSUs
In FY 2021, CAPEX from the 14 largest energy PSUs stood at INR 1.4 lakh crore (18.8 USD billion) (MoF, 2021b). This is a 16% reduction from FY 2020, attributed to COVID-19 lockdowns (Shukla, 2021b). The government has set an increased expenditure mandate for FY 2022, though it remains to be seen if this will be met, given the deadly COVID-19 wave in the summer of 2021. While not a subsidy, PSU CAPEX is a form of government support, as the government owns PSUs and directs how they use resources. PSUs do not report on CAPEX by energy type, but their primary business models are aligned with specific energy subsectors. If we assume that most CAPEX goes to the sector where each PSU conducts its primary operations, then 85% of CAPEX would be linked to fossil fuel extraction, processing, and transportation, with the remainder for power generation. The full allocation to fossil fuels is likely higher, as a significant share of power will be using coal.
Among the 14 PSUs, the seven energy Maharatnas account for 84% of CAPEX and play a critical role in shaping India’s energy future. As shown in Figure 9, FY 2021 saw an increase in CAPEX for the upstream producers of coal (CIL), oil and natural gas (Gas Authority of India Limited [GAIL], Oil and Natural Gas Corporation Limited [ONGC]) but a drop in power generation (NTPC) and oil marketing (Indian Oil Corporation Limited [IOCL], Bharat Petroleum Corporation Limited [BPCL], and Hindustan Petroleum Corporation Limited [HPCL]).
Figure 9. CAPEX trends of seven major PSUs in India, FY 2014 to FY 2021
Source: MoF, 2021b.
INR
cro
re (
real
FY
2021
)
0
5,000
10,000
15,000
20,000
25,000
30,000
35,000
40,000
45,000
50,000
Coal Oil and gas Electricity
CIL ONGC GAIL HPCL BPCL IOCL NTPC
20212014

28
Mapping India's Energy Policy 2022
PSU investment can also be mapped by analyzing projects. In our last review, we identified official reporting on 183 PSU energy projects from FY 2014–FY 2020, finding 11 times more investment in fossil fuels than clean energy (Viswanathan et al., 2021). This has not been updated. Media and annual reports flag some new projects in areas such as renewable power, fuel cells, and green hydrogen, alongside initial interest in green hydrogen by IOCL and BPCL, and solar manufacturing from CIL. However, this is unlikely to greatly influence overall trends. NTPC, the PSU clean energy leader, has 2.2 GW of ongoing renewable projects, but three times as much in ongoing coal projects (NTPC, 2021a).
4.2.3 PSU Ambition for a Clean Energy Transition
Given their large role in the energy sector, PSUs’ ambition could play a key role in delivering on clean energy targets and long-term phase down plans for fossil fuels. Table 1, overleaf, provides an update of changes in the stated ambition of the seven energy Maharatnas, over four key parameters, finding:
• Vision and mission: Vision and mission statements have not changed for any PSU since our previous review. They contain references to alternative energy, but it is not always unambiguously clean. While statements from PSU leaders in recent times have alluded to more clean technology, it is not yet institutionalized in their corporate vision and mission.
• Corporate targets: ONGC and BPCL announced new targets for clean energy, while all three OMCs set targets for EV charging stations. The trend is toward increased capacity addition targets but, save for NTPC, investment targets are not stated.
• Strategic partners: Of the four parameters, this aspect has seen the most progress with several inter-PSU collaborations via memorandums of understanding (MoUs) or joint ventures such ONGC–NTPC, IOCL–NTPC, CIL–NTPC, and ONGC–SECI. Partnerships have been signed with foreign corporations like Phinergy and EDF for collaboration on emerging clean technology.
• Social responsibility: All PSUs continue to engage in significant corporate social responsibility (CSR) expenditure, with a cumulative INR 2,435 crore (USD 0.3 billion) in FY 2021. A key contribution has been COVID-19 relief: all PSUs have carried out projects in communities where they operate, as well as heavily affected regions. It must be noted that government guidelines on CSR do not allow expenditure on sustainability to qualify, while just transition is not mentioned (Department of Public Enterprises, 2014).
We identify the following ambition gaps and actionable points:
• In the next year, vision and targets should change to address how PSUs will contribute to net-zero targets by 2070. Achieving economy-wide net-zero would imply much earlier timelines in peak fossil fuel use. India has also agreed to a phase down of unabated coal as a part of the Glasgow Climate Pact, which has significant implications for CIL and NTPC (United Nations Framework Convention on Climate Change, 2021b).
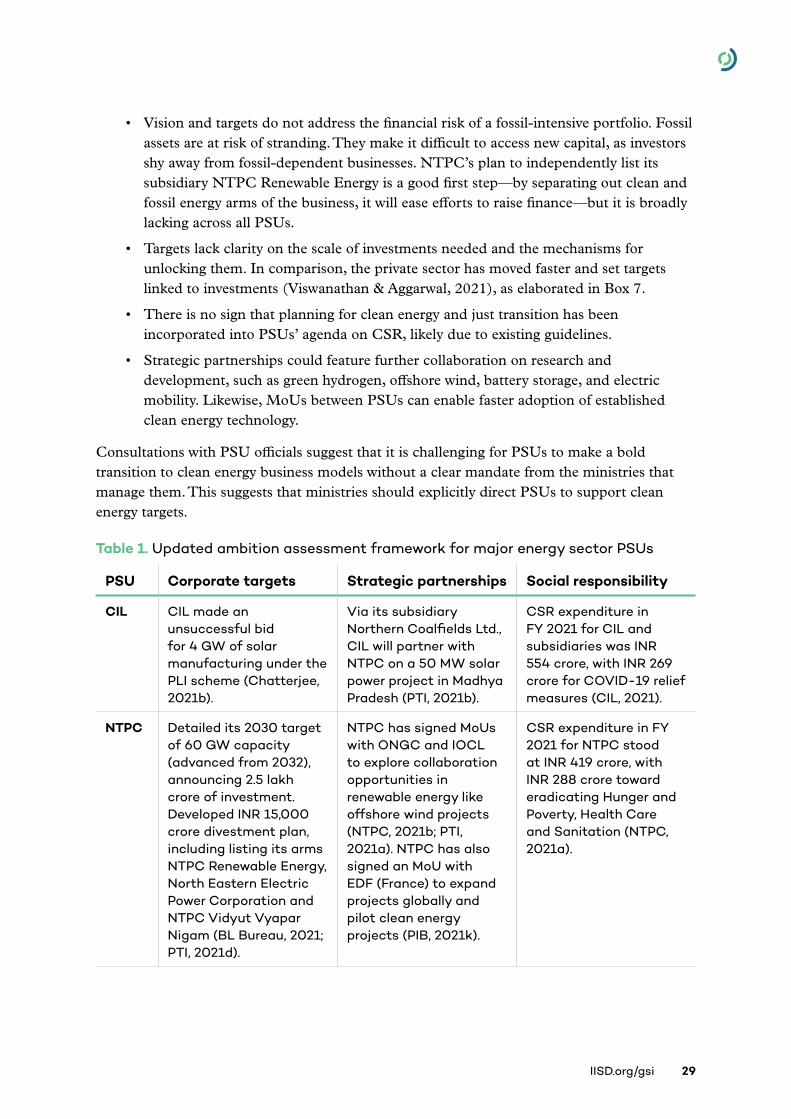
IISD.org/gsi 29
• Vision and targets do not address the financial risk of a fossil-intensive portfolio. Fossil assets are at risk of stranding. They make it difficult to access new capital, as investors shy away from fossil-dependent businesses. NTPC’s plan to independently list its subsidiary NTPC Renewable Energy is a good first step—by separating out clean and fossil energy arms of the business, it will ease efforts to raise finance—but it is broadly lacking across all PSUs.
• Targets lack clarity on the scale of investments needed and the mechanisms for unlocking them. In comparison, the private sector has moved faster and set targets linked to investments (Viswanathan & Aggarwal, 2021), as elaborated in Box 7.
• There is no sign that planning for clean energy and just transition has been incorporated into PSUs’ agenda on CSR, likely due to existing guidelines.
• Strategic partnerships could feature further collaboration on research and development, such as green hydrogen, offshore wind, battery storage, and electric mobility. Likewise, MoUs between PSUs can enable faster adoption of established clean energy technology.
Consultations with PSU officials suggest that it is challenging for PSUs to make a bold transition to clean energy business models without a clear mandate from the ministries that manage them. This suggests that ministries should explicitly direct PSUs to support clean energy targets.
Table 1. Updated ambition assessment framework for major energy sector PSUs
PSU Corporate targets Strategic partnerships Social responsibility
CIL CIL made an unsuccessful bid for 4 GW of solar manufacturing under the PLI scheme (Chatterjee, 2021b).
Via its subsidiary Northern Coalfields Ltd., CIL will partner with NTPC on a 50 MW solar power project in Madhya Pradesh (PTI, 2021b).
CSR expenditure in FY 2021 for CIL and subsidiaries was INR 554 crore, with INR 269 crore for COVID-19 relief measures (CIL, 2021).
NTPC Detailed its 2030 target of 60 GW capacity (advanced from 2032), announcing 2.5 lakh crore of investment. Developed INR 15,000 crore divestment plan, including listing its arms NTPC Renewable Energy, North Eastern Electric Power Corporation and NTPC Vidyut Vyapar Nigam (BL Bureau, 2021; PTI, 2021d).
NTPC has signed MoUs with ONGC and IOCL to explore collaboration opportunities in renewable energy like offshore wind projects (NTPC, 2021b; PTI, 2021a). NTPC has also signed an MoU with EDF (France) to expand projects globally and pilot clean energy projects (PIB, 2021k).
CSR expenditure in FY 2021 for NTPC stood at INR 419 crore, with INR 288 crore toward eradicating Hunger and Poverty, Health Care and Sanitation (NTPC, 2021a).

30
Mapping India's Energy Policy 2022
PSU Corporate targets Strategic partnerships Social responsibility
IOCL IOCL plans to build India's first green hydrogen plant and set up 10,000 electric vehicle charging stations in the next three years (Mishra, 2021; Reuters, 2021b).
IOCL has entered a joint venture with Phinergy (Israel) to develop fuel cells, hydrogen storage solutions, and green mobility (IOCL, 2021b). IOCL has also signed an MoU with NTPC to explore renewable energy projects (NTPC, 2021b).
CSR expenditure in FY 2021 for IOCL stood at INR 460 crore, with INR 36 crore spent on COVID-19-related medical equipment (IOCL, 2021a).
HPCL HPCL plans to set up 5,000 electric vehicle charging stations in the next 3 years (Choudhary, 2021).
HPCL signed an agreement with Tata Power to set up end-to-end EV charging stations at HPCL's petrol pumps across the country (Capital Market, 2021).
CSR expenditure in FY 2021 for HPCL was INR 156 crore, with INR 5.8 crore for various COVID-19 relief measures across the country (HPCL, 2021).
BPCL BPCL signed an MoU with SECI to set up 10 GW of renewable capacity by 2040. It also plans to convert 7,000 petrol stations to energy stations, including EV charging and hydrogen (ET Energy World, 2021; PTI, 2021c).
BPCL has partnered with Bhabha Atomic Research Centre to scale up alkaline electrolyzer technology for producing green hydrogen (Indo-Asian News Service, 2021).
CSR expenditure in FY 2021 for BPCL stood at INR 145 crore with INR 5.4 crore spent for various COVID-19 relief measures across the country (BPCL, 2021).
GAIL No significant additional targets identified.
No significant new partnerships identified.
CSR expenditure in FY 2021 for GAIL stood at INR 148 crore with INR 4.1 crore spent for various COVID-19 relief measures across the country (GAIL, 2021).
ONGC ONGC announced the building of 10 GW of renewable energy capacity by 2040 through acquisitions (Reuters, 2021a).
ONGC and NTPC signed an MoU to expand renewable energy and explore offshore wind projects (PTI, 2021a). ONGC also signed an MoU with SECI to scale up clean energy projects (PTI, 2021e).
CSR expenditure for FY 2021 for ONGC stood at INR 553 crore, with INR 64 crore spent promoting health care (ONGC, 2021).
Note: No change to the vision and mission of all PSUs.

IISD.org/gsi 31
Box 7. Case study: Lessons from India’s leading private-sector energy companies
Led by India’s two wealthiest industrialists, RNESL and AGEL have made headlines with their clean energy commitments. RNESL plans to invest INR 5.95 lakh crore (USD 80.1 billion) over 10–15 years in setting up green energy projects, while AGEL aspires to be the world’s biggest renewable energy producer by 2030, with USD 50–70 billion in investments (Chatterjee, 2021a; Sanjal, 2021).
RNESL’s initial announcement stated that INR 75,000 crore (USD 10.1 billion) would be invested across four technologies that would be manufactured: solar cells and modules; batteries for energy storage; electrolyzer units to produce green hydrogen; and fuel cells to store and reuse hydrogen (Chatterjee, 2021a). None of these technologies have an established manufacturing industry in India, with no pilot projects by RNESL. Despite this, RIL has successfully won a PLI bid to build a 4 GW vertically integrated solar manufacturing unit (Ranjan, 2021). Further, RNESL has set a target to bring green hydrogen prices down to under USD 1 per 1 kg in 1 decade from current prices, which range between USD 3 to 6.5 per kg (Business Standard, 2021). To achieve technological know-how, RNESL has entered strategic partnerships with emerging clean energy companies through acquisitions and investments. Since the June 2021 announcement, RNESL has invested about USD 1.3 billion in REC Solar, NexWafe, Sterling and Wilson, Stiesdal, Ambri, and Faradion (Bhardwaj, 2021; PTI, 2021f). Through the USD 771 million purchase, RNESL wishes to use REC’s “industry leading technology in their [RNESL] fully integrated, metallic Silicon to PV Panel manufacturing giga factory at Dhirubhai Ambani Green Energy Giga Complex, Jamnagar initially starting with 4 GW per annum capacity” (RNESL, 2021).
AGEL’s target is dependent on rapid and dramatic growth in building renewable power generation capacity with a projected compound annual growth rate of 28% between 2022 and 2030 (AGEL, 2021). This requires raising capital at scale via both domestic and international markets. Green bonds have become increasingly cost effective in bringing global investments to India, with frequent oversubscription and an expectation of even lower interest rates in the years ahead (Trivedi, 2021). AGEL has been quick to move and issued USD 750 million in green bonds in 2021 on the back of USD 362.5 million raised in 2019 (Shukla, 2021a). AGEL has been able to use the benefits of green bonds, such as bypassing the sectoral limitation of conventional debt financing and is poised to access a much wider pool of lenders (Roy et al., 2021). Further, Adani Group has entered a joint venture with Total Energies, which sees Total acquiring 50% ownership of AGEL’s solar portfolio (Total Energies, 2020). This strategic partnership with an international energy utility is expected to improve business capabilities and puts AGEL ahead of the market undergoing an energy transition.
With a comparable market cap, India’s energy PSUs can emulate the business decisions taken by RNESL and AGEL as they plan their diversification strategies. There are clear opportunities and established financing instruments to achieve ambitious targets set at the national level. The key differentiator, however, remains the extent to which PSUs share the same sense of urgency and scale of ambition.

32
Mapping India's Energy Policy 2022
4.3 Role of Public Finance Institutions in India’s Energy Transition The role of government-owned PFIs is important because their decisions influence all finance: they reduces risk at a project level, unlock private investments, as well as influence wider trends by sending signals about the type of energy a government is backing (Muttitt et al., 2021). It also matters because the good governance and financial stability of PFIs have wider implications for economic stability. Considering the significant role that PFIs play in India’s energy sector and their high impact, it is a key pillar of government support to align with energy transition.
4.3.2 The Big Picture: Overall trends for fossil fuel and clean energy financing in India
The investment landscape for energy is undergoing a large structural shift. On the one hand, it is increasingly difficult to mobilize finance for fossil fuels, likely reflecting trends such as the rise of environmental, social, and governance disclosures and commitments to end international public fossil finance. In India, state-owned institutions have therefore, emerged as lenders of last resort, putting considerable risk on public balance sheets. On the other hand, clean energy targets are creating new opportunities. The Standing Committee on Energy (2022) estimates the need for INR 1.5–2 lakh crore (USD 20.2–26.9 billion) per year to meet the 2030 renewable energy targets, around 0.75–1.25 lakh crore (USD 10.1–16.8 billion) per year above existing investment levels. Part of this can be leveraged by PFIs.
The two best sources to study overall trends for energy financing in India are independent studies, whose findings are summarized in Table 2.
To supplement existing studies, we conducted a bottom-up review of data publicly reported by India’s biggest central-level PFIs that lend to the energy sector, such as voluntary disclosures, annual reports, and investor presentations. A summary is provided in Appendix C along with a complete list of the financial institutions, including 12 PSBs and three NBFCs namely Power Finance Corporation, REC Ltd. and the Indian Renewable Energy Development Agency (IREDA). Right-to-information requests were also explored, though unsuccessfully (see Box 8). One overarching finding is that PFI voluntary reporting is extremely limited.
According to the data collected for 15 PFIs, out of the total outstanding credit of INR 12,66,544 crore (USD 171 billion) as of March 2021 for broad energy-related occupations,4 the outstanding credit for clean energy5 was only 6.7%, at INR 85,139 crore (USD 11.5 billion). The rest of the credit went to conventional sources across the energy value chain, from extraction to distribution. For PSBs, the proportion for clean energy was lower, at 4.3%,
4 Energy-related occupations considered here include electricity generation, transmission, and distribution, non-conventional energy, petroleum, coal products, nuclear fuels, and mining and quarrying.5 For consistency of language with the rest of this report, we use the term “clean energy” in this chapter, but the actual terms reported on by PFIs are often unclear, using categories such as “non-conventional energy” and “renewable energy,” without a firm definition. As such, we cannot determine what precisely is included in this PFI outstanding credit, and it may not be consistent with our own definition of “clean energy” as outlined in the “Approach” section.

IISD.org/gsi 33
while for NBFCs it was 8.3%. This shows the rising importance of NBFCs such as IREDA in providing clean energy financing in India.
Table 2. Literature review of existing data for fossil fuels and clean energy
Data Source Scope of Study Key Findings
Shift the Subsidies database by Oil Change International & Friends of the Earth US (2021)
Tracks international public finance for all fossil fuel and renewable energy.
Based on bottom-up project and transaction level data, including grants, loans, equity purchases, guarantees, and insurance.
Covers multilateral and bilateral development banks along with select Indian development financial institutions (DFIs).6
For India, identified average annual fossil fuel finance (2018–2020) of INR 7,121 crore (USD 1.1 billion).
Currently, there are no coal, oil, or gas exclusion policies at India’s bilateral DFIs.
India was the third largest G20 recipient country for known international public finance for renewable energy (after France and Brazil) between 2018–2020.
Coal vs. Renewables Financial Analysis series by the Centre for Financial Accountability & Climate Trends (2021)
Tracks select project finance loans across coal and renewable power generation projects in India that reached financial close during a calendar year.
Covers both state-owned and private financial institutions.
In 2020, only one coal power project received a loan, worth INR 8,520 crore (USD 1.2 billion), from Power Finance Corporation and REC. Majority state-owned financial institutions emerged as lenders of last resort for coal, as private financial institutions avoided the sector.
Public debt financing for coal power was ~1.8 times more than renewable energy in 2020.
The share of funding provided by state-owned and government banks was 19% of overall renewable energy power lending, compared to 56% from other commercial banks.
In addition, an attempt was made to assess annual PFI loan disbursements for fossil fuel and clean energy projects, to determine trends in financial flows. However, limited data is disclosed by PSBs on this front. For the three NBFCs studied, annual disbursements for the power sector stood at INR 190,116 crore (USD 25.6 billion) in FY 2021, of which only INR 16,422 crore (USD 2.2 billion)—8.6% of total disbursements—went to renewable energy, significantly less than fossil fuel-based power. Since these NBFCs mainly cater to power sector
6 DFIs are institutions endorsed or supported by the Government of India primarily to provide development and project finance to one or more sectors or subsectors of the economy.
34
Mapping India's Energy Policy 2022
needs, the overall disbursements for the full energy value chain are expected to be significantly higher than this. Further, the main new data that were identified in the study are linked to Basel III disclosures: a global, voluntary framework created to improve bank governance after the 2008 financial crisis. On energy, it includes standard reporting categories on: energy infrastructure, coal mining, petroleum (non-infrastructure), coal products, and nuclear fuels.
Box 8. Right-to-information requests on PFI lending
Efforts were also made to gather data through right-to-information requests, but this was not successful. From a total of 34 requests for a breakdown of loans and credits by energy technology, only seven PFIs replied. Those who did not provide data gave a range of responses. Some argued that they do not disaggregate loans by type of energy and that this would be a disproportionate diversion of resources. Others stated that the data were too commercially sensitive to share. This is an important finding since a number of PFIs in India committed to “consider the range of fossil fuel investments in our portfolios” and “increase the pace and coverage of investment in renewable energy” through the Finance in Common Summit declaration (Finance in Common, 2020), signed in 2020 by the Association of Development Financing Institutions in Asia and the Pacific. Signatories should already be allocating resources to track these indicators. Regulators are recommended to go one step further and to require that all PFIs improve transparency and uniformity in reporting on energy to enable better decision making and accountability.
4.3.3 Risk Exposure for PFIs Invested in Energy Infrastructure
Under Basel III, PSBs report on their total gross credit risk exposure,7 which is the maximum potential loss to a lender if the borrower defaults on payment, before accounting for collateral. For India’s 12 PSBs, the total gross credit risk exposure in the category “energy infrastructure” stood at INR 5,02,134 crore (67.6 USD billion) in FY 2021, as shown in Figure 10.
Equivalent data for NBFCs were not available since Basel III norms do not apply to NBFCs. Notably, 8 out of 12 banks had a greater than 5% risk exposure (qualified as “large”) to energy infrastructure as of the end of March 2021. From Figure 10, it can be seen that Punjab and Sindh Bank had the highest exposure, followed by Bank of India.
Basel III reporting is not disaggregated by all banks consistently, making it hard to determine how credit risk exposure is spread across fossil and clean energy. Some banks—such as the Indian Bank and Bank of Baroda—do provide a breakdown of risk exposure to renewable energy, and this is less than 10% of energy infrastructure projects. This suggests that the large majority of the risk for PSBs is shared between fossil and T&D projects, which would be consistent with the relatively short period of time in which lending has grown for clean energy projects.
7 Gross credit risk exposure is a measurement of the maximum potential loss to a lender if the borrower defaults on payment. It provides a measure of exposure to counterparty credit risk (before collateral).

IISD.org/gsi 35
Figure 10. PFIs’ gross credit risk exposure to energy infrastructure (INR crore)
Source: Bank of Baroda (BoB), 2019, 2020, 2021; Bank of India (BoI), 2019, 2020, 2021; Bank of Maharashtra (BoM), 2019, 2020, 2021; Canara Bank (CB), 2019, 2020, 2021; Central Bank of India (CBI), 2019, 2020, 2021; Indian Bank (IB), 2019, 2020, 2021; Indian Overseas Bank (IOB), 2019, 2020, 2021; Punjab National Bank (PNB), 2019, 2020, 2021; Punjab and Sindh Bank, 2019, 2020, 2021; State Bank of India (SBI), 2019, 2020, 2021a; UCO Bank, 2019, 2020, 2021; Union Bank of India (UBI), 2019, 2020, 2021.
4.3.4 Risk Exposure for PFIs Invested in Coal Mining in India
The only Basel III disclosures that are specific to a fossil sub-component of energy are for coal mining, where gross credit risk exposure of PSBs has significantly increased since FY 2019, as summarized in Figure 11. The bank with the highest exposure (both in terms of volume and share of total portfolio) in FY 2021 was the SBI, whose exposure increased nearly four times from FY 2019, presumably linked to government targets on increased coal production to reduce reliance on imports. PNB and Union Bank also saw growth in this period (in absolute terms) but to a lesser degree. It is worth noting that SBI is also among the top 10 shareholders of CIL, and both SBI and PNB are its bankers (Sreedhar Ramamurthy & Singh, 2019). This continued finance for coal mining, despite high credit risks, is a different trend than for coal power (see Box 10).
2018–19
2019–20
2020–21
% of their total portfolio
0 100,000 200,000 300,000 400,000 500,000 600,000
Total in INR Crore
0
2
4
6
8
10
12
SBI PNB CBI UBI CB BoM BoI BoB IB IOB PSB UCO
2018–19 2019–20 2020–21

36
Mapping India's Energy Policy 2022
Figure 11. PFIs’ gross credit risk exposure to coal mining projects (INR crore)
Source: Bank of India, 2019, 2020, 2021; Central Bank of India, 2019, 2020, 2021; PNB, 2019, 2020, 2021; SBI, 2019, 2020, 2021a; UCO Bank, 2019, 2020, 2021; Union Bank of India, 2019, 2020, 2021. No adequately disaggregated data could be identified for the remaining five PSBs in their voluntary reporting.
PFIs also report on non-performing assets (NPAs) in their lending portfolios, but only three central-level PFIs were identified that sufficiently disaggregated NPAs to identify trends in the coal mining sector, as illustrated in Figure 12. Based on the available data, in FY 2021, around 8% of SBI’s NPAs were in the coal mining sector. While we were not able to source disaggregated data for the Bank of Maharashtra, Bhatt (2021) identified that 63% of NPAs held by the Bank of Maharashtra were in the coal mining, coal-based power generation, and transmission industries.
Figure 12. NPAs in the coal mining sector (INR crore)
Source: Bank of India, 2019, 2020, 2021; SBI, 2019, 2020, 2021a, and right-to-information response from CBI.
% of their total portfolio
0
0.05
0.10
0.15
0.25
0.20
0.30
0.35
SBI PNB CBI UBI BoI BoB UCO
2018–19 2019–20 2020–21
0
2,000
4,000
6,000
8,000
10,000
12,000
14,000
Total in INR Crore20
18–
19
2019
–20
2020
–21
INR crore
2018–19
2019–20
2020–21
0 100 200 300 400 500 600 700 800
SBI
CBI
BoI
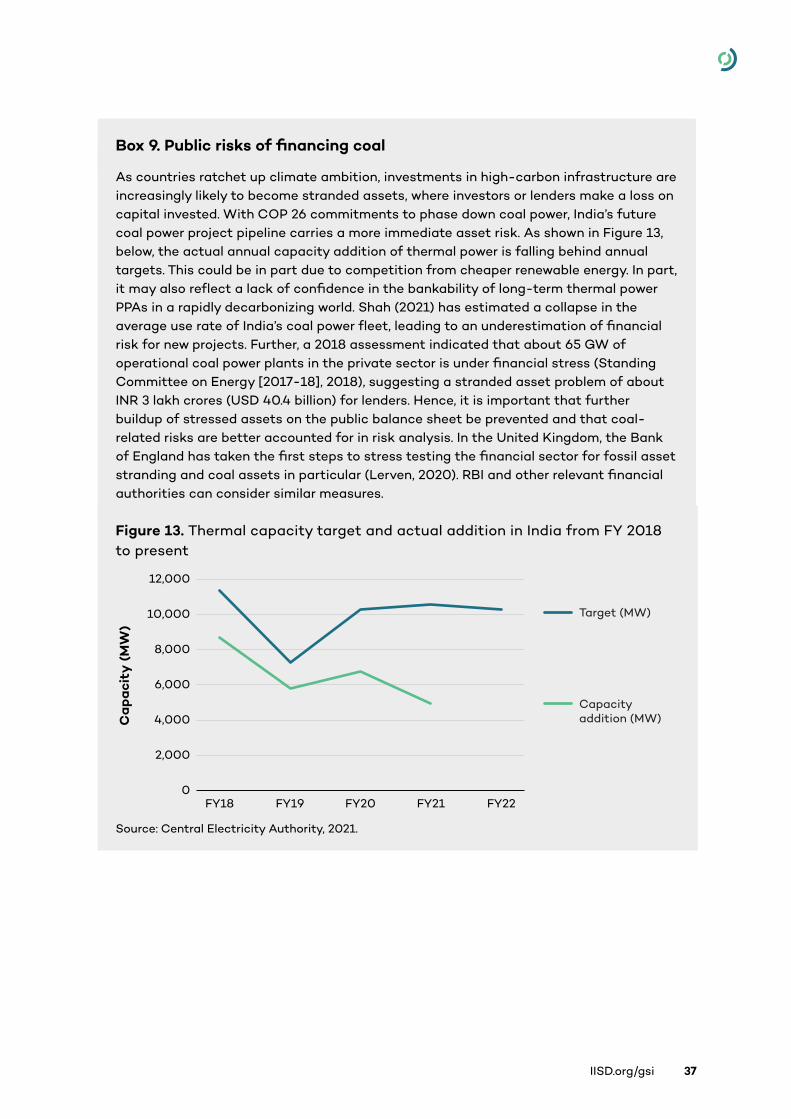
IISD.org/gsi 37
Box 9. Public risks of financing coal
As countries ratchet up climate ambition, investments in high-carbon infrastructure are increasingly likely to become stranded assets, where investors or lenders make a loss on capital invested. With COP 26 commitments to phase down coal power, India’s future coal power project pipeline carries a more immediate asset risk. As shown in Figure 13, below, the actual annual capacity addition of thermal power is falling behind annual targets. This could be in part due to competition from cheaper renewable energy. In part, it may also reflect a lack of confidence in the bankability of long-term thermal power PPAs in a rapidly decarbonizing world. Shah (2021) has estimated a collapse in the average use rate of India’s coal power fleet, leading to an underestimation of financial risk for new projects. Further, a 2018 assessment indicated that about 65 GW of operational coal power plants in the private sector is under financial stress (Standing Committee on Energy [2017-18], 2018), suggesting a stranded asset problem of about INR 3 lakh crores (USD 40.4 billion) for lenders. Hence, it is important that further buildup of stressed assets on the public balance sheet be prevented and that coal-related risks are better accounted for in risk analysis. In the United Kingdom, the Bank of England has taken the first steps to stress testing the financial sector for fossil asset stranding and coal assets in particular (Lerven, 2020). RBI and other relevant financial authorities can consider similar measures.
Figure 13. Thermal capacity target and actual addition in India from FY 2018 to present
Source: Central Electricity Authority, 2021.
FY18 FY19 FY20 FY21 FY22
Capacity addition (MW)
Target (MW)
0
2,000
4,000
6,000
8,000
10,000
12,000
Cap
acit
y (
MW
)
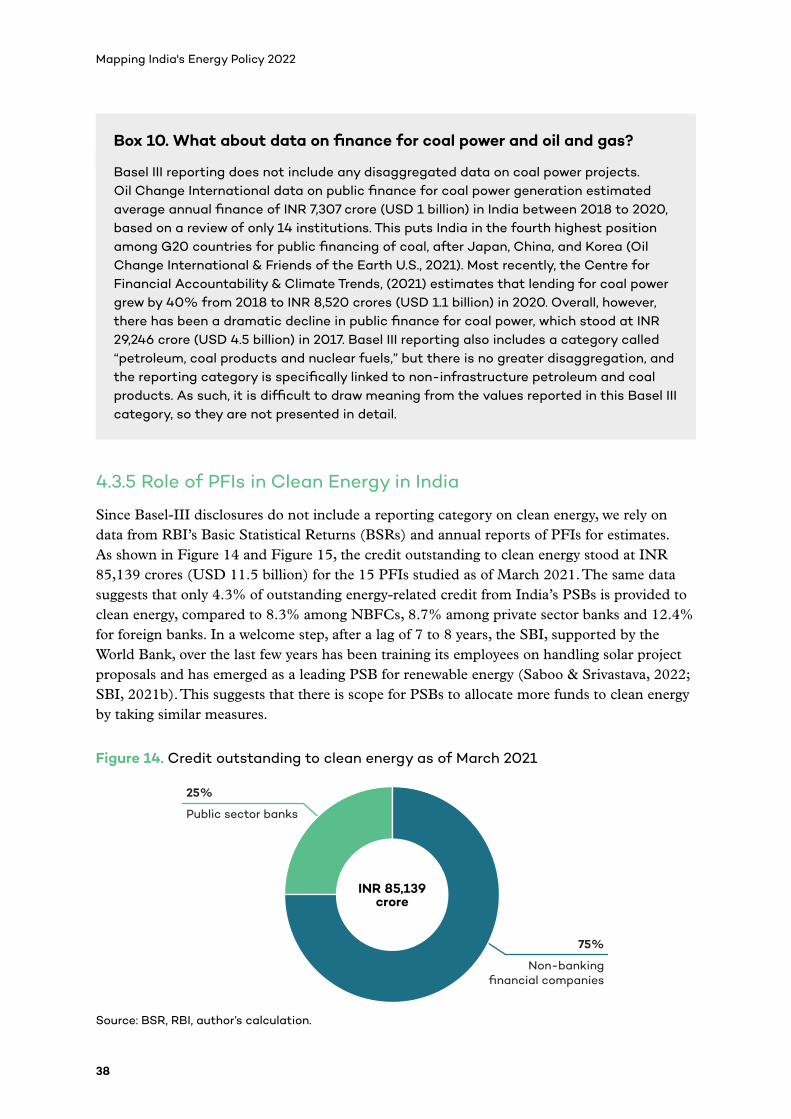
38
Mapping India's Energy Policy 2022
Box 10. What about data on finance for coal power and oil and gas?
Basel III reporting does not include any disaggregated data on coal power projects. Oil Change International data on public finance for coal power generation estimated average annual finance of INR 7,307 crore (USD 1 billion) in India between 2018 to 2020, based on a review of only 14 institutions. This puts India in the fourth highest position among G20 countries for public financing of coal, after Japan, China, and Korea (Oil Change International & Friends of the Earth U.S., 2021). Most recently, the Centre for Financial Accountability & Climate Trends, (2021) estimates that lending for coal power grew by 40% from 2018 to INR 8,520 crores (USD 1.1 billion) in 2020. Overall, however, there has been a dramatic decline in public finance for coal power, which stood at INR 29,246 crore (USD 4.5 billion) in 2017. Basel III reporting also includes a category called “petroleum, coal products and nuclear fuels,” but there is no greater disaggregation, and the reporting category is specifically linked to non-infrastructure petroleum and coal products. As such, it is difficult to draw meaning from the values reported in this Basel III category, so they are not presented in detail.
4.3.5 Role of PFIs in Clean Energy in India
Since Basel-III disclosures do not include a reporting category on clean energy, we rely on data from RBI’s Basic Statistical Returns (BSRs) and annual reports of PFIs for estimates. As shown in Figure 14 and Figure 15, the credit outstanding to clean energy stood at INR 85,139 crores (USD 11.5 billion) for the 15 PFIs studied as of March 2021. The same data suggests that only 4.3% of outstanding energy-related credit from India’s PSBs is provided to clean energy, compared to 8.3% among NBFCs, 8.7% among private sector banks and 12.4% for foreign banks. In a welcome step, after a lag of 7 to 8 years, the SBI, supported by the World Bank, over the last few years has been training its employees on handling solar project proposals and has emerged as a leading PSB for renewable energy (Saboo & Srivastava, 2022; SBI, 2021b). This suggests that there is scope for PSBs to allocate more funds to clean energy by taking similar measures.
Figure 14. Credit outstanding to clean energy as of March 2021
Source: BSR, RBI, author’s calculation.
75%
Non-bankingfinancial companies
25%
Public sector banks
INR 85,139 crore
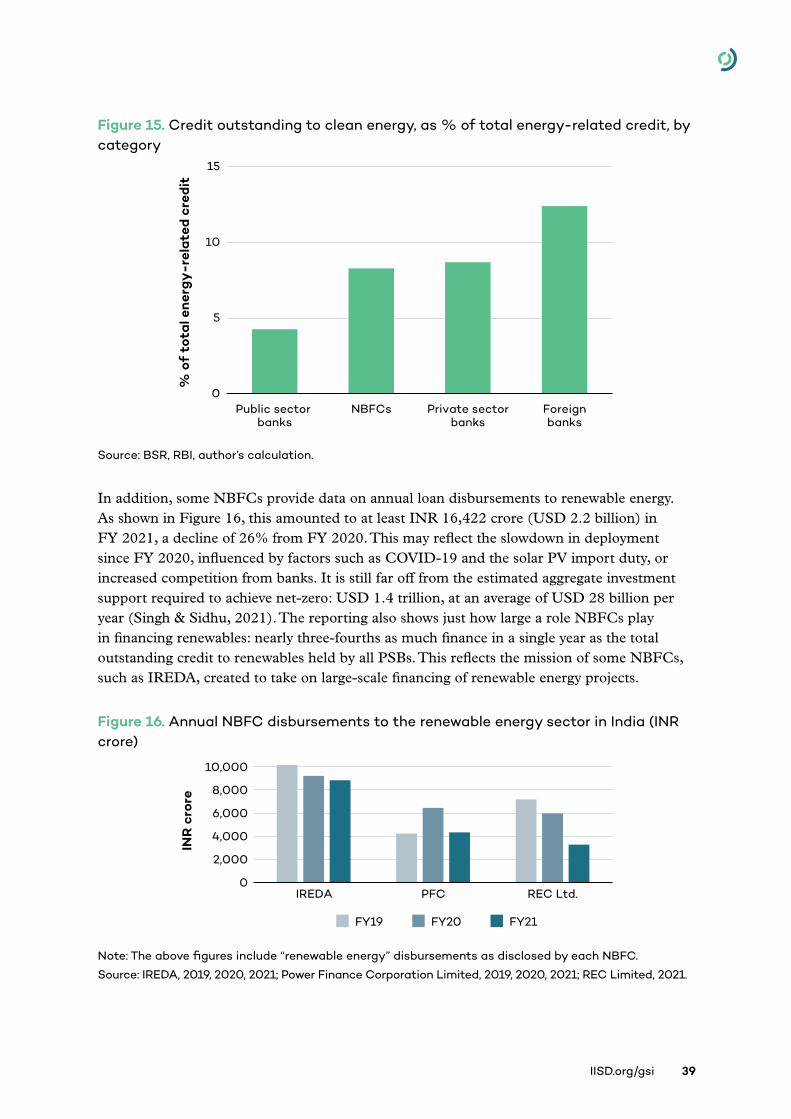
IISD.org/gsi 39
Figure 15. Credit outstanding to clean energy, as % of total energy-related credit, by category
Source: BSR, RBI, author’s calculation.
In addition, some NBFCs provide data on annual loan disbursements to renewable energy. As shown in Figure 16, this amounted to at least INR 16,422 crore (USD 2.2 billion) in FY 2021, a decline of 26% from FY 2020. This may reflect the slowdown in deployment since FY 2020, influenced by factors such as COVID-19 and the solar PV import duty, or increased competition from banks. It is still far off from the estimated aggregate investment support required to achieve net-zero: USD 1.4 trillion, at an average of USD 28 billion per year (Singh & Sidhu, 2021). The reporting also shows just how large a role NBFCs play in financing renewables: nearly three-fourths as much finance in a single year as the total outstanding credit to renewables held by all PSBs. This reflects the mission of some NBFCs, such as IREDA, created to take on large-scale financing of renewable energy projects.
Figure 16. Annual NBFC disbursements to the renewable energy sector in India (INR crore)
Note: The above figures include “renewable energy” disbursements as disclosed by each NBFC.
Source: IREDA, 2019, 2020, 2021; Power Finance Corporation Limited, 2019, 2020, 2021; REC Limited, 2021.
0
5
10
15
Public sector banks
NBFCs Private sectorbanks
Foreignbanks
% o
f to
tal e
nerg
y-r
elat
ed c
redi
t
0
2,000
4,000
6,000
8,000
10,000
IREDA PFC REC Ltd.
INR
cro
re
FY19 FY20 FY21

40
Mapping India's Energy Policy 2022
India is the third largest G20 recipient country for known international public finance for renewable energy, after France and Brazil (Oil Change International & Friends of the Earth U.S., 2021). Given the attractiveness of the Indian market for global institutional investors and ambitious renewable energy targets, there is a clear role for PFIs to leverage greater investments.
As reported recently by IREDA, this may include new tools to deepen the money market, such as infrastructure development funds, infrastructure investment trusts, alternate investment funds, bonds and asset-based securitization (IREDA, 2021).
Measures can also be taken at a policy level to help increase the volume of finance available for clean energy. In a welcome step, the Union Budget for FY 2023 announced using Sovereign Green Bonds (SGBs) to mobilize resources for green energy transition in public sector projects (GoI, 2022). The detailed policy document and first issuance are still awaited, but it is expected that SGBs will be significant in bridging the investment gap for clean energy. In early 2022, the government also announced an INR 1,500 crore (USD 0.2 billion) equity infusion to IREDA, which it estimates would be sufficient to enable an additional INR 12,000 crore (USD 1.6 billion) in lending, as well as helping IREDA borrow and provide credit at lower interest rates (Standing Committee on Energy, 2022).
4.3.6 Improving Transparency for Improved Decision Making
Globally, financing for energy is at a tipping point. As of the end of 2021, over 180 financial institutions have announced their divestment from coal mining, coal-fired power plants, or both. At climate negotiations, 39 countries and financial institutions committed to ending international public support for unabated fossil fuels (United Nations Framework Convention on Climate Change, 2021a). While many emerging commitments are focused on international public finance, domestic financial institutions will soon become the next frontier.
Today, it is very challenging to determine the role that PFIs are playing in promoting clean energy transition and, at the same time, the level of public risk linked to fossil asset exposure. On top of existing efforts by the regulator (see Box 11), steps to improve reporting are critical to enable better decision making about the role of PFIs in plans to transition toward net-zero. RBI can go further by setting norms for improved transparency and uniformity in PFI reporting, so that full information on lending for fossil and clean energy is available to all stakeholders. Such efforts can and should be aligned with ongoing efforts to establish a “green taxonomy,” defining the types of investments that can be truly considered sustainable.
IISD.org/gsi 41
Box 11. Regulator’s role in directing finance toward the energy transition
For PSBs in India, 40% of total lending, adjusted net credit, or credit equivalent of off-balance-sheet exposure—whichever is higher—must be channelled to sectors identified as “priority sector lending” (PSL), such as agriculture, micro-enterprises, and social infrastructure.
As of March 31, 2021, the total priority sector advances stood at INR 24 lakh crore (USD 323.2 billion). Since March 2015, the national regulator, RBI, has included renewable energy in PSL. This includes solar power generators, biomass-based power generators, windmills, micro-hydro plants, and non-conventional-energy-based lighting and remote village electrification (RBI, n.d.-b) but currently does not include EVs (Rocky Mountain Institute India, 2022).
RBI further increased lending limits in September 2020 from INR 15 crore to INR 30 crore (USD 2 million to 4 million) per project and INR 10 lakh (USD 134,662) per borrower for individual households. Some industry players have argued that the cap was inadequate to meet the funding requirements of planned megaprojects, and some of these loans could instead be structured as direct grants using Jan Dhan accounts to reduce transaction costs (Jai, 2020).
In other measures to promote clean energy, RBI also updated the PSL guidelines to include loans for stand-alone solar agricultural pumps, solarization of grid-connected agricultural pumps and solar power plants on barren or fallow land, or in stilt fashion, on agriculture land owned by farmers (RBI, n.d.-b) but the uptake has been low. Like other areas, there is a need for greater data transparency by PSBs on loans disbursed, as more subcategories get added to the PSL guidelines.
In April 2021, RBI joined as a Member of the Central Banks and Supervisors Network for Greening the Financial System (NGFS) (Reserve Bank of India, 2021). Launched in 2017, the NGFS is a group that looks to share best practices and contribute to the development of environment and climate risk management in the financial sector while mobilizing mainstream finance to support the transition toward a sustainable economy. RBI specified that it expects to benefit by learning from and contributing to global efforts on green finance (Reserve Bank of India, 2021). Recently, RBI has also set up a Sustainable Finance Group within the Department of Regulation, which will be spearheading efforts and regulatory initiatives in the areas of sustainable finance and climate risk.

42
Mapping India's Energy Policy 2022
5.0 Energy Revenues and
Externalities
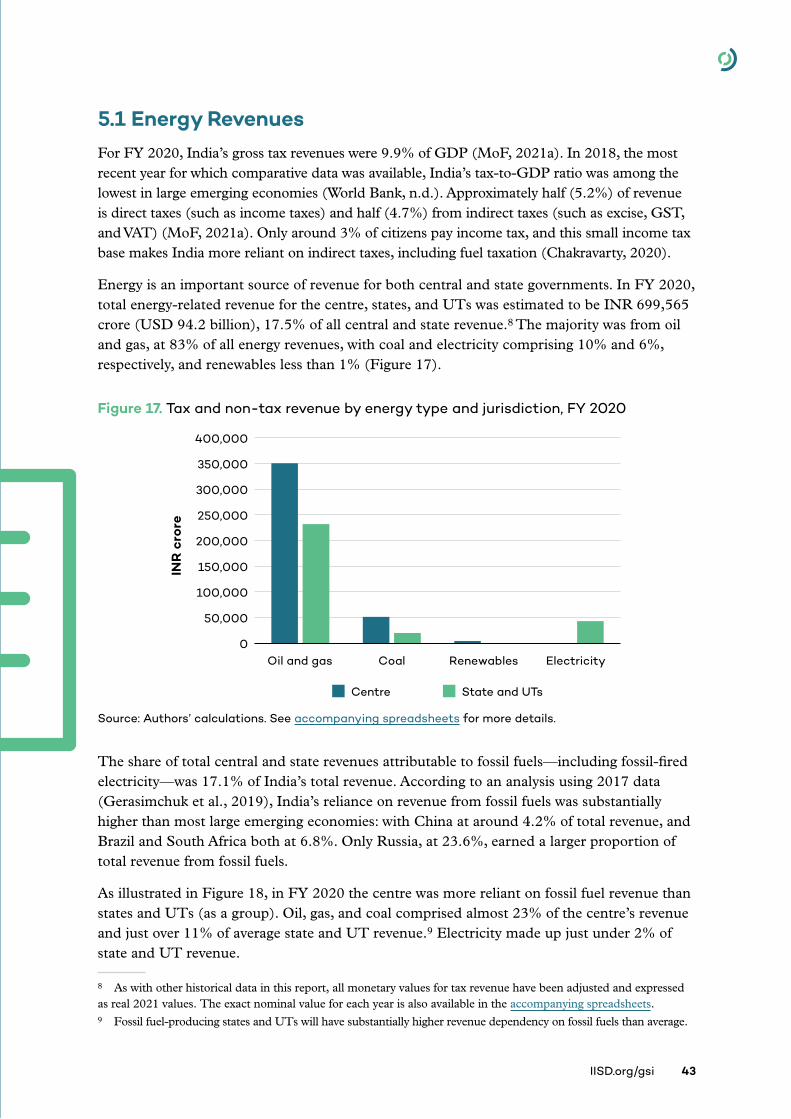
IISD.org/gsi 43
5.1 Energy RevenuesFor FY 2020, India’s gross tax revenues were 9.9% of GDP (MoF, 2021a). In 2018, the most recent year for which comparative data was available, India’s tax-to-GDP ratio was among the lowest in large emerging economies (World Bank, n.d.). Approximately half (5.2%) of revenue is direct taxes (such as income taxes) and half (4.7%) from indirect taxes (such as excise, GST, and VAT) (MoF, 2021a). Only around 3% of citizens pay income tax, and this small income tax base makes India more reliant on indirect taxes, including fuel taxation (Chakravarty, 2020).
Energy is an important source of revenue for both central and state governments. In FY 2020, total energy-related revenue for the centre, states, and UTs was estimated to be INR 699,565 crore (USD 94.2 billion), 17.5% of all central and state revenue.8 The majority was from oil and gas, at 83% of all energy revenues, with coal and electricity comprising 10% and 6%, respectively, and renewables less than 1% (Figure 17).
Figure 17. Tax and non-tax revenue by energy type and jurisdiction, FY 2020
Source: Authors’ calculations. See accompanying spreadsheets for more details.
The share of total central and state revenues attributable to fossil fuels––including fossil-fired electricity––was 17.1% of India’s total revenue. According to an analysis using 2017 data (Gerasimchuk et al., 2019), India’s reliance on revenue from fossil fuels was substantially higher than most large emerging economies: with China at around 4.2% of total revenue, and Brazil and South Africa both at 6.8%. Only Russia, at 23.6%, earned a larger proportion of total revenue from fossil fuels.
As illustrated in Figure 18, in FY 2020 the centre was more reliant on fossil fuel revenue than states and UTs (as a group). Oil, gas, and coal comprised almost 23% of the centre’s revenue and just over 11% of average state and UT revenue.9 Electricity made up just under 2% of state and UT revenue.
8 As with other historical data in this report, all monetary values for tax revenue have been adjusted and expressed as real 2021 values. The exact nominal value for each year is also available in the accompanying spreadsheets.9 Fossil fuel-producing states and UTs will have substantially higher revenue dependency on fossil fuels than average.
Centre State and UTs
0
50,000
100,000
150,000
200,000
250,000
300,000
350,000
400,000
Oil and gas Coal Renewables Electricity
INR
cro
re
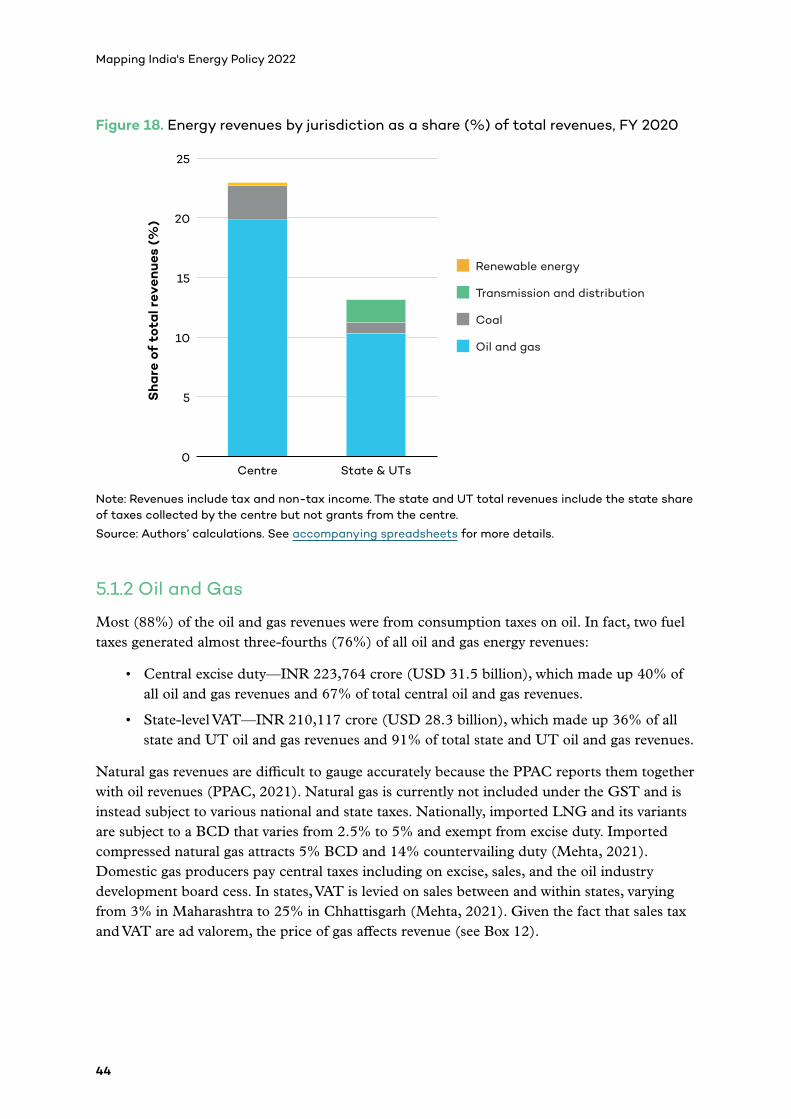
44
Mapping India's Energy Policy 2022
Figure 18. Energy revenues by jurisdiction as a share (%) of total revenues, FY 2020
Note: Revenues include tax and non-tax income. The state and UT total revenues include the state share of taxes collected by the centre but not grants from the centre.
Source: Authors’ calculations. See accompanying spreadsheets for more details.
5.1.2 Oil and Gas
Most (88%) of the oil and gas revenues were from consumption taxes on oil. In fact, two fuel taxes generated almost three-fourths (76%) of all oil and gas energy revenues:
• Central excise duty—INR 223,764 crore (USD 31.5 billion), which made up 40% of all oil and gas revenues and 67% of total central oil and gas revenues.
• State-level VAT—INR 210,117 crore (USD 28.3 billion), which made up 36% of all state and UT oil and gas revenues and 91% of total state and UT oil and gas revenues.
Natural gas revenues are difficult to gauge accurately because the PPAC reports them together with oil revenues (PPAC, 2021). Natural gas is currently not included under the GST and is instead subject to various national and state taxes. Nationally, imported LNG and its variants are subject to a BCD that varies from 2.5% to 5% and exempt from excise duty. Imported compressed natural gas attracts 5% BCD and 14% countervailing duty (Mehta, 2021). Domestic gas producers pay central taxes including on excise, sales, and the oil industry development board cess. In states, VAT is levied on sales between and within states, varying from 3% in Maharashtra to 25% in Chhattisgarh (Mehta, 2021). Given the fact that sales tax and VAT are ad valorem, the price of gas affects revenue (see Box 12).
Sha
re o
f to
tal r
even
ues
(%)
0
5
10
15
20
25
Centre State & UTs
Renewable energy
Transmission and distribution
Oil and gas
Coal

IISD.org/gsi 45
Figure 19. Central and state oil and gas revenues, FY 2020 (as a % of total)
Source: Authors’ calculations. See accompanying spreadsheets for more details.
In the next decade, revenues from oil and gas, in particular can be expected to grow significantly, but to be volatile, due to the impacts of increasing climate ambition. This suggests the need for planning around how to invest revenues strategically in both energy transition and social protection (see Box 13).
Box 12. Natural gas pricing
Domestically produced natural gas makes up 46% of total consumption (PPAC, 2020) and has multiple complex pricing regimes linked to different time periods. For wells producing gas prior to 2014, gas is priced according to the fiscal terms of the licensing policy governing the well. India has had multiple licensing policies that used different pricing mechanisms like cost plus, profit sharing, or open acreage licensing systems. All of these result in different wellhead prices. Since 2014, the price has been benchmarked to international prices by a formula that uses four international benchmarks: US Henry Hub, the UK National Balancing Point, the Russian domestic gas, and the Canadian Alberta reference price. This formula is adjusted bi-annually. It is expected that pricing regimes prior to 2014 will converge with this new gas pricing formula. End user prices also vary with sectors, as imported LNG is pooled with domestic gas to create different prices in each sector (Mehta, 2021).
Excise duty40%
Value added tax36%
Customs duty 4%
Crude oil cess 3%
IGST 2%
CGST 1%
Service tax 0.003%
Corporate tax 4%
Dividend income 2%
Profit on exploration 1%
Royalty 1%
DDT 1%
NCCD 0.2%
Consumption Production
Consumption Production
SGST 1%
Octroi, duties 0.13%
Entry, other taxes 0.07%
Royalty 2%
Dividend income 0.04%
Centre60%
State40%

46
Mapping India's Energy Policy 2022
Box 13. Investing fuel tax super profits in clean energy and just transition
Today, fossil energy taxes generate a large share of revenue. But what about the future? Recent projections suggest that revenues will grow, largely due to anticipated growth in oil product prices and consumption. According to the World Energy Outlook 2021, India’s total oil demand will increase from 4.8 million barrels per day (mbd) in 2019 to 6.0–7.2 mbd in 2030, while average crude prices could shift from USD 64 per barrel to USD 56–77 per barrel (IEA, 2021b). The range depends upon whether the world and India continue under current policy settings (the IEA’s Stated Policy scenario: STEPS) or adopt more ambitious climate policies (Sustainable Development Scenario: SDS).
Estimating future revenue is complicated because it involves many factors, but a simple approach can capture the major trends. Using IEA scenarios for fossil energy consumption and production as well as oil prices, we assume the same average tax burden as FY2019–2020 (Figure 20) and find two things. First, revenues are likely to grow considerably, even in scenarios with accelerated clean energy transition: an additional INR 30,000 to INR 340,000 crore (USD 4 to 48 billion) by 2030, compared to 2019. Second, fossil energy is not a reliable source of revenue. For oil in particular, as India pursues energy independence by 2047 (which implies very low or no oil consumption by 2050), consumption will fall even farther than the SDS scenario, driving lower revenues.
The additional slice of fossil tax “super profits” in the coming years should be used strategically on investment rather than general expenditure. Two priorities stand out. First, allocate a share for clean energy, which, by accelerating transition, will reduce external costs, provide consumers with alternatives and itself become a source of revenue. The most transparent way would be to reinstate the National Clean Energy and Environment Fund (NCEEF), or an equivalent, focused on 2030, 2047, and net-zero targets, alongside efforts to improve the performance of earmarking (see Box 14). The second is to focus a share on socially responsible transition. High fuel taxes are already a frequent topic of debate, given their impacts on the cost of living. High rates can be justified—if there are mechanisms to reinvest revenue in social protection and just transition. At the same time, the centre and states should work together to widen the tax base and diversify sources of revenue.
Figure 20. Scenarios for government revenue from fossil fuel products, 2019–2050
Source: Authors, based on IISD tax data and data from (IEA, 2021a).
0
25,000
50,000
75,000
100,000
125,000
150,000
175,000
200,000
2019 2030 2035 2040 2045 2050
US
D M
illio
n
India STEPS
India SDS

IISD.org/gsi 47
5.1.3 Coal
At the central level, the majority of the INR 50,920 crore (USD 6.9 billion) in revenues from coal production and consumption in FY 2020 was derived from taxes at the point of consumption, with the GST Compensation Cess alone comprising 52% of total coal revenues (Figure 21). For state and UT revenues, most of the INR 19,707 crore (USD 2.7 billion) came from production-based non-tax measures: royalties and District Mineral Foundation (DMF) contributions (calculated as a percentage of royalties), which comprised 23% of total coal revenues. It should be noted that only a small number of states have large coal reserves, and therefore they raise significant revenue from coal.
Figure 21. Central and state coal revenues, FY 2020 (as a % of total)
Source: Authors’ calculations. See accompanying spreadsheets for more details.
IGST–Imports 7%
Basic customs duty 3%
Central GST–CIL 2%
Integrated GST–CIL 0.25%
Central sales tax–CIL 0.03%
Dividend–CIL 7%
Contribution to NMET–CIL 0.32%
Dividend–SCCL 0.13%
Consumption Production
Consumption Production
State royalty–CIL 16%
Contribution to DMF–CIL 5%
State royalty–SCCL 3%
Dividend–SCCL 0.13%
State cess on coal–CIL 3%
State GST–CIL 2%
Centre72%
State28%
GST compensation cess52%
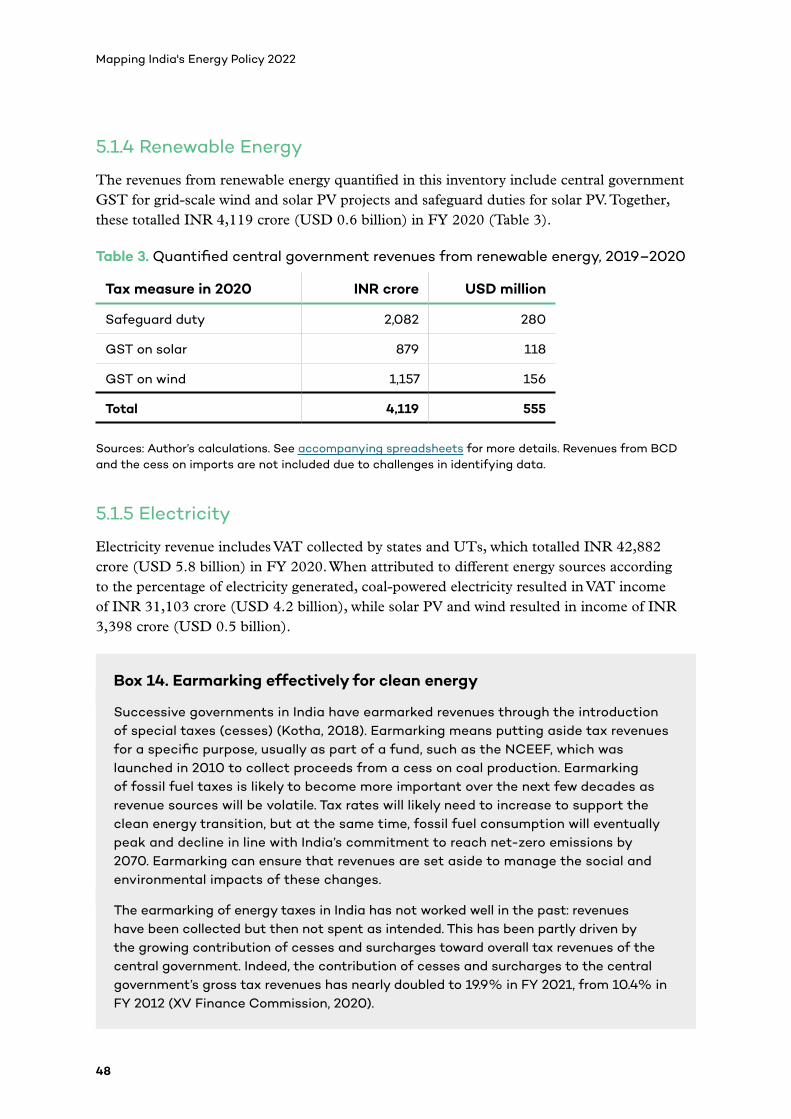
48
Mapping India's Energy Policy 2022
5.1.4 Renewable Energy
The revenues from renewable energy quantified in this inventory include central government GST for grid-scale wind and solar PV projects and safeguard duties for solar PV. Together, these totalled INR 4,119 crore (USD 0.6 billion) in FY 2020 (Table 3).
Table 3. Quantified central government revenues from renewable energy, 2019–2020
Tax measure in 2020 INR crore USD million
Safeguard duty 2,082 280
GST on solar 879 118
GST on wind 1,157 156
Total 4,119 555
Sources: Author’s calculations. See accompanying spreadsheets for more details. Revenues from BCD and the cess on imports are not included due to challenges in identifying data.
5.1.5 Electricity
Electricity revenue includes VAT collected by states and UTs, which totalled INR 42,882 crore (USD 5.8 billion) in FY 2020. When attributed to different energy sources according to the percentage of electricity generated, coal-powered electricity resulted in VAT income of INR 31,103 crore (USD 4.2 billion), while solar PV and wind resulted in income of INR 3,398 crore (USD 0.5 billion).
Box 14. Earmarking effectively for clean energy
Successive governments in India have earmarked revenues through the introduction of special taxes (cesses) (Kotha, 2018). Earmarking means putting aside tax revenues for a specific purpose, usually as part of a fund, such as the NCEEF, which was launched in 2010 to collect proceeds from a cess on coal production. Earmarking of fossil fuel taxes is likely to become more important over the next few decades as revenue sources will be volatile. Tax rates will likely need to increase to support the clean energy transition, but at the same time, fossil fuel consumption will eventually peak and decline in line with India’s commitment to reach net-zero emissions by 2070. Earmarking can ensure that revenues are set aside to manage the social and environmental impacts of these changes.
The earmarking of energy taxes in India has not worked well in the past: revenues have been collected but then not spent as intended. This has been partly driven by the growing contribution of cesses and surcharges toward overall tax revenues of the central government. Indeed, the contribution of cesses and surcharges to the central government’s gross tax revenues has nearly doubled to 19.9% in FY 2021, from 10.4% in FY 2012 (XV Finance Commission, 2020).

IISD.org/gsi 49
The coal cess and NCEEF: The NCEEF was originally intended to support clean energy technology research and innovative projects (PIB, 2011). However, it received criticism for not disbursing the majority of its funds and for allocating more disbursements to ministries than to renewable energy projects (Sengupta, 2017). Upon the introduction of the GST in 2017, the NCEEF was abolished, and the original coal cess was replaced with a GST Compensation Cess on coal, with the intention of compensating states for losses arising from the removal of state-level taxes until the end of 2022.
DMF: The DMF was instituted in 2015 with the objective of using royalties from mining companies for the benefit of mining-affected communities. Only INR 12,414 crore (USD 1.7 billion) has been spent as of January 2020, which is about 35% of the total amount accrued (Banerjee, 2020). A study by the Centre for Science and Environment found that DMF spending has been mainly used for building physical infrastructure, like roads and bridges, rather than its intended purpose of improving socio-economic outcomes in mining-affected communities (Shalya, 2020). The centre later allowed states to use 30% of DMF funds for COVID-19 relief efforts (Mishra, 2020).
Recommendations to improve earmarking include:
1. Improving the institutional setup of the fund by inducting a wide range of stakeholders in its governance, such as civil society groups, local administration, and the private sector.
2. Narrowing the scope of the fund’s usage to a few clearly defined purposes in guidelines.
3. Formulation of a process document with an overview of the fund’s governance structure, policies, processes as well as monitoring and evaluation frameworks.
4. Improving public accountability by mandating regular financial and performance audits.
5. Promoting transparency by sharing performance data on publicly available websites.
These measures are likely to succeed if they are complemented with structural changes that reduce the centre’s dependence on cesses, such as by diversifying tax revenue sources.
5.2 Energy Externalities in India To better understand the extent to which revenue collection is proportionate to the un-priced social costs of energy, this section provides a conservative estimate of externalities. The estimates are at the lower end of likely true costs for two reasons: we do not attempt to quantify all externalities (such as impacts on land and water, productivity losses and medical expenses associated with air pollution, and fugitive emissions from oil and gas extraction), and we use midpoint values or more conservative options from the literature in our calculations.
We are aware that trying to assign a financial value to energy externalities is fraught with difficulty. We do not intend to imply that human lives can be reduced to a financial value, or

50
Mapping India's Energy Policy 2022
that the human cost of externalities can be excused if the right tax rate is assigned. Rather, we believe that revenue collection from energy can and must be contextualized with reference to externalities and that taking a conservative approach is usually sufficient to draw meaningful conclusions and least likely to devolve into debates around methodology—bearing in mind that the true value of externalities could be many times higher. To illustrate uncertainty, we also provide a higher estimate based on less conservative but equally valid data, while emphasizing that many negative externalities remain unquantified. Key findings are summarized below. Appendix D provides an overview of key variables as well as details on the calculations and sources.
5.2.1 Results
5.2.1.1 Fossil Fuels
The externalities for fossil fuels estimated in this study totalled between INR 1,441,464 crore (USD 203 billion) and INR 3,543,108 (USD 500 billion) in FY 2020. Below, we provide a summary of our estimates by energy source, and compare them for reference with a recent IMF analysis of social costs of energy (Parry et al., 2021), converted into common units. Further details are provided in Table 4.
Coal
The three quantified externalities for coal combustion—air pollution-related deaths and disease (in working days lost) and impacts of climate change—were estimated to total INR 744,491 crore (USD 105 billion) using conservative assumptions. This was lower than the IMF estimate of around INR 1,125,000 crore (USD 160 billion) (Parry et al., 2021). The main difference was in the estimate of the cost of local air pollution from coal: we estimate INR 147,634 crore (USD 21 billion) while the IMF estimated INR 483,000 crore (USD 68 billion). The discrepancy is likely due to differences in assumptions used for the value of a statistical life. We use a highly conservative value derived from an Indian-based study (Bhattacharya et al., 2007), while the IMF uses a value for India extrapolated from U.S. data, adjusted according to income differences between countries which tend to be much higher. Using less-conservative assumptions, our quantified externalities for coal totalled INR 2,222,114 crore (USD 314 billion). See Appendix D for further discussion.
Oil
The quantified externalities for oil included climate change impacts plus several external costs associated with transport fuels: air pollution, road accidents, road damage, and vehicle congestion. Road damage, congestion, and traffic accidents are all proportional to the amount driven, which is related to fuel consumption (Burke & Nishitateno, 2015; Zhang & Burke, 2020). Ideally, all driving (including by EVs) would be taxed per kilometre of travel, with surcharges for congested areas, weight (road damage), and noise pollution. Until that is feasible, fuel prices should reflect these costs, and failure to do so creates an externality.
Using conservative assumptions, the total externalities quantified were estimated to be INR 666,763 crore (USD 94 billion). This is similar to the IMF estimate of INR 702,000
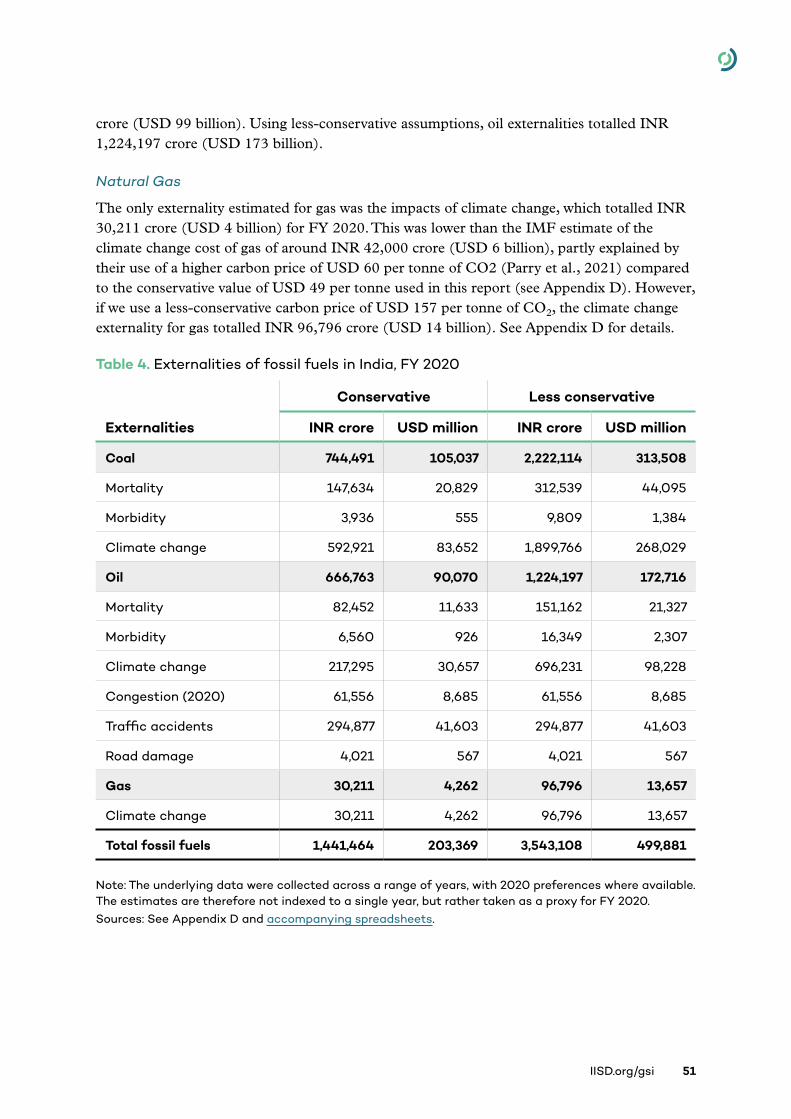
IISD.org/gsi 51
crore (USD 99 billion). Using less-conservative assumptions, oil externalities totalled INR 1,224,197 crore (USD 173 billion).
Natural Gas
The only externality estimated for gas was the impacts of climate change, which totalled INR 30,211 crore (USD 4 billion) for FY 2020. This was lower than the IMF estimate of the climate change cost of gas of around INR 42,000 crore (USD 6 billion), partly explained by their use of a higher carbon price of USD 60 per tonne of CO2 (Parry et al., 2021) compared to the conservative value of USD 49 per tonne used in this report (see Appendix D). However, if we use a less-conservative carbon price of USD 157 per tonne of CO2, the climate change externality for gas totalled INR 96,796 crore (USD 14 billion). See Appendix D for details.
Table 4. Externalities of fossil fuels in India, FY 2020
Externalities
Conservative Less conservative
INR crore USD million INR crore USD million
Coal 744,491 105,037 2,222,114 313,508
Mortality 147,634 20,829 312,539 44,095
Morbidity 3,936 555 9,809 1,384
Climate change 592,921 83,652 1,899,766 268,029
Oil 666,763 90,070 1,224,197 172,716
Mortality 82,452 11,633 151,162 21,327
Morbidity 6,560 926 16,349 2,307
Climate change 217,295 30,657 696,231 98,228
Congestion (2020) 61,556 8,685 61,556 8,685
Traffic accidents 294,877 41,603 294,877 41,603
Road damage 4,021 567 4,021 567
Gas 30,211 4,262 96,796 13,657
Climate change 30,211 4,262 96,796 13,657
Total fossil fuels 1,441,464 203,369 3,543,108 499,881
Note: The underlying data were collected across a range of years, with 2020 preferences where available. The estimates are therefore not indexed to a single year, but rather taken as a proxy for FY 2020. Sources: See Appendix D and accompanying spreadsheets.

52
Mapping India's Energy Policy 2022
5.2.1.2 Renewable Energy and EVs
For grid-scale solar PV and wind power, externalities were estimated using life cycle assessment (LCA) approach for GHG emissions and integration costs. Integration costs are estimated because the variable and unpredictable nature of renewable electricity imposes costs (primarily for flexible generation and storage) that are not typically reflected in prices paid by consumers. The estimates drew on capacity additions for India in 2020, but due to a lack of domestic metrics, international values were used for the costs per unit: integration costs and life-cycle emissions (see Appendix D). The total conservative cost of these externalities was estimated to be INR 12,993 crore (USD 1.8 billion), as elaborated in Table 5.
Externalities for EVs were not estimated in this study. Other research has found that external costs for EVs do not differ significantly from conventional vehicles in terms of road accidents, road damage, and vehicle congestion (Jochem et al., 2015). However, climate change, noise, and air pollution externalities for EVs tend to be lower (Jochem et al., 2015). For example, life-cycle GHG emissions of average medium-size battery EVs registered in 2021 were found to be lower than comparable gasoline cars by 19%–34% in India (Bieker, 2021).
Box 15. Traffic accidents and congestion
Congestion and traffic accidents are a fossil fuel externality because they create costs that are not reflected in fuel prices. In the case of congestion, road space is a scarce resource and, in the absence of pricing, too many drivers will use the road and cause it to become congested. Congestion reduces productivity and causes wasted fuel. Traffic accidents impose costs through death, injury, and vehicle damage. None of these costs are captured in fuel prices, but the severity of impacts (amount of congestion and number of accidents) is proportional to the amount driven. Vehicle ownership is a fixed cost and therefore does not influence the decision to drive, but rather running costs will. Ideally driving (including by EVs) would be taxed per kilometre travelled with surcharges for congested areas, weight (which affects road damage), and noise pollution. Until that is implemented, it is reasonable that the key running cost for most vehicles—fuel prices—reflects these external costs.
Estimating congestion and accident costs is challenging. Congestion requires knowledge of the marginal cost of driving: the impact of one more vehicle on the road. For road accidents, part of the cost is considered internal to drivers (such as own-driver injuries in single-vehicle accidents) and others are external (such as injuries to pedestrians or cyclists, property and medical costs borne by third parties). For these reasons, we use the IMF’s estimates for India from Parry et al. (2021). We also use IMF estimates for road damage, which are based on highway maintenance expenditures. See Parry et al. (2014) for a detailed description of methodology.

IISD.org/gsi 53
Table 5. Externalities of renewable energy in India, FY 2020
Externalities
Conservative Less conservative
INR crore USD million INR crore USD million
Integrations costs 11,851 1,672 14,403 2,032
LCA GHG emissions solar PV
729 103 2,338 330
LCA GHG emissions wind (onshore)
353 50 1,131 160
Total 12,933 1,825 17,872 2,521
Sources: See Appendix D and accompanying spreadsheets.
5.3 Comparison of Revenues and ExternalitiesWe estimate that the total conservative externalities for fossil fuels (INR 1,441,464 crore; USD 203 billion) in FY 2020 were more than double the value of fossil fuel revenues (INR 6,52,564 crore; USD 88 billion). Oil and gas externalities were 20% higher than revenues, while coal externalities were 11 times revenues. For renewables, externalities were 10% higher than the current level of revenues.
These externalities are lower-bound estimates given many external costs were not included (and therefore the totals are likely to underestimate full costs) and conservative values were used.
From a “polluter-pays” perspective, the findings indicate that the external costs of coal are much higher than the total revenues it contributes to government budgets. Even oil, which has relatively high taxation rates for transport fuels, contributes significantly less revenue than a conservative estimate of its externalities. Renewable energy also appears to create fewer revenue benefits than its external costs, given the expense of grid integration costs (although this varied with the assumptions about integration costs). However, between fossil fuels and renewable energy, there is a compelling case for lower renewable energy taxes to encourage a switch to sources of electricity with much lower externalities. All of this suggests that there is considerable room to bring the price of fossil energy more in line with its costs, to help stimulate the transition to clean energy in an efficient way. As the government elaborates more detailed policy frameworks on net-zero, we recommend that it explicitly articulate the role that taxation can play in carbon pricing and how revenues can be strategically invested in clean energy and social protection tools, to manage impacts on the cost of living.

54
Mapping India's Energy Policy 2022
Figure 22. Comparison of revenues and externalities by energy sources, FY 2020 (INR crore)
Notes: 1. Revenues include central, state, and UT revenues. 2. Externalities were calculated using India-specific sources where possible. Estimates for congestion, traffic accidents, and road damage are taken directly from Parry et al. (2021). The “less-conservative estimate” was calculated using higher values from the literature for the social cost of carbon, value of a statistical life, number of deaths caused by air pollution, median rather than minimum wage for working days lost, and integration costs for renewables. It is considered less conservative and not an upper bound due to the large number of externalities that were not assessed, as summarized in the diagram.
Sources: See Appendix D and accompanying spreadsheets for more details.
INR 1,000k crore
-2.5 -1.5 -0.5 0.5-2 -1 0 1
Coal Total
Climate change
Air pollution mortality
Air pollution morbidity
RevenuesExternalities
Oil & Gas Total
Climate change
Air pollution mortality
Air pollution morbidity
Congestion
Road damage
Traffic accidents
RE Total
LCA GHG emissions
Integration costs
Less conservative estimate
IISD.org/gsi 55
6.0 RecommendationsBased on the findings of this report, we recommend that India should undertake the following next steps to enable a clean energy transition:
1. Align support with 2030 targets and net-zero
a. Continue to phase out support for fossil fuels in a socially responsible way.
b. Introduce new support as needed to meet clean energy targets and ensure a just transition.
c. Establish a body to coordinate actions across support, taxation, and pricing for energy, with relevant ministries, departments, and expert agencies to bring policy coherence (Singh, 2022a).
2. Shift subsidies
a. Establish a National Electricity Council as a platform on power sector issues and mandate it to lead dialogue between centre and states on electricity subsidy reform, including targeting subsidies to low-income consumers and swapping subsidies for sustainable agriculture practices (Agarwal, 2020).
b. Ensure that any subsidies for LPG are targeted and combined with support to incubate non-fossil cooking technologies.
c. Develop a strategy and timeline to reform coal subsidies responsibly—for example, shifting subsidies away from the input (coal) and toward the service (affordable electricity).
d. Identify how much support is required to achieve clean energy targets, particularly for new and emerging technologies—and provide it.
3. Diversify PSUs
a. Ministries should mandate energy PSUs to diversify into clean energy and adjust CSR rules to explicitly encourage support for sustainability and just transition.
b. PSUs should ramp up investment in clean energy while establishing net-zero roadmaps for phasing down fossil fuels.
4. Shift public finance
a. Ministries should increase clean energy sector lending targets in line with stated policy targets.
b. PFIs in India should seek to swiftly end new primary public finance for coal thermal power or mining, other than decommissioning and just transition, to minimize already-high levels of exposure to fossil assets. PFIs should further set out a vision and roadmap on how to phase out public finance for fossil fuels and manage possible stranded assets.

56
Mapping India's Energy Policy 2022
5. Use taxation strategically
a. High fossil fuel tax revenue during a period of increasing prices should be set aside for: i) improved social protection and public services to reduce living costs; and ii) public support for clean energy, including just transition, to reduce volatility and improve security in the medium term.
b. As the government elaborates more detailed policy frameworks on net-zero, it should explicitly articulate what role taxation plays in creating accurate and consistent carbon pricing and the social protection that is needed to redirect revenues to the poor and vulnerable.
6. Improve transparency
a. Ministries, departments, and central banks should create clear “sectoral categories” for fossil fuel and clean energy for reporting by institutions under them to demarcate the use of different energy fuel types across the economy.
b. PSUs and PFIs should improve reporting on support for energy to enable better joined-up decision making.

IISD.org/gsi 57
ReferencesAdani Green Energy Limited. (2021). Equity presentation—December 2021. https://www.
adanigreenenergy.com/-/media/Project/GreenEnergy/Investor-Downloads/Equity-Investor-Presentations/December-2021.pdf
Agarwal, D. (2020, July 3). Rethinking the role of institutions for effective policy implementation in power sector. Council on Energy, Environment and Water. https://www.ceew.in/blogs/rethinking-role-institutions-effective-policy-implementation-power-sector
Aggarwal, P., Viswamohanan, A., Narayanaswamy, D., & Sharma, S. (2020). Unpacking India’s electricity subsidies: Reporting, transparency, and efficacy. International Institute for Sustainable Development, Council on Energy, Environment and Water. https://www.iisd.org/publications/india-electricity-subsidies
Banerjee, S. (2020, April 6). Utilising District Mineral Foundation funds to fight the COVID-19 crisis in India: Current and future opportunities. Brookings. https://www.brookings.edu/blog/up-front/2020/04/06/utilising-district-mineral-foundation-funds-to-fight-the-covid-19-crisis-in-india-current-and-future-opportunities/
Bank of Baroda. (2019). Disclosures (on consolidated basis) under Pillar 3 in terms of new capital adequacy. https://www.bankofbaroda.in/-/media/Project/BOB/CountryWebsites/India/shareholders-corner/march-2019-24-14.pdf
Bank of Baroda. (2020). Disclosures (on consolidated basis) under Pillar 3 in terms of new capital adequacy. https://www.bankofbaroda.in/-/media/Project/BOB/CountryWebsites/India/shareholders-corner/march-2020-24-14.pdf
Bank of Baroda. (2021). Disclosures (on consolidated basis) under Pillar 3 in terms of new capital adequacy. https://www.bankofbaroda.in/-/media/Project/BOB/CountryWebsites/India/shareholders-corner/march-2021-24-14.pdf
Bank of India. (2019). Basel III (Pillar 3)—Disclosures (consolidated) March, 2019. https://www.bankofindia.co.in/BaselIIIDisclosure
Bank of India. (2020). Basel III (Pillar 3)—Disclosures (consolidated) March, 2020. https://www.bankofindia.co.in/BaselIIIDisclosure
Bank of India. (2021). Basel III (Pillar 3)—Disclosures (consolidated) March, 2021. https://www.bankofindia.co.in/BaselIIIDisclosure
Bank of Maharashtra. (2019). Basel III—Pillar 3 disclosures at March 31, 2019. https://www.bankofmaharashtra.in/basel_iii_disclosure
Bank of Maharashtra. (2020). Basel III—Pillar 3 disclosures at March 31, 2020. https://www.bankofmaharashtra.in/basel_iii_disclosure
Bank of Maharashtra. (2021). Basel III—Pillar 3 disclosures at March 31, 2021. https://www.bankofmaharashtra.in/basel_iii_disclosure

58
Mapping India's Energy Policy 2022
Bhandari, R., Kumar, B., & Mayer, F. (2020). Life cycle greenhouse gas emission from wind farms in reference to turbine sizes and capacity factors. Journal of Cleaner Production, 277, 123385. https://doi.org/10.1016/j.jclepro.2020.123385
Bharat Petroleum Corporation Limited. (2021). Annual report 2020-21. https://www.bharatpetroleum.in//pdf/OurFinancial/BPCL-AR-2020-21-04092021-1206AM-with-Link-Compressedcompressed-9e07f3.pdf
Bhardwaj, S. (2021, October 22). What Reliance could target next in green energy. Bloomberg Quint. https://www.bloombergquint.com/business/what-reliance-could-target-next-in-green-energy
Bhatt, N. (2021). Public financing of coal in the midst of climate crisis. Citizen Consumer and Civic Action Group. https://www.cag.org.in/newsletters/public-newsense/public-financing-coal-midst-climate-crisis
Bhattacharya, S., Alberini, A., & Cropper, M. L. (2007). The value of mortality risk reductions in Delhi, India. Journal of Risk and Uncertainty, 34(1), 21–47. https://doi.org/10.1007/s11166-006-9002-5
Bhushan, C., Banerjee, S., & Agarwal, S. (2020). Just transition in India. https://iforest.global/wp-content/uploads/2020/12/Book-preview-final.pdf
Bieker, G. (2021). A global comparison of the life-cycle greenhouse gas emissions of combustion engine and electric passenger cars. International Council on Clean Transportation. https://theicct.org/publication/a-global-comparison-of-the-life-cycle-greenhouse-gas-emissions-of-combustion-engine-and-electric-passenger-cars/
Biswas, T., & Ganesan, K. (2021, April 22). A fresh push for green hydrogen. The Hindu. https://www.thehindu.com/opinion/op-ed/a-fresh-push-for-green-hydrogen/article34379481.ece
Biswas, T., Yadav, D., & Baskar, A. G. (2020). A green hydrogen economy for India: Policy and technology imperatives to lower production cost. Council on Energy, Environment and Water; Shakti Sustainable Energy Foundation. https://www.ceew.in/publications/reducing-green-hydrogen-production-cost-in-india
BL Bureau. (2021, September 28). NTPC revises its RE targets to 60 GW by 2030. Business Line. https://www.thehindubusinessline.com/companies/ntpc-revises-its-re-targets-to-60-gw-by-2030/article36708752.ece
Bodnar, P., Gray, M., Grbusic, T., Herz, S., Lonsdale, A., Mardell, S., Ott, C., Sundaresan, S., & Varadarajan, U. (2020). How to retire early: Making coal phaseout feasible and just. Rocky Mountain Institute, Sierra Club, and Carbon Tracker Initiative. https://rmi.org/wp-content/uploads/2021/03/rmi_how_to_retire_early.pdf
Burke, P. J., & Nishitateno, S. (2015). Gasoline prices and road fatalities: International evidence. Economic Inquiry, 53(3), 1437–1450.

IISD.org/gsi 59
Business Standard. (2021, September 3). Mukesh Ambani sees green hydrogen costs coming down to $1 per kg in 10 yrs. https://www.business-standard.com/article/economy-policy/mukesh-ambani-sees-green-hydrogen-costs-coming-down-to-1-per-kg-in-10-yrs-121090300540_1.html
Canara Bank. (2019). Basel III Disclosures as on 31.03.2019. https://canarabank.com/User_page.aspx?othlink=139
Canara Bank. (2020). Basel III Disclosures as on 31.03.2020. https://canarabank.com/User_page.aspx?othlink=139
Canara Bank. (2021). Basel III Disclosures as on 31.03.2021. https://canarabank.com/User_page.aspx?othlink=139
Capital Market. (2021, July 17). Tata Power ties up with HPCL to set up EV charging stations. Business Standard India. https://www.business-standard.com/article/news-cm/tata-power-ties-up-with-hpcl-to-set-up-ev-charging-stations-121071700216_1.html
Central Bank of India. (2019). BASEL III Disclosures as on 31 March 2019. https://www.centralbankofindia.co.in/en/basel-III-disclosure
Central Bank of India. (2020). BASEL III Disclosures as on 31 March 2020. https://www.centralbankofindia.co.in/en/basel-III-disclosure
Central Bank of India. (2021). BASEL III Disclosures as on 31 March 2021. https://www.centralbankofindia.co.in/en/basel-III-disclosure
Central Electricity Authority. (2020a). Annual report 2019-20. https://cea.nic.in/old/reports/annual/annualreports/annual_report-2020.pdf
Central Electricity Authority. (2020b). Report on optimal generation capacity mix for 2029-30. Ministry of Power, Government of India. https://cea.nic.in/old/reports/others/planning/irp/Optimal_mix_report_2029-30_FINAL.pdf
Central Electricity Authority. (2021). Review of progress of thermal power projects under execution in the country (Quarterly Review No. 176). https://cea.nic.in/thermal-project-monitoring-i-division/?lang=en
Central Electricity Authority. (2022, February). Installed capacity report. https://cea.nic.in/installed-capacity-report/?lang=en
Centre for Financial Accountability & Climate Trends. (2021). Coal vs. renewable | financial analysis. https://www.cenfa.org/uncategorized/coal-vs-renewable-financial-analysis/
Chakravarty, P. (2020, September 28). Why so few Indians pay income tax. BloombergQuint. https://www.bloombergquint.com/opinion/why-so-few-indians-pay-income-tax
Chakravarty, S., & Somanathan, E. (2021). There is no economic case for new coal plants in India. World Development Perspectives, 24, 100373. https://doi.org/10.1016/j.wdp.2021.100373

60
Mapping India's Energy Policy 2022
Chatterjee, A. (2021a, June 25). Massive green push: Reliance Industries to invest Rs 75,000 crore in 3 years. Financial Express. https://www.financialexpress.com/industry/massive-green-push-reliance-industries-to-invest-rs-75000-crore-in-3-years/2278016/
Chatterjee, A. (2021b, October 26). Rs 4,500-crore scheme: Solar PLI: 16 companies make the cut. Financial Express. https://www.financialexpress.com/industry/rs-4500-crore-scheme-solar-pli-16-companies-make-the-cut/2356828/
Chaturvedi, V., & Malyan, A. (2021). Implications of a net-zero target for India’s sectoral energy transitions and climate policy. Council on Energy, Environment and Water. https://www.ceew.in/publications/implications-of-net-zero-target-for-indias-sectoral-energy-transitions-and-climate-policy
Chirayil, M., & Sreenivas, A. (2021). Early age-based retirement of coal power plants: Misplaced emphasis? Prayas (Energy Group). https://www.prayaspune.org/peg/publications/item/501-early-age-based-retirement-of-coal-power-plants-misplaced-emphasis.html
Choudhary, S. (2021, September 19). HPCL to build 5,000 electric vehicle charging stations in three years. ET Energy World. https://energy.economictimes.indiatimes.com/news/oil-and-gas/hpcl-to-build-5000-electric-vehicle-charging-stations-in-three-years/86335786
Clean Air Fund, Dalberg Advisors, Blue Sky Analytics, & Confederation of Indian Industry. (2021). Air pollution and its impact on business: The silent pandemic. https://www.cleanairfund.org/wp-content/uploads/2021/04/01042021_Business-Cost-of-Air-Pollution_Long-Form-Report.pdf
Coady, D., Parry, I., Le, N.-P., & Shang, B. (2019). Global fossil fuel subsidies remain large: An update based on country-level estimates. International Monetary Fund. https://www.imf.org/en/Publications/WP/Issues/2019/05/02/Global-Fossil-Fuel-Subsidies-Remain-Large-An-Update-Based-on-Country-Level-Estimates-46509
Coal India Limited. (2021). Annual report & accounts 2020–2021. https://www.coalindia.in/media/documents/AR_2.pdf
Council on Energy, Environment and Water Centre for Energy Finance. (n.d.). Electric mobility dashboard. https://cef.ceew.in/intelligence/tool/electric-mobility
Council on Energy, Environment and Water Centre for Energy Finance. (2020, September 2). One for all, all for one: Interoperability of public electric vehicle charging in India. https://cef.ceew.in/masterclass/analysis/interoperability-of-public-electric-vehicle-charging-in-india
Council on Energy, Environment and Water Centre for Energy Finance. (2021). Catalysing green hydrogen growth in India. https://cef.ceew.in/masterclass/analysis/catalysing-green-hydrogen-growth-in-india
Cropper, M., Cui, R., Guttikunda, S., Hultman, N., Jawahar, P., Park, Y., Yao, X., & Song, X.-P. (2021). The mortality impacts of current and planned coal-fired power plants in India. Proceedings of the National Academy of Sciences, 118(5). https://doi.org/10.1073/pnas.2017936118

IISD.org/gsi 61
Dahiya, S., & Ghildiyal, S. (2021, October 14). India’s coal crisis explained in graphs. https://energyandcleanair.org/indias-coal-crisis-explained-in-graphs
Department of Public Enterprises. (2014). Guidelines on corporate social responsibility and sustainability for central public sector enterprises. https://dpe.gov.in/sites/default/files/Guidelines_on_CSR_SUS_2014.pdf
Department of Public Enterprises. (2020). List of Maharatna, Navratna and Miniratna CPSEs. https://dpe.gov.in/about-us/divisions/list-maharatna-navratna-and-miniratna-cpses
Discount shopping: PSU refiners stock up on cheap Russian crude. (2022, March 19). Economic Times. https://energy.economictimes.indiatimes.com/news/oil-and-gas/discount-shopping-psu-refiners-stock-up-on-cheap-russian-crude/90315355
Domestic LPG cylinder price hiked by Rs 50, now just 50 paise short of Rs 1,000 mark. (2022, May 7). Economic Times. https://economictimes.indiatimes.com/industry/energy/oil-gas/domestic-lpg-cylinder-price-hiked-by-rs-50-now-just-50-paise-short-of-rs-1000-mark/articleshow/91390507.cms?from=mdr
ET EnergyWorld. (2021, December 26). BPCL, SECI to set up 10 GW renewable energy capacity by 2040. https://energy.economictimes.indiatimes.com/news/renewable/bpcl-seci-to-set-up-10-gw-renewable-energy-capacity-by-2040/88500084
Finance in Common. (2020, November 12). Joint declaration of all public development banks in the world. https://financeincommon.org/sites/default/files/2021-06/FiCs%20-%20Joint%20declaration%20of%20Public%20Development%20Banks.pdf
Financial Express. (2021). Don’t renege on PPAs; Room for renegotiation may be created, but with penalties. https://www.financialexpress.com/opinion/dont-renege-on-ppas-room-for-renegotiation-may-be-created-but-with-penalties/2365202/
Ganesan, K. (2021, October 15). Explained: How alarming is the issue of coal shortage in India? [Interview]. https://www.mid-day.com/amp/lifestyle/nature-&-wildlife/article/explained-how-alarming-is-the-issue-of-coal-shortage-in-india-23196774
Ganesan, K., & Narayanaswamy, D. (2021). Coal power’s trilemma: Variable cost, efficiency and financial solvency. Council on Energy, Environment and Water. https://www.ceew.in/sites/default/files/CEEW-study-on-thermal-decommissioning-coal-electricity-power-plants.pdf
Garg, V. (2021, October 18). IEEFA India: Energy crisis shows coal is an expensive and unreliable source of electricity generation. Institute for Energy Economics & Financial Analysis. http://ieefa.org/ieefa-india-energy-crisis-shows-coal-an-expensive-and-unreliable-source-of-electricity-generation/
Garg, V., Beaton, C., Sharma, S., Bridle, R., Viswanathan, B., Narayanaswamy, D., & Ganesan, K. (2020). Mapping India’s energy subsidies 2020: Fossil fuels, renewables and electric vehicles. International Institute for Sustainable Development. https://www.iisd.org/publications/mapping-indias-energy-subsidies-2020-fossil-fuels-renewables-and-electric-vehicles
Garg, V., & Geddes, A. (2019). Beyond fossil fuels: Fiscal transition in the BRICS – India [Case study]. Institute for Sustainable Development. https://www.iisd.org/system/files/publications/beyond-fossil-fuels-india.pdf
62
Mapping India's Energy Policy 2022
Garg, V., Gerasimchuk, I., Beaton, C., Bandyopadhyay, K. R., Whitley, S., Worrall, L., Scott, A., Patel, S., Chugh, G., Gupta, A., Jain, A., Malhotra, R., & Sodhi, G. (2017, November 28). India’s energy transition: Mapping subsidies to fossil fuels and clean energy in India. Institute for Sustainable Development. https://www.iisd.org/library/india-energy-transition-mapping-subsidies-fossil-fuels-and-clean-energy-india
Garg, V., Gulia, J. & Thayillam, A. K. (2021a). India’s power sale agreement (PSA) hold-up: Fixing a renewable energy bottleneck potential solutions for an aggravating renewable energy industry conundrum. JMK Research and Analytics, Institute for Energy Economics and Financial Analysis. https://ieefa.org/wp-content/uploads/2021/04/Indias-Power-Sale-Agreement-Hold-Up-Fixing-a-Renewable-Energy-Bottleneck_April-2021.pdf
Garg, V., Gulia, J., Gupta, N., & Thayillam, A. K. (2021b). Viability assessment of new domestic solar module manufacturing units.
Gas Authority of India Limited. (2021). Integrated annual report 2020-21. https://gailonline.com/pdf/InvestorsZone/AnnualReports/IntegratedAnnualReport202021.pdf
Gerasimchuk, I., Kühne, K., Roth, J., Geddes, A., Oharenko, Y., Bridle, R. & Garg, V. (2019). Beyond fossil fuels: Fiscal transition in BRICS. International Institute for Sustainable Development, Global Subsidy Initiative, Leave it in the Ground Initiative. https://www.iisd.org/sites/default/files/publications/beyond-fossil-fuels-brics.pdf
Ghosh, A. (2021, July 21). Policy must pave the path for a green-hydrogen economy in India. Financial Express. https://www.financialexpress.com/opinion/a-green-hydrogen-economy-for-india/2294481/
Government of India. (2018). National policy on biofuels—2018. https://mopng.gov.in/files/uploads/NATIONAL_POLICY_ON_BIOFUELS-2018.pdf
Government of India. (2022). Union budget 2022-2023. https://www.indiabudget.gov.in/doc/budget_speech.pdf
Gunatilake, H., Ganesan, K., & Bacani, E. (2014). Valuation of health impacts of air pollution from power plants in Asia: A practical guide. Asian Development Bank. https://www.adb.org/sites/default/files/publication/149583/south-asia-wp-30.pdf
Gupta, A., Vyas, S., Hathi, P., Khalid, N., Srivastav, N., Spears, D., & Coffey, D. (2019). Persistence of solid fuel use despite increases in LPG ownership: New survey evidence from rural north India [Preprint]. SocArXiv. https://doi.org/10.31235/osf.io/yv2es
Guttikunda, S. K., & Jawahar, P. (2018). Evaluation of particulate pollution and health impacts from planned expansion of coal-fired thermal power plants in India using WRF-CAMx modeling system. Aerosol and Air Quality Research, 18(12), 3187–3201. http://aaqr.org/files/article/6793/24_AAQR-18-04-OA-0134_3187-3202.pdf
Helbling, T. (2020). Externalities: Prices do not capture all costs. International Monetary Fund. https://www.imf.org/external/pubs/ft/fandd/basics/external.htm
Heptonstall, P. J., & Gross, R. J. K. (2020). A systematic review of the costs and impacts of integrating variable renewables into power grids. Nature Energy, 6, 72–83.

IISD.org/gsi 63
Hindustan Petroleum Corporation Limited. (2021). Annual report 2020-21. https://www.hindustanpetroleum.com/documents/pdf/Annual%20Report%202020_2021.pdf
Indian Bank. (2019). Basel III – Pillar III disclosures—March 31, 2019. https://www.indianbank.in/wp-content/uploads/2018/06/Basel-III_Pillar-III_Disclosures_Mar_2019.pdf
Indian Bank. (2020). Basel III – Pillar III disclosures—March 31, 2020. https://www.indianbank.in/wp-content/uploads/2019/04/Basel-III-Pillar-III-Disclosures-as-on-31.03.2020.pdf
Indian Bank. (2021). Basel III – Pillar III disclosures—March 31, 2021. https://www.indianbank.in/wp-content/uploads/2019/04/Basel-III-----Pillar-III-Disclosures-as-on-31.03.2021.pdf
Indian Oil Corporation Limited. (2021a). Integrated annual report 2020-21. https://www.iocl.com/contents/integrated-annual-report-2020-21/financial-capital.html
Indian Oil Corporation Limited. (2021b, March 17). IndianOil and Phinergy, Israel forms JV to boost India’s e-mobility aspirations. https://iocl.com/NewsDetails/59187
Indian Overseas Bank. (2019). Annual Basel II Pillar 3 information disclosure. https://www.iob.co.th/FileList?id=3
Indian Overseas Bank. (2020). Annual Basel II Pillar 3 information disclosure. https://www.iob.co.th/FileList?id=3
Indian Overseas Bank. (2021). Annual Basel II Pillar 3 information disclosure. https://www.iob.co.th/FileList?id=3
Indian Renewable Energy Development Agency. (2019). 32nd annual report 2018-19. https://www.ireda.in/doc/annual-report/annual-report-ireda-18-19.-pdf
Indian Renewable Energy Development Agency. (2020). 33rd annual report 2019-20. https://www.ireda.in/images/HTMLfiles/IREDA_AR_2019-20_All%20pages(1).pdf
Indian Renewable Energy Development Agency. (2021). 34th annual report 2020-21. https://www.ireda.in/images/HTMLfiles/Annual%20Report%202020-21.pdf
Indo-Asian News Service. (2021, December 14). BPCL, Bhabha Atomic Research Centre join hands for green hydrogen production. ETEnergyworld.Com. https://energy.economictimes.indiatimes.com/news/renewable/bpcl-bhabha-atomic-research-centre-join-hands-for-green-hydrogen-production/88268199
Institute for Energy Economics & Financial Analysis. (2021, June 3). IEEFA: New coal-fired power plants in India will be economically unviable. http://ieefa.org/ieefa-new-coal-fired-power-plants-in-india-will-be-economically-unviable/
International Council on Clean Transportation. (2019). Health impacts of air pollution from transportation sources in Delhi. https://theicct.org/sites/default/files/ICCT_factsheet_health_impact_airpollution_Delhi_20190705.pdf
International Energy Agency. (n.d.). India—Countries & regions. https://www.iea.org/countries/india
International Energy Agency. (2020a). India 2020—Energy policy review. https://webstore.iea.org/download/direct/2933?fileName=India_2020-Policy_Energy_Review.pdf
64
Mapping India's Energy Policy 2022
International Energy Agency. (2020b). World energy outlook 2020. https://www.iea.org/reports/world-energy-outlook-2020
International Energy Agency. (2021a). India energy outlook 2021. https://www.iea.org/reports/india-energy-outlook-2021
International Energy Agency. (2021b). World energy outlook 2021. https://www.iea.org/reports/world-energy-outlook-2021
International Institute for Sustainable Development. (n.d.). Energy policy tracker—India. https://www.energypolicytracker.org/country/india/
International Road Assessment Programme. (2021). IRAP toolkit. https://indiarap.org/irap-toolkit/
Jai, S. (2020, September 7). Doubling priority lending for renewables to help only small installations. Business Standard. https://www.business-standard.com/article/economy-policy/doubling-priority-lending-for-renewables-to-help-only-small-installations-120090600370_1.html
Jain, A., Tripathi, S., Mani, Sunil, Patnaik, Sasmita, Shahidi, Tauseef, & Ganesan, Karthik. (2018). Access to clean cooking energy and electricity: Survey of States 2018. Council on Energy, Environment and Water. https://www.ceew.in/sites/default/files/CEEW-Access-to-Clean-Cooking-Energy-and-Electricity-11Jan19_0.pdf
JMK Research & Analytics. (2021). Q3 2021 India RE update (Jul-Sep 2021). https://jmkresearch.com/renewable-sector-published-reports/q3-2021-india-re-update/
Jochem, P., Doll, C., & Fichtner, W. (2015). External costs of electric vehicles. Transportation Research Part D Transport and Environment, 42, 60–76. https://doi.org/10.1016/j.trd.2015.09.022
Joshi, A. (2021). Punjab passes bill in Legislative Assembly to renegotiate renewable energy tariffs. Mercom India. https://mercomindia.com/punjab-renewable-energy-tariffs-renegotiation-bill/
Kannappan, S. (2022, February 2). Union budget 2022-23: Why CSE disagrees with government’s proposal on coal gasification. Down to Earth. https://www.downtoearth.org.in/news/economy/union-budget-2022-23-why-cse-disagrees-with-government-s-proposal-on-coal-gasification-81372
Kar, S. (2022, April 6). Petrol, diesel prices hike: ₹10 increased in 16 days, 80 paise up today. Hindustan Times. https://www.hindustantimes.com/business/petrol-price-today-diesel-price-today-april-6-2022-fuel-price-hike-of-rs-10-per-litre-101649207607060.html
Kaur, H. (2021). EVs need regulatory charge. The Hindu Business Line. https://www.thehindubusinessline.com/opinion/evs-need-regulatory-charge/article34552060.ece
Kniesner, T. J., & Viscusi, W. K. (2019, July 29). The value of a statistical life. Oxford Research Encyclopedia of Economics and Finance. https://doi.org/10.1093/acrefore/9780190625979.013.138
Kotha, A. P. (2018). Cesses in the Indian tax regime: A historical analysis (SSRN Scholarly Paper ID 3095500). Social Science Research Network. https://papers.ssrn.com/abstract=3095500

IISD.org/gsi 65
Kumar, M., & Verma, N. (2022, January 19). India fuel price freeze eases inflation pressure, boosts Modi election hopes—observers. Reuters. https://www.reuters.com/markets/commodities/india-fuel-price-freeze-eases-inflation-pressure-boosts-modi-election-hopes-2022-01-19/
Kumar, R. (2021, November 29). Why India decided to release 5 million barrels from its Strategic Petroleum Reserve. The New Indian Express. https://www.newindianexpress.com/business/2021/nov/29/explainer--why-india-decided-to-release-5-million-barrels-from-its-strategic-petroleum-reserve-2389624.html
Kumaresh, G., Saldanha, F., Lich, T., & Moennich, J. (2021). Estimation of socio-economic loss due to road traffic accidents in India (SAE Technical Paper No. 2021-26–0012). SAE International. https://doi.org/10.4271/2021-26-0012
Mani, S., Agrawal, S., Jain, A., & Ganesan, K. (2021). State of clean cooking energy access in India: Insights from the India residential energy survey (IRES) 2020. Council on Energy, Environment and Water.
Mehta, V. S. (2021). The next stop: Natural gas and India’s journey to a clean energy future. Centre for Science and Environment. https://csep.org/books-chapters/the-next-stop-natural-gas-and-indias-journey-to-a-clean-energy-future/
Ministry of External Affairs. (2021, November 2). National Statement by Prime Minister Shri Narendra Modi at COP26 Summit in Glasgow. https://www.mea.gov.in/Speeches-Statements.htm?dtl/34466/National+Statement+by+Prime +Minister+Shri+Narendra+Modi+at+COP26+Summit+in+Glasgow
Ministry of Finance. (2021a). Union budget 2021-22. Government of India. https://www.indiabudget.gov.in/budget2021-22/doc/Budget_at_Glance/bag5.pdf
Ministry of Finance. (2021b, February 1). Union budget. Government of India. https://www.indiabudget.gov.in/
Ministry of Labour and Employment. (2018). Area wise rates of minimum wages for scheduled employments in the central sphere. https://labour.gov.in/sites/default/files/MW%20PDF.pdf
Ministry of New and Renewable Energy. (2022, March 22). Programme/scheme wise cumulative physical progress as on Feb, 2022. Government of India. https://mnre.gov.in/the-ministry/physical-progress
Ministry of Petroleum and Natural Gas. (n.d.-a). About PM Ujjwala Yojana. Government of India. https://pmuy.gov.in/about.html
Ministry of Petroleum and Natural Gas. (n.d.-b). Biofuels. Government of India. http://petroleum.nic.in/sites/default/files/biofuels.pdf
Ministry of Petroleum and Natural Gas. (2021). Annual report 2020-21. Government of India. https://mopng.gov.in/files/TableManagements/MoPNG-Annual-Report-combined.pdf
Ministry of Power. (2021a). Revamped distribution sector scheme: A reform based and results-linked scheme. Government of India. https://powermin.gov.in/sites/default/files/uploads/OM_Revamped_Distribution_Sector_Scheme.pdf

66
Mapping India's Energy Policy 2022
Ministry of Power. (2021b). Waiver of inter-state transmission charges on transmission of the electricity generated from solar and wind sources under Para 6.4(6) of the Tariff Policy, 2016. Government of India. https://img.saurenergy.com/2021/11/waiver_of_ists_charge_compressed.pdf
Ministry of Statistics and Programme Implementation. (2021). Energy statistics India—2022. Government of India. https://mospi.gov.in/documents/213904/1606151//Energy%20Statistics%20India%2020221644825594802.pdf/aed59aac-4d5a-995b-1232-bb68397cd873
Mishra, T. (2020, March 29). States can tap up to 30 per cent of remaining DMF funds to combat Covid-19. Business Line. https://www.thehindubusinessline.com/economy/states-can-tap-up-to-30-of-remaining-dmf-funds-to-combat-covid-19/article31197093.ece
Mishra, T. (2021, August 27). IndianOil to build India’s first green hydrogen plant at Mathura Refinery. Business Standard India. https://www.business-standard.com/article/companies/indianoil-to-build-india-s-first-green-hydrogen-plant-at-mathura-refinery-121082700730_1.html
Mishra, V., & Ghosh, S. (2020, July 8). Electricity sector needs revamp. Deccan Herald. https://www.deccanherald.com/opinion/panorama/electricity-sector-needs-revamp-858415.html
Mudgill, A. (2022, May 23). How will petrol & diesel excise cuts, LPG subsidy impact OMC stocks? Economic Times. https://economictimes.indiatimes.com/markets/stocks/news/how-will-petrol-diesel-excise-cuts-lpg-subsidy-impact-omc-stocks/articleshow/91735760.cms
Muttitt, G., Sharma, S., Mostafa, M., Kühne, K., Doukas, A., Gerasimchuk, I., & Roth, J. (2021). Step off the Gas: International public finance, natural gas and clean alternatives in the Global South. International Institute for Sustainable Development. https://www.iisd.org/publications/natural-gas-finance-clean-alternatives-global-south
Narain, S. (2021, November 2). India’s new climate targets: Bold, ambitious and a challenge for the world. https://www.downtoearth.org.in/blog/climate-change/india-s-new-climate-targets-bold-ambitious-and-a-challenge-for-the-world-80022
National Renewable Energy Laboratory. (n.d.). Life cycle greenhouse gas emissions from solar photovoltaics. https://www.nrel.gov/docs/fy13osti/56487.pdf
NTPC. (2021a). 45th Integrated annual report 2020-2021. https://www.ntpc.co.in/sites/default/files/downloads/Annual-Report-2020-21.pdf
NTPC. (2021b, November 15). NTPC in pact with Indian Oil for collaboration on renewable energy [Press release]. https://www.ntpc.co.in/en/media/press-releases/details/ntpc-pact-indian-oil-collaboration-renewable-energy
Organisation for Economic Co-operation and Development. (n.d.). OECD glossary of statistical terms—Externalities—OECD definition. https://stats.oecd.org/glossary/detail.asp?ID=3215
Organisation for Economic Co-operation and Development. (2001). OECD glossary of statistical terms—Taxes definition. https://stats.oecd.org/glossary/detail.asp?ID=2657

IISD.org/gsi 67
Organisation for Economic Co-operation and Development. (2020a). Revenue statistics 1965-2019: Interpretive guide. https://www.oecd.org/tax/tax-policy/oecd-classification-taxes-interpretative-guide.pdf
Organisation for Economic Co-operation and Development. (2020b). Revenue statistics 2021: The initial impact of COVID-19 on OECD tax revenues. https://www.oecd.org/tax/revenue-statistics-2522770x.htm
Oil Change International, & Friends of the Earth US. (2021). Past last call. http://priceofoil.org/content/uploads/2021/10/Past-Last-Call-G20-Public-Finance-Report.pdf
Oil and Natural Gas Corporation Limited. (2021). Annual reports 2020-21. https://www.ongcindia.com/wps/wcm/connect/en/investors/annual-reports/annual-reports21
Pai, S. (2021). Building bridges to a just transition: Connecting India’s challenges and solutions with international experience. International Institute for Sustainable Development. https://www.iisd.org/publications/building-bridges-just-transition-india
Parry, I., Black, S., & Vernon, N. (2021). Still not getting energy prices right: A global and country update of fossil fuel subsidies [Working paper no. 2021/236]. International Monetary Fund. https://www.imf.org/en/Publications/WP/Issues/2021/09/23/Still-Not-Getting-Energy-Prices-Right-A-Global-and-Country-Update-of-Fossil-Fuel-Subsidies-466004
Parry, I., Veung, C., & Heine, D. (2014). How much carbon pricing is in countries’ own interests? The critical role of co-benefits [Working paper no. 14/174]. International Monetary Fund. https://www.imf.org/external/pubs/ft/wp/2014/wp14174.pdf
Patnaik, S., & Mani, S. (2019). (Ujjwala 2.0 series) Realising the Ujjwala dream. Collaborative Clean Air Policy Centre. https://ccapc.org.in/policy-briefs/2019/8/4/ujjwala-2-series-patnaik-mani
Petroleum Planning & Analysis Cell. (2020). Monthly report on natural gas production, availability and consumption. https://www.ppac.gov.in/WriteReadData/Reports/202012300750444371885MonthlyGasReport-November2020_WEB.pdf
Petroleum Planning & Analysis Cell. (2021). Contribution to central and state exchequer. https://www.ppac.gov.in/content/149_1_PricesPetroleum.aspx
Power Finance Corporation Limited. (2019). 33rd annual report. https://www.pfcindia.com/DocumentRepository/ckfinder/files/Investors/Annual_Reports/PFC%20AR%202018-19%20final.pdf
Power Finance Corporation Limited. (2020). 34th annual report. https://www.pfcindia.com/DocumentRepository/ckfinder/files/Investors/Annual_Reports/PFC_AR2019_2024122020.pdf
Power Finance Corporation Limited. (2021). 35th annual report. https://www.pfcindia.com/DocumentRepository/ckfinder/files/Investors/Annual_Reports/PFC_AR_202021_English.pdf

68
Mapping India's Energy Policy 2022
Prasad, G. C., & Bhaskar, U. (2021). Steep import duty on solar cells, modules from Apr ’22. Livemint. https://www.livemint.com/news/india/india-to-impose-steep-customs-duty-on-solar-cells-modules-from-april-2022-11615387885538.html
Prayas Energy Group. (2021). Energy: Taxes and transition in India [Working paper]. https://www.prayaspune.org/peg/publications/item/485-energy-taxes-and-transition-in-india.html
Press Information Bureau. (2011, April 6). Creation of National Clean Energy Fund. https://pib.gov.in/newsite/PrintRelease.aspx?relid=71517
Press Information Bureau. (2020, July 1). Shri Dharmendra Pradhan says that improving availability of natural gas at an affordable cost across the country, providing level playing field among gas consumers, and ushering a gas based economy are the focus areas [Press release]. https://pib.gov.in/PressReleaseIframePage.aspx?PRID=1635717
Press Information Bureau. (2021a). Cabinet approves Production Linked Incentive scheme “National Programme on High Efficiency Solar PV Modules” [Press release]. www.pib.gov.in/Pressreleaseshare.aspx?PRID=1710113
Press Information Bureau. (2021b). Cabinet approves Production Linked Incentive scheme “National Programme on Advanced Chemistry Cell Battery Storage” [Press release]. https://pib.gov.in/PressReleasePage.aspx?PRID=1717938
Press Information Bureau. (2021c, June 15). Ethanol distillation capacities to double by 2025 and achieve 20 % blending target [Press release]. https://pib.gov.in/PressReleasePage.aspx?PRID=1727206#:~:text=Secretary%2C%20DFPD%20said%20that%20as,to%20achieve%2020%20%25%20blending%20target
Press Information Bureau. (2021d, August 5). Promotion of hydrogen as automotive fuel [Press release]. https://pib.gov.in/PressReleasePage.aspx?PRID=1742793
Press Information Bureau. (2021e, August 5). Steps to enhance domestic manufacturing of solar PV cells and modules [Press release]. https://pib.gov.in/PressReleasePage.aspx?PRID=1742795
Press Information Bureau. (2021f, August 10). Total 5,17,322 electric vehicles registered in the country over the last three years, 38 original Equipment Manufacturers (OEMs) of e-2W, e-3W & e- 4W registered under phase-II of FAME-India Scheme [Press release]. https://pib.gov.in/PressReleasePage.aspx?PRID=1744394
Press Information Bureau. (2021g, August 12). India achieves 100 GW Milestone of Installed Renewable Energy Capacity [Press release]. https://pib.gov.in/PressReleasePage.aspx?PRID=1745254#:~:text=The%20total%20installed%20renewable%20energy,in%20terms%20of%20installed%20capacity
Press Information Bureau. (2021h, August 15). The Prime Minister, Shri Narendra Modi addressed the nation from the ramparts of the Red Fort on the 75th Independence Day [Press release]. https://pib.gov.in/PressReleasePage.aspx?PRID=1746070
Press Information Bureau. (2021i, September 15). Government has approved Production Linked Incentive (PLI) Scheme for Auto Industry and Drone Industry to enhance India’s manufacturing capabilities [Press release]. https://www.pib.gov.in/PressReleasePage.aspx?PRID=1755062

IISD.org/gsi 69
Press Information Bureau. (2021j, October 5). Notification issued on incentives and disincentives pertaining to vehicle scrapping policy [Press release]. https://pib.gov.in/PressReleaseIframePage.aspx?PRID=1761200#:~:text=Notification%20issued%20on%20incentives%20and%20disincentives%20pertaining%20to%20Vehicle%20Scrapping%20Policy&text=In%20the%20Vehicle%20Scrapping%20Policy,maintenance%20and%20fuel%20consumption%20costs
Press Information Bureau. (2021k, October 7). NTPC in pact with Électricité de France S.A. for cooperation in international power sector [Press release]. https://pib.gov.in/PressReleasePage.aspx?PRID=1761711
Press Information Bureau. (2022). Cabinet approves Intra-State Transmission System – Green Energy Corridor Phase-II. [Press release]. https://pib.gov.in/PressReleaseIframePage.aspx?PRID=1788011
Press Trust of India. (2021a, July 4). NTPC, ONGC to boost development of offshore wind energy. The Economic Times. https://economictimes.indiatimes.com/industry/renewables/ntpc-ongc-to-boost-development-of-offshore-wind-energy/articleshow/84111106.cms
Press Trust of India. (2021b, September 23). Coal India arm NCL joins hands with NTPC to install solar power project in MP. The Economic Times. https://economictimes.indiatimes.com/industry/renewables/coal-india-arm-ncl-joins-hands-with-ntpc-to-install-solar-power-project-in-mp/articleshow/86453839.cms
Press Trust of India. (2021c, September 27). BPCL to invest Rs 1 lakh cr to become future-ready. The Economic Times. https://economictimes.indiatimes.com/industry/energy/oil-gas/bpcl-to-invest-rs-1-lakh-cr-to-become-future-ready/articleshow/86557891.cms?from=mdr
Press Trust of India. (2021d, October 3). NTPC chalks out Rs 15,000 crore divestment plan, to list arms NTPC REL, NEEPCO, NVVNL. The Economic Times. https://economictimes.indiatimes.com/industry/energy/power/ntpc-chalks-out-rs-15000-crore-divestment-plan-to-list-arms-ntpc-rel-neepco-nvvnl/articleshow/86724356.cms
Press Trust of India. (2021e, December 2). ONGC inks pact with SECI to develop renewable, ESG projects. ET Energy World. https://energy.economictimes.indiatimes.com/news/renewable/ongc-inks-pact-with-seci-to-develop-renewable-esg-projects/88055444
Press Trust of India. (2021f, December 31). Reliance buys British battery firm for GBP 100 mn. ET Energy World. https://energy.economictimes.indiatimes.com/news/power/reliance-buys-british-battery-firm-for-gbp-100-mn/88609196
Punjab National Bank. (2019). Pillar-3 disclosures under Basel III For 31 March 2019. https://www.pnbindia.in/financials-archives.html
Punjab National Bank. (2020). Pillar-3 disclosures under Basel III For 31 March 2020. https://www.pnbindia.in/financials-archives.html
Punjab National Bank. (2021). Pillar-3 disclosures under Basel III For 31 March 2021. https://www.pnbindia.in/financials-archives.html
Punjab and Sindh Bank. (2019). Basel-III disclosures—Quarter ended 31st March 2019. https://punjabandsindbank.co.in/system/uploads/document/1_2019061010251093361.pdf
70
Mapping India's Energy Policy 2022
Punjab and Sindh Bank. (2020). Basel-III disclosures—Quarter ended 31st March 2020. https://punjabandsindbank.co.in/system/uploads/document/2150_2020071510554950542.pdf
Punjab and Sindh Bank. (2021). Basel-III disclosures—Quarter ended 31st March 2021. https://punjabandsindbank.co.in/system/uploads/document/basel_disclosure_english.pdf
Rahman, A., Agrawal, S., & Jain, A. (2021). Powering agriculture in India: Strategies to Boost Components A and C Under PM-KUSUM Scheme. Council on Energy, Environment and Water, Shakti Sustainable Energy Foundation. https://www.ceew.in/sites/default/files/ceew-study-on-pm-kusum-scheme-for-solar-based-power-plants-and-grid-pumps-india.pdf
Ranjan, R. (2021, November 12). Jindal, Shirdi Sai, and Reliance Win IREDA’s solar module manufacturing PLI auction. Mercom India. https://mercomindia.com/jindal-shirdi-sai-reliance-win-iredas-module-pli-auction/
REC Limited. (2021). Investor presentation—performance highlights Q1 FY22. https://www.recindia.nic.in/financial-presentations
Reliance New Energy Solar Limited. (2021, October 10). Reliance New Energy Solar Ltd- acquires REC Solar Holdings, one of the world’s leading solar cell/panels and polysilicon manufacturing company. https://www.ril.com/getattachment/0c9c77e4-63fd-4931-92d8-d3bca3c7cf0f/Reliance-New-Energy-Solar-Ltd-Acquires-Rec-Solar-H.aspx
Reserve Bank of India. (n.d.-a). List of scheduled commercial banks. https://m.rbi.org.in/scripts/bs_viewcontent.aspx?Id=3657
Reserve Bank of India. (n.d.-b). Master directions – priority sector lending (PSL) – targets and classification. https://www.rbi.org.in/Scripts/BS_ViewMasDirections.aspx?id=11959
Reserve Bank of India. (2021). Statement of commitment to support greening India’s financial system. https://rbidocs.rbi.org.in/rdocs/content/pdfs/NGFS03112021_EN.pdf
Reuters. (2021a, August 14). India’s top explorer ONGC looks at acquisitions for 10GW renewable aim. https://www.reuters.com/business/energy/indias-top-explorer-ongc-looks-acquisitions-10gw-renewable-aim-2021-08-14/
Reuters. (2021b, November 3). India’s top refiner plans thousands of electric car charging stations. ET Energy World. https://energy.economictimes.indiatimes.com/news/oil-and-gas/indias-top-refiner-plans-thousands-of-electric-car-charging-stations/87510701
Ricke, K., Drouet, L., Caldeira, K., & Tavoni, M. (2018). Country-level social cost of carbon. Nature Climate Change, 8(10), 895–900. https://doi.org/10.1038/s41558-018-0282-y
Rocky Mountain Institute India. (2022). Banking on electric vehicles in India: A blueprint for inclusion of EVs in priority sector lending guidelines. https://www.niti.gov.in/sites/default/files/2022-01/Banking-on-EV_web_2.0a.pdf
Roy, D., Nanda, P., & Choudhary, A. (2021, July 27). Green bonds: India’s best bet against climate change. Business Today. https://www.businesstoday.in/opinion/columns/story/green-bonds-indias-best-bet-against-climate-change-302498-2021-07-27
IISD.org/gsi 71
Saboo, A., & Srivastava, S. (2022). Renewable energy financing landscape in India: The journey so far and the need of the hour. http://ieefa.org/wp-content/uploads/2022/01/Renewable-Energy-Financing-Landscape-in-India_February-2022.pdf
Samadi, S. (2017). The social costs of electricity generation—Categorising different types of costs and evaluating their respective relevance. Energies, 10(3), 356. https://doi.org/10.3390/en10030356
Sanjal, P. (2021, October 4). Adani says total green investments to top $50 Billion by 2030. Bloomberg. https://www.bloomberg.com/news/articles/2021-10-04/adani-says-total-green-investments-to-top-50-billion-by-2030
Sarwal, R., Varadan, A., Ramakumar, S. S. V., Kumar, S., Mehta, A., Kumar Singh, S., & Mathai, R. (2021). Road map for ethanol blending in India 2020-25. NITI Aayog, Ministry of Petroleum and Natural Gas.
Sengupta, D. (2017, February 15). Clean energy cess collections rise, but spending low. The Economic Times. https://economictimes.indiatimes.com/industry/energy/power/clean-energy-cess-collections-rise-but-spending-low/articleshow/57163542.cms
Shah, K. (2021). Overestimated financial viability of India’s coal-fired power plants LCOE for India’s coal power project pipeline needs to be revised. Institute for Energy Economics & Financial Analysis. https://ieefa.org/wp-content/uploads/2021/07/Overestimated-Viability-of-Indias-Coalfired-Plants_July-2021.pdf
Shalya, C. (2020). DMF: Implementation status and emerging best practices. https://www.cseindia.org/dmf-implementation-status-and-emerging-best-practices-10057
Sharma, S., Bellmann, C., Beaton, C., & Pant, A. (2021, December 20). Supporting marine fishing sustainably: A review of central and state government support for marine fisheries in India. International Institute for Sustainable Development. https://www.iisd.org/publications/supporting-marine-fisheries-india
Sharma, S., Moerenhout, T., Aklin, M., & Bajaj, K. (2021). How to target LPG subsidies in India: Step 2. Evaluating policy options in Jharkhand. International Institute for Sustainable Development. https://www.iisd.org/publications/target-lpg-subsidies-india-jharkhand
Sharma, S., Singh, C., Beaton, C., Sharma, A., Merrill, L., Laan, T., Zinecker, A., & Kitson, L. (2019). Gender and fossil fuel subsidy reform in India: Findings and recommendations. International Institute for Sustainable Development. https://www.iisd.org/library/gender-fossil-fuel-subsidy-reform-india
Shrimali, G. (2020). Getting to India’s electric vehicle targets cost-effectively: To subsidize or not, and how? Social Science Research Network. https://doi.org/10.2139/ssrn.3618028
Shukla, H. (2021a). Adani Green Energy raises $750 million through green bond issuance. Mercom India. https://mercomindia.com/adani-green-raises-million-green-bond/
Shukla, A. (2021b). Central PSUs set to miss FY21 capex target. The New Indian Express. https://www.newindianexpress.com/business/2021/feb/24/central-psus-set-to-miss-fy21-capex-target-2268231.html

72
Mapping India's Energy Policy 2022
Singh, K. (2022a, January 24). Bureaucracies for the better. Issues in Science and Technology, 38(2). https://issues.org/india-energy-ministries-bureaucracy-singh/
Singh, R. K., & Lacqua, F. (2021, November 3). India sees carbon emissions peaking in 2040-45. BloombergQuint. https://www.bloombergquint.com/business/india-sees-carbon-emissions-peaking-in-2040-45
Singh, S. (2022b, January 3). What is average salary in India? (2022). MoneyMint. https://moneymint.com/what-is-average-salary-in-india/
Singh, V. P., Chawla, K., & Jain, S. (2020). Financing India’s transition to electric vehicles. https://cef.ceew.in/solutions-factory/publications/CEEW-CEF-financing-india-transition-to-electric-vehicles.pdf
Singh, V. P., & Sharma, N. (2021). Mapping costs for early coal decommissioning in India. Council on Energy, Environment and Water. https://cef.ceew.in/solutions-factory/publications/CEEW-CEF-mapping-costs-for-early-coal-decommissioning-in-india.pdf
Singh, V. P., & Sidhu, G. (2021). Investment sizing India’s 2070 net-zero target. https://cef.ceew.in/solutions-factory/publications/CEEW-CEF-Investment-Sizing-India%E2%80%99s-2070-Net-Zero-Target.pdf
Solar Bay. (2020, October 15). Understanding the ownership cost of solar power. https://solarbay.com.au/portfolio-item/understanding-the-ownership-cost-of-solar-power/
Soman et al. (2019). India’s energy transition: The impact of the goods and services tax on solar photovoltaic and coal power costs. International Institute for Sustainable Development, Council on Energy, Environment and Water. https://www.iisd.org/library/indias-energy-transition-goods-services-tax-coal-solar
Sreedhar Ramamurthy, & Singh, A. K. (2019). Banking on India’s coal conundrum. Fair Finance India. https://fairfinanceindia.org/media/495382/coa-mining-report_141119_final.pdf
Standing Committee on Energy. (2022). Financial constraints in renewable energy sector. Lok Sabha Secretariat. http://164.100.47.193/lsscommittee/Energy/17_Energy_21.pdf
Standing Committee on Energy (2017-18). (2018). Impact of RBI’s revised framework for resolution of stressed assets on NPAs in the electricity sector (No. 40). 16th Lok Sabha. http://164.100.47.193/lsscommittee/Energy/16_Energy_40.pdf
State Bank of India. (2019). Pillar III disclosures (consolidated) as on 31 March 2019. State Bank of India. https://sbi.co.in/web/investor-relations/disclosure
State Bank of India. (2020). Pillar III Disclosures (consolidated) as on 31 March 2020. State Bank of India. https://sbi.co.in/web/investor-relations/disclosure
State Bank of India. (2021a). Pillar III disclosures (consolidated) as on 31 March 2021. State Bank of India. https://sbi.co.in/web/investor-relations/disclosure
State Bank of India. (2021b). Sustainability report 2020-21. https://sbi.co.in/documents/17826/24401/140621-Sustainability+Report%28SR%29+year+2020-21.pdf/ba271367-9542-e96a-0589-2968954b2e17?t=1623659643326
IISD.org/gsi 73
Tongia, R. (2021, October 20). The inside story of India’s coal and power crises. Hindustan Times. https://www.hindustantimes.com/opinion/the-inside-story-of-india-s-coal-and-power-crises-101634109277881.html
Total Energies. (2020, June 2). India: Total expands its partnership with Adani to renewables and acquires 50% of a 2 GW solar portfolio [Press release]. https://totalenergies.com/media/news/press-releases/india-total-expands-its-partnership-adani-renewables-and-acquires-50-2-gw-solar-portfolio
Trivedi, S. (2021, August 19). Green bonds are driving cost-effective finance to clean energy in India. Institute for Energy Economics & Financial Analysis. http://ieefa.org/ieefa-green-bonds-are-driving-cost-effective-finance-to-clean-energy-in-india/
UCO Bank. (2019). Basel III Pillar III disclosure as on 31.03.2019. https://www.ucobank.com/english/quarterly-results.aspx
UCO Bank. (2020). Basel III Pillar III disclosure as on 31.03.2020. https://www.ucobank.com/english/quarterly-results.aspx
UCO Bank. (2021). Basel III Pillar III disclosure as on 31.03.2021. https://www.ucobank.com/english/quarterly-results.aspx
Ueckerdt, F., Hirth, L., Luderer, G., & Edenhofer, O. (2013). System LCOE: What are the costs of variable renewables? Energy, 63, 61–75. https://doi.org/10.1016/j.energy.2013.10.072
Union Bank of India. (2019). Basel III Pillar-3 disclosures for March 2019. https://www.unionbankofindia.co.in/english/basel-disclosures-iii.aspx
Union Bank of India. (2020). Basel III Pillar-3 disclosures for March 2020. https://www.unionbankofindia.co.in/english/basel-disclosures-iii.aspx
Union Bank of India. (2021). Basel III Pillar-3 disclosures for March 2021. https://www.unionbankofindia.co.in/english/basel-disclosures-iii.aspx
United Nations Framework Convention on Climate Change. (2021a). 26th United Nations Climate Change Conference of the Parties. Statement on international public support for the clean energy transition. https://ukcop26.org/statement-on-international-public-support-for-the-clean-energy-transition/
United Nations Framework Convention on Climate Change. (2021b). Glasgow climate pact. https://unfccc.int/documents/310475
Upadhyay, A., Dey, S., Chowdhury, S., & Goyal, P. (2018). Expected health benefits from mitigation of emissions from major anthropogenic PM2.5 sources in India: Statistics at state level. Environmental Pollution, 242, 1817–1826. https://doi.org/10.1016/j.envpol.2018.07.085
van Lerven, F. (2020). Banking on coal: How central banks can address the financial risks and support a capital shift away from coal. New Economic Foundation. https://neweconomics.org/uploads/files/BankingOnCoal_200204_180818.pdf
74
Mapping India's Energy Policy 2022
Viscusi, W. K., & Masterman, C. J. (2017). Income elasticities and global values of a statistical life. Journal of Benefit-Cost Analysis, 8(2), 226–250. https://doi.org/10.1017/bca.2017.12
Viswanathan, B., & Aggarwal, P. (2021, September 28). Why aren’t energy PSUs at the forefront of India’s energy transition? The Economic Times. https://economictimes.indiatimes.com/industry/renewables/why-arent-energy-psus-at-the-forefront-of-indias-energy-transition/articleshow/86579372.cms
Viswanathan, B., Viswamohanan, A., Aggarwal, P., Naraswamayany, D., Geddes, A., Sumarno, T. B., Schmidt, M., Beaton, C., Goel, S., Dutt, A., & Ganesan, K. (2021). Mapping India’s energy subsidies 2021: Time for renewed support to clean energy. International Institute for Sustainable Development. https://www.iisd.org/system/files/2021-07/mapping-india-energy-subsidies-2021.pdf
Vivid Economics. (2016). Energy system externalities in South Africa: Report prepared for the Department of Energy and Shell. http://www.energy.gov.za/files/IEP/2016/IEP-AnnexureC1-Energy-Systems-Externalities-in-SA.pdf
Wooders, P., Steenblik, R., & Zinecker, A. (2019). Measuring fossil fuel subsidies in the context of the Sustainable Development Goals. International Institute for Sustainable Development. https://www.iisd.org/publications/report/measuring-fossil-fuel-subsidies-context-sustainable-development-goals
World Bank. (n.d.). Revenue, excluding grants (% of GDP)—India. https://data.worldbank.org/indicator/GC.REV.XGRT.GD.ZS?locations=IN
World Trade Organization. (1994). Agreement on subsidies and countervailing measures. https://www.wto.org/english/docs_e/legal_e/24-scm.pdf
XV Finance Commission. (2020). Finance commission in COVID times: Report for 2021-26. https://fincomindia.nic.in/WriteReadData/html_en_files/fincom15/Reports/XVFC%20VOL%20I%20Main%20Report.pdf
Zhang, T., & Burke, P. J. (2020). The effect of fuel prices on traffic flows: Evidence from New South Wales. Transportation Research Part A: Policy and Practice, 141, 502–522. https://doi.org/10.1016/j.tra.2020.09.025

IISD.org/gsi 75
Appendix A. Subsidy Methods and CalculationsThis report’s approach to subsidy identification and quantification follows the methodology described in Garg et al. (2020)—readers are invited to refer to that publication for full details. Only a few key changes have taken place since our methodology was established. Our definition of subsidy continues to be based on Article 1 of the Agreement on Subsidies and Countervailing Measures of the WTO, (1994), given its comprehensiveness and widespread agreement (all WTO members). In addition to classifying subsidies by key WTO subsidy categories, beneficiaries and simulated activities, the data spreadsheets [link] underlying this study now also classify subsidies according to the formal guidelines for measuring fossil fuel subsidies under SDG indicator 12.c.1, to help facilitate reporting (Wooders et al., 2019).
Wherever possible, our subsidy estimates are drawn from official government sources, such as documentation pertaining to the process of budget drafting and execution, performance monitoring, reports of state-owned companies, annual reports, and tariff orders of electricity DISCOMs. In cases where it is not possible to identify an official estimate, various methods are used to quantify subsidies independently, as outlined in Garg et al., (2020). Since our last review, by Viswanathan et al. (2021), a limited number of changes have taken place to the database and quantification, as listed below.
New Subsidies—Added Retrospectively
• RE.16 Bio Power has been added as a sub-component of “Biogas Power (off-grid) Programme for decentralized power generation applications and thermal application.” For details on new subsidy schemes, see Appendix B.
Subsidies Methodology Revised—Retrospectively
• Starting from our current review, instead of relying on industry consultations for obtaining benchmark rates of solar modules, we have shifted to JMK Research and Analytics’ periodic India RE update (JMK Research & Analytics, 2021). The benchmark costs have been revised retrospectively from FY 2019 to FY 2021 and result in a revision of estimates for the following subsidies:
° RE.20 Accelerated Depreciation (Solar Component).
° RE.25 Lower GST and Custom Duty Solar.
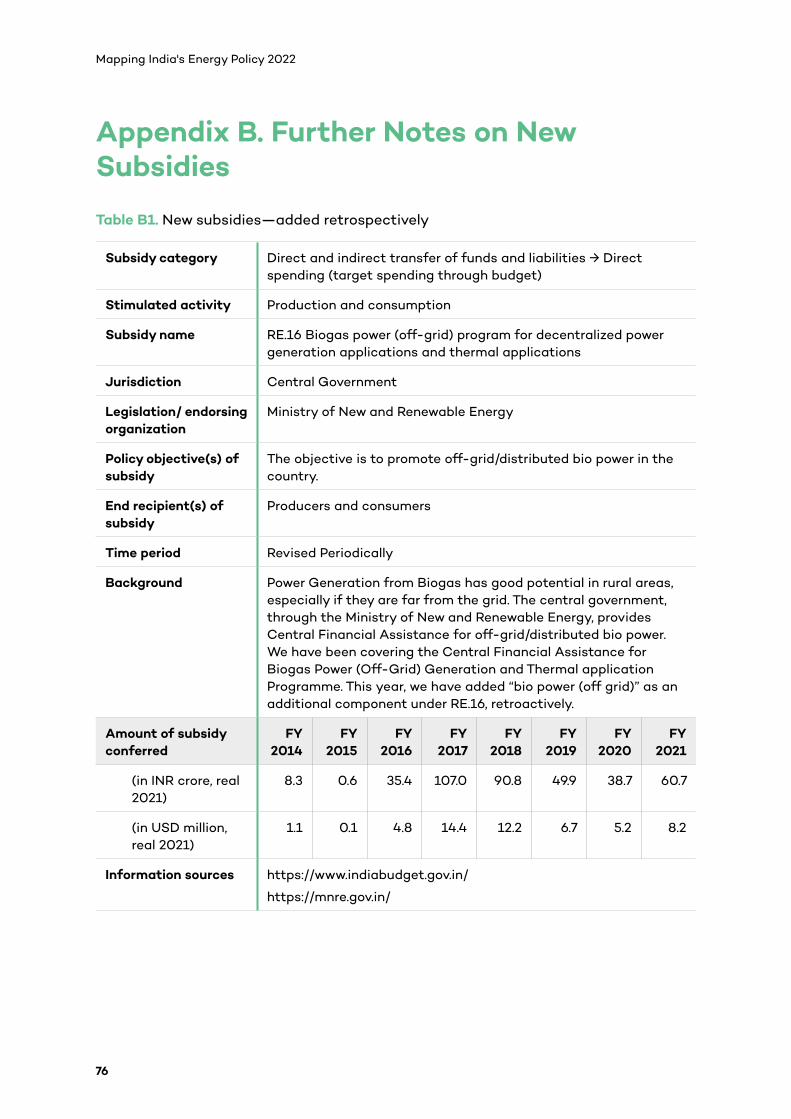
76
Mapping India's Energy Policy 2022
Appendix B. Further Notes on New Subsidies
Table B1. New subsidies—added retrospectively
Subsidy category Direct and indirect transfer of funds and liabilities → Direct spending (target spending through budget)
Stimulated activity Production and consumption
Subsidy name RE.16 Biogas power (off-grid) program for decentralized power generation applications and thermal applications
Jurisdiction Central Government
Legislation/ endorsing organization
Ministry of New and Renewable Energy
Policy objective(s) of subsidy
The objective is to promote off-grid/distributed bio power in the country.
End recipient(s) of subsidy
Producers and consumers
Time period Revised Periodically
Background Power Generation from Biogas has good potential in rural areas, especially if they are far from the grid. The central government, through the Ministry of New and Renewable Energy, provides Central Financial Assistance for off-grid/distributed bio power. We have been covering the Central Financial Assistance for Biogas Power (Off-Grid) Generation and Thermal application Programme. This year, we have added “bio power (off grid)” as an additional component under RE.16, retroactively.
Amount of subsidy conferred
FY 2014
FY 2015
FY 2016
FY 2017
FY 2018
FY 2019
FY 2020
FY 2021
(in INR crore, real 2021)
8.3 0.6 35.4 107.0 90.8 49.9 38.7 60.7
(in USD million, real 2021)
1.1 0.1 4.8 14.4 12.2 6.7 5.2 8.2
Information sources https://www.indiabudget.gov.in/
https://mnre.gov.in/

IISD.org/gsi 77
Appendix C. List of Public Finance Institutions
Table C1. List of public finance institutions
S.No. Name of financial institution Category
1. Bank of Baroda Public sector bank
2. Bank of India Public sector bank
3. Bank of Maharashtra Public sector bank
4. Canara Bank Public sector bank
5. Central Bank of India Public sector bank
6. Indian Bank Public sector bank
7. Indian Overseas Bank Public sector bank
8. Punjab National Bank Public sector bank
9. Punjab & Sindh Bank Public sector bank
10. State Bank of India Public sector bank
11. UCO Bank Public sector bank
12. Union Bank of India Public sector bank
13. Indian Renewable Energy Development Agency Limited
Non-banking financial company
14. Power Finance Corporation Non-banking financial company
15. REC Limited Non-banking financial company
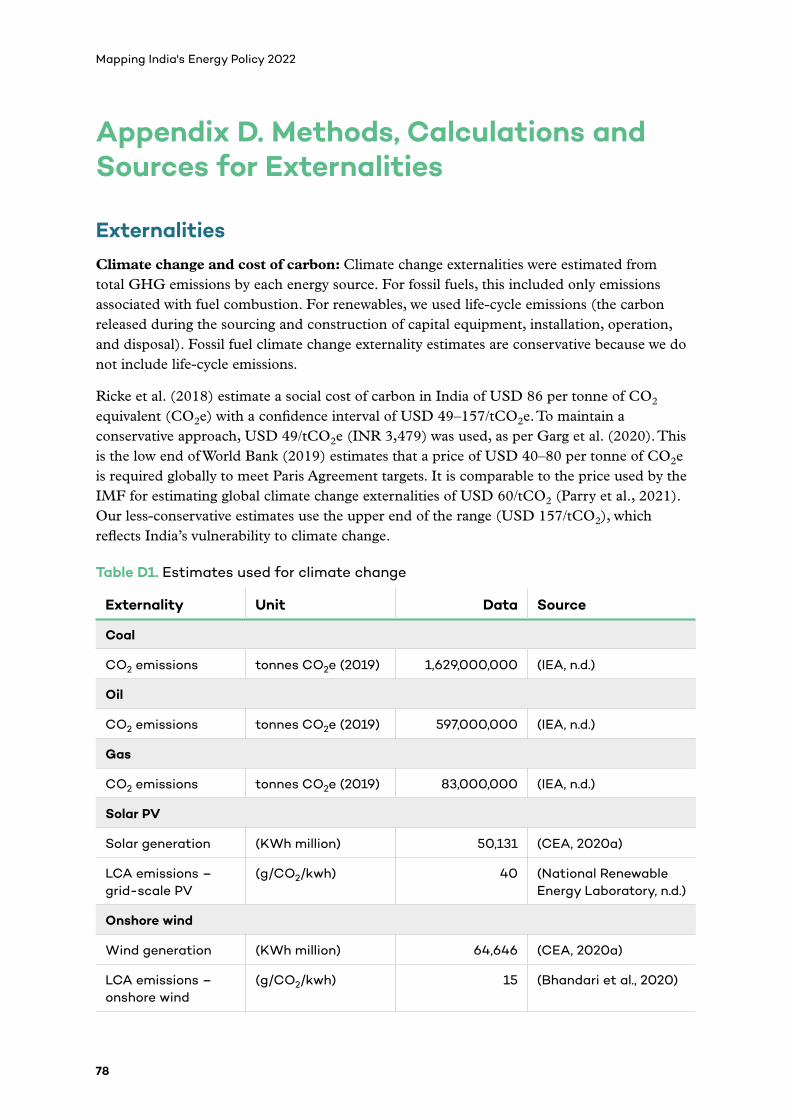
78
Mapping India's Energy Policy 2022
Appendix D. Methods, Calculations and Sources for Externalities
ExternalitiesClimate change and cost of carbon: Climate change externalities were estimated from total GHG emissions by each energy source. For fossil fuels, this included only emissions associated with fuel combustion. For renewables, we used life-cycle emissions (the carbon released during the sourcing and construction of capital equipment, installation, operation, and disposal). Fossil fuel climate change externality estimates are conservative because we do not include life-cycle emissions.
Ricke et al. (2018) estimate a social cost of carbon in India of USD 86 per tonne of CO2 equivalent (CO2e) with a confidence interval of USD 49–157/tCO2e. To maintain a conservative approach, USD 49/tCO2e (INR 3,479) was used, as per Garg et al. (2020). This is the low end of World Bank (2019) estimates that a price of USD 40–80 per tonne of CO2e is required globally to meet Paris Agreement targets. It is comparable to the price used by the IMF for estimating global climate change externalities of USD 60/tCO2 (Parry et al., 2021). Our less-conservative estimates use the upper end of the range (USD 157/tCO2), which reflects India’s vulnerability to climate change.
Table D1. Estimates used for climate change
Externality Unit Data Source
Coal
CO2 emissions tonnes CO2e (2019) 1,629,000,000 (IEA, n.d.)
Oil
CO2 emissions tonnes CO2e (2019) 597,000,000 (IEA, n.d.)
Gas
CO2 emissions tonnes CO2e (2019) 83,000,000 (IEA, n.d.)
Solar PV
Solar generation (KWh million) 50,131 (CEA, 2020a)
LCA emissions – grid-scale PV
(g/CO2/kwh) 40 (National Renewable Energy Laboratory, n.d.)
Onshore wind
Wind generation (KWh million) 64,646 (CEA, 2020a)
LCA emissions – onshore wind
(g/CO2/kwh) 15 (Bhandari et al., 2020)

IISD.org/gsi 79
Externality Unit Data Source
Cost of carbon
Carbon price (conservative)
USD/tCO2e 49 (Ricke et al., 2018)
Carbon price (less-conservative)
USD/tCO2e 157 (Ricke et al., 2018)
Morbidity from air pollution and working days lost (WDL): Morbidity due to air pollution was measured only in WDL, given the difficulty of estimating medical expenses and losses in productivity arising from illness. The number of WDL for coal and transport fuels was estimated from total WDL from all ambient air pollution in India of 1.3 billion in 2020 (Clean Air Fund et al., 2021). The share for coal-fired power was 9% (Cropper et al., 2021) and the share for transport fuel combustion was 15% (Upadhyay et al., 2018).
We used a conservative value for WDL of INR 321 (USD 4.69), being the minimum wage for an unskilled agricultural worker (Ministry of Labour and Employment, 2018), as per Gunatilake et al. (2014) and Garg et al. (2020). The less-conservative estimate uses the median average wage of INR 800 per day (Singh, 2022b).
Table D2. Estimates used for morbidity from air pollution
Externality Unit Data Source
Coal
WDL # days 117,000,000 (Clean Air Fund et al., 2021)
Oil
WDL # days 195,000,000 (Clean Air Fund et al., 2021)
Value of WDL
Value of WDL (conservative)
INR 321 Ministry of Labour and Employment, 2018)
Value of WDL (less-conservative)
INR 800 (S. Singh, 2022)
Value of a statistical life (VSL): VSL refers to the amount individuals are willing to pay (WTP) to reduce the risk of death (Kniesner & Viscusi, 2019). It does not attempt to assign a monetary value to a human life, which would be unethical, as well as impossible to quantify. There are different methodologies for estimating a VSL. In developed countries, the WTP method is the preferred method for road accident cost estimation (Kumaresh et al., 2021). WTP studies (surveys of individuals) gather data that is aggregated to provide a value that a group of individuals are willing to pay to save one statistical life.

80
Mapping India's Energy Policy 2022
The VSL used in our estimates is a midpoint value from the literature of USD 150,000 (INR 11,115,750). This was the VSL determined by (Bhattacharya et al., 2007) based on WTP studies in India and is very similar to the VSL generated for India by the International Road Assessment Programme (2021) “Rule of Thumb method,” which indicates that VSL is GDP per capita multiplied by 70 (Kumaresh et al., 2021).
A VSL of USD 150,000 is significantly higher than the VSL used to estimate coal externalities for coal in Garg et al. (2020) of USD 33,060 (INR 2,449,911), which was based on the average life insurance value for India (Guttikunda & Jawaharm, 2014). While this low value has the benefit of being strongly conservative, we consider it underestimates VSL and is not consistent with other estimates for India, which range from USD 150,000 (Bhattacharya et al., 2007; Kumaresh et al., 2021) to USD 275,000 (Viscusi & Masterman, 2017).
Table D3. Estimates used for mortality from air pollution and value of a statistical life
Externality Unit Data Source
Coal
Deaths (conservative)
# deaths 132,500 (Guttikunda & Jawahar, 2018)
Deaths (less-conservative)
# deaths 153,000 (Guttikunda & Jawahar, 2018)
Oil
Deaths # deaths 74,000 (The International Council on Clean Transportation, 2019)
VSL (conservative) USD 150,000 (Bhattacharya et al., 2007) updated to 2018 in (S. Chakravarty & Somanathan, 2021)
VSL (less-conservative)
USD 275,000 (Viscusi & Masterman, 2017)
Traffic accidents, congestion, and road damage: Estimating congestion and accident costs is challenging. Congestion requires knowledge of the marginal cost of driving: the impact of one more vehicle to the road. For road accidents, part of the cost is considered internal to drivers (such as own-driver injuries in single vehicle accidents) and others are external (such as injuries to pedestrians or cyclists, property and medical costs borne by third parties). For these reasons, we use the IMF’s estimates for India from Parry et al. (2021). We also use IMF estimate for road damage, which are based on highway maintenance expenditures. See Parry et al. (2014) for a detailed description of methodology.
Grid integration costs: Renewable energy has external costs created by variability in production (Vivid Economics, 2016). This variability causes challenges for the grid operator, including the need for short-term balancing and maintaining additional capacity for when renewables are not producing (profile costs). The presence of these external costs without an
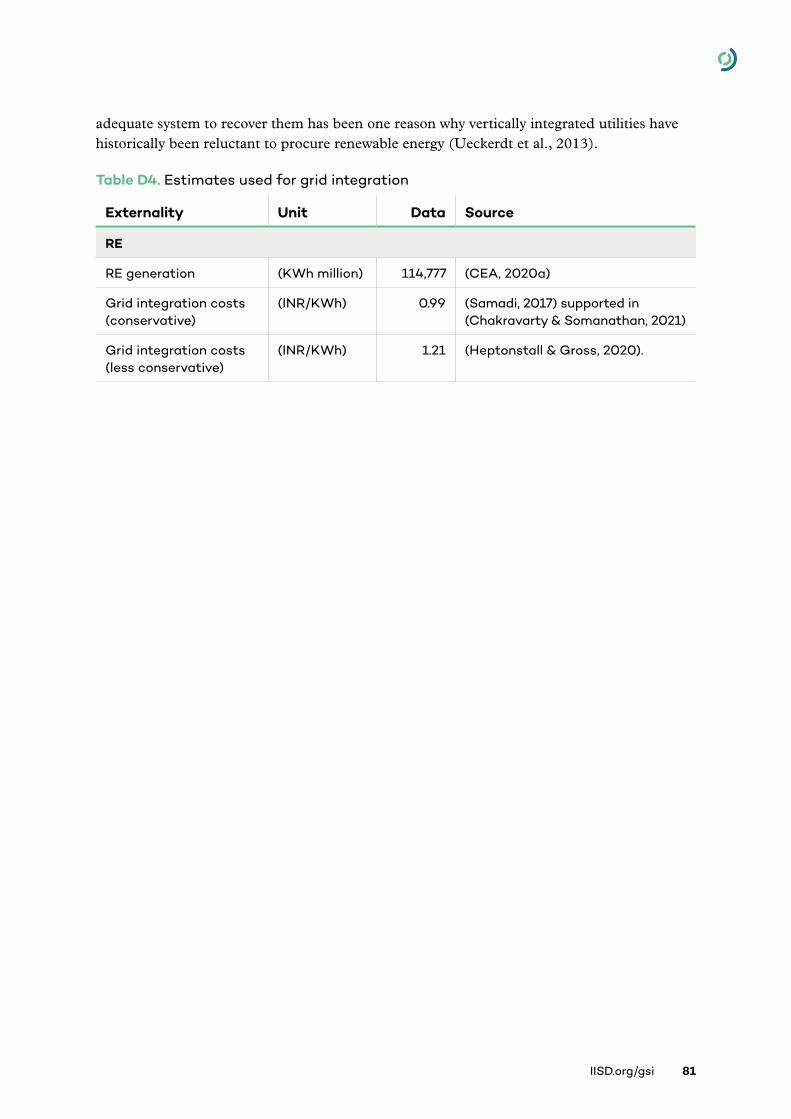
IISD.org/gsi 81
adequate system to recover them has been one reason why vertically integrated utilities have historically been reluctant to procure renewable energy (Ueckerdt et al., 2013).
Table D4. Estimates used for grid integration
Externality Unit Data Source
RE
RE generation (KWh million) 114,777 (CEA, 2020a)
Grid integration costs (conservative)
(INR/KWh) 0.99 (Samadi, 2017) supported in (Chakravarty & Somanathan, 2021)
Grid integration costs (less conservative)
(INR/KWh) 1.21 (Heptonstall & Gross, 2020).

82
Mapping India's Energy Policy 2022


