Embed Size (px)
Citation preview
IFPRI Discussion Paper 00863
May 2009
The Short-Run Macroeconomic Impact of Foreign Aid to Small States
An Agnostic Time Series Analysis
Henrik Hansen
Derek Headey
Development Strategy and Governance Division
INTERNATIONAL FOOD POLICY RESEARCH INSTITUTE
The International Food Policy Research Institute (IFPRI) was established in 1975. IFPRI is one of 15 agricultural research centers that receive principal funding from governments, private foundations, and international and regional organizations, most of which are members of the Consultative Group on International Agricultural Research (CGIAR).
FINANCIAL CONTRIBUTORS AND PARTNERS
IFPRI’s research, capacity strengthening, and communications work is made possible by its financial contributors and partners. IFPRI receives its principal funding from governments, private foundations, and international and regional organizations, most of which are members of the Consultative Group on International Agricultural Research (CGIAR). IFPRI gratefully acknowledges the generous unrestricted funding from Australia, Canada, China, Finland, France, Germany, India, Ireland, Italy, Japan, Netherlands, Norway, South Africa, Sweden, Switzerland, United Kingdom, United States, and World Bank.
AUTHORS
Henrik Hansen, University of Copenhagen Institute of Food and Resource Economics Email: [email protected] Derek Headey, International Food Policy Research Institute Postdoctoral Fellow, Development Strategy and Governance Division Email: [email protected]
Notices 1 Effective January 2007, the Discussion Paper series within each division and the Director General’s Office of IFPRI were merged into one IFPRI–wide Discussion Paper series. The new series begins with number 00689, reflecting the prior publication of 688 discussion papers within the dispersed series. The earlier series are available on IFPRI’s website at www.ifpri.org/pubs/otherpubs.htm#dp. 2 IFPRI Discussion Papers contain preliminary material and research results, and have been peer reviewed by at least two reviewers—internal and/or external. They are circulated in order to stimulate discussion and critical comment.
Copyright 2009 International Food Policy Research Institute. All rights reserved. Sections of this document may be reproduced for noncommercial and not-for-profit purposes without the express written permission of, but with acknowledgment to, the International Food Policy Research Institute. For permission to republish, contact [email protected].
iii
Contents
Abstract V
1. Introduction 1
2. A Simple Accounting Framework for Aid Flows 3
3. A Simple Econometric Model of Absorption, Spending and Production 7
4. The Data 11
5. Empirical Results 15
6. Conclusion 17
References 19
iv
List of Tables
1. The sample of small developing countries 11
2. Summary statistics for the sample of small developing countries, 1972-2003 11
3. Means and standard deviations for the variables in the VAR models, 1972-2003 12
4. Dynamic responses to an aid shock: Average aid flow, absorption, spending, and production for
the 13 aid-dependent countries 15
5. Dynamic responses to an aid shock: Average aid flow, absorption, spending, and production for the seven non-aid-dependent countries 16
List of Figures
1. Changes in aid, net imports and domestic demand (% GDP in 1973) in 13 aid-dependent SDCs 13
2. Changes in aid, net imports and domestic demand (% GDP in 1973) in seven non-aid-dependent SDCs 14
v
ABSTRACT
We herein investigate the short-run macroeconomic impact of aid in small developing countries (SDCs) by using a vector auto regression (VAR) model to study the impact of aid on net import (absorption) and domestic demand (spending). We focus on average country effects within two country sub-groups, and find substantial differences between ‘aid-dependent’ SDCs and other SDCs that are more dependent on natural resources, tourism or financial services. In aid-dependent SDCs, aid absorption more or less equals spending, although only half of the aid flow is absorbed and spent. In the non-aid-dependent group, aid does not seem to be absorbed or spent in any systematic fashion.
Keywords: foreign aid, small states, vector auto regression, mean group estimator, macroeconomic impacts

1
1. INTRODUCTION
Although many aspects of small developing countries (SDCs) have been widely researched in the development literature, especially their structural differences compared to larger developing countries,1 relatively little is known about the effectiveness of aid in SDCs.2 This is surprising given that one of the most distinctive features of SDCs is their high degree of dependence on foreign aid. On average, small states tend to receive two to three times as much aid (relative to GDP) as large states, raising real concerns about the implications for both long-run institutional development and short-run macroeconomic management. A key objective of the present study is to expand our knowledge of this second area of concern, namely the impact of aid to SDCs on short-run macroeconomic management.
Aid can be highly fungible, and donors wish to know that their money is really being spent. However, donors and recipients alike also want to be sure that large aid inflows do not indirectly cause macroeconomic problems that could limit the overall impact of foreign aid on growth and development. Of special concern in small open economies (i.e. those that depend heavily on the ability of strong export sectors to generate enough exchange to satisfy import demand) is the possibility that aid flows denominated in foreign currencies may raise either nominal exchange rates or the prices of other critical resources that are in limited domestic supply (e.g. skilled workers or coastal land). These effects, known as Dutch Disease, are often considered one of the main reasons for the apparent ineffectiveness of aid.3 The textbook method for avoiding Dutch Disease is to ‘absorb’ aid inflows through increased imports. An alternative solution (although one that may be less attractive to donors) is for aid recipients to delay absorption and aid spending by bolstering their foreign exchange reserves.
With our focus on the short-run macroeconomic impacts of aid, the present study is related to several recent studies evaluating foreign aid through a variety of empirical approaches and techniques. For example, the fiscal response literature uses theoretically-motivated models to simulate the effect of aid on government expenditure, tax revenue and other policies, given the utility preferences of policymakers (see, for example, McGillivray and Morrissey, 2004). Other studies examine the volatility of aid flows, and consider implications for the appropriate utilization of aid by recipients (Pallage and Robe, 2001; Bulíř and Hamann, 2003, 2008). Other recent reports use overtly historical analyses that combine narrative and empirical elements from small sets of countries to examine the absorption and spending decisions of aid recipients, where absorption is defined as increases in the current account deficit (net of aid), and spending as increases in the government fiscal deficit net of aid (IMF 2005; Aiyar et al. 2006; Berg et al. 2007; Foster and Killick 2006; Killick and Foster 2007).4 Although this research is still in its infancy, it offers some interesting insights into how recipients might respond to a significant up-scaling of aid, as mandated by the Gleneagles summit of 2004. At the time of this report, only one study, that of Aiyar and Ruthbah (2008), provides an econometric analysis of absorption and spending in a cross-section of countries. The findings of Aiyar and Ruthbah generally support the case studies in Berg et al. (2007) and Foster and Killick (2006), in that these authors consistently find quite low spending ratios and even smaller absorption ratios.
Our approach is methodologically similar to recent studies using more atheoretical or agnostic approaches to gauge the effects of aid on the macroeconomy. These studies use vector autoregressive
1 A number of recent papers have systematically tested for differences between small and large states. See, among others,
Streeten (1993), Bertram (1993), Milner and Westaway (1993), Briguglio (1995), Armstrong et al. (1998), Easterly and Kraay (2000), Armstrong and Read (2002), and Kose and Prasad (2002).
2 In particular, there are very few cross-country studies, especially of the econometric kind, on aid effectiveness in SDCs. See Feeny (2007) for a recent example. However, country studies have been reported in numbers too large to allow them to be adequately referenced herein.
3 See Adam (2006) for a survey and discussion of Dutch Disease effects of aid flows. 4 The studies by IMF (2005), Aiyar et al. (2006) and Berg et al. (2007) are closely related and (more or less) written by the
same group of authors. Although IMF (2005) was the first, we hereinafter refer to Berg et al. (2007), as it is the most comprehensive study.
2
(VAR) models to estimate the impact of aid receipt on fiscal policy in individual countries [e.g. the report of Osei, et al. (2005) on this issue in Ghana].
While related to all these branches of the macroeconomic literature, our study is methodologically distinct in that we also use the agnostic VAR approach, but we focus our attention on a range of countries rather than a single country. Furthermore, although we examine the macroeconomic utilization of aid in the short run, as is done in the more narrative reports by Berg et al. (2007) and Foster and Killick (2006), we expand on the prior studies by examining both spending and absorption responses using more systematic econometric techniques.
Generally speaking, it could be problematic to use a VAR approach to gauge short-run aid impacts across a wide range of countries, given the variety of legitimate uses to which aid can be put in the short run. This variety is amply demonstrated in even the small number of countries analyzed in the studies of Berg et al. (2007) and Foster and Killick (2006). Moreover, heterogeneity in the quality of domestic policy could also confound our analysis, given that poor policy environments can add an additional spanner into the workings of aid in the macroeconomy. However, we herein focus on 20 small developing countries, using a strategy that has two advantages with regard to the above concerns. First, we are effectively studying the short-run effects of aid in economies that are, in many cases, ‘supra-open’ in terms of trade policies and trade to GDP ratios. Second, small economies (especially small island economies) are typically thought to have somewhat better policies and institutions compared to other developing countries.5 Thus, our focus on SDCs allows us to investigate the extent to which aid is absorbed and spent in a group of highly aid-dependent economies that satisfy the implicit assumptions of a textbook prescription for how aid ought to be used, in that they have relatively good policies and institutions, and are characterized by very high degrees of openness. So although we do not wish to over-emphasize the relevance of our results to issues such as the impacts of doubling aid to African countries, our results are indirectly relevant in the sense that if aid-dependent SDCs do not absorb and spend aid in a textbook fashion, we would tend to doubt that textbook absorption and spending would be seen in larger and less open economies.
In summary, this study has three major objectives. The first objective is to improve our knowledge of aid usage in a group of countries that are highly aid-dependent and where there are strong concerns about the indirect impacts of aid on the macroeconomy. A second objective is to develop and test a new econometric tool for testing macroeconomic questions that have previously relied in large part on case study analysis, often of a narrative nature. The third and final objective is to examine whether countries that possess broadly textbook characteristics do, indeed, absorb and spend aid inflows in a manner that does not disturb the short-run macroeconomic balances.
Accordingly, the paper is organized as follows. Section 2 outlines the theoretical underpinnings of aid’s short-run effects on the macroeconomy in terms of absorption and spending, and discusses the diverse responses observed in the Berg et al. and Foster and Killick studies. Section 3 describes our econometric modeling techniques in detail. Section 4 presents our data set. Section 5 discusses our empirical results. Section 6 provides some brief concluding remarks and directions for future research.
5 The reasons for the relatively good socioeconomic performance of SDCs are typically thought to be two-fold. First, SDCs
have an apparent disadvantage that could work to their advantage in the long run, namely an extreme dependence upon the world economy, which is thought to impose the discipline of competition on domestic markets, and to pressure policymakers into adopting internationally acceptable policies and institutional structures. Second, their lack of political and economic importance on the international stage could mean that larger countries do not view them as economically threatening, and may even see ‘rewarding’ SDC support as a cost-effective means of acquiring support in UN voting decisions (Bertram 1993). Thus, powerful countries may be inclined to offer SDCs more favorable conditions on trade, offshore finance laws, migration, and foreign aid, relative to other LDCs.
3
2. A SIMPLE ACCOUNTING FRAMEWORK FOR AID FLOWS
In this section, we discuss possible scenarios for the macroeconomic use of aid flows. In line with Berg et al. (2007), we do not formulate a fully-fledged theoretical model, but rather adopt an accounting approach by using balance-of-payments and the national accounts system as an organizing framework. The main purpose of this discussion is to identify channels by which increases in aid inflows could affect macroeconomic aggregates. In contrast to the analyses in Berg et al. (2007), we herein focus on economy-wide aggregates rather than on government decisions and the interaction between monetary and fiscal policy.
Aid Flows in the Balance-of-Payments Accounts
Most foreign aid is transferred to an economy in the form of a grant or loan to the recipient country government.6 In the balance-of-payments system, aid grants are recorded as current transfers on the current account, while loans are recorded as changes in the net financial position of the capital account (vis-à-vis the rest of the world). Hence, we can specify the following balance-of-payments identities:
1 1( ) ( ) ,gt t t t t t t t tCA X M W i L r D A (1)
( ).o l rt t t tKA L A A (2)
In equation 1, the current account (CA) is defined as the net export of goods and services (export, X, less import, M) plus net private transfers (W, mainly remittances and worker compensation) less net interest payments to foreigners (iL + rD), with interest payments on market loans (iL) separated from interest payments on concessional aid loans (rD). The final term in the capital accounts definition (1) is that of aid grants (Ag). In equation 2, the capital account (KA) is specified simply as the net change in non-aid foreign debt (�Lo), which has both private and public elements, plus the foreign aid loan given within the year (Al), less repayments of principal on the aid loans (amortizations).7
Using the fact that the difference between the current account and the capital account equals the change in foreign reserves (�R), we have the following decomposition of the overall balance-of-payments:
1 1( ) ( ) .g l r ot t t t t t t t t t t tA A A R M X i L r D W L (3)
From this identity it is clear that from a purely accounting perspective, an increase in the net aid inflow (through either a grant or loan) can ‘enter the economy’ in five ways. The inflow may:
Increase foreign reserves
Increase net imports of goods and services
Finance interest payments on foreign debt (both aid and non-aid debt)
Finance a decrease in private transfers
Decrease net external debt (or increase capital flight)
Put simply, aid inflows may be thought of as initially increasing foreign reserves, because many large donations are transferred to dollar accounts in the central banks of recipient countries. Thereafter, it is up to the recipient country government and central bank to channel the aid resource into the economy.
6 Both grants and loans may be ‘in kind’ but this does not influence the following discussion. 7 The sum of the aid grant and the aid loan less the repayment corresponds to the definition of net official development aid
(ODA) by the Development Assistance Committee (DAC): net ODA = Ag +Al - Ar.
4
As we will discuss below, there is unlikely to be any optimal way of ‘distributing’ the aid inflow across the balance of payments (BoP) components, as aid increases are often granted and disbursed under a variety of different circumstances (e.g. macroeconomic crises). For the moment, we wish to analyze the impact of aid inflows under ‘normal’ circumstances, so we focus on the most common intended use of aid inflows: to fund an increase in net imports. Therefore, we define the rate of absorption of an increase in aid as the increase in net imports relative to the increase in aid. Letting � denote change over time, absorption of aid in a given period can be specified as:
( ).
( )t t
g l rt t t
M XAbsorption
A A A
(4)
Thus, absorption can be seen as a measure of the direct, real resource transfer associated with an increase in the aid inflow.8 As discussed in Berg et al. (2007), absorption is largely controlled by the central bank through its decisions on reserve accumulation and interest rate policy, to the extent that interest rates influence the demand for private sector imports via aggregate demand. Some important exceptions to the central bank control of aid flows are seen in aid-in-kind, aid given directly to the government for purchase of imported goods and services, aid given directly to NGOs, and grants for debt forgiveness. Aid is fully absorbed in the first three cases, while there is no absorption in the case of debt forgiveness. In most countries, these exceptions are quite small in magnitude, leaving the central bank controlling most of the decisions surrounding the absorbance of an increase in aid flow.
Aid Flows in the National Accounts System
In terms of national account identities, aid loans do not appear directly, while aid grants are part of disposable gross national income (disp. GNI):
1 1
1 1
. ( )
( ) ( ) ( ) .
gt t t t t t t t
gt t t t t t t t t t t
disp GNI Y W i L r D A
C I G M X W i L r D A
(5)
The notation in equation 5 follows standard nomenclature: Y is GDP, C is household consumption expenditure, I is investment, and G is government consumption. In the second line of equation 5, GDP is specified as domestic demand (C + I + G) less net imports (M - X).
It can be discerned from the above equations that GDP less net interest payments on foreign debt plus workers’ compensation from abroad defines GNI, while adding remittances and aid grants yields disposable GNI. Hence, foreign aid has no direct impact on the main macroeconomic aggregates constituting GDP and GNI. An aid grant that is not used to finance net imports will increase national financial savings, but may not alter GDP and/or GNI (in the short run) if the grant is used to either increase reserves or decrease foreign debt.9 Aid only affects the components of GDP when the recipient government spends the inflow.10 Berg et al. (2007), in their definition of aid spending, look at changes in government fiscal deficit (net of aid) relative to changes in aid inflow. While this definition clearly relates the spending decision to government policies, we prefer the notion of spending aid to have a definition more closely linked to the macroeconomy. We therefore use a broader definition of spending, by looking at the change in total domestic demand relative to the change in aid:
8 Our definition of absorption differs from the definition in Berg et al. (2007), as we include only net imports of goods and
services, while they also include net interest payments and private transfers (the non-aid current account). As will be apparent later, we consider the former a more natural choice in our setting.
9 Naturally, over time, there may be second-order effects from an increased reserve position or decreases in interest and principal payments on debt.
10 When aid is given to an NGO, the spending decision is recorded as an increase in household consumption and private investment, because NGOs are included in the private sector in the national accounts system.
5
( ).
( )t t t
g l rt t t
C I GSpending
A A A
(6)
Under this definition, a government decision not to widen the fiscal deficit could still result in increased spending if the private sector increases consumption or investment.
Absorption, spending and production
The main reason for the above definitions of absorption and spending is that they work directly on the national accounts identity by linking spending and absorption decisions to changes in GDP relative to the increase in aid inflows:
( )
.
tg l rt t t
YProduction
A A A
Spending Absorption
(7)
Based on this identity, we can discuss different short-run responses as combinations of the spending and absorption of increased aid inflows.
With regard to spending, an increased aid transfer to the government can be utilized in four ways. The response generally preferred by bilateral donors is what Berg et al. (2007) term the ‘textbook case,’ i.e. full absorption and spending that leaves GDP unaffected (in the short run) because the increased domestic demand is exactly offset by increased net imports. In the long run, it is hoped that the inflow results in increased productive capacity via investments in physical and human capital, and possibly even in improved institutions (financed by government consumption or investment in the short run). But although this is the textbook response to aid inflow, a variety of circumstances could warrant different utilization of aid inflows.
For example, a second response would be to let the inflow be absorbed but not spent. This may occur when the foreign exchange generated by aid flow is used to sterilize the monetary impact of a fiscal deficit, leading to increases in the exchange rate and net imports (absorption). If government consumption and investment decreases, then spending will be less than absorption, and a visible real resource transfer will have a negative short-run impact on growth. Thus, the decision not to spend the inflow may be reasonable in times of fiscal stress, but it is not a sustainable development strategy.
A third response would be to spend but not absorb the inflow. Such an expansion would be similar to an increase in domestic demand without any increase in aid inflow, and would result in a considerable short-run pressure on GDP, which also may not be sustainable. Both Berg et al. (2007) and Foster and Killick (2006) discuss the spending/no-absorption combination in detail, generally noting that this is a highly unattractive policy option because it is analogous to deficit financing of public expenditure.
Finally, a fourth option is to neither absorb nor spend the inflow. One way this could be done is via principal payment on external debt. In some situations, aid has been disbursed to avoid countries’ defaulting on their external debt obligations (so-called defensive lending); under such circumstances, the increased inflow is obviously meant to finance interest payments (and possibly principal repayment) on external debt.11 In recent years, grants for debt forgiveness (which are clearly intended to decrease the net external debt) have been very popular among a number of bilateral donors, and this strategy has been an integral part of the Heavily Indebted Poor Countries (HIPC) initiative.
A second and very important rationale for neither absorbing nor spending aid is to bolster foreign exchange reserves, as often advocated by the IMF in times of balance-of-payment crises (see IMF 2004). In small countries that are highly dependent on volatile and unpredictable export revenues and aid flows,
11 Needless to say, ‘defensive lending’ is never stated explicitly as an aid program. However, fairly strong evidence suggests
the occurrence of defensive lending to highly indebted poor African countries (Birdsall et al. 2003).
6
smoothing out the inflow of foreign reserves and ensuring a relatively large stock of reserves may be a sound practice at any time (indeed, a common measure of reserve status is ‘months of imports,’ implying that highly import-dependent SDCs ought to maintain larger-than-average reserves). Conversely, this means that full absorption and spending of aid within any given year may be a bad choice when fiscal and macroeconomic stability is an issue. Hence, when aid flows are volatile and have unpredictable elements, full absorption and spending should only be achieved over time, not within a single year.
This idea of dynamic absorption and spending is implicit in the country studies in Berg et al. (2007) and Foster and Killick (2006), since aid absorption and spending is measured over two- to four-year periods. However, while full absorption and spending is the best short-run response, it is not the desired medium-term result if one expects well managed aid flows to increase national income over the medium and long runs through investment in physical capital, human capital, and institutional capacity building. If aid has a medium-term impact on productivity, then spending should be greater than one and should ultimately exceed absorption, which should be less than one, reflecting an increase in exports. This may be one reason why the country studies in Berg et al. (2007) and Foster and Killick (2006) often find that spending exceeds absorption.
7
3. A SIMPLE ECONOMETRIC MODEL OF ABSORPTION, SPENDING AND PRODUCTION
The above discussion illustrates the need for dynamic models for the econometric analysis of absorption and spending, because the optimal time horizon for measuring absorption and spending cannot be given a priori. The econometric model of absorption, spending and production developed herein accommodates the complications arising in such a dynamic context.
The Econometric Model
We herein formulate and apply a simple dynamic econometric model that seeks to account for a country’s absorption, spending and changes to GDP following a sudden increase in foreign aid.12 We use a vector autoregressive (VAR) model because it does not impose too much a priori structure. Our starting point for the econometric model is the national income accounts identity, measured in constant local currency units and given as annual changes:
( )jt jt jt jt jt jt
jt jt
Y C I G M X
D NM
(8)
where Yjt is GDP in country j at time t, Cjt is household consumption, Ijt is gross capital formation (investment), Gjt is government consumption, Xjt is exports of goods and services, and Mjt is imports of goods and services. As in Section 2, we can specify the changes in GDP (Yjt) as the change in domestic demand (Djt) less the change in net imports (NMjt), thereby directly linking our definitions of absorption and spending.
In order to obtain ‘standardized’ measures across countries, we divide the changes in GDP and its components by GDP in the initial year. Hence, we look at the change in real GDP from year t-1 to year t, relative to the initial level and the contributions from the terms on the right-hand side of the identity:
( )jt jt jt jty d m x
(9)
where each of the series have been transformed by
0
, , , , .jtjt jt jt jt jt jt
j
Vv V Y D X M
Y
(10)
For foreign aid, we look at the net inflows of aid (grants plus loans minus principal repayments) less emergency aid and technical cooperation. The aid inflow is measured analogously to the national income accounts variables in equation 9; i.e. we model the change in aid inflows (A) in country j from t-1 to t relative to GDP in the initial year:
0
.jtjt
j
Aa
Y
(11)
The national income accounts variables in equation 9 and the aid variable in equation 11 are used to specify a VAR model. However, because equation 9 is an identity, the covariance matrix of disturbances is singular. As shown in Barten (1969), the parameters of the model can be consistently estimated by omitting one of the variables from the system. In the present model, it doesn’t matter which
12 By ‘sudden increase,’ we mean an unanticipated exogenous change in aid, or at least a change in aid that is not predictable
given our model set-up.
8
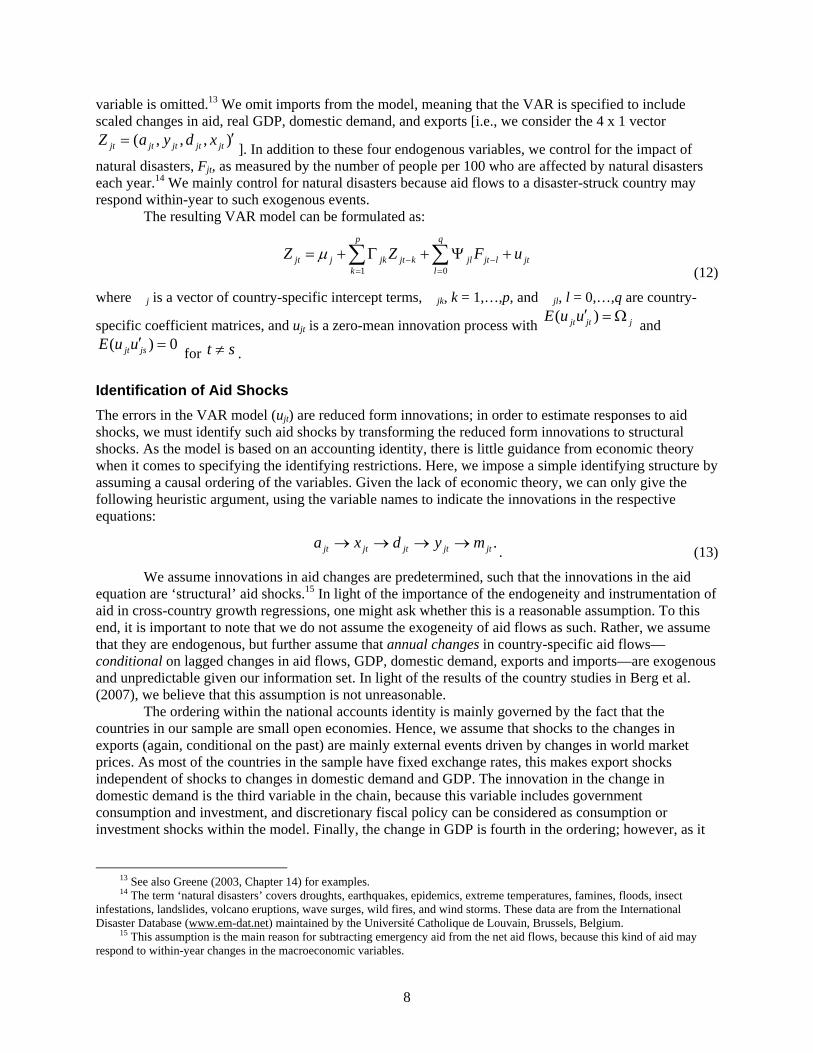
variable is omitted.13 We omit imports from the model, meaning that the VAR is specified to include scaled changes in aid, real GDP, domestic demand, and exports [i.e., we consider the 4 x 1 vector
( , , , )jt jt jt jt jtZ a y d x]. In addition to these four endogenous variables, we control for the impact of
natural disasters, Fjt, as measured by the number of people per 100 who are affected by natural disasters each year.14 We mainly control for natural disasters because aid flows to a disaster-struck country may respond within-year to such exogenous events.
The resulting VAR model can be formulated as:
1 0
p q
jt j jk jt k jl jt l jtk l
Z Z F u
(12)
where �j is a vector of country-specific intercept terms, �jk, k = 1,…,p, and �jl, l = 0,…,q are country-
specific coefficient matrices, and ujt is a zero-mean innovation process with ( ) jt jt jE u u
and ( ) 0 jt jsE u u
for t s .
Identification of Aid Shocks
The errors in the VAR model (ujt) are reduced form innovations; in order to estimate responses to aid shocks, we must identify such aid shocks by transforming the reduced form innovations to structural shocks. As the model is based on an accounting identity, there is little guidance from economic theory when it comes to specifying the identifying restrictions. Here, we impose a simple identifying structure by assuming a causal ordering of the variables. Given the lack of economic theory, we can only give the following heuristic argument, using the variable names to indicate the innovations in the respective equations:
.jt jt jt jt jta x d y m . (13)
We assume innovations in aid changes are predetermined, such that the innovations in the aid equation are ‘structural’ aid shocks.15 In light of the importance of the endogeneity and instrumentation of aid in cross-country growth regressions, one might ask whether this is a reasonable assumption. To this end, it is important to note that we do not assume the exogeneity of aid flows as such. Rather, we assume that they are endogenous, but further assume that annual changes in country-specific aid flows—conditional on lagged changes in aid flows, GDP, domestic demand, exports and imports—are exogenous and unpredictable given our information set. In light of the results of the country studies in Berg et al. (2007), we believe that this assumption is not unreasonable.
The ordering within the national accounts identity is mainly governed by the fact that the countries in our sample are small open economies. Hence, we assume that shocks to the changes in exports (again, conditional on the past) are mainly external events driven by changes in world market prices. As most of the countries in the sample have fixed exchange rates, this makes export shocks independent of shocks to changes in domestic demand and GDP. The innovation in the change in domestic demand is the third variable in the chain, because this variable includes government consumption and investment, and discretionary fiscal policy can be considered as consumption or investment shocks within the model. Finally, the change in GDP is fourth in the ordering; however, as it
13 See also Greene (2003, Chapter 14) for examples. 14 The term ‘natural disasters’ covers droughts, earthquakes, epidemics, extreme temperatures, famines, floods, insect
infestations, landslides, volcano eruptions, wave surges, wild fires, and wind storms. These data are from the International Disaster Database (www.em-dat.net) maintained by the Université Catholique de Louvain, Brussels, Belgium.
15 This assumption is the main reason for subtracting emergency aid from the net aid flows, because this kind of aid may respond to within-year changes in the macroeconomic variables.
9
precedes changes in imports, the goods market is assumed to be cleared by changes in imports, not by changes in GDP.16
The VAR model is mainly formulated to analyze the short- and medium-run impact of aid flows. Therefore, our specific choice of structural ordering should not be interpreted as an attempt to provide a strict identification of structural shocks. Instead, the key assumption is that aid flows are predetermined, meaning that the innovations in the aid equation can be interpreted as aid shocks to the economies in question.
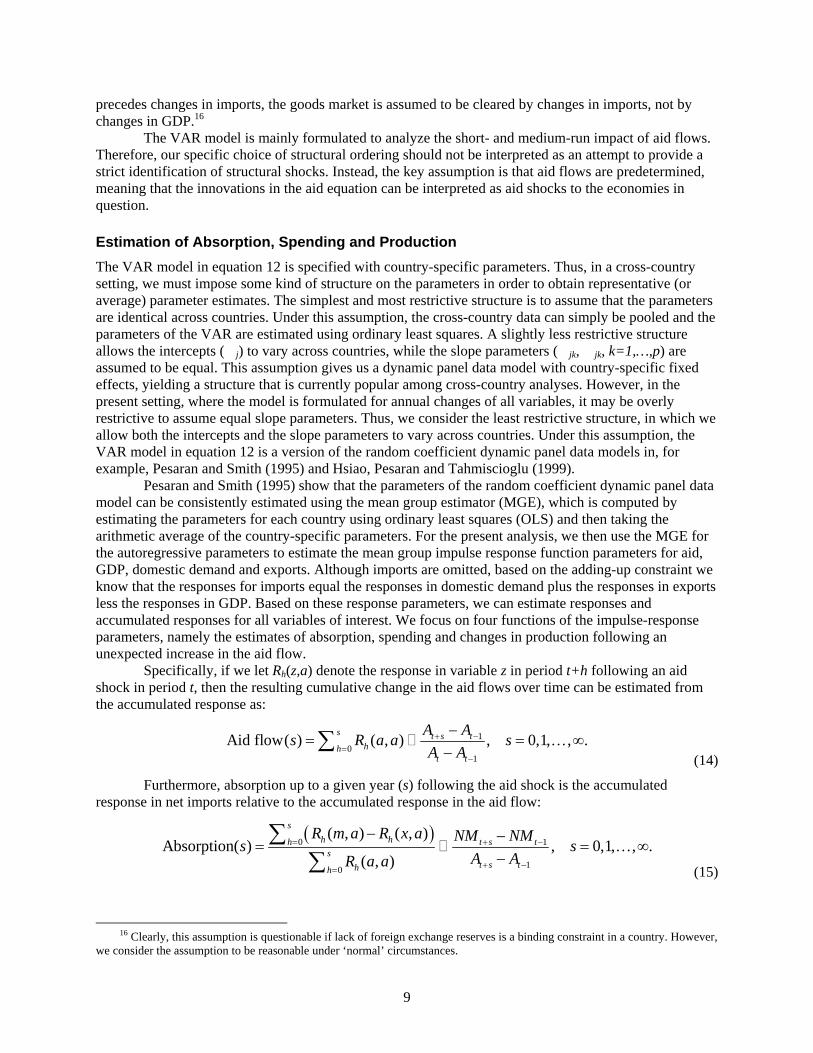
Estimation of Absorption, Spending and Production
The VAR model in equation 12 is specified with country-specific parameters. Thus, in a cross-country setting, we must impose some kind of structure on the parameters in order to obtain representative (or average) parameter estimates. The simplest and most restrictive structure is to assume that the parameters are identical across countries. Under this assumption, the cross-country data can simply be pooled and the parameters of the VAR are estimated using ordinary least squares. A slightly less restrictive structure allows the intercepts (�j) to vary across countries, while the slope parameters (�jk, �jk, k=1,…,p) are assumed to be equal. This assumption gives us a dynamic panel data model with country-specific fixed effects, yielding a structure that is currently popular among cross-country analyses. However, in the present setting, where the model is formulated for annual changes of all variables, it may be overly restrictive to assume equal slope parameters. Thus, we consider the least restrictive structure, in which we allow both the intercepts and the slope parameters to vary across countries. Under this assumption, the VAR model in equation 12 is a version of the random coefficient dynamic panel data models in, for example, Pesaran and Smith (1995) and Hsiao, Pesaran and Tahmiscioglu (1999).
Pesaran and Smith (1995) show that the parameters of the random coefficient dynamic panel data model can be consistently estimated using the mean group estimator (MGE), which is computed by estimating the parameters for each country using ordinary least squares (OLS) and then taking the arithmetic average of the country-specific parameters. For the present analysis, we then use the MGE for the autoregressive parameters to estimate the mean group impulse response function parameters for aid, GDP, domestic demand and exports. Although imports are omitted, based on the adding-up constraint we know that the responses for imports equal the responses in domestic demand plus the responses in exports less the responses in GDP. Based on these response parameters, we can estimate responses and accumulated responses for all variables of interest. We focus on four functions of the impulse-response parameters, namely the estimates of absorption, spending and changes in production following an unexpected increase in the aid flow.
Specifically, if we let Rh(z,a) denote the response in variable z in period t+h following an aid shock in period t, then the resulting cumulative change in the aid flows over time can be estimated from the accumulated response as:
10
1
Aid flow( ) ( , ) , 0,1, , .s t s t
hht t
A As R a a s
A A
(14)
Furthermore, absorption up to a given year (s) following the aid shock is the accumulated response in net imports relative to the accumulated response in the aid flow:
0 1
10
( , ) ( , )Absorption( ) , 0,1, , .
( , )
s
h hh t s ts
t s thh
R m a R x a NM NMs s
A AR a a
(15)
16 Clearly, this assumption is questionable if lack of foreign exchange reserves is a binding constraint in a country. However,
we consider the assumption to be reasonable under ‘normal’ circumstances.
10
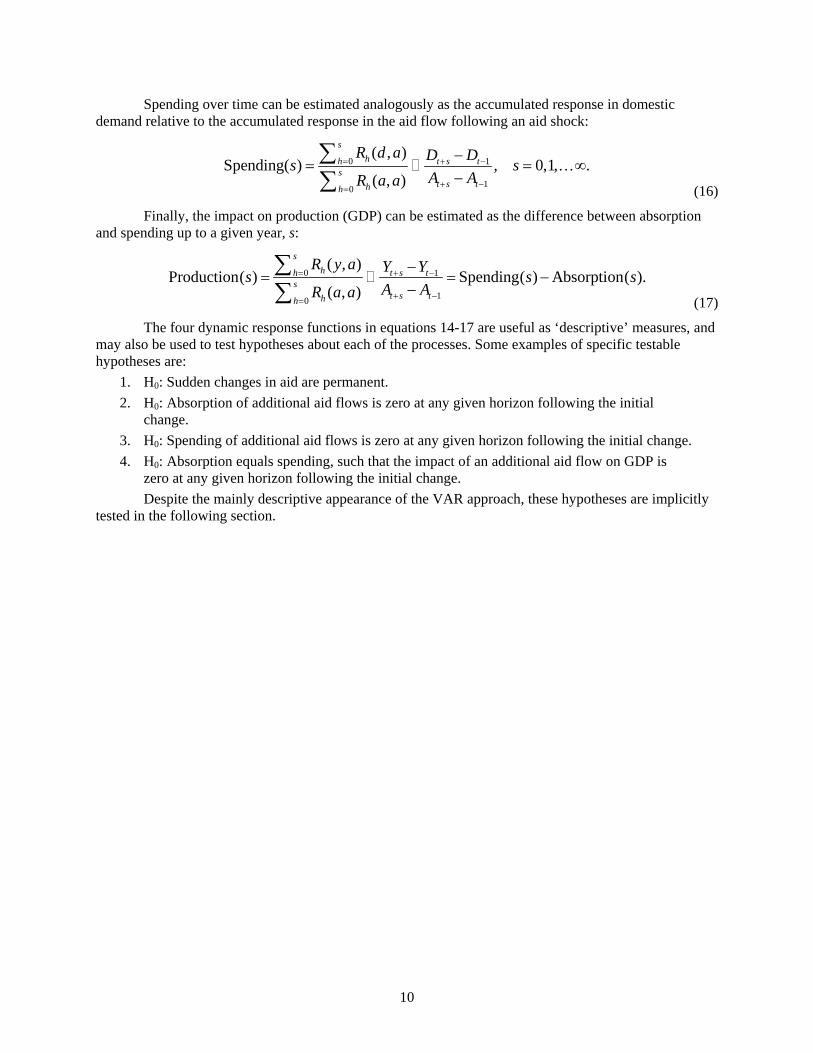
Spending over time can be estimated analogously as the accumulated response in domestic demand relative to the accumulated response in the aid flow following an aid shock:
0 1
10
( , )Spending( ) , 0,1, .
( , )
s
hh t s ts
t s thh
R d a D Ds s
A AR a a
(16)
Finally, the impact on production (GDP) can be estimated as the difference between absorption and spending up to a given year, s:
0 1
10
( , )Production( ) Spending( ) Absorption( ).
( , )
s
hh t s ts
t s thh
R y a Y Ys s s
A AR a a
(17)
The four dynamic response functions in equations 14-17 are useful as ‘descriptive’ measures, and may also be used to test hypotheses about each of the processes. Some examples of specific testable hypotheses are:
1. H0: Sudden changes in aid are permanent.
2. H0: Absorption of additional aid flows is zero at any given horizon following the initial change.
3. H0: Spending of additional aid flows is zero at any given horizon following the initial change.
4. H0: Absorption equals spending, such that the impact of an additional aid flow on GDP is zero at any given horizon following the initial change.
Despite the mainly descriptive appearance of the VAR approach, these hypotheses are implicitly tested in the following section.
11
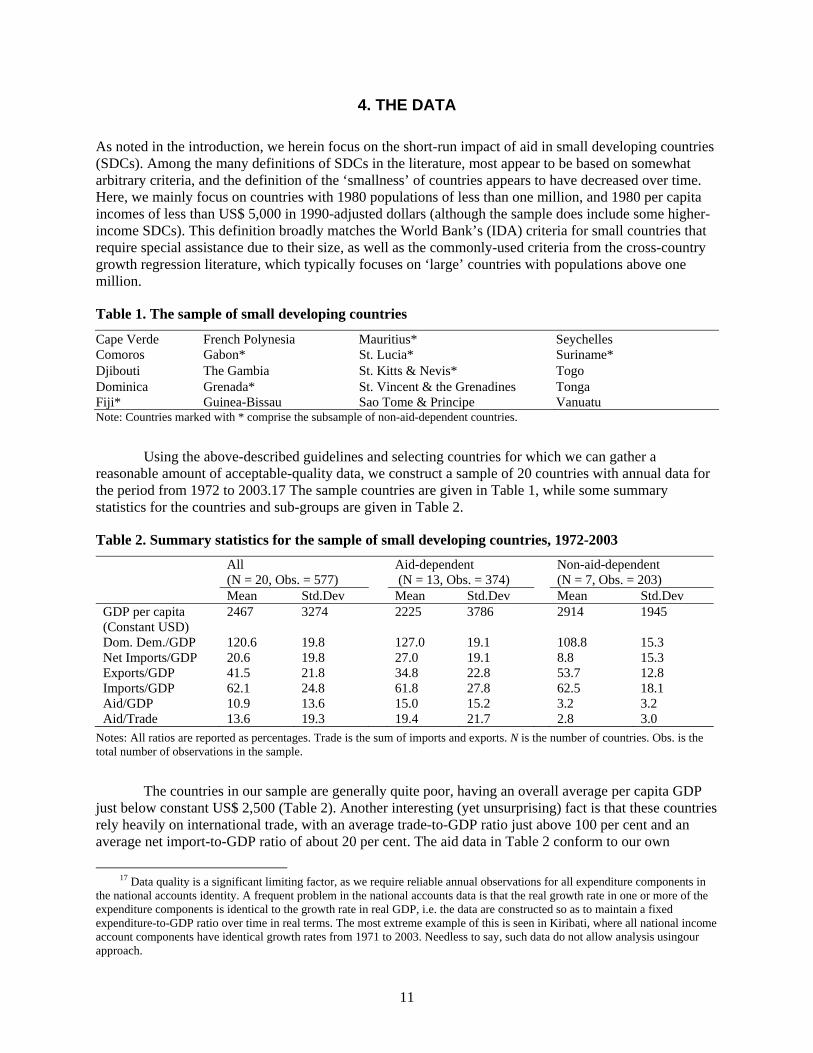
4. THE DATA
As noted in the introduction, we herein focus on the short-run impact of aid in small developing countries (SDCs). Among the many definitions of SDCs in the literature, most appear to be based on somewhat arbitrary criteria, and the definition of the ‘smallness’ of countries appears to have decreased over time. Here, we mainly focus on countries with 1980 populations of less than one million, and 1980 per capita incomes of less than US$ 5,000 in 1990-adjusted dollars (although the sample does include some higher-income SDCs). This definition broadly matches the World Bank’s (IDA) criteria for small countries that require special assistance due to their size, as well as the commonly-used criteria from the cross-country growth regression literature, which typically focuses on ‘large’ countries with populations above one million.
Table 1. The sample of small developing countries
Cape Verde French Polynesia Mauritius* Seychelles Comoros Gabon* St. Lucia* Suriname* Djibouti The Gambia St. Kitts & Nevis* Togo Dominica Grenada* St. Vincent & the Grenadines Tonga Fiji* Guinea-Bissau Sao Tome & Principe Vanuatu Note: Countries marked with * comprise the subsample of non-aid-dependent countries.
Using the above-described guidelines and selecting countries for which we can gather a reasonable amount of acceptable-quality data, we construct a sample of 20 countries with annual data for the period from 1972 to 2003.17 The sample countries are given in Table 1, while some summary statistics for the countries and sub-groups are given in Table 2.
Table 2. Summary statistics for the sample of small developing countries, 1972-2003
All (N = 20, Obs. = 577)
Aid-dependent (N = 13, Obs. = 374)
Non-aid-dependent (N = 7, Obs. = 203)
Mean Std.Dev Mean Std.Dev Mean Std.Dev GDP per capita (Constant USD)
2467 3274 2225 3786 2914 1945
Dom. Dem./GDP 120.6 19.8 127.0 19.1 108.8 15.3 Net Imports/GDP 20.6 19.8 27.0 19.1 8.8 15.3 Exports/GDP 41.5 21.8 34.8 22.8 53.7 12.8 Imports/GDP 62.1 24.8 61.8 27.8 62.5 18.1 Aid/GDP 10.9 13.6 15.0 15.2 3.2 3.2 Aid/Trade 13.6 19.3 19.4 21.7 2.8 3.0
Notes: All ratios are reported as percentages. Trade is the sum of imports and exports. N is the number of countries. Obs. is the total number of observations in the sample.
The countries in our sample are generally quite poor, having an overall average per capita GDP just below constant US$ 2,500 (Table 2). Another interesting (yet unsurprising) fact is that these countries rely heavily on international trade, with an average trade-to-GDP ratio just above 100 per cent and an average net import-to-GDP ratio of about 20 per cent. The aid data in Table 2 conform to our own
17 Data quality is a significant limiting factor, as we require reliable annual observations for all expenditure components in
the national accounts identity. A frequent problem in the national accounts data is that the real growth rate in one or more of the expenditure components is identical to the growth rate in real GDP, i.e. the data are constructed so as to maintain a fixed expenditure-to-GDP ratio over time in real terms. The most extreme example of this is seen in Kiribati, where all national income account components have identical growth rates from 1971 to 2003. Needless to say, such data do not allow analysis usingour approach.
12
definition by including grants and loans minus loan repayments, but excluding emergency aid and technical cooperation. Under this definition, we see that the annual aid inflow could finance, on average, half of the annual net imports, indicating that most of these small economies largely finance net imports through external resources other than aid.
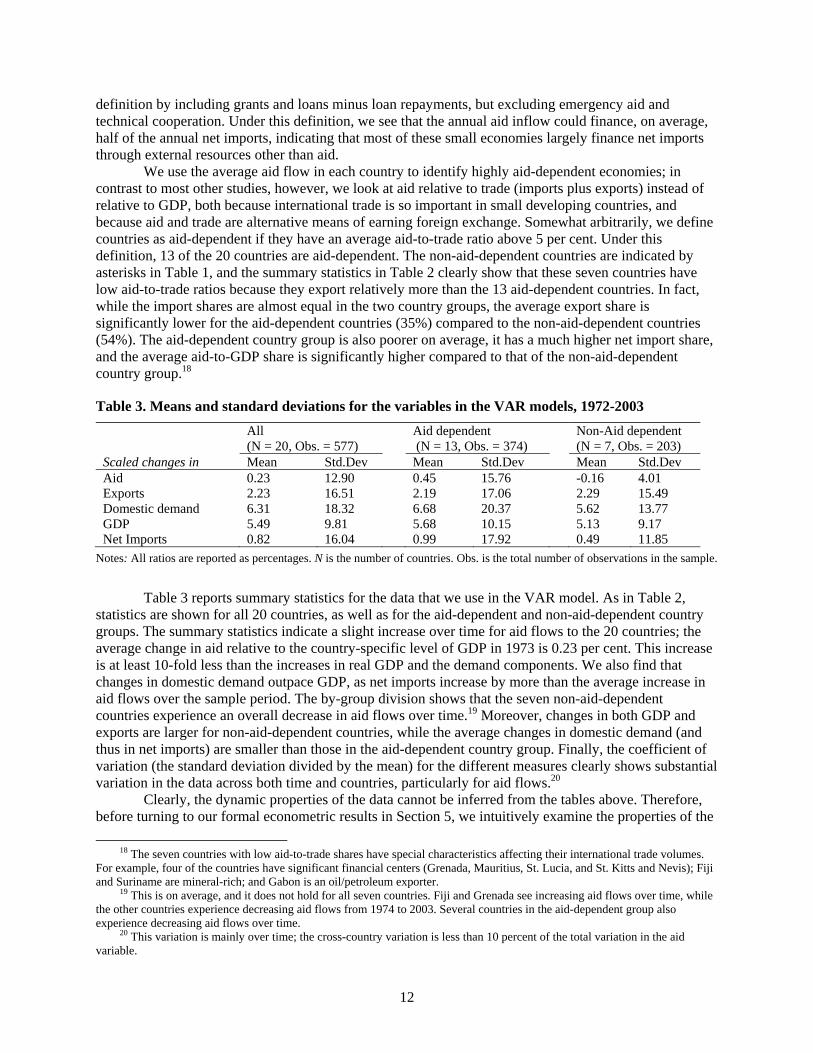
We use the average aid flow in each country to identify highly aid-dependent economies; in contrast to most other studies, however, we look at aid relative to trade (imports plus exports) instead of relative to GDP, both because international trade is so important in small developing countries, and because aid and trade are alternative means of earning foreign exchange. Somewhat arbitrarily, we define countries as aid-dependent if they have an average aid-to-trade ratio above 5 per cent. Under this definition, 13 of the 20 countries are aid-dependent. The non-aid-dependent countries are indicated by asterisks in Table 1, and the summary statistics in Table 2 clearly show that these seven countries have low aid-to-trade ratios because they export relatively more than the 13 aid-dependent countries. In fact, while the import shares are almost equal in the two country groups, the average export share is significantly lower for the aid-dependent countries (35%) compared to the non-aid-dependent countries (54%). The aid-dependent country group is also poorer on average, it has a much higher net import share, and the average aid-to-GDP share is significantly higher compared to that of the non-aid-dependent country group.18
Table 3. Means and standard deviations for the variables in the VAR models, 1972-2003
All (N = 20, Obs. = 577)
Aid dependent (N = 13, Obs. = 374)
Non-Aid dependent (N = 7, Obs. = 203)
Scaled changes in Mean Std.Dev Mean Std.Dev Mean Std.Dev Aid 0.23 12.90 0.45 15.76 -0.16 4.01 Exports 2.23 16.51 2.19 17.06 2.29 15.49 Domestic demand 6.31 18.32 6.68 20.37 5.62 13.77 GDP 5.49 9.81 5.68 10.15 5.13 9.17 Net Imports 0.82 16.04 0.99 17.92 0.49 11.85
Notes: All ratios are reported as percentages. N is the number of countries. Obs. is the total number of observations in the sample.
Table 3 reports summary statistics for the data that we use in the VAR model. As in Table 2, statistics are shown for all 20 countries, as well as for the aid-dependent and non-aid-dependent country groups. The summary statistics indicate a slight increase over time for aid flows to the 20 countries; the average change in aid relative to the country-specific level of GDP in 1973 is 0.23 per cent. This increase is at least 10-fold less than the increases in real GDP and the demand components. We also find that changes in domestic demand outpace GDP, as net imports increase by more than the average increase in aid flows over the sample period. The by-group division shows that the seven non-aid-dependent countries experience an overall decrease in aid flows over time.19 Moreover, changes in both GDP and exports are larger for non-aid-dependent countries, while the average changes in domestic demand (and thus in net imports) are smaller than those in the aid-dependent country group. Finally, the coefficient of variation (the standard deviation divided by the mean) for the different measures clearly shows substantial variation in the data across both time and countries, particularly for aid flows.20
Clearly, the dynamic properties of the data cannot be inferred from the tables above. Therefore, before turning to our formal econometric results in Section 5, we intuitively examine the properties of the
18 The seven countries with low aid-to-trade shares have special characteristics affecting their international trade volumes.
For example, four of the countries have significant financial centers (Grenada, Mauritius, St. Lucia, and St. Kitts and Nevis); Fiji and Suriname are mineral-rich; and Gabon is an oil/petroleum exporter.
19 This is on average, and it does not hold for all seven countries. Fiji and Grenada see increasing aid flows over time, while the other countries experience decreasing aid flows from 1974 to 2003. Several countries in the aid-dependent group also experience decreasing aid flows over time.
20 This variation is mainly over time; the cross-country variation is less than 10 percent of the total variation in the aid variable.
13
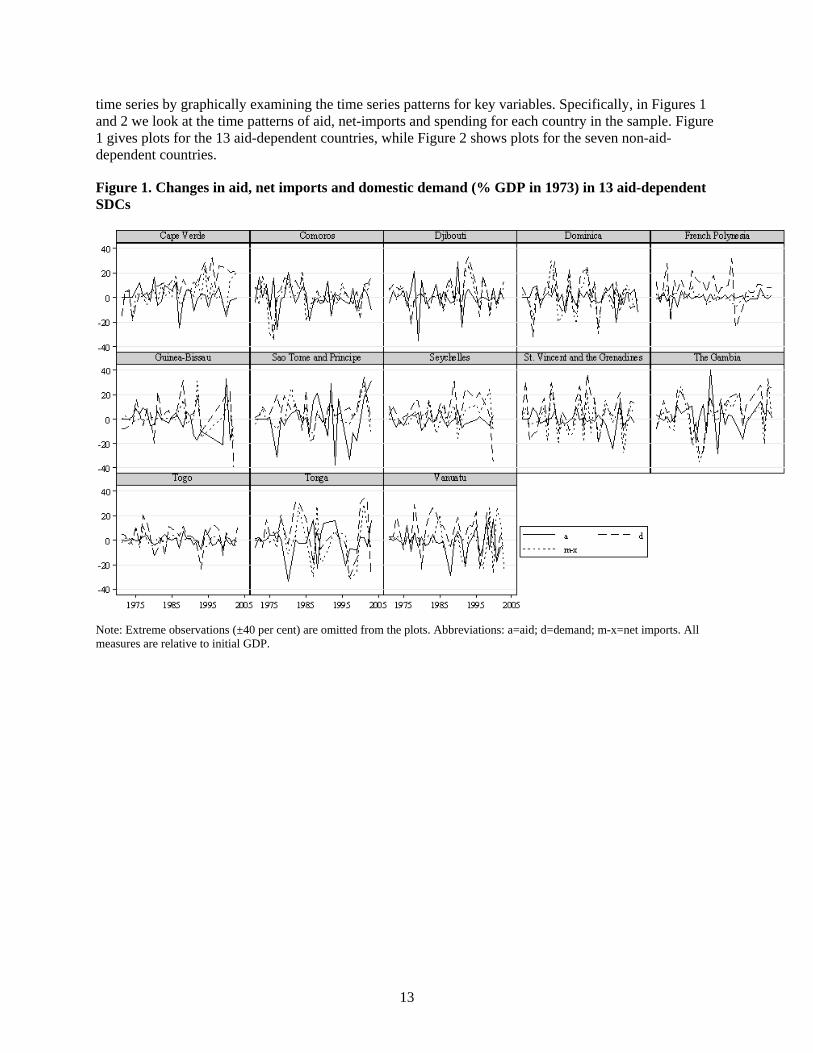
time series by graphically examining the time series patterns for key variables. Specifically, in Figures 1 and 2 we look at the time patterns of aid, net-imports and spending for each country in the sample. Figure 1 gives plots for the 13 aid-dependent countries, while Figure 2 shows plots for the seven non-aid-dependent countries.
Figure 1. Changes in aid, net imports and domestic demand (% GDP in 1973) in 13 aid-dependent SDCs
Note: Extreme observations (±40 per cent) are omitted from the plots. Abbreviations: a=aid; d=demand; m-x=net imports. All measures are relative to initial GDP.
14
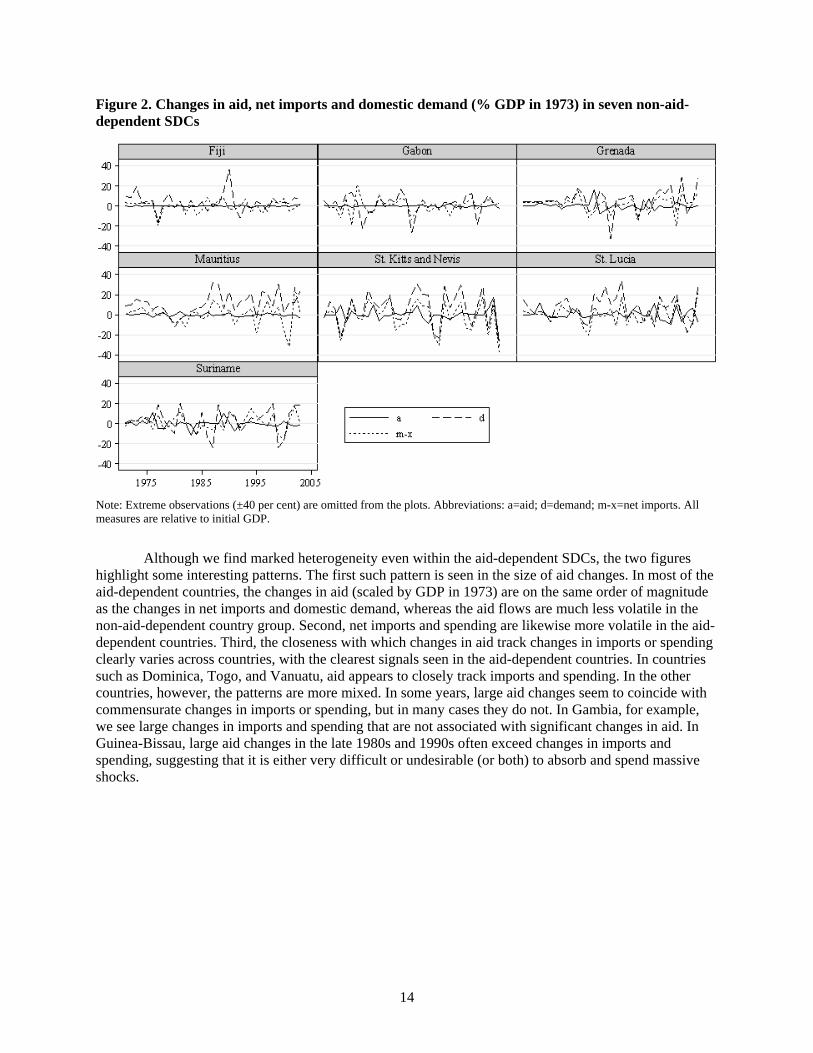
Figure 2. Changes in aid, net imports and domestic demand (% GDP in 1973) in seven non-aid-dependent SDCs
Note: Extreme observations (±40 per cent) are omitted from the plots. Abbreviations: a=aid; d=demand; m-x=net imports. All measures are relative to initial GDP.
Although we find marked heterogeneity even within the aid-dependent SDCs, the two figures highlight some interesting patterns. The first such pattern is seen in the size of aid changes. In most of the aid-dependent countries, the changes in aid (scaled by GDP in 1973) are on the same order of magnitude as the changes in net imports and domestic demand, whereas the aid flows are much less volatile in the non-aid-dependent country group. Second, net imports and spending are likewise more volatile in the aid-dependent countries. Third, the closeness with which changes in aid track changes in imports or spending clearly varies across countries, with the clearest signals seen in the aid-dependent countries. In countries such as Dominica, Togo, and Vanuatu, aid appears to closely track imports and spending. In the other countries, however, the patterns are more mixed. In some years, large aid changes seem to coincide with commensurate changes in imports or spending, but in many cases they do not. In Gambia, for example, we see large changes in imports and spending that are not associated with significant changes in aid. In Guinea-Bissau, large aid changes in the late 1980s and 1990s often exceed changes in imports and spending, suggesting that it is either very difficult or undesirable (or both) to absorb and spend massive shocks.
15
5. EMPIRICAL RESULTS
While the graphical results are interesting, and allow us to look at country-specific results, they do not provide a rigorous tool for examining and formally testing more complex dynamic patterns in the data. The more formal econometric model we propose in Section 3 seeks to fill this gap. As we explain in Section 3, the autoregressive parameters of the VAR model are reduced form parameters with no direct interpretation; this is why we do not present or discuss the autoregressive parameter estimates. Instead, we focus on the dynamic responses, represented by the estimations of aid flow, absorption, spending and production changes following an exogenous aid shock.
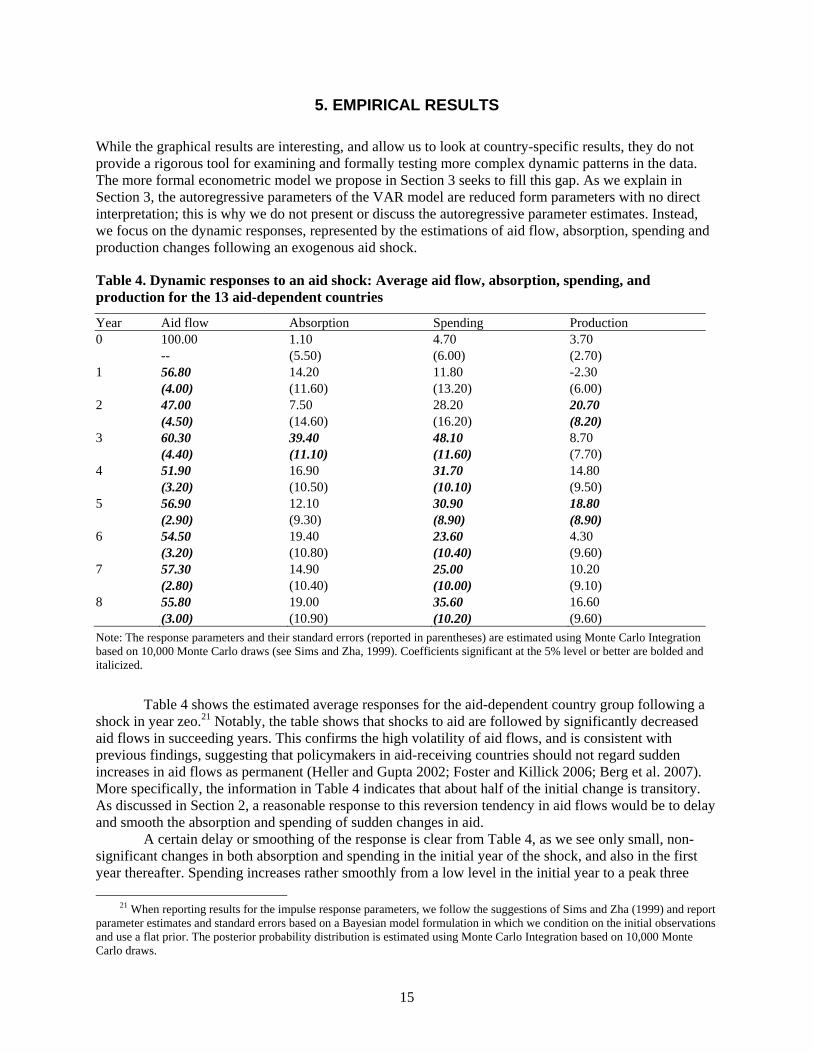
Table 4. Dynamic responses to an aid shock: Average aid flow, absorption, spending, and production for the 13 aid-dependent countries
Year Aid flow Absorption Spending Production 0 100.00 1.10 4.70 3.70 -- (5.50) (6.00) (2.70) 1 56.80 14.20 11.80 -2.30 (4.00) (11.60) (13.20) (6.00) 2 47.00 7.50 28.20 20.70 (4.50) (14.60) (16.20) (8.20) 3 60.30 39.40 48.10 8.70 (4.40) (11.10) (11.60) (7.70) 4 51.90 16.90 31.70 14.80 (3.20) (10.50) (10.10) (9.50) 5 56.90 12.10 30.90 18.80 (2.90) (9.30) (8.90) (8.90) 6 54.50 19.40 23.60 4.30 (3.20) (10.80) (10.40) (9.60) 7 57.30 14.90 25.00 10.20 (2.80) (10.40) (10.00) (9.10) 8 55.80 19.00 35.60 16.60 (3.00) (10.90) (10.20) (9.60)
Note: The response parameters and their standard errors (reported in parentheses) are estimated using Monte Carlo Integration based on 10,000 Monte Carlo draws (see Sims and Zha, 1999). Coefficients significant at the 5% level or better are bolded and italicized.
Table 4 shows the estimated average responses for the aid-dependent country group following a shock in year zeo.21 Notably, the table shows that shocks to aid are followed by significantly decreased aid flows in succeeding years. This confirms the high volatility of aid flows, and is consistent with previous findings, suggesting that policymakers in aid-receiving countries should not regard sudden increases in aid flows as permanent (Heller and Gupta 2002; Foster and Killick 2006; Berg et al. 2007). More specifically, the information in Table 4 indicates that about half of the initial change is transitory. As discussed in Section 2, a reasonable response to this reversion tendency in aid flows would be to delay and smooth the absorption and spending of sudden changes in aid.
A certain delay or smoothing of the response is clear from Table 4, as we see only small, non-significant changes in both absorption and spending in the initial year of the shock, and also in the first year thereafter. Spending increases rather smoothly from a low level in the initial year to a peak three
21 When reporting results for the impulse response parameters, we follow the suggestions of Sims and Zha (1999) and report
parameter estimates and standard errors based on a Bayesian model formulation in which we condition on the initial observations and use a flat prior. The posterior probability distribution is estimated using Monte Carlo Integration based on 10,000 Monte Carlo draws.
16
years after the shock. The point estimate of the peak level of spending is 48 per cent, indicating that about half of the change in aid is spent. While we cannot reject the possibility of higher levels of spending, full spending of the additional aid flow is highly unlikely, as it is clearly outside the two-standard-error band. The absorption ratios are smaller than the spending ratios, but only by a small margin, and the time patterns are fairly similar. The peak level of absorption is also seen in year three following the shock, although the point estimate of the peak is only 40 per cent, yielding a relatively small effect on GDP.
Table 4 paints a clear picture of aid shock smoothing and somewhat low absorption and spending ratios compared to the ideal absorption and spending prescription. However, absorption and spending rates just below 50 per cent are higher than the findings for most of the countries examined in Berg et al. (2007) and Foster and Killick (2006). Furthermore, the time pattern of absorption and spending indicates reasonably consistent monetary and fiscal policies in the aid-dependent countries, thereby avoiding severe macroeconomic imbalances that could be caused by the increased aid inflow.
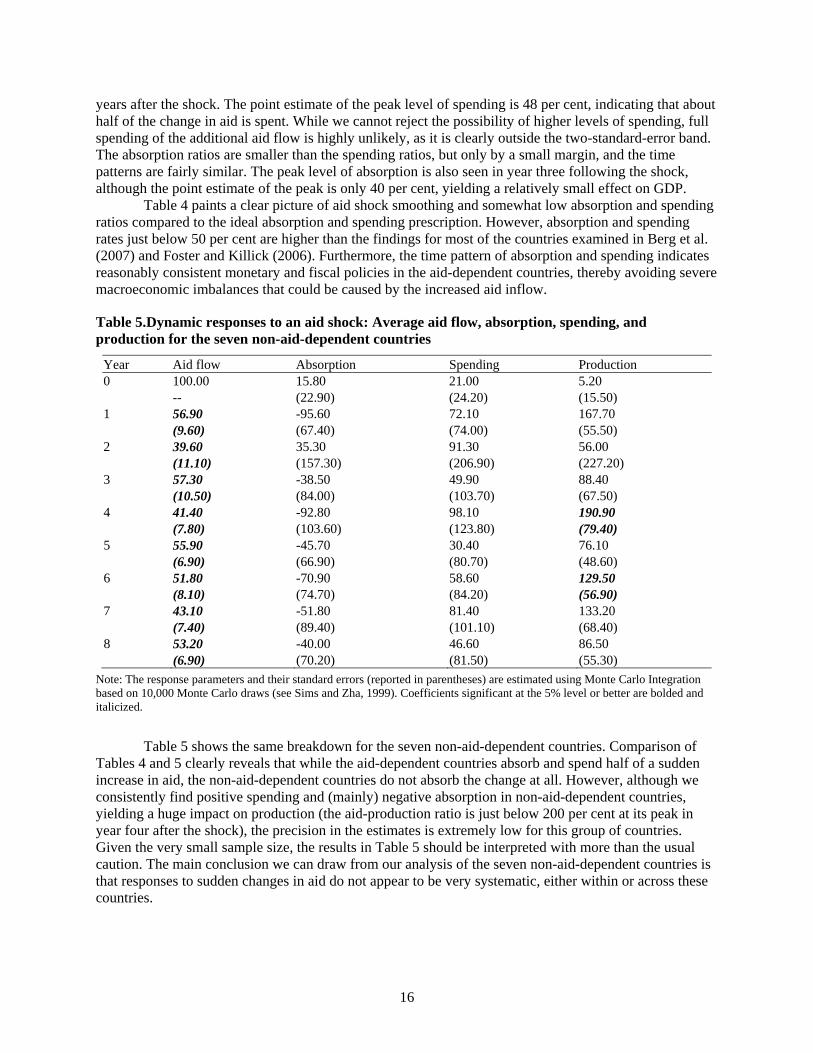
Table 5.Dynamic responses to an aid shock: Average aid flow, absorption, spending, and production for the seven non-aid-dependent countries
Year Aid flow Absorption Spending Production 0 100.00 15.80 21.00 5.20 -- (22.90) (24.20) (15.50) 1 56.90 -95.60 72.10 167.70 (9.60) (67.40) (74.00) (55.50) 2 39.60 35.30 91.30 56.00 (11.10) (157.30) (206.90) (227.20) 3 57.30 -38.50 49.90 88.40 (10.50) (84.00) (103.70) (67.50) 4 41.40 -92.80 98.10 190.90 (7.80) (103.60) (123.80) (79.40) 5 55.90 -45.70 30.40 76.10 (6.90) (66.90) (80.70) (48.60) 6 51.80 -70.90 58.60 129.50 (8.10) (74.70) (84.20) (56.90) 7 43.10 -51.80 81.40 133.20 (7.40) (89.40) (101.10) (68.40) 8 53.20 -40.00 46.60 86.50 (6.90) (70.20) (81.50) (55.30)
Note: The response parameters and their standard errors (reported in parentheses) are estimated using Monte Carlo Integration based on 10,000 Monte Carlo draws (see Sims and Zha, 1999). Coefficients significant at the 5% level or better are bolded and italicized.
Table 5 shows the same breakdown for the seven non-aid-dependent countries. Comparison of Tables 4 and 5 clearly reveals that while the aid-dependent countries absorb and spend half of a sudden increase in aid, the non-aid-dependent countries do not absorb the change at all. However, although we consistently find positive spending and (mainly) negative absorption in non-aid-dependent countries, yielding a huge impact on production (the aid-production ratio is just below 200 per cent at its peak in year four after the shock), the precision in the estimates is extremely low for this group of countries. Given the very small sample size, the results in Table 5 should be interpreted with more than the usual caution. The main conclusion we can draw from our analysis of the seven non-aid-dependent countries is that responses to sudden changes in aid do not appear to be very systematic, either within or across these countries.
17
6. CONCLUSION
We herein develop a simple vector autoregressive (VAR) model to describe the short-run macroeconomic responses to sudden aid shocks in SDCs. Using the notions of absorption and spending introduced to the aid literature by the IMF (2005; later published in a revised version as Berg et al., 2007) we describe how this idea of absorbing and spending aid can be extended to macroeconomic variables, where it describes changes in net imports and domestic demand relative to changes in aid flow. We believe that this conceptual expansion is particularly interesting because absorption and spending are then naturally related to the national income accounts identity and, hence, to GDP.
We stress the importance of allowing for a flexible dynamic structure when modeling absorption and spending, because the observed volatility of aid flows necessitates a certain degree of prudence in the absorption and spending decisions in recipient countries. This leads us to consider a VAR model as the least restrictive empirical framework. In addition, when we estimate average absorption and spending rates across a group of SDCs, we use the mean group estimator (Pesaran and Smith, 1995) to allow for country-specific heterogeneity in the VAR model parameters. We consider such a flexible parametric approach to be necessary when looking at short-run changes in macroeconomic variables across countries.
While the novelty of the present econometric analysis—as well as justified concerns over data quality—warrants considerable caution in interpretation and warns against drawing overly strong inferences, our results suggest some reasonably clear conclusions. Specifically, for aid-dependent countries, we can reject several of the proposed hypotheses. The first hypothesis was that sudden changes in aid are permanent. On the contrary, we find that aid flows to SDCs are mean reverting and, in addition, highly volatile. This reemphasizes the importance of ‘aid smoothing’ in aid-dependent countries, and allows us to be somewhat encouraged when we see that the aid-dependent countries typically appear to do this. Our second and third hypotheses were that aid flows are neither absorbed nor spent. Again, we are inclined to reject these hypotheses, because we find a reasonably strong co-movement in absorption and spending for the group of aid-dependent SDCs, which in turn implies that there is little short-run (demand-driven) impact of aid shocks on GDP (as expected). This is in contrast to the findings from the country studies reported in Berg et al. (2007) and Foster and Killick (2006), and also counters the findings of the only other econometric study of this kind that we know of (Aiyar and Ruthbah 2008). Aiyer and Ruthbah find that spending significantly exceeds absorption in both the short and long runs in a large cross-section of countries. It is unclear what can be inferred from these differences, as both the data and empirical methods differ between this prior study and the present work. However, we note that our results for the non-aid-dependent sample are much weaker than those for the aid-dependent sample, so much so that the non-aid-dependent results are more in line with the findings of Aiyar and Ruthbah (2008).
While we do not think these results are entirely surprising given the large aid inflows in aid-dependent SDCs, the results do provide encouraging information to donors. For example, when aid flows to an economy are an important source of resources, there does appear to be sufficient focus on absorbing the resource flow. In contrast, when other resource flows are more important than aid (e.g. exports of natural resources or financial services), then aid flows may be primarily used to augment foreign exchange reserves. This in turn can lead to a possible mismatch between absorption and spending, whereby large increases in aid may lead to short-run problems and macroeconomic imbalances.
Since our approach is methodologically novel, it behooves us to consider the implications of our work for future research. Such analyses could include further experiments with the econometric modeling of short-run responses. Although the VAR approach is largely atheoretical or ‘agnostic,’ we are required to impose restrictions on the causal ordering of the variables in the VAR-model without formal theoretical guidance. Arguably, the key assumption of this ordering is that changes in aid, conditional on the past, are predetermined with respect to the other variables. This assumption can be challenged. For example, in very small economies that are highly dependent on imports, donors may react to any factor that threatens the import capacity of the country (e.g., export shocks or terms of trade shocks, such as the recent surge in international food prices). There are also different ways in which one might define subsamples or average

18
across them, and future investigations in this area would do well to identify the robustness of alternative means of grouping responses. Nevertheless, the use of VAR-type models in the context of aid flows seems as though it will be a useful avenue for improving our understanding of both how aid is actually utilized in the short run, and how its utilization might be improved.
19
REFERENCES
Adam, C. 2006. Exogenous inflows and real exchange rates. In The macroeconomic management of foreign aid: Opportunities and pitfalls, P. Isard, L. Lipschitz, A. Mourmouras, and B. Yontcheva, eds. Washington, D.C.: International Monetary Fund.
Aiyar, S., A. Berg, M. Hussain, A. Mahone, and S. Roache. 2006. High aid inflows: The case of Ghana. In The macroeconomic management of foreign aid: Opportunities and pitfalls, P. Isard, L. Lipschitz, A. Mourmouras, and B. Yontcheva, eds. Washington, D.C.: International Monetary Fund.
Aiyar, S., and Ruthbah, U. 2008. Where did all the aid go? An empirical analysis of absorption and spending, IMF Working Paper 08/34. Washington, D.C.: International Monetary Fund.
Armstrong, H., R. J. de Kervenoael, X. Li, and R. Read. 1998. A comparison of the economic performance of different micro-states, and between microstates and larger countries. World Development 26 (4): 639–656.
Armstrong, H., and R. Read. 2002. The phantom of liberty? Economic growth and the vulnerability of small states, Journal of International Development 14 (4): 435–458.
Barten, A. P. 1969. Maximum likelihood estimation of a complete system of demand equations, European Economic Review, 1 (1): 7–73.
Berg, A., S. Aiyar, M. Hussain, S. Roache, T. Mirzoev, and A. Mahone. 2007. The macroeconomics of scaling up aid. Lessons from recent experience. Occasional Paper 253. Washington, D.C.: International Monetary Fund.
Bertram, G. 1993. Sustainability, aid, and material welfare in small South Pacific island economies, 1900-90, World Development 21 (2): 247–258.
Birdsall, N., S. Claessens, and I. Diwan. 2003. Policy selectivity foregone: debt and donor behavior Africa. World Bank Economic Review 17 (3): 409–435.
Briguglio, L. 1995. Small island developing states and their economic vulnerabilities, World Development 23 (9): 1615–1632.
Bulíř, A., and A.J. Hamann. 2003. Aid volatility: an empirical assessment. IMF Staff Papers 50 (1): 64–89. Washington, D.C.: International Monetary Fund.
Bulíř, A., and A.J. Hamann. 2008. Volatility of development aid: From the frying pan into the fire? World Development 36 (10): 2048–2066.
Easterly, W., and A. Kraay. 2000. Small states, small problems? Income, growth and volatility in small states, World Development 28 (11): 2013–2027.
Feeny, S. 2007. Impacts of foreign aid to Melanesia. Journal of the Asia Pacific Economy 12 (1): 34–60.
Foster, M., and T. Killick. 2006. What would doubling aid do for macroeconomic management in Africa? ODI Working Paper 264. London: Overseas Development Institute.
Greene, W. H. 2003. Econometric Analysis. 5th Edition. New Jersey: Pearson Education, Inc., Prentice Hall.
Heller, P., and S. Gupta. 2002. Challenges in expanding development assistance. IMF Policy Discussion Paper PDP/02/5. Washington, D.C.: International Monetary Fund.
Hsiao, C., M.H. Pesaran, and A,.K. Tahmiscioglu. 1999. Bayes estimation of short-run coefficients in dynamic panel data models. In Analysis of panels and limited dependent variable models, C. Hsiao, K. Lahiri, L.-F. Lee and M. H. Pesaran, eds. Cambridge: Cambridge University Press.
IMF 2005. The macroeconomics of managing increased aid inflows: Experiences of low-income countries and policy implications, IMF Policy Development and Review Department (In consultation with the Area, Fiscal, Monetary and Financial Systems, and Research Departments). Washington, D.C.: International Monetary Fund.
20
IMF 2004. The IMF and aid to Sub-Saharan Africa, Evaluation Report, Independent Evaluation Office of the IMF, Washington, D.C.: International Monetary Fund.
Killick, T., and M. Foster. 2007. The macroeconomics of doubling aid to Africa and the centrality of the supply side. Development Policy Review, 25 (2): 167–192.
Kose, M. A., and E.S. Prasad. 2002. Thinking big: how can small states hold their own in an increasingly globalized economy? Finance and Development 39 (4).
McGillivray, M., and O. Morrissey. 2004. Fiscal effects of aid. In Fiscal policy for development: poverty, reconstruction and growth, T. Addison, and A. Roe, eds. New York: Palgrave Macmillan.
Milner, C., and T. Westaway. 1993. Country size and the medium term growth process: some country size evidence, World Development, 21 (2): 203–212.
Osei, R., O. Morrissey, and T. Lloyd. 2005. The fiscal effects of aid in Ghana. Journal of International Development 17 (8):1037–1053.
Pallage, S., and M. Robe. 2001. Foreign aid and the business cycle, Review of International Economic, 9 (4): 641–672.
Pesaran, M. H., and R. Smith. 1995. Estimating long-run relationships from dynamic heterogeneous panels. Journal of Econometrics 68 (11): 79–113.
Sims, C. A., and T. Zha. 1999. Error bands for impulse responses. Econometrica 67 (5):1113–1156.
Streeten, P. 1993. The special problems of small countries. World Development, 21 (2): 197–2002.
RECENT IFPRI DISCUSSION PAPERS
For earlier discussion papers, please go to www.ifpri.org/pubs/pubs.htm#dp. All discussion papers can be downloaded free of charge.
862. European Union preferential trade agreements with developing countries and their impact on Colombian and Kenyan carnation exports to the United Kingdom. Guyslain K. Ngeleza and Andrew Muhammad, 2009
861. The linkages between agriculture and malaria: Issues for policy, research, and capacity strengthening. Kwadwo Asenso-Okyere, Felix A. Asante, Jifar Tarekegn, andKwaw S. Andam, 2009.
860. La biotecnología agropecuaria en América Latina: Una visión cuantitativa. José Falck-Zepeda, César Falcón, Maria José Sampaio-Amstalden, José Luis Solleiro Rebolledo, Eduardo Trigo, and Javier Verástegui, 2009.
859. Preferential trade agreements between the monetary community of Central Africa and the European Union: Stumbling or building blocks? A general equilibrium approach. Guyslain K. Ngeleza and Andrew Muhammad, 2009.
858. Preliminary evidence on internal migration, remittances, and teen schooling in India. Valerie Mueller and Abusaleh Shariff, 2009.
857. Productivity convergence in Brazil: The case of grain production. Eduardo Magalhaes and Xinshen Diao, 2009.
856. Dynamics of structural transformation: An empirical characterization in the case of China, Malaysia, and Ghana. Thaddee Badibanga, Xinshen Diao, Terry Roe, and Agapi Somwaru, 2009.
855. Do institutions limit clientelism? A study of the district assemblies common fund in Ghana. Afua Branoah Banful, 2009.
854. The evolution of Chinese entrepreneurial firms: Township-village enterprises revisited. Chenggang Xu and Xiaobo Zhang, 2009.
853. Evaluating the impact of land tenure and titling on access to credit in Uganda. Carly K. Petracco and John Pender, 2009.
852. Participation by Men and Women in Off-Farm Activities: An Empirical Analysis in Rural Northern Ghana. Nancy McCarthy and Yan Sun, 2009.
851. Measuring agricultural innovation system properties and performance: Illustrations from Ethiopia and Vietnam. David J. Spielman and Dawit Kelemework, 2009.
850. Are returns to mothers’ human capital realized in the next generation?: The impact of mothers’ intellectual human capital and long-run nutritional status on children’s human capital in Guatemala. Jere R. Behrman, Alexis Murphy, Agnes R. Quisumbing, and Kathryn Yount, 2009.
849. Understanding Farmers' Perceptions and Adaptations to Climate Change and Variability: The Case of the Limpopo Basin, South Africa. Glwadys Aymone Gbetibouo, 2009.
848. Agglomeration, migration, and regional growth: A CGE analysis for Uganda. Paul Dorosh and James Thurlow, 2009.
847. Biosafety decisions and perceived commercial risks: The role of GM-free private standards. Guillaume Gruère and Debdatta Sengupta, 2009.
846. Impact of soaring food price in Ethiopia: does location matter? John M. Ulimwenju, Sindu Workneh, and Zelekawork Paulos, 2009.
845. Aggregate effects of imperfect tax enforcement. Miguel Robles, 2009.
844. Agricultural strategy development in West Africa: The false promise of participation? Danielle Resnick and Regina Birner, 2008.
843. Climate variability and maize yield in South Africa: Results from GME and MELE methods. Wisdom Akpalu, Rashid M. Hassan, and Claudia Ringler, 2008.
842. Local impacts of a global crisis: Food price transmission and poverty impacts in Ghana. Godsway Cudjoe, Clemens Breisinger, and Xinshen Diao, 2008.
841. Technology transfer, policies, and the role of the private sector in the global poultry revolution. Clare A. Narrod, Carl E. Pray, and Marites Tiongco, 2008.
840. The impact of agricultural extension and roads on poverty and consumption growth in fifteen Ethiopian villages. Stefan Dercon, Daniel O. Gilligan, John Hoddinott, and Tassew Woldehanna, , 2008.
INTERNATIONAL FOOD POLICY RESEARCH INSTITUTE
www.ifpri.org
IFPRI HEADQUARTERS
2033 K Street, NW Washington, DC 20006-1002 USA Tel.: +1-202-862-5600 Fax: +1-202-467-4439 Email: [email protected]
IFPRI ADDIS ABABA
P. O. Box 5689 Addis Ababa, Ethiopia Tel.: +251 11 6463215 Fax: +251 11 6462927 Email: [email protected]
IFPRI NEW DELHI
CG Block, NASC Complex, PUSA New Delhi 110-012 India Tel.: 91 11 2584-6565 Fax: 91 11 2584-8008 / 2584-6572 Email: [email protected]


