Embed Size (px)
Citation preview
Handbook of Star Forming Regions Vol. IAstronomical Society of the Pacific, 2008Bo Reipurth, ed.
The σ Orionis Cluster
Frederick M. WalterStony Brook UniversityStony Brook, NY 11794-3800, USA
William H. Sherry
National Solar ObservatoryTucson AZ, USA
Scott J. Wolk & Nancy R. Adams
Center for AstrophysicsCambridge MA 02139, USA
Abstract. Theσ Orionis cluster is the group of stars surrounding the high massσ Oristellar system. It is kinematically distinct from the OrionOB1a and OB1b associations,against which it is projected. The cluster could contain up to ∼700 stars and substellarmass objects, with a total mass of about 225 M⊙ within a radius of about 30 arcmin.The age is 2–3 million years. The distance, from main sequence fitting corrected for thesub-solar metallicity, is 420±30 pc. The mass function is similar to the field star massfunction, and has been traced well into the planetary mass regime. The disk fraction isnormal for its age. The cluster appears to be an older and lessmassive analog of theOrion Nebula Cluster.
1. Introduction
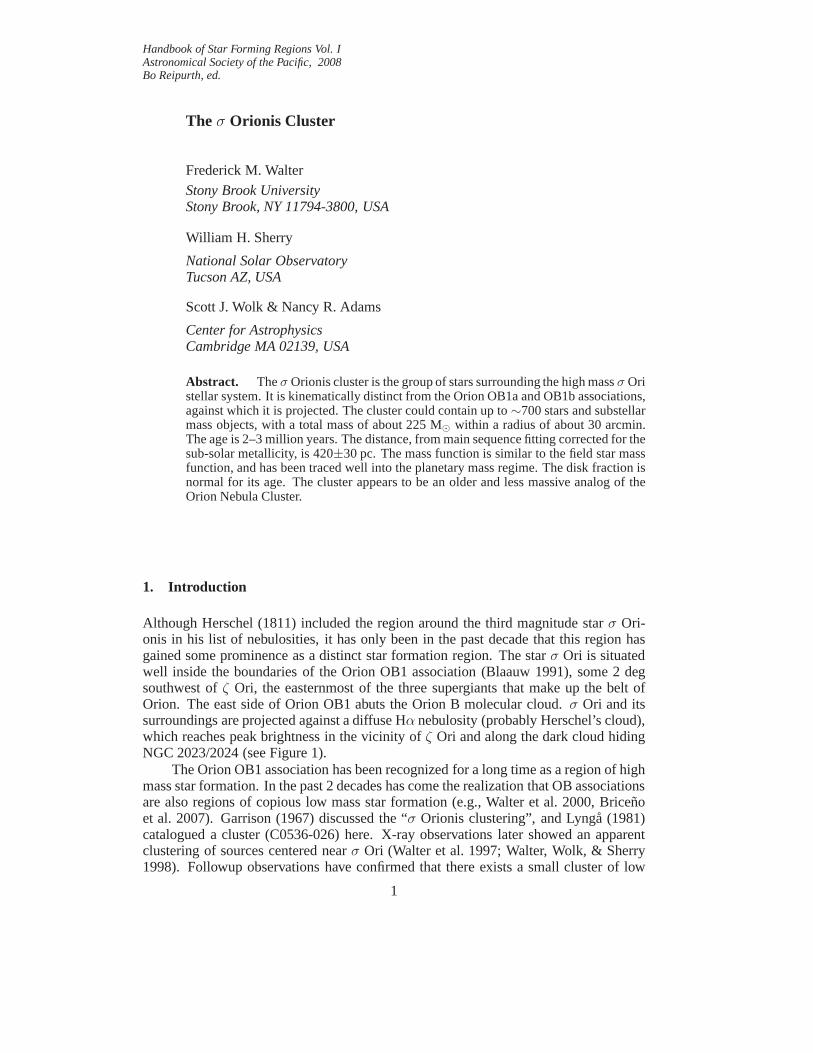
Although Herschel (1811) included the region around the third magnitude starσ Ori-onis in his list of nebulosities, it has only been in the past decade that this region hasgained some prominence as a distinct star formation region.The starσ Ori is situatedwell inside the boundaries of the Orion OB1 association (Blaauw 1991), some 2 degsouthwest ofζ Ori, the easternmost of the three supergiants that make up the belt ofOrion. The east side of Orion OB1 abuts the Orion B molecular cloud. σ Ori and itssurroundings are projected against a diffuse Hα nebulosity (probably Herschel’s cloud),which reaches peak brightness in the vicinity ofζ Ori and along the dark cloud hidingNGC 2023/2024 (see Figure 1).
The Orion OB1 association has been recognized for a long timeas a region of highmass star formation. In the past 2 decades has come the realization that OB associationsare also regions of copious low mass star formation (e.g., Walter et al. 2000, Bricenoet al. 2007). Garrison (1967) discussed the “σ Orionis clustering”, and Lynga (1981)catalogued a cluster (C0536-026) here. X-ray observationslater showed an apparentclustering of sources centered nearσ Ori (Walter et al. 1997; Walter, Wolk, & Sherry1998). Followup observations have confirmed that there exists a small cluster of low
1
2 Walter et al.
Figure 1. The region surroundingσ Ori. North is up, east is to the left. Theother bright stars areζ Ori to the upper left andǫ Ori (upper right). The red isdiffuse Hα emission. The Horsehead is visible east ofσ Ori, while the Flame Nebula(NGC 2024) is east ofζ Ori. Courtesy Robert Gendler.
mass stars associated withσ Ori, embedded within or projected against the larger OBassociation. This we have called theσ Ori cluster.
Our aim here is to present an overview, focussing on the important characteristicsof the cluster, With a few exceptions, we do not comment on theproperties of individualstars. We do not supply a list of members, aside from the brightest stars.
σ Ori 3
2. Overview of Fossil Star Formation in Orion OB1
Orion OB1 (Blaauw 1964, 1991) is a well studied nearby example of an OB association.OB associations (Ambartsumian 1947) are young, gravitationally unbound groups ofstars defined by a population of high mass stars. Associations are often large on thesky; the stellar densities are not sufficient to gravitationally bind these associationsagainst galactic tides (Bok 1934). OB associations are onlyrecognizable for a fewtens of millions of years, until the highest mass stars burn out and the fainter stars areabsorbed into the field.
Ambartsumian recognized that the O and B stars were short-lived, and could nothave moved far from their birthplaces in a few million years,so such a grouping ofhigh mass stars must mark a region of recent star formation. Active star formation,manifested by embedded infrared sources, active accretion, and prominent circumstel-lar disks, generally occurs only over a period of a few million years; older associationsare generally no longer forming stars. These older OB associations are fossil star form-ing regions. They retain most of the end-products of the starformation process. Theaccretion process is complete (except perhaps for the lowest mass objects): all starshave attained their ultimate masses. The gas and dust of the stellar nursery has dissi-pated, blown away by the hot star winds or supernova shocks, revealing all members,even at short wavelengths.
The Orion OB1 association covers an enormous extent on the sky, most promi-nently in the belt of Orion and the Orion Nebula. The association has been divided intofour sub-associations (Blaauw 1964). Within the association we see a wide range ofconditions, from fossil regions (Ori OB1a) to regions of active on-going star formation(Orion OB1d - the Orion Nebula Cluster). The association hasbeen discussed, and itscomponents defined, by Blaauw (1964, 1991), Warren & Hesser (1977a, 1977b, 1978),Brown et al. (1994), and de Zeeuw et al. (1999).
3. The Massive Stars
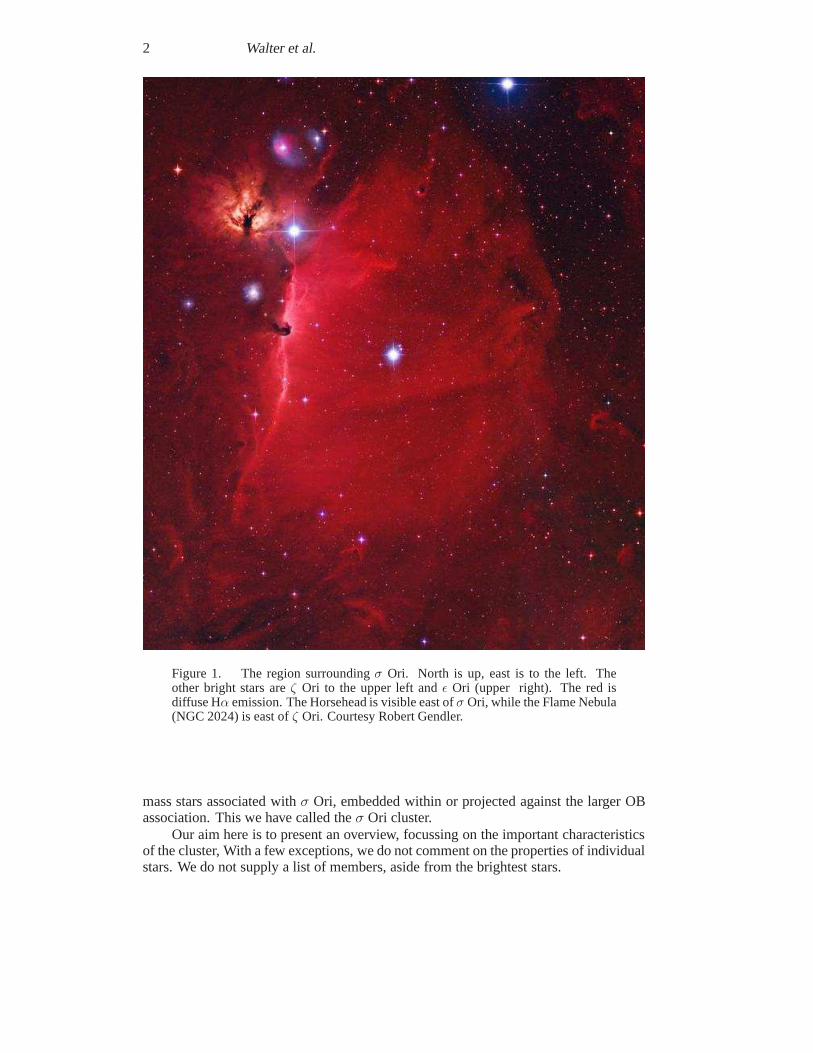
The trapezium systemσ Ori (Figure 2) is considered a member of the Orion OB1bsubassociation. The A and B components form a 0.25 arcsec visual binary (ADS 4241;BU 1032 AB). The orbit (Heintz 1997) has been refined using speckle observations(Hartkopf et al. 1996); the period is 155 years. Frost & Adams(1904) suspectedσ Ori(presumably AB) of having a variable radial velocity . The A component is a double-lined spectroscopic binary (Bolton 1974) with about a 140 day period and a highlyeccentric orbit (Peterson et al. 2008). The Aa component is about 0.5 mag brighter thanAb. The C, D, and E components share a common proper motion with σ Ori AB, andare likely physical companions.σ Ori E (V1030 Ori) is a magnetic B star (Greenstein& Wallerstein 1958; Landstreet & Borra 1978).
It is σ Ori, notζ Ori, that illuminates the Horsehead nebula (Reipurth & Bouchet1984). Abergel et al. (2003) concluded, based on ISOCAM observations, that the rimof the Horsehead is a photodissociation region illuminatededge-on, and thatσ Ori andthe Horsehead must be about the same distance from Earth. Based on its extinction,and the Hipparcos parallaxes,ζ Ori appears to be in the foreground.
In all, there are 19 stars withV <11 mag within 30 arcmin ofσ Ori AB (Table 1).Based on positions in the color-magnitude diagram, 15 of these appear to be membersof the cluster, and two others are possible members (Sherry et al. 2008). Figure 3 shows
4 Walter et al.
Figure 2. The center of theσ Ori cluster in theV (left) andI (right) bands. Northis up, east is to the left. The components are labelled in theV band image.σ Ori ABis saturated and bleeds in the N-S direction. The images are reconstructed from aboutthree thousand 0.2 sec integrations taken with the SMARTS/CTIO 0.9m reflector,shifted and added to improve spatial resolution. Each field covers about 5 arcminon a side. The scaling is logarithmic. Caballero (2005) shows a similar figure in theJ + H band.
that the members define a narrow zero-age main sequence (ZAMS). Stars with spectraltypes later than about A0 lie above the ZAMS. Caballero (2007a) examined the 41stars in common between the Tycho-2 and 2MASS catalogs that lie within 30 arcmin ofσ Ori AB. He found 26 likely members and 4 candidate members in 23 stellar systemswith masses>1.2 M⊙. For the cooler stars in the sample, Caballero based membershipcriteria on indicators of youth, including strong X-ray emission, near-IR excesses, Hαemission, and Li absorption.
4. The Distance to the σ Orionis Cluster
The Hipparcos parallax ofσ Ori is 2.84±0.91 mas (Perryman et al. 1997). Conse-quently, many authors adopt the 352 pc best distance toσ Ori as the distance to thecluster. This is not a well-determined distance: this parallax placesσ Ori between260 pc and 520 pc from the Sun at 68% confidence. Caballero (2008b) derived a dy-namical distance forσ Ori AB of 334+25
−22 pc, assuming the stars are single (see Sect. 3.)and the age is 3 Myr.
If σ Ori is a member of the Ori OB1b association, one can use the better-constraineddistance to the association as an estimate of the distance toσ Ori and its cluster. DeZeeuw et al. (1999) used the Hipparcos parallaxes to determine a mean distance of473±33 pc for the OB1b association. The authors noted that the actual uncertaintyis larger than the formal uncertainty of 33 pc because they had to use a simplifiedmembership selection due to the small proper motions of association members. This
σ Ori 5
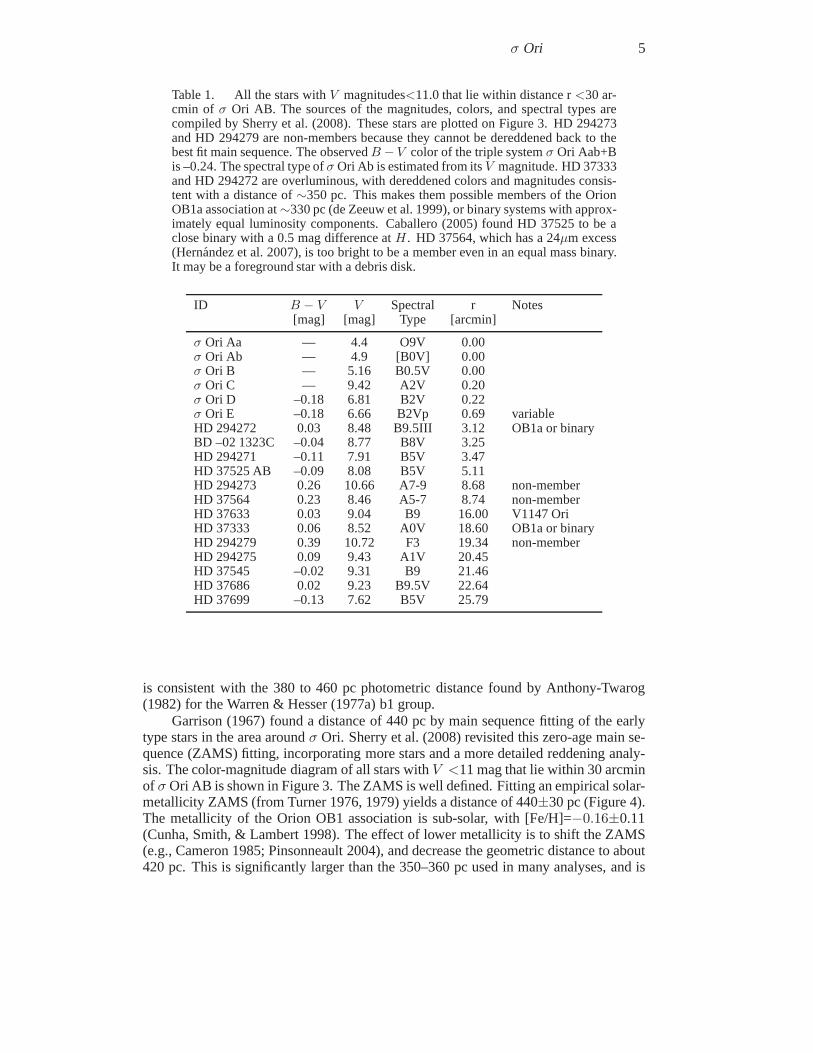
Table 1. All the stars withV magnitudes<11.0 that lie within distance r<30 ar-cmin of σ Ori AB. The sources of the magnitudes, colors, and spectral types arecompiled by Sherry et al. (2008). These stars are plotted on Figure 3. HD 294273and HD 294279 are non-members because they cannot be dereddened back to thebest fit main sequence. The observedB − V color of the triple systemσ Ori Aab+Bis –0.24. The spectral type ofσ Ori Ab is estimated from itsV magnitude. HD 37333and HD 294272 are overluminous, with dereddened colors and magnitudes consis-tent with a distance of∼350 pc. This makes them possible members of the OrionOB1a association at∼330 pc (de Zeeuw et al. 1999), or binary systems with approx-imately equal luminosity components. Caballero (2005) found HD 37525 to be aclose binary with a 0.5 mag difference atH . HD 37564, which has a 24µm excess(Hernandez et al. 2007), is too bright to be a member even in an equal mass binary.It may be a foreground star with a debris disk.
ID B − V V Spectral r Notes[mag] [mag] Type [arcmin]
σ Ori Aa — 4.4 O9V 0.00σ Ori Ab — 4.9 [B0V] 0.00σ Ori B — 5.16 B0.5V 0.00σ Ori C — 9.42 A2V 0.20σ Ori D –0.18 6.81 B2V 0.22σ Ori E –0.18 6.66 B2Vp 0.69 variableHD 294272 0.03 8.48 B9.5III 3.12 OB1a or binaryBD –02 1323C –0.04 8.77 B8V 3.25HD 294271 –0.11 7.91 B5V 3.47HD 37525 AB –0.09 8.08 B5V 5.11HD 294273 0.26 10.66 A7-9 8.68 non-memberHD 37564 0.23 8.46 A5-7 8.74 non-memberHD 37633 0.03 9.04 B9 16.00 V1147 OriHD 37333 0.06 8.52 A0V 18.60 OB1a or binaryHD 294279 0.39 10.72 F3 19.34 non-memberHD 294275 0.09 9.43 A1V 20.45HD 37545 –0.02 9.31 B9 21.46HD 37686 0.02 9.23 B9.5V 22.64HD 37699 –0.13 7.62 B5V 25.79
is consistent with the 380 to 460 pc photometric distance found by Anthony-Twarog(1982) for the Warren & Hesser (1977a) b1 group.
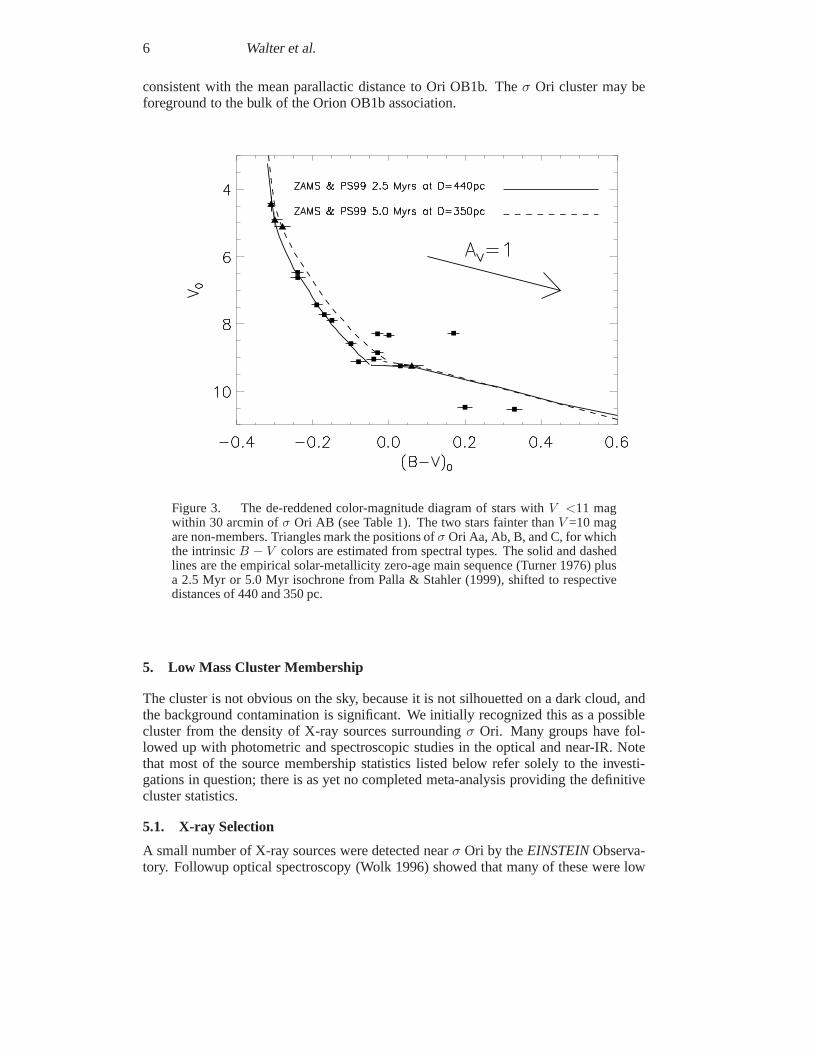
Garrison (1967) found a distance of 440 pc by main sequence fitting of the earlytype stars in the area aroundσ Ori. Sherry et al. (2008) revisited this zero-age main se-quence (ZAMS) fitting, incorporating more stars and a more detailed reddening analy-sis. The color-magnitude diagram of all stars withV <11 mag that lie within 30 arcminof σ Ori AB is shown in Figure 3. The ZAMS is well defined. Fitting anempirical solar-metallicity ZAMS (from Turner 1976, 1979) yields a distanceof 440±30 pc (Figure 4).The metallicity of the Orion OB1 association is sub-solar, with [Fe/H]=−0.16±0.11(Cunha, Smith, & Lambert 1998). The effect of lower metallicity is to shift the ZAMS(e.g., Cameron 1985; Pinsonneault 2004), and decrease the geometric distance to about420 pc. This is significantly larger than the 350–360 pc used in many analyses, and is
6 Walter et al.
consistent with the mean parallactic distance to Ori OB1b. Theσ Ori cluster may beforeground to the bulk of the Orion OB1b association.
Figure 3. The de-reddened color-magnitude diagram of starswith V <11 magwithin 30 arcmin ofσ Ori AB (see Table 1). The two stars fainter thanV =10 magare non-members. Triangles mark the positions ofσ Ori Aa, Ab, B, and C, for whichthe intrinsicB − V colors are estimated from spectral types. The solid and dashedlines are the empirical solar-metallicity zero-age main sequence (Turner 1976) plusa 2.5 Myr or 5.0 Myr isochrone from Palla & Stahler (1999), shifted to respectivedistances of 440 and 350 pc.
5. Low Mass Cluster Membership
The cluster is not obvious on the sky, because it is not silhouetted on a dark cloud, andthe background contamination is significant. We initially recognized this as a possiblecluster from the density of X-ray sources surroundingσ Ori. Many groups have fol-lowed up with photometric and spectroscopic studies in the optical and near-IR. Notethat most of the source membership statistics listed below refer solely to the investi-gations in question; there is as yet no completed meta-analysis providing the definitivecluster statistics.
5.1. X-ray Selection
A small number of X-ray sources were detected nearσ Ori by theEINSTEINObserva-tory. Followup optical spectroscopy (Wolk 1996) showed that many of these were low
σ Ori 7
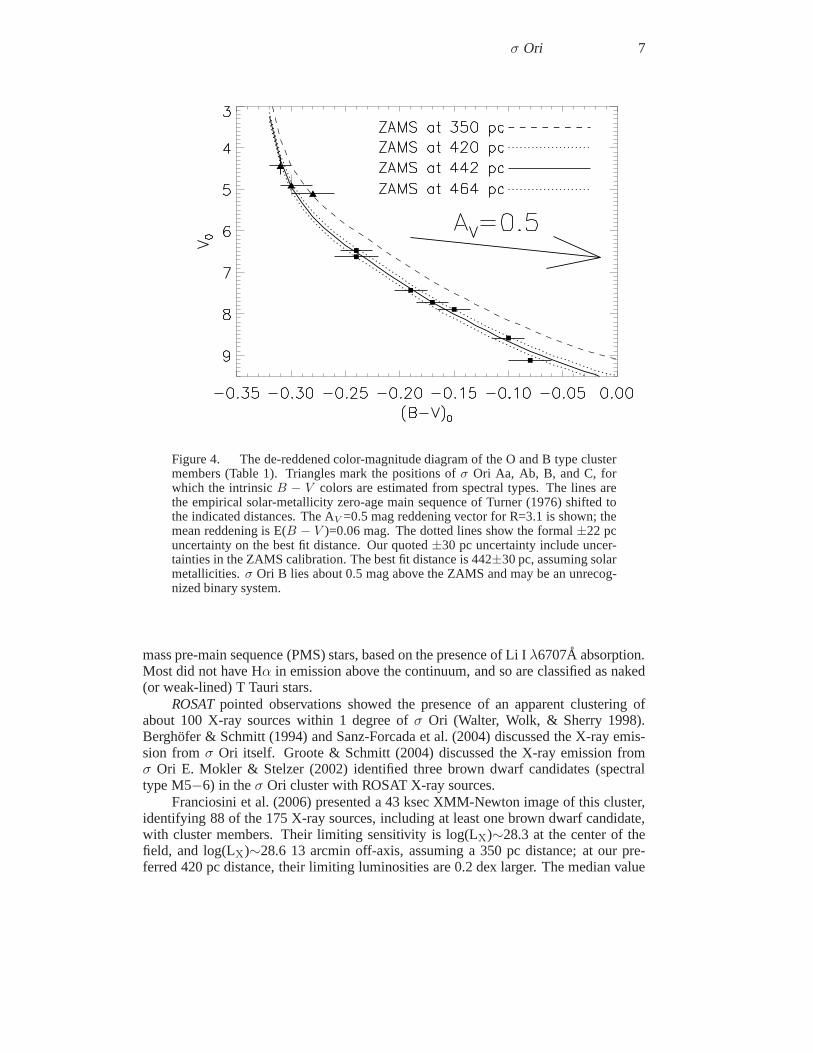
Figure 4. The de-reddened color-magnitude diagram of the O and B type clustermembers (Table 1). Triangles mark the positions ofσ Ori Aa, Ab, B, and C, forwhich the intrinsicB − V colors are estimated from spectral types. The lines arethe empirical solar-metallicity zero-age main sequence ofTurner (1976) shifted tothe indicated distances. The AV =0.5 mag reddening vector for R=3.1 is shown; themean reddening is E(B − V )=0.06 mag. The dotted lines show the formal±22 pcuncertainty on the best fit distance. Our quoted±30 pc uncertainty include uncer-tainties in the ZAMS calibration. The best fit distance is 442±30 pc, assuming solarmetallicities.σ Ori B lies about 0.5 mag above the ZAMS and may be an unrecog-nized binary system.
mass pre-main sequence (PMS) stars, based on the presence ofLi I λ6707A absorption.Most did not have Hα in emission above the continuum, and so are classified as naked(or weak-lined) T Tauri stars.
ROSATpointed observations showed the presence of an apparent clustering ofabout 100 X-ray sources within 1 degree ofσ Ori (Walter, Wolk, & Sherry 1998).Berghofer & Schmitt (1994) and Sanz-Forcada et al. (2004) discussed the X-ray emis-sion fromσ Ori itself. Groote & Schmitt (2004) discussed the X-ray emission fromσ Ori E. Mokler & Stelzer (2002) identified three brown dwarf candidates (spectraltype M5−6) in theσ Ori cluster with ROSAT X-ray sources.
Franciosini et al. (2006) presented a 43 ksec XMM-Newton image of this cluster,identifying 88 of the 175 X-ray sources, including at least one brown dwarf candidate,with cluster members. Their limiting sensitivity is log(LX)∼28.3 at the center of thefield, and log(LX)∼28.6 13 arcmin off-axis, assuming a 350 pc distance; at our pre-ferred 420 pc distance, their limiting luminosities are 0.2dex larger. The median value
8 Walter et al.
of log( LX
Lbol
) of –3.3 is near the saturation limit for cool star coronae, and is higher thanseen in other young clusters, such as the ONC. They attributed this to an increase inlog( LX
Lbol
) with age to about 4 Myr, where it saturates (Flaccomio et al.2003). They ob-served half the PMS stars to be significantly variable in X-rays during this observation.
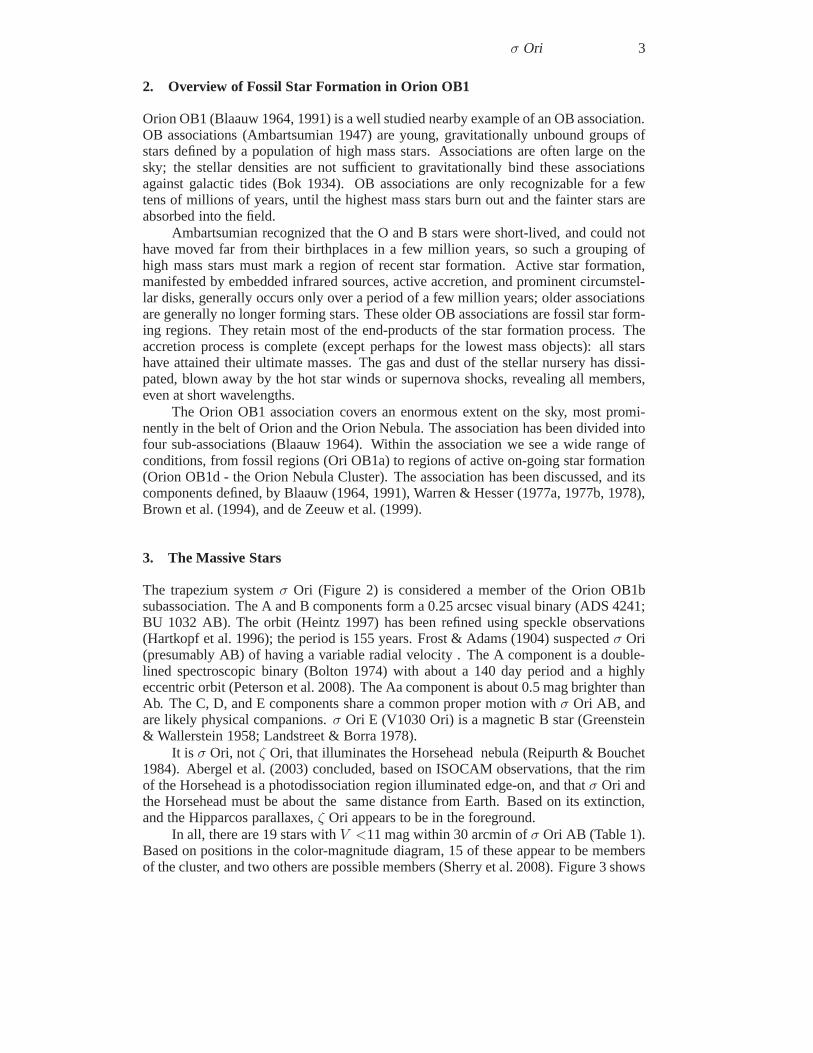
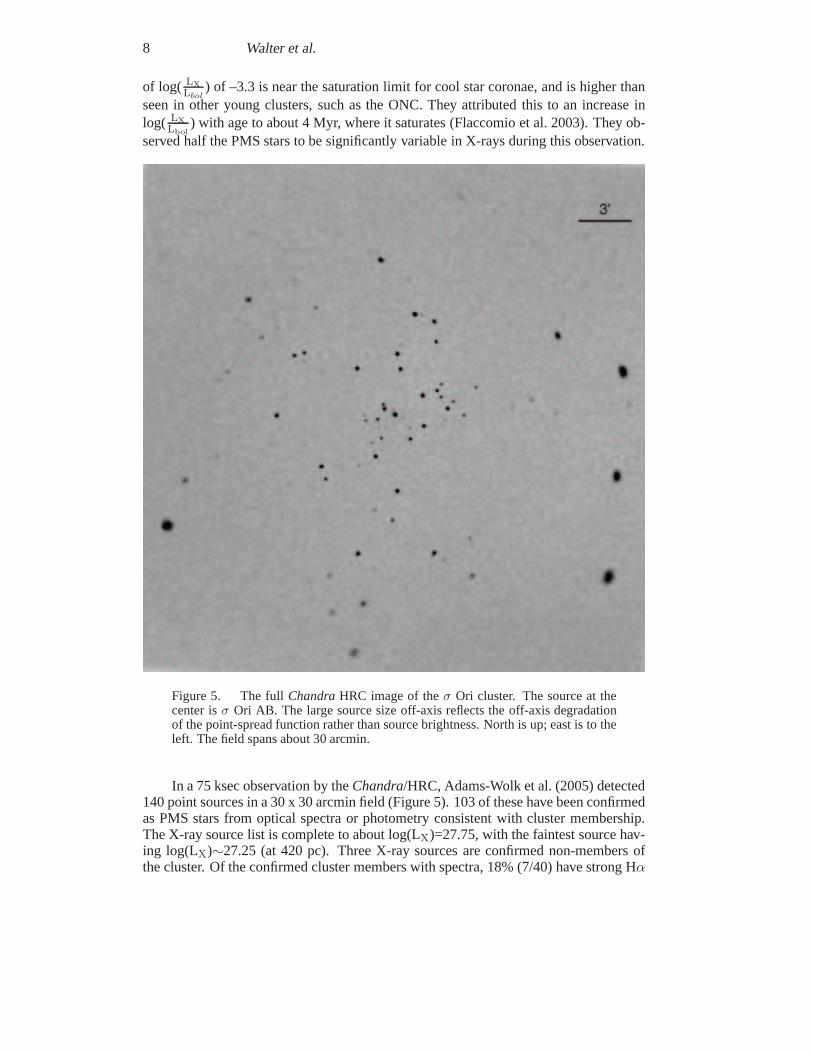
Figure 5. The fullChandraHRC image of theσ Ori cluster. The source at thecenter isσ Ori AB. The large source size off-axis reflects the off-axis degradationof the point-spread function rather than source brightness. North is up; east is to theleft. The field spans about 30 arcmin.
In a 75 ksec observation by theChandra/HRC, Adams-Wolk et al. (2005) detected140 point sources in a 30 x 30 arcmin field (Figure 5). 103 of these have been confirmedas PMS stars from optical spectra or photometry consistent with cluster membership.The X-ray source list is complete to about log(LX)=27.75, with the faintest source hav-ing log(LX)∼27.25 (at 420 pc). Three X-ray sources are confirmed non-members ofthe cluster. Of the confirmed cluster members with spectra, 18% (7/40) have strong Hα
σ Ori 9
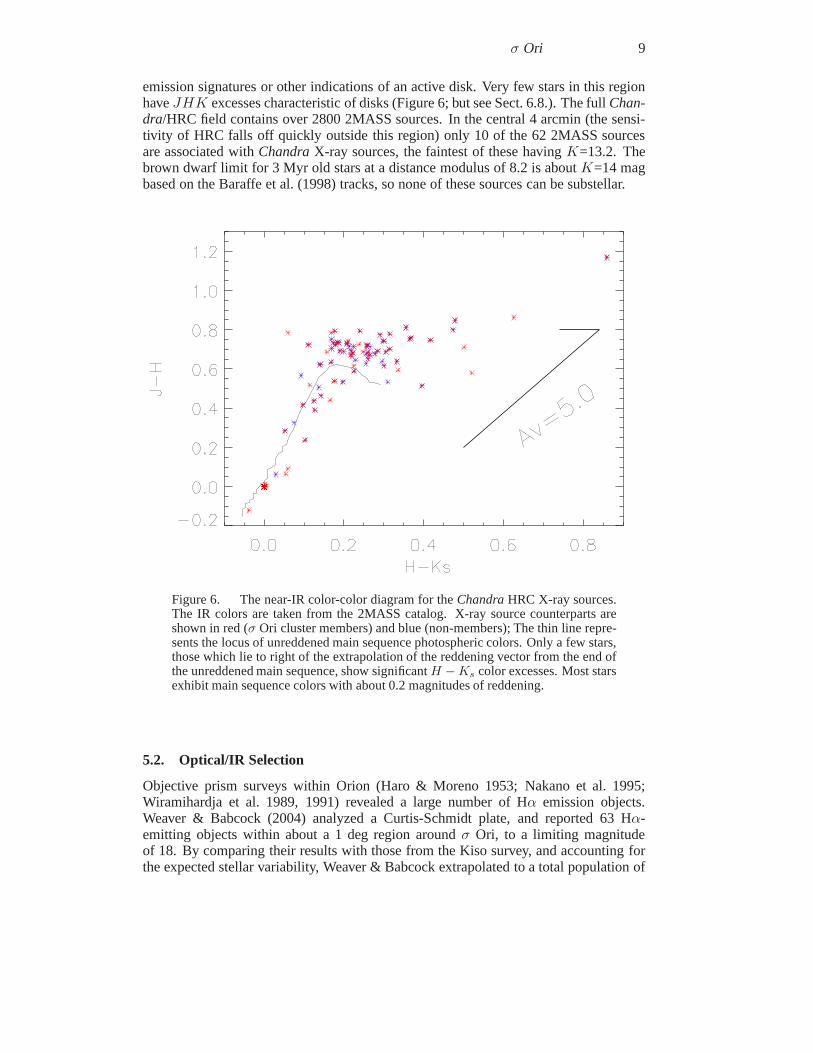
emission signatures or other indications of an active disk.Very few stars in this regionhaveJHK excesses characteristic of disks (Figure 6; but see Sect. 6.8.). The fullChan-dra/HRC field contains over 2800 2MASS sources. In the central 4 arcmin (the sensi-tivity of HRC falls off quickly outside this region) only 10 of the 62 2MASS sourcesare associated withChandraX-ray sources, the faintest of these havingK=13.2. Thebrown dwarf limit for 3 Myr old stars at a distance modulus of 8.2 is aboutK=14 magbased on the Baraffe et al. (1998) tracks, so none of these sources can be substellar.
Figure 6. The near-IR color-color diagram for theChandraHRC X-ray sources.The IR colors are taken from the 2MASS catalog. X-ray source counterparts areshown in red (σ Ori cluster members) and blue (non-members); The thin line repre-sents the locus of unreddened main sequence photospheric colors. Only a few stars,those which lie to right of the extrapolation of the reddening vector from the end ofthe unreddened main sequence, show significantH − Ks color excesses. Most starsexhibit main sequence colors with about 0.2 magnitudes of reddening.
5.2. Optical/IR Selection
Objective prism surveys within Orion (Haro & Moreno 1953; Nakano et al. 1995;Wiramihardja et al. 1989, 1991) revealed a large number of Hα emission objects.Weaver & Babcock (2004) analyzed a Curtis-Schmidt plate, and reported 63 Hα-emitting objects within about a 1 deg region aroundσ Ori, to a limiting magnitudeof 18. By comparing their results with those from the Kiso survey, and accounting forthe expected stellar variability, Weaver & Babcock extrapolated to a total population of
10 Walter et al.
about 250 Hα-emitting objects, with unreddenedV ≤16.5, corresponding to spectraltypes of dM0 and earlier in this region, or a mean space density of 0.86 pc−3.
Many low mass PMS stars, especially those earlier than K0–K5, tend not to emitHα above the continuum. We obtained optical spectra of many of the counterparts ofthe EINSTEINandROSATX-ray sources (Wolk 1994; Walter et al. 1998). Of these,there are 82 likely low mass PMS stars within 30 arcmin ofσ Ori. Twenty eight other,non-X-ray-selected stars, were also found to be low mass PMSstars.
Walter et al. (1998) obtained spectra of 258 stars selected from the HST GuideStar catalog within 30 arcmin ofσ Ori and withV <15 mag. Of these, 22% are PMSstars (spectral types G and K). If the Guide Star Catalog is complete toV =15 magin this region, this suggests a space density of 120 PMS starsper deg2 in the range10< V <15 within 30 arcmin ofσ Ori, and a total population of about 90 low massstars in this magnitude range.
Sherry et al. (2004) surveyed a 0.89 deg2 region aroundσ Ori photometrically inV RCIC . They usedV magnitudes andV −IC colors to estimate membership probabil-ities for stars with 15≤V≤19 (Figure 7). Membership probabilities were calculated byfitting the number of stars in bins along a number of cross-sections through the color-magnitude diagram with the sum of a Maxwellian-like distribution of field stars and aGaussian distribution of cluster members as a function ofV − IC color. This allowedthe authors to estimate both the number of cluster members and the number of fieldstars at each point along the cluster locus.
Kenyon et al. (2005) obtained spectra of 76 photometrically-selected low masscandidates (54 of which are not included in the Sherry et al. sample). They found thatover 2/3, and perhaps as many as 90%, are clearly PMS members of the cluster.
Figure 8 shows the spatial distribution of the known low mass(spectral types Gand later) members of the cluster. It includes all the stars for which Sherry et al. (2004)estimated membership probabilities in excess of 80%, as well as the stars from Kenyonet al. (2005) that are not clear non-members. It also includes spectroscopic PMS stars(Walter et al. 1998) within 40 arcmin ofσ Ori. It does not include the fainter objectsfrom Bejar et al. (2004a; 2004b) or Caballero et al. (2007).
Hernandez et al. (2007) surveyed the area with theSpitzerSpace Telescope. Us-ing the IRAC colors (primarily to exclude galaxies) and 2MASS andV -band mag-nitudes, they identified 1280 point sources. The sample is “essentially complete” toJ=14.0 mag, which corresponds to 0.15 M⊙ at a distance of 440 pc and a 3 Myr age.Of these stars, they considered 336 to be members based on location in theV vs.V −JandJ vs. J − K color-magnitude diagrams and ancillary information (X-rays, vari-ability, optical spectroscopy). Membership of another 133color-selected stars (mostlywith 13< J <14 mag) is considered uncertain because of heavy contamination and alack of ancillary information.
5.3. Contamination by Field Stars
Photometric selection of cluster members is efficient for the σ Ori cluster because thecluster locus is distinct from the bulk of the field stars along our line of sight. Yet thereare field stars that lie on the cluster locus on the color-magnitude diagram. This makesit impossible to unambiguously classify any individual star as a cluster member basedupon single-epoch photometry alone. Sherry (2003) indicated that the contamination is∼20% (from his Figure 6.6). Sherry et al. (2004) concluded that the field star contami-nation in their photometrically selected sample of likely cluster members (13< V <20)
σ Ori 11
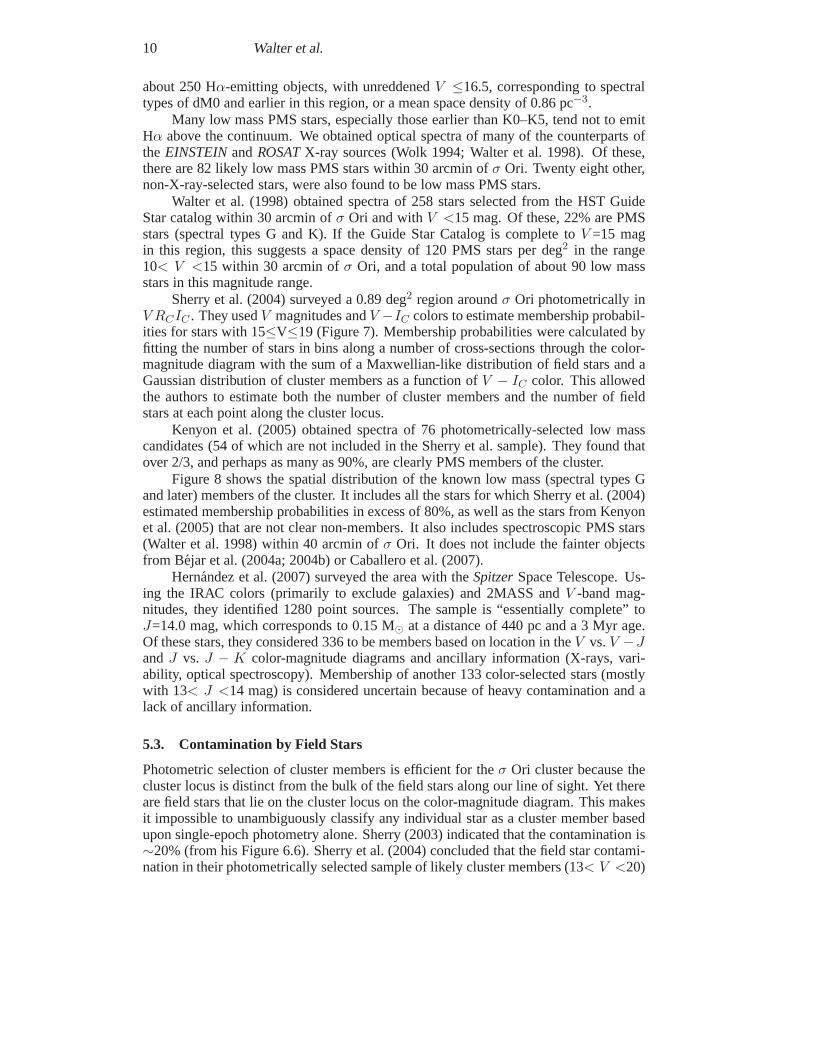
Figure 7. The left panel shows theV vs.V −IC color-magnitude diagram of 9556stars in 0.89 deg2 aroundσ Ori. The solid line is a 2.5 Myr isochrone (Baraffe etal. 1998; Baraffe et al. 2001) at a distance of 440 pc (de Zeeuwet al. 1999). Thisisochrone marks the expected position of the PMS locus for Orion OB1b. Thereis a clear increase in the density of stars around the expected position of the PMSlocus. The completeness limit of these data is marked by the dashed line. The rightpanel shows the same color-magnitude diagram for the 0.27 deg2 control field. Theisochrone (solid line) is the same as in the left panel. The dashed line marks thefainter completeness limit of the control fields. This figurewas taken from Sherry etal. (2004).
is relatively small. At lower masses (0.006< MM⊙
<0.11), Caballero et al. (2007) esti-mated a 12% contamination in stars selected in theI vs.I−J color-magnitude diagram.
Kenyon et al. (2005) used intermediate-resolution spectrato measure the Li Iλ6708A and Na Iλ8183/8195A absorption lines to confirm the youth of candidatecluster members. They found that at least 57 of the 76 stars intheir sample show mul-tiple signatures of youth and only 6 of the stars were clearlyforeground M dwarfs. Theremaining 13 members had at least one signature of youth (theradial velocity of thecluster, a low gravity, or enhanced Li absorption). This indicates that the level of fieldstar contamination among photometrically selected candidate cluster members in themass range 0.04< M
M⊙<0.3 is 15±10%.
Burningham et al. (2005) obtained follow-up spectra of 117 additional photomet-ric candidate cluster members from theRCIC survey of Kenyon et al. (2005). Basedupon the radial velocity distribution of their spectroscopic sample, they concluded that
12 Walter et al.
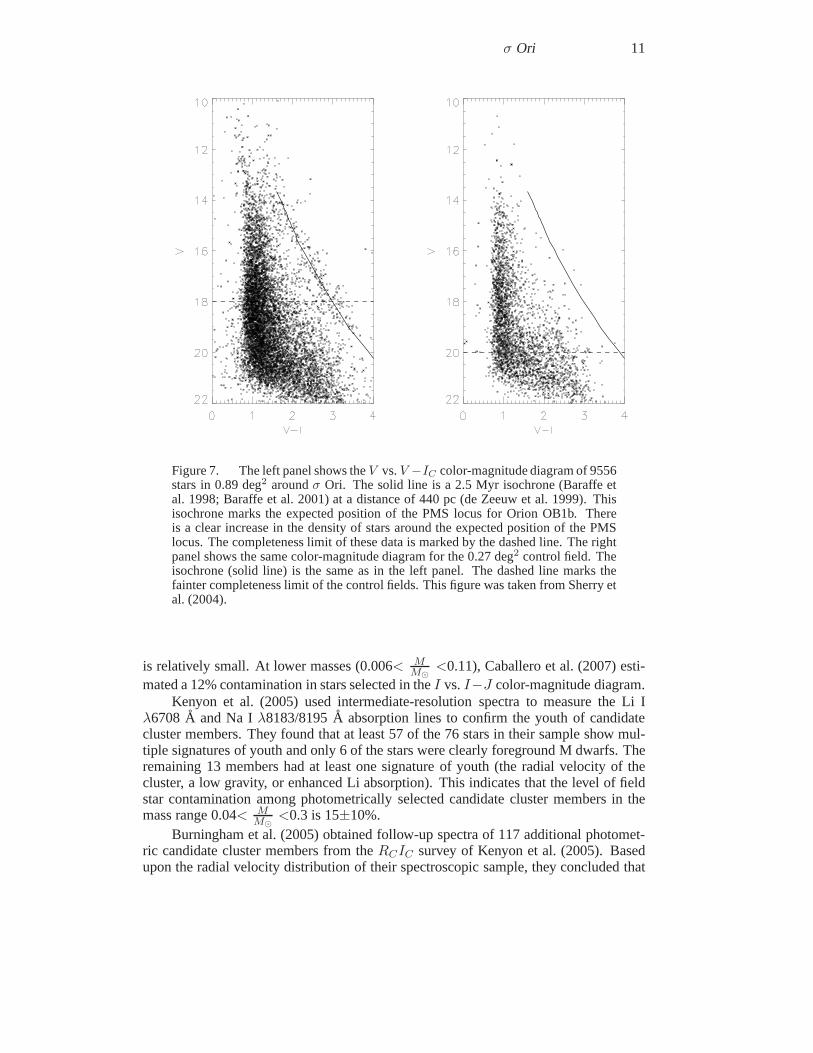
Figure 8. The low mass (spectral types GKM) members of theσ Ori clustercurrently identified from spectroscopy or photometry. The size of the dot is in-versely proportional to theV magnitude of the star. The brightest star plotted hasV =10.4 mag. See the text for details of the completeness. The plus near the centermarks the location ofσ Ori.
photometric selection does not miss a significant number of cluster members and thatfor I <17 the cluster locus on at least theIC vs.R − IC color-magnitude diagram hasa low level of field star contamination.
A more likely, and more insidious, source of contamination is from the PMS pop-ulations of the other Orion OB1 subassociations. Brown et al. (1994) discussed thepopulations of the four subassociations. Because the radial velocities are similar (seeSect. 6.3.) and the proper motions are small, the populations cannot be easily distin-guished kinematically. Orion OB1a is closer and older (330 pc; 10 Myr) than OrionOB1b (450 pc; 2 Myr), and so should be distinguishable statistically on the basis ofa color-magnitude diagram or age indicators. The assignation of memberships of theB stars in Warren & Hesser (1977a; see also Figure 6 of Sherry et al. 2004) is solelyby location on the sky, which is likely unphysical. We expectsignificant overlap of theforeground OB1a association in the rectangle that defines the OB1b association. Sherryet al. (2004, 2008) discussed the contamination by high massstars (see also Table 1);
σ Ori 13
contamination by low mass members of the OB1a association was claimed by Jeffrieset al. (2006; see Sect. 6.3.).
6. Cluster Properties
6.1. Spatial Structure
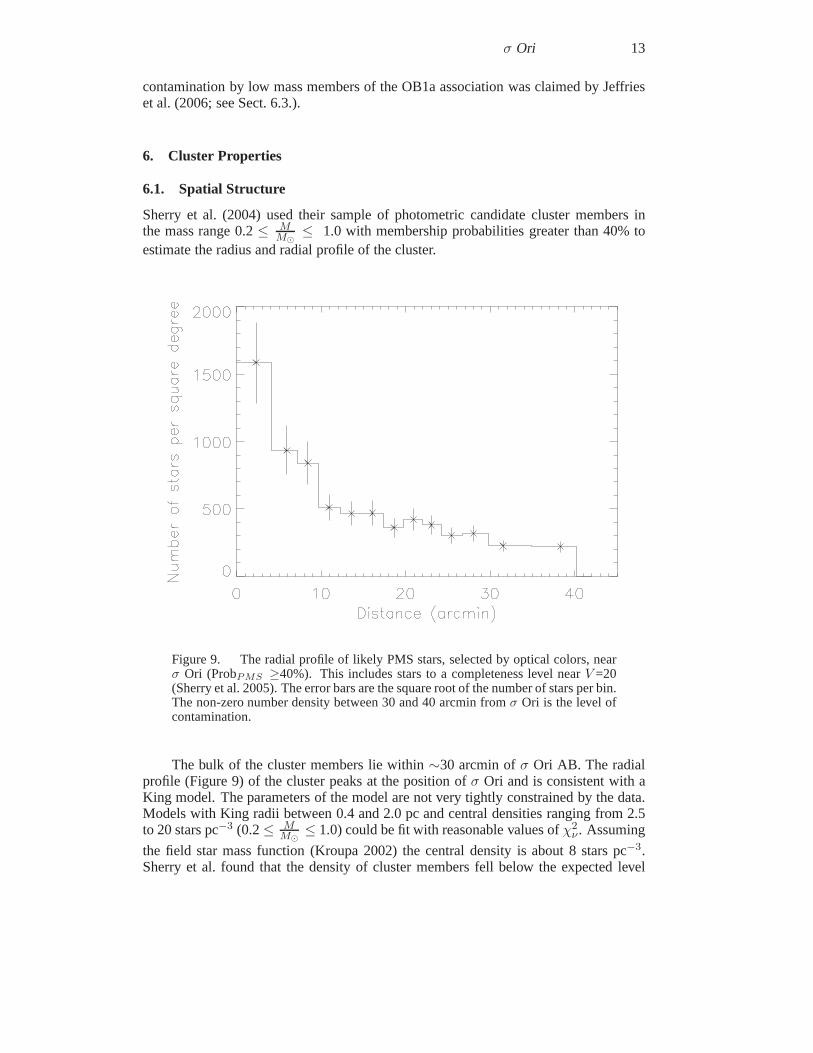
Sherry et al. (2004) used their sample of photometric candidate cluster members inthe mass range 0.2≤ M
M⊙≤ 1.0 with membership probabilities greater than 40% to
estimate the radius and radial profile of the cluster.
Figure 9. The radial profile of likely PMS stars, selected by optical colors, nearσ Ori (ProbPMS ≥40%). This includes stars to a completeness level nearV =20(Sherry et al. 2005). The error bars are the square root of thenumber of stars per bin.The non-zero number density between 30 and 40 arcmin fromσ Ori is the level ofcontamination.
The bulk of the cluster members lie within∼30 arcmin ofσ Ori AB. The radialprofile (Figure 9) of the cluster peaks at the position ofσ Ori and is consistent with aKing model. The parameters of the model are not very tightly constrained by the data.Models with King radii between 0.4 and 2.0 pc and central densities ranging from 2.5to 20 stars pc−3 (0.2≤ M
M⊙≤ 1.0) could be fit with reasonable values ofχ2
ν . Assuming
the field star mass function (Kroupa 2002) the central density is about 8 stars pc−3.Sherry et al. found that the density of cluster members fell below the expected level
14 Walter et al.
of field star contamination at a distance of 30 to 40 arcmin from σ Ori AB. The tidalradius of the cluster was poorly constrained.
Bejar et al. (2004a) fit the radial profile of the substellar population with an ex-ponential functionρ = ρ0e
−r/r0 . Their best fit exponential hasρ0=0.26±0.03 objectsarcmin−2 and r0=0.09±0.06 pc (using a distance of 350 pc). This radial profile issimilar to that of the low-mass stars.
Hernandez et al. (2007) found the radial profile of the cluster has a FWHM of0.25 degrees. The possible enhancement in disk fraction toward the northeast (Sect. 6.9.),in the direction of NGC 2024 andζ Ori, may indicate contamination by a younger pop-ulation.
Caballero (2008a) reported that the cluster (340 members and candidates fromCaballero 2008c) consists of a core region of about 20 arcminradius surrounded by ararefied halo. The core can be fit with a King profile; the surface density falls off asradius−1. The stars more massive than 3.7 M⊙ concentrate towards the core, wherethere may be a deficit of low mass objects. The cluster is not azimuthally-symmetric:Caballero found an overdensity extending east from the cluster toward the region ofthe Horsehead Nebula. He also reported that the distribution of stars outside the core isfilamentary rather than smoothly distributed. He did not discuss possible contaminationfrom stars associated with NGC 2024.
6.2. Reddening
The low reddening of the cluster is one of the properties thatmakes it such a valu-able site to study young stars and substellar mass objects.σ Ori has E(B − V ) of0.05 mag (Lee 1968; Brown et al. 1994). Shull & van Steenberg (1985) quoted E(B −
V ) = 0.06 mag forσ Ori E. Thirteen members of Orion OB1b within 40 arcmin ofσ Orihave a median extinction E(B−V ) = 0.05 mag (Brown et al. 1994). Sherry et al. (2008)found a mean E(B − V ) of 0.06±0.005 mag, and obtained a tight de-reddened color-magnitude diagram (Figure 4) from simply assuming(B − V )0 from the spectral typesof the high mass members. All of these analyses have assumed AV /E(B − V ) = 3.1.
The measured neutral hydrogen column density NH along the line of sight toσ Oriis about 3.3×1020 cm−2 with a 20% uncertainty (Fruscione et al. 1994; Bohlin et al.1983). Forσ Ori E the measured NH is 4.5×1020 cm−2 with an uncertainty of 20%(Fruscione et al. 1994; Shull & van Steenberg 1985). These values of NH are consistentwith E(B − V )∼0.05–0.08 using the standard ratio of total-to-selective absorption.
6.3. Radial Velocity
The radial velocity ofσ Ori AB was measured at 29.2±2 km s−1 by Wilson (1953)and at 27 km s−1 by Morrell & Levato (1991). This is somewhat larger than the23.1±1.4 km s−1 mean velocity of the Orion OB1b association (Morrell & Levato1991). The measured radial velocities of probable low-massmembers of theσ Oricluster are consistent with that ofσ Ori. Walter et al. (1998) found a mean radialvelocity for spectroscopic members between 25 and 30 km s−1. Burningham et al.(2005) measured a peak in the velocity distribution at 29.5 km s−1 with a range of 24–37 km s−1. Kenyon et al. (2005) found a mean of 31.2 km s−1 for 66 low mass membersand possible members. Muzerolle et al. (2003) found a mean velocity of 30.9 km s−1
for 6 substellar-mass objects. Zapatero Osorio et al. (2002a) found a much larger radialvelocity of 37.3 km s−1, also primarily for substellar mass objects.
σ Ori 15
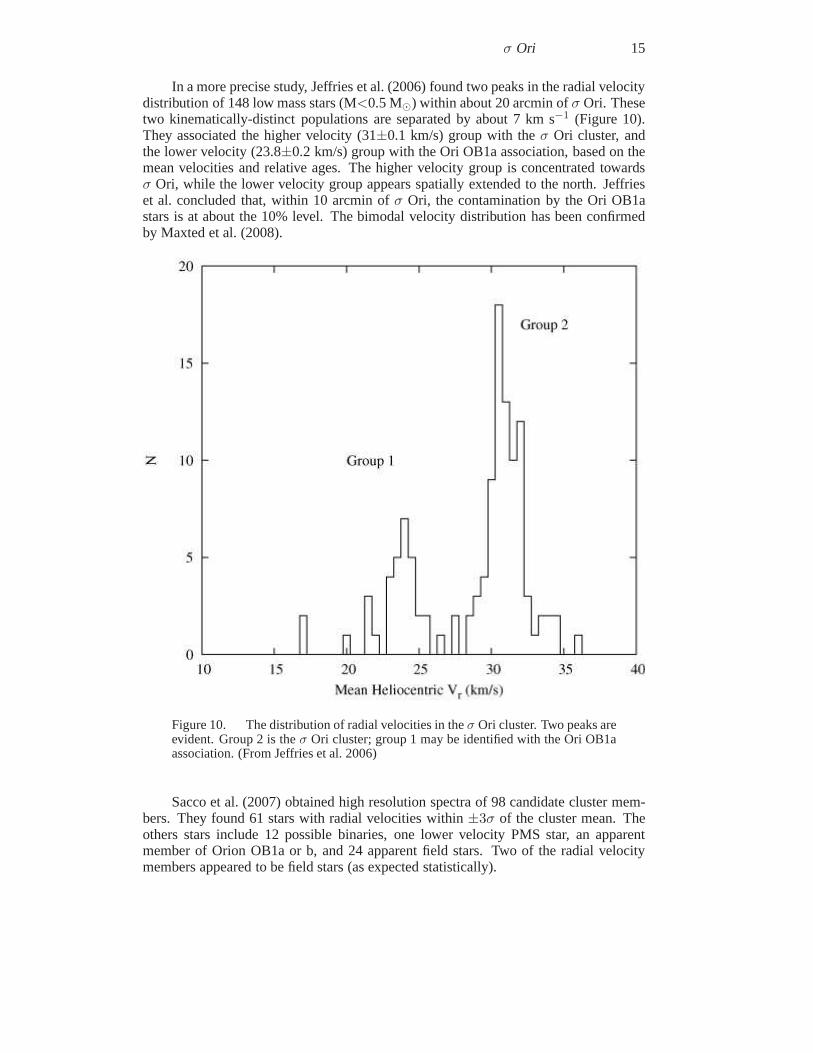
In a more precise study, Jeffries et al. (2006) found two peaks in the radial velocitydistribution of 148 low mass stars (M<0.5 M⊙) within about 20 arcmin ofσ Ori. Thesetwo kinematically-distinct populations are separated by about 7 km s−1 (Figure 10).They associated the higher velocity (31±0.1 km/s) group with theσ Ori cluster, andthe lower velocity (23.8±0.2 km/s) group with the Ori OB1a association, based on themean velocities and relative ages. The higher velocity group is concentrated towardsσ Ori, while the lower velocity group appears spatially extended to the north. Jeffrieset al. concluded that, within 10 arcmin ofσ Ori, the contamination by the Ori OB1astars is at about the 10% level. The bimodal velocity distribution has been confirmedby Maxted et al. (2008).
Figure 10. The distribution of radial velocities in theσ Ori cluster. Two peaks areevident. Group 2 is theσ Ori cluster; group 1 may be identified with the Ori OB1aassociation. (From Jeffries et al. 2006)
Sacco et al. (2007) obtained high resolution spectra of 98 candidate cluster mem-bers. They found 61 stars with radial velocities within±3σ of the cluster mean. Theothers stars include 12 possible binaries, one lower velocity PMS star, an apparentmember of Orion OB1a or b, and 24 apparent field stars. Two of the radial velocitymembers appeared to be field stars (as expected statistically).
16 Walter et al.
6.4. Mass Function
The σ Ori cluster is an ideal region wherein to measure the initialmass function ofsubstellar objects because it is young, compact, and unreddened. There has not beenmuch time for substellar cluster members to evaporate out ofthe cluster.
Sherry et al. (2004) showed that the mass function between 0.2 and 1.0 M⊙ isconsistent with Kroupa’s (2002) field star mass function. They suggested that the massfunction may be top-heavy: given the observed numbers of lowmass stars, one expectsto find more than 10 high mass stars only 1.4% of the time. This conclusion is heavilydependent on how one tallies multiple stars (shouldσ Ori be considered as one star orsix?) Caballero (2007a), on the other hand, found that the mass function between 1.1and 24 M⊙ has a power law slope of +2.0+0.2
−0.1, consistent with the Salpeter (1955) slopeof +2.3.
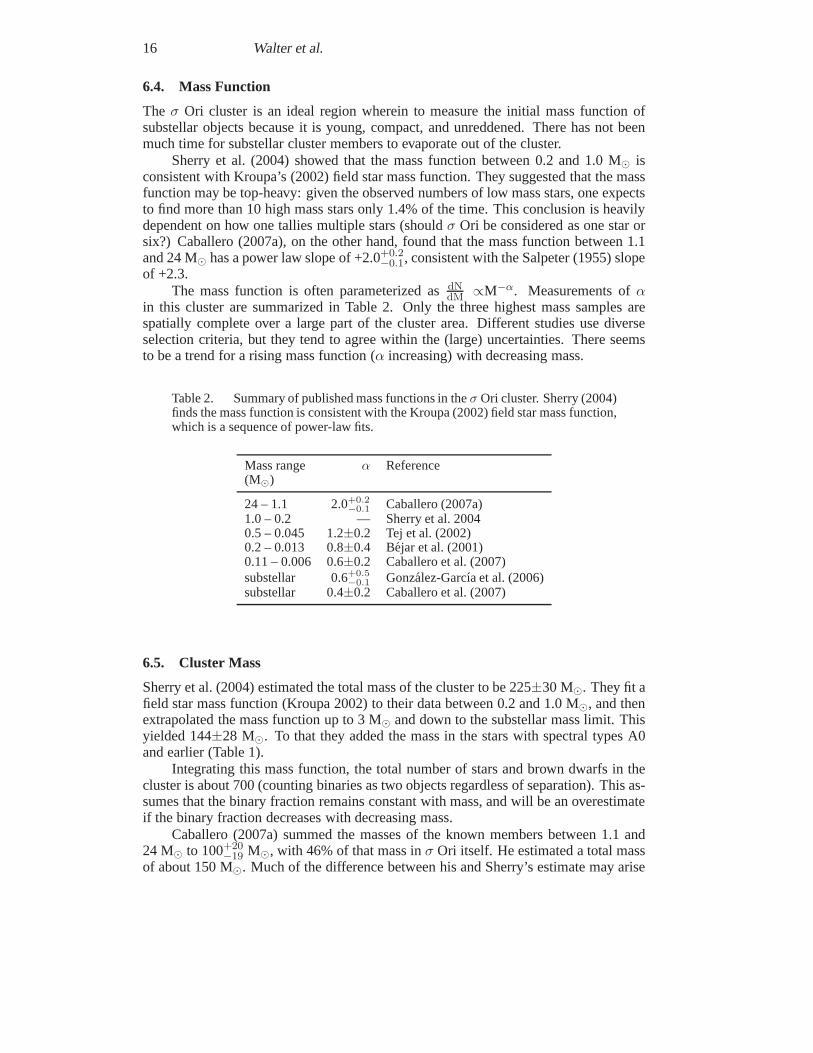
The mass function is often parameterized asdN
dM∝M−α. Measurements ofα
in this cluster are summarized in Table 2. Only the three highest mass samples arespatially complete over a large part of the cluster area. Different studies use diverseselection criteria, but they tend to agree within the (large) uncertainties. There seemsto be a trend for a rising mass function (α increasing) with decreasing mass.
Table 2. Summary of published mass functions in theσ Ori cluster. Sherry (2004)finds the mass function is consistent with the Kroupa (2002) field star mass function,which is a sequence of power-law fits.
Mass range α Reference(M⊙)
24 – 1.1 2.0+0.2
−0.1 Caballero (2007a)1.0 – 0.2 — Sherry et al. 20040.5 – 0.045 1.2±0.2 Tej et al. (2002)0.2 – 0.013 0.8±0.4 Bejar et al. (2001)0.11 – 0.006 0.6±0.2 Caballero et al. (2007)substellar 0.6+0.5
−0.1 Gonzalez-Garcıa et al. (2006)substellar 0.4±0.2 Caballero et al. (2007)
6.5. Cluster Mass
Sherry et al. (2004) estimated the total mass of the cluster to be 225±30 M⊙. They fit afield star mass function (Kroupa 2002) to their data between 0.2 and 1.0 M⊙, and thenextrapolated the mass function up to 3 M⊙ and down to the substellar mass limit. Thisyielded 144±28 M⊙. To that they added the mass in the stars with spectral types A0and earlier (Table 1).
Integrating this mass function, the total number of stars and brown dwarfs in thecluster is about 700 (counting binaries as two objects regardless of separation). This as-sumes that the binary fraction remains constant with mass, and will be an overestimateif the binary fraction decreases with decreasing mass.
Caballero (2007a) summed the masses of the known members between 1.1 and24 M⊙ to 100+20
−19 M⊙, with 46% of that mass inσ Ori itself. He estimated a total massof about 150 M⊙. Much of the difference between his and Sherry’s estimate may arise
σ Ori 17
from Caballero’s assuming a 360 pc distance to the cluster; decreasing the luminosityof the stars by∼ 20% lowers the estimated masses commensurately.
Either way, the mass is too small for the cluster to be gravitationally bound, unlessthe velocity dispersion of the cluster is much less than the expected (and observed - seeFigure 10) velocity dispersion of 1–2 km s−1.
6.6. Age of the Low Mass Population
Age estimates for most clusters are based upon the main sequence turn-off. Blaauw(1964) estimated an 8 Myr age for Orion OB1b based upon the high-mass stars. Morerecently, Brown et al. (1994) estimated an association age of 1.7 Myr based on Walravenphotometry. Sinceσ Ori Aa is an O9V star (Edwards 1976), the cluster must be youngerthan∼10 Myr old.
One can also use the temperature of the main sequence turn-onto estimate thecluster age. Sherry et al. (2008) found the turn-on to be nearspectral type A0. Coolercluster members are well above the main sequence (cf. Figure3). Fitting PMS modelisochrones near the ZAMS turn-on yields an age of 2–3 Myr. Ageestimates based uponthe position of low-mass PMS cluster members on the color-magnitude diagram rangefrom about 2 to 5 Myr (Zapatero Osorio et al. 2002a; Oliveira et al. 2002; Sherry et al.2004).
Spectra of cluster members in the mass range 0.5≤ MM⊙
≤ 0.8 show no evidencefor depletion of Li. This constrains the cluster age to be less than 8 Myr with a mostprobable age of 2–4 Myr (Zapatero Osorio 2002a). Sacco et al.(2007) did find threestars that showed evidence for Li depletion, but in two casesthe Li abundances and theisochronal ages are consistent with membership in the olderOB1a association. Thesestars are likely not members of theσ Ori cluster.
The main source of uncertainty on the age of the cluster is theuncertainty in thedistance (which depends in large part on the poorly determined metallicity). Use ofthe smaller 350 pc distance give systematically larger ages. These age estimates alsodepend upon the accuracy of low-mass PMS star models at fairly young ages. Baraffeet al. (2002) cautioned that there are significant uncertainties in the model calculations,especially at the younger ages.
6.7. Age Spread
The full effect of high mass stars upon low mass star formation is not known. Do highmass stars trigger or terminate low mass star formation? Discovery of a quantifiablespread in the ages of low mass stars, along with a good age sequence, in an OB associ-ation will go far towards elucidating the interactions thatdrive star formation in a denseenvironment.
The cluster locus has a small but significant width on theV vs. V − IC color-magnitude diagram. Sherry (2003) compared the observed width of the cluster locuswith the widths of several simulated cluster loci constructed with different star forma-tion histories. He assumed a binary fraction similar to thatof field G dwarfs, and thatthe population was made of naked T Tauri stars with variability amplitudes similar tothose observed by Herbst (1994). He concluded that there wasno need for an agespread to explain the observed width of the color-magnitudediagram, but an age spreadof up to 1 Myr could not be excluded.
Burningham et al. (2005) also examined the possible age spread among membersof the σ Ori cluster. They used two epochR and i′ observations of cluster members
18 Walter et al.
taken in 1999 and 2003 to estimate the variability of each cluster member. This methodof estimating variability allowed them to include the effects of measurement errors inthe variability of each star. They then constructed a seriesof models with a varyingfraction of equal mass binaries. They found that the observed spread on the color-magnitude diagram was too large to be fully accounted for by the combined effects ofobservational errors, variability (over 1–4 years), and binaries. They concluded that thelarger spread on the color-magnitude diagram may be accounted for by either longer pe-riod accretion driven variability, an age spread of∼2 Myrs (using a distance of 440 pc,or 4 Myrs using a distance of 350 pc), or a combination of long term variability and asmaller age spread.
6.8. Properties of the Stars
Clusters provide snapshots of stars over a range of masses, at one particular age. Inter-preted properly, one can use a sample of clusters of known ages to determine empiri-cally how stellar properties evolve with time. To do so, one must assume that differingenvironmental effects (e.g., cluster density) and initialconditions are not important.
One property of clusters that may change with time is the binary fraction. Maxtedet al. (2008) have examined the spectroscopic binary fraction in theσ Ori andλ Oriclusters. They identify 7 PMS spectroscopic binaries (14.1< IC <16.6) in theirσ Orifields. Based on theγ velocities, five of these are kinematic members of group 2 (theσ Ori cluster), one is a member of group 1, and one has uncertainmembership. Whiletheir sample reaches toIC=18.9, they find no binaries in the combined sample withIC >16.6. They conclude that the spectroscopic binary fractionfor the bright stars(IC <16.6; M<0.1 M⊙) is 0.095+0.012
−0.028, while that of the less massive objects is<0.075at 90% confidence. The suggestion that very low mass stars andbrown dwarfs have aspectroscopic binary fraction lower than that of more massive stars has implications forstar formation in the cluster environment.
Scholz & Eisloffel (2004) examined the variability of a sample of 23 low mass(0.07 ≤ M
Modot ≤ 0.7) stars and brown dwarf candidates in the cluster. Sixteen ofthese are low level variables, with amplitudes<0.2 mag atI, which is probably dueto rotation. The other 7 objects exhibit T Tauri-like stochastic variability. These alsotend to have strong emission line spectra. Rotation periodsrange from 4 hours to 10days, with the large-amplitude variables tending to rotatemore slowly, consistent witha disk-locking scenario. They concluded that5 − 7% of objects in this mass rangeretain disks at the age of this cluster. Caballero et al. (2004) monitored 28 brown dwarfcandidate members for variability on timescales of one hourto 2 years. They foundhalf to be variable, withI-band amplitudes of 0.01 to 0.4 mag. They identified rotationperiods of 3-40 hours in 3 objects. They found a correlation between large amplitudevariability and the presence of strong Hα emission or IR continuum excesses, whichthey interpreted as signatures of active accretion. Earlier, Bailer-Jones & Mundt (2001)had found similar results from a variability study of a diverse sample of low massobjects which include 7 members of theσ Ori cluster.
The published X-ray luminosity function (Franciosini et al. 2006) shows that theX-ray emission from the more massive (spectral type K) members of theσ Ori clusteris about a factor of 4 lower than that observed in the Orion Nebula Cluster, or in Cha I,and is comparable to that ofρ Oph. At lower masses (spectral type M), theσ Oriluminosities are below all three other young clusters. Thisdiscrepancy can be mitigated
σ Ori 19
if those candidates not detected in X-rays are actually non-members, and if the distanceis increased from 352 to 420 pc (see Sherry et al. 2008).
6.9. Disk Fraction and Active Accretion
Protoplanetary disk lifetimes control the time available for planet formation. The 2–5 Myr age of theσ Ori cluster provides a snapshot of a cluster at an age when disks arebeginning to disappear, possibly as a result of planet formation.
Sherry et al. (2004) did not find any evidence for significant near-IR excesses in aJ − H, H − K color-color diagram. Jayawardhana et al. (2003) conductedaJHKL′
survey of several star forming regions, including theσ Ori cluster. They detectedK−L′
excesses around 2 out of the 6σ Ori cluster members they observed. Oliveira & vanLoon (2004) undertook a mid-IR survey of a diverse sample of objects nearσ Ori.Oliveira, Jeffries & van Loon (2004) conducted anL′ survey of 28 mostly low mass,likely cluster members. They found that about half the starsretain disks. For an≈3 Myrcluster age, this is consistent with a mean 6 Myr disk survival time. That there area significant number of stars with nIR excesses atL′ and not atK reflects the coolphotospheric temperatures of these low mass stars. Oliveira et al. (2006) extended thissurvey withK andL′ imaging of 83 cluster members with 0.04≤ M
M⊙≤ 1.0. K − L′
color excesses indicate that 27 stars have warm circumstellar dust, for a disk frequencyof 33±6%. They found no significant dependence of the disk fractionon stellar mass.
Hernandez et al. (2007) usedSpitzerIRAC and MIPS colors for a more sensitivestudy of the disk population. They found that 27% of the members have optically thickdisks. Another 7% have evolved disks, that is, transition disks with large inner holes ordebris disks. The optically-thick disk fraction is largestin the low mass (<1 M⊙) stars;the evolved disks are most prevalent among the higher mass objects. They found nocorrelation between X-ray luminosity and disk properties,which suggests that accretionis not a dominant driver of T Tauri X-ray emission. There may be a slight tendency forthe fraction of members with circumstellar disks to be enhanced towards the center ofthe cluster. Overall, the disk fraction in theσ Ori cluster is consistent with the generaldecrease in disk fraction with cluster age.
Caballero et al. (2007) found that 47±15% of the lower mass (0.006< MM⊙
< 0.11)objects have near-IR excesses from optically thisk disks detectable between 1 and 8µm.This disk fraction may be slightly larger than that Hernandez et al. found for the lowmass stars, extending the general trend for observed disk fraction to increase with de-creasing mass. Zapatero Osorio et al. (2007) inferred a diskfraction of about 50%in a sample of 12 planetary mass (7−14 MJup) objects from IRAC 3.6−8.0 µm fluxexcesses. Three of these planetary mass objects identified with disks were earlier tabu-lated, but not found to have disks, by Caballero et al. (2007). Scholz & Jayawardhana(2008) measured a disk fraction of 29+16
−13% in a sample of 18 planetary mass objects(M<20 MJup), based on IRAC 8.0µm flux excesses.
One can also use the presence of strong Hα emission (above the level attributableto a stellar chromosphere) as a proxy for accretion, and an active accretion disk. About8% of the spectroscopically-confirmed PMS stars (spectral types G to K) in the Walteret al. (1998) sample have an Hα equivalent width in excess of 10A, and appear to beactively accreting at this time. A larger fraction (18%) of the X-ray-selectedChandraHRC sample shows Hα emission (Sect 5.1.). Using White & Basri’s (2003) criterion,Caballero (2005) estimated that 46+16
−13% of the K and M stars are active accretors,although this may be biased since stars with Hα in emission were targeted.
20 Walter et al.
Gatti et al. (2008) estimated mass accretion rates for 31 lowmass cluster memberswith circumstellar disks by using an empirical relation between the Paschenγ lineluminosity and the accretion luminosity. The mass accretion rates are about a factor of10 lower than those measured in theρ Oph region. This is consistent with viscous diskaccretion models (Hartmann et al. 1998).
Caballero (2007a) also noted that the bright B5V member HD 37699 is an IRASsource, and may have a circumstellar disk.
6.10. Globules, Proplyds, and Herbig-Haro Objects
Even fossil star forming regions retain some evidence of their dusty predecessors. Theσ Ori cluster is still young, and neighbors the embedded and still active star formationregion NGC 2024. Ogura & Sugitani (1998) surveyed Ori OB1b for reflection nebulosi-ties, bright-rimmed clouds, and cometary globules. They cataloged 63 clouds (some ofwhich have multiple discrete components). While most of these are far removed fromthe immediate region of the cluster, the spatial distribution of the cometary globulesresembles a shell of about 1◦ radius centered near, and with tails directed away from,σ Orionis. These clouds may be the last molecular evidence of the giant molecularcloud that spawned theσ Ori cluster, as it is destroyed by irradiation and winds fromσ Orionis itself. See the chapter by Alcala et al. in this bookfor more details.
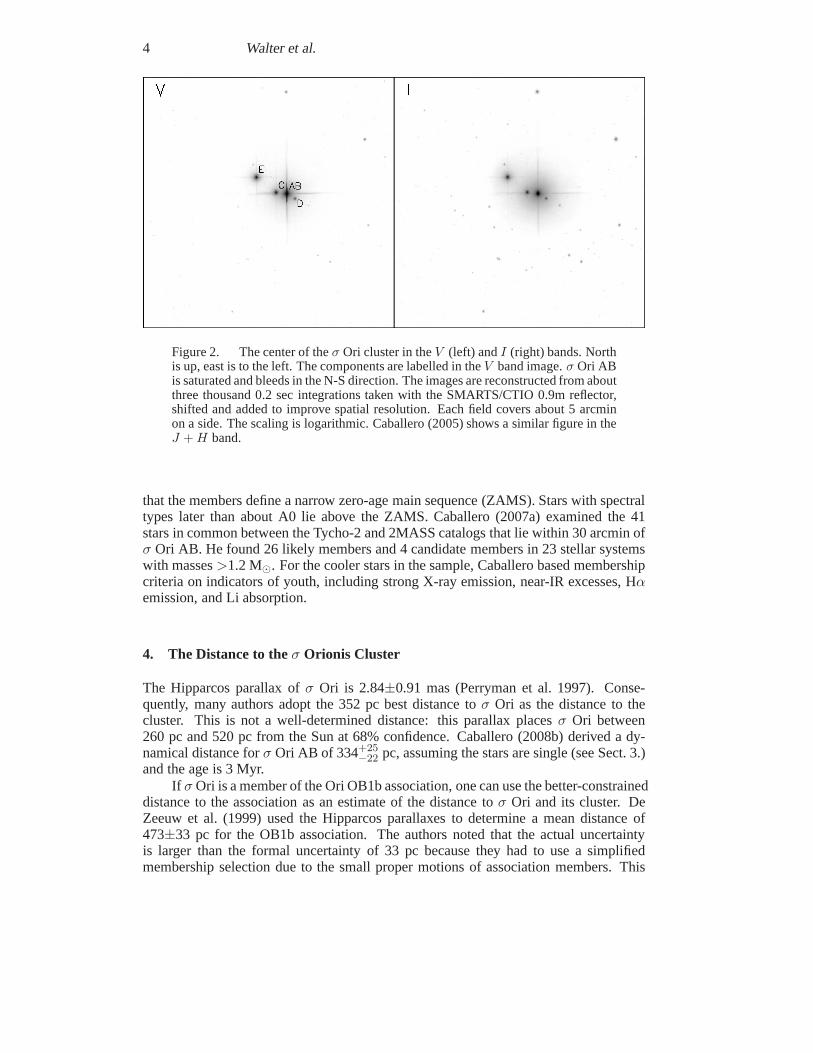
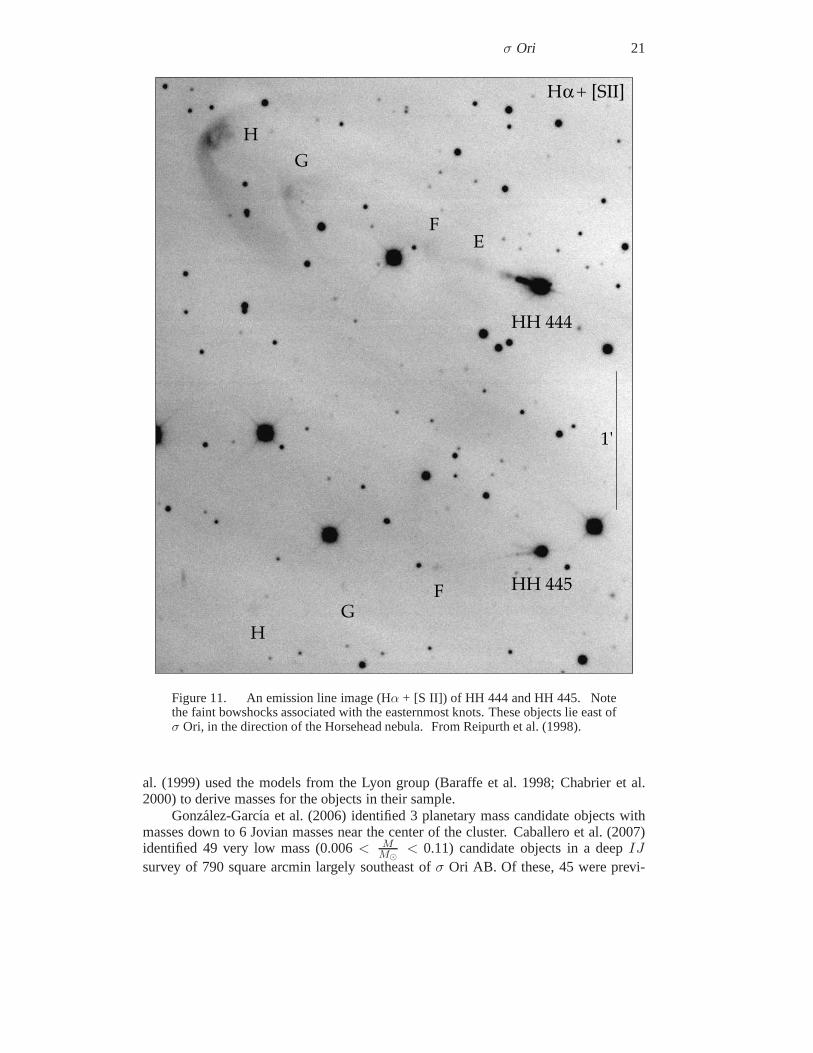
Four Herbig-Haro flows (HH 444–447) are known in the vicinityof σ Ori (Reipurthet al. 1998; Andrews et al. 2004). HH 444 and HH 445 (Figure 11)have extendedemission structures which point away fromσ Ori. Andrews et al. interpreted theseas photoevaporating proplyds. The driving sources includeV510 Ori, V603 Ori, andHaro 5-39. Each has a large mid-IR excess (Oliveira & van Loon2004) indicative of alarge circumstellar disk. Lopez-Martın et al. (2001) obtained high resolution spectra ofHH 444, and generated a model of the object.
Van Loon & Oliveira (2003) reported the discovery of a mid-IRsource,σ OriIRS1, near, but not coincident with,σ Ori at a projected separation about 3 arcsec(∼ 1000 AU) to the north-northeast. IRS1 is positionally coincident with a radio source(Drake 1990). Caballero (2005, 2007b) reported near-IR andX-ray counterparts to thismid-IR source. It appears to be an evaporating proplyd. Thisclears up the mystery ofwhy σ Ori appeared to have a strong IR excess.
7. Substellar Mass Objects
Theσ Ori cluster has been a rich hunting ground for brown dwarfs. At the 2–5 Myrage of the cluster, brown dwarfs are still bright (K ∼14 for a 0.07 M⊙ brown dwarf at450 pc), and have late-M to mid-L spectral types. This makes them detectable in broadband, wide field surveys.
Bejar et al. (1999) reported the detection of 49 candidate brown dwarfs in aRIZsurvey of 870 arcmin2 region aroundσ Ori. Zapatero Osorio et al. (2000) reported thedetection of three L-type objects with inferred masses between 5 and 15 Jovian massesnearσ Ori. Later work (Bejar et al. 2001, 2004a) extended this survey to cover about1 deg2. These surveys have found 171 photometrically selected candidate substellarcluster members. Low-resolution optical and near-IR spectroscopy (Bejar et al. 1999,Martın et al. 2001, Barrado y Navascues et al. 2001, 2003) shows that these objectshave spectral types between M6 and mid-L with strong Hα emission and weak alkalinelines (due to low gravity) which have been interpreted as indicators of youth. Bejar et
σ Ori 21
HH 444
HH 445FG
H
Hα + [SII]
1'
EF
GH
Figure 11. An emission line image (Hα + [S II]) of HH 444 and HH 445. Notethe faint bowshocks associated with the easternmost knots.These objects lie east ofσ Ori, in the direction of the Horsehead nebula. From Reipurthet al. (1998).
al. (1999) used the models from the Lyon group (Baraffe et al.1998; Chabrier et al.2000) to derive masses for the objects in their sample.
Gonzalez-Garcıa et al. (2006) identified 3 planetary masscandidate objects withmasses down to 6 Jovian masses near the center of the cluster.Caballero et al. (2007)identified 49 very low mass (0.006< M
M⊙< 0.11) candidate objects in a deepIJ
survey of 790 square arcmin largely southeast ofσ Ori AB. Of these, 45 were previ-
22 Walter et al.
ously known. Thirty are considered confirmed cluster members because of near-IR fluxexcesses or spectroscopic indicators of youth (Hα emission, low gravity, or Li absorp-tion). Statistically, they expect 6 of the remaining 19 to beforeground contamination.At a distance of 360 pc, 33 of these are brown dwarfs and 11 are planetary mass objects.They found no evidence that the mass function turns over at least down to their detec-tion limit, and suggested that the substellar mass objects form via the same physicalmechanism that leads to low mass stars.
Zapatero Osorio et al. (2002b) suggested that S Ori 70 (SOri J053810.1−023626)is an∼2–8 MJup object, and is a free-floating planet. If confirmed, this is the leastmassive free-floating object yet identified. Martın & Zapatero Osorio (2003) measuredthe surface gravity, and estimated a 3 MJup mass and a radius of 0.16 R⊙, independentof the distance to the object. Burgasser et al. (2004) contested this, concluding thatit is more likely an old field T dwarf. However, Zapatero Osorio et al. (2008) used avery small proper motion and near-IR colors which are different from field T dwarfsto bolster their argument for membership in theσ Ori cluster, and consequently a lowmass. Scholz & Jayawardhana (2008) also find indications of youth and low mass inS Ori 70.
The confirmation of planetary mass objects is of some interest, in that it wouldprovide insights into how very low mass objects (i.e., Jovian mass free-floaters) form.Do they form an extension of the mass function for isolated objects, or do they form asplanets, in circumstellar disks, that are then ejected in close encounters in a dense clus-ter environment? All the masses quoted in this section are derived on the assumption ofa distance of 352 pc to theσ Ori cluster. The luminosities and masses are higher for the420-440 pc distance. While the details of the end of the mass function are uncertain,there are a large number of very low mass objects in this cluster.
8. Summary and Implications
The low mass stars in the fossil star formation regions like Orion OB1b provide a newview into the structure and history of these associations. The numerous low mass starsprovide a more complete view of the mass and mass functions, and the spatial extentsof the associations, than one can gather from the high mass stars alone. The low massstars allow one to probe the age spreads and to look for mass segregation within theassociations. They provide a more robust measure of the spatial structure of the associ-ations.
The σ Ori cluster, a small part of the Orion OB1b association, contains up to∼225 M⊙ in up to∼700 stars and substellar mass objects. The age is 2–3 Myr; thecluster extends out about 30 arcmin (3.5 pc at a 420 pc distance). The mass function ex-tends from an O9V star to well down into the substellar mass regime. Reddening is low:the mean E(B − V ) is about 0.06 mag. About half the low mass stars have circumstel-lar disks, and some are still actively accreting. Theσ Ori cluster is not gravitationallybound, and will diffuse into the general Orion OB1b association in the astronomicallynot-too-distant future.
In part because theσ Ori cluster has only recently been recognized, no meta-analysis of all the known members yet exists. Indeed, only recently has a combined listof likely members become available (Caballero 2008c). Witha complete membershiplist, and uniform spectroscopy and photometry, it will be possible to completely char-
σ Ori 23
acterize the cluster, from its age (and age spread), spatialdistribution, and kinematics,to its metallicity and distance, and to the distribution of stellar properties.
Theσ Ori cluster is well matched, in terms of total mass, with the cluster surround-ing NGC 2024 (Comeron et al. 1996). The NGC 2024 cluster is more highly embedded,appears younger, and has a much higher central density. Comparative studies of the twomay help us understand the early evolution of stellar clusters.
Theσ Ori cluster is a lower mass and older analog of the Orion Nebula Cluster. Incontrast to the Orion Nebula Cluster, which stands out distinctly from its neighbors, theσ Ori cluster today is a part of the large and coeval Orion OB1b association. The appar-ent simplicity of the ONC may be a matter of perspective – bothspatial and temporal.By the time the ONC has aged 2 million years, it will be joined by a myriad of starsand clusters now embedded in the surrounding molecular cloud. Examination of theinterplay of the components in these complex regions may tell us whether associationsform in pieces - as the agglomeration of clusters forming about the high mass stars - oras a whole.
Acknowledgments. This research has made use of the SIMBAD database, oper-ated at CDS, Strasbourg, France. Star formation research atStony Brook was supportedin part by NSF grant 0307454. We thank the referee, J. Caballero, for many useful com-ments and suggestions.
References
Abergel, A., Teyssier, D., Bernard, J.P., et al. 2003, A&A, 410, 577Adams-Wolk, N.R., Wolk, S.J., Walter, F.M., & Sherry, W.H. 2005, in the Poster Proceedings
of Protostars and Planets V, LPI Contribution No. 1286., 8425Ambartsumian, V.A. 1947 inStellar Evolution and Astrophysics, Acad. Sci. Armen., YerevanAndrews, S.M., Reipurth, B., Bally, J., & Heathcote, S.R. 2004, ApJ, 606, 353Anthony-Twarog, B.J. 1982, AJ, 87, 1213Bailer-Jones, C.A.L. & Mundt, R. 2001, A&A 367, 218Baraffe, I., Chabrier, G., Allard, F., & Hauschildt, P.H. 1998, ApJ, 337, 403Baraffe, I., Chabrier, G., Allard, F., & Hauschildt, P. 2001, in The Formation of Binary Stars,
IAU Symp. 200, eds. H. Zinnecker & R.D. Mathieu, ASP, p. 483Baraffe, I., Chabrier, G., Allard, F., & Hauschildt, P.H. 2002, A&A 382, 563Barrado y Navascues, D., Zapatero Osorio, M.R., Bejar, V.J.S., et al. 2001, A&A, 377, L9Barrado y Navascues, D., Bejar, V.J.S., Mundt, R., et al. 2003, A&A, 404, 171Bejar, V.J.S., Zapatero Osorio, M.R. & Rebolo, R. 1999, ApJ, 521, 671Bejar, V.J.S., Martın, E.L., Zapatero Osorio, M.R., et al. 2001, ApJ, 556, 830Bejar, V.J.S., Caballero, J.A., Rebolo, R., et al. 2004a, Ap&SS, 292, 339BBejar, V.J.S., Zapatero Osorio, M.R., & Rebolo, R. 2004b, AN, 325, 705Berghofer, T.W. & Schmitt, J.H.M.M. 1994, A&A, 290, 435Blaauw, A. 1964, ARAA, 2, 213Blaauw, A. 1991, inThe Physics of Star Formation and Early Stellar Evolution, eds. C.J. Lada
and N.D. Kylafis (Dordrecht: Kluwer), p 125Bohlin, R.C., Jenkins, E.B., Spitzer, L., Jr., et al. 1983, ApJS, 51, 277Bok, B.J. 1934, Harvard Circ., 384Bolton, C.T. 1974, ApJ, 192, L7Briceno, C., Preibisch, T., Sherry, W.H., Mathieu, R.D., Mamajeck, E.A., Walter, F.M. & Zin-
necher, H. 2007, inProtostars and Planets V, eds B. Reipurth, D. Jewitt, and K. Keil,(Tucson: University of Arizona), p. 345
Brown, A.G.A., de Geus, E.J., & de Zeeuw, P.T. 1994, A&A, 289,101
24 Walter et al.
Burgasser, A.J., Kirkpatrick J.D., McGovern M.R., McLean I.S., Prato L., Reid I.N., 2004, ApJ,604, 827
Burningham, B., Naylor, T., Littlefair, S.P., & Jeffries, R.D. 2005, MNRAS, 356, 1583Caballero, J.A., Bejar, V.J.S., Rebolo, R., & Zapatero Osorio, M.R., 2004, A&A, 424, 857Caballero, J.A. 2005, AN, 326, 1007Caballero, J.A. 2007a, A&A, 466, 917Caballero, J.A. 2007b, AN, 328, 917Caballero, J.A. 2008a, MNRAS, 383, 375Caballero, J.A. 2008b, MNRAS, 383, 750Caballero, J.A. 2008c, A&A, 478, 667Caballero, J.A., Bejar, V.J.S., Rebolo, R., et al. 2007, A&A, 470, 903Cameron, L.M. 1985, A&A, 152, 250Chabrier, G., Baraffe, I., Allard, F., & Hauschildt, P. 2000, ApJ, 542, 464Comeron, F., Rieke, G.H. & Rieke, M.J. 1996, ApJ, 473, 294Cunha, K., Smith, V.V., & Lambert, D.L. 1998, ApJ, 493, 195de Zeeuw, P.T., Hoogerwerf, R., de Bruijne, J.H.J., Brown, A.G.A., & Blaauw, A. 1999, A&A,
117, 354Drake, S.A. 1990, AJ, 100, 572Edwards, T.W. 1976, AJ, 81, 245Flaccomio, E., Micela, G., & Sciortino, S. 2003, A&A, 402, 277Franciosini, E., Pallavicini, R., & Sanz-Forcada, J. 2006 A&A, 446, 501Frost, E.B. & Adams, W.S. 1904, ApJ, 19, 151Fruscione, A., Hawkins, I., Jelinsky, P., & Wiercigroch, A.1994, ApJS, 94, 127Garrison, R.F. 1967, PASP, 79, 433Gatti, T., Natta, A., Randich, S., Testi, L., & Sacco, G. 2008, A&A, 481, 423Gonzalez-Garcıa, B.M., Zapatero Osorio, M.R., Bejar, V.J.S., et al. 2006, A&A, 460, 799Greenstein, J.L. & Wallerstein. G. 1958, ApJ, 127, 237Groote, D. & Schmitt J.H.M.M. 2004, A&A, 418, 235Haro, G. & Moreno, A. 1953, Bol. Obs. Tonantz. Tacub., 1, 11Hartkopf, W.I., Mason, B.D. & McAlister, H.A. 1996, AJ, 111,370Hartmann, L., Calvet, N., Gullbring, E., & D’Alessio, P. 1998, ApJ, 495, 385Heintz, W.D. 1997, ApJS, 111, 335Herbst, W., Herbst, D.K., Grossman, E.J., & Weinstein, D. 1994, AJ, 108, 1906Hernandez, J., Hartmann, L., Megeath, T., et al. 2007, ApJ,662, 1067Herschel, W. 1811, Philosophical Transactions of the RoyalSociety of London, 101, 269Jayawardhana, R., Ardila, D.R., Stelzer, B, & Haisch, K.E. 2003, AJ, 126, 1515Jeffries, R.D., Maxted, P.F.L., Oliveira, J.M., & Naylor, T. 2006, MNRAS, 371, L6Kenyon, M.J., Jeffries, R.D., Naylor, T., Oliveira, J.M., &Maxted, P.F.L. 2005, MNRAS, 356,
89Kroupa, P. 2002, Science, 295, 82Landstreet, J.D. & Borra E.F. 1978, ApJ, 224, L5Lee, T. A. 1968, ApJ 152, 1125Lopez-Martın, L., Raga, A.C., Lopez, J.A., & Meaburn, J.2001, A&A, 371, 1118Lynga, G. 1981, ADC Bull, 1, 90Martın, E.L. & Zapatero Osorio, M.R., 2003, ApJ, 593, L113Maxted, P.F.L., Jeffries, R.D., Oliveira, J.M., Naylor, T.& Jackson, R.J. 2008, MNRAS, 385,
2210Mokler, F. & Stelzer, B. 2002, A&A, 391, 1025Morrell, N. & Levato, H. 1991, ApJS, 75, 965Muzerolle, J., Hillenbrand, L., Calvet, N., Briceno, C., &Hartmann, L. 2003, ApJ, 592, 266Nakano, M., Wiramihardja, S., & Kogure, T. 1995, PASJ, 47, 889Ogura, K. & Sugitani, K. 1998, PASA, 15, 91Oliveira, J.M., Jeffries, R.D., Kenyon, M.J., Thompson, S.A., & Naylor, T. 2002, A&A, 382,
L22Oliveira, J.M., Jeffries, R.D., & van Loon, Th. 2004, MNRAS,347, 1327
σ Ori 25
Oliveira, J.M., Jeffries, R.D., van Loon, Th., & Rushton, M.T. 2006, MNRAS, 369, 272Oliveira, J.M. & van Loon, Th. 2004, A&A, 418, 663Palla, F. & Stahler, S.W. 1999, ApJ, 392, 667Perryman, M.A.C., Lindegren, L., Kovalevsky, J. et al. 1997, A&A, 323, 49Peterson, D.M. et al. 2008, in preparationPinsonneault, M.H, Terndrup, D.M., Hanson, R.B., & Stauffer, J.R. 2004, ApJ, 600, 946Reipurth, B., Bally, J., Fesen, R.A., & Devine, D. 1998, Nature, 396, 343Reipurth, B. & Bouchet, P. 1984, A&A, 137, L1Sacco, G.G., Randich, S., Franciosini, E., Pallavicini, R., & Palla, F. 2007, A&A, 462, L23Salpeter, E.E. 1955, ApJ, 121, 161Sanz-Forcada, J., Franciosini, E., & Pallavicini, R. 2004,A&A, 421, 715Scholz, A. & Eisloffel, J. 2004, A&A, 419, 249Scholz, A. & Jayawardhana, R. 2008, ApJ, 672, L49Sherry, W.H. 2003, PhD Thesis, SUNY Stony BrookSherry, W.H., Walter, F.M., & Wolk, S.J. 2004, AJ, 128, 2316Sherry, W.H., Walter, F.M., & Wolk, S.J. 2005, in the Poster Proceedings ofProtostars and
Planets V, LPI Contribution No. 1286., 8599Sherry, W.H., Walter, F.M., Wolk, S.J., & Adams, N.R. 2008, AJ, 135, 1616Shull, J.M. & van Steenberg, M.E. 1985, ApJ, 294, 599Tej, A., Sahu, K.C., Chandrasekhar, T. & Ashok, N.M. 2002, ApJ, 578, 523Turner, D.G. 1976, AJ, 81, 97Turner, D.G. 1979, PASP, 91, 642van Loon, J.T. & Oliveira, J.M. 2003, A&A, 405, L33Walter, F.M., Alcala, J.M., Neuhauser, R., Sterzik, M. & Wolk, S.J. 2000, inProtostars and
Planets IV, eds. V. Mannings, A.P. Boss, and S.S. Russell, University of Arizona, p. 273Walter, F.M., Wolk, S.J., & Sherry, W.H. 1998,Cool Stars, Stellar Systems, and the Sun 10, eds.
R. Donahue & J. Bookbinder (ASP: San Francisco), p. 1793Walter, F.M., Wolk, S.J., Freyberg, M. & Schmitt, J.H M.M. 1997, MmSAI, 68, 1081Warren, W.H., Jr., & Hesser, J.E. 1977a, ApJS, 34, 115Warren, W.H., Jr., & Hesser, J.E. 1977b, ApJS, 34, 207Warren, W.H., Jr., & Hesser, J.E. 1978, ApJS, 36, 497Weaver, Wm.B. & Babcock, A. 2004, PASP, 116, 1035White, R.J. & Basri, G.S. 2003, ApJ, 582, 1109Wilson, R.E. 1953,General Catalogue of Stellar Radial VelocitiesCarnegie Institute, Washing-
ton D.C.Wiramihardja, S., Kogure, T., Yoshida, S., Nakano, M., Ogura, K., & Iwata, T. 1991, PASJ, 43,
27Wiramihardja, S., Kogure, T., Yoshida, S., Ogura, K., & Nakano, M., 1991, PASJ, 41, 155Wolk, S.J. 1996, PhD thesis, SUNY Stony BrookZapatero Osorio, M.R., Bejar, V.J.S. Martın, E.L., et al.2000, Science, 290, 103Zapatero Osorio, M.R., Bejar, V.J.S., Pavlenko, Ya., et al. 2002a, A&A, 384, 937Zapatero Osorio, M.R., Bejar, V.J.S. Martın, E.L., et al.2002b, ApJ, 578, 536Zapatero Osorio, M.R., Caballero, J.A., Bejar, V.J.S., etal. 2007, A&A 472, L9Zapatero Osorio, M.R., Bejar, V.J.S., Bihain, G., et al. 2008, A&A, 477, 895


