Embed Size (px)
Citation preview
Mon. Not. R. Astron. Soc. 319, 137±153 (2000)
Coordinated monitoring of the eccentric O-star binary Iota Orionis:the X-ray analysis
Julian M. Pittard,1,2w Ian R. Stevens,1w Michael F. Corcoran,3w Ken G. Gayley,4w
Sergey V. Marchenko5w and Gregor Rauw1,6w²1School of Physics and Astronomy, University of Birmingham, Edgbaston, Birmingham B15 2TT2Department of Physics and Astronomy, University of Leeds, Woodhouse Lane, Leeds LS2 9JT3Universities Space Research Association/Laboratory for High Energy Astrophysics, GSFC, Greenbelt, MD 20771, USA4University of Iowa, Iowa City, IA 52245, USA5DeÂpartment de Physique, Universite de MontreÂal, CP 6128, Succursale Centre-Ville, MontreÂal, QueÂbec H3C 3J7, Canada6Institut d'Astrophysique & GeÂophysique, Universite de LieÁge, 5 Avenue de Cointe, B-4000 LieÁge, Belgium
Accepted 2000 June 23. Received 2000 June 6; in original form 1999 September 16
A B S T R A C T
We analyse two ASCA observations of the highly eccentric O9 III1B1 III binary Iota
Orionis obtained at periastron and apastron. Based on the assumption of a strong colliding-
wind shock between the stellar components, we expected to see significant variation in the
X-ray emission between these phases. The observations proved otherwise: the X-ray
luminosities and spectral distributions were remarkably similar. The only noteworthy feature
in the X-ray data was the hint of a proximity effect during periastron passage. Although this
`flare' is of relatively low significance, it is supported by the notable proximity effects seen
in the optical, and the phasing of the X-ray and optical events is in very good agreement.
However, other interpretations are also possible.
In view of the degradation of the SIS instrument and source contamination in the GIS data
we discuss the accuracy of these results, and also analyse archival ROSAT observations. We
investigate why we do not see a clear colliding-wind signature. A simple model shows that
the wind attenuation to the expected position of the shock apex is negligible throughout the
orbit, which poses the puzzling question of why the expected 1/D variation (i.e. a factor of
7.5) in the intrinsic luminosity is not seen in the data. Two scenarios are proposed: either the
colliding-wind emission is unexpectedly weak such that intrinsic shocks in the winds
dominate the emission, or, alternatively, the emission observed is colliding-wind emission but
in a more complex form than we would naively expect. Complex hydrodynamical models
are then analysed. Despite strongly phase-variable emission from the models, both are
consistent with the observations. We find that if the mass-loss rates of the stars are low then
intrinsic wind shocks could dominate the emission. However, when we assume higher mass-
loss rates of the stars, we find that the observed emission could also be consistent with a
purely colliding-wind origin. A summary of the strengths and weaknesses of each
interpretation is presented. To distinguish between the different models X-ray observations
with improved phase coverage will be necessary.
Key words: binaries: general ± stars: early-type ± stars: individual: Iota Orionis (HD 37043)
± X-rays: stars.
1 I N T R O D U C T I O N
The Orion OB1 stellar association is one of the brightest and
richest concentrations of early-type stars in the vicinity of the Sun
(Warren & Hesser 1977). It contains large numbers of young O-
and B-type stars, and this, combined with its position well below
q 2000 RAS
w E-mail: [email protected] (JMP); [email protected] (IRS);
[email protected] (MFC); [email protected]
(KGG); [email protected] (SVM); [email protected] (GR)
² Charge de Recherches FNRS, Belgium.
Dow
nloaded from https://academ
ic.oup.com/m
nras/article/319/1/137/1075512 by guest on 20 August 2022
the galactic plane �kbl � 2168� with subsequent low foreground
absorption, makes it an optimal object to study. The OB1
association is also famous for an exceptionally dense concentra-
tion of stars known as the Trapezium cluster, located near u1 Ori.
The stellar density of the Trapezium cluster has been estimated by
several authors in recent years and its central region is now
thought to exceed ,4 � 104 stars pc23 (McCaughrean & Stauffer
1994), making it one of the densest young clusters currently
known.
Iota Orionis (HR 1889; HD 37043) is a well known highly
eccentric �e � 0:764� early-type binary system (O9 III1B1 III,
P � 29:13376 d� located in the C4 subgroup of the Orion OB1
association, approximately 30 arcmin south of the Trapezium
cluster. In the last decade Iota Orionis has drawn attention for the
possibility of an enhanced, focused wind between the two stars
during the relatively close periastron encounter (Stevens 1988;
Gies, Wiggs & Bagnuolo 1993; Gies et al. 1996). Although data
consistent with this effect was presented (residual blueshifted
emission in Ha that accelerates from about 2100 to 2180 km s21),
previous evidence was inconclusive, and the possibility of a
random fluctuation of the primary's wind was not ruled out by
Gies et al. (1996). These authors also found no evidence of any
systematic profile deviations which are associated with non-radial
pulsations. The latest optical monitoring (Marchenko et al. 2000)
again obtained data consistent with a proximity effect.
Iota Orionis is perhaps even more interesting for the possible
existence of a strong colliding-wind interaction region between
the two stars, which should be most clearly recognized at X-ray
wavelengths. As demonstrated by Corcoran (1996), perhaps the
best direct test for the importance of colliding-wind emission is to
look for the expected variation with orbital phase. X-ray data can
also be used to extract information on the characteristics of this
region (e.g. geometry, size, temperature distribution), which can in
turn constrain various stellar parameters, including mass-loss
rates. This possibility has already been explored for the Wolf±
Rayet (WR) binary g2 Velorum (Stevens et al. 1996). Further-
more, a direct comparison of the recently presented sudden
radiative braking theory of Gayley, Owocki & Cranmer (1997)
with observed X-ray fluxes has not yet been made. For this goal,
Iota Orionis has the dual advantage of a high X-ray flux (partially
as a result of its relative proximity, D , 450 pc� and a highly
eccentric orbit (the varying distance between the stars should act
as a `probe' for the strength of the radiative braking effect). Iota
Orionis is additionally intriguing for its apparent lack of X-ray
variability (see Section 2) whilst colliding-wind theory predicts a
strongly varying X-ray flux with orbital phase.
In this paper we present the analysis and interpretation of two
ASCA observations of Iota Orionis proposed by the XMEGA
group, as well as a reanalysis of some archival ROSAT data. These
are the first detailed ASCA observations centred on this object,
although ASCA has previously observed the nearby O-stars d Ori
and l Ori (Corcoran et al. 1994) and surveyed the Orion Nebula
(Yamauchi et al. 1996). ASCA observations of WR1O binaries
(e.g. g2 Velorum ± Stevens et al. 1996; WR 140 ± Koyama et al.
1994) have provided crucial information on colliding stellar winds
in these systems. The new ASCA observations of Iota Orionis
enable us to perform a detailed study of the X-ray emission in this
system. The periastron observation covered ,65 ks and includes
primary minimum �f � 20:009�; periastron passage �f � 0:0�and quadrature �f � 0:014�; and allows an unprecedented look at
interacting winds in an eccentric binary system over a range of
different orientations. The apastron observation covered ,25 ks
and allows us to compare the X-ray properties at the maximum
orbital separation. Thus these two new observations offer the
additional benefit of improving the poor phase sampling of this
object.
The new ASCA observations were coordinated with an
extensive set of ground-based optical observations reported in
Marchenko et al. (2000). In this work, the spectra of the
components were successfully separated, allowing the refinement
of the orbital elements (including the restriction of the orbital
inclination to 508 & i & 708� and confirmation of the rapid apsidal
motion. Strong tidal interactions between the components during
periastron passage and phase-locked variability of the secondary's
spectrum were also seen. However, no unambiguous signs of the
bow shock crashing onto the surface of the secondary were found.
These results are extremely relevant to the interpretation of the
ASCA X-ray data.
This paper is organized as follows: in Section 2 we briefly
discuss previous X-ray observations of Iota Orionis; in Section 3
we present our analysis of the new ASCA data sets and re-examine
archival ROSAT data. In Section 4 we examine possible inter-
pretations of the data. Comparisons with other colliding-wind
systems are made in Section 5, and in Section 6 we summarize
and conclude.
2 P R E V I O U S X - R AY O B S E RVAT I O N S O F
I OTA O R I O N I S
On account of its high X-ray flux, Iota Orionis has been observed
on several occasions. X-ray emission from Iota Orionis was
reported by Long & White (1980) in an analysis of Einstein
Imaging Proportional Counter (IPC) data, and a count rate of
0:289 ^ 0:007 count s21 in the 0.15±4.5 keV band was obtained.
The spectral resolution (E/DE) of the IPC was only 1±2, so only
the crudest spectral information could be obtained, although it was
observed that the spectrum was soft, peaking below 1 keV. The
authors noted that qualitatively good fits could be obtained with a
variety of spectral models leading to an uncertainty of a factor of 2
in their quoted luminosity of 2:3 � 1032 erg s21 (0.15±4.5 keV).
Since this observation the X-ray properties of Iota Orionis have
been studied on numerous occasions (Snow, Cash & Grady 1981;
Chlebowski, Harnden & Sciortino 1989; Collura et al. 1989;
Waldron 1991; Gagne & Caillault 1994; BerghoÈfer & Schmitt
1995a; Geier, Wendker & Wisotzki 1995; Kudritzki et al. 1996;
Feldmeier et al. 1997a). Owing to the different X-ray satellites,
data-analysis techniques and orbital phases, meaningful compari-
sons between the data sets are difficult, and we simply refer the
reader to the above mentioned papers. We note, however, the
results of previous X-ray variability studies of Iota Orionis, per-
formed by Snow et al. (1981) and Collura et al. (1989) on Einstein
data, and by BerghoÈfer & Schmitt (1995a) on ROSAT data. Snow
et al. found that the count rates from three IPC observations were
twice as high as the Long & White (1980) observation, leading to
the simple interpretation that the X-ray emission from Iota Orionis
could vary by up to a factor of 2 (with a statistical significance of
3s ), although it was noted that at the time of the observations
there were problems with the instrumental gain shifts of the IPC.
Collura et al. (1989) re-examined the issue of variability with a
more rigorous method and found that they could only place upper
limits of 12 per cent on the amplitude of variability over time-
scales ranging from 200 s up to the duration of each observational
interval. In contrast to the findings of Snow et al. (1981) no
138 J. M. Pittard et al.
q 2000 RAS, MNRAS 319, 137±153
Dow
nloaded from https://academ
ic.oup.com/m
nras/article/319/1/137/1075512 by guest on 20 August 2022

evidence of long-term variability between observations was
detected. Finally BerghoÈfer & Schmitt (1995a) found an
essentially flat light curve from ROSAT observations, consistent
with the previous findings of Collura et al. (1989), although again
the phase sampling was rather poor. The lack of dramatic
variability in these previous studies could be a result of poor phase
sampling and/or the soft response of the instruments (assuming
that X-rays from the wind collision are harder than those
intrinsically emitted from the individual winds). Our ASCA
observations were specifically designed to address this by (i)
sampling at phases where the variation should be maximized; and
(ii) by leveraging the extended bandpass of ASCA to measure the
hard flux.
Table 1 summarizes the Einstein IPC observations and the
rather confusing situation with regard to whether and at what level
there is any variability (note that it is not meant to imply that there
is any real source variability). It also emphasizes the poor phase
sampling and serves as a useful highlight as to one of the reasons
why the latest ASCA data presented in this paper were obtained. In
column 3 we list the orbital phase at the time of observation,
calculated from the ephemeris
HJD �periastron� � 2451 121:658 1 29:133 76E
derived from the latest optical monitoring of this system
(Marchenko et al. 2000). As a result of the large number of
orbits which have elapsed, the listed phases are only approximate
and do not account for the apsidal motion detected in Iota Orionis
(Stickland et al. 1987; Marchenko et al. 2000). We also draw
attention to the different count rates obtained by different authors
when analysing the same data sets, and the relatively constant
count rates obtained from different data sets by the same authors.
A further ROSAT analysis of Iota Orionis was published by
Geier et al. (1995), who obtained a position-sensitive proportional
counter (PSPC) observation centred on the Trapezium cluster.
This discovered that most of the X-ray emission from the region
originated from discrete sources, in contrast to the previous
Einstein data where the sources were spatially unresolved. Nearly
all of the 171 X-ray sources were identified with pre-main
sequence stars in subgroups Ic and Id of the Orion OB1
association. The four pointings made from 1991 March 14±18,
together gave a total effective exposure time of 9685 s. However,
Iota Orionis was significantly off-axis in all of these pointings.
Assuming a Raymond & Smith (1977) thermal plasma spectral
model, a single-temperature fit gave kT � 0:22 keV and NH �1020 cm22; whilst a two-temperature fit with a single absorption
column gave kT1 � 0:12 keV; kT2 � 0:82 keV and NH � 3 �1020 cm22:
Two analyses of ROSAT PSPC spectra, which ignored the
binary nature of Iota Orionis, have recently been published by
Kudritzki et al. (1996) and Feldmeier et al. (1997a). The X-rays
were assumed to originate from cooling zones behind shock
fronts. These are a natural development of the intrinsically
unstable radiative driving of hot-star winds (see e.g. Owocki,
Castor & Rybicki 1988). Although the authors stated that good fits
were obtained, no formal indication of their goodness was given.
Because binarity may significantly affect the X-ray emission, we
use this as the basis of our interpretation of the data. This approach
complements these alternative single-star interpretations.
3 T H E X - R AY DATA A N A LY S I S
Despite previous attempts to characterize the X-ray properties
of Iota Orionis, our understanding remains poor. For instance,
from the previous Einstein and ROSAT data it looks like a typical
O-star. However, on account of its stellar and binary properties,
Iota Orionis should reveal a clear X-ray signature of colliding
stellar winds which one would expect to show dramatic orbital
variability as the separation between the stars changes. ASCA
should be well suited for the study of this emission on account of
its high spectral resolution and greater bandpass. In this section we
report on the analysis performed on the two new phase-
constrained ASCA data sets. This is followed by a reanalysis of
two archival ROSAT data sets, and a comparison with results
obtained from colliding-wind models.
3.1 The ASCA analysis
3.1.1 Data reduction
Iota Orionis was twice observed with ASCA during 19971. An
observation on 1997 September 21 was timed to coincide with
periastron passage, whilst the October 6 observation was timed to
coincide with apastron passage. The event files from each
instrument were screened using the ftool ascascreen. For the
standard SIS analysis the BRIGHT data mode was processed using
medium and high bit rate data. Hot and flickering pixels were
removed and the standard screening criteria applied.
The four X-ray telescopes (XRTs) onboard ASCA each have
spatial resolutions of 2.9-arcmin half-power diameter. In spite of
the broad point-spread function (PSF), the jittering of the
spacecraft can appear on arcminute scales. To avoid inaccurate
flux determinations and spurious variability in the light curves, the
radius of the source region should normally be no smaller than
3 arcmin (ASCA Data Reduction Guide). For most cases the
recommended region filter radius for bright sources in the SIS is
4 arcmin. Because of concerns of contamination from nearby
sources, our standard analysis adopted a source radius of 3 arcmin.
The estimation of the X-ray background initially proved
somewhat troublesome. The presence of a nearby source forced
a thin annulus, creating a large variance on the background
spectrum, which invariably still contained contaminating counts.
The available blank sky backgrounds were also found to be
unsatisfactory. After much consideration, the background was
estimated from the entire charge-coupled device (CCD) excluding
the source region and other areas of high count rate. This method
produced a large number of background counts, reducing the
uncertainty in its spectral shape, and resulting in a spectral
distribution for the source which was better constrained.
Table 1. Einstein IPC observations of Iota Orionis.
Sequence Date of Phase IPC count s21
number obs. f (LW80) (SCG81) (C89)
3842 23/9/79 0.34 0.28911263 03/3/80 0.90 0.6095095 05/3/80 0.97 0.585 0.4175096 23/3/80 0.59 0.607 0.413
10413 16/2/81 0.92 0.367
Notes. The count rates listed were obtained from the followingpapers: LW80 ± Long & White (1980); SCG81 ± Snow et al.(1981); C89 ± Collura et al. (1989).
1 Details of the ASCA satellite may be found in Tanaka, Inoue & Holt
(1994).
X-ray analysis of the eccentric O-star binary Iota Orionis 139
q 2000 RAS, MNRAS 319, 137±153
Dow
nloaded from https://academ
ic.oup.com/m
nras/article/319/1/137/1075512 by guest on 20 August 2022

For the GIS analysis, the standard rejection criteria for the
particle background were used together with the rise time
rejection procedure. Unlike the SIS, the intrinsic PSFs of the
GIS are not negligible compared to the XRTs and a source region
filter of 4-arcmin radius was used. The serendipitous source
detected by the SIS instruments was not spatially resolved by the
GIS instruments and hence the source spectra extracted from the
latter contain contaminating counts from this object.
Two methods of background subtraction for the GIS instru-
ments are commonly used. Either one can use blank-sky images
with the same region filter as used for the source extraction, or one
can choose a source-free area on the detector at approximately the
same off-axis angle as the source. In our analysis the second
method was favoured owing to the following reasons.
(i) The cut-off rigidity (COR) time dependence can be correctly
taken into account.
(ii) The blank-sky background files were taken during the early
stages of the ASCA mission, and do not include the secular
increase of the GIS internal background.
(iii) The blank-sky background files were also taken from high
Galactic latitude observations, and hence possible diffuse X-ray
emission near Iota Orionis cannot be taken into account.
Despite these reasons, the blank-sky method of background
subtraction was also tested and in contrast to the SIS analysis both
methods produced spectral fit results which agreed within their
uncertainties. However, all subsequent work including the results
reported in this paper used a background extracted from the same
field as the source.
The effective exposure times and count rates for the various
instruments during the periastron and apastron pointings are
detailed in Table 2. The numbers in columns 4 and 5 refer only to
the specific source regions extracted.
In Fig. 1 we show the SIS0 field from the periastron observation
for two different energy bands. In addition to Iota Orionis, a
serendipitous source is clearly visible to the right, being most
noticeable in the harder image. A ROSAT PSPC image of Iota
Orionis is shown in Fig. 2, and demonstrates more clearly the
crowding of sources in this region of the sky. The serendipitous
source in Fig. 1 is tentatively identified as NSV 2321, an early
G-type star (optical coordinates: RA�2000:0� � 05h35m22s;Dec:�2000:0� � 205854 035 00�: As already noted, this source
complicates the analysis, of which more details are given in
Section 3.1.4.
3.1.2 The X-ray light curves
Light curves from all four instruments were extracted for each of
the two observations and analysed with the xronos package. A
subset of these is shown in Fig. 3. Somewhat surprisingly the light
curves were found to be remarkably constant. For the periastron
SIS0 observation, a fit, assuming the background-subtracted
source was constant, gave x2n � 0:85: For the apastron observation
a corresponding analysis gave x2n � 0:75: If the majority of the
X-ray emission was from the wind collision region, one would
expect significant variation given the highly eccentric nature of
the system. There is also little difference between the count rates
of the periastron and apastron observations.
Table 2. Effective exposure times and number of counts (backgroundcorrected) for each of the four instruments onboard ASCA during theperiastron and apastron pointings. The percentage of counts in the sourceregion owing to the background varied between 20±25 per cent for theperiastron pointing and 15±23 per cent for the apastron pointing. Theorbital phase spanning each observation is also listed in column 1.
Observation Inst. Exp. Counts in Count rate (s21)(phase, f ) (s) source region in source region
Periastron SIS0 65672 12543 0.1910.9905±1.068 SIS1 66545 9729 0.146
GIS2 72288 4301 0.060GIS3 72336 5085 0.070
Apastron SIS0 23934 4856 0.2031.502±1.529 SIS1 23798 3225 0.136
GIS2 24496 1416 0.058GIS3 24496 1814 0.074
Figure 1. Screened images from the SIS0 periastron data at energies below 1.0 keV (left) and above 1.0 keV (right). The serendipitous source is noticeably
brighter in the image on the right, which tells us that its spectrum is relatively harder than Iota Orionis. The left image clearly shows the characteristic
`Maltese Cross' of the XRT PSF.
140 J. M. Pittard et al.
q 2000 RAS, MNRAS 319, 137±153
Dow
nloaded from https://academ
ic.oup.com/m
nras/article/319/1/137/1075512 by guest on 20 August 2022

However, close to periastron passage (corresponding to 2:38 �104 s after the start of the observation) there does seem to be a
small transient spike in both the SIS0 (see Fig. 3) and GIS2/3 count
rates (although nothing appears in the SIS1 light curve). This
`flare' is of relatively low significance, and could be entirely
instrument related as it occurs just before an interval of bad
data. Supporting evidence for this comes from Moreno &
Koenigsberger (1999) who have recently investigated the effect
of tidal interactions between the stars around periastron passage.
They found that if the radius of the primary is smaller than 15 R(,
the enhancement in the mass-loss rate at periastron, and therefore
the effect on the colliding-wind emission, should not be signifi-
Lcant. However, the phasing of the X-ray flare is almost perfect
with a similar event seen in the optical (Marchenko et al. 2000). To
examine whether the flare possibly occurred in the background a
cross-correlation analysis was performed. No significant correlation
was found between the source and background light curves, whilst a
strong correlation clearly occurred between the unsubtracted and
subtracted source light curves. We conclude, therefore, that it is
unlikely that this `flare' occurs in the background data.
3.1.3 The X-ray spectra
Using the xspec package, source X-ray spectra were extracted
from each data set, re-binned to have a minimum of 10 counts
per bin (as required for x2 fitting), and fitted with both single and
two-temperature Raymond±Smith (RS) spectral models. We
emphasize at this point that this simple analysis is an effort to
characterize (i) the overall shape of the spectrum and its
temperature distribution, (ii) the amount of variability in the
spectral parameters and (iii) the discrepancies between theoretical
colliding stellar wind spectra and the observed data (see Section
4.2). It is not meant to imply that in the two-temperature fits the
emission physically occurs from two distinct regions at separate
temperatures, and is simply in keeping with X-ray analysis
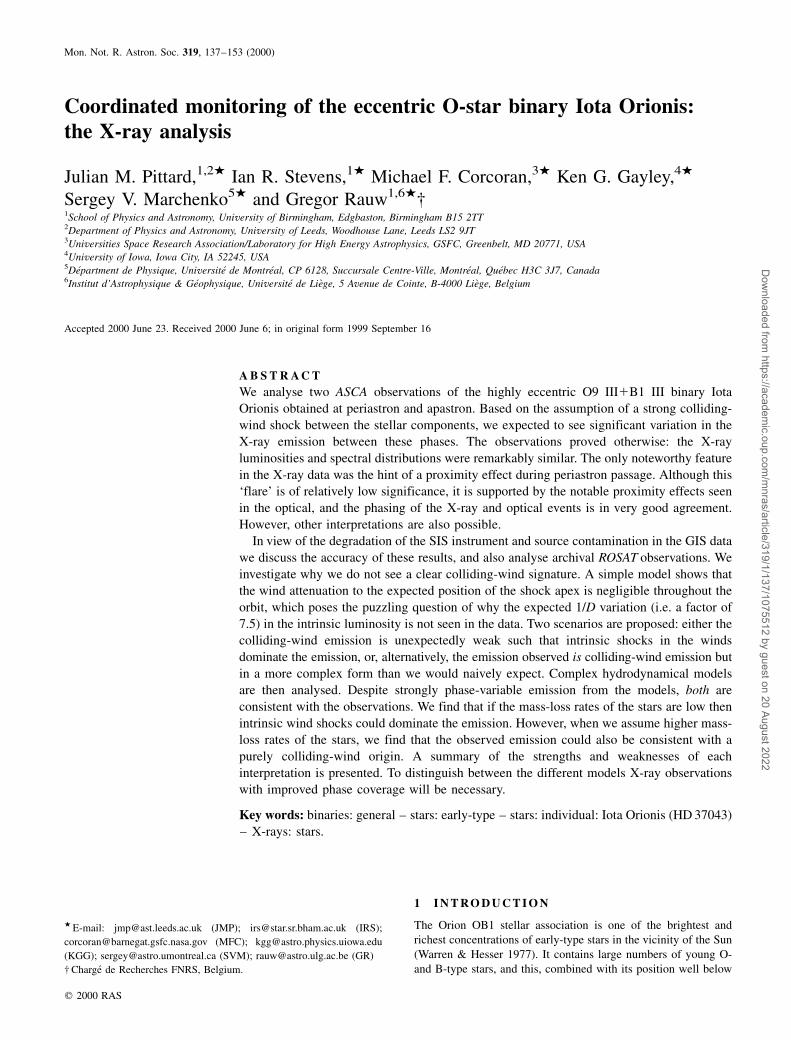
techniques commonly used today. The upper panel of Fig. 4 shows
a two-temperature RS model with one absorption component
which has been simultaneously fitted to the SIS0 and SIS1
periastron data sets, whilst the lower panel shows the correspond-
ing fit to the GIS2 and GIS3 periastron data sets. We include data
down to ,0.5 keV for the SIS instruments (important for
measuring changes in NH, although see Section 3.1.4) and to
,0.8 keV for the GIS instruments (where the effective area is
roughly 10 per cent of the maximum effective area for this
instrument, thus enabling us to extract maximum information
about the emission below 1.0 keV).
Some line emission is clearly seen, in particular at ,1.85 and at
,2.30 keV, of which the former is most probably from Si xiii.
Numerous spectral models were fitted to the data on both an
instrument by instrument basis and to various combinations of the
four instruments, including all four instruments together. First
we attempted single temperature solar abundance fits. Only the
fit to the combined GIS2 and GIS3 apastron data was acceptable:
NH � 2:71 ^ 0:63 � 1021 cm22; kT � 0:61 ^ 0:06 keV; EM �7:7 ^ 1:7 � 1054 cm23 and x2
n � 0:92: Fits using non-solar
abundances were not significantly improved, although the addition
of a second independent plasma component did result in much
better fits and we report some results in Table 3. Immediately
Figure 2. ROSAT PSPC image of the Iota Orionis field. This image number is rf200700n00, and clearly shows the X-ray sources near Iota Orionis, which is
the brightest source at the centre of the field. The serendipitous ASCA source is labelled. Contour levels are 1, 2, 5, 10, 20 and 50 counts. Epoch 2000.0
coordinates are shown.
X-ray analysis of the eccentric O-star binary Iota Orionis 141
q 2000 RAS, MNRAS 319, 137±153
Dow
nloaded from https://academ
ic.oup.com/m
nras/article/319/1/137/1075512 by guest on 20 August 2022

obvious is that the fits to the periastron and apastron SIS data are
very similar, both in terms of the spectral parameters and the
resulting luminosities. Clearly there is not an order of magnitude
variation which we expected in the intrinsic luminosity. This is
also true for the corresponding fits to the GIS data. Thus it appears
at first glance that any variability is small. This has implications
for a colliding-wind interpretation of the data, although at this
stage we do not rule this model out. Other general comments
which we can make on the spectral fits are the following.
(i) The SIS data sets return much higher values of NH and much
lower values of the characteristic temperature, kT, than the GIS
data sets.
(ii) Both the SIS and GIS fits return absorbing columns which
are greater than the estimated interstellar column �2:0 �1020 cm22; Savage et al. 1977; Shull & Van Steenberg 1985)
arguing for the presence of substantial circumstellar absorption
consistent with strong stellar winds.
(iii) Owing to the larger variance on the GIS data, the GIS fit
results are statistically acceptable, whereas those to the SIS data
are not.
(iv) If the global abundance is allowed to vary during the fitting
process, the general trend in the subsequent fit results is that the
characteristic temperature increases, the absorbing column
decreases, the normalization increases, and the abundance fits at
0.05±0.2 solar. The resulting x2n is basically unchanged. These fit
Figure 3. Background subtracted light curves from the SIS0 detector for the periastron (top) and apastron (bottom) observations. They are remarkably
constant considering the anticipated wind interaction. However, an emission `spike' is clearly seen in the periastron light curve, which occurs just before the
point of closest approach of the stars �MJD � 50 713:285 36�: It is not seen in the SIS1 data, though, and we note that it occurs just before a period of bad
data, and therefore could be entirely instrumental.
142 J. M. Pittard et al.
q 2000 RAS, MNRAS 319, 137±153
Dow
nloaded from https://academ
ic.oup.com/m
nras/article/319/1/137/1075512 by guest on 20 August 2022
results bear all the hallmarks of the problems mentioned by
Strickland & Stevens (1998) and we question their accuracy.
(v) The metallicities generally fit closer to solar values if a two-
temperature RS model is used.
(vi) If a simultaneous SIS and GIS fit is made, the returned
temperatures are similar to those from the SIS data set alone. This
is perhaps not so surprising, however, given that the variance on
the GIS data is much larger than the SIS, and therefore that the SIS
data has a much larger influence in constraining the fit.
Two-temperature RS models with separate absorbing columns to
each component were also fitted, as were two temperature spectral
models with neutral absorption fixed at the ISM (interstellar
medium) value and an additional photoionized component.
However, both failed to significantly improve the fitting and we
do not comment on these further.
3.1.4 Problems with the analysis
Although the differences between the individual SIS0 and SIS1
data sets, and between the GIS2 and GIS3 data sets are within the
fit uncertainties, there is a large discrepancy between the fit results
made to the SIS data sets on the one hand and the GIS data sets on
the other. Models which fit the GIS do not fit the SIS, and vice
versa. Whilst we can already state with some confidence that the
X-ray emission is not strongly variable, the above is obviously a
large cause for concern which we should still explore. For
instance, if we ignore the lack of variability for a moment and
assume that a colliding-wind scenario is the correct model, then
the fitted temperatures should provide some information on the
pre-shock velocities of the two winds, and whether these vary as a
function of orbital phase. Hence for this reason we wish to
determine which of the SIS or GIS temperatures is most accurate.
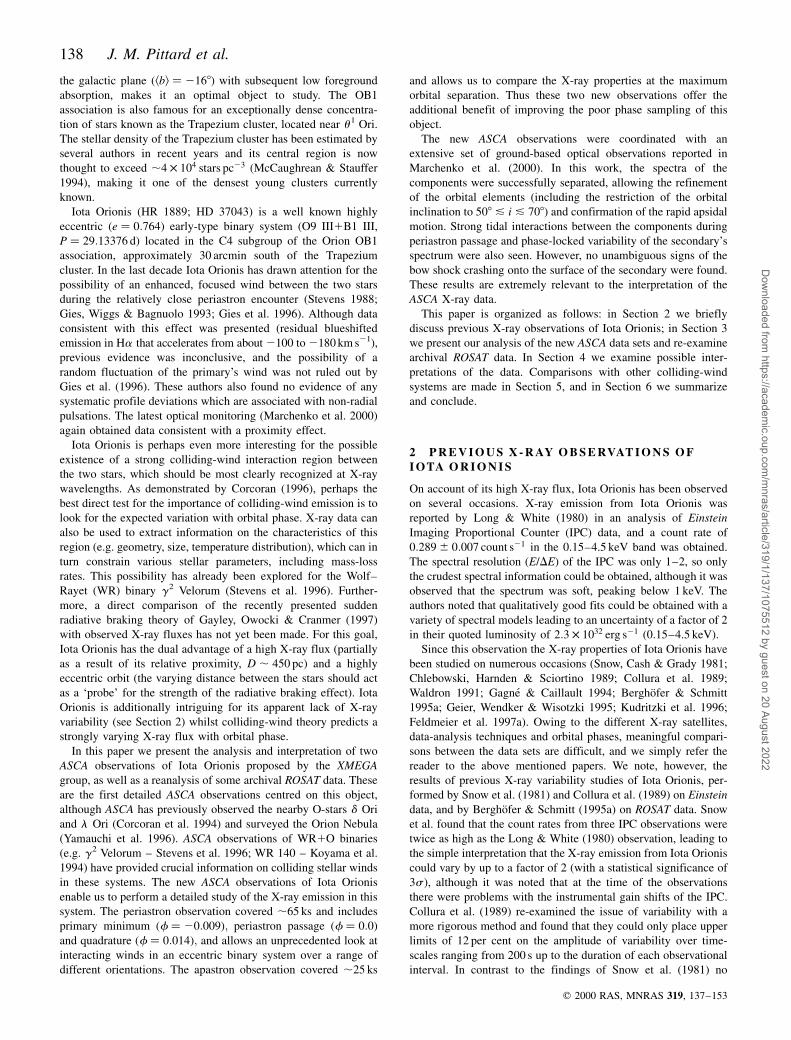
First the fit-statistic parameter space was investigated for false
or unphysical minima. This is shown in Fig. 5 for a single-
temperature RS model fitted to the SIS0 and GIS2 periastron data.
It is clear that there are no additional minima between the two
shown, and the SIS0 minimum in particular is very compact.
However, at very high confidence levels there is a noticeable
extension of the GIS2 confidence region towards the SIS0
minimum. Despite this the results seem to be totally incompatible
with each other. Other possible explanations for the observed
discrepancy are offered below.
(i) Degradation of the SIS instruments. The HEASARC website
(http://heasarc.gsfc.nasa.gov/docs/asca/watchout.html) reports that
there is clear evidence for a substantial divergence of the SIS0 and
SIS1 detectors since late 1994, with even earlier divergence
between the SIS and GIS data. It is also noted that both the SIS0
and SIS1 efficiencies below 1 keV have been steadily decreasing
over time, which at 0.6 keV can be as much as 20 per cent for data
taken in 1998. The loss in low-energy efficiency manifests itself as
a higher inferred column density, introducing an additional NH
uncertainty of a few times 1020 cm22. This is consistent with our
results where the SIS detectors return higher values of NH than the
GIS (see Table 3), although we note that the difference in our fits
can often be much larger. An increasing divergence of the SIS and
GIS spectra in the energy range below 1 keV has also been noted
Figure 4. Two-temperature Raymond±Smith spectral model fits to the
combined SIS0 and SIS1 data (upper panel) and the combined GIS2 and
GIS3 data (lower panel) from the entire periastron observation. Both
spectral components and the combined model are shown, together with the
data. A minimum of 10 counts is in each data bin.
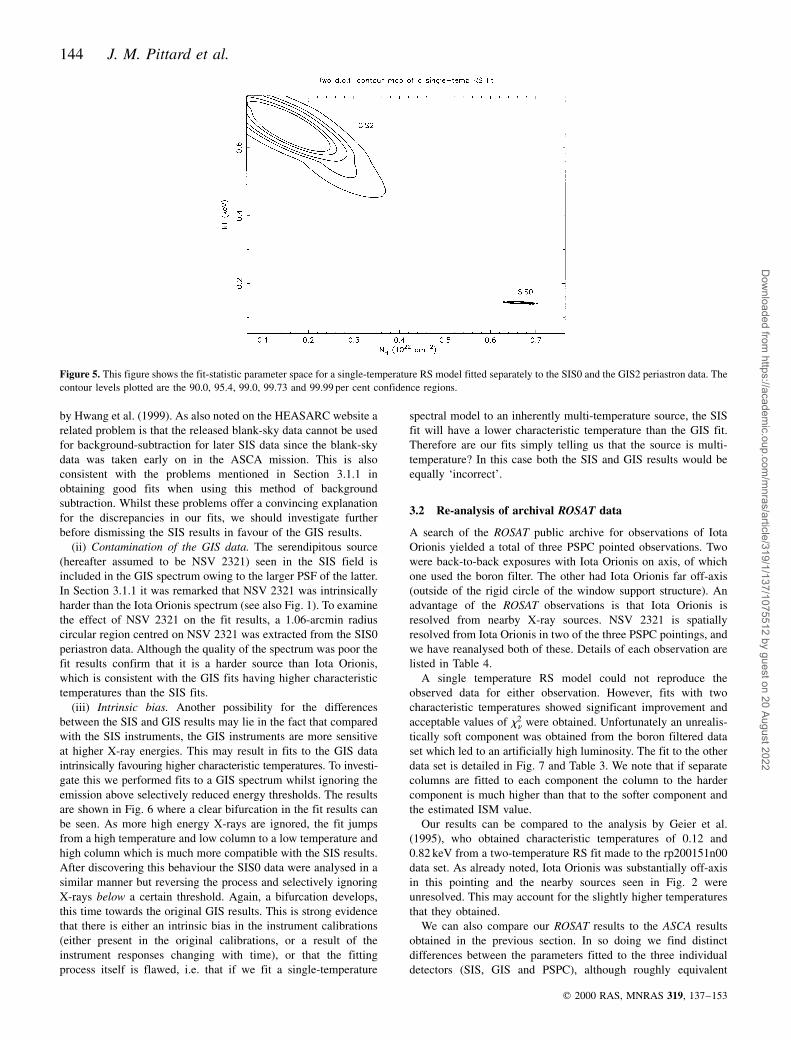
Table 3. Two-temperature spectral fitting results. Fits made to the combined SIS0 and SIS1 data sets and the combined GIS2 and GIS3data sets are shown, as well as that to an archive ROSAT data set (see Table 4). The estimated ISM column is 2:0 � 1020 cm22: Theemission measure and luminosities (0.5±2.5 keV) were calculated assuming a distance of 450 pc. The emission measure to the softcomponent of the rf200700n00 fit could not be constrained and led to unrealistic luminosities. Consequently we do not include it here.Many other spectral models were also examined (see main text) but for conciseness and simplicity we do not report them here.
Data NH kT1 kT2 EM1 EM2 x2n Lx(int) Lx(abs)
(1021 cm22) (keV) (keV) (1054 cm23) (1054 cm23) (DOF) (1032 erg s21) (1032 erg s21)
Periastron SIS 5:0710:2820:28 0:1410:01
20:01 0:6110:0220:02 260161
261 4:610:520:5 2.06 (225) 20.17 1.04
Apastron SIS 3:9010:5320:53 0:1510:01
20:01 0:6110:0320:03 94147
247 4:110:720:7 2.06 (143) 8.99 1.00
Periastron GIS 1:9710:5520:76 0:6110:05
20:04 3:1212:3120:92 6:0610:97
21:21 0:9410:3620:34 1.08 (381) 2.01 1.08
Apastron GIS 4:7311:4321:46 0:2510:10
20:07 2:1510:7020:58 681266
246 2:010:9620:65 0.77 (210) 12.3 1.46
rp200700n00 0:2810:4220:15 0:1110:03
20:05 0:7010:1320:14 26:71806
214:6 3:6310:7320:73 0.61 (11) 1.85 1.60
X-ray analysis of the eccentric O-star binary Iota Orionis 143
q 2000 RAS, MNRAS 319, 137±153
Dow
nloaded from https://academ
ic.oup.com/m
nras/article/319/1/137/1075512 by guest on 20 August 2022
by Hwang et al. (1999). As also noted on the HEASARC website a
related problem is that the released blank-sky data cannot be used
for background-subtraction for later SIS data since the blank-sky
data was taken early on in the ASCA mission. This is also
consistent with the problems mentioned in Section 3.1.1 in
obtaining good fits when using this method of background
subtraction. Whilst these problems offer a convincing explanation
for the discrepancies in our fits, we should investigate further
before dismissing the SIS results in favour of the GIS results.
(ii) Contamination of the GIS data. The serendipitous source
(hereafter assumed to be NSV 2321) seen in the SIS field is
included in the GIS spectrum owing to the larger PSF of the latter.
In Section 3.1.1 it was remarked that NSV 2321 was intrinsically
harder than the Iota Orionis spectrum (see also Fig. 1). To examine
the effect of NSV 2321 on the fit results, a 1.06-arcmin radius
circular region centred on NSV 2321 was extracted from the SIS0
periastron data. Although the quality of the spectrum was poor the
fit results confirm that it is a harder source than Iota Orionis,
which is consistent with the GIS fits having higher characteristic
temperatures than the SIS fits.
(iii) Intrinsic bias. Another possibility for the differences
between the SIS and GIS results may lie in the fact that compared
with the SIS instruments, the GIS instruments are more sensitive
at higher X-ray energies. This may result in fits to the GIS data
intrinsically favouring higher characteristic temperatures. To investi-
gate this we performed fits to a GIS spectrum whilst ignoring the
emission above selectively reduced energy thresholds. The results
are shown in Fig. 6 where a clear bifurcation in the fit results can
be seen. As more high energy X-rays are ignored, the fit jumps
from a high temperature and low column to a low temperature and
high column which is much more compatible with the SIS results.
After discovering this behaviour the SIS0 data were analysed in a
similar manner but reversing the process and selectively ignoring
X-rays below a certain threshold. Again, a bifurcation develops,
this time towards the original GIS results. This is strong evidence
that there is either an intrinsic bias in the instrument calibrations
(either present in the original calibrations, or a result of the
instrument responses changing with time), or that the fitting
process itself is flawed, i.e. that if we fit a single-temperature
spectral model to an inherently multi-temperature source, the SIS
fit will have a lower characteristic temperature than the GIS fit.
Therefore are our fits simply telling us that the source is multi-
temperature? In this case both the SIS and GIS results would be
equally `incorrect'.
3.2 Re-analysis of archival ROSAT data
A search of the ROSAT public archive for observations of Iota
Orionis yielded a total of three PSPC pointed observations. Two
were back-to-back exposures with Iota Orionis on axis, of which
one used the boron filter. The other had Iota Orionis far off-axis
(outside of the rigid circle of the window support structure). An
advantage of the ROSAT observations is that Iota Orionis is
resolved from nearby X-ray sources. NSV 2321 is spatially
resolved from Iota Orionis in two of the three PSPC pointings, and
we have reanalysed both of these. Details of each observation are
listed in Table 4.
A single temperature RS model could not reproduce the
observed data for either observation. However, fits with two
characteristic temperatures showed significant improvement and
acceptable values of x2n were obtained. Unfortunately an unrealis-
tically soft component was obtained from the boron filtered data
set which led to an artificially high luminosity. The fit to the other
data set is detailed in Fig. 7 and Table 3. We note that if separate
columns are fitted to each component the column to the harder
component is much higher than that to the softer component and
the estimated ISM value.
Our results can be compared to the analysis by Geier et al.
(1995), who obtained characteristic temperatures of 0.12 and
0.82 keV from a two-temperature RS fit made to the rp200151n00
data set. As already noted, Iota Orionis was substantially off-axis
in this pointing and the nearby sources seen in Fig. 2 were
unresolved. This may account for the slightly higher temperatures
that they obtained.
We can also compare our ROSAT results to the ASCA results
obtained in the previous section. In so doing we find distinct
differences between the parameters fitted to the three individual
detectors (SIS, GIS and PSPC), although roughly equivalent
Figure 5. This figure shows the fit-statistic parameter space for a single-temperature RS model fitted separately to the SIS0 and the GIS2 periastron data. The
contour levels plotted are the 90.0, 95.4, 99.0, 99.73 and 99.99 per cent confidence regions.
144 J. M. Pittard et al.
q 2000 RAS, MNRAS 319, 137±153
Dow
nloaded from https://academ
ic.oup.com/m
nras/article/319/1/137/1075512 by guest on 20 August 2022

attenuated luminosities. In particular, the ROSAT spectrum has a
significantly larger flux at soft energies.
3.3 The preferred data sets
This leads us to the crucial question: which data set do we have
most confidence in? The negative points of each are:
(i) the SIS data sets are invariably affected by the degradation of
the CCDs;
(ii) the GIS does not have a particularly good low energy
response and does not spatially resolve the close surrounding
sources which contaminate the subsequent analysis;
(iii) the PSPC has poor spectral resolution compared to the SIS
and GIS.
Despite the better spectral resolution of both instruments onboard
ASCA, it would seem (from the uncertainties mentioned in Section
3.1.4) that the ROSAT data set returns the most accurate spectral
fit parameters. However, the better spectral capabilities of ASCA
convincingly demonstrates that there is no significant variation in
the luminosity, spectral shape or absorption of the X-ray emission
between the periastron and apastron observations.
3.4 The X-ray luminosities
The attenuated (i.e. absorbed) X-ray luminosity in the 0.5±2.5 keV
band of the rp200700n00 ROSAT PSPC data set (fitted by a two-
temperature RS spectral model with one absorbing column) is
,1:6 � 1032 erg s21: As previously mentioned it is often not easy
to compare values with those estimated in previous papers because
of the different spectral models assumed, the various energy bands
over which the luminosities were integrated, the different methods
of background subtraction employed, and the possible contamina-
tion from nearby sources (e.g. NSV 2321). However, as reported
in Section 2, Long & White (1980) estimated an attenuated
luminosity of Lx � 2:3 � 1032 erg s21 from a single Einstein
IPC observation. Chlebowski et al. (1989) obtained Lx � 3:0 �1032 erg s21 from seven Einstein IPC pointings. These values are
within a factor of 2 of the observed ROSAT 0.5±2.5 keV
luminosity from the rp200700n00 data set �1:6 � 1032 erg s21�:This is not unexpected given the differences in the various
analyses. The 0.5±10.0 keV luminosities, from our analysis of the
ASCA data sets (,1:0 � 1032 erg s21�; are also in rough agreement
with the 0.5±2.5 keV ROSAT values, albeit slightly reduced for
both the periastron and apastron observations.
Because the ASCA data sets have much better spectral
resolution, it would be a missed opportunity if we did not take
advantage of this. Thus, whilst again acknowledging that the
ASCA results may be systematically incorrect, in Fig. 8 we show
the intrinsic and attenuated flux ratios of the periastron and
Figure 6. This figure shows the fit-statistic parameter space for a single-
temperature RS model fitted to a GIS2 spectrum extracted from a 2-arcmin
radius circle centred on Iota Orionis. The emission above certain energy
thresholds was ignored during the fit process. For the top, middle and
bottom panel these were 2.0, 1.7 and 1.2 keV respectively. The contour
levels plotted are the 68.3, 90.0 and 99.0 per cent confidence regions. The
change from one minimum to the other is clearly shown.
Table 4. Effective exposure times, background subtracted countrate and number of counts in the source region for the two ROSATPSPC observations examined. The `rf' data set was Boron filteredwhich blocks X-ray photons with energies between 0.188±0.28 keV.
Observation Phase Exp. Counts Count rate(s) (s21)
rp200700n00 0.1697±0.1841 746 1153 1.545rf200700n00 0.1841±0.1846 1305 489 0.374
X-ray analysis of the eccentric O-star binary Iota Orionis 145
q 2000 RAS, MNRAS 319, 137±153
Dow
nloaded from https://academ
ic.oup.com/m
nras/article/319/1/137/1075512 by guest on 20 August 2022
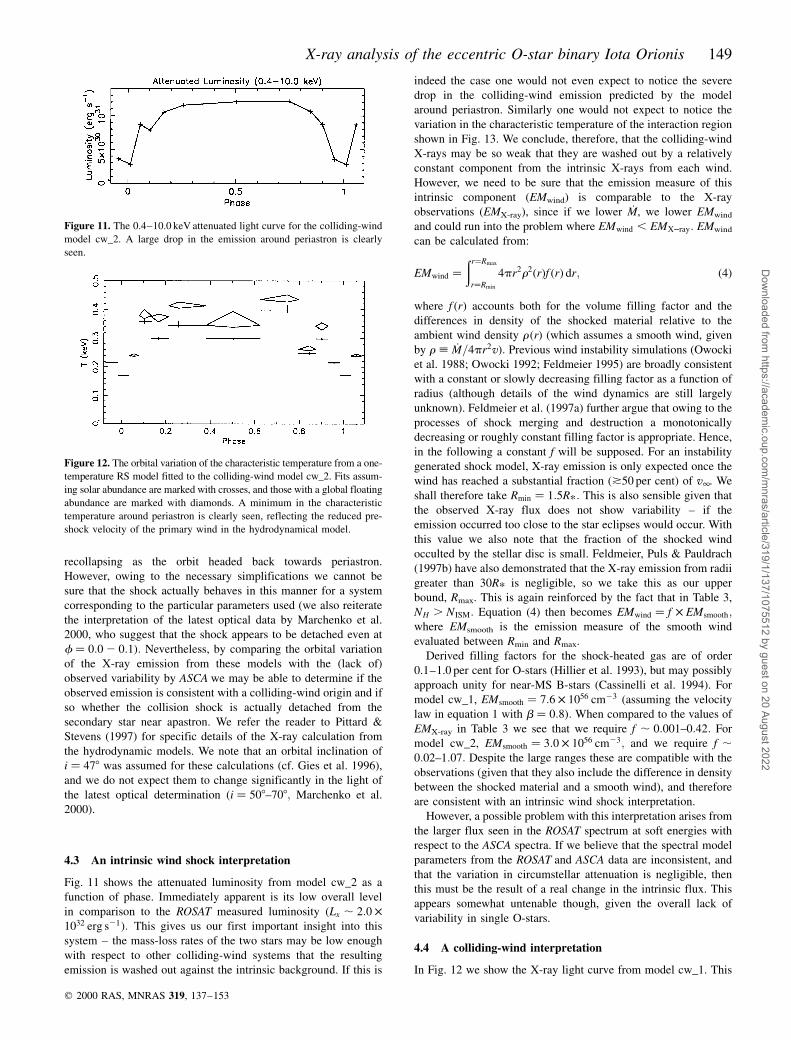
apastron observations. The fluxes are integrated in the energy
ranges 1.0±2.0, 2.0±3.0, 3.0±4.0, 4.0±5.0, 5.0±6.0 and 6.0±
7.0 keV although we note that the counts above 6.0 keV are
minimal. Two-temperature RS spectral model fits were made to
the combined SIS0 and SIS1 data, the combined GIS2 and GIS3
data, and all four data sets together. The top panel shows the
intrinsic flux ratio, whilst the lower panel shows the attenuated
flux ratio.
Immediately clear from Fig. 8 is the fact that the intrinsic
luminosity from the fit of all four data sets is almost constant
between periastron and apastron, and this is also basically the case
for the attenuated luminosity. If the majority of the X-ray emission
was the result of colliding-wind, one would expect the X-ray flux
at periastron to be near maximum, since Lx is proportional to 1/D.
However, at energies above ,1 keV, the intrinsic Lx could be
severely reduced around periastron as the shorter distance between
the stars decreases the maximum pre-shock wind velocities. These
effects are not seen.
Assuming that the bolometric luminosity of the Iota Orionis
system is Lbol � 2:5 � 105 L( (Stickland et al. 1987), we obtain
log Lx=Lbol � 26:78 from the observed ROSAT luminosity. This
compares to a value of 26:6010:1620:17 deduced from an Einstein
observation (Chlebowski et al. 1989). It is in even better
agreement with the new results of BerghoÈfer et al. (1997) who
obtain log Lx=Lbol � 26:81 �s � 0:38� for stars of luminosity
classes III±V and colour index �B 2 V� & 20:25; which are
appropriate for Iota Orionis. These results suggest that any
emission from a colliding-wind shock is at a low level (,50 per
cent of the total emission), consistent with the lack of variability
between the ASCA pointings. We also repeat at this point the
comment made by Waldron et al. (1998) on the validity of the
Lx/Lbol relationship: that the canonical ratio �Lx=Lbol , 1027�should only be interpreted as an observed property of X-ray
emission from OB stars.
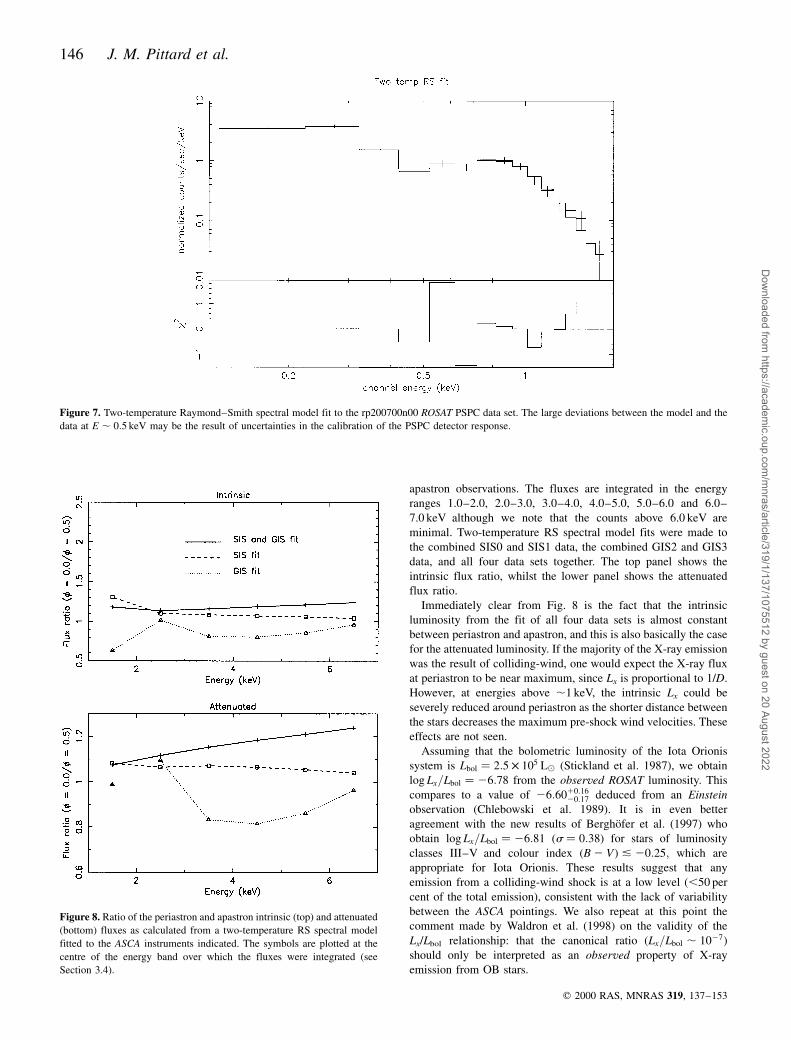
Figure 7. Two-temperature Raymond±Smith spectral model fit to the rp200700n00 ROSAT PSPC data set. The large deviations between the model and the
data at E , 0:5 keV may be the result of uncertainties in the calibration of the PSPC detector response.
Figure 8. Ratio of the periastron and apastron intrinsic (top) and attenuated
(bottom) fluxes as calculated from a two-temperature RS spectral model
fitted to the ASCA instruments indicated. The symbols are plotted at the
centre of the energy band over which the fluxes were integrated (see
Section 3.4).
146 J. M. Pittard et al.
q 2000 RAS, MNRAS 319, 137±153
Dow
nloaded from https://academ
ic.oup.com/m
nras/article/319/1/137/1075512 by guest on 20 August 2022

4 I N T E R P R E TAT I O N
In the previous sections we have reported some very puzzling
results. Iota Orionis was previously thought likely to have a
colliding-wind signature which would show significantly different
characteristics between periastron and apastron, and which would
act as a test-bed for the latest colliding-wind theories, such as
radiative braking. Although there are concerns over the accuracy
of the ASCA data and the absolute values of the fit results, it is still
possible to compare relative differences between the periastron
and apastron observations. However, we find that the ASCA X-ray
light curves and fitted spectra show incredibly little difference
between the two pointings.
The extracted spectra also have lower characteristic tempera-
tures than originally expected, especially for the apastron
observation where the primary's wind should collide with either
the secondary's wind or its photosphere at close to its terminal
velocity (see Pittard 1998).
So, the issue is why there is not an obvious colliding-wind
X-ray signal in Iota Orionis. Given the evidence for colliding
winds in other systems it seems unlikely that there is something
fundamentally wrong with the colliding-wind paradigm. Two
interpretations are therefore possible. One is that the majority of
the observed emission is from intrinsic shocks in the winds of one
or both stars (cf. Feldmeier et al. 1997a and references therein)
which dominates a weaker colliding-wind signal. In this scenario
the variation of the observed emission with orbital separation
would be expected to be small given the large emitting volume
and the lack of substantial intrinsic variability. Alternatively the
emission could be from a colliding-wind origin but in a more
complex form than one would naively expect. In the following
subsections we focus our attention on each of these in turn.
4.1 The circumstellar absorption
Before discussing the merits and faults of each of these scenarios,
it is important to have a good understanding of the level and
variability of the circumstellar absorption in the system. In
Feldmeier et al. (1997a) a model for the wind attenuation of the
primary star was derived from modelling of the UV/optical
spectrum. They concluded that the wind of the primary O-star is
almost transparent to X-rays. If the attenuation is indeed
negligible then (since the intrinsic X-ray colliding-wind luminos-
ity is expected to change as 1/D) we would expect to see
variability in the ASCA data. The fact that we do not has led us to
re-consider the attenuation in the system from a colliding-wind
perspective, and we have calculated the absorbing column to the
apex of the wind collision region as a function of orbital phase.
This gives us an idea of the transparency of the wind along the line
of sight to the shock apex. The basic assumptions involved in the
construction of this model are as follows.
(i) The winds of both stars are spherically symmetric and are
characterized by the velocity law
v�r� � v1 1:0 2Rp
r
� �b
; �1�
where b � 0:8:(ii) The wind collision shock apex is determined solely by a
ram-pressure momentum balance. No radiation effects such as
radiative inhibition or braking are included.
(iii) Where no ram-pressure balance exists the shock collapses
onto the photosphere of the secondary and the apex is therefore
located where the line of centres intersects the secondary surface.
(iv) The shock is not skewed by orbital motion.
(v) The shock half-opening angle, u , is determined from the
equation
u . 1 2h2=5
4
� �h1=3 �2�
for 1024 # h # 1; where
h � _M2v2
_M1v1
: �3�
v1 and v2 are the pre-shock velocities of the primary and
secondary winds at the shock apex. This is basically the equation
presented in Eichler & Usov (1993) but modified for non-terminal
velocity winds.
The line of sight to Earth from the shock apex is calculated and
the circumstellar absorbing column along it evaluated from
knowledge of the wind density and the position of the shock
cone. The ISM absorption is not added because it is constant with
orbital phase and we are primarily interested in the variation (and
it is also much smaller at NH , 2:0 � 1020 cm22�:The orbit assumed for the calculation is shown in Fig. 9. It is
based on the cw_1 model presented in Pittard (1998). The
direction of Earth is marked, as well as the position of the
secondary star relative to the primary at various phases. In Fig. 10
we show the resulting orbital variability of the circumstellar
column with orbital and stellar parameters appropriate for Iota
Orionis (the values used were again for model cw_1 in Pittard
1998, which for convenience we list in Table 5) with a range of
orbital inclinations. For i � 908 the numerical results were
checked against an analytical form.
Unlike binaries with circular orbits, the circumstellar column as
a function of phase for an inclination i � 08 is not constant, being
lower at apastron than at periastron. In Fig. 10 this variation is
approximately an order of magnitude. This is a direct result of the
density of the primary's wind enveloping the shock cone, being
higher at periastron than at apastron, which mostly reflects the
combination of the change in the orbital separation and the pre-
shock velocity of the primary.
At higher inclinations �i * 308� the shock apex is occulted by
the secondary star just before periastron. This is shown by a gap in
the curves in Fig. 10. At i � 908 the primary star also occults the
shock apex. On account of the large volume of any colliding winds
X-ray emission, these occultations are not expected to have any
observational X-ray signatures. At inclinations i * 308 the
maximum value of the circumstellar column becomes more
asymmetric, and shifts in phase to where the shock apex is
`behind' the primary (i.e. f , 0:15 ± see Fig. 9). The orbital
inclination has just been recalculated to lie in the range i �508±708 (cf. Marchenko et al. 2000).
Comparing these results with the fitted columns in Table 3 is
difficult, although they are of the correct order of magnitude.
Assuming an ionized wind temperature of ,104 K, the t � 1
optical depth surface occurs at NH , 2 � 1021 cm22 and NH ,6 � 1021 cm22 for 0.5 and 1.0 keV photons respectively (cf. for
example, Krolick & Kallman 1984). This difference is mostly the
result of the oxygen K-edge. Thus as Fig. 10 shows, the wind is
indeed largely transparent at both of these energies, and for
realistic values of the mass-loss rates. Only at phases near f � 0:0;where NH , 1022 cm22; does the absorption begin to become
appreciable (this is one of the causes of the X-ray minima in
X-ray analysis of the eccentric O-star binary Iota Orionis 147
q 2000 RAS, MNRAS 319, 137±153
Dow
nloaded from https://academ
ic.oup.com/m
nras/article/319/1/137/1075512 by guest on 20 August 2022

Figs 11 and 12). We therefore face two hard questions. First, given
the near transparency of the wind throughout most of the orbit,
why do we not see the intrinsic variation in the colliding-wind X-
ray luminosity? Secondly, why do we not see enhanced absorption
in our periastron observation? In the hope of providing
satisfactory answers to these questions we have calculated the
expected colliding-wind X-ray emission from a complicated
hydrodynamical model, as detailed in the following section.
4.2 The cw_1 and cw_2 models
In this section we investigate in greater depth whether a
colliding-wind model can be consistent with the lack of variability
in the characteristic temperature and count rate of the ASCA data
and the unremarkable X-ray luminosity of this system. In
particular, we have two questions: (i) is the X-ray luminosity
from the wind collision low enough that the expected phase
variability is lost in the intrinsic background; (ii) are radiative
braking effects stronger than anticipated and can they provide an
explanation for both the low luminosity and the constant X-ray
temperatures?
Hydrodynamical models of the wind collision in Iota Orionis
with h � 31 and 72 (with terminal velocity values input as v1 and
v2) were presented in Pittard (1998). These simulations included
the realistic driving of the winds by the radiation field of each star
by using the line-force approximations of Castor, Abbott & Klein
(1975). This approach allows the dynamics of the winds and
radiation fields to be explored, and a number of interesting and
significant effects have been reported (e.g. Stevens & Pollock
1994; Gayley, Owocki & Cranmer 1997, 1999). We refer the
reader to these papers for a fuller discussion.
In Pittard (1998) it was found that the colliding-wind shock
always collapsed down onto the surface of the secondary star
during periastron passage. On the other hand, there were large
differences in the dynamics of the shock throughout the rest of the
orbit. For model cw_2 the shock remained collapsed throughout
the entire orbit, whilst for model cw_1 the shock lifted off the
surface of the secondary as the stars approached apastron, before
Figure 9. The assumed orbit in the frame of reference of the primary (marked with a cross at 0,0) for the cw_1 model. The direction of Earth is marked with
an arrow. At periastron the line of sight into the system may be through the secondary wind for a very short period. This is mainly dependent on the
inclination angle of Iota Orionis, which is poorly known. The phases, f , over which the ASCA and ROSAT exposures were made are delineated by diamonds.
Also indicated are the phases corresponding to the images in fig. 1 of Pittard (1998) and the light curve in Fig. 12 (see Section 4.1).
Figure 10. Circumstellar column to the colliding-wind shock apex as a
function of orbital phase for the same stellar parameters as used for model
cw_1. The inclination of Iota Orionis is not well known so we show results
for four sets of inclination (solid: i � 908; dash: i � 608; dot-dash: i � 308;
dot: i � 08�: The latest observational determination puts it at between 508
and 708 (Marchenko et al. 2000). Gaps in the curves indicate stellar
occultation.
Table 5. Parameters used for the hydrodyna-mical models cw_1 and cw_2 ± see Pittard(1998) for a discussion of the observationalestimates. A subscript 1 (2) indicates the valuefor the primary (secondary) star.
Parameter Model cw_1 Model cw_2
MÇ 1 (M( yr21) 6.16�1027 3.06�1027
MÇ 2 (M( yr21) 1.88�1028 5.10�1029
v11 (km s21) 2300 2380v12 (km s21) 2200 1990
148 J. M. Pittard et al.
q 2000 RAS, MNRAS 319, 137±153
Dow
nloaded from https://academ
ic.oup.com/m
nras/article/319/1/137/1075512 by guest on 20 August 2022
recollapsing as the orbit headed back towards periastron.
However, owing to the necessary simplifications we cannot be
sure that the shock actually behaves in this manner for a system
corresponding to the particular parameters used (we also reiterate
the interpretation of the latest optical data by Marchenko et al.
2000, who suggest that the shock appears to be detached even at
f � 0:0 2 0:1�: Nevertheless, by comparing the orbital variation
of the X-ray emission from these models with the (lack of)
observed variability by ASCA we may be able to determine if the
observed emission is consistent with a colliding-wind origin and if
so whether the collision shock is actually detached from the
secondary star near apastron. We refer the reader to Pittard &
Stevens (1997) for specific details of the X-ray calculation from
the hydrodynamic models. We note that an orbital inclination of
i � 478 was assumed for these calculations (cf. Gies et al. 1996),
and we do not expect them to change significantly in the light of
the latest optical determination �i � 508±708; Marchenko et al.
2000).
4.3 An intrinsic wind shock interpretation
Fig. 11 shows the attenuated luminosity from model cw_2 as a
function of phase. Immediately apparent is its low overall level
in comparison to the ROSAT measured luminosity �Lx , 2:0 �1032 erg s21�: This gives us our first important insight into this
system ± the mass-loss rates of the two stars may be low enough
with respect to other colliding-wind systems that the resulting
emission is washed out against the intrinsic background. If this is
indeed the case one would not even expect to notice the severe
drop in the colliding-wind emission predicted by the model
around periastron. Similarly one would not expect to notice the
variation in the characteristic temperature of the interaction region
shown in Fig. 13. We conclude, therefore, that the colliding-wind
X-rays may be so weak that they are washed out by a relatively
constant component from the intrinsic X-rays from each wind.
However, we need to be sure that the emission measure of this
intrinsic component (EMwind) is comparable to the X-ray
observations (EMX-ray), since if we lower MÇ , we lower EMwind
and could run into the problem where EMwind , EMXÿray: EMwind
can be calculated from:
EMwind ��r�Rmax
r�Rmin
4pr2r2�r�f �r� dr; �4�
where f �r� accounts both for the volume filling factor and the
differences in density of the shocked material relative to the
ambient wind density r (r) (which assumes a smooth wind, given
by r ; _M=4pr2v�: Previous wind instability simulations (Owocki
et al. 1988; Owocki 1992; Feldmeier 1995) are broadly consistent
with a constant or slowly decreasing filling factor as a function of
radius (although details of the wind dynamics are still largely
unknown). Feldmeier et al. (1997a) further argue that owing to the
processes of shock merging and destruction a monotonically
decreasing or roughly constant filling factor is appropriate. Hence,
in the following a constant f will be supposed. For an instability
generated shock model, X-ray emission is only expected once the
wind has reached a substantial fraction (*50 per cent) of v1. We
shall therefore take Rmin � 1:5Rp: This is also sensible given that
the observed X-ray flux does not show variability ± if the
emission occurred too close to the star eclipses would occur. With
this value we also note that the fraction of the shocked wind
occulted by the stellar disc is small. Feldmeier, Puls & Pauldrach
(1997b) have also demonstrated that the X-ray emission from radii
greater than 30Rp is negligible, so we take this as our upper
bound, Rmax. This is again reinforced by the fact that in Table 3,
NH . NISM: Equation (4) then becomes EMwind � f � EMsmooth;where EMsmooth is the emission measure of the smooth wind
evaluated between Rmin and Rmax.
Derived filling factors for the shock-heated gas are of order
0.1±1.0 per cent for O-stars (Hillier et al. 1993), but may possibly
approach unity for near-MS B-stars (Cassinelli et al. 1994). For
model cw_1, EMsmooth � 7:6 � 1056 cm23 (assuming the velocity
law in equation 1 with b � 0:8�: When compared to the values of
EMX-ray in Table 3 we see that we require f , 0:001±0:42: For
model cw_2, EMsmooth � 3:0 � 1056 cm23; and we require f ,0:02±1:07: Despite the large ranges these are compatible with the
observations (given that they also include the difference in density
between the shocked material and a smooth wind), and therefore
are consistent with an intrinsic wind shock interpretation.
However, a possible problem with this interpretation arises from
the larger flux seen in the ROSAT spectrum at soft energies with
respect to the ASCA spectra. If we believe that the spectral model
parameters from the ROSAT and ASCA data are inconsistent, and
that the variation in circumstellar attenuation is negligible, then
this must be the result of a real change in the intrinsic flux. This
appears somewhat untenable though, given the overall lack of
variability in single O-stars.
4.4 A colliding-wind interpretation
In Fig. 12 we show the X-ray light curve from model cw_1. This
Figure 11. The 0.4±10.0 keV attenuated light curve for the colliding-wind
model cw_2. A large drop in the emission around periastron is clearly
seen.
Figure 12. The orbital variation of the characteristic temperature from a one-
temperature RS model fitted to the colliding-wind model cw_2. Fits assum-
ing solar abundance are marked with crosses, and those with a global floating
abundance are marked with diamonds. A minimum in the characteristic
temperature around periastron is clearly seen, reflecting the reduced pre-
shock velocity of the primary wind in the hydrodynamical model.
X-ray analysis of the eccentric O-star binary Iota Orionis 149
q 2000 RAS, MNRAS 319, 137±153
Dow
nloaded from https://academ
ic.oup.com/m
nras/article/319/1/137/1075512 by guest on 20 August 2022

time the colliding-wind emission is much stronger (owing to the
higher mass-loss rates assumed ± see Table 5), and is again very
variable. At the phases corresponding to the ASCA data the
synthetic light curve is at local minima, and consistent with the
observed luminosity2. The model light curve also predicts that
the observed luminosity at phase f � 0:17 should be higher than
those at phases f � 0:0 and 0.5, with the latter at roughly the
same level3. From Table 3 we indeed find that this is the case, with
the ROSAT luminosity matching the predicted light curve almost
exactly4. One slight worry is that the two Einstein observations at
phases f , 0:90 and 0.97 do not show a significant enhancement
in count rate with respect to the observation at phase f � 0:59: It
would therefore be clearly useful to obtain new observations at
these phases.
The orbital variation of the characteristic temperature fitted to
the colliding-wind region of model cw_1 is shown in Fig. 14. Our
best estimate of the temperature varies from ,0.2 keV at
periastron to ,0.3±0.4 keV at apastron. This temperature variation
is much less than expected from a simple consideration of the
variation of the pre-shock velocities along the line of centres, and
reflects the fact that the fitted temperature is an average over the
entire post-shock region. The temperatures predicted by the model
are comparable with the observed data and we thus conclude that
this model demonstrates that the observed emission does not allow
us to discard a colliding-wind interpretation.
4.5 Other possibilities/factors
Another intriguing possibility is that radiative braking in the Iota
Orionis system is actually quite efficient (more so than the
predictions of both models cw_1 and cw_2). This might also
explain the inference of Marchenko et al. (2000) that the shock is
lifted off the surface of the secondary around periastron. This
would require strong coupling between the B-star continuum and
the primary wind, but cannot be ruled out by our present
understanding. In the adiabatic limit (which is a good approxima-
tion for the wind collision in Iota Orionis at apastron), Stevens,
Blondin & Pollock (1992) determined that
Lx / _M2v23:2D21�1 1���hp �=h2; �5�
where it was assumed that the temperature dependence of the
cooling curve was L / T20:6: This latter assumption is appro-
priate for post-shock gas in the temperature range ,105±107 K,
which corresponds to pre-shock velocities of up to ,1000 km s21
for solar abundance material. (Note: there is a typographical error
in the corresponding equation of Stevens & Pollock 1994).
Assuming that h is small (i.e. that the wind of the primary
dominates) we then find that to first order, Lx / v21:2: Thus the
X-ray luminosity is almost inversely proportional to the pre-shock
velocity of the primary wind. A reduction of 10 (50) per cent in
the latter leads to an increase in the emission of 13 (130) per cent.
Conversely, we find, from the equations in Usov (1992), that
Lx / v25=2 for the shocked primary wind and Lx / v1=2 for the
shocked secondary wind. For model cw_1 the emission from the
latter appears to be dominant. Hence, for the same variations in
the pre-shock velocity as discussed above, the emission is reduced
by 5 and 30 per cent respectively. The discrepancy between
these two sets of results is because of the different assumptions on
the form of the cooling curve. Usov (1992) assumed cooling
Figure 13. The 0.4±10.0 keV attenuated light curve for the colliding-wind
model cw_1. The small crosses (joined by the solid line) were calculated
from the frames in fig. 1 of Pittard (1998) at the phases indicated on Fig. 9.
A large drop in the emission around periastron is clearly seen. However,
when the shock detaches from the secondary in this model a much larger
grid is required to `capture' all of the X-ray emission ± this is shown by the
dotted line. Also marked on this figure are the observed luminosities from
the ASCA and ROSAT pointings. The uncertainty in the count rates is a
minimum of 1.2 per cent for the SIS0 periastron data, rising to a maximum
of 4.3 per cent for the GIS2 apastron data. However, owing to the
uncertainties in the spectral shapes we conservatively assume a ^20 per
cent error in their resultant luminosities. A very good fit is obtained if one
retains a healthy scepticism about the exact size/depth of the periastron
minimum in the model, where our assumption of axisymmetry is least
valid. We also mark on the relative count rates of the three Einstein
observations reported by Snow et al. (1981). Because the conversion from
count rate to luminosity is poorly known for these observations we have
assumed uncertainties of ^35 per cent and arbitrarily adjusted their scaling
to best fit our model curve.
Figure 14. The orbital variation of the characteristic temperature from a
one-temperature RS model fitted to the colliding-wind model cw_1. Fits
assuming solar abundance are marked with crosses, and those with a global
floating abundance are marked with diamonds. A minimum in the
characteristic temperature around periastron is clearly seen, reflecting the
reduced pre-shock velocity of the primary wind in the hydrodynamical
model. Note that unrealistically high values (.1 keV) are obtained over
the range 0:2 & f & 0:9 owing to the grid not capturing all of the
emission. The rectangles and ellipses show the correct results of solar and
floating abundance fits to a larger hydrodynamical grid over this phase
range. Thus the characteristic temperature is within the range 0.2±0.4 keV
over the entire orbital phase.
2 We note that the equations of Usov (1992) give unattenuated luminosities
roughly an order of magnitude below the results of our numerical calculations.3 There is some uncertainty in the true luminosity during the periastron
passage because the assumption of axisymmetry is poor at these phases,
and additionally the optical data suggests that the wind collision region
does not collapse onto the surface of the secondary.4 We note that the quoted GIS Lx �f � 0:5� is much higher than the GIS Lx
�f � 0:0� value. We conclude that this is the result of uncertainties in the
spectral fit parameters because the GIS background subtracted count rates
are nearly identical from Table 2.
150 J. M. Pittard et al.
q 2000 RAS, MNRAS 319, 137±153
Dow
nloaded from https://academ
ic.oup.com/m
nras/article/319/1/137/1075512 by guest on 20 August 2022

dominated by bremsstrahlung (i.e. L / T1=2�; which is more
appropriate at higher temperatures �T . 107 K�: Clearly then, the
situation is rather confusing at present, not least because the actual
position of the colliding-wind region relative to the two stars is
very poorly known, as is the relative mass-loss rates of the stars. It
is therefore difficult for us to be any more quantitative without
performing a rigorous parameter-space study.
It is also possible that the characteristics of the emission may
be altered by other physical processes. In investigating how
electron thermal conduction may affect colliding-wind X-ray
emission, Myasnikov & Zhekov (1998) discovered that pre-
heating zones in front of the shock have the overall effect of
increasing the density of the wind interaction region. The
resulting X-ray emission was found to change markedly, with a
large increase in luminosity and a significant softening of the
spectrum. Softer X-rays suffer significantly higher absorption so
the resulting observed emission may have an unremarkable
luminosity. Whether the observed emission would show orbital
variability is not clear at this stage.
Finally, complex mutual interactions between the various
physical processes occurring in colliding-wind systems may also
significantly alter the resultant emission. For instance, Folini &
Walder (2000) suggest that the effects of thermal conduction and
radiative braking may positively reinforce each other. We are a
long way from performing numerical simulations which would
investigate this.
5 C O M PA R I S O N W I T H OT H E R
C O L L I D I N G - W I N D S Y S T E M S
Most early-type systems with strong colliding-wind signatures are
WR1OB binaries. These are different from OB1OB systems in a
number of ways which may explain why it appears that stronger
colliding-wind signatures are obtained from WR1OB systems.
First, the high values of MÇ WR provide more wind material which
can be shocked. Secondly, the spectral emissivity for WC wind
abundances is greater than that for solar abundances at the same
mass-density (i.e. mass-loss rate ± see Stevens et al. 1992).
However, both of these points may also act in reverse (high mass-
loss rates also provide more absorption, and the emissivity of WN
wind abundances for a given mass density is below that of solar).
At this point it is therefore instructive to compare the X-ray
characteristics of Iota Orionis with other early-type binary
systems. The latter can be subdivided into three distinct groups
as detailed in the following subsections.
5.1 Those with strong colliding-wind signatures
Into this group fall the well-known binaries WR 140 (HD 193793)
and g2 Velorum (WR 11, HD 68273). Both these systems show
clear evidence for colliding stellar winds including phase-variable
emission and a hard spectrum. WR 140 (WC71O4-5, P � 7:94 yr�is famous for its episodic dust formation during periastron passage
(Williams et al. 1990). Strong X-ray emission from WR 140 was
discovered by EXOSAT and its progressive extinction with phase
by the WC7 wind has been used to derive the CNO abundances of
the WR wind (Williams et al. 1990). Possible non-thermal X-ray
emission has also recently been discovered in this system, as
witnessed by the variability of the Fe K line (Pollock, Corcoran &
Stevens 1999).
ROSAT observations of g2 Velorum (WC81O9I, P � 78:5 d�
were presented by Willis, Schild & Stevens (1995). The hard
X-ray flux showed a phase repeatable increase by a factor of 4
when the system was viewed through the less-dense wind of the
O-star, which was attributed to the addition of a harder component
to the largely unvarying softer emission. More recent ASCA
observations (Stevens et al. 1996, and a re-analysis by Rauw et al.
2000) confirmed these results. A detailed comparison of these data
with synthetic spectra generated from a grid of hydrodynamical
colliding-wind models provided evidence that the hard X-ray
emission comes directly from the wind collision.
5.2 Those showing some evidence of colliding winds
The best example of this category is V444 Cyg (WR 139, HD
193576), a well-studied eclipsing WN51O6 binary with an orbital
period P � 4:21 d and well known physical parameters. Corcoran
et al. (1996) confirmed from phase-resolved ROSAT observations
that although the luminosity was 1±2 orders of magnitude lower
than the predictions of Stevens et al. (1992), there was an orbital
dependence of the flux. This on its own did not completely rule
out the O-star being the source of the X-rays, although fairly
convincing evidence for colliding winds remained. First, the high
value of the characteristic temperature outside of eclipse �kT ,1:7 keV� was much greater than the typical temperatures of single
O-stars �kT , 0:5 keV�: Secondly, the variation of the emission
was consistent with a shock location near the O-star surface, as
would be expected given the higher mass-loss rate of the WR star
and previous deductions from ultraviolet IUE (International
Ultraviolet Explorer) observations (Shore & Brown 1988).
Finally, the assumption of instantaneous terminal wind velocity
overestimates the observed X-ray luminosity. More recent ASCA
(Maeda et al. 1999) and optical (Marchenko et al. 1997) obser-
vations of this system have reinforced this interpretation. How-
ever, some puzzling X-ray characteristics remain such as large
amplitude short time-scale variability which is not easily
explained by a colliding-wind model (Corcoran et al. 1996).
Another system which shows some, but not overwhelming,
characteristics of colliding winds is 29 UW Canis Majoris (HR
2781; HD 57060). This is also a short-period �P � 4:3934 d�eclipsing binary system. ROSAT X-ray observations presented by
BerghoÈfer & Schmitt (1995b) showed phase-locked variability
with a single broad trough centred near secondary minimum.
However a colliding-wind interpretation was dismissed by the
authors on the assumption that the wind momenta of the com-
ponent stars were broadly similar and thus that the shocked region
was nearly planar (Wiggs & Gies 1993). Such a scenario should
form a double-peaked light curve (e.g. Pittard & Stevens 1997)
and the majority of the emission was therefore attributed to the
secondary's wind. The unremarkable X-ray luminosity also
seemed in accordance with single O-star emission. However, if
the wind momenta are much more imbalanced than believed, the
light curve would be expected to have a single broad minimum, in
agreement with the observations. HD 57060 also suffers from the
Struve±Sahade effect (Gies, Bagnuolo & Penny 1997; Stickland
1997), and whilst the cause of this remains uncertain, colliding
stellar winds is one possible interpretation. We therefore conclude
that colliding winds may still be significant in this system.
Other strong candidates for colliding-wind emission include
HD 93205 and HD 152248 (cf. Corcoran 1996), both of which are
due to be observed with the XMM±Newton satellite, and HD
165052 (see Pittard & Stevens 1997 for more details).
X-ray analysis of the eccentric O-star binary Iota Orionis 151
q 2000 RAS, MNRAS 319, 137±153
Dow
nloaded from https://academ
ic.oup.com/m
nras/article/319/1/137/1075512 by guest on 20 August 2022

5.3 Those with no colliding-wind signature
Many early-type binaries observed by X-ray satellites show no
signature of colliding-wind emission. For the most part this is
because the observations are generally short, the light curves
extremely sparse and the expected luminosities near or below
previous detection limits. However, one fairly bright frequently
observed system which shows no signs whatsoever of colliding-
wind emission is d Orionis A (HD 36486), a spectroscopic and
eclipsing binary (O9.5 II 1 B0 III) with a 5.7-d period. As far as
we know there has been no published paper which specifically
investigates any potential colliding-wind emission in this system.
6 C O N C L U S I O N S
In this paper we have analysed two ASCA X-ray observations of
the highly eccentric early-type binary Iota Orionis, which were
taken half an orbit apart at periastron and apastron. Although all
previous observations were short and without good phase
coverage, it was expected that a strong colliding-wind signature
would be seen. This expectation was based on the almost order of
magnitude variation in the orbital separation between these phases
and the known dependence of the X-ray luminosity of colliding
winds (and suspected dependence of the spectral shape) with this.
In turn it was hoped that this would reveal further insight into the
physics of radiative driving and stellar winds from early-type
stars, and in particular the additional interactions possible in
binary systems. Indeed, Iota Orionis was selected as a target
precisely because substantial changes were expected which would
allow us to `probe' the dynamics of the wind collision and infer
the amount of radiative braking/inhibition.
Although our analysis was complicated by various problems
experienced with the ASCA data sets, we found the emission to be
surprisingly constant and unvarying between the two observations,
in direct contradiction with our expectations. A further analysis of
archival ROSAT data demonstrated a relatively low X-ray
luminosity from this system of Lx , 1:0 2 1:6 � 1032 erg s21:Using a simple model we confirmed that the column along the line
of sight to the expected position of the shock apex was unlikely to
produce any significant attenuation of the shock X-rays, except
perhaps around periastron. Based on an expected 1/D variation in
the emission this did not help to explain our constant count rate,
and subsequently significantly more complex hydrodynamical
models were used to investigate the problem.
Despite strongly phase-variable emission from the models, both
were consistent with the observations. The model with the lower
mass-loss rates (cw_2) predicted attenuated luminosities an order
of magnitude below the observational data, implying that intrinsic
wind shocks emit the majority of the observed emission. On the
other hand, the model with the higher mass-loss rates (cw_1)
predicted minima in the colliding-wind emission which coincided
with the phases of the ASCA observations, and slightly enhanced
emission at the phase of the ROSAT observation. This was also
consistent with the data, implying that the observed emission
could also be interpreted as purely colliding-wind emission. In
Table 6 we summarize the strengths and weaknesses of each of
these.
Unfortunately it is impossible to distinguish between these two
interpretations with the limited data set currently available.
Additional observations are clearly needed. New data with
increased spatial resolution (to avoid source confusion from
objects such as NSV 2321), spectral resolution and counts (to
constrain spectral and luminosity variability), and phase coverage
is necessary if we are to begin distinguishing the competing
interpretations. Observations at other wavelengths to further refine
the system parameters (particularly the mass-loss rates of both
stars) are also desirable.
Finally we compare the Iota Orionis observations with those
obtained for other early-type binary systems. Although Iota
Orionis is not the first well-studied early-type binary to show no
clear signature of colliding-wind emission (d Orionis A is
another), it is the first binary with a highly eccentric orbit not to do
so. The lack of a clear colliding-wind signature in Iota Orionis
makes it noticeably different from other eccentric binaries (e.g.
WR 140, g2 Velorum) where such signatures are readily seen at
X-ray energies. Thus, Iota Orionis raises new open questions in
our understanding of early-type binaries. In particular, we would
like to know why the colliding-wind emission is not obvious in
Iota Orionis. Is it simply a result of the low mass-loss rates, a
particular combination of system parameters, or are there deeper
forces at work? This may be the first indication of the importance
of radiative braking on a line-driven wind.
AC K N OW L E D G M E N T S
We thank the XMEGA group for the opportunity of analysing the
ASCA data sets and John Blondin for the use of VH-1. In particular
we would like to acknowledge some very helpful comments from
various members of the XMEGA group. We acknowledge the
use of the Birmingham and Leeds Starlink nodes where the
calculations were performed. We are indebted to the developers
and maintainers of the X-ray packages xspec and xselect,
distributed by HEASARC, and of asterix, distributed by PPARC.
JMP gratefully acknowledges funding from the School of Physics
Table 6. Summary of the strengths and weaknesses of the two interpretations of the X-ray emission considered.
Intrinsic wind shocks Colliding winds
Pros Lack of variability in ASCA data. Light curve and spectra of model cw_1 are consistent with theobservational data, despite neither matching our initial simple expectations.
Low mass-loss rates of the stars can reduce CW emissionbut without running into problemswith the X-ray emission measure exceeding that of the wind.
Cons Circumstellar attenuation around periastron may be significant. Modelling is very difficult and contains a number of assumptionsand approximations.
Optical data suggests that the wind collision shock does not crashonto the surface of the secondary during periastron passage.
152 J. M. Pittard et al.
q 2000 RAS, MNRAS 319, 137±153
Dow
nloaded from https://academ
ic.oup.com/m
nras/article/319/1/137/1075512 by guest on 20 August 2022

& Astronomy at Birmingham, and the Department of Physics and
Astronomy at Leeds, and IRS acknowledges funding of a PPARC
Advanced Fellowship. This research has made use of the
SIMBAD astronomical database at the CDS, Strasbourg. Finally
we would like to thank the referee whose constructive comments
greatly improved this paper.
R E F E R E N C E S
BerghoÈfer T. W., Schmitt J. H. M. M., 1995a, Adv. Space Res., 16, 163
BerghoÈfer T. W., Schmitt J. H. M. M., 1995, in van der Hucht K. A.,
Williams P. M., eds, Proc. IAU Symp. 163, Wolf-Rayet Stars: Binaries;
Colliding winds; Evolution, Kluwer Academic Publishers. Dordrecht,
p. 382
BerghoÈfer T. W., Schmitt J. H. M. M., Danner R., Cassinelli J. P., 1997,
A&A, 322, 167
Caillault J.-P., Gagne M., Stauffer J. R., 1994, ApJ, 432, 386
Cassinelli J. P., Cohen D. H., MacFarlane J. J., Sanders W. T., Welsh B. Y.,
1994, ApJ, 421, 705
Castor J. I., Abbott D. C., Klein R. I., 1975, ApJ, 195, 157
Chlebowski T., Harnden F. R., Jr, Sciortino S., 1989, ApJ, 341, 427
Collura A., Sciortiono S., Serio S., Vaiana G. S., Harnden F. R., Jr, Rosner
R., 1989, ApJ, 338, 296
Corcoran M. F., 1996, RMAA Conf Ser., 5, 54
Corcoran M. F. et al., 1994, ApJ, 436, L95
Corcoran M. F., Stevens I. R., Pollock A. M. T., Swank J. H., Shore S. N.,
Rawley G. L., 1996, ApJ, 464, 434
Eichler D., Usov V. V., 1993, ApJ, 402, 271
Feldmeier A., 1995, A&A, 299, 523
Feldmeier A., Kudritzki R.-P., Palsa R., Pauldrach A. W. A., Puls J., 1997a,
A&A, 320, 899
Feldmeier A., Puls J., Pauldrach A. W. A., 1997b, A&A, 322, 878
Folini D., Walder R., 2000, ASP Conf. Ser., 204, 267
Gagne M., Caillault J.-P., 1994, ApJ, 437, 361
Gagne M., Caillault J.-P., Stauffer J. R., 1995, ApJ, 445, 280
Gayley K. G., Owocki S. P., Cranmer S. R., 1997, ApJ, 475, 786
Gayley K. G., Owocki S. P., Cranmer S. R., 1999, ApJ, 513, 442
Geier S., Wendker H. J., Wisotzki L., 1995, A&A, 299, 39
Gies D. R., Wiggs M. S., Bagnuolo W. G., Jr, 1993, ApJ, 403, 752
Gies D. R., Barry D. J., Bagnuolo W. G. Jr, Sowers J., Thaller M. L., 1996,
ApJ, 469, 884
Gies D. R., Bagnuolo W. G., Jr, Penny L. R., 1997, ApJ, 479, 408
Hillier D. J., Kudritzki R. P., Pauldrach A. W. A., Baade D., Cassinelli J. P.,
Puls J., Schmitt J. H. M. M., 1993, A&A, 276, 117
Hwang U., Mushotzky R. F., Burns J. O., Fukazawa Y., White R. A., 1999,
ApJ, 516, 604
Koyama K., Maeda Y., Tsuru T., Nagase F., Skinner S. L., 1994, PASJ, 46,
L93
Krolick J. H., Kallman T. R., 1984, ApJ, 286, 366
Kudritzki R. P., Palsa R., Feldmeier A., Puls J., Pauldrach A. W. A., 1996,
in Zimmermann H. U., TruÈmper J., Yorke H., eds, MPE Report 263,
Proc. `RoÈntgenstrahlung from the Universe'
Long K. S., White R. L., 1980, ApJ, 239, L65
McCaughrean M. J., Stauffer J. R., 1994, AJ, 108, 1382
Maeda Y., Koyama K., Yokogawa J., Skinner S., 1999, ApJ, 510, 967
Marchenko S. V., Moffat A. F. J., Eenens P. R. J., Cardona O., Echevarria
J., Hervieux Y., 1997, ApJ, 485, 826
Marchenko S. V. et al., 2000, MNRAS, 317, 333
Moreno E., Koenigsberger G., 1999, RMAA, 35, 157
Myasnikov A. V., Zhekov S. A., 1998, MNRAS, 300, 686
Owocki S. P., 1992, in Heber U., Jeffery S., eds, The Atmospheres of
Early-type Stars. Springer, Heidelberg, p. 393
Owocki S. P., Castor J. I., Rybicki G. B., 1988, ApJ, 335, 914
Pittard J. M., 1998, MNRAS, 300, 479
Pittard J. M., Stevens I. R., 1997, MNRAS, 292, 298
Pollock A. M. T., Corcoran M. F., Stevens I. R., 1999, in van der Hucht K.
A., Koenigsberger G., Eenens P. R. J., eds, Proc. IAU Symp. 193,
Wolf±Rayet Phenomena in Massive Stars and Starburst Galaxies.
Astron Soc. Pac., San Francisco, p. 388
Rauw G., Stevens I. R., Pittard J. M., Corcoran M. F., 2000, MNRAS, 316,
129
Raymond J. C., Smith B. W., 1977, ApJS, 35, 419
Savage B. D., Bohlin R. C., Drake J. F., Budich W., 1977, ApJ, 216, 291
Shore S. N., Brown D. N., 1988, ApJ, 334, 1021
Shull J. M., Van Steenberg M. E., 1985, ApJ, 194, 599
Snow T. P., Jr, Cash W., Grady C. A., 1981, ApJ, 244, L19
Stevens I. R., 1988, MNRAS, 235, 523
Stevens I. R., Pollock A. M. T., 1994, MNRAS, 269, 226
Stevens I. R., Blondin J. M., Pollock A. M. T., 1992, ApJ, 386, 265
Stevens I. R., Corcoran M. F., Willis A. J., Skinner S. L., Pollock A. M. T.,
Nagase F., Koyama K., 1996, MNRAS, 283, 589
Stickland D. J., 1997, Obser., 117, 37
Stickland D. J., Pike C. D., Lloyd C., Howarth I. D., 1987, A&A, 184, 185
Strickland D. K., Stevens I. R., 1998, MNRAS, 297, 747
Tanaka Y., Inoue H., Holt S. S., 1994, PASJ, 46, L37
Usov V. V., 1992, ApJ, 389, 635
Waldron W. L., 1991, ApJ, 382, 603
Waldron W. L., Corcoran M. F., Drake S. A., Smale A. P., 1998, ApJS,
118, 217
Warren W. H., Jr, Hesser J. E., 1977, ApJS, 34, 115
Wiggs M. S., Gies D. R., 1993, ApJ, 407, 252
Willis A. J., Schild H., Stevens I. R., 1995, A&A, 298, 549
Williams P. M., van der Hucht K. A., Pollock A. M. T., Florkowski D. R.,
van der Woerd H., Wamsteker W. M., 1990, MNRAS, 243, 662
Yamauchi S., Koyama K., Sakano M., Okada K., 1996, PASJ, 48, 719
This paper has been typeset from a TEX/LATEX file prepared by the author.
X-ray analysis of the eccentric O-star binary Iota Orionis 153
q 2000 RAS, MNRAS 319, 137±153
Dow
nloaded from https://academ
ic.oup.com/m
nras/article/319/1/137/1075512 by guest on 20 August 2022


