Embed Size (px)
Citation preview
arX
iv:h
ep-p
h/94
1134
1v1
19
Nov
199
4
ROMA Preprint n. 1072-1994hep-ph/9411341
THE NEUTRINO CROSS SECTION AND UPWARD GOING MUONS
Paolo Lipari, Maurizio Lusignoli and Francesca Sartogo
Dipartimento di Fisica, Universita di Roma “la Sapienza”,
and I.N.F.N., Sezione di Roma, Piazzale A. Moro 2,
I-00185 Roma, Italy
Abstract
The charged current cross section for neutrinos with energy of a few GeV is
reanalysed. In this energy range the cross section for the lowest multiplicity
exclusive channels is an important fraction of σCC and the approximation
of describing the cross section with deep inelastic scattering formulae may
be inaccurate. Possible consequences of our reanalysis of the cross section
in the interpretation of the data obtained by deep underground detectors on
ν–induced upward going muons (both stopping and passing) are discussed.
PACS numbers: 13.15.Dk, 12.15.F, 96.40.Tv
Typeset using REVTEX
1

It is well known that measurements of the atmospheric neutrino fluxes allow to performsensitive studies on neutrino oscillations. In some cases an anomaly has been observed,and interpreted as positive evidence for neutrino oscillations [1,2]. Other experiments haveinstead obtained results compatible with the no–oscillation hypothesis, and gave thereforeexclusion plots in the neutrino oscillation parameter space (∆m2, sin2 2θ) [3,4]. In thesestudies it is often necessary to compare experimental results with theoretical calculationsthat depend on assumptions about the neutrino fluxes and interactions.
In this letter we want to reanalyse the charged current (CC) neutrino and antineu-trino cross sections with particular attention to the energy range Eν
<∼ 10 GeV, and
discuss possible consequences for the interpretation of the measurements of the atmo-spheric neutrino fluxes obtained by deep underground detectors. We will argue that it ispossible to improve on the description of the cross sections used in several recent analysesof neutrino-induced upward going muons [4–6] including a more careful treatment of thelowest multiplicity channels (quasi–elastic scattering and single pion production). Themain effect of this more careful description of the neutrino cross sections is an increaseof the flux of low energy upward going muons. Information on the energy spectrum ofupward going muons can be obtained from the measurement of the ratio of event num-bers with muons stopping in the apparatus or passing through [4]. Since with respect toprevious calculations [5,6] we obtain a larger rate of stopping muon events and the pre-dicted rate of passing events is increased by a smaller amount, the excluded region in theneutrino oscillation parameter space obtained from the measured ratio stopping/passingcould be significantly reduced. The interpretation of integral measurements of the muonflux with a low (Emin
µ ∼ 1 GeV) energy threshold could also be modified.The flux of upward going muons of energy Eµ ≥ Emin
µ and direction Ω can be calculatedas
Φµ∓(Eminµ , Ω) =
∫∞
Eminµ
dEν φνµ(νµ)(Eν , Ω) nνµ(νµ)→µ∓(Eminµ ; Eν) , (1)
where φνµ(νµ)(Eν , Ω) is the differential flux of νµ (νµ) and nνµ(νµ)→µ∓(Eminµ ; Eν) is the
average number of muons above a threshold energy Eminµ produced by a neutrino of energy
Eν . It is given by
nνµ(νµ)→µ∓(Eminµ ; Eν) = NA
∫ Eν
Eminµ
dE0
dσνµ(νµ)
dE0
(E0, Eν) [R(E0) − R(Eminµ )] . (2)
In equation (2), NA is Avogadro’s number and the cross section refers to neutrino-nucleonCC scattering. The energy E0 of the muon at the production point is weighted by a factordσ/dE0, the relevant cross section, and by a factor R(E0) − R(Emin
µ ) (R(E) is the rangein rock of a muon of energy E) that takes into account the larger effective target availablewith increasing muon energy. Note that nνµ(νµ)→µ∓ depends not only on the total CCcross–section but also on the shape of the muon energy spectrum. In equation (1) weare implicitly assuming that the observed muons are collinear with the parent neutrinos(Ωµ ≃ Ων) and in eq.(2) we are neglecting fluctuations in the muon energy losses [7].
2
The calculated muon flux (eq.1) depends on the inclusive cross-section for muon pro-duction. In the literature [4–6] this cross section has been evaluated using the deep in-elastic scattering formalism. The deep inelastic scattering (DIS) cross section, expressedin terms of the usual kinematical variables y = 1 − Eµ/Eν and x = Q2/(2mNEνy), mustbe integrated over x and y up to the kinematical limits which, neglecting the lepton mass[8], are 0 ≤ x ≤ 1 and 0 ≤ y ≤ (1 + xmN/(2 Eν))
−1. We will denote this method ofcalculation as Method I.
We observe that the DIS formulae are expected to be valid only for Q2 sufficiently large,and that using them for calculating the cross section of low energy neutrinos implies anextrapolation into a region where nonperturbative effects may become important. Most ofthe parametrizations of the parton distribution functions (PDF) [9] are valid only above aminimum Q2
of several GeV2. The parton distributions for Q2 ≤ Q2
have been considered
to be the same as at Q2, neglecting further evolution [5,6]. More recently new sets of
parton distributions that consider the evolution down to a lower value Q2≃ 0.3 GeV2
have been made available [10].As a possible improvement we suggest to consider separately the contributions of the
exclusive channels of lowest multiplicity, i.e. quasi–elastic scattering and single pion pro-duction, and describe the additional channels collectively using the DIS formulae (MethodII). We decompose therefore the CC neutrino cross section as the sum of three contribu-tions:
σCCν(ν) = σQEL + σ1π + σDIS . (3)
The quasi–elastic cross section in eq.3 is calculated following [11]. The main uncer-tainty is in the axial–vector form factor, for which we follow [12] assuming FA(Q2) =−1.25 (1 + Q2/M2
A)−2, with MA = 1.0 GeV. Inclusion of nuclear effects would decreaseσQEL by ∼ 5%.
To determine the energy distribution of the muon produced together with a singlepion we make the simplifying assumption of dominance of ∆(1232) production. The crosssection is normalized to the results of the more complete calculation by Fogli and Nardulli[13], for a maximum mass of the pion-nucleon system Wc = 1.4 GeV. To avoid doublecounting, the deep inelastic scattering contribution σDIS is limited to the kinematic regionwhere the mass of the hadronic system in the final state is W ≥ Wc [14]. This correspondsin the (x, y) plane to the condition 2 mN Eν y(1 − x) ≤ W 2
c − m2N .
We observe that for neutrino energies not much larger than the nucleon mass, a largefraction of the phase space corresponds to W ≤ Wc. The deep–inelastic formula in thisregion does not take into account the detailed features of the dynamics, with consequencesboth on the absolute value of the cross section and on the shape on the muon spectrum.Moreover, the kinematical region m2
N < W 2 < (mN + mπ)2 is unphysical. When it isincluded in σDIS, as in Method I, it takes (but only roughly) into account the quasi–elastic contribution.
The neutrino CC cross section and its components calculated according to equation (3),using the PDF of Owens for σDIS, are plotted in fig.1 and compared with large statisticsdata for the inclusive process at high [15] and low [16] energy, and with data on one–pion
3

production [17] and quasi–elastic scattering [18]. The exclusive channels contribute 89%(12%) of the cross section for Eν = 1 (10) GeV. Our model is explicitely non–scaling,the ratio σν/Eν is not a constant. In the energy range Eν ∼ 1–10 GeV the ratio σν/Eν
is ∼ 20% higher than the value measured at higher energy. At lower energies, closerto the threshold for muon production, σν/Eν drops to zero. The comparison with data[19] of the neutrino CC cross sections is rather encouraging, notwithstanding the largeexperimental errors. The situation is much less satisfactory for antineutrinos, in that ourrecipe yields results systematically larger than the sparse available data [20]. Note thatthe contribution of antineutrinos to the total flux of positive and negative muons is ∼ 1/3of the total.
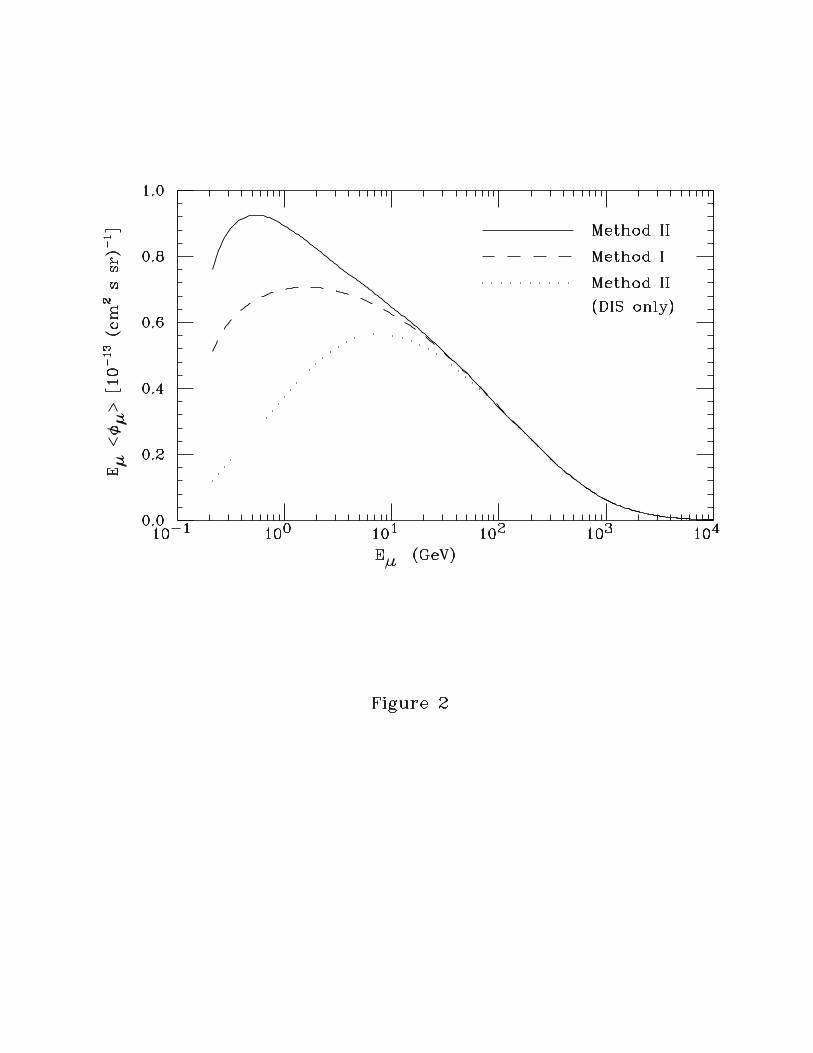
We have calculated the flux of upward going muons according to equation (1) andits differential version [5] using different models of the neutrino fluxes [21] and differentparametrizations [9,10] for the nucleon structure functions in σDIS. In fig.2 we show theresult of a differential muon flux calculation, in which the neutrino flux from Butkevichet al. [21], and the parton distributions given by Owens [9] have been used. The solidcurve is obtained using Method II for the cross section (the dotted curve is the partialcontribution of σDIS), while the dashed curve is obtained with Method I (with results inexcellent agreement with other authors [6]). The fluxes obtained with the two methodsare essentially equal for Eµ
>∼ 10 GeV, but at lower muon energies Method II gives a result
that is considerably larger, by ∼ 12% for Eµ = 3 GeV and by ∼ 25% for Eµ = 1 GeV.The contribution of the exclusive channels in Method II amounts to ∼ 60% (32%) forEµ = 1 GeV (3 GeV).
We now discuss possible consequences of this correction to the muon flux estimate.The IMB collaboration [4] has measured a ratio of rates of stopping and passing upwardgoing muons (Ns/Np) = 0.16 ± 0.019. They have compared this result with a detailedMontecarlo calculation based on Method I, using the structure functions of EHLQ [9]and the neutrino flux of Volkova, corrected at low energy with the results of Lee andKoh [21], obtaining 0.163 for the stopping/passing ratio in the absence of oscillations. Ithas been noted that in performing the ratio stopping/passing the uncertainty due to theabsolute normalization of the neutrino flux is greatly reduced and this has been verifiedin independent calculations [5,6].
To calculate a prediction for the rates of stopping and passing upward going muons ina specific detector, one needs of course a detailed knowledge of acceptances and detectionefficiencies. As an approximation to the real experimental situation, following [5], wedefine stopping muons those in the energy interval 1.25 ≤ Eµ ≤ 2.5 GeV and passingmuons those with Eµ ≥ 2.5 GeV, assuming moreover that the detector acceptance andefficiency for muons above 1.25 GeV are approximately independent from the directionand energy of the particles. The fluxes Φs(Φp) are obtained integrating eq. 1, with theappropriate Emin, on the entire downward hemisphere.
We report in Table I the results of calculations of Φs, Φp and their ratio obtainedwith different models for the neutrino fluxes and different sets of leading–order partondistributions. Both Method I (only DIS) and Method II – our preferred one – have beenused. We observe that the results of Method II are larger than those of Method I. For
4

those parton distributions that have a high Q2the ratio Φs/Φp is increased by ∼ 10%. The
variation is much less for parton distributions having low Q2, but it is interesting to note
that Method II calculations using different structure functions are in better agreementwith each other. The neutrino fluxes of Volkova and Butkevitch (and Mitsui too) predictvery similar Φs/Φp, notwithstanding the differences of ∼ 10% in normalization, while theBartol flux is flatter and predicts a ratio somewhat smaller (by ∼ 5%).
In order to discuss the possible effects of neutrino oscillations, we define the quantity
rs =(Φs/Φp)
(Φs/Φp), (4)
where (Φs/Φp) is the stopping/passing ratio in absence of neutrino oscillations. The ratiors depends on the neutrino oscillation parameters (∆m2, sin2 2θ). We will only considerhere the case of νµ ↔ ντ oscillations.
To take into account the effects of oscillations we have to make in eq. (1) the sub-stitution φνµ
→ [1 − Pνµ→ντ] φνµ
, and analogously for antineutrinos. The double ratio rs
may take the values rmin ≤ rs ≤ 1. With our definitions of Φs and Φp, the maximumsuppression of the stopping to passing ratio is rmin ≃ 0.66, corresponding to sin2 2θ = 1and ∆m2 ≃ 1.3 × 10⁻³ eV2. The ratio rs becomes unity in the limit sin2 2θ → 0 and/or∆m2 → 0, that correspond to the no oscillation case, and also for ∆m2 → ∞. In this limit(in practice for ∆m2 >
∼ 1 eV2) neutrinos of all significant energies oscillate many times,so that the spectrum is suppressed without distortions by a constant factor 1− 1
2sin2 2θ,
and the stopping/passing ratio remains unchanged.In fig.3 we have drawn lines of constant rs in the ∆m2, sin2 2θ plane. The region
favoured at 90% c.l. by the recent Kamiokande-III analysis [2] is also shown, limited bythe dashed line. As one can see, parameters in this region imply measurable effects inobservations of upward going muons: in fact the region to the right of the curve rs = 0.8corresponds approximately to the region excluded by the (Method I) analysis of the IMBcollaboration [4].
Let us assume that r∗s be the ratio of an experimental result with the theoretical no–oscillation value and its error ∆r∗s includes both the experimental error and the systematicuncertainty in the theoretical calculation. At 90% c.l. one could exclude in the (∆m2,sin2 2θ) plane the region corresponding to values |rs − r∗s | ≥ 1.64 ∆r∗s [22]. Use of MethodII for the neutrino cross section increases the theoretical prediction by ∼ 10%, thereforer∗s would be lowered by the same amount, with obvious consequences on the excludedregion. We urge therefore the experimental groups that have collected and are collectingdata on upward going muons to reanalyze them going beyond the DIS approximation forthe ν cross section.
P.L. acknowledges useful conversations with T.K. Gaisser and T. Stanev, M.L. supportby the European Community under HCM Programme, contract CHRX-CT93-0132.
5
REFERENCES
[1] K.S. Hirata et al. (Kamiokande-II Coll.), Phys.Lett.B 205, 416 (1988), ibid. 280, 146(1992); D. Casper et al. (IMB Coll.), Phys.Rev.Lett. 66, 2561 (1991); M.C. Goodmanet al. (Soudan-2 Coll.) in Proc. 23rd Int. Cosmic Ray Conf. (Calgary) 4, 446, (1993).
[2] Kamiokande-III Collaboration, paper presented by M. Nakahata to ICHEP94 Con-ference, Glasgow, to appear in the Proceedings.
[3] Ch. Berger et al. (Frejus Coll.), Phys.Lett.B 245, 305 (1990), ibid. 227, 489 (1989);M.Aglietta et al. (Nusex Coll.), Europhys.Lett. 8, 611 (1989); M. Mori et al.
(Kamiokande Coll.), Phys.Lett.B 270, 89 (1991); M.M. Boliev et al. (Baksan Coll.),in Proc. 3rd Int. Workshop on Neutrino Telescopes (M. Baldo Ceolin, ed.), Venice,1991, p.235.
[4] R. Becker-Szendy et al. (IMB Coll.), Phys.Rev.Lett. 69, 1010 (1992).[5] E. Akhmedov, P. Lipari and M. Lusignoli, Phys.Lett.B 300, 128 (1993).[6] W. Frati, T.K. Gaisser, A.K. Mann and T. Stanev, Phys.Rev.D 48, 1140 (1993).[7] For a discussion of the collinearity approximation, see [6]. Muon energy loss fluctua-
tions are negligible here (see P. Lipari and T. Stanev, Phys.Rev.D 44, 3543 (1991)).[8] For nonzero lepton mass formulae, see C.H. Albright and C. Jarlskog, Nucl.Phys.B
84, 467 (1975).[9] E. Eichten, I. Hinchcliffe, K. Lane and C. Quigg (EHLQ), Rev.Mod.Phys. 56, 579
(1984) and 58, 1065 (1986) (E); J.F. Owens Phys.Lett.B 266, 126 (1991).[10] M. Gluck, E.Reya and A.Vogt, Z.Phys.C 53, 127 (1992); A.D. Martin, W.J. Stirling
and R.G. Roberts (MRS), Phys.Rev.D 47, 867 (1993) and preprint DTP/94/78 (hep-ph/9409410).
[11] C.H. Llewellyn Smith, Phys.Rep. 3, 271 (1971).[12] S.V. Belikov, Z.Phys.A 320, 625 (1985).[13] G.L. Fogli and G. Nardulli, Nucl.Phys.B 160, 116 (1979).[14] We have neglected the contribution of two pion production with W ≤ Wc, which we
expect to be quite small.[15] D.B. McFarlane et al. (CCFRR), Z.Phys.C 26,1 (1984).[16] N.J.Baker et al. Phys.Rev.D 25, 617 (1982). Reference to other low energy experi-
ments can be found in [19].[17] S.J. Barish et al., Phys.Rev.D 19, 2521 (1979).[18] S.J. Barish et al., Phys.Rev.D 16, 3103 (1977).[19] Rev. Particle Properties, Phys.Rev.D 45, part II (1992).[20] O.Erriquez et al., Phys.Lett. 80B, 309 (1979).[21] L.V. Volkova, Yad.Fiz. 31, 784 (1980) (Sov.J.Nucl.Phys. 31, 1510 (1980));
A.V. Butkevich, L.G. Dedenko and I.M. Zheleznykh, Yad.Fiz. 50, 142 (1989)(Sov.J.Nucl.Phys. 50, 90 (1989)); K. Mitsui, Y. Minorikawa and H. Komori, N.Cim.C9, 995 (1986); V. Agrawal, T.K.Gaisser, P. Lipari and T. Stanev, paper in preparation(“Bartol”); H. Lee and Y.S. Koh, N.Cim.B 105, 883 (1990).
[22] This is true for gaussian errors and far from the boundaries of the physical region (fora discussion, see [19]). Note that assuming [5] a 12% relative error on experiment, a
6
much smaller theoretical error, and r∗s = 1, one obtains for the 90% c.l. lower limitrs ≥ 0.8.
7
TABLES
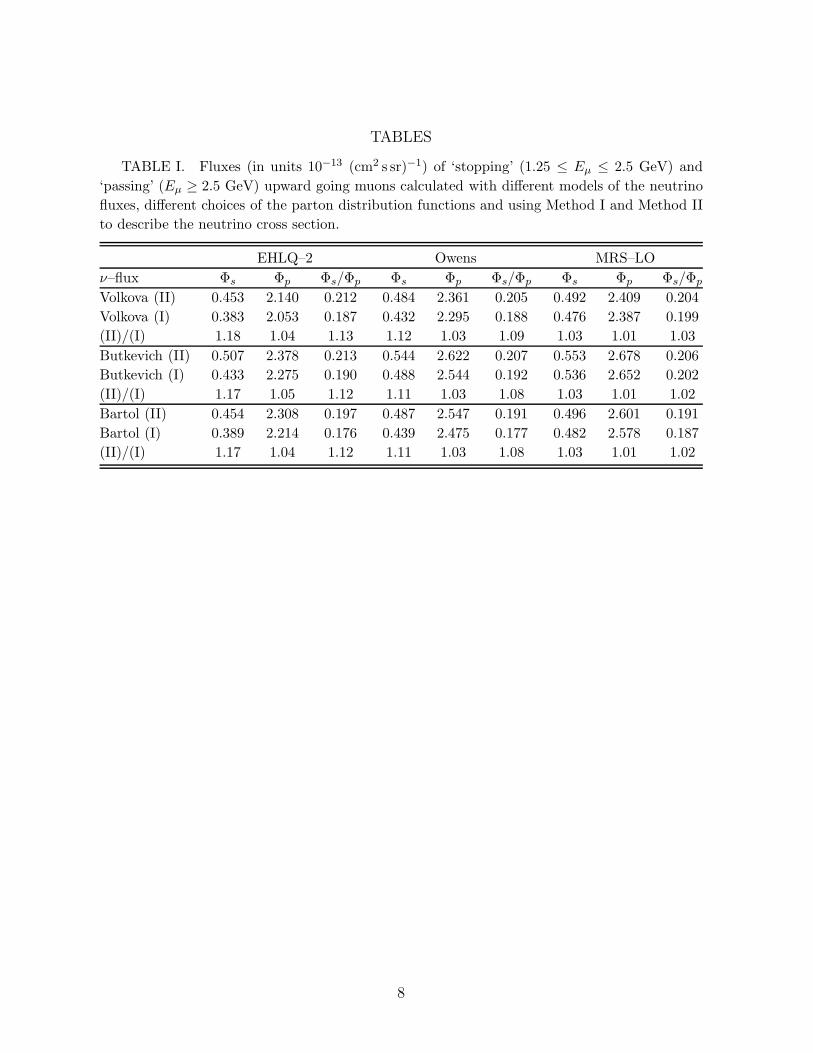
TABLE I. Fluxes (in units 10−13 (cm2 s sr)−1) of ‘stopping’ (1.25 ≤ Eµ ≤ 2.5 GeV) and
‘passing’ (Eµ ≥ 2.5 GeV) upward going muons calculated with different models of the neutrino
fluxes, different choices of the parton distribution functions and using Method I and Method II
to describe the neutrino cross section.
EHLQ–2 Owens MRS–LO
ν–flux Φs Φp Φs/Φp Φs Φp Φs/Φp Φs Φp Φs/Φp
Volkova (II) 0.453 2.140 0.212 0.484 2.361 0.205 0.492 2.409 0.204
Volkova (I) 0.383 2.053 0.187 0.432 2.295 0.188 0.476 2.387 0.199
(II)/(I) 1.18 1.04 1.13 1.12 1.03 1.09 1.03 1.01 1.03
Butkevich (II) 0.507 2.378 0.213 0.544 2.622 0.207 0.553 2.678 0.206
Butkevich (I) 0.433 2.275 0.190 0.488 2.544 0.192 0.536 2.652 0.202
(II)/(I) 1.17 1.05 1.12 1.11 1.03 1.08 1.03 1.01 1.02
Bartol (II) 0.454 2.308 0.197 0.487 2.547 0.191 0.496 2.601 0.191
Bartol (I) 0.389 2.214 0.176 0.439 2.475 0.177 0.482 2.578 0.187
(II)/(I) 1.17 1.04 1.12 1.11 1.03 1.08 1.03 1.01 1.02
8
FIGURES
FIG. 1. νµ CC cross sections plotted as a function of energy.
FIG. 2. Differential flux of upward going muons averaged in angle over one hemisphere and
plotted as a function of muon energy.
FIG. 3. Curves in the (∆m2, sin2 2θ) plane that correspond to constant values for the
double ratio rs. Also shown (dashed) is the 90% c.l. curve obtained by the Kamiokande-III
combined analysis of contained and semi–contained events [2].
9

This figure "fig1-1.png" is available in "png" format from:
http://arXiv.org/ps/hep-ph/9411341v1

This figure "fig1-2.png" is available in "png" format from:
http://arXiv.org/ps/hep-ph/9411341v1

This figure "fig1-3.png" is available in "png" format from:
http://arXiv.org/ps/hep-ph/9411341v1