Embed Size (px)
Citation preview
THE MOLECULAR ORGANIZATION OF ARTIFICIAL LIPID BILAYERS
A STUDY OF THEIR DIELECTRIC IMPEDANCE AND SURFACE TENSION
by
DEREK ROWLAND LAVER
A thesis submitted for the degree of
DOCTOR OF PHILOSOPHY
in the faculty of science of
THE UNIVERSITY OF NEW SOUTH WALES
1983
This is to certify that the work embodied in this thesis has not been
previously submitted for the award of a degree in any institution.
• • • •••••••
FEBRUARY, 1983

DEDICATION
To my wife, Deborah
CONTENTS
Acknowledgments ( ; )
Collaboration ( ; ; ; )
Abstract ( i V)
Chapter Index (vii)
Glossary of Major Symbols ( X i )
Appendix A 235
References 240
Publications 247
ACKNOWLEDGEMENTS
My sincerest thanks to Professor Hans Coster for his
guidance, inspiration and constant availability during my years at
laboratory. Professor Hans Coster has been a great supervisor.
sound
his
Dr Robert Ashcroft played a significant part in my "formative"
years of scientific research. I found working with him both enjoyable
and inspiring.
I wish to thank Dr John Smith who has been a good friend and has
shown continuous interest in my welfare over my the years of my research
here.
Dr Joe Wolfe in the last year of my work here has not only helped
me become more aware of the scientific community but has been a willing
source of friendship and advice. He certainly makes "physics fun".
My thanks to Terry Chilcott who has always been willing to share
his technical experience. The quality of his workmanship in designing
and building the impedance measuring system has certainly made
experimental work much less frustrating.
My thanks to David Knowles for lightening my experimental load and
sharing the joys and frustrations of research.
Sue Murray-Jones helped considerably with the proof reading of this
thesis. Sue has been constantly available for organizing those
; i
hard-to-do things and has certainly contributed to the happy atmosphere
in the lab.
I would like to thank Dr Joe D'Arrigo and Dr David Gruen for their
helpful discussions.
Mr Jack Sandall working in the mechanical workshop did a great job
on constructing the membrane supporting apparatus.
Kim Crestani, a student of architecture, removed the burden of
drawing the diagrams. Jane Campbell produced the photographs presented
in this thesis. The quality of their work is certainly a high point in
the presentation of this thesis.
Also wish to thank Toni Benton for accurately (and quickly) typing
the equations and corrections and Rev. Paul Bayliss and Judy Leeds for
proof reading the manuscript.
To my wife, Debbie, who has contributed to much of the typing,
proof reading and funding of this thesis and without whom I would surely
have gone crazy. What can I say?

i i i
COLLABORATION
Several portions of the work described in this thesis was done jointly
with other people.
Dr Hans Coster and Terry Chillcot designed and built the impedance
measuring system used in the experiments described in this thesis.
The software controlling the impedance measuring system was written by
Terry Chil lcot.
The software handling the data and its analysis was written jointly with
Terry Chi llcot.
The discussion on the location of cholesterol in lipid bilayers was
greatly assisted by Dr Robert Ashcroft and Dr John Smith.
The project described in Chapter 9 was a collaborative effort with Dr
John Smith.
The experiments on bilayer tension were done jointly with David Knowles,
who was undertaking an honours project in this topic.
iv
ABSTRACT
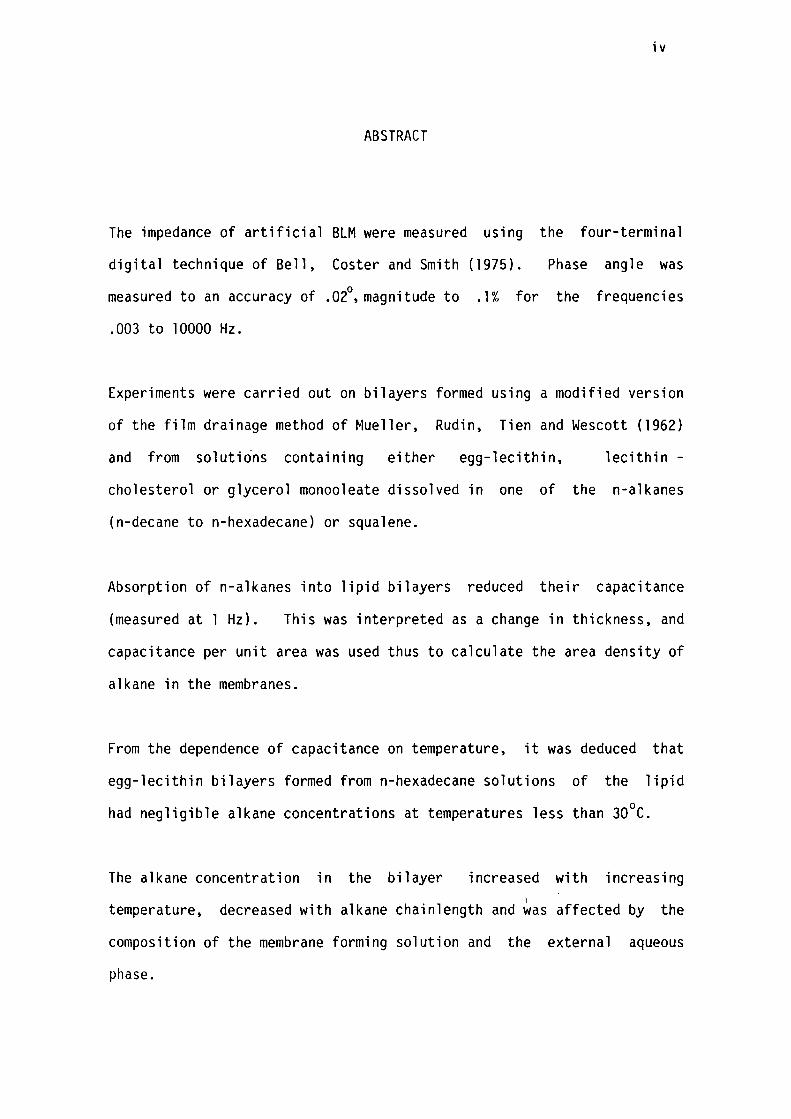
The impedance of artificial BLM were measured using the four-terminal
digital technique of Bell, Coster and Smith (1975). Phase angle was
measured to an accuracy of .02°, magnitude to .1% for the frequencies
.003 to 10000 Hz.
Experiments were carried out on bilayers formed using a modified version
of the film drainage method of Mueller, Rudin, Tien and Wescott (1962)
and from solutions containing either egg-lecithin, lecithin -
cholesterol or glycerol monooleate dissolved in one of the n-alkanes
(n-decane to n-hexadecane) or squalene.
Absorption of n-alkanes into lipid bilayers reduced their capacitance
(measured at 1 Hz). This was interpreted as a change in thickness, and
capacitance per unit area was used thus to calculate the area density of
alkane in the membranes.
From the dependence of capacitance on temperature, it was deduced that
egg-lecithin bilayers formed from n-hexadecane solutions of the lipid 0 had negligible alkane concentrations at temperatures less than 30 C.
The alkane concentration in the bilayer increased with increasing I
temperature, decreased with alkane chainlength and was affected by the
composition of the membrane forming solution and the external aqueous
phase.
V
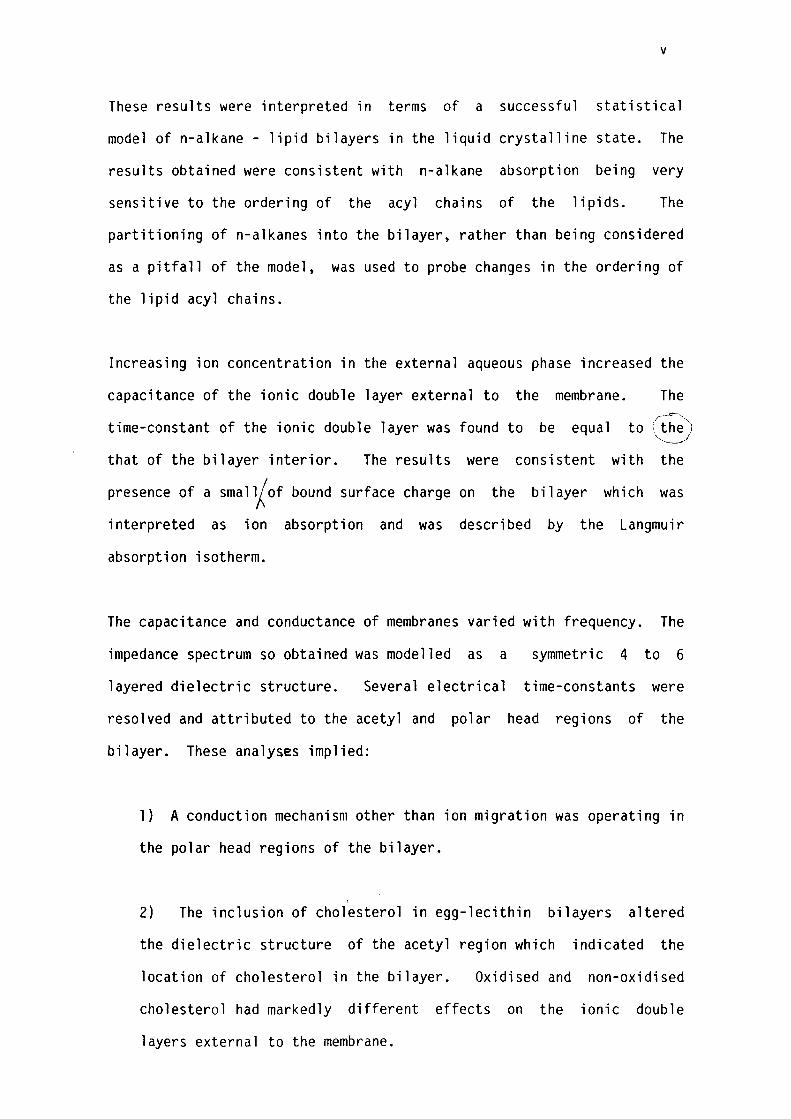
These results were interpreted in terms of a successful statistical
model of n-alkane - lipid bilayers in the liquid crystalline state. The
results obtained were consistent with n-alkane absorption being very
sensitive to the ordering of the acyl chains of the lipids. The
partitioning of n-alkanes into the bilayer, rather than being considered
as a pitfall of the model, was used to probe changes in the ordering of
the lipid acyl chains.
Increasing ion concentration in the external aqueous phase increased the
capacitance of the ionic double layer external to the membrane. The
time-constant of the ionic double layer was found to be equal r~-.,."-
to i. the 1 ~
that of the bilayer interior. The results were consistent with the
presence of a sma11Jof bound surface charge on the bilayer which was
interpreted as ion absorption and was described by the Langmuir
absorption isotherm.
The capacitance and conductance of membranes varied with frequency. The
impedance spectrum so obtained was modelled as a symmetric 4 to 6
layered dielectric structure. Several electrical time-constants were
resolved and attributed to the acetyl and polar head regions of the
bilayer. These analyses implied:
1) A conduction mechanism other than ion migration was operating in
the polar head regions of the bilayer.
I
2) The inclusion of cholesterol in egg-lecithin bilayers altered
the dielectric structure of the acetyl region which indicated the
location of cholesterol in the bilayer. Oxidised and non-oxidised
cholesterol had markedly different effects on the ionic double
layers external to the membrane.
vi
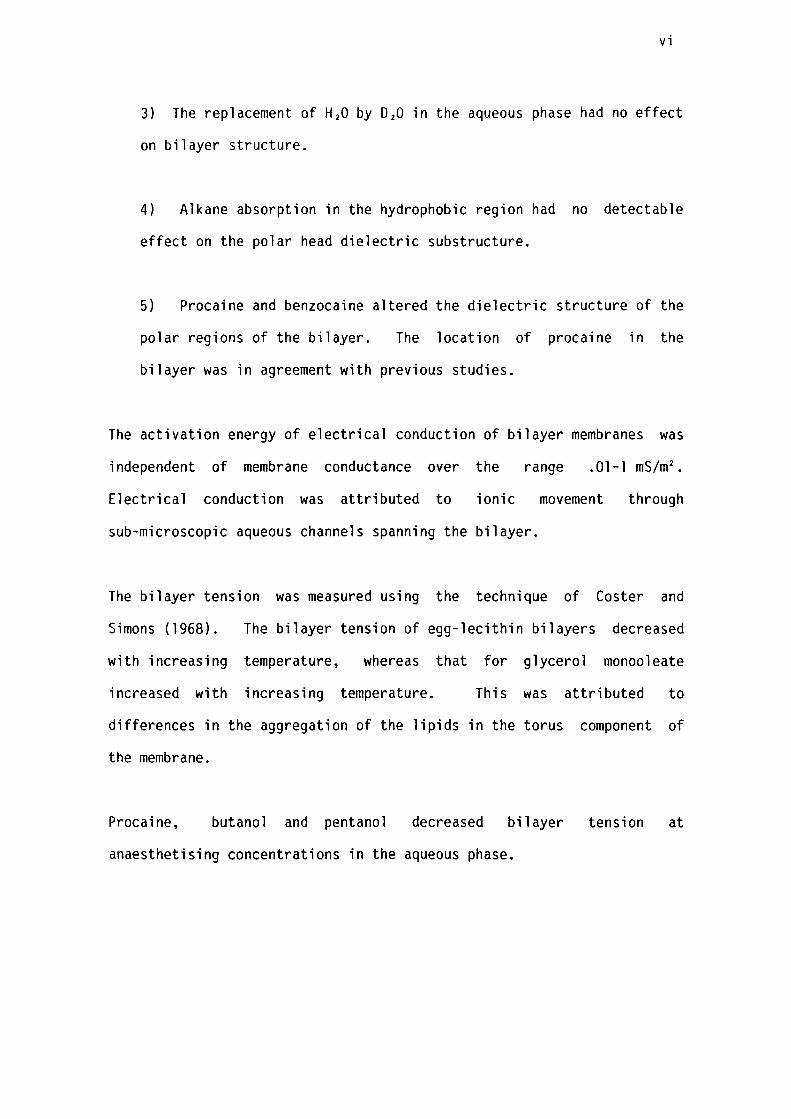
3) The replacement of H20 by 020 in the aqueous phase had no effect
on bilayer structure.
4) Alkane absorption in the hydrophobic region had no detectable
effect on the polar head dielectric substructure.
5) Procaine and benzocaine altered the dielectric structure of the
polar regions of the bilayer. The location of procaine in the
bilayer was in agreement with previous studies.
The activation energy of electrical conduction of bilayer membranes was
independent of membrane conductance over the range .01-l mS/m2.
Electrical conduction was attributed to ionic movement through
sub-microscopic aqueous channels spanning the bilayer.
The bilayer tension was measured using the technique of Coster and
Simons (1968). The bilayer tension of egg-lecithin bilayers decreased
with increasing temperature, whereas that for glycerol monooleate
increased with increasing temperature. This was attributed to
differences in the aggregation of the lipids in the torus component of
the membrane.
Procaine, butanol and pentanol decreased bilayer tension at
anaesthetising concentrations in the aqueous phase.
vii INDEX
Page CHAPTER l - REVIEW
1.1 Introduction 2
1.2 Organization and Function of Biological Membranes 2
1.3 The Physical Properties of Artificial 7 Planar Bimolecular Lipid Membranes (BLM)
1.4 The Dielectric Properties of Artificial BLM 18
CHAPTER 2 - THE DIELECTRIC MODEL OF ARTIFICIAL BIMOLECULAR LIPID MEMBRANES
2. l Introduction 24
2.2 Hydrophobic Region 25
2.3 Polar Regions 32
2.4 Aqueous Phase 34
2.5 Philosophy of Measurement 38
CHAPTER 3 - APPARATUS
3. l Introduction 44
3.2 Membrane Apparatus 46
3.3 Amplifier Assembly 49
3.4 Computor Control 52
CHAPTER 4 - MATERIALS AND METHODS
4. l Introduction 56
4.2 Materials 56
4.3 Making Bilay!:!rS 59 I
4.4 Calibration and Performance of Apparatus 61
4.5 Data Analysis, Reduction and Presentation 67
CHAPTER 5 - LIPID - ALKANE INTERACTIONS IN ARTIFICIAL BLM
5. l Introduction
5.2 Theoretical Considerations
5.3 Materials and Methods
5.4 Results
5.5 Discussion
5.6 Summary
CHAPTER 6 - EFFECT OF EXTERNAL ELECTROLYTE ON THE CAPACITANCE OF LIPID BILAYERS
6. l Introduction
6.2 Preliminary Theoretical Considerations
6.3 Methods
6.4 Results
6.5 Discussion
6.6 Summary
75
79
85
86
89
101
104
107
111
111
114
123
CHAPTER 7 - THE DIELECTRIC STRUCTURE OF THE HYDROPHOBIC-HYDROPHILIC INTERFACE OF EGG-LECITHIN AND GMO BILAYERS
7.1 Introduction
7.2 Methods
7. 3 Results
7.4 Discussion
7.5 Summary
CHAPTER 8 - THE DIELECTRIC STRUCTURE OF ARTIFICIAL BLM I THE EFFECT OF CHOLESTEROL AND n-ALKANE INCLUSION
127
128
129
135
144
II THE EFFECT OF D20/H20 REPLACEMENT IN THE AQUEOUS PHASE
8.1 Introduction
8.2 Methods
8.3 Results
147
150
150
Viii
ix
8.4 Discussion 152
8.5 Summary 156
CHAPTER 9 - THE CONDUCTANCE OF LIPID BILAYERS
9. l Introduction 159
9.2 Materials and Methods 161
9.3 Results 162
9.4 Discussion 167
9.5 Summary 179
CHAPTER 10 - ENERGY OF FORMATION OF LIPID BILAYERS
l O. l Introduction 182
10.2 Theoretical Considerations 185
10.3 Methods 187
10.4 Results 190
10.5 Discussion 192
10.6 Summary 199
CHAPTER 11 - THE EFFECT OF SOME LOCAL ANAESTHETICS ON THE PHYSICAL PROPERTIES OF EGG-LECITHIN BLM
11. l Introduction 202
11. 2 Materials and Methods 204
11. 3 Results 205
11.4 Discussion 209
11. 5 Summary 219
CHAPTER 12 - SUMMARY
12. l Summary 223
12.2 Suggestions for Further Work 233
X
APPENDIX A: DATA STROAGE AND PRESENTATION 235
GLOSSARY OF SYMBOLS xi
a) Alphabetical Symbols
SYMBOL
A
a
a
A.C.
ADC
b
BLM
BZA
BULFIS
C
Cl and C2
PAGE DESCRIPTION
18 area
25 ionic radius
186 head group area in the plane of the bilayer (Chapter 10 only)
19 alternating current
61 ratio of the gain response of voltage and "current" amplifiers
188 area of planar bilayer
62 amplitude ratio of signals arr1v1ng at both input channels of BULFIS
42 amplitude ratio of the voltage across the membrane and series impedance standards
53 analog to digital convertor
172 pore diameter or hydrated ion diameter
1 bimolecular lipid membranes
75 benzyl alcohol
44 Biophysics Ultra Low Impedance Spectrometer
39 capacitance
63 input capacitance of differential amplifiers l and 2 respectively
87 n-tetradecane
87 n-hexadecane
79 area specific n-alkane molar concentration in the bilayer
18 dielectric capacitance of the membrane
c. l
C' m
DAC
DFCM
E
xii 20 capacitance of the ionic double layer
109 binding-ion concentration in "bulk"aqueous phase
27 ion concentration of "ith" species
79 area specific molar concentration of acyl chains in the bilayer "leak"
80 total area specific capacitance of solventless bilayers
80 total area specific capacitance of bilayers containing n-alkanes
38 capacitance of a GC network
188 capacitance of planar bilayer
35 ion concentration in the "bulk" aqueous phase
175 ion concentration in an aqueous pore
35 displacement field
175 ion diffusion coefficient in an aqueous pore
18 direct current
28 ion diffusion coefficient
52 digital to analog convertor
32 double fixed charge membrane
25 electric field
170 activation energy for conduction
186 energy of elastic deformation
187 energy of formation
6 excitation - or excitability inducing modules
39 conductance
38 parallel resistor-capacitor network
28 membrane conductance due to ion species i
131 bi lay.er conductivity due to aqueous pores \
38 conductance of the "Nth" GC network
175 single pore conductance
8 glycerol monooleate
h
I
J. 1
K
k
M
N
n. 1
NFP
NMR
q
R
R
r
Rl and R2
RAM
so
Sl and S2
T
lll
xiii
26 distance from an interface
83 enthalpy of the lipid acyl chains
29 total current
28 electrical current carried by an ion species i
82 partition coefficient of n-alkanes into the bilayer
20 Boltzmann constant
186 area-elastic modulus
142 partition coefficient between the aqueous phase and the polar heads
79 molecular weight
185 micelle aggregation number
78 molecular order parameter of the "ith" carbon atom of the lipid acyl chains
54 normalised fit parameter for raw data
16 nuclear magnetic resonance
189 net hydrostatic pressure
20 electronic charge
82 molar gas constant
188 radius of curvature of bowed membrane (Chapter 10 only)
25 radius vector
63 resistors used for calibrating the differential amplifiers
52 Random Access Memory
83 internal entropy of the lipid acyl chains
189 surface area of water compartments
20 absolute temperature
25 electrostatic self energy of an ion in a medi~m
172 energy of hydration
172 interfacial energy
172 total energy difference
28 externally applied potential
xiv
vm 25 volume
Vo 38 steady state voltage
w 39 angular frequency of the A.C. signal
x2 70 statistical quality of fit parameter
xa 79 alkane mole fraction in the bilayer
x. 27 thermodynamic force driving ion diffusion l
XN 185 Micelle aggregation number
z 40 magnitude of impedance
z 36 ion valency
ZR 67 ratio of impedance of membrane to that of the impedance standard
zs -42 magnitude of the standard impedance
b) Greek Symbols
Cl
y
£ m
£ 0
£ r £ w
e
µ. l
0 µ B
0 µ . l
173 geometrical constant
16 monolayer tension
28 ion partition coefficient
16 surface tension of the oil-water interface
18 membrane thickness
18 Dielectric constant of the hydrophobic region of lipid membranes
20 permittivity of vacuum
22 dielectric constant of a medium
20 dielectric constant of the aqueous phase
78 angle spanned by the C-H bonds of the hydrocarbon chain and the axis perpendicular to the bilayer
20 Debye length in an electrolyte
28 ionic mobility
185 standard chemical potential of lipids in the bilayer
27 standard chemical potential of an ion species, i
-µ. l
0 6µ
0 6µ
V m
0
Orn
T
• 1 and•" D D
185 standard chemical potential of lipids in inverted micelles
27 electrochemical potential of an ion species, i
82 standard chemical potential difference between alkane in the bilayer and torus (Chapter 5 only)
186 standard chemical potential difference between lipids in the torus and the bilayer (Chapter 10 only)
189 volume added to aqueous solution
189 volume displaced by bowed membrane
18 lateral pressure
16 lateral pressure of the acyl chains
16 lateral pressure of the polar heads
30 net charge concentration
37 concentration of bound charge
109 number of possible ion binding sites
142 summation
38 electrical time-constant
40 phase angle of impedance
61 difference between the phase responses of the amplifiers
xv
62 phase difference between signals arriving at both input channels of BULFIS
42 phase difference between A.C. signals across the membrane and series impedance standards
42 phase angle of the standard impedance
27 electrostatic potential
20 membrane surface potential in the absence of an externally applied field
CHAPTER l
REVIEW
1.1 INTRODUCTION
1.2 ORGANIZATION AND FUNCTION OF BIOLOGICAL MEMBRANES
1.3 THE PHYSICAL PROPERTIES OF ARTIFICIAL PLANAR BIMOLECULAR LIPID MEMBRANES (BLM)
1. 31 Reconstitution of Cell Membrane Structure
1.32 BLM Formation and Stability
1.321 Forces Involved in BLM Formation
1.322 The Role of Solvent in Membrane Stability
1.33 The Ultra Structure of Lipid Membranes
1.34 The Pitfalls of Solvent Retention in Artificial BLM
1.35 Molecular Interactions in BLM
1.4 THE ELECTRICAL PROPERTIES OF ARTIFICIAL BLM
1.41 D.C. Characteristics
1.42 A.C. Characteristics
Page
2
2
7
7
9
11
12
13
14
18
18
19
2
1.1 INTRODUCTION
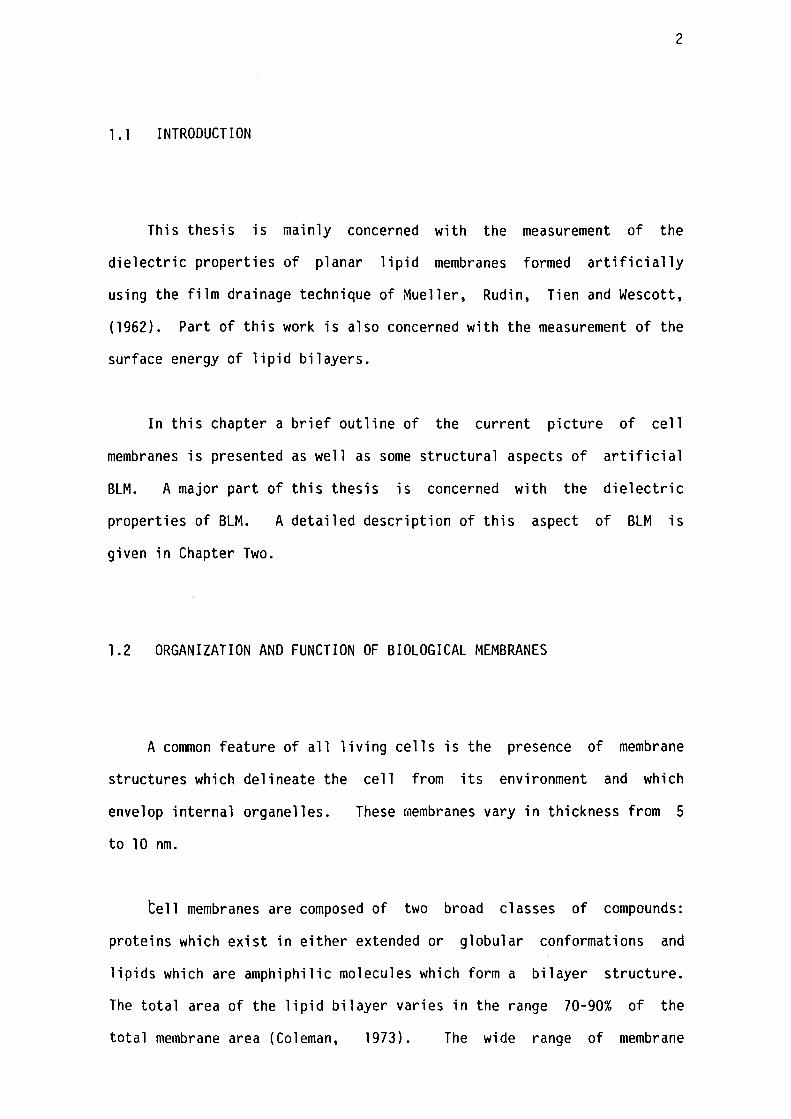
This thesis is mainly concerned with the measurement of the
dielectric properties of planar lipid membranes formed artificially
using the film drainage technique of Mueller, Rudin, Tien and Wescott,
(1962). Part of this work is also concerned with the measurement of the
surface energy of lipid bilayers.
In this chapter a brief outline of the current picture of cell
membranes is presented as well as some structural aspects of artificial
BLM. A major part of this thesis is concerned with the dielectric
properties of BLM. A detailed description of this aspect of BLM is
given in Chapter Two.
1.2 ORGANIZATION AND FUNCTION OF BIOLOGICAL MEMBRANES
A common feature of all living cells is the presence of membrane
structures which delineate the cell from its environment and which
envelop internal organelles. These membranes vary in thickness from 5
to 10 nm.
tell membranes are composed of two broad classes of compounds:
proteins which exist in either extended or globular conformations and
lipids which are amphiphilic molecules which form a bilayer structure.
The total area of the lipid bilayer varies in the range 70-90% of the
total membrane area (Coleman, 1973). The wide range of membrane
3
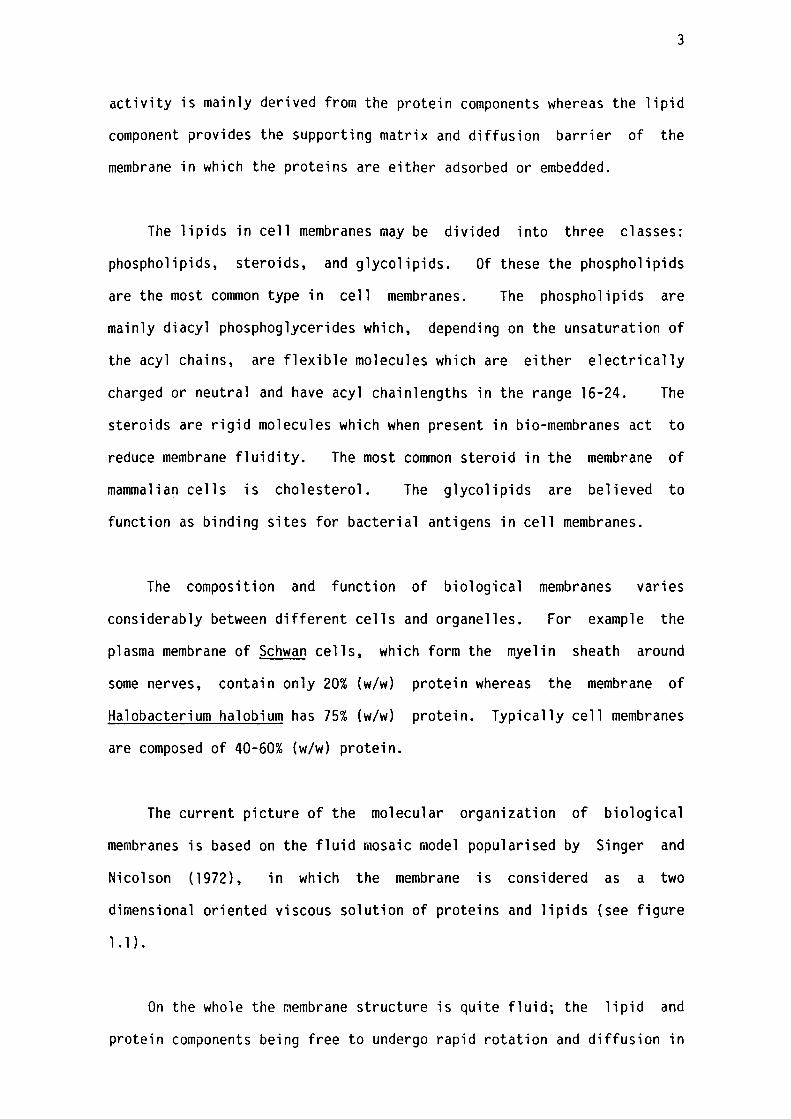
activity is mainly derived from the protein components whereas the lipid
component provides the supporting matrix and diffusion barrier of the
membrane in which the proteins are either adsorbed or embedded.
The lipids in cell membranes may be divided into three classes:
phospholipids, steroids, and glycolipids. Of these the phospholipids
are the most common type in cell membranes. The phospholipids are
mainly diacyl phosphoglycerides which, depending on the unsaturation of
the acyl chains, are flexible molecules which are either electrically
charged or neutral and have acyl chainlengths in the range 16-24. The
steroids are rigid molecules which when present in bio-membranes act to
reduce membrane fluidity. The most common steroid in the membrane of
mammalian cells is cholesterol. The glycolipids are believed to
function as binding sites for bacterial antigens in cell membranes.
The composition and function of biological membranes varies
considerably between different cells and organelles. For example the
plasma membrane of Schwan cells, which form the myelin sheath around
some nerves, contain only 20% (w/w) protein whereas the membrane of
Halobacterium halobium has 75% (w/w) protein. Typically cell membranes
are composed of 40-60% (w/w) protein.
The current picture of the molecular organization of biological
membranes is based on the fluid mosaic model popularised by Singer and
Nicolson (1972), in which the membrane is considered as a two
dimensional oriented viscous solution of proteins and lipids (see figure
l. l).
On the whole the membrane structure is quite fluid; the lipid and
protein components being free to undergo rapid rotation and diffusion in
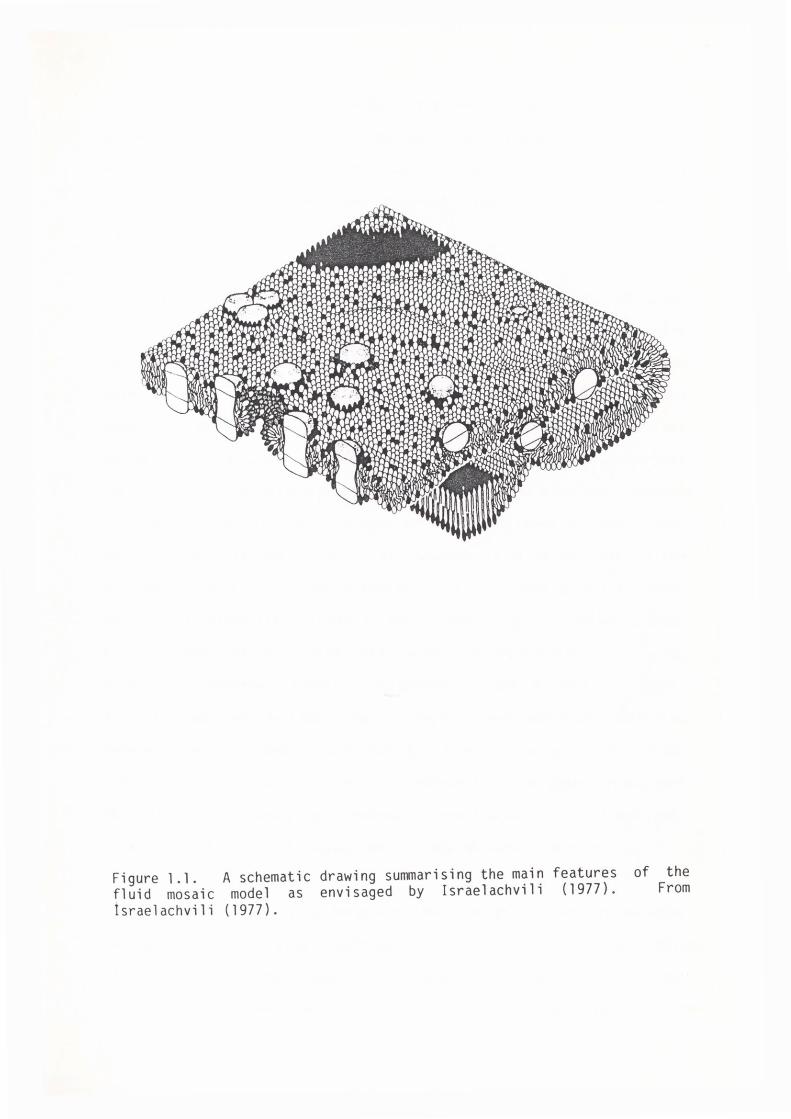
Figure 1.1. A schematic drawing summar1s1ng the main features of the fluid mosaic model as envisaged by Israelachvili (1977). From lsraelachvili (1977).
4
the plane of the membrane (Edidin, 1974 and Pope and Cornell, 1978).
However:, the membrane is heterogeneous and "islands" of restricted
mobility may exist which have been associated with the occurrence
of phase separations of membrane components (Edidin, 1974 and Nicolson,
1976).
The stability and organisation of the fluid mosaic structure
of cell membranes chiefly depends on the hydrophobic - hydrophilic
forces between the amphiphilic membrane components and the aqueous
phase (Singer and Nicolson, 1972). The hydrophobic portions of the
membrane components are confined to the membrane interior and the
hydrophilipic parts are in co·ntact with the water. This imposes certain
constraints on the molecular packing of the different membrane components.
If, for example, the polar groups of the lipids have a large cross
sect i ona 1 area in the p 1 ane of the bilayer re 1 at i ve to that of the
hydrophobic portion of the molecule, then a curved structure would
result (Israelachvili, Mitchell and Ninham, 1976). Further, curved
bilayers would be associated with asymmetric distributions of lipids
across the membrane (Carnie, Israelachvili and Pailthorpe, 1979).
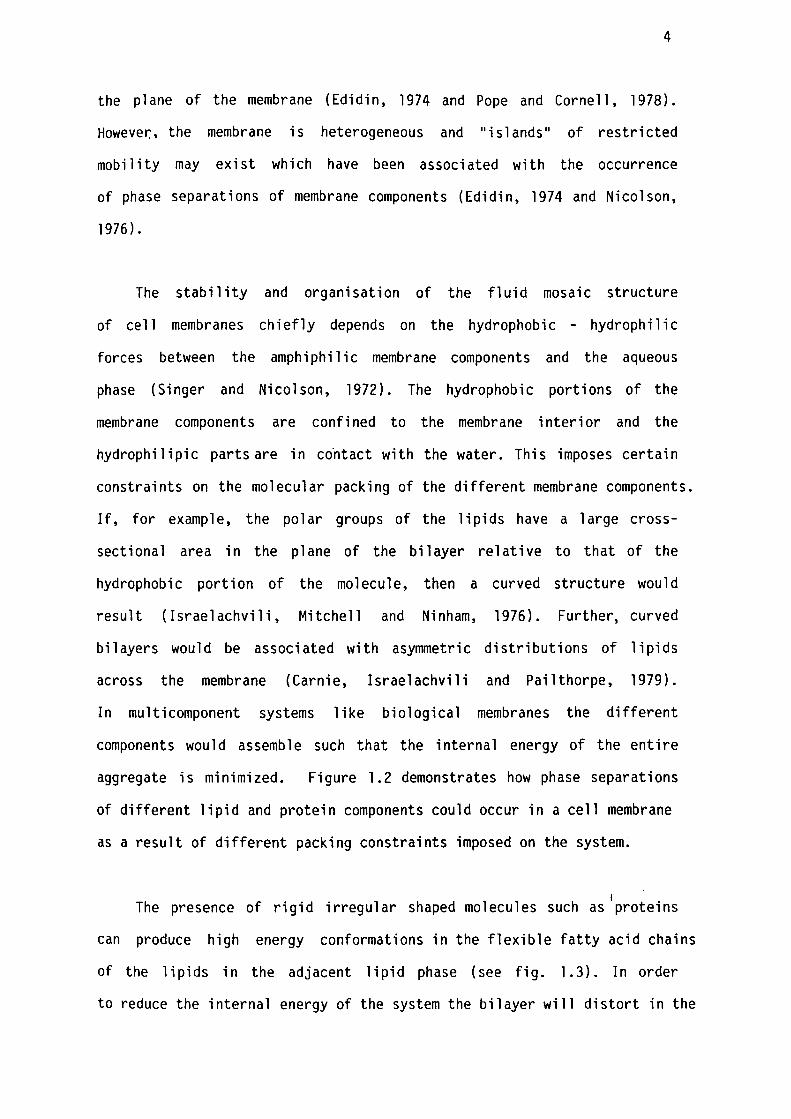
In multicomponent systems like biological membranes the different
components would assemble such that the internal energy of the entire
aggregate is minimized. Figure 1.2 demonstrates how phase separations
of different lipid and protein components could occur in a cell membrane
as a result of different packing constraints imposed on the system.
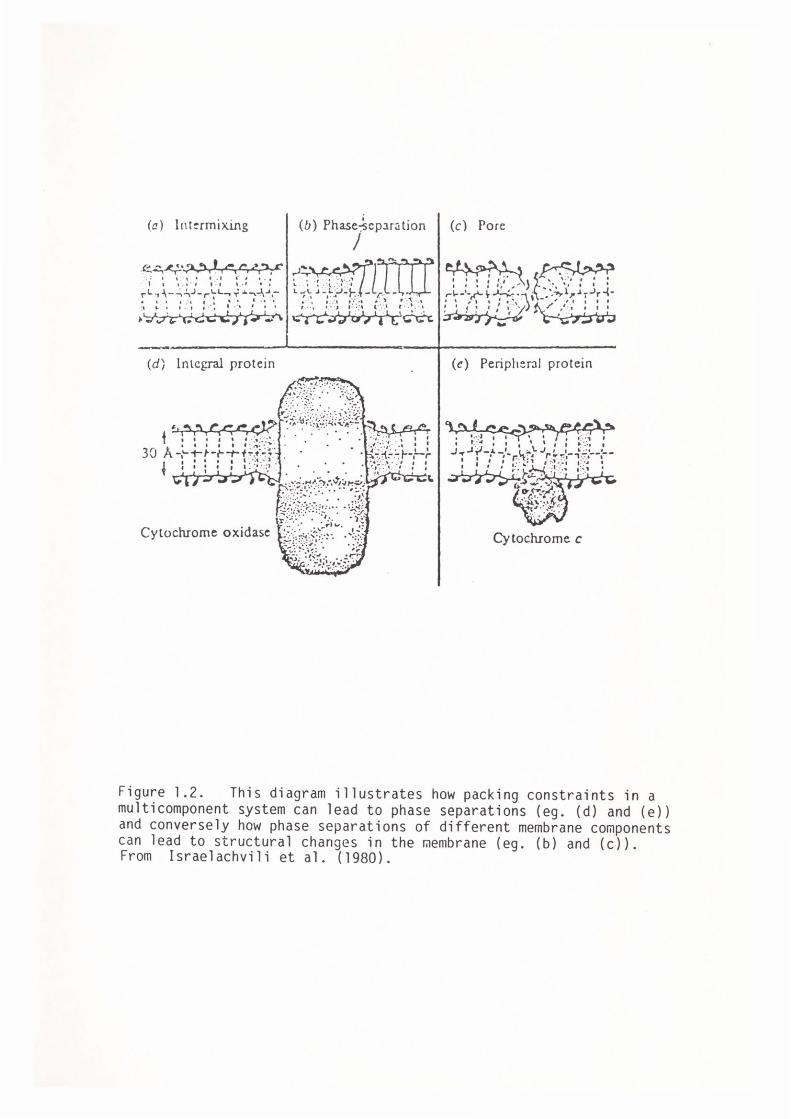
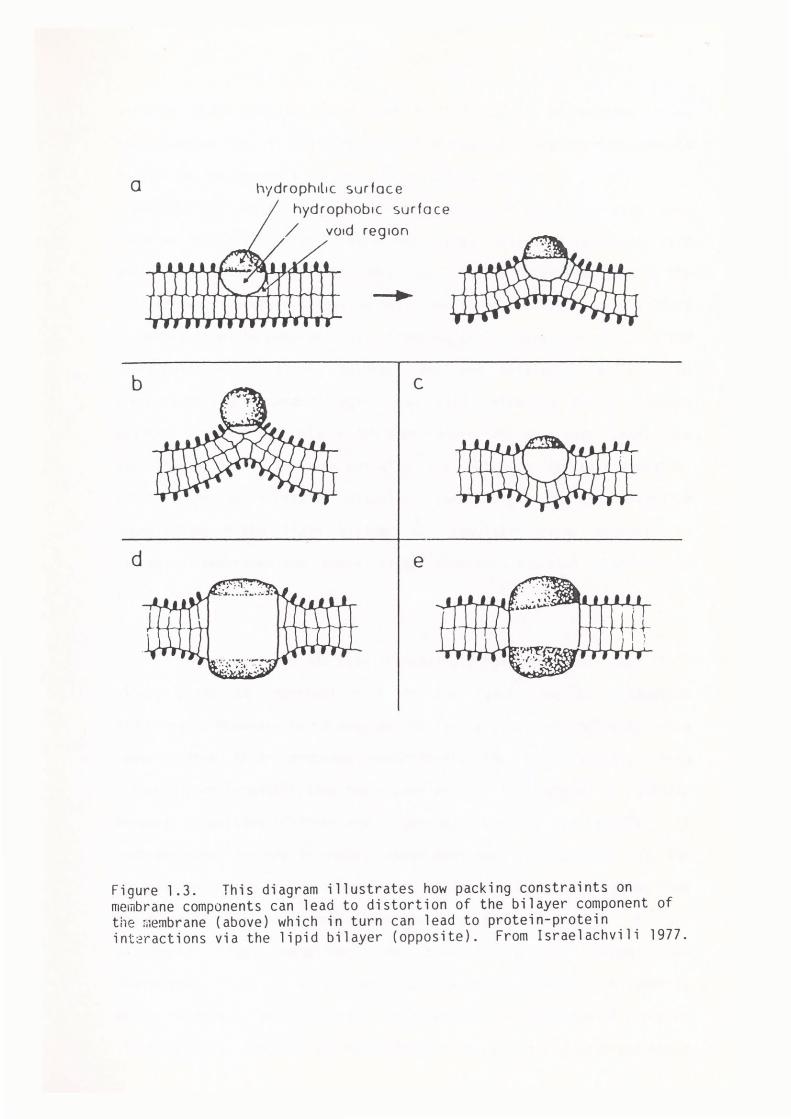
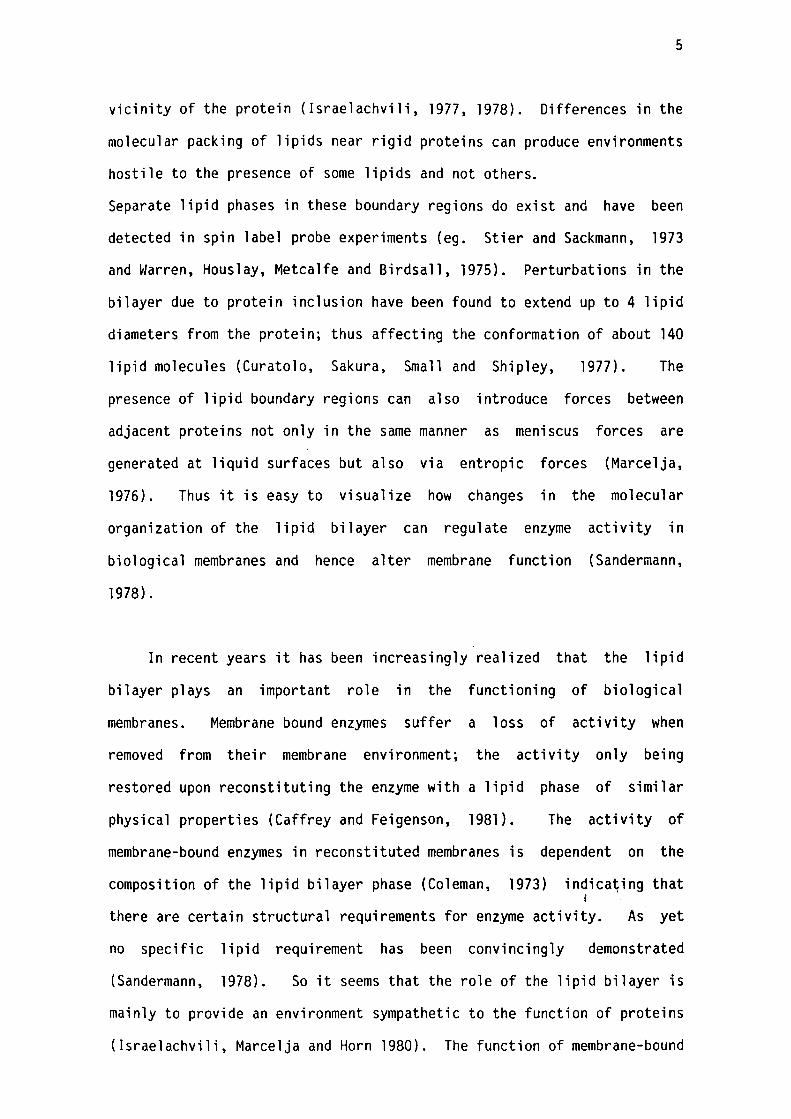
I • The presence of rigid irregular shaped molecules such as proteins
can produce high energy conformations in the flexible fatty acid chains
of the lipids in the adjacent lipid phase (see fig. l.3). In order
to reduce the internal energy of the system the bilayer will distort in the
{1!) lnt~rmixing (c) Pore
~ .. (~ ! : i : :> >-} -~ •, t I t I I , I 1 , .. , J
,-1--'-,rA-\..)....{.,,·Ji .'-""1--l.,.~r r+ t \ r ' , 1 r :- , . - " I I t t I
~' , ·· t-,._r,-.;; .ii ~ ,._
(d) Integral protein (e) Peripheral protein
Cytochrome oxidase Cytochrome c
Figure l .2. This diagram illustrates how packing constraints in a multicomponent system can lead to phase separations (eg. (d) and (e)) and conversely how phase separations of different membrane components can lead to structural changes in the membrane (eg. (b) and (c)). From Israelachvili et al. (1980).
a
b
d
hydroph1l1c surf ace
hydrophobic surface
/ void region
C
e
Figure 1.3. This diagram illustrates how packing constraints on membrane components can lead to distortion of the bilayer component of the membrane (above) which in turn can lead to protein-protein int2ractions via the lipid bilayer (opposite). From Israelachvili 1977.
5
vicinity of the protein (Israelachvili, 1977, 1978). Differences in the
molecular packing of lipids near rigid proteins can produce environments
hostile to the presence of some lipids and not others.
Separate lipid phases in these boundary regions do exist and have been
detected in spin label probe experiments (eg. Stier and Sackmann, 1973
and Warren, Houslay, Metcalfe and Birdsall, 1975). Perturbations in the
bilayer due to protein inclusion have been found to extend up to 4 lipid
diameters from the protein; thus affecting the conformation of about 140
lipid molecules (Curatolo, Sakura, Small and Shipley, 1977). The
presence of lipid boundary regions can also introduce forces between
adjacent proteins not only in the same manner as meniscus forces are
generated at liquid surfaces but also via entropic forces (Marcelja,
1976). Thus it is easy to visualize how changes in the molecular
organization of the lipid bilayer can regulate enzyme activity in
biological membranes and hence alter membrane function (Sandermann,
1978).
In recent years it has been increasingly realized that the lipid
bilayer plays an important role in the functioning of biological
membranes. Membrane bound enzymes suffer a loss of activity when
removed from their membrane environment; the activity only being
restored upon reconstituting the enzyme with a lipid phase of similar
physical properties (Caffrey and Feigenson, 1981). The activity of
membrane-bound enzymes in reconstituted membranes is dependent on the
composition of the lipid bilayer phase (Coleman, 1973) indica\ing that j
there are certain structural requirements for enzyme activity. As yet
no specific lipid requirement has been convincingly demonstrated
(Sandermann, 1978). So it seems that the role of the lipid bilayer is
mainly to provide an environment sympathetic to the function of proteins
(Israelachvili, Marcelja and Horn 1980). The function of membrane-bound
6
polypeptides is affected by the mobility of the fatty acid carbon chains
of the lipids as well as the state of the bilayer interface (eg. the
degree of hydration, surface charge, hydrogen bonding etc.) (Sandermann,
1978).
The structure and function of cell membranes is sensitive to
changes in their internal end external environment (Nicolson, 1976).
Phase transitions and phase separations of membrane components can be
triggered by the binding of divalent cations, changes in temperature and
pH (Jacobson and Papahadjopolous, 1975), changes in the ionic strength
(MacDonald, Simon and Baer, 1976) or the presence of foreign corapounds
such as anaesthetics (Lee, 1978), cholesterol or proteins (Birrel and
Griffith, 1976). The close proximity of another membrane is known to
alter the organization of proteins in thylakoid membranes (Staehelin and
Arntzen, 1979). The various mechanisms for these responses to
environmental changes on membrane structure were considered by
Israelachvili (1978).
The presence of raembrane-soluble raolecules such as short chain
n-alkanes inactivate excitation inducing modules (EIM) in nerve axon.
Haydon, Hendry, Levinson and Requena (1977) correlated the inactivation
of the EIM with changes in the structure of the lipid bilayer induced by
the alkane molecules. Many studies have correlated the potency of
membrane-modifying drugs to their hydrophobicity and hence postulate
that the site of action of these drugs is the lipid bilayer rather than
specific proteins. To examine the validity of this hypothesis part of
this thesis will investigate the effect of membrane soluble drugs such
as n-alkanes, alkanols and aminobenzoic acid esters on the properties
of lipids bilayers.
7
1.3 THE PHYSICAL PROPERTIES OF ARTIFICIAL PLANAR BIMOLECULAR LIPID
MEMBRANES (BLM)
1.31 Reconstitution of Cell Membrane Structure
The study of the cell membrane structure reconstituted in vitro has
begun only recently with the work of Mueller, Rudin, Tien and Wescott
(1962). Though the significance of such studies was realized much
earlier by Langmuir and Waugh (1938). The large area and planar
geometry of these structures allowed easy access to the aqueous phases
on both sides of the membrane and thus proved to be convenient membrane
models in mechanical, electrical and permeability studies.
Basically the technique of Mueller et al. (1962) was to disperse
the lipid components of the membrane in a hydrophobic solvent and form a
film of this solution across a circular support submerged in an aqueous
solution. The surface active lipid components form monolayers at each
oil-water interface. The hydrophobic solution drains away from between
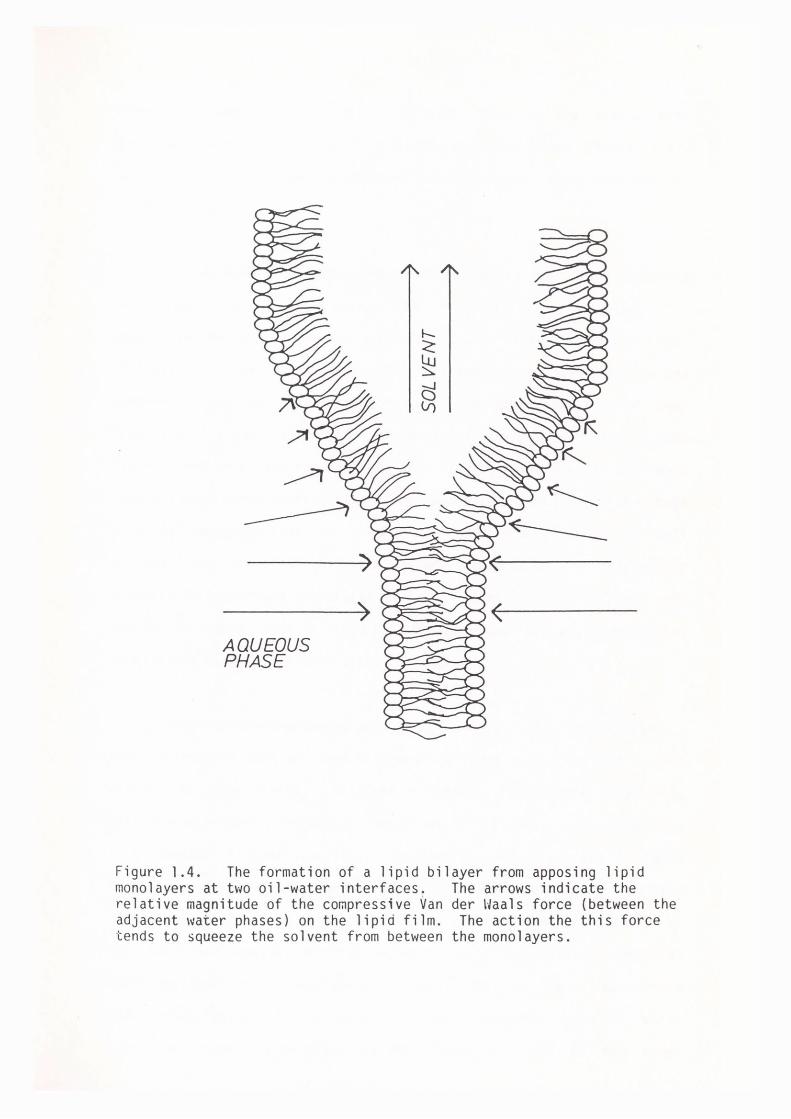
the two monolayers allowing them to form a bilayer (see figure 1.4).
The formation of the bilayer is spontaneous and is usually complete
within 5-30 minutes. The film drainage technique of Mueller et al.
(1962) is the most common technique used to generate lipid bilayer
membranes, though modifications on this basic process are many and
varied depending on the specific study at hand.
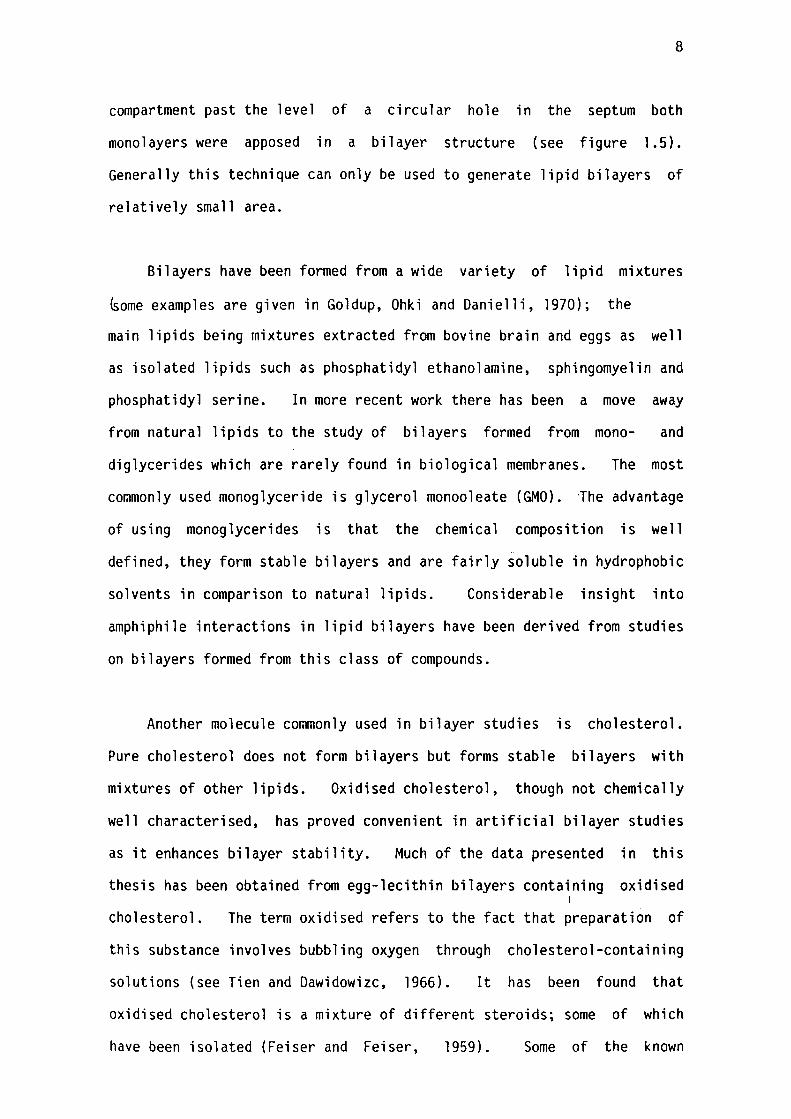
Takagi et al (1965) and also more recently Montal and Mueller il972)
formed asymmetric lipid bilayers by apposing two monolayers across a
circular support. This was done by spreading a monolayer of two
different lipid mixtures at the air-water interface of two separated
compartments. By alternately raising the water levels of each
AQUEOUS PHASE
)
Figure 1.4. The formation of a lipid bilayer from apposing lipid monolayers at two oil-water interfaces. The arrows indicate the relative magnitude of the compressive Van der Waals force (between the adjacent water phases) on the lipid film. The action the this force tends to squeeze the solvent from between the monolayers.
8
compartment past the level of a circular hole in the septum both
monolayers were apposed in a bilayer structure (see figure 1.5).
Generally this technique can only be used to generate lipid bilayers of
relatively small area.
Bilayers have been formed from a wide variety of lipid mixtures
~ome examples are given in Goldup, Ohki and Danielli, 1970); the
main lipids being mixtures extracted from bovine brain and eggs as well
as isolated lipids such as phosphatidyl ethanolamine, sphingomyelin and
phosphatidyl serine. In more recent work there has been a move away
from natural lipids to the study of bilayers formed from mono- and
diglycerides which are rarely found in biological membranes. The most
coramonly used monoglyceride is glycerol monooleate (GMO). The advantage
of using monoglycerides is that the chemical composition is well
defined, they form stable bilayers and are fairly soluble in hydrophobic
solvents in comparison to natural lipids. Considerable insight into
amphiphile interactions in lipid bilayers have been derived from studies
on bilayers formed from this class of compounds.
Another molecule coramonly used in bilayer studies is cholesterol.
Pure cholesterol does not form bilayers but forms stable bilayers with
mixtures of other lipids. Oxidised cholesterol, though not chemically
well characterised, has proved convenient in artificial bilayer studies
as it enhances bilayer stability. Much of the data presented in this
thesis has been obtained from egg-lecithin bilayers containing oxidised l
cholesterol. The term oxidised refers to the fact that preparation of
this substance involves bubbling oxygen through cholesterol-containing
solutions (see Tien and Dawidowizc, 1966). It has been found that
oxidised cholesterol is a mixture of different steroids; some of which
have been isolated (Feiser and Feiser, 1959). Some of the known
Ll l.J .:-,.,,·t~t'. ........ ''J I_ ! ;"
I ' ~\ ... 1· L:: ~1 .._· -· ·
' ANNU LUS (l 0 _,
F ---...:.;:,·
AIR 50LVEN f f r- )
a i 1
SOLVENT'\:
1-~TER ~ ! f
\___ / ~ 1 : ... l
lLR\ ··t111 mr\~ iw.7\ ~ ; ~ . ~ ~ '.
R. ~ J ~ :> •
Figure 1.5. Th.e process of forming a asymmetric bilayers using the method of mbnolayer apposition first used by f•lontal and f,iueller (1972). The apposing monolayers are positioned across the aperture by raising the water levels in each compartment. From White et al . (1976).
9
oxidation products of cholesterol have been found to exist in living
tissue and therefore it is not unreasonable to use this steroid mixture
in artificial BLM to model the bilayer component of living membranes
(Tien, Carbone and Dawidowicz, 1966).
Most commonly used solvents in bilayer generation in earlier
bilayer studies were mixtures of hydrocarbons (eg. n-decane or
n-tetradecane) with chloroform - methanol solutions or mineral oil
mixtures. The recent trend is toward more well defined systems which
only contain a single component solvent of which the most common are
compounds from the n-alkane series between n-decane and n-hexadecane.
Squalene is a common solvent used in forming bilayers of GMO as it does
not, apparently, affect membrane structure (Simon, Lis, MacDonald and
Kauffman, 1977 and White, 1978).
1.32 Formation and Stability of BLM
1.321 Forces Involved in BLM Formation
Lipid molecules become aligned in monolayer aggregates at each
oil-water interface of the film in order to minimise the interfacial
energy arising from the Born repulsive forces between the hydrophobic
acyl chains of the lipids and the water molecules and the charged groups
in the polar heads of adjacent lipids (see figure 1.4 and 1.6). The
film then thins over a period of a few minutes as the lipid solution
drains away under the action of its buoyancy in water.
The transition from the thick film (approximately lOum thick) to
the bilayer state occurs rapidly and the mechanism for this is not well
understood. The spontaneous transition from the thick film to the
:/> / •·. ,, .
·--:'
/
·/ /
/
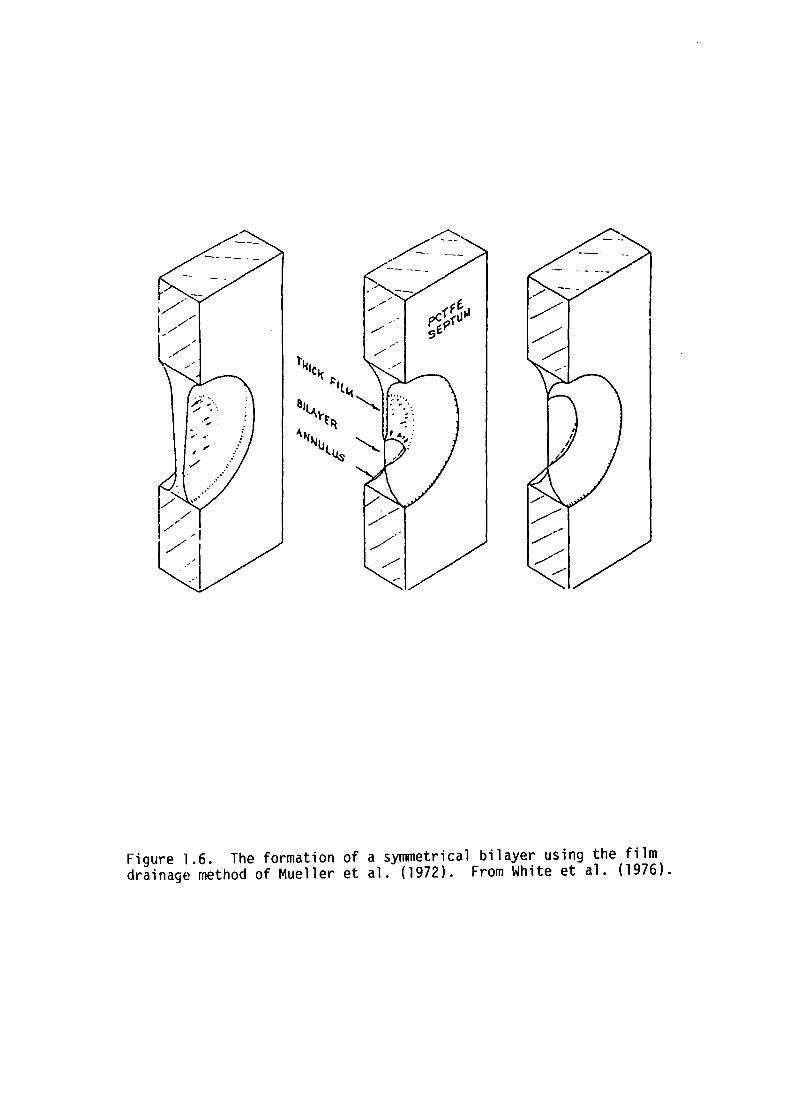
Figure 1.6. The formation of a symmetrical bilayer using the film drainage method of Mueller et al. (1972). From White et al. (1976).
10
bilayer indicates that the bilayer is a lower energy structure. It was
pointed out by Danielli (1966), that the energy of the oil-lipid
interface of the thick film could contribute significantly to the total
energy of the film. The bilayer would not have such an interface and
therefore should have a lower energy. More recent measurements of the
contact angles between thick films and bilayers (Pagano and Thompson,
1967 and Andrews et al., 1970) indicate that the energy difference
between the thick film and the bilayer is only .1% of the energy of
formation. It was then postulated that for small film thicknesses that
the Van der Waals attractive forces between adjacent water phases is a
small but significant compressive force on the bilayer which accelerates
the removal of solvent from between apposing monolayers. The size of
this attractive Van Der Waals force has been calculated by Ninham and
Parsegian (1970) and was found to rapidly increase with decreasing
membrane thickness. The magnitude of this compressive force is shown in
table l. 1. This positive feed-back situation leads to a squeezing of
the remaining bulk solution between the monolayers in a zipper action.
Another possible contributing factor to the bilayer formation could
be the partial ordering of the alkane molecules in the partly thinned
bilayer compared with the molecules in the torus. The initial formation
of bilayer is possibly initiated by random thermal fluctuations in
membrane thickness (Tien and Dawidowicz, 1966).
The main force opposing the continued thinning of lipid bilayers is
the short range repulsive forces between the atomic orbitals of adjacent
molecules causing the lipids in the bilayer to behave like "hard discs"
of a finite radius. The osmotic and viscous drag forces tend to impede
the flow of hydrophobic solvent out of the bilayer during thinning.
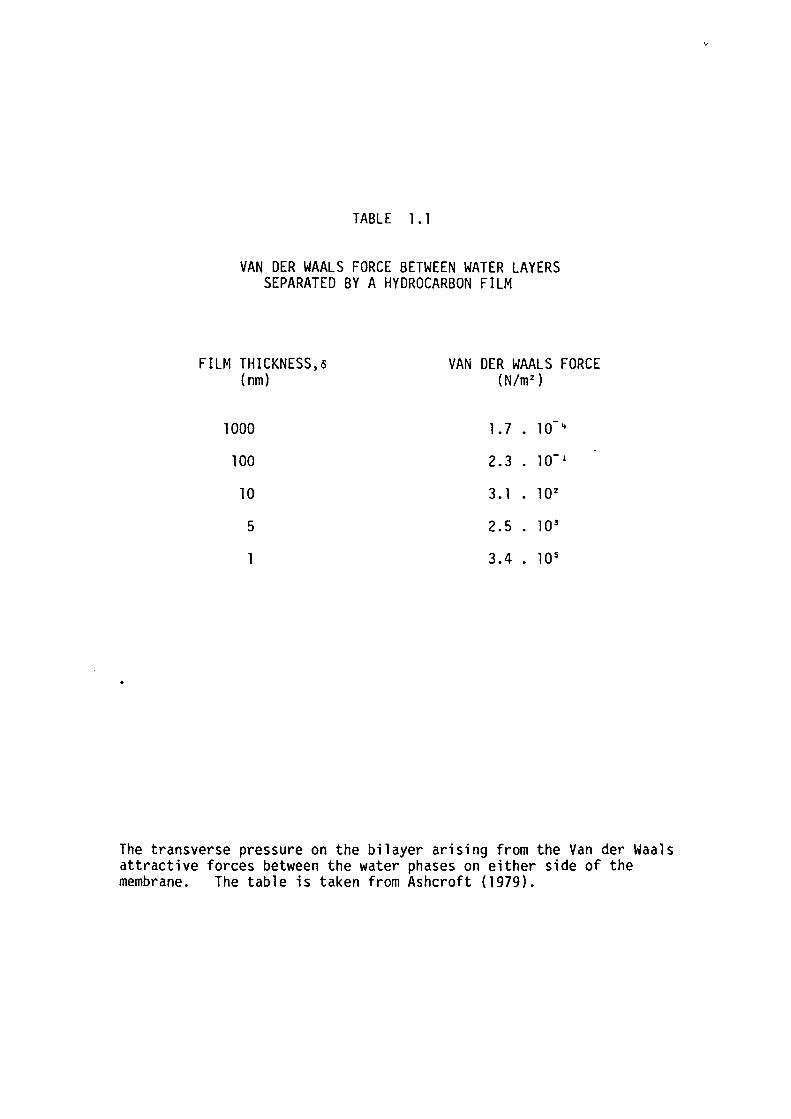
TABLE l. l
VAN DER WAALS FORCE BETWEEN WATER LAYERS SEPARATED BY A HYDROCARBON FILM
FILM THICKNESS,o (nm)
1000
100
10
5
VAN DER WAALS FORCE (N/m 2 )
2. 3 . 10- I
3.1 . 10 2
2.5 . 10'
3.4. 10 5
The transverse pressure on the bilayer ar1s1ng from the Van der Waals attractive forces between the water phases on either side of the membrane. The table is taken from Ashcroft (1979).
11
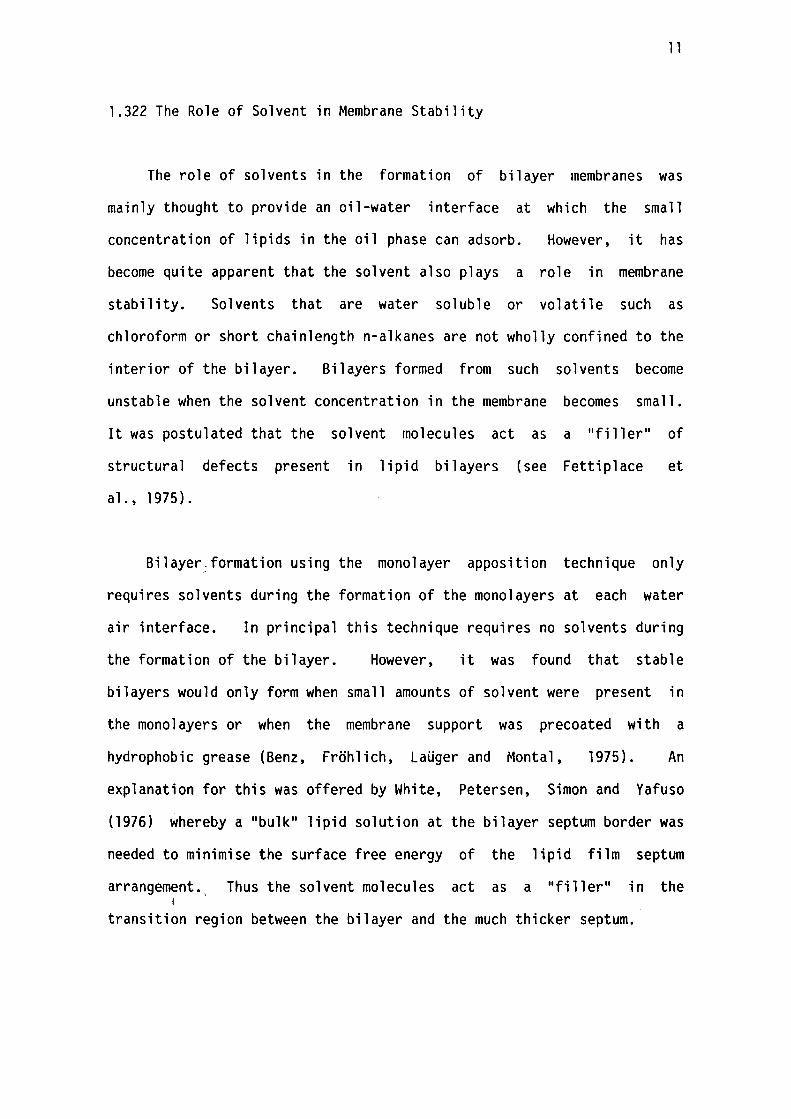
1.322 The Role of Solvent in Membrane Stability
The role of solvents in the formation of bilayer membranes was
mainly thought to provide an oil-water interface at which the small
concentration of lipids in the oil phase can adsorb. However, it has
become quite apparent that the solvent also plays a role in membrane
stability. Solvents that are water soluble or volatile such as
chloroform or short chainlength n-alkanes are not wholly confined to the
interior of the bilayer. Bilayers formed from such solvents become
unstable when the solvent concentration in the membrane becomes small.
It was postulated that the solvent molecules act as a "filler" of
structural defects present in lipid bilayers (see Fettiplace et
al., 1975).
BilayerJormation using the monolayer apposition technique only
requires solvents during the formation of the monolayers at each water
air interface. In principal this technique requires no solvents during
the formation of the bilayer. However, it was found that stable
bilayers would only form when small amounts of solvent were present in
the monolayers or when the membrane support was precoated with a
hydrophobic grease {Benz, Frohlich, LaUger and Montal, 1975). An
explanation for this was offered by White, Petersen, Simon and Yafuso
(1976) whereby a 11 bulk 11 lipid solution at the bilayer septum border was
needed to minimise the surface free energy of the lipid film septum
arrangement., Thus the solvent molecules act as a "filler" in the I
transition region between the bilayer and the much thicker septum.
12
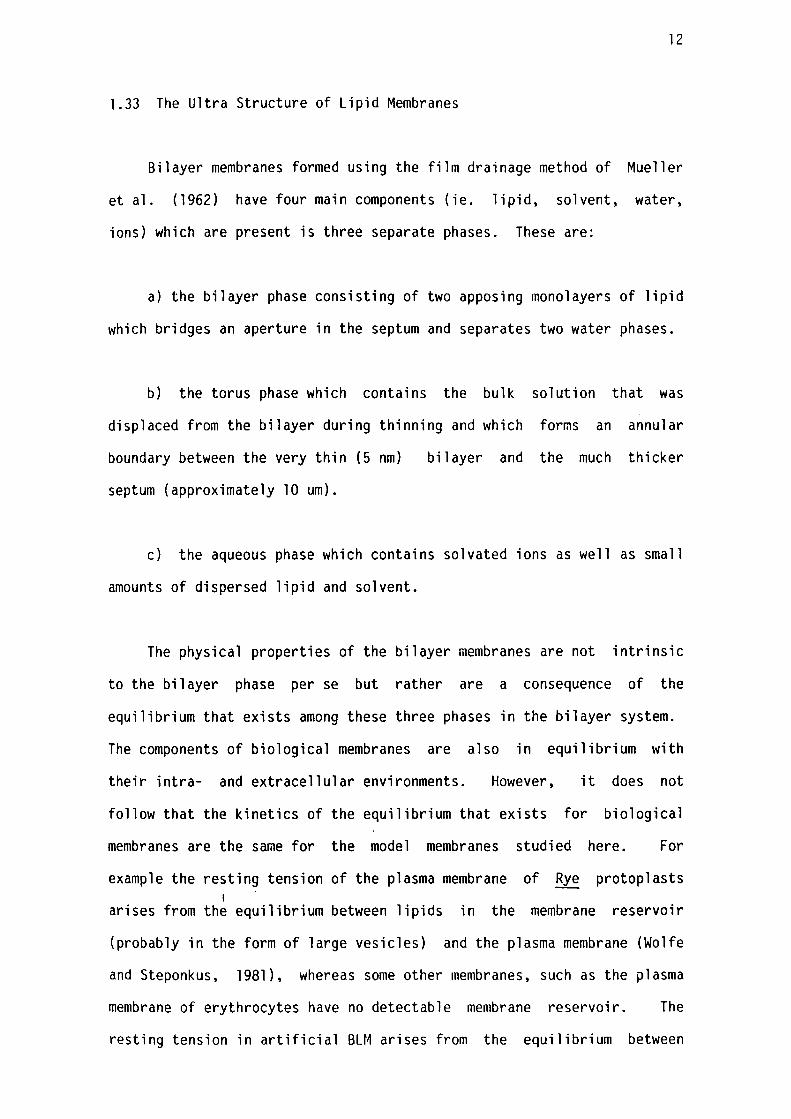
1.33 The Ultra Structure of Lipid Membranes
Bilayer membranes formed using the film drainage method of Mueller
et al. (1962) have four main components (ie. lipid, solvent, water,
ions) which are present is three separate phases. These are:
a) the bilayer phase consisting of two apposing monolayers of lipid
which bridges an aperture in the septum and separates two water phases.
b) the torus phase which contains the bulk solution that was
displaced from the bilayer during thinning and which forms an annular
boundary between the very thin (5 nm)
septum (approximately 10 um).
bilayer and the much thicker
c) the aqueous phase which contains solvated ions as well as small
amounts of dispersed lipid and solvent.
The physical properties of the bilayer membranes are not intrinsic
to the bilayer phase per se but rather are a consequence of the
equilibrium that exists among these three phases in the bilayer system.
The components of biological membranes are also in equilibrium with
their intra- and extracellular environments. However, it does not
follow that the kinetics of the equilibrium that exists for biological
membranes are the same for the model membranes studied here. For
example the restin~ tension of the plasma membrane of Rye protoplasts j
arises from the equilibrium between lipids in the membrane reservoir
(probably in the form of large vesicles) and the plasma membrane (Wolfe
and Steponkus, 1981), whereas some other membranes, such as the plasma
membrane of erythrocytes have no detectable membrane reservoir. The
resting tension in artificial BLM arises from the equilibrium between
13
lipids dispersed in the torus (probably in the form of inverted
micelles) and the bilayer (Gruen and Wolfe, 1982). Differences such as
these must be born in mind when comparing phenomena witnessed in
artificial BLM and living membranes.
1.34 The Pitfalls of Solvent Retention in Artificial BLM
A consequence of the thermodynamic equilibrium between the torus
and bilayer phases in artificial BLM is that a significant amount of
alkane solvent is present in both the bilayer phase and in small lenses
of solvent distributed across the bilayer interior (see figure 1.7).
These solvent lenses "microlenses" scatter light strongly and have a
large mass compared to the surrounding bilayer (White and Thompson
1973). These microlenses have proved disastrous for analytical and
optical studies. This problem has been reviewed by Fettiplace et al.
(1975).
The presence of n-alkanes in BLM poses additional problems as
changes in the concentration of alkanes in the bilayer due to
environmental changes render it difficult to interpret changes induced
in the molecular organization of lipid bilayers. For example, the
effect of benzyl alcohol on membrane thickness was interpreted by
Ashcroft, Coster and Smith (1977) as a change in lipid head group area.
However, Ebihara, Hall, MacDonald, McIntosh and Simon (1979) interpreted
this data in terms of a change in the solvent retention of the bilayer
induced by the adsorption of benzyl alcohol.
Furthermore, biological membranes do not contain extraneous
molecules such as the n-alkanes and even more important, the presence of
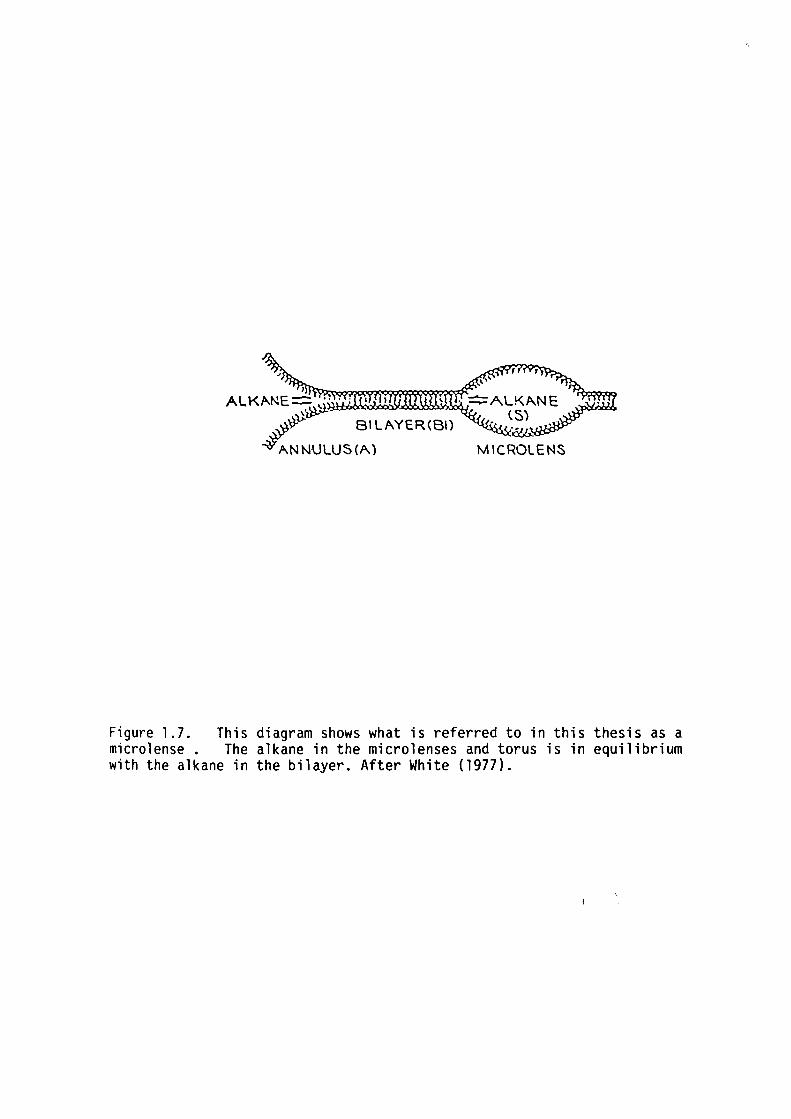
Figure 1.7. This diagram shows what is referred to in this thesis as a microlense. The alkane in the microlenses and torus is in equilibrium with the alkane in the bilayer. After White (1977).
14.
n-alkanes in living membranes significantly alters membrane function and
structure (Haydon et al., 1977). Also the ionic conduction properties
of membrane bound polypeptides such as Gramicidin are altered by the
presence of n-alkanes in the hydrophobic interior of reconstituted
membranes ( Hendry, Urban and Haydon, 1978).
Thus efforts have been made to form bilayers which contain
insignificant solvent concentrations. White (1978) found that squalene,
though present in the torus could not partition into the bilayer phase
of bilayers formed from GMO, presumably because of its large molecular
dimensions compared to that of the bilayer. Longer chainlength
n-alkanes such as n-hexadecane are believed to have similarly low
solubility characteristics in bilayers formed from egg-lecithin (Haydon
et al., 1977).
Part of this thesis will be involved with characterizing the alkane
solubility properties of lipid bilayers in order to identify changes in
the lipid ordering from variations in the alkane solubility as well as
distinguishing solvent related properties of lipid bilayers to those
more relevant to living membranes.
1.35 Molecular Interactions in BLM
The conformation of lipid molecules in bilayers will be such that
the total Gibbs-free-energy of the bilayer-torus, aqueo~s solution 1
system is a minimum. The lipid molecules have a uniform packing density
throughout the bilayer and behave as a compressed liquid. The partial
molar volume of the lipids in the bilayer is constant and remains
independent of molecular conformation (ie. the lipid molecules are
non-compressible) as the presence of voids in a bilayer composed of
15 ·
flexible molecules such as lipids is energetically unfavourable (eg see
Fettiplace et al., 1971 and Gruen, 1980a).
Therefore the thickness of solventless* lipid bilayers is inversely
proportional to the cross sectional area of the lipid molecules in the
plane of the bilayer. The interfacial energy for the hydrocarbon-water
interface is 50 mJ/m 2 • However the free energy associated with the
total membrane-water interface is much lower (in the range .5-5mJ/m 2;
see Goldup et al., 1970). This makes the self-assembly of lipids into
bilayer structures energetically favourable.
The acyl chains are anchored at one end to the the polar head
groups at the bilayer-water interface which causes them to be partially
aligned in the bilayer. The Van der Waals attractive forces between
adjacent hydrocarbon chains favours a small lipid area per molecule in
the plane of the membrane (Gruen, 1980a).
The lowest energy configuration of the lipid fatty acid chains is a
random coil similar to that of n-alkanes in a liquid. The lateral
pressure in the lipid bilayer favours extended (all trans carbon-carbon
bonds) configurations which produce small lateral molecular cross
sections at the bilayer water interface (ie. minimising the energy due
to the oil-water interface). However, decreasing the molecular area at
the bilayer surface increases the order and the internal energy of the
fatty acid chains of the lipid molecules.
* This relationship does not hold when bilayers contain hydrophobic
molecules that do not contribute to the total surface area of the
bilayer.
16
Measurements of the order parameters of the acyl chains of
deuterated dipalmitoyl phosphatidylcholine using NMR techniques
(Stockton and Smith, 1976) found that the acyl chains are in an ordered
state near the hydrophobic-hydrophilic interface. However, near the
bilayer midplane they are disordered, behaving like an alkane liquid.
0 Computer modelling of this system by Marcelja (1974) and later by ·~
Gruen (1980a) found that the order profile of the acyl chains across the . er
~'J''),~ hydrophobic interior of these lipid bilayers is consistent with a
tf lateral pressure of 27 rnN/m. At equilibrium the following equation (
holds:
1. l
Where from left to right the terms are the lateral pressure of the
acyl chains and polar groups, the surface tension of the water-oil
interface (50 mN/m) and the surface tension of the bilayer-water
interface (which is negligible; see Chapter 10). From inspection of
equation 1.1 it seems that a significant contribution to the lateral
pressure arises from the polar head-group interactions in the bilayer,
22 mN/m for the polar heads as compared to 27 mN/m for the acyl chains.
The hydrophilic portion of the egg-lecithin molecule consists of a
choline phosphate electric dipole. In principle,the axis of the choline
phosphate dipole can take on any configuration between 0°and 90° to the
plane of the bilayer. The electrostatic interaction between adjacent
lipid molecules is a function of the lipid cross sectional area, the
relative orientation of the charged dipoles and the dielectric nature of
the material separating them. The internal energy of the charged
dipoles comes from the internal energy of the chemical bonds, energy in
17
the electrostatic field of the dipole (ie. the Born self energy), and
the dipole electrostatic potential between adjacent lipids. NMR studies
of Buldt, Gally, Seelig, Seelig and Zaccai (1979) indicate that the axis
of the choline phosphate dipole of dipalmitoyl phosphatidylcholine in
multilamella preparations is oriented parallel to the plane of the
bilayer though this has not yet been conclusively validated for planar
lipid bilayers. If this were so then the electrostatic force between
adjacent lipids is attractive. A simple calculation* of the maximum
lateral pressure that would arise from electrostatic attraction is
approximately 10 mN/m. However electrostatic screening effects of ions
in the external electrolyte could reduce the head-group interactions.
This possibility will be investigated latter in this thesis.
The net head-group interactions between adjacent lipids are
repulsive. The repulsive force may derived from water structuring in
the hydration shells of lipid polar groups. This effect has already
been postulated for ions in solution (Bockris and Reddy, 1970). NMR
studies on deuterated water has shown that that ten water molecules per
lipid to not freeze at 0°c in dipalmitoyl phosphatidylcholine bilayers
presumably as a result of the inhomogeneous structuring which prevents
hydrogen bonding between water molecules (see review of Pope et al.,
1978). Each lipid molecule appeared to alter the structuring of some 20
water molecules.
* This value was derived by calculating the electrostatic attractive
force between adjacent dipoles. From the number of dipoles along a
metre of bilayer surface an approximation of the total lateral
pressure was made.
18
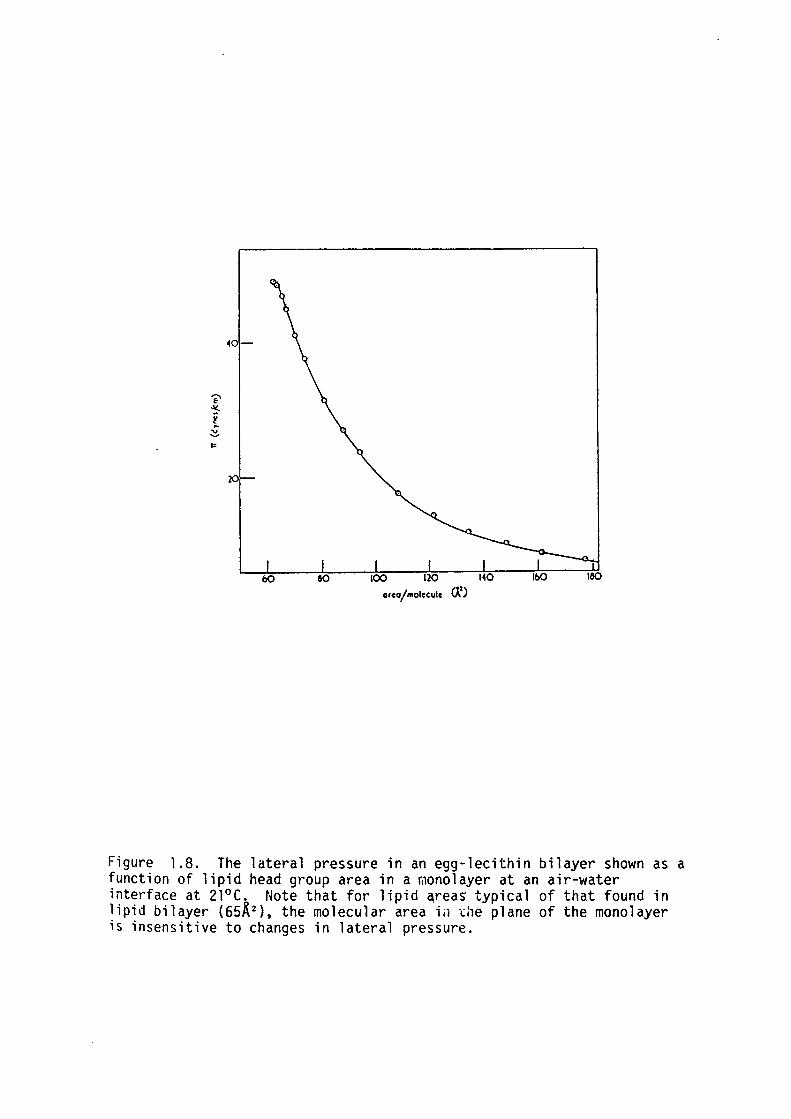
Mechanical studies of lipid monolayers at the air-water interfaces
have measured the area per lipid as a function of lateral pressure. The
lateral pressure - lipid area relationship (n-A curve) of egg-lecithin
monolayers is shown in figure 1.8. The relationship is very steep for 0
lipid areas in the plane of the monolayer less than 65 A2 which
indicates that the lipids in bilayer aggregates are quite compressed.
Thus in lipid bilayers the area per molecule and hence bilayer thickness
will be very insensitive to changes in lateral pressure.
1.4 ELECTRICAL PROPERTIES OF ARTIFICIAL BLM
1.41 D.C. Characteristics
The most striking feature of lipid bilayer membranes is their high
electrical resistance; measurements of this parameter vary from
10 2to l0 5 ohms/m 2 • Membrane conductance has been measured as a function
of electrolyte concentration, pH, and cation binding (see review by
Goldup et al., 1970). However, measurements of the bilayer resistance
are never very reproducible and large variations in electrical
conductivity have been reported even on identical bilayer systems. For
example LaUger, Lesslauer, Marti and Richter (1967) found the resistance
of lecithin - n-decane bilayer was generally in the range l0 2 to 10~
ohm/m 2 whereas Hanai, Haydon and Taylor (1965c) found the resistance of
the same bilayers to be much higher and attributed the
lower values reported elsewhere to border "leakage". Hanai et al.
(1965c) demonstrated a linear relationship between bilayer area and
conductivity though the authors noted that this result is difficult to
obtain as border leakage often varied during changes in the membrane
area ( see also Miyamoto and Thompson, 1967). Van Zutphen and Van
~o
20
,u) area/molecule I.I\
Figure 1.8. The lateral pressure in an egg-lecithin bilayer shown as a function of lipid head group area in a monolayer at an air-water interface at 21°C. Note that for lipid ~rea~ typical of that found in lipid bilayer (6SK 2 ), the molecular area i;1 -.::ie plane of the monolayer is insensitive to changes in lateral pressure.
19
Deenen (1967) found that the resistance of egg-lecithin bilayers could
be reduced a hundred fold by adding trace amounts of lysolecithin to the
bilayer forming mixture. Israelachvili et al. (1980) pointed out that
the shape of these molecules makes it an ideal lipid for pore formation
in lipid membranes.
It is of interest to note that the resistance of lipid bilayers,
though very high, is a factor of 10''-10 16 less than that predicted from
theoretical calculations of "naked" ion translocation through the
hydrophobic interior of the bilayer (see Chapter 9). Various
alternatives to "naked" ion translocation were proposed by Parsegian
(1969) and MacDonald (1976) which will be considered in later sections.
1.42 A.C. Characteristics
Studies of the alternating current electrical characteristics of
lipid bilayer membranes have obtained values of membrane capacitance in
the range 3-8 mF/m 2 depending on the bilayer composition. The
capacitance measurements of lipid bilayers, in contrast to the
electrical resistance measurements, are very reproducible. The
dielectric capacitance of the bilayer membranes can be related to their
thickness by the following equation:-
Where 11 0 11 is the membrane thickness and 11 e: 11 is the dielectric m
constant of the region containing the fatty acid chains. Hanai, Haydon
and Taylor (1965b) suggested that the dielectric constant of the
hydrophobic interior of lipid bilayers should be similar to that
20
measured in alkane liquids (in the range 2-2.2). However, Ohki (1968)
pointed out that if the fatty acid chains of the lipids were aligned
perpendicular to the plane of the bilayer then the dielectric constant
of the bilayer would be appreciably higher than that of hydrocarbon
liquids. However, the more recent calculations of Huang and Levitt
( 1977) obtained values of the dielectric constant in the range 2. 1 to
2.2. Comparative optical and electrical studies of Tien and Diana
( 1967) placed the value of the dielectric constant of the hydrophobic
region in the range 1.6-3.8.
LaUger et al. ( 1967) and Everitt and Haydon (1968),
Gouy-Chapman theory applied to the bilayer-solution interface,
using
showed
that during capacitance measurements part of the externally applied
potential appears across the aqueous phase adjacent to the membrane.
The subsequent redistribution of ions at the membrane-solution
interfaces gives rise to ionic double layers that have capacitances
which act in series with the dielectric capacitance of the bilayer. The
exact analytical solution for the A.C. impedance of the double layer was
calculated by Smith (1977) who predicted that the time-constant of the
ionic double layer was equal to that of the membrane. The capacitance
of the double layer, CDL' for the case of small applied potential
differences was shown to be given by the following equation:
e: e: c0L = ~ w coshtffi} 1.3
Where e:w is the dielectric constant of water.
In effect, the double layer capacitance is equal to what is
expected frora a slice of electrolyte one "hypothetical" Debye length
thick. The "hypothetical" Debye length here refers to the Debye length
21
of a bulk solution phase with an ion concentration equal to that in the
plane of fixed charges.
The predictions of Everitt and Haydon (1968) were latter verified
experimentally by White (1973) from measurements of the salt dependent
capacitance of GMO - n-decane bilayers. Earlier measurements of Hanai
et al. (1964) reported that ionic strength had no effect on the
capacitance of egg-lecithin - n-decane bilayers which was attributed to
absorbed surface charge in these bilayers. However, more recent
measurements of Coster and Smith (1974) detected a significant variation
in bilayer capacitance of egg-lecithin bilayers which were formed using
n-tetradecane solvent. The effects of varying ion concentration in the
external electrolyte on bilayer capacitance will be examined in later
sections of this thesis.
It has long been known that the heterogeneity of the dielectric
structure due to the different chemical nature of the hydrophobic and
hydrophilic regions of lipid bilayers would influence the optical and
electrical properties of the film. The impedance of this heterogeneous
structure should exhibit a dispersion with the frequency of the
externally applied potential (Hanai et al., 1965a). Though some
indirect evidence for a dispersion in bilayer capacitance existed
(Coster and Simons, 1970 and Clowes, Cherry and Chapman, 1971) it was
commonly believed that the bilayer capacitance was independent of
frequency {Hanai et al., 1964).
Coster and Smith (1974) using a novel four terminal digital
impedance @easuring technique documented in Bell, Coster and Smith
(1975) demonstrated a small (3%) dispersion in the capacitance of
egg-lecithin bilayers over the frequency range 1-90 Hz. These results
22 ·
were consistent with a region of low dielectric constant (the
hydrophobic interior) sandwiched between two regions of higher
dielectric constant with £r in the range 20-40 (the hydrophilic region).
By extending the frequency range of the impedance measurements Ashcroft,
Coster and Smith (1977) resolved two electrically distinct polar regions
which were associated with the regions containing the choline phosphate
dipoles and the glycerol region of the egg-lecithin molecules. This
thesis will employ comparative studies on GMO and egg-lecithin
bilayers to test the hypothesis of Ashcroft et al. (1977) and so
characterize the dielectric structure of the hydrophobic-hydrophilic
interface of egg-lecithin and GMO bilayers.
CHAPTER 2
THE DIELECTRIC MODEL OF ARTIFICIAL BIMOLECULAR LIPID MEMBRANES.
2. l INTRODUCTION
2.2 HYDROPHOBIC REGION
2. 21 Ion Self Energy
2.22 Membrane Conductance
2.23 Membrane Capacitance
2.3 POLAR REGIONS
2.4 AQUEOUS PHASE
2.41 Effect of Unstirred Regions
2.42 Effect of Ionic Double Layers
2.5 PHILOSOPHY OF MEASUREMENT
2.51 Time Domain vs. Frequency Domain
2.52 Four Terminal Digital Impedance Measuring Technique
page
24
25
25
27
29
32
34
34
35
38
38
41
23
24 -
2.1 INTRODUCTION
This chapter is concerned with the quantitative examination of the
dielectric model of egg-lecithin bilayers as well as the principles
involved in the impedance - measuring techniques used in elucidating
bilayer structure.
For simplicity, in the analysis which follows, monovalent ions are
considered to be the carriers of electrical current through the bilayer.
The equilibrium distribution of ions throughout the membrane and
solution will determine the relative electrical conduction properties of
different regions in the membrane system.
For the purposes of this study the ions are considered to exist in
three chemically distinct regions; the aqueous phase external to the
membrane, the hydrophobic region containing the acyl chains and the
polar heads forming a region with fixed charges between the hydrophobic
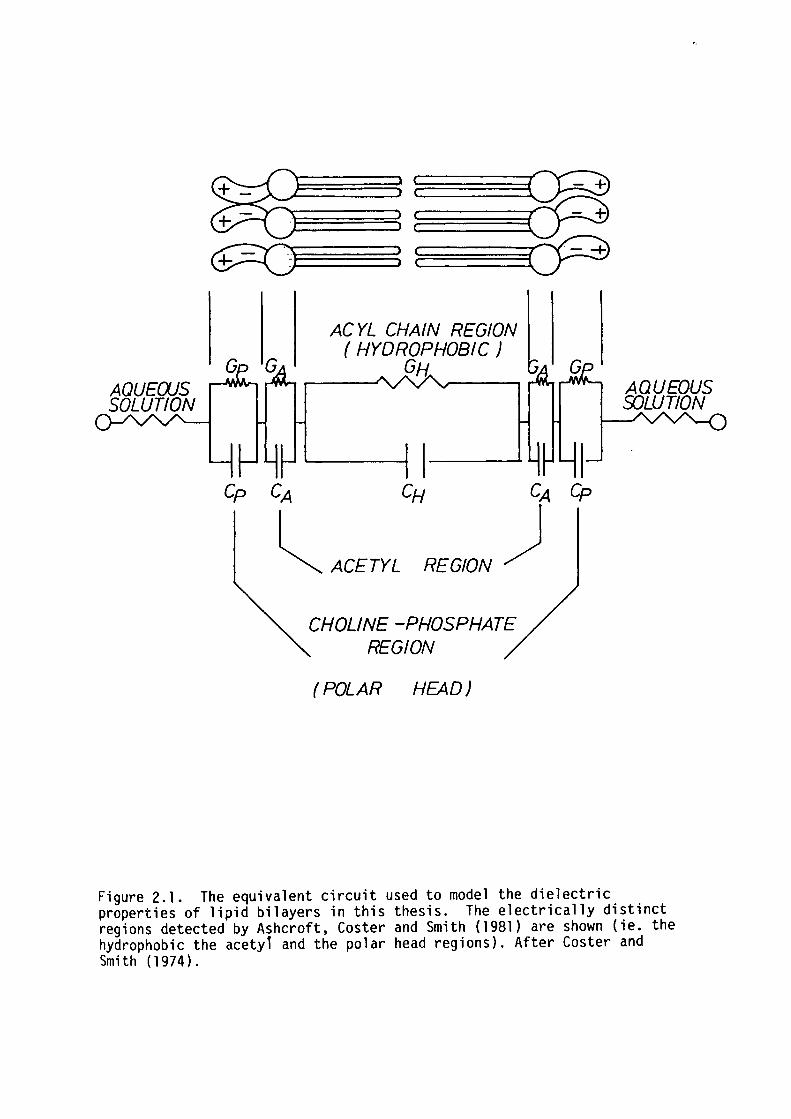
region and the aqueous phase. In this thesis the electrical properties
of the bilayer were modelled by a series combination of parallel
resistor-capacitor networks; each simulating the dielectric properties
of different regions in the bilayer (see figure 2.1).
In later chapters of this thesis the dielectric substructure of
membrane - electrolyte systems will be deduced by modelling the i
impedance dispersion of lipid bilayers to this equivalent circuit. The
interpretation of the data requires an understanding of the charge
storage and conductive mechanisms in these bilayer systems. The
dielectric and conductive properties of these regions are considered
separately.
AOUEOJS SOLUTION
Cp
AC YL CHAIN REGION (HYDROPHOBIC)
GH
REGION
CHOLINE -PHOSPHATE REGION
( POLAR HEAD)
Figure 2.1. The equivalent circuit used to model the dielectric properties of lipid bilayers in this thesis. The electrically distinct regions detected by Ashcroft, Coster and Smith (1981) are shown (ie. the hydrophobic the acetyl and the polar head regions). After Coster and Smith ( 197 4) .
25
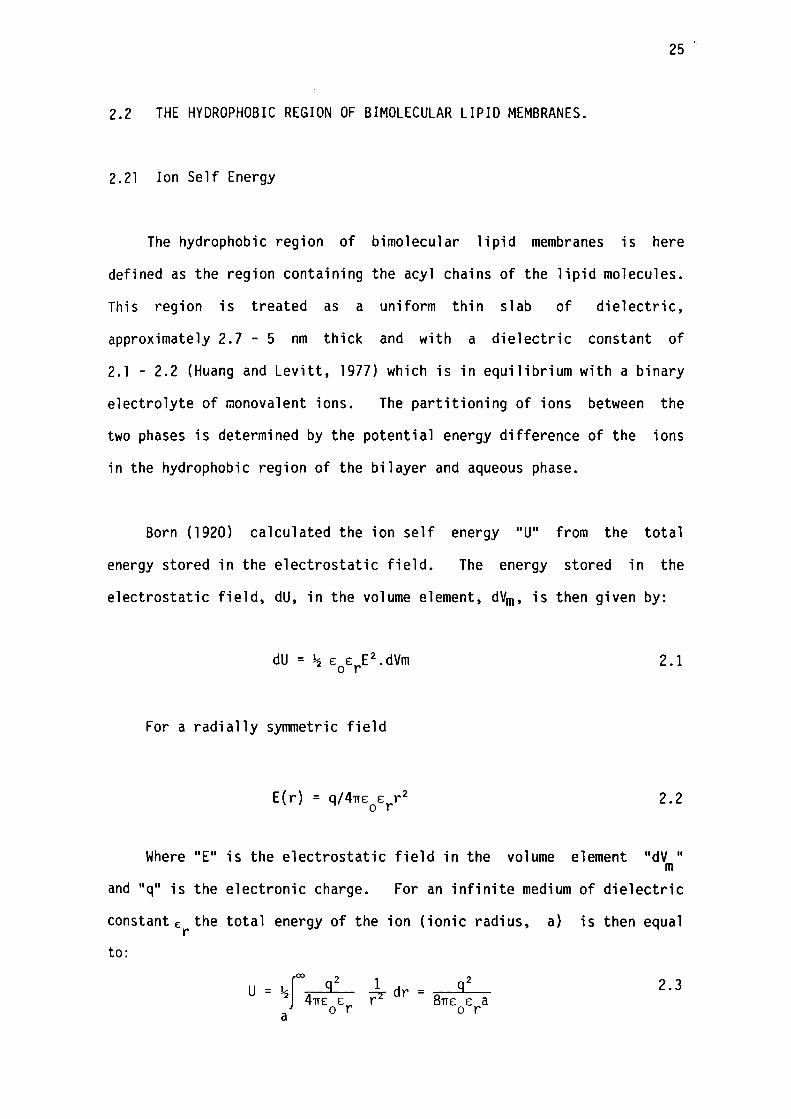
2.2 THE HYDROPHOBIC REGION OF BIMOLECULAR LIPID MEMBRANES.
2.21 Ion Self Energy
The hydrophobic region of bimolecular lipid membranes is here
defined as the region containing the acyl chains of the lipid molecules.
This region is treated as a uniform thin slab of dielectric,
approximately 2.7 - 5 nm thick and with a dielectric constant of
2.1 - 2.2 (Huang and Levitt, 1977) which is in equilibrium with a binary
electrolyte of rnonovalent ions. The partitioning of ions between the
two phases is determined by the potential energy difference of the ions
in the hydrophobic region of the bilayer and aqueous phase.
Born (1920) calculated the ion self energy "U" from the total
energy stored in the electrostatic field. The energy stored in the
electrostatic field, dU, in the volume element, dVm, is then given by:
dU = ½ £ £ E2 .dVm o r
For a radially symmetric field
E(r) = q/4n£ £ r 2 o r
2.1
2.2
Where ''E" is the electrostatic field in the volume element "dV" m
and "q" is the electronic charge. For an infinite medium of dielectric
constant E the total energy of the ion (ionic radius, a) is then equal r
to:
U = '-"foo q2 2 4n£ £ a o r
1 g2 r2"" dr = 8n£ £
o r 2.3
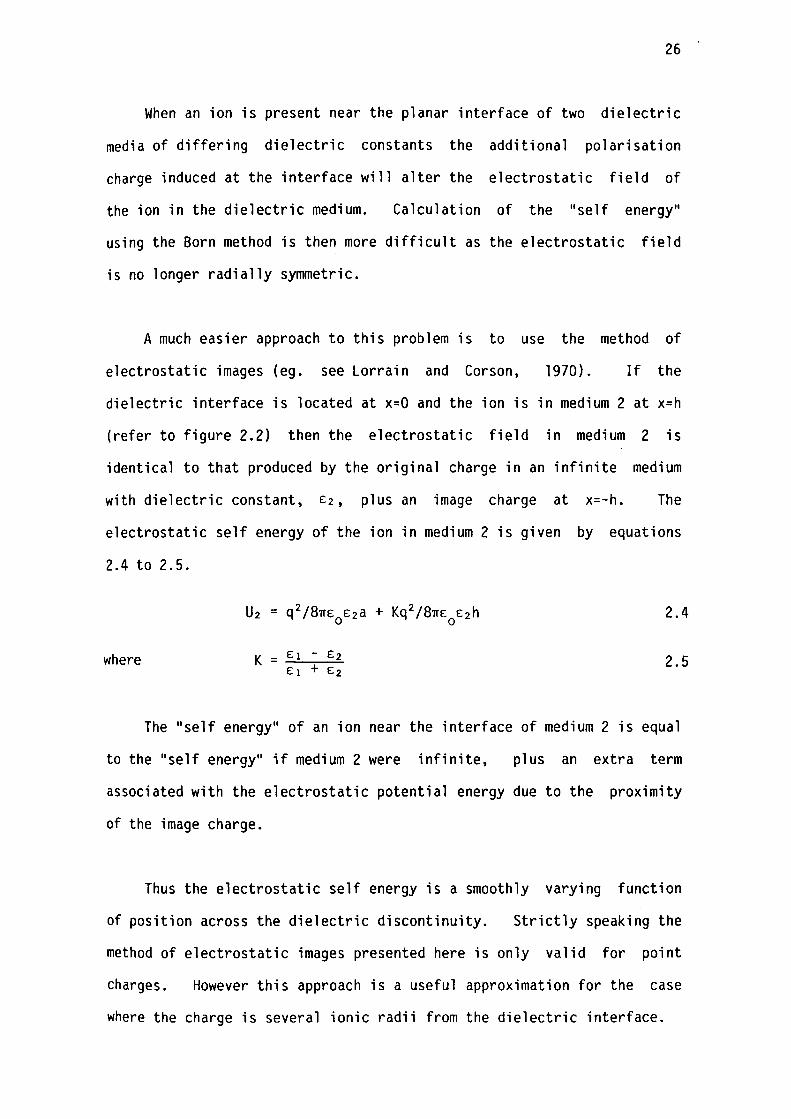
26
When an ion is present near the planar interface of two dielectric
media of differing dielectric constants the additional polarisation
charge induced at the interface will alter the electrostatic field of
the ion in the dielectric medium. Calculation of the "self energy"
using the Born method is then more difficult as the electrostatic field
is no longer radially symmetric.
A much easier approach to this problem is to use the method of
electrostatic images (eg. see Lorrain and Corson, 1970). If the
dielectric interface is located at x=O and the ion is in medium 2 at x=h
(refer to figure 2.2) then the electrostatic field in medium 2 is
identical to that produced by the original charge in an infinite medium
with dielectric constant, £2, plus an image charge at x=-h. The
electrostatic self energy of the ion in medium 2 is given by equations
2.4 to 2.5.
2.4
where 2.5
The "self energy" of an ion near the interface of medium 2 is equal
to the "self energy11 if medium 2 were infinite, plus an extra term
associated with the electrostatic potential energy due to the proximity
of the image charge.
Thus the electrostatic self energy is a smoothly varying function
of position across the dielectric discontinuity. Strictly speaking the
method of electrostatic images presented here is only valid for point
charges. However this approach is a useful approximation for the case
where the charge is several ionic radii from the dielectric interface.
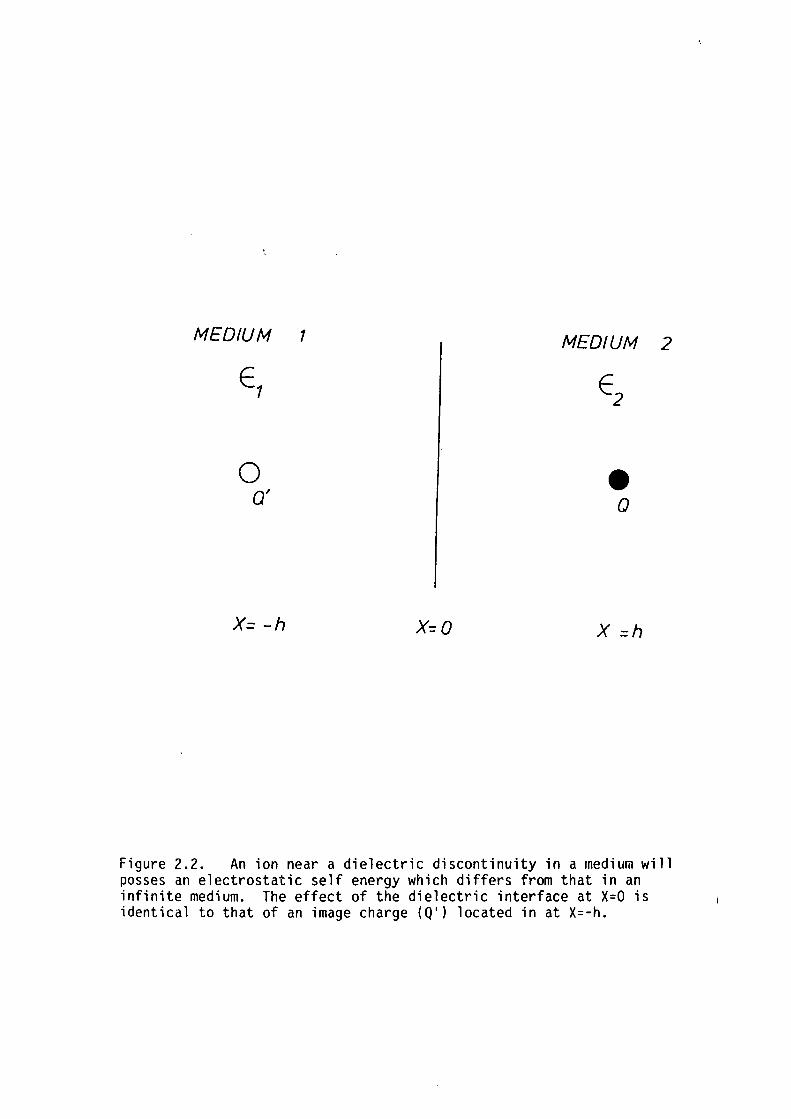
MEDIUM 1
0 Q'
X= -h X=O
MEDIUM 2
-Q
X =h
Figure 2.2. An ion near a dielectric discontinuity in a medium will posses an electrostatic self energy which differs from that in an infinite medium. The effect of the dielectric interface at X=O is identical to that of an image charge (Q') located in at X=-h.
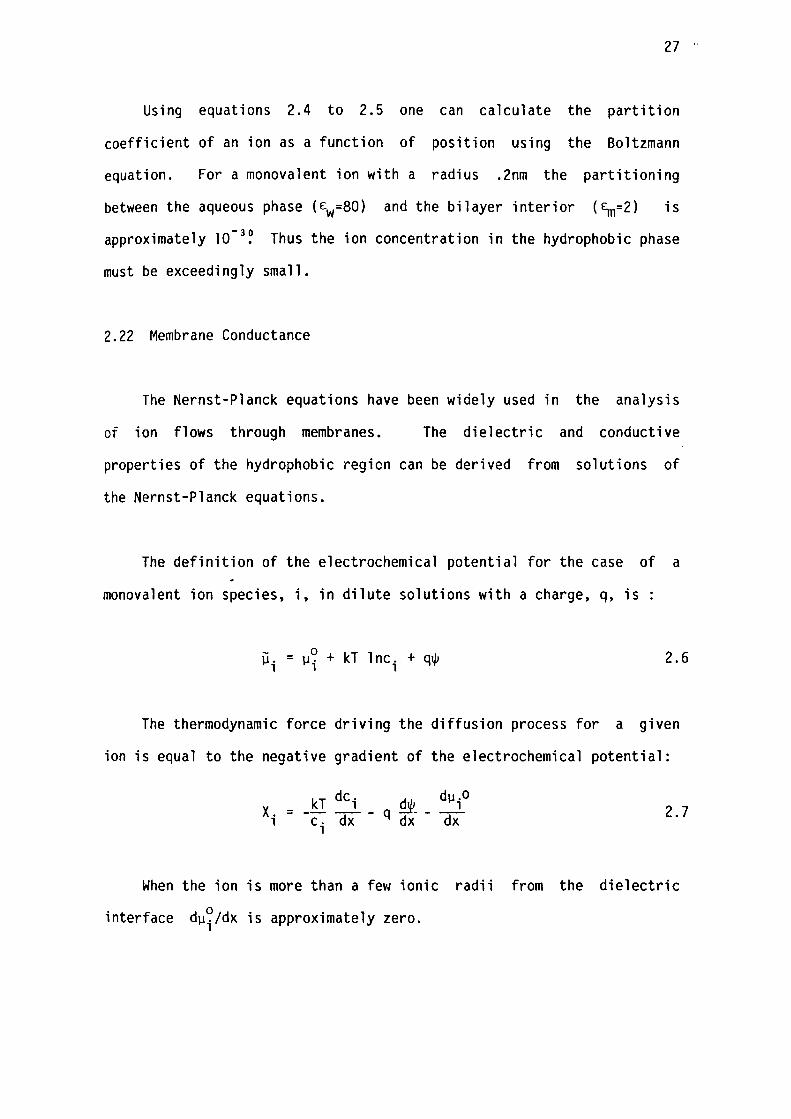
27 ,.
Using equations 2.4 to 2.5 one can calculate the partition
coefficient of an ion as a function of position using the Boltzmann
equation. For a monovalent ion with a radius .2nm the partitioning
between the aqueous phase (£w=80) and the bilayer interior (~=2) is -30 approximately 10 . Thus the ion concentration in the hydrophobic phase
must be exceedingly small.
2.22 Membrane Conductance
The Nernst-Planck equations have been widely used in the analysis
of ion flows through membranes. The dielectric and conductive
properties of the hydrophobic region can be derived from solutions of
the Nernst-Planck equations.
The definition of the electrochemical potential for the case of a
monovalent ion species, i, in dilute solutions with a charge, q, is :
µ. = µ? + kT lnc. + q~ 2.6 1 1 1
The thermodynamic force driving the diffusion process for a given
ion is equal to the negative gradient of the electrochemical potential:
2.7
When the ion is more than a few ionic radii from the dielectric
interface dµ~/dx is approximately zero. 1
28.
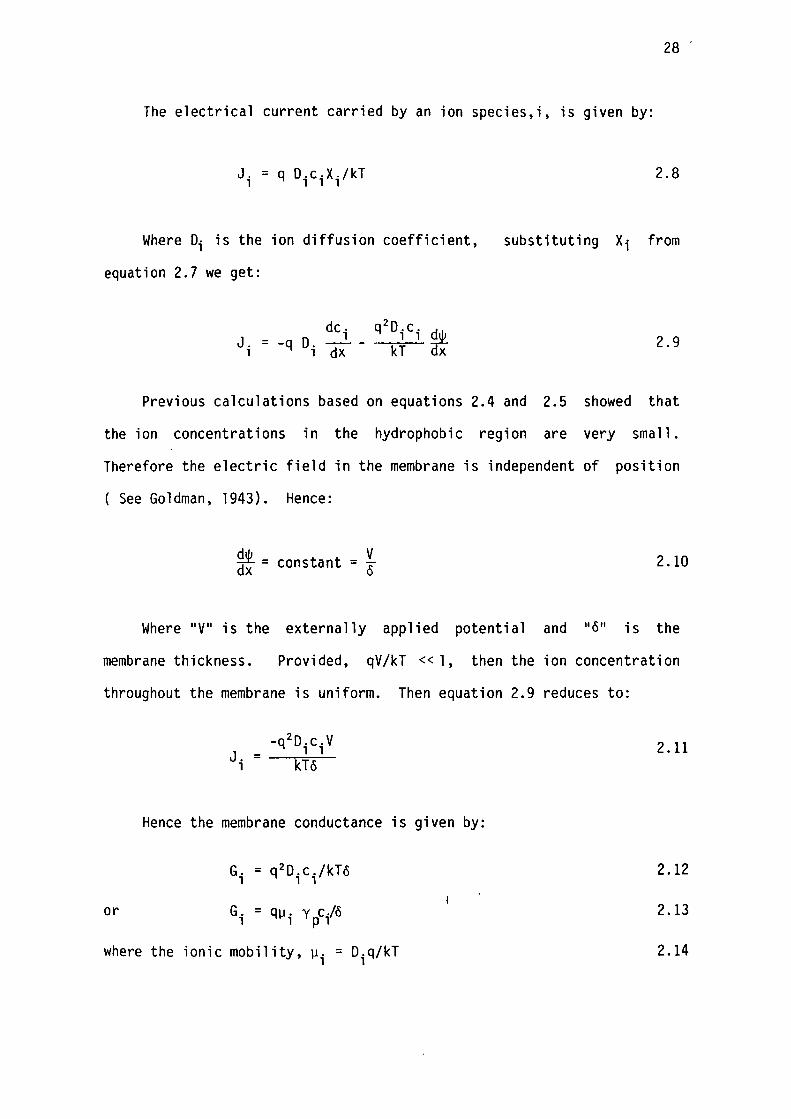
The electrical current carried by an ion species,i, is given by:
J. = q D.c.X./kT l l l l
2.8
Where Di is the ion diffusion coefficient, substituting Xi from
equation 2.7 we get:
de. l
Ji = -q Di dX 2.9
Previous calculations based on equations 2.4 and 2.5 showed that
the ion concentrations in the hydrophobic region are very small.
Therefore the electric field in the membrane is independent of position
( See Goldman, 1943). Hence:
~ = constant = i dx u 2.10
Where 11 V11 is the externally applied potential and 11 611 is the
membrane thickness. Provided, qV/kT « 1, then the ion concentration
throughout the membrane is uniform. Then equation 2.9 reduces to:
Hence
or
where the
-q 2 D.c.V l l Ji = --,k...,,,T=-o-
the membrane conductance is
G. l
= q2 D.c./kTo l l
G. l
= qµ. y c./6 l p l
ionic mobility, µi = D.q/kT l
2 .11
given by:
2.12
2.13
2.14
29 ·
Neumcke and Lauger (1969) extended this analysis to the case where
the standard chemical potential was position dependent. The self energy
of the ions in the hydrophobic interior included terms which accounted
for the effects of the dielectric discontinuity at the membrane aqueous
interface. The results obtained by these authors showed a non-linear
voltage - current (V-1) property which, for suitable values of the
parameters, was similar to the V-1 characteristics of lipid bilayers
measured in previous studies (Hanai et al., 1964).
2.23 Membrane Capacitance
i) Capacitance Due to Charge Storage
Electrical work can be stored within the hydrophobic region of the
membrane in the form of either space charge due to unequal cation and
anion concentration profiles within the membrane or as dielectric charge
storage due to interfacial polarisation at discontinuities in the
dielectric properties of the medium.
The dielectric, area-specific, membrane capacitance, CD, can be
calculated using the following expression:
CD=££ /6 2.15 o r
The non-dielectric charge storage in the membrane can only be
calculated from the exact solutions to the Nernst-Planck equations.
However, an upper limit to the non-dielectric capacitance was calculated
by Ashcroft (1979) using a modification of the method of Neumcke, Walz
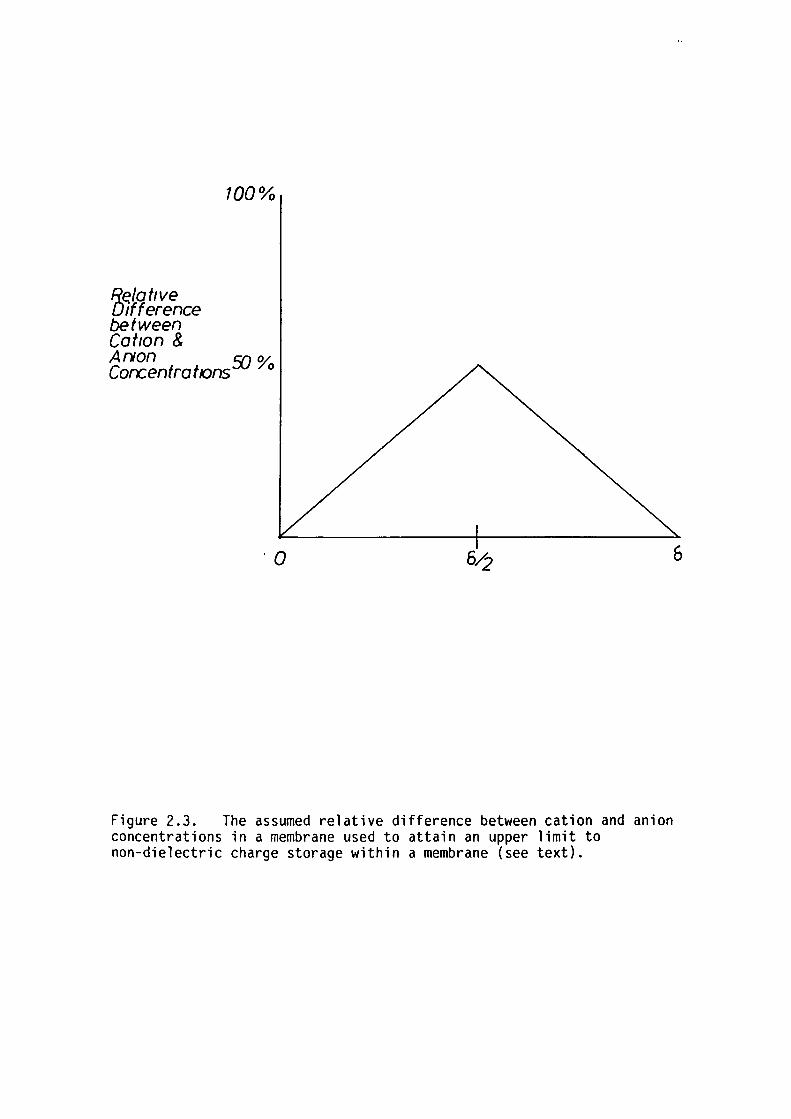
and Lauger (1970). It was assumed that the net space-charge was a
linear function of position with a maximum at the membrane midplane
30
equal to 50% of the total ion concentration (see fig 2.3). The voltage
across the membrane, V, can then be calculated by twice integrating
Poisson's equation which gives the following expression:
Uhere cris the net charge concentration at the membrane midplane.
An upper limit to the charge storage in ion profiles can be made by
choosing a large ion concentration in the membrane, say 1~7 mole/m ~ and
d = 6 nm then Vis 10- 15 volts. The total charge stored, calculated by
integrating the space-charge over volume, is 10- 37 coulomb. Hence the
capacitance due to the presence of this space charge distribution is
10- 22 F/m2 which is negligible compared to the dielectric capacitance of
the membrane (5.10- 7 F/m2 ).
The membrane capacitance and conductance have been examined here
using the time independent Nernst-Planck equations. However, the
membrane impedance is calculated from measurements of A.C. voltage
signals. The general solution of the Nernst-Planck equation in the
presence of a sinusoidal displacement from the equilibrium has been
presented by Smith (1977). His calculations show that the Goldman and
time-independent approximations are valid for the derivation of the
capacitance and conductance of the hydrophobic region.
ii) Phenoffienological Capacitance Due to Time Varying Resistances
The analysis of the data in this thesis relies on the assumption
that the dispersion in the measured capacitance and conductance of lipid
bilayers is due solely to their non-homogeneous dielectric structure.
R~/aflve Difference between Gofton &
100¾
An1on fIJ 3/t Corcenfrat,ons 0
·o
Figure 2.3. The assumed relative difference between cation and anion concentrations in a membrane used to attain an upper limit to non-dielectric charge storage within a membrane (see text).
6
31
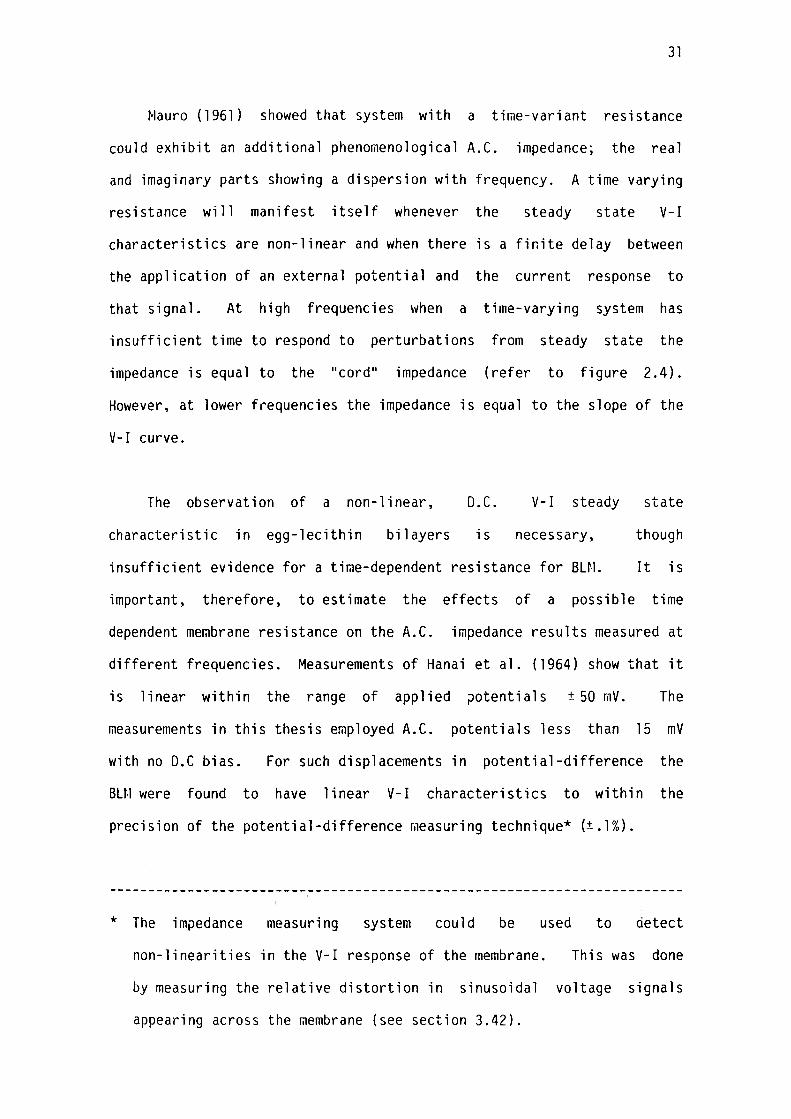
Mauro (1961) showed that system with a time-variant resistance
could exhibit an additional phenomenological A.C. impedance; the real
and imaginary parts showing a dispersion with frequency. A time varying
resistance will manifest itself whenever the steady state V-1
characteristics are non-linear and when there is a finite delay between
the application of an external potential and the current response to
that signal. At high frequencies when a time-varying system has
insufficient time to respond to perturbations from steady state the
impedance is equal to the "cord" impedance (refer to figure 2.4).
However, at lower frequencies the impedance is equal to the slope of the
V-1 curve.
The observation of a non-linear, D.C. V-1 steady state
characteristic in egg-lecithin bilayers is necessary, though
insufficient evidence for a time-dependent resistance for BLM. It is
important, therefore, to estimate the effects of a possible time
dependent membrane resistance on the A.C. impedance results measured at
different frequencies. Measurements of Hanai et al. (1964) show that it
is linear within the range of applied ;:>otentials ± 50 mV. The
measurements in this thesis employed A.C. potentials less than 15 mV
with no D.C bias. For such displacements in potential-difference the
BLM were found to have linear V-1 characteristics to within the
precision of the potential-difference ~easuring technique* (±.1%).
to detect * The impedance measuring system could be used
non-linearities in the V-1 response of the membrane. This was done
voltage signals by measuring the relative distortion in sinusoidal
appearing across the membrane (see section 3.42).
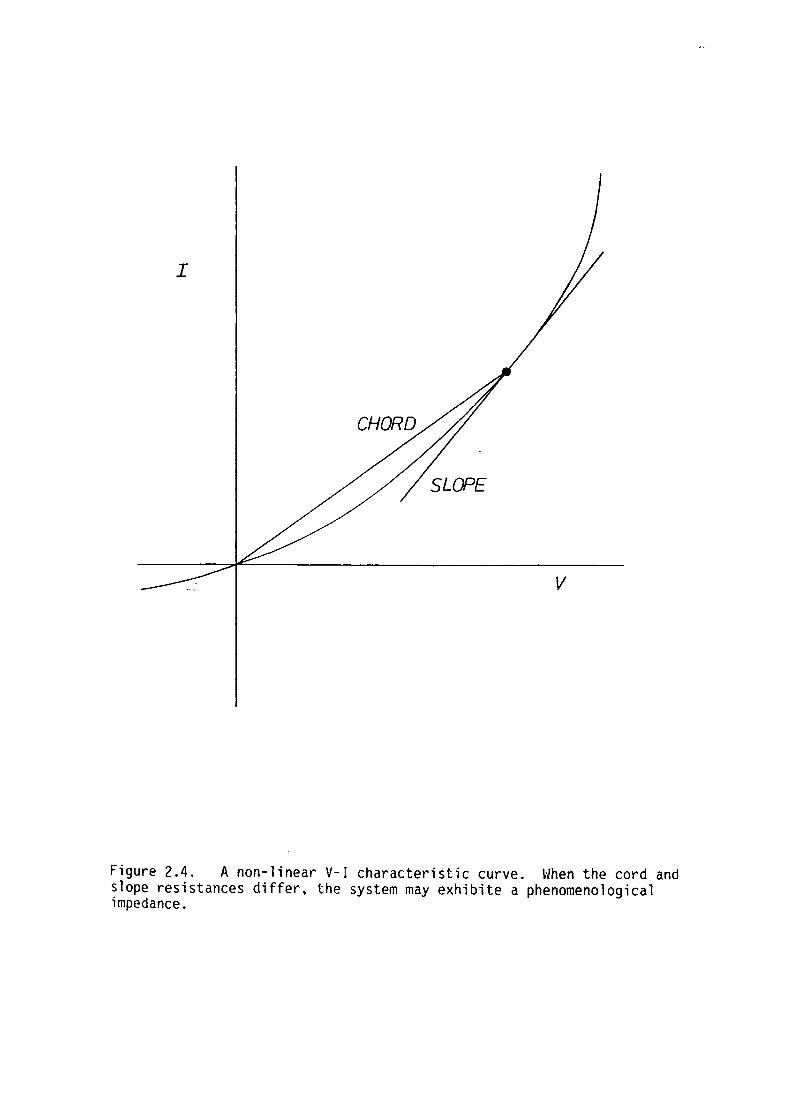
Figure 2.4. A non-linear V-1 characteristic curve. When the cord and slope resistances differ, the system may exhibite a phenomenological impedance.
32 "
The anomalous impedance dispersion that would occur if the bilayer
impedance was indeed both time-varying and non-linear could be ignored.
From the above considerations it is valid, for small voltage
signals, to consider the hydrophobic region of egg-lecithin bilayers as
an ideal capacitor shunted by an ohmic resistor. The capacitance of the
hydrophobic region will then be equal to that of a parallel plate
capacitor filled with a medium with a dielectric constant equal to that
of the acyl chain region of the BLM, having a plate separation equal to
the thickness of that region.
2.3 POLAR REGION
The polar region, here, is defined as the region containing the
non-acyl chain chemical moieties at the hydrophobic - hydrophilic
interface of lipid bilayers. In the case of egg-lecithin that would
include the glycerol and choline phosphate moieties of the molecule.
The alignment of the choline phosphate dipoles at the
membrane-solution interface creates a region of fixed charges believed
to have a dielectric constant in the range 20-40 (Coster and Smith, 1974
and Ashcroft, 1979) and a thickness, depending on the dipole
orientation, between .5 and 1.1 nm. The dielectric capacitance of the
choline phosphate region should then be in the range .2-.8 F/m 2 •
Theoretical calculations of the impedance of the double fixed
charge membrane (DFCM) by Mauro (1962) showed that an additional
capacitance could arise from space charge at the junction of the
33
positive and negative sheets of fixed charge. Mauro pointed out that
the choline phosphate groups may form a DFCM and that the capacitance of
the polar region would be the parallel combination of the dielectric and
'Mauro' capacitances.
Subsequent examination of the electrical properties of the polar
region by raeans of their electrophoretic raobility (Hanai et al., 1965a)
indicated that the choline phosphate dipole of the egg-lecithin
molecules in bilayers is oriented parallel to the plane of the membrane.
More recent NMR studies in multilayers (eg. Seelig, Gally and
Wohlgemuth, 1977) show that the axis of the choline phosphate group is
parallel to the plane of the bilayer and has considerable rotational
mobility. In the light of this it appears unlikely that the theory of
the DFCM can be successfully applied to the polar region of egg-lecithin
bilayers. In any case Coster (1973) showed that even if the polar head
region of egg-lecithin bilayers could be modelled as a DFCM the effect
of the 'Mauro' capacitance is small compared to the dielectric
capacitance of the polar heads over the frequency range of impedance
measurements employed in this thesis.
34 ,,
2.4 AQUEOUS PHASE
2.41 The Effect of Unstirred Regions
Significant contributions to the merabrane impedance can arise from
unstirred layers and ionic double layers in the electrolyte adjacent to
the membrane.
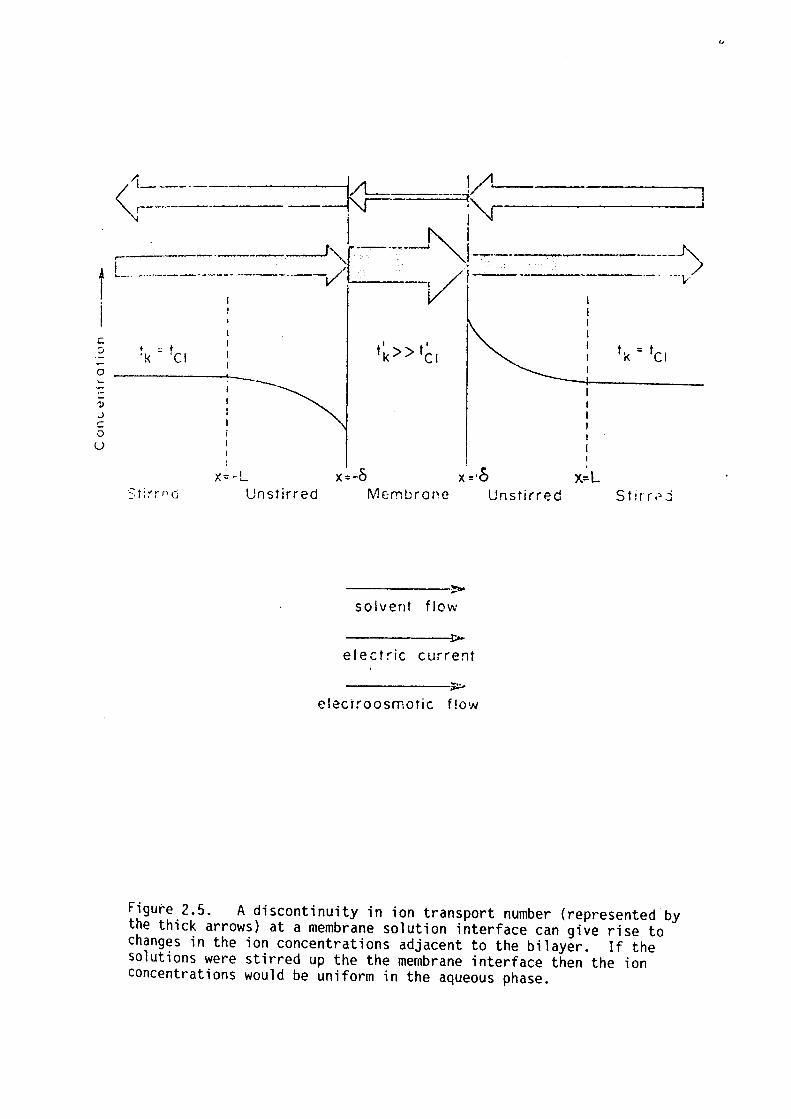
Passing a steady current across a membrane - electrolyte boundary
when ion transport numbers in the membrane and electrolyte are
different can lead to a perturbation in the ion concentration profiles
in the regions adjacent to the BLM whereby the ion concentrations are
either increased or decreased (see figure 2.5). If the electrolyte was
perfectly stirred right up to the membrane boundary then this effect
\'IOU l d not occur.
The perturbations in the ion concentration profiles in the
unstirred regions adjacent to the membrane will introduce a dispersion
in capacitance and conductance. Measureraents of the effect of unstirred
layers on the zero-current conductance of glycerol monooleate
(Gf,iO) - n-decane bilayers containing valinomycin (an ionophore
selective for potassiura) ~as obtained by Ciani, Gambali, Gliozzi and
Rolandi (1975). This study revealed that the effect of unstirred layers
on the measured raembrane conductance, where the ionic strength in th~ I
4 aqueous phase exceeded 10 M/m 3 , could be ignored provided the membrane
conductance was less than 0.1S/m 2 • All the results reported in this
thesis were obtained from bilayers for which this condition was
applicable.
1---------~ !/1 , . --· =t .-------- -- I iv t c-=-:-.-:::====---------)C ----~~----~---·-· __ ) i
C: ::,
-0
t = t 'k 'Cl
--x:::-L X=--8 x=·b X=L
Un s t i r red M cm bra P e Un s t i r r e d S t i r r ;, j
------>-solvent flow
------1:-· e I e c t ric current
------~ electroosmotic f !ow
Figure 2.5. A discontinuity in ion transport number {represented by the thick arrows) at a membrane solution interface can give rise to changes in the ion concentrations adjacent to the bilayer. If the solutions were stirred up the the membrane interface then the ion concentrations would be uniform in the aqueous phase.
,,
Sraith (1977) calculated the effects of unstirred layers on the low
frequency membrane - electrolyte impedance. It was found that the
capacitance of a membrane bounded by unstirred layers could be
significantly higher than its dielectric capacitance. However, for the
lipid bilayers studied in this thesis the effect of unstirred layers was
expected to be negligible.
2.42 Ionic Double Layers
When a potential difference is applied across a
membrane - electrolyte system a portion of the _applied electric field
will appear in the external solution. This is a consequence of the fact
that the displacement field, D, due to the applied potential difference,
is continuous across the membrane solution interface. However, the
movement of ions, external to the membrane, in this field will screen
the electric field frora the bulk electrolyte phase. This produces a net
space-charge at the membrane solution interface. This region of net
charge will be referred to as the Gouy-Chapman ionic double layer. The
potential as a function of position through such a system under an
applied potential, V, is shown in figure 2.6. Lauger et al. ( 1967)
calculated the capacitance of a neutral membrane solution system by
calculating the derivative of net space charge with respect to the
applied voltage. This was done as follows.
The space charge as a function of position in the aqueous phase ~s f
given by:
\there (refer to figure 2.6)
<1> 0 (x) = (tjJ(x) - t/l(oo))fkT
2.17
2.18
36
The position dependent potential can then be calculated from
Poisson's equation which with planar symmetry becomes:
~= ~-= ~ dx 2 dx £ £ o r 2.19
It can be shown that equation 2.21 is obtained by solving equations
2.18 and 2.19 and applying the following boundary conditions.
where
and
- V iµ{oo) - 2
= y_ + 2kT ln {1 + tanh(a/2).e-X/A} IJi(x) 2 q 1 - tanh(a/2).e-x/A
V a= (2 - iµ(o))/2kT
which is the debye length in the bulk aqueous phase.
2.20
2.21
2.22
2.23
One can
further simplify this equation by applying the boundary conditions and
using the Goldman approximation.
The total capacitance of the membrane electrolyte system, I
now be calculated by integrating the space charge over all
dividing by the applied voltage.
Hence:
2.24
2.25
C. can m' 11 x11 and
2.26
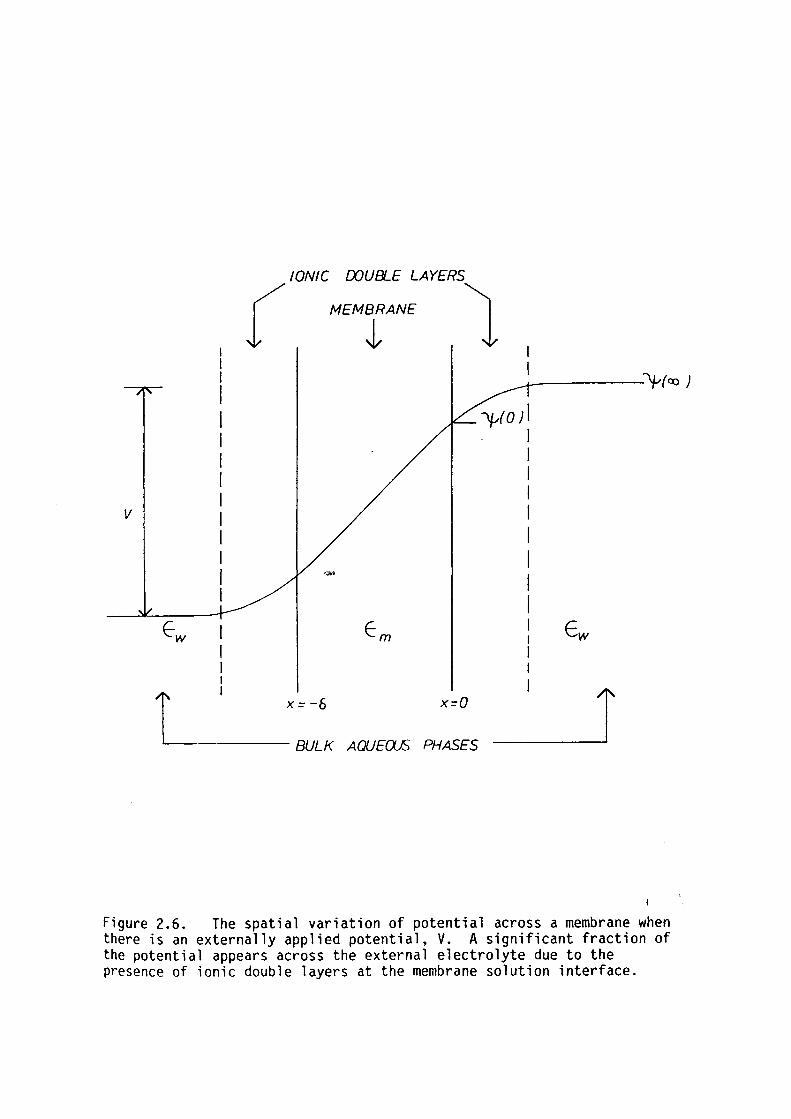
-'------:\/--(co J
V
1 X= -6 x=O
BULK AQUEOJS PHASES J
j
Figure 2.6. The spatial variation of potential across a membrane when there is an externally applied potential, V. A significant fraction of the potential appears across the external electrolyte due to the presence of ionic double layers at the membrane solution interface.
37
Everitt and Haydon (1968) used the same theoretical analysis to
calculated the capacitance of a charged membrane. If the presence of a
surface bound charge, 0 b , gives rise to a potential at the membrane's
surface, ~0• in the absence of an externally applied field, then:
v .. £ £w cosh(q~ /kf)
0 0
2.27
~Jhere ~ = 2kT sinh- 1{qobA/2kT£ Ew) 0 q 0
2.28
When 11 ~ 11 is large or 11 A II is sma 11 equation 2. 27 reduces to 0
equation 2. 15. Therefore neglecting the presence of ion double layers
when calculating membrane thickness from the total membrane capacitance,
using equation 2. 15, is only valid when the bilayer has a large net
surface charge or when the ion concentration in the aqueous phase is
high (>. l Molar).
The rigorous treatment of the impedance of membrane solutions
systems has been made by Smith (unpublished data). The solutions to the
steady state Nernst-Planck equations for the membrane - solution
interface allowed calculation of the capacitance and conductance of the
ionic double layers external to the membrane. Smiths results indicated
that the ionic double layer has a electrical time constant equal to that
of the membrane irrespective of the external ion concentrations in the
bulk phase. This region will therefore not effect the relative
dispersion in membrane impedance. However, th~ capacitance at each l
frequency will be somewhat reduced. This surprising result will be
discussed later in this thesis (see Chapter 7).
38
2.5 PHILOSOPHY OF MEASUREMENT
2.51 Time Domain vs. Frequency Domain
Thus far, techniques for measuring membrane impedance have fallen
into two main categories; measurements in the time domain and
measurements in the frequency doraain ( each being the Fourier transform
of the other) .
i) Time Doraain
This method of measuring membrane impedance involves introducing a
step change in voltage or current across the bilayer and measuring the
subsequent time-course of the current or voltage signal. This is
equivalent to simultaneously applying a whole spectrum of A.C. voltage
signals across the bilayer. However the choice of the relative
amplitudes of the different frequency components of the voltage and
current steps are restricted to that obtained from fourier transform of
the time-course of the applied voltage or current.
The voltage response of a single parallel resistor-capacitor (GC)
network to a current step is of the form:
where:
V(t) = voltage across the GC network at time t
VO = voltage at t= 00
2.29
2.30
39
T1 = the electrical time-constant of the network
c1 = the capacitance of the GC network
G1 = the conductance of the GC network
Uhen r~ such arrangements of GC elements in series (see figure 2.7)
are subjected to a current step.
0 It can be seen that, Vn,
N -t/T L V0 (1 - e n)
n=l n
the steady state voltage across
2.31
each
element will determine the maximum contribution of each element to the
total potential across the bilayer. It is seen that in latter sections
(see Chapter 7 and Chapter 9) that the conductance of the polar head
regions is at least three to five orders of magnitude higher than the
hydrophobic region. Therefore the polar heads will only contribute
.001-.1% of the total measured signal. further, these measurements of
V(t) in the time interval between the step current pulse and t<.0001
second have to be made to accurately determine the time constant of the
polar head regions.
ii) Frequency Domain
The Maxwell-Wagner dispersion in capacitance, C, and conductance,
G, of a network of N GC elements in series can be derived from the
following recursive relations:
C n+ 1 ( w) = _w_2 c_n_c_n_-l_(_2_c_n +_c_n_-_1_) _+_4_Cn_-_l_(_cn_)_2_+_2c_n_G_~_-_l
For n=2 to N-1 (2Gn+Gn-1)2+w2(2cn+Cn-l)2 2.12
2GnGn_ 1(2Gn+Gn-l) + w2(2GnCn-l+4Gn-l(Cn) 2) =------------------ 2.33
where and 2.34
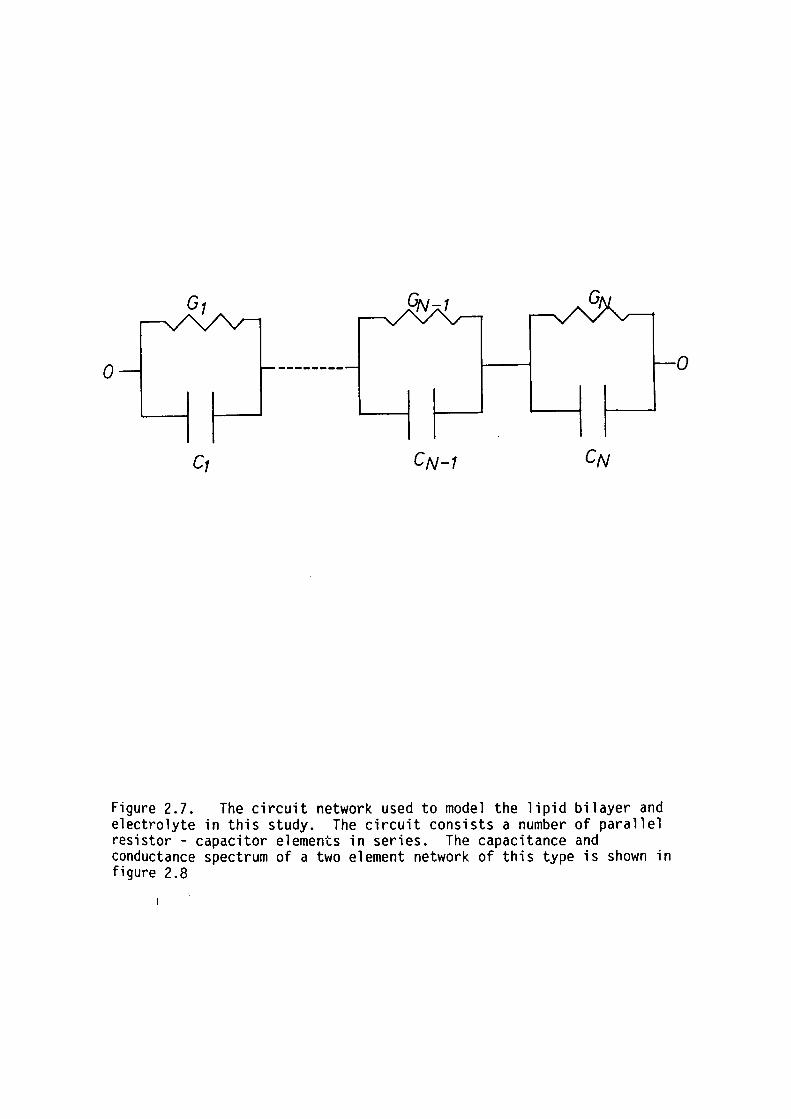
0
c,
Figure 2.7. The circuit network used to model the lipid bilayer and electrolyte in this study. The circuit consists a number of parallel resistor - capacitor elements in series. The capacitance and conductance spectrum of a two element network of this type is shown in figure 2.8
0
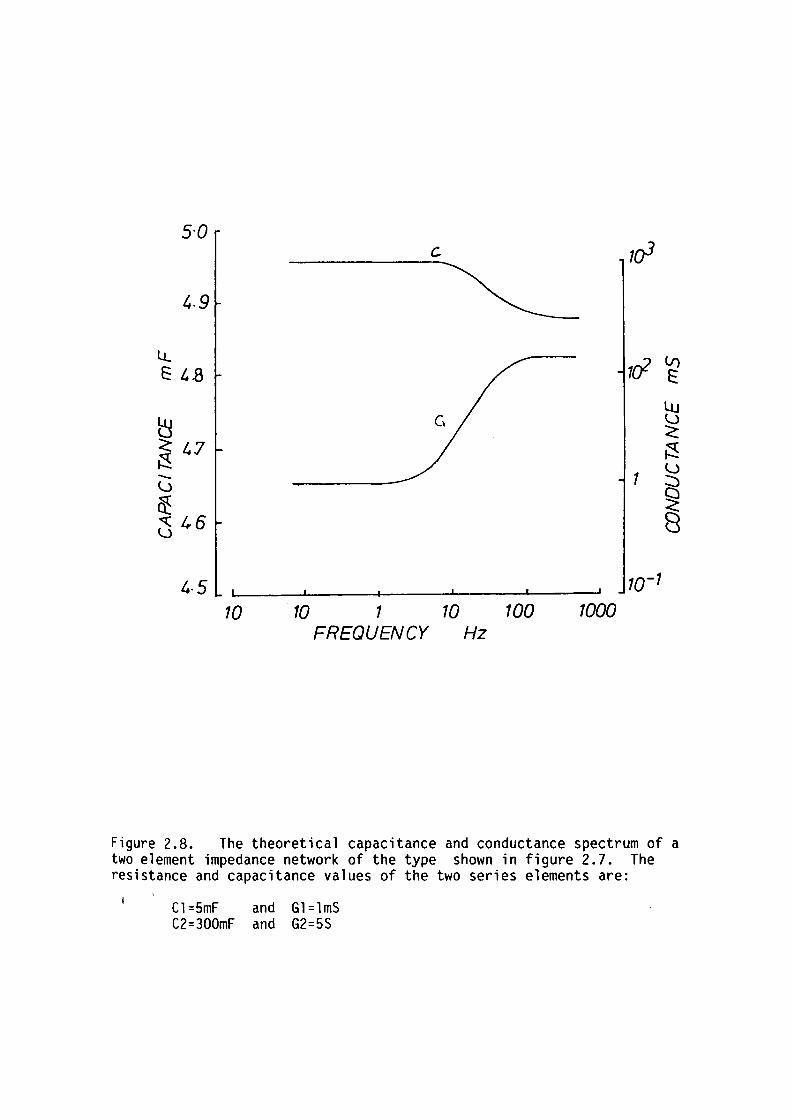
5·0 C 1a3
4,9
lJ_ l/) 1rl E 4.8 E
Lu
~ (._)
<: ~ t..7 ~ ~ (._) - 1 :::, (J
~ ~ "( 46 8 (._)
4.5 10-1
10 10 1 10 100 1000 FREQUENCY Hz
Figure 2.8. The theoretical capacitance and conductance spectrum of a two element impedance network of the type shown in figure 2.7. The resistance and capacitance values of the two series elements are:
Cl=5mF and Gl=lmS C2=300mF and G2=5S
40
The frequency dependence of a two element circuit of the type shown
in figure 2.7 is shown in figure 2.8. G(w) and C(w) can be derived
from measurements of the total impedance Z(w) and phase •(w) angle of
the multi-element circuit using the following equations:
C(w) = sin i{w) w Z w) 2.35
2.36
Measurements of Z(w) and •(w) have been made using and A.C.
impedance measuring bridge (see Hanai et al., 1964 and White 1970). A
balance is obtained when the phase angle and amplitude in the known and
unknown arms of the bridge are equal. The main difficulty with this
method is the detection of balance as the voltage across the membrane
must remain small in order to remain in the linear portion of the V-1
characteristics of the bilayer (V<50 mV). The long times required to
obtain a balance at frequencies less than 10 Hz make this null detection
method impractical for ultra-low frequency impedance measurements.
Further, such bridge measurements are restricted to 2 (or sometimes 3)
terminal methods where the electrode - solution impedances make it
difficult to extract the membrane impedances from the total impedance.
This is particularly so at low frequencies (eg.
1970).
Coster and Simons,
Measurements pf membrane impedance in the frequency domain are l
superior to that in the time domain because there is no necessity for
high time resolution during bridge measurements. Further, noise
reduction techniques in A.C. measurements is superior to those in D.C.
measurements.
41
2.52 Four Terminal Digital lrapedance Measuring Technique
A digital impedance measuring technique was developed by Coster and
Smith (1974) to measure membrane impedance in the frequency range .lHz 0
to 100 Hz with a resolution of .3% amplitude and .02 phase angle. This
method overcame the problems inherent in A.C. null detection techniques
at these low frequencies.
The digital impedance measuring technique directly measures the
phase difference and amplitude ratio of the current and voltage signals
occurring across the bilayer and a known standard hard-wire network
connected in series with the membrane. This is done by simultaneously
measuring the time course of the voltage signal developed across the
membrane and standard impedance network. This eliminates the need to
detect a balance. A schematic diagram showing the principle of the
impedance measuring system is shown in figure 2.9. Greater detail of
the impedance measuring system "BULFIS'' is given in chapter 4.
Potential measurements in the frequency and time domain require an
electrical connection between the measuring device and the aqueous phase
near the membrane. Two different electrode configurations have been
used for sampling membrane potential; the two terminal and the four
terminal method.
The two terminal method involves connecting the potential measuring
device to the current injecting electrodes. Correct calculation of the
membrane potential necessitates a correction for the frequency dependent
electrode-solution potential in series with the membrane potential. The
effect of the electrode solution potential can be allowed for (eg see
Coster and Simons, 1970) but requires highly accurate measurements as
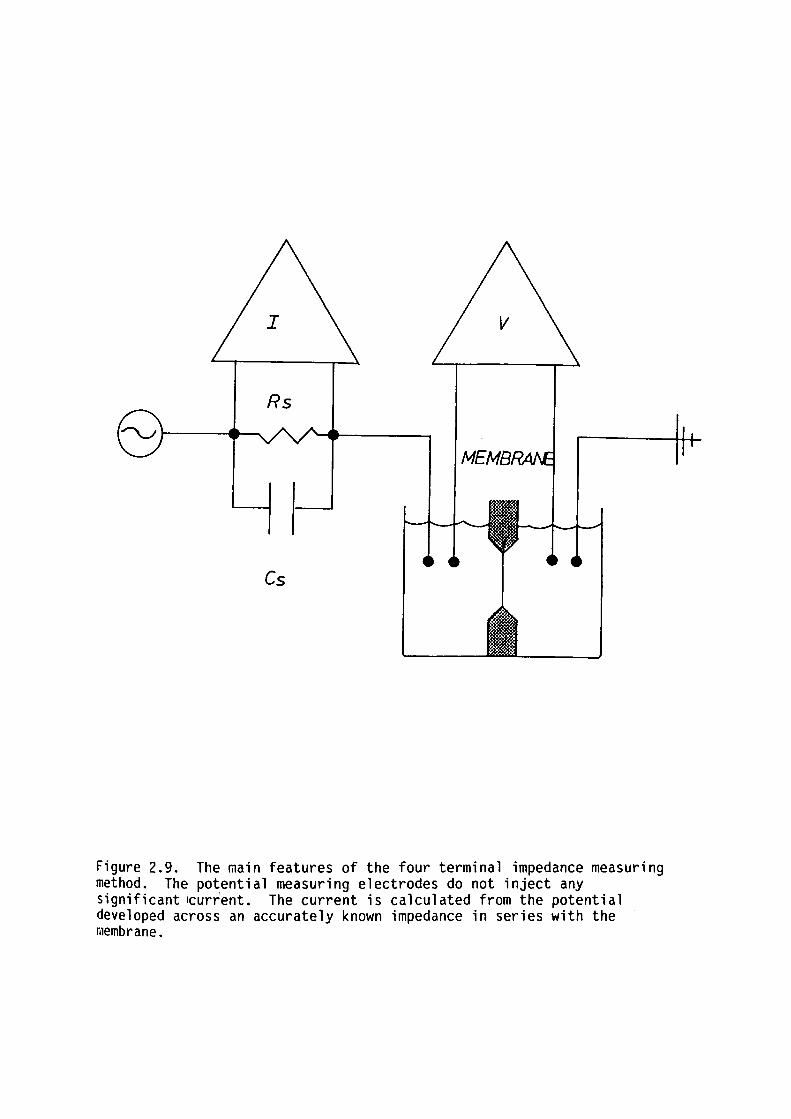
Rs
Cs
Figure 2.9. The main features of the four terminal impedance measuring method. The potential measuring electrodes do not inject any significant ~urient. The current is calculated from the potential developed across an accurately known impedance in series with the membrane.
42
the vectorial subtraction procedure is extremely sensitive to small
errors.
The four terminal method employs two pairs of electrodes; one pair
for injecting current and a separate pair for measuring membrane
potential. Provided the input impedance of the voltmeter is
sufficiently high (10 13 ohms} the potential at the electrode solution
interface is equivalent to the electrostatic (zero current} value. The
effect of the electrode-solution potential then cancels when using an
identical pair of potential electrodes. Thus the four terrainal method
eliminates the need to correct for the electrode - solution impedance.
The impedance of the membrane can be derived from the phase
difference, ~D, and amplitude ratio, AR', between the voltage signals
appearing across the me~brane and the impedance standards using the
following equations:
2.37
\Jhere "~s" and "Zs" are the phase and magnitude of the standard
impedance.
CHAPTER 3
APPARATUS
3.1 INTRODUCTION
3.2 MEMBRANE APPARATUS
3. 3 AMPLIFIER ASSEMBLY
3.31 General Principles of the Design
page
44
46
49
49
3.32 Amplifier Assembly; Mechanical Construction 50
3.33 Amplifier Electronics 51
3.4 COMPUTER CONTROL
3.41 BULFIS Hardware
3.411 Progranvnable Signal Generator
3.412 Data Acquisition Boards
3.42 BULFIS Software
52
52
52
53
53
43
44
3.1 INTRODUCTION
The function of the various components of the experimental
apparatus fell into four main categories. Photographs of the overall
experimental setup are shown in figures 3.1 and 3.2. The experimental
apparatus consisted of:-
a) an assembly to contain the membrane and its electrolyte environment
for impedance measurements·.
b) Four Ag/AgCl electrodes, a voltage divider network, standard
impedances and two differential amplifiers (for amplifying the small
voltage signals developed across the membrane and standard impedance)
which were housed in a Teflon frame.
c) a Faraday cage mounted on an antivibration platform which contained
the amplifiers and bilayer apparatus.
d) the Biophysics Ultra Low Frequency Impedance Spectrometer (BULFIS)
which embodied an LSI 11 microprocessor connected on line to the
experiment. It controlled the generation of the sine wave, acquisition
of raw data (voltage and current signals) and computation of membrane
impedance.
The hardware and software for BULFIS was developed by T. Chilcott
of this laboratory, based on an earlier digital four terminal impedance
measuring system described by Bell, Coster and Smith (1975).
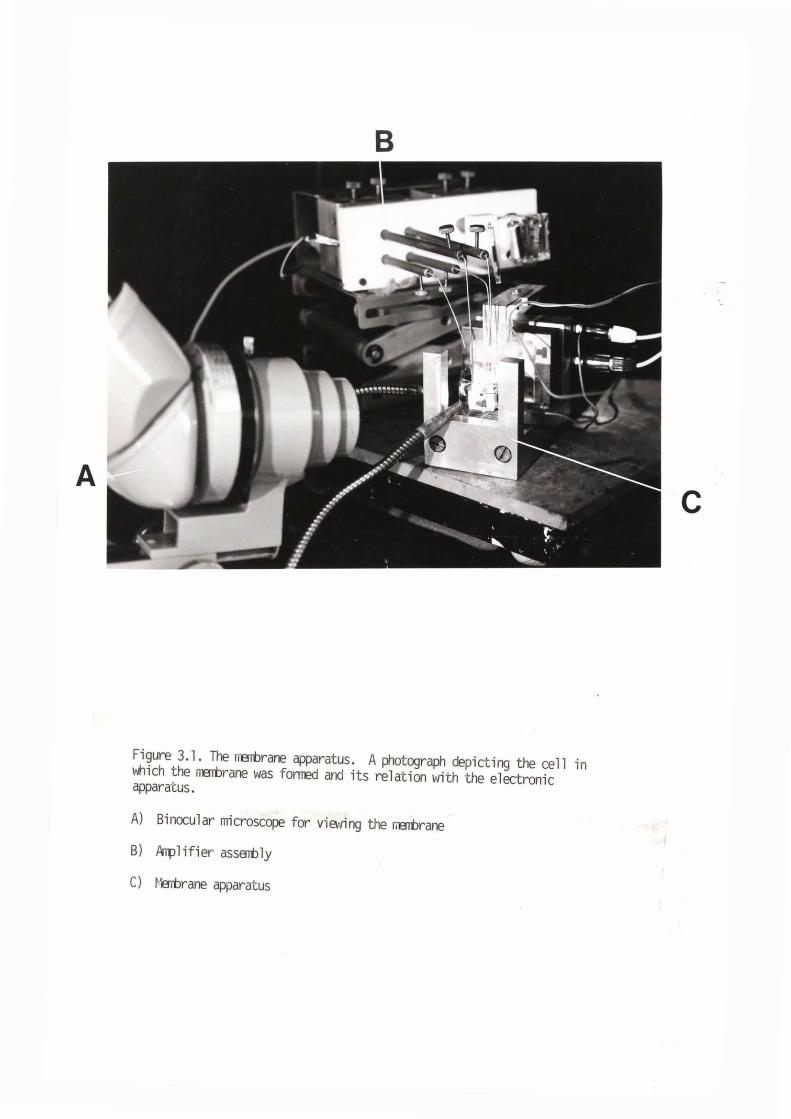
A
B
Figure 3.1. The rrarbrane apparatus. A photograph depicting the cell in which the rrarbrane ~'/as fonred and its relation with the electronic apparatus.
A) Bi nocu l ar microscope for vi e-,i ng the rrarbr ane
B) Arplifier asserbly
C) Memrane apparatus
C
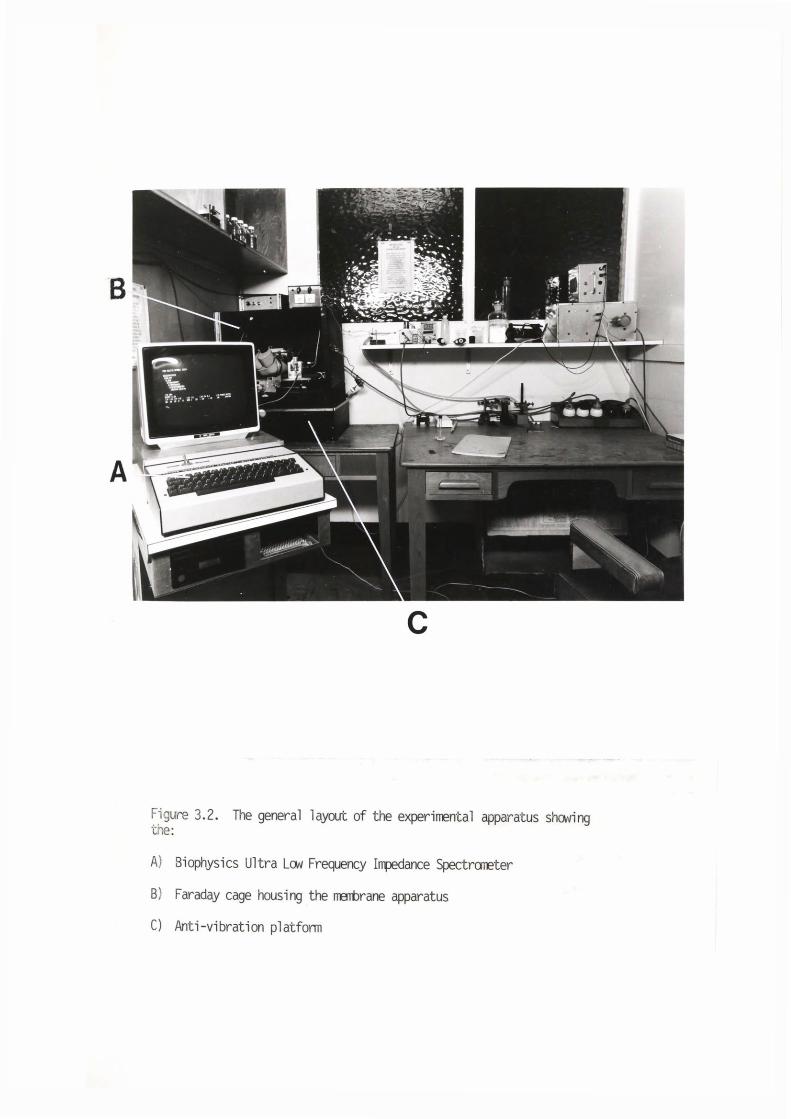
A
C
Figure 3.2. The general layout of the experiirental apparatus shONing the:
A) Biophysics Ultra LON Frequency Irrpedance Spectrareter
B) Faraday cage housing the rrarbrane apparatus
C) Anti-vibration platform
45
The experimental design was aimed at performing accurate impedance
measurements of lipid bilayers which have stable mechanical and
electrical properties in an accurately monitored environment. Some
factors taken into consideration during the design of this apparatus
were:-
a) Minimising electrical noise and mechanical vibration in the membrane
environment.
b) Minimising the effect of any stray capacitance or current shunt paths
on the measured membrane impedance.
c) Eliminating the probability of surface active or extraneous
hydrophobic substances (from other experiments conducted with the
apparatus) contaminating the membrane. This was done by ensured easy
cleaning of all non-disposable components.
The precise impedance measurements needed in these experiments
placed heavy demands on the experimental apparatus. A significant part
of the work in this thesis was devoted to overcoming the problems
inherent in accurate measurements of high impedance. Technical details
of apparatus was only given in this thesis where such detail is required
to clarify the validity/feasibility of experiments or any results
obtained.
46
3.2 MEMBRANE APPARATUS
The apparatus containing the membrane and electrolyte is shown in
figures 3.2 and 3.3.
Black lipid bilayers (membranes) were formed across a 1-2 mm
aperture in a polycarbonate septum dividing two compartments which
contained electrolyte. A plexiglass vial formed the inner compartment
which was suspended in a small glass beaker. The polycarbonate septum
was fixed across a hole milled into the side of the plexiglass vial.
The adhesive used for this purpose was a solution of plexiglass in
ethylene dichloride. This was used as it ensured a water-tight,
mechanically strong, non-contaminating seal between the polycarbonate
and plexiglass.
A countersunk hole was milled into the polycarbonate septum, while
mountea on a brass block, using the tip of a highly polished 5 mm
diameter drill bit. Any rag that remained at the edge of the hole was
removed by gently abrading it with a piece of fine emery cloth. Water
was the only lubricant used while machining the plexiglass vial. This
was to circu~vent the possibility of trace amounts of machine oil being
absorbed into the plexiglass and contaminating membranes in future
experiments. The vial and septum were then thoroughly cleaned in
alcohol and distilled water before use.
Heat was added or removed from the electrolyte via a solid state
Peltier (Cambion 601-4000) which was raounted in thermal contact with the
base of the glass beaker. The Peltier device was operated from a
variable (0-SV) D.C. power supply. The power supply was remote from the
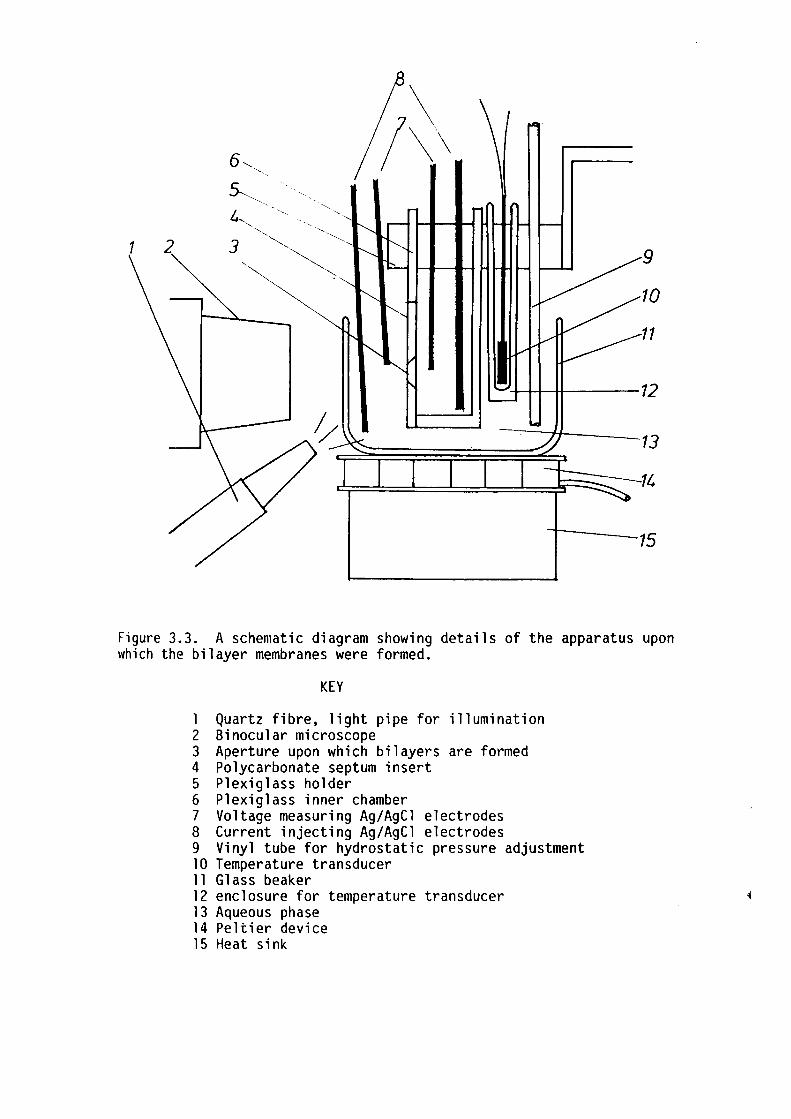
1 2
13
15
Figure 3.3. A schematic diagram showing details of the apparatus upon which the bilayer membranes were formed.
KEY
l Quartz fibre, light pipe for illumination 2 Binocular microscope 3 Aperture upon which bilayers are formed 4 Polycarbonate septum insert 5 Plexiglass holder 6 Plexiglass inner chamber 7 Voltage measuring Ag/AgCl electrodes 8 Current injecting Ag/AgCl electrodes 9 Vinyl tube for hydrostatic pressure adjustment 10 Temperature transducer 11 Glass beaker 12 enclosure for temperature transducer 13 Aqueous phase 14 Peltier device 15 Heat sink
47
rest of the experimental apparatus, to avoid problems of A.C.
pickup by voltage and current measuring amplifiers.
signal
In most experiments an air-cooled copper heat sink under the
Peltier device was sufficient as a source, or sink of, heat which was
pumped into, or out of, the membrane chamber via the Peltier device.
Experiments involving measurements at more that 5°C below ambient
temperature employed a water-cooled brass heat sink. This improved the
efficiency of the Peltier device. However, mechanical vibration
transmitted through the water pipes feeding the heat sink reduced
membrane stability.
wherever possible.
Therefore the air-cooled heat sink was used
The temperature was monitored (±.5°C) using
temperature transducer Analog Devices AD 590KF).
mounted in a small glass vial which was suspended in
adjacent to the membrane.
a
This
the
solid state
device was
electrolyte
A syringe connected to the beaker by a length of vinyl tube was
used to equalize the hydrostatic pressure across the membrane by adding
or removing small quantities of aqueous solution.
Four silver-chloride coated silver (Ag/AgCl) electrodes, suspended
from fixed brass rods, were immersed in the aqueous solutions on either
side of the ~embrane. Two of these electrodes were for injecting
current though the membrane and two for measuring the pot~ntial
developed across the membrane. The potential-measuring electrodes were
suspended so that they were close to the membrane. This was to reduce
the voltage drop that occurred across the layer of electrolyte between
the membrane and the ~otential measuring electrodes.
48
These electrodes were made by electrolytic deposition of silver
chloride onto a length of silver wire immersed in a l Molar potassium
chloride electrolyte. The main advantage of using Ag/AgCl electrodes in
measuring potential differences is that they have a well defined
electrode-solution potential.
The plexiglass chamber, septum and Ag/AgCl electrodes were
discarded after they had been in contact with certain contaminating
chemicals (where their effect on BLM may have been the subject of
investigations in prior experiments).
The membrane was viewed in white light under a 10-40x binocular
microscope. Good visibility was required to monitor changes in the
me~brane geometry due to bowing as the reflectivity coefficient of
bilayer membranes is very low. The illumination was produced by a 100
watt quartz-halogen light bulb operating from a remote 12 V D.C. power
supply and variac. The light was channelled through quartz fibre optics
to the membrane. This provided a cool source of illumination very close
to the membrane which could be easily adjusted for maximum visibility
and which did not introduce A.C. pickuµ effects associated with normal
A.C. driven microscope type illumination.
The membrane and amplifier apparatus were placed in an earthed
steel Faraday cage which reriuced the extraneous electrical noise induced
in the electrical circuitry of the apparatus. All power supplies
operating from 50 Hz mains power supplies were well removed from the
Faraday cage.
49
The Faraday cage was mounted on an antivibration platform which
consisted of two stages in series. The first consisted of a 160 Kg
cement block mounted on six springs resting in a viscous bath of silicon
oil. The second stage was a 10 Kg steel slab which was supported by
four soft rubber balls. The time-constants for the two stages of the
anti-vibration platform were l second and .3 second respectively. This
arrangement greatly attenuated any mechanical vibration that was
transmitted from the floor to the me@brane.
3. 3 A~1PLIFIER ASSEMBLY
3.31 General Design Principles
The construction of the amplifier assembly was designed to overcome
many of the problems inherent in high impedance electrical measurements.
All high impedance current pathways had to be rigidly supported, well
separated, with all insulating surfaces being accessible for easy
cleaning. This was necessary to reduce any capacitive or leak current
paths to ground which could otherwise be significant considering the
small currents flowing through the membrane. The length of all high
im?edance current pathways was kept to a minimum to reduce the
extraneous electrical noise in the circuitry. The amplifier assembly
had to be compact to enable it to be located close to the membrane
apparatus. This reduced the length of the high impedance leads between
the merabrane and the amplifiers.
It was imperative that the design of this apparatus was such that
its electrical contact with the @embrane the electrolyte did not affect
the membrane properties. For example the maximura potential difference
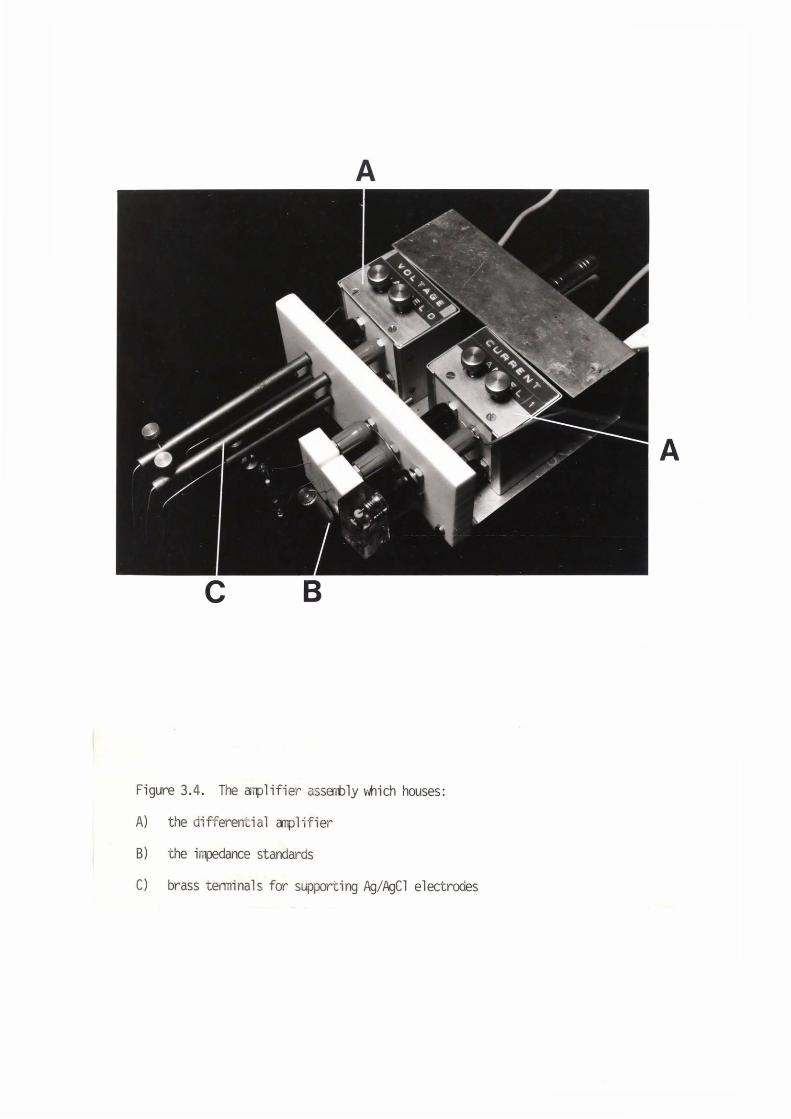
A
A
C B
Figure 3.4. The a,plifier asserbly which houses:
A) the different ial ~lifier
B) the ir,1pedance standards
C) brass temiinals for supporting Ag/AgCl electrodes
50
developed across the membrane had to be less than 30mV in order to
remain in the linear region of the membranes voltage current
characteristics. If the signal greatly exceeded this value, the
membrane potential difference could swing into the non-linear part of
its V-1 characteristics.
3.32 Amplifier Assembly; Mechanical Construction
The amplifier assembly provided an aluminium and Teflon framework
supporting two differential amplifiers (each enclosed in separately
earthed boxes), four brass rods {which held the Ag/AgCl electrodes), a
voltage divider and a network of resistors and capacitors which were
used as standard impedances in series with the membrane. Al 1 high
impedance current paths were supported on Teflon inserts (see figure
. 3.4).
A 5 V (peak-to-peak) sine wave signal, generated by BULFIS, passed
through a voltage divider (mounted at the back of the amplifier frame)
which attenuated the signal to 10 mV. The divider was designed to have
a frequency response that filtered out any high frequency extraneous
noise that may have been induced (by coupling to the rest of the digital
circuitry) in the current line from BULFIS. The current then passed
through the electrolyte and membrane via two rigi;d .. brass rods and
Ag/AgCl electrodes. The return path to ground included the network of
standard resistors and capacitors. The voltage developed. across this
network was used to calculate the current flowing through tte ~mbrane.
51
3.33 Amplifier Electronics
Determination of bilayer substructure from the dispersion of its
impedance with frequency requires high accuracy measurements of
impedances in the order of l0 9 -l0' 0 ohms (±.1% amplitude and ±.02° phase
angle). Therefore it was essential that both of the amplifiers had very
low distortion characteristics over the frequency
range .003 Hz to 10 KHz.
The amplifier circuitry consisted of three stages; an input buffer,
a differential high gain amplifier and an output line driver.
The purpose of the first stage was to reduce impedance of the
current path from 10' 3ohms to 2 K ohms. This was achieved by means of a
FET-input electrometer operational amplifier (unity gain, Analog Devices
AD 515) which was used as an input buffer for the differential
amplifier. Across the input of any FET-input amplifier a small bias
current is present. The electronic design must minimise this as it
could cause significant D.C. potentials to develop across a lipid
bilayer membrane because it normally has such a high impedance. D.C.
offsets of the membrane potential difference had to be avoided to ensure
that the A.C. measurements were made in the linear portion of the V-1
characteristics. The very high input impedance (l0 13 ohms) and ulta-low
input bias current (100 fA) of the AD 515 caused no significant
perturbation in the electrical potential across the membrane.
The second stage of the amplifier employed a precision
instrumentation amplifier (gain 300, Analog Devices AD 521) to amplify
the 10 r.iV differential inj)ut signal. Its high cor,1mon mode rejection
52
ratio and its nearly ideal output characteristics were well suited for
this high gain application.
The output stage used an operational amplifier unity gain,
National LN 355) to drive the low impedance co-axial cable between the
amplifiers and BULFIS.
The circuit diagram of the amplifiers and the important features
of the amplifier input and output characteristics are shown in figure
3.5 and table 3.1.
3.4 COMPUTER CONTROL
3.41 BULFIS Hardware
BULFIS is the Biophysics Ultra Low rrequency Impedance Spectrometer
which consists of an LSI 11 mini-computer, a programmable signal
generator and two transient recorder boards for rapid data acquisition.
The microprocessor initiated signal generation/sampling. Real time was
generated by a crystal controlled clock which provided 50 clocking rates
between 1MHz and .0426 Hz in steps increasing by a factor of 1.416.
Figure 3.6 shows a block diagram depicting the main aspects of the
BULFIS systera.
3.411 Programmable Signal Generator
A sine wave voltage signal was digitally synthesized as follows. A
sine wave table held in random access memory (RAM) was read into a
twelve bit digital-to-analog convertor (DAC). The frequency of the
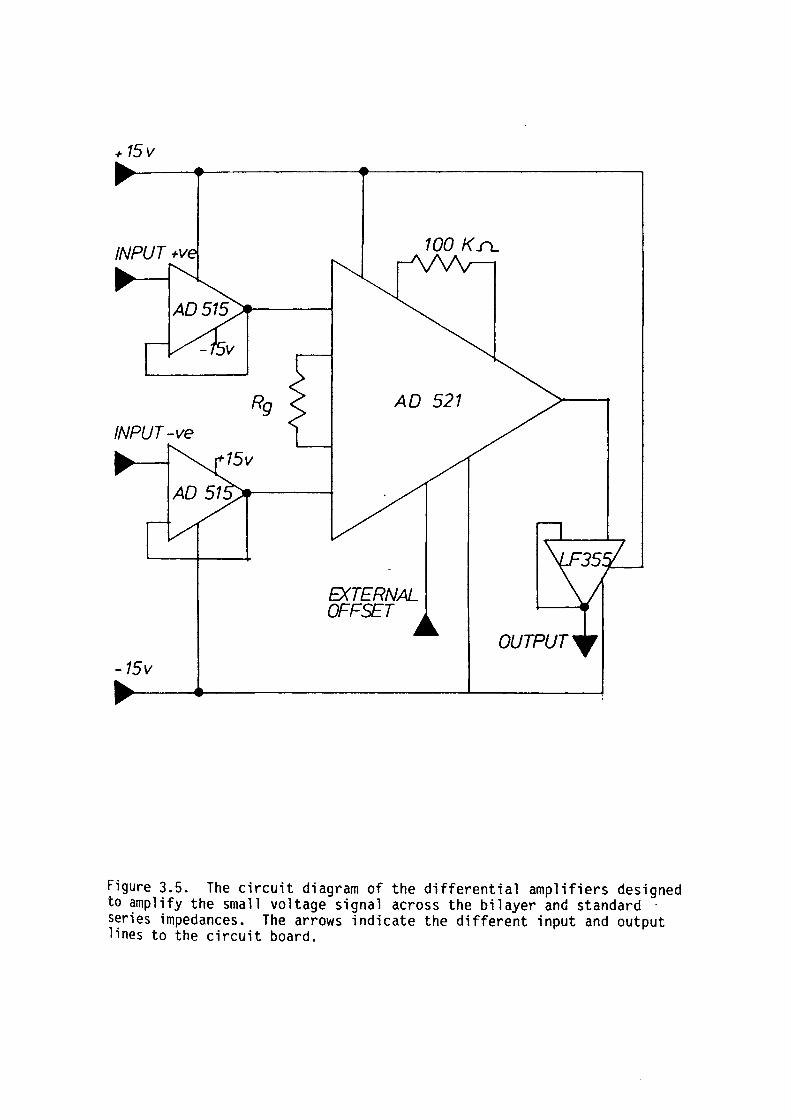
+ 15v
Rg
INPUT-ve
-15v
100 K.rL
AD 521
EXTERNAL OFFSET
Figure 3.5. The circuit diagram of the differential amplifiers designed to amplify the small voltage signal across the bilayer and standard · series impedances. The arrows indicate the different input and output lines to the circuit board.
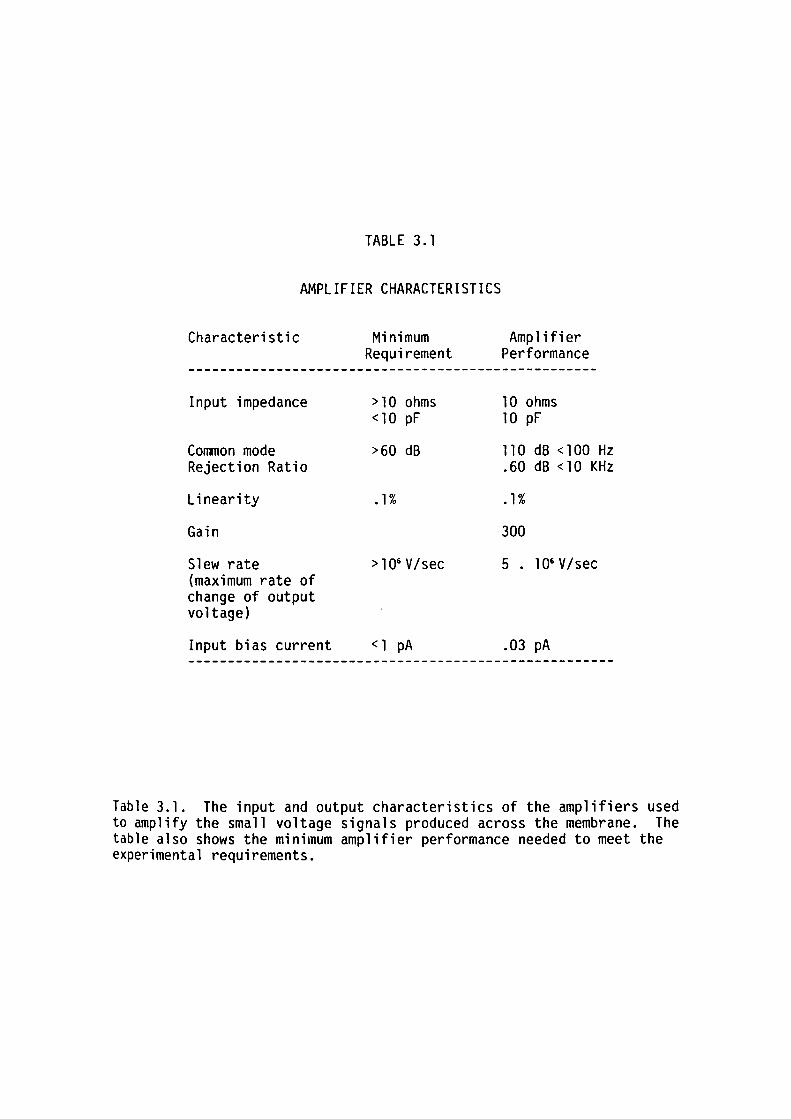
TABLE 3.1
AMPLIFIER CHARACTERISTICS
Characteristic
Input impedance
Common mode Rejection Ratio
Linearity
Gain
Slew rate (maximum rate of change of output voltage)
Input bias current
Minimum Requirement
> 10 ohms <10 pF
>60 dB
• 1 %
>106 V/sec
< 1 pA
Amplifier Performance
10 ohms 10 pF
110 dB < 100 Hz .60 dB < 10 KHz
• 1 %
300
5 . 106 V/sec
.03 pA
Table 3.1. The input and output characteristics of the amplifiers used to amplify the small voltage signals produced across the membrane. The table also shows the minimum amplifier performance needed to meet the experimental requirements.
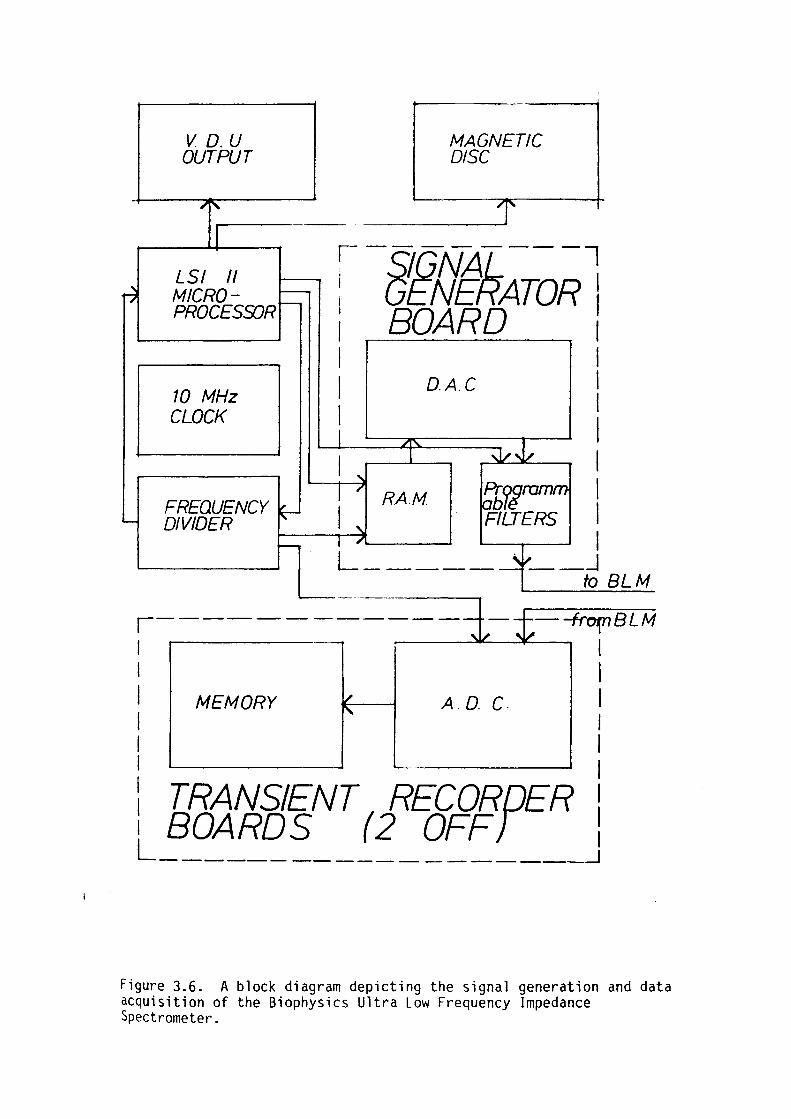
V D.U OUTPUT
LSI II MICROPROCES9JR
10 MHz CLOCK
FREQUENCY DIVIDER
MAGNETIC DISC
,--------7 - SIGNAL : GENERATOR I i BOARD 1
I I I 0.A.C I
I .______,,,..------,-----.& I I
~boqram I RA.M. ,~ I
FILTERS I L _____ . __ J
to BLM ---------
;~-=~----=~-----=~---~_._=-~iBLM I I I MEMORY A D. c. I I I I I I I : TRANSIENT( RECORDER I 1 BOARDS 2 OFF} 1 L________________ J
Figure 3.6. A block diagram depicting the signal generation and data acquisition of the Biophysics Ultra Low Frequency Impedance Spectrometer.
53
ensuing sinusoidal signal was determined by the clock ?Ulse rate from
the crystal controlled clock; the basic clock rate being divided by a
series of programmable dividers. The signal was then filtered by a
series of digital filters. The generator had an accuracy of twelve bits
and a linearity of ± .5 of the least significant bit (this was
approximately .012% ). The frequency was accurate to one part in 10 5 •
3.412 Data Acquisition Boards
Two separate phase locked analog-to-digital convertors (ADC)
sampled the amplified voltage signals returning from the membrane and
series impedance. The data was then stored in random access memory
(RAM), signal averaged (at all but the lowest frequencies used, multiple
cycles of the A.C. signal were sampled) on board to reduce any random
noise and then dumped into the computer memory.
3.42 BULFIS Software
A program was written in machine language for the LSI 11
microprocessor for precise impedance measurements. The program
initialized a data file for the impedance data and then called up a
separate data file (frequency file) which contained the information
required to program the signal generator and data acquisition boards.
The computer program gave the signal generator the correct signal ·,
amplitude, frequency, offset and filtering. The appropriate signal was
then generated. Signal sampling was triggered by the program. The
sampling rate and the number of signal periods to be averaged was passed
across to the transient recorder boards. When the data had been
acquired and stored in memory the program used a fast least squares
54
fitting routine to fit a theoretical sinusoidal wave to the voltage and
current data in memory and returned the amplitude ratio, the phase
difference and the normalized fit parameter (NFP) for the data sampled
at each channel.
The NrP was calculated by summing the square of the differences
between all the experimental and theoretical data points, and was
nor~alized by dividing by the sum of the squares of the experimental
data points. Ideally the NFP should be zero, and minimization of this
parameter was used as the criteria for accepting the subsequent
impedance calculations as valid. Consequently the sum of the NFP of
both channels was stored along with the amplitude ratio· and phase
difference between the two channels in the impedance data file. These
parameters were considered representative of the raw data.
The program displayed the corrected impedance data on a visual
display unit. The form of this output and the computer print out of the
data and frequency files are shown in Appendix A.
CHAPTER 4
MATERIALS AND METHODS
4. l INTRODUCTION
4.2 MATERIALS
4.21 Inorganic Solutions
4.22 Organic Chemicals
4.3 MAKING BILAYERS
4.31 BLM Formation
4.32 Membrane Stability; General Observations
4.4 CALIBRATION AND PERFORMANCE OF APPARATUS
4.41 Amplifier Matching and Corrections
4.42 Calibrating for Stray Capacitance
4.43 Calibrating of Impedance Standards
4.44 Overall Performance of the Apparatus
4.5 DATA ANALYSIS, REDUCTION AND PRESENTATION
4.51 Data Presentation
4.52 Data Reduction
4.53 Description of Theoretical Fitting Technique
4.54 Overall Performance of Fitting Technique
55
page
56
56
56
57
59
59
60
61
61
63
64
66
67
67
69
70
71
56
4.1 INTRODUCTION
The experimental work reported in this thesis had three main
facets:-
a) The formation of bimolecular lipid membranes
b) Measurements of the membrane impedance
c) Reduction of data, its analysis and hence extraction of
information concerning the membrane dielectric structure.
Various calibration and performance-testing measurements were
periodically carried out on the experimental apparatus. These tests
were vital in ensuring the validity of the impedance measurements and
section 4.4 has been devoted to a detailed description of some of these
procedures which are particularly relevant to the accurate determination
of membrane structure.
4.2 MATERIALS
4.21 Inorganic Solutions
All salts used in aqueous solutions were A.R. grade. Solutes were
weighed on a Mettler balance (H6T 160 g) with a precision of .lmg.
Water used for these solutions was three times distilled and was
deionized by passing through a ion exchange membrane. Electrolyte
57
solutions of concentrations less than lM were made up by the dilution of
aliquots taken from 1 M stock solutions using a microlitre pipette
(Pipettman P200).
4.22 Organic Chemicals
i) Egg-Lecithin
Lecithin is the generic name for 1-,2-diacylphosphatidylcholine; or
using the structural nomenclature, 3 sn-phosphatidylcholine. This is
one class of phospholipids. The general structural formula for
egg-lecithin is shown in figures 4.1 and 4.2. The relative composition
of egg-yolk lecithin is shown in table 4.1.
Lecithin, extracted from egg-yolk, was obtained from Sigma chemical
company. It was dissolved in chloroform (1 gram in 10 ml) and stored at
-4°C.
ii) Cholesterol
Cholesterol is a compound belonging to a group of crystalline
alcohols known as sterols and is the principal sterol in the tissue of
vertebrates.
Many of the bilayer membranes in this study were formed from
solutions containing oxidised cholesterol (ie. mixture of cholesterol
and its oxidation products). Various molecular models for cholesterol
and some of its main oxidation products are shown in figures 4.1 and
4.3. Oxidised cholesterol (95% pure cholesterol) was donated by
K.Thulborn, School of Biochemistry, University of Melbourne. It was
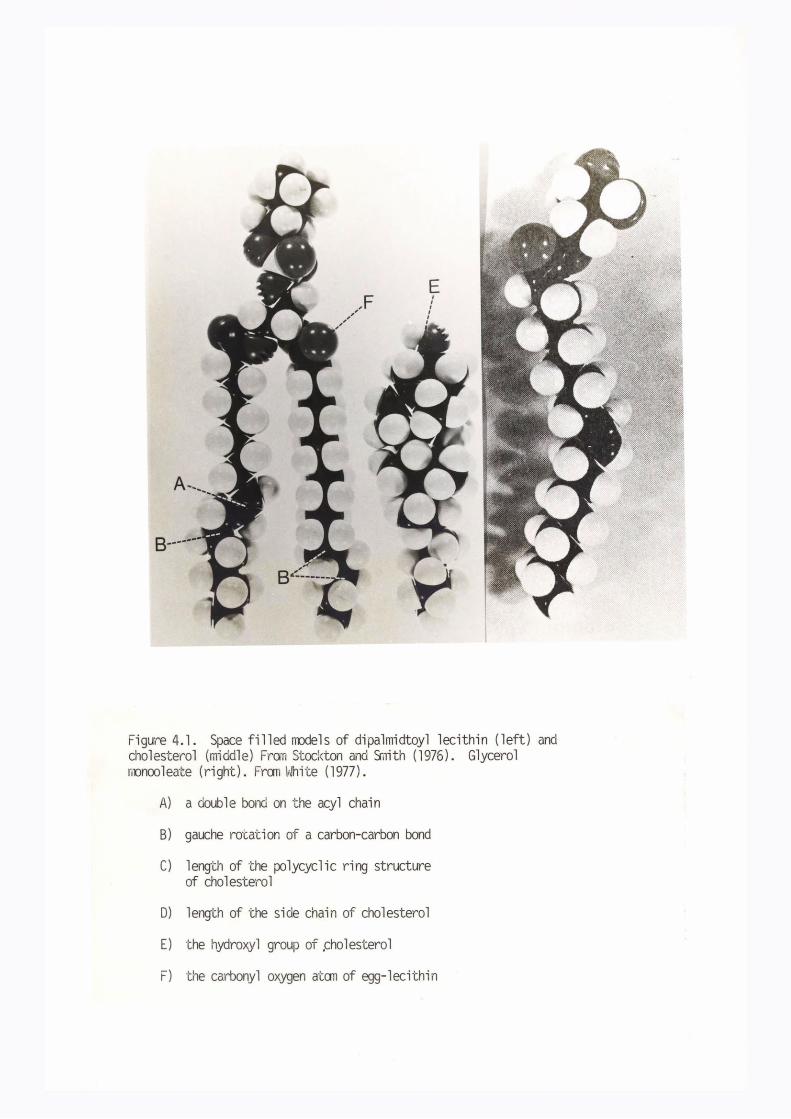
E
Figure 4.1. Space filled rrodels of dipalmidtoyl lecithin (left) and cholesterol (middle) FraTI Stockton and ~nith ( 1976). Glycerol rronooleate (right). Fran t~hite (1977).
A) a double bond on the acyl chain
B) gauche rotation of a carbon-carbon bond
C) lengt h of the polycyclic ring structure of cholesterol
D) length of the side chain of cholesterol
E) the hydroxyl group of .cholesterol
F) the carbonyl oxygen atan of egg-lecithin
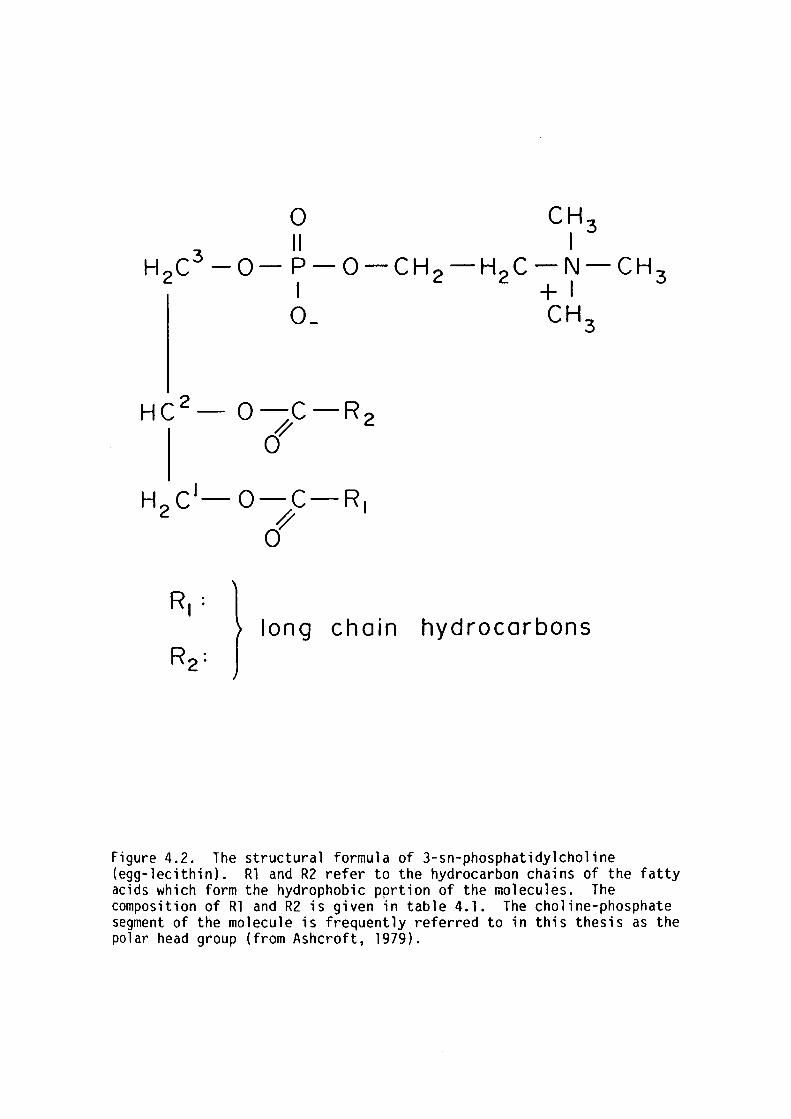
0 CH 3
3 II I -O-P-0-CH -H C-N-CH
I 2 2 + I 3
O_ CH 3
HC 2 - O-C-R 4 2 0
H c'-o-c-R 2 ~ I
0
long chain hydrocarbons
Figure 4.2. The structural formula of 3-sn-phosphatidylcholine (egg-lecithin). Rl and R2 refer to the hydrocarbon chains of the fatty acids which form the hydrophobic pprtion of the molecules. The composition of Rl and R2 is given in table 4.1. The choline-phosphate segment of the molecule is frequently referred to in this thesis as the polar head group (from Ashcroft, 1979).
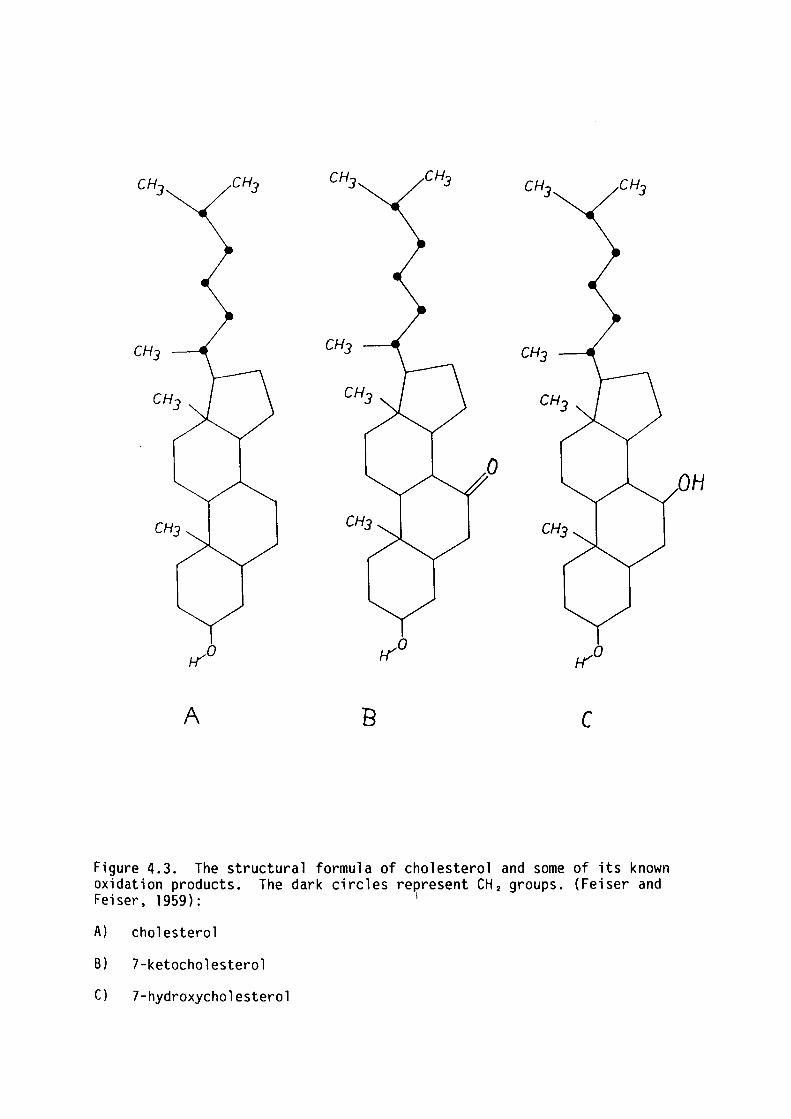
rro
A B C
Figure 4.3. The structural formula of cholesterol and some of its known oxidation products. The dark circles represent CH 2 groups. (Feiser and Feiser, 1959): 1
A) cholesterol
B) 7-ketocholesterol
C) 7-hydroxycholesterol
OH
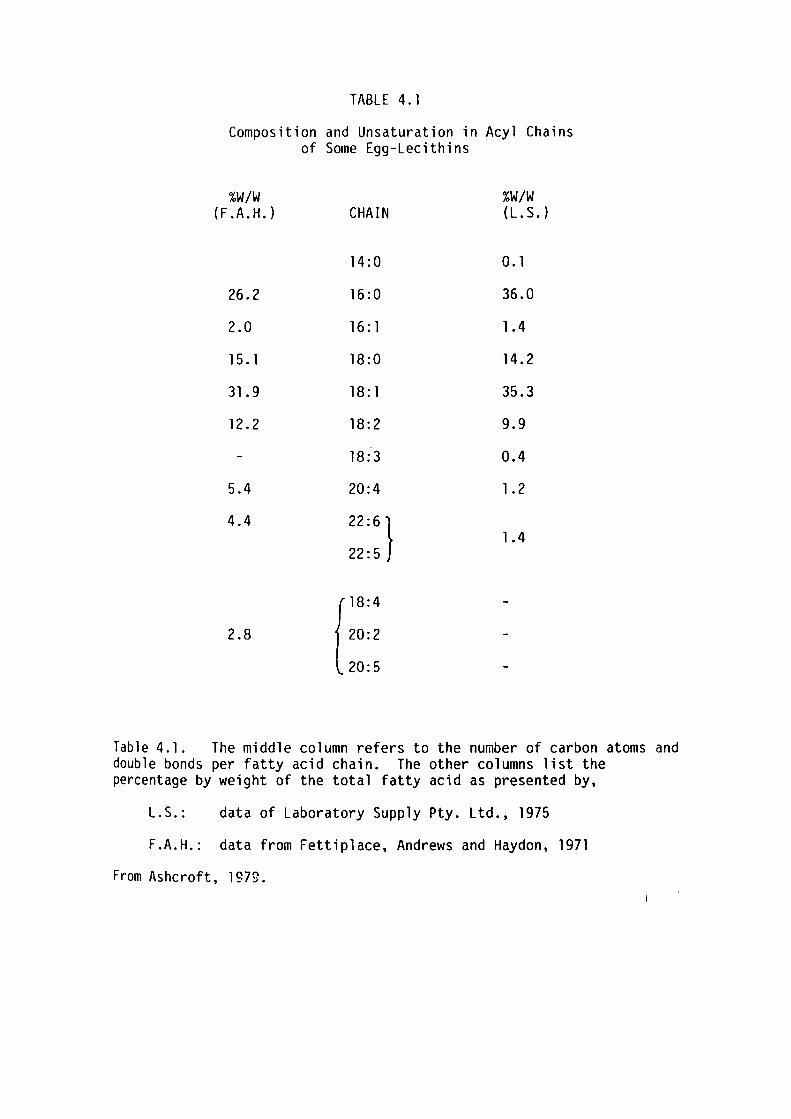
TABLE 4. l
Composition and Unsaturation in Acyl Chains of Some Egg-Lecithins
%W/W %W/W (F.A.H.) CHAIN (L.S.)
14:0 0. l
26.2 16:0 36.0
2.0 16: l 1.4
15. l 18:0 14.2
31.9 18: l 35.3
12.2 18:2 9.9
18:3 0.4
5.4 20:4 1.2
4.4 22: 6} 1.4
22:5
r8:4 2.8 20:2
20:5
Table 4.1. The middle column refers to the number of carbon atoms and double bonds per fatty acid chain. The other columns list the percentage by weight of the total fatty acid as presented by,
L.S.: data of Laboratory Supply Pty. Ltd., 1975
F.A.H.: data from Fettiplace, Andrews and Haydon, 1971
From Ashcroft, 1979.
58
stored in a solution of chloroform and methanol (.5g in 10 ml) at -4°C.
Cholesterol (99.9% pure)
Biochemistry, University of
steroid.
iii) Glycerol Monooleate
was a gift from Dr.
New South Wales,
K. Barrow, School of
who synthesized the
Glycerol monooleate (GMO) is a monoglyceride consisting of a
glycerol polar region condensed onto an oleic acid residue. Though
rarely found in living membranes it is commonly used in bilayer
studies. The structural for~ula and space filling model of GMO are
shown in figures 4.1 and 4.4. Glycerol monooleate (>99% pure) was
obtained from both the Sigma Chemical Company and Nu Chek.
iv) Other Reagents
The n-alkanes (>99% pure) were purchased from BDH laboratory
reagents and Sigma Chemical Company.
Benzyl alcohol was donated by the School of Chemistry, University
of New South ~ales.
The p-aminobenzoic acid ester type local anaesthetics were obtained
from Sigma Chemical Company.
The n-alcanols (A.R. grade) were obtained from Sigma Chemical
Company.
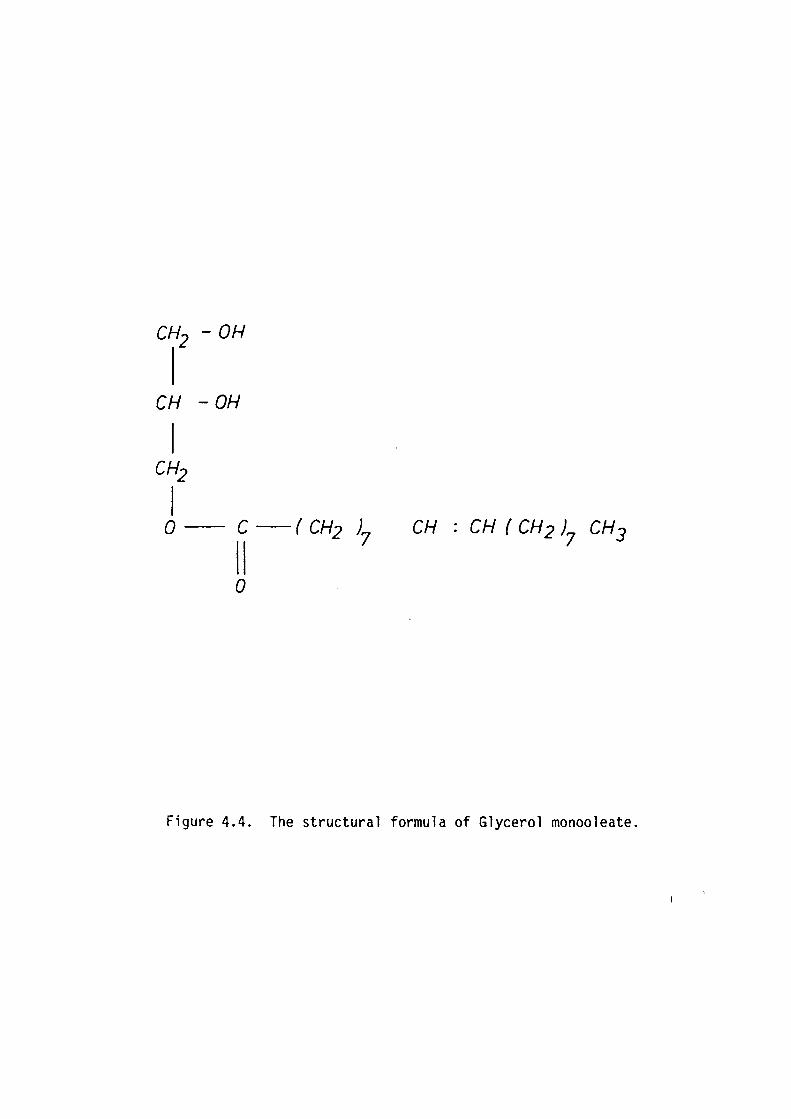
CH2 - OH
I CH -OH
CH
Figure 4.4. The structural formula of Glycerol monooleate.
59
v) Preparation of Lipid Solutions
Fifty microlitres of a solution of egg-lecithin and chloroform (ie.
0.5mg of lecithin) were pipetted into a glass vial. The solvent was
evaporated off in a vacuum oven at room temperature for 3 hours. The
solute was then dispersed in .5 ml of the designated n-alkane forming a
solution of 15 m~ lecithin.
4.3 MAKING BILAYERS
4.31 SLM Formation
Bilayers were formed using a modification of the film drainage
method of Mueller et al. (1962). A solution of lecithin in alkane was
extruded from a syringe over a hole in a polycarbonate septum. The
solvent then slowly drained out of the thinning membrane. Interference
of the light reflecting from both membrane-solution interfaces ~roduced
coloured fringes. The spontaneous formation of "black" membrane usually
occurred in 1-15 minutes. However, this could often be initiated
earlier by carefully touching the lipid film with the tip of the syringe
needle. The formation of stable black membranes was found to be
dependent on many factors such as temperature, membrane composition, the
external electrolyte and the author's need to leave the experiment to go
home (invariably this would enhance bilayer stability !). These effects
are discussed in more detail in latter sections. Figure 4.5 shows the
interference pattern of the reflected light from a typical lipid film
during the formation of a lipid bilayer.
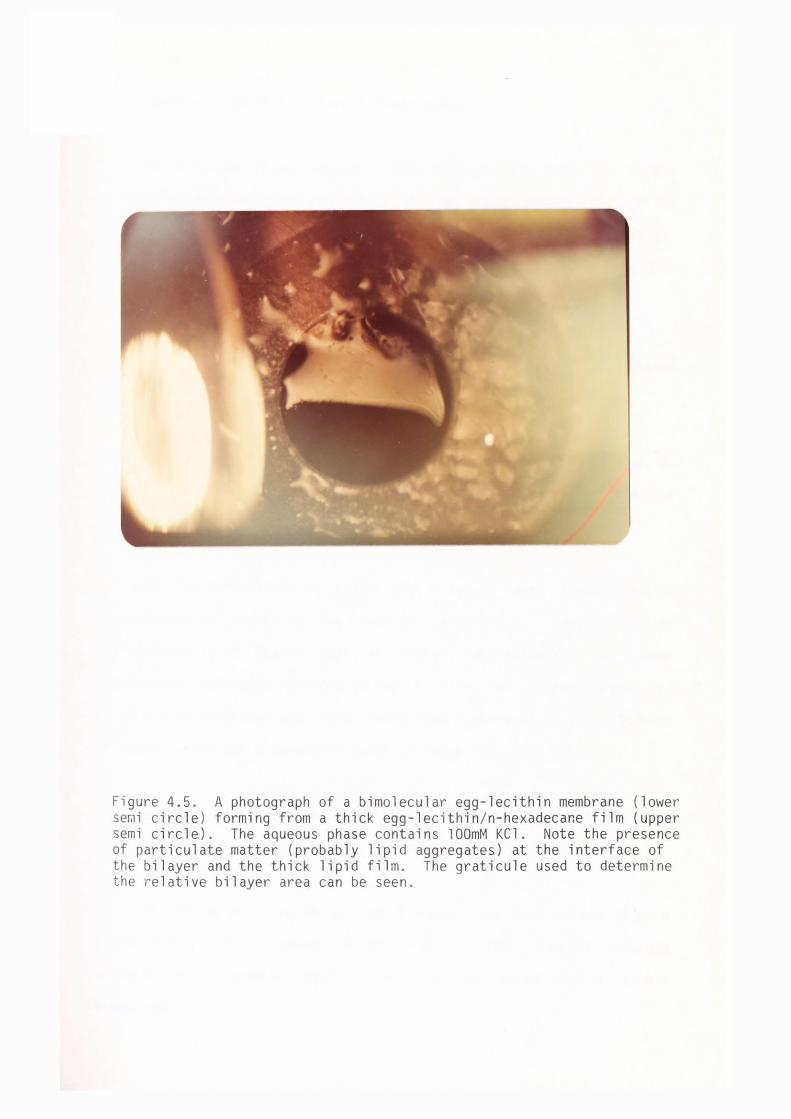
Fi gure 4.5. A photograph of a bimolecular egg-lecithin membrane (lower se~i circle) forming from a thick egg-lecithin / n-hexadecar.e film (upper semi circle). The aqueous phase contains lOOmM KCl. Note the presence of particulate matter (probably lipid aggregates) at the interface of the bilayer and the thick lipid film. The graticule used to determine the re lative bilayer area can be seen.
60
4.32 Membrane Stability; General Observations
The formation of bimolecular lipid membranes, that had stable
mechanical and electrical properties for long enough periods of time to
enable successful impedance measurements, was often an arduous task.
The factors found to be important in determining membrane stability were
the following:-
(a) Vibration and electric noise (in excess of 100-150 mV) caused
the rupture of bilayers.
(b) The optimum pH for membrane stability was between 6.5 and 8.
If the pH of the electrolyte was much outside this range the membranes
became less stable.
(c) The temperature at which the bilayers were formed was a
critical factor affecting the membrane stability. Stable bilayer
membranes could be formed best at higher temperatures. At lower
temperatures membranes ruptured during thinning or thinned unevenly,
resulting in membranes with large shunt conductances with an abundance
of "grey" areas and trapped 11 islands 11 of thick film.
(d) The presence of oxidised cholesterol in the membrane forming
solution was found to be a stablizing influence.
(e) The hole cut in the septum to support the membrane had to be a
planar circle with a s~ooth 11 knife edge 11 • This enabled accurate
estimates of the membrane area as well as the promotion of stable
membranes.
(f) The presence of surface active conta~inants (eg.
etc.) acted to reduce membrane stability.
61
detergents
(g) Bilayers formed from solutions with high li~id concentrations
were invariably more stable than those formed from weaker solutions.
4.4 CALIBRATION AND PERFORMANCE OF APPARATUS
It was important to carry out periodic checks on the experimental
apparatus to ensure that the impedance dispersions measured by BULFIS
were due to the membrane substructure and not an artifact of the
experi~1ental design. These checks entailed measuring differences in the
amplifiers' gain and phase response, measuring stray capacitance at the
amplifier inputs and calibrating the impedance standards in series with
the membrane.
4.41 Amplifier Matching and Corrections
All amplifiers have a limited frequency- and phase-response
especially at high frequencies. It was imperative that both amplifiers
be matched such that a common signal at the amplifier inputs produce an
amplitude ratio of one and a phase difference of zero at the outputs.
Any deviation from this ideal behavior was measured using the following
procedure:-
The amplifier inputs were connected in parallel across a common A.C.
voltage signal (see figure 4.6). Any phase, ~c, or amplitude, Ac,
difference between the two output signals could then have arisen solely
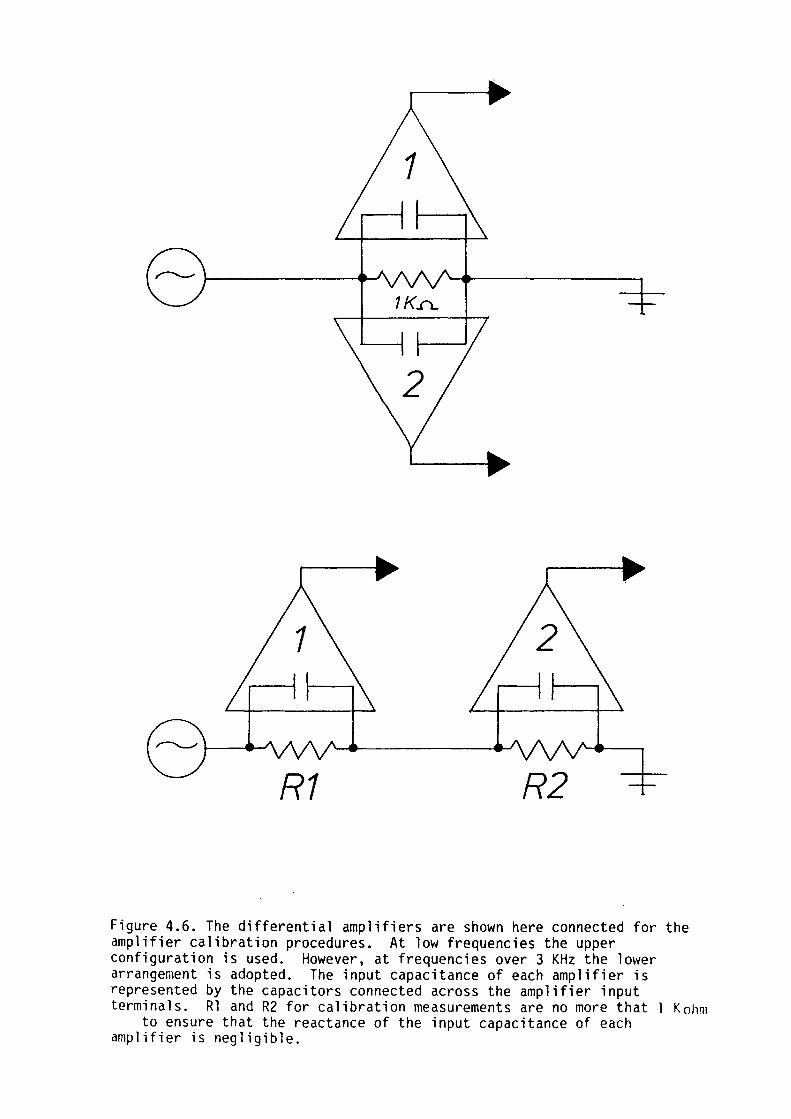
1 Krt..
R1 R2
Figure 4.6. The differential amplifiers are shown here connected for the amplifier calibration procedures. At low frequencies the upper configuration is used. However, at frequencies over 3 KHz the lower arrangement is adopted. The input capacitance of each amplifier is represented by the capacitors connected across the amplifier input terminals. Rl and R2 for calibration measurements are no more that Kohm
to ensure that the reactance of the input capacitance of each amplifier is negligible.
62
from small differences the phase and gain response in both amplifiers.
Measurements of the phase difference and amplitude ratio of the two
voltage signals were carried out over the experimental frequency range
using BULFIS operated in an impedance measuring mode. BULFIS then
calculated and filed the correction factors which were used whenever
measurements were done at each experimental frequency. The data at each
frequency were corrected using the following equations.
4.1
A'= R 4.2
Where •c and Ac are the correction factors for phase and amplitude,
•Rand AR respectively are the phase and amplitude parameters
representing the raw data and A~ and ·~ are the corrected raw data
parameters respectively.
The phase and gain response of each araplifier at high frequencies
( >3 Hz) was significantly affected by the presence of the other
amplifier connected in parallel with its input. The µrevious amplifier
configuration was clearly unsuitable for measuring differences in the
amplifiers' phase and gain response at these high frequencies. The
correction factors for phase and gain in the frequency range 3 - 10 KHz
were determined using the following procedure:-
The amplifiers were connected in series across two separate low
valued resistors (R=lK ohm) shown in figure 4.6. Low valued resistors
were used for this purpose because the stray input capacitance of the
amplifiers would not cause any significant phase difference at the
amplifier inputs. Phase angle corrections were then measured directly
63
from the signals at each amplifier output. Provided that the corrected
amplitude ratios at lou frequencies had been accurately measured and the
amplitude ratio of the voltage signals appearing across two series
resistors was independent of frequency indirect measurement of the gain
correction factors could be made at these high frequencies.
Trial-and-error estimates of the gain corrections were given to BULFIS
until a frequency-independent amplitude and phase response at high
frequencies was obtained.
4.42 Calibrating for Stray Capacitance
At the input of any amplifier exists a stray input capacitance
which arises from the electronic design of the amplifiers and the
dielectric properties of the material located between input terminals.
The reactance of this stray capacitance was included in the total
measured impedance of the membrane. It was important that its
contribution to the total impedance be known and appropriate corrections
made. Having matched the phase and gain responses of both amplifiers,
the following procedure was employed to calculate the stray capacitance
(Cl and C2) at the input of each amplifier from the phase difference
between the amplifier outputs.
The inputs of amplifiers l and 2 were each connected across one of
the two series resistors (Rl=lOK ohm and R2=50K ohm). Any phase
difference between the amplifier outputs must have been a consequence of I
the reactive impedance of the stray capacitance at the input of· each
amplifier. The corrected phase difference, •b, between the two output
signals was then measured at selected frequencies and recorded.
Resistor Rl was then replaced with Rl' (Rl '=SOK ohm) and the new phase
difference •o was measured. The parallel stray capacitance at the input
64
of each amplifier could then be derived by solving the following
simultaneous equations.
At a given angular frequency, w:-
$ 1 = w(ClRl - C2R2) D
$ 11 = w(ClRl 1 - C2R2) D
Subtracting equation 4.4 from 4.3 one obtains
$ I $11 Cl = D - D
w(Rl - Rl 1 )
4.43 Calibration of Irapedance Standards
4.3
4.4
Measurements of the phase difference and amplitude ratio of the
outputs of both amplifiers yielded incorrect values for the membrane
impedance only if the impedance standards in series with the membrane,
from which the current was calculated, was not accurately known.
Capacitance standards were ea l i brated ( at l KHz, 20° C) with accuracy
of one ?art in 10 5 on a General Radio capacitance measurement system
(Type 1621) incorporating a capacitance bridge (Type 1616) at the
C.S.I.R.0. Division of Applied Physics. The capacitors, used as
standards, were made from polystyrene and exhibited a
frequency-independent capacitance (within ±.01%).
Maintaining accurately known, high value resistance standards
(10-1000 M ohm) was difficult as their resistance was subject to drifts
65
with time (typically 1% over a few years) and therefore the resistors
had to be calibrated regularly.
When calibrating high resistances on a conventional resistance
raeasuring bridge high power supply voltages (100-500 V) were needed to
obtain adequate sensitivity. However, high valued resistors have a
voltage dependent resistance (varying typically by 10% over 100 V). In
these experiments the standard resistors were subject to very
voltages (approximately 10 mV). Therefore measurements on
resistance raeasuring bridge could only be ~ade at low voltages.
small
the
An alternative "self-calibrating" technique using BULFIS was
developed to measure the high valued resistors at very low voltages
(10 mV). The standard resistor to be calibrated was connected in
parallel with an accurately known standard capacitor. This parallel GC
network was then used as a standard by which the impedance of another
unknown parallel GC was measured. A series of impedance measurements
over the frequency range .01-10000 Hz was then coramenced using this
arrangewent which is shown in figure 4.7. A frequency dispersion in the
calculated value of the equivalent parallel capacitance and conductance
of the ''unknown" network would only occur if incorrect values of the
standard resistor were fed into the BULFIS software. Provided the time
constant of the standard and ''unknown" GC networks were sufficiently
different this method was very sensitive to small errors in estimates of
the standard resistor.
For exaraple, figure 4.7 shows the effect of trial-and-error
estimates of a nominal 10 9 ohm standard resistor. In this case the
correct value of the 10 9 ohra resistor was found to be 919±1 Mohm. In
this way the resistance of an unknown resistor was calibrated against
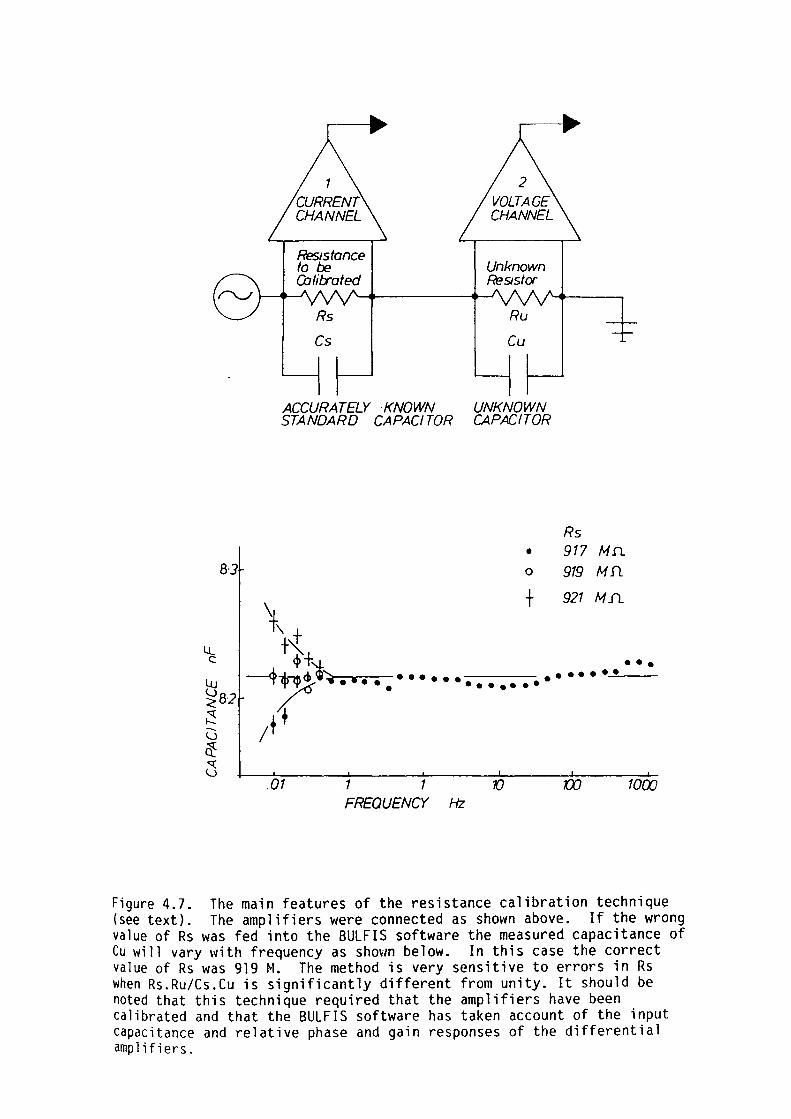
8-3
Unknown ReS1sfor
Ru
Cs Cu
ACCURATELY KNOWN UNKNOWN STANDARD CAPACITOR CAPACITOR
• 0
t
Rs 917 Mn. 919 Mfl
921 Mfl
\ t t'\. ~ +'-I- •••
--4-,1,,,11 ~ ~~ • I • • • • • • • • ---- • • • • • •·-=•'---? . . ..... . ;++
.01 .1 1 10 1000 FREQUENCY Hz
Figure 4.7. The main features of the resistance calibration technique (see text). The amplifiers were connected as shown above. If the wrong value of Rs was fed into the BULFIS software the measured capacitance of Cu will vary with frequency as shown below. In this case the correct value of Rs was 919 M. The method is very sensitive to errors in Rs when Rs.Ru/Cs.Cu is significantly different from unity. It should be noted that this technique required that the amplifiers have been calibrated and that the BULFIS software has taken account of the input capacitance and relative phase and gain responses of the differential amplifiers.
66
the reactance of an accurately known capacitor. Maintenance of standard
capacitors was not fraught with the same difficulties as that of
resistors. The values obtained by this method agreed (within the
experimental error of ±.1%) with those obtained using a 10 V power
supply on a resistance measuring bridge (Keithly 515A) at the C.S.I.R.O.
Division of Applied Physics.
4.44 Overall Performance of the Apparatus
The corrections for the different phase and gain responses over the
frequency range .001 - 10000 Hz were small. A computer print out of
these corrections at each frequency is shown in Appendix A. The stray
input capacitance of the amplifiers was found to less than 10 pF.
Though the effect of this on the impedance measurements was small (<. 1%)
the appropriate corrections were still made to the raw data. The
capacitance of the septum was less than 50 pF which is therefore also
negligible.
The signal distortion and random noise on the voltage signal
introduced by either the signal generator or differential amplifiers
could be measured using the sine wave least squares fitting routine in
BULFIS. The total noise/signal ratio and relative distortion was found
to be in the range .001-.1%. Any data collected from signals with
distortion or random noise greater than .1% of the signal amplitude were
rejected.
Measurements of impedance could be made over the frequency
.001 Hz to 10000 Hz with a maximum error of .03% in magnitude and
in phase angle.
range
.02°
67
4.5 DATA ANALYSIS, REDUCTION AND PRESENTATIO~
The analysis of the impedance data involved the following
procedures:-
a) The derivation of SLM impedance from the raw data recorded on
magnetic disc during the experiments.
b) Fitting the impedance data to a Maxwell-Wagner dispersion.
Software for this purpose was written in Focal and compiled with
machine language subroutines to run on a PDP ll/03 computer. This was
written jointly with Terry Chilcott at the University of New South
Wales.
4.51 Data Presentation
The frequency data file and the data file containing the raw data
at each experimental frequency was read into the computer memory from
magnetic disc. Once stored in the computer memory the raw data could be
plotted on a visual display unit as any one of the parameters defining
membrane impedance as a function of frequency.
?arameters are now considered.
a) Impedance ratio ZR and phase difference ~D
The nature of these
These are related directly to the corrected raw data. Z can be
calculated from the following:
Z - 1/A' R - R 4.6
68
ZR and •6 are essentially the corrected raw data parameters (albeit
with a few minor corrections) and thus had the advantage of being
closely related to the experimental raeasurements. However, ZR and •6 on
their mm had little physical significance as they are effectively a
comparison between the membranes electrical properties and that of an
arbitrary standard impedance. Thus direct comparison between
~easurements on different membranes using different standard impedances
would be difficult.
b) Total impedance Zand phase angle•·
These variables could be derived form the raw data using the
following equations:-
Z = Z /A' S R 4.7
\/here Z 5 and •s are the phase and magnitude of the standard
impedance respectively. These parameters were an absolute measure of
the electrical properties of the bilayer. Z(w) typically varied by five
orders of magnitude over the experimental frequency range. Most of this
variation was due to the frequency-dependent reactance of the membrane
capacitance with only a minor contribution from the membrane
substructure; that is, these parameters were insensitive to the presence
of dielectric substructure in lipid merabranes.
c) The inpedance expressed as the total equivalent parallel capacitance,
C and conductance, G. These were derived from the following equations:-
C(w)= sin t w z G(w) = cos t z 4.8
Data, when presented in the above form, had several advantages.
Firstly, any frequency dependence of C(w) and G(w) was due only to
59
inhomogeneity in the dielectric medium between the voltage measuring
electrodes. Thus if any dielectric substructure existed within the
bilayer or in the adjacent electrolyte it would have caused a dispersion
in these parameters.
Secondly, the physical significance of the membrane impedance could
be seen at a glance when expressed in these terms. For example the low
frequency capacitance (say 1 Hz) was simply related to the bilayer area
and thickness; and the relative size of the dispersion in capacitance
and conductance was indicative of the deviations from homogeneity in the
bilayer.
Small, time-dependent current shunts frequently occurred through or
around the membrane during the course of impedance measurements. These
introducea bogus frequency dispersions in the total measured
conductance. However, the frequency dispersion in membrane capacitance
remained undistorted by any time-dependent current''leaks~ Therefore to
obtain detail of the membrane substructure it was better to fit a
theoretical ~axwell-Wagner dispersion to the capacitance data than to
the raw impedance data. The theoretical fit to the conductance data was
merely a confirmation of the theoretical fit to the capacitance data.
4.52 Data Reduction
The following procedures were used to prepare the raw data for
theoretical fitting. The impedance data for each frequency scan,
usually expressed in terms of capacitance and conductance, were
displayed on a visual display unit. This was mainly done to chec~ that
the data were collected from bilayers that had stable electrical
properties during the course of data acquisition.
70
All the frequency scans where then normalised to a chosen frequency
scan to correct for small changes in the membrane area that might have
occurred between successive frequency scans. The average membrane
capacitance of each scan, over the experimental frequency range, was
used for calculating the normalization factors for the data. The
computer then automatically rejected those data points which did not
meet the S?ecified criteria (see section 3.42). The data were then
averaged and stored on magnetic disc. Averaged data were then ready for
fitting to a theoretical Maxwell-Wagner dispersion.
4.53 Description of Theoretical Fitting Technique
The theoretical fitting technique was capable of resolving six to
seven dielectrically distinct layers in the impedance data of
egg-lecithin bilayers over the experimental frequency range. The
fitting technique involved one of two alternative procedures.
a) A least squares fitting routine which fitted a Maxwell-Wagner
dispersion to any of the impedance related parameters ~entioned
previously.
b) A manual "trial and error'' method in which estimates of the
dielectric structural parameters were adjusted so that the theoretical
dispersion was best fitted to the data that were presented on the visual
display unit. This was used as a fine adjustment to the theoretical fit
after the least squares fitting routine had been used.
A good fit to the data was achieved when the x squared parameter
for the fit to the capacitance data was minimised. The number of
dielectrically distinct regions used to fit the data was ~rogressively
71
increased until no significant improvement in the fit could be obtained.~
In this way the highest possible resolution of bilayer structure was
obtained from the experimental data.
4.54 Overall Performance of fitting Technique
The data acquisition, reduction and theoretical fitting techniques
were tested for their accuracy and resolution for extracting structural
information of the bilayer. This was done in the following manner.
A series of impedance measurements were rnade over the frequency
range .01 - 10000 Hz on a hard-wire network of a number of parallel GC
elements in series. This simulated the type of substructural dielectric
properties of an egg-lecithin bilayer composed of six distinct layers.
The data were then averaged and fitted to a Maxwell-Uagner theoretical
dispersion in the same manner as was done with the bilayer impedance
data (see figure 4.8). The hard-wire network was dismantled and the
individual components measured on an impedance measuring bridge (\Jayne
Kerr Universal Bridge Type 8 224).
Table 4.1 the shows values of the individual resistors and
capacitors that gave the best theoretical fit to the measured impeaance
data obtained by BULFIS. The values of the individual co~ponents
r:ieasured on the impedance measuring bridge are also given. Figure 4.9
shows the frequency dispersion and Maxwell-Uagner theoretical fit to 1
hard-wire network simulating dielectrically distinct regions with
similar ti@e constants. The circuit elements were chosen so that the
Maxwell-Wagner dispersion of the whole network was similar to that
obtained from lipid bilayers.
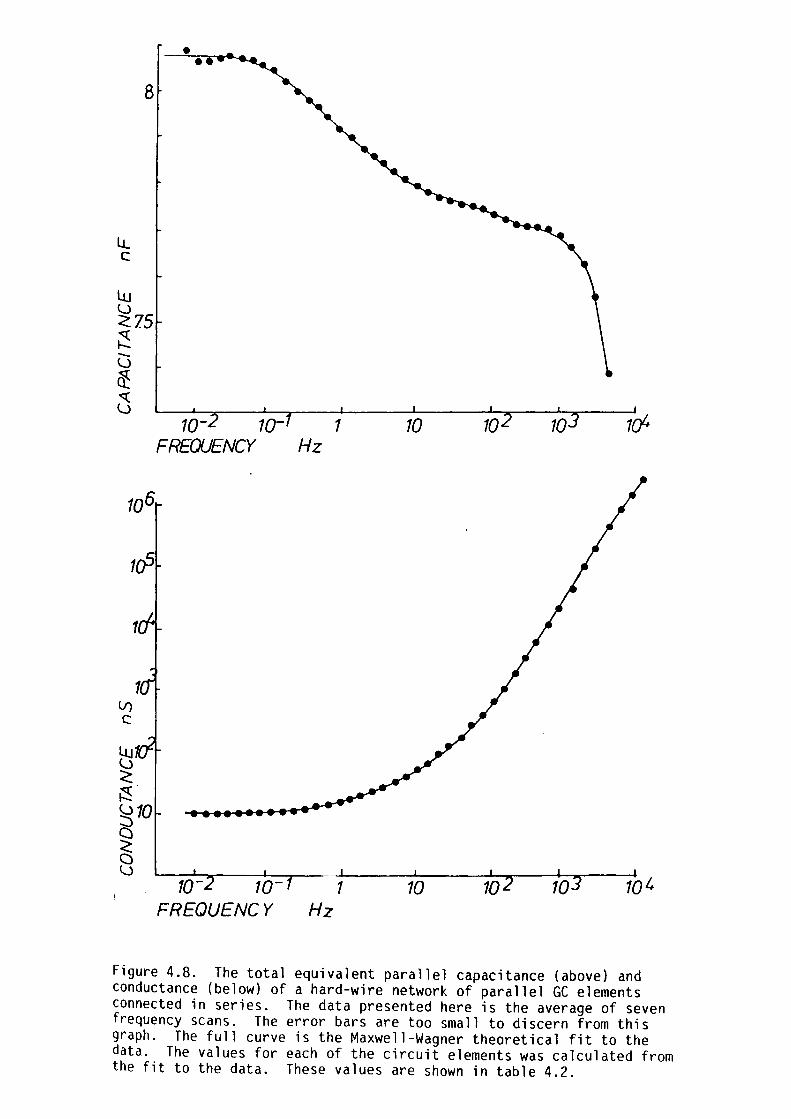
lL C
• •• 8
10- 10- 1 10 10 1~ FREQUENCY Hz
1a5
~-m~-~-~10~-~--~;--~10--~h~2~-;-0~1--104 FREQUENCY Hz
Figure 4.8. The total equivalent parallel capacitance (above) and conductance (below) of a hard-wire network of parallel GC elements connected in series. The data presented here is the average of seven frequency scans. The error bars are too small to discern from this graph. The full curve is the Maxwell-Wagner theoretical fit to the data. The values for each of the circuit elements was calculated from the fit to the data. These values are shown in table 4.2.
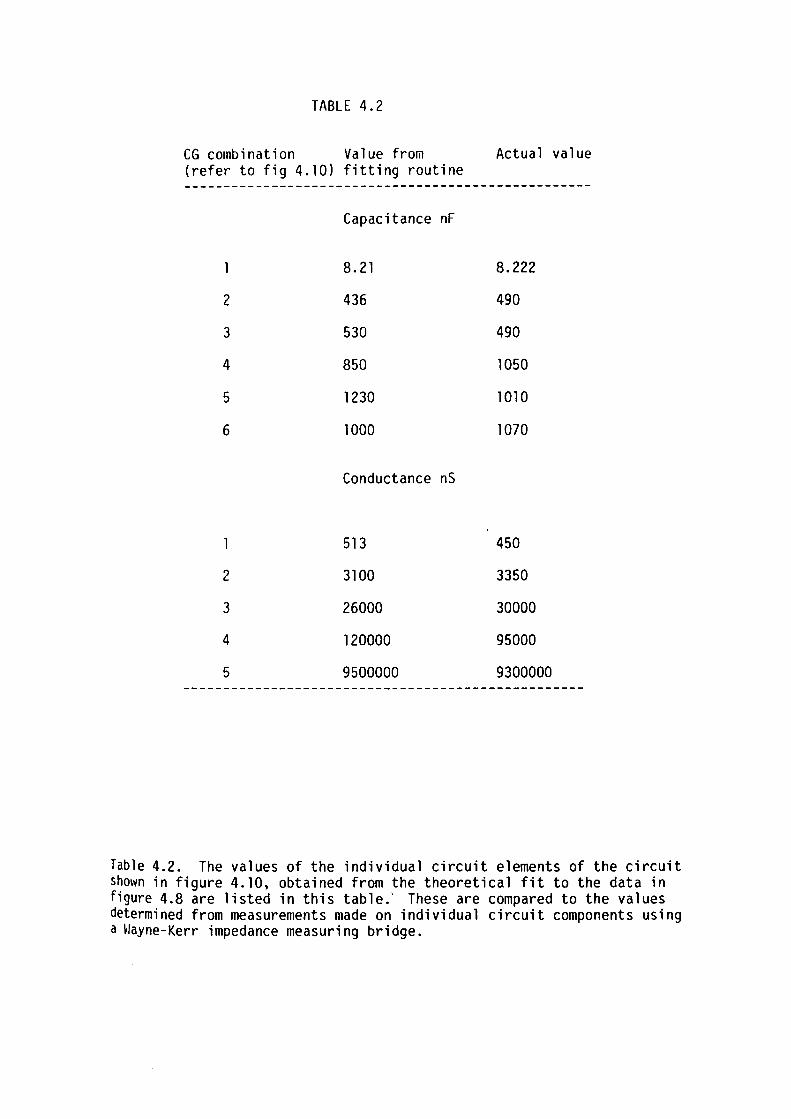
TABLE 4.2
CG combination Value from (refer to fig 4. 10) fitting routine
2
3
4
5
6
2
3
4
5
Capacitance
8.21
436
530
850
1230
1000
Conductance
513
3100
26000
120000
9500000
nF
nS
Actual value
8.222
490
490
1050
1010
1070
450
3350
30000
95000
9300000
Table 4.2. The values of the individual circuit elements of the circuit shown in figure 4. 10, obtained from the theoretical fit to the data in figure 4.8 are listed in this table.· These are compared to the values determined from measurements made on individual circuit components using a Wayne-Kerr impedance measuring bridge.
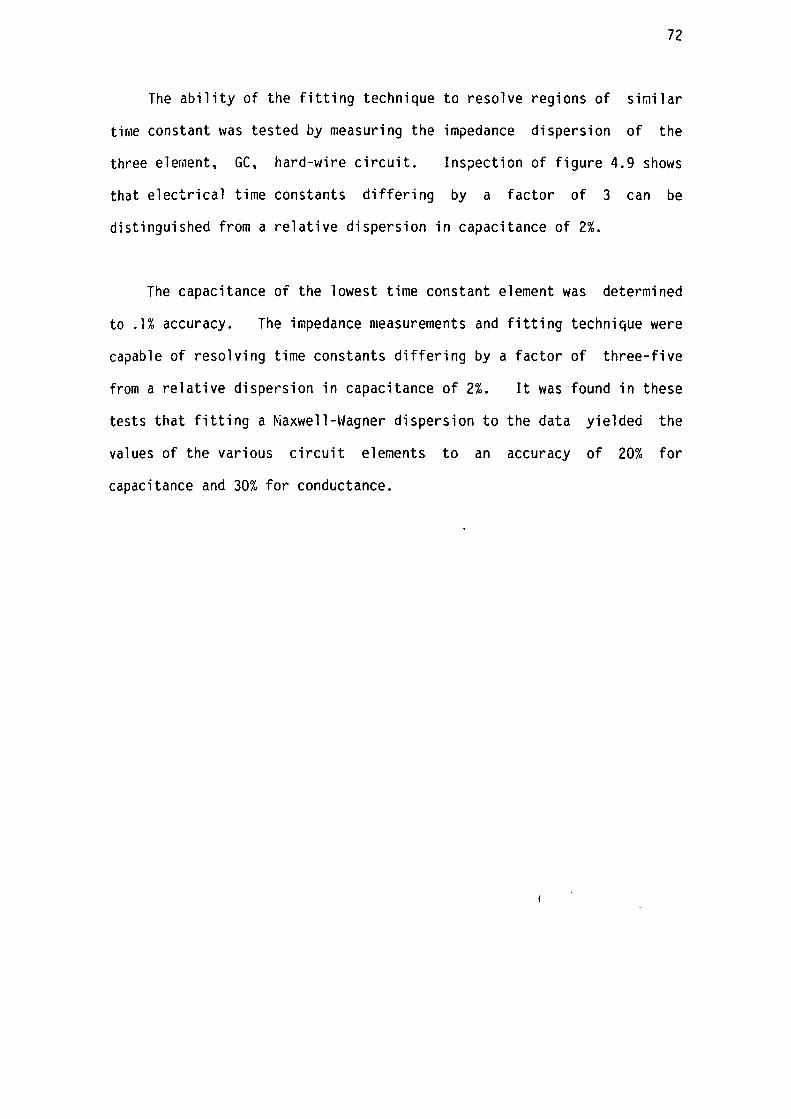
72
The ability of the fitting technique to resolve regions of si~ilar
ti@e constant was tested by measuring the impedance dispersion of the
three element, GC, hard-wire circuit. Ins?ection of figure 4.9 shows
that electrical time constants differing by a factor of 3 can be
distinguished from a relative dispersion in capacitance of 2%.
The capacitance of the lowest time constant element was determined
to .1% accuracy. The impedance measurements and fitting technique were
capable of resolving time constants differing by a factor of three-five
from a relative dispersion in capacitance of 2%. It was found in these
tests that fitting a ~axwell-Wagner dispersion to the data yielded the
values of the various circuit elements to an accuracy of 20% for
capacitance and 30% for conductance.
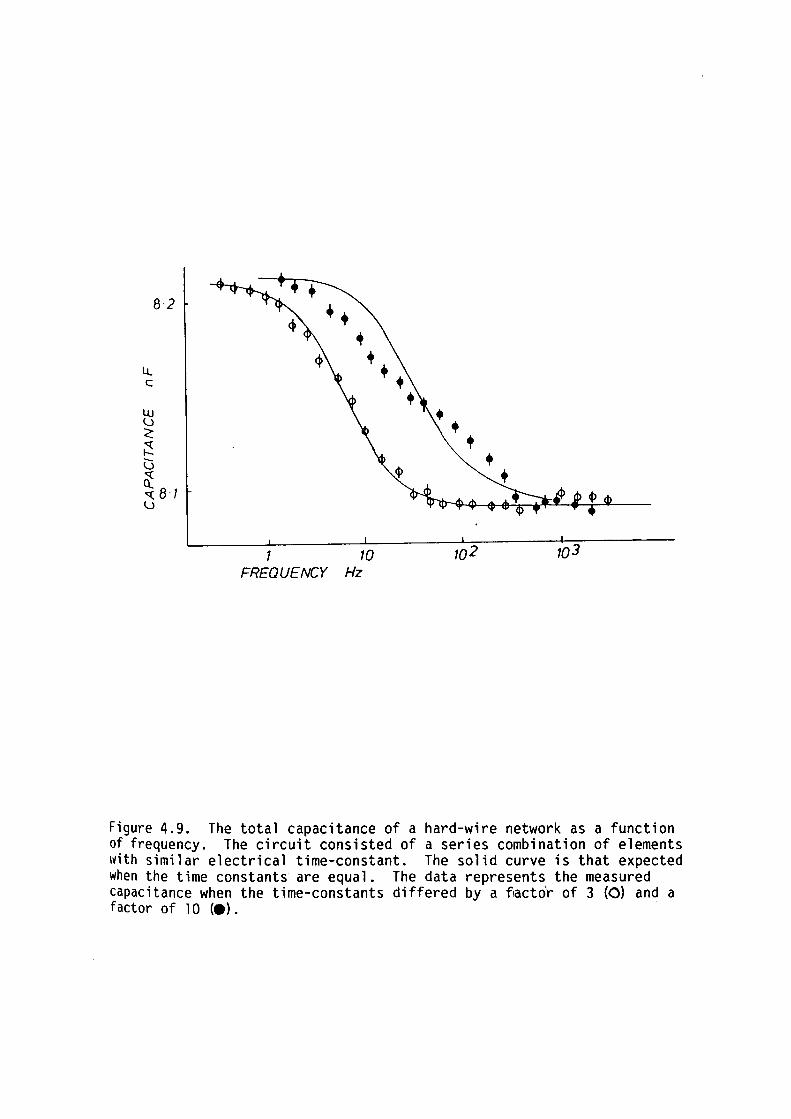
ll. C
8·2
1 10 103
FREQUENCY Hz
Figure 4.9. The total capacitance of a hard-wire network as a function of frequency. The circuit consisted of a series combination of elements with similar electrical time-constant. The solid curve is that expected when the time constants are equal. The data represents the measured capacitance when the time-constants differed by a f1acto'r of 3 (0) and a factor of 1 0 (e).
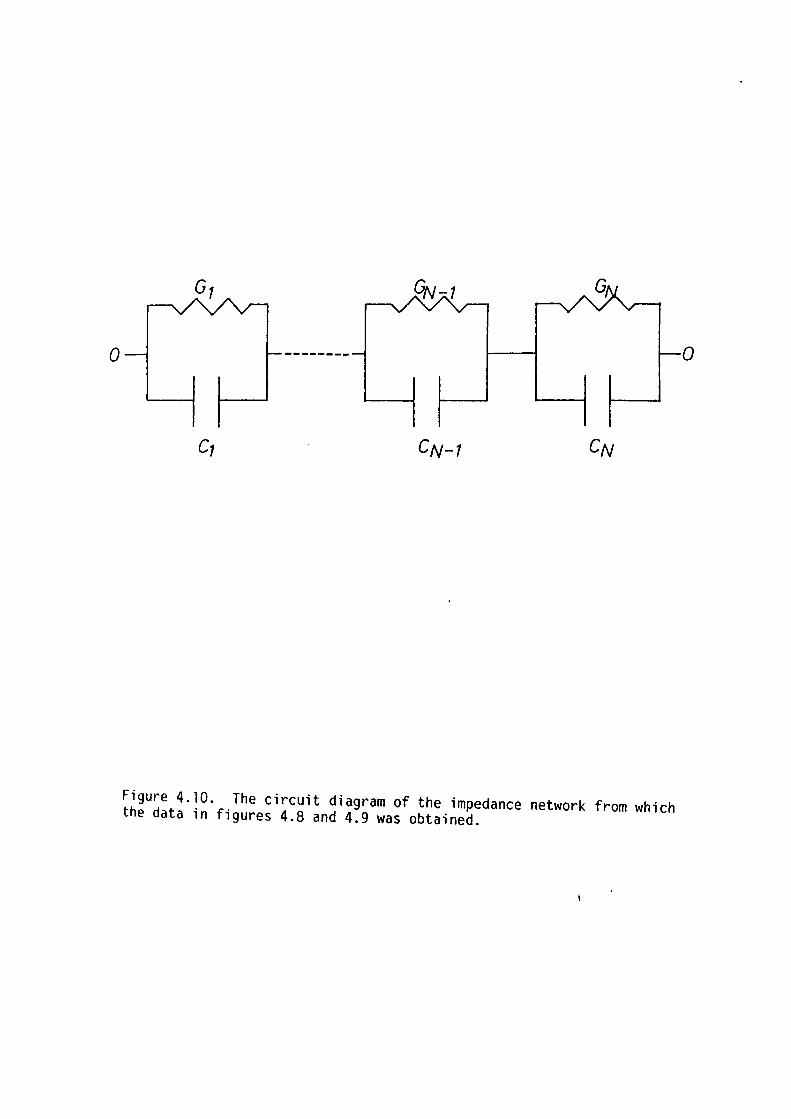
0
Figure 4. 10. The circuit diagram of the impedance network from which the data in figures 4.8 and 4.9 was obtained.
0
CHAPTER 5
LIPID - n-ALKANE INTERACTIONS IN ARTIFICIAL BLM
5.1 INTRODUCTION
5.2 THEORETICAL CONSIDERATIONS
5.21 Calculation of n-Alkane Concentration in Egg-Lecithin Bilayers
5.22 Thermodynamic Considerations
5.23 The Bilayer Interior: Order and Its Effect on the Partitioning of n-Alkanes
5.3 MATERIAL AND METHODS
5.4 RESULTS
5.41 SLM Capacitance: Temperature Dependence
page
75
79
79
82
83
85
86
87
5.42 BLM Capacitance: Dependence on 87 Torus Alkane Concentration
5.43 The Effect of Cholesterol and Benzyl Alcohol 88 on Bilayer Capacitance
73
5.5 DISCUSSION
page
89
5.51 Interpretation of the Low Temperature Capacitance 89
5.52 Effect of Microlenses 90
5.53 n-Alkane Absorption: Chainlength Dependence 91
5.54 Bilayers Formed From Binary Mixtures of n-Alkanes 93
5.541 Bilayers Formed From Solutions 93 Containing n-Decane
5.542 The Assumption of Ideal Mixing 94 Between the n-Alkane- and Acyl Chains
5.55 Acyl Chain Order and its Effect 96 on n-Alkane Partitioning
5.56 Absorption of n-Alkanes: Interpretation 98 of Teraperature Dependence
5.57 Coraparison With GMO Bilayers 99
5.6 SUMMARY 101
74
75
5.1 INTRODUCTION
Single, planar lipid bilayers, in principle, should accurately
model the bilayer component of living membranes. The method co11111only
used in research on planar bilayers is the one described in this thesis;
namely the lipids are dispersed in a hydrophobic solvent such as one of
the n-alkanes and a film of this solution is established across an
aperture in a septum dividing two aqueous solutions. The bilayer
spontaneously forms as the solvent is expelled from the film into the
surrounding annular region (torus) between the bilayer and the septum
(see Chapter 2).
The bilayers so formed contain varying amounts of alkane solvent
which is presumably in thermodynamic equilibrium with the bulk
lipid-alkane solution of the torus and the lipid in the aqueous
solution.
Naturally occurring membranes probably do not contain any alkane
hydrophobic molecules. Further, the incorporation of solvents such as
the alkanes into living membranes significantly alters membrane
function; acting indiscriminately as l~cal anaesthetics (Haydon, Hendry,
Levinson and Requena, 1977). The presence of varying concentrations of
n-alkanes has also been reported to modulate the conduction properties
of reconstituted membranes containing passive ion pores such as
gramicidin (Hendry, Urb1an and Haydon, 1978).
In the past, differences in the response of multilayer lipid
preparations and single planar bilayers to the addition of molecules
such as benzyl alcohol (BZA) and cholesterol have been attributed in
76
part to the presence of n-alkane solvents in the latter (eg. Ebihara et
al. 1979). Hence the validity of artificial µlanar bilayers, which
contain solvent, as models for the cell membrane, might be questionable.
Therefore the interaction between hydrophobic solvents, such as the
n-alkanes, and lipid bilayers is important to our understanding of this
membrane model.
A systematic study of n-alkane absorption in egg-lecithin bilayers
and its dependence on variations in temperature and alkane chainlength
has been made. In previous studies it was assumed that ideal mixing of
the alkane chains and lipid acyl chains occurs (Haydon et al., 1977 and
Uhite, 1977). To test this assumption the µartition coefficient of the
n-alkanes between the bilayer and torus was measured for different
alkane concentrations in the torus. These measurements were made on
bilayer membranes containing mixtures of more than one alkane as this
effectively extended the µossible range of alkane concentrations in the
membrane torus.
The absorption of alkanes into the interior of artificial planar
bilayers is knmm to increase their thickness (Benz, Froh l i eh, Lauger
and Montal, 1975, ~Jhite, 1977 and Fettiplace, Andrews and Haydon, 1971),
alter their surface tension (White, 1975) and water permeability
(Fettiplace, 1978). By assuming the alkane concentration in the bilayer
is linearly related to the membrane thickness the alkane concentration
in the bilayer could be determined ( Fettiplace et al., 1971 and Uhite,
1377) (See also section 5.2). Studies of alkane absorption in bilayers
formed from monoglycerides such as glycerol monooleate (GMO) have shown
that the concentration of alkane solvent present depends on the
chainlength of both the ~onoglyceride and the alkane components of the
bilayer (Benz et al., 1975 and White, 1977). Uhite (1978) found that
77
bilayers could be formed with negligibly small (equilibrium) solvent
concentrations by the use of hydrophobic solvents that have such large
molecular diraensions (eg. squalene) that they are effectively too big to
fit into the bilayer structure (ie. they are similar in length to the
hydrocarbon chains of the monoglyceride). Independent Raman
spectroscopy studies of Simon, Lis, MacDonald and Kauffman (1977)
support White•s (1978) conclusion. Further it has been found that the
relative solubility of alkane in the bilayer is dependent on temperature
(Uhite, 1977). Decreasing the temperature causes the solvent in the
bilayer to collect into (perhaps frozen) microlenses, whereupon it is
removed from the bilayer proper. This effect has been exploited by
White (1974) as a method for producing essentially solventless GMO
bilayers.
Glycerol Monooleate is a neutral monoglyceride rarely found in
biological membranes. Much of the surface tension and alkane solubility
experiments have been made on artificial bilayers formed frori1 GMO-alkane
solutions. This is mainly because GMO is better defined chemically and
for~s bilayers more easily at physiological salt concentrations than do
natural lipid mixtures. Egg-lecithin bilayers have been studied in
these experiments because they more closely model biological membranes
than bilayers formed from GMO.
In order to account for the behaviour of lipids in bilayers a
statistical mechanical model of the acyl chain conformation of
dipalra.itoyl i)hosphatidylcholine in bilayer aggregates in the liquid
crystalline state was developed by Marcelja (1974). The partition
function was calculated for a single acyl chain located in a molecular
field which modelled the average behaviour of the neighbouring acyl
chains. Gruen (198Oa) refined the raean field model of Marcelja by
78
including explicit terms in the partition function which accounted the
polar group interactions and the energy at the oil-water interface.
Gruen (1980b,1980c) then extended this model to treat the partitioning
of alkanes between a saturated aqueous phase and the bilayer interior.
The results of the model are in good quantitative agreement with
experimental results.
BZA and cholesterol are known to alter the order parameter* of the
acyl chains in the bilayer (Turner and Oldfield (1979) for BZA and
Stockton and Smith (1976) for cholesterol). It was also suggested that
these r.1olecules may induce changes in the partitioning of n-alkanes into
the bilayer interior (Haydon et al. (1977) for Cholesterol and Ebihara
et al. (1979) for BZA). The effect of oxidised cholesterol and BZA on
the absorption of alkanes in the bilayers has been measured as part of
the present study. The results presented in the chapter will be
interpreted on the basis of Gruen's model of the bilayer interior.
The partitioning of n-alkanes (chainlength 10 to 16 carbon atoms)
between the bilayer and torus has been investigated in this study in
order to identify the factors which modulate the solubility of alkanes
in lipid bilayers.
* The molecular order parameter ni at the ith carbon atom of the acyl
chain is defined by the expression:
~- = <-3 cos 2 0 + l> 1
Uhere II e II is the angle spanned by the C-H bonds and the axis
~erpendicular to the plane of the bilayer. The parenthesis indicate
the thermodynamic average. The order parameter is a measure of the
internal entropy of the acyl chains.
79
In this way changes in the physical properties of lipid bilayers
due to changes in alkane absorption may be discerned from those due
other environmental changes which are of greater relevance to living
membranes.
5.2 THEORETICAL CONSIDERATIONS
5.21 Calculation of n-Alkane Concentration in Egg-Lecithin Bilayers
It has been shown that bilayer membranes containing alkane solvents
are thicker than those that are solvent free. Provided the difference
in thickness, ~o, between the solvent free and solvent containing
bilayer arises entirely from the partial molar volume of the alkane in
the bilayer (ie. provided the area density of the lipids is unchanged),
one can calculate the molar concentration of alkane per unit area in the
bilayer, ca, using the following expression:
5. l
l-Jhere "p" and "M" are the mass density and raolecular weight of the
solvent. The volume-averaged mole fraction of alkane with respect to
the acyl chains, Xa, is given by:
5.2
Where c 1 is the number of moles of acyl chains per unit of membrane
area.
80
Previous studies (eg. see Fettiplace, Andrews and Haydon, 1971,
White, 1974 and Fettiplace et al., 1975) have used measurements of
membrane capacitance to measure II C II
a and hence estimate the molar
concentration per unit area in the bilayer,
calculated using the following expression.
l t;
In this study IIC II
a was
5.3
Where "C "' and "C II are the capacitances of the al kane-1 i pi d bilayer m m and the same bilayer in its alkane free state respectively. 11 £ 11 and
0
"c" are the permittivity of free space and relative dielectric constant m
of the hydrophobic region which is about 2.1-2.l (Huang and Levitt,
1977). Equation 5.3 is valid provided that:
(a) The molecular volume of the alkane solvent contributes to the
volume of the hydrophobic region without contributing to the membrane
surface area as an increase in the membrane area per molecule is
energetically unfavorable. Thus the bilayer interfacial area occupied
by each lipid is considered independent of both temperature* and alkane
concentration (see Fettiplace et al., 1975).
(b) The dielectric constant of the alkanes used in these experiments
was in the range 2.02-2.06, which was considered to be approximately
equal (within error of ±2%) to that of the lipid acyl chains. The
temperature dependence of the dielectric constant is negligible; varying
less than ±2% in the temperature range of the experiments (Chemical
Rubber Company Handbook of Chemistry and Physics, 1976).
* Increasing the temperature, if anything, should on entropic grounds,
cause a (small) increase in area occupied per lipid molecule.
81
(cl The alkane volume density is temperature independent in the
temperature range of these experiments,
\~hite, 1975).
to within 3% (eg. see
(d) the error introduced by neglecting the effect of microlenses on the
measured area of these bilayers is sma 11 nJhite and Thompson, 1973 and
also see Discussion).
The thickness of the solvent free bilayer is largely determined by
the ratio of the partial molar volume of the acyl chains of the
molecules to the area of the lipid molecule in the ~lane of the bilayer
(Israelachvili, Mitchell and Ninham, 1976). The former quantity can be
considered constant.
Implicit in the calculation of the alkane mole fraction is the
assumption that the alkane is uniformly distributed throughout the
bilayer interior. However, considerable evidence has been accumulated
which shows that this is may not be the case, and that the alkane
preferentially occupies the region near the midplane of the bilayer; the
area near the bilayer-water interface being effectively inaccessible to
alkanes (eg. see Simon, Stone and Busto-Latorre, 1977, Simon, Stone and
Bennett, 1979, and White, King and Cain, 1981). Our estimates of the
alkane mole fraction do not take into account this heterogeneity and
therefore represent a weighted average of the position dependent alkane
distribution throughout the bilayer interior. Thus the present I
estimates of the alkane mole fraction in the bilayer are only
qualitative.
Previous measurements (Ashcroft et al., 1981 ) shm, that the
capacitance of egg-lecithin bilayers at frequencies of l Hz includes the
82
geometric capacitance of the central hydrophobic layer as well as the
series capacitance of the carboxyl-ester-oxygens on either side of the
membrane. Further, it is known that the capacitance of the Gouy-Chapman
ionic double layers on either side of the· membrane also contributes to
the measured capacitance at l Hz, although this should be significant
only at low ion concentrations in the aqueous phase (LaUger et al., 1967
and Ashcroft et al., 1981). Discussion of the effects of ionic double
layers on the measured bilayer capacitance is not presented here. For
further details the reader is referred to Chapter 6. However, on
inspection of equation 5.3 one can see that any errors introduced by
ignoring the effects of bilayer substructure or ion double layers cancel
exactly when calculating the alkane concentration within the bilayer.
5.22 Thermodynamic Considerations
Provided ideal mixing occurs between the lipid acyl chains and the
alkane one can apply the following thermodynamic analysis to treat the
absorption of n-alkanes in the bilayer interior. (The validity of this
assumption will be discussed latter.)
At thermodynamic equilibrium the difference in chemical potential
of alkane molecules between the torus and bilayer phases must be zero.
From this condition one can relate the standard chemical potential
difference, 6µ 0 , and the partition coefficient of n-alkanes, K, between
the two phases:
6µ 0 = -RT ln K 5.4
Where "T" is the absolute teraperature and "R" is the molar gas
constant. The standard chemical potential difference can be expressed
83
in terms of a difference in the internal entropy, 11 5°, and enthalpy, 11 H~
of the n-alkane. Thus:
5.5
The temperature dependence of 11 11µ 0 " is then given by:
5.6
Provided that 11 115° 11 and "11H 0 " are temperature independent, equation
5.5 and 5.6 reduce to the following well known expressions:
5.7
5.8
5.23 The Bilayer Interior; Order and Its Effect on the Partitioning of
Alkanes
The acyl chains in a lipid bilayer above its phase transition are
in a semi-ordered state. The lowest energy conformation of the lipid
acyl chains is a coil with random orientation like that of the alkanes
in bulk liquid. Order is imparted to the acyl chains by their
attachment at one end to polar head groups which are aligned at the
bilayer-water interface. It can be argued on theoretical grounds that
the acyl chains are straightened to minimize the free energy at the
hydrocarbon-water interface (see section 1.35). Deuterated NMR studies
of Seelig and Seelig (1974) and Stockton and Smith (1976) show that the
order parameter for the acyl chains is nearly constant (at .45) up to
84
the tenth carbon atom of the egg-lecithin molecule but decreases after
this towards the bilayer midplane. This indicates that the acyl chains
of the lipids are well ordered in the the outer .8 nm of the hydrophobic
region, behaving somewhat like a wax, while the central region of the
bilayer is much more disordered, more like an alkane liquid.
The alkanes are chemically similar to the acyl chains. However,
the alkanes have no polar groups and therefore are not anchored to the
bilayer interface and are free to reside wholly within the bilayer.
Gruen (198Gb), when modelling the absorption of alkanes in lipid
bilayers, considered the energy cost of creating free space for the
alkanes and the free energy of mixing of acyl and alkane chains in the
plane of the bilayer.
Gruen's (1980a) modelling of this system predicted two important
factors which affect the alkane absorption and which are both closely
related to the order parameter of the acyl chains (Gruen, 1980b and
1980c). Firstly, in regions of high acyl chain order the alkane chains
are partially constrained to lie parallel to the acyl chains. Thus the
internal entropy of the alkane molecules is much lower in these regions
than in regions of low acyl chain order. Secondly, creating space for
alkane requires a straightening of the acyl chains and hence a reduction
in the area per acyl chain (as the area per lipid is constant). In
regions of high order a change in the area per acyl chain involves a
greater increase in free energy of the lipid molecules than in regions 1
of lower order. Therefore regions of higher order in the bilayer are
relatively hostile to the presence of alkanes.
In the light of this model, it should be expected that membrane
85
additives which alter the order of the acyl chains of the lipids should
also alter the concentrations of n-alkanes in the bilayer.
5.3 ~-IATERIALS AND METHODS
Black lipid membranes were generated from solutions of egg-lecithin
and oxidised cholesterol dissolved in n-alkanes ( 15 mM with respect to
lecithin) with chainlengths between that of ten carbon atoms (n-decane)
and sixteen carbon atoms (n-hexadecane). Membranes were generated at 0
temµeratures between 25-45 C (depending on the alkane solvent) with a
lml-1 KCl in the aqueous phase. Bilayer formation occurred spontaneously.
Hm'lever, quite often it was initiated pre;naturely by touching the thick
lipid film with the tip of a syringe.
In order to modulate the mole fraction of a particular n-alkane in
egg-lecithin bilayers (at constant temperature) it was necessary to form
bilayers from lipid solutions over a wide range of lipid concentrations.
However, using a single alkane solvent it is only possible to generate
stable membranes from lipid solutions over a narrow range of
solvent-liµid concentrations. Formation of bilayers from solutions
containing low solvent concentrations could not be achieved because of
the limited solubility of lipids in the solvent. This problem was
overcome by dissolving the lipids in a long chainlength alkane (eg.
hexadecane) which, at tem~eratures less than 35°C, is essentially
excluded from the bilayer phase. The effect of low concentratio~s of
shorter chainlength alkanes could be studied by adding small amounts to
the lipid-hexadecane mixture.
86
In these studies the bilayer and torus were assumed to be in
equilibrium when the capacitance of the membrane had attained a steady
value (varying less than 1% in 15 minutes). All measurements reported
here were on bilayers which had been allowed to come to thermodynamic
equilibrium with the torus and were bimolecular (ie. 'black') over the
entire aperture in the septum. The area, excluding the torus, was
determined (to an accuracy of ±2%) using a graticuled eyepiece mounted
on a 40x microscope.
Care was taken to ensure that the bilayer remained flat during
measurements of bilayer capacitance. The membrane was kept flat by
periodically adjusting the hydrostatic µressure across the film by
adding appropriate amounts of distilled water to the aqueous phase on
one side of the membrane. The progress of unbowing the membrane was
monitored visually under reflected white light.
5.4 RESULTS
Stable egg-lecithin bilayers could only be generated at
temperatures where significant amounts of alkane solvent would remain in
the bilayer after formation (at least l : 10 mole ratio alkane:
egg-lecithin). Only after the film had become bimolecular over the
entire aperture in the septum could the temperature be lowered. Upon
lowering the temperature solvent left the bilayer phase of the membrane
apparently aggregating into microlenses. In this case I am referring to
small droplets of liquid alkane visible as isolated ''pinpoints" of high
reflectance under the viewing microscope. The membrane would usually
attain a steady capacitance within 15-20 minutes of a change in
temperature.
87
5.41 BLM Capacitance; Temperature Dependence
The specific capacitance of egg-lecithin bilayers was found to
decrease with decreasing temperature. It can be seen from figure 5. 1
that the capacitance of bilayers generated with the longer chainlength
alkanes (C 1 ~-C 16 alkanes) appeared to have approximately the same upper
limiting value of capacitance at low temperatures.
The bilayer capacitance decreased with increasing temperature at
low solvent concentrations and then asymptotically approached a lower
li~it of approximately 3.5 ±.3 mF/m 2 • From the results shown in
figure 5.1 it is clear that the bilayer thickness (and hence alkane
solubility) was reduced with increasing chainlength of the alkane
present.
The upper limit of membrane capacitance at low temperatures was
repeatable within ±2%. However, the temperature dependence of membrane
thickness at higher temperatures showed greater variation between
different membranes. The magnitude of the experimentally measured
scatter in the results can be seen in figure 5.2.
5.42 BLM Capacitance: Dependence on Torus Alkane Concentration
Egg-lecithin bilayers were formed from solutions in which a given
alkane molecule could be varied over a wide range of concentrations (see
methods). I
Egg-lecithin bilayers formed with a mixture of n-decane and
n-hexadecane were found to have no well-defined, stable, capacitance.
The bilayer capacitance varied between 3.7 mF/~ 2 and 5 mF/m 2 over a
period of 2 hours. This long-term time dependence in bilayer
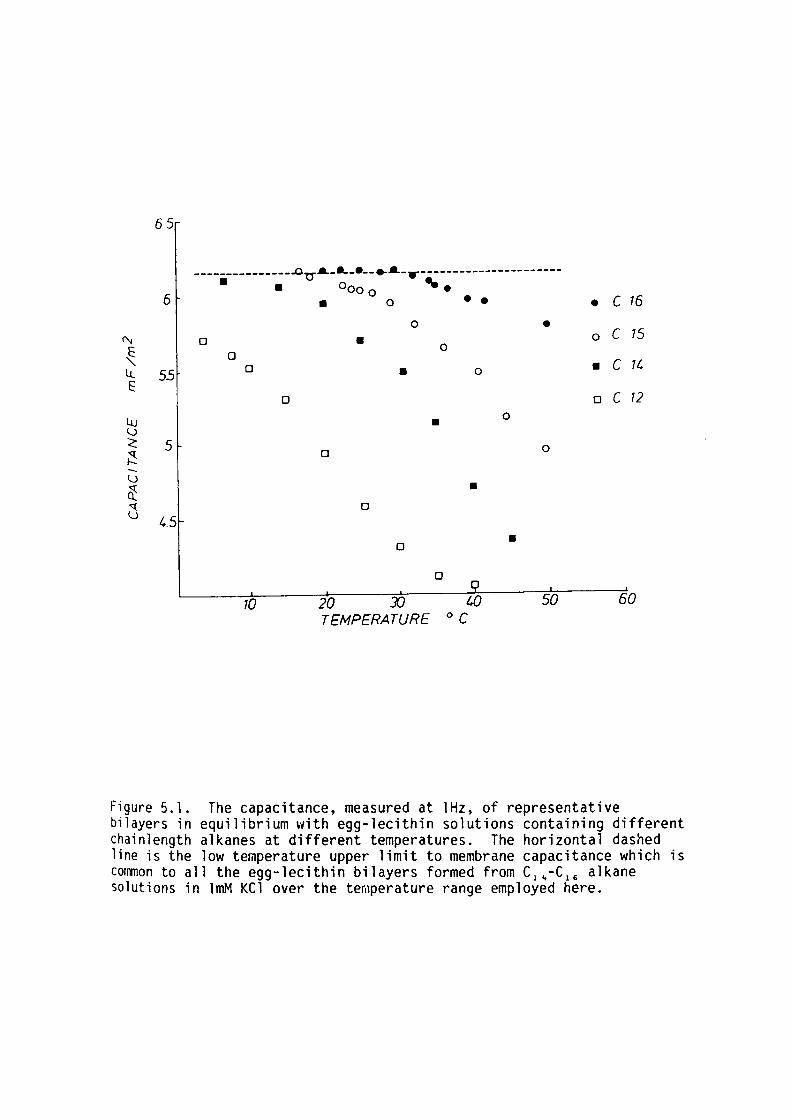
65
---------------.ou-.a._._ __ -•.&.-..-----------------------6
• • oooo ._ • • C 16 • 0 • • 0 •
"' D • 0 C 15
~ 0
D C 11. D • Li.. 55 • 0
E: D D C 12
Lu • 0
u <: 5 0 ~ D
u ~ • 0 D
4.5 • D
D
10 20 30 t.O 50 60
TEMPERATURE oc
Figure 5.1. The capacitance, measured at lHz, of representative bilayers in equilibrium with egg-lecithin solutions containing different chainlength alkanes at different temperatures. The horizontal dashed line is the low temperature upper limit to membrane capacitance which is common to all the egg-lecithin bilayers formed from C1 ~-C 16 alkane solutions in lmM KCl over the temperature range employed here.
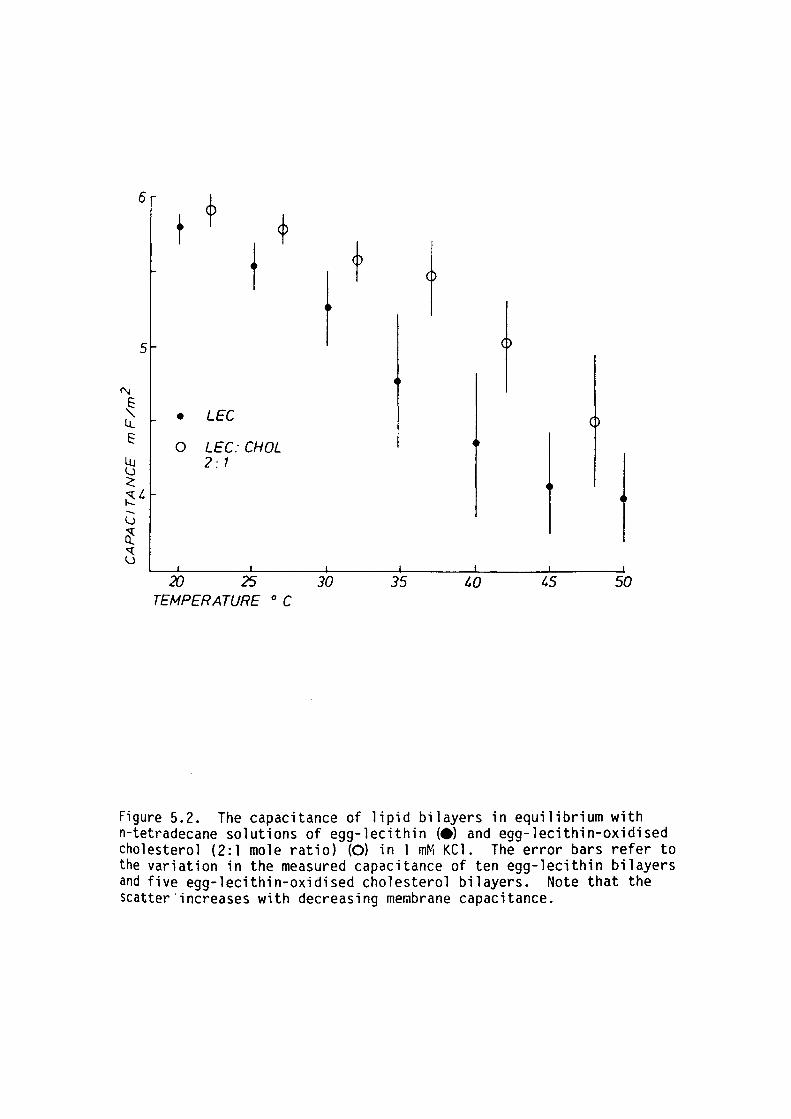
6 t t ~ t t t t
5
('\j
~ • LEC I.!.. E
0 LEC: CHOL Lu 2: 1 u ~
~I. --u cl ~ u
20 25 30 35 1.0 1.5 50 TEMPERATURE o C
Figure 5.2. The capacitance of lipid bilayers in equilibrium with n-tetradecane solutions of egg-lecithin (•) and egg-lecithin-oxidised cholesterol (2:1 mole ratio) (0) in l mM KCl. The error bars refer to the variation in the measured capacitance of ten egg-lecithin bilayers and five egg-lecithin-oxidised cholesterol bilayers. Note that the scatter·increases with decreasing membrane capacitance.
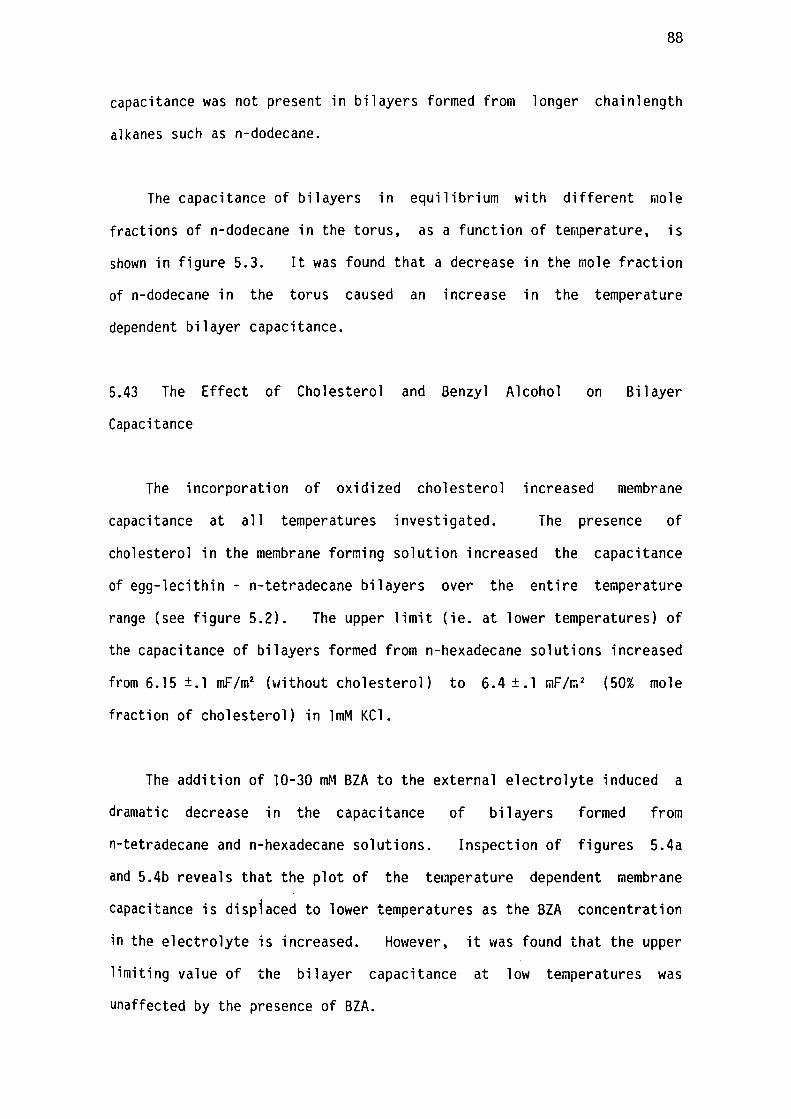
88
capacitance was not present in bilayers formed from longer chainlength
alkanes such as n-dodecane.
The capacitance of bilayers in equilibrium with different mole
fractions of n-dodecane in the torus, as a function of temperature, is
shown in figure 5.3. It was found that a decrease in the mole fraction
of n-dodecane in the torus caused an increase in the temperature
dependent bilayer capacitance.
5.43 The Effect of Cholesterol and Benzyl Alcohol on Bilayer
Capacitance
The incorporation of oxidized cholesterol increased membrane
capacitance at all temperatures investigated. The presence of
cholesterol in the membrane forming solution increased the capacitance
of egg-lecithin - n-tetradecane bilayers over the entire temperature
range (see figure 5.2). The upper limit (ie. at lower temperatures) of
the capacitance of bilayers formed from n-hexadecane solutions increased
from 6.15 ±.1 mF/m2 (without cholesterol) to 6.4 ±.1 mF/ra 2 (50% mole
fraction of cholesterol) in lmM KCl.
The addition of 10-30 mM BZA to the external electrolyte induced a
dramatic decrease in the capacitance of bilayers formed from
n-tetradecane and n-hexadecane solutions. Inspection of figures 5.4a
and 5.4b reveals that the plot of the te~perature dependent membrane
capacitance is dispiaced to lower temperatures as the BZA concentration
in the electrolyte is increased. However, it was found that the upper
limiting value of the bilayer capacitance at low temperatures was
unaffected by the presence of BZA.
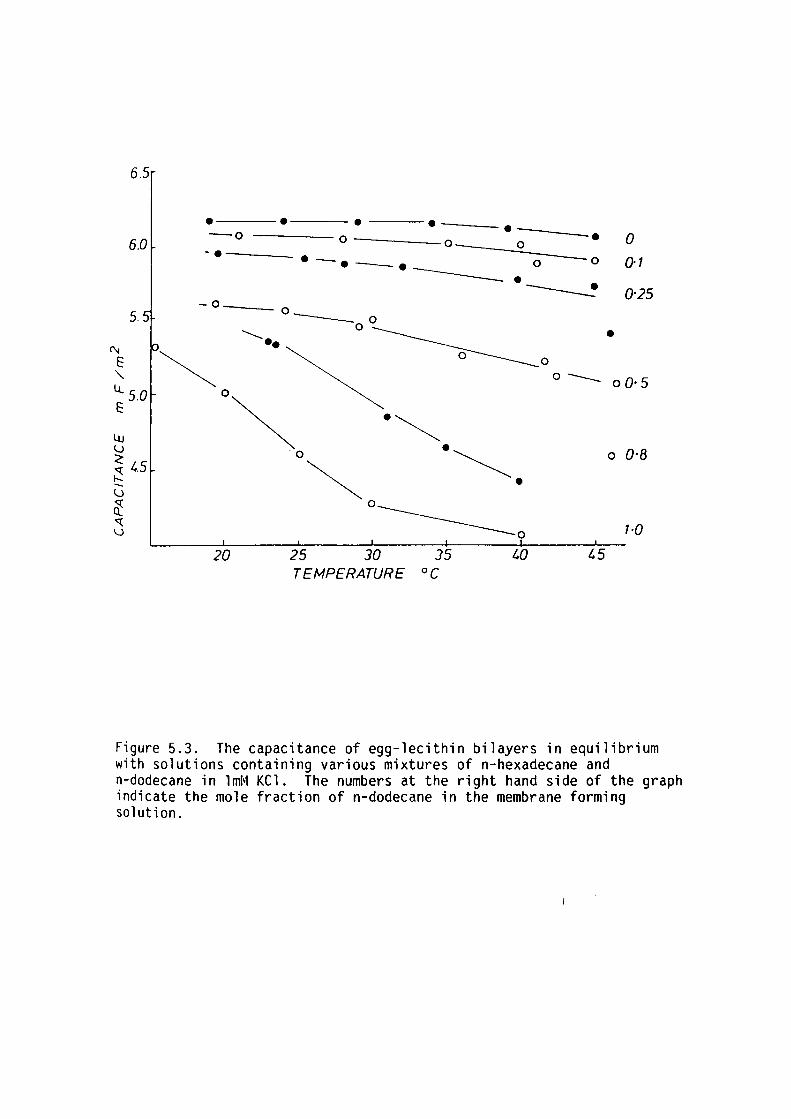
(\j
E
"
6.5
6.0
5.
u. 5.0 E
•---•---. ---. ---. -----o -----o----- • o_ o 0 -·---- ---::_ __ _
·-·-· 0 - 0 0·1 ---· -o __ _
0---00 ---..........
~o ·~ o
~ -~ 0 -~
~ . 0---------0
~ 0·25
• 0
0 -- oO·S
0 0·8
1·0
20 25 30 JS t.O t.5 TEMPERATURE °C
Figure 5.3. The capacitance of egg-lecithin bilayers in equilibrium with solutions containing various mixtures of n-hexadecane and n-dodecane in lmM KCl. The numbers at the right hand side of the graph indicate the mole fraction of n-dodecane in the membrane forming solution.
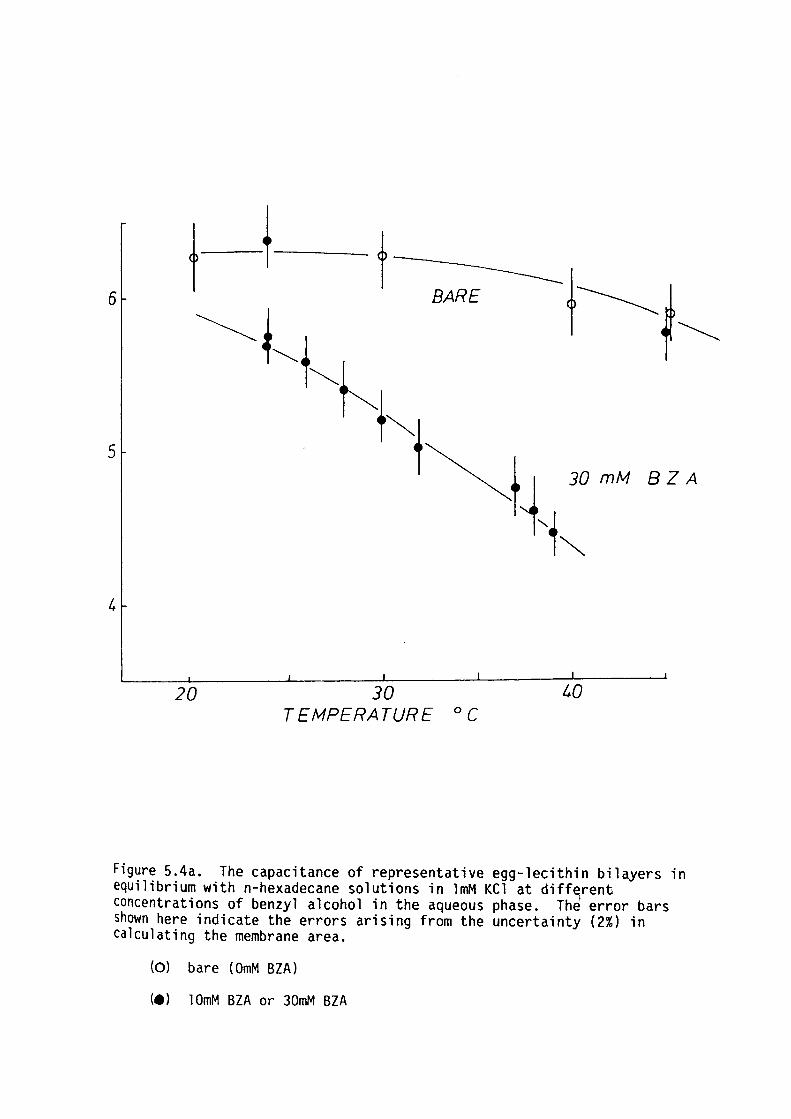
t t 6
5
20
t BARE
t"'
30 TEMPERATURE °C
t~f~
,,"'
lO
Figure 5.4a. The capacitance of representative egg-lecithin bilayers in equilibrium with n-hexadecane solutions in lmM KCl at different concentrations of benzyl alcohol in the aqueous phase. Th~ error bars shown here indicate the errors arising from the uncertainty (2%) in calculating the membrane area.
(O) bare (OmM BZA)
(e) lOmM BZA or 30mM BZA
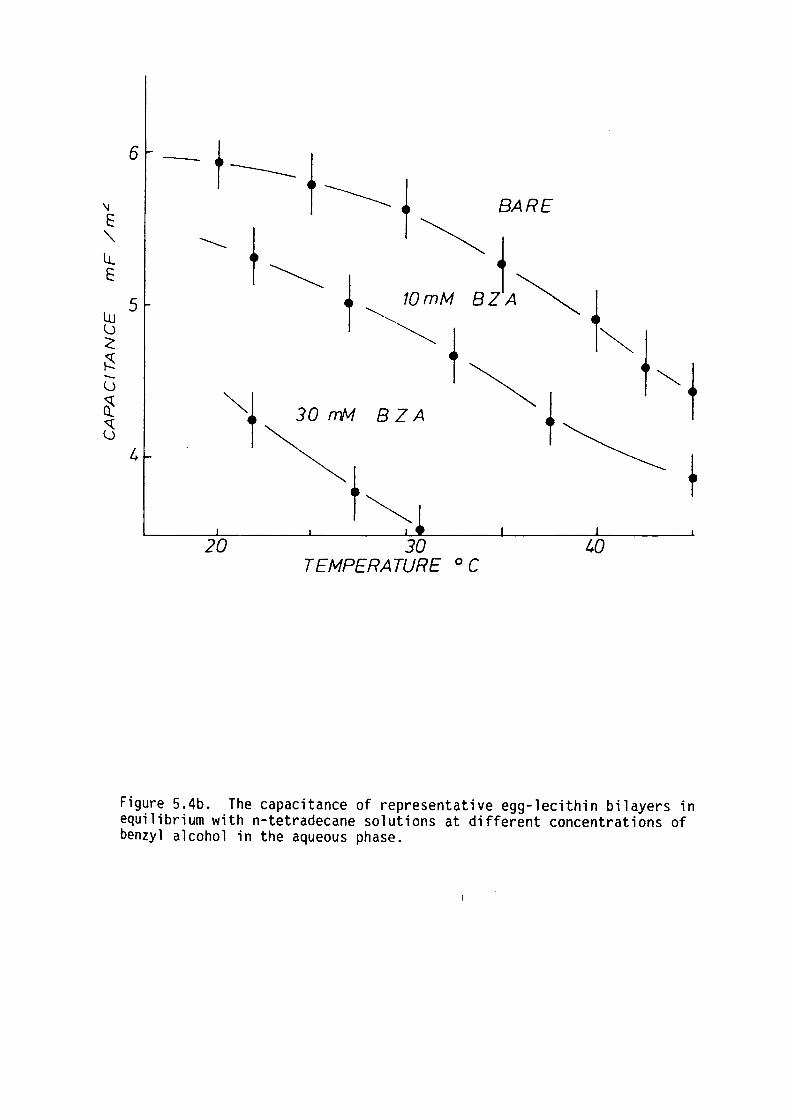
\J
E
" lJ.. E
Lu l)
< ~ -l) ~ <:( l)
6 -t t ------------ --------------- t BA R E
--- t ~ 5
t~ "'f 30 rrM BZA
~t~ 4
t 20 30 40
TEMPERATURE oc
Figure 5.4b. The capacitance of representative egg-lecithin bilayers in equilibrium with n-tetradecane solutions at different concentrations of benzyl alcohol in the aqueous phase.
89
5.5 DISCUSSION
5.51 Interpretation of the Low Temperature Capacitance
The different chainlength alkanes had different, temperature-
dependent, effects on the hydrophobic region capacitance. At
sufficiently low temperatures these differences vanished so that the
capacitance (and hence thickness) of these egg-lecithin bilayers was
independent of the temperature and alkane chainlength for the longer
chainlength alkanes. This implies that the concentration of the longer
chainlength alkanes in the bilayer at these low temperatures must be
very small. It seems likely that the capacitance of bilayers containing
n-dodecane would continue to follow a similar dependence on temperature
as the longer chainlength alkanes and would have had the same limiting
low temperature values at temperatures below the lowest values that
could be employed in the current experiments (see figure 5.1).
Based on these data it is now assumed that bilayers containing
n-hexadecane in 1 mM KCl external electrolyte are essentially solvent 0
free* at temperatures up to 30 C. Thus solventless egg-lecithin
bilayers were produced by generating the bilayer films at elevated
temperatures and then reducing the temperature which lowered the alkane
concentration. This technique is analogous to the 11 freeze-out 11 method
of White (1974). The analogy, however, is only superficial as the
mechanisms for removal of solvent in egg-lecithin bilayers and GMO
bilayers may be different (see section 5.57).
* Solvent free only in that the bilayer thickness was unaffected
(within an experimental error of ±2%) by the possible presence of
trace amounts of solvent within the bilayer.
90
The capacitance of egg-lecithin bilayers formed by this method in
100 mM KCl was 6.8± .2mF/m 2 at 25°C (see results in Chapter 6) which
compared favourably with capacitance of bilayers formed by monolayer
apposition (7.21 ± .2~F/m 2). The latter are believed to have negligible
solvent concentrations as determined by the effect of D.C. voltage bias
on membrane capacitance (Benz et al., 1975).
Therefore the upper limiting value of bilayer capacitance at low
temperatures is assumed to be the capacitance of the solvent-free
bilayer which represents the variable, C , m
difference in the standard chemical potential,
in equation 5.3.
0 ~µ' in the bilayer
The
and
torus for different alkanes could then be calculated on the basis of
equation 5.4 and assuming that the alkane mole fraction in the torus is
unity*.
5.52 Effect of Microlenses
White (1974) observed that alkane which was displaced from the
bilayer upon changes in the bilayer-torus equilibrium, collected into
small lenses of bulk alkane called microlenses which were clearly
visible under a low power microscope. This phenomenon was also observed
in the present experiments. Being much thicker than the surrounding
bilayer, the lenses of trapped solvent contribute little to the
capacitance of the bilayer. If the microlenses do occupy a significant
fraction of the membrane surface area then this would introduce errors
into the estimates of bilayer thickness derived from the total membrane
capacitance.
* The lipid concentration in the torus was always very small ~ 30mM).
The total alkane mole fraction was then always greater than 99%.
91
A detailed study of the effect of microlenses on estimates of the
bilayer area has been carried out by White and Thompson (1973). It was
found that the total area occupied by microlenses depended on the amount
of solvent disproportioned from the bilayer and the size of the
microlenses formed. The calculations of Uhite and Thompson (1973)
sho\1ed that in extreme cases microlenses could occupy 10% of the bilayer
area.
Inspection of figures 5.2 and 5.5 shows that the scatter in the
~embrane capacitance between different membranes ( for a given solvent)
increased with increasing alkane concentration in the bilayer. The
scatter in the bilayer capacitance increased from 2%, when no solvent
was present, to a maximum of 20% which was similar to that reported by
White and Thompson (1973) for bilayers containing n-decane.
If variations in the area of raicrolenses between different
membranes were responsible for the experimentally observed scatter then
large variations in the upper limiting capacitance would also be
observed. Therefore it can be concluded that microlenses only had a
s@all effect on the total capacitance of the membrane ~2%). The
experimental scatter must then arise from variations in the alkane
concentrations within the bilayer interior.
5.53 n-Alkane Absorption: Chainlength Dependence
1 The scatter in the experimentally measured alkane mole fraction in
the egg-lecithin bilayers was approximately ±25%. The reason for the
considerable variability is not known. One possibility is that the
concentration of solvent in the torus is not well defined and that
variations in the torus concentration of different membranes can lead to
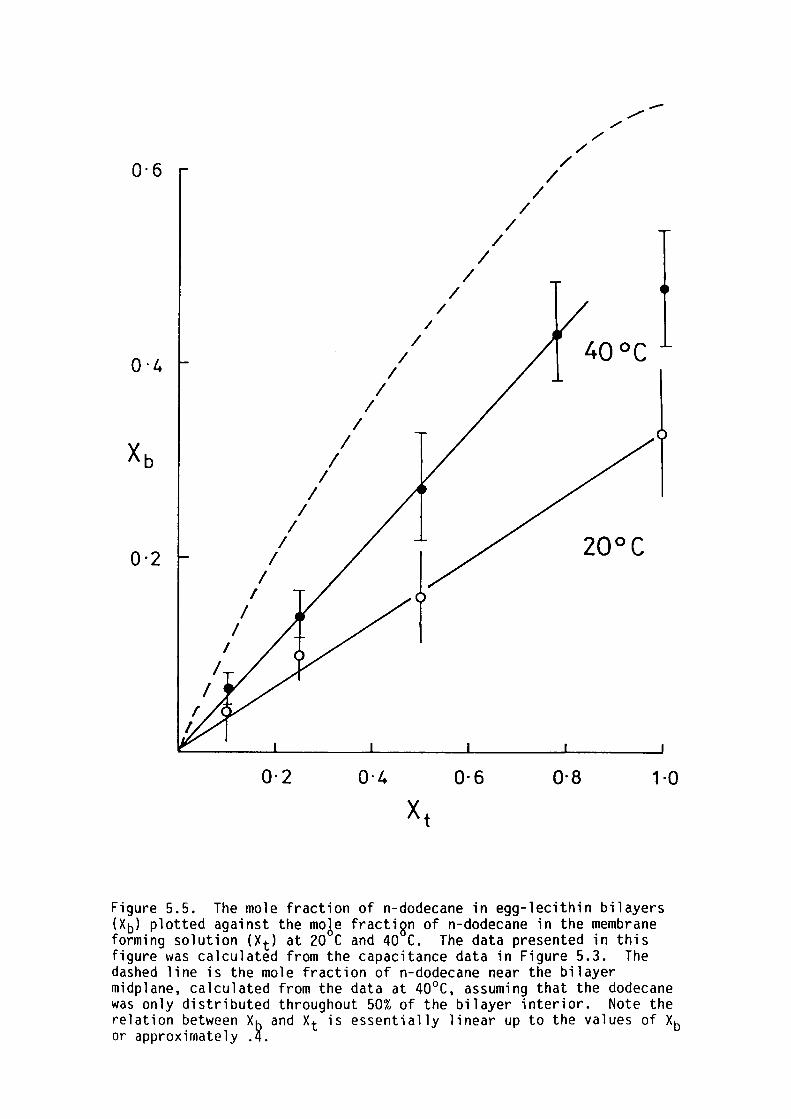
0·6
0·4
0·2
I I
I I
I I
I I
I
I
0·2
I
I I
I
I
I /
I
0·4
I
/ /
/
/ /
/ /
0·6
/ /
/ /
-/ /
/ /
/ /
20°c
0·8 1 ·0
Figure 5.5. The mole fraction of n-dodecane in egg-lecithin bilayers (Xb) plotted against the mo!e fractign of n-dodecane in the membrane forming solution (Xt) at 20 C and 40 C. The data presented in this figure was calculated from the capacitance data in Figure 5.3. The dashed line is the mole fraction of n-dodecane near the bilayer midplane, calculated from the data at 40°C, assuming that the dodecane was only distributed throughout 50% of the bilayer interior. Note the relation between Xb and Xt is essentially linear up to the values of Xb or approximately .4.
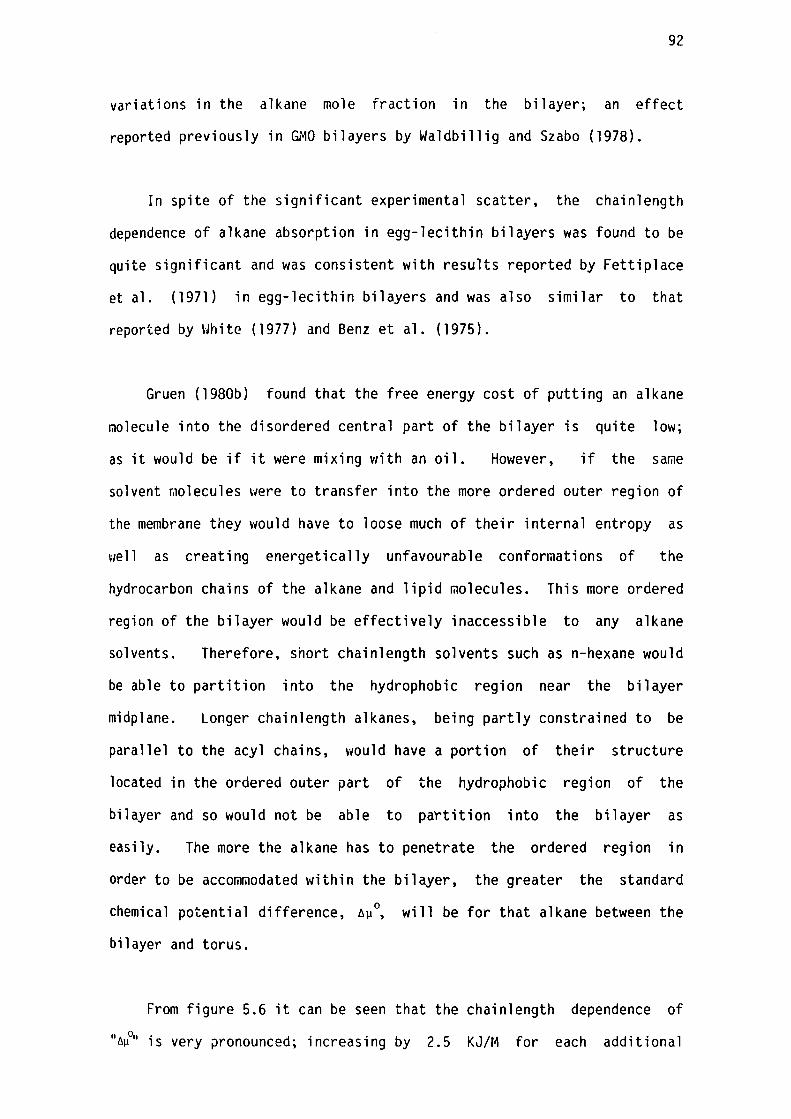
92
variations in the alkane mole fraction in the bilayer; an effect
reported previously in GMO bilayers by Waldbillig and Szabo (1978).
In spite of the significant experimental scatter, the chainlength
dependence of alkane absorption in egg-lecithin bilayers was found to be
quite significant and was consistent with results reported by Fettiplace
et al. (1971) in egg-lecithin bilayers and was also similar to that
reported by White (1977) and Benz et al. (1975).
Gruen (1980b) found that the free energy cost of putting an alkane
molecule into the disordered central part of the bilayer is quite low;
as it would be if it were mixing with an oil. However, if the same
solvent QOlecules were to transfer into the more ordered outer region of
the membrane they would have to loose much of their internal entropy as
~ell as creating energetically unfavourable conformations of the
hydrocarbon chains of the alkane and lipid molecules. This more ordered
region of the bilayer would be effectively inaccessible to any alkane
solvents. Therefore, short chainlength solvents such as n-hexane would
be able to partition into the hydrophobic region near the bilayer
midplane. Longer chainlength alkanes, being partly constrained to be
parallel to the acyl chains, would have a portion of their structure
located in the ordered outer part of the hydrophobic region of the
bilayer and so would not be able to partition into the bilayer as
easily. The more the alkane has to penetrate the ordered region in
order to be accommodated within the bilayer, the greater the standard
chemical potential difference, 6µ 0 , will be for that alkane between the
bilayer and torus.
From figure 5.6 it can be seen that the chainlength dependence of
11 6µ°'• is very pronounced; increasing by 2. 5 KJ/M for each add it i ona 1
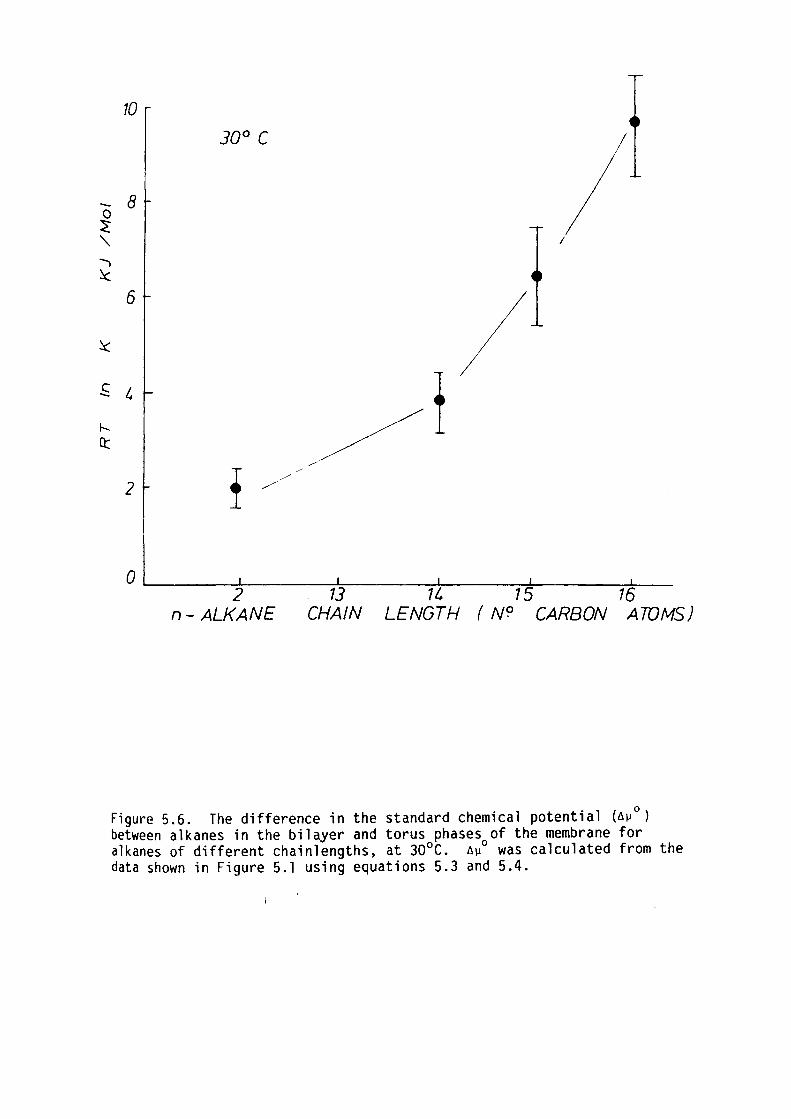
10
30° C
8
I
6
2
0 '--------;:!;--------:--l;;::----------:+-----,--,!---------1--2 13 1l 15 16
n-ALKANE CHAIN LENGTH ( N'? CARBON A70MS)
Figure 5.6. The difference in the standard chemical potential (6µ 0)
between alkanes in the bilayer and torus phases of the membrane for alkanes of different chainlengths, at 30°C. 6µ0 was calculated from the data shown in Figure 5.1 using equations 5.3 and 5.4.
93
carbon atom in the alkane chain. The l O\'I values of "e-,·/" for n-dodecane
show that alkane near the midplane of the bilayer contributes very
little to the "e-,µ0 " of the longer alkanes. This suggests that the main
contribution to the standard chemical potential of the alkanes in the
bilayer arises from the terminal carbon atoms of the longer alkanes.
Thus it seems that the partitioning of n-alkanes into the bilayer would
be sensitive to the order parameters of the acyl chains near the
bilayer-water interface.
5.54 Bilayers Formed From Binary i4ixtures of n-Alkanes
5.541 Bilayers formed From Solutions Containing n-Decane
!~early all of the earlier bilayer work was carried out on
egg-lecithin bilayers formed from n-decane solutions. As found in many
previous studies, bilayers formed from n-decane solutions had no well
defined capacitance (eg. Andrews and Haydon, 1968 and White and
Thorapson, 1973). In these studies it was suggested that this was due to
a time varying disproportioning of n-decane into ~icrolenses. In the
present experiments it was apparent that n-decane was sufficiently
volatile to affect the time course of the capacitance of bilayers formed
from this solvent; an effect already known in bilayers containing
n-nonane (Haydon et. al., 1977). Thus the. bilayer thickness never
reached a stable value in the life time of the membrane (typically 2
hours). Therefore the bilayers containing n-decane must be treated as
~hree phase systems (ie. the bilayer, the torus and the atmosphere) and
precautions would need to be taken to ensure that the aqueous phase and
adjacent atmosphere are in equilibrium with the n-decane in the bilayer
(for the atmosphere this represents substantial technical problems).
The fact that such precautions were in general not ta~en may account for
94
the considerable variation in bilayer capacitances reported in the
literature for apparently identical bilayer systems using n-decane
solvents (eg the capacitance of egg-lecithin - cholesterol bilayers
containing n-decane; c.f. Hanai, Haydon and Taylor, 1965b and Haydon et.
a 1 . , 1977) .
5.542 The Assumption of Ideal Mixing Between the n-Alkane- and Acyl
Chains
The maximura thickness of egg-lecithin bilayers saturated with
solvent was estimated at about 4.7-5.Snm* which is approximately twice
the extended chainlength of a typical lipid in the bilayer each acyl
chain having an average chainlength of 17 carbon atoms). Indeed for a
bilayer to attain a greater thickness, a new, "bulk" alkane phase would
need to form between the two apposing monolayers. Formation of such a
phase is unlikely** as this would be not lead to any further increase in
entropy-due-to-mixing of the lipid acyl chains and the alkanes, since
any additional alkane would then partition into a separate phase.
For further details the reader is referred to the discussion in
the previous studies of Taylor and Haydon (1966) and White (1970).
* These values are slightly over estimated as the capacitance of ionic
double layers in series with the dielect;ic capacitance of the
bilayer was not taken into account.
** In any case the spontaneous formation of a bilayer from a thick film
shows that on the basis of free energy the formation of such a
central phase is unfavourable.
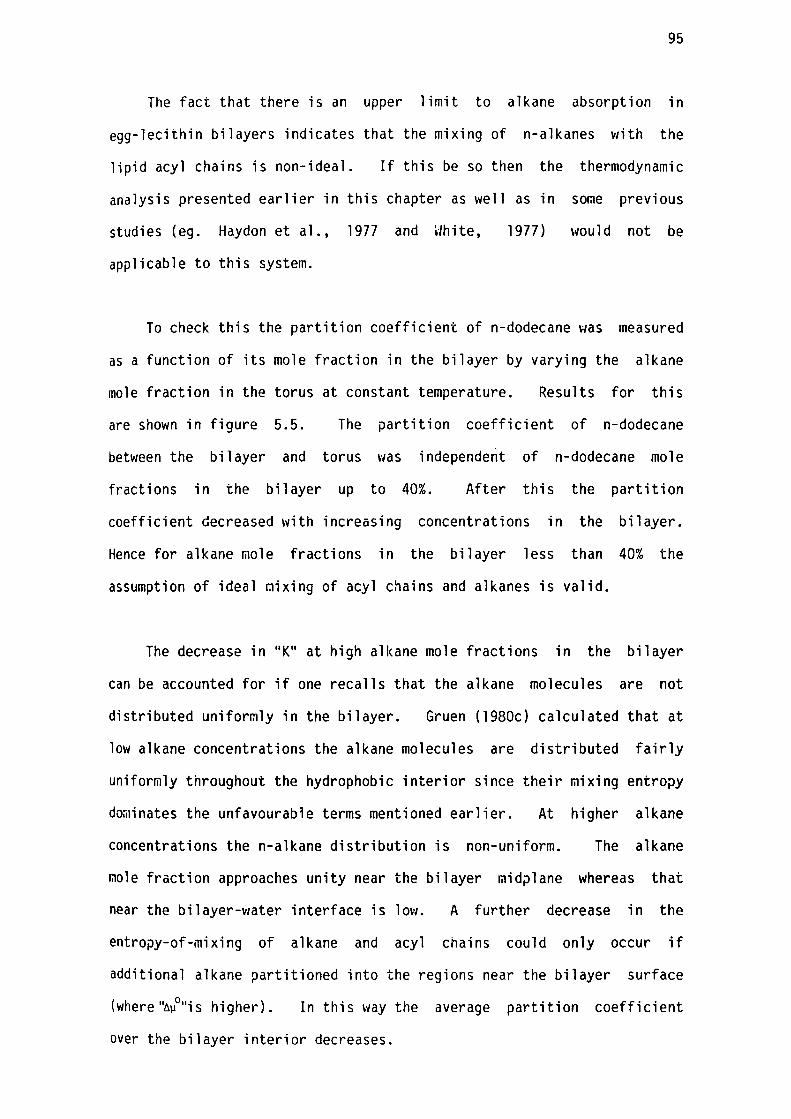
95
The fact that there is an upper limit to alkane absorption in
egg-lecithin bilayers indicates that the mixing of n-alkanes with the
lipid acyl chains is non-ideal. If this be so then the thermodynamic
analysis presented earlier in this chapter as well as in some previous
studies (eg. Haydon et al., 1977 and White, 1977) would not be
applicable to this system.
To check this the partition coefficient of n-dodecane was measured
as a function of its mole fraction in the bilayer by varying the alkane
mole fraction in the torus at constant temperature. Results for this
are shown in figure 5.5. The partition coefficient of n-dodecane
between the bilayer and torus was independent of n-dodecane mole
fractions in the bilayer up to 40%. After this the partition
coefficient decreased with increasing concentrations in the bilayer.
Hence for alkane mole fractions in the bilayer less than 40% the
assumption of ideal ~ixing of acyl chains and alkanes is valid.
The decrease in 11 K11 at high alkane mole fractions in the bilayer
can be accounted for if one recalls that the alkane molecules are not
distributed uniformly in the bilayer. Gruen (1980c) calculated that at
low alkane concentrations the alkane molecules are distributed fairly
uniformly throughout the hydrophobic interior since their mixing entropy
dominates the unfavourab~e terms mentioned earlier. At higher alkane
concentrations the n-alkane distribution is non-uniform. The alkane
mole fraction approaches unity near the bilayer mid~lane whereas that
near the bilayer-water interface is low. A further decrease in the
entropy-of-mixing of alkane and acyl chains could only occur if
additional alkane partitioned into the regions near the bilayer surface
(where "ti/"is higher). In this way the average partition coefficient
over the bilayer interior decreases.
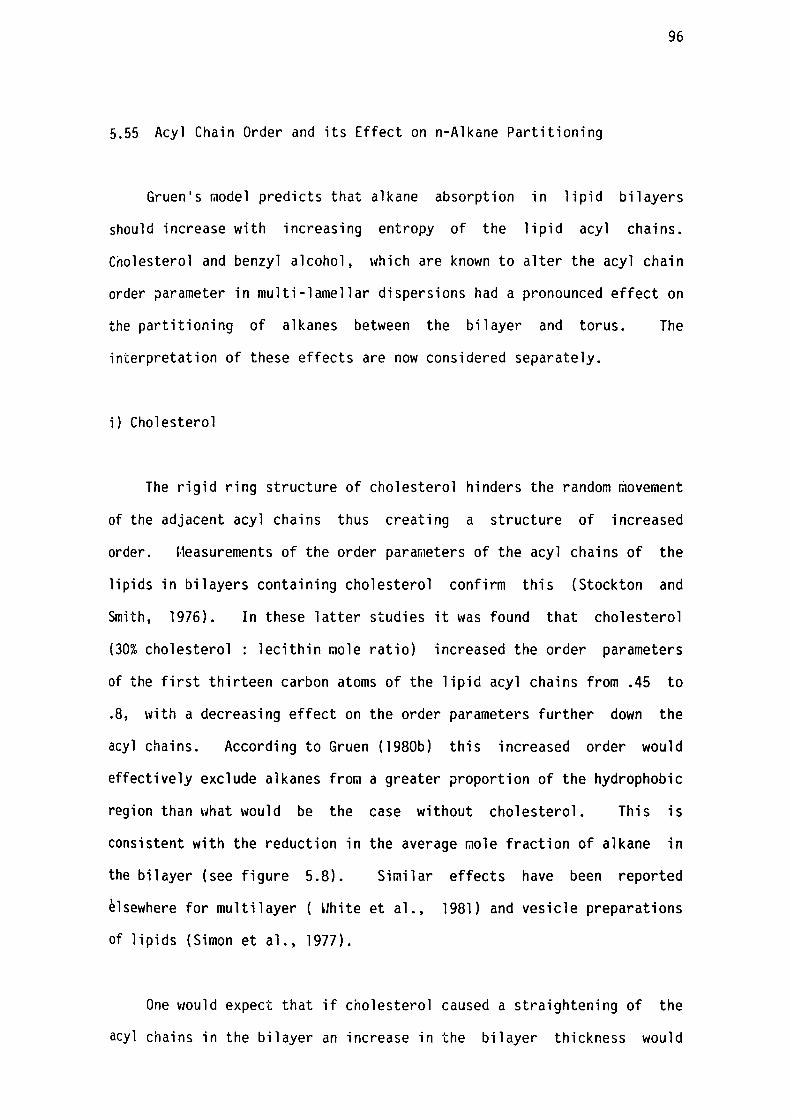
96
5.55 Acyl Chain Order and its Effect on n-Alkane Partitioning
Gruen's @odel predicts that alkane absorption in lipid bilayers
should increase with increasing entropy of the lipid acyl chains.
C~olesterol and benzyl alcohol, which are known to alter the acyl chain
order ~arameter in multi-lamellar dispersions had a pronounced effect on
the partitioning of alkanes between the bilayer and torus. The
interpretation of these effects are now considered separately.
i) Cholesterol
The rigid ring structure of cholesterol hinders the random raovement
of the adjacent acyl chains thus creating a structure of increased
order. Measurements of the order parameters of the acyl chains of the
lipids in bilayers containing cholesterol confirm this (Stockton and
Smith, 1976). In these latter studies it was found that cholesterol
(30% cholesterol : lecithin mole ratio) increased the order parameters
of the first thirteen carbon atoms of the lipid acyl chains from .45 to
.8, with a decreasing effect on the order parameters further down the
acyl chains. According to Gruen (198Ob) this increased order would
effectively exclude alkanes from a greater proportion of the hydrophobic
region than vhat would be the case without cholesterol. This is
consistent with the reduction in the average ~ole fraction of alkane in
the bilayer (see figure 5.8). Similar effects have been reported I .
elsewhere for multilayer ( \Jhite et al., 1981) and vesicle preparations
of lipids (Simon et al., 1977).
One would expect that if cholesterol caused a straightening of the
acyl chains in the bilayer an increase in the bilayer thickness would
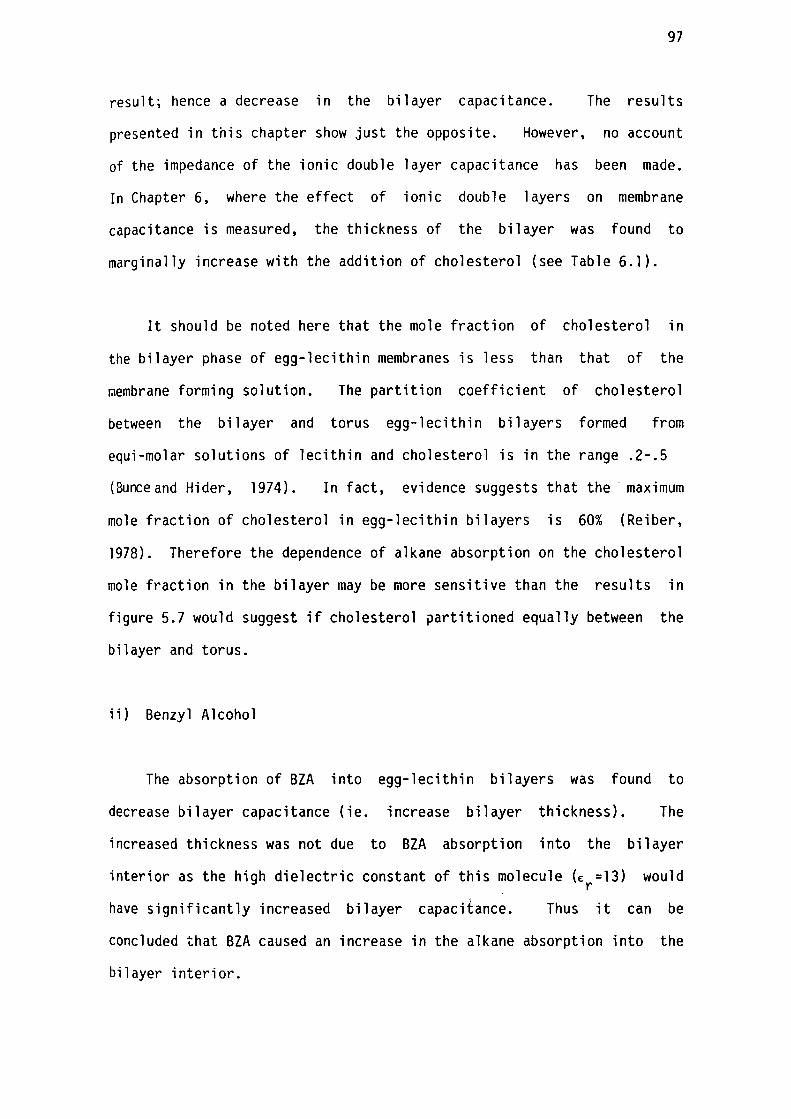
97
result; hence a decrease in the bilayer capacitance. The results
presented in this chapter show just the opposite. However, no account
of the impedance of the ionic double layer capacitance has been made.
In Chapter 6, where the effect of ionic double layers on membrane
capacitance is measured, the thickness of the bilayer was found to
marginally increase with the addition of cholesterol (see Table 6.1).
It should be noted here that the mole fraction of cholesterol in
the bilayer phase of egg-lecithin membranes is less than that of the
~embrane forming solution. The partition coefficient of cholesterol
between the bilayer and torus egg-lecithin bilayers formed from
equi-molar solutions of lecithin and cholesterol is in the range .2-.5
(Bunceand Hider, 1974). In fact, evidence suggests that the· maximum
mole fraction of cholesterol in egg-lecithin bilayers is 60% (Reiber,
1978). Therefore the dependence of alkane absorption on the cholesterol
mole fraction in the bilayer may be more sensitive than the results in
figure 5.7 would suggest if cholesterol partitioned equally between the
bilayer and torus.
ii) Benzyl Alcohol
The absorption of BZA into egg-lecithin bilayers was found to
decrease bilayer capacitance (ie. increase bilayer thickness). The
increased thickness was not due to BZA absorption into the bilayer
interior as the high dielectric constant of this molecule(£ =13) would , r
have significantly increased bilayer capacitance. Thus it can be
concluded that BZA caused an increase in the alkane absorption into the
bilayer interior.
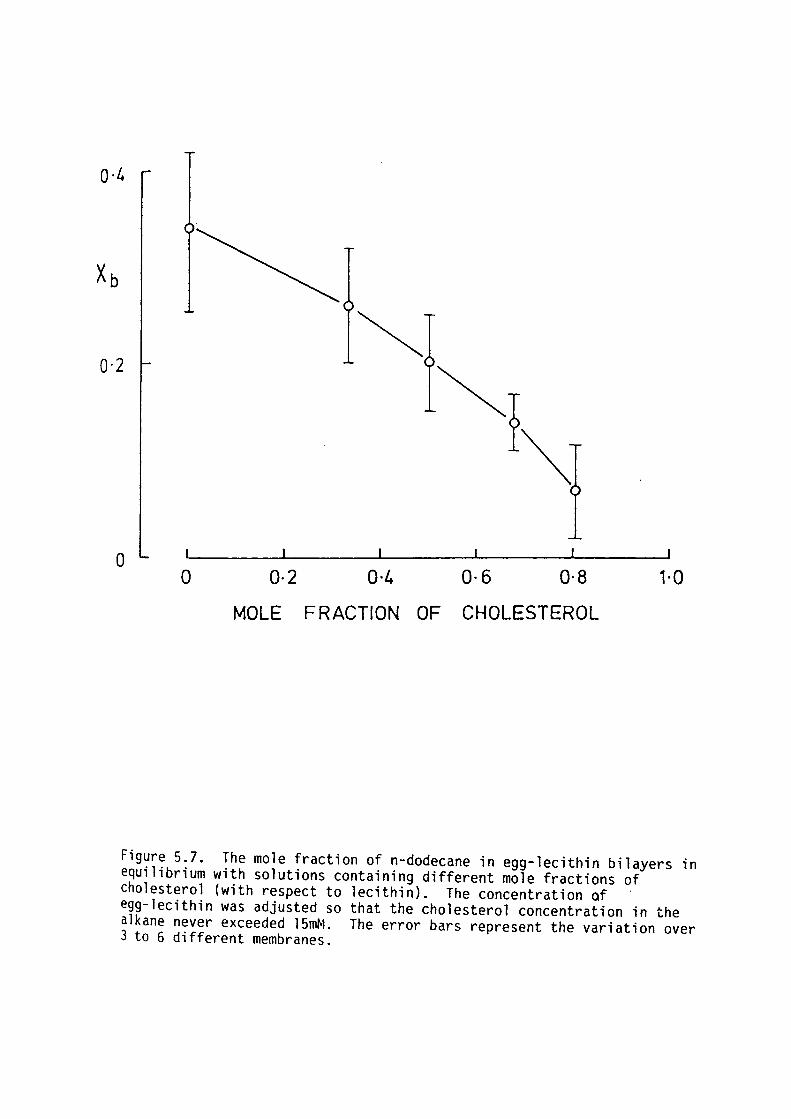
O ·L.
0·2
0 0 0·2 0·4 0·6 0·8 1·0
MOLE FRACTION OF CHOLESTEROL
Figure 5.7. The mole fraction of n-dodecane in egg-lecithin bilayers in equilibrium with solutions containing different mole fractions of cholesterol (with respect to lecithin). The concentration of ' egg-lecithin was adjusted so that the cholesterol concentration in the alkane never exceeded 15mM. The error bars represent the variation over 3 to 6 different membranes.
98
Benzyl alcohol is an amphiphilic molecule and hence is surface
active. Absorption of benzyl alcohol at the bilayer interface is likely
to reduce the energy arising from the oil-water interface by reducing
the area of oil-water contact. This would then allow a slight increase
in the lipid head group area and consequently a reduction in the acyl
chain order parameter. This suggestion is supported by the results of
NMR experiments reported by Turner and Oldfield (1979).
The minimum low temperature limiting thickness of egg-lecithin
bilayers was unaffected by the addition of BZA. This is surprising
since one would expect a change in the order parameter of the acyl
chains in the bilayer to induce a change in bilayer thickness. Either
changes in the order parameter of the lipid acyl chains are insufficient
to produce detectable changes in bilayer thickness or alkane exists in
the bilayer which does not "freeze out" at the temperatures employed in
these experiments.
5.56 Absorption of n-Alkanes: Interpretation of Temperature Dependence
Figure 5.8 shows the temperature dependence of the difference in
the standard chemical potential, ~µ 0 , between the bilayer and torus for
different alkanes. The temperature dependence increased with increasing
chainlength of the alkane solvent. At higher temperatures the
temperature dependence of "~µ0" appeared to vanish ( at least for the
shorter chainlength alkanes).
Provided the entropy and enthalpy components of 11 ~µ011 are
temperature independent then one can use eGuations 5.7 and 5.8 to
evaluate the relative roles of entropy and enthalpy in the partitioning
of n-alkane between the bilayer and torus phases. The results presented
99
here suggest that "tiµ0 " is dependent on the ordering of the 1 i pi d acyl
chains in the bilayer. Deuterated lipid NMR studies (Stockton,
Polnaszek, Tullock, Hasan and Smith, 1976) on egg-lecithin multilayer
preparations showed that the order of the acyl chains is temperature
dependent; the order parameters of the first eight carbon atoms of the
chain decreasing from .46 ± .01 at 30°C to .37 ± .03 at 55°C.
As the ordering of the bilayer interior varies with temperature it atiH 0 0
unlikely " a tiS " t zero in equation 5.6 is is that setting 11 ..:::..:::.:.:.• and al 0 a aT
good approximation. Hence caution must be used when interpreting the
gradient and intercept of data presented in figure 5.8 on the basis of
equations 5.7 and 5.8.
5.57 Comparison With GMO ailayers
The temperature and alkane chainlength dependence of alkane
solubility was similar for GMO and egg-lecithin bilayers. However, the
alkane solubility in egg-lecithin bilayers was found to be lower than
that observed for GMO bilayers. The mole fractions of the
various n-alkanes in egg-lecithin bilayers reported in the present study
are compared to those found in GMO bilayers by Hhite (1977)
5. 1.
in Table
Though the extended chainlength of the acyl chains of GMO and
egg-lecithin are similar, capacitance measurements indicate that the
acyl chains of egg-lecithin in bilayer aggregates have a more extended
conformation (compare results in figures 6.1 and 6.2). This means that
the acyl chains of GMO are more disordered and thus provide an
environment more favourable to the presence of n-alkanes. This could
explain the relatively large alkane solubility of GMO membranes.
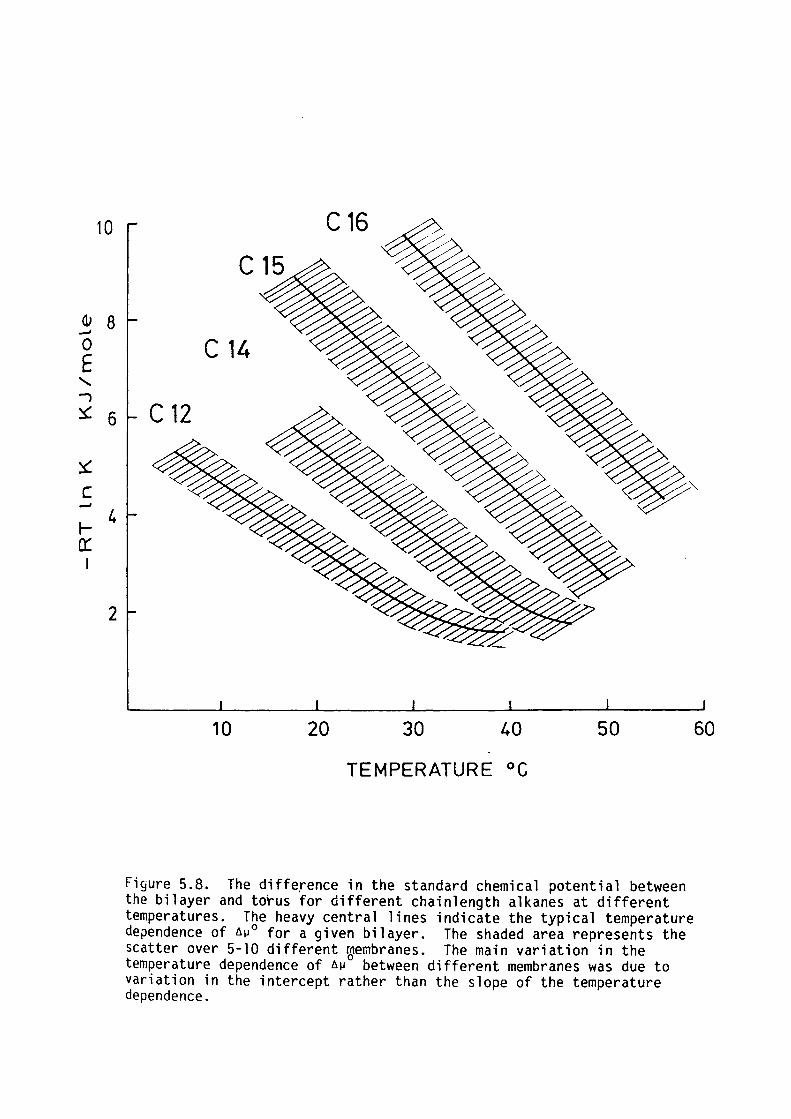
10
a., - 8 0 E ' -, ~ 6
~
C __,
I-4
0::: I
2
C16
C14
C 12
10 20 30 40 50
TEMPERATURE °C
Figure 5.8. The difference in the standard chemical potential between the bilayer and torus for different chainlength alkanes at different temperatures. The heavy central lines indicate the typical temperature dependence of 6µ 0 for a given bilayer. The shaded area represents the scatter over 5-10 different membranes. The main variation in the temperature dependence of 6µ 0 between different membranes was due to variation in the intercept rather than the slope of the temperature dependence.
60
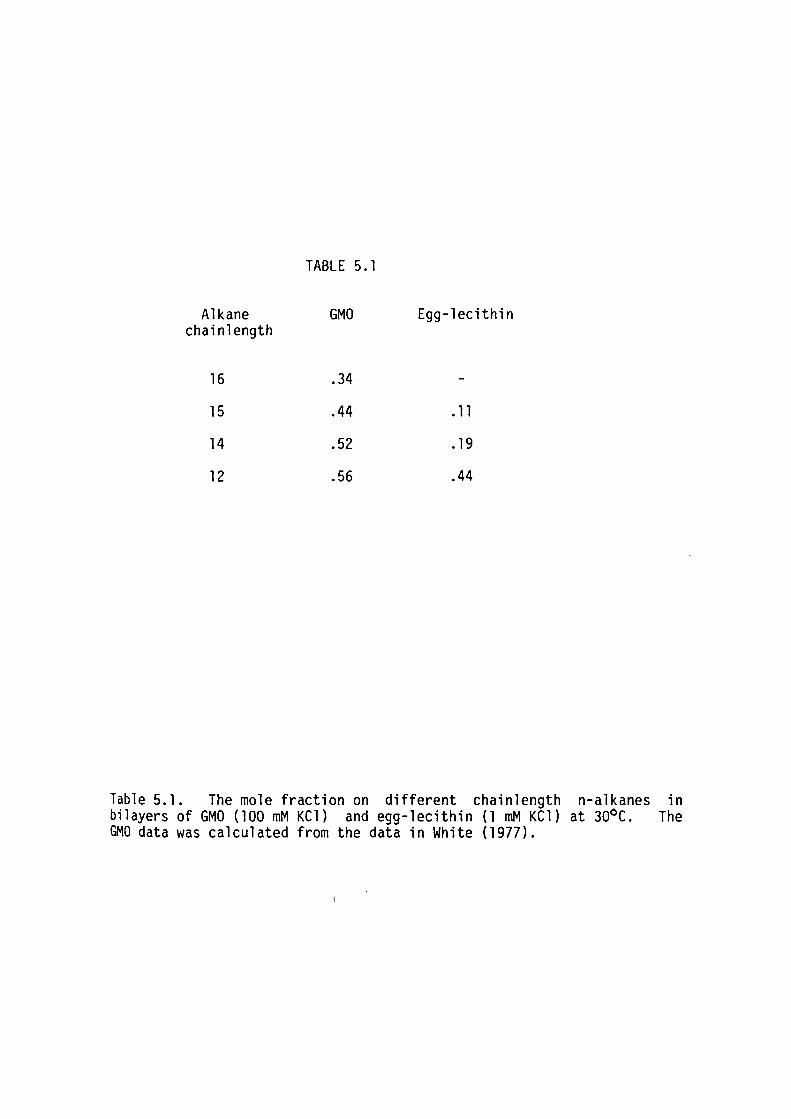
TABLE 5.1
Alkane GMO Egg-lecithin chain length
16 .34
15 .44 • 11
14 .52 . 19
12 .56 .44
Table 5.1. The mole fraction on different chainlength n-alkanes in bilayers of GMO (100 mM KCl) and egg-lecithin (1 mM KCl) at 30°C. The GMO data was calculated from the data in White (1977).
100
The mechanism for the removal of solvent from the interior of
egg-lecithin bilayers at low temperatures may be different from that
proposed by White (1974) for Gi40 bilayers. ~Jhite interpreted the
removal of solvent from the bilayer as a freezing effect implying that
it is an intrinsic property of the alkane solvent. The temperature at
\lhich the solvent "condensed" out of egg-lecithin membranes was well
above the freezing point of the alkane present and was also found to be
dependent on the bilayer composition. While alkane in egg-lecithin
bilayers could also freeze at low temperatures, the effect could not be
observed because the partition coefficients of the alkanes in the
bilayer were very low at temperatures in the vicinity of their freezing
point.
101
5.6 SUMi>lARY
The partition coefficient of n-alkanes between the bilayer and
torus of egg-lecithin bilayers was measured for n-alkanes with ten to
sixteen carbon atoms using measurements of membrane capacitance.
The partition coefficient was found to decrease with increasing
alkane chainlength and increase with increasing temperature.
It was found that n-decane was unsuitable as a solvent in these
experiments as the partitioning of n-decane into the aqueous phase and
atmosphere could not be ignored and could not be controlled.
Egg-lecithin bilayers containing negligible amounts of solvent
could be produced using a method similar to the freeze out method of
White (1974). Bilayers formed using n-hexadecane were found to be 0 solvent free at temperatures below 30 C.
The partition coefficient of n-alkanes in the bilayer was found to
depend on the alkane mole fraction. Thus it was concluded that the
assumption of ideal raixing between acyl- and alkane chains in the
bilayer was not valid when the alkane mole fraction exceeded 40% (with
respect to the acyl chains of the lipid).
Membrane additives knmm to alter the order pararaeter of the acyl
chains in lipid bilayers had pronounced effects on the partitioning of
alkanes into egg-lecithin bilayers. Cholesterol, known to increase the
order para~eter, decreased the partition coefficient and benzyl alcohol,
known to decrease the order parameter, increased the partition
coefficient. This was found
statistical mechanical model of
crystalline state.
102
to be consistent with a well-known
lipid-alkane bilayers in the liquid
The variation of the standard che~ical potential with temperature
was Qeasured for alkanes of different chainlengths. From these results
it Has concluded that the enthalpy and entropy of the alkanes in the
bilayer are in themselves a function of temperature. This is indicative
of the different state of the hydrophobic interior of lipid bilayers at
different te~peratures.
Thus far, solvent retention in lipid bilayers has been considered a
major pitfall of the model. However, it seems that the partitioning of
n-alkanes into lipid bilayers may be a useful probe in detecting small
variations in the ordering of the acyl chains in the hydrophobic
interior of lipid bilayers.
CHAPTER 6
EFFECT OF EXTERNAL ELECTROLYTE ON THE
CAPACITANCE OF LIPID BILAYERS
6. l INTRODUCTION
6.2 PRELIMINARY THEORETICAL CONSIDERATIONS
6.3 METHODS
6.4 RESULTS
6.41 Glycerol Monooleate Bilayers
Page 104
107
111
111
111
6.42 Egg-Lecithin Bilayers 112
6.43 Egg-Lecithin Bilayers Containing Cholesterol 113
6.5 DISCUSSION 114
6.51 Effect of Ions on Bilayer Structure. 114
6.52 The Capacitance of Ionic Double Layers 115
6.53 The Nature of Bound Charge on Lipid Bilayers 118
6.54 The Effect of Cholesterol on Bilayer Capacitance 121
6.55 Comparison With Previous Work 122
6.6 SUMMARY 123
103
104
6.1 INTRODUCTION
Biological membranes are involved in many aspects of cellular
activity. It is now recognized that the function of these membranes is
sensitive to the composition of their aqueous environment; particularly
to the presence of monovalent and multivalent cations ( eg. see Cole,
1968, Hope and Walker, 1975). Consequently many studies have been made
on model membrane systems in an effort to understand the mechanism
whereby alkali metal and alkaline earth cations can modulate membrane
function (eg. see references sighted in Sacre and Tocanne, 1977).
Ion - lipid and water - lipid binding has been detected by
deuterated water and labeled sodium NMR techniques (eg. see review of
Pope and Cornell, 1978). Competitive binding of alkali metal ions to
the polar groups of egg-lecithin has been detected in the Na23 NMR study
of Persson, Lindblom and Lindman (1974). Furthermore, the chemical
nature of the polar groups of the lipid determines what effects ions in
the external aqueous phase have on the structure of lipids aggregates
(Sacre and Tocanne, 1977). Therefore it was of interest to see whether
binding of monovalent cations ions had any effects on the ordering of
lipid molecules in egg-lecithin bilayers.
Dielectric measurements of the effects of monovalent ions on the
capacitance of single planar lipid bilayers have been relatively few and
all reported measurements have been on bilayers containing undetermined
concentrations of n-alkane solvent ( eg. Hanai Haydon and Taylor, 1964,
Coster and Simons, 1970 and Ohki, 1970). Further, almost all the
reported measurements were carried out using two ter@inal impedance
measuring methods where it is difficult to separate the
105
electrode-solution impedance frora that of the membrane plus
electrode - solution interface.
those studies were raeasured at
Further,
frequencies
the membrane capacitances in
over 100 Hz. At these
frequencies the impedance of the external electrolyte was a significant
fraction of the measured total impedance; especially at the lower ion
concentrations eraployed in those studies.
Hanai et al. (1964) found no significant dependence of membrane
capacitance on the external ion concentration for bilayers for@ed from
egg-lecithin - n-decane solutions in electrolytes with concentrations
ranging from .001 - 4.18 M NaCl. White (1973) measured the effect of
varying external ion concentrations on the capacitance of GMO bilayers
formed from n-decane solutions. The capacitance of these membranes was
consistent with that predicted by the Gouy-Chapman theory for a
bilayer - electrolyte syste~ with a sraall concentration of charge fixed
at the membrane - aqueous interface. Coster and Smith (1974), using a
four terminal impedance measuring technique reported an increase in the
capacitance, measured at a frequency of lHz, of egg-lecithin -
n-tetradecane bilayers with increasing KCl concentrations in the aqueous
phase. However, the exact interpretation of these results was uncertain
as the n-tetradecane concentration in these bilayers was unknown.
In this study of the effects of ions on lipid bilayers, solventless
egg-lecithin and GMO bilayers have been employed as these eliminated the
need to account for varying solvent concentrations in the bilayer. GMO
bilayers in the present study were formed from squalene solutions as
these bilayers have been found to contain negligible squalene
concentrations (Simon et al., 1977 and White, 1978).
106
The alkane solubility in the acyl chain region of lipid bilayers is
sensitive the the entropy of the acyl chains (see Chapter 5). The
alkane solubility in egg-lecithin bilayers has been used as a means of
detecting possible changes in the structure of the hydrophobic region of
bilayers due to ion - lipid interactions at the choline phosphate polar
head groups.
Dielectric studies of egg-lecithin bilayers containing oxidised
cholesterol and n-tetradecane showed that oxidized cholesterol increased
the bilayer capacitance (Ashcroft, 1979). This was confir@ed in the
present study for solventless bilayers (see previous chapter). This
result i~plies that cholesterol decreased bilayer thickness. However,
X-ray diffraction studies on lipid multilayer preparations by ~lclntosh
( 1978) shm'led that cholesterol increases the thickness of bilayers in
the liquid crysta 11 i ne state. The apj)arent discrepancy between these
two findings will be riiscussed later in this chapter.
The aim was to measure the effects of different ion concentrations
and ion species on the dielectric and charge storage properties of
solventless egg-lecithin and GMO bilayers using low frequency impedance
measurements. The results have been interpreted in terms of the
predictions of the Gouy-Chapman theory apj)lied to the
membrane - electrolyte syste@.
Though GMO is rarely found in biological merabranes the use of GMO
in forming bilayers in this study conveys several advantages. For
example, GMO readily forras bilayers with stable electrical properties
over a wide range of electrolyte concentrations.
107
While the effect of ionic double layers have been discussed in
regard to their effects on the bilayer capacitance (eg. see Everitt and
Haydon, 1968 and Smith, 1977), as yet no complete theoretical treatment
of the impedance of ionic double layers near the electrostatic dipoles
of egg-lecithin has been made. Thus the effect of the electrostatic
dipoles of egg-lecithin on the capacitance of the ionic double layers is
largely unknown. GMO molecules are electrically neutral, with a
negligible electrostatic dipole field. This allows a simpler
interpretation to be made of the effects of ions on the capacitance of
GNO membranes on the basis of the Gouy-Chapman theory.
o.2 PREL114INARY THEORETICAL CONSIDERATIONS
The theoretical examination of the dielectric model of lipid
raembranes in section 2.42 showed that when an external potential
difference is applied across the membrane during impedance measurements
part of the potential difference will appear across the external aqueous
phase. As a consequence of this, ionic double layers exist at the
membrane - solution interface and these have a capacitance and
conductance that acts in series with the dielectric impedance of the
bilayer. The total membrane capacitance, Cm, is given by:
C - + { 1 2 }- I
m- "toi Si 6. 1
The dielectric capacitance, CD of the bilayer is given by:
E E o m
6.2
108
\·Jhere "E " is the dielectric constant of the membrane. The m
capacitance of the ionic double layers, 11.' on each side of the membrane
when there is an electrostatic potential at the membrane surface,t , (in 0
the absence of an externally applied field ie. t =0) is given by:-a,
6.3
Where "z" is the ion valency, "Ew", the dielectric constant of
water and ">. ", the Debye 1 ength in the aqueous phase. The membrane
surface potential can be related to the bound charge at the
membrane surface, as, using the following expression:
6.4
When there is no net bound surface charge equation 6.1 reduces to:-
At this point it is necessary to draw a distinction between bound
charges and those involved in electrostatic screening of membrane
surface potentials.
At equilibrium the electrochemical potential of both mobile and
bound ions is equal. The electro-chemical potential,µ, is given by:
6.6
\Jhere "v(x)"is the coulomb electrostatic potential and c is the ion C
concentration. An ion is considered as being at a bound-site when the
standard chemical potential , µ 0 , of that ion is less than that in the
109
bulk aqueous phase. The difference in standard chemical potential
between bound and mobile ions is the binding energy which could arise
from che~ical bonding or ion-specific electrostatic interactions (eg.
see Eisenman, 1961 and D'Arrigo 1978).
In this chapter three models describing charge binding to lipid
bilayers are considered; namely:
1) The concentration of bound charge at the membrane surface is
constant regardless of the electrolyte concentration.
2) The raain ion species in the electrolyte (~ajority ions) bind to the
membrane.
3) The binding-ion concentration in the electrolyte is small (minority
ions) and is independent of the electrolyte concentration (binding due
to im~urities in the electroly~ or the membrane Torus).
The variation of the ionic double layer capacitance with
electrolyte concentration for models 2 and 3 will now be calculated.
Provided the absorption of ions onto the surface of lipid bilayers
can be described by the Langmuir adsorption isotherm the bound charge
density on the membrane surface is given by:
ln 0 8 ~µo lj,
= ln cf - - q O + ln o ~ 7<T m 6.7
Provided 0 8 «oM
110
Where "°s' is the bound charge density and "oM" is the bound charge
density, when all the binding sites are occupied. "cf" is the 0
binding-ion concentration in the electrolyte and "Liµ" is the standard
chemical potential difference between ions in the bound and free states.
Substituting ~0 from equation 6.4 into equation 6.7 leads to the
following expression.
6.8
I:, 0
Kl = ---h- + ln oM 6.9
1ihere "Kl" is a constant. liowever if the bound charge does not
originate from the majority ions in the electrolyte and the
concentration of the impurity ions, either in the electrolyte or
~eLlbrane torus, does not vary with the electrolyte concentration then
one can write the following expression:
6.10
I:, 0 K2 = - kT + 1 n OM + 1 n cf 6.11
~~here "K2" is a constant. The surface charge density for cases 2
and 3 was determined from the solutions to the transcendental equations
(o.8 and 6.11). This was done using a graphical technique for different
electrolyte concentrations and different values of Kl and K2. The
membrane surface potential and double layer capacitance was then
calculated at each electrolyte concentration using equations 6.3 and
6.4. The solutions to these equations are presented and discussed in
section S.5.
111
6.3 METHODS
Glycerol Monooleate bilayer membranes were formed at 20°c from
squalene solutions using the film drainage technique described in
Chapter 4. Glycerol monooleate was obtained from two sources; from
Sigma chemical company (>99% pure) as well as from Nu-Chek (>99% pure).
Egg-lecithin bilayers were generated from n-hexadecane and
n-dodecane solutions at 40°C (10 ~M with respect to lecithin).
~easurements of capacitance reported in this chapter where made at a . 0
frequency of lHz and at temperatures in the range 20-30 C.
Bilayers were also for~ed from egg-lecithin and cholesterol
mixtures. Two different forms of cholesterol were used; oxidised
cholesterol (95% purity) and unoxidised cholesterol (>99% pure).
6.4 RESULTS
5.41 Glycerol ,,ionooleate i3ilayers
GMO bilayers formed rapidly fror,1 thick Gi;Q -squalene fili:ls; the
bilayers attaining equilibrium uith the torus within 5 minutes. The
appearance of the films during thinning was independent of the
concentration and ion type in the external electrolyte over
concentrations ranging from .l mM to 4 M. The life-time of these
bilayers was quite short; rarely exceeding 15 minutes.
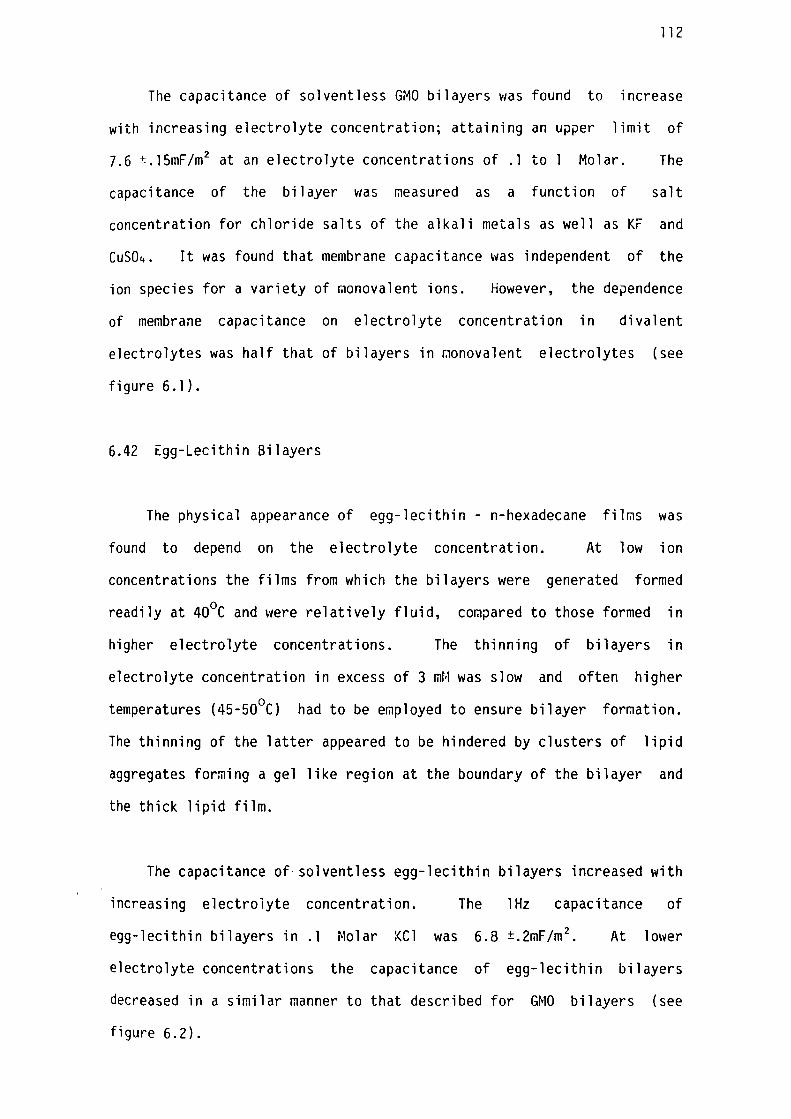
112
The capacitance of solventless G~O bilayers was found to increase
with increasing electrolyte concentration; attaining an upper limit of
7.6 ±. 15mF/m2 at an electrolyte concentrations of .l to Molar. The
capacitance of the bilayer was measured as a function of salt
concentration for chloride salts of the alkali metals as well as Kr and
cuso ... It was found that membrane capacitance was independent of the
ion species for a variety of monovalent ions. However, the dependence
of membrane capacitance on electrolyte concentration in divalent
electrolytes was half that of bilayers in ~onovalent electrolytes (see
figure 6.1).
6.42 Egg-Lecithin Bilayers
The physical appearance of egg-lecithin - n-hexadecane films was
found to depend on the electrolyte concentration. At low ion
concentrations the films from which the bilayers were generated formed
readily at 40°C and were relatively fluid, compared to those formed in
higher electrolyte concentrations. The thinning of bilayers in
electrolyte concehtration in excess of 3 mM was slow and often higher 0 temperatures (45-50 C) had to be employed to ensure bilayer formation.
The thinning of the latter appeared to be hindered by clusters of lipid
aggregates forming a gel like region at the boundary of the bilayer and
the thick lipid film.
The capacitance of· solventless egg-lecithin bilayers increased with
increasing electrolyte concentration. The lHz capacitance of
egg-lecithin bilayers in .1 Molar KCl was 6.8 ±.2mF/m 2 • At lower
electrolyte concentrations the capacitance of egg-lecithin bilayers
decreased in a similar manner to that described for GMO bilayers (see
figure 6.2).
8 I
C'\,j
~ 7 ~ Ll.J (J
<'. ~ -(J
~ ~ (J 6
GMO/
t
t 10-
SQUALENE
t
t
t 'i
t
10-
ELECTROLYTE
I t
10-
CONCENTRATION
t
10-1
t 1 f
1 10
Mo! /m3
/
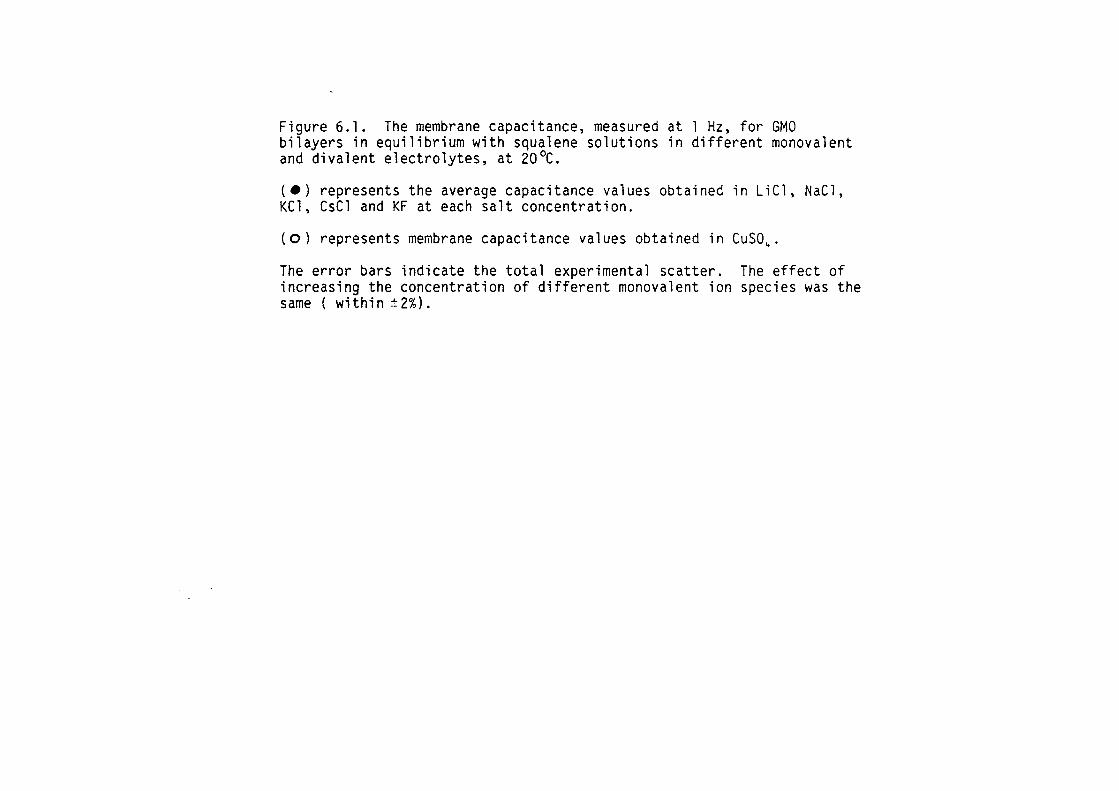
Figure 6.1. The membrane capacitance, measured at 1 Hz, for GMO bilayers in equilibrium with squalene solutions in different monovalent and divalent electrolytes, at 20°C.
(e) represents the average capacitance values obtained in LiCl, NaCl, KCl, CsCl and KF at each salt concentration.
( o) represents membrane capacitance va 1 ues obtained in CuS0 4 •
The error bars indicate the total experimental scatter. The effect of increasing the concentration of different monovalent ion species was the same ( within ±2%).
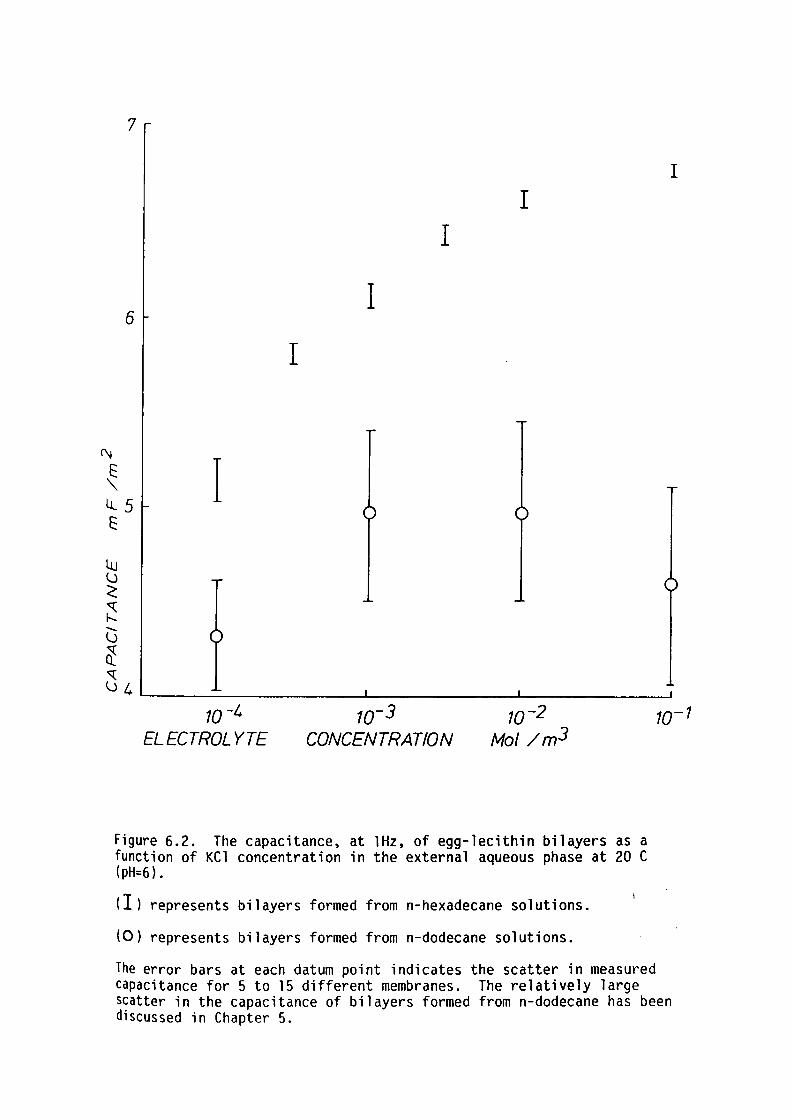
Lu (J <'. ~ ...... (J ~ "(
7
6
I
I
I I
I
I
(J4~----------~-------~------~ 10-4
ELECTROLYTE 10-3
CONCENTRATION
Figure 6.2. The capacitance, at lHz, of egg-lecithin bilayers as a function of KCl concentration in the external aqueous phase at 20 C ( pH=6) .
(!) represents bilayers formed from n-hexadecane solutions.
(0) represents bilayers formed from n-dodecane solutions.
The error bars at each datum point indicates the scatter in measured capacitance for 5 to 15 different membranes. The relatively large scatter in the capacitance of bilayers formed from n-dodecane has been discussed in Chapter 5.
113
The capacitance of egg-lecithin bilayers formed from n-dodecane
solutions of the lipid also showed a dependence on the ion concentration
(see figure 6.2). However, the dependence was less significant than
those of solventless bilayers (the scatter in the results greatly
increased when n-dodecane was present in the bilayer). This was due to
non-reproducibility in the measured mole fractions of n-dodecane in the
hydrophobic bilayer interior (see discussion in Chapter 5).
The mole fraction of the alkane in the bilayer phase was determined
from the meabrane capacitance (see Chapter 5). The mole fraction of
n-dodecane in egg-lecithin bilayers at 20°c was in the range 20-40%.
Figure 6.3 shows the measured mole fraction of n-dodecane at different
l t l t t t . t t t of 20°c. e ec ro ye concen ra ions a a empera ure The data in figure
6.3 indicates that the n-dodecane mole fraction in the bilayer at 100 mM
KCl was approximately 100% higher than that at low ion concentrations at
the same temperature.
6.43 Egg-lecithin Bilayers Containing Cholesterol
The capacitance of egg-lecithin bilayers containing cholesterol
(50% raole fraction) was measured for KCl concentrations in the range
. l m:~ to 10 mM. Oxidized cholesterol (50% mole fraction) significantly
increased the capacitance of egg-lecithin bilayers at low electrolyte
concentrations. The magnitude of the effect decreased with increasing
ion concentration until at 10 mN concentration the addition of oxidised
cholesterol had no measurable effect on membrane capacitance. However,
the presence of pure cholesterol in egg-lecithin membranes (50% mole
fraction) decreased the membrane capacitance at low electrolyte
concentrations and the magnitude of the effect Has not reduced at higher
electrolyte concentrations (see figure 6.4).
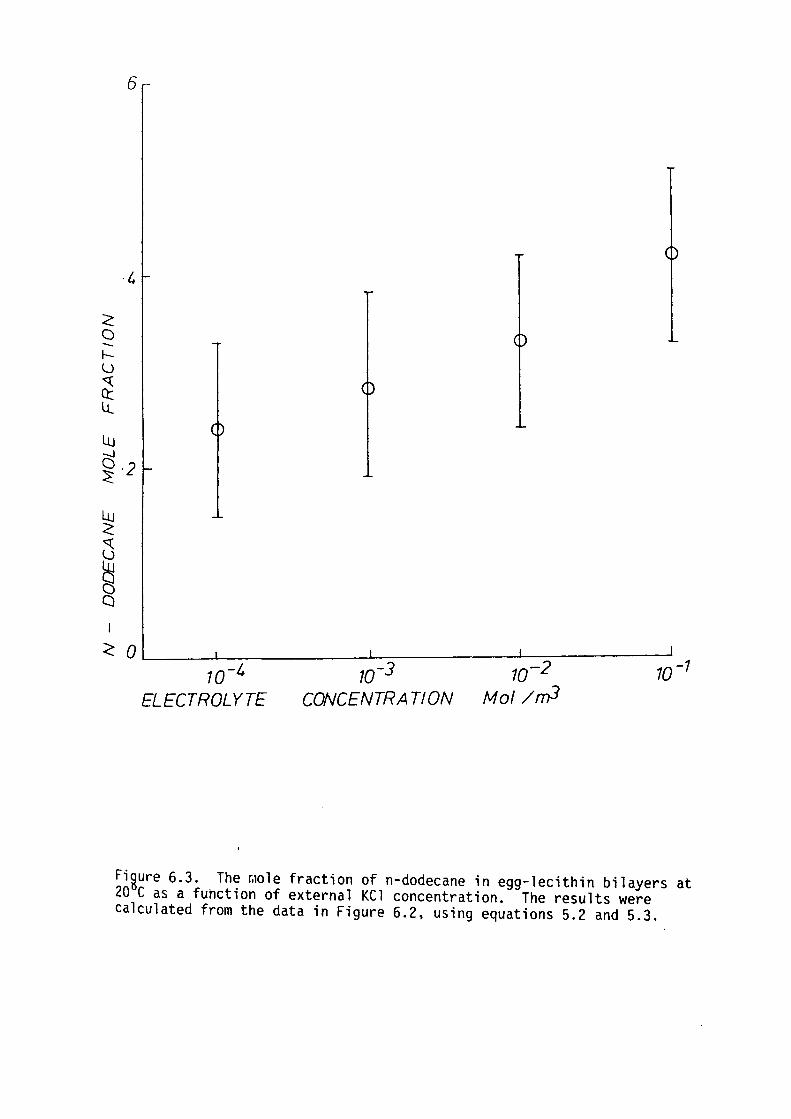
6
·4
< a --1--lJ ~ a: LL
UJ -.J
~-2
<: 0 L__----1...----:-----~~---___.L~2-----::10-1 1 o-t 10-3 10-
ELECTROLYTE CONCENTRATION Mo/ /rr,3
Fi~ure 6.3. The r,1ole fraction of n-dodecane in egg-lecithin bilayers at 20 Casa fuhction of external KCl concentration. The results were calculated from the data in Figure 6.2, using equations 5.2 and 5.3.
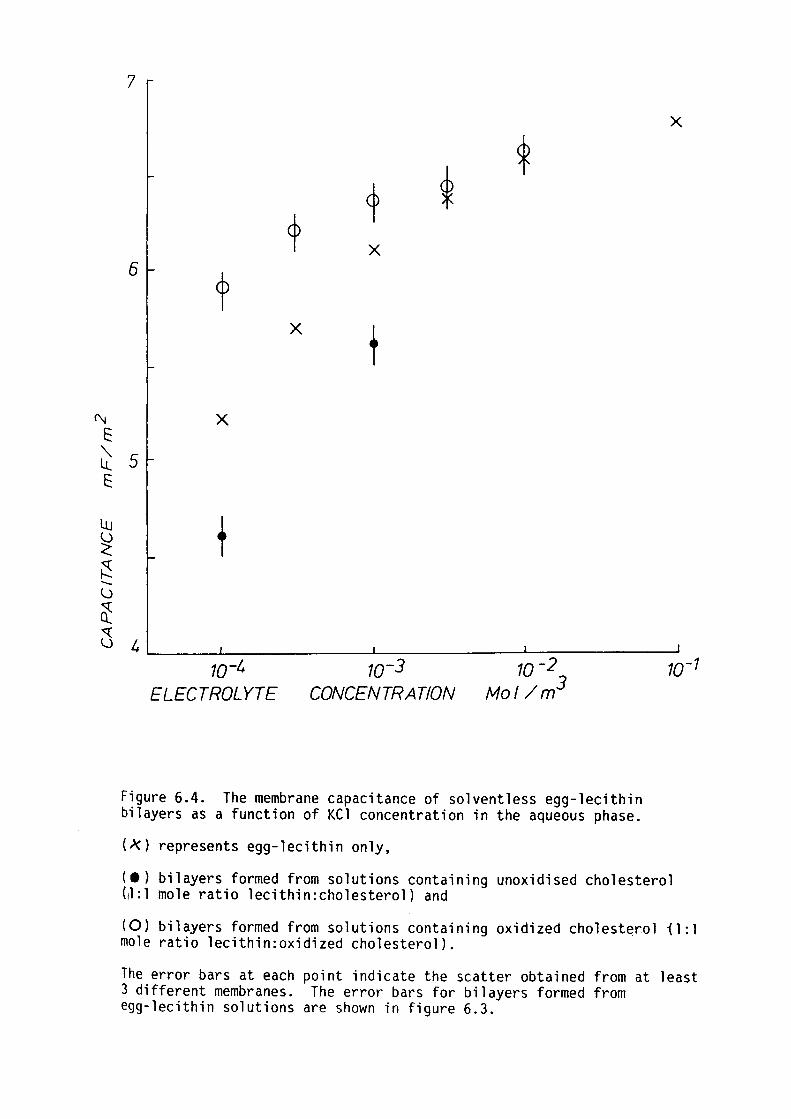
(\j
E:
" Lt. E:
Lu
~ ~ ..._ u ~ ~
7
X 6
X t X
5
4 10-l 10-3 10-2
ELECTROLYTE CONCENTRATION Mo! /m3
Figure 6.4. The membrane capacitance of solventless egg-lecithin bilayers as a function of KCl concentration in the aqueous phase.
( )() represents egg-1 ecithi n only,
X
10-1
(e) bilayers formed from solutions containing unoxidised cholesterol (~:l mole ratio lecithin:cholesterol) and
(0) bilayers formed from solutions containing oxidized cholesterol il :l mole ratio lecithin:oxidized cholesterol).
The error bars at each point indicate the scatter obtained from at least 3 different membranes. The error bars for bilayers formed from egg-lecithin solutions are shown in figure 6.3.
114
6.5 DISCUSSION
6.51 Effect of Ions on Bilayer Structure
The presence of ions in the aqueous phase had significant
observable effects on the for~ation of egg-lecithin bilayers. This
observation suggests that the configuration of lipids in the bilayer may
have been affected by interactions between the charged groups of the
egg-lecithin raolecules and the mobile ions in the electrolyte.
Inferring ion dependent structural changes in solventless
egg-lecithin bilayers from changes in the raembrane capacitance was
difficult because variations in the ionic double layer capacitance was
by far the most predominant effect (this will be shown in later sections
of this chapter). However, measurement of the alkane absorption into
lipid bilayers was not bedeviled by the effects of ionic double layer
capacitances. Changes in the ordering of lipids in the bilayer should
be reflected in changes in the partitioning of n-alkane raolecules
between the bilayer and torus. It was concluded (see Chapter 5) that
this should be a sensitive indicator of structural changes in the
hydrophobic region.
The experimental scatter rendered it difficult to detect relative
changes in the alkanes absorption much less than 50%. At. l M KCl the
alkane absorption showed an increase but it was difficult to say how
significant this increase was due to large experimental scatter. In any
case the effect that ions, at 100 raM concentration in the aqueous phase,
had on the absorption of alkane into egg-lecithin bilayers was small
compared to the large changes re~orted in Chapter 5. Thus it appears
that the presence of ions in the aqueous phase does affect lipid
115
ordering in bilayers. However, the effect on membrane ordering is
relatively small compared to that due to changes in temperature or
~embrane composition. Therefore it is not unreasonable to assume that
the effect of varying ion concentrations on membrane thickness is small
at ion concentrations less than 100 ml1.
Presented here is a tentative explanation of how it is possible
that ions can significantly effect the formation of egg-lecithin
bilayers without effecting the final bilayer st~ucture. Egg-lecithin
being sparingly soluble in n-alkane solutions, exists mainly in
mono-disperse aggregates which may be repelled by electrostatic forces.
At high ion concentrations the repulsive forces between neighbouring
aggregates are screened by the mobile ions in the electrolyte thus
allowing them to cluster. However, the distance between adjacent lipids
is much smaller than between aggregates so at these ion concentrations
the charge screening between individual lipids is negligible.
6.52 The Capacitance of the Ionic Double Layers
Considering the total capacitance of the membrane solution system,
as predicted by equation 6.1, it can be seen that at high electrolyte
concentrations the effect of ionic double layers on the total membrane
capacitance is small (since the double layer capacitance is large).
Thus at high electrolyte concentrations the membrane capacitance is
approximately equal to the dielectric capacitance of the bilayer. I
Inspection of figures 6.1 and 6.2 shows that the membrane capacitance
does approach an upper limit at high electrolyte concentrations as
expected from the Gouy-Chapman theory. At 100 mM KCl the membrane
capacitance approximates to within 2% the dielectric capacitance of the
bilayers.
116
At 1ow ion concentrations the ionic double layer capacitance is
small and hence this could significantly reduce the total membrane
capacitance. Provided the raembrane thickness and hence the dielectric
capacitances of solventless egg-lecithin and GMO bilayers are
indepenGent of electrolyte concentration then one can calculate the
capacitance of the ionic double layers by subtracting dielectric
capacitance from the total membrane capacitance as follows:
~/here "Cm" and "Cot are the membrane capacitance and ionic double
layer capacitance at an electrolyte concentration, c0 , and "Coo" is the
~embrane capacitance at high electrolyte concentrations (assuming c0~ C00 ).
The ionic double layer capacitances calculated on the basis of
equation 6.10 for egg-lecithin and GMO bilayers at different electrolyte
concentrations are shown in figure S.5. Comparing the measured double
layer capacitances to the predictions of the Gouy-Chapman theory (refer
to equations 6.2 and 6.3) in figure 6.5 shows that the results
significantly deviated from that expected for a neutral membrane or a
merabrane that possessed a constant bound charge. Therefore it appears
that the membrane possessed a bound charge that varied with the ion
concentration in the aqueous phase.
1 Alternatively it may be said that the deviation of the double layer
capacitance from that expected for a neutral membrane was due to an
underestimate of the dielectric constant of the aqueous phase adjacent
to the bilayer. This can be discounted as the dielectric constant of
the aqueous phase would need to be 320 at distances up to 30 nm from the
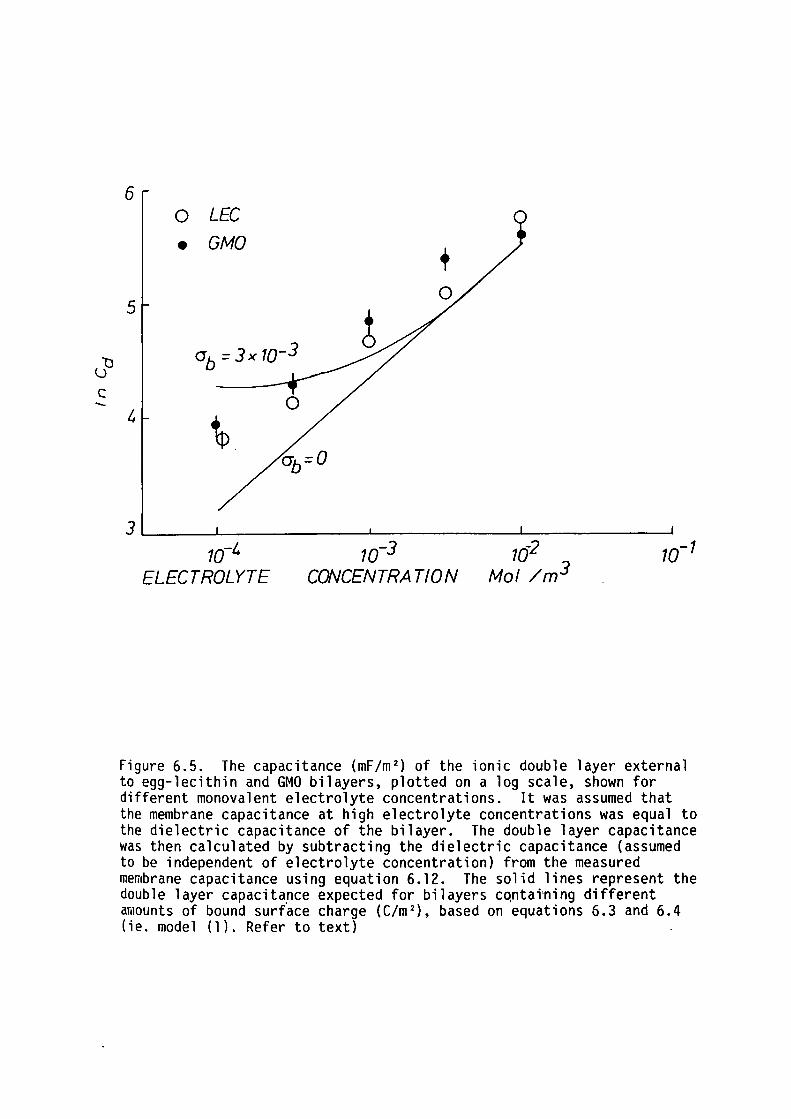
01)
C --
6 0 LEC
• GMO +
5
<Jb = 3x 10⁻³
4 \
3 L--__ _._ _______ ...__ ______ ___._ ______ ____.
10-4
ELECTROLYTE 10-1
CONCENTRATION
Figure 6.5. The capacitance (mF/m 2 ) of the ionic double layer external to egg-lecithin and GMO bilayers, plotted on a log scale, shown for different monovalent electrolyte concentrations. It was assumed that the membrane capacitance at high electrolyte concentrations was equal to the dielectric capacitance of the bilayer. The double layer capacitance was then calculated by subtracting the dielectric capacitance (assumed to be independent of electrolyte concentration) from the measured membrane capacitance using equation 6.12. The solid lines represent the double layer capacita_nce expected for bilayers cqntat-ning different amounts of bound surface charge (C/m 2 ), based on equations 6.3 and 6.4 (ie. model (1). Refer to text)
117
bilayer surface. The reorienting of water near the lipid polar moieties
in lipid bilayers should tend to reduce the dielectric constant of the
electrolyte in the immediate vicinity of the membrane surface.
Alternatively the presence of an electrostatic dipole field near
the membrane surface would produce a membrane surface potential higher
than that predicted by equation 6.4. Thus the ionic double layer
capacitance will be higher than that expected for a bilayer with zero
net charge. Considering the molecular structure of GMO and egg-lecithin
{see figure 7.6) it can be seen that the charge separation within the
electrostatic dipoles of egg-lecithin is about .4 nm, whereas GMO has no
charged groups. Thus it is clear that the electrostatic dipole
potential near the membrane surface in these two bilayer systems should
be vastly different. However, the results in figure 6.5 show that the
double layer capacitances in series with GMO and egg-lecithin bilayers
were about the same, indicating that the dipole potential of the choline
phosphate groups of egg-lecithin had little effect on the double layer
capacitance.
This is not surprising as the effect of electrostatic dipoles
should only be important when the Debye length in the electrolyte is
similar to the se?aration of the discrete charges (Cole, 1969). At low
concentrations where the ionic double layers contribute significantly to
the membrane capacitance the Debye length is about 10nm which is much
larger than the discrete charge separation. However, at concentrations '
where the Debye length is similar to the charge separation I in· the
choline phosphate groups (ie where the effect of electrostatic dipoles
cannot be ignored) the capacitance of the ionic double layers was large
and did not contribute significantly to the total membrane capacitance.
Thus if a deviation from the Gouy-Chapman theory did occur at high
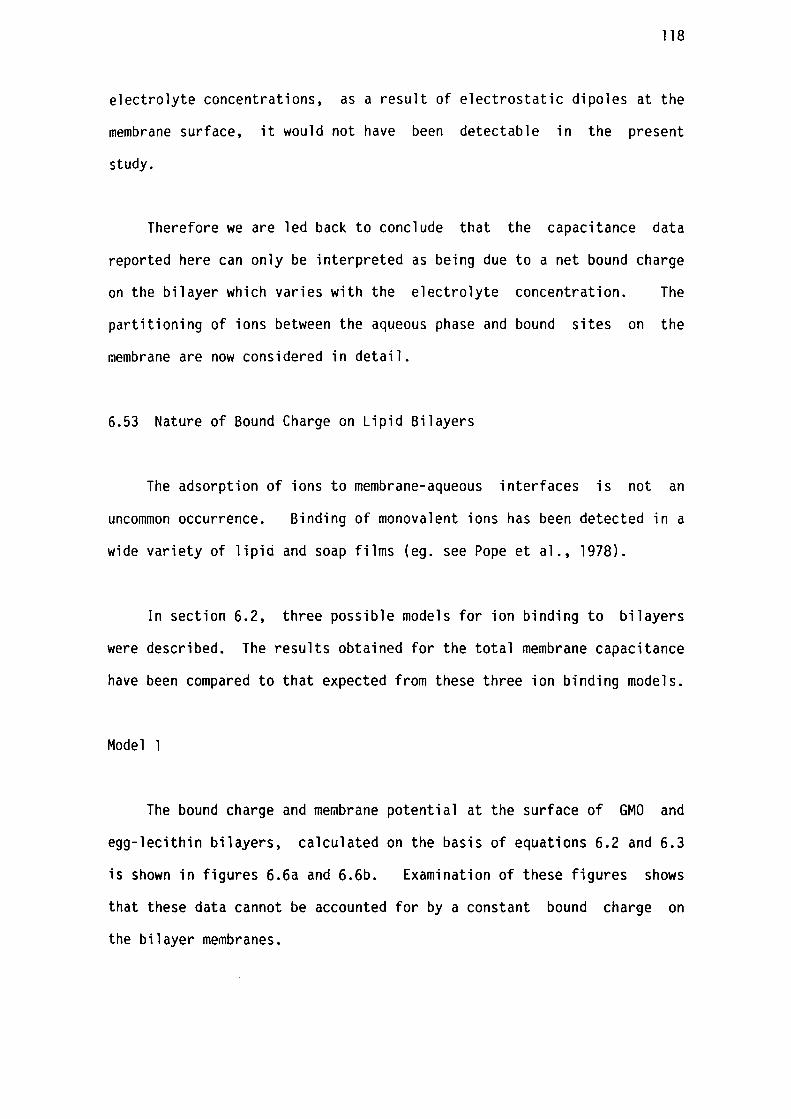
118
electrolyte concentrations, as a result of electrostatic dipoles at the
membrane surface, it would not have been detectable in the present
study.
Therefore we are led back to conclude that the capacitance data
reported here can only be interpreted as being due to a net bound charge
on the bilayer which varies with the electrolyte concentration. The
partitioning of ions between the aqueous phase and bound sites on the
membrane are now considered in detail.
6.53 Nature of Bound Charge on Lipid Bilayers
The adsorption of ions to membrane-aqueous interfaces is not an
uncommon occurrence. Binding of monovalent ions has been detected in a
wide variety of lipid and soap films (eg. see Pope et al., 1978).
In section 6.2, three possible models for ion binding to bilayers
were described. The results obtained for the total membrane capacitance
have been compafed to that expected from these three ion binding models.
Model 1
The bound charge and membrane potential at the surface of GMO and
egg-lecithin bilayers, calculated on the basis of equations 6.2 and 6.3
is shown in figures 6.6a and 6.6b. Examination of these figures shows
that these data cannot be accounted for by a constant bound charge on
the bilayer membranes.
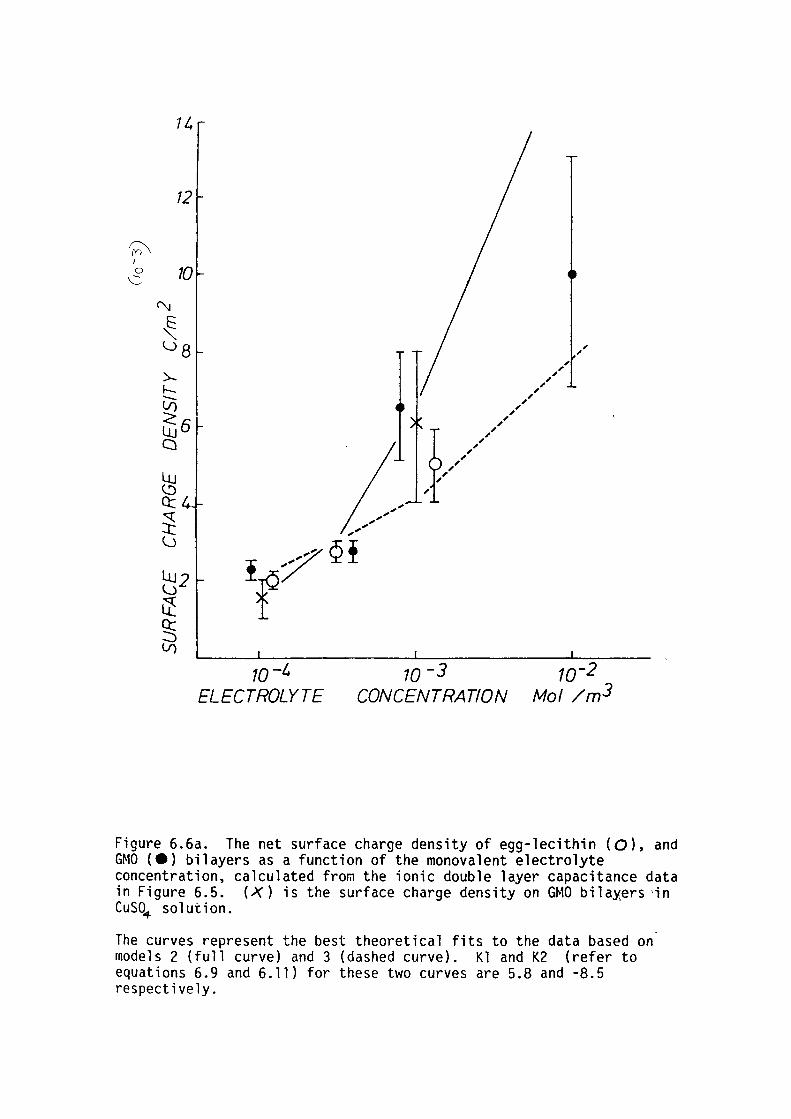
1 L,
12
10-4 ELECTROLYTE
, ,, ,,
, ,
,,,,,,'
J/,/
10-3 CONCENTRATION
10-2 Mo/ /m3
Figure 6.6a. The net surface charge density of egg-lecithin (O), and GMO (e) bilayers as a function of the monovalent electrolyte concentration, calculated from the ionic double layer capacitance data in Figure 6.5. (X) is the surface charge density on GMO bila;;ers ·in CuS04 solution.
The curves represent the bes~ theoretical fits to the data based on models 2 (full curve) and 3 (dashed curve). Kl and K2 (refer to equations 6.9 and 6. 11) for these two curves are 5.8 and -8.5 respectively.
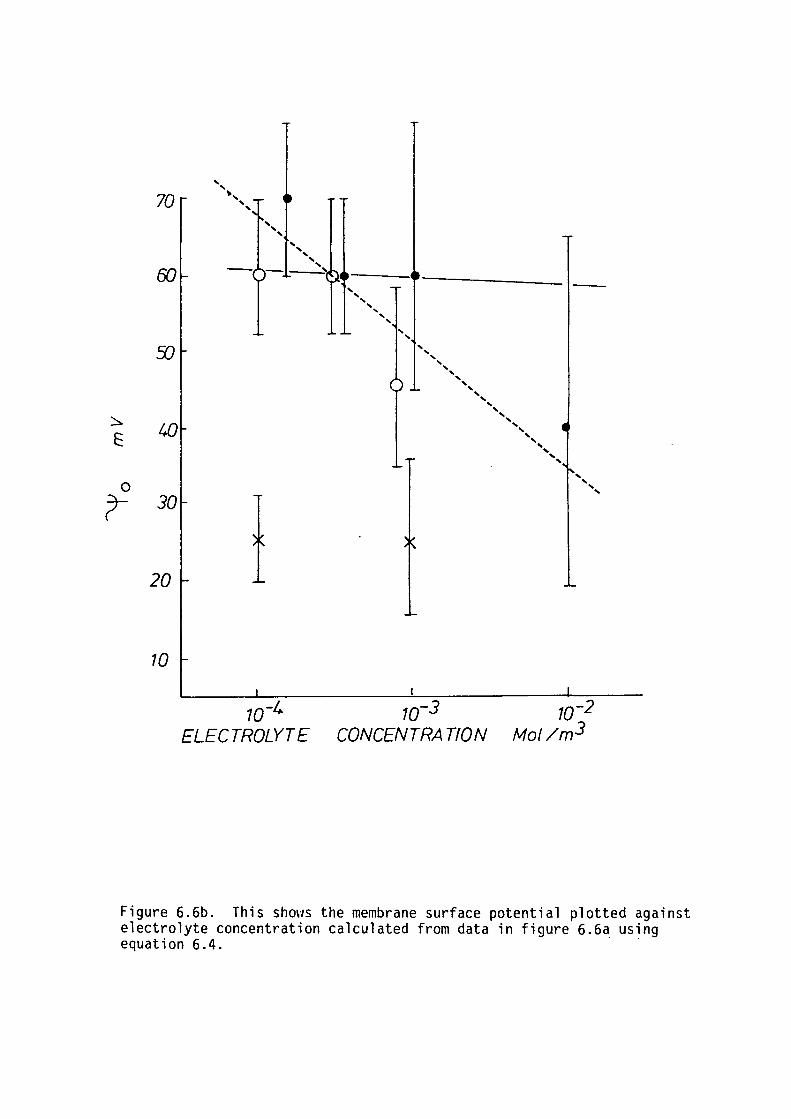
70
60
0
( 30
20
10
' ' ", ' '
',,
10-4 ELECTROLYTE
' ' ' ' ' ' ' ' ' ', ',
',, ',
10-1 CONCENTRATION
',, .. , ',
' ', '
Figure 6.6b. This shows the membrane surface potential plotted against electrolyte concentration calculated from data in figure 6.6a using equation 6.4. ·
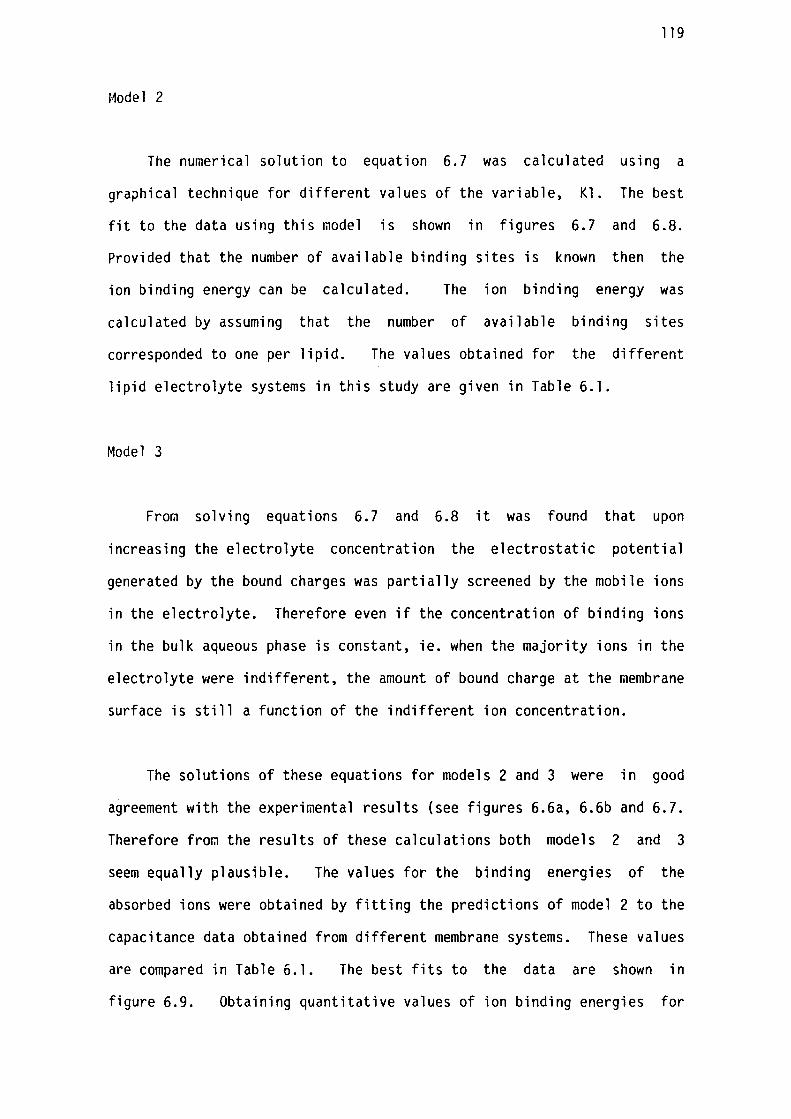
119
Model 2
The numerical solution to equation 6.7 was calculated using a
graphical technique for different values of the variable, Kl. The best
fit to the data using this model is shown in figures 6.7 and 6.8.
Provided that the number of available binding sites is known then the
ion binding energy can be calculated. The ion binding energy was
calculated by assuming that the number of available binding sites
corresponded to one per lipid. The values obtained for the different
lipid electrolyte systems in this study are given in Table 6. l.
Model 3
From solving equations 6.7 and 6.8 it was found that upon
increasing the electrolyte concentration the electrostatic potential
generated by the bound charges was partially screened by the mobile ions
in the electrolyte. Therefore even if the concentration of binding ions
in the bulk aqueous phase is constant, ie. when the majority ions in the
electrolyte were indifferent, the amount of bound charge at the membrane
surface is still a function of the indifferent ion concentration.
The solutions of these equations for models 2 and 3 were in good
agreement with the experimental results (see figures 6.6a, 6.6b and 6.7.
Therefore fro~ the results of these calculations both models 2 and 3
seem equally plausible. The values for the binding energies of the
absorbed ions were obtained by fitting the predictions of model 2 to the
capacitance data obtained from different membrane systems. These values
are compared in Table 6.1. The best fits to the data are shown in
figure 6.9. Obtaining quantitative values of ion binding energies for
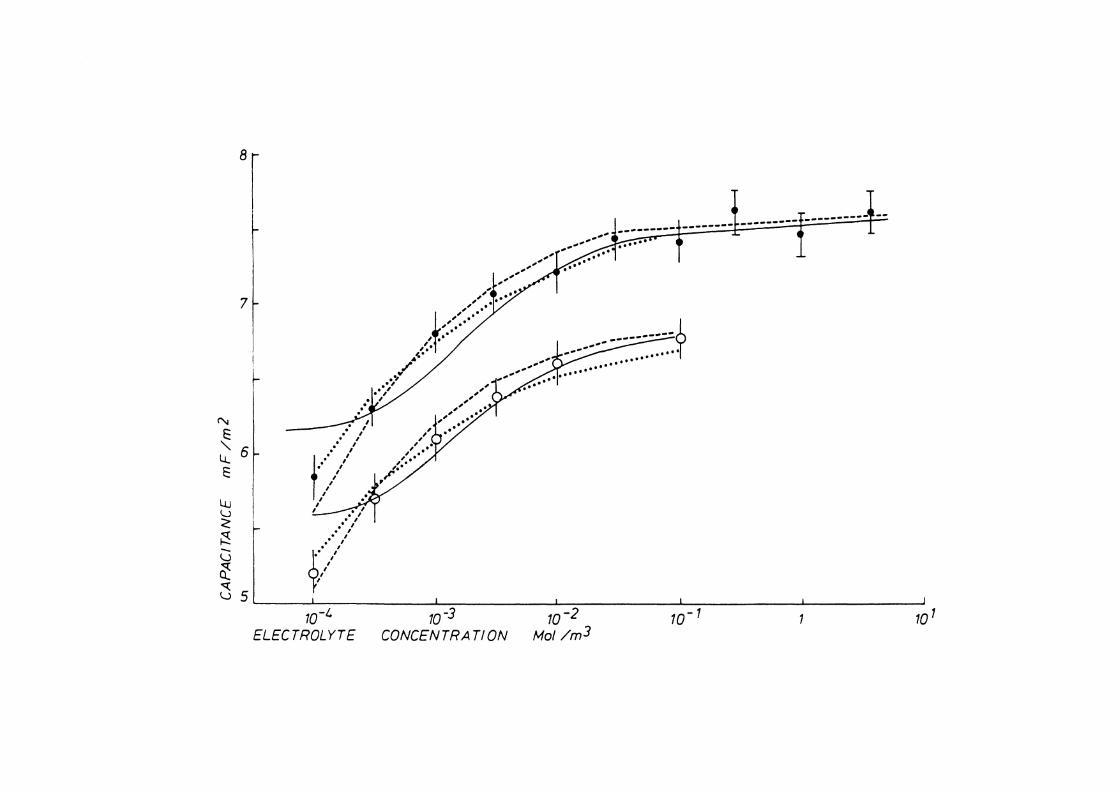
co
I I I I I I I I I I I I I I I I I I I I I I I I I I I
...... . _............ :::>, ..
··---~:',..................... ·· ................ .... ...
-~
(Q
cW/.::JW
l/)
3JN
'v'1IJ'v'd
VJ ..... I a .....
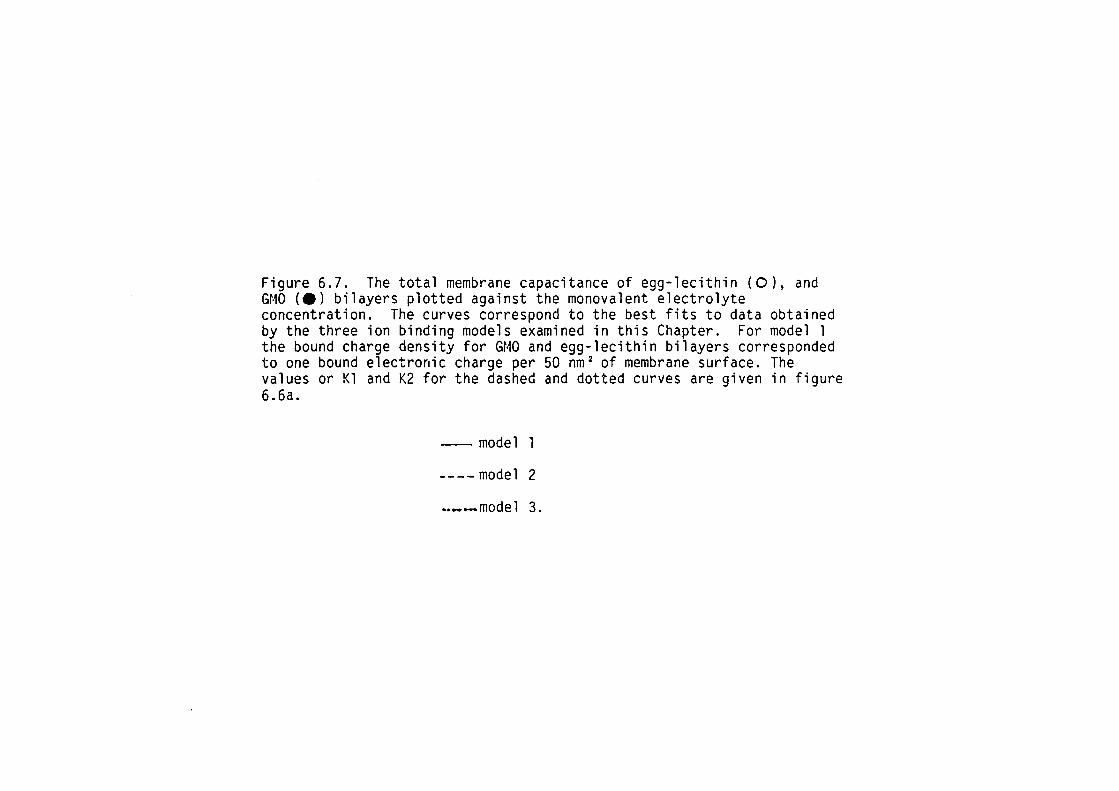
Figure 6.7. The total membrane capacitance of egg-lecithin (0), and GMO (e) bilayers plotted against the monovalent electrolyte concentration. The curves correspond to the best fits to data obtained by the three ion binding models examined in this Chapter. For model l the bound charge density for GMO and egg-lecithin bilayers corresponded to one bound electronic charge per 50 nm 2 of membrane surface. The values or Kl and K2 for the dashed and dotted curves are given in figure 6.6a.
-- model l
----model 2
• ... -model 3.
C'\j
~ i ~
8
7
6
<'. 5 § l.)
~ 0
T
70-1. 10-.1 10-ELECTROLYTE Ca'I/CENTRATION Mol/m3
10- 1 10
Figure 6.8. A summary of the membrane capacitance data presented in this Chapter. This is compared to the predictions of model 2 (solid lines). The membrane surface potential, surface charge and bilayer dielectric capacitance derived from fitting this charge binding model to the membrane are given in Table 6.1.
(-&) GMO in Cu SO .. (•) GMO in monovalent electrolytes (e) Egg-lecithin in KCl (D) Egg-lecithin and unoxidised cholesterol (1:1 mole ratio) in KCl. (0) Egg-lecithin and oxidized cholesterol (1 :1 mole ratio) in KCl.
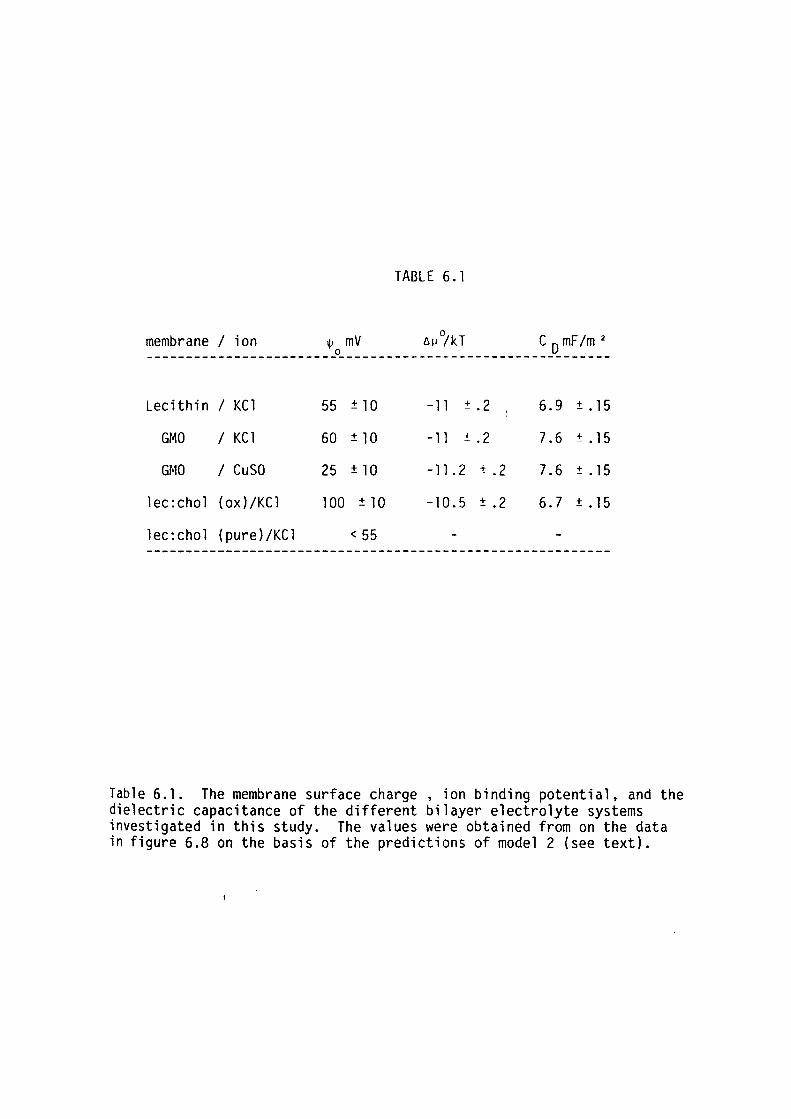
TABLE 6. l
membrane / ion "' mV tiµ 0/kl C O mF /m 2
- - - --- - - - - -- -- - ---- - - - - 0 - - - - - - - - - - - - - - - - - - - - - - - - - - -- - - - --
Lecithin I KCl 55 ±10 -11 ± • 2 6.9 ± • 15
GMO I KCl 60 ±10 -11 ± .2 7.6 ± • 15
GMO I CuSO 25 ± 10 -11 .2 ± .2 7.6 ± • 15
lec:chol (ox)/KCl 100 ±10 -10.5 ± .2 6.7 ± • 15
lec:chol (pure)/KCl < 55
Table 6.1. The membrane surface charge , ion binding potential, and the dielectric capacitance of the different bilayer electrolyte systems investigated in this study. The values were obtained from on the data in figure 6.8 on the basis of the predictions of model 2 (see text).
120
~odel 3 was difficult as the concentration of the binding ions, if any,
were unkno\'m.
If the surface charge on the lipid bilayers was due to the presence
of impurities in the lipid samples during isolation then one would
expect the quantity and nature of the impurities to vary significantly
between lipid samples from different supply companies. The results show
that there was no variation in the capacitance of bilayers formed from
GMO obtained from two different sources.
Alternatively binding of alkali metal cations from the electrolyte
may be occurring. Selective cation binding to lipid bilayers has been
detected in many studies (eg. see Persson et al., 1974). However, no
similar species dependence in ionic double layer capacitance was
apparent in G~lO bilayers nor was~i-~) any significant difference
between ion binding to egg-lecithin and GMO bilayers. Either the ion
binding due to alkali metal cations in this study is not species
specific or trace impurities, which may have been present in all the
experiments, were strongly absorbed onto the bilayer.
In any case it can be said that it is unlikely that the ion binding
was due to ion-ion interactions as this type of binding is strong and
highly selective for both the mobile ions and the lipid polar groups
(see Eisenman, 1961, and D'Arrigo, 1978). Therefore it is more likely
that weaker interactions such as ion dipole-dipole and induced I
dipole-dipole forces are responsible for ion adsorption onto these
bilayers.
12 l
6.54 The Effect of Cholesterol on Bilayer Ca~acitance
The substance which has become known as oxidised cholesterol
represents neither a single compound nor is it completely characterised.
However, it is extremely useful in bilayer studies as it acts as a
membrane stabilizer (see Chapter 1). Oxidised cholesterol and pure
cholesterol had opposite effects on the bilayer capacitance at low
electrolyte concentrations (see figure 6.4). At high electrolyte
concentrations the addition of oxidised cholesterol had very little
effect on the total capacitance of egg-lecithin bilayers. By comparing
the data to the numerical solutions of equation 6.7 it was found that
the effect of adding oxidised cholesterol was a marginal decrease in the
bilayer dielectric capacitance (see Table 6.1).
The surface charge density on egg-lecithin bilayers was calculated
from the ionic double layer capacitance as in previous sections.
However, as bilayers containing cholesterol are multicomponent systems
it is only possible to calculate the average ion binding energy over the
membrane surface (as the composition of the bilayer is not ~ell known).
Therefore the ion binding energies shown in Table 6.1 for bilayers
containing cholesterol only represent an average over all the bound
ions.
The presence of ~ure cholesterol (50% mole fraction) in
egg-lecithin bilayers decreased the bound surface charge density whereas
oxidised cholesterol doubled the surface charge density. Thus it
appears that either ionic impurities were present in oxidised
cholesterol that were not present in the pure sample or that ions could
bind more strongly to the some of the oxidation products of cholesterol.
122
The discrepancy between the conclusions of Ashcroft (1979) and
those of X-ray diffraction experiments (e.g. McIntosh, 1978) concerning
the effect of cholesterol on bilayer thickness was probably due to the
variations in the ionic double layer capacitance arising from the
presence of oxidised cholesterol which were unknown to Ashcroft (1979).
When the capacitance of the double layers was taken into consideration
the relative effects of cholesterol on bilayer thickness obtained from
dielectric measurements were similar to that obtained from X-ray
diffraction experiments.
6.55 Comparison With Previous Work
The values obtained for the upper limit of the capacitance of
GMO-squalene bilayers at high electrolyte concentrations were in good
agreement with those found by other workers (c.f. the present value of
7.6 ±. l5mF/m 2 \tith the value of 7.45 ± .24mF/m 2 (Benz et al., 1975, and
7.78 ± .005mF/m 2 (White, 1978)).
Previous measurements of capacitance as a function of electrolyte
concentration (White, 1973) of bilayers formed from GMO - n-decane
solution were consistent with the membrane having a bound surface charge
which was independent of ion concentration in the electrolyte. ~Jhi te
(1973) attributed this bound charge to the presence of ionic impurities
in the membrane forming solution or electrolyte. The results reported
here are different to those reported by White (1973) in that the I
variation of membrane capacitance with increasing ion concentration was
smaller and was consistent with a varying bound surface charge.
The capacitance of egg-lecithin bilayers was also found to depend
on the ion concentration; a similar effect to that found by Coster and
123
Coster and Smith (1974) but in disagreement with the findings of
Hanai et al. (1964). The increased scatter in the capacitance
measurements when n-dodecane was present in the bilayer tended to mask
the effect of varying ion concentrations. This raay account for why the
variation of bilayer capacitance with electrolyte concentration was
unnoticed by Hanai et al. (1964) in egg-lecithin bilayers containing
high n-decane concentrations.
6.6 SUMMARY
The capacitances of solventless egg-lecithin,
egg-lecithin - cholesterol and GMO bilayers were measured at different
ion concentrations in the external aqueous phase. The results were
interpreted in terms of the Gouy-Chapman theory applied to the
bilayer-water interface.
The capacitance of bilayers in electrolyte concentrations in excess
of .1 Molar was approximately equal to the dielectric capacitance of the
bilayer. At lower concentrations the capacitance of the ionic double
layers in series with the dielectric capacitance of the bilayer reduced
the total capacitance of the membrane.
The presence of a significant mole fraction of n-alkane in the
bilayer {in this case n-dodecane) introduced experimental scatter in the
capacitance which tended to raask the effect of ions on the membrane
capacitance. This might also account for the lack of effect reported by
Hanai et al. (1964) on egg-lecithin bilayers which also contained high
concentrations of solvent.
124
The results in figure 6.3 show that the n-dodecane mole fraction in
egg-lecithin bilayers increased with the external electrolyte
concentration. However, the ion concentration dependence of n-alkane
absorption was small compared that observed for other factors studied in
Chapter 5. It was concluded that, even though the ordering of the acyl
chains was slightly altered, the thickness of egg-lecithin bilayers was
largely independent of the electrolyte concentration.
The ion dependent capacitance of GMO bilayers measured in these
experiments was different to that obtained in previous measurements by
White (1973) on GMO - n-decane bilayers obtained using a two terminal
impedance measuring technique. The capacitance of the ionic double
layers obtained in this study deviated significantly from that expected
from Gouy-Chapman theory for a neutral membrane or one that had a
constant bound surface charge.
The Gouy-Chapman theory applied to ionic double layers external to
lipid bilayers by Everitt and Haydon (1968) was extended in this study
to include the possibility of an electrolyte concentration dependent ion
binding to the membrane surface. The results obtained is this study
were consistent with a weak, non-selective binding between either
majority ions in the electrolyte or trace impurities in the electrolyte
or membrane forming solution and bilayer surface.
Oxidised cholesterol had little effect on the bilayer thickness; if
anything there was a 2-3% increase. At low ion concentrations oxidised
cholesterol and pure cholesterol had opposite effects on me~brane
capacitance. The difference in the effects of these compounds on
bilayer capacitance at low electrolyte concentrations was chiefly
determined by variations in the capacitance of the ionic double layers.
125
It was concluded on the basis of the Gouy-Chapman analysis used in this
study that oxidised cholesterol caused a significant increase in the
bound charge density at the membrane surface whereas pure cholesterol
did not. Variation in the double layer capacitance upon the addition of
oxidised cholesterol to egg-lecithin bilayers at low electrolyte
concentrations seemed to be the main cause for its apparently opposite
effects on membrane thickness reported by Ashcroft (1979) and McIntosh
(1978).
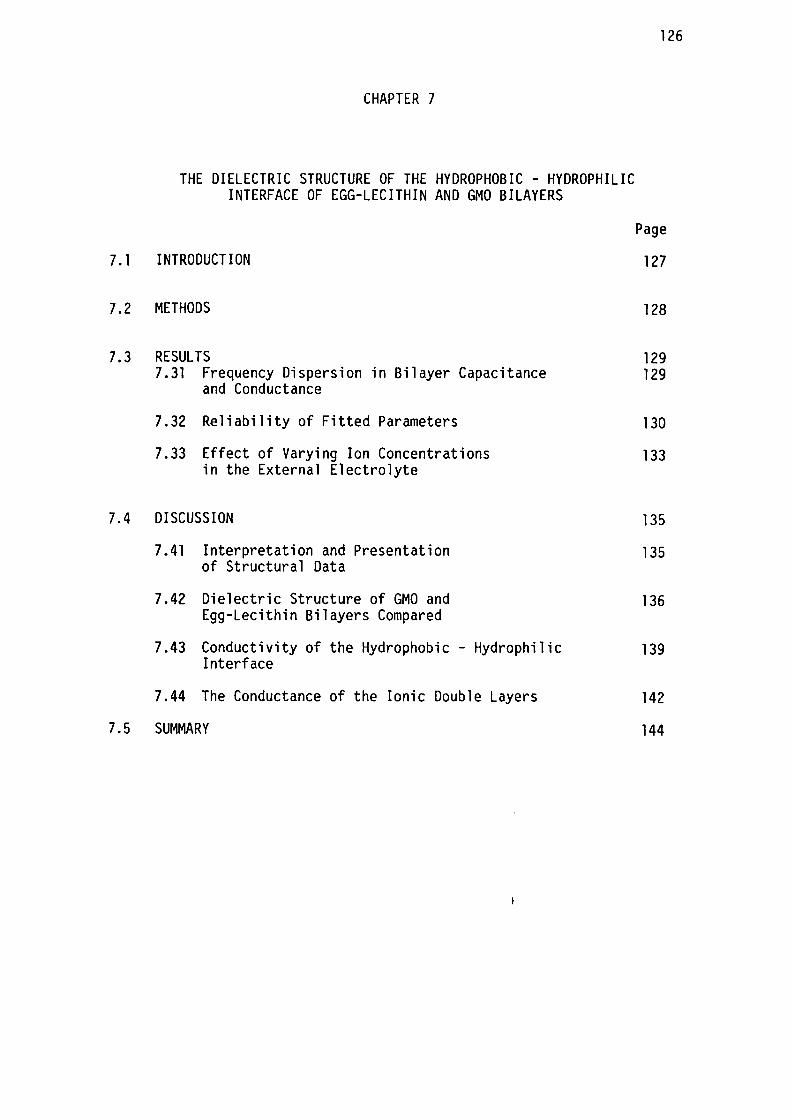
CHAPTER 7
THE DIELECTRIC STRUCTURE OF THE HYDROPHOBIC - HYDROPHILIC INTERFACE OF EGG-LECITHIN AND GMO BILAYERS
7. l INTRODUCTION
7.2 METHODS
7.3 RESULTS 7.31 Frequency Dispersion in Bilayer Capacitance
and Conductance
7.32 Reliability of Fitted Parameters
7.33 Effect of Varying Ion Concentrations in the External Electrolyte
7 .4 DISCUSSION
7.41 Interpretation and Presentation of Structural Data
7.42 Dielectric Structure of GMO and Egg-Lecithin Bilayers Compared
7.43 Conductivity of the Hydrophobic - Hydrophilic Interface
7.44 The Conductance of the Ionic Double Layers
7.5 SUMMARY
126
Page
127
128
129 129
130
133
135
135
136
139
142
144
127
7. 1 INTRODUCTION
It is known that a slab of dielectric material consisting of a
series of discrete layers which have different electrical time-constants
exhibits a Maxwell-Wagner dispersion in total capacitance and
conductance. Coster and Smith (1974) were the first to measure this
dispersion in lipid bilayer membranes in the frequency range .1-100 Hz
which was associated with the dielectric inhomogeneity of the bilayer.
The results of Coster and Smith were successfully modelled with a
trilayer dielectric substructure consisting of a hydrophobic region
bounded by two relatively polar regions. The hydrophobic region was
associated with the acyl chains of the lipids and the polar regions with
the choline phosphate groups. Refinements to the measuring system by
Ashcroft, Coster and Smith (1981) revealed a third dielectrically
distinct region producing a frequency dispersion in bilayer capacitance
in the frequency range .01-.l Hz. This region had dielectric properties
midway between those of the polar and the hydrophobic regions. The
dielectric parameters \'/ere associated with the region of the bilayer
containing the carboxyl and ester-oxygen atoms of the lipids. Further
technical advances in the impedance measuring system now allow the
resolution of additional dielectric substructure with lipid membranes.
This chapter is concerned with the assignment of the dielectric j
parameters derived from fitting the theoretical Maxwell-Wagner impedance
dispersion to the impedance data and the interpretation of the
dielectric structure. To aid this, the dielectric structure of bilayer
membranes formed from egg-lecithin have been compared with that of
bilayers formed from glycerol monooleate. Although the dielectric
128
structure of bilayers formed from GMO and egg-lecithin should have some
similarities, in that both molecules have similar hydrophobic and acetyl
chemical moieties, there should also be differences in the dielectric
structure of these two bilayer systems as the polar head-group regions
of the former consists of the alignment of choline phosphate dipoles and
the latter contains mainly hydroxyl groups. Comparison of and
contrasting the dielectric dispersions of bilayers formed from these two
amphiphiles has allowed assignment of the dielectric parameters to
different parts of the bilayer structure. This has then provided a
basis for the study of the conductance mechanisms at the hydrophobic -
hydrophilic interface.
7.2 METHODS
Egg yolk lecithin bilayers were formed at 40°C from solutions
containing different chainlength n-alkanes. Solventless egg-lecithin
bilay~rs were generated using n-hexadecane solutions by the technique
described in Chapters 4 and 5. Egg-lecithin bilayers were formed in
aq~ous solutions containing l, 10, and 100 mM KCl.
-GMO bilayers were formed from 200mM solutions of glycerol
monooleate in n-hexadecane at 20°c. The ion concentrations in the
aqueous phase were in the range 10- 4 to 4.5 Molar.
Impedance dispersion measurements were conducted at 20-25°C. Uhen
membrane capacitance had sufficiently settled (varying by less than .2%
per 30 minutes) a series of frequency scans of membrane impedance was
commenced. Each scan involved measurements of membrane impedance at
129
35-45 frequencies, in increments of a factor of 1.4, varying in value
from .003 to 10000 Hz. Such a frequency scan took 30-45 minutes. All
impedance data reported here was an average of at least 3 such scans on
egg-lecithin bilayers. However, the relatively short life span of GMO
bilayers only allowed results of single frequency scans to be analysed.
7.3 RESULTS
7.31 Frequency Dispersion in Bilayer Capacitance and Conductance
The capacitance of egg-lecithin bilayers was found to reach
sufficiently steady values for frequency scans of the impedance in 20-40
minutes. The membrane conductance to a small extent remained time
dependent, usually increasing by 2-10% per hour. Hanai et al. {1965c)
demonstrated that a significant fraction of the membrane current was due
to border "leakage" {ie. current shunts through or around the torus).
Occasionally the conductance of the bilayer would jump to a new value,
presumably due to an abrupt change in the border "leak" current. This
"leak" conductance was estimated by plotting the linear relationship
between r.1er.1brane capacitance {proportional to bilayer area) and membrane
conductance and extrapolating to the conductance intercept. The
i@pedance of the current shunt does not reflect any intrinsic property
of the bilayer structure and therefore was subtracted from the data
before being fitted to a Maxwell-Wagner dispersion.
Bilayers formed from GMO thinned rapidly achieving a steady
capacitance in 3-10 minutes. However the bimolecular films were short
lived, lasting at most 60 minutes.
130
All experimental impedance data obtained from lipid bilayers showed
a frequency dependent capacitance and conductance which could be
accurately fitted to a Maxwell-Wagner dispersion expected from a
sandwich of substructural layers with 4-6 distinctly resolvable
electrical time-constants (ie,
bilayer is symmetric).
7-11 different layers assuming the
7.32 Reliability of Fitted Parameters
There were found to be two main sources of variability in the
fitted membrane parameters. These were:
a) the variations between successive membranes,
imperfect control of the bilayer environment
probably due to
b) uncertainties in the Maxwell-Wagner fit to the data, arising from
experimental error or the limited frequency range of the impedance
measurer.tents.
Here the various factors affecting the reliability and accuracy of
the dielectric parameters extracted from the least squares fitting
routine are considered.
i) Uncertainty in Accounting for the D.C. Conductance
j
Resolution of two time-constants within the bilayer was obtained
from the capacitance dispersion in the frequency range .003-.03 Hz. The
dielectric parameters giving the best Maxwell-Wagner fit to the
experimental data in this frequency range depended on what fraction of
the membrane current was attributed to the intrinsic conductance
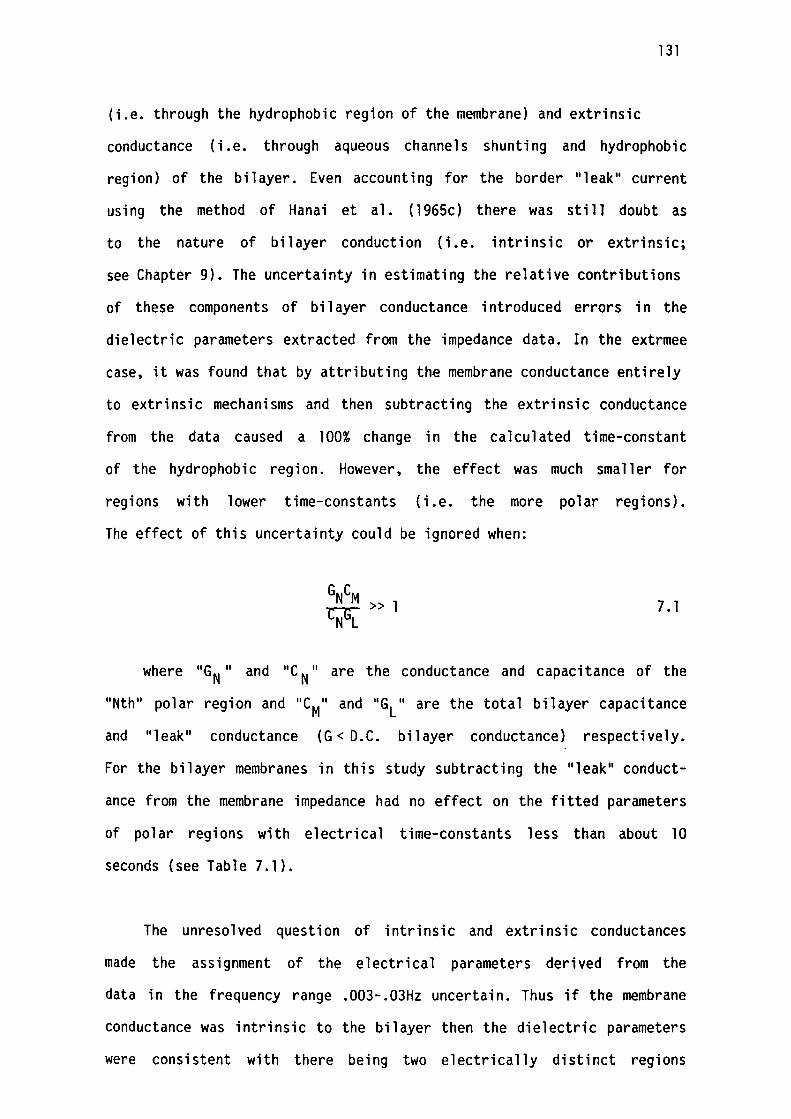
131
(i.e. through the hydrophobic region of the membrane) and extrinsic
conductance (i.e. through aqueous channels shunting and hydrophobic
region) of the bilayer. Even accounting for the border "leak" current
using the method of Hana i et al . ( 1965c) there was st i 11 doubt as
to the nature of bilayer conduction (i.e. intrinsic or extrinsic;
see Chapter 9). The uncertainty in estimating the relative contributions
of these components of bilayer conductance introduced errors in the
dielectric parameters extracted from the impedance data. In the extrmee
case, it was found that by attributing the membrane conductance entirely
to extrinsic mechanisms and then subtracting the extrinsic conductance
from the data caused a 100% change in the ea lcul ated time-constant
of the hydrophobic region. However, the effect was much smaller for
regions with lower time-constants (i.e. the more polar regions).
The effect of this uncertainty could be ignored when:
7. l
where "GN " and "C N" are the conductance and capacitance of the
"Nth" polar region and "CM" and "GL" are the total bilayer capacitance
and "leak" conductance (G < 0.C. bilayer conductance) respectively.
For the bilayer membranes in this study subtracting the "leak" conduct
ance from the membrane impedance had no effect on the fitted parameters
of polar regions with electrical time-constants less than about 10
seconds (see Table 7.1).
The unresolved question of intrinsic and extrinsic conductances
made the assignment of the electrical parameters derived from the
data in the frequency range . 003-. 03Hz uncertain. Thus if the membrane
conductance was intrinsic to the bilayer then the dielectric parameters
were consistent with there being two electrically distinct regions
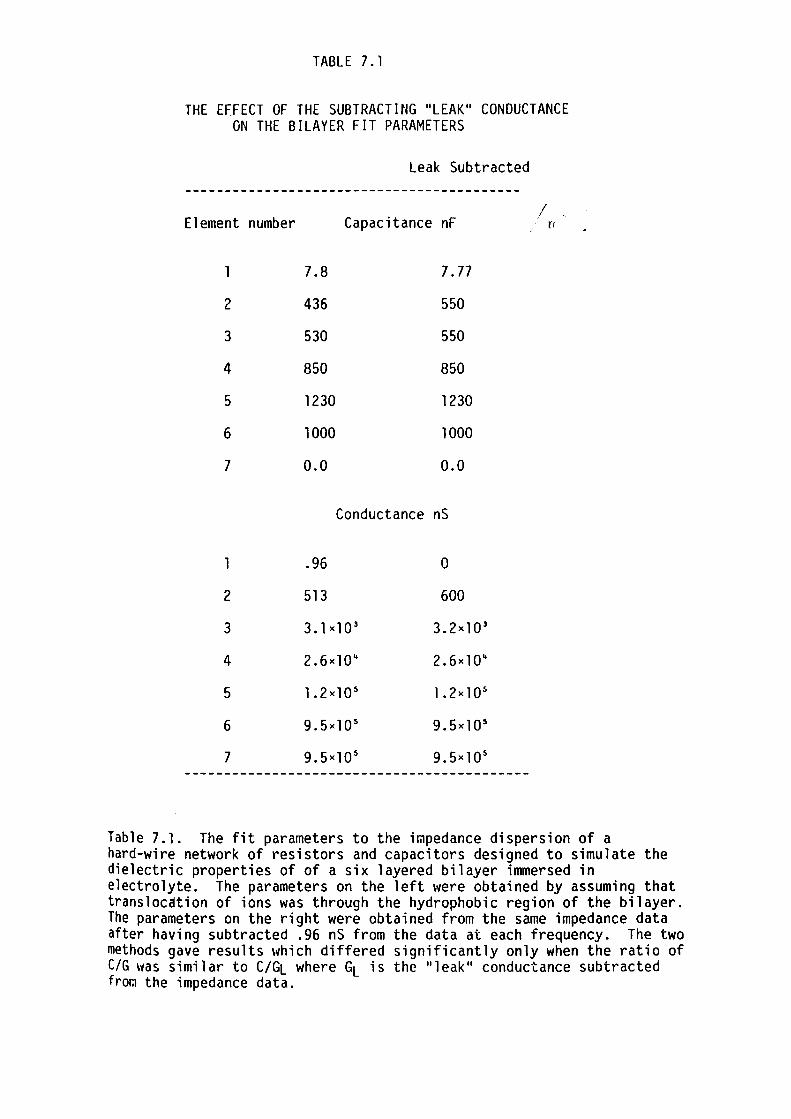
TABLE 7. l
THE EFFECT OF THE SUBTRACTING "LEAK" CONDUCTANCE ON THE BILAYER FIT PARAMETERS
Leak Subtracted
------------------------------------------Element number Capacitance nF I -
n
l 7.8 7. 77
2 436 550
3 530 550
4 850 850
5 1230 1230
6 1000 1000
7 0.0 0.0
Conductance nS
l .96 0
2 513 600
3 3.1><10 3 3.2><10 3
4 2.6><10" 2.6><10"
5 l .2><10 5 l .2><10 5
6 9.5><10 5 9.5><10~
7 9. 5><10 5 9.5><10 5
-------------------------------------------
Table 7.1. The fit parameters to the impedance dispersion of a hard-wire network of resistors and capacitors designed to simulate the dielectric properties of of a six layered bilayer immersed in electrolyte. The parameters on the left were obtained by assuming that translocation of ions was through the hydrophobic region of the bilayer. The parameters on the right were obtained from the same impedance data after having subtracted .96 nS from the data at each frequency. The two methods gave results which differed significantly only when the ratio of C/G \'fas similar to C/GL where GL is the "leak" conductance subtracted fro~ the impedance data.
132
associated with the acyl chains of the lipids. On the other hand, if
the conductance was via an extrinsic mechanism, say transmembrane water
channels, then subtraction of the extrinsic component from the data
yielded dielectric parameters that were consistent with there being one
electrical time-constant associated with the hydrophobic region and
another associated with a more polar region.
ii) Errors due to Finite Frequency Range
At low frequencies the resistive component of the membrane
impedance is large compared with the reactive component (loosely
speaking the bilayer looks more like a resistor than a capacitor).
Accurate measurement of the me~brane capacitance at these low
frequencies was limited by the large relative errors in measuring the
small phase angles of the membrane impedance. Therefore as the
membrane conductance increased (ie. in the presence of concentrated
electrolyte solutions) the low frequency limit of data acquisition moved
to higher frequencies (.03-.l Hz). Thus at high salt concentrations the
structural information in the very low frequency range could not be
easily resolved as data at very low frequencies became progressively
inaccurate.
At high frequencies the bilayer impedance was much less than that
of the electrolyte between the membrane and the potential measuring
electrodes due to the relatively high capacitance of the bilayer. Thus I
the dielectric properties of the bilayer are not easily resolved at
these high frequencies. Therefore the high frequency limit of data
acquisition was determined by the relative impedances of the bilayer and
electrolyte. This explains why the polar substructure was more easily
133
resolved in high external KCl concentrations where the electrolyte
impedance was much smaller (see Table 7.2).
Tests on hard-wire impedance networks showed that the polar head
parameters could be determined to within an accuracy of 20% in
capacitance and 30% in conductance (see Table 7.1 and also section
4.54). The capacitance of the hydrophobic region could be determined
with a precision of ±0.2% and in the case of solventless bilayers was
repeatable to within ±2% between different membranes.
7.33 Effect of Varying Ion Concentrations in the External Electrolyte.
The capacitance of the egg-lecithin and GMO bilayers increased
with increasing KCl concentration in accord with the results of
Chapter 6. Increasing the KCl concentration in the external electrolyte
moved the large dispersion in capacitance and conductance arising from
the electrolyte impedance to higher frequencies. However, at low
frequencies the general shape of the dispersion remained unchanged (see
figures 7.la, 7.lb and 7.2a; also see Tables 7.2 and 7.3). It was also
found that the impedance dispersion of GMO bilayers was insensitive to
pH over the range l to 6.
The capacitance of GMO - n-hexadecane bilayers was less than that
measured for GMO-squalene bilayers reported in Chapter 6. This is
because n-hexadecane was slightly soluble in the hydrophobic interior of l
GMO bilayers (White, 1977 and Haydon et al., 1977). However, bilayers
for~ed using n-hexadecane solvent had longer life-times than those using
squalene and therefore where more suitable for impedance dispersion
measurements.
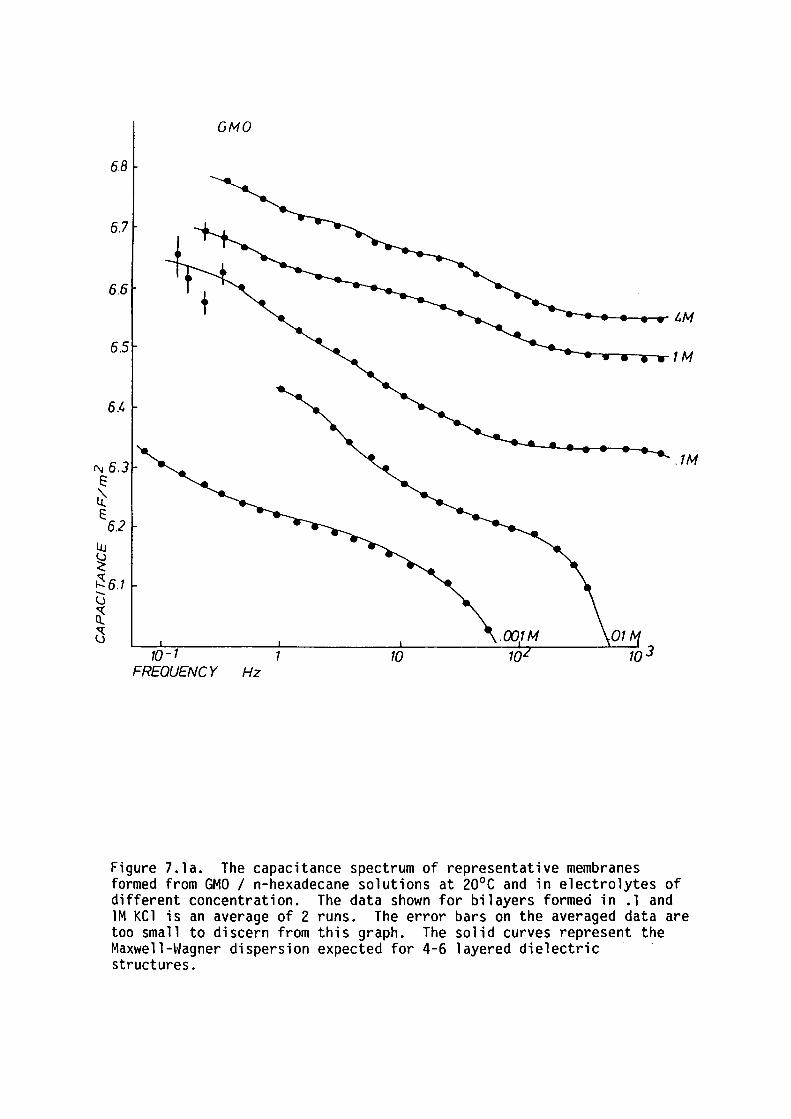
GMO
6.8
6.7
6.6
6.5
6.t.
C\j 6.3 E
.TM
~ E
6.2
10-1 1 10 FREQUENCY Hz
Figure 7.la. The capacitance spectrum of representative membranes formed from GMO/ n-hexadecane solutions at 20°c and in electrolytes of different concentration. The data shown for bilayers formed in .1 and lM KCl is an average of 2 runs. The error bars on the averaged data are too small to discern from this graph. The solid curves represent the Maxwe 11-Wagner dispersion expected for 4-6 layered dielectric · structures.
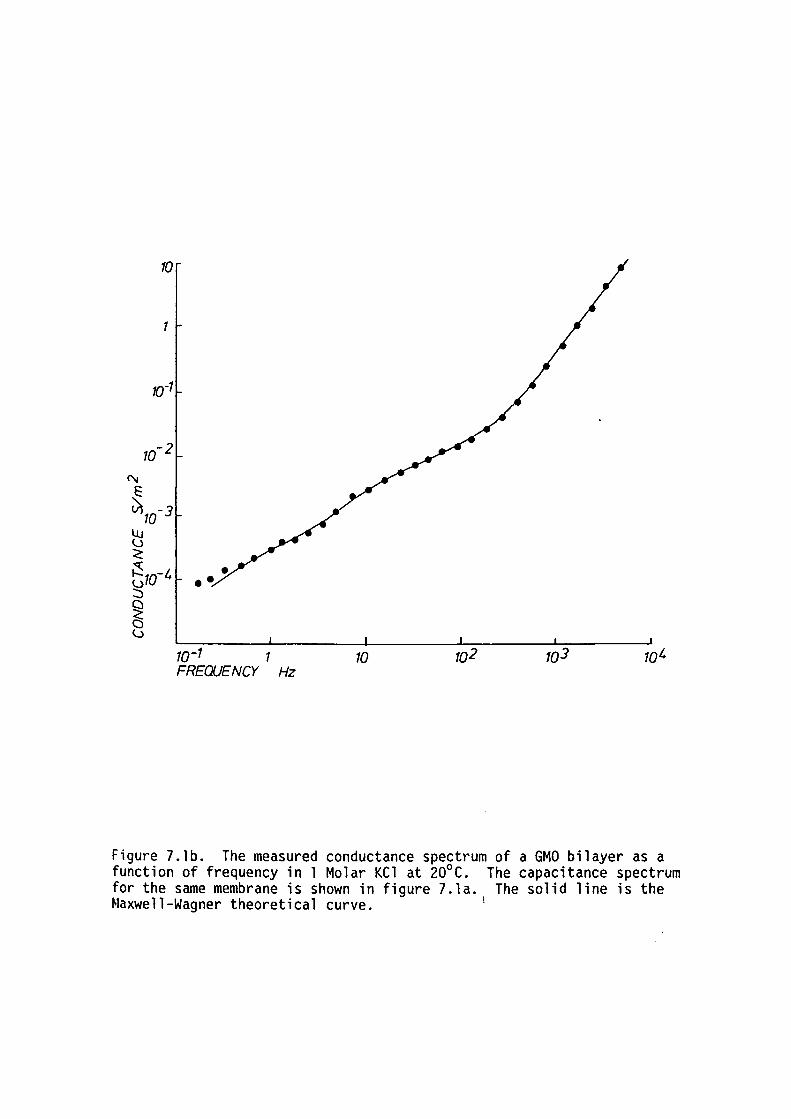
10
1
10-1 1 10 102 FREOUE NCY Hz
Figure 7.lb. The measured conductance spectrum of a GMO bilayer as a function of frequency in l Molar KCl at 20°C. The capacitance spectrum for the same membrane is shown in figure 7.la. The solid line is the Maxwell-Wagner theoretical curve. 1
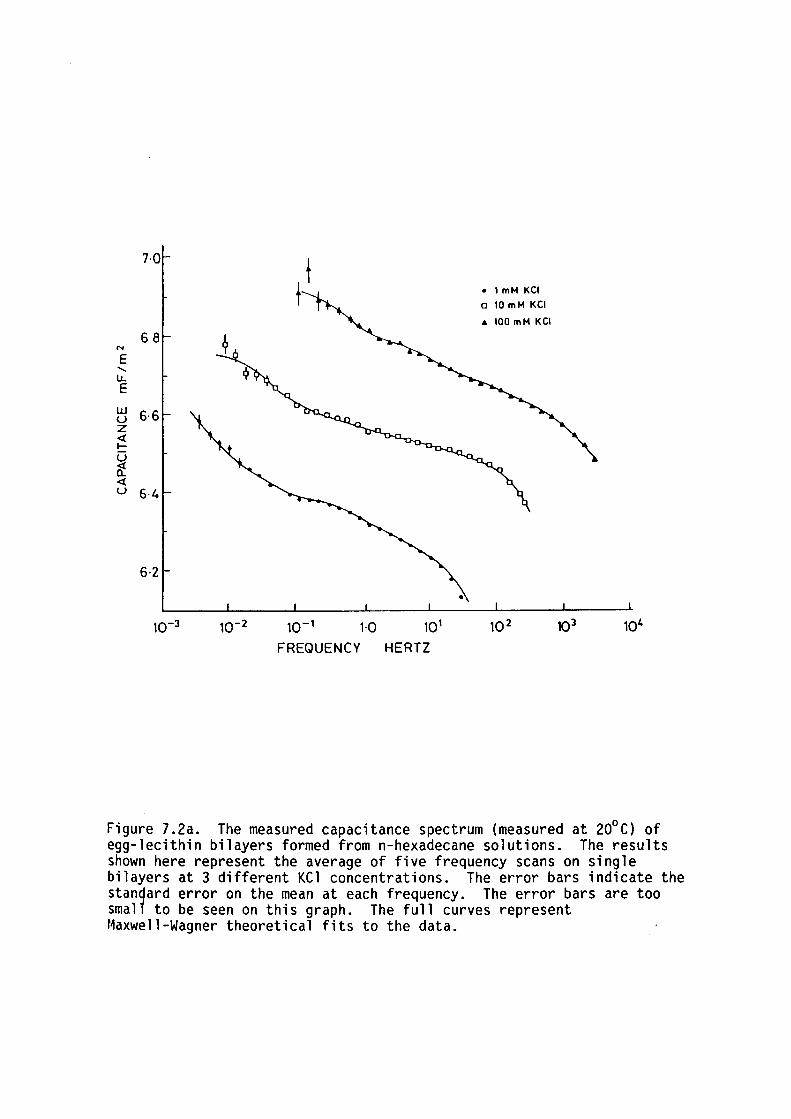
7-0
6·8 N
E ....... lL E
w 6·6 u z <{ ..... u ~ <{ u 6-4
6·2
t I
10-1 1·0
FREQUENCY 101
HERTZ
• 1 mM KCI
a 10 mM KCI
• 100 mM KCI
10 2 103 104
Figure 7.2a. The measured capacitance spectrum (measured at 20°C) of egg-lecithin bilayers formed from n-hexadecane solutions. The results shown here represent the average of five frequency scans on single bilayers at 3 different KCl concentrations. The error bars indicate the stangard error on the mean at each frequency. The error bars are too smal1 to be seen on this graph. The full curves represent Maxwell-Wagner theoretical fits to the data.
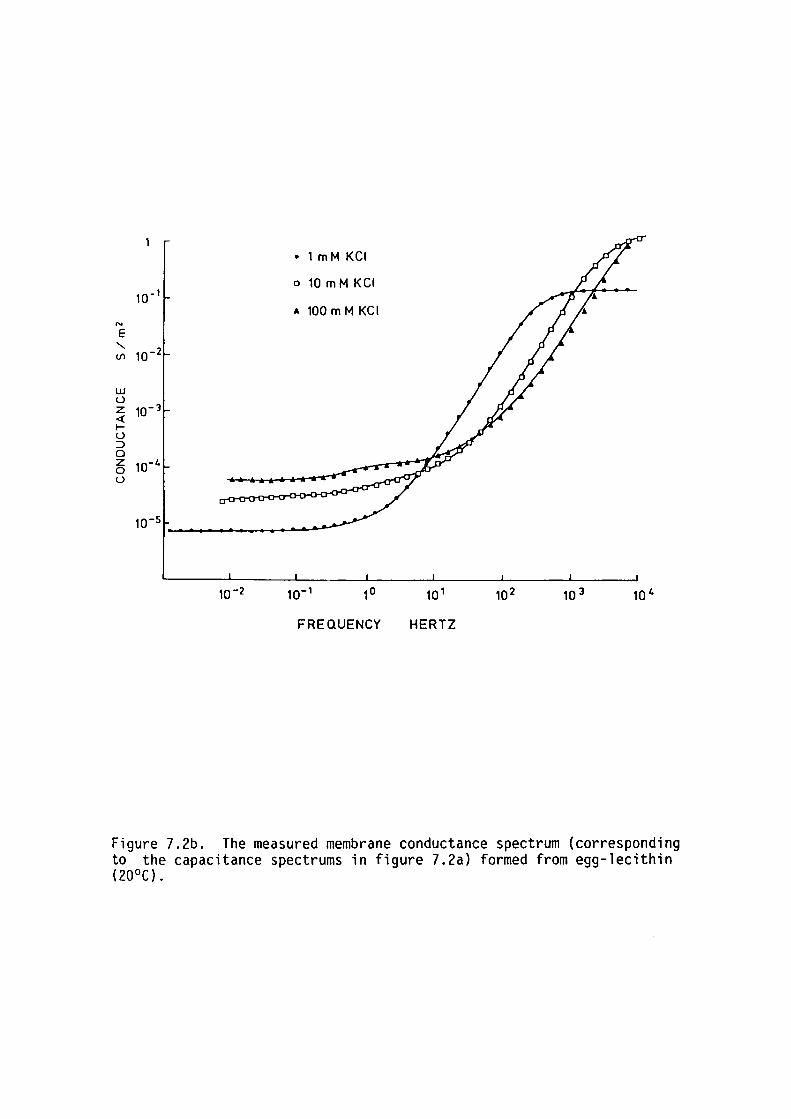
• 1mMKCI
a 10 m M KCI ,a-1
" 100 m M KCI N
E '- ,a-2 Vl
w u z 10-J <( I-u :::> 0 z ,o-4 0 u
,a-s
10 2 10 3 10 4
FREQUENCY HERTZ
Figure 7.2b. The measured membrane conductance spectrum (corresponding to the capacitance spectrums in figure 7.2a) formed from egg-lecithin ( 20°c) .
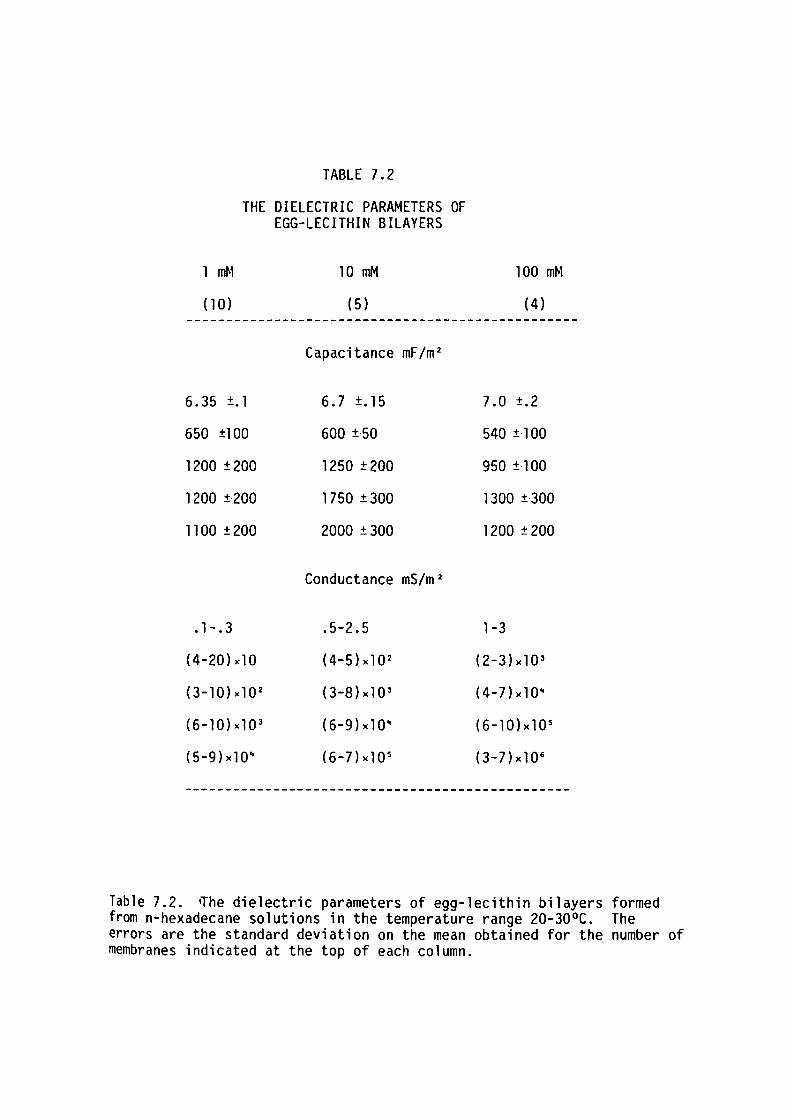
TABLE 7.2
THE DIELECTRIC PARAMETERS OF EGG-LECITHIN BILAYERS
1 mM
( 10)
6.35 ±. 1
650 ±100
1200 ±200
1200 ±-200
1100 ±200
. 1-. 3
(4-20)x10
(3-10)xl0 2
(6-10)xl0 3
(5-9)x10"
10 mM
(5)
Capacitance mF/m 2
6.7 ±.15
600 ±-50
1250 ± 200
1750 ±300
2000 ±300
Conductance mS/m 2
.5-2.5
{4-5)xl0 2
(3-8)xl0 3
( 6-9) X 10"
(6-7)xl0 5
100 mM
(4)
7 .0 ±.2
540 ± 100
950 ± 100
1300 ± 300
1200 ± 200
1-3
(2-3)xl0 3
(4-7) X 10"
(6-10)xl0 5
(3-7)xl0 6
------------------------------------------------
Table 7.2. ~he dielectric parameters of egg-lecithin bilayers formed from n-hexadecane solutions in the temperature range 20-30°C. The errors are the standard deviation on the mean obtained for the number of membranes indicated at the top of each column.
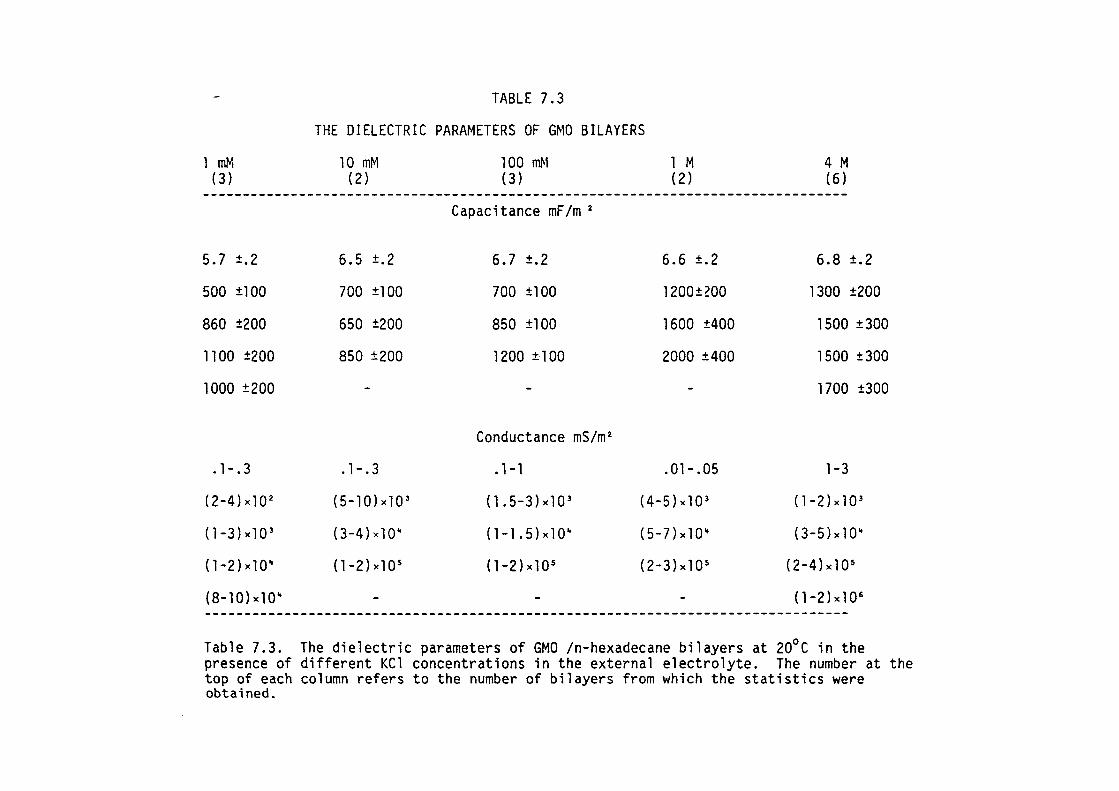
l mM ( 3)
5.7 ±.2
500 ±100
860 ±200
1100 ±200
1000 ±200
.1-.3
(2-4)xl0 2
(l-3)xl0 3
(l-2)xl0"
(8-lO)xlO"
TABLE 7.3
THE DIELECTRIC PARAMETERS OF GMO BILAYERS
10 mM ( 2)
6.5 ±.2
700 ±100
650 ±200
850 ±200
-
. 1-. 3
(5-l0)xl0 3
(3-4)xl0"
(l-2)xl0 5
-
100 mM (3)
Capacitance mF /m 2
6.7 ±.2
700 ±100
850 ±100
1200 ± l 00
-
Conductance mS/m 2
. l -1
(l .5-3)xl0 3
(l-l .5)xl0"
(l-2)xl0 5
-
l M ( 2)
6.6 ±.2
l 200±WO
1600 ±400
2000 ±400
-
.01-.05
(4-5)xl0 3
(5-7)xl0"
(2-3)xl0 5
-
4 M (6)
6.8 ±.2
1300 ±200
1500 ±300
1500 ±300
1700 ±300
1-3
(l-2)xl0 3
(3-5)xl0"
(2-4)xl0 5
(1-2)xl0 6
Table 7.3. The dielectric parameters of GMO /n-hexadecane bilayers at 20°c in the presence of different KCl concentrations in the external electrolyte. The number at the top of each column refers to the number of bilayers from which the statistics were obtained.
134
The general shape of the dispersion of GMO and egg-lecithin
bilayers was distinctly different (see figure 7.3); the main difference
being that the capacitance of GMO bilayers was independent of frequency
at frequencies over 100 Hz whereas that for egg-lecithin continued to
disperse. At frequencies less than 100 Hz the shape of the impedance
dispersions for egg-lecithin and GMO bilayers was similar.
Inspection of Table 7.3 reveals that the electrical time-constant
and hence the relative conductivity, of the polar regions of GMO and
egg-lecithin bilayers was insensitive to large changes in the external
electrolyte concentration. Only the most conductive portions of the
polar region showed any dependence of time-constant on the electrolyte
concentration and then only at electrolyte concentrations in excess of
l Molar. The dependence of the conductivity of the most conductive
portion of the polar structure on the ion concentration in the external
electrolyte is shown in figure 7.4.
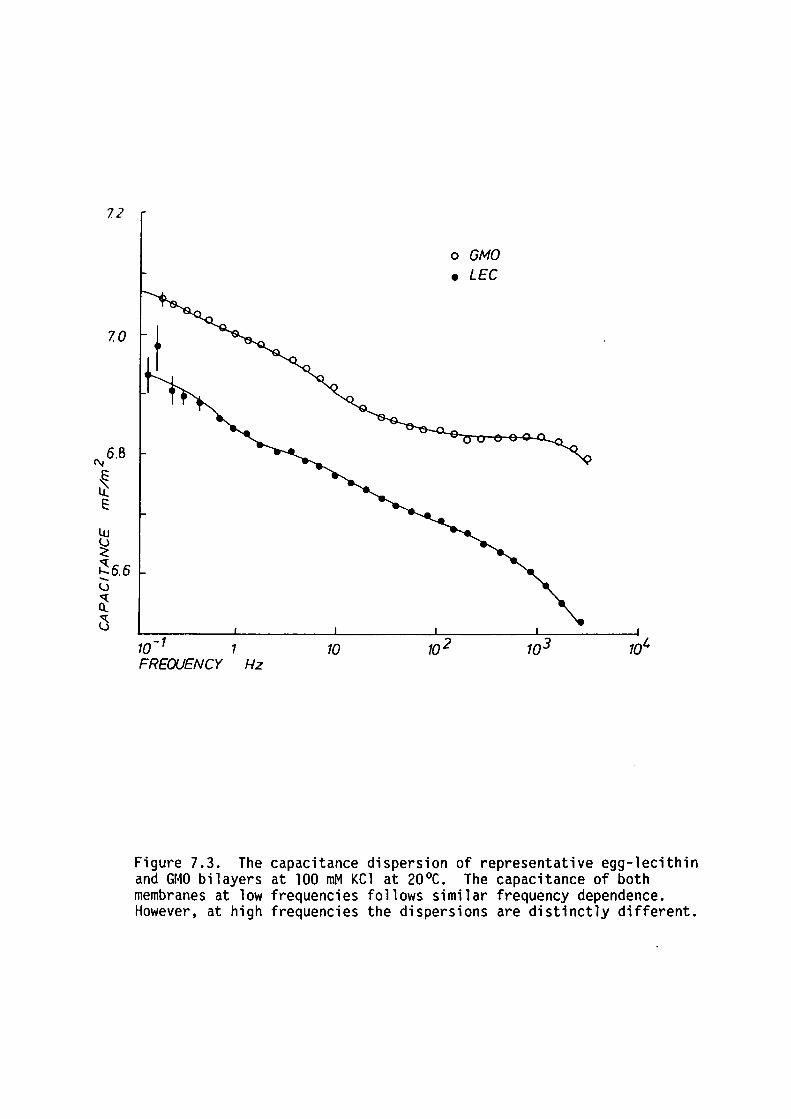
72
7. 0
""6.8
~ l( E
Lu
~ ~6.6 -u ~ 0
10-1 1 FREQUENCY Hz
10
o GMO • LEG
Figure 7.3. The capacitance dispersion of representative egg-lecithin and GMO bilayers at 100 mM KCl at 20°C. The capacitance of both membranes at low frequencies follows similar frequency dependence. However, at high frequencies the dispersions are distinctly different.
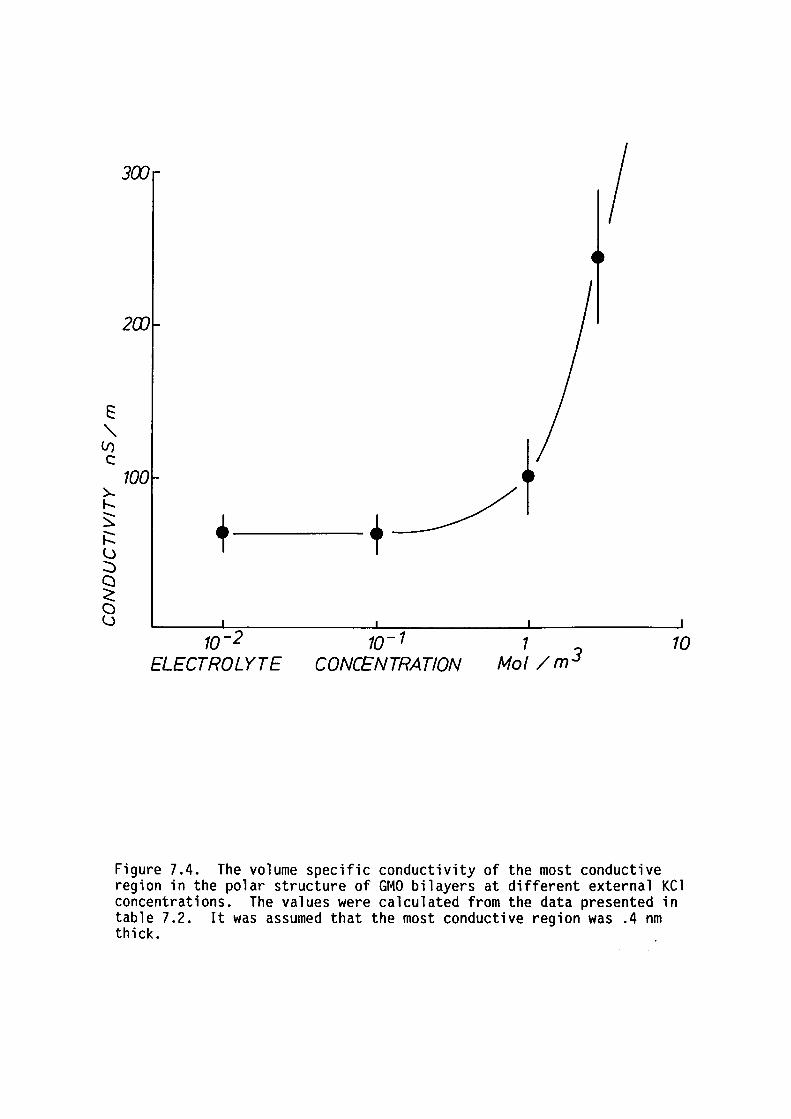
E
" l/) C:
J(X)
2(1]
100 >--I--:::::.. .::: l) :::> a :::: a l)
10-2 ELECTROLYTE
10- 1 CONCENTRATION
1 Mo! /m 3
I
10
Figure 7.4. The volume specific conductivity of the most conductive region in the polar structure of GMO bilayers at different external KCl concentrations. The values were calculated from the data presented in table 7.2. It was assumed that the most conductive region was .4 nm thick.
135
7.4 DISCUSSION
7.41 Interpretation and Presentation of Structural Data
The first measurements of membrane dielectric substructure by
Coster and Smith (1974) were able to identify a polar region which was
associated with the alignment of choline phosphate groups at the
membrane solution interface. Later, Ashcroft, Coster and Smith (1981)
using a refined measuring technique were able to identify another less
polar region which was associated with the acetyl and ester oxygen atoms
of the lecithin molecules. Each region was considered as a thin slab of
dielectric with a fairly well defined dielectric constant and thickness.
With the new, improved low frequency impedance spectrometer
(BULFIS) and the subsequent refinements in the measuring techniques, the
resolution of dielectric structure has much increased.
Tables 7.2 and 7.3 shows that six distinct electrical
have been detected in the polar regions of the bilayer.
Inspection of
time-constants
However, this
new wealth of information brings with it problems which have set new
limitations to the extended interpretation now possible. Firstly, the
assignment of dielectric parameters to different parts of the bilayer
and consequently the co~parison of different bilayer structures is more
difficult with a many layered dielectric model. Secondly, the
structural information inferred from the high frequency data is
truncated due to the limited frequency range of the data acquisition 1
system and the impedance of the electrolyte. Therefore there is some
uncertainty as to which part of the hydrophobic - hydrophilic interface
is manifest in the impedance dispersions. Thirdly, when one examines
the dielectric parameters in the previous Tables it can be shown that
they pertain to regions that are only .1-.4 nm thick. Over these short
136
distances the concept of a distinct region with a well defined
dielectric constant and conductivity is clearly unrealistic. Even if
step changes in dielectric constant do occur at the boundary of each
region the conductance and hence dielectric time constant would remain a
smoothly varying function of position. For a bilayer solution interface
the dielectric properties would exhibit a monotonic spatial variation
between those of the hydrophobic interior and those of the external
aqueous phase. The analysis of the data presented here models this
somewhat nebulous transition region between these two phases with series
of step changes.
In this chapter (and some subsequent chapters) the dielectric data
obtained from lipid bilayers will be presented in the form of electrical
time-constant diagra~s. These particular experimental plots readily
give insight into the possible spatial variation of dielectric
time-constant in the bilayer structure.
To assign a dielectric constant to each layer requires some
additional, a priori information. However, one can gain estimates of
the dielectric constant of different parts of the bilayer structure by
comparing the chemical and dielectric structures of egg-lecithin and GMO
bilayers. Assignment of the parameters in Tables 7.2 and 7.3 to
different parts of the bilayer structure will now be discussed.
7.42 Dielectric Structure of1 GMO and Egg-Lecithin Bilayers Compared
The dielectric structure of GMO was easier to interpret than
of egg-lecithin because the capacitance dispersion of the entire
region lay within the experimentally useful range of frequencies;
capacitance dispersion being complete before the dispersion due to
that
polar
the
the
137
presence of the aqueous phase began. The cessation of the irapedance
dispersion at about 100 Hz provided a convenient "raarker'' on the
experimental data which was associated with the most conductive part of
the G~O polar region (presumably the hydroxyl groups of the GMO
molecules).
The lowest electrical time constant detected in the GMO bilayer
structure was 10- 2 second and which we here associate with the hydroxyl
region which should be approxi~ately .3-.4 nm thick depending on the
relative orientation of the hydroxyl groups (see figure 7.5). The
dielectric constant of similar chemical moieties such as the short chain
alcohols and diols is in the range 25-40 (Chemical Rubber Company
Handbook of Che~istry and Physics, 1976). Providea the dielectric
constant of the hydroxyl region of GMO bilayers is also in the range
25-40 then the capacitance of the hydroxyl region would be
600-1200 mF/m 2• Comparing these values with those in Table 7.1 it seems
that the one or two regions with the lowest electrical time-constants
can be associated with the hydroxyl regions of the bilayer.
The other regions with higher electrical time-constant (>.l second)
must then be associated with the acetyl region of GMO bilayers. It is
expected that regions of the dielectric substructure of egg-lecithin
bilayers having similar time-constants (>.lsecond), can also be
associated with the the acetyl region of egg-lecithin bilayers.
Provided the acetyl region of egg-lecithin and GMO bilayers is
about .3 nm (see figure 7.5) then the total capacitance of the acetyl
region is consistent with it having a relative dielectric constant in
the range 6-12 which is akin to that expected from similar chemical
moieties such as acetic acid (see figure 7.6).
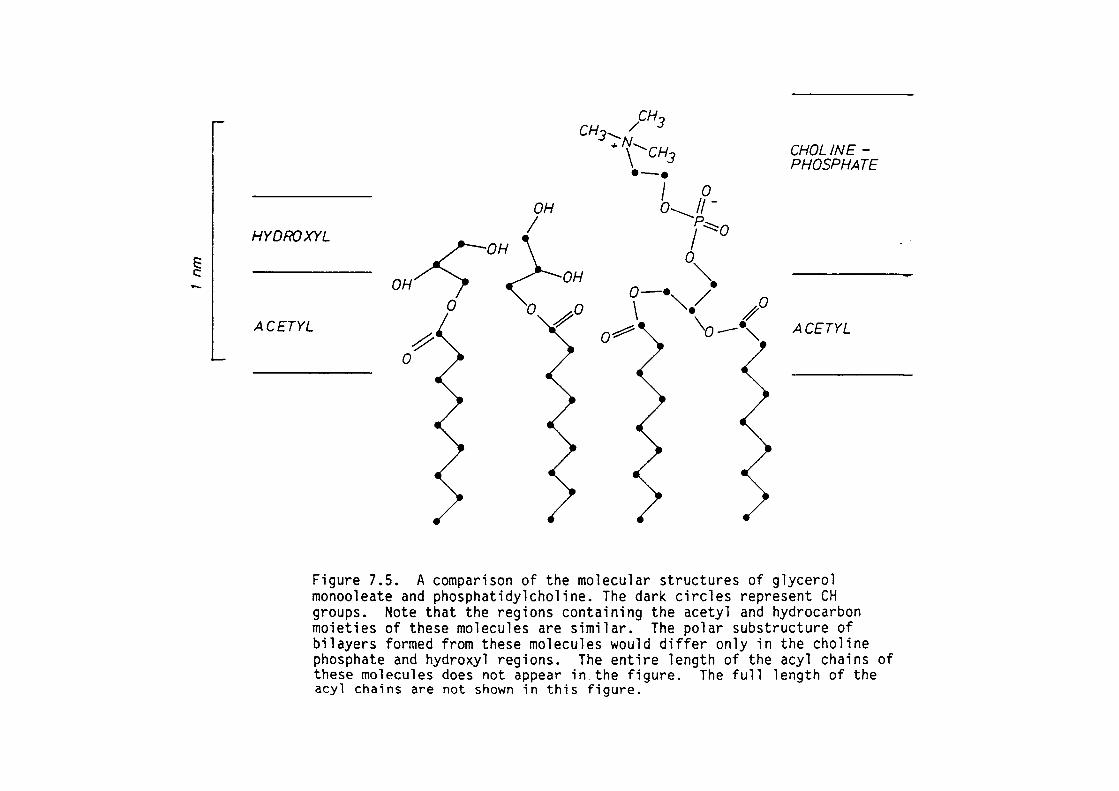
CH3
CH....._/ CHOLINE-3 + \'CH3 PHOSPHATE ·-· I P-o __ ,
OH P:::::::o I I
~ 0 HYDROXYL OH "
OH 0-• /• 0 ~ I ---- OH0 0 0 \ "'\ / ACETYL _ o '( 0,, a-"
ACETYL ~~ 0
Figure 7.5. A comparison of the molecular structures of glycerol monooleate and phosphatidylcholine. The dark circles represent CH groups. Note that the regions containing the acetyl and hydrocarbon moieties of these molecules are similar. The polar substructure of bilayers formed from these molecules would differ only in the choline phosphate and hydroxyl regions. The entire length of the acyl chains of these molecules does not appear in the figure. The full length of the acyl chains are not shown in this figure.
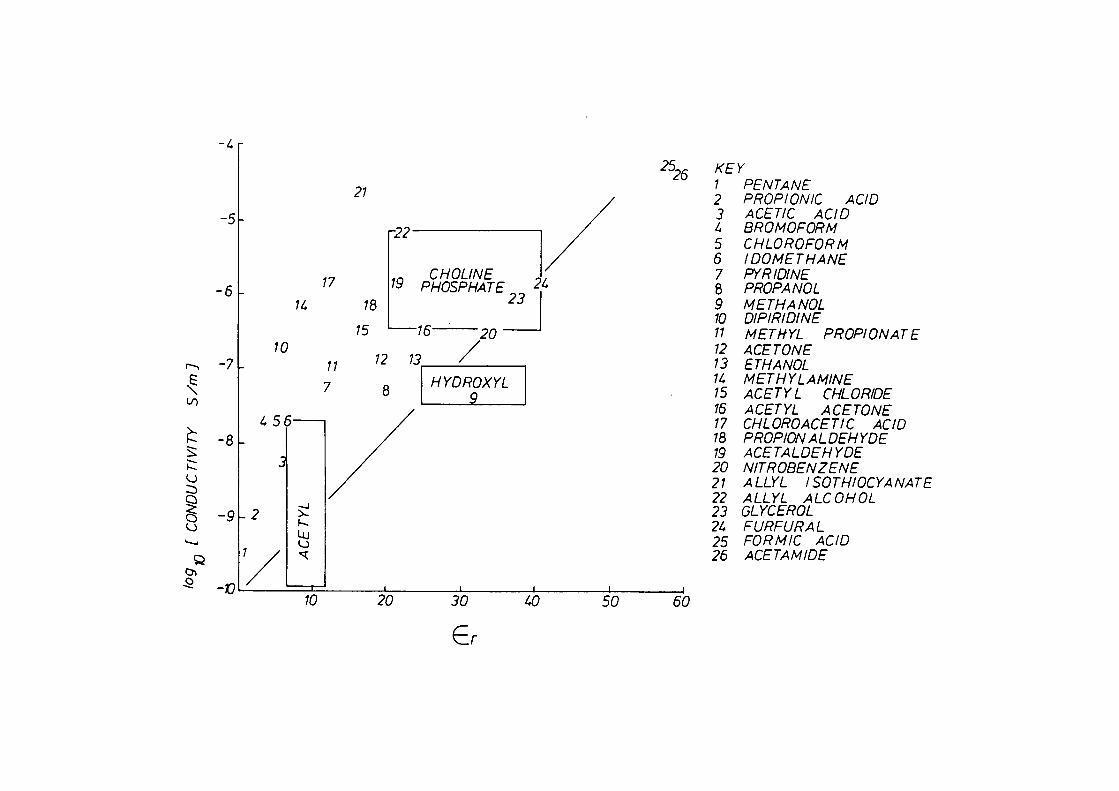
-I.
-5
-6
r..., -7
~ V')
t ~ ~ u ::, a
-8
~ -9~2 u .......
10
I. 5 6
11.
-.J )... 1-.
17
11
7
21
22-/
19 ~nULIIVC
18 I PHOSPHATE 21.
16 _:_J 15
12
8
/20
13 I_H_Y_D:.,_~-0-XYL-I
Q 0\ ~
t3 1/1 ~ -v 10 20 30 1.0 50
Er
2526
60
KEY 1 PENTANE 2 PROPIONIC ACID 3 ACETIC ACID I. BROMOFORM 5 CHLOROFORM 6 IDOMETHANE 7 PfRIDINE 8 PROPANOL 9 METHANOL 10 DIPIRID!NE 11 METHYL PROPIONATE 12 ACETONE 13 ETHANOL 11. METHYLAMINE 15 ACETY L CHLORIDE 16 ACETYL ACETONE 17 CHLOROACETIC ACID 18 PROP/ON ALDEHYDE 19 ACETALDEHYDE 20 NITROBENZENE 21 ALLYL I SOTHIOCYANATE 22 ALLYL ALCOHOL 23 GLYCEROL 21. FURFURAL 25 FORMIC ACID 26 ACETAMIDE
Figure 7.6. Presented here is a pictorial summary of the dielectric structural characterization of GMO and egg-lecithin bilayer systems described in this chapter. The possible range of dielectric constants of each main region within these two bilayer structures and their measured conductivities are compared with that reported for pure non-aqueous polar liquids (Washburn, 1929). The full line represents the assumed relationship between dielectric constant and conductivity within the bilayer. This relationship was used in generating the time-constant diagrams in figures 7.7 and 7.8) from the data in Tables 7.2 and 7.3.
138
Egg-lecithin bilayers exhibit a dispersion in capacitance and
conductance at frequencies much higher than that of GMO bilayers. The
dispersion data obtained from egg-lecithin bilayers at high frequencies
was indicative of regions with lower electrical time-constants than
those found in GMO bilayers. The additional dielectric parameters
(with tirae-constants in the range 10- 5 to 10- 3 second), obtained fro@ the
high frequency data are expected to be due to the presence of the region
containing the choline phosphate dipoles. From the molecular dimensions
of the choline phosphate group of egg-lecithin and the capacitance
values shown in Table 7.2 it is possible to estiraate the dielectric
consta~t of the region containing these chemical raoieties. However, it
is li~ely that only part of the dielectric structure of this region can
be detected (see section 7.32). Therefore only an upper limit to the
dielectric constant of this region can be estimated.
is calculated as approx. 40.
This upper li~it
Figure 7.6 shows volume specific conductivity of each main region
in the polar structure (viz. of the acetyl, hydroxyl and choline
phosphate) of egg-lecithin and GMO bilayers plotted against the
dielectric constant of each raain region.
The dielectric time-constant profiles for a number of egg-lecithin
and GMO bilayers are compared in figures 7.7 and 7.8. In order to
assign dielectric constants to each electrically distinct region in the
·membrane structure it was necessary to assurae a linear relationship l
between the conductivity and dielectric constant of the different parts
of the raembrane structure. This linear relationship was based on the
above estimates of the average dielectric constant of each region and
the conductances of each region, calculated from the parameters in
Tables 7.2 and 7.3 (see figure 7.6). It is important to note that the
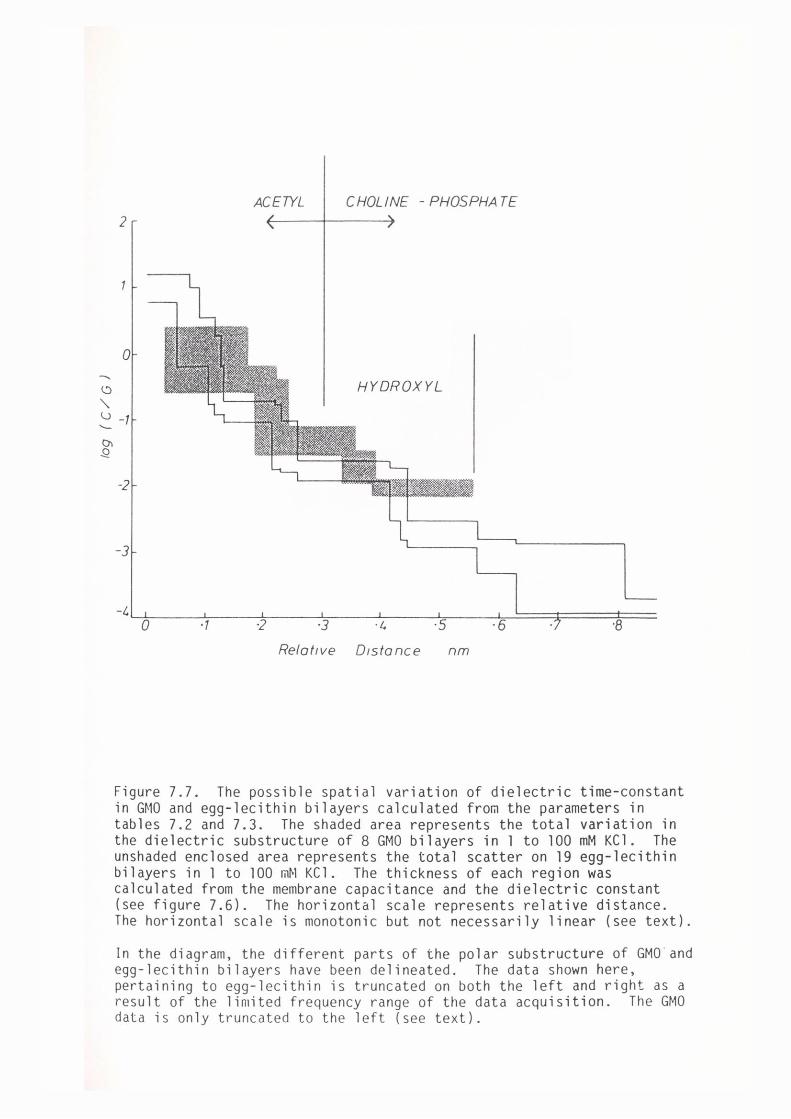
(.'.)
"
2
0
ACETYL CHOLINE - PHOSPHATE
HYDROXYL
l) - 1 --2
-3
-lL....!:- --L----!-----1=----'-----..l,;:-- --~==::t====+== 0 ·1 ·2 ·3 · t. ·5 ·6 ·B
Relat,ve D,stonce nm
Figure 7.7. The possible spatial variation of dielectric time-constant in GMO and egg-lecithin bilayers calculated from the parameters in tables 7.2 and 7.3. The shaded area represents the total variation in the dielectric substructure of 8 GMO bilayers in l to 100 mM KCl. The unshaded enclosed area represents the total scatter on 19 egg-lecithin bilayers in l to 100 mM KCl. The thickness of each region was calculated from the membrane capacitance and the dielectric constant (see figure 7.6). The horizontal scale represents relative distance. The horizontal scale is monotonic but not necessarily linear (see text).
In the diagram, the different parts of the polar substructure of GMO . and egg - lec ithin bilayer s have been de lineated. The data shown here, pertaining t o egg-l ec i t hin i s t ru ncated on both the left and righ t as a resul t of the li mi ted freq uency r ange of the data acquisition. The GMO data i s only tr uncated to t he left (see text ).
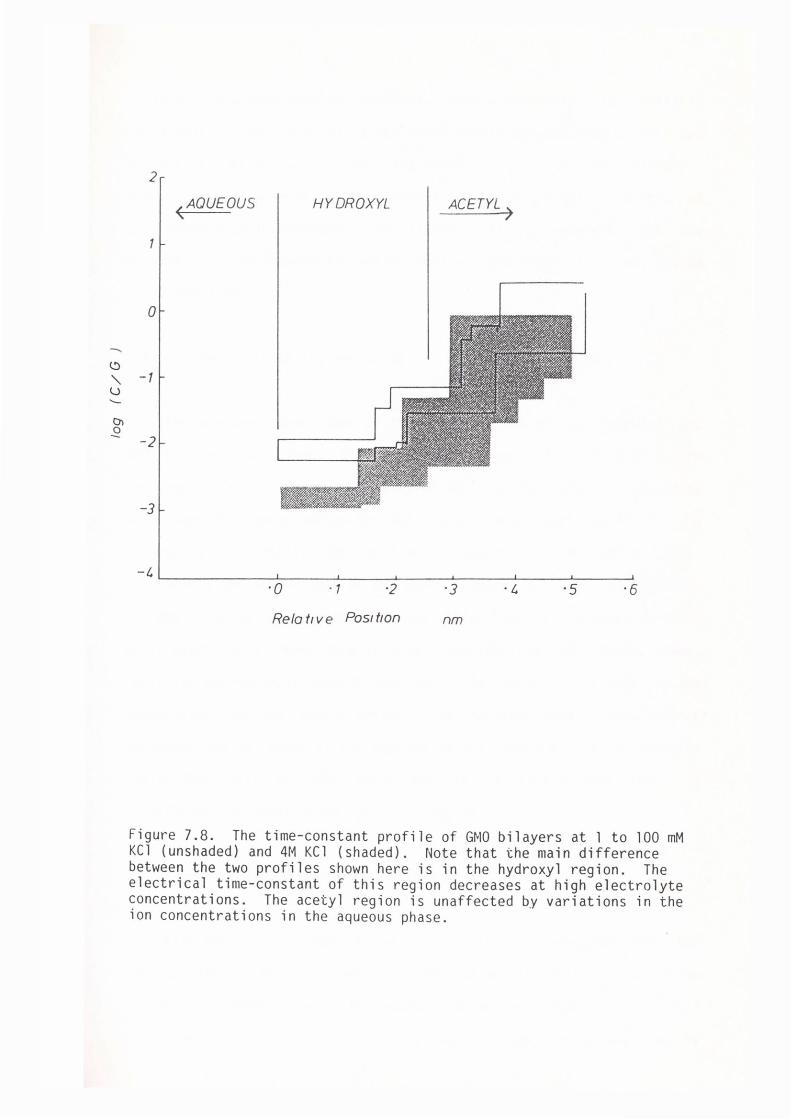
--.. l'.)
" u '--
°' -2
2
(AQUEOUS HYDROXYL ACETYL ~
0
-1
-2
-3
-ll_ _____ ___J__ ___ .J_ __ ---4--__ _.__ ___ .._ __ ....._ __ _.
·O . 1 ·2 ·] ·5 ·6
Relat,ve Pos,flon nm
Figure 7.8. The time-constant profile of GMO bilayers at l to 100 mM KCl (unshaded) and 4M KCl (shaded). Note that the main difference between the two profiles shown here is in the hydroxyl region. The electrical time-constant of this region decreases at high electrolyte concentrations. The acetyl region is unaffected by variations in the ion concentrations in the aqueous phase.
139
scale of these time-constant diagrams, though monotonic, is certainly
not linear as the linearity of the relationship between conductivity and
dielectric constant used in deriving these plots is somewhat arbitrary.
However, from correlating the conductivity and dielectric constant of
~any other organic compounds (see figure 7.6) it appears that the
assumed relation between dielectric constant and conductivity may not be
a bad approximation.
7.43 Conductivity of the Hydrophobic - Hydrophilic Interface
The measured conductance of the polar regions of egg-lecithin and
GMO bilayers was found to be in the range_ . l to 104 Slm2 which
corresponds to a volu~e conductivity of 10- 10 to 10- 5 Sim. It should be
noted here that these values are small compared to that found in the
adjacent electrolyte (.l Sim for l mM KCl and 10 Sim for 100 mM KCl).
Furthermore the conductance of the acetyl region of both egg-lecithin
and GMO bilayers was considerably less than that of highly purified
water which has a conductance of 4xl0- 3 Sim (Bockris and Reddy, 1970).
These low conductances suggest that there is very little electrolyte
penetration into the acetyl region. On the other hand, the choline
phos~hate dipole region of the egg-lecithin bilayers _has a conductance
higher than that of pure water and it is likely that there is
significant ion penetration into this region.
i) Conductivity at Low Ion Concentrations
From the results shown in figure 7.4 it can be seen that the
conductivity of the polar regions of GMO and egg-lecithin is insensitive
to the ion concentration in the aqueous phase at concentrations less
than l Molar KCl. From these results two possible conclusions can be
140
drawn. Either the electrical conduction in the polar regions was due to
raechanisms other than ion migration or the ion concentrations in the
polar regions were bufferred against changes in the external electrolyte
concentration.
Consider the presence of a bound charge at the membrane surface
(see Chapter 6). When the electrolyte concentration in the bulk phase
is less than the surface charge density the total ion concentration near
the region of bound charge is equal to the bound charge concentration.
At higher electrolyte concentrations the bufferring effect of the bound
charge becomes negligible.
Theoretical calculations presented in Chapter 2 and Chapter 6
demonstrate that the capacitance of the ionic double layers is dependent
on the ion concentration near the membrane. The results presented in
Chapter 5 indicate that the ionic double layer capacitance varied with
salt concentration even at very low concentrations. This evidence
suggests that the ion concentrations near the polar regions of GMO and
egg-lecithin bilayers were not bufferred by regions of bound charge
(even at very low ion concentrations).
The fact that the polar head conductance of GMO cannot be
attributed to the bufferring of the ion concentrations in the polar
regions suggests that conduction mechanisms other than ion migration are
significant in deterraining bilayer conductivity. It was found that
large variations in the pH had no significant effect on the polar head
conductance of GMO bilayers. Therefore the possibility of conduction by
hydroxide and hydronium ion migration seems unli~ely.
141
The conductivity of the polar regions of GMO and egg-lecithin
bilayers was similar to that found for a wide variety of non-aqueous
polar liquids. Figure 7.6 co~pares the conductivities of the acetyl,
hydroxyl and choline-phosphate regions to that of pure liquids with
different dielectric constants. The results shown in figure 7.6 suggest
that when the electrolyte concentration is less than l Molar the
conductance of the hydrophobic - hydrophilic interface of egg-lecithin
and GMO bilayers is ~ainly due to the intrinsic conductivity of the
lipiri material.
ii) Conductivity at High Ion Concentrations
At high electrolyte concentrations sufficient concentrations of
ions partitioned into the polar region of GMO bilayers to contribute
significantly to the total electrical current. The time-constant
profiles for GMO at low and high concentrations are compared in figure
7.8. Provided the ion mobility in the polar regions was not very
different to that in the electrolyte then an order of magnitude estimate
of the partition coefficient between the bulk electrolyte and the polar
regions of GMO bilayers could then be made using the following equation:
conductivity of polar region conductivity of external electrolyte 7.2
The ~artition coefficient calculated from this expression was -8
approx. 10 which indicates that the energy barrier to ions in this
region is 40 KJ/Mole (loosely speaking 18 kT's).
Thus it appears that there are at least two conduction mechanisms
operating in the polar regions of egg-lecithin and GMO bilayers. That
is a non-ion migration type of conductance raechanism which is not
142
dependent on the external ion concentration, as well as an ion migration
type of conductance mechanism. The conduction due to ion migration is
negligible at low ion concentrations but increases linearly with ion
concentration until at high concentrations it
conductance mechanism.
7.44 The Conductance of the Ionic Double Layers
is the do~inant
In Chapter 2 the electrical properties of dielectrics in
equilibrium with electrolytes was calculated using the Nernst-Planck
equations. Provided the electric field is not a rapidly varying
function of position the ionic conduction in the membrane could be
approximated by the following expression:
7.3
As the ion concentrations in the ionic double layers are relatively
high one would expect these regions to have conductances similar to
that of the aqueous phase. From the values of the ionic double layer
capacitance obtained in the previous chapter the electrical
time-constant of the double layers should be many orders of magnitude
lower than that of the bilayer. In that case the dispersion in the
totai membrane impedance should have a contribution arising from the
different time-constants of the ionic double layers and the membrane.
However, it was found that no dispersion due to ionic double layers
was present at frequencies over .003 Hz, so it was impossible to
distinguish the time-constant of the ionic double layers fro~ that of
the bilayer. This indicated that the time-constant of the ionic double
layers was approximately equal to that of the membrane and also that the
143
conductance of the double layers was not proportional to the external
ion concentration. This result, as strange as it may seem, is in
agreement with the predictions of Smith (1977) which were based on the
solutions to the time-dependent Nernst-Planck equations. This
unexpected result is due to the fact that the electric field near the
membrane surface exhibits a large spatial variation (due to the high
values of space-charge in the double layers). Therefore the concepts
which are normally applied to macroscopic systems, in which the electric
field is relatively constant, do not apply in the electrolyte near the
membrane surface.
144
7.5 SUMMARY
Artificial BLM were produced from egg-lecithin - n-hexadecane and
GMO - n-hexadecane solutions. The impedance of artificial BLM was
measured using an updated version of the four-terminal digital technique
of Bell, Coster and Smith (1975) over the frequency range
.003 Hz to 10 KHz. ~odelling the impedance spectrura so obtained with a
Maxwell-Wagner dispersion enabled conclusions to be drawn concerning the
dielectric structure and conductance profile of the hydrophobic interior
and the hydrophobic - hydrophilic interface of lipid bilayers.
By comparing the dielectric structures of GMO and egg-lecithin
bilayers it was possible to assign values of resistance and capacitance
to the acetyl, hydroxyl and choline phosphate regions of these bilayers.
The dispersion in membrane capacitance in the frequency range
.003 Hz to 10 Hz was associated with the acetyl regions of the GMO and
egg-lecithin molecules. At higher frequencies the capacitance
dispersion was associated \'lith the hydroxyl and choline phosphate groups
of the Gl-10 and egg-lecithin molecules.
From the capacitance of each electrically distinct region within
the polar heads of the lipids it was possible to gain estimates of the
dielectric constant of these regions. It was found that the dielectric
constant of the polar head regions varied with position over the range
6-40 and was akin to that of chemically similar polar liquids.
The conductance of the regions containing the acetyl groups and
hydroxyl groups of the G~O and egg-lecithin molecules was much less than
that of purified water. Further, a 10- fold change in the external ion
145
concentrations had only marginal effects on the dielectric properties of
these regions. Thus it was concluded that electrolyte penetration into
the polar regions of these bilayers was negligible in egg-lecithin
bilayers and became significant in GMO bilayers only at ion
concentrations in excess of l Molar; with the possible exception of the
choline phosphate regions as these had relatively high conductivities.
The variation of polar head conductance with external ion
concentration was consistent with two conductance mechanisms in the
polar regions of egg-lecithin and GMO bilayers: a non ion-migration
mechanism which was dominant at low ion concentrations and an ion
migration type of conductance with was do~inant at high electrolyte
concentrations.
The partition coefficient of ions in the hydroxyl region of GMO
bilayers, calculated from the electrical conductivity at high
electrolyte concentrations, was found to be l~~
The time-constant of the ionic double layers was found to be equal
to that of the bilayer itself. This was in agreement with the
predictions of Smith (1977) based on the solutions to the time-dependent
Nernst-Planck equations.
CHAPTER 8
THE DIELECTRIC STRUCTURE OF ARTIFICIAL BLM:
I THE EFFECT OF CHOLESTEROL AND n-ALKANE INCLUSION
II THE EFFECT OF D20/H 2 0 REPLACEMENT IN THE AQUEOUS PHASE
8. l INTRODUCTION
8.2 METHODS
8.3 RESULTS
8.4
8.31 The Effect of Cholesterol on Bilayer Impedance
8.32 The Effect of D2 0/H 20 Replacement
8.33 The Effect of n-Alkane Absorption
DISCUSSION
8.41 The Location of Cholesterol in Egg-Lecithin Bilayers
8.42 The Effect of D2 0/H 20 Replacement on Bilayer Structure
8.43 The Location of n-Alkane Chains in Eg~-Lecithin Bilayers
8.5 SUMMARY
146
Page
147
150
150
150
151
151
152
152
154
155
156
147
8. l INTRODUCTION
In the previous chapter the dielectric structure of the
hydrophobic-hydrophilic interface of egg-lecithin and GMO bilayers was
characterized. This chapter is concerned with the effects on the
dielectric substructure of cholesterol and n-alkane incorporation into
egg-lecithin and GMO bilayers, as well as the effect of replacing the
aqueous phase with D2 0. The results will be interpreted on the basis of
the dielectric model of egg-lecithin bilayers developed in the previous
chapter.
Cholesterol is a major component of most biological membranes.
Though many studies on the effects of cholesterol have been made its
role in biological membranes is not well understood. In general it
seems that cholesterol acts as a moderator of membrane properties.
Cholesterol, when present in biological membranes, has been found to
reduce the thermal sensitivity in mammalian cells {Cress and Gerner,
1980) and increase ethanol tolerance in erythrocyte membranes in mice
(Chin, Parsons and Goldstein, 1978). Thus it seems that cell membranes
high cholesterol levels are much less susceptible to the action of
membrane soluble drugs and changes in the external environment.
However, cholesterol has also been found to induce local anaesthesia in
membranes which do not normally have cholesterol {Stephens and
Shinitzky, 1977).
X-ray and neutron diffraction studies { Franks, 1976, Worcester and
Franks, 1976 and McIntosh, 1978) indicate that cholesterol is aligned
perpendicular to the plane of the bilayer with its rigid ring structure
embedded in the acyl chain region, and its hydroxyl group located in the
148
vicinity of the glycerol region of the phospholipids. The exact location
of cholesterol in egg-lecithin bilayers has been the subject of some
debate. NMR studies by Darke, Finer ,Flook and Phillips (1972) on lipid
vesicles indicate interactions between the hydroxyl group of cholesterol
and the phosphate group of the lipids. This was later confirmed by
Phillips and Finer (1974). However, Huang (1976), on the basis of
previous reports concerning stereo specificity of phospholipid-steroid
interactions (eg. Brockerhoff, 1974), suggested that the hydroxyl group
of cholesterol interacts with the carbonyl groups of the phospholipids.
Subsequent NMR studies by Chatterjie and Brockerhoff (1978) support this
suggestion. A more recent study (Reiber, 1978) gave evidence indicating
that hydrogen bonding does not occur between cholesterol and lipid
molecules in lipid bilayers. Reiber went on to say that the stereo
specific interactions reported in earlier studies may have been due to
different degrees of hydration of the hydroxyl groups of the different
cholesterol isomers. However this evidence does not rule out the planar
alignment of the hydroxy groups of cholesterol and the carbonyl groups
of the lipids.
Low frequency impedance measurements similar to those described in
the previous chapter were also made on egg-lecithin bilayers containing
oxidised cholesterol. Oxidised cholesterol is a mixture of pure
cholesterol {95%) together with some of its oxidation products (see
Chapter 2). Some of the oxidation products of cholesterol have been
isolated from biological material {see Feiser and Feiser, 1959 and also
see Chapter 1). Hence, the composition and structure of egg-lecithin
bilayers, with added oxidised cholesterol, are presumably closer to that
of lipid bilayers present in cell ~embranes, than those of the pure
egg-lecithin bilayers described in the previous chapter. These
measurements also allow an investigation of whether the location of
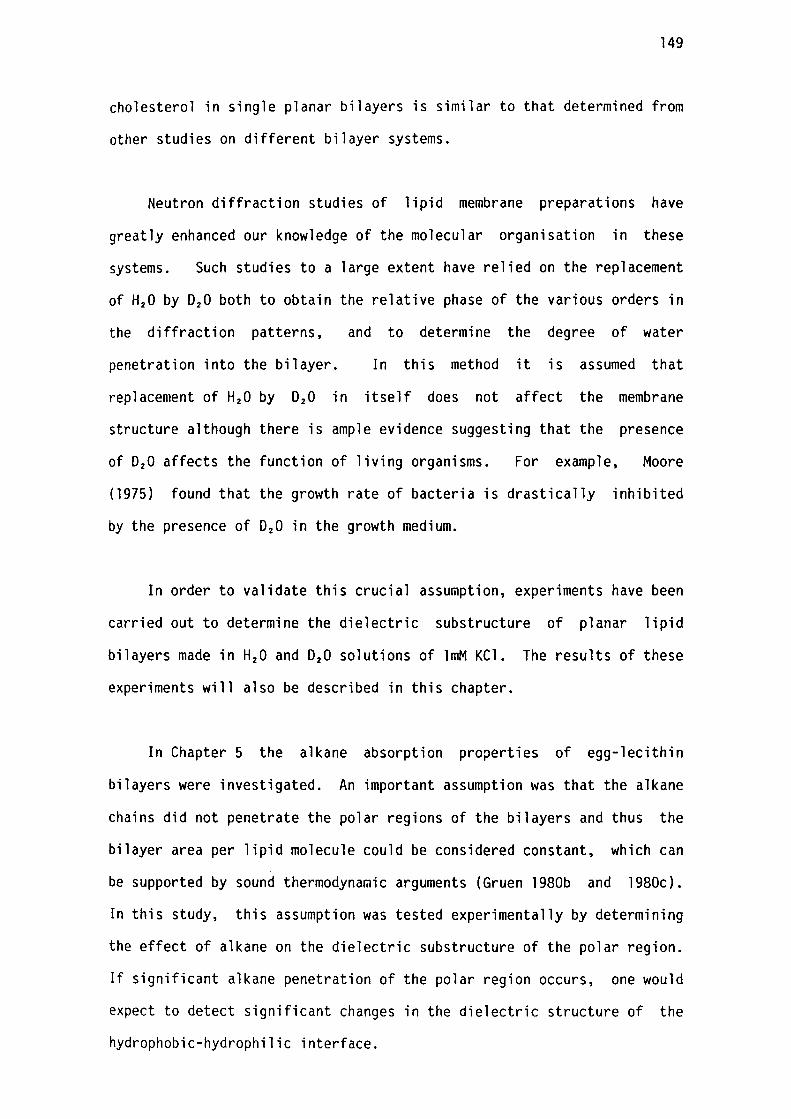
149
cholesterol in single planar bilayers is similar to that determined from
other studies on different bilayer systems.
Neutron diffraction studies of lipid membrane preparations have
greatly enhanced our knowledge of the molecular organisation in these
systems. Such studies to a large extent have relied on the replacement
of H2 o by 02 0 both to obtain the relative phase of the various orders in
the diffraction patterns, and to determine the degree of water
penetration into the bilayer. In this method it is assumed that
replacement of H2 o by D2 0 in itself does not affect the membrane
structure although there is ample evidence suggesting that the presence
of D2 0 affects the function of living organisms. For example, Moore
(1975) found that the growth rate of bacteria is drastically inhibited
by the presence of D2 0 in the growth medium.
In order to validate this crucial assumption, experiments have been
carried out to determine the dielectric substructure of planar lipid
bilayers made in H2 o and D2 0 solutions of lmM KCl. The results of these
experiments will also be described in this chapter.
In Chapter 5 the alkane absorption properties of egg-lecithin
bilayers were investigated. An important assumption was that the alkane
chains did not penetrate the polar regions of the bilayers and thus the
bilayer area per lipid molecule could be considered constant, which can
be supported by sound thermodynaraic arguments (Gruen 1980b and 1980c).
In this study, this assumption was tested experimentally by determining
the effect of alkane on the dielectric substructure of the polar region.
If significant alkane penetration of the polar region occurs, one would
expect to detect significant changes in the dielectric structure of the
hydrophobic-hydrophilic interface.
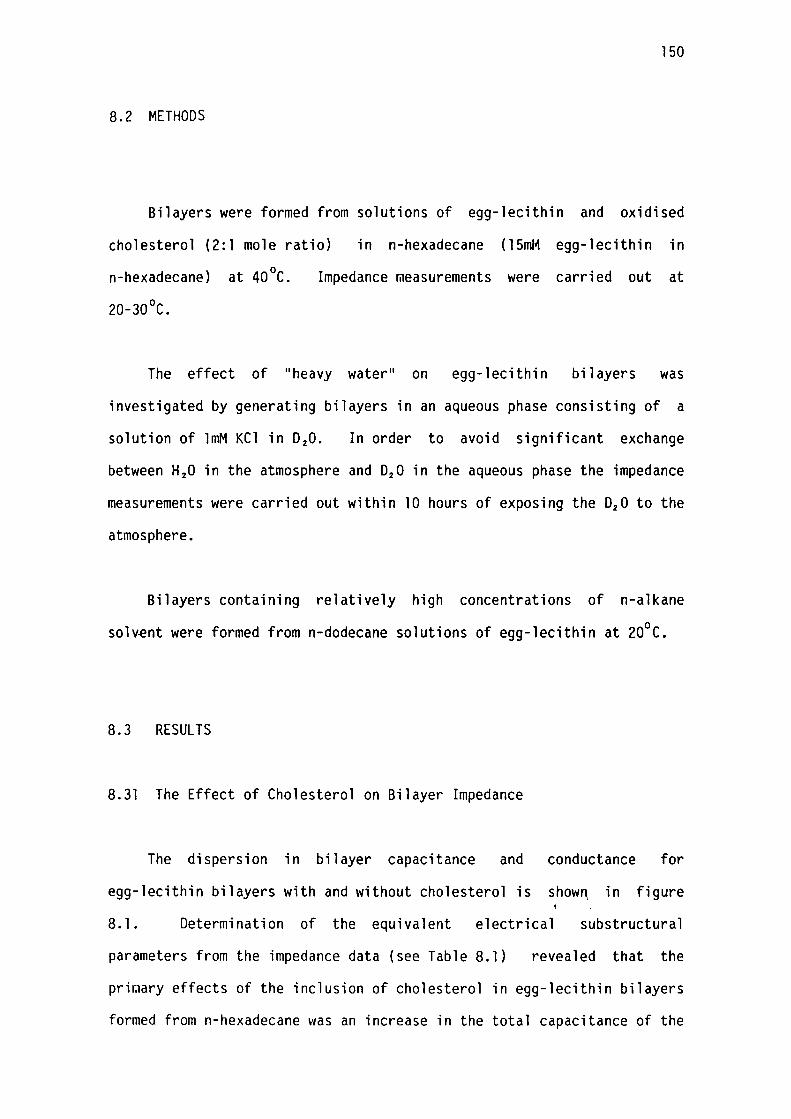
150
8.2 METHODS
Bilayers were formed from solutions of egg-lecithin and oxidised
cholesterol (2:l mole ratio) in n-hexadecane (l5mM egg-lecithin in
n-hexadecane)
20-30°C.
0 at 40 C. Impedance measurements were carried out at
The effect of "heavy water" on egg-lecithin bilayers was
investigated by generating bilayers in an aqueous phase consisting of a
solution of lmM KCl in D2 0. In order to avoid significant exchange
between H2o in the atmosphere and D2 0 in the aqueous phase the impedance
measurements were carried out within 10 hours of exposing the D2 0 to the
atmosphere.
Bilayers containing relatively high concentrations of n-alkane
solv~nt were formed from n-dodecane solutions of egg-lecithin at 20°C.
8.3 RESULTS
8.31 The Effect of Cholesterol on Bilayer Impedance
The dispersion in bilayer capacitance and conductance for
egg-lecithin bilayers with and without cholesterol is show~ in figure l
8. l. Determination of the equivalent electrical substructural
parameters from the impedance data (see Table 8.1) revealed that the
pri~ary effects of the inclusion of cholesterol in egg-lecithin bilayers
formed from n-hexadecane was an increase in the total capacitance of the
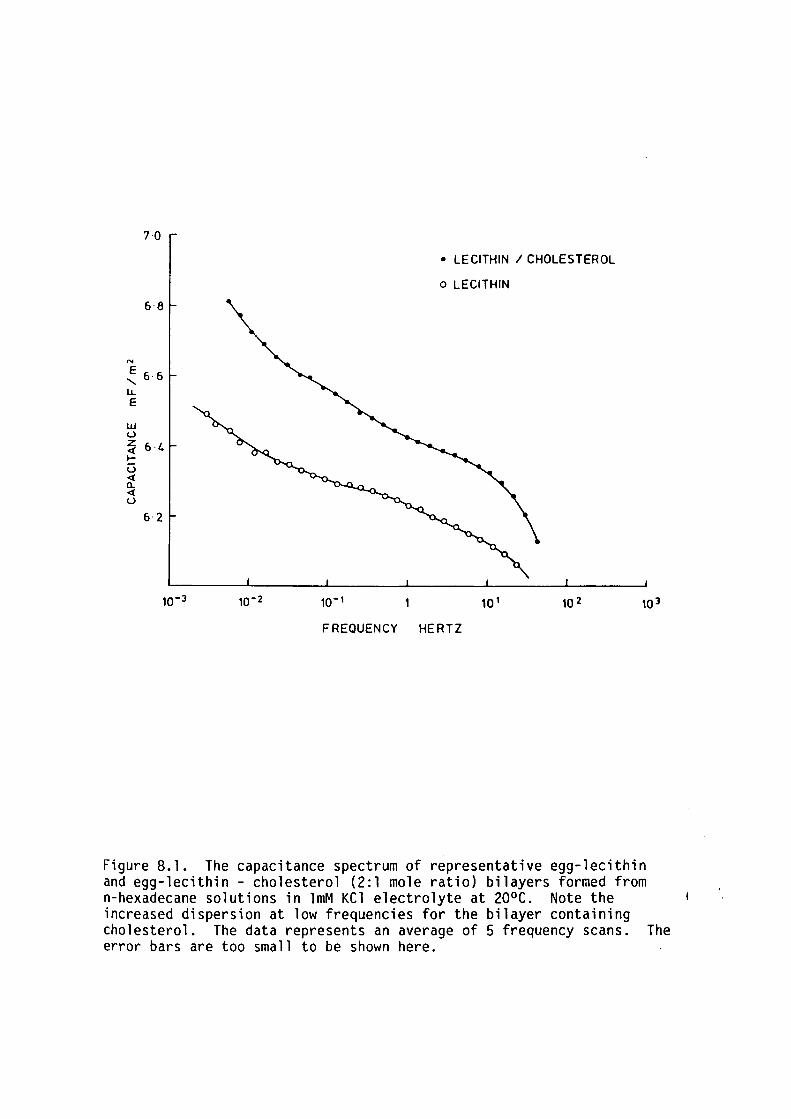
7·0
6·8
N
E 6·6
' 1.1. E
UJ <.) z f,-l, <( I-u <( a.. <( <.)
6·2
10- 1
• LECITHIN / CHOLESTEROL
o LECITHIN
10 1 10 2
FREQUENCY HERTZ
10 3
Figure 8.1. The capacitance spectrum of representative egg-lecithin and egg-lecithin - cholesterol (2:1 mole ratio) bilayers formed from n-hexadecane solutions in lmM KCl electrolyte at 20°C. Note the increased dispersion at low frequencies for the bilayer containing cholesterol. The data represents an average of 5 frequency scans. The error bars are too small to be shown here.
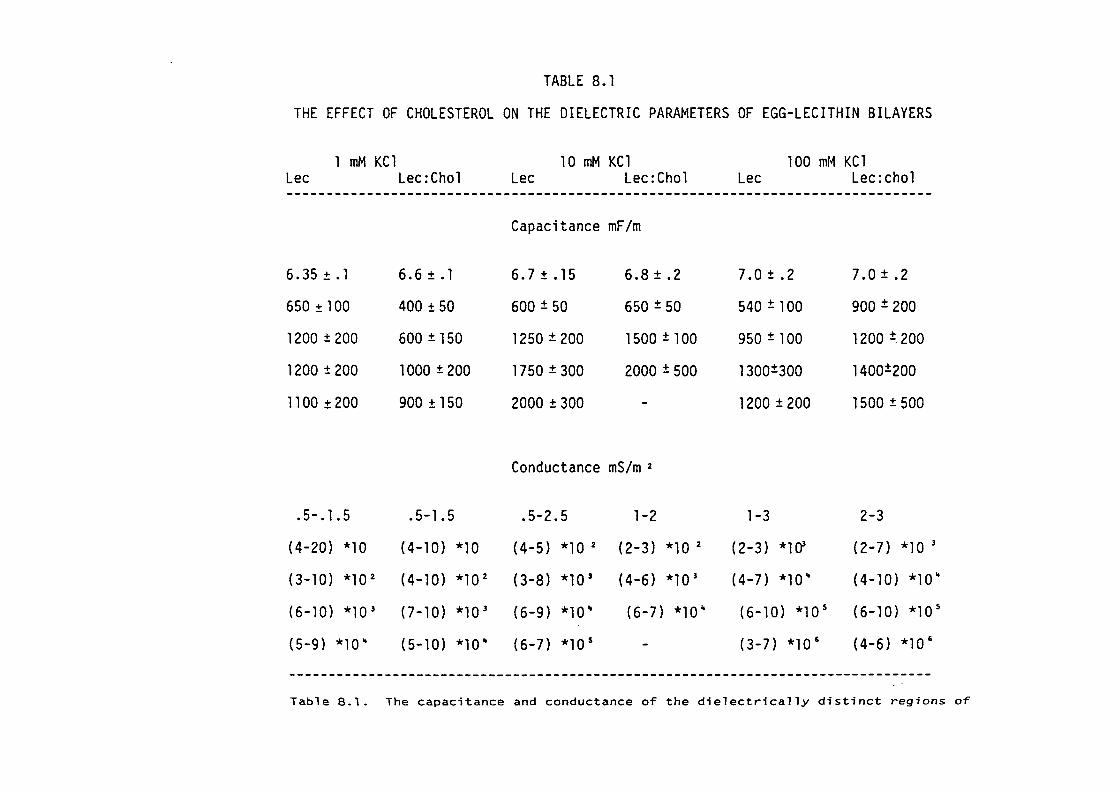
TABLE 8.1
THE EFFECT OF CHOLESTEROL ON THE DIELECTRIC PARAMETERS OF EGG-LECITHIN BILAYERS
1 mM KCl 10 mM KCl 100 mM KCl Lee Lec:Chol Lee Lec:Chol Lee Lec:chol
Capacitance mF/m
6. 35 ± • l 6.6±.1 6.7±.15 6.8 ± .2 7.0±.2 7.0±.2
650 ± l 00 400 ± 50 600 ± 50 650 ± 50 540 ± 100 900 ± 200
1200 ± 200 600 ± 150 1250 ± 200 1500 ± l 00 950 ± 100 1200 ± 200
1200 ± 200 1000 ± 200 1750 ± 300 2000 ± 500 13QQ±3QO 1400±200
1100 ± 200 900 ± 150 2000 ± 300 - 1200 ± 200 1500 ± 500
Conductance mS/m 2
.5-.1.5 • 5-1 • 5 .5-2.5 1-2 1-3 2-3
(4-20) *10 ( 4-10) *10 (4-5) *10 2 (2-3) *10 2 (2-3) *1()3 (2-7) *10 3
(3-10) *10 2 (4-10) *10 2 (3-8) *10 3 (4-6) *10 3 (4-7) *10" ( 4-10) *10"
(6-10) *10 3 (7-10) *10 3 (6-9) *10" (6-7) *10" (6-10) *10 5 (6-10) *10 5
(5-9) *10" (5-10) *10" (6-7) *10 5 - (3-7) *10 6 (4-6) *10 6
Table 8.1. The capacitance and conductance of the dielectrically distinct regions of
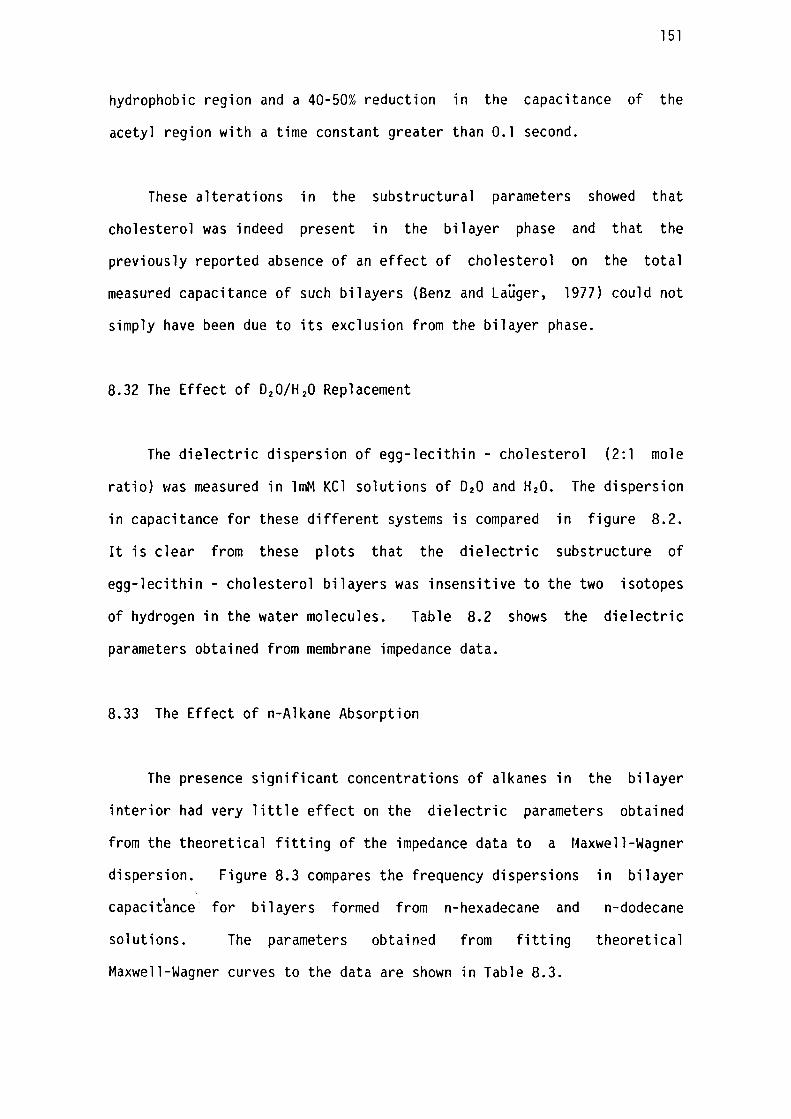
151
hydrophobic region and a 40-50% reduction in the capacitance of the
acetyl region with a time constant greater than 0. l second.
These alterations in the substructural parameters showed that
cholesterol was indeed present in the bilayer phase and that the
previously reported absence of an effect of cholesterol on the total
measured capacitance of such bilayers (Benz and Lauger, 1977) could not
simply have been due to its exclusion from the bilayer phase.
8.32 The Effect of D20/H 20 Replacement
The dielectric dispersion of egg-lecithin - cholesterol (2:1 mole
ratio) was measured in lmM KCl solutions of 020 and H20. The dispersion
in capacitance for these different systems is compared in figure 8.2.
It is clear from these plots that the dielectric substructure of
egg-lecithin - cholesterol bilayers was insensitive to the two isotopes
of hydrogen in the water molecules. Table 8.2 shows the dielectric
parameters obtained from membrane impedance data.
8.33 The Effect of n-Alkane Absorption
The presence significant concentrations of alkanes in the bilayer
interior had very little effect on the dielectric parameters obtained
from the theoretical fitting of the impedance data to a Maxwell-Wagner
dispersion. Figure 8.3 compares the frequency dispersions in bilayer
"tl capac1 ance
solutions.
'
for bilayers formed from n-hexadecane and n-dodecane
The parameters obtained from fitting theoretical
Maxwell-Wagner curves to the data are shown in Table 8.3.
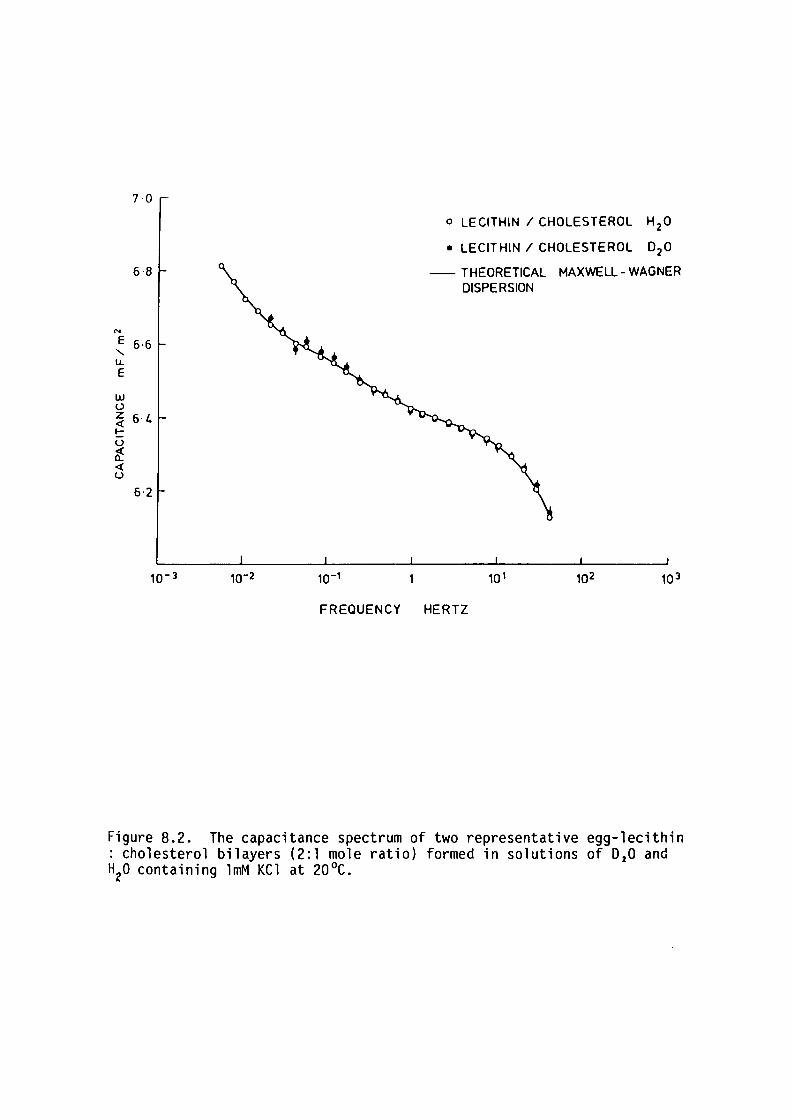
7 0
6·8
N
E 6·6
' lL E
w u z 6·4 <(
!:: u ~ <( u
6·2
o LECITHIN / CHOLESTEROL H20
• LECITHIN/ CHOLESTEROL 0 20
- THEORETICAL MAXWELL-WAGNER DISPERSION
10 1 10 3
FREQUENCY HERTZ
Figure 8.2. The capacitance spectrum of two representative egg-lecithin : cholesterol bilayers (2:1 mole ratio) formed in solutions of 0 20 and H2o containing lmM KCl at 20°c.
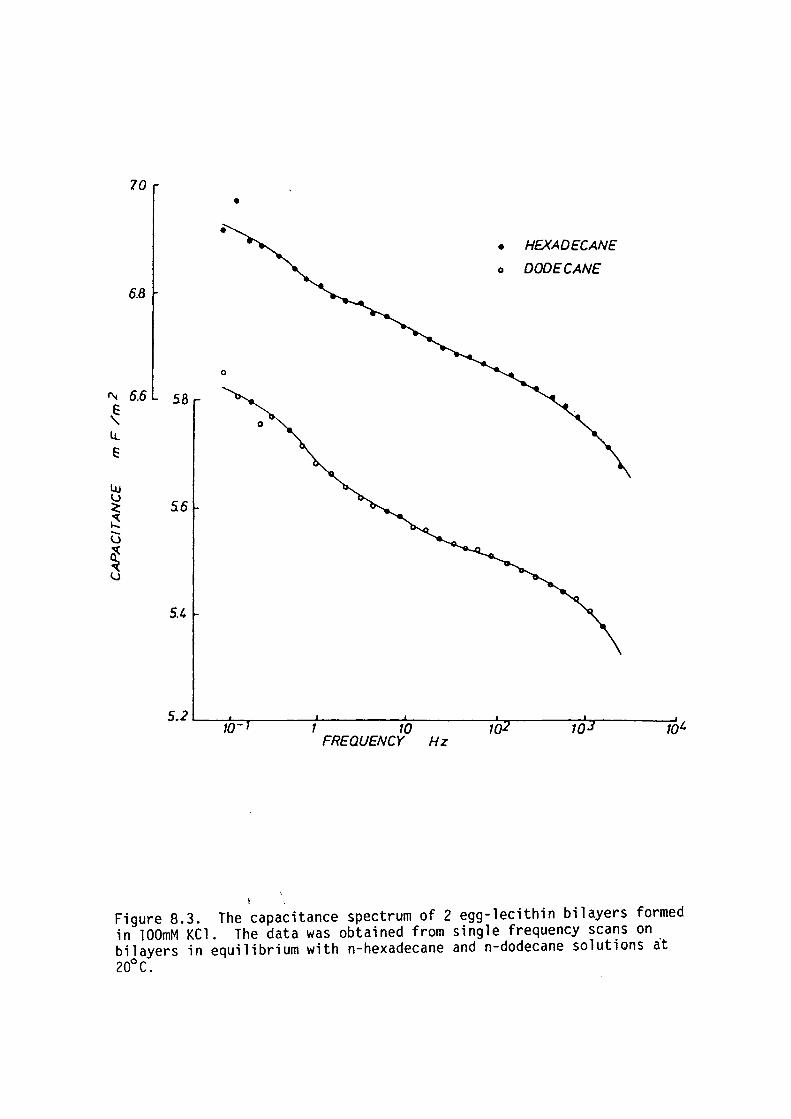
10 •
• HEXADECANE
o DODECANE
6.8
0
l"\j 6.6 58 ~ ~ 0
u.. E
IJJ l)
~ 56 ~ -l) ~ l)
5.4
5.2 ,.___-;n-=r-----:-------:;';;-----~r-------:'-,.------' 10- 1 FREQUENC?O Hz 1 10 101.
I
Figure 8.3. The capacitance spectrum of 2 egg-lecithin bilayers formed in lOOmM KCl. The data was obtained from single frequency scans on bilayers in equilibrium with n-hexadecane and n-dodecane solutions at 20°c.
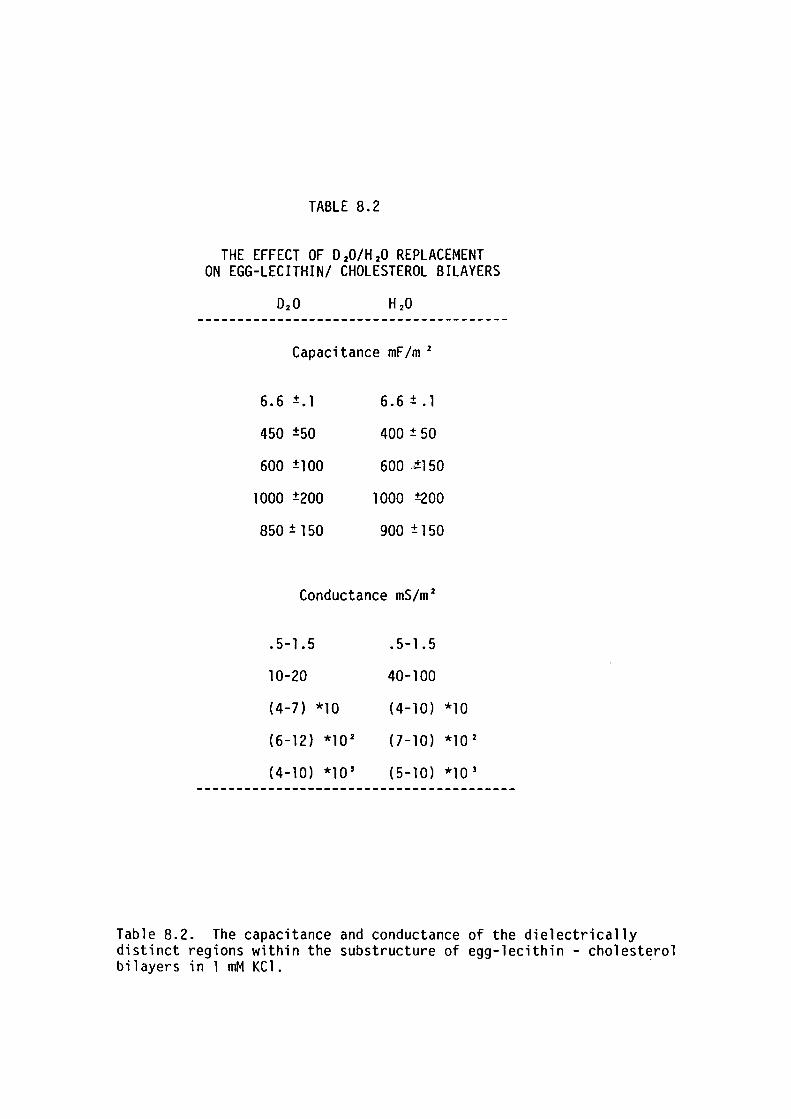
TABLE 8.2
THE EFFECT OF D20/H 20 REPLACEMENT ON EGG-LECITHIN/ CHOLESTEROL BILAYERS
Capacitance mF /m 2
6.6 ±.1
450 ±50
600 ±lQQ
1000 ±200
850 ± 150
6.6±.1
400 ± 50
600 .tl 50
1000 ±200
900 ± 150
Conductance mS/m 2
.5-1.5 . 5-1 . 5
10-20 40-100
(4-7) *10 (4-10)
(6-12) *l O 2 (7-10)
( 4-10) *10' ( 5-10)
*10
*l O 2
*l O 1
----------------------------------------
Table 8.2. The capacitance and conductance of the dielectrically distinct regions within the substructure of egg-lecithin - cholest~rol bilayers in l mM KCl.
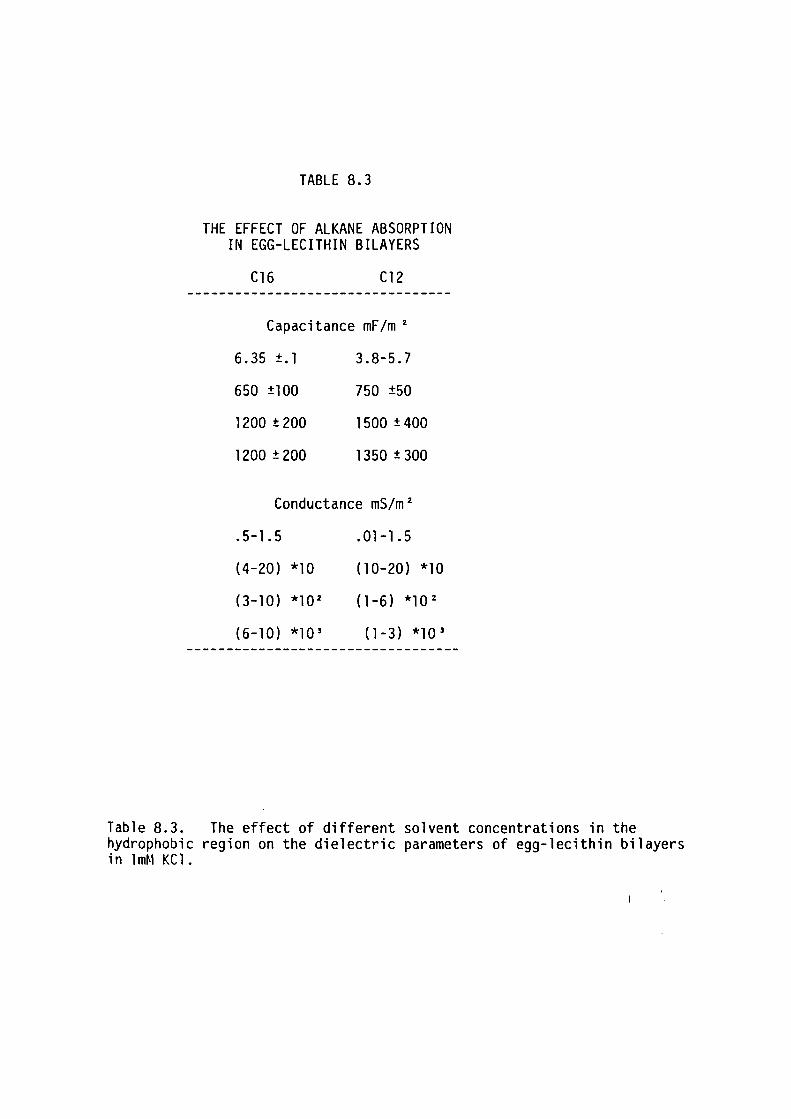
TABLE 8.3
THE EFFECT OF ALKANE ABSORPTION IN EGG-LECITHIN BILAYERS
C16 C12
Capacitance mF /m 2
6.35 ±.1
650 ±100
1200 t 200
1200 ± 200
3.8-5.7
750 ±50
1500 ± 400
1350 ± 300
Conductance mS/m 2
• 5-1 • 5
(4-20) *10
(3-10) *10 2
(6-10) *10'
.01-1.5
(10-20) *10
(1-6) *10 2
(1-3) *10'
Table 8.3. The effect of different solvent concentrations in the hydrophobic region on the dielectric parameters of egg-lecithin bilayers in lmM KCl.
152
8.4 DISCUSSION
8.41 The Location of Cholesterol in Egg-Lecithin Bilayers
On the basis of the studies described
concluded that the increase in the overall
in Chapter 6, it was
bilayer capacitance of
egg-lecithin bilayers when cholesterol was present, was not due to a
decrease in membrane thickness but rather to an increase in the
capacitance of the ionic double layers external to the membrane. The
apparent increase in the capacitance of the hydrophobic region
(extracted from the impedance dispersion data) also incorporated the
effects due to these same ionic double layers (see Chapter 7). By
taking the capacitance of the ionic double layers into account, the
dielectric capacitance of the bilayer was found to slightly decrease
(2-3%) with the addition of cholesterol.
The dielectric time-constant profiles of egg-lecithin bilayers with
and without cholesterol are compared in figure 8.4. The profiles were
generated in the same manner as those in Chapter 7. If either the
dielectric constant or thickness of the hydrophobic - hydrophilic
interface of egg-lecithin bilayers was altered by the presence of
cholesterol, then one would expect the time-constant profiles to be
different. The location of cholesterol within the bilayer could be
determined from the relative effects of its inclusion in the bilayer
structure upon the bilayer time-constant profile.
Examination of figure 8.4 reveals that the inclusion of cholesterol
in the bilayer structure had the effect of broadening (ie. decreasing
the capacitance) those regions with electrical time-constants in the
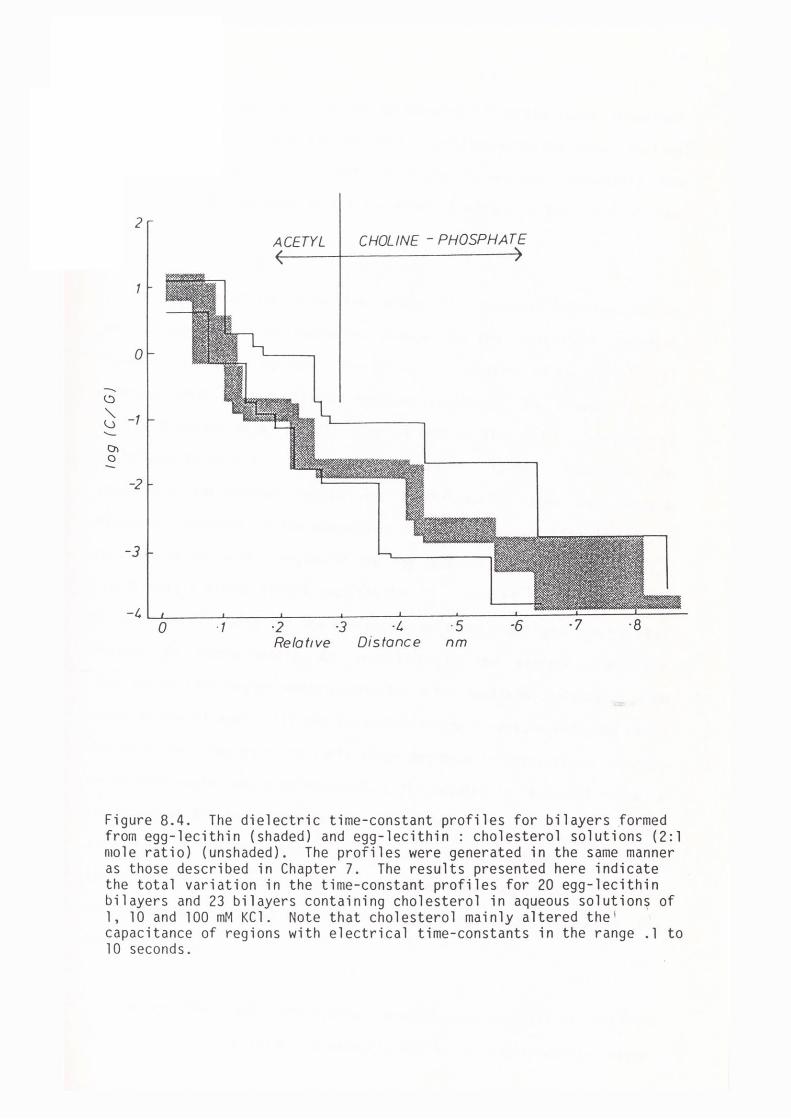
2 ACETYL CHOLINE - PHOSPHATE
0
-t.'.) "- -1 (_.) .,__
OI 0
-2
-3
-I. L..L ___ .J._ __ ...J.._ __ -4-__ _L __ ____.L ___ '::-__ --=-__ -:-__ ·2 ·] ·I. ·5 ·6 ·7 ·8 0 · 1 Relat,ve Distance nm
Figure 8.4. The dielectric time-constant profiles for bilayers formed from egg-lecithin (shaded) and egg-lecithin : cholesterol solutions (2:1 mole ratio) (unshaded). The profiles were generated in the same manner as those described in Chapter 7. The results presented here indicate the total variation in the time-constant profiles for 20 egg-lecithin bilayers and 23 bilayers containing cholesterol in aqueous solution~ of 1, 10 and 100 mM KCl. Note that cholesterol mainly altered the 1
capacitance of regions with electrical time-constants in the range . 1 to 10 seconds.
153
range 0.1 to 10 seconds. It can be concluded from the study described
in Chapter 7 that these regions were associated with the inner portion
of the acetyl region. The decrease in capacitance was presumably the
result of a 40% decrease in the dielectric constant in this part of the
bilayer.
Alteration of the effective dielectric constant of any region
should produce a corresponding change in the equivalent parallel
capacitance of that region. The dielectric constant of the cholesterol
molecule (with the exception of the hydroxyl group) is thought to be
2.27 (Fettiplace et al., 1971), whereas that of the lecithin acyl chains
is thought to be 2.1 - 2.2 (Huang and Levitt, 1977). Therefore the
presence of cholesterol should not significantly alter the average
dielectric constant of the hydrophobic region. However, the dielectric
constant of the acetyl region of the egg-lecithin bilayers appears to be
significantly higher (6-12) (see Chapter 7). Thus if the ring structure
of cholesterol, with its low dielectric constant, bridges the acetyl
region, an approximately 30% reduction in the average dielectric
constant of that region would result for a 2:1 lecithin-cholesterol mole
ratio in the bilayer. If the cholesterol ring structure extended into
the polar head region a similarly large decrease in capacitance of the
polar head region would be expected. The results in Table 8. l show a
reduction of 30% in the capacitance of the acetyl region without a large
alteration of the polar head capacitance. This indicates that the
cholesterol ring structure certainly extends into the glycerol bridge
region but not as far as the inner portion of the polar heads of the
lecithin molecules.
On the other hand, the hydroxyl group on the cholesterol molecule
should be reasonably polar, presumably having a significantly higher
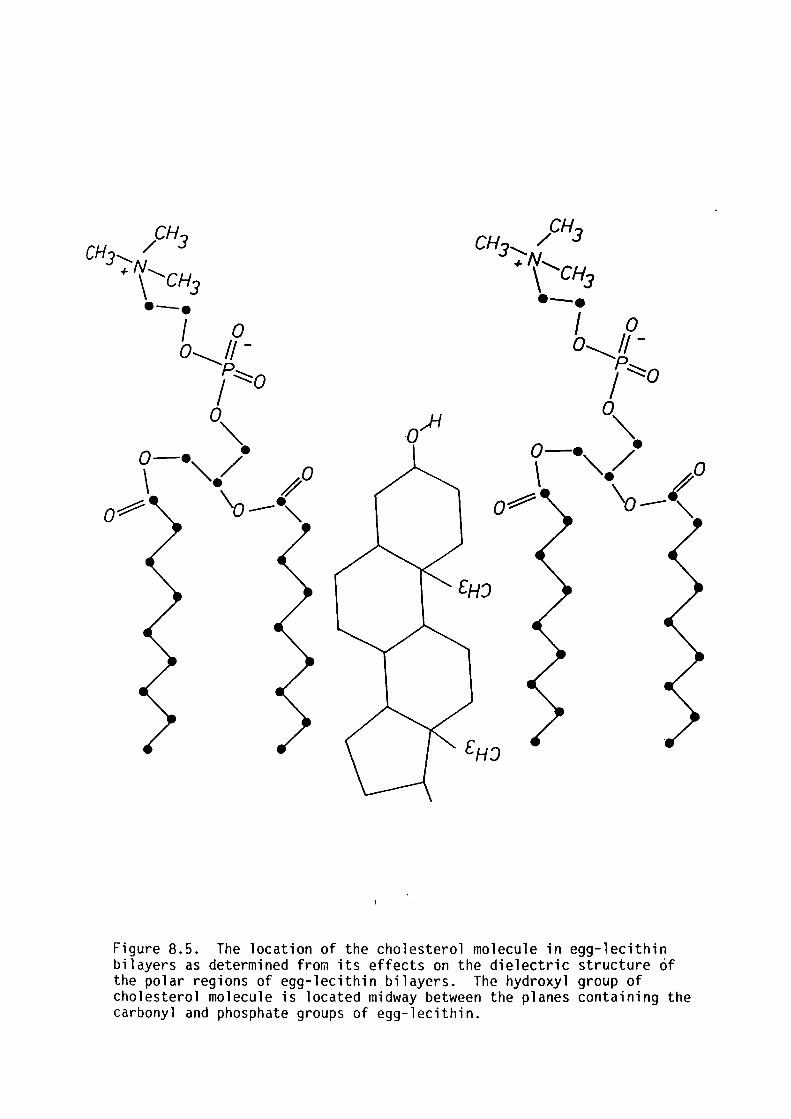
CH CH / 3 3,
+l('CH3
·-· I o 0~11-
P::::::::o I o'\.
0-• /. \ "-• ~o
0~ "a--·"
Figure 8.5. The location of the cholesterol molecule in egg-lecithin bilayers as determined from its effects on the dielectric structure of the polar regions of egg-lecithin bilayers. The hydroxyl group of cholesterol molecule is located midway between the planes containing the carbonyl and phosphate groups of egg-lecithin.
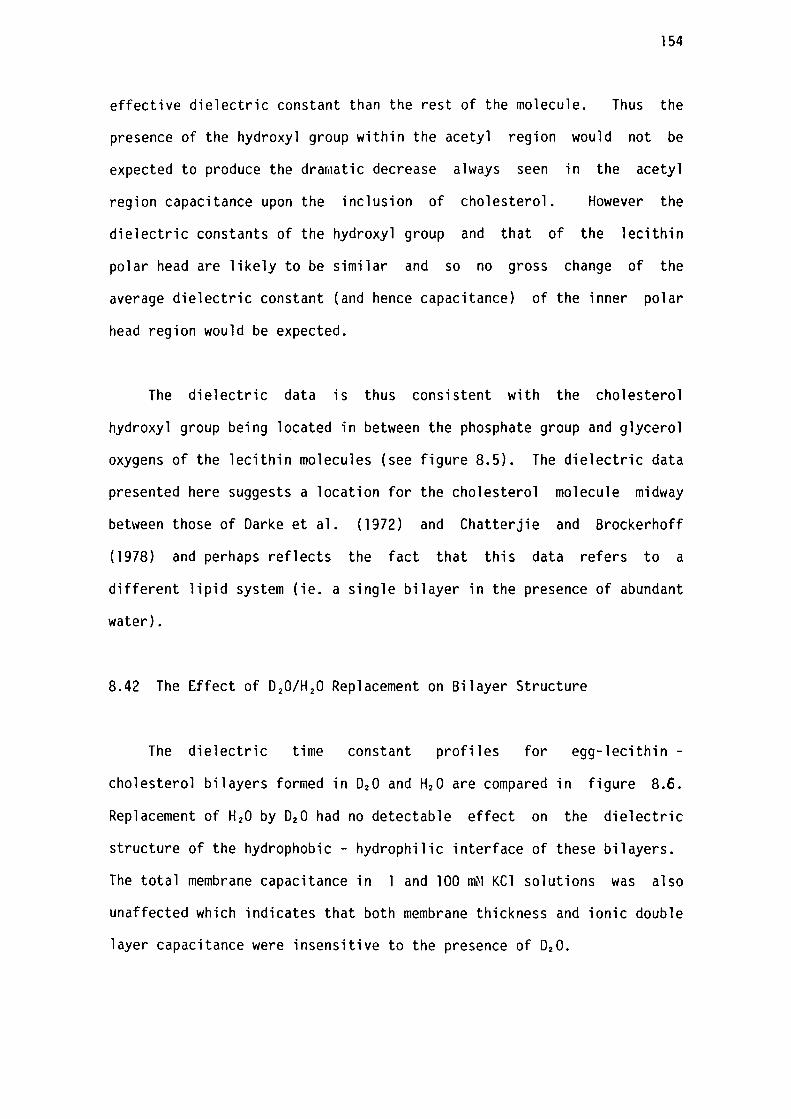
154
effective dielectric constant than the rest of the molecule. Thus the
presence of the hydroxyl group within the acetyl region would not be
expected to produce the drawatic decrease always seen in the acetyl
region capacitance upon the inclusion of cholesterol. However the
dielectric constants of the hydroxyl group and that of the lecithin
polar head are likely to be similar and so no gross change of the
average dielectric constant (and hence capacitance) of the inner polar
head region would be expected.
The dielectric data is thus consistent with the cholesterol
hydroxyl group being located in between the phosphate group and glycerol
oxygens of the lecithin molecules (see figure 8.5). The dielectric data
presented here suggests a location for the cholesterol molecule midway
between those of Darke et al. (1972) and Chatterjie and Brockerhoff
(1978) and perhaps reflects the fact that this data refers to a
different lipid system (ie. a single bilayer in the presence of abundant
water).
8.42 The Effect of D20/H 20 Replacement on Bilayer Structure
The dielectric time constant profiles for egg-lecithin -
cholesterol bilayers formed in D20 and H20 are compared in figure 8.6.
Replacement of H20 by D20 had no detectable effect on the dielectric
structure of the hydrophobic - hydrophilic interface of these bilayers.
The total membrane capacitance in l and 100 m~1 KCl solutions was also
unaffected which indicates that both membrane thickness and ionic double
layer capacitance were insensitive to the presence of 020.
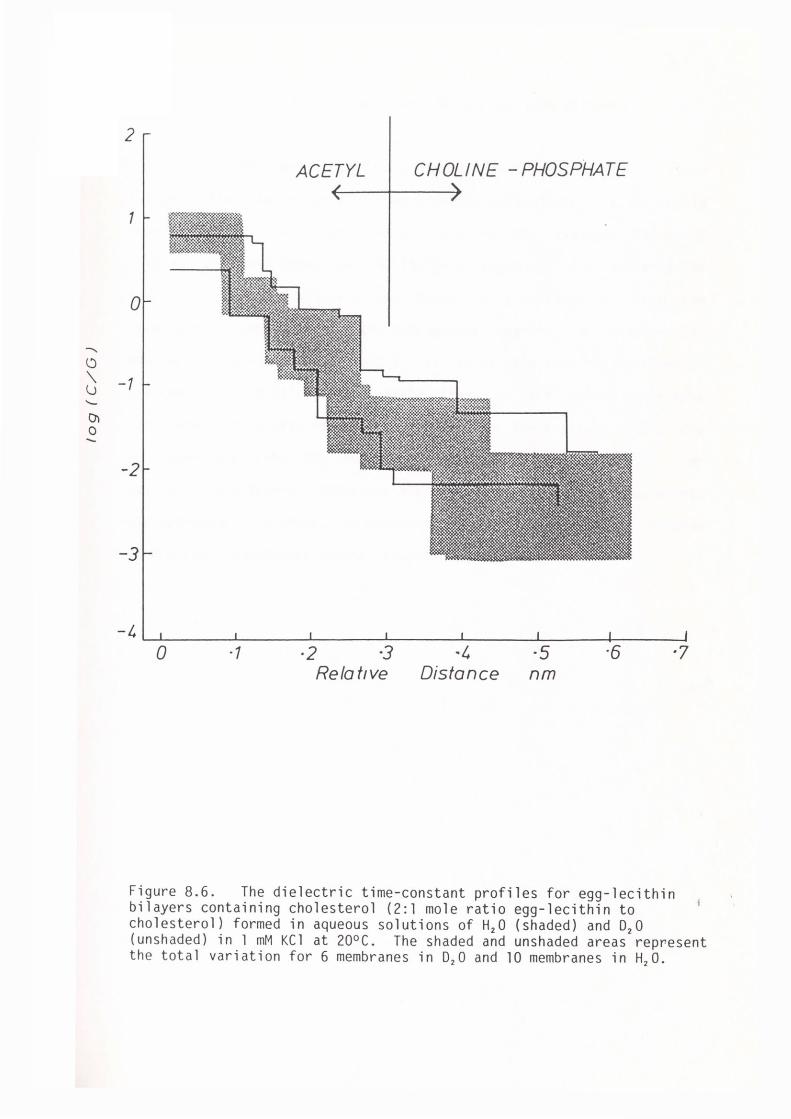
"' ('.)
\. lJ ......
°' 0 --
2
ACETYL CHOLINE -PHOSPHATE
1
0
-1
-2
-3
-4L....J. ___ _._ __ _L ___ --1-__ ----1. ___ J._ _____ ----j
·6 ·7 0 ·2 ·3 ·4 Distance
·5 nm
·1 Reio five
Figure 8.6 . The dielectric time-constant profiles for egg-lecithin bilayers containing cholesterol (2:1 mole ratio egg-lecithin to cholesterol) formed in aqueous solutions of H2 o (shaded) and 02 0 (unshaded) in l mM KCl at 20°C . The shaded and unshaded areas represent the total variation for 6 membranes in 02 0 and 10 membranes in H2 o.
155
8.43 The Location of n-Alkane Chains in Egg-Lecithin Bilayers
If n-alkanes were to partition into the polar regions of a lipid
bilayer, then the presence of a hydrophobic molecule (Er= 2. l) would
have the effect of significantly reducing the average dielectric
constant and hence capacitance of the polar regions. The presence of
n-alkanes in lipids bilayers was found to significantly alter the
structure and composition of the hydrophobic region (see Chapter 5).
However, from examining Table 8.3, it can be seen that the presence of
n-alkane in lipid bilayers had little effect on the polar dielectric
structure. From this it can be concluded that the n-alkane chains did
not penetrate into the acetyl or choline phosphate regions of
egg-lecithin bilayers. Hence the alkanes are mainly located deep within
the hydrophobic interior, in agreement with the results of neutron
diffraction experiments (White, King and Cain, 1981).
156
8.5 SUMMARY
In the present study the low frequency impedance dispersions of
bilayers formed from egg-lecithin and those from egg-lecithin - oxidised
cholesterol (2:1 mole ratio) were compared. The presence of oxidised
cholesterol in the bilayer structure caused a 5% increase in the bilayer
capacitance (in lmM KCl) over the frequency range .003-10000 Hz, as well
as a decrease in the capacitance of the acetyl region. The former
effect was due to changes in the ionic double layers external to the
membrane which has been discussed in Chapters 6 and 7.
The effect of oxidised cholesterol on the various dielectric
parameters of the bilayer hydrophobic - hydrophilic interface allowed
the location of cholesterol in the bilayer structure to be determined.
The data was consistent with the ring structure of cholesterol being
embedded in the acyl chain region and penetrating the acetyl region.
This suggested that the location of the hydroxyl group of the
cholesterol molecules was midway between the plane containing the
phosphate groups and the carbonyl groups of the lipids.
The presence of n-alkanes in egg-lecithin bilayers had a
significant effect on bilayer thickness. However, the dielectric
structure of the polar regions was insensitive to the presence of
n-alkanes. It was therefore concluded that n-alkanes are not present in '
the polar head regions df egg-lecithin bilayers and that they must be
located deep within the bilayer structure.
It was generally concluded in the present study that replacement of
H2o by 02 0 had essentially no effect on the dielectric structure of
157
egg-lecithin - cholesterol bilayers and therefore should not effect the
fidelity of the bilayer structure determined by neutron diffraction
methods.
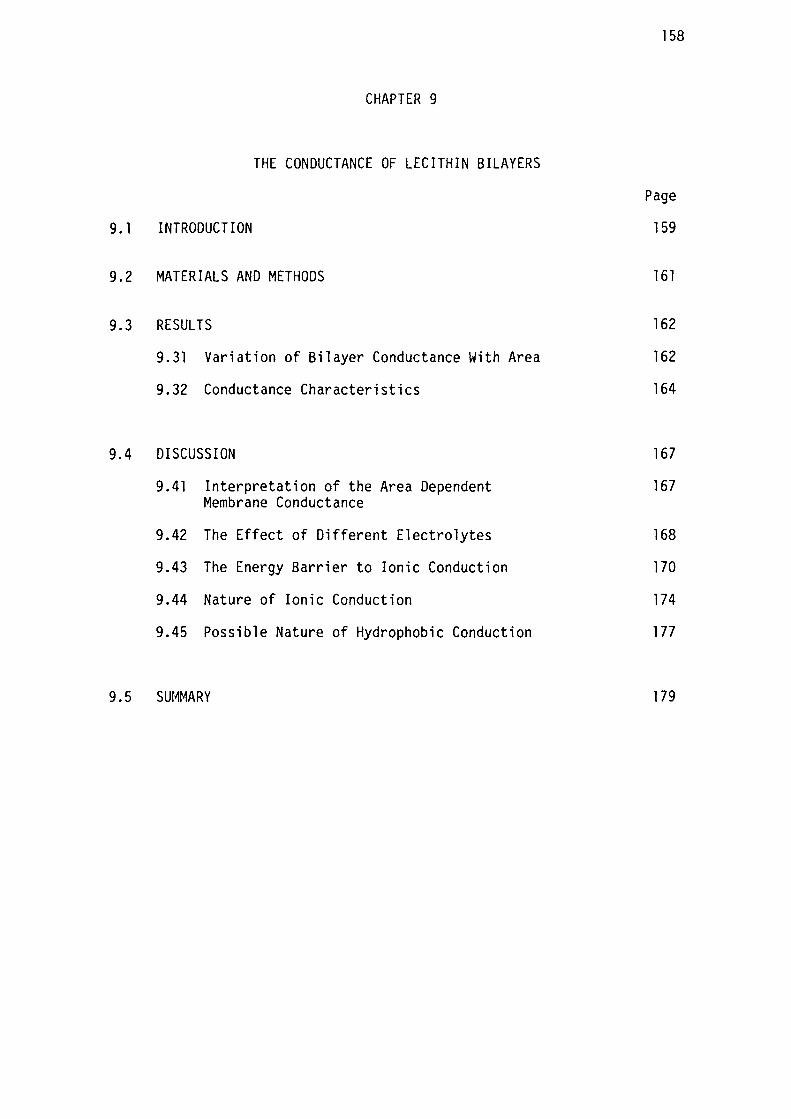
CHAPTER 9
THE CONDUCTANCE OF LECITHIN BILAYERS
9.1 INTRODUCTION
9.2 MATERIALS AND METHODS
9.3 RESULTS
9.4
9.31 Variation of Bilayer Conductance With Area
9.32 Conductance Characteristics
DISCUSSION
9.41 Interpretation of the Area Dependent Membrane Conductance
9.42 The Effect of Different Electrolytes
9.43 The Energy Barrier to Ionic Conduction
9.44 Nature of Ionic Conduction
9.45 Possible Nature of Hydrophobic Conduction
9.5 SUMMARY
158
Page
159
161
162
162
164
167
167
168
170
174
177
179
159
9. 1 INTRODUCTION
Although the electrical properties of planar lipid bilayers have
often been studied, little is known about the nature and origin of their
intrinsic conductance. Several studies have reported that the
conductance is 'irreproducible' and quote only an order of magnitude for
the measured conductance. Even when reproducible conductance
measurements are obtained it is still difficult to distinguish between
the conductance of the bilayer component itself and the conductance of
the torus surrounding the bilayer ( Miyamoto and Thompson, 1967). Some
values reported for the area-specific conductance of egg-lecithin and
egg-lecithin - cholesterol bilayers are shown in table 9.1.
It has been proposed (Hanai, Haydon and Taylor, 1965c) that only
the very lowest measured values of bilayer conductance (approximately
.01 mS/m 2 ) reflect those intrinsic to the bilayer itself, and that any
higher values are a consequence of ''leaks" associated with the torus.
This conclusion was reached from the absence of any observed dependence
of the conductance upon the bilayer area, except for bilayers with very
low conductance.
In this chapter I describe experiments made specifically to deduce
the bilayer conductance. The dependence of bilayer conductance on area
was measured in order to distinguish between the conductance of the
bilayer and the "leak" conductance of the membrane border.
The origin of the membrane conductance was of some importance to
the study of the dielectric substructure of lipid bilayers undertaken in
this thesis. It was found (see Chapter 7) that a small portion of the
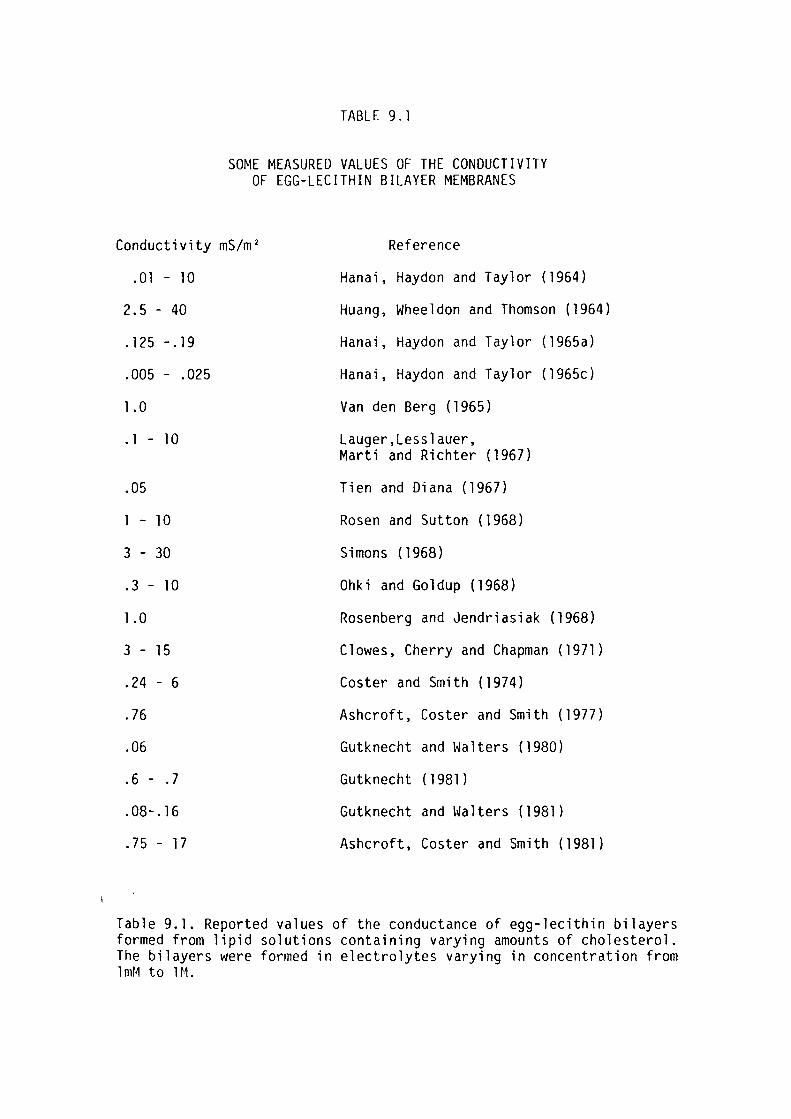
TABLE 9. l
SOME MEASURED VALUES OF THE CONDUCTIVITY OF EGG-LECITHIN BILAYER MEMBRANES
Conductivity mS/m 2 Reference
. 01 - 10
2.5 - 40
. 125 - . 19
.005 - .025
1.0
. 1 - 10
.05
1 - 10
3 - 30
. 3 - 10
1.0
3 - 15
.24 - 6
.76
.06
. 6 - . 7
.08-. 16
. 75 - 17
Hanai, Haydon and Taylor (1964)
Huang, Wheeldon and Thomson (1964)
Hanai, Haydon and Taylor (1965a)
Hanai, Haydon and Taylor (1965c)
Van den Berg (1965)
Lauger,Lesslauer, Marti and Richter (1967)
Tien and Diana (1967)
Rosen and Sutton (1968)
Simons (1968)
Ohki and Goldup (1968)
Rosenberg and Jendriasiak (1968)
Clowes, Cherry and Chapman (1971)
Coster and Smith (1974)
Ashcroft, Coster and Smith (1977)
Gutknecht and Walters (1980)
Gutknecht (1981)
Gutknecht and Walters (1981)
Ashcroft, Coster and Smith (1981)
Table 9.1. Reported values of the conductance of egg-lecithin bilayers formed from lipid solutions containing varying amounts of cholesterol. The bilayers were formed in electrolytes varying in concentration from lmM to lM.
160
dielectric substructure of lipid bilayers, determined from the membrane
impedance at very low frequencies (>.03 Hz), was dependent on whether
the measured conductance was attributed to the hydrophobic conductance
of the bilayer (i.e. the intrinsic conductance) or the presence of
aqueous channels traversing the membrane.
One way of obtaining useful information about the mechanisms
responsible for the conductance is to measure its temperature
dependence, and hence obtain the activation energy for the translocation
of charge across the bilayer. Previous attempts to measure the
temperature dependence of bilayer conductivity reported little or no
temperature dependence (eg. Hanai et al., 1965c and Simons, 1968). The
activation energies have indeed been measured for bilayers in the
presence of special additives such as various carriers and pore-inducers
(Ginsberg and Noble, 1974) and compounds thought to enhance electronic
conduction (Rosenberg and Bhowr11ik, 1969). These additives greatly
increased the conductance. However, the temperature dependence of the
intrinsic conductance of egg-lecithin bilayers themselves appears not to
have been studied in detail. Evaluation of the activation energy
permits some conclusions to be drawn concerning the concentration of
charge carriers in the bilayer, and their nature of entry and
translocation.
To investigate the mechanisms whereby charge translocation might
occur across the bilayer, the dependence of bilayer conductivity on
temperature and the type and concentration of ions in the aqueoues phase
has been measured.
Measurements of the A.C. conductance have been made at frequencies
low enough to accurately reflect that of the D.C. membrane conductance
161
and yet to allow sufficiently rapid simultaneous measurement of the
bilayer capacitance and conductance. The aim of this
identify possible mechanisms of charge translocation
bilayers.
9.2 MATERIALS AND METHODS
study is to
across lipid
Egg-lecithin, egg-lecithin - cholesterol (2:1 mole ratio) and GMO
bilayers were formed using the technique outlined in Chapter 4. GMO
bilayers were formed from squalene and n-hexadecane solutions. Bilayers
containing egg-lecithin were formed from n-hexadecane solutions of the
lipid.
The bilayer capacitance and conductance were measured
simultaneously to a precision of better than 0.1% using the digital
four-terminal impedance measuring technique described in Chapters 2 and
4. Measurements of A.C. membrane impedance were made at .1 and l Hz.
In an endeavour to determine the relative contributions that the
bilayer and torus components of the membrane make towards the total
membrane conductance, the bilayer conductance was measured as a function
of bilayer area using two methods. Both methods assumed that the low
frequency capacitance was proportional to bilayer area as has been
demonstrated previously by Hanai et al. (1965c) and Coster and Simons
(1968). The first method involved measuring me~brane capacitance and
conductance, while the planar bilayer increased in area from 20% to 100%
of its final planar area (which was approximately the area of the hole
in the septum), during the formation of the bilayer from the thick lipid
162
film. The second method involved measurements of membrane capacitance
and conductance whilst bowing the membrane under a net hydrostatic
pressure.
(1965c).
This second method was originally used by Hanai et al.
The former method was mainly used in this study to evaluate
the bilayer conductance.
Before the temperature was varied, the area dependence of the
conductance of each bilayer was checked to ensure that the area
independent contribution to bilayer conductance was not significant.
Measurements of the temperature dependent membrane conductance were
made during heating and cooling of the membrane to allow for the effects
of the ti~e-variation of bilayer conductance during the course of the
experiment.
9.3 RESULTS
9.31 Variation of Bilayer Conductance With Area
Figure 9.1 shows some results for the relationship between the
bilayer capacitance and conductance, measured at l Hz, as a function of
bilayer area (lecithin bilayers formed from n-hexadecane solutions in
mM electrolyte). It was apparent in each of these cases that the
relationship was reasonably linear and that the relation between bilayer j
capacitance and conductance was similar for planar and bowed bilayers.
This suggests that the contributions made to the measured electrical
properties by areas of the film which are not yet bimolecular, i.e. when
the bilayer area had not yet reached that of the hole in the septu~, are
negligible. Thus for the results shown in figure 9.1 it would be
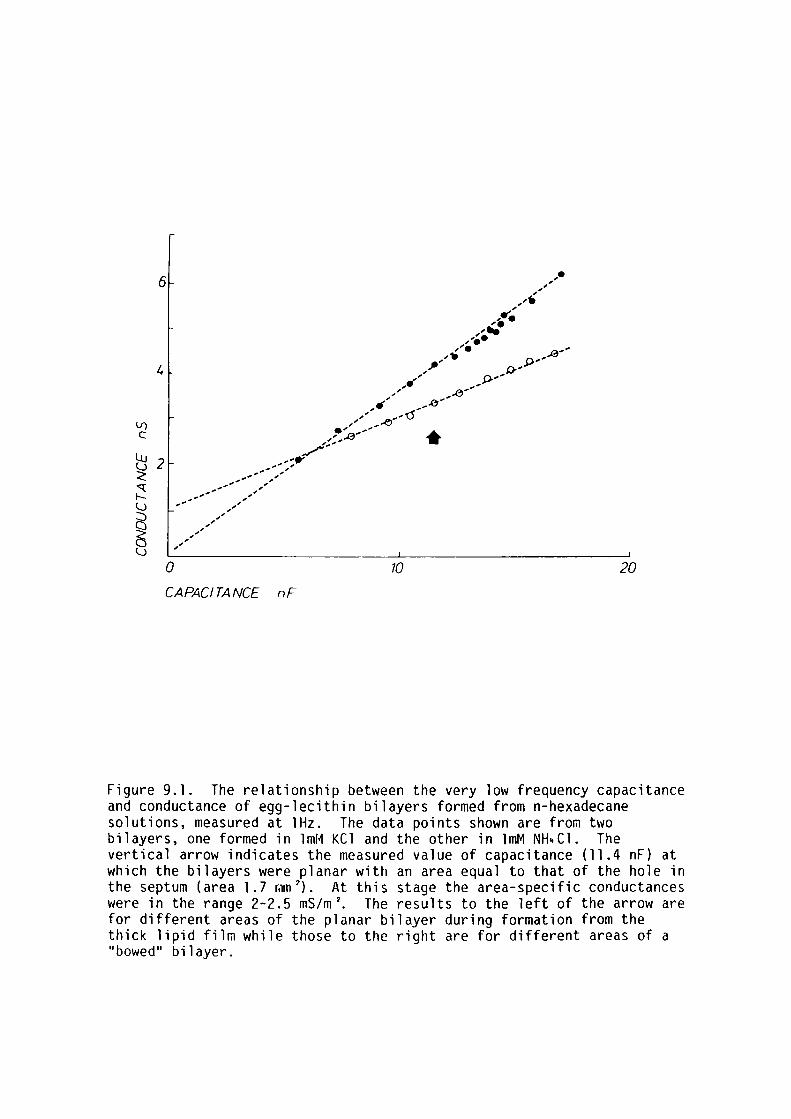
0 10 20
CAPACITANCE nF
Figure 9.1. The relationship between the very low frequency capacitance and conductance of egg-lecithin bilayers formed from n-hexadecane solutions, measured at lHz. The data points shown are from two bilayers, one formed in lmM KCl and the other in lmM NH~Cl. The vertical arrow indicates the measured value of capacitance (11.4 nF) at which the bilayers were planar with an area equal to that of the hole in the septum ( area l. 7 r,1m 2 ). At this stage the area-speci fie conductances were in the range 2-2.5 mS/m 2 • The results to the left of the arrow are for different areas of the planar bilayer during formation from the thick lipid film while those to the right are for different areas of a "bowed" bilayer.
163
expected that the extrapolation of the relationship back to zero
capacitance (i.e. area=O) would give an unequivocal result for the
conductance of any element that was independent of bilayer area (i.e.
the torus). The full implications of this statement will be discussed
later. In these two examples the percentage contributions of the
conductance of the torus, relative to the conductance of the bilayer
(100% black), were 1.5% and 30% for lmM KCl and NH~Cl respectively.
Indeed for nearly all the bilayers studied in l mM electrolytes, using
fresh batches of egg-lecithin, it was found that the "leak" conductance
was less than 50% of the total membrane conductance.
Occasionally bilayers were generated from lipid solutions that had
been allowed to "go off". Bilayers formed from such solutions were less
stable and had markedly higher conductances than bilayers formed from
fresh lipid solutions (less than a few days old).
Thick lipid films, when formed in electrolytes of high
concentrations (. 10 mM), contained clusters of lipid aggregates, visible
under the binocular microscope, which appeared to be displaced into the
torus as the bilayer formed (see figure 4.5). These aggregates were
observed to remain at the boundary of the torus and the bilayer phases.
It was noticed that bilayers formed from films containing high
concentrations of these aggregates tended to possess higher "leak"
conductances. Further, bilayers formed from these films would undergo
abrupt changes in conductance after the bilayer was 100% black.
Mechanical movement (either by bowing or touching with a syringe needle)
could also induce abrupt changes in membrane conductance.
Nany times, attempts to distinguish the
conductances whilst bowing the membrane at high
bilayer and "leak"
ion concentrations
164
were frustrated by the occurrence of sudden changes in the ''leak"
current (see figure 9.2).
Therefore, instead of bowing the membrane to vary the bilayer area,
the membrane conductance was generally measured as a function of the
area of the planar bilayer during its formation from the thick lipid
film. The bilayers at this stage of their formation were certainly not
in equilibrium with the torus. However, there is evidence suggesting
that this did not affect the validity of this technique (see
discussion). Measurements of bilayer conductance obtained this way
where similar to those obtained by bowing the merabrane (see figure
9.1) but had the advantage of leaving the membrane relatively
undisturbed. Egg-lecithin bilayers formed in lmM KCl had relatively
stable electrical properties therefore most of the data was collected
from bilayers in aqueous solutions with low ion concentrations.
It was also found that the conductance generally would increase as
the membrane aged; it usually increased by 2-10% per hour.
The presence of cholesterol in egg-lecithin bilayers had no effect
on the bilayer conductance. Therefore the results obtained from bilayers
with and without cholesterol are presented together.
9.32 Conductance Characteristics
i) Effect of Different External Electrolytes
To investigate some of the possible mechanisms of charge
translocation, the conductance of bilayers in lmM electrolyte solutions
containing ions of different radii and charge was measured at lHz (see
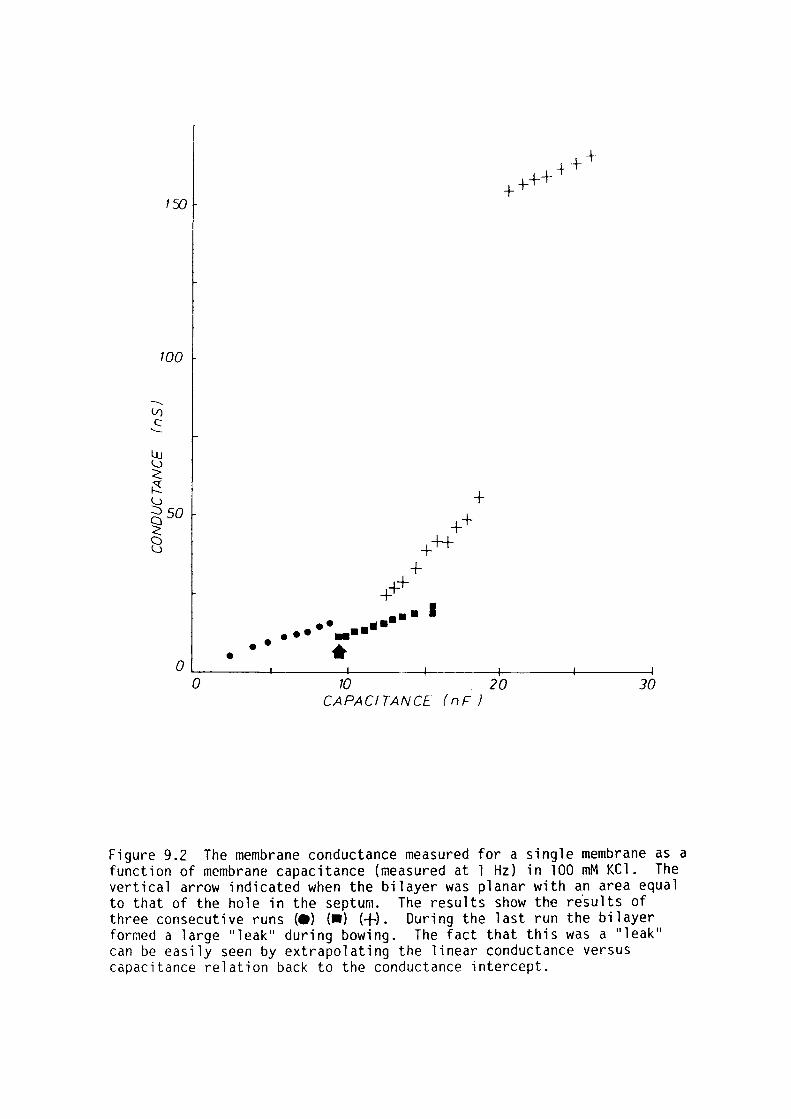
100
-V) C -
++ +
++ +++
+
• • I •• • •• . .. -·· • •• •
+
0 L--------+----~-----~-----L----_.J_ ___ ___J
0 W 20 30 CAPACITANCE (nF)
Figure 9.2 The membrane conductance measured for a single membrane as a function of membrane capacitance (measured at 1 Hz) in 100 mM KCl. The vertical arrow indicated when the bilayer was planar with an area equal to that of the ho 1 e in the septum. The results show the re·sul ts of three consecutive runs (e) (•) (+). During the 1 ast run the bi 1 ayer formed a large "leak" during bowing. The fact that this was a "leak" can be easily seen by extrapolating the linear conductance versus capacitance relation back to the conductance intercept.
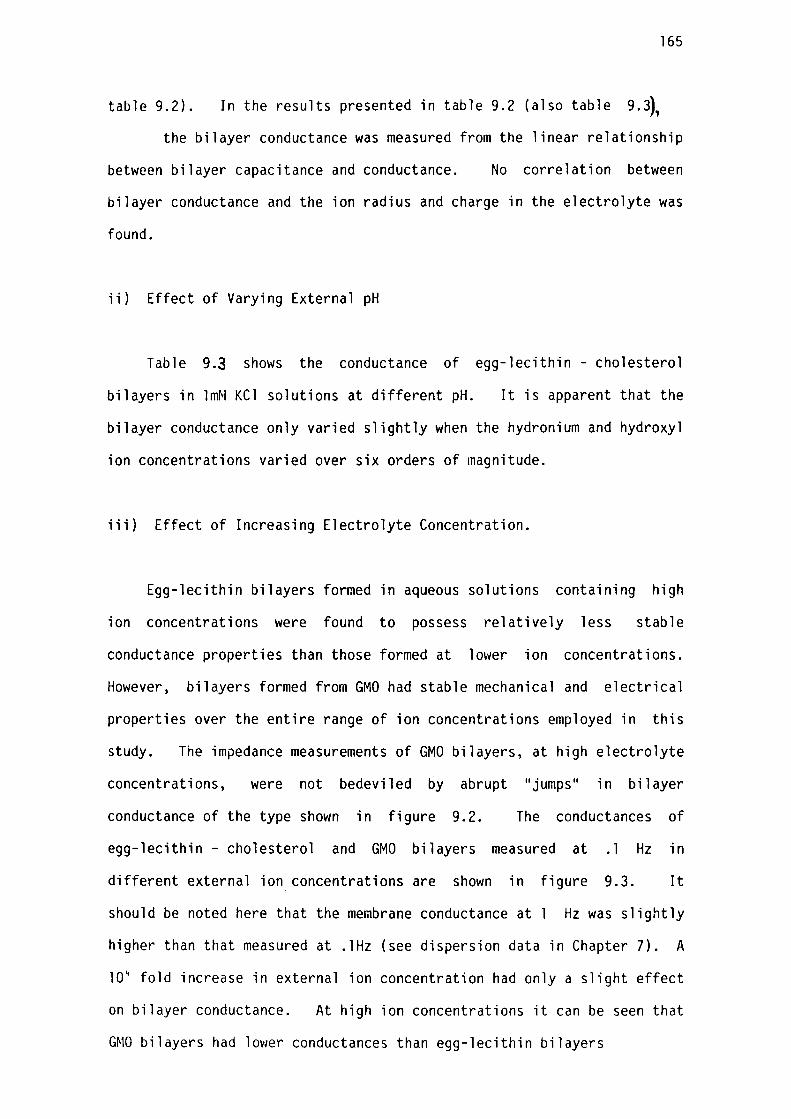
165
table 9.2). In the results presented in table 9.2 (also table 9.~,
the bilayer conductance was measured from the linear relationship
between bilayer capacitance and conductance. No correlation between
bilayer conductance and the ion radius and charge in the electrolyte was
found.
ii) Effect of Varying External pH
Table 9.3 shows the conductance of egg-lecithin - cholesterol
bilayers in lmM KCl solutions at different pH. It is apparent that the
bilayer conductance only varied slightly when the hydronium and hydroxyl
ion concentrations varied over six orders of magnitude.
iii) Effect of Increasing Electrolyte Concentration.
Egg-lecithin bilayers formed in aqueous solutions containing high
ion concentrations were found to possess relatively less stable
conductance properties than those formed at lower ion concentrations.
However, bilayers formed from GMO had stable mechanical and electrical
properties over the entire range of ion concentrations employed in this
study. The impedance measurements of GMO bilayers, at high electrolyte
concentrations, were not bedeviled by abrupt "jumps" in bilayer
conductance of the type shown in figure 9.2. The conductances of
egg-lecithin - cholesterol and GMO bilayers measured at .l Hz in
different external ion concentrations are shown in figure 9.3. It
should be noted here that the me~brane conductance at Hz was slightly
higher than that measured at .lHz (see dispersion data in Chapter 7). A
1O~ fold increase in external ion concentration had only a slight effect
on bilayer conductance. At high ion concentrations it can be seen that
GMO bilayers had lower conductances than egg-lecithin bilayers
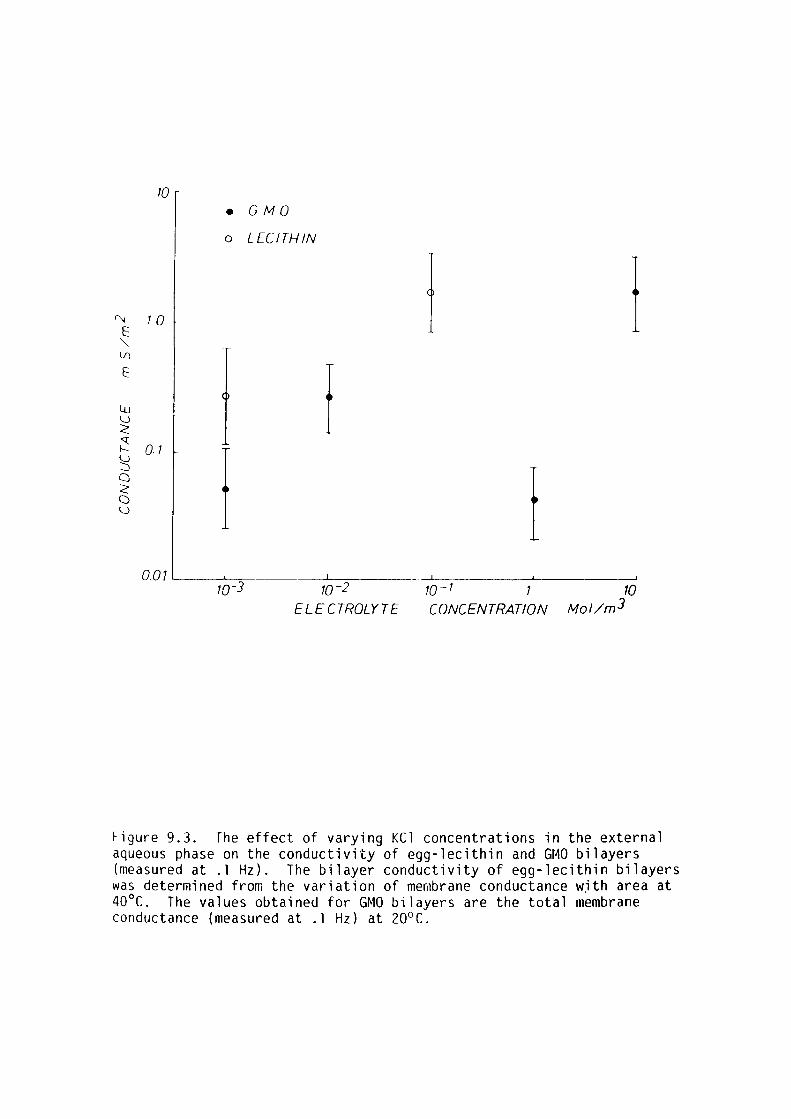
10
• GMO
o LECITHIN
~ 10 I t E
" VJ
E
t ll.J u < q I---. 07
! u :)
l a < C) u
007 70-J 10-2 10-1 1 10
ELECTROLYTE CONCENTRATION Mol/m3
Figure 9.3. The effect of varying KCl concentrations in the external aqueous phase on the conductivity of egg-lecithin and GMO bilayers (measured at .1 Hz). The bilayer conductivity of egg-lecithin bilayers was determined from the variation of membrane conductance with area at 40°C. The values obtained for GMO bilayers are the tot~l m~mbrane conductance (measured at . l Hz) at 20°C.
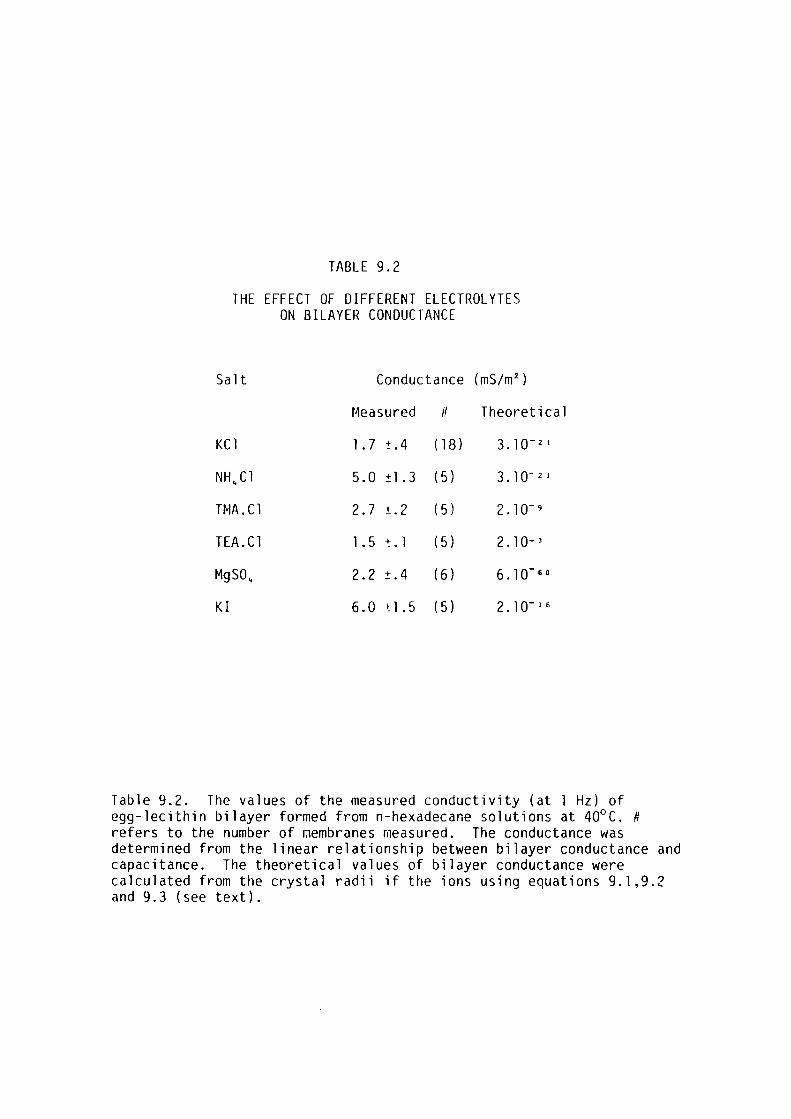
TABLE 9.2
THE EFFECT OF DIFFERENT ELECTROLYTES ON BILAYER CONDUCTANCE
Salt Conductance (mS/m 2 )
Measured # Theoretical
KCl l. 7 ±. 4 ( 18) 3.10-21
NH.,Cl 5.0 ± l. 3 ( 5) 3 • lo- 2 I
TMA.Cl 2.7 ±.2 ( 5) 2. 10- 9
TEA. Cl l. 5 ±. l ( 5) 2. 10- 3
MgSO., 2.2 ±.4 ( 6) 6. 10-60
Kl 6.0 ±l.5 ( 5) 2 •lo- I 6
Table 9.2. The values of the measured conductivity (at l Hz) of egg-lecithin bilayer formed from n-hexadecane solutions at 40°C. # refers to the number of membranes measured. The conductance was determined from the linear relationship between bilayer conductance and capacitance. The theoretical values of bilayer conductance were calculated from the crystal radii if the ions using equations 9. 1,9.2 and 9.3 (see text).
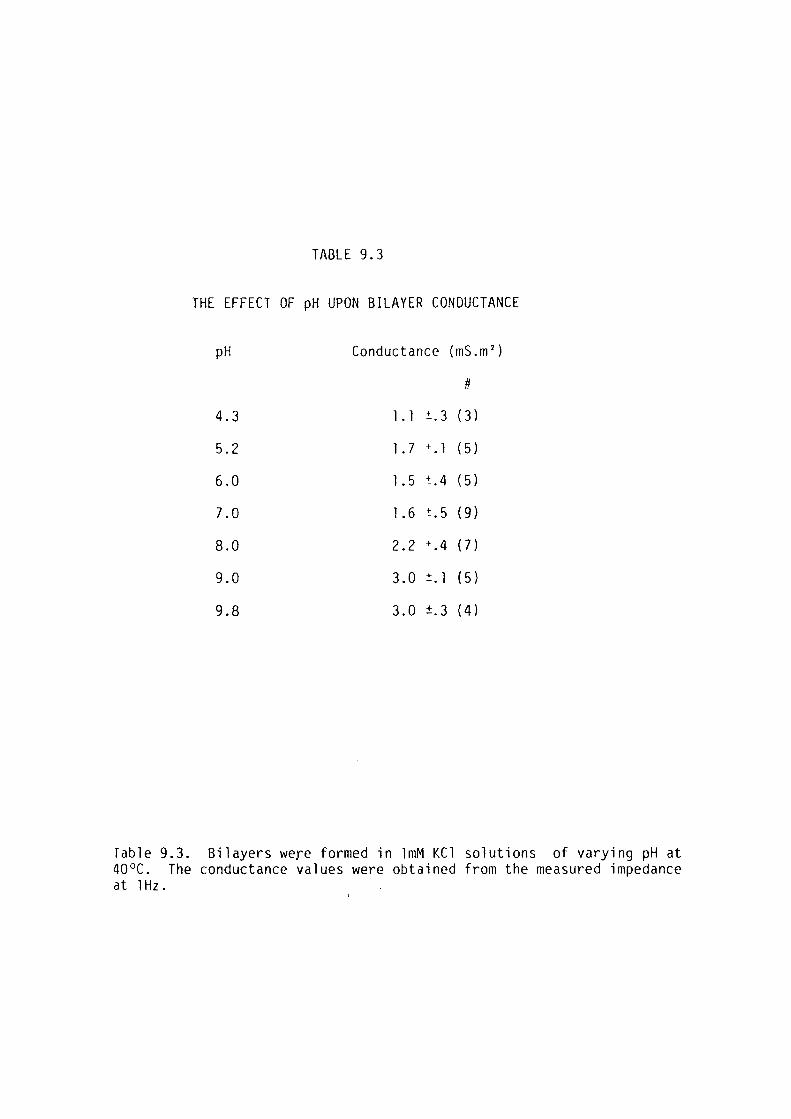
TABLE 9.3
THE EFFECT OF pH UPON BILAYER CONDUCTANCE
pH Conductance (mS.m 2 )
#
4.3 l. l ±. 3 (3)
5.2 l. 7 +_. l ( 5)
6.0 l. 5 ±.4 ( 5)
7.0 1.6 -1:. 5 ( 9)
8.0 2.2 ±.4 ( 7)
9.0 3.0 ±. l ( 5)
9.8 3.0 ±.3 ( 4)
Table 9.3. Bilayers were formed in lmM KCl solutions of varying pH at 40°C. The conductance values were obtained from the measured impedance at l Hz.
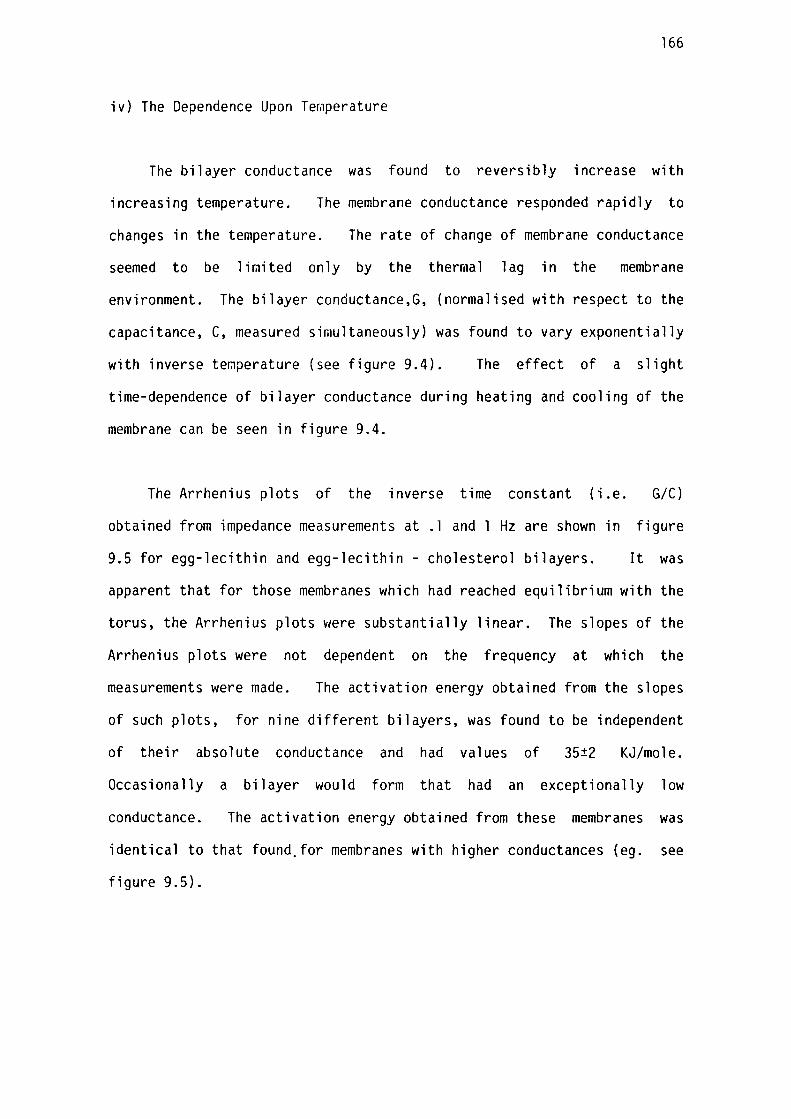
166
iv) The Dependence Upon Temperature
The bilayer conductance was found to reversibly increase with
increasing temperature. The membrane conductance responded rapidly to
changes in the temperature. The rate of change of membrane conductance
seemed to be limited only by the thermal lag in the membrane
environment. The bilayer conductance,G, (normalised with respect to the
capacitance, C, measured simultaneously) was found to vary exponentially
with inverse temperature (see figure 9.4). The effect of a slight
time-dependence of bilayer conductance during heating and cooling of the
membrane can be seen in figure 9.4.
The Arrhenius plots of the inverse time constant (i.e. G/C)
obtained from impedance measurements at . 1 and 1 Hz are shown in figure
9.5 for egg-lecithin and egg-lecithin - cholesterol bilayers. It was
apparent that for those membranes which had reached equilibrium with the
torus, the Arrhenius plots were substantially linear. The slopes of the
Arrhenius plots were not dependent on the frequency at which the
measurements were made. The activation energy obtained from the slopes
of such plots, for nine different bilayers, was found to be independent
of their absolute conductance and had values of 35±2 KJ/mole.
Occasionally a bilayer would form that had an exceptionally low
conductance. The activation energy obtained from these membranes was
identical to that found. for membranes with higher conductances (eg. see
figure 9.5).
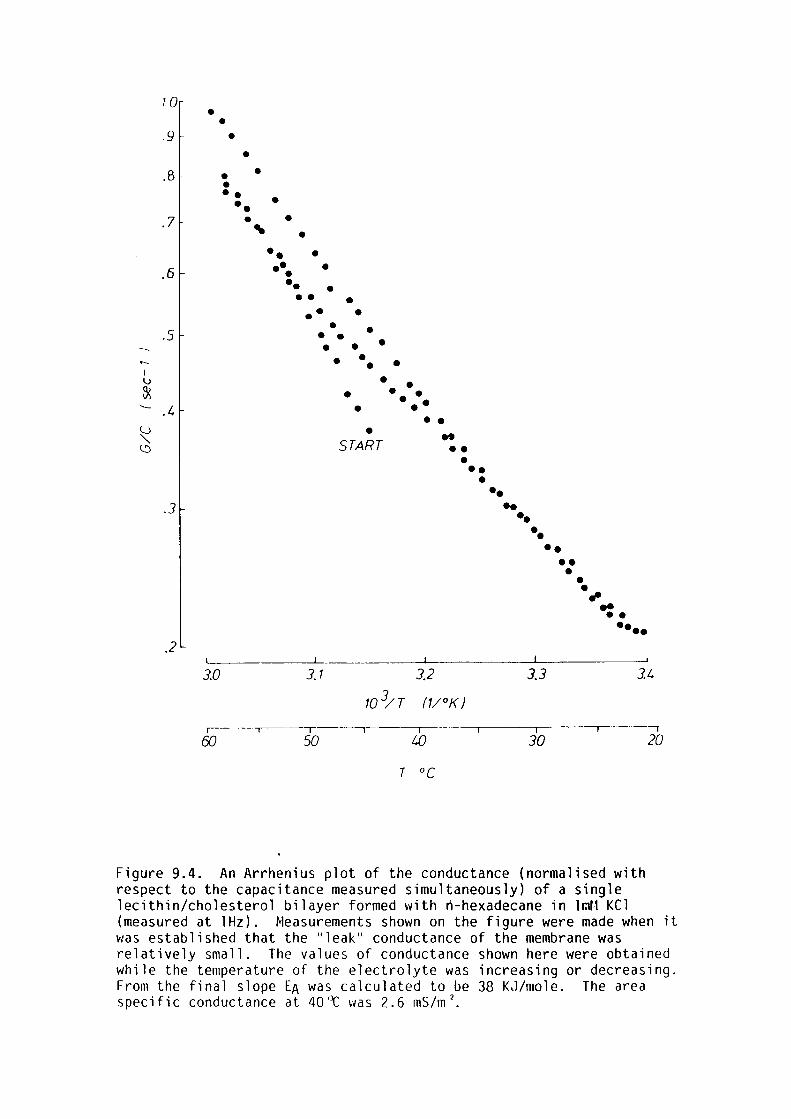
10
. 9
. 8
.7
.6
.5
- .I.
. 3
. 2
• • •
• • ••
•
•• •
3.0
•
.. • • • •• •• • ••
• • • ••
•• • • • • •
• • • •
• •
•
•
•
• •
• • • • • • • • • START
.. •• •
3.1
•• • •• .. ••
•• •• •• •
J.3
• • .. .. • • ••••
ll
r---~--~---~---~----.---~---r-- ----, ffJ 50 lO 30 20
T °C
Figure 9.4. An Arrhenius plot of the conductance (normalised with respect to the capacitance measured simultaneously) of a single lecithin/cholesterol bilayer formed with ~-hexadecane in lmM KCl (measured at lHz). Measurements shown on the figure were made when it was established that the "leak" conductance of the membrane was relatively small. The values of conductance shown here were obtained while the temperature of the electrolyte was increasing or decreasing. From the final slope EA was calculated to be 38 KJ/mole. The area specific conductance at 40'-t was 2.6 mS/m 2 •
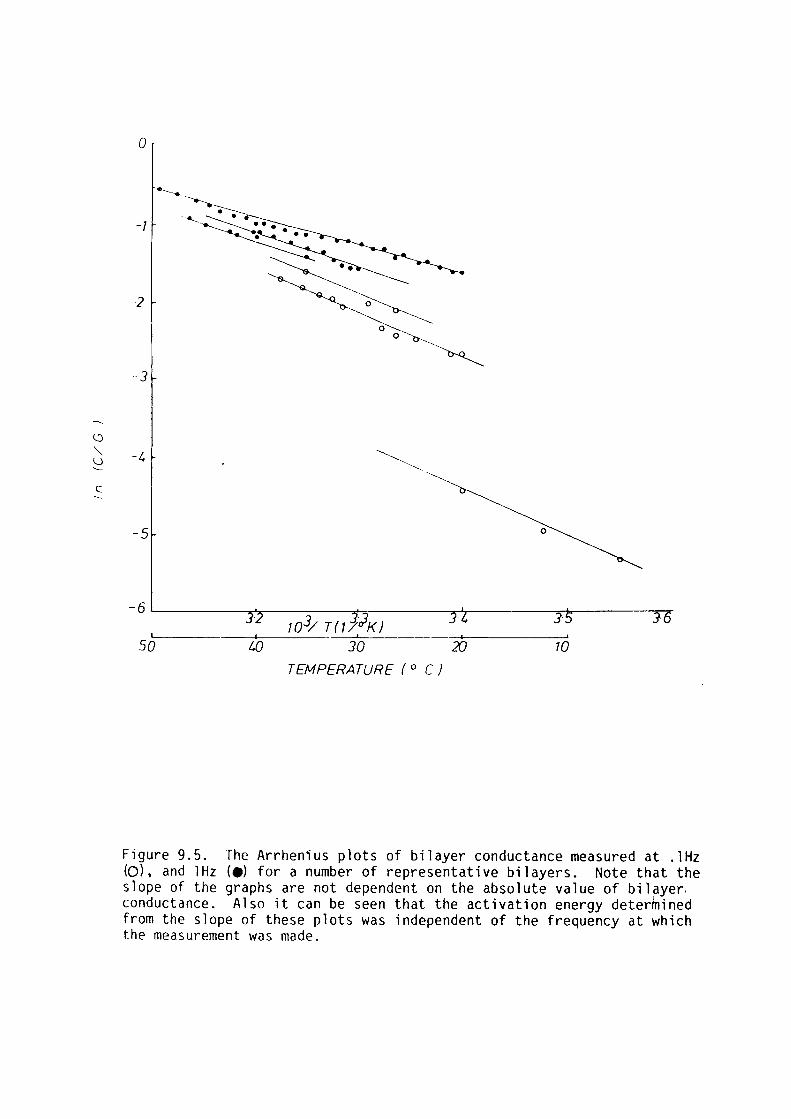
(.'.)
" u
C -
0
-,
-2
0 0
-3
- t, ~-
-5 0
-6L_ ___ ~--'=-------='-:~---~~----J~-~----J,_....,.-103/ T(ti K)
so t.O 30 20 70
TEMPERATURE ( ° C)
Figure 9.5. The Arrhenius plots of bilayer conductance measured at . lHz (O), and lHz (e) for a number of representative bilayers. Note that the slope of the graphs are not dependent on the absolute value of bilayer, conductance. Also it can be seen that the activation energy determined from the slope of these plots was independent of the frequency at which the measurement was made.
167
9.4 DISCUSSION
9.41 Interpretation of the Area Dependent Membrane Conductance
Most of the measurements of bilayer conductance in this study were
made while the bilayer was forming from the thick lipid film. The fact
that the bilayers were not in equilibrium with the torus during
measurements of the bilayer conductance did not effect the validity of
the measurement. This assertion is based on two observations. Firstly,
the bilayer conductance responded much more rapidly to changes in
temperature than did the bilayer composition (as determined from bilayer
capacitance; see Chapter 5). Secondly, the bilayer conductance
determined from this technique was the same as that determined from
bowing the membrane, allowing the bilayer to come to equilibrium with
the torus at each stage of bowing. From this data it seems that the
approach to equilibrium between ions in the bilayer and the external
aqueous phase was much more rapid than the approach to equilibrium
between the lipid and alkane molecules in the bilayer and torus.
From the relation between membrane conductance and bilayer area one
could obtain an unequivocal value for the area-independent membrane
conductance. However it should be pointed out that the area-dependent
membrane conductance determined from this relation need not entirely
exclude border "leaks" .·
For example, one possible conductance mechanism giving rise to area
dependent "leaks" could be the following: if stable transmembrane
pores in the torus are in the form of non-disperse lipid aggregates
that reside ~ainly at the interface of the bilayer and torus (presumably
because the torus is thinnest at this point) and if the magnitude of
168
the "leak" is proportional to the concentrations of these aggregates
then the following could occur.
As the bilayer area increases (at the expense of the thick lipid
film) the lipid aggregates in the thick lipid film get trap~ed at the
bilayer-torus interface. The number of clusters at the interface will
increase proportionally to the bilayer area. This would cause the
"leak" current in the torus also to increase proportionally with bilayer
area.
Though the proposed mechanism is by no means substantiated,
particulate matter of some form (possibly lipid aggregates) was present
in thick lipid films (see figure 4.5) especially at high electrolyte
concentrations. Further these particles did get swept into the
bilayer-torus interface and significantly slowed the rate of bilayer
formation. It was also observed that bilayers with high concentrations
of these particles had relatively high ''leak" conductances.
Determination of the bilayer conductance from the linear relation
between membrane conductance and capacitance does not conclusively
exclude the effects of the torus "leak". However, it does give a closer
estimate of the bilayer conductance than that obtained from the total
membrane conductance.
9.42 The Effect of Different Electrolytes.
i) The Effect of Different Ion Species
To give some insights into the mechanism responsible for charge
translocation through the bilayer, we can now examine how the measured
169
conductance is dependent upon the radius and charge of the ionic species
present in the external aqueous solution. Table 9.2 indicates that a
three fold increase in cationic radius (from potassium to
tetramethylammonium (TEA)) has only a slight effect upon bilayer
conductance. Similarly replacing the monovalent electrolyte with one
that only contained divalent ions (MgSO~) also had little effect.
If the conductance was a consequence of ions passing through the
hydrophobic interior of the bilayer, then the area specific conductance
could be calculated from the Nernst-Planck equations. Provided that the
electric field in the hydrophobic region is reasonably constant, the
conductance, G, of the bilayer is given by the following equation:
9. l
where 11 q11 is the magnitude of the electronic charge, 11 k11 is the
Boltzmann constant and, 11 0 11 , is the thickness of the hydrophobic region.
11 c- 11 and 11 D- 11 are the concentration and diffusion constants of the ionic l l
species, i, respectively. A detailed treatment of the derivation of
equation 9. l is given in Chapter 2 (see equations 2.6-2. 14).
The ion concentration in the hydrophobic region can be calculated
using the following equations:
9.2
where t.U = z 2q2 {-1 - _l } 8ne: e: a e: e:
o r m w 9.3
where 11 t.U II here is the Born energy difference between the aqueous
phase and the bilayer interior. The activation energy for the
170
translocation of an ion through the hydrophobic interior will be at
least equal to that of the Born energy of partitioning.
In Table 9.5 the theoretical values of the bilayer conductance are
given. It is immediately apparent that the discrepancies between the
theory and experiment, both in magnitude of the conductance and the lack
of a strong variation in different electrolytes, are so large that
conduction due to "naked" ions through the hydrophobic region can be
discounted. Possible alternative forms of ion translocation mechanisms
across lipid membranes will be investigated later.
ii) The Effect of Different Ion Concentrations
It is difficult to distinguish a definite relation between bilayer
conductance and ion concentration from the data presented here.
However, the relative lack of effect of varying ion concentrations on
bilayer conductance is similar to that reported in some previous studies
(eg. Coster and Smith, 1974). The fact that GMO bilayers had -lower
conductances than egg-lecithin bilayers at high ion concentrations was
probably a consequence of the relative stability of the conduction
properties of GNO bilayers.
9.43 The Energy Barrier to Ionic Conduction
The value of activation energy, EA, for bilayer conduction deduced
from the present experiments is 35±2 KJ/mole I which is significantly
higher than that expected for ion diffusion in bulk water. This
suggests that the ionic conductance reported here is not associated with
macroscopic water channels as would be expected from "leak" paths in the
membrane torus. Similar values of EA were obtained from bilayers
171
possessing high (2m5/m 2 ) and low ( .01 mS/m 2 ) conductances. This
indicates that similar mechanisms were responsible for conduction in
both high and low conductance bilayers. This lends support to the
proposal that the conductance reported in this study is due to the
bilayer component of the membrane.
The measured activation energy for electrical conduction does not
itself reveal anything directly about the mechanism of charge
translocation through the membrane. However, it does allow us at least
to narrow down the range of possible mechanisms on the basis of
consistency of the predicted activation energy with that obtained
experimentally.
We consider here various mechanisms whereby ions can cross the
hydrophobic region of a lipid bilayer, and hence derive the minimum
activation energy expected for each. The mechanisms themselves were
originally discussed by Parsegian (1969) and MacDonald (1976).
i) Hydrated Ion Translocation.
The electrostatic energy difference is reduced as the radius of the
ion increases, and will thus be lower for hydrated ions than for 11 naked 11
ions. However, the partitioning of hydrated ions into the hydrophobic
interior of lipid bilayers involves the interfacial free energy of the
11 bubble 11 of water surrounding the ion in the hydrophobic phase as
suggested by MacDonald (1976) and Ashcroft and Coster (1978). The
energy difference creating additional oil-water interface, 6U5, plus the
electrostatic self energy, 6U, is given by:
172
= 4nyb 2 + z 2 q2 /8n£ E b {-1 - _l } 0 m E E m w
9.4
where "y" is the interfacial tension between the hydrophobic phase
and "b" is the radius of the water "bubble". "4U" increases with the s increasing radius of the hydration shell associated with each ion.
Another contribution to the total energy difference for an ion in
the aqueous phase and the hydrophobic region of the membrane, 4UH,
arises from the change in the free energy of hydration due to
differences in the hydration number (and hence radius) of the hydrated
ion in these two phases. As discussed by Ashcroft and Coster (1978)
this latter contribution probably does not play a very significant part
provided that the hydration number in the case of H+ does not drop below
3 or 4 (Ashcroft and Coster, 1978). For K+ and Cl- which have larger
radii, this will be even less significant as the hydration energies for
these ions are ~uch smaller than for H+. Therefore the total energy
difference will have a minimum value for some value of "b'' (MacDonald,
1976). This will occur when:
9.5
At a radius given by:
9.6
For y = 0.05 J/m and then b=0.34 nm and 4UT=l40 KJ/mole. Thus the
minimum possible energy difference for an ion enclosed in a "bubble" of
water in the membrane, relative to when it is in aqueous solution, is
still very much in excess of the measured activation energy.
173
ii) Formation of a Transmembrane Pore During Translocation.
The energy difference for translocation through the hydrophobic
region would be a great deal smaller if the ion could traverse through a
"pore" of higher dielectric constant. Thus for a cylindrical pore of
radius b, which contains water and spans a hydrophobic region of width
y, the electrostatic energy difference for an ion in the center of such
a pore and in the aqueous solution (see Parsegian, 1969) is given by:
9.7
where "a" is a geometrical constant depending on the form of the
pore. a= 0.175 for a cylindrical pore. For~ation of such a pore again
involves creating an interface between the aqueous pore and the
hydrophobic region. The interfacial free energy for this is given by:
9.8
Again, since "tiUs" increases with pore radius and "tiUE" decreases
with pore radius, a minimum energy exists.
point is given by:
The radius of this minimum
For a hydrophobic region, thickness 6=3nm, the optimum radius,
b , is equal to 0. 14nm. The minimum possible energy activation
energy for this process is then 160 KJ/mole.
This again is large compared with the experimental value. Further,
a pore of this radius is comparable in dimension to the ionic radii of
174
many ions, and for many ions therefore the pore would need to be larger
with a concomitant increase in II tiU 11•
T
iii) Ion Inside a Pre-Existing Transmembrane Pore.
The ion translocation itself may not involve the process of
creating a pore in the hydrophobic region, but proceeds through a
pre-existing pore formed by an independent process, which is part of the
intrinsic structure of the lipid bilayer. In this case the activation
energy for the translocation process will be far less. The Born energy
remains to be considered, and for a water filled pore is given by
equation 9.7. If the ionic diffusion in these pores is similar to that
in the bulk aqueous phase then the activation energy for diffusion
through the electrolyte in the pore (considered on a bulk phase) will be
"' l 7 KJ /mole. The remaining 18 KJ/mole required to match the
experimental value of 35 KJ/mole could be attributed in part to a
temperature dependent pore population as well as to the electrostatic
energy difference associated with the passage of an ion through the
hydrophobic interior via a narrow aqueous pore. The minimum radius of
the pores that would completely account for the remaining 18 KJ/Mole is
"'l nm.
9.44 Nature of Ionic Conduction
The vast difference between the calculated conductivity of ''naked"
ions in the bilayer and that measured experimentally was sufficient
evidence to completely discount the possibility of charge translocation
through the membrane by dehydrated ions. Further, the activation energy
of bilayer conduction was sufficiently low to also eliminate the
possibility that ions could pass directly through the hydrophobic
175
interior. It could also be concluded from the experimentaly measured
value of the activation energy that the charge translocation through
macroscopic aqueous channels was unlikely. Therefore it seems as though
the main charge translocation mechanism in these bilayers was ion
conduction via narrow aqueous channels. The lower limit to the radius
of these putative channels was estimated at l nm. The investigations
into the area-dependent membrane conductance did not conclusively locate
the aqueous channels as being in the bilayer or torus components of the
membrane.
Here, various consequences of the presence of these putative pores
will now be considered.
If the pores are evenly distributed across the surface of the
bilayer one can calculate the average number of pores which would be
consistent with the measured value of the area specific conductance
(approx. l lilS/m 2 ) • The conductance of each pore (G) can be estimated p
from its geometric dimensions and the average ion concentrations in the
pore (c ) via the following equation: p
9. 10
The equilibrium value of "c " is related to the external ionic p
concentration, c , via the relation: 0
For U =18KJ/mole and lml~ KCl external 0 concentration of ions in the pore will be lµM at 40 C.
9. 11
electrolyte the
The value of Gp
is then approx. 1.5x10- 1 ~ S/w 2 if b=lnm and 6=3nm. Approximately 6.10 10
176
pores/ra 2 would then be necessary to produce the observed conductance.
These pores would be separated by an average distance of 4µm, and would
only occupy 2.10~ % of the bilayer area. The area occupied by pores
will thus be so small that the pores would contribute insignificantly to
the total membrane capacitance.
Cass and Finkelstein (1967) found no evidence for the existence of
transmembrane pores on the basis of their study of the water
permeability of lipid membranes. However, the additional amount of
water present in the bilayer due to these putative pores represents an
average concentration of less than 10-~ % w/w which would be negligible
compared to that normally "dissolved'' in the bilayer. Hence
of variations in water channel population, and hence
conductance, would not be possible from measurements of the
conductivity of the bilayer.
detection
bilayer
hydraulic
It is of interest to note that the properties of membrane
conduction in this study and the hydraulic conductivities of bilayers
reported in other studies (eg. Fettiplace, 1978, and Finkelstein and
Cass, 1967) are distinctly different. The activation energy of
hydraulic conduction in other studies is significantly higher than that
found for charge translocation in this study. Further, the activation
energy and magnitude of the hydraulic conductivity in lipid bilayers was
sensitive to the bilayer composition, whereas the charge translocation
was insensitive to bilayer composition. Some measured values for the
activation energy of the hydraulic conductivity of bilayers are in the
range 55-61 KJ/raole for lecithin - cholesterol (Redwood and Haydon,
1969, Price and Thompson, 1969 and Graziani and Livne, 1972).
177
Pore formation in egg-lecithin bilayers may arise from the presence
of trace impurities such as lysolecithin which is known to be a pore
former (Israelachvili et al., 1980) and is also known to drastically
increase bilayer conductance (Van Zutphen and Van Oeenen, 1967).
Lysolecithin can be produced as a breakdown product of egg-lecithin.
That would account for the fact that bilayers formed from "old" lipid
solutions had markedly higher conductances. It is possible that trace
amounts of lysolecithin in fresh egg-lecithin solutions may be
responsible for transmembrane pores. However,this proposal is difficult
to reconcile with the lack of effect of membrane composition in the
aqueous channel population.
It should be noted that conduction through "pores" in the torus
still remains a possibility. These pores could be present as convoluted
aqueous channels through clusters of mechanically stable lipid
aggregates which are trapped in the torus due to surface tension
effects. The concentration of lipid in the membrane torus are far in
excess of the lipid critical micelle concentration. Therefore it is
reasonable to assume that there is an abundant supply of lipid
aggregates available for pore formation - the area dependence of the
total conductance of such pores has been discussed earlier (see section
9.41).
9.45 Possible Nature of Hydrophobic Conductance
I No definite conclusions as to the nature of the intrinsic
conduction properties (i.e. the conduction of the hydrophobic region) of
the bilayer can be ascertained from experiments described here-except
that it must be very small compared to the measured values of bilayer
conductivity. The intrinsic conductive properties of the
178
hydrophobic - hydrophilic interface were investigated in Chapter 7. It
was concluded that the conductance of the polar regions of GMO and
egg-lecithin bilayers formed in aqueous solutions of l to 100 mM KCl was
not due to an ion migration mechanism. The results were consistent with
the polar head conduction being an intrinsic property of the bilayer
material. If this is so then the intrinsic conduction in the
hydrophobic region might also be a result of the "intrinsic'' conductance
of the lipid material.
In order to obtain the dielectric substructure of the bilayers from
their impedance dispersion, the non-hydrophobic conductance of the
bilayer must be subtracted from the bilayer impedance (see Chapter 7).
From data presented in this chapter it appears that the hydrophobic
conductance of the bilayer is much smaller than the total bilayer
conductance, and therefore virtually 100% of the D.C. conductance should
be subtracted from the impedance data before extracting information
concerning the bilayer dielectric structure from the impedance data (see
Chapter 7).
179
9.5 SUMMARY
In this chapter the conductance characteristics of egg-lecithin,
egg-lecithin-cholesterol and GMO bilayers were measured. These
characteristics were then compared to those expected for various
mechanisms for the translocation of ions across the hydrophobic region
of lipid bilayers.
Any area independent component of membrane conductance (which was
presumably due to torus 11 leak 11 conductance) was subtracted from the
membrane conductance.
Varying the ion species, ion concentrations and pH in the external
aqueous phase had relatively little effect on the conductance over a
wide range of ion concentrations, ion crystal radii and charge. On the
basis of these results it was concluded that translocation of either
"bare'' or hydrated ions through the hydrophobic region could not account
for the measured bilayer conduction.
The temperature dependence of bilayer conduction was measured and
was found to vary exponentially with inverse temperature. The
activation energy of ion conduction ( obtained from Arrhenius plots of
bilayer conductivity) was found to be 35 ±2 KJ/mole. This value was
much lower than that predicted for mechanisms involving ion
translocation through a hydrophobic region. The data was consistent
with ion conduction via very small aqueous channels a few nanometres in
diameter. The activation energy of conduction was sufficiently high to
dismiss the possibility of ion conduction through macroscopic water
channels in the torus.
180
It was also concluded that the hydrophobic conductance of the
bilayer was negligible compared to the total bilayer conducance. In
view of the fact that the conductivity of the polar regions of
egg-lecithin and GMO bilayers were largely independent of the external
ion concentration it was postulated that the very small intrinsic
hydrophobic conductance of the bilayer may be a property of the bilayer
material rather than due to ion migration.
CHAPTER 10
ENERGY OF FORMATION OF LIPID BILAYERS
10. l INTRODUCTION
10.2 THEORETICAL CONSIDERATIONS
10.21 Thermodynamics of Lipid Partitioning Between the Bilayer and Torus
10.22 Free Energy of Lipid Bilayers
10.3 METHODS
10. 4 RESULTS
10.5 DISCUSSION
10.51 Rationale for the Method
10.52 Energy of Formation: Temperature Dependence
10.53 Bilayer Tension: the Effect of Electrolyte Concentration and Cholesterol
10.6 SUMMARY
181
Page
182
185
185
186
187
190
192
192
193
198
199
182
10. l INTRODUCTION
The plasma membranes of nearly all plant cells and most animal
cells are in a state of tension. The importance of this variable in the
functioning of cell membranes in vivo has not yet been demonstrated.
However, thermodynamic considerations suggest that the solubility and
activity of membrane-bound enzymes is dependent on the tension and
elasticity of the lipid bilayer (Bates and Wolfe, 1980, and Gruen and
Wolfe, 1982). Van Deenen et al. (1976) found that the partitioning of
phospholipase into lipid monolayers varied drastically with only small
(5mN/m) changes in the lateral pressure of the monolayer.
The mechanism for local anaesthesia due to alkanes has been
associated with variations in thickness of the bilayer component of the
plasma membrane of squid axon (Haydon et al., 1977). However, it is
likely that this mechanism does not apply to other groups of local
anaesthetics (eg. Aminobenzoic acid ester types - see Chapter 11). The
modulation of membrane function caused by changes in the bilayer tension
induced by local anaesthetics is an alternative mechanism for
consideration. Part of this chapter is devoted to characterizing the
lateral tension properties of egg-lecithin and egg-lecithin -
cholesterol bilayers.
The tension required to rupture most biological and artificial
membranes, studied to date, ~s about 5 mN/m. Assuming that the area
elastic modulus of the bilayer component of membranes is of the order of
100 mN/m (eg. see Wobschall, 1971) the maximum elastic deformation that
would occur in most biological membranes is about 2-4%. Variations in
bilayer area far in excess of this have been frequently observed in
183
artificial lipid bilayers (Hanai et al., lSS5c and Coster and Simons,
1968) and in plasma membranes of living cells (Wolfe and Steponkus
1981 and Curtain, unpublished results). Previous studies have found
that over sufficiently long times, the stress-strain relation in
artificial bimolecular lipid membranes (Coster and Simons, 1968) and the
plasma membranes of rye protoplasts (Wolfe and Steponkus, 1981) follows
a surface energy law.
Wolfe (1979) applied the Gibbs equation to the equilibrium that
exists between lipids in the torus and the bilayer of artificial lipid
membranes (I discussed the existence of this putative equilibrium in
Section 10.2). His calculations showed that the equilibrium tension in
lipid bilayers is to a large extent dependent on the condition of the
lipid in the torus. Whilst considerable progress has been made in
studying the bulk solution-monolayer equilibrium of different
amphiphiles at oil-water interfaces no detailed experimental
investigation has been made on the thermodynamics of lipid incorporation
into egg-lecithin bilayers. This chapter describes measurements of
bilayer tension of bilayers formed from GMO and egg-lecithin at
different temperatures. The results are interpreted in terms of Wolfe's
modelling of the bilayer-torus equilibrium.
The bilayer tension is derived from the variation of transmembrane
hydrostatic pressure with the inverse of the radius of curvature of a
bowed BLM. The radius of curvature is derived from the area of the
bowed BLM; the area itself being determined from the membrane
capacitance. This technique is an adaption of that of Coster and Simons
(1968); the improvements made to the method of Coster and Simons will be
described here also.
184
The energy of formation of lipid-water interfaces has been
measured using a variety of techniques. Tien and Diana (1967), Coster
and Simons (1968) and Wolfe (1979) deter~ined the bifacial surface
energy* of planar lipid bilayers by measuring the surface area increase
upon bowing the membrane. Wobschall (1971) used the periodic bowing
version of the technique of Coster and Simons (1968). At the low
frequencies of bowing, where there was sufficient time given for lipid
molecules to transfer into the bilayer, the bilayer stress-strain
relation followed a surface energy law. At high frequencies, where the
number of molecules in the bilayer remained essentially constant, the
bilayer stress-strain relation followed an elastic law. From this,
esti~ates of the elastic modulus of the bilayer could be obtained.
Haydon and Taylor (1968) calculated the surface tension of egg-lecithin
bilayers from measurements of the angle of contact between thick lipid
films and lipid bilayers. A novel method for measuring the resting
tension in flat bilayers was developed by Grabowski and Cowen (1977)
whereby the modes of thermal excitations in the bilayer were measured by
laser light scattering.
* The monofacial surface energy is that due to the lipid
monolayer-water interface. However, in these studies the surface energy
of two apposing monolayers was measured. Thus the bifacial surface
energy was double that of the monolayer.
185
10.2 THEORETICAL CONSIDERATIONS
10.21 Thermodynamics of Lipid Partitioning Between the Bilayer and
Torus
Single planar lipid bilayers, by virtue of their rigid support at
the septum, can maintain a net lateral tension. The analysis presented
here follows that of Wolfe (1979) who considered the equilibrium between
lipids in the torus and bilayer phases of the membrane at a constant
tension and applied the Gibbs equation to the equilibrium between lipids
in the bilayer and torus.
Bilayers are only stable when the lipid concentration in the torus
is far in excess of the critical micelle concentration. Therefore
essentially all the lipids are in aggregates of some form. The
treatment here considers the lipid molecules in the torus to exist in
monodisperse aggregates of size N (see figure 10.l).
The Gibbs free energy of the lipids in the torus and bilayers
phases at equilibrium are equal. Therefore one can write the following
expression:
kT XB kT XN 0 ( ) + ln ° + ln µBy --;;- --;;-=µN N N 10. l
Hhere "XN" is the lipid concentration that exists in aggregates
with aggregation number, N, and tiµ\(y) is the standard cherni ea l I
potential of the lipids in the torus and the bilayer at a tension "2y".
The translational entropy of the lipids in the effectively infinite
bilayer is much smaller than that of aggregates, therefore, this term
can be neglected in equation 10.l. Part of the standard chemical
potential of the lipids in the bilayer arises from its interfacial
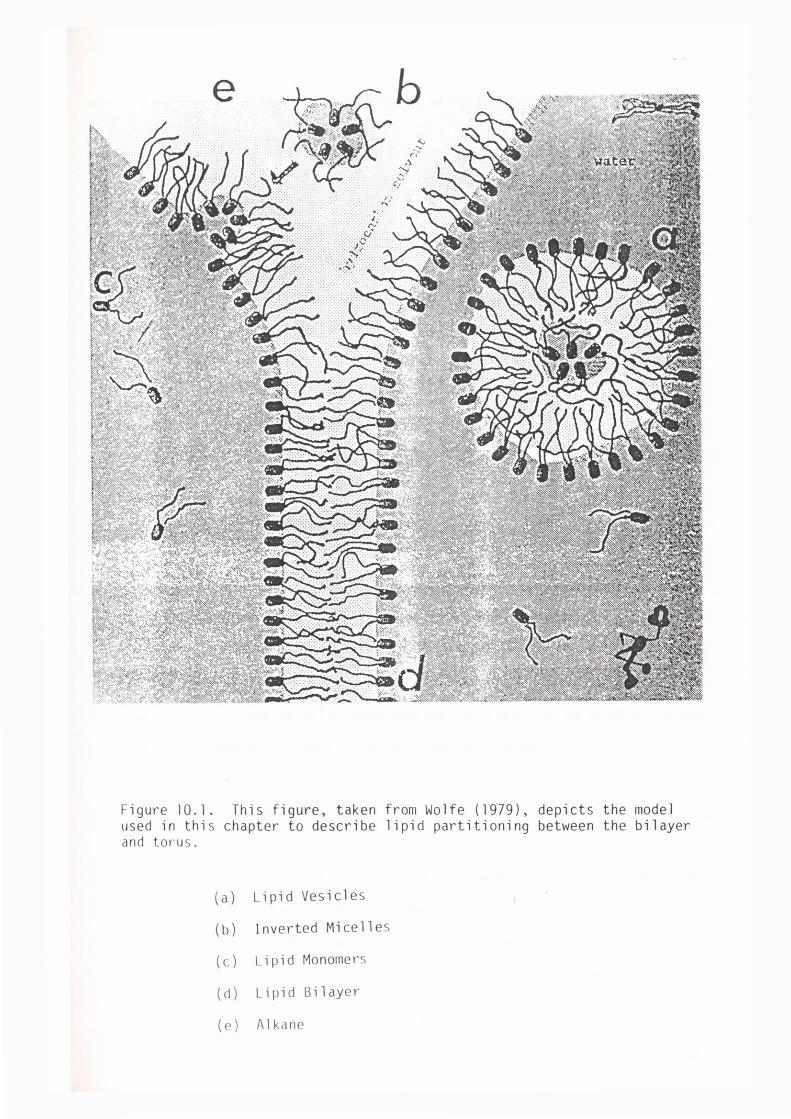
e b
Figure 10.l. This figure, taken from Wolfe (1979), depicts the model used in this chapter to describe lipid partitioning between the bilayer and torus.
(a) Lipid Vesicles
( b) Inverted Micelle s
( C) Lipid Monomers
( d) Lipid Bilayer
( e) Alkane
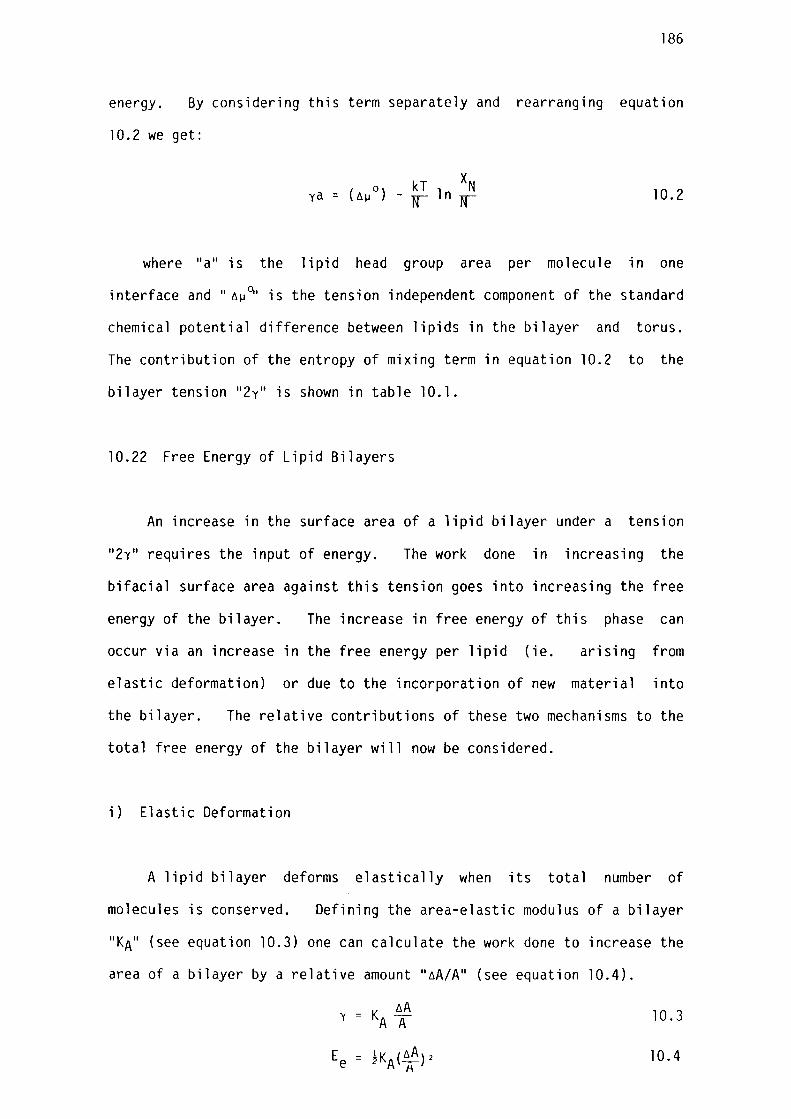
186
energy. By considering this term separately and rearranging equation
10.2 we get:
X ( o) kT l n N
ya :: 6µ - r r 10.2
where "a" is the lipid head group area per molecule in one
interface and" 6µ~' is the tension independent component of the standard
chemical potential difference between lipids in the bilayer and torus.
The contribution of the entropy of mixing term in equation 10.2 to the
bilayer tension "2y" is shown in table 10.1.
10.22 Free Energy of Lipid Bilayers
An increase in the surface area of a lipid bilayer under a tension
"2y" requires the input of energy. The work done in increasing the
bifacial surface area against this tension goes into increasing the free
energy of the bilayer. The increase in free energy of this phase can
occur via an increase in the free energy per lipid (ie. arising from
elastic deformation) or due to the incorporation of new material into
the bilayer. The relative contributions of these two mechanisms to the
total free energy of the bilayer will now be considered.
i) Elastic Deformation
A lipid bilayer deforms elastically when its total number of
' molecules is conserved. Defining the area-elastic modulus of a bilayer
"KA" (see equation 10.3) one can calculate the work done to increase the
area of a bilayer by a relative amount "6A/A" (see equation 10.4).
y = K 6A A A 10. 3
10. 4
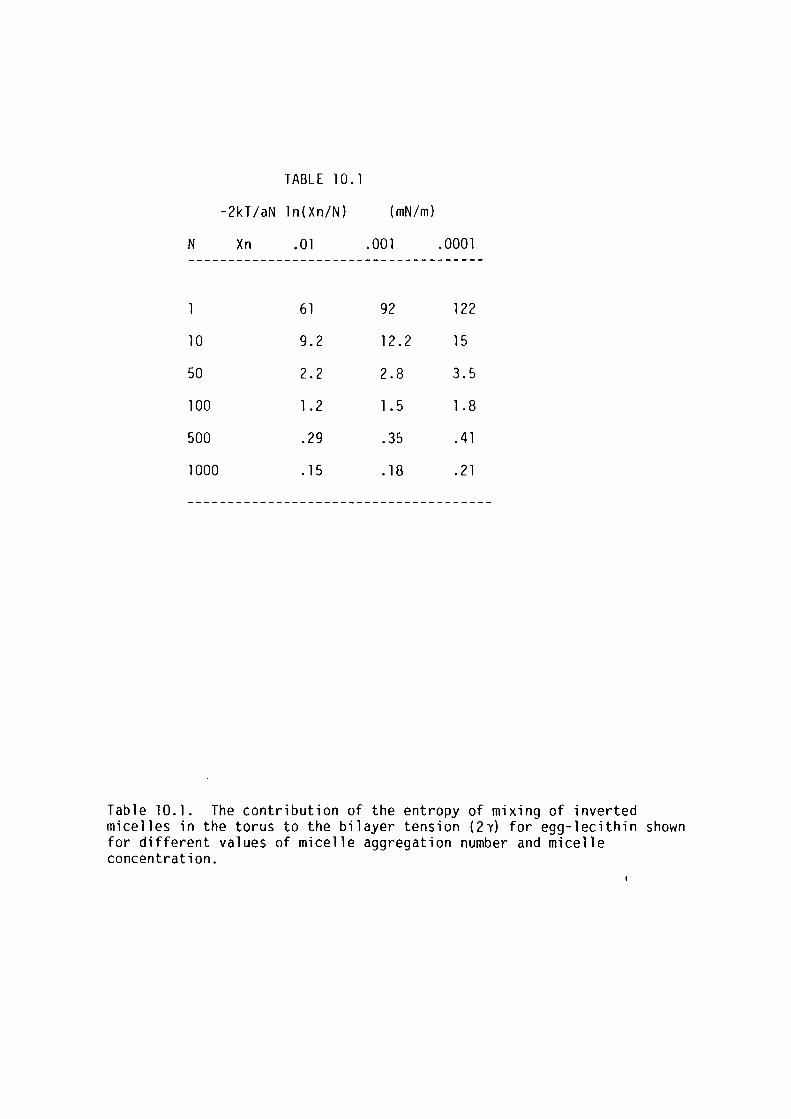
N
10
50
100
500
1000
TABLE 10. l
-2kT/aN ln{Xn/N)
Xn . 0 l
61
9.2
2.2
l.2
.29
. 15
{mN/m)
.001
92
12.2
2.8
l. 5
.35
. 18
.0001
122
15
3.5
l.8
. 41
. 21
--------------------------------------
Table 10. l. The contribution of the entropy of mixing of inverted micelles in the torus to the bilayer tension {2Y) for egg-lecithin shown for different values of micelle aggregation number and micelle concentration.
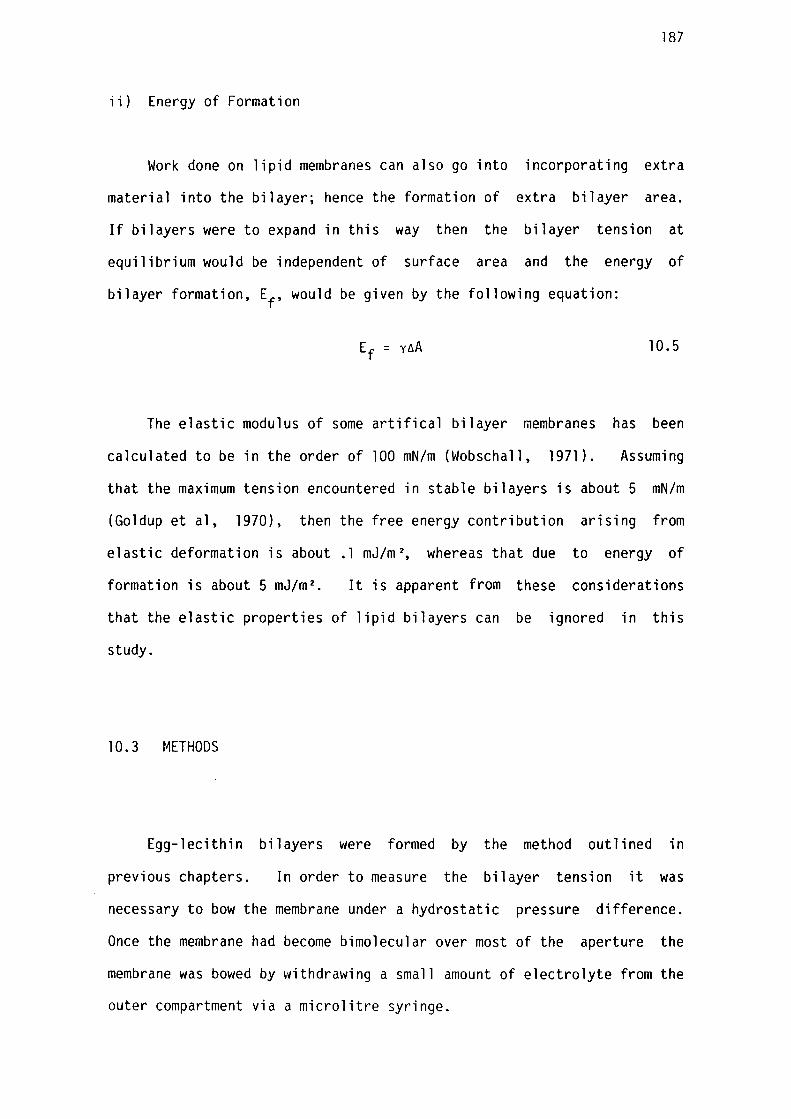
187
ii) Energy of Formation
Work done on lipid membranes can also go into incorporating extra
material into the bilayer; hence the formation of extra bilayer area.
If bilayers were to expand in this way then the bilayer tension at
equilibrium would be independent of surface area and the energy of
bilayer formation, Ef, would be given by the following equation:
10.5
The elastic modulus of some artifical bilayer membranes has been
calculated to be in the order of 100 mN/m (Wobschall, 1971). Assuming
that the maximum tension encountered in stable bilayers is about 5 mN/m
(Goldup et al, 1970), then the free energy contribution arising from
elastic deformation is about .1 mJ/m 2 , whereas that due to energy of
formation is about 5 mJ/m 2 • It is apparent from these considerations
that the elastic properties of lipid bilayers can be ignored in this
study.
10.3 METHODS
Egg-lecithin bilayers were formed by the method outlined in
previous chapters. In order to measure the bilayer tension it was
necessary to bow the membrane under a hydrostatic pressure difference.
Once the membrane had become bimolecular over most of the aperture the
membrane was bowed by withdrawing a small amount of electrolyte from the
outer compartment via a microlitre syringe.
188
When the bilayer area had increased sufficiently, part of the
hydrostatic pressure was then removed so that the membrane flattened
slightly. It was assumed that equilibrium between the bilayer and torus
was achieved when the membrane capacitance reached a steady value. When
equilibrium was attained the capacitance 11 C11 of the spherical bilayer
was measured and then the membrane was flattened by adding a known
quantity of electrolyte to the outer compartment. At this point two
variations of the protocol were tested. One involved unbowing the
bilayer in several stages, allowing the bilayer and torus to come to
equilibrium at each point and recording the capacitance. Then, having
completely flattened the bilayer, the capacitance, "C II of the planar 0 '
bilayer was measured. Alternatively, the bilayer was flattened in one
step, giving insufficient time for the torus to move before taking the
capacitance of the flat membrane. Achievement of the flat bilayer could
be easily detected under reflected light since the bilayer acts as a
spherical mirror whose focal point goes to infinity when it is flat.
This second variation of the method was found to be most suitable for
measuring bilayer tensions in this study (see discussion). The area of
the bowed membrane was determined from the membrane capacitance using
the following equation:
10.6
Hhere "A II is the area of the flat membrane. The radius of 0
curvature, R, of the membrane, just prior to being flattened, was then
determined from the area of the bowed membrane at equi l i br'i uril, A,
relative to its projected area normal to the septum (assumed to be equal
to "A") using the following equation: 0
_l R = A{4n(A - A ) } 2
0 l O. 7
189
The hydrostatic pressure difference across the membrane whilst
bowed could be calculated from the volume of the aqueous solution, v A
that was added to the outer compartment when flattening the membrane.
This was done using equation 10.8:
10.8
Where 10. 9
~Jhere 11 p 11 and "g" are the density of water and the acceleration due
to gravity. "S1" and 11 S2 11 are the areas of the air-water interface in
both water compartments and 11 v II is the volume of water displaced by the m
bowed membrane. The tension of the bowed bilayer with a radius of
curvature, R, supporting a pressure difference "tiP" is given by the
Laplace-Young equation:
2y = ~ 10. 10
The procedure was repeated 3-5 times for each membrane for
different relative increases in bilayer area during bowing in the range
10-60%. Measurements of bilayer tension at temperatures below that
necessary for rapid bilayer formation were made by bowing the membrane
at elevated temperatures. Thus after equilibrating the membrane at a
lower temperature, the capacitance was measured and then the membrane
was flattened. A period of 15-20 minutes was allowed for equilibration I
of the membrane at each temperature.
This method warrants some discussion.
is reserved for a later section.
However, such a discussion
190
10.4 RESULTS
Thick egg-lecithin films became bimolecular over most of the
supporting aperture in 5-15 minutes. Upon bowing the membrane, there
was no immediate increase in capacitance. Thus the initial area
increase was entirely due to an increase in the area of the torus. The
formation of the additional bilayer due to bowing proceeded at about the
same rate as that found for bilayer formation in flat membranes. At
different degrees of bowing the membrane torus was anchored at different
points on the septum (see figure 10.2). The capacitance would settle
within 10-20 minutes of bowing. However, during this time, different
evaporation rates in the aqueous phases in both water filled
compartments invariably produced additional, unknown, hydrostatic
pressure across the membrane. Sometimes, particularly at elevated
temperatures, the time variation in hydrostatic pressure due to
evaporation losses was sufficiently rapid to bow the bilayer into a
hemisphere over a period of 30 minutes. Capacitance changes upon
progressive flattening of an already-formed bilayer~re much more rapid.
For this reason it was fairly difficult to measure hysteresis curves of
membrane capacitance during bowing and flattening. A plot of the time
variation in bilayer capacitance during bowing and flattening is shown
in figure 10.3. Note that during unbowing the capacitance settled to a
steady value with two distinct "rates". The initial rapid decrease in
capacitance was associated with the decrease in bilayer area as a direct
result of a change in the curvature of the membrane. After the initial
rapid decrease a slower decrease in capacitance persisted for 5-10
minutes which was associated with a change in the shape of the torus.
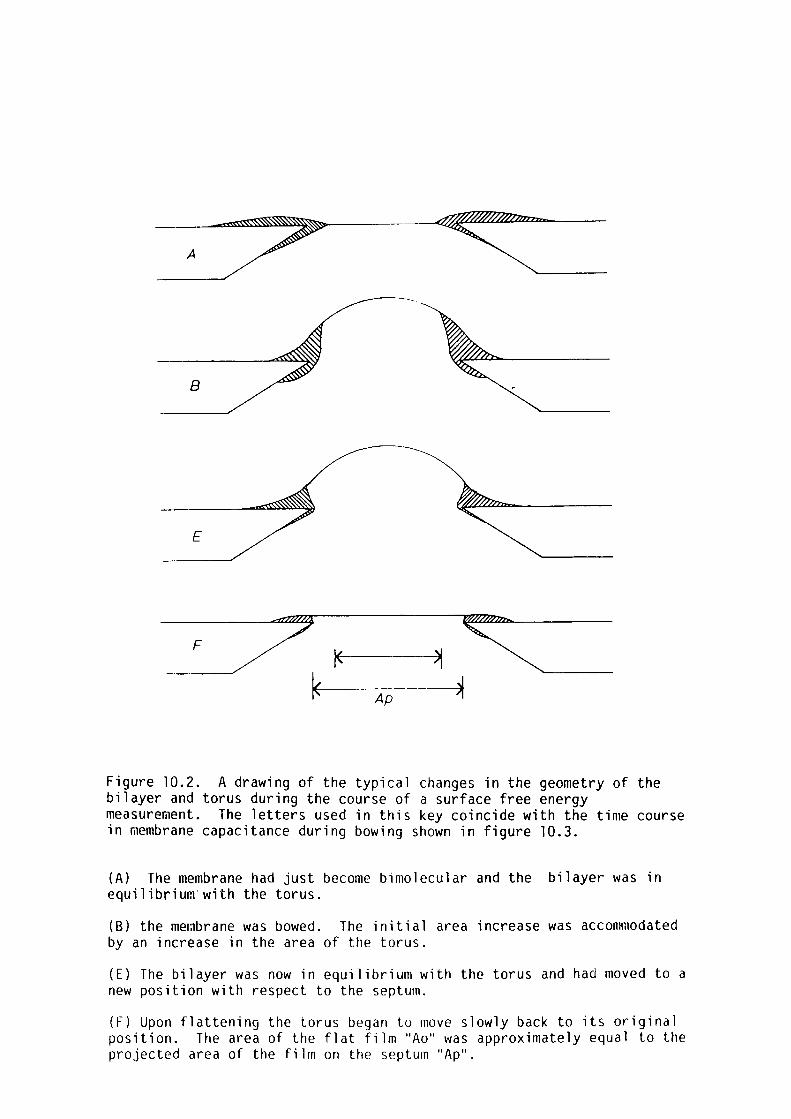
a
E
Figure 10.2. A drawing of the typical changes in the geometry of the bilayer and torus during the course of a surface free energy measurement. The letters used in this key coincide with the time course in membrane capacitance during bowing shown in figure 10.3.
(A) The membrane had just become bimolecular and the bilayer was in equilibrium'with the torus.
(B) the membrane was bowed. The initial area increase was accommodated by an increase in the area of the torus.
(E) The bilayer was now in equilibrium with the torus and had moved to a new position with respect to the septum.
(F) Upon flattening the torus began to move slowly back to its original position. The area of the flat film "Ao" was approximately equal to the projected area of the film on the septum "Ap".
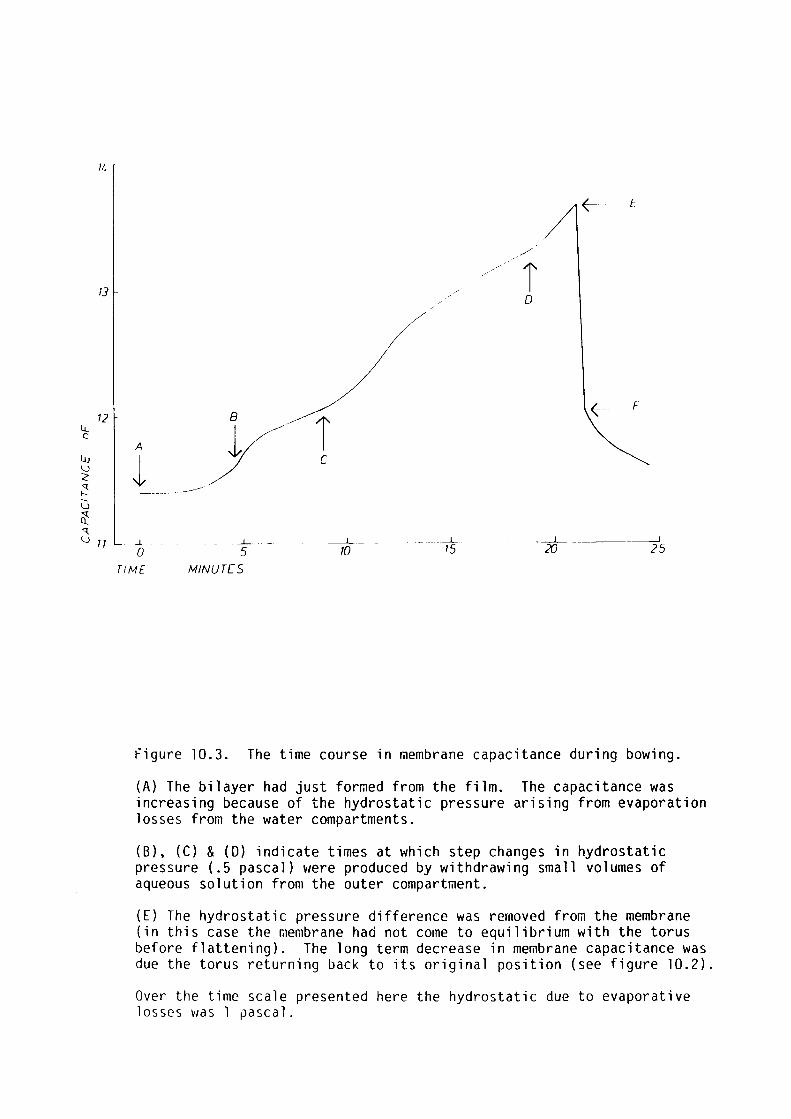
ll
13
12 lJ... C
Lu u ~
~ u r}_ <t: u 11
E
/
i D
~-F y- 1' A
l C
--------
..l ~--- ___.I_ ___ --- - -----'-- _____ _j__ _______ ___J
0 5 10 15 20 25
TIME MINUTES
Figure 10.3. The time course in membrane capacitance during bowing.
{A) The bilayer had just formed from the film. The capacitance was increasing because of the hydrostatic pressure arising from evaporation losses from the water compartments.
(B), (C) & (D) indicate times at which step changes in hydrostatic pressure (.5 pascal) were produced by withdrawing small volumes of aqueous solution from the outer compartment.
{E) The hydrostatic pressure difference was removed from the membrane (in this case the membrane had not come to equilibrium with the torus before flattening). The long term decrease in membrane capacitance was due the torus returning back to its original position {see figure 10.2).
Over the time scale presented here the hydrostatic due to evaporative losses was l pascal.
191
Two variations of the method described previously were tested.
When measurements were made by repeatedly flattening bowed membranes
over short times the measurements of inverse radius of curvature were
linearly proportional to the hydrostatic pressure. Consequently the
bifacial tension of the bilayer, calculated from the gradient of this
plot, was independent of membrane area which was similar to the findings
of Coster and Simons (1968). When the membrane was unbowed in
successive steps the calculated bilayer tension varied significantly
with membrane curvature. The comparison of results obtained by these
two variations is shown in figure 10.4. The significance of the
discrepancy in the values obtained by these two procedures will be
discussed later.
The temperature dependence of bilayer tension in bilayers formed
from egg-lecithin and cholesterol is shown in figure 10.5. The bilayer
tension in egg-lecithin membranes increased with decreasing temperature
whereas the tension in bilayers formed from GMO decreased with
decreasing temperature ( see Table 10.2). The values shown in Table
10.2 are in agreement with tension values obtained by Wolfe (1979) and
Andrews et al. (1970) for identical bilayer systems. Measurements of
bilayer tension on each membrane were repeatable to ±10%. The variation
in bilayer tension between different membranes was ±25%.
Inspection of figure 10.5 shows that the effect of using different
chainlength alkanes in the merabrane forming solution on the lateral
tension of egg-lecithin bilayers was not very significant; if anything
there was a slight reduction in bilayer tension for shorter chainlength
alkanes.
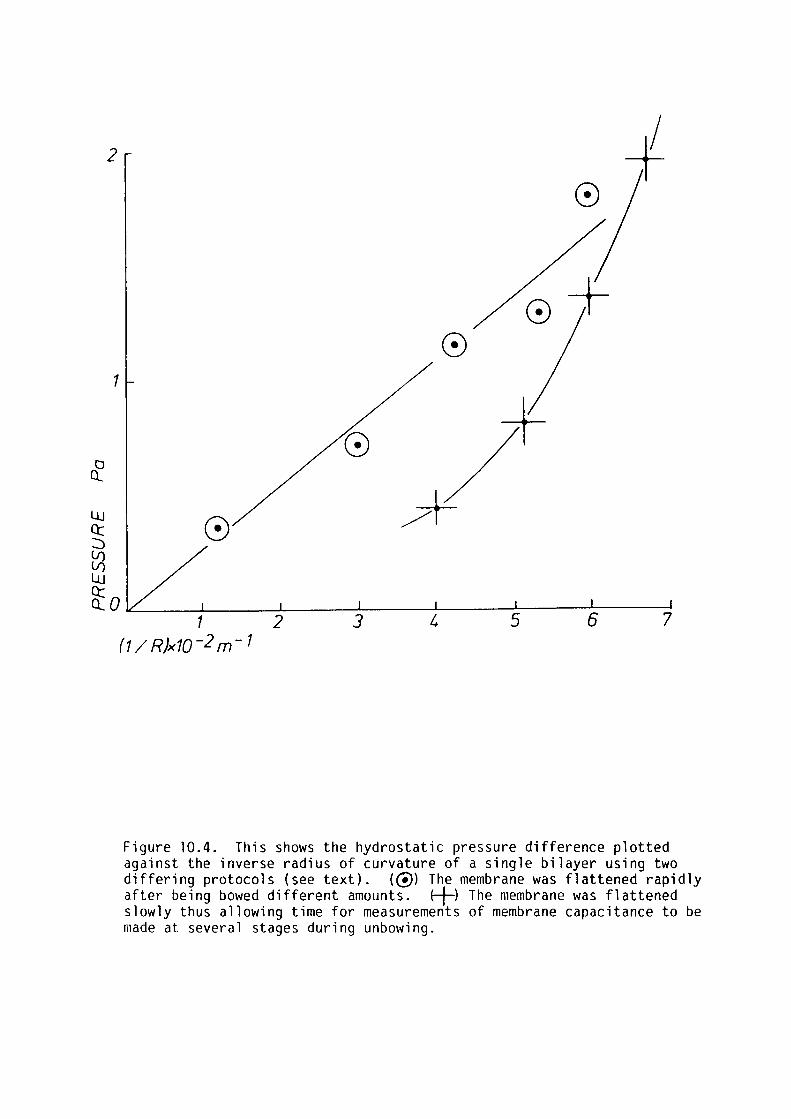
2
0
0+ 0
1
0 CJ
Q
LU 0 ~ ct
::)
~ Lu
[o 1 2 3 5 6 7
(1 / R)x10-2 m- 1
Figure 10.4. This shows the hydrostatic pressure difference plotted against the inverse radius of curvature of a single bilayer using two differing protocols (see text). (@) The membrane was flattened rapidly after being bowed different amounts. {-f-) The membrane was f1 attened slowly thus allowing time for measurements of membrane capacitance to be made at several stages during unbowing.
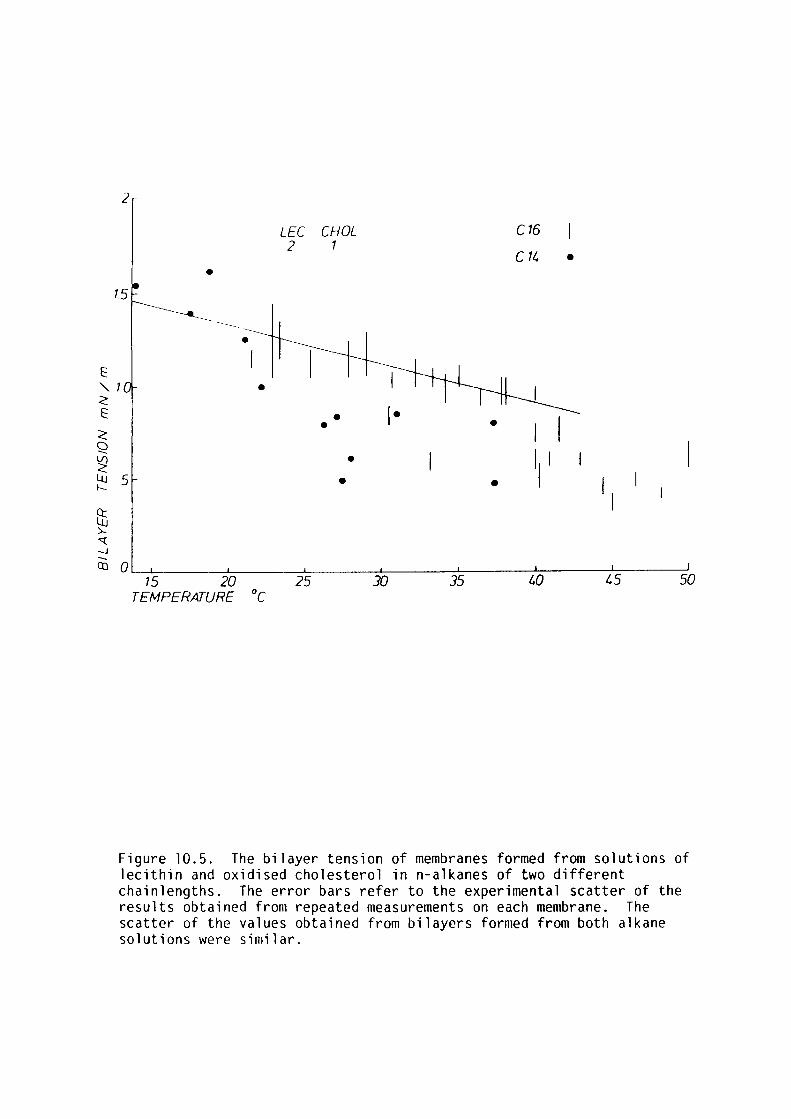
2
LEC CHOL C16 2 1 cu. •
• 15
E:
·········;1t1ii-"- 7 • I < E:
< Q ~ Lu I--
~ >--":t: -.J --(l:)
• I• • • I I II I •
5 • • I I
0 15 20 25 JO 35 1.0 1.5 50
TEMPERATURE oc
Figure 10.5. The bilayer tension of membranes formed from solutions of lecithin and oxidised cholesterol in n-alkanes of two different chainlengths. The error bars refer to the experimental scatter of the results obtained from repeated measurements on each membrane. The scatter of the values obtained from bilayers formed from both alkane solutions were similar.
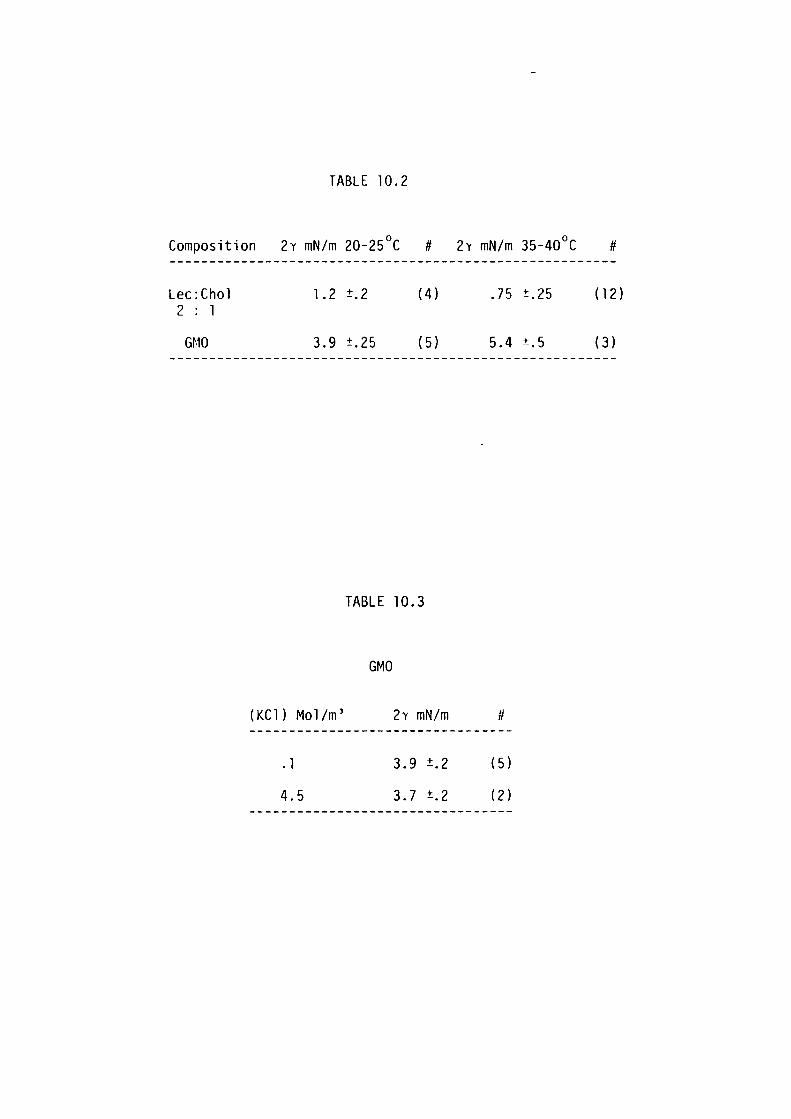
TABLE 10. 2
Composition 2Y mN/m 20-25°( # 2Y mN/m 35-40°( # --------------------------------------------------------Lec:Chol 2 l
GMO
1.2
3.9
(KCl) Mol/m 3
• l
4.5
±.2 ( 4)
±.25 ( 5)
TABLE 10.3
GMO
2Y mN/m
3.9 ±.2
3. 7 ±. 2
.75
5.4
#
( 5)
( 2)
±.25 ( 12)
±.5 ( 3)
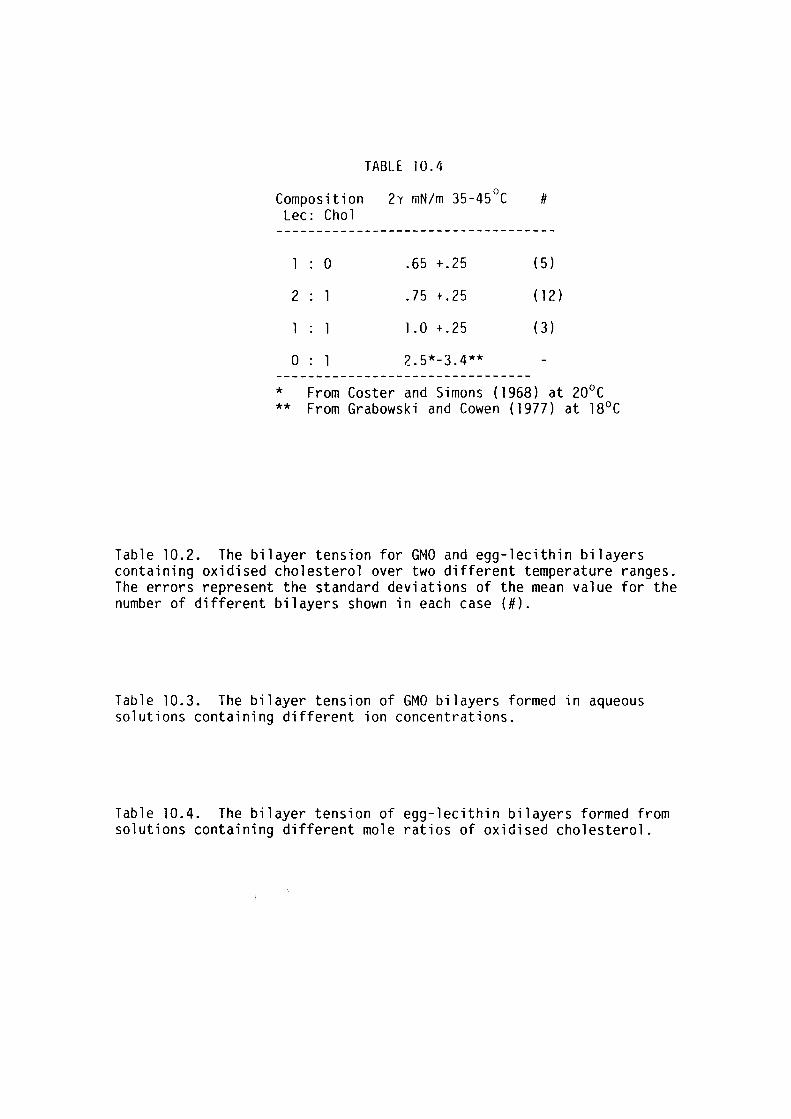
TABLE 10.4
Composition 2Y mN/m 35-45°( # Lee: Chol
0
2
0
.65 +.25
.75 +.25
( 5)
( 12)
1.0 +.25 (3)
2.5*-3.4**
* From Coster and Simons (1968) at 20°C ** From Grabowski and Cowen (1977) at l8°C
Table 10.2. The bilayer tension for GMO and egg-lecithin bilayers containing oxidised cholesterol over two different temperature ranges. The errors represent the standard deviations of the mean value for the number of different bilayers shown in each case (#).
Table 10.3. The bilayer tension of GMO bilayers formed in aqueous solutions containing different ion concentrations.
Table 10.4. The bilayer tension of egg-lecithin bilayers formed from solutions containing different mole ratios of oxidised cholesterol.
192
The bilayer tension of GMO and egg-lecithin bilayers was found to
be essentially unaffected by a 50 fold increase in the external
electrolyte concentration {see Table 10.3). Measurements of the bilayer
tension of egg-lecithin bilayers at high electrolyte concentrations were
exceedingly difficult as the formation of the bilayer was much slower
and the membrane was more fragile at these concentrations.
The inclusion of cholesterol in varying mole fractions in
egg-lecithin bilayer was found to increase the bilayer tension {see
Table 10.4). However, the temperature dependence of the bilayer tension
remained unaffected.
10.5 DISCUSSION
10.51 Rationale for the Method
Equilibrium between the bilayer and torus upon bowing the membrane
was difficult to detect as the approach to equilibrium was slow. This
was further complicated by the effect of differing rates of evaporation
from both electrolyte compartments; introducing unaccountable drifts in
the hydrostatic pressure over the equilibrating period of the membrane.
However, the approach to equilibrium during flattening was much more
rapid. Therefore it was desirable to conduct the tension measurements
whilst unbowing the membrane.
It was also found that the Plateau-Gibbs border was not rigidly
anchored to the septum and that the torus of lipid solution would move
away from the edge of the hole during bowing. Thus the area of the
bilayer, projected normal to the septum, varied with bowing and was
193
always greater than the area of the aperture. Examination of figure
10.3 shows that the movement of the torus over the 15 second time
interval immediately after flattening caused an underestimate of "A II
0
but not by more than 2%. However, over longer periods "A" could have 0
been underestimated by up to 10%. The effects of significant
underestimates of "A II in calculating the reciprocal radius of curvature 0
can be seen in figure 10.4 for the case where the bilayer was unbowed at
different rates. Therefore it was necessary to accurately determine the
area of the projection of the bowed film on the septum. Hence, after
measuring the capacitance of the membrane at equilibrium in the bowed
state, the membrane was flattened and the capacitance immediately
measured, not allowing sufficient time for the torus to move. From a
knowledge of the bilayer specific capacitance and the total capacitance
of the flattened bilayer the area could then be calculated.
The fact that the bilayer wasn't in mechanical equilibrium
immediately after unbowing has no bearing on the validity of this
approach as no intrinsic property of the bilayer was being investigated
after the membrane had been flattened. The capacitance of the bilayer
merely served as a measure of the effective projected area of the
membrane whilst it was bowed.
1-0.52 Energy of Formation: Temperature Dependence
In order to interpret the temperature dependence of bilayer tension
reported here we will calculate the partial derivative of "ya'' in
equation 10.2. The temperature-variation of the micelle concentration
"XN" is not likely to be important as the bilayer tension is logarithmic
in micelle concentration. Therefore terms arising from the temperature
194
variation of 11XN II can be neglected. The temperature dependence of the
bilayer surface energy is then given by:
where
0 aya _ a6µ + k O _ kT aN (D + l) ar-ar N war
X D=-ln;
10. 11
In these experiments 11 ~ 11 was in the range (2-4). 10- 3• Therefore,
as "N" is no less than unity, it is unlikely that 11 0 11 lies outside the
range 7-20. One expects that the variation of aggregation number with
increasing temperature to be negative both from the higher entropy of
smaller aggregates and from the relaxation of geometric packing
constraints (due to increased fluidity) at higher temperature. Hence:
aN > O 10.12 aT
As "D" lies in the range 7-20 then 1.):::0+1. Equation 10.11 can be
expressed as:
aya a6µ 0 kT + kT(D + l) (- aN) ar- =at+ N N2 aT 10. 13
From this equation it can be seen that the aggregation number, N,
of the lipids in the torus will effect the temperature dependence of the
bilayer tension. The smaller the aggregation number of the lipids in
the torus the more positive the temperature dependence of bilayer
tension. I
Differences of temperature dependence of bilayer tensions in
egg-lecithin and GMO bilayers have been assumed to be a result of
differences in the aggregation of the lipids in the torus. The
temperature dependence of bilayer tension in these two bilayer systems
will now be considered separately.
i) Egg-Lecithin
From the data in figure 10.3 the value of ayo aT
approximately -10-i kT/°C per molecule.
0
Thus a~T <O. 0
Then I ai\:r I > ~ + k~~ ( - ~)
195
was calculated as
10. 13
Thus it can be seen that the temperature dependence of the
standard chemical potential difference between lipids in the bilayers
and torus of egg-lecithin membranes is the dominant factor in the
temperature dependence of bilayer tension; the entropy terms being much 0
smaller. This implies that either .,a~µT " or "N" is large. It is not
certain which of these two alternatives is the case. Hm,ever, the
latter possibility is more likely as the internal conformation of the
lipid molecules in the bilayer is not expected to vary significantly with
temperature nor is it expected to be very different to that found in lipid
aggregates (inverted micelles) in the torus.
It can be concluded that the standard chemical potential difference
between lipids in the torus and bilayer decreases with increasing
temperature.
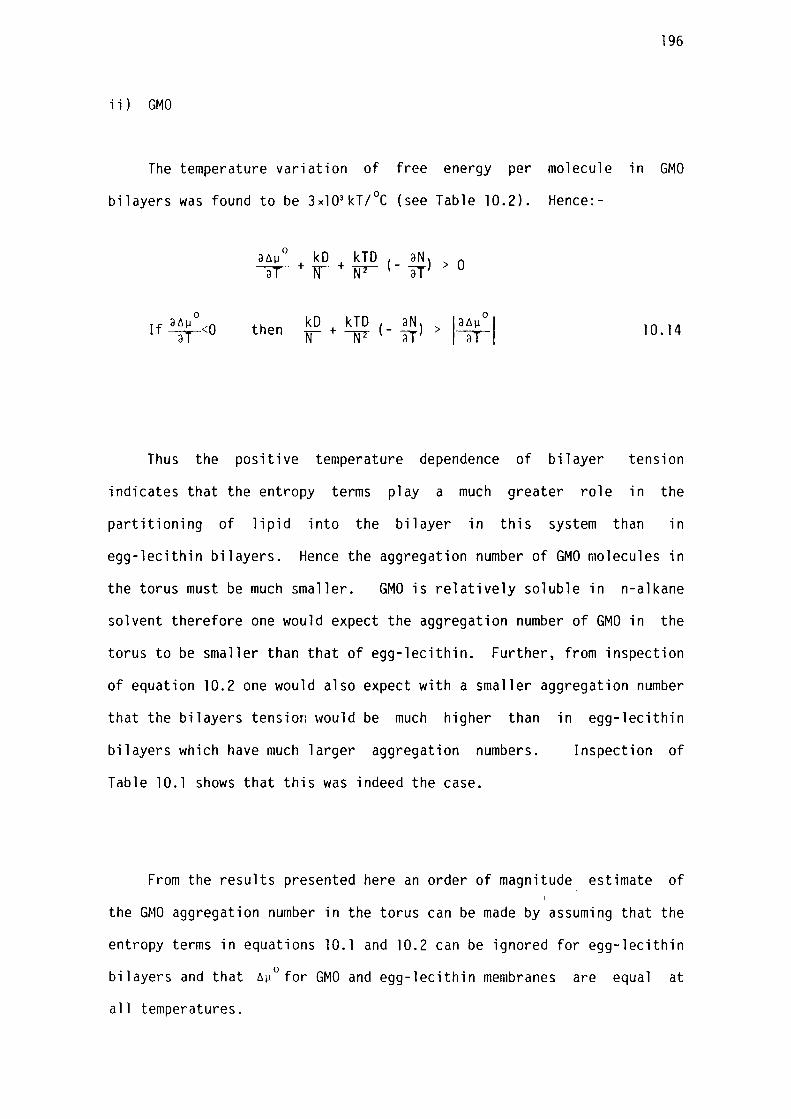
196
ii) GMO
The temperature variation of free energy per molecule in GMO
bilayers was found to be 3xl03 kT/°C (see Table 10.2). Hence:-
0
If atiµ <O al then l O. 14
Thus the positive temperature dependence of bilayer tension
indicates that the entropy terms play a much greater role in the
partitioning of lipid into the bilayer in this system than in
egg-lecithin bilayers. Hence the aggregation number of GMO molecules in
the torus must be much smaller. GMO is relatively soluble in n-alkane
solvent therefore one would expect the aggregation number of GMO in the
torus to be smaller than that of egg-lecithin. Further, from inspection
of equation 10.2 one would also expect with a smaller aggregation number
that the bilayers tension would be much higher than in egg-lecithin
bilayers which have much larger aggregation numbers.
Table 10.l shows that this was indeed the case.
Inspection of
From the results presented here an order of magnitude estimate of
the GMO aggregation number in the torus can be made by assuming that the
entropy terms in equations 10. l and 10.2 can be ignored for egg-lecithin
bilayers and that tiµ 0 for GMO and egg-1 eci thin membranes are equal at
all temperatures.
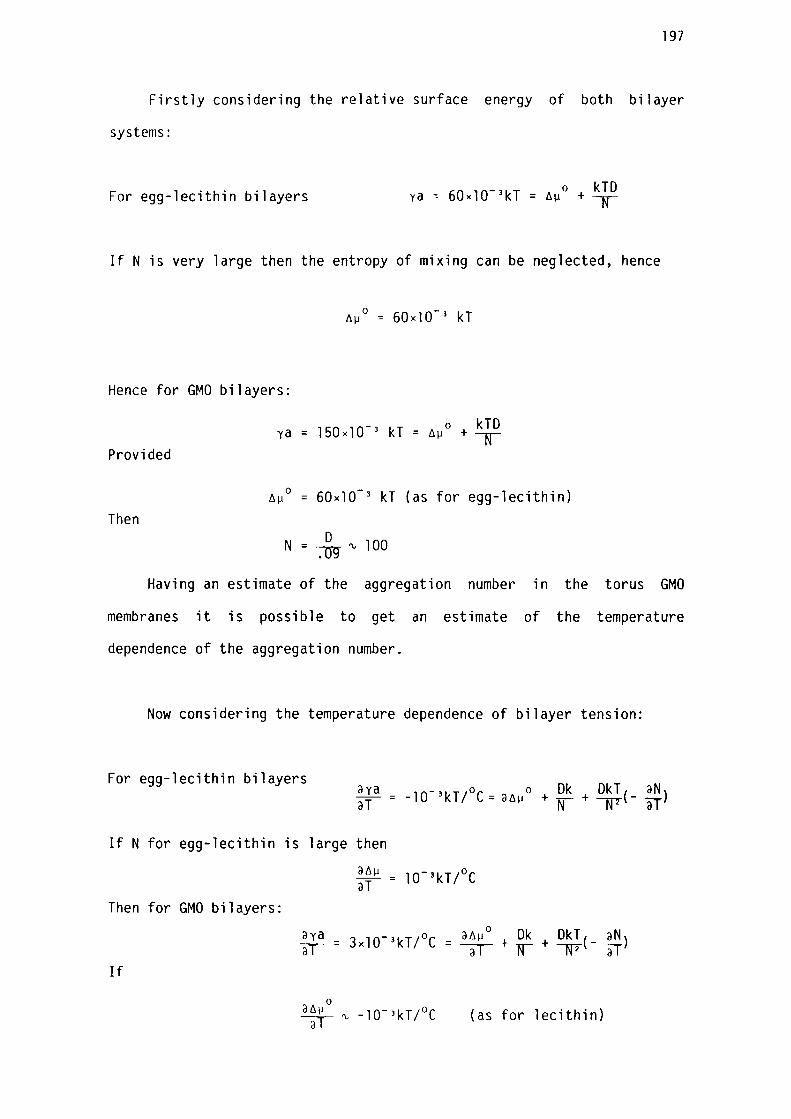
197
Firstly considering the relative surface energy of both bilayer
systems:
For egg-lecithin bilayers 0 = 6µ
kTD + N
If N is very large then the entropy of mixing can be neglected, hence
Hence for GMO bilayers:
Provided
0 = 6µ
kTD +N
6µ 0 = 60xl0 3 kT (as for egg-lecithin) Then
D N = -:iyg-"' 100
Having an estimate of the aggregation number in the torus GMO
membranes it is possible to get an estimate of the temperature
dependence of the aggregation number.
Now considering the temperature dependence of bilayer tension:
For egg-lecithin bilayers aya aT
If N for egg-lecithin is large then
Then for GMO bilayers:
If
a6 µ - l0- 3 kT/°C aT -
(as for lecithin)
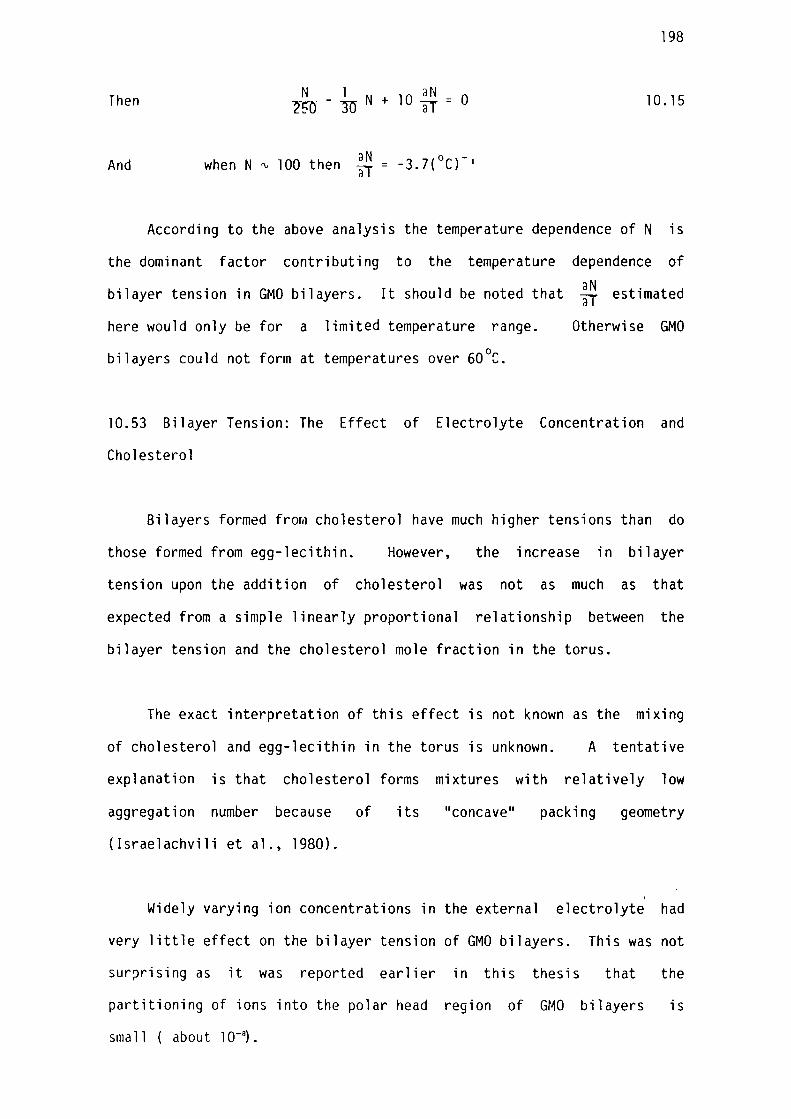
198
Then N 1 N + lO aN = 0 ~ 1U aT 10. 15
And aN o when N ~ 100 then aT = -3.7( C)- 1
According to the above analysis the temperature dependence of N is
the dominant factor contributing to the temperature dependence of
bilayer tension in GMO bilayers. It should be noted that ~ estimated
here would only be for a limited temperature range. 0 bilayers could not form at temperatures over 60 C.
Otherwise GMO
10.53 Bilayer Tension: The Effect of Electrolyte Concentration and
Cholesterol
Bilayers formed from cholesterol have much higher tensions than do
those formed from egg-lecithin. However, the increase in bilayer
tension upon the addition of cholesterol was not as much as that
expected from a simple linearly proportional relationship between the
bilayer tension and the cholesterol mole fraction in the torus.
The exact interpretation of this effect is not known as the mixing
of cholesterol and egg-lecithin in the torus is unknown. A tentative
explanation is that cholesterol forms mixtures with relatively low
aggregation number because of its "concave"
(Israelachvili et al., 1980).
packing geometry
I
Widely varying ion concentrations in the external electrolyte had
very little effect on the bilayer tension of GMO bilayers. This was not
sur~rising as it was reported earlier in this thesis that the
partitioning of ions into the polar head region of GMO bilayers is
sma 11 ( about 1 o-e) •
199
10.6 SUMMARY
The bilayer tension of membranes formed from GMO and egg-lecithin
was measured using a variation of the technique of Coster and Simons
(1968). The method was adapted to overcome difficulties peculiar to the
present lipid bilayer membranes.
The stress-strain relation in lipid bilayers was that expected from
the surface energy law. Elastic contributions to the free energy of the
bilayer were negligible.
The temperature variation of bilayer tension in GMO and
egg-lecithin bilayers was distinctly different. GMO bilayers maintained
large tensions which increased with increasing temperature.
Egg-lecithin bilayers, on the other hand, had much smaller tensions
which decreased with increasing temperature. The difference in the
tension properties of these two systems was consistent with
egg-lecithin bilayers being in equilibrium with very large aggregates
and GMO bilayers being in equilibrium with relatively small -aggregates,
containing about 100 molecules. The increase in GMO bilayer tension
with increasing temperature was mainly due to a decrease in the
aggregation number of the molecules with increasing temperature.
From the data presented in this chapter it seems that entropy plays
a minor role in determining the energy of formation of egg-lecithin
bilayers. However, in GMO membranes entropy plays the dominant role in
bilayer-torus equilibrium.
200
The addition of cholesterol into egg-lecithin bilayers produced
bilayers which had higher tensions. The mechanism for this is not yet
known. However, it is possible that egg-lecithin - cholesterol
mixtures have smaller aggregation numbers than pure egg-lecithin.
A 50 fold increase in the ion concentration in the
had no measurable effect on GMO bilayers. This lack
aqueous phase
of effect is
consistent with a high energy barrier to ions in the polar regions of
GMO discussed in previous chapters.
CHAPTER 11
THE EFFECT OF SOME LOCAL ANAESTHETICS ON THE
PHYSICAL PROPERTIES OF EGG-LECITHIN BLM
11.l INTRODUCTION
11.2 MATERIALS AND METHODS
11.3 RESULTS
11.4
11. 31 Procaine
11.32 Other p-Aminobenzoic Acid Esters
11 . 33 Alcohols
DISCUSSION
11 . 41 p-Aminobenzoic Acid Esters
11 .411 Surface Charge
11.412 Dielectric Structure
11.413 Bilayer Conductance
Page
202
204
205
205
206
207
209
209
209
210
213
11 . 42 Alcohols: Their Effect on Dielectric Structure 214
11 . 43 Bilayer Tension: Effect of Local Anaesthetics 214
11 . 44 Comparison With Previous Work 215
11. 45 Possible Mechanisms For ~ocal Anaesthesia 216
11.5 SUMMARY 219
201
202
11. l INTRODUCTION
From the viewpoint of their practical application in medicine,
local anaesthetics are clinically important drugs.
their ability to inhibit the propagation of nerve
This is a result of
action potentials
without causing cell death.
is not well understood.
Their mode of action, at a molecular level,
An understanding of the mechanism of
anaesthesia by local anaesthetics will yield new insights, not only into
the action of anaesthetics per se, but also into the more general
problem of the function of biological membranes.
The inhibition of the action potential in squid axon by local
anaesthetics is mainly due to a reduction in the conductivity of the
sodium channel; the conductance of the potassium channel being much
less sensitive to the presence of local anaesthetics (see review by
Ritchie and Greengard, 1966).
Given the functional importance of the bilayer component of
biological membranes (see review in Chapter l) it was of interest in
this study to investigate the effects of local anaesthetics on the
structure of artificial lipid bilayers.
Some models for the action of local anaesthetics associate the
action of anaesthetic with specific proteins, acting at specific sites
on the protein (Hille, 1980). However, the wide variety of compounds
which act as anaesthetics, as well as their often additive effects
(Staiman and Seeman, 1975) on a wide variety of membranes and membrane
functions, suggests that the site of action of anaesthetics is a
203
non specific site with polar and non-polar properties (Franks and
Lieb, 1978).
Anaesthetics are known to increase membrane area and fluidity
(Seeman and Roth, 1972). It has been postulated that anaesthesia is a
direct consequence of this (Seeman, 1972). However, X-ray (Franks and
Lieb, 1978), and NMR experiments (Boggs, Yoong and Hsia, 1976, Boggs,
Roth, Yoong, Wong and Hsia, 1976 and Turner and Oldfield, 1979) found
that, at the relatively low concentrations required to induce
anaesthesia in living cells, anaesthetics had no detectable effects on
lipid organization in multilayer and vesicle preparations.
suggested that anaesthetics specifically act at sites on
It was then
the membrane
bound proteins (though this is difficult to reconcile with the notion of
non-specific sites referred to earlier) or at the surrounding annular
lipid region (Lee, 1976, Richards, 1976 and Franks and Lieb, 1978).
Ashcroft, Coster and Smith (1977) and Haydon et al. (1977) proposed
that the anaesthetic action of hydrophobic molecules, such as the
n-alkanes and amphiphilic molecules, such as benzyl alcohol, was due to
their ability to swell lipid bilayers, both in artificial systems as
well as in biological membranes. Ashcroft (1979) investigated this
possibility for amphiphilic molecules such as procaine and benzocaine by
measuring their effect on the dielectric structure of artifical
egg-lecithin bilayers generated from n-tetradecane lipid solutions. On
the basis of those studies it was postulated that anaesthetics generally
act by inducing changes in the thickness of the bilayer component of
biological membranes.
In this thesis artificial BLM have been re-characterised with
improved apparatus in the light of recent contributions to the
204
understanding of the physical properties of lipid bilayers. Namely,
alkane absorption (eg. White, 1977 and Gruen, 1980a and 1980b),
capacitance of ionic double layers (Smith, 1977) and bilayer tension
(eg. Wolfe, 1979). Given this re-characterisation, the effects of some
alcohols and p-aminobenzoic acid ester ty~es of local anaesthetic were
re-examined in an attempt to test the validity of conclusions of
Ashcroft (1979) in solventless bilayer systems. The results presented
in this chapter have been interpreted in terms of the physical and
electrical properties of lipid bilayers described in this thesis.
11.2 MATERIALS AND METHODS
Artificial bimolecular lipid membranes were formed from n-alkane
solutions containing egg-lecithin and egg-lecithin - cholesterol
(2:1 mole ratio).
The effects of some of the p-aminobenzoic acid ester types of local
anaesthetics on lipid bilayers were investigated by adding appropriate
amounts of these chemicals to the aqueous phase. Both procaine and
tetracaine were added to the membrane system in the form of a
hydrochloride salt. Alcohols were added to the membrane via either the
membrane forming solutions or the aqueous phase.
Control experiments were conduct~d at the beginning of each series
of measurements with a new anaesthetic. The physical and electrical
properties of the control membranes were compared to those obtained from
membranes known to be uncontaminated. This served as a check to ensure
that traces of anaesthetics employed in earlier experiments (adsorbed on
205
the walls of the membrane chambers, for instance) did not contaminate
bilayers in subsequent experiments.
When the effects of slightly volatile drugs on egg-lecithin
bilayers were being investigated, the impedance measurements performed
were made within 2 hours of exposing the drug to the atmosphere.
Neasurements of bilayer surface free energy were made using the
same procedure as that employed in similar measurements described in the
previous chapter.
The molecular models of the local anaesthetics used in this study
are shown in figure 11.1.
11.3 RESULTS
11.31 Procaine
The presence of procaine in the aqueous phase at concentrations in
the range 1-5 mM had no detectable effect on the capacitance (measured
at lHz) of solvent free egg-lecithin and egg-lecithin - cholesterol
bilayer (see Table 11.1).
The frequency dispersion in bilayer capacitance and conductance was
markedly effected by procaine at mM concentrations. At frequencies
above lHz the dispersion due to the polar regions of egg-lecithin
bilayers, with and without cholesterol, virtually disappeared when
procaine was present (see figure 11.2).
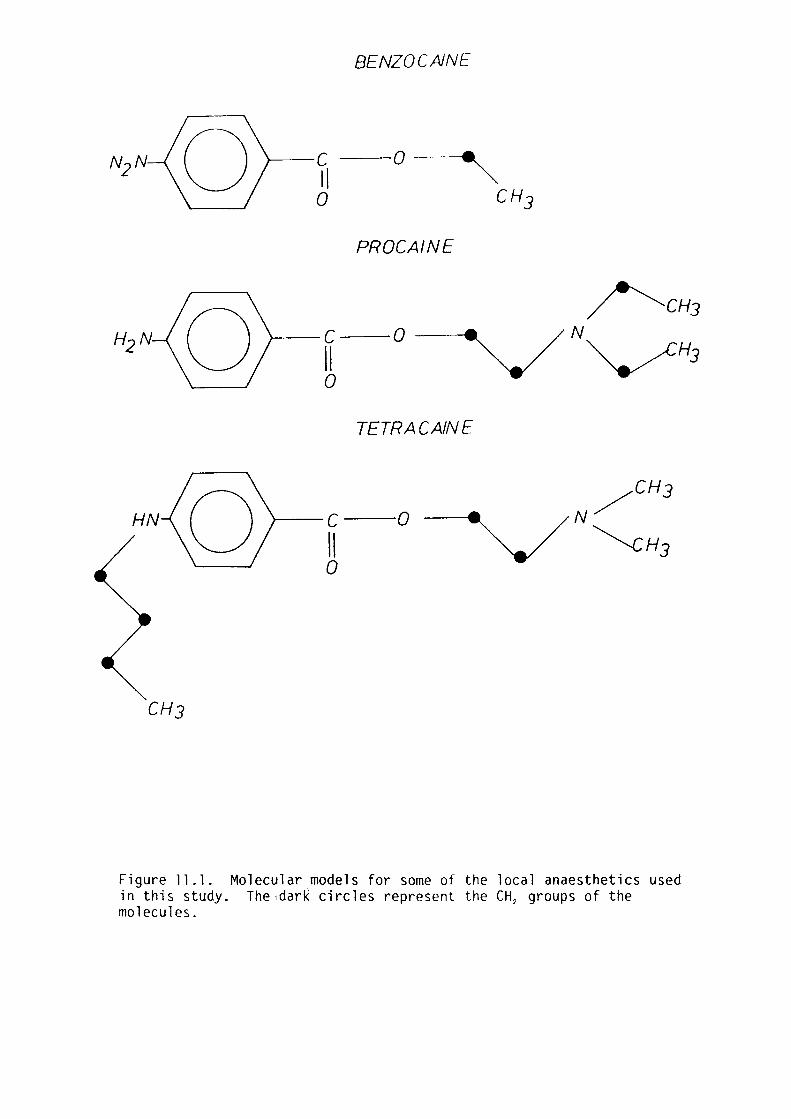
BENZOCAJNE
N2 N C 0~ II 0 CH3
PROCAINE
~CH3
H2 N C 0 N
II ~H3 0
TETRA CAINE
HN --c---o II 0
CH3
Figure 11. l. Molecular models for some of the local anaesthetics used in this study. The1dark circles represent the CH 2 groups of the molecules.
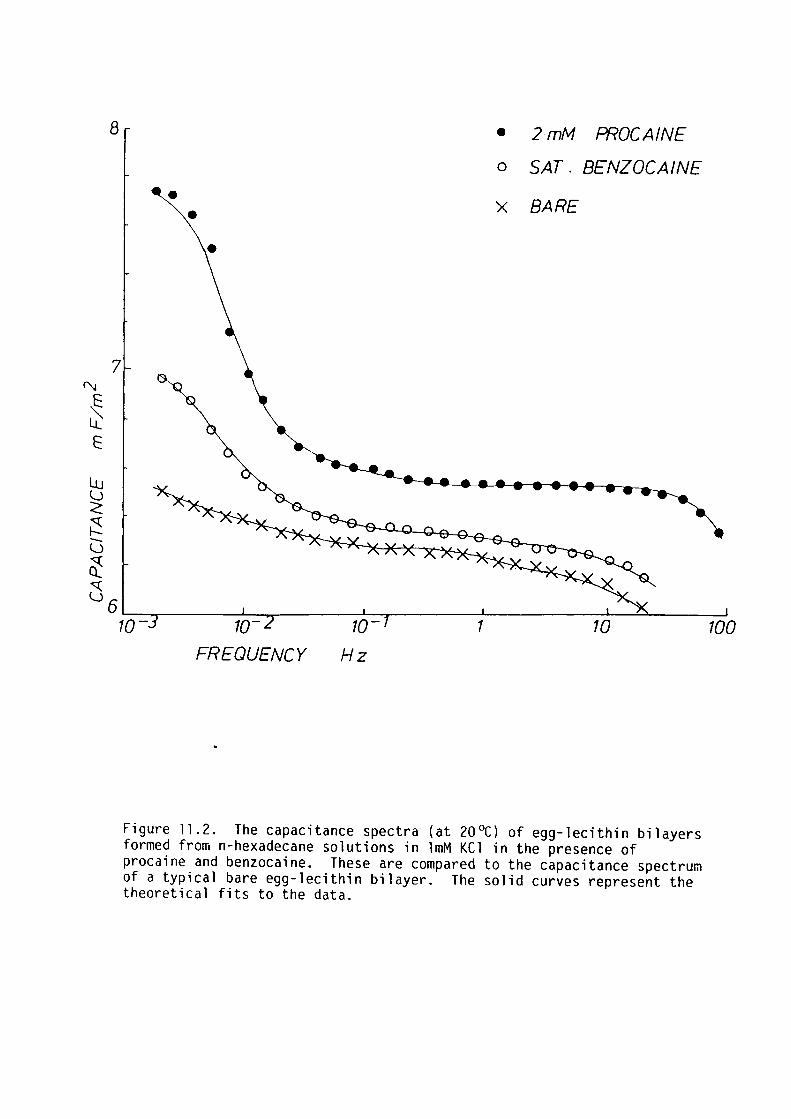
Lu l..)
~
~ G rf_ <::(
8
7
• 2 mM PROCAINE
o SAT. BENZOCAINE
• • X BARE
•
l..)6L_ ______ 1-_____ .J._ ______ _J_ ____ :-=-~.i_--~ 10- 70- 10- 1 10 100
FREQUENCY Hz
Figure 11.2. The capacitance spectra (at 20°C) of egg-lecithin bilayers formed from n-hexadecane solutions in lmM KCl in the presence of procaine and benzocaine. These are compared to the capacitance spectrum of a typical bare egg-lecithin bilayer. The solid curves represent the theoretical fits to the data.
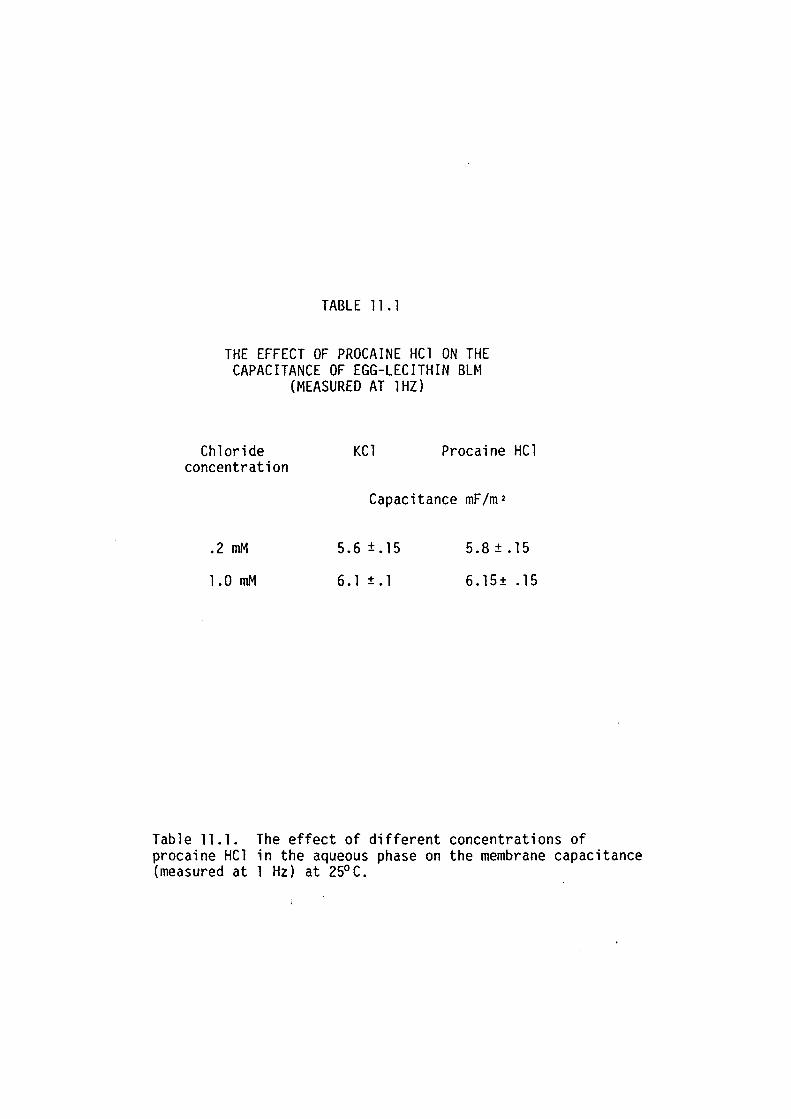
TABLE 11. l
THE EFFECT OF PROCAINE HCl ON THE CAPACITANCE OF EGG-LECITHIN BLM
(MEASURED AT lHZ)
Chloride concentration
.2 mM
1.0 mM
KCl Procaine HCl
Capacitance mF/m 2
5.6 ±.15
6.1 ±.1
5.8±.15
6.15± .15
Table 11.1. The effect of different concentrations of procaine HCl in the aqueous phase on the membrane capacitance (measured at l Hz) at 25°C.
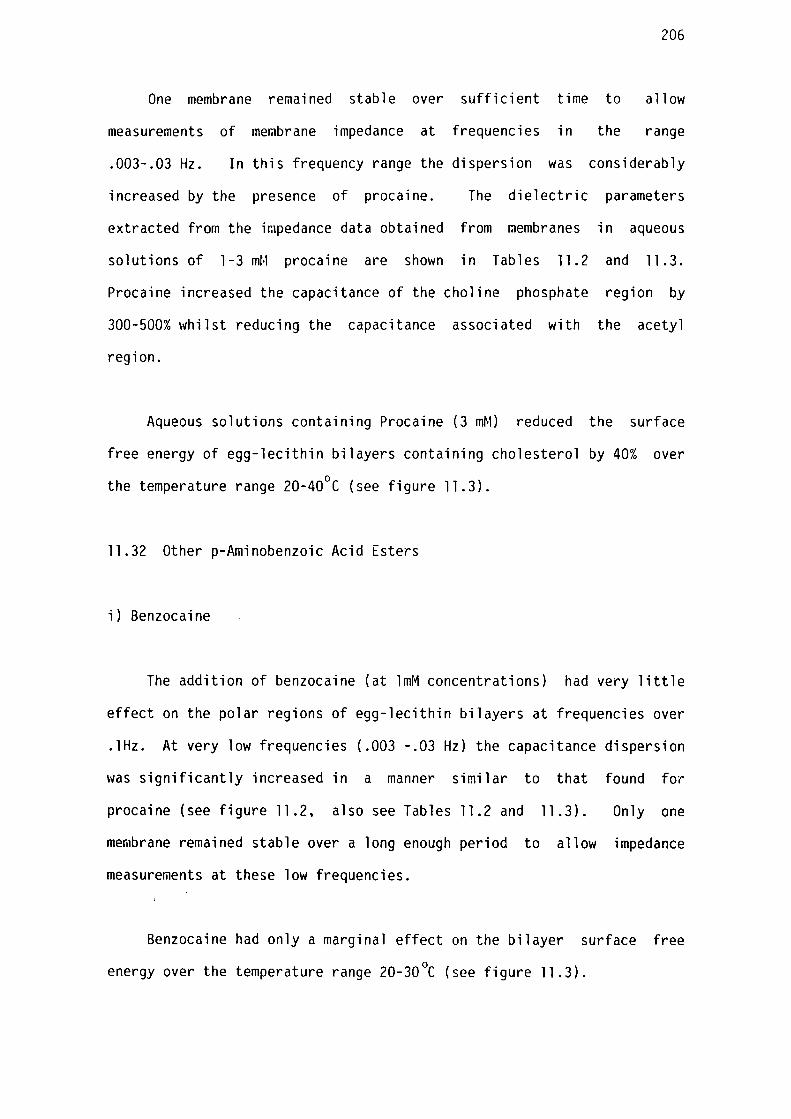
206
One membrane remained stable over sufficient time to allow
measurements of merabrane impedance at frequencies in the range
.003-.03 Hz. In this frequency range the dispersion was considerably
increased by the presence of procaine. The dielectric parameters
extracted from the impedance data obtained from raembranes in aqueous
solutions of 1-3 mM procaine are shown in Tables 11. 2 and 11. 3.
Procaine increased the capacitance of the choline phosphate region by
300-500% whilst reducing the capacitance associated with the acetyl
region.
Aqueous solutions containing Procaine (3 mM) reduced the surface
free energy of egg-lecithin bilayers containing cholesterol by 40% over
the temperature range 20-40°C (see figure 11.3).
11.32 Other p-Aminobenzoic Acid Esters
i) Benzocaine
The addition of benzocaine (at lmM concentrations) had very little
effect on the polar regions of egg-lecithin bilayers at frequencies over
.lHz. At very low frequencies (.003 -.03 Hz) the capacitance dispersion
was significantly increased in a manner similar to that found for
procaine (see figure 11.2, also see Tables 11.2 and 11.3). Only one
membrane remained stable over a long enough period to allow impedance
measurements at these low frequencies.
Benzocaine had only a marginal effect on the bilayer surface free
energy over the temperature range 20-30°C (see figure 11.3).
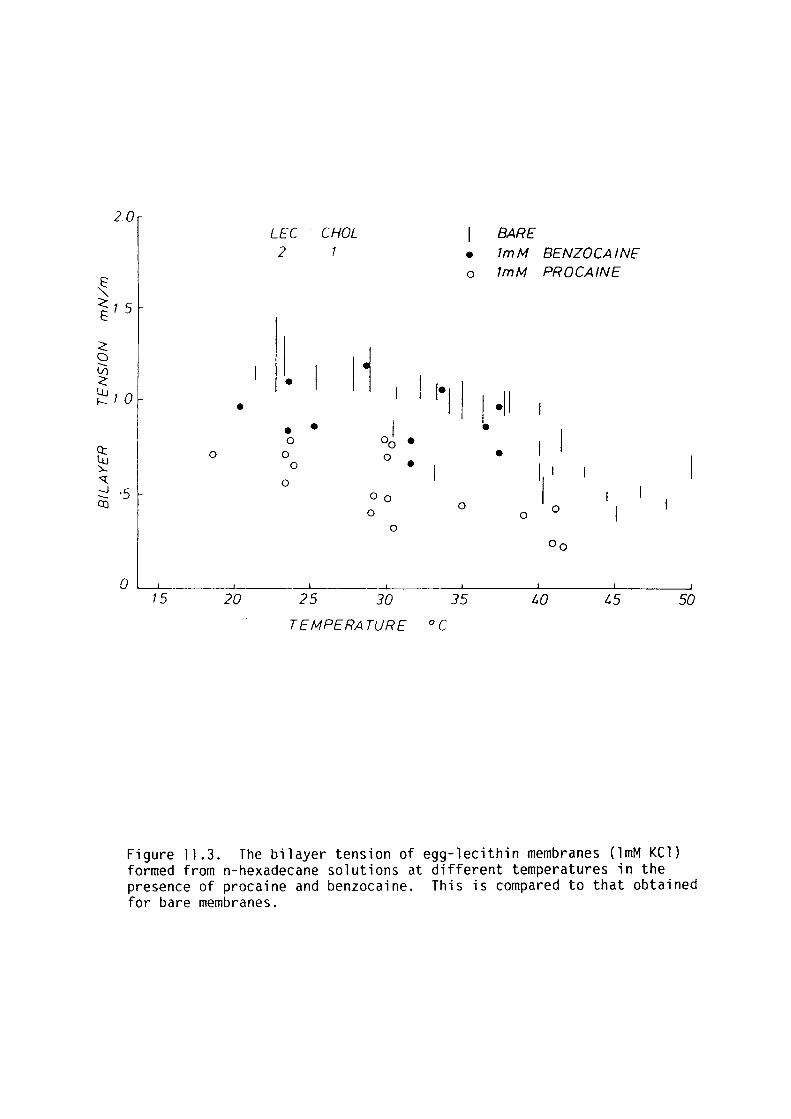
2.0 LEC CHOL BARE 2 7 • 1mM BENZOCAINE
~ 0 1mM PROCAINE
~,5 E
~ a --V) ~ • 11 I 1·11 ~10
1 .11 •
ct Lu )...
~ -J
---Q)
• • 01 • 0 • I I 0
0 0 0 • 0 • I I
0 I ·5 Oo I 0 0 I 0 0
0
Oo
0 15 20 25 30 35 l0 l5 50
TEMPERATURE oc
Figure ll .3. The bilayer tension of egg-lecithin membranes (lmM KCl) formed from n-hexadecane solutions at different temperatures in the presence of procaine and benzocaine. This is compared to that obtained for bare membranes.
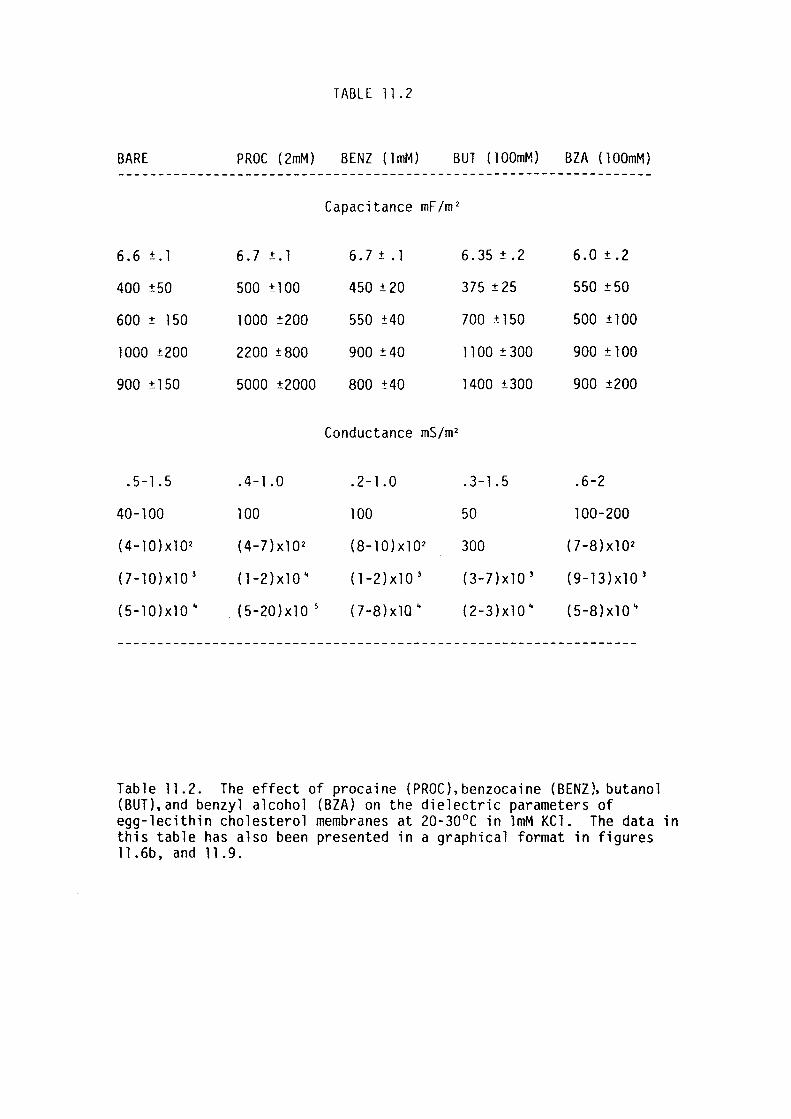
TABLE 11 . 2
BARE PR0C (2mM) BENZ ( lmM) BUT ( l 00mM) BZA ( l 00mM) -------------------------------------------------------------------
Capacitance mF/m 2
6.6 ±.l 6.7 ±. l 6.7±.l 6. 35 ±. 2 6.0 ± .2
400 ±50 500 ±100 450 ± 20 375 ± 25 550 ± 50
600 ± 150 1000 ±200 550 ±40 700 ±150 500 ±100
1000 ±200 2200 ± 800 900 ± 40 l l 00 ± 300 900 ± 100
900 ±150 5000 ±2000 800 ±40 1400 ±300 900 ±200
Conductance mS/m 2
. 5- l. 5 . 4- l .0 .2-l.0 . 3- l. 5 .6-2
40-100 100 100 50 100-200
( 4-10) xl 02 (4-7)x10 2 (8-lO)xl0 2 300 (7-8)x10 2
(7-10)xl0 3 (1-2)x10" (1-2)xl0 3 (3-7lx10 3 (9-13)xl0 3
(5-lO)xlO" (5-20)x10 5 (7-8)x10" (2-3)x10" (5-8)x10"
Table 11.2. The effect of procaine (PR0C),benzocaine (BENZ~ butanol (BUT),and benzyl alcohol (BZA} on the dielectric parameters of egg-lecithin cholesterol membranes at 20-30°C in lmM KCl. The data in this table has also been presented in a graphical format in figures l l . 6b, and 11 . 9.
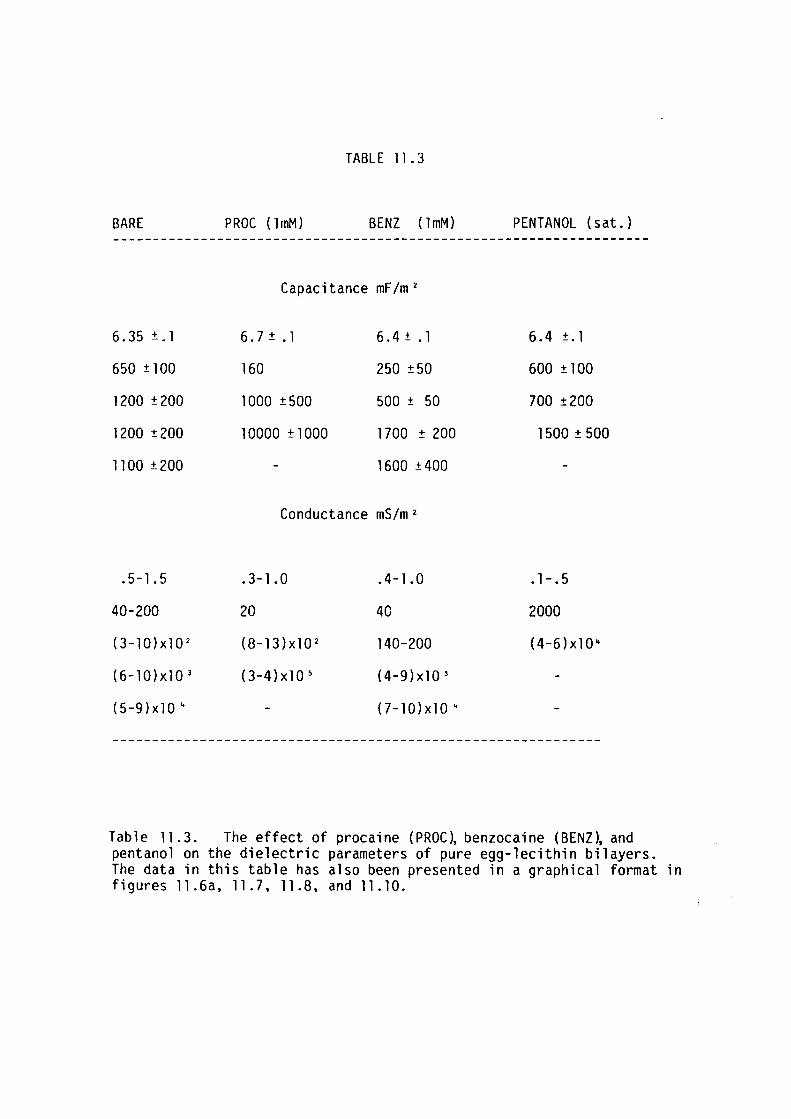
BARE
6.35 ±.1
650 ± 100
1200 ± 200
1200 ±200
1100 ±200
. 5-1. 5
40-200
(3-lO)xl0 2
(6-10)xl0 3
(5-9)xl0"
TABLE 11. 3
PR0C (lmM) BENZ (lmM)
Capacitance mF /m 2
6.7±.l 6.4±.l
160 250 ±50
1000 ±500 500 ± 50
10000 ± l 000 1700 ± 200
1600 ± 400
Conductance mS/m 2
. 3-1 . 0
20
(8-l3)xl0 2
(3-4)xl0 5
. 4-1.0
40
140-200
(4-9)xl0'
(7-lO)xlO"
PENTAN0L (sat.)
6.4 ±. l
600 ± 100
700 ±200
1500 ± 500
.l-.5
2000
(4-6)xl0"
Table 11.3. The effect of procaine (PR0C~ benzocaine (BENZ~ and pentanol on the dielectric parameters of pure egg-lecithin bilayers. The data in this table has also been presented in a graphical format in figures 11.6a, 11. 7, 11.8, and 11.10.
207
ii) Tetracaine
Attempts to measure the frequency dispersion in membrane
capacitance in the presence of tetracaine were frustrated by the
presence of large membrane conductances which increased rapidly as the
bilayer aged. With lmM tetracaine and lr.iM KCl in the aqueous phase the
r.iembrane conductance increased from l0mS/m 2 immediately after formation
of the bilayer to 200 mS/m 2 within 15 minutes of formation. This effect
was also present at r.iuch lower concentrations of the anaesthetic. When
the concentration of tetracaine in the aqueous phase was less than
.01 mM the conductance was stable enough to allow impedance measurements
at frequencies as low as .1 Hz. However, even at these low tetracaine
concentrations the bilayer conductance still increased by 5 mS/m 2 over
the course of an experimental run (approximately 20 minutes).
At .01 mM tetracaine in the aqueous phase there was no
change observed in the dielectric structure parameters
hydrophobic - hydrophilic interface of lipid bilayers.
11 . 33 Alcohols
i) n-Alkanols
detectable
of the
Ethanol at concentrations up to 100 mM in the aqueous phase and
150 mM in the r.ier.ibrane forming solution had no detectable effect on
either the ir.ipedance dispersion, the capacitance measured at lHz or the
surface free energy of egg-lecithin bilayers (see figure 11.4).
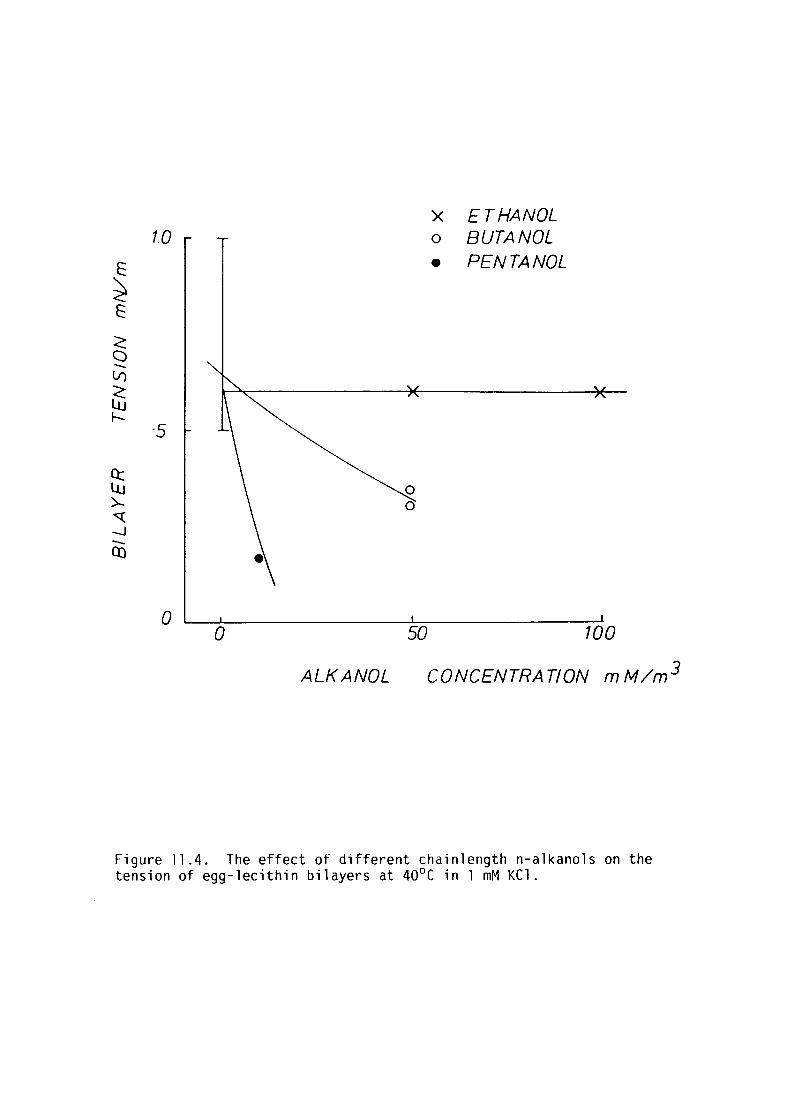
X ETHANOL 1.0 0 BUTANOL
t: • PENTANOL
~ t: ~ C) -l/)
~ Lu f--
·S
Q:: Lu 0 >- 0 "'{ -J -(l)
0 0 so 100
ALK ANOL CONCENTRATION mM/m 3
Figure 11 .4. The effect of different chainlength n-alkanols on the tension of egg-lecithin bilayers at 40°C in l mM KCl.
208
Longer chainlength alkanols such as butanol and pentanol at
concentrations in the range 10-50 mM in the aqueous phase significantly
reduced the surface free energy of egg-lecithin bilayers (see
figure 11.5).
The effect of these alkanols on the dielectric structure of the
bilayers was not detectable from these measurements (see Tables 11.2 and
11.3).
ii) Benzyl Alcohol
The effect of benzyl alcohol on the impedance dispersion of
egg-lecithin and egg-lecithin - cholesterol bilayers at frequencies over
.1 Hz was undetectable at BZA concentrations up to l00mM.
However the effect on the alkane absorption of lipid bilayers was
quite profound (see figures 5.4a and 5.4b).
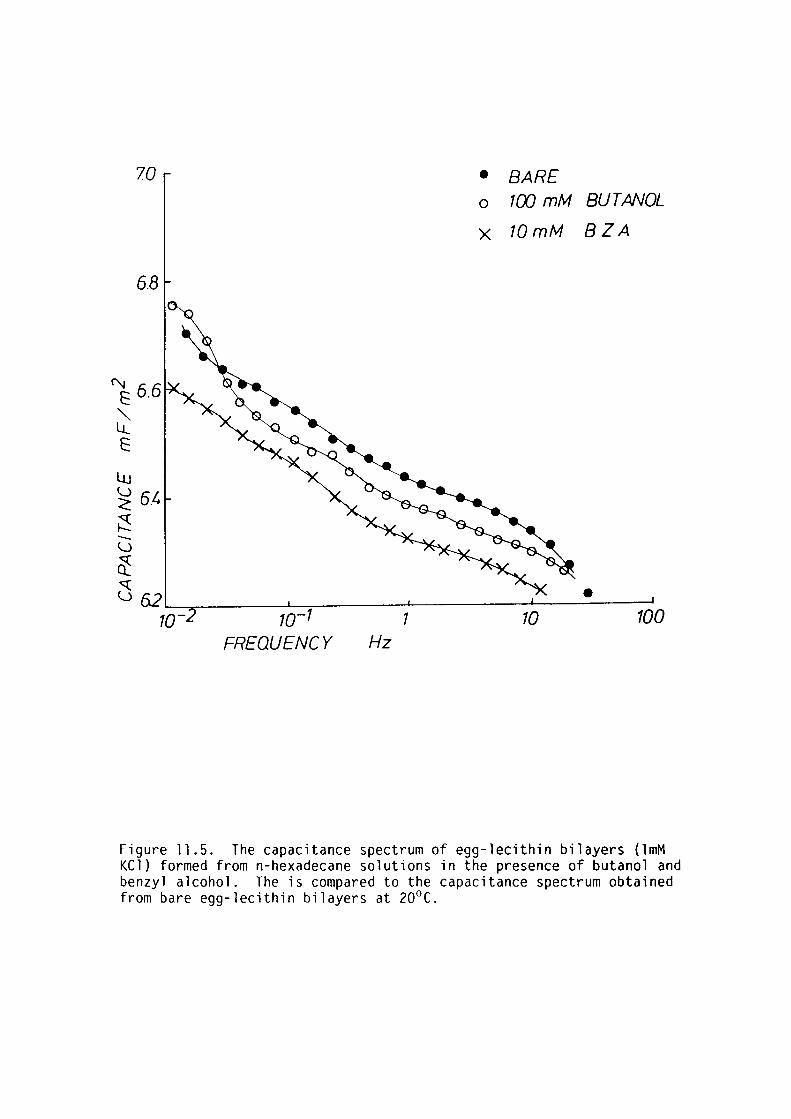
70
6.8
16.6 ~ Lt. t:
UJ ~ 6.4 ~ -<..J rf_
• BARE o 100 mM BUTAN0L
X 10mM B Z A
~ . <..J 62L_.,.---___ _,1__~ ___ _.J_ ____ ---Jl---------:-10- 10-1 1 10 100
FREQUENCY Hz
Figure 11.5. The capacitance spectrum of egg-lecithin bilayers (lmM KCl) formed from n-hexadecane solutions in the presence of butanol and benzyl alcohol. The is compared to the capacitance spectrum obtained from bare egg-lecithin bilayers at 20°C.
209
ll.4 DISCUSSION
11.41 p-Aminobenzoic Acid Esters
11.411 Surface Charge
Procaine can exist in either a charged or an uncharged form
depending on the pH of the aqueous phase. The pKa of the amino group of
procaine is 9.0. Therefore in these experiments, where the pH of the
aqueous phase was approximately 6,
charged form.
procaine existed mainly in its
A study of the binding of charged drugs to lipid bilayers by
Lee, (1978) showed that the apparent pKa of charged diethylammonium
moieties of bound procaine is shifted from 9.0 in the aqueous phase to
8.0 at the membrane surface. This is a result of the fact that
additional work is needed to bring the charged form of procaine near to
the bilayer against the Born repulsive forces near the hydrophobic
region of the bilayer.
In Chapter 6 it was shown that at low external ion concentrations
the membrane capacitance was sensitive to changes in the ionic double
layer capacitance, which was in turn dependent on the bilayer bound
surface charge and electrolyte concentration. Therefore if the charged
form of procaine binds significantly ~o egg-lecithin bilayers one ~ould
expect to measure an increase in the total membrane capacitance. The
results presented here show that the addition of procaine to aqueous
solutions containing .l and l mM KCl had a negligible effect on the
total membrane capacitance. Thus it appears that the membrane surface
210
charge was unaffected by the absorption of procaine, and that the
charged form of procaine did not bind to egg-lecithin bilayers at a
pH of 6 in the aqueous phase. This indicates that the effects procaine
had on the properties of lipid bilayers in this study were probably due
to the presence of the neutral form of the anaesthetic.
11.412 Dielectric Structure
The addition of procaine {at l mM concentrations in the aqueous
phase) had a profound effect on the bilayer impedance dispersion of
egg-lecithin and egg-lecithin cholesterol bilayers. The dispersion in
bilayer capacitance over the frequency range l to 100 Hz almost vanished
and the low frequency dispersion was significantly increased. The
dielectric time constant diagrams, showing the effects of procaine and
benzocaine on the spatial variation of time-constant within egg-lecithin
and egg-lecithin cholesterol bilayers, are shown in figures
11 . 6a, 11 . 6b and 11 . 7
There are a number of different interpretations as to how the
dielectric structure of the hydrophobic-hydrophilic interface of
egg-lecithin bilayers is altered by the absorption of neutral procaine
molecules. These are set out below:
l) Procaine may significantly increase the dielectric capacitance of
the choline phosphate region. This can be discounted however, as the
thickness of the choline phosphate region would need to be less than
.1 nm to account for the high capacitance values. The relatively high
dielectric constant of the polar regions {see Chapter 7) suggests that
the possibility of an additional increase in the dielectric constant
upon the inclusion of procaine is unlikely.
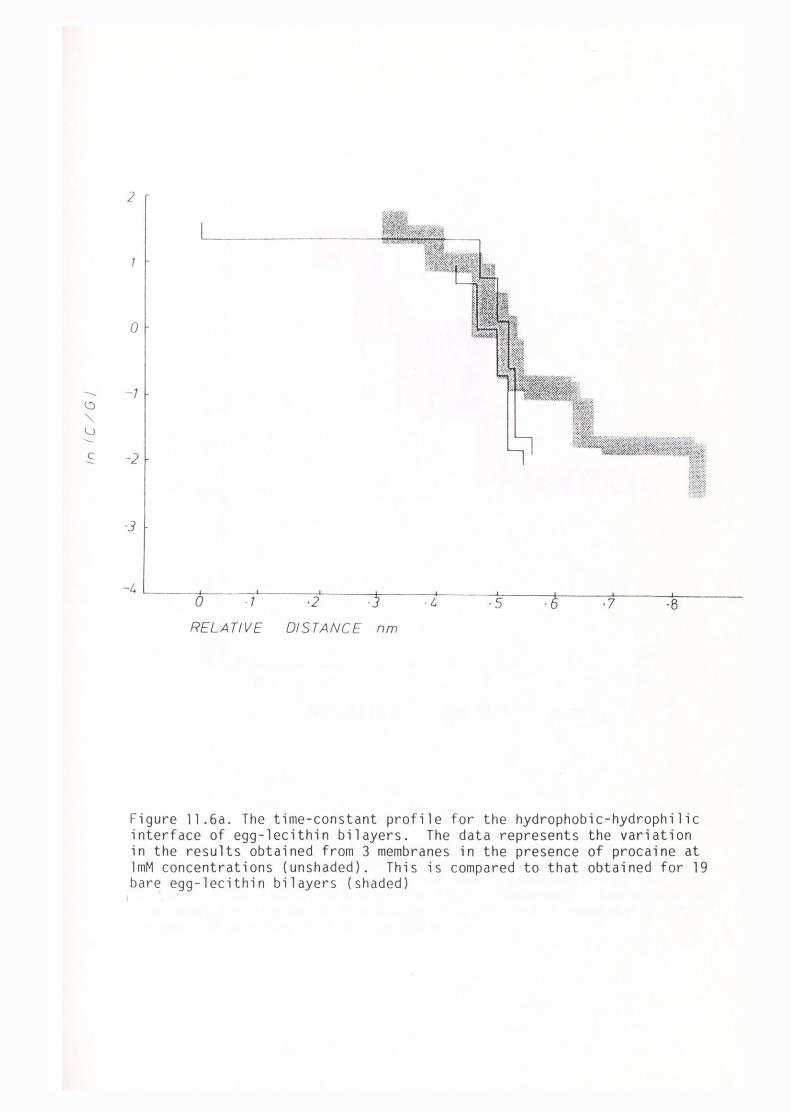
2
0
- 7
-2
-J
-~!~~~it
~tlll '.Jj~;kiYit?J.W\~~cw+~~!~~;
i:;;M:
-l ~ ---0;1;--' ---~, ----;.2-:;----_-!:3----;_l~1 ------!:_s=-----.s!c---.-='-f---J.s'----RELATIVE DISTANCE nm
Figure 11 .6a. The time-constant profile for the hydrophobic-hydrophilic interface of egg-lecithin bilayers. The data represents the variation in the results obtained from 3 membranes in the presence of procaine at lmM concentrations (unshaded). This is compared to that obtained for 19 bare egg - lecithin bilayers (shaded)
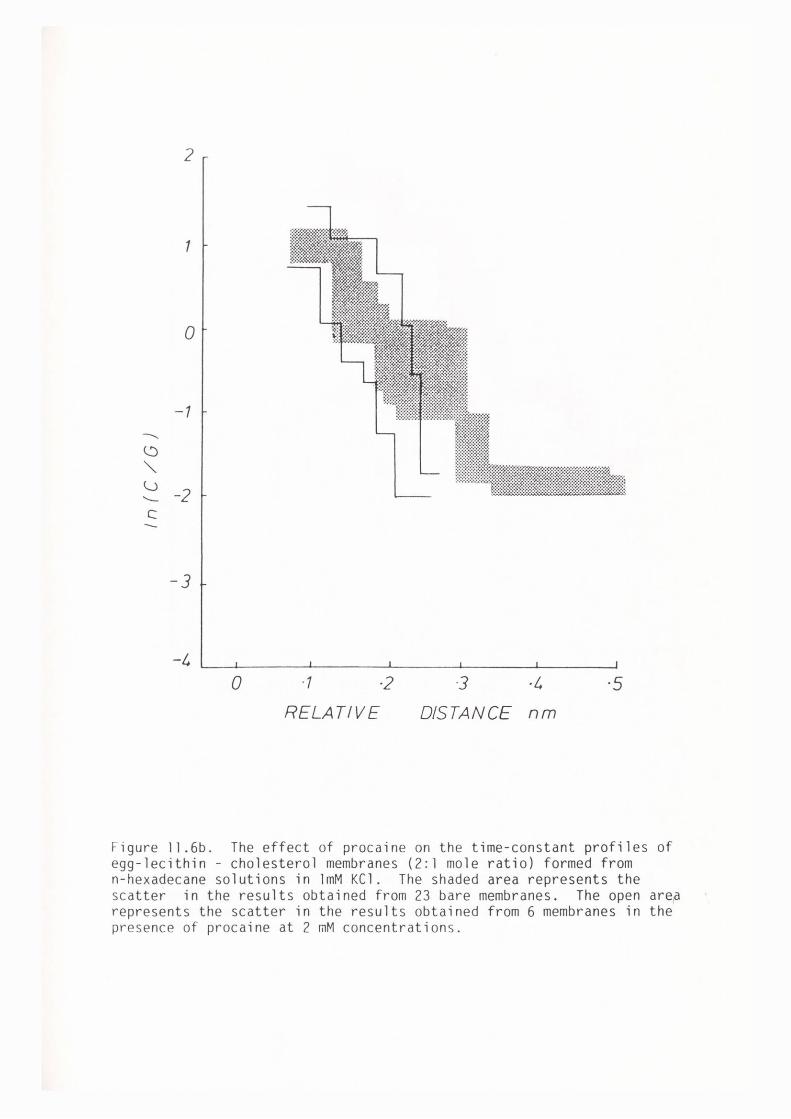
2
1
0
-1
-2 C: --
-3
0 ·1 -2
RELATIVE
3 ·l ·5
DISTANCE nm
Figure 11 .6b. The effect of procaine on the time-constant profiles of egg-lecithin - cholesterol membranes (2:l mole ratio) formed from n-hexadecane solutions in lmM KCl. The shaded area represents the scatter in the results obtained from 23 bare membranes. The open are~ represents the scatter in the results obtained from 6 membranes in the presence of procaine at 2 mM concentrations.
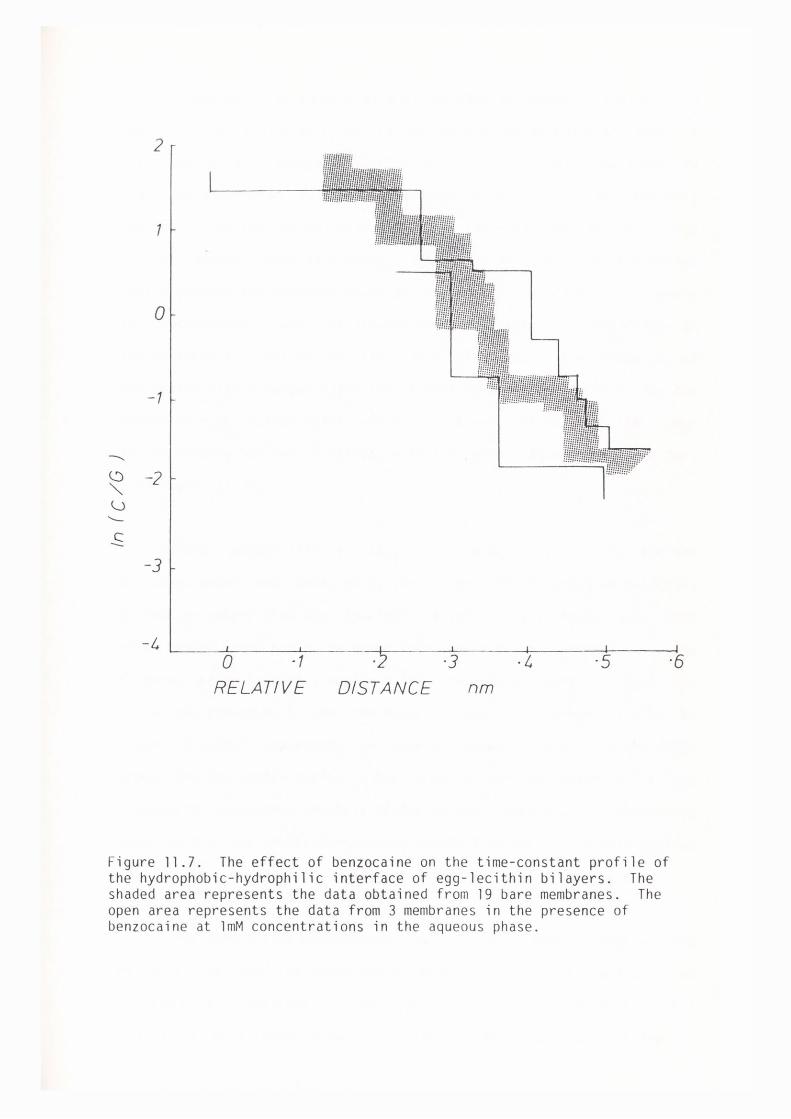
2
1
0
-1
-c:: -
-]
-l 0 ·1 ·2 ·] ·l ·5
RELATIVE DISTANCE nm
Figure ll .7. The effect of benzocaine on the time-constant profile of the hydrophobic-hydrophilic interface of egg-lecithin bilayers. The shaded area represents the data obtained from 19 bare membranes. The open area represents the data from 3 membranes in the presence of benzocaine at lmM concentrations in the aqueous phase.
·6
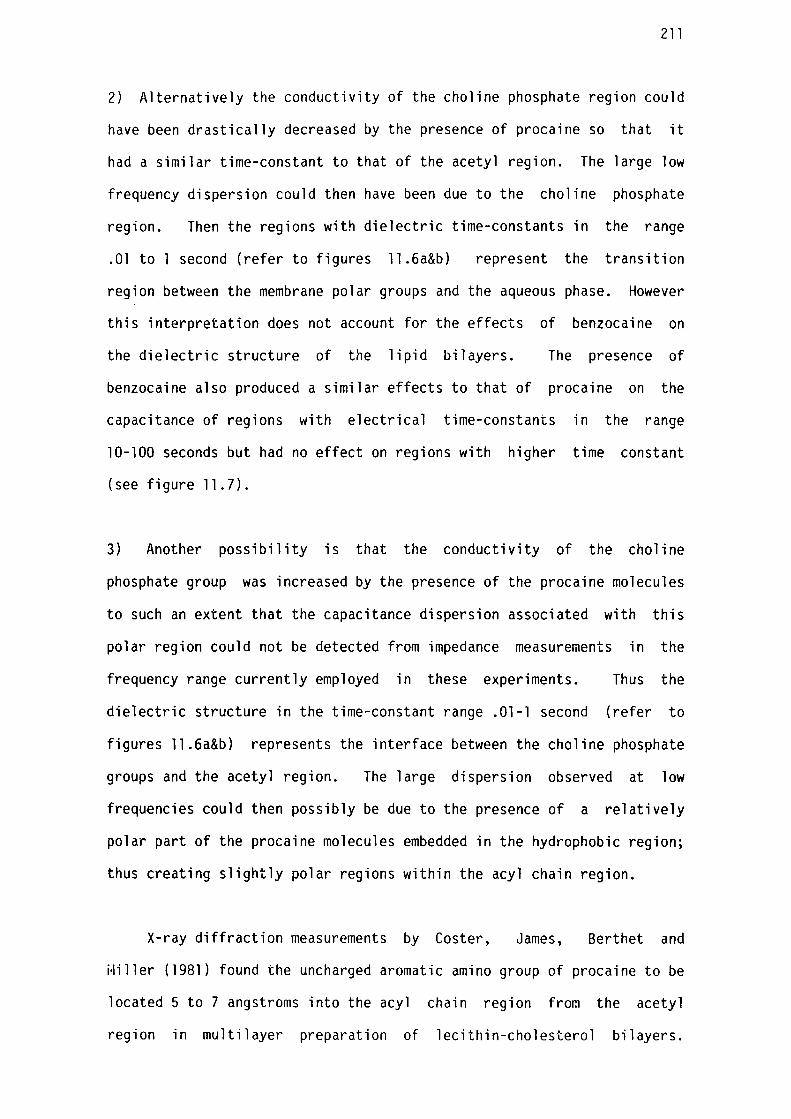
211
2) Alternatively the conductivity of the choline phosphate region could
have been drastically decreased by the presence of procaine so that it
had a similar time-constant to that of the acetyl region. The large low
frequency dispersion could then have been due to the choline phosphate
region. Then the regions with dielectric time-constants in the range
.01 to 1 second (refer to figures 11.6a&b) represent the transition
region between the membrane polar groups and the aqueous phase. However
this interpretation does not account for the effects of benzocaine on
the dielectric structure of the lipid bilayers. The presence of
benzocaine also produced a similar effects to that of procaine on the
capacitance of regions with electrical time-constants in the range
10-100 seconds but had no effect on regions with higher time constant
(see figure 11.7).
3) Another possibility is that the conductivity of the choline
phosphate group was increased by the presence of the procaine molecules
to such an extent that the capacitance dispersion associated with this
polar region could not be detected from impedance measurements in the
frequency range currently employed in these experiments. Thus the
dielectric structure in the time-constant range .01-1 second (refer to
figures 11.6a&b) represents the interface between the choline phosphate
groups and the acetyl region. The large dispersion observed at low
frequencies could then possibly be due to the presence of a relatively
polar part of the procaine molecules embedded in the hydrophobic region;
thus creating slightly polar regions within the acyl chain region.
X-ray diffraction measurements by Coster, James, Berthet and
Hiller (1981) found the uncharged aromatic amino group of procaine to be
located 5 to 7 angstroms into the acyl chain region fro~ the acetyl
region in multilayer preparation of lecithin-cholesterol bilayers.
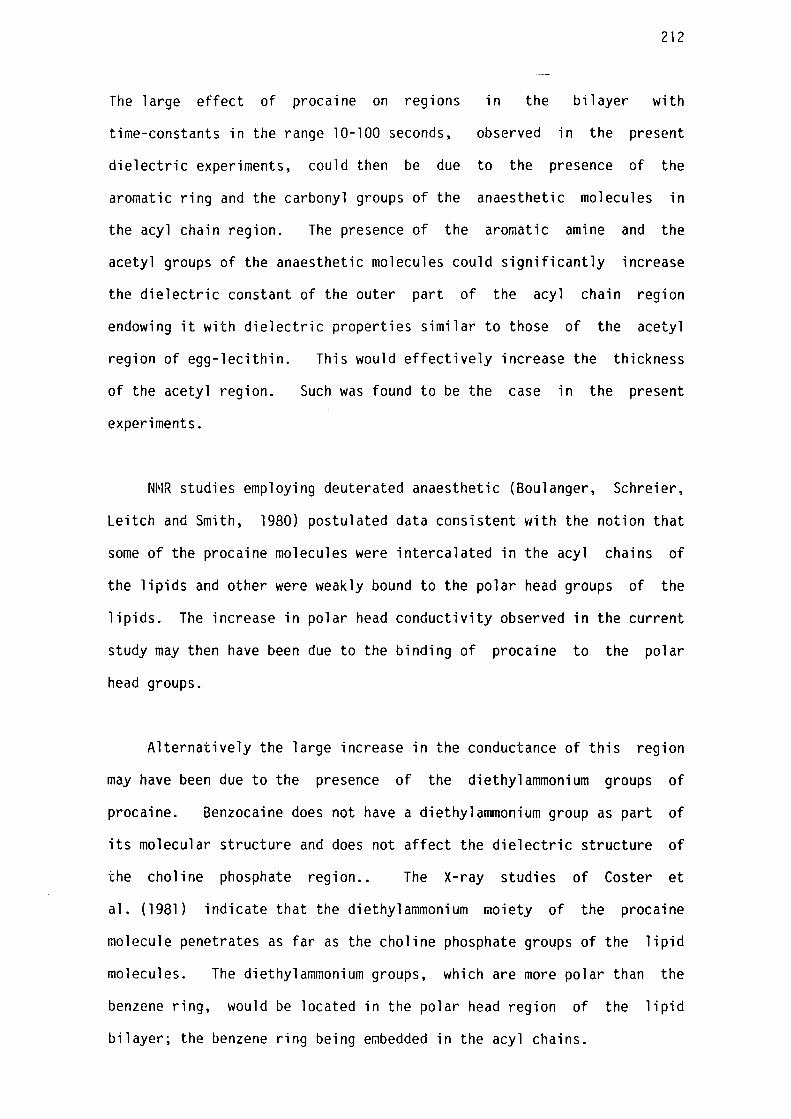
212
The large effect of procaine on regions in the bilayer with
time-constants in the range 10-100 seconds, observed in the present
dielectric experiments, could then be due to the presence of the
aromatic ring and the carbonyl groups of the anaesthetic molecules in
the acyl chain region. The presence of the aromatic amine and the
acetyl groups of the anaesthetic molecules could significantly increase
the dielectric constant of the outer part of the acyl chain region
endowing it with dielectric properties similar to those of the acetyl
region of egg-lecithin. This would effectively increase the thickness
of the acetyl region.
experiments.
Such was found to be the case in the present
NNR studies employing deuterated anaesthetic (Boulanger, Schreier,
Leitch and Smith, 1980) postulated data consistent with the notion that
some of the procaine molecules were intercalated in the acyl chains of
the lipids and other were weakly bound to the polar head groups of the
lipids. The increase in polar head conductivity observed in the current
study may then have been due to the binding of procaine to the polar
head groups.
Alternatively the large increase in the conductance of this region
may have been due to the presence of the diethylammonium groups of
procaine. Benzocaine does not have a diethylammonium group as part of
its molecular structure and does not affect the dielectric structure of
the choline phosphate region.. The X-ray studies of Coster et
al. (1981) indicate that the diethylammonium moiety of the procaine
molecule penetrates as far as the choline phosphate groups of the lipid
molecules. The diethylammonium groups, which are more polar than the
benzene ring, would be located in the polar head region of the lipid
bilayer; the benzene ring being e~bedded in the acyl chains.
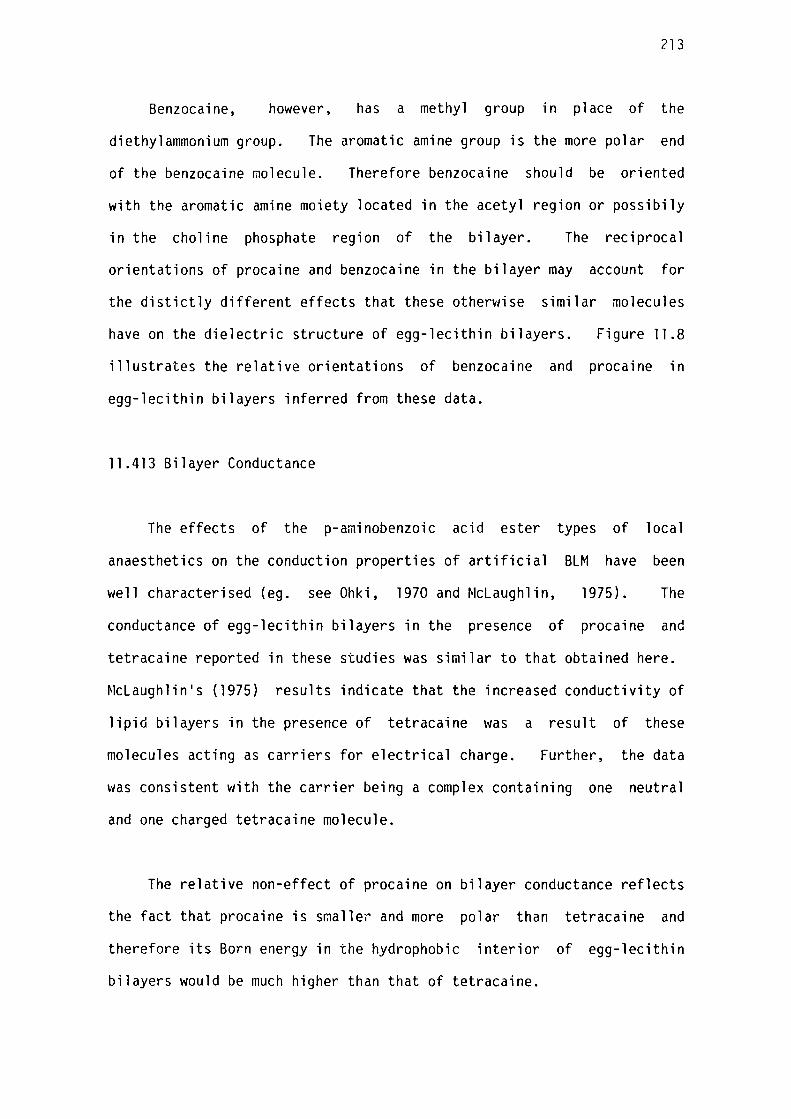
213
Benzocaine, however, has a methyl group in place of the
diethylammonium group. The aromatic amine group is the more polar end
of the benzocaine molecule. Therefore benzocaine should be oriented
with the aromatic amine moiety located in the acetyl region or possibily
in the choline phosphate region of the bilayer. The reciprocal
orientations of procaine and benzocaine in the bilayer may account for
the distictly different effects that these otherwise similar molecules
have on the dielectric structure of egg-lecithin bilayers. Figure 11 .8
illustrates the relative orientations of benzocaine and procaine in
egg-lecithin bilayers inferred from these data.
11.413 Bilayer Conductance
The effects of the p-aminobenzoic acid ester types of local
anaesthetics on the conduction properties of artificial BLM have been
well characterised (eg. see Ohki, 1970 and McLaughlin, 1975). The
conductance of egg-lecithin bilayers in the presence of procaine and
tetracaine reported in these studies was similar to that obtained here.
McLaughlin's (1975) results indicate that the increased conductivity of
lipid bilayers in the presence of tetracaine was a result of these
molecules acting as carriers for electrical charge. Further, the data
was consistent with the carrier being a complex containing one neutral
and one charged tetracaine molecule.
The relative non-effect of procaine on bilayer conductance reflects
the fact that procaine is smalle, and more polar than tetracaine and
therefore its Born energy in the hydrophobic interior of egg-lecithin
bilayers would be much higher than that of tetracaine.
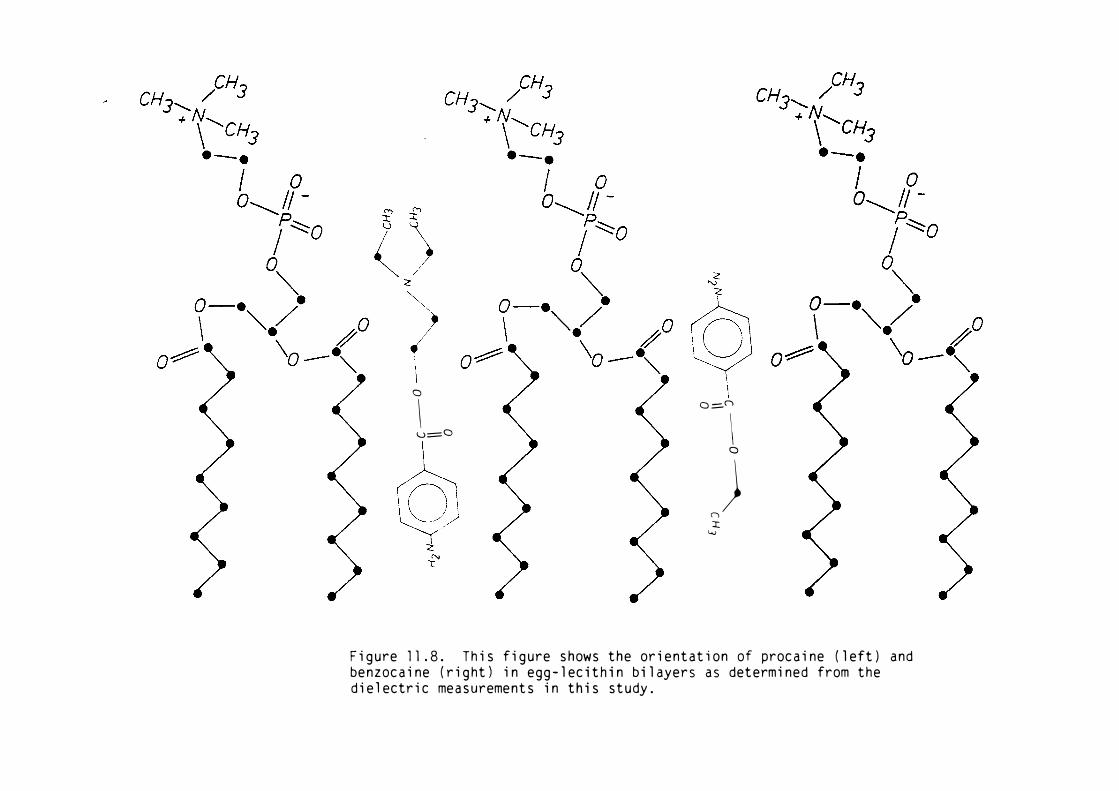
a
\ u=a
a="
\ 0
�) :i::
c...,
Figure 11 .8. This figure shows the orientation of procaine (left) and benzocaine (right) in egg-lecithin bilayers as determined from the dielectric measurements in this study.
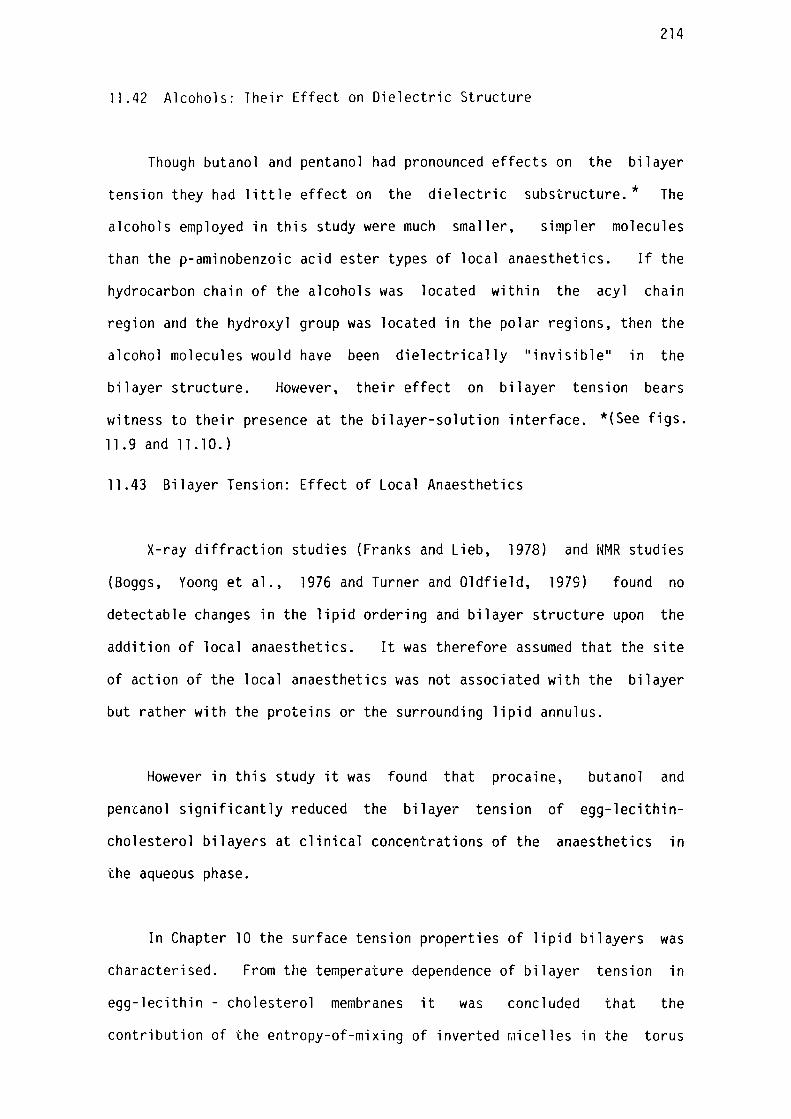
214
11.42 Alcohols: Their Effect on Dielectric Structure
Though butanol and pentanol had pronounced effects on the bilayer
tension they had little effect on the dielectric substructure.* The
alcohols employed in this study were much smaller, simpler molecules
than the p-aminobenzoic acid ester types of local anaesthetics. If the
hydrocarbon chain of the alcohols was located within the acyl chain
region and the hydroxyl group was located in the polar regions, then the
alcohol molecules would have been dielectrically "invisible" in the
bilayer structure. However, their effect on bilayer tension bears
witness to their presence at the bilayer-solution interface. *(See figs.
11 . 9 and 11 . 10. )
11.43 Bilayer Tension: Effect of Local Anaesthetics
X-ray diffraction studies (Franks and Lieb, 1978) and NMR studies
(Boggs, Yoong et al., 1976 and Turner and Oldfield, 1979) found no
detectable changes in the lipid ordering and bilayer structure upon the
addition of local anaesthetics. It was therefore assumed that the site
of action of the local anaesthetics was not associated with the bilayer
but rather with the proteins or the surrounding lipid annulus.
However in this study it was found that procaine, butanol and
pentanol significantly reduced the bilayer tension of egg-lecithin
cholesterol bilayers at clinical concentrations of the anaesthetics in
the aqueous phase.
In Chapter 10 the surface tension properties of lipid bilayers was
characterised. From the temperature dependence of bilayer tension in
egg-lecithin - cholesterol membranes it was concluded that the
contribution of the entropy-of-mixing of inverted raicelles in the torus
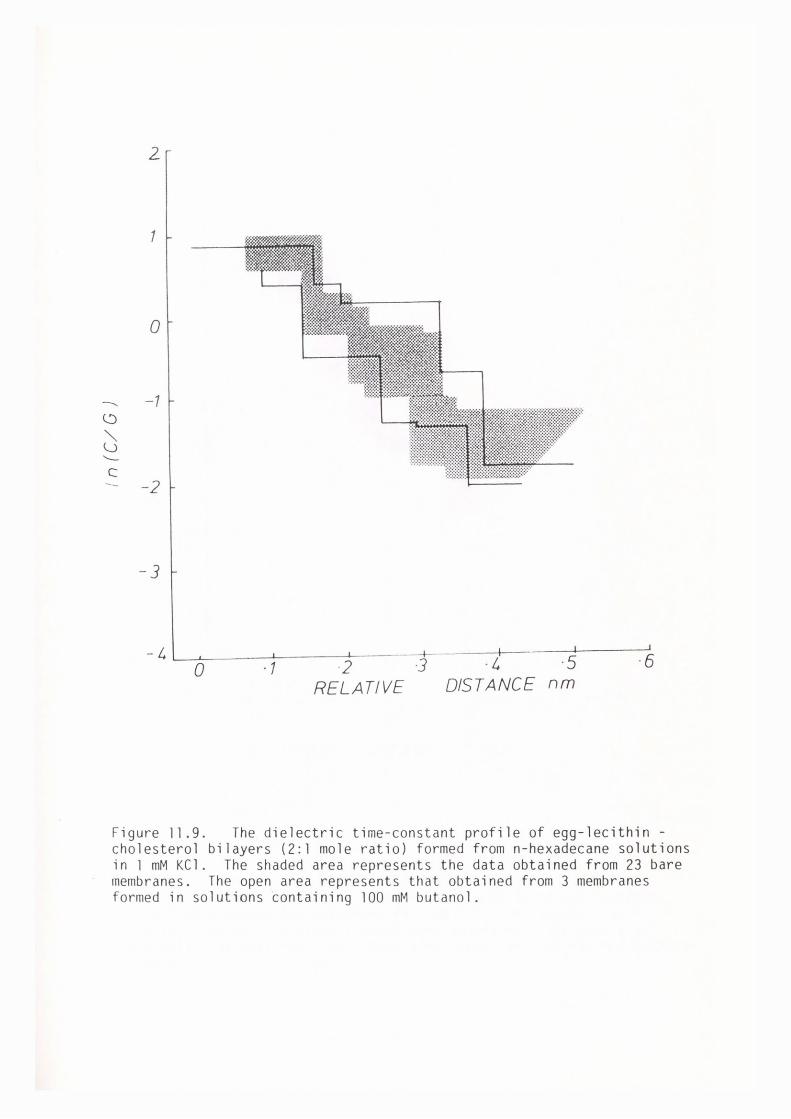
2
1
0
- 1
C -2
- 3
- lLL----L----+----:!;---_74r---~-St-------;:__6 0 ·1 ·2 3
RELATIVE DISTANCE nm
Figure ll .9. The dielectric time-constant profile of egg-lecithin -cholesterol bilayers (2:l mole ratio) formed from n-hexadecane solutions in l mM KCl. The shaded area represents the data obtained from 23 bare membranes. The open area represents that obtained from 3 membranes formed in solutions tontaining 100 mM butanol.
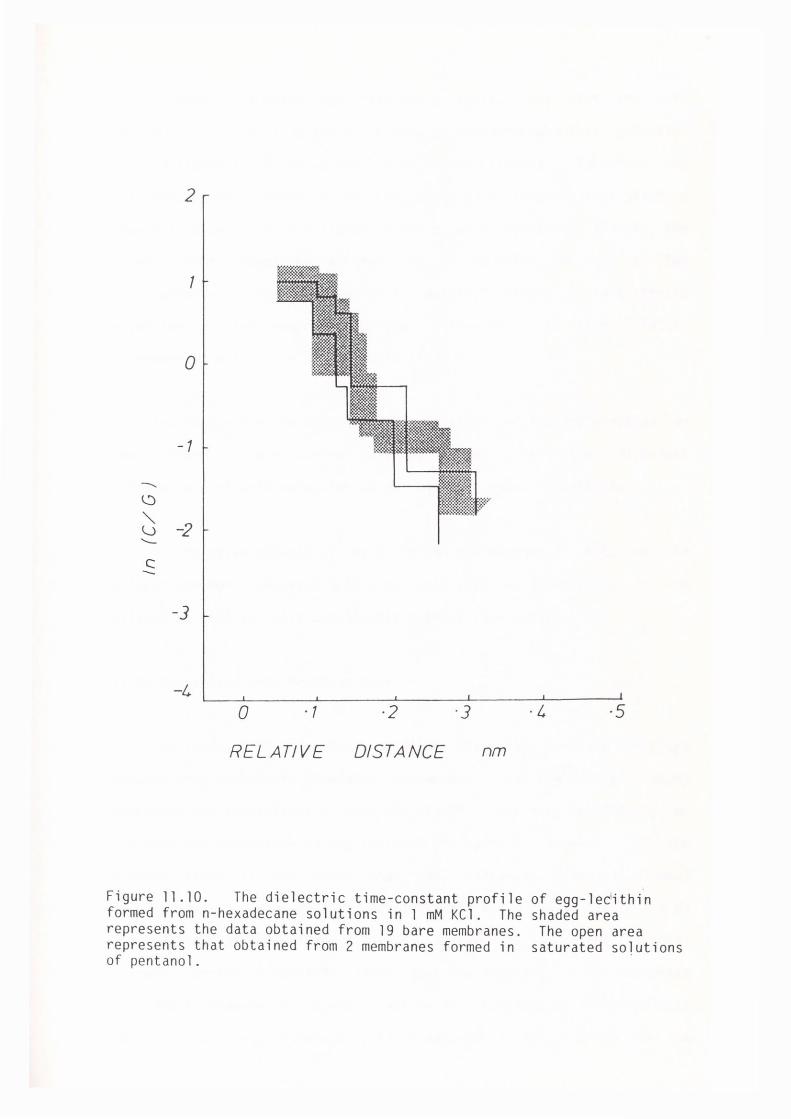
2
1
0
-1
-(.:) " -2 ~ '--
c:: --]
-l
0 . 1
RELATIVE
·2
DISTANCE
·]
nm
Figure 11. 10. The dielectric time-constant profile formed from n-hexadecane solutions in 1 mM KCl. The represents the data obtained from 19 bare membranes. represents that obtained from 2 membranes formed in of pentano 1.
·l ·5
of egg-lec'ithin shaded area The open area
saturated solutions
215
to the membrane tension was relatively small, and that the main
contribution arises from the difference in standard che~ical potential
between lipids in the torus and lipids in the bilayer. Therefore the
anaesthetics that reduce bilayer tension do so by reducing the standard
chemical potential of the lipids in the bilayer relative to that in the
torus. This might be achieved by a reduction in area of the
hydrocarbon - water interface due to 11 masking 11 effects of anaesthetic
molecules at the membrane surface. However, the interpretation
presented here is by no means conclusive.
The reason for the different effects of benzocaine and procaine on
the bilayer surface tension may be a result of the different
orientations of both molecules at the bilayer aqueous interface.
The relative effects of the different chainlength alcohols on the
bilayer tension correlated well with their relative solubilities in the
bilayer as well as their anaesthetic potency (see Table 11.4).
11.44 Comparison With Previous Work
The location of anaesthetic molecules within the membrane structure
deduced from dielectric impedance measurements in the present study
confirmed the conclusions of Ashcroft, (1979) concerning the location of
procaine and benzocaine in egg-lecithin bilayers. However, in the
present study it was found that the n-alkanols, benzyl alcohol
(see Chapter 5), procaine and benzocaine all had a negligible affect on
the thickness of solventless bilayers. It seems as though the thickness
changes reported by Ashcroft (1979) upon the addition of anaesthetics
were due to changes in the mole fraction of n-tetradecane in the bilayer
which were probably associated with an altered lipid ordering in the
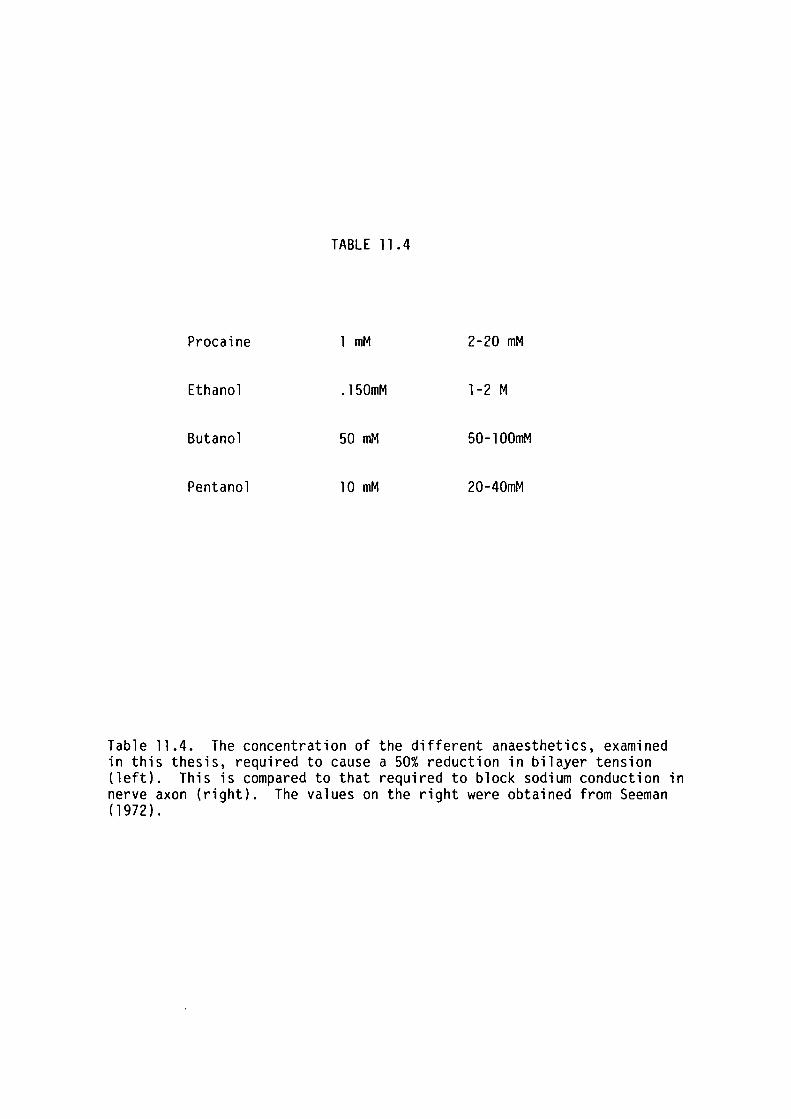
TABLE 11. 4
Procaine l mM 2-20 mM
Ethanol .l50mM 1-2 M
Butanol 50 mM 50-l00mM
Pentanol 10 mM 20-40mM
Table 11.4. The concentration of the different anaesthetics, examined in this thesis, required to cause a 50% reduction in bilayer tension (left). This is compared to that required to block sodium conduction in nerve axon (right). The values on the right were obtained from Seeman (1972).
216
bilayer. This has been conclusively demonstrated in Chapter 5 for the
case of benzyl alcohol. Changes in the acyl chain ordering in lipid
bilayers have been observed upon the addition of relatively high
concentrations of benzyl alcohol, procaine and tetracaine to vesicle
preparations, by the use of deuterated NMR techniques (Turner and
Oldfield, 1979, Boulanger et al., 1980 and Boulanger et al., 1981).
Much smaller changes in the acyl chain ordering at clinical anaesthetic
concentrations, too small to be resolved by NMR methods, might also be
responsible for the variations in the alkane solubility in egg-lecithin
bilayers (c.f. also Chapter 5).
11.45 Possible Mechanisms For Local Anaesthesia
It is believed that the excitation in nerve axon results from
protein pores spanning the membrane which contain some form of voltage
dependent ion gating mechanism (Ehrenstein, 1976, Lee, 1976 and
Ashcroft, Coster and Smith, 1977).
From thermodynamic considerations of the fluid mosaic model
and
of
discussed in Chapter l, the function of membrane
proteins should be very sensitive to the structure
their immediate lipid environment.
bound enzymes
and composition
Ashcroft, Coster and Smith (1977) and Haydon et al. (1977)
postulated that changes in the thickness of the bilayer component of
biological membranes by anaesthetic molecules (such as n-alkanes) were
consistant with their anaesthetic action.
It was then postulated that anaesthesia could be induced by a
relative change in the dimensions of the hydrophobic region of the lipid
217
bilayer with respect to the sodium channels. A mismatch between the
dimensions of the hydrophobic regions of the protein and lipid
components of the membrane could lead to a distortion in the boundary
lipid region of the protein (as seen in figure 11. 10). It was proposed
(see Ashcroft, Coster and Smith, 1977) that the strain in the sodium
channel produced as a result of this mismatch mediated blocking of the
sodium channel.
In this study there was no indication that anaesthetics would cause
a general increase in the thickness of the bilayer component of
biological membranes; unless, of course, they were in equilibrium with a
saturated solution of relatively small hydrophobic molecules.
However, the fact that some anaesthetics in the present study
significantly reduced bilayer tension raises an alternative possibility.
If the lipid bilayer is norr.,ally distorted ("cusped" or "dimpled"), in
the vicinity of the sodium channel, then a change in the surface tension
of the bilayer could significantly alter the stresses on the protein.
However, it should be noted that the mechanisms that give rise to the
resting tension i~ the axon plasma membrane are likely to be different
to those responsible for tension artificially produced in lipid bilayers
in this study. It is thus not yet ce1~tain whether local anaesthetics do
in fact alter the surface tension properties of the lipid bilayer
component of nerve axon plasma membranes.
At this point it should be mentioned that general structural
changes in the bilayer component of biological membranes need not be
responsible for blockage of the sodium channels in nerve axon. This has
already been pointed out by (Lee, 1976) and hinted at in the concluding
remarks of Franks and Lieb (1978).
218
The fact that local anaesthetics in the present study could reduce
bilayer tension as a result of altering the equilibrium between lipids
in the bilayer and torus phases of the ~embrane raises the possibility
that anaesthetics can also alter the equilibrium between the boundary
lipids of the sodium channel and the lipid bilayer. Such a change in
the equilibrium between the boundary and bilayer phases of
multicomponent systems (like living membranes) could lead to significant
changes in the composition of the boundary lipid phase, which in turn
could give rise to changes in the fluidity, geometry, surface charge and
surface potential of the membrane in the immediate vicinity of the
sodium channel. In fact on this basis neutral anaesthetic molecules
such as benzocaine, by altering the lipid composition of the boundary
lipid region, could change the membrane surface potential near sodium
channels in nerves.
Unfortunately this hypothesis is difficult to test and it is
definitely beyond the scope of the simple me~brane model employed in the
present study. However, studies on artificial BLM reconstituted with
excitation inducing material may give additional insights into the mode
of action of local anaesthetics.
219
11.5 SUMMARY
The effects of some n-alkanol and p-aminobenzoic acid ester types
of local anaesthetics on egg-lecithin and egg-lecithin - cholesterol
artificial BLM were investigated. The results were interpreted in terms
of the dielectric and surface tension properties of the lipid bilayers
characterised in this thesis.
The presence of amphiphilic local anaesthetics in egg-lecithin
bilayer systems had little effect on the capacitance (measured at 1 Hz)
of solventless bilayers.
The presence of the protonated form of procaine in the aqueous
phase did not significantly alter the capacitance of the ionic double
layers external to the membrane. This suggested that the charged form
of procaine did not partition significantly into the membrane.
The presence of tetracaine in the aqueous phase drastically
increased the bilayer conductance. This increase in conductance was
consistent with previous measurements made by McLaughlin (1975). In
that study it was found that the increased bilayer conductance was due
to a charged tetracaine complex acting as a carrier of electrical
current in the bilayer interior.
I Procaine and benzocaine both had significant effects on the
frequency dependence of the bilayer capacitance. At low frequencies
(.003 Hz to .1 Hz) both procaine and benzocaine increased the relative
dispersion in bilayer capacitance. At higher frequencies procaine
virtually abolished the frequency dependence of the bilayer capacitance
220
due to the polar head regions whereas benzocaine had no detectable
effect on the dispersion.
From the relative effects of these two related compounds on the
dielectric structure it was possible to infer the location and
orientation of the anaesthetic molecules within the bilayer structure.
The data was consistent with the aromatic amine group of procaine being
embedded in the acyl chain region of the bilayer with the
diethylammonium moieties penetrating the region containing choline
phosphate groups of the lipid. The location of procaine within the
bilayer as determined from these dielectric measurements
with that previously found by X-ray (Coster et al.,
studies (Boulanger et al., 1980).
is consistent
1981) and NMR
Indications were that procaine and benzocaine probably had opposite
orientations within the bilayer, ie. the benzene ring of procaine was
intercalated among the acyl chains of the lipid whereas that of
benzocaine was penetrating the acetyl region.
The addition of benzyl alcohol, butanol and pentanol to artificial
BLM had no effect on the capacitance of solventless bilayers over the
entire experimental frequency range. This lack of effect could not be
interpreted as being due to the exclusion of these molecules from the
bilayer phase as their presence in the bilayer was reflected by changes
in the surface tension and alkane solubility properties of the bilayer.
Thus these molecules were dielectrically ''invisible" at their
binding sites within the bilayer.
221
Procaine, butanol and pentanol, at clinical concentrations in the
aqueous phase, significantly reduced the surface tension of
egg-lecithin - cholesterol bilayers. The magnitude of the reduction in
bilayer tension correlated well (with the exception of benzocaine) with
the anaesthetic potency of the anaesthetic molecules on nerve axon.
Previous studies of the dielectric properties of lipid bilayer
systems containing hydrophobic and amphiphilic anaesthetic molecules
(Ashcroft, Coster and Smith, 1977 and Haydon et al., 1977) proposed that
changes in thickness of the bilayer component of the plasma membrane,
induced by local anaesthetics, mediated the blockage of the sodium
channels in nerve axon. However, in this study there was no evidence
found which suggested that anaesthetics with amphiphilic molecular
structures could induce anaesthesia by altering the bilayer thickness.
The fact that some local anaesthetics lowered the surface tension
in egg-lecithin-cholesterol bilayers indicated that the bilayer-torus
equilibrium in these artificial bilayer systems was altered by the
incorporation of these molecules into the membrane structure. The fact
that the anaesthetics had this effect on artificial BLM raised the
possibility that the mechanism of anaesthesia (for amphiphilic molecules
at least) could involve changes in the equilibrium between the lipids in
the bilayer and those in the boundary lipid region of the sodium
channels in nerve. A change in the composition in the lipid
environment, caused by such a change in the bilayer/boundary-lipid
equilibrium could then mediate the blocking of the ion channels.
CHAPTER 12
SUMMARY
12.1 SUMMARY
12.2 SUGGESTIONS FOR FURTHER WORK
Page
223
233
222
223
12.l SUMMARY
i) Bilayer Formation
This thesis describes low frequency impedance measurements on
artificial bimolecular lipid membranes over the frequency range
.003-10000 Hz. Artificial bimolecular lipid membranes were formed from
n-alkane and squalene solutions of glycerol monooleate, egg-lecithin,
and mixtures of the latter with oxidised and unoxidised cholesterol.
The membranes were generated by using the film drainage method of
Mueller, Rudin, Tien, and Wescott (1962). Experiments were performed
with membranes generated from n-alkanes of various chainlengths from
that of n-decane to n-hexadecane.
ii) Electrical Measurements
A four terminal digital impedance measuring technique, based on
that of Bell, Coster and Smith (1975), was employed to measure bilayer
impedance. In this method the membrane impedance was calculated from
the relative phase and amplitude of sinusoidal voltage signals appearing
across the membrane and a known impedance standard when sinusoidal
current of accurately known frequency was passed through the membrane
and the series, known, impedance network. The recent technical
improvements to the impedance measuring system embodied in this system
(the Biophysics Ultra Low Impedance Spectrometer- or BULFIS) allowed
resolution of phase angles and impedances of .1% and .02° over the
frequency range .001 - l0O00Hz.
To accommodate the increased accuracy and extended frequency range
of the impedance measuring apparatus, several improvements to the
224
amplifier electronics were made. This thesis also describes the
improved procedures for calibrating and correcting the differences in
the phase and gain responses and input capacitances as well as the
calibration technique for the impedance standards.
iii) Characterising the n-alkane Solubility Properties of Egg-Lecithin
Bilayers
This thesis describes investigations into the dependence of alkane
solubility in egg-lecithin bilayers on the alkane chainlength,
temperature, its concentration in the torus and the acyl chain ordering
of the lipids.
It was found that the absorption of increasing amounts of n-alkane
into the bilayer interior caused a significant increase in bilayer
thickness. From the relative changes in the bilayer thickness it was
possible to estimate the total n-alkane concentration in the bilayer.
The partitioning of n-alkanes into the bilayer was found to
increase with increasing temperature and decrease with increasing alkane
chainlength. From the variation of thickness of solvent containing
bilayers with temperature and alkane chainlength it was possible to
conclude that for sufficiently long chainlength alkanes at sufficiently 0
low temperatures (ie n-hexadecane below 30 C) the concentration of the
alkane solvent in the bilayer was negligible. In this way egg-lecithin l
bilayers could be produced that were effectively solventless. The
essentially solvent-free nature of these membranes was verified by the
fact that the capacitance of these bilayers was similar to those formed
by monolayer apposition (which are generally accepted to be
solvent-free).
225
The assumption of ideal mixing between the acyl chain of the lipids
in the bilayer and the alkane chains was tested experimentally using
measurements of the n-alkane concentration in bilayers, when the latter
were in equilibrium with a torus containing more than one type of alkane
molecule. It was found that the assumption of ideal mixing was valid
only when the alkane mole fraction in the bilayer interior was less
than 40%.
The absorption of n-alkanes into lipid bilayers was found to be
very sensitive to the ordering of the acyl chains in the hydrophobic
interior. Benzyl alcohol, known to disorder the acyl chain region of
lipid bilayers at high concentrations, dramatically increased the
absorption of n-alkanes into egg-lecithin bilayers. On the other hand,
cholesterol, which is known to increase the order of the acyl chain
region, significantly reduced the absorption of n-alkanes into
egg-lecithin bilayers. This dependence on the acyl chain order was
found to be consistent with a very successful statistical mechanical
model of lipid-alkane bilayers in the liquid crystalline state
(Gruen, 1980b). That model has successfully accounted for the
chainlength dependence of n-alkane solubility in the bilayer.
The production of solventless bilayers allowed a more useful
comparison to be made between
artificial and living systems.
the properties of lipid bilayers
On the other hand the partitioning
in
of
n-alkane solvents between the bilayer and torus was found to be a useful
probe in detecting small variations in the ordering of the lipid acyl
chain. Indeed, the change in partitioning appeared to be more sensitive
to small changes in the ordering of the acyl chains than, for instance,
changes in the thickness of solventless bilayers.
226
iv) The Effect of Ions on Bilayer Capacitance.
The capacitance of all the membrane electrolyte systems
investigated in this thesis increased to an upper limit with increasing
ion concentration in the external aqueous phase.
From the relatively small effect of external ion concentration on
the alkane solubility in egg-lecithin bilayers it was concluded that the
variation in bilayer capacitance with ion concentration was mainly due
to the ion dependent capacitance of the ionic double layers external to
the membrane.
The capacitance of the ionic double layers in series with the
dielectric capacitance of the bilayer significantly reduced the total
measured capacitance of the membrane over the frequency range
.003-10000 Hz. From the analysis of the bilayer impedance dispersion
over this frequency range it was found that the time constant of the
ionic double layer was very close, if not equal (within the range of
experimental error of BULFIS), to that of the bilayer hydrophobic region
at all concentrations of the external electrolyte. This implied that
the conductance of the ionic double layer was very low and essentially
independent of the external ion concentration. This strange result had
been predicted from solutions to the time dependent Nernst-Planck
equations,
Smith (1977).
as applied to the bilayer electrolyte interface by
The capacitance of the ionic double layers external to the membrane
was calculated, assuming that the measured capacitance of the
at high electrolyte concentrations was approximately equal
dielectric capacitance of the membrane (which was assumed
membrane
to the
to be
227
independent of electrolyte concentration). The results were analysed in
terms of the Gouy-Chapman theory. They were consistent with an ion
concentration dependent net charge absorption at the membrane solution
interface, which could be described by the Langmuir absorption isotherm.
The inclusion of oxidised and non-oxidised cholesterol had
distinctly different effects on the measured capacitance of egg-lecithin
bilayers at low ion concentrations. However, the effect of these
compounds on bilayer thickness, although significant, was found to be
small. It was concluded, therefore, that one must be sure to take the
effects of ionic double layers into account when determining thickness
changes in lipid bilayers from measurements of membrane capacitance.
v) Dielectric Dispersion Measurements
a) Characterising the Dielectric Structure
It was found that over the frequency range .003 Hz to 10000 Hz the
total membrane capacitance and conductance of bilayers formed from
egg-lecithin and glycerol monooleate showed a dispersion with frequency.
This dispersion was fitted with a theoretical interfacial polarisation
model for a multilayer sandwich of dielectrics- a Maxwell-Wagner system.
The experimental data was fitted with a Maxwell-Wagner dispersion
modeling a sandwich structure containing 4-6 dielectrically distinct
layers.
By comparing and contrasting the dielectric structures of GMO and
egg-lecithin bilayers determined in this way, it was possible to
characterise the dielectric substructure of both these membrane systems.
228
The dielectric parameters obtained from the impedance data of both
bilayer systems for that part of the substructure with electrical
time-constants greater than .l-1 second were assigned to the acetyl
regions of both of the bilayer systems investigated. Parameters for
the regions with time-constants less than .l second were assigned to
either the hydroxyl region of the GMO bilayers or,
egg-lecithin bilayers, the choline phosphate region.
in the case of
The ion concentration in the aqueous phase had very little effect
on the polar head dielectric structure of any of the bilayer systems
investigated in this thesis.
The conductance of the hydroxyl region of GMO bilayers was
independent of the external electrolyte concentration up to l Molar
concentrations. After this the conductance increased with increasing
electrolyte concentration. This was consistent with there being two
conductance mechanisms operating within the polar region of GMO
bilayers: one being independent of the external ion concentration, and
the other varying more or less linearly with ion concentration. The
latter became significant only at high ion concentrations. This
suggested that a conduction mechanism, other than ion migration, was
operating in the polar head regions of GMO bilayers (perhaps associated
with the intrinsic conductivity of the lipid material). The fact that
the conductance of the polar regions of egg-lecithin was independent of
ion concentration in this study raises the possibility that a similar i
intrinsic conductance mechanism may also have been dominant in the
hydrophobic regions of lipid bilayers.
On the basis of the polar head conductivity at high ion
concentrations it was possible to calculate the partition coefficient
229
for ions between the aqueous phase and the polar head region. The
partition coefficient was of the order of 10- 8 which indicated that there
was no significant ion penetration of the membrane polar structure.
b) Cholesterol
From the relative effects of the inclusion of cholesterol in the
bilayer structure of egg-lecithin bilayers, it was possible to locate
this molecule in the bilayer. Cholesterol when present in egg-lecithin
bilayers significantly reduced the capacitance of the acetyl region.
This was interpreted as being due to the presence of the steroid ring
structure in the region containing the acetyl groups of the lipids. The
hydroxyl group of cholesterol would then have been located in a plane
midway between the carbonyl and phosphate groups of egg-lecithin. This
was also consistent with the effect of cholesterol on the dielectric
parameters determined for the region containing the choline phosphate
groups in the bilayers.
c) n-Alkanes
From the lack of effect of n-alkane absorption on the polar head
dielectric structure it was concluded that these molecules mainly reside
deep within the bilayer structure.
The replacement of H2o in the aqueous phase with D20 had neither a
detectable effect on the dielectric substructure nor an effect on the
ionic double layer capacitance in egg-lecithin-cholesterol bilayers.
This independently confirmed the validity of the use of D2 0/H 2 0
230
replacement in neutron diffraction experiments using lipid multilayers.
e) Anaesthetics
Procaine and benzocaine in the external aqueous phase at pH 6 and
at anaesthetising concentrations had significant effects on the
dielectric substructure of egg-lecithin bilayers, indicating that these
molecules were indeed absorbed into the bilayer structure. The data was
consistent with procaine and benzocaine having opposite orientations in
the bilayer. It was concluded that procaine was aligned perpendicular
to the plane of the bilayer with the aromatic group intercalated in the
lipid acyl chains and the diethylammonium group penetrating the choline
phosphate region of the bilayer. It was reasoned that benzocaine would
be oriented in such a way that its methyl group was embedded in the
acyl chain region and its aromatic ring structure was in the acetyl
region of the bilayer.
The incorporation of alcohols in the bilayer structure had no
effect on the dielectric substructure of the bilayer. Thus these
molecules were "invisible" to the impedance measuring techniques used in
this study.
vi) Membrane Electrical Conduction
The conductance of lipid bilayers in aqueous solutions of different
ion species and varying concentrations was measured. It was found that
the bilayer conductance was relatively insensitive to ion concentration,
radius or charge of the ions. On the basis of this is was possible to
discount the possibility of ion conduction directly through the
hydrophobic region of the bilayer.
231
The bilayer conductance increased with increasing temperature and
was found to vary exponentially with inverse absolute temperature. The
activation energy of bilayer conductance was 35 ± 2 KJ/mole which was
sufficiently low to confirm the previous conclusion that the conduction
did not involve the partitioning of the ions into the hydrophobic
region. On the other hand, the value was sufficiently high to eliminate
the possibility of bilayer conduction via water channels of macroscopic
dimensions.
The data obtained in this chapter was shown to be consistent with
ion conduction via aqueous channels with dimensions of the order of a
few nanometres. The location of these pores, whether evenly distributed
across the bilayer surface, or localised at the bilayer-torus interface
was not certain.
vii) Bilayer Surface Tension
a) Characterising Bilayer Tension
The tension of egg-lecithin and GMO bilayers was measured using the
membrane bowing technique of Coster and Simons (1968). The results were
interpreted in terms of the bilayer torus equilibrium as envisaged by
~~olfe (1979).
The bilayer tension of GMO bilayers were relatively high and I
increased with increasing temperature. On the other hand the tension of
egg-lecithin bilayers was low and decreased with increasing temperature.
This temperature dependence allowed certain insights into the bilayer
torus equilibrium.
232
The data were consistent with GMO molecules in the bilayer being in
equilibrium with small micellular aggregates in the torus (approximately
100 molecules per aggregate). The data indicated that egg-lecithin· in
the torus must be in relatively large aggregates, so that the entropy of
mixing of lipids in this system had little effect on the bilayer
tension.
b) Cholesterol
Cholesterol was found to increase the tension of egg-lecithin
bilayers but the mechanism for this effect was not certain.
c) Anaesthetics
Procaine, butanol and pentanol, at relatively low concentrations in
the aqueous phase, all significantly reduced the tension of egg-lecithin
bilayers. Therefore it could be concluded that these anaesthetics
significantly altered the lipid equilibrium between the bilayer and
torus components of the membrane. On the basis of this result it was
suggested that the mechanism of action of local anaesthetics on nerves
may involve alteration of the lipid equilibrium between the annulus of
lipids around the proteinaceous sodium channels and the lipids in the
rest of the bilayer.
233
12.2 SUGGESTIONS FOR FURTHER WORK
Artificial bimolecular membranes, used in this study to model the
bilayer component of living membranes, have physical properties peculiar
to the lipid equilibrium that exists between the bilayer and torus
components of the membrane. It is important to remember this when
applying the conclusions based on this artificial system to living
membrane systems, where the lipid equilibrium between the membrane and
the environment will be different.
An alternative model that could be employed in dielectric studies
would be large bimolecular vesicles. Vesicle systems would model the
bilayer component of living membranes that are not in equilibrium with a
lipid ''reservoir". Dielectric and surface tension studies on large
vesicles would be an interesting extension to the work reported in this
thesis.
The main advantage of using vesicles is that they contain
absolutely no hydrophobic solvents, as they can be readily formed
without the use of such solvents. The results obtained from vesicle
systems would be easier to interpret than those obtained from planar
bilayers which are in equilibrium with a solvent reservoir.
Vesicles, provided they are of
aspirated into small glass pipettes.
sufficient diameter could be
The pipette would act as an
insulating border (ie. functioning as a septum) as well as providing a
means of mechanically clamping the vesicle for the purposes of
electrical and mechanical measurements. The aspiration of single cells
234
into glass pipettes is now a commonly used technique in membranes
studies (eg. Wolfe and Steponkus, 1981).
Further work could also be undertaken in characterising the
electrical and surface tension properties of artificial bilayers
containing proteinaceous excitability inducing material (EIM). The
effect of changes in bilayer tension and thickness on the electrical
activity of these membrane components could then be investigated. This
would allow additional insight into the dependence of sodium channel
conductance in nerve axon on the state of the surrounding lipid matrix.
The effect of membrane thickness on the electrical activity of
gramicidin (a passive, transmembrane ion pore) in lipid bilayers has
been investigated by Hendry, Urban and Haydon (1978). The electrical
properties of EIM isolated from Enterobacter cloacae, reconstituted with
lipid bilayers has been well characterised in previous studies
(Kushnir,1968 and Bean, 1973). However, no study of the effects of
bilayer tension and thickness or addition of local anaesthetics on
membrane excitability in these model membranes has been made.
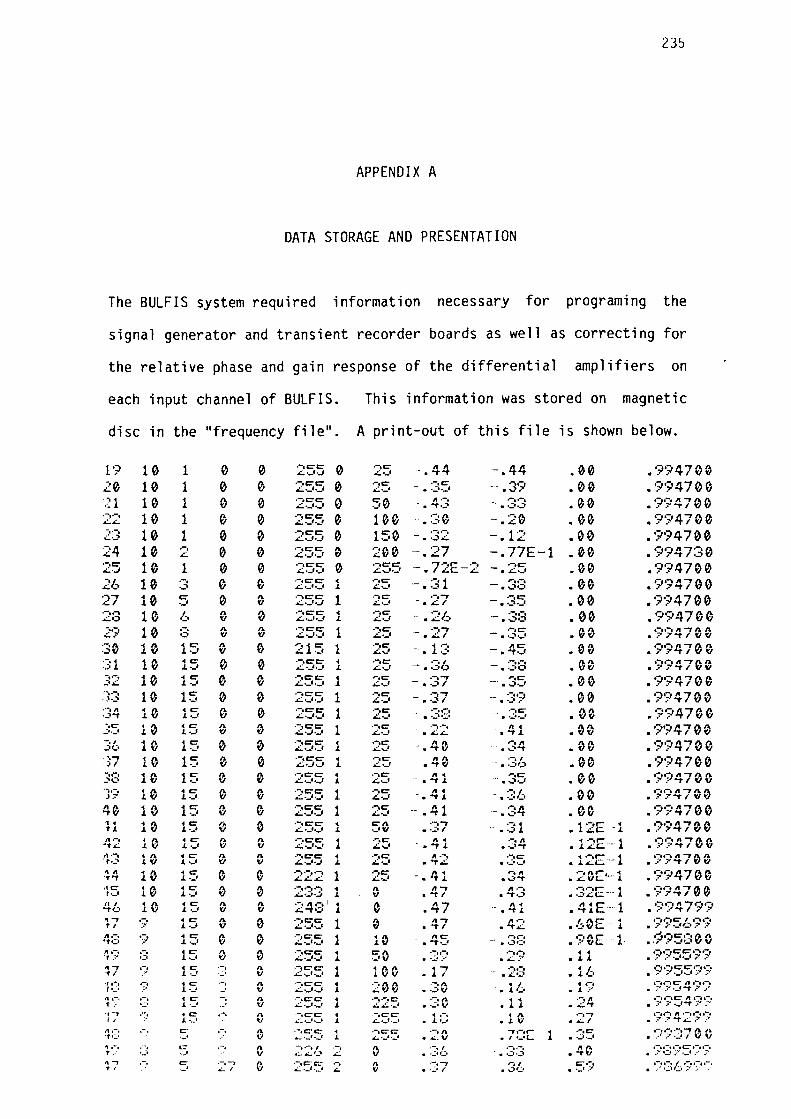
235
APPENDIX A
DATA STORAGE AND PRESENTATION
The BULFIS system required information necessary for programing the
signal generator and transient recorder boards as well as correcting for
the relative phase and gain response of the differential amplifiers on
each input channel of BULFIS. This information was stored on magnetic
disc in the "frequency file". A print-out of this file is shown below.
19 10 1 0 0 .-,c-c:- 0 .-,C' -. 44 -.44 .00 .994700 "-·-'·J -'·-' 20 10 1 0 0 .-,C'C' 0 .-,c- .-.c-
-·· .39 00 _9·;,4700 ..::.._,._, .::.,._, - . . ,:_,._, . 21 10 1 0 0 .-.c-c- 0 50 - 11--, - .-.. -. .00 .994700 ..::,._,._, ..... ,;- .. ,:.. . .::-.-.. -. 10 1 0 0 .-,c-c- 0 100 • :~:0 -.20 00 .994700 L..:.:. ~--'·-' . -.. -. 10 1 0 0 .-,c-c:- 0 150 - .-.. -. - 1 ·-:• .00 . •;,94 70 0 ~-.;, ..::,._,._, . . _;..::_ . .:..
24 10 .-. 0 0 .-,cc:- 0 200 -·. 27 -.77E-1 00 . ·;,·~4730 ..:. ,.::.._,._, . .-,e ..:.:.-J 10 1 0 0 .-.c-c:-
L..·-'·-· 0 .-.c:-c-.::.,.._,._, -.72E-2 - .-,c- .00 .994700 . .::.,.._, 26 10 .-. 0 0 .-,c-c:- 1 .-,c- - • :31 - ,-,,-, 00 .994700 . .:,, ,.::.._,._, .:.,._, .v•::• . 27 10 C" 0
,. ·--C"C' 1 .-.c- - . -.-, - .-,c- 00 .994700 ·-' '(/ ..::,._,.J L·-' • 4'. I .. ::,._, . .-.. -. 10 l, ,. 0 .-,c::-c- 1 . -,c _ ... 21.; . - .-.. -. 00 .994700 ..:.:.·~ '(/ ,.:;.._,._, ..::,._, • v•=- . --.. -. 10 .-. 0
,. .-,c-c- 1 .-,c- - .-.-, - .-,c- .00 .-•• -. " -, "' /1. .::..~ ,:;:, 1(/ ..:.:.,._,._, £,_, • 4/ .. ,::.._, . ?)"TI 'f/'(J
:30 . ,. 15 ,. 0 215 1 .-,C' -· 1 ·-=· - "C" 00 . 'i'l4700 J. '(/ '(/ ,£._I . ·-· . ..,.._, .
31 10 • C" 0 0 .-,c-c- • .-,c- - .-. , - .-.. -. .00 . ·;:•i4 70 0 J.._, ,.::._,._. J. ..::,._, • . ,,:.,1:, • -:.-•J -.. -, 10 • C" 0 0 .-.c-c.~ 1 .-,c- .-. ...,. --- .-,c- 00 • 9'?'4700 ;,..::.. J.-• ..::,._,._, .:,..._, - •._-.I . .,:,._, . ,·,.-. 10 15 0 0 .-.c:c:- 1 .-,c- - .-.-,. -- . :3·;, .00 . 9'?4700 ._:,.,;. L·-'·-' .a::,._, . -~ / .·-, 11 10 • C" 0 0 . -,c-c- 1 .-,c .. .-.. -. .-,c- ,. ,. .994700 ._:,.,. J.--· ,.:,,._,._, .::,.._, • -.:.-·=· .. :;,_ .. _. . 1(/'(/
·,c::- 10 • C" ,. ,. .-,c-c- 1 . -,c .-,.-. " . .00 • ·:;,·~4700 .:..•--• L ._, '(/ '(/ ..::.-J·-' ..::,._, - . .,;;_.,,:._ • .,. J. -,, 10 • C" ,. 0 .-,c-c- 1 .-,c- -. 40 -· .-. " 00 • '?'7'4 70 0 ,;.,:._. J. ._, '(/ ..::_._,._, ..,:;,.._, . ..,:..-., . ·V""7 10 15 0 0 .-,c-c 1 --.c- /I ,. -- .-. , .00 .994700 j/ L•.J•J ,.:::..._, . .,. '(/ .. .:;.,,~ -.. -. 10 15 0 0 .-,C"C" • .-.c- ·- /I • .. .-,c- 00 . '7"~14 70 0 _-.o L·-'·-' J. .::,,.._, • .,. J. . ~--· . ·-,.-. 10 • C" 0 0 .-,C'C' • . -,c- " . ·- .-, I .00 • '7"7'4700 J7 J.•..J ..:.:,._,._, L ,._, • .,. J. .. :._,,.:.,
40 • ,. 15 ,. 0 .-,c-c:.- • .-,c -- .41 ~-. 34 00 . ·;,·~J4700 J. V V ..::,._,._, J. L·-' . ., . 10 • C" r • 0 .-,C"C' • C",. .-,-, -- .-... 12E • . •7•;•4700 ·t J. L ._, 1(/ ..:,:.._,._. L ·-''fl • • .:;,1 / • • ,:.. J. . -L
11,-. • ,. • C" 0 ,. .-,c-c- • .-,c- /I • .-. " ... -,,- .. .·;:·~4700 ·-t"- J. l(J
.l ·-· V .:::,.._,._, J. .;.._. • .,. J. .. ~ .. ..., . J..::.c:;.··-J. ,,.-. • ,. • C" ,. ,. .-,c-c- • . -,c- ,..-. .-,c- .. . -,r- '4 • '?"~4700 't.:;. J."' J.._, "' V ..:.:,._,.J J. .::_._, • -t-L . -~·--· . J. .::.c.·-- J. . " • ,. • C" ,. 0 .-.. -.. -. 1 .-,c - /I • ,., " • 20E'-· 1 .994700 "T"t J. l(J
.l ·-· V ..::..::.~ .:,.._, •• .,. .L . ..:., .....
,1 a= • ,. • C" 0 0 .-.. -.. -. • ,. ,,-, ".-. .-•• -,,- <f • ·~·:;-4700 t,_I J. '(/ J. ·-·
..:,;. . .;., . .:, L V • "t I ....... ~ • ,.:,.::..c,-·~ L II I 10 • C" ,.
0 24:~:i • 0 "-, - " . /I.,- 1 • •;1•;J4 79•;1 .. .,.,.::, L ._, '(/ J. • "T / • .,. J. • .,. J. t:. -· ., .-, • C" ,. 0 .-,c:c- • 0 /I-, 4·-::· • f,0E··-· 1 . 'l';-'5b'i'i t I ::r L ._, 1(/ .:;.._ .. _, J. • ""t I . ~
"·-· .-. • C" ,. ,. .-.c-c· 1 10 -· /IC" -·· .-.. -. r,Ar- • .:~·;15:.:~00 •t•:.• / J. ·-' V 1(/ .:;,._,._, • 6"t·-' • -;t•.:• . ."'(JC. ·J.· 11,-. .-, 15 0 0 .-.c:-c- • 50 ·-=··~~ . -.. -. • • • '7"/55'7''? ·t / ·=·
..:.:,._,._, J. . ·-· .. · • L 7 . J. J. ~-, ,-, • C" - ,. .-,c-c: 1 100 • !' .-.. -. 1 l, . ,7 .. ;:55·;·;· ·t I ;,
J. ·-' ·, V .:.:,._,._, . J. I ·- • .;.1.::\ . -,,.-, .-, 15 .-, ,. . -,c-c- 1 200 .-. n. • I t .-. . ·;··;:54·-;:··;-t•.:• .:• - V ..:,;,._,._, . . .:_, '(/ . J.I.:,;., . J. .:•
,, .-. .-. • c::- -: ,. .-.c-c- • .-,--,c .-, n. • • .-,11 ,-, ,-, C' II ,-, ,-, 1 .- •.:..• J. ._, ·- V ..:.:,._,._, J. ..:.:.~·-' . . .:_, '(/ . J. J. • L6t . :-· ;;• ._,.., .-=' .:• .,--, .. -. • c::- -- " .-,c-c- • . -,c.-~ '4 .-• • ,. .-,--, .-.. -, " .-, .-.. -.
j / :• J. ._, V .&:.:.,_,._. J. _.:_._,._, . L ,_. . J. '(/ • .:.:, I . 7l'...-L?:· ... 11,-, c:- .-. ,. .-,c-c:- • .-,cc- .-.11 -,,-., 1 .-,c- .-. ,-•• -. --, II. (1.
·t·~· -' V .:_._,._, J. ..:.:,._,._, • ..:.. V . I •:.:•c.. .. ,,:;,.,._. . / .:-1.,:_., vv ., .-, ,·-, i:::- ·- ,. -.. -., --, 0 .-, / .-.. -. ,. ,. ,-, ,-, .-. &:: .-•• -, 't.·· ,..:., ··-' V .:_.,_,J ..:: .. .:._,,:.:, . . ::,, . .,;. .... \:J . :r,::,, ;.•._• _; .. 7-
~--, - c; .-,-, 0 . -,c·c.- ,., ,.. .-. --y .-, I c:-,-• ·~-·:::l, ·?·~,-~ .. t I - ,;__ I .:.:,._,._, .::. V - • . .;_, I . ..:,,.:;.. •• _, :.v .
The significance of the columns of data (from left to right)
described:
236
are now
(F)- programs the rate at which the function in the signal
generator is clocked out. The clocking rate is calculated
using the following formula:
clocking rate= lMHz x 2 (F)/2 1024
(S)- sets the number of analog steps for the sinusoidal output of
the signal generator. The number of steps is given by:
steps per period= 2 (S)
(V)- sets the number of periods over which the transient recorder
boards sample and average.
(G)- The first argument sets the number of periods of the sine
function loaded into the signal generator and the second tells
BULFIS where to find the function (either in EPROM (0) or on
di SC ( l ) ) .
(A)- determines the amplitude of the output signal (O=OV to 255=5V).
(L)- both arguments select the RC filters on the output of the
signal generator.
{D)- sets the D.C. offset on the output signal (volts).
{M)- are the correction factors for the relative phase and gain of
the differential amplifiers at each frequency.
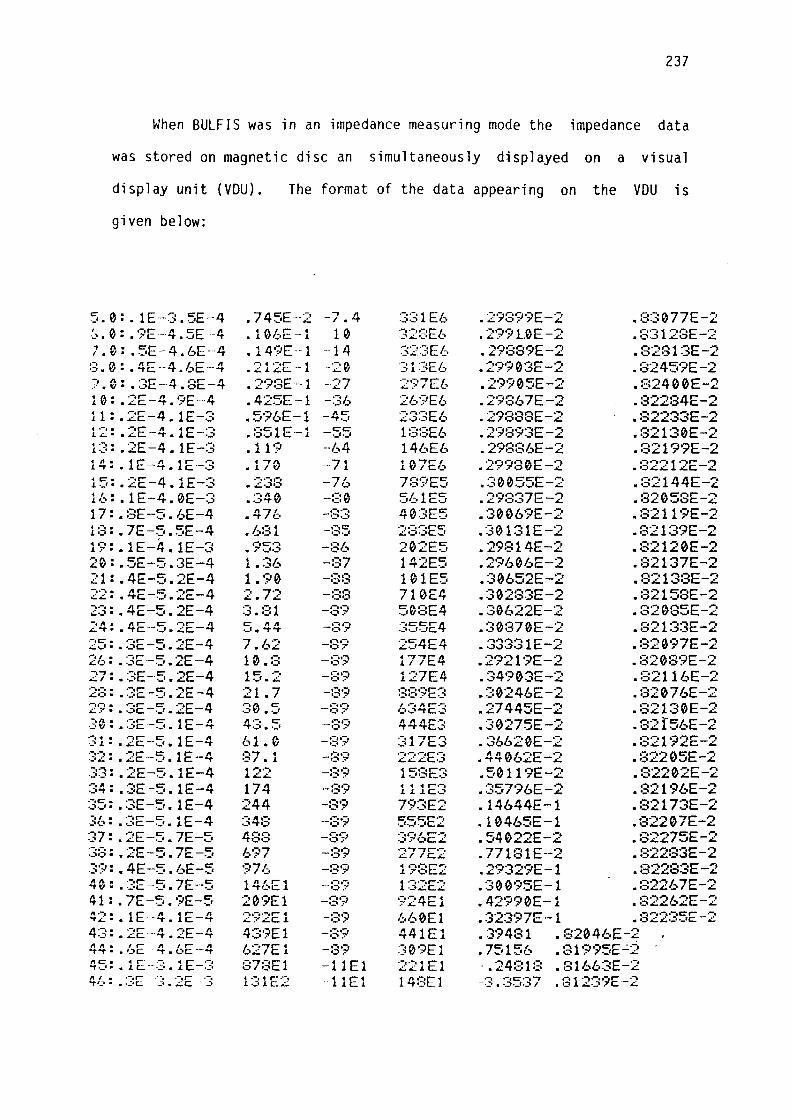
237
When BULFIS was in an impedance measuring mode the impedance data
was stored on magnetic disc an simultaneously displayed on a visual
display unit (VDU). The format of the data appearing on the VDU is
given below:
5.0:.1E-3.5E-4 .745E-2 -7.4 -~. 0 : . ·;:E -4. 5E -4 • 1 0l,E -1 1 0 7.0:.5E-4.6E-4 .149E-1 -14 ::::.0: .4E--4.bE--4 .212E-1 -20 ;, . 0: . :3E--·4. 8E-4 10:. 2E-4. 'iE·-··4 11 : • 2E-4. 1 E-3 12: .2E-4.1E-:3 1 :3: • 2E -4 • 1 E-:3 14:. lE-4. lE·-3 15: . 2E -4 • l E -:3 U.~ •• 1 E-4. 0E--:3 1 7 : • :3E -5 • l ... E -4 1:3:. 7E-5.5E-4 1'?:. lE-4. lE-3 20:. 5E-5. :3E-4 2l:.4E-5.2E-4 22:.4E-5.2E-4 2:3: .4E-5.2E-4 24: .4E--5.2E-4 25: . 3E-·5. 2E-4 26: . :3E·-5. 2E-4 27:. :3E-·5. 2E-4 .-.,-, • .-, r- C' .-. ,- II ,..::,:-, • •.,;.c.-._,• .L.C -61'
2'i:. :3E-5. 2E-4 -~:0:. :3E-5. lE-4 :31:. 2E-5. lE-4 :::2:. 2E-5.1E-4 . 3:3: • 2E -5 • 1 E -4 :34 : • ::::E -5 • 1 E -4 :35: • :3E -5. 1 E -4 3b:. :]E-5. lE-4 :37 : • 2E -·5 • 7E -5 :3:3: • 2E -5. 7E -5 .3·;-:. 4E-5. 6E-5 40: • :~:E-5. 7E-·-5 41:.7E-5.9E-5
.425E-1 .596E-1 • :351 E·-1 .119 . 170
.-.. -.. -. • ,.:;_.~,:::,
.:340
. 476
.6:31 .-,c---, • 7._, . .,
1. :36 1. "i0 .-. ,.-. ..::. • I..::.,
C" II II ._ .. ~.., 7.62 10. :3 15.2 21. 7 :30 .5 4:3.5 61.0 :37. 1 .. .-.. -. J.£~
174 244 :34:::: 4:3:3 6'i7 ·;.,71:.. 14l:,E 1 20'iE1
42:.lE-4.lE-4 292El 43:.2E-4.2E-4 439El 44:.bE 4.bE-4 627E1 45:.1E--:3.1E-:~: 87:3E1 46-.3E 3.2E 3 131E2
-·27 -36 -45
c-c:--._,._,
-7/~
.-.. -. -.,:-. . .,;.
.-,c·-·=-·-' -:36
,-,-, -,,:-., .-,.-, -·=-·=-.-.. -. -·=-·=--:3•;, -:3'?' .-..-. -,,:..7 .-.. -. -·=-·"'
-:3•;1 -:3•-;, -:3'"i' -:3•-;, -:3•-;, --:3•-;i
-:3·/ -:3•-;, ---:3·-;: -:3•-;, -:3·;) -:3•-;, -:3•-;, -11El -11E1
331E6
:32:3El:1
:31:3El:, 2'7'7E6 269E6 23:3E6
14bE6 107E6
5l,1E5 403E5 .-•• -,,-,r-c:-..:.:.•=•·:;ac..,_,
202E5 142E5 101E5 710E4 508E4 :355E4 254E4 177E4 127E4 .-•• - •• -. r- .-, ·=-·=- ,':'C,,.;t I.-, 11r-,-, ,_ .... .:- ..... c.-~ /I II II,-.-, "1""1' "'tC.-:>
317E3 222E:3 .. c-,-• .--.-, J. ·-··=-C.·-' 4 <t 4 ,-.-. J. J. .L c.-.:>
C'C"C'r-•-, ._,._,._,c,, :3'?6E2 .-,-,-,,.-. £ I I C:.L.
1 ·;,::::E2 1:32E2 'i24E1 l,b0El 441E1 :309E1 221El 14::::E 1
. 2·:;,9L0E-2 • 29:389E-2 • 29•:;,03E-2 • 2·~·7'05E-2 .29867E-2 .29888E-2 • 2·i8•;J:3E-2 • 29886E-2 .29980E-2 • :30055E-2 .2'7'837E-2 .30069E-2 .30131E-2 .29814E-2 .29606E-2 .30652E-2 . 302:33E-2 .:30622E-2 .30870E-2 • :33331E-2 .29219E-2 .34';>03E-2 .30246E-2 .27445E-2 .30275E-2 . 36620E-2 .44062E-2 .50119E-2 .35796E-2 .14644E-1 . 10465E-1 .54022E-2 • 77181E--2 .29329E-1 • :300'7'5E-1 .42990E-1
• :3:3077E-2 . :3:3128E-2 • 8281:3E-2 .:32459E-2 .02400E-2 • :322:34E-2 .:32233E-2 .82130E-2 • 8219'7'E-2 • :=:2212E-2 • :32144E-2 . :32058E-2 • :3211 'IE-2 .82139E-2 . :32120E-2 .82137E-2 • :3213:3E-2 • :32158E-2 .82085E-2 .82133E-2 . :32 0'i7E-2 • :320:3·;,E-2 .:32116E-2 . :3207bE-2 • :32130E-2 .82l56E-2 • :321 ';12E-2 .:32205E-2 .:32202E-2 • :321 ·~bE-2 .82173E-2 .:32207E-2 .82275E-2 • :322:33E-2 .:32283E-2 • :=:226 7E-2 .:32262E-2
.32397E-1 .82235E-2
.39481 .82046E-2
.75156 .81995E~2 -.24818 .81b63E-2 -3.3537 .81239E-2
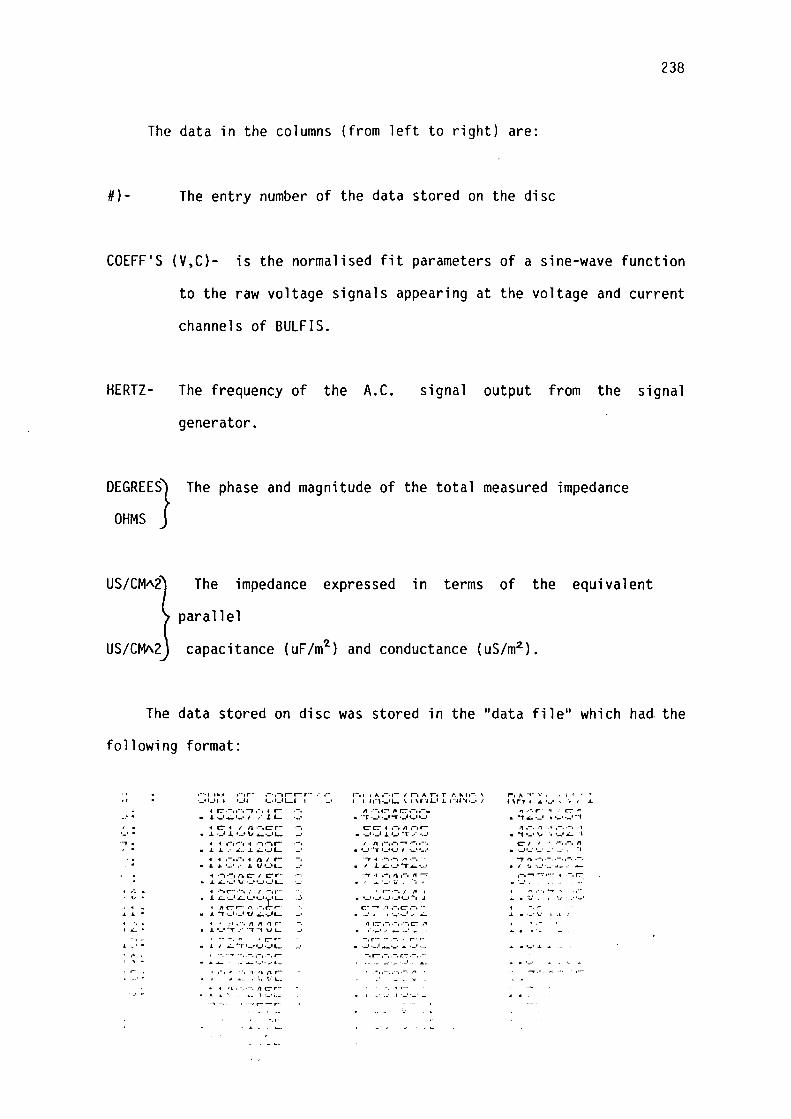
238
The data in the columns (from left to right) are:
#)- The entry number of the data stored on the disc
COEFF'S (V,C)- is the normalised fit parameters of a sine-wave function
to the raw voltage signals appearing at the voltage and current
channels of BULFIS.
HERTZ-
DEGREES}
OHMS
US/CMA2
US/CMA2
The frequency of the A.C.
generator.
signal output from the signal
The phase and magnitude of the total measured impedance
The impedance expressed in terms of the equivalent
parallel
capacitance (uF/m2 ) and conductance (uS/m2 ).
The data stored on disc was stored in the "data fi 1 e" whi eh had. the
following format:
·-· . ,.
I ,-. • <i • ...
L ...;_ "
.l ·-' •
t ,, '
' , .
,-·., • .._.. .-··,r·- ,-.,-,r-r- r- , ,- r-, 1 l A,-.,- , r, A r, T ,._ ",,-. , ·-• 1- 11 I '-'t 1-· 1-'LI I ·-• I I 11-1--•L \ I \t··tL1 .I. f··1t•1._, /
,t C.-,,-·, r ,-·, i r· .·-, • J. ·-1 .:... •-• I •. • l L
,. c:- .. / 11 .-,c:- r- .-, • .i. ._, J. ·--· \I .:.. ·-· '- ·-·
.. -4. ,-, .... , .. .-, .-, .-- .·-, • J. J. •• · ...: .. .L ,._._,L,
i .. ,-•• - ... /),.; r-- J. L ,,..;, .. L 'V ,:.,;,L -•
,. .-,.-1 r .. c:.-, c-r- · . • J. .:. .. • ;.) \,- ·-' ,_, ._1 L ..
i ,-,r_- ,••, l I .-.,··· • .l ..;.-.-•..:..,_,,_.;t'L-
-1 /t C:- r.-· '" .-, . r-• J . .,.._1._1 '<I ,._,_IL
.. , .. , ,···, ,, /I 'l ,--• .i. •-• ·'T .·· '"'t --,- '1 L
•rr-• J. I ,._ --1· •-••-•·-'L _, . ·-, - .... --,.-,,-,.-,,--
··, ., -'• ,., r· J •- ' '-, ~ .. : L.
-4 I 'l,-, -, /lc-r-.__ l ·-· i ...
" .-. ,::-- ,. ,:-:- .-.. -. • ·-r ._, ._,-,- ._, ,_, ._,
C"C 4 ,-. II ,-,r:-• ._1 ._, J. •-• ,.T •• · •.-•
I II, ... ,,-,-.-,,-·, • •-• ·•·1· •-•~• I ._, '-·•
••• , ... - •• -. !'1 .-, .·-,
• I .l ~--•"'T~·--• ....,. ., .-, I\,-,,,--;
• , ... ·-· i,i . ··, , ' r·- .-, ; 1' I
• ·-··-······-··-· ...... J c:·· - _.., ,-,c- ,-, .·-. .. _,' '·-··-' .· ..;...
" r.::-- ,-, .-, .·-, c- ,, . ;· ·-· .· ·- ·-' -· . -, r·- -·-.. -, ~ r·· r-
• ·-' ._., ~ ·-· ... ·-· ··-· ·-, r- ,-, ,-, r~ ,-, .-.
·- ·- -··- ·.-' -' ,-,,-·, .·-,.-. ·"' '
I._,,_,-·
r-1 A ,- T , -. i I '
f\t·, ' J. ·-· ' ... , "' ., .-.r··., _. r'.'",.
• •T.:..·-•· • ,_,._,-·1 ., .-..... ~ ,-, .-, _.·t . ..,. ·-· \, ·,· ·-· ~ .. , C' I I • --,,-, 11
•• _ .. _. ,_, . __ . -· • 1
..,. .,. .-, .-.. -, .-.. -. • I ~ ._, ··-· _._ . ~
,-.~--:, .. - 4 .-,r.::-. ... _,' r.,"·,- ..
' -.~· ··-· ·-· -I .-, r
J. • ·-· '-'' I .I. , . .... • j ·-
... • ·-· J. ...
..... ·-·
239
The left column contains the sum of the normalised fit parameters
of the voltage and current channels of BULFIS at each frequency. The
second and third columns contain the phase difference and amplitude
ratio of the voltage signals arriving at both input channels of BULFIS.
240
REFERENCES
Andrews,D.M. and Haydon,D.A. (1968) J. Mol. Biol 32,149-150
Andrews,D.M.,Manev,E.D. and Haydon,D.A. (1970) Spee.Disc. Far. Soc. 1,46-56
Ashcroft,R.G. (1979) PhD. thesis, University of New South Wales
Ashcroft,R.G., Coster,H.G.L. and Smith,J.R. (1977) Biochim. Biophys. Acta 469, 13-22
Ashcroft,R.G., and Coster,H.G.L. (1978) Bioelectrochem. Bioenrg. 5, 37-42
Ashcroft,R.G., Coster,H.G.L. and Smith,J.R. (1981) Biochim. Biophys. Acta 643, 191-204
Bean, R.C. (1973) Membranes 2, 409-477
Bates,E.H. and Wolfe,J. (1980) in Advances in Liquid Crystals Research and Applications (Bata,L., ed.) pp 739-749 Akademiai Kiado, Budapest
Bell,D.J., Coster,H.G.L. and Smith,J.R. (1975) J. Physics E. 8, 66-70
Benz,R., Frohlich,0., LaUger,P. and Montal,M. (1975) Biochim. Biophys. Acta 394, 323-334
Benz,R. and LaUger,P. (1977) Biochim. Biophys. Acta 468, 245-258
Birrell,G.B. and Griffith,0.H. (1976) Biochem. 15, 2925-2929
Bockris,J. and Reddy,A.K.N. (1970) Modern Electrochemistry, Plenum press, N.Y.
Boggs,J.M., Roth,S.H., Yoong,T., Wong,E. and Hsia,J.C. (1976) Mol. Pharmacol. 12, 136-143
Boggs,J.M., Yoong,T. and Hsia,J.C. (1976) ~Mol. Pharmacol. 12, 127-135
Born,M. (1920) Z. Phys. 1, 45-48
Boulanger,Y., Schreier,S.,Leitch,L.C. and Smith,I.C.P. (1980) Can. J. Biochem. 58, 968-995
Boulanger,Y., Schreier,S. and Smith,I.C.P. (1981) Biochem. 20, 6824-6830
Brockerhoff,H. (1974) Lipids 9, 645-650
BUldt,G., Gally,H.U., Seelig,A., Seelig,J. and 1 Zaccai,G. (1979) J. Mol. Biol. 134, 673-691
Bunce,A.S. and Hider,R.C. (1974) Biochim. Biophys. Acta 363, 423-427
241 Caffrey,M. and Feigenson,G.W. (1981) Biochem. 20, 1949-1961
Carnie,S. Israelachvili,J.N. and Pailthorpe,B.A. (1979) Biochim. Biophys. Acta 554, 340-357
Cass,A. and Finkelstein,A. (1967) J. Gen. Physiol. 50 1765- 1784
Chatterjie,N. and Brockerhoff,H. (1978) Biochim. biophys. Acta 511, 116-119
Chemical Rubber Company Handbook of Chemistry and Physics (1976) 57th edition., West,R.C. ed. Chemical Rubber Company Press.
Chin,J.H., Parsons,L.M. and Goldstein,D.B. (1978) Biochim. Biophys. Acta 513, 358-363
Ciani,S., Gambale,F., Gliozzi,A. and Rolandi,R. (1975) J. Memb. Biol. 24, 1-34
Clowes,A.W., Cherry,R.J. and Chapman,D. (1971) Biochim. Biophys. Acta 249, 301-317
Cole,K.S. (1968) "Membranes, Ions and Impulses; a chapter of classical biophysics" University of California Press pp 458-463
Cole,K.S. (1969) Biophys. J. 9, 465-469
Coleman,R. (1973) Biochim. Biophys. Acta 300, 1-30
Coster,H.G.L. (1973) Biophys. J. 13, 1119-1123
Coster,H.G.L., James,V.J., Berthet,C. and Miller,A. (1981) Biochim. Biophys. Acta 641, 281-285
Coster, H.G.L. and Simons, R. (1968) Biochim. Biophys. Acta 163, 234-239
Coster, H.G.L. and Simons, R. (1970) Biochim. Biophys. Acta 203, 17-27
Coster,H.G.L. and Smith,J.R. (1974) Biochim. Biophys. Acta 373, 151-164
Cress,A.E. and Gerner,E.W. (1980) Nature 283, 677-679
Curatolo,W., Sakura,J.D., Small,D.M. and Shipley,G.G. (1977) Biochem. 16, 2313-2319
Danielli,J.F. (1966) J. Theoret. Biol. 12, 439-441
Darke,A., Finer,E.G., Flook,A.G. and Phillips,M.C. (1972) J. Mol. Biol. 63, 265-279
D'Arrigo,J.S. (1978) Am. J. Physiol. 235, Cl09-Cll7
Ebihara,L., Hall,J.E., MacDonald,R.C., Mcintosh,T.J. and Simon,S.A. (1979) Biophys. J. 28,185-196
Edidin,M. (1974) Ann. Rev. Biophys. Bioenerg. 3, 179-201
Ehrenstein,G. (1976) Physics Today (october) pp 33-39
242
Everitt,C.T. and Haydon, 0.A. (1968) J. Theoret. Biol. 18, 371-379
Feiser,L.F. and Feiser,M. (1959) Steroids, pp 233-235 (Reinhold)
Fettiplace,R., Andrews,D.M. and Haydon,D.A. (1971) J. Membrane Biol. 5, 277-296
Fettiplace,R., Gordon,L.G.M., Hladky,S.B., Requena,J., Zingsheim,H.P. and Haydon, D.A. Methods of Membrane Biol. (1975) (Korn,E.0., ed.) Vol 4. pp 1-75. Plenum press New York
Fettiplace,R. (1978) Biochim. Biophys. Acta 513, 1-10
Finkelstein,A. and Cass,A. (1967) Nature 216, 717-718
Franks,N.P. (1976) J. Mol. Biol. 100, 345-358
Franks,N.P. and Lieb,W.R. (1978) Nature 274, 339-342
Ginsberg,S. and Noble,D. (1974) J. Memb. Biology. 18:163-76
Goldman,D.E. (1943) J. Gen. Physiol. 27, 37-60
Goldup,A., 0hki,S. and Danielli,J.F. (1970) Ree. Proc. in Surf. Sci. 3, 193-260
Grabowski,E.F. and Cowen,J.A. (1977) Biophys. J. 18, 23-28
Graziani,Y. and Livne,A. (1972) J. Memb. Biol. 7, 275-284
Gruen,0.W.R. (1980a) Biochim. Biophys. Acta 595, 161-183
Gruen,0.W.R. (1980b) Biophys. J. 33,149-166
Gruen,D.W.R. (1980c) Biophys. J. 33,167-187
Gruen,D.W.R. and Wolfe,J. (1982) Biochim. Biophys. Acta 688, 572-580
Gutknecht,J. (1981) J. Memb. Biol. 61, 61-66
Gutknecht,J. and Walters,A. (1980) J. Memb. Biol. 56,65-72
Gutknecht,J. and Walters,A. (1981) Biochim. Biophys. Acta 645, 161-162
Hanai,T.,Haydon,D.A., and Taylor,J. (1964) Proc.Royal.Soc 281,377-391
Hanai,T., Haydon,D.A. and Taylor,J. (1965a) J. Theoret. Biol. 9, 278-296
Hanai,T.,Haydon,D.A. and Taylor,J. (1965b) J. Theoret. Biol. 9,422-432
Hanai,T., Haydon,D.A. and Taylor,J. (1965c) J. Theoret. Biol. 9, 433-443
Haydon,0.A.,Hendry,B.M.,Levinson,S.R., and Requena,J. (1977) Biochim. Biophys. Acta 470,17-34
Haydon,D.A. and Taylor,J. (1968) Nature 217, 739-740
Hendry,B.M., Urban,B.W. and Haydon, D.A. (1978) Biochim. Biophys. Acta 513, 106-116
Hille,B. (1980) "Progress in Anesthesiology" V2 ed. Fink,B.R. Raven Press pp 1-5
Huang,C.H. (1976) Nature 259, 242-244
Huang,C.H., Wheeldon,L., and Thompson,T.E. (1964) J. Mol. Biol. 8, 148-160
Huang,W.T. and Levitt,D.G. (1977) Biophys. J. 17, 111-128
243
Hope,A.B. and Walker,N.A. (1975). "The Physiology of Giant Algal Cells" Cambridge Press.
Jacobson,K. and Papahadjopolous,D. (1975) Biochem. 14, 152-161
Israelachvili,J.N. (1977) Biochim. Biophys. Acta 469, 221-225
Israelachvili,J.N. (1978) in "Light Transducing Membranes Structure, Function and Evolution", Ed. Deamer,D.W., Acced. Press, pp 91-107
Israelachvili,J.N.,Marcelja,S. and Horn,R.G. (1980) Quart. Rev. Biophys. 13, 121-200
Israelachvili,J.N., Mitchell,0:J. and Ninham,B.W. (1976) J. Chem. Soc. Faraday Trans. II 72, 1525-1568
Kushnir,L.D. (1968) Biochim. Biophys. Acta 150, 285-299
Langmuir,I. and Waugh,D.F. (1938) J. Gen. Physiol. 21, 745-755
LaUger,P.,Lesslauer,W.,Marti,E. and Richter,J. (1967) Biochim. Biophys. Acta 135,20-32
Lee,A.G. (1976) Nature 262,545-548
Lee,A.G. (1978) Biochim. Biophys. Acta 514, 95-105
Mac0onald,R.C. (1976) Biochim. Biophys. Acta 448:193-198
Mac0onald,R.C., Simon,S.A. and Baer,E. (1976) Biochem. 15, 885-891
Lorrain,P. and Corson,D. (1970) Electromagnetic Feilds and Waves, 2nd. ed., W.H.Freedman and Co.
Marcelja,S. (1974) Biochim. Biophys. Acta 367, 165-176
Marcelja,S. (1976) Biochim. Biophys. Acta 367, 165-176
Mauro,A. (1961) Biophys. J. l, 353-372
Mauro,A. (1962) Biophys. J. 2, 179-198
Mcintosh,T.J. (1978) Biochim. Biophys. Acta 513,43-58
Mclaughlin,S. (1975) "Progress in Anesthesiology" Vl ed. Fink,B.R. Raven Press pp 193-220
Miyamoto,V.K. and Thompson,T.E. (1967) J. Col. Int. Sci. 25, 16-25
244
Montal,M. and Mueller,P. (1972) Proc. Nat. Accad. Sci. USA 69, 3561-3566
Moore,P.B. (1975) in Brookhaven Symp. (Shoenborn,B.P. ed.), Vol. 27, VII 67-74
Mueller,P., Rudin,0.0., Tien,H.T. and Wescott,W.C. (1962) Nature 194, 979-981
Neumcke,B. and Lauger,P. (1969) Biophys. J. 9, 1160-1170
Neumcke,B. Walz, and Lauger (1970) Boiphys. J. 10, 172-182
Nicolson,G.L. (1976) Biochim. Biophys. Acta 457, 57-108
Ninham,B.W. and Parsegian,V.A. (1970) J. Chem. Phys. 53, 3398-3402
0hki ,S. (1968) J. Theoret. Biol. 19, 97-115
0hki ,S. (1970) Biochim. Biophys. Acta 219, 18-27
0hki,S. and Goldup,A. (1968) Nature 217, 458-459
Pagano,R.E.,Rysschaert,J.M. and Miller,I.R., J. Memb. Biol. (1972) 10, 11-30
Pagano,R. and Thompsom,T.E. (1967) Biochim. Biophys. Acta 144, 666-669
Parsegian,A. (1969) Nature 221, 844-846
Parsegian,V.A. and Ninham,B.W. (1969) Nature 217, 1197-1198
Pang, K.Y. and Miller, K.W. (1978) Biochim. Biophys. Acta 511, 1-9
Persson,N.0., Lindblom,G. and Lindman,B. (1974) Chem. Phys. Lipids 12, 261-270
Pillips,M.C. and Finer,E.G. (1974) 356, 199-206
Pope,J.M. and Cornell ,B.A. (1978) Prog. in Surf. Memb. Sci. 12, 183-243
Price,H.D. and Thompson,T.E. (1969) J. Mol. Biol. 41, 443-457
Redwood,W.R. and Haydon,D.A. (1969) J. Theoret. Biol. 22, 1-8
Reiber,H. (1978) Biochim. Biophys. Acta 512, 72-83
Ritchie,J.M. and Greengard,P. (1966) An. Rev. Pharmacol. 6, 405-430
Richards,C.D. (1976) Nature 262, 534
Rosen,D. and Sutton,A.M. (1968) Biochim. Biophys. Acta 163, 226-233
Rosenberg,B. and Bhowmik,B.B. (1969) Chem.Phys.Lipids. 3:109-24
Rosenberg,B. and Jenriasiak,G.L. (1968) Chem. Phys. Lipids 2, 47-54
Sacre,M.M. and Tocanne,J.F. (1977) Chem. Phys. Lip. 18, 334-354
Sandermann,H. (1978) Biochim. Biophys. Acta 515, 209-237
245
Seelig,J. and Seelig,A. (1974) Biochem. 13, 4839-4845
Seelig,J., Gally,H. and Wohlgemuth,R. (1977) Biochim. Biophys. Acta 467, 109-119
Seeman,P. (1972) Pharmacol. Rev. 24, 583-655
Seeman,P. and Roth,S. (1972) Biochim. Biophys. Acta 255, 171-177
Simon,S.A.,Lis,L.J.,MacDonald,R.C. and Kauffman,J.W. (1977) Biophys. J. 19,83-90
Simon,S.A., Stone,W.L. and Busto-Latorre,P. (1977) Biochim. Biophys. Acta 468, 378-388
Simon, S.A., Stone,W.L. and Bennett,P.B. (1979) Biochim. Biophys. Acta 550,38-47
Simons,R. (1968) J. Mol. Biol. 36, 287-288
Singer,S.J. and Nicolson,G.L. (1972) Science 175, 720-731
Smith,J.R. (1977) PhD thesis, university of New South Wales.
Staehelin,L.A. and Arntzen,C.J. (1979) in "Chlorophyll Organization and Energy Transfer in Photosynthesis" Ciba Found. Symp. 61, 147-175
Staiman,A.L. and Seeman,P. (1975) Can. J. Physiol. Pharmacol. 53, 513-524
Stephens,C.L. and Shinitzky,M. (1977) Nature 270, 267-268
Stier,A. and Sackmann,E. (1973) Biochim. Biophys. Acta 311, 400-408
Stockton,G.W. and Smith,I.C.P. (1976) Chem. Phys. Lipids 17, 251-263
Stockton,G.W., Polnaszek,C.F., Tullock,A.P., Hasan,F. and Smith,I.C.P. (1976) Biochem. 15, 954-966
Takagi,M., Azuma,K. and Kishimoto,U. (1965) Ann. Rep. Biol. Works. Fae. Sci. Osaka University 13, 107-110
Taylor,J. and Haydon,D.A. (1966) Disc. Far. Soc 42,51-59
Tien,H.T., Carbone,S. and Dawidowicz,E.A. (1966) Nature 212, 718-719
Tien,H.T. and Dawidowicz,E.A. (1966) J. Col. lnt. Sci 22, 438-453
Tien,H.T. and Diana,A.L. (1967) Nature 215, 1199-1200
Turner,G.L. and Oldfield,E. (1979) Nature 277, 669-670
246
Van Deenen,L.L.M., Demel,R.A., Geurts van Kessel,W.S.M., Kamp,H.H., Reolofsen,B., Verkleij,A.J., Wirtz,K.W.A. and Zwaal,R.F.A. (1976) in The Structural Basis of Membrane Function (Hatefi,Y. and Djadavi-0haniance,L., eds.), pp 21-38 Accedemic Press, New York
Van den Berg,H.J. (1965) J. Mol. Biol. 12, 290-291
Van Zutphen,H. and Van Deenen,L.L.M. (1967) Chem. Phys. Lipids 1, 389-
Waldbillig,R. and Szabo,G. (1978) Nature 272, 839-840
Warren,G.B., Houslay,M.D., Metcalfe,J.C. and Birdsall,N.J.M. (1975) Nature 255, 684-687
Washburn,E.W. ed. (1929) International Critical Tables V6 pp 142-144. (McGraw Hill Book Company).
White,S.H. ( 1970) Biophys. J . l 0 , l 1 2 7 - 11 48
White, S. H. ( 1973) Biochim. Biophys. Acta 323, 343-350
White, S. H. (1974) Biochim. Biophys.Acta 356, 8-16
~Jhite,S.H. (1975) Biophys. J. 15, 95-117
White,S.H. ( 1977) annals N.Y. Acad. Sci. 303, 243-265
White, S.H. (1978) Biophys. J. 23, 337-347
White,S.H., King,G.I. and Cain,J.E. (1981) Nature 290, 161-163
White,S.H.,Petersen,D.C.,Simon,S. and Yafuso,M. (1976) Biophys. J. 16, 481-481
White,S.H. and Thompson,T.E. (1973) Biochim. Biophys. Acta 223, 7-22
Wobschall ,D. (1971) J. Col. Int. Sci. 36, 385-396
Wolfe,J. (1979) PhD thesis, Australian National University
Wolfe,J. and Steponkus, (1981) Biochim. Biophys. Acta 643, 663-668
Worcester,D.L. and Franks,N.P. (1976) J. Mol. Biol. 100, 359-378
247
PUBLICATIONS
During the course of this project some of the material presented in this
thesis has been published in the scientific literature. These were as
follows:
'The Molecular Organisation of Bimolecular Lipid Membranes: The effect
of Cholesterol Inclusion' by R.G. Ashcroft, H.G.L. Coster, D.R. Laver
and J.R. Smith (submitted for publication to Biochimica Biophysica
Acta.)
'The Molecular Basis of Anaesthesia' by H.G.L.
J.R. Smith. In Bioelectrochemistry. Edited by H.
Plenum Press. New York, N.Y. 1980.
Coster, D.R. Laver, and
Keyzer and F. Gutmann.
'Effect of D20/H20 Replacement on the Dielectric Structure of Lipid
Bilayer Membranes' by H.G.L. Coster, D.R. Laver and B.P. Schoenborn.
Biochimica Biophysica Acta (1982) 686, 141-143


