Embed Size (px)
Citation preview
The LivingLandscapeAn Ecological Approach to Landscape Planning
S E C O N D E D I T I O N
FREDER ICK STE INERWith a new preface by the author
ARCHITECTURE / URBAN DESIGN / LANDSCAPE ARCHITECTURE
Praise for the second edition of The Living Landscape
“The Living Landscape offers a thoughtful and excellent examination of how we canunderstand, analyze, and interpret the landscape as interacting physical, biological, andcultural systems. This book is unique because of the emphasis the author places onunderstanding the landscape in terms of relationships among these systems. The LivingLandscape is a useful and timely contribution to the growing body of knowledge on eco-logical planning.”
—Forster Ndubisi, professor and department head, Department of LandscapeArchitecture and Urban Planning, Texas A & M University
“Frederick Steiner demonstrates how an organized and clear model of ecological plan-ning can be a useful tool for planners to deal with projects at different scales and withdifferent natural and human components.”
—Danilo Palazzo, associate professor of urban design, Politecnico di Milano
The Living Landscape is a manifesto, resource, and textbook for architects, landscapearchitects, environmental planners, students, and others involved in creating humancommunities. Since its first edition, published in 1990, it has taught its readers how todevelop new-built environments while conserving natural resources. No other book pre-sents such a comprehensive approach to planning that is rooted in ecology and design.And no other book offers a similar step-by-step method for planning with an emphasison sustainable development. This second edition of The Living Landscape offersFrederick Steiner’s design-oriented ecological methods to a new generation of studentsand professionals.
FREDERICK STEINER is dean and Henry M. Rockwell Chair, School of Architecture,University of Texas at Austin. He is the author of several books, including HumanEcology: Following Nature’s Lead (Island Press, 2002) and The Essential Ian McHarg(Island Press, 2006).
Cover design by Ed Atkeson/Berg DesignCover photo by AVTG, iStockphoto.com
Washington • Covelo • Londonwww.islandpress.orgAll Island Press books are printed on recycled, acid-free paper.
The
Living
Landscap
e
S E C O N DE D I T I O N
Cyan Magenta
Yellow Black 4/c Cyan Magenta
Yellow Black all 4/c
STEINER

ABOUT ISLAND PRESS
Island Press is the only nonprofit organization in the United States whose principal purpose is the publication
of books on environmental issues and natural resource management. We provide solutions-oriented informa-
tion to professionals, public officials, business and community leaders, and concerned citizens who are shap-
ing responses to environmental problems.
Since 1984, Island Press has been the leading provider of timely and practical books that take a multidisci-
plinary approach to critical environmental concerns. Our growing list of titles reflects our commitment to
bringing the best of an expanding body of literature to the environmental community throughout North
America and the world.
Support for Island Press is provided by the Agua Fund, The Geraldine R. Dodge Foundation, Doris Duke
Charitable Foundation, The Ford Foundation, The William and Flora Hewlett Foundation, The Joyce Foun-
dation, Kendeda Sustainability Fund of the Tides Foundation, The Forrest & Frances Lattner Foundation, The
Henry Luce Foundation, The John D. and Catherine T. MacArthur Foundation, The Marisla Foundation, The
Andrew W. Mellon Foundation, Gordon and Betty Moore Foundation, The Curtis and Edith Munson Foun-
dation, Oak Foundation, The Overbrook Foundation, The David and Lucile Packard Foundation, Wallace
Global Fund, The Winslow Foundation, and other generous donors.
The opinions expressed in this book are those of the author(s) and do not necessarily reflect the views of
these foundations.
THE LIVINGLANDSCAPE

THE LIVING LANDSCAPEAn Ecological Approach to Landscape Planning
Second Edition
Frederick SteinerUniversity of Texas at Austin
Washington • Covelo • London
The Living Landscape, Second Edition
© 2008 Frederick Steiner
All rights reserved under International and Pan-American Copyright Conventions. No part of this book may be reproduced in
any form or by any means without permission in writing from the publisher: Island Press, Suite 300, 1718 Connecticut Ave.,
NW, Washington, DC 20009
ISLAND PRESS is a trademark of the Center for Resource Economics.
Steiner, Frederick R.
The living landscape : an ecological approach to landscape planning / Frederick Steiner. — 2nd ed.
p. cm.
Originally published: New York : McGraw Hill, c2000.
Includes bibliographical references and index.
ISBN-13: 978-1-59726-396-2 (pbk. : alk. paper)
ISBN-10: 1-59726-396-6 (pbk. : alk. paper)
1. Land use—Planning. 2. Land use—Environmental aspects. 3. Landscape architecture. 4. Landscape protection. I. Title.
HD108.6.S74 2008
333.73′17—dc22 2007049541
Printed on recycled, acid-free paper
Manufactured in the United States of America
10 9 8 7 6 5 4 3 2 1
Keywords: biodiversity conservation, charrettes, ecological planning, farmland protection, geographic information systems,
growth management, human communities, land conservation, land use planning, landscape architecture, neighborhood plan-
ning, participatory planning, regional planning, site design, suitability analysis, urbanization, watershed planning, wildlife
planning

To Anna

Copyright notices:
Page 9: Excerpt from “Think Little” in A Continuous Harmony, copyright© 1972, 1970 by Wendell Berry, reprinted by permission of HarcourtBrace Jovanovich.
Page 14: Excerpt from Thomas Dunne and Luna B. Leopold, Water in En-vironmental Planning, copyright © 1978 by W. H. Freeman and Com-pany. Used with permission.
Pages 23–24: Excerpt from Charles F. Wilkinson and H. Michael Ander-son, “Land and Resource Planning in National Forests,” Oregon Law Re-view 64(1), 1985. Reprinted by permission. Copyright © 1985 by Univer-sity of Oregon.
Page 30: Excerpt from Richard S. Bolan, “Social Planning and Policy Devel-opment,” in Frank S. So, Israel Stollman, Frank Beal, and David S. Arnold(eds.) The Practice of Local Government Planning, 1979. Reprinted with per-mission of the International City Management Association, 777 N. CapitolSt. N.E., #500, Washington, DC 20002-4201.
Page 34: Excerpt reprinted from Applied Geography, 15, Robert C. deLoe, p. 58, copyright 1995, with permission from Elsevier Science.
Pages 35 and 168: Excerpts from Don A. Dillman, Mail and TelephoneSurveys: The Total Design Method, copyright © 1978 by John Wiley &Sons, New York.
Pages 39 and 353: Excerpts from John Reps, Town Planning in FrontierAmerica. Copyright © 1969 by Princeton University Press.
Pages 39–40: Excerpt from Efraim Gil and Enid Lucchesi, “Citizen Partic-ipation in Planning,” in Frank So, Israel Stollman, Frank Beal, and DavidS. Arnold (eds.) The Practice of Local Government Planning, 1979.Reprinted with permission of the International City Management Asso-ciation, 777 N. Capitol St. N.E., #500, Washington, DC 20002-4201.
Page 52: Excerpt from Fundamentals of Ecology, 3d ed., by Eugene P.Odum, copyright © 1971 by Saunders College Publishing, a division ofHolt, Rinehart & Winston, Inc., reprinted by permission of the publisher.
Page 64: Figure 3.7 from Physical Geology, Richard Foster Flint and BrianJ. Skinner, copyright © 1974, John Wiley & Sons, Inc. Reprinted by per-mission of John Wiley & Sons, Inc.
Page 68: Excerpt reprinted from Landscape Planning, 3d ed., William M.Marsh, copyright © 1983, 1991, 1998, John Wiley & Sons, Inc. Reprintedby permission of John Wiley & Sons, Inc.
Page 103: Figure 3.38 reprinted from Biotic Communities: SouthwesternUnited States and Northwestern Mexico, David E. Brown, ed. CourtesyThe University of Utah Press.
Pages 110 and 170: Excerpts reprinted by permission of the publishersfrom Looking at Cities by Allan B. Jacobs, Cambridge, Mass.: HarvardUniversity Press, copyright © 1985 by the President and Fellows of Har-vard College.
Page 158: Figure 4.3 from Henry C. Hightower, “Population Studies,” inWilliam I. Goodman and Eric C. Freund (eds.) Principles and Practice ofUrban Planning, 1968. Reprinted with permission of the InternationalCity Management Association, 777 N. Capitol St., N.E., #500, Washing-ton, DC 20002-4201.
Page 190: Excerpt from Steven I. Gordon and Gaybrielle E. Gordon, “TheAccuracy of Soil Survey Information for Urban Land-use Planning.”Reprinted by permission of the Journal of the American Planning Associa-tion 47(3): 301–312, 1981.
Page 204: Excerpt from Lewis D. Hopkins, “Methods for Generating LandSuitability Maps: A Comparative Evaluation.” Reprinted by permission ofthe Journal of the American Institute of Planners 43: 386–400, 1977.
Page 217: Excerpt from Devon M. Schneider, David R. Godschalk, andNorman Axler, “The Carrying Capacity Concept as a Planning Tool.”Reprinted with permission from PAS Report No. 338: “The Carrying Ca-pacity Concept as a Planning Tool,” copyright 1978 by the American
Planning Association, 122 S. Michigan Ave., Suite 1600, Chicago, IL60603-6107.
Page 229: Excerpt from Paul Davidoff and Thomas Reiner, “A ChoiceTheory of Planning.” Reprinted by permission of the Journal of the Amer-ican Institute of Planners 28(May): 102–115, 1962.
Page 243: Excerpt from Morris Hill, “A Goals-Achievement Matrix forEvaluating Alternative Plans.” Reprinted by permission of the Journal ofthe American Institute of Planners 34(1): 19–28, 1968.
Page 243: Excerpt from Donald Miller, “Project Location Analysis Usingthe Goals-Achievement Methods of Evaluation.” Reprinted by permis-sion of the Journal of the American Planning Association 46(2): 195–208,1980.
Pages 243–244: Excerpts from Larry Hirschhorn, “Scenerio to Writing: ADevelopmental Approach.” Reprinted by permission of the Journal of theAmerican Planning Association 46(2): 172–183, 1980.
Pages 271–272: Excerpt from William R. Lassey, Planning in Rural Environments, copyright 1977 by McGraw-Hill, Inc. Reprinted with permission.
Pages 325–327: Figures 9.34, 9.35, 9.36, 9.37, 9.38, 9.39 granted with per-mission from A Region at Risk, Robert D. Yaro and Tony Hiss, © RegionalPlan Association, 1996. Published by Island Press, Washington, DC, andCovelo, CA.
Pages 332 and 353: Excerpts from Philip P. Greene, Jr., “Land Subdivi-sion,” and Robert M. Leary, “Zoning,” in William I. Goodman and Eric C.Freund (eds.) Principles and Practices of Urban Planning, 1968. Reprintedwith permission of the International City Management Association, 777N. Capitol St. N.E., #500, Washington, DC 20002-4201.
Page 339: Excerpt from John A. Humphreys, “Breckenridge, Point Sys-tems: Keeping Score” (vol. 55, no. 10, pp. 23–25). Reprinted with permis-sion from Planning magazine, copyright 1985 by the American PlanningAssociation, 122 S. Michigan Ave., Suite 1600, Chicago, IL 60603-6107.
Pages 342–343: Reproduced by permission of the Smithsonian Institu-tion Press from Planning Conservation for Statewide Inventories of CriticalAreas: A Reference Guide (Report Three). Center for National Areas,Smithsonian Institution. © Smithsonian Institution, Center for NaturalAreas, 1974.
Page 367: Excerpt from Stuart M. Butler, “Enterprise Zone Theorist Callsfor Unplanning” (vol. 47, no. 2, p. 6). Reprinted with permission fromPlanning magazine, copyright 1981 by the American Planning Associa-tion, 122 S. Michigan Ave., Suite 1600, Chicago, IL 60603-6107.
Page 373: Excerpt from William Toner, “Saving Farms and Farmlands: ACommunity Guide.” Reprinted with permission from PAS Report No.333: “Saving Farms and Farmlands: A Community Guide,” copyright1978 by the American Planning Association, 122 S. Michigan Ave., Suite1600, Chicago, IL 60603-6107.
Page 390: Excerpt from Frank S. So, “Finance and Budgeting,” in FrankSo, Israel Stollman, Frank Beal, and David S. Arnold (eds.) The Practice ofLocal Government Planning, 1979. Reprinted with permission of the In-ternational City Management Association, 777 N. Capitol St. N.E., #500,Washington, DC 20002-4201.
Page 411: Excerpt from Richard E. Klosterman, “Foundation for Norma-tive Planning.” Reprinted by permission of the Journal of the American In-stitute of Planners 44(1): 37–46, 1978.
Page 412: Excerpt from The City in History copyright © 1961 and re-newed 1989 by Louis Mumford, reprinted by permission of HarcourtBrace Jovanovich.
Page 412: Excerpt from Fremont E. Kast and James E. Rosenzweig, Orga-nization and Management: A Systems and Contingency Approach, copy-right 1974 by McGraw-Hill, Inc. Reprinted with permission.
Page 416: Excerpt use granted with permission from A Region at Risk,Robert D. Yaro and Tony Hiss, © Regional Plan Association, 1996. Pub-lished by Island Press, Washington, DC and Covelo, CA.
CONTENTS
ix
PREFACE TO SECOND EDITION xiii
PREFACE TO FIRST EDITION xvii
ACKNOWLEDGMENTS xix
CHAPTER 1 INTRODUCTION 3
BASIC CONCEPTS 4
THE TRADITIONAL FRAMEWORK OF PLANNING INTHE UNITED STATES 5
A NEW APPROACH 9
ECOLOGICAL PLANNING METHOD 9Step 1: Identification of Planning Problems and
Opportunities 12Step 2: Establishment of Planning Goals 12Step 3: Landscape Analysis, Regional Level 13Step 4: Landscape Analysis, Local Level 14Step 5: Detailed Studies 16Step 6: Planning Area Concepts, Options,
and Choices 18Step 7: Landscape Plan 20Step 8: Continued Citizen Involvement and
Community Education 20Step 9: Design Explorations 21Step 10: Plan and Design Implementation 21Step 11: Administration 23
WORKING PLANS 23
CHAPTER 2 IDENTIFYING ISSUES ANDESTABLISHING PLANNING GOALS 27
TECHNIQUES FOR INVOLVING PEOPLE IN THEIDENTIFICATION OF ISSUES AND THEESTABLISHMENT OF GOALS 28Task Forces 28
Citizens’ Advisory Committees and Technical Advisory Committees 29
Neighborhood Planning Councils 29Group Dynamics 30Nominal- Group Workshops 31Focus Groups 31Delphi 33Policy Delphi 34Public Opinion Polls 35Town Meetings and Public Hearings 38
GOAL SETTING 40
TWO EXAMPLES OF GOAL- ORIENTED PLANNING 41The Oregon Comprehensive Planning Law 41The New Jersey Pinelands Comprehensive
Management Plan 45
CHAPTER 3 INVENTORY AND ANALYSIS OF THE BIOPHYSICALENVIRONMENT 51
MAKING A BASE MAP AND A REGIONAL CONTEXTMAP 53
Major sources of information 55
INVENTORY ELEMENTS 55Regional Climate 56
Summary of regional climate inventory elements 62Major sources of information 62
Earth 62Summary of geologic inventory elements 65Major sources of information 67
Terrain 67Summary of physiography inventory elements 71Major sources of information 71
Water 71Summary of hydrologic inventory elements 85
Major sources of information 85
Soils 86Summary of soils inventory elements 94Major sources of information 95
Microclimate 95Summary of microclimate inventory elements 99Major sources of information 99
Vegetation 99Summary of vegetation inventory elements 104Major sources of information 104
Wildlife 104Summary of wildlife inventory elements 107Major sources of information 107
Existing Land Use and Land Users 107Summary of existing land- use and land- user elements 115Major sources of information 115
ANALYSIS AND SYNTHESIS OF INVENTORYINFORMATION 115Bivariate Relationships 116Layer- Cake Relationships 120The Holdridge Life- Zone System 120
TWO EXAMPLES OF BIOPHYSICAL INVENTORY AND ANALYSIS 122The New Jersey Pinelands Comprehensive
Management Plan 123The Biodiversity Plan for the Camp Pendleton
Region, California 130
CHAPTER 4 HUMAN COMMUNITYINVENTORY AND ANALYSIS 141
SOURCES OF EXISTING INFORMATION 143Land- Use Maps and Settlement Pattern Diagrams 143Histories 145Census Data 148Newspapers and Periodicals 148Phone Books 148Community Organizations and Clubs 149Colleges and Universities 149Government and Public Agencies 149Synopsis of Information Sources 149
USE OF EXISTING DATA TO GENERATE NEWINFORMATION 149Population Trends, Characteristics, and
Projections 150Trends 150Characteristics 153Projections 153
Development Projections 159Economic Analyses 161User Groups 165
GENERATION OF NEW INFORMATION 167Mail and Telephone Surveys 167Face- to- Face Interviews 169Participant Observation 170
ANALYSIS AND SYNTHESIS OF SOCIALINFORMATION 171Establish Visual and Landscape Patterns 171Urban Morphology 173Identification of Interactions and Relationships 173Community Needs Assessment 175
TWO EXAMPLES OF HUMAN COMMUNITYINVENTORY AND ANALYSIS 176New Jersey Pinelands Comprehensive
Management Plan 176The Biodiversity Plan for the Camp Pendleton
Region, California 178
CHAPTER 5 SUITABILITY ANALYSIS 187
APPROACHES TO SUITABILITY ANALYSIS—METHODS 188Natural Resources Conservation Service Systems 188
Land Evaluation Value 191Site Assessment Value 192Combining the LE and SA Systems 194Modified LESA System 194Use of LESA at the Federal Level 198
The McHarg, or University of Pennsylvania, SuitabilityAnalysis Method 200
Dutch Suitability Analysis 207
COMPUTER APPLICATIONS 213
THE CARRYING- CAPACITY CONCEPT 217
TWO APPLICATIONS OF SUITABILITY ANALYSIS 219The Development of Performance Requirements in
Medford Township, New Jersey 219Locating Areas for Rural Housing in Whitman
County, Washington 220
CHAPTER 6 PLANNING OPTIONS AND CHOICES 229
OPTIONAL PLANS 230
TECHNIQUES FOR SELECTING PREFERENCES 235The Charrette 235
The Charrette Process 236Charrette Groundwork 237Introduction to Planning Area, Introduction
to Participants 237The Teams 238Team Instructions 240Citizen Interviews 240Brainstorming and Synthesis 240Outcomes from the Charrette 241
Task Forces, Citizens’ Advisory Committees, andTechnical Advisory Committees 241
Citizen Referendum and Synchronized Surveys 242Goals- Achievement Matrix 243Scenario Writing 243Public Hearings 244
xCONTENTS
TWO EXAMPLES OF SELECTING PREFERENCES 245Portland, Oregon, Alternative Land- Use Plans 245The Biodiversity Plan for the Camp Pendleton Region,
California 247
CHAPTER 7 LANDSCAPE PLANS 253
RECOGNITION AND ADOPTION OF PLAN 255
STATEMENT OF POLICIES 257
STRATEGIES TO ACHIEVE POLICIES 259
LANDSCAPE PLAN MAP 260
PLAN ELEMENTS AND ORGANIZATION 261
TWO EXAMPLES OF PLANS 264Comprehensive Management Plan for the New Jersey
Pinelands 264Teller County/City of Woodland Park, Colorado, Growth
Management Plan 266
CHAPTER 8 CONTINUING CITIZENINVOLVEMENT ANDCOMMUNITY EDUCATION 271
CITIZEN INVOLVEMENT 272
CLASSIFICATION OF CITIZEN PARTICIPATIONTECHNIQUES 274
CONTINUING COMMUNITY EDUCATION 275Information and Education 275Publications 277Television and Radio 278
TWO EXAMPLES OF EDUCATION PROGRAMS 279University of Wisconsin–Extension Community
Economic Development Program 279The Blueprint for a Sustainable Bay Area 285
CHAPTER 9 TESTING PLANNING CONCEPTSTHROUGH DESIGN 291
SITE DESIGN 292
INDIVIDUAL LAND- USER DESIGNS: FARM ANDRANCH CONSERVATION PLANS 293
SIMULATION 295
CONCEPTUAL DESIGN FROM CHARRETTES 296La Lomita Charrette 298Common Themes from the La Lomita Charrette 298
Building Codes 299Community Gardens 300Housing Possibilities 300Solar Energy 300
Arroyo Vista Charrette 301
CONCEPTUAL DESIGN OF NEW FACILITIES 304The Concept Design 305
Phase 1 305Phase 2 308
Summary of the Concept Design 310
DEMONSTRATION PROJECTS 311
INNOVATIVE DESIGN PROJECTS 314
TWO EXAMPLES OF DETAILED DESIGN 317Connecticut River Valley, Massachusetts 317New York–New Jersey–Connecticut Metropolitan
Region 321
CHAPTER 10 PLAN AND DESIGNIMPLEMENTATION 329
POWER TO REGULATE 330Zoning 330Planned Unit Developments (PUDs) 334Performance Standards 334Design Guidelines and Controls 339Critical or Environmentally Sensitive Areas 339Floodplain Management 344Wetland and Riparian Area Protection 346
Federal Wetlands Protection 347General State Responses 348
Habitat Conservation Plans 349Historic Preservation 352Subdivision Regulations 353Building Codes 355Covenants 357
POWER TO CONDEMN AND TO EXACT 358Impact Fees and Land Dedications 358
POWER TO SPEND 359Easements 359Development Rights Purchase and Transfers 360Capital Improvement Programming 364Public Land Management 365
POWER TO TAX 366
INTERAGENCY COORDINATION FOR GROWTHMANAGEMENT 367
PROGRAM LINKAGE AND CROSS- COMPLIANCE 369
NONGOVERNMENTAL STRATEGIES 369
DESERT VIEW TRI- VILLAGES IMPLEMENTATION 370Desert Overlay 370Suburban Desert Overlay 371
IMPLEMENTATION MATRIX 371
THREE EXAMPLES OF PLANNING IMPLEMENTATION 373Innovative Zoning for Agricultural Land Protection
in York County, Pennsylvania, and Black Hawk County, Iowa 373
xiCONTENTS
Scottsdale, Arizona, Environmentally Sensitive LandsOrdinance 377
CHAPTER 11 ADMINISTRATION OFPLANNING PROGRAMS 381
CURRENT PLANNING 382The Role of Planning Commissions and
Review Boards 382The Role of Planning Staffs 383The Impact of Procedural Requirements 385
THE BUDGET 385Planning, Programming, and Budget System
(PPBS) 385Program Strategies 387Capital Improvement Programming 390
ENVIRONMENTAL IMPACT ASSESSMENTS 391Environmental Impact Analysis 394Economic Impact Analysis 396
Fiscal Impact Analysis 399Social Impact Analysis 402
TWO EXAMPLES OF PLANNING ADMINISTRATION 404Portland, Oregon, Regional Growth Management
Planning 404The Tucson WASH Ordinance and Environmental
Resource Zone 407
CHAPTER 12 CONCLUSION 411
APPENDICES 419
GLOSSARY 425
ACRONYMS 437
BIBLIOGRAPHY 439
INDEX 459
xiiCONTENTS
PREFACE TO SECOND EDITION
xiii
Communities in the United States and around the
world face dramatic change in the twenty-first cen-
tury, driven largely by population dynamics and
consumption, urbanization, and global and regional
environmental processes. We know, for instance, cli-
mate is changing globally and locally. How land and
other resources are used and consumed influence
those climatic changes.
Population growth and migration will change
the demographic structure of the planet. At the be-
ginning of the twentieth century, our planet was
home to some 2 billion inhabitants. Currently, over
6.6 billion people live on Earth. The United Nations
projects the world’s population to plateau at 9.4 bil-
lion by the year 2050, then creep up to 10.4 billion
by 2100.
On Tuesday, October 17, 2006, the United States
welcomed our 300,000,000th resident. Our popula-
tion is growing both naturally and through immi-
gration. We expect to reach 400 million people in
2043, if current trends continue.
We live in the first urban century. For the first time
in human history, half of the world’s population live
in metropolitan regions. In the future, even more
people will move to cities. Global urban populations
are expected to double by 2030. By 2050, two-thirds
of the people in the world will be living in urban re-
gions. The movement of people to cities and metro-
politan regions involves the transformation of spaces
from rural and natural to urban and suburban, the
urbanization of the wild, the abandonment of the
rural, and the recovery of older urban neighbor-
hoods. Here are some key questions related to both
population growth and urbanization:
• Why do people choose to live where they do?
• What policies direct/affect growth and devel-
opment?
• What are the long-term impacts of these poli-
cies?
• What knowledge is necessary to inform inter-
ventions designed to mitigate those impacts?
Various new technologies increase our ability to
connect with each other and with vast amounts of
information. New connecting networks and infor-
mation systems will alter landscapes and communi-
ties, the transfer of knowledge, time, social relation-
ships, and education. Connecting technologies—the
automobile and the Internet—may also divide peo-
ple and, thus, further fragment landscapes and com-
munities. We constantly attempt to connect through
information and transportation technologies. Con-
nectivity will continue to transform human society,
but how? Some queries we could use to find answers
are the following:
• What will cities look like when people do not
have to be close to each other for commercial
reasons?
• How will business, educational, and public in-
stitutions be affected?
• How will connectivity affect use, knowledge,
experience, and perception of our built envi-
ronments?
Questions like these are being addressed by re-
searchers in various disciplines. There is not a lack
of attention to the questions, but cohesiveness in
providing the answers is missing. The planning pro-
fession can bring threads together from different
disciplines in ways that other professions cannot.
Planning is based on linking knowledge from di-
verse fields to action. Plans, however, need to be re-
alized and this can be accomplished creatively by ar-
chitects and landscape architects.
Global environmental processes also drive land-
scape changes and adaptations. Climate-change
trends are well known. Increased carbon dioxide in
the atmosphere changes rainfall, cloudiness, wind
strength, and temperature. For example, these
changes already influence the life cycles of polar
bears in the Arctic; cause small islands to disappear
in the South Pacific, as the calamities of nature in-
crease; and, with less and less cloud cover to support
moisture-dependent species, cause rain forest island
habitats around mountaintops in Costa Rica to de-
crease in area annually.
In addition to global climate changes, local cli-
mates are changing as regions undergo urbaniza-
tion and suburbanization. The urban heat island ef-
fect results as more surfaces are paved over. As we
learn more about such drivers from the global to
local scales, we can adjust our city and regional
plans and community designs to mitigate deleteri-
ous consequences, while taking strategic advantage
of opportunities.
We are biological creatures who depend on the
living landscape to sustain us. We interact with each
other and with our physical environments. Plants
and animals are affected by our actions, and our ex-
istence is impacted by plants and animals. We exist
within complex sets of interactions—that is, we live
in an ecological world.
Learning to perceive the world as a never-ending
system of interactions—that is, to think about our
surroundings and our relationships with our envi-
ronments and each other ecologically—is challeng-
ing. Such perceptions force us to rethink our views
of economics, politics, and business. It suggests dif-
ferent ways to plan and design communities and re-
gions. In economics, for example, an ecological view
suggests a much more complex set of relationships
than supply and demand: supply of what, from
where, and at what cost, not only in dollars but in
relation to other species and other generations.
This book is intended for planners, architects,
landscape architects, and others engaged in creating
human communities. My thesis is that we can learn
from our natural surroundings to plan for change.
In doing so, we can create more livable built envi-
ronments while protecting natural environments.
Landscapes, as a synthesis of human and natural
processes, provide an ideal scale for such planning.
Henry David Thoreau observed that “the earth
was the most glorious instrument, and I was audi-
ence to its strains.” Those concerned with planning
have a responsibility to play that instrument with
care and precision. I hope that The Living Landscape
will help in this quest.
Guide to the Second Edition
Throughout this edition, I have updated informa-
tion and expanded sections. For example, I have ex-
xivPREFACE
panded the discussions of regional-level landscape
inventories and the takings/givings issue. Scant in-
formation about geographic information systems
(GIS) was included in the first edition; this edition
includes many GIS examples. Two additional tech-
niques for citizen participation, policy Delphi and
focus groups, are introduced, while charrettes re-
ceive more attention. Other new or expanded topics
include urban morphology, remote sensing, design
guidelines, floodplain management, wetlands and
riparian area protection, habitat conservation plans,
and historic preservation.
Frederick Steiner
Austin, Texas
June, 2007
xvPREFACE

PREFACE TO THE FIRST EDITION
xvii
Two fundamental reasons to plan are to influence
equitable sharing among people and to ensure the
viability of the future. Because we cannot function
by ourselves, each of us is required to share time and
space. Sharing is necessary for the well-being of our
neighbors and of future generations. This book is
about a specific kind of planning; it is about how to
share physical space in communities.
The rather abstract notion of human spatial or-
ganization manifests itself in the use of land. But the
term land use oversimplifies the organization of hu-
man communities. Landscape I find to be a better
word. Working with landscapes, planners can begin
to understand the connectivity of settlement pat-
terns and functions over time and space. The lines
between urban and rural as well as between natural
and cultural have become blurred, if indeed such
lines were ever clear. With the intermixing of the
distinctions between urban/rural and natural/cul-
tural, understanding landscapes from a spatial,
functional, and dynamic perspective becomes a key
to balancing conflicting uses of land, water, and air.
The landscapes of this planet need help. Con-
flicts over the use of land and about environmental
and social degradation abound. Complex and often
seemingly contradictory questions must be ad-
dressed: Where should new communities be lo-
cated? How do new community developers accom-
modate housing that is affordable? Can new com-
munities be designed that are safe, healthy, and
beautiful? How can existing communities be revital-
ized and restored? Where can new development and
open space be located in the existing built-up areas
of metropolitan regions? Can we dispose of our haz-
ardous and solid waste in a responsible manner?
What about the alternatives of recycling our waste
or simply using fewer hazardous products? How do
we protect prime agricultural areas in urbanizing
regions?
Agriculture and urban uses often conflict, as do
many old and new uses—retirement communities
and mining, tourism and timber harvesting. Must
such old and new uses always conflict? People often
move to suburban and rural areas for open space and
recreational amenities. In addition to causing prob-
lems for existing inhabitants, the new land uses
created by the new residents often disrupt wildlife
habitats and other environmentally sensitive areas.
How do we plan open space that will allow both
recreational uses and wildlife habitat? Sometimes
new land uses are sited in areas that are susceptible
to natural hazards. Can we use our growing knowl-
edge about earthquakes, forest fires, hurricanes, and
flooding to direct human uses to the safest locations?
In seeking to address these questions, it is tempt-
ing to adopt a global perspective. Certainly many
issues that prompt these questions exist internation-
ally. But, because the legal, political, economic, and
cultural forces vary widely from nation to nation, I
have chosen to focus on planning in the United
States. The citizens of the United States share a com-
mon boundary and cultural heritage with Canadi-
ans. Canada made many advances in environmental
planning during the 1980s, when the national lead-
ership in the United States retreated from environ-
mental concerns. Because I have been influenced by
Canadian policy and because several Canadian col-
leagues have read and reviewed portions of this
book in its manuscript form, I hope that some
Canadians may find it useful for their work. I also
hope that my international work filters through the
pages that follow. The focus, however, is on the
United States.
Americans seem to have an especially difficult
time sharing when it comes to the land. We have set
aside spectacular natural landscapes, but we despoil
other beautiful places with garish signage, trash, and
just plain ugly buildings. We Americans produce
garbage at an unequaled pace, yet resist the location
of waste dumps in our neighborhoods. We seek to
live in the countryside but, once we settle in a rural
area, try to prevent farmers from continuing their
normal, sometimes dirty and smelly, activities. We
do not want the government to tell us what to do
with our land, but we seek help from the govern-
ment in times of natural disaster. We want our
neighborhoods to be squeaky clean but turn our
backs to poor people who live in substandard hous-
ing, or in trailers, or on the street.
To more fairly share the bounty of natural re-
sources in the United States, we must ask: Who suf-
fers and who benefits from our decisions? In making
and adopting public policy, we must analyze who
benefits and who pays for the decisions that elected
leaders make. This book presents a framework for
presenting information to decision makers. The
preparation of the book grew out of my need to ex-
plain the planning process to my students. Most of
these students have pursued degrees in planning,
landscape architecture, and environmental science,
but they and I have been enriched by others from
geography, architecture, soil science, forestry, civil
engineering, business, and sociology. Although
written by a teacher, the book is based on my experi-
ence as a practitioner and researcher. Through my
practical experience and research, I have sought to
plan for places that are fit, adaptable, and delightful.
Planning is more than a tool or a technique; it is
a philosophy for organizing actions that enable peo-
ple to predict and visualize the future of any land
area. Moreover, planning gives people the ability to
link actions on specific parcels of land to larger re-
gional systems. It is up to us to plan with vision. Our
responsibility is to retain what we treasure, because
we are merely guests on those spaces of the Earth
that we inhabit. We should leave good impressions
about our visit.
Frederick Steiner
Tempe, Arizona, 1990
xviiiPREFACE TO THE FIRST EDITION
ACKNOWLEDGMENTS
xix
There are several colleagues at Washington State
University (WSU), the University of Colorado at
Denver, and Arizona State University (ASU) who
have supported my work and have offered helpful
advice and criticism. Those most helpful in the
completion of the first edition were Bill Budd,
Hamid Shirvani, Paul Rasmussen, Jack Kartez, Mack
Roberts, Tom Bartuska, Don Satterlund, Yuk Lee,
Lois Brink, Lauri Johnson, Peter Schaeffer, and Ken
Struckmeyer. I owe much to my former students in
landscape architecture, regional planning, and envi-
ronmental science at WSU and Colorado. Donna
(Hall) Erickson, George Newman, Doug Osterman,
and John Theilacker stand out as four to whom I
owe the greatest debts for the first edition.
I studied planning at the University of Pennsyl-
vania and was influenced by several of Penn’s fine
planning and design faculty, especially Ann Strong,
John Keene, Jon Berger, Dan Rose, Art Johnson, and
Robert Coughlin. The late Ian McHarg was a won-
derful mentor and is an enduring inspiration. Le -
nore Sagan is a constant, steady influence within the
Penn community, and I value her sage, maternal
guidance through the ivy walks and city streets of
Philadelphia.
Several Dutch friends have influenced my think-
ing about landscape planning, especially Ingrid
Duchhart, Hubert van Lier, Meto Vroom, and the
late Nico de Jonge of the Dutch Agricultural Univer-
sity, Wageningen. They know much about green
fields below dark skies and hope in new worlds.
I benefited greatly from the helpful criticisms by
Elizabeth Watson and Sam Stokes on a draft of the
manuscript for the first edition. Others who have
contributed to my ideas in one way or another in-
clude Mark Lapping, Lloyd Wright, Max Schnepf,
Ron Eber, Chuck Little, Bill Toner, Lee Nellis, War-
ren Zitzmann, Cecily Corcoran Kihn, J. Glenn Eug-
ster, Jean Tarlet, Christine Carlson, Dennis Canty,
Larry Larsen, Kip Petersen, and Terri Morrell.
Typing of the manuscript for the first edition
was done by various people including Brenda
Stevens, Angela Briggs, Gail Rise, Telisa Swan, Nita
Thomas, Jane Bower, Doris Birch, and Penn Clerical
Services of Philadelphia. The final version of the
first edition was typed by Pam Erickson and Kathy
Saykally of the School of Architecture and Planning,
University of Colorado at Denver. I thank them for
preparing that manuscript in its final form.
The first- edition illustrations were completed by
a number of people, including Lonnie Kennedy,
Mark Woods, Gary McMath, Brandon Burch, Clint
Keller, Christine Carlson, Doug Osterman, Louis
Burwell, Chuck Watson, Brad Nelson, Richard
Van De Mark, Brad Pugh, Gary Christensen, Eliza-
beth Slocum, Joseph Bell, and Gretchen Schalge. I
appreciate their diligence and hard work. I also
thank the many others who allowed me to use their
illustrations and photographs and to quote from
their work. Robert Yaro and Chris Reid, then with
the Center for Rural Massachusetts; Martin Bier-
baum and Michael Neuman, then with the New Jer-
sey Office of State Planning; George Bowechop of
the Makah Tribal Council, as well as the council’s
planning consultant, Chuck Warsinske; Annemarie
and Hans Bleiker of the Institute for Participatory
Management and Planning in Monterey, California;
the New Jersey Pinelands Commission; and the late
Narendra Juneja were especially generous. Philip
Maechling’s photographs help portray the essence
of the living landscape and made an invaluable con-
tribution to the first edition for which I am grateful.
I would also like to thank the following review-
ers for their many helpful comments and sugges-
tions on the manuscript that led to the first edi-
tion: Nicholas Dines, University of Massachusetts;
Patrick Mooney, The University of British Colum-
bia; and William Shepherd, Virginia Polytechnic In-
stitute and State University.
Four friends have had a substantial influence on
the original edition, each in their distinct way, and
have made an enduring contribution to this version
as well. They are Joanne Barnes Jackson, Jerry
Young, Ken Brooks, and Bill Wagner. I am grateful to
each of them in many ways. In addition, I am in-
debted through their published works to the pio-
neers in ecological planning—Patrick Geddes, Aldo
Leopold, Lewis Mumford, Benton MacKaye, Artur
Glikson, and G. Angus Hills.
I incurred many debts in writing the original ver-
sion. I have accumulated many more in the process
of revision. Carl Steinitz and the U.S. Environmental
Protection Agency were generous in providing per-
mission for the Camp Pendleton study. Professor
Steinitz’s comments, suggestions, and criticisms
were especially insightful. He and Allan Shearer of
Harvard University were helpful with the Camp
Pendleton maps and illustrations. Kurt Bauer offered
excellent recommendations—and a wealth of histor-
ical knowledge—about planning in southwestern
Wisconsin. The following individuals provided valu-
able assistance to update information about specific
examples (including a few that were edited out be-
cause of space limitations): Ron Eber, Rob Ribe, and
Ethan Seltzer (Oregon and Portland); Chuck War -
sinske (the Makah Reservation); Peter Pollock
(Boulder, Colorado); Kip Petersen (Teller County,
Colorado); George Newman (Snohomish County,
Washington); Ron Shaffer (University of Wisconsin–
Extension); Bill Hendrix (Palouse Path); Judith Kari-
nen (West Colfax Avenue, Colorado); and Willie Flu-
cos (Dayton, Ohio).
My ASU students have contributed much, as did
their predecessors at my previous universities. For-
mer ASU students who were especially influential
for this edition include Jim McCarthy, Michael
Collins, Kate Goodrich, Scott Davis, Ross Cromarty,
Kim Shetter, Donna Issac, Michael Rushman, Bill
Kasson, John Blair, Jeff Schmidt, Susan Jackson,
Ginny Coltman, Elisa Corcuera, Joaquin Maruffo,
Allyce Hargrove, Scott Pieart, Bill Whitmore, John
Leach, and Carlos Licón. Zitao Fang helped compile
data for several tables in Chapter 4. Lizi McGeorge, a
visiting student from Australia, helped organize the
North Sonoran charrette and provided much useful
information about charrettes.
At ASU, I am fortunate to be in an interdiscipli-
nary School of Planning and Landscape Architec-
ture in a multidisciplinary College of Architecture
and Environmental Design. I benefit greatly work-
ing with colleagues from planning, landscape archi-
tecture, and environmental resources within the
School of Planning and Landscape Architecture.
In particular, I appreciate the ideas of Professor
Laurel McSherry with whom I cotaught an environ-
mental planning studio. It is not easy to teach with
the school director, because there are many inter-
ruptions and distractions. Laurel’s good humor
made teaching the studio a joy. She also influenced
how I view and represent landscapes. David Pijawka
was a valued mentor on the subject of sustainability,
and I enjoy our work together. He is a most gener-
xxACKNOWLEDGMENTS
ous and valued colleague. I collaborated with several
ASU colleagues on a series of studies in northern
Phoenix, notably Joe Ewan and Rebecca Fish Ewan.
They were generous in providing maps of their wash
studies and preserve plans. I especially appreciate
the contributions of Jim Burke, Ward Brady,
William Miller, Jana Fry, Michael Collins, Nancy
Osborne, and Jack Gilcrest to the geographic infor-
mation systems maps of north Phoenix included in
this book. Excellent comments were provided on
drafts of this edition by Ramon Arrowsmith, Tony
Brazel, John Brock, James Burke, Theresa Cameron,
Ash Campbell, Jeffrey Cook, Katherine Crewe, Ron
Faas, Joseph Ewan, Rebecca Fish Ewan, Grady Gam-
mage, Douglas Green, Subhro Guhathakurta, John
Keane, Mary Kihl, Hubert van Lier, Lynn Miller, Lee
Nellis, Jolene Ostler, Ray Quay, Michael Rushman,
Max Underwood, and Bob Yaro. Mookesh Patel of
the ASU School of Design helped significantly with
the consistency of the illustrations. Others who have
made contributions in various ways include Dick
Eribes, Julie McQuary, Gerald McSheffrey, Alvin
Mushkatel, Nan Ellin, Richard Lai, Ignacio San Mar-
tin, Ted Cook, Gary Whysong, and Ruth Yabes.
A group of us at ASU joined with colleagues
from the City of Phoenix, the State of Arizona, and
several firms to form the North Sonoran Collabora-
tive. Since 1994, our informal, interdisciplinary col-
laborative has produced studies and plans and orga-
nized charrettes for the northern Phoenix area. The
concept for the collaborative was Ray Quay’s, the as-
sistant planning director. Other city leaders of the
group include Jim Burke, Jolene Ostler, and Dean
Brennan. Urban wildlife specialist Joe Yarkin pro-
vided leadership among the state agencies.
I particularly value the mentorship of Dean John
Meunier. He provided unwavering encouragement
for the multidisciplinary environmental planning
mission of our school. I am also grateful to Dean
Meunier for his support, as well as that of my col-
leagues and of Arizona State University, for a sabbat-
ical leave. I spent much of the sabbatical in Rome en-
gaged in preparing this second edition as well as
other writing projects. In this regard, I thank the
American Academy in Rome and the National En-
dowment for the Arts. I was fortunate to receive the
National Endowment for the Arts Rome Prize Fel-
lowship in Historic Preservation and Conservation,
which enabled me to be in Italy during my sabbatical.
Italy provided an ideal setting for writing this edi-
tion. The translators of the Italian edition asked es-
pecially probing, thoughtful questions, which influ-
enced my approach to rewriting the book. I am
inspired by Maria Cristina Treu’s ecological plans for
Italian provinces and Danilo Palazzo’s comprehen-
sive review of American environmental planning.
Ornella Piscopo of the University of Rome was a val-
ued source of knowledge on the carrying capacity
concept and its possible implications for planning.
Many individuals provided advice and sugges-
tions on the original edition, which were incorpo-
rated into this version. In particular, Donna Erick-
son, Joan Woodward, and Forster Ndubisi have
influenced the ways I approach planning and have
made numerous suggestions about how to improve
this book. I welcome the reader’s criticisms on this
edition, because I see it as a living document.
Since 1993, I have been most fortunate to work
with Chris Duplissa: a writer could wish for no bet-
ter word processor. Not only does she not make typ-
ing errors, Chris adds a critical understanding to the
projects she undertakes, contributing much to the
quality in the process. Other staff keep the ASU
School of Planning and Landscape Architecture
functioning well, for which I am thankful, especially
Dena Marson, Stefani Angstadt- Leto, and Sasha
Valdez.
I appreciate the support of many McGraw- Hill
staff in undertaking the second edition, especially
Wendy Lochner and Robin Gardner. B. J. Clark and
Jean Akers of McGraw- Hill were responsible for the
first edition and their contributions were numerous.
My deepest gratitude is for my family. Anna,
Halina, and Andrew provide the love and support
that makes this work possible.
xxiACKNOWLEDGMENTS


THE LIVINGLANDSCAPE
1INTRODUCTION
3
Conventionally the planning process is presented as a linear progression of activi-
ties. Decision making, like other human behavior, seldom occurs in such a linear,
rational manner. Still, it is a logical sequence of activities and presents a convenient
organizational framework. The common steps in the process include the identifica-
tion of problems and opportunities; the establishment of goals; inventory and
analysis of the biophysical environment, ideally at several scales; human commu-
nity inventory and analysis; detailed studies like suitability analysis; the develop-
ment of concepts and the selection of options; the adoption of a plan; community
involvement and education; detailed design; plan implementation; and plan ad-
ministration. This book is organized around these conventional topics—but with
an ecological perspective. The chapters that follow cover most of the steps in the
process.
Each chapter includes a “how-to” section for accomplishing the pertinent step,
and a few examples where such activities have been successfully undertaken. For
many of the chapters, various planning efforts undertaken in northern Phoenix,
Arizona, are used to illustrate each step. The author has
been involved in the Phoenix planning work for the
past decade. Because this work is largely on the subur-
ban fringe, and because ecological planning is also use-
ful for more urban and rural areas, several additional
prototypical efforts have been selected to illustrate the
principles described and to compare them with the
more conventional approaches to planning.
Before discussing each step, it will be helpful to first
define a few key terms. It will then be necessary to pro-
vide a brief overview of traditional planning in the
United States. The ecological planning method, the
subject of this book, can then be described and the dif-
ference of its approach better understood.
Basic Concepts
Planning has been defined as the use of scientific,
technical, and other organized knowledge to pro-
vide options for decision making as well as a process
for considering and reaching consensus on a range
of choices. As John Friedmann (1973) has succinctly
put it, planning links knowledge to action. There is a
difference between project planning and compre-
hensive planning. Project planning involves design-
ing a specific object such as a dam, highway, harbor,
or an individual building or group of buildings.
Comprehensive planning involves a broad range of
choices relating to all the functions of an area. Reso-
lution of conflicts, often through compromises, is
the inherent purpose of comprehensive planning.
Environment refers to our surroundings. Environ-
mental planning is “the initiation and operation of
activities to manage the acquisition, transformation,
distribution, and disposal of resources in a manner
capable of sustaining human activities, with a mini-
mum distribution of physical, ecological, and social
processes” (Soesilo and Pijawka 1998, 2072).
Management has been defined as the judicious
use of means to accomplish a desired end. It involves
working with people to accomplish organizational
goals. For practical purposes, many see the distinc-
tion between planning and management as largely
semantic. The management of resources, such as
land, may be a goal of a planning process. Con-
versely, planning may be a means of management.
Ecosystem management is the deliberate process of
understanding and structuring an entire region
with the intention of maintaining sustainability and
integrity (Slocombe 1998a, 1998b).
Land use is a self-defining term. One can debate
whether a harbor involves land use or water use, but
“land” generally refers to all parts of the surface of
the earth, wet and dry. The same area of that surface
may be used for a variety of human activities. A har-
bor, for instance, may have commercial, industrial,
and recreational purposes. A farm field may be used
for speculation and recreation as well as for agricul-
ture. All human activity is in one way or another
connected with land.
Landscape is related to land use. The composite
features of one part of the surface of the earth that
distinguish it from another area is a landscape. It is,
then, a combination of elements—fields, buildings,
hills, forests, deserts, water bodies, and settlements.
The landscape encompasses the uses of land—hous-
ing, transportation, agriculture, recreation, and nat-
ural areas—and is a composite of those uses. A land-
scape is more than a picturesque view; it is the sum
of the parts that can be seen, the layers and intersec-
tions of time and culture that comprise a place—a
natural and cultural palimpsest.
The English word ecology is derived from the
Greek word for house, oikos. The expanded defini-
tion is the study of the reciprocal relationships of all
organisms to each other and to their biotic and
physical environments (Ricklefs 1973). Obviously,
humans are organisms and thus are engaged in eco-
logical relationships.
The use of ecological information for planning
has been a national policy since late 1969, when the
U.S. Congress, through the National Environmental
4CHAPTER 1
5INTRODUCTION
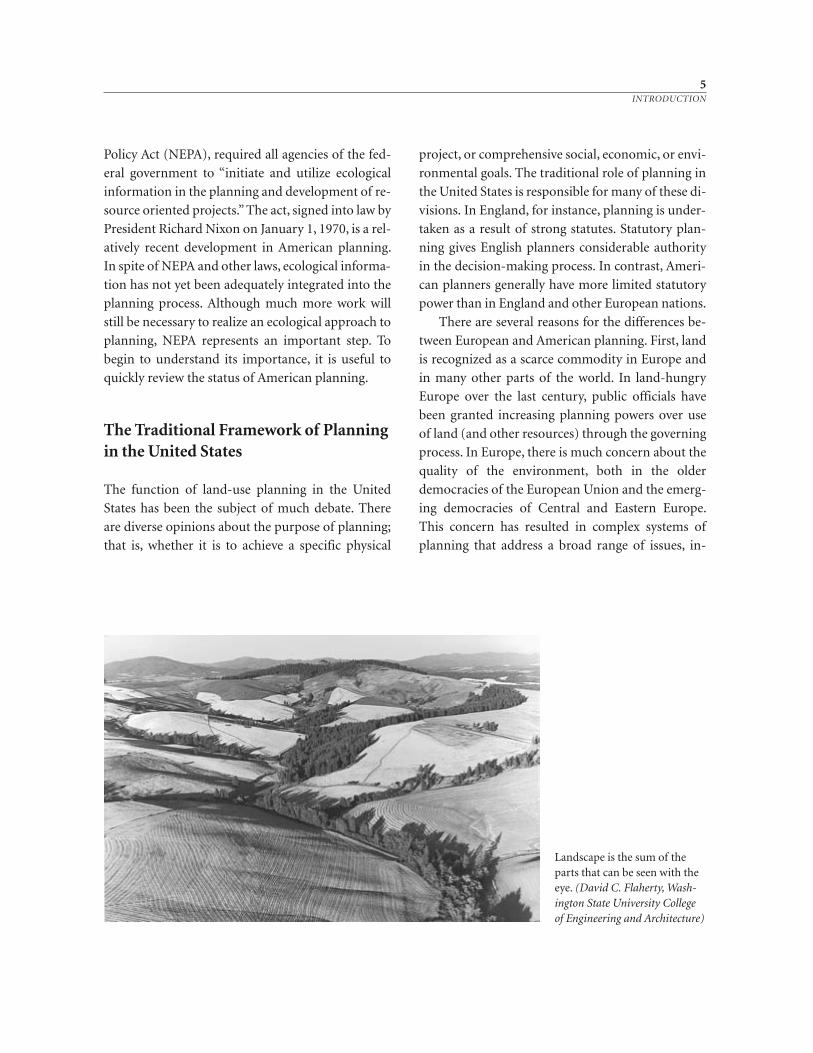
Landscape is the sum of theparts that can be seen with theeye. (David C. Flaherty, Wash-ington State University Collegeof Engineering and Architecture)
Policy Act (NEPA), required all agencies of the fed-
eral government to “initiate and utilize ecological
information in the planning and development of re-
source oriented projects.” The act, signed into law by
President Richard Nixon on January 1, 1970, is a rel-
atively recent development in American planning.
In spite of NEPA and other laws, ecological informa-
tion has not yet been adequately integrated into the
planning process. Although much more work will
still be necessary to realize an ecological approach to
planning, NEPA represents an important step. To
begin to understand its importance, it is useful to
quickly review the status of American planning.
The Traditional Framework of Planningin the United States
The function of land-use planning in the United
States has been the subject of much debate. There
are diverse opinions about the purpose of planning;
that is, whether it is to achieve a specific physical
project, or comprehensive social, economic, or envi-
ronmental goals. The traditional role of planning in
the United States is responsible for many of these di-
visions. In England, for instance, planning is under-
taken as a result of strong statutes. Statutory plan-
ning gives English planners considerable authority
in the decision-making process. In contrast, Ameri-
can planners generally have more limited statutory
power than in England and other European nations.
There are several reasons for the differences be-
tween European and American planning. First, land
is recognized as a scarce commodity in Europe and
in many other parts of the world. In land-hungry
Europe over the last century, public officials have
been granted increasing planning powers over use
of land (and other resources) through the governing
process. In Europe, there is much concern about the
quality of the environment, both in the older
democracies of the European Union and the emerg-
ing democracies of Central and Eastern Europe.
This concern has resulted in complex systems of
planning that address a broad range of issues, in-
cluding housing, recreation, aesthetics, open space,
and transportation.
Another reason emerges from the origins of the
United States. Thomas Jefferson and the other
founding fathers were influenced strongly by John
Locke, who viewed the chief end of establishing a
government as the preservation of property. Locke,
in his Two Treatises of Government, defined property
as “lives, liberties, and estates” (Laslett 1988). Else-
where, Locke wrote of the “pursuit of happiness.” It
was Jefferson who combined Locke’s terms, “life, lib-
erty, and the pursuit of happiness.” But it has been
the view of property as possession, rather than
Locke’s predominant version—life, liberty, and es-
tate—that has prevailed. The constitution of the
Commonwealth of Pennsylvania states in Article 1,
Section 1, that “all . . . men have certain inherent
and indefeasible rights, among which are those of
enjoying and defending life and liberty, of acquir-
ing, possessing and protecting property.” And the
Fifth Amendment of the U.S. Constitution contains
this clause: “No person shall . . . be deprived of life,
liberty, or property, without due process of law; nor
shall private property be taken for public use with-
out just compensation.” To those in the new repub-
lic, who had fought against the landed elite of the
mother country, property rights were seen as a fun-
damental freedom.
The Bill of Rights institutionalized the founding
fathers’ concern about private property rights. Their
“Bill of Rights included no fewer than four separate
provisions aimed specifically at protecting private
interests in property,” observes John Humbach
(1989, 337). However, Humbach also notes that
“private property exists to serve the public good”
(1989, 345). The influential British utilitarian
philosopher Jeremy Bentham declared that “before
laws were made, there was no property; take away
laws and property ceases” (1887, 113). As a result,
according to Humbach (and other legal scholars),
“Property rights are a creation of laws, and the law
of property must, like all other law, serve a public
purpose” (1989, 345).
The initial public purpose for the new nation
was the settlement, or the resettlement by mostly
European immigrants, of the American subconti-
nent (Opie 1998). However, when Jefferson (who
had written the Declaration of Independence) and
the others who authored the Constitution rode to
Philadelphia on horseback or in carriages from their
Virginia estates, their Pennsylvania farms, or their
New England towns, they traveled through a seem-
ingly endless expanse of woodlands, rich farmlands,
and rolling pastures graced by fresh, clear creeks and
rivers, abundant game, and pristine coastlines. In
Philadelphia they were concerned foremost with
protecting human rights and freedoms. Even the
most foresighted of the framers of the Constitution
could not have envisioned the environmental and
social crises that subsequently accompanied the in-
dustrialization and urbanization of America.
The U.S. Constitution, however, does give the
states and their political subdivisions the power of
regulation. Police powers, which provide the basis
for state and local regulation, were derived by the
states from the Tenth Amendment, which reads:
“The powers not delegated to the United States by
the Constitution, nor prohibited by it to the States,
are reserved to the States respectively, or to the peo-
ple.”
The states, in the use of police powers, must con-
sider the Fifth Amendment because the U.S.
Supreme Court has held that the “taking clause” is
embodied in the due process clause of the Four-
teenth Amendment and hence applies to the states.
In addition, state constitutions contain taking
clauses, some with rather interesting twists. For in-
stance, Article 1, Section 16 (the Ninth Amend-
ment) of the Washington State Constitution states:
“No private property shall be taken or damaged for
public or private use without just compensation
having first been made” [emphasis added]. A per-
son’s private use of property cannot damage the
property of another person in Washington State.
Given this constitutional backdrop, the federal
and several state legislatures have slowly but steadily
6CHAPTER 1
increased statutory authority for planning. In addi-
tion, the courts have consistently upheld land-use
regulations that do not go “too far” and thus consti-
tute a taking. In addition, courts have supported
some restrictions on the use of environmentally
sensitive areas, such as wetlands, floodplains, and
the habitats of endangered species. However, plan-
ning remains a fragmented effort in the United
States, undertaken primarily by powerful vested
business interests and sometimes by consent. Plan-
ning by consent, which depends largely on an indi-
vidual’s persuasive power, has caused several adap-
tations on the part of American planners. These
adaptations can be broken down into two broad cat-
egories: administrative and adversary.
Administrative planners are realists who re-
spond directly to governmental programs either as
bureaucrats in a city or regional planning agency or
as consultants. Successful administrative planners
build political power in the city or metropolitan re-
gion where they work. They administer programs
for voluntary community organizations and health,
education, and welfare associations designed to sup-
port the political–economic structure of the nation-
state. They may also administer transportation or
utility programs deemed necessary by the same
structure. By building political power, administra-
tive planners serve the power structure of the city or
region. The result is that often the unempowered
groups in an area suffer. Poor people suffer the most,
bearing the brunt of the social costs, when planners
and others administer the programs of the status
quo.
Adversary planners are idealists and respond to
issues, such as those resulting from social or envi-
ronmental concerns, often as advocates for a certain
position. They usually work outside the power
structure, forming new coalitions among the previ-
ously unorganized in order to mobilize support for
their cause. Often advocacy planners work for veto
groups—ad hoc organizations opposed to a contro-
versial project or proposal such as a highway, a high-
density housing complex, a factory, or a landfill. Ad-
vocacy planners also work for nongovernmental or-
ganizations (NGOs), neighborhood planning com-
mittees, and community associations.
The rights of people have a deep-seated heritage
in American history, from the Declaration of Inde-
pendence, the Constitution, and the Bill of Rights
through the Thirteenth and Nineteenth Amend-
ments and to the labor, civil rights, and women’s
movements. Human rights have been the important
issue for one group of advocacy planners called by
various terms including community organizers, ad-
versary planners, and change agents. In Reveille for
Radicals, Saul Alinsky (1946) best articulated the
philosophy for the latest crest of this movement,
which began to ebb when Richard Nixon cut off
funding for a variety of programs created during the
1960s. Many of the social programs created during
the 1960s were concerned with making basic
changes in the urban power structure. The pro-
grams were a result of the civil rights movement and
the attention brought to the poor living conditions
in urban ghettos by the riots that occurred there.
The withdrawal of the federal commitment to do-
mestic human rights programs begun by President
Nixon continued through most of the 1970s, except
during the presidency of Jimmy Carter. During the
Ronald Reagan administration, the social programs
that had been created during the 1960s were almost
completely dismantled. The emphasis on “privatiza-
tion” and “state and local control” for addressing so-
cial issues continued during the 1990s in the United
States, as well as in some European nations.
With the passage of the NEPA, the Congress of
the United States put into motion the machinery for
the protection of the environment by setting forth
certain general aims of federal activity in the envi-
ronmental field, establishing the Council on Envi-
ronmental Quality (CEQ), and instructing all fed-
eral agencies to include an impact statement as part
of future reports or recommendations on actions
significantly affecting the quality of the human en-
7INTRODUCTION
vironment. Subsequent regional, state, and federal
actions—such as state environmental policy acts,
land-use legislation, and the Coastal Zone Manage-
ment Act (CZMA)—have furthered this commit-
ment.
As with the heritage for human rights, these en-
vironmental measures are deeply rooted in the
American tradition. Laced throughout the social
criticism of Henry David Thoreau, the novels of
Mark Twain, the poetry of Walt Whitman, the pho-
tography of Ansel Adams, the films of John Ford, the
art of Georgia O’Keeffe, and the music of Woody
Guthrie is the love for nature.
Even before the recent governmental action,
both administrative and adversary planners had
been concerned with degradation of the environ-
ment. In the nineteenth century, the young Freder-
ick Law Olmsted traveled to England where he wit-
nessed the efforts of reformers to use techniques of
the English landscape garden tradition to relieve the
pressures of urban blight brought on by the Indus-
trial Revolution. The resulting public parks were
viewed as natural refuges from the evils of the sur-
rounding industrial city. Public parks in English
cities were pastoral retreats and escapes from urban
congestion and pollution. Olmsted and American
reformers adopted the idea. Their first creation was
Central Park in New York City, planned and built
between 1857 and 1861. Eventually, these efforts led
to the City Beautiful Movement, after the World’s
Columbian Exposition of 1893 in Chicago. The City
Beautiful Movement resulted in numerous parks
and public facilities being built in the early twenti-
eth century.
During the late nineteenth and early twentieth
centuries a great national parks system took form
and blossomed under the leadership of President
Theodore Roosevelt. Also in the late nineteenth cen-
tury, the use of river drainage basins or watersheds
as the basic geographical unit for planning was initi-
ated. The humanist engineer Arthur Morgan, an ad-
vocate of the watershed conservancy idea, helped
organize the Miami Conservancy District in and
around Dayton, Ohio, and later directed the Ten-
nessee Valley Authority. During the New Deal,
greenbelt new towns—new satellite communities
surrounded by parks and accessible to cities by au-
tomobile—were created by economist Rexford Tug-
well and other leaders. Urban parks, national parks,
watershed conservancies, greenbelt new towns—
each was a response designed to maintain some por-
tion of the natural environment during periods of
increased human settlement.
Ian McHarg (1969) was Saul Alinsky’s environ-
mentalist counterpart and the author of a manifesto
for ecological planning similar to the one Alinsky
wrote for community advocacy. Although social ac-
tivism and environmentalism are separate (and
sometimes conflicting) American traditions, they
share common problems. Environmental programs
were as vulnerable in the 1980s as social programs
were a decade earlier. Ronald Reagan chose not to
enforce many environmental laws enacted during
the 1970s. He appointed people to key positions in
environmental and natural resource management
agencies who were opposed to the conservation
missions of those agencies. Legally established envi-
ronmental goals will not be achieved unless govern-
mental enforcement is supported by the public. In
spite of actions of the Reagan administration, the
American public has generally continued to favor
the protection of water, air, and land resources. In
addition, President Reagan’s successor, George H. W.
Bush, declared himself an environmentalist, and
when presenting Ian McHarg with the National
Medal of Art in 1992, he stated, “It is my hope that
the art of the twenty-first century will be devoted to
restoring the earth” (McHarg 1997a, 331). Further-
more, former vice president Al Gore is an avowed en-
vironmentalist (see Gore 1992). The Clinton–Gore
administration established the influential Presi-
dent’s Council on Sustainable Development (1996)
and generally emphasized more environmentally
sensitive policies for the federal government. How-
8CHAPTER 1
ever, even the Clinton–Gore approach was not as
“green” as those taken by many other nations.
Neither administrative nor advocacy planners
have been totally effective. While administrative
planners may be able to get things done, unempow-
ered groups often suffer. While advocacy planners
may win important civil rights struggles or stop fla-
grant abuse of the natural environment, overall
problems persist and people remain poor—fre-
quently poorer—and environmental degradation
continues, too often at a more rapid rate.
A New Approach
There is a need for a common language, a common
method among all those concerned about social eq-
uity and ecological parity. This method must be able
to transcend disciplinary territorialism and be ap-
plicable to all levels of government. And it is imper-
ative that this approach incorporate both social and
environmental concerns. As the poet Wendell Berry
has observed, “The mentality that destroys a water-
shed and then panics at the threat of flood is the
same mentality that gives institutionalized insult to
black people [and] then panics at the prospect of
race riots” (1972, 73).
What is needed is an approach that can assist
planners in analyzing the problems of a region as
they relate to each other, to the landscape, and to the
national and local political economic structure. This
might be called an applied human ecology, or simply
ecological planning. Each problem is linked to the
community in one or more specific ways. Banking is
related to real estate which is related to development
pressure which is related to schools which is related
to a rising tax base which is related to retirees orga-
nizing against increasing property taxes. This ap-
proach identifies how people are affected by these
chain reactions and presents options for the future
based on those impacts.
University of Wisconsin wildlife biologist Aldo
Leopold was perhaps the first person to advocate an
“ecological ethic” for planning, doing so in the
1930s (1933, 1949). He was subsequently joined by
such individuals as Lewis Mumford (1944, 1961)
and Benton MacKaye (1940). Mumford and Mac-
Kaye were strongly influenced by the Scottish biolo-
gist and town planner Patrick Geddes and the En-
glish garden city advocate Ebenezer Howard. Others
who have proposed or developed ecological ap-
proaches for planning include the Canadian forester
G. Angus Hills (1961); the Israeli architect and town
planner Artur Glikson (1971); the American land-
scape architects Philip Lewis (1969), Ian McHarg
(1969, 1996, with Steiner 1998), Anne Spirn (1984),
Rob Thayer (1994), and John Lyle (1994); the Cana-
dian landscape architect Michael Hough (1995); the
American planners Jon Berger (with Sinton 1985),
Randall Arendt (1996), and Tim Beatley (with Man-
ning 1997); the French geographer and planner Jean
Tarlet (1985, 1997); the Italian planners Enzo Scan-
durra and Silvia Macchi (1995); and the American
architects Sim Van der Ryn (with Cowan 1996) and
Peter Calthorpe (1993). Daniel Smith and Paul Hel-
mund (1993) present a wonderful guide for apply-
ing ecology to the planning of greenways, while the
Italian planner Danilo Palazzo (1997) provides a
comprehensive overview of the development of eco-
logical planning in the United States.
Ecological Planning Method
What is meant by ecological planning? Planning is a
process that uses scientific and technical informa-
tion for considering and reaching consensus on a
range of choices. Ecology is the study of the relation-
ship of all living things, including people, to their
biological and physical environments. Ecological
planning then may be defined as the use of biophys-
ical and sociocultural information to suggest oppor-
tunities and constraints for decision making about
the use of the landscape. Or, as defined by Ian
9INTRODUCTION
McHarg, it is the approach “whereby a region is un-
derstood as a biophysical and social process com-
prehensible through the operation of laws and time.
This can be reinterpreted as having explicit oppor-
tunities and constraints for any particular human
use. A survey will reveal the most fit locations and
processes” (1997a, 321).
McHarg has summarized a framework for eco-
logical planning in the following way:
All systems aspire to survival and success. This state
can be described as synthropic-fitness-health. Its an-
tithesis is entropic-misfitness-morbidity. To achieve
the first state requires systems to find the fittest envi-
ronment, adapt it and themselves. Fitness of an envi-
ronment for a system is defined as that requiring the
minimum of work and adaptation. Fitness and fitting
are indications of health and the process of fitness is
health giving. The quest for fitness is entitled adapta-
tion. Of all the instrumentalities available for man for
successful adaptation, cultural adaptation in general
and planning in particular, appear to be the most di-
rect and efficacious for maintaining and enhancing
human health and well-being (1981, 112–113).
Arthur Johnson explained the central principle
of this theory in the following way: “The fittest envi-
ronment for any organism, artifact, natural and so-
cial ecosystem, is that environment which provides
the [energy] needed to sustain the health or well-
being of the organism/artifact/ecosystem. Such an
approach is not limited by scale. It may be applied to
locating plants within a garden as well as to the de-
velopment of a nation” (1981, 107).
The ecological planning method is primarily a
procedure for studying the biophysical and socio-
cultural systems of a place to reveal where specific
land uses may be best practiced. As Ian McHarg has
summarized repeatedly in his writings and in many
public presentations: “The method defines the best
areas for a potential land use at the convergence of
all or most of the factors deemed propitious for the
use in the absence of all or most detrimental condi-
tions. Areas meeting this standard are deemed in-
trinsically suitable for the land use under considera-
tion.”
As presented in Figure 1.1, there are 11 interact-
ing steps. An issue or group of related issues is iden-
tified by a community—that is, some collection of
people—in Step 1. These issues are problematic or
present an opportunity to the people or the envi-
ronment of an area. A goal(s) is then established in
Step 2 to address the problem(s). Next, in Steps 3
and 4, inventories and analyses of biophysical and
sociocultural processes are conducted, first at a
larger level, such as a river drainage basin or an ap-
propriate regional unit of government, and second
at a more specific level, such as a small watershed or
a local government.
In Step 5, detailed studies are made that link the
inventory and analysis information to the prob-
lem(s) and goal(s). Suitability analyses are one such
type of detailed study. Step 6 involves the develop-
ment of concepts and options. A landscape plan is
then derived from these concepts in Step 7.
Throughout the process, a systematic educational
and citizen involvement effort occurs. Such involve-
ment is important in each step but especially so in
Step 8, when the plan is explained to the affected
public. In Step 9, detailed designs are explored that
are specific at the individual land-user or site level.
These designs and the plan are implemented in Step
10. In Step 11, the plan is administered.
The heavier arrows in Figure 1.1 indicate the
flow from Step 1 to Step 11. Smaller arrows between
each step suggest a feedback system whereby each
step can modify the previous step and, in turn,
change from the subsequent step. The smaller indi-
cate other possible modifications through the pro-
cess. For instance, detailed studies of a planning area
(Step 5) may lead to the identification of new prob-
lems or opportunities or the amendment of goals
(Steps 1 and 2). Design explorations (Step 9) may
change the landscape plan, and so on. Once the pro-
10CHAPTER 1
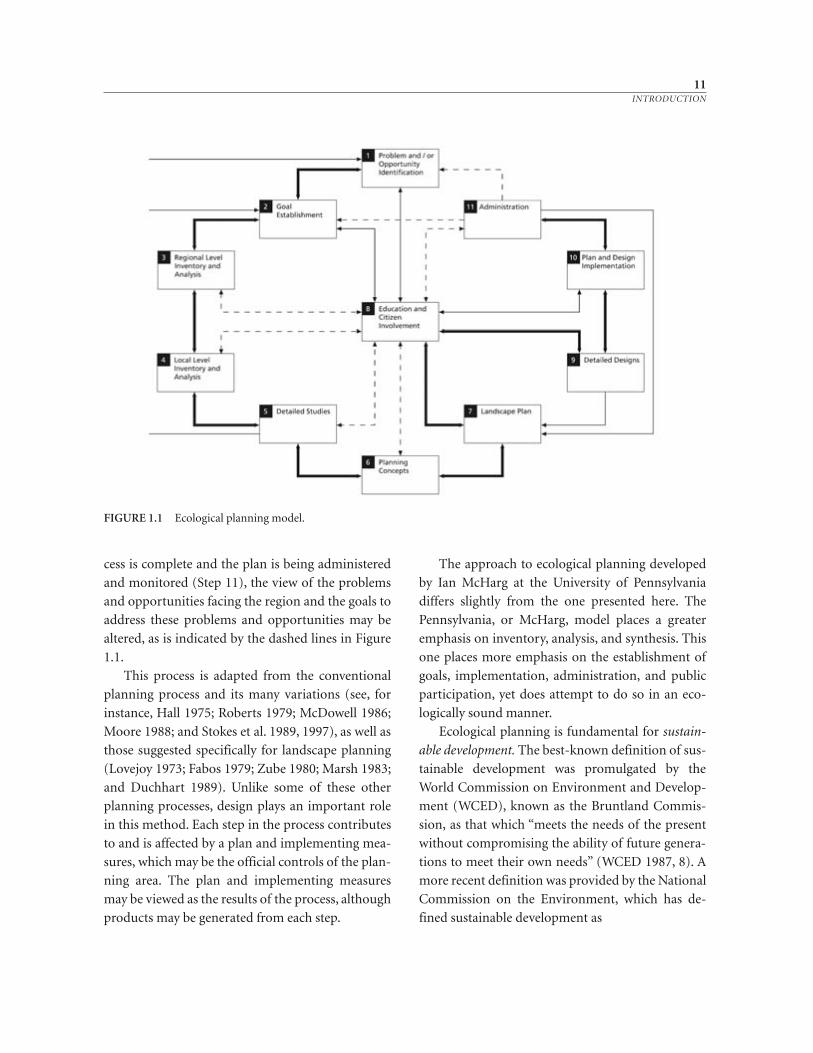
FIGURE 1.1 Ecological planning model.
cess is complete and the plan is being administered
and monitored (Step 11), the view of the problems
and opportunities facing the region and the goals to
address these problems and opportunities may be
altered, as is indicated by the dashed lines in Figure
1.1.
This process is adapted from the conventional
planning process and its many variations (see, for
instance, Hall 1975; Roberts 1979; McDowell 1986;
Moore 1988; and Stokes et al. 1989, 1997), as well as
those suggested specifically for landscape planning
(Lovejoy 1973; Fabos 1979; Zube 1980; Marsh 1983;
and Duchhart 1989). Unlike some of these other
planning processes, design plays an important role
in this method. Each step in the process contributes
to and is affected by a plan and implementing mea-
sures, which may be the official controls of the plan-
ning area. The plan and implementing measures
may be viewed as the results of the process, although
products may be generated from each step.
The approach to ecological planning developed
by Ian McHarg at the University of Pennsylvania
differs slightly from the one presented here. The
Pennsylvania, or McHarg, model places a greater
emphasis on inventory, analysis, and synthesis. This
one places more emphasis on the establishment of
goals, implementation, administration, and public
participation, yet does attempt to do so in an eco-
logically sound manner.
Ecological planning is fundamental for sustain-
able development. The best-known definition of sus-
tainable development was promulgated by the
World Commission on Environment and Develop-
ment (WCED), known as the Bruntland Commis-
sion, as that which “meets the needs of the present
without compromising the ability of future genera-
tions to meet their own needs” (WCED 1987, 8). A
more recent definition was provided by the National
Commission on the Environment, which has de-
fined sustainable development as
11INTRODUCTION
12CHAPTER 1
a strategy for improving the quality of life while pre-
serving the environmental potential for the future, of
living off interest rather than consuming natural cap-
ital. Sustainable development mandates that the pres-
ent generation must not narrow the choices of future
generations but must strive to expand them by pass-
ing on an environment and an accumulation of re-
sources that will allow its children to live at least as
well as, and preferably better than, people today. Sus-
tainable development is premised on living within the
Earth’s means (National Commission on the Envi-
ronment 1993, 2).
Enzo Scandurra and Alberto Budoni have stated
the underlying premise for sustainability especially
well and succinctly: “The planet cannot be consid-
ered as a gigantic source of unlimited raw materials,
neither, equally, as a gigantic dump where we can
dispose of all waste from our activities” (1997, 2).
The environment is both a source and a sink, but its
capacities to provide resources and to assimilate
wastes are not limitless.
Timothy Beatley and Kristy Manning (1997) re-
late sustainable development to ecological plan-
ning. They note that “McHargian-style environ-
mental analysis . . . [has] become a commonplace
methodological step in undertaking almost any
form of local planning” (Beatley and Manning
1997, 86). They also note, however, that although
such analyses are “extremely important, . . . a more
comprehensive and holistic approach is required”
(Beatley and Manning 1997, 86). The steps that fol-
low attempt to provide a more comprehensive ap-
proach.
Step 1: Identification of Planning Problems
and Opportunities
Human societies face many social, economic, politi-
cal, and environmental problems and opportuni-
ties. Since a landscape is the interface between social
and environmental processes, landscape planning
addresses those issues that concern the interrela-
tionship between people and nature. The planet
presents many opportunities for people, and there is
no shortage of environmental problems.
Problems and opportunities lead to specific
planning issues. For instance, suburban develop-
ment often occurs on prime agricultural land, a cir-
cumstance that local officials tend to view as a prob-
lem. A number of issues arise involving land-use
conflicts between the new suburban residents and
the farmers—such as who will pay the costs of pub-
lic services for the newly developed areas. Another
example is an area like an ocean beach or mountain
town with the opportunity for new development
because of its scenic beauty and recreational ameni-
ties. A key challenge would be that of accommodat-
ing the new growth while protecting the natural re-
sources that are attracting people to the place.
Step 2: Establishment of
Planning Goals
In a democracy, the people of a region establish
goals through the political process. Elected repre-
sentatives will identify a particular issue affecting
their region—a steel plant is closing, suburban
sprawl threatens agricultural land, or a new power
plant is creating a housing boom. After issues have
been identified, goals are established to address the
problem. Such goals should provide the basis for
the planning process.
Goals articulate an idealized future situation. In
the context of this method, it is assumed that once
goals have been established there will be a commit-
ment by some group to address the problem or op-
portunity identified in Step 1. Problems and oppor-
tunities can be identified at various levels. Local
people can recognize a problem or opportunity and
then set a goal to address it. As well, issues can be na-
tional, international, or global in scope. Problem
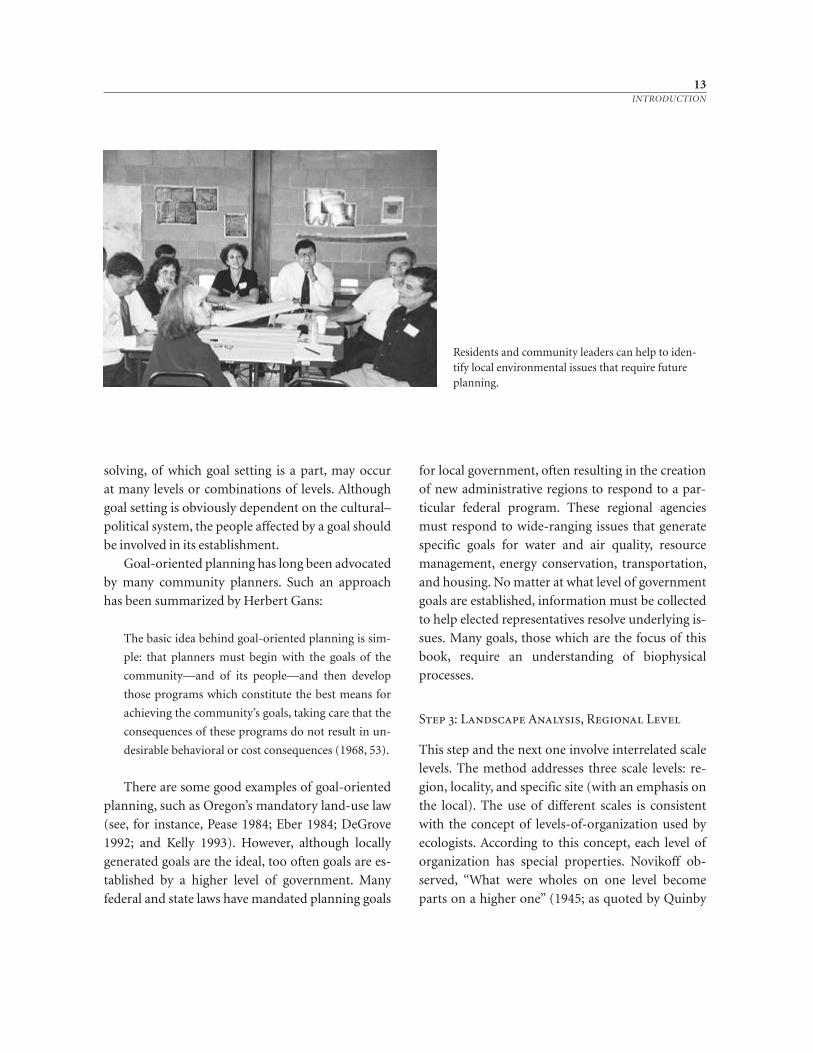
13INTRODUCTION
Residents and community leaders can help to iden-tify local environmental issues that require futureplanning.
solving, of which goal setting is a part, may occur
at many levels or combinations of levels. Although
goal setting is obviously dependent on the cultural–
political system, the people affected by a goal should
be involved in its establishment.
Goal-oriented planning has long been advocated
by many community planners. Such an approach
has been summarized by Herbert Gans:
The basic idea behind goal-oriented planning is sim-
ple: that planners must begin with the goals of the
community—and of its people—and then develop
those programs which constitute the best means for
achieving the community’s goals, taking care that the
consequences of these programs do not result in un-
desirable behavioral or cost consequences (1968, 53).
There are some good examples of goal-oriented
planning, such as Oregon’s mandatory land-use law
(see, for instance, Pease 1984; Eber 1984; DeGrove
1992; and Kelly 1993). However, although locally
generated goals are the ideal, too often goals are es-
tablished by a higher level of government. Many
federal and state laws have mandated planning goals
for local government, often resulting in the creation
of new administrative regions to respond to a par-
ticular federal program. These regional agencies
must respond to wide-ranging issues that generate
specific goals for water and air quality, resource
management, energy conservation, transportation,
and housing. No matter at what level of government
goals are established, information must be collected
to help elected representatives resolve underlying is-
sues. Many goals, those which are the focus of this
book, require an understanding of biophysical
processes.
Step 3: Landscape Analysis, Regional Level
This step and the next one involve interrelated scale
levels. The method addresses three scale levels: re-
gion, locality, and specific site (with an emphasis on
the local). The use of different scales is consistent
with the concept of levels-of-organization used by
ecologists. According to this concept, each level of
organization has special properties. Novikoff ob-
served, “What were wholes on one level become
parts on a higher one” (1945; as quoted by Quinby
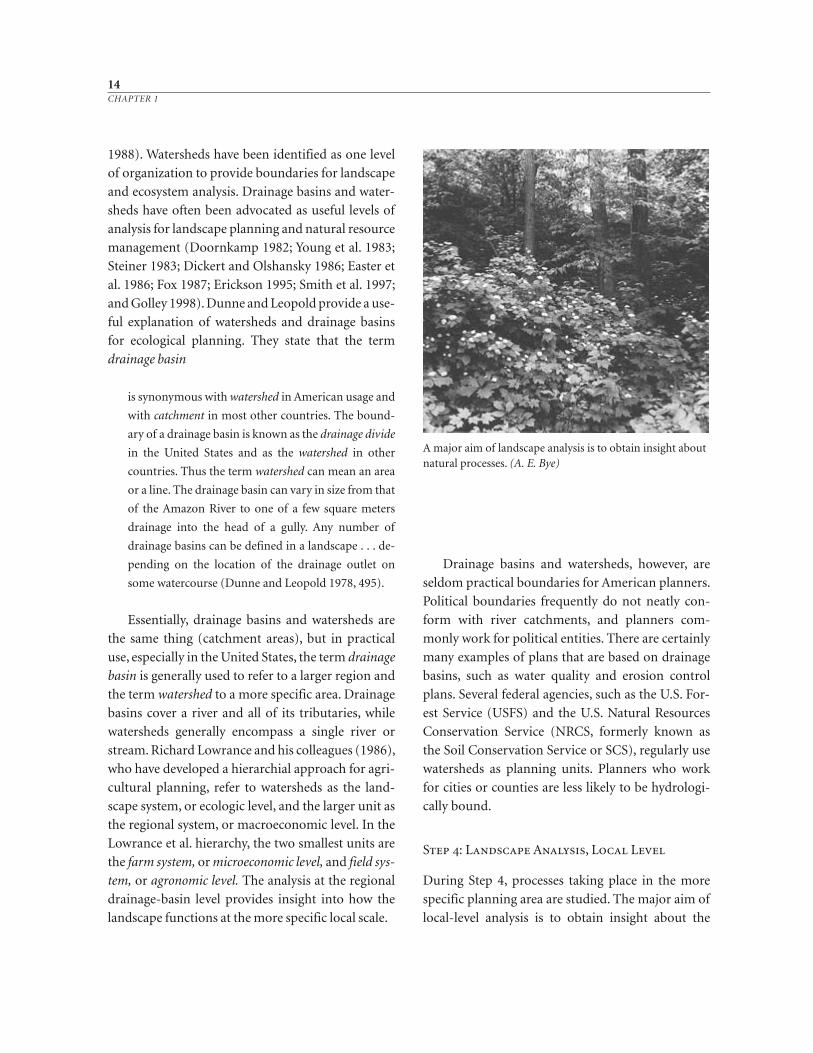
1988). Watersheds have been identified as one level
of organization to provide boundaries for landscape
and ecosystem analysis. Drainage basins and water-
sheds have often been advocated as useful levels of
analysis for landscape planning and natural resource
management (Doornkamp 1982; Young et al. 1983;
Steiner 1983; Dickert and Olshansky 1986; Easter et
al. 1986; Fox 1987; Erickson 1995; Smith et al. 1997;
and Golley 1998). Dunne and Leopold provide a use-
ful explanation of watersheds and drainage basins
for ecological planning. They state that the term
drainage basin
is synonymous with watershed in American usage and
with catchment in most other countries. The bound-
ary of a drainage basin is known as the drainage divide
in the United States and as the watershed in other
countries. Thus the term watershed can mean an area
or a line. The drainage basin can vary in size from that
of the Amazon River to one of a few square meters
drainage into the head of a gully. Any number of
drainage basins can be defined in a landscape . . . de-
pending on the location of the drainage outlet on
some watercourse (Dunne and Leopold 1978, 495).
Essentially, drainage basins and watersheds are
the same thing (catchment areas), but in practical
use, especially in the United States, the term drainage
basin is generally used to refer to a larger region and
the term watershed to a more specific area. Drainage
basins cover a river and all of its tributaries, while
watersheds generally encompass a single river or
stream. Richard Lowrance and his colleagues (1986),
who have developed a hierarchial approach for agri-
cultural planning, refer to watersheds as the land-
scape system, or ecologic level, and the larger unit as
the regional system, or macroeconomic level. In the
Lowrance et al. hierarchy, the two smallest units are
the farm system, or microeconomic level, and field sys-
tem, or agronomic level. The analysis at the regional
drainage-basin level provides insight into how the
landscape functions at the more specific local scale.
Drainage basins and watersheds, however, are
seldom practical boundaries for American planners.
Political boundaries frequently do not neatly con-
form with river catchments, and planners com-
monly work for political entities. There are certainly
many examples of plans that are based on drainage
basins, such as water quality and erosion control
plans. Several federal agencies, such as the U.S. For-
est Service (USFS) and the U.S. Natural Resources
Conservation Service (NRCS, formerly known as
the Soil Conservation Service or SCS), regularly use
watersheds as planning units. Planners who work
for cities or counties are less likely to be hydrologi-
cally bound.
Step 4: Landscape Analysis, Local Level
During Step 4, processes taking place in the more
specific planning area are studied. The major aim of
local-level analysis is to obtain insight about the
14CHAPTER 1
A major aim of landscape analysis is to obtain insight aboutnatural processes. (A. E. Bye)
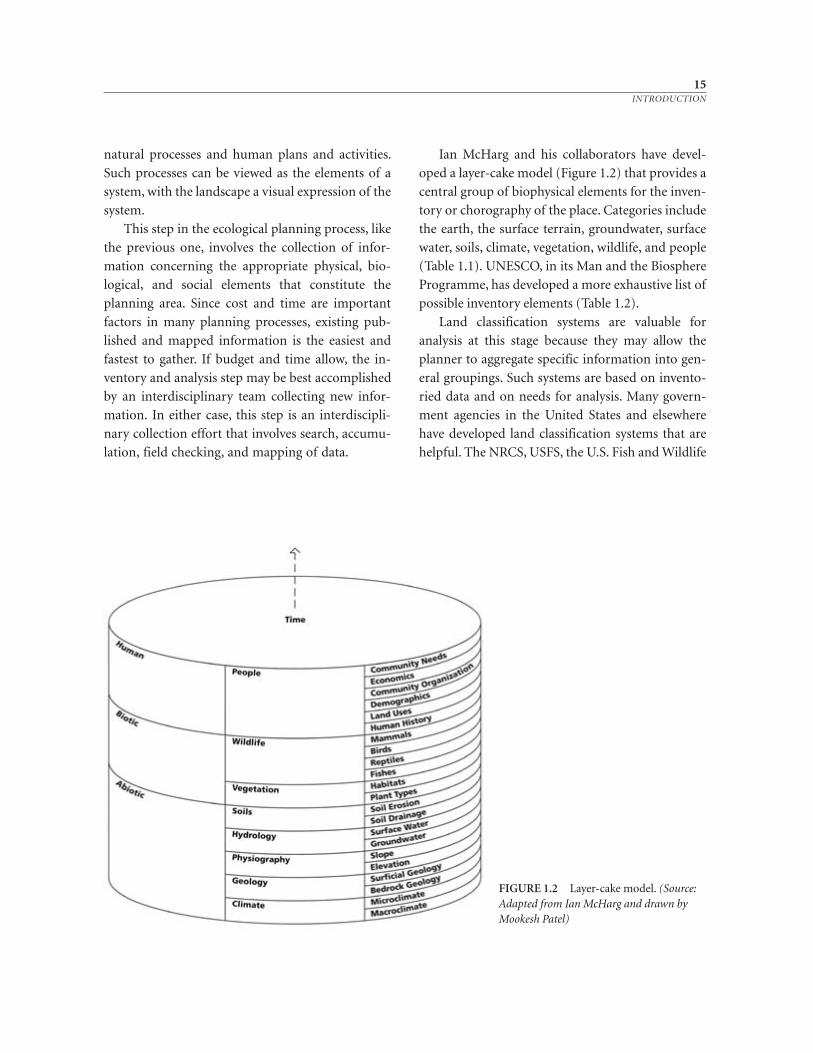
FIGURE 1.2 Layer-cake model. (Source:Adapted from Ian McHarg and drawn byMookesh Patel)
natural processes and human plans and activities.
Such processes can be viewed as the elements of a
system, with the landscape a visual expression of the
system.
This step in the ecological planning process, like
the previous one, involves the collection of infor-
mation concerning the appropriate physical, bio-
logical, and social elements that constitute the
planning area. Since cost and time are important
factors in many planning processes, existing pub-
lished and mapped information is the easiest and
fastest to gather. If budget and time allow, the in-
ventory and analysis step may be best accomplished
by an interdisciplinary team collecting new infor-
mation. In either case, this step is an interdiscipli-
nary collection effort that involves search, accumu-
lation, field checking, and mapping of data.
15INTRODUCTION
Ian McHarg and his collaborators have devel-
oped a layer-cake model (Figure 1.2) that provides a
central group of biophysical elements for the inven-
tory or chorography of the place. Categories include
the earth, the surface terrain, groundwater, surface
water, soils, climate, vegetation, wildlife, and people
(Table 1.1). UNESCO, in its Man and the Biosphere
Programme, has developed a more exhaustive list of
possible inventory elements (Table 1.2).
Land classification systems are valuable for
analysis at this stage because they may allow the
planner to aggregate specific information into gen-
eral groupings. Such systems are based on invento-
ried data and on needs for analysis. Many govern-
ment agencies in the United States and elsewhere
have developed land classification systems that are
helpful. The NRCS, USFS, the U.S. Fish and Wildlife
Service (USFWS), and the U.S. Geological Survey
(USGS) are agencies that have been notably active in
land classification systems. However, there is not a
consistency of data sources even in the United
States. In urban areas, a planner may be over-
whelmed with data for inventory and analysis. In re-
mote rural areas, on the other hand, even a Natural
Resources Conservation Service survey may not ex-
ist, or the survey may be old and unusable. An even
larger problem is that there is little or no consistency
in scale or in the terminology used among various
agencies. A recommendation of the National Agri-
cultural Lands Study (1981) was that a statistical
protocol for federal agencies concerning land re-
source information be developed and led by the Of-
fice of Federal Statistical Policy and Standards. One
helpful system that has been developed for land
classification is the USGS Land-Use and Land-
Cover Classification System (Table 1.3).
The ability of the landscape planner and ecosys-
tem manager to inventory biophysical processes
may be uneven, but it is far better than their capabil-
ity to assess human ecosystems. An understanding
of human ecology may provide a key to sociocultu-
ral inventory and analysis. Since humans are living
things, human ecology may be thought of as an ex-
pansion of ecology—of how humans interact with
each other and their environments. Interaction then
is used as both a basic concept and an explanatory
device. As Gerald Young (1974, 1978, 1983, 1989),
who has illustrated the pan-disciplinary scope of
human ecology, noted:
In human ecology, the way people interact with each
other and with the environment is definitive of a
number of basic relationships. Interaction provides a
measure of belonging, it affects identity versus alien-
ation, including alienation from the environment.
The system of obligation, responsibility and liability
is defined through interaction. The process has be-
come definitive of the public interest as opposed to
private interests which prosper in the spirit of inde-
pendence (1976, 294).
Step 5: Detailed Studies
Detailed studies link the inventory and analysis in-
formation to the problem(s) and goal(s). One ex-
16CHAPTER 1
TABLE 1.1Baseline Natural ResourceData Necessary for Ecological Planning
The following natural resource factors are likely to be ofsignificance in planning. Clearly the region under studywill determine the relevant factors, but many are likely tooccur in all studies.
CLIMATE. Temperature, humidity, precipitation, wind ve-locity, wind direction, wind duration, first and last frosts,snow, frost, fog, inversions, hurricanes, tornadoes, tsunamis,typhoons, Chinook winds
GEOLOGY. Rocks, ages, formations, plans, sections, proper-ties, seismic activity, earthquakes, rock slides, mud slides,subsidence
SURFICIAL GEOLOGY. Kames, kettles, eskers, moraines,drift and till
GROUNDWATER HYDROLOGY. Geological formationsinterpreted as aquifers with well locations, well logs, waterquantity and quality, water table
PHYSIOGRAPHY. Physiographic regions, subregions, fea-tures, contours, sections, slopes, aspect, insolation, digitalterrain model(s)
SURFICIAL HYDROLOGY. Oceans, lakes, deltas, rivers,streams, creeks, marshes, swamps, wetlands, stream orders,density, discharges, gauges, water quality, floodplains
SOILS. Soil associations, soil series, properties, depth to sea-sonal high water table, depth to bedrock, shrink-swell, com-pressive strength, cation and anion exchange, acidity-alka-linity
VEGETATION. Associations, communities, species, compo-sition, distribution, age and conditions, visual quality, spe-cies number, rare and endangered species, fire history, suc-cessional history
WILDLIFE. Habitats, animal populations, census data, rareand endangered species, scientific and educational value
HUMAN. Ethnographic history, settlement patterns, exist-ing land use, existing infrastructure, economic activities,population characteristics
SOURCE: Adapted from McHarg 1997b.
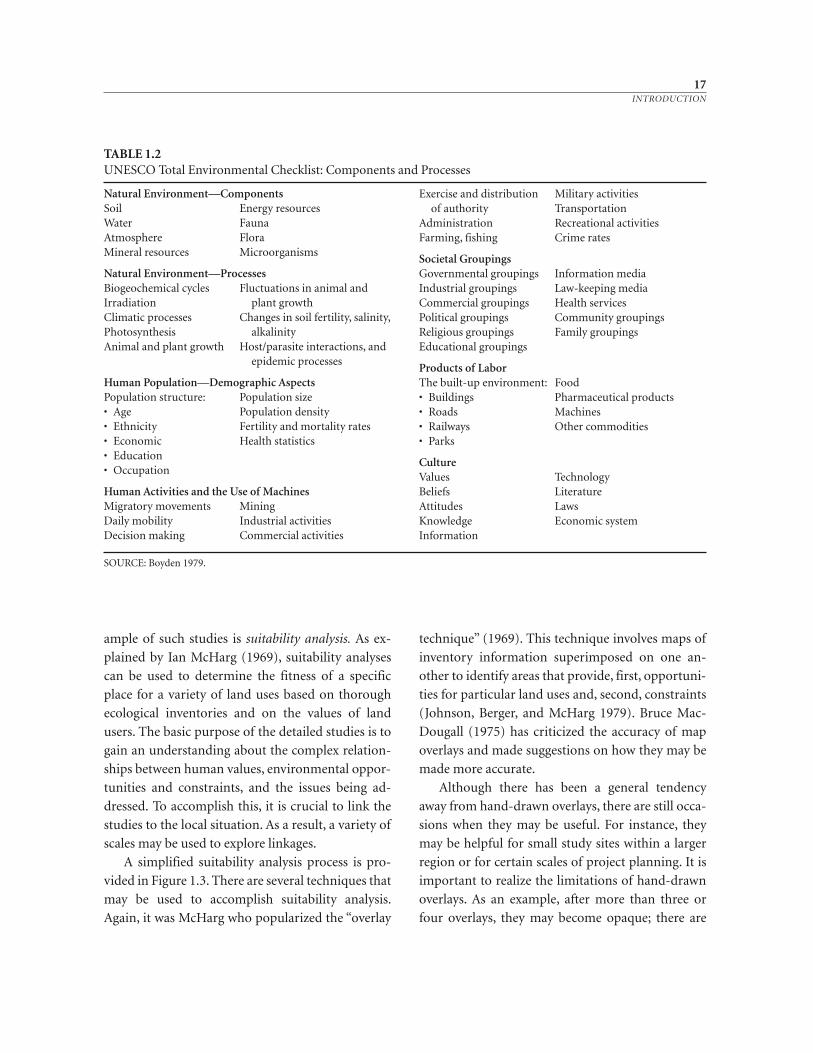
17INTRODUCTION
TABLE 1.2UNESCO Total Environmental Checklist: Components and Processes
Exercise and distribution Military activitiesof authority Transportation
Administration Recreational activitiesFarming, fishing Crime rates
Societal GroupingsGovernmental groupings Information mediaIndustrial groupings Law-keeping mediaCommercial groupings Health servicesPolitical groupings Community groupingsReligious groupings Family groupingsEducational groupings
Products of LaborThe built-up environment: Food• Buildings Pharmaceutical products• Roads Machines• Railways Other commodities• Parks
CultureValues TechnologyBeliefs LiteratureAttitudes LawsKnowledge Economic systemInformation
Natural Environment—ComponentsSoil Energy resourcesWater FaunaAtmosphere FloraMineral resources Microorganisms
Natural Environment—ProcessesBiogeochemical cycles Fluctuations in animal and Irradiation plant growthClimatic processes Changes in soil fertility, salinity,Photosynthesis alkalinityAnimal and plant growth Host/parasite interactions, and
epidemic processes
Human Population—Demographic AspectsPopulation structure: Population size• Age Population density• Ethnicity Fertility and mortality rates• Economic Health statistics• Education• Occupation
Human Activities and the Use of MachinesMigratory movements MiningDaily mobility Industrial activitiesDecision making Commercial activities
SOURCE: Boyden 1979.
ample of such studies is suitability analysis. As ex-
plained by Ian McHarg (1969), suitability analyses
can be used to determine the fitness of a specific
place for a variety of land uses based on thorough
ecological inventories and on the values of land
users. The basic purpose of the detailed studies is to
gain an understanding about the complex relation-
ships between human values, environmental oppor-
tunities and constraints, and the issues being ad-
dressed. To accomplish this, it is crucial to link the
studies to the local situation. As a result, a variety of
scales may be used to explore linkages.
A simplified suitability analysis process is pro-
vided in Figure 1.3. There are several techniques that
may be used to accomplish suitability analysis.
Again, it was McHarg who popularized the “overlay
technique” (1969). This technique involves maps of
inventory information superimposed on one an-
other to identify areas that provide, first, opportuni-
ties for particular land uses and, second, constraints
(Johnson, Berger, and McHarg 1979). Bruce Mac-
Dougall (1975) has criticized the accuracy of map
overlays and made suggestions on how they may be
made more accurate.
Although there has been a general tendency
away from hand-drawn overlays, there are still occa-
sions when they may be useful. For instance, they
may be helpful for small study sites within a larger
region or for certain scales of project planning. It is
important to realize the limitations of hand-drawn
overlays. As an example, after more than three or
four overlays, they may become opaque; there are
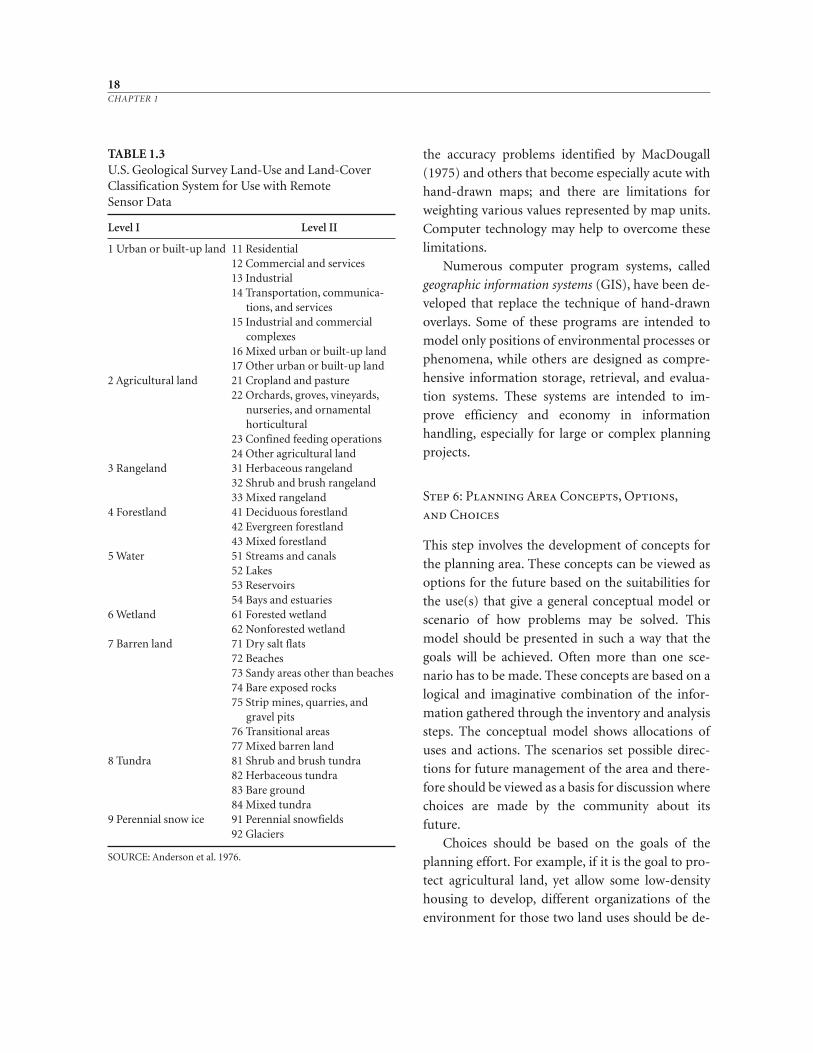
the accuracy problems identified by MacDougall
(1975) and others that become especially acute with
hand-drawn maps; and there are limitations for
weighting various values represented by map units.
Computer technology may help to overcome these
limitations.
Numerous computer program systems, called
geographic information systems (GIS), have been de-
veloped that replace the technique of hand-drawn
overlays. Some of these programs are intended to
model only positions of environmental processes or
phenomena, while others are designed as compre-
hensive information storage, retrieval, and evalua-
tion systems. These systems are intended to im-
prove efficiency and economy in information
handling, especially for large or complex planning
projects.
Step 6: Planning Area Concepts, Options,
and Choices
This step involves the development of concepts for
the planning area. These concepts can be viewed as
options for the future based on the suitabilities for
the use(s) that give a general conceptual model or
scenario of how problems may be solved. This
model should be presented in such a way that the
goals will be achieved. Often more than one sce-
nario has to be made. These concepts are based on a
logical and imaginative combination of the infor-
mation gathered through the inventory and analysis
steps. The conceptual model shows allocations of
uses and actions. The scenarios set possible direc-
tions for future management of the area and there-
fore should be viewed as a basis for discussion where
choices are made by the community about its
future.
Choices should be based on the goals of the
planning effort. For example, if it is the goal to pro-
tect agricultural land, yet allow some low-density
housing to develop, different organizations of the
environment for those two land uses should be de-
18CHAPTER 1
TABLE 1.3U.S. Geological Survey Land-Use and Land-CoverClassification System for Use with Remote Sensor Data
Level I Level II
1 Urban or built-up land 11 Residential12 Commercial and services13 Industrial14 Transportation, communica-
tions, and services15 Industrial and commercial
complexes16 Mixed urban or built-up land17 Other urban or built-up land
2 Agricultural land 21 Cropland and pasture22 Orchards, groves, vineyards,
nurseries, and ornamental horticultural
23 Confined feeding operations24 Other agricultural land
3 Rangeland 31 Herbaceous rangeland32 Shrub and brush rangeland33 Mixed rangeland
4 Forestland 41 Deciduous forestland42 Evergreen forestland43 Mixed forestland
5 Water 51 Streams and canals52 Lakes53 Reservoirs54 Bays and estuaries
6 Wetland 61 Forested wetland62 Nonforested wetland
7 Barren land 71 Dry salt flats72 Beaches73 Sandy areas other than beaches74 Bare exposed rocks75 Strip mines, quarries, and
gravel pits76 Transitional areas77 Mixed barren land
8 Tundra 81 Shrub and brush tundra82 Herbaceous tundra83 Bare ground84 Mixed tundra
9 Perennial snow ice 91 Perennial snowfields92 Glaciers
SOURCE: Anderson et al. 1976.
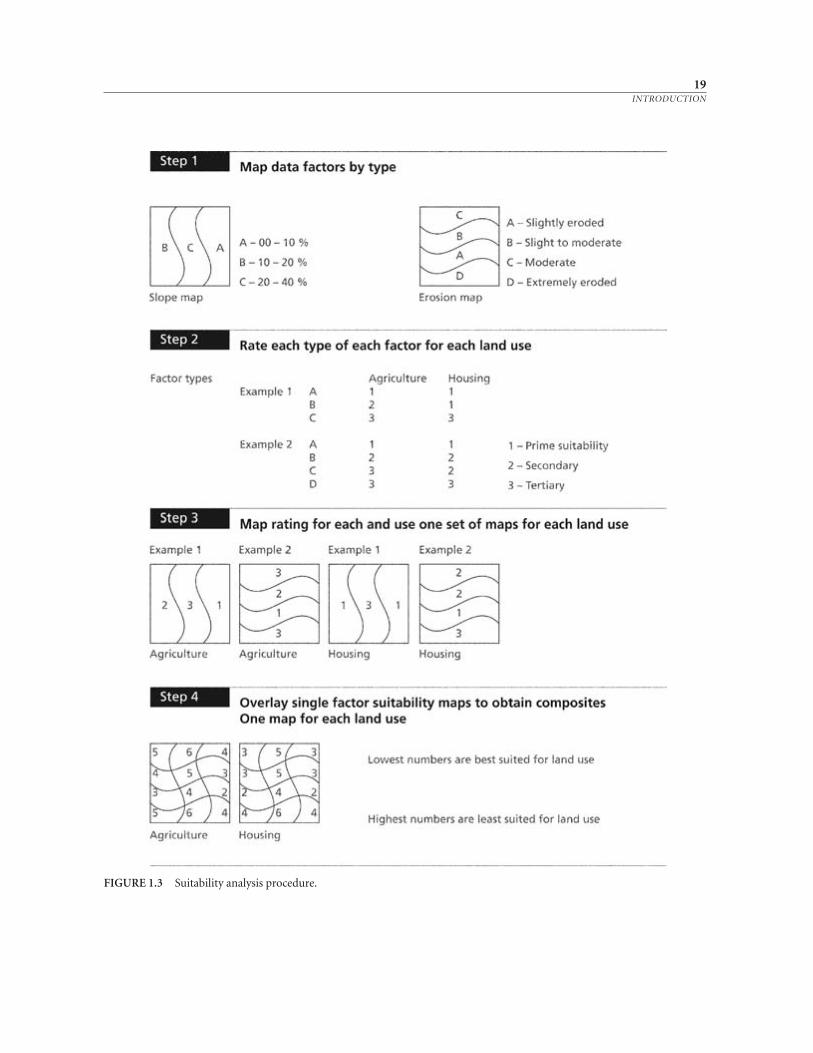
19INTRODUCTION
FIGURE 1.3 Suitability analysis procedure.
veloped. Different schemes for realizing the desired
preferences also need to be explored.
The Dutch have devised an interesting approach
to developing planning options for their agricul-
tural land reallocation projects. Four land-use op-
tions are developed, each with the preferred scheme
for a certain point of view. Optional land-use
schemes of the area are made for nature and land-
scape, agriculture, recreation, and urbanization.
These schemes are constructed by groups of citi-
zens working with government scientists and plan-
ners. To illustrate, for the nature and landscape
scheme, landscape architects and ecologists from
the Staatsbosbeheer (Dutch Forest Service) work
with citizen environmental action groups. For agri-
culture, local extension agents and soil scientists
work with farm commodity organizations and
farmer cooperatives. Similar coalitions are formed
for recreation and urbanization. What John Fried-
mann (1973) calls a dialogue process begins at the
point where each of the individual schemes is con-
structed. The groups come together for mutual
learning so that a consensus of opinion can be
reached through debate and discussion.
Various options for implementation also need to
be explored, which must relate to the goal of the
planning effort. If, for example, the planning is be-
ing conducted for a jurisdiction trying to protect its
agricultural land resources, then it is necessary not
only to identify lands that should be protected but
also the implementation options that might be em-
ployed to achieve the farmland protection goal.
Step 7: Landscape Plan
The preferred concepts and options are brought to-
gether in a landscape plan. The plan gives a strategy
for development at the local scale. The plan provides
flexible guidelines for policymakers, land managers,
and land users on how to conserve, rehabilitate, or
develop an area. In such a plan, enough freedom
should be left so that local officials and land users
can adjust their practices to new economic demands
or social changes.
This step represents a key decision-making
point in the planning process. Responsible officials,
such as county commissioners or city council mem-
bers, are often required by law to adopt a plan. The
rules for adoption and forms that the plans may take
vary widely. Commonly in the United States, plan-
ning commissions recommend a plan for adoption
to the legislative body after a series of public hear-
ings. Such plans are called comprehensive plans in
much of the United States but are referred to as gen-
eral plans in Arizona, California, and Utah. In some
states (like Oregon) there are specific, detailed ele-
ments that local governments are required to in-
clude in such plans. Other states permit much flexi-
bility to local officials for the contents of these plans.
On public lands, various federal agencies, including
the USFS, the U.S. National Park Service (NPS), and
the U.S. Bureau of Land Management (BLM), have
specific statutory requirement for land management
plans.
The term landscape plan is used here to empha-
size that such plans should incorporate natural and
social considerations. A landscape plan is more than
a land-use plan because it addresses the overlap and
integration of land uses. A landscape plan may in-
volve the formal recognition of previous elements in
the planning process, such as the adoption of policy
goals. The plan should include written statements
about policies and implementation strategies as well
as a map showing the spatial organization of the
landscape.
Step 8: Continued Citizen Involvement and
Community Education
In Step 8, the plan is explained to the affected public
through education and information dissemination.
Actually, such interaction occurs throughout the
20CHAPTER 1
planning process, beginning with the identification
of issues. Public involvement is especially crucial as
the landscape plan is developed, because it is impor-
tant to ensure that the goals established by the com-
munity will be achieved in the plan.
The success of a plan depends largely on how
much people affected by the plan have been in-
volved in its determination. There are numerous ex-
amples of both government agencies and private
businesses suddenly announcing a plan for a project
that will dramatically impact people, without first
having consulted those individuals. The result is
predictable—the people will rise in opposition
against the project. The alternative is to involve peo-
ple in the planning process, soliciting their ideas and
incorporating those ideas into the plan. Doing so
may require a longer time to develop a plan, but lo-
cal citizens will be more likely to support it than to
oppose it and will often monitor its execution.
Step 9: Design Explorations
To design is to give form and to arrange elements
spatially. By making specific designs based on the
landscape plan, planners can help decision makers
visualize the consequences of their policies. Carry-
ing policies through to arranging the physical envi-
ronment gives meaning to the process by actually
conceiving change in the spatial organization of a
place. Designs represent a synthesis of all the previ-
ous planning studies. During the design step, the
short-term benefits for the land users or individual
citizen have to be combined with the long-term eco-
nomic and ecological goals for the whole area.
Since the middle 1980s, several architects have
called for a return to traditional principles in com-
munity design. These “neotraditionals” or “new ur-
banists” include Peter Calthorpe, Elizabeth Plater-
Zyberk, Andres Duany, Elizabeth Moule, and
Stefanos Polyzoides. Meanwhile, other architects
and landscape architects have advocated more eco-
logical, more sustainable design; these include John
Lyle, Robert Thayer, Sim Van der Ryn, Carol
Franklin, Colin Franklin, Leslie Jones Sauer, Rolf
Sauer, and Pliny Fisk. Michael and Judith Corbett
with others helped merge these two strains in the
Ahwahnee Principles (Local Government Commis-
sion 1991; Calthorpe et al. 1998). (See Table 1.4.)
Ecological design, according to David Orr, is
“the capacity to understand the ecological context
in which humans live, to recognize limits, and to get
the scale of things right” (1994, 2). Or, as Sim Van
der Ryn and Stuart Cowan note, ecological design
seeks to “make nature visible” (1996, 16). These
principles provide clear guidance for ecological de-
sign (see also Grant et al. 1996, Beatley and Man-
ning 1997). While some designers and planners
might object to the placement of design within the
planning process, in an ecological perspective such
placement helps to connect design with more com-
prehensive social actions and policies.
Step 10: Plan and Design Implementation
Implementation is the employment of various
strategies, tactics, and procedures to realize the goals
and policies adopted in the landscape plan. The Ah-
wahnee Principles provide guidelines for imple-
mentation (Table 1.4). On the local level, several dif-
ferent mechanisms have been developed to control
the use of land and other resources. These tech-
niques include voluntary covenants, easements,
land purchase, transfer of development rights, zon-
ing, utility extension policies, and performance
standards. The preference selected should be appro-
priate for the region. For instance, in urban areas
like King County, Washington, and Suffolk County,
New York, traditional zoning has not proved effec-
tive for protecting farmland. The citizens of these
counties have therefore elected to tax themselves to
purchase farmland preservation easements from
farmers. In more rural counties like Whitman
21INTRODUCTION
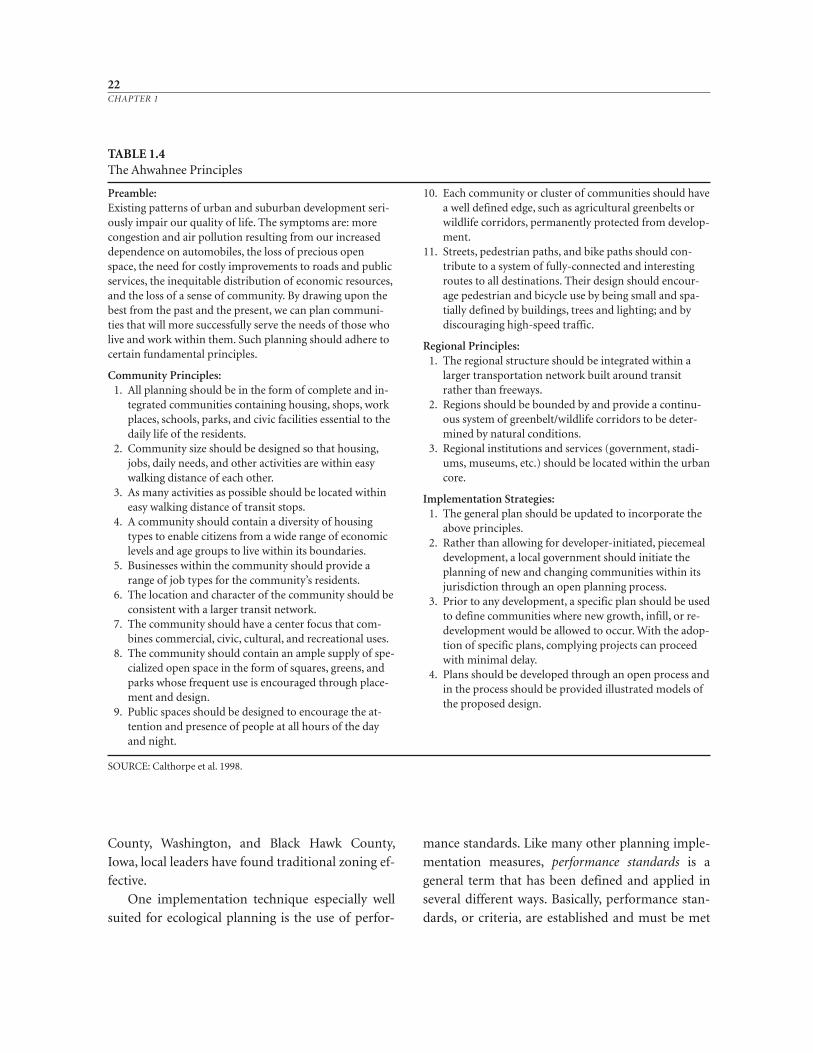
County, Washington, and Black Hawk County,
Iowa, local leaders have found traditional zoning ef-
fective.
One implementation technique especially well
suited for ecological planning is the use of perfor-
mance standards. Like many other planning imple-
mentation measures, performance standards is a
general term that has been defined and applied in
several different ways. Basically, performance stan-
dards, or criteria, are established and must be met
22CHAPTER 1
TABLE 1.4The Ahwahnee Principles
Preamble:Existing patterns of urban and suburban development seri-ously impair our quality of life. The symptoms are: morecongestion and air pollution resulting from our increaseddependence on automobiles, the loss of precious openspace, the need for costly improvements to roads and publicservices, the inequitable distribution of economic resources,and the loss of a sense of community. By drawing upon thebest from the past and the present, we can plan communi-ties that will more successfully serve the needs of those wholive and work within them. Such planning should adhere tocertain fundamental principles.
Community Principles:1. All planning should be in the form of complete and in-
tegrated communities containing housing, shops, workplaces, schools, parks, and civic facilities essential to thedaily life of the residents.
2. Community size should be designed so that housing,jobs, daily needs, and other activities are within easywalking distance of each other.
3. As many activities as possible should be located withineasy walking distance of transit stops.
4. A community should contain a diversity of housingtypes to enable citizens from a wide range of economiclevels and age groups to live within its boundaries.
5. Businesses within the community should provide arange of job types for the community’s residents.
6. The location and character of the community should beconsistent with a larger transit network.
7. The community should have a center focus that com-bines commercial, civic, cultural, and recreational uses.
8. The community should contain an ample supply of spe-cialized open space in the form of squares, greens, andparks whose frequent use is encouraged through place-ment and design.
9. Public spaces should be designed to encourage the at-tention and presence of people at all hours of the dayand night.
10. Each community or cluster of communities should havea well defined edge, such as agricultural greenbelts orwildlife corridors, permanently protected from develop-ment.
11. Streets, pedestrian paths, and bike paths should con-tribute to a system of fully-connected and interestingroutes to all destinations. Their design should encour-age pedestrian and bicycle use by being small and spa-tially defined by buildings, trees and lighting; and bydiscouraging high-speed traffic.
Regional Principles:1. The regional structure should be integrated within a
larger transportation network built around transitrather than freeways.
2. Regions should be bounded by and provide a continu-ous system of greenbelt/wildlife corridors to be deter-mined by natural conditions.
3. Regional institutions and services (government, stadi-ums, museums, etc.) should be located within the urbancore.
Implementation Strategies:1. The general plan should be updated to incorporate the
above principles.2. Rather than allowing for developer-initiated, piecemeal
development, a local government should initiate theplanning of new and changing communities within itsjurisdiction through an open planning process.
3. Prior to any development, a specific plan should be usedto define communities where new growth, infill, or re-development would be allowed to occur. With the adop-tion of specific plans, complying projects can proceedwith minimal delay.
4. Plans should be developed through an open process andin the process should be provided illustrated models ofthe proposed design.
SOURCE: Calthorpe et al. 1998.
before a certain use will be permitted. These criteria
usually involve a combination of economic, envi-
ronmental, and social factors. This technique lends
itself to ecological planning because criteria for spe-
cific land uses can be based on suitability analysis.
Step 11: Administration
In this final step, the plan is administered. Adminis-
tration involves monitoring and evaluating how the
plan is implemented on an ongoing basis. Amend-
ments or adjustments to the plan will no doubt be
necessary because of changing conditions or new
information. To achieve the goals established for the
process, planners should pay special attention to the
design of regulation review procedures and of the
management of the decision-making process.
Administration may be accomplished by a com-
mission comprising citizens with or without the
support of a professional staff. Citizens should play
an important role in administering local planning
through commissions and review boards that over-
see local ordinances. To a large degree, the success of
citizens’ boards and commissions depends on the
extent of their involvement in the development of
the plans that they manage. Again, Oregon provides
an excellent example of the use of citizens to admin-
ister a plan. The Land Conservation and Develop-
ment Commission (LCDC), comprising seven
members who are appointed by the governor and
supported by its professional staff, is responsible for
overseeing the implementation of the state land-use
planning law. Another group of citizens, 1000
Friends of Oregon, monitors the administration of
the law. The support that the law has received from
the public is evidenced by the defeat of several at-
tempts to abolish mandatory statewide land-use
planning in Oregon. However, as Department of
Land Conservation and Development (DLCD) staff
member Ron Eber observes, “It is a myth that plan-
ning is easy in Oregon—it is a battle every day!”
(personal communication 1999). For example, in
the early 1990s, a counterforce to 1000 Friends of
Oregon was organized; “Oregonians in Action” is a
property-rights group that is opposed to the pro-
gressive statewide planning program.
Working Plans
A method is necessary as an organizational frame-
work for landscape planners. Also, a relatively stan-
dard method presents the opportunity to compare
and analyze case studies. To adequately fulfill re-
sponsibilities to protect the public health, safety, and
welfare, the actions of planners should be based on a
knowledge of what has and has not worked in other
settings and situations. A large body of case study
results can provide an empirical foundation for
planners. A common method is helpful for both
practicing planners and scholars who should probe
and criticize the nuances of such a method in order
to expand and improve its utility.
The following chapters are organized roughly
parallel to the method. The identification of plan-
ning problems and opportunities is not discussed
independently because it is assumed that once an is-
sue has been defined, a process such as the one de-
scribed here will be triggered. In addition, many of
the techniques described in the next chapter can be
used to both define issues and establish goals. Also,
there are no separate discussions of regional- and
local-level ecological inventories (Steps 3 and 4) be-
cause the techniques used are similar. Instead, there
are separate detailed descriptions of inventories and
analyses of the biophysical environment and the hu-
man community.
The approach suggested here should be viewed
as a working method. The pioneering forester Gif-
ford Pinchot advocated a conservation approach to
the planning of the national forests. His approach
was both utilitarian and protectionist, and he be-
lieved “wise use and preservation of all forest re-
sources were compatible” (Wilkinson and Anderson
23INTRODUCTION
1985, 22). To implement this philosophy, Pinchot in
his position as chief of the U.S. Forest Service re-
quired “working plans.” Such plans recognized the
dynamic, living nature of forests. In the same vein,
the methods used to develop plans should be viewed
as a living process. However, this is not meant to im-
ply that there should be no structure to planning
methods. Rather, working planning methods should
be viewed as something analogous to a jazz compo-
sition: not a fixed score but a palette that invites im-
provisation.
The method offered here has a landscape ecolog-
ical—specifically, human ecological—bias. As noted
by the geographer Donald W. Meinig, “Environ-
ment sustains us as creatures; landscape displays us
as cultures” (1979, 3). As an artifact of culture, land-
scapes are an appropriate focus of planners faced
with land-use and environmental management is-
sues. Ecology provides insight into landscape pat-
terns, processes, and interactions. An understanding
of ecology reveals how we interact with each other
and our natural and built environments. What we
know of such relationships is still relatively limited,
but it is expanding all the time. As Ilya Prigogine
and Isabelle Stengers have observed, “Nature speaks
in a thousand voices, and we have only begun to lis-
ten” (1984, 77).
24CHAPTER 1


2IDENTIFYING ISSUES AND
ESTABLISHING PLANNING GOALS
27
Human communities are dynamic where change is inherent and integral. Change is
challenging—often presenting an opportunity and a problem simultaneously. For
communities, it is important to sort out the important issues associated with change
and to develop strategies for coping with the adjustments that may be necessary.
Involving people in decisions about the future is one way to help communities
address change. Participation is “the process by which public concerns, needs, and
values are incorporated into governmental decision making” (Creighton 1992, 10)
and “wherein citizens and government officials jointly plan or implement public
policies” (Sarkissian 1994, 11). James Creighton (1992) identifies eight benefits of
public participation: (1) improved quality of decisions, (2) the minimization of
costs, (3) consensus building, (4) increased ease of implementation, (5) the avoid-
ance of worst-case confrontations, (6) the maintenance of credibility and legiti-
macy, (7) the anticipation of public concerns and attitudes, and (8) the develop-
ment of public expertise and creativity. Even though there are many benefits,
citizens “will not participate in a . . . planning process unless: there are tangible
issues, they consider the issues significant, and they feel
their participation has a reasonable chance of making
a difference” (Institute for Participatory Management
and Planning 1997, III-12).
Wendy Sarkissian observes that the following four
components are required for citizen participation:
• Both citizens and government tacitly or explic-
itly agree to cooperate with each other in the for-
mation of policy.
• An atmosphere of mutual trust and respect must
dominate the process, although cooperation
need not be complete at all times.
• Both parties have real power to affect public-
policy decision-making. Although one side may
have more power than the other, the power of
neither side may be trivial.
• As a process, rather than as a stable state, partici-
pation may evolve or regress. It is possible that
cooperation may deepen or there may be a re-
turn to conflict (1994, 11).
Strategic planning is a process developed by busi-
nesses to set the course of change by linking plans to de-
cision making. The process has also been adopted by
NGOs, public agencies, and communities to chart their
futures. The strategic planning process begins with an
“environmental scan,” which helps to identify key issues
and the context. The environmental scan has some par-
allels to the ecological inventory that will be discussed
in the next two chapters. After the scan is completed,
the organization writes a mission statement, that is, a
brief declaration of the purposes for which the unit ex-
ists and functions. The mission statement attempts to
clearly delineate the purpose of the unit and its plan. It
may be helpful for the individuals undertaking the plan
to draft a mission statement at an early stage in the
planning process. This mission should be linked to the
key issues to be addressed in the planning process.
Early on, draft goals can be established to direct the
process. These goals will be refined through the pro-
cess and eventually formally adopted (see Chapter 7).
The Oregon statewide land-use planning law and the
comprehensive management plan for the New Jersey
Pinelands are two examples of planning that is goal
oriented and that emphasizes ecological concerns.
Techniques for Involving People in theIdentification of Issues and theEstablishment of Goals
The most straightforward means of arriving at spe-
cific planning goals in a democratic society is by vot-
ing. However, before goals reach a vote, they must be
defined. In addition, many issues do not reach a pop-
ular vote and are decided through actions by the leg-
islative and/or the administrative branches of gov-
ernment. As a result, a variety of means have been
developed to identify issues, to establish goals, and to
assess public opinion about potential issues and
goals. Some techniques include the use of task forces,
citizens’ and technical advisory committees, neigh-
borhood planning councils, group dynamics, nomi-
nal-group workshops, focus groups, and Delphi (Gil
and Lucchesi 1979). Policy Delphi is a variation on
the traditional Delphi technique. Once potential
goals are set, politicians and public officials often de-
pend on opinion polls for public reaction. Public
opinion polls are also used to survey the problems
and opportunities of an area and thereby to identify
issues. An alternative to impersonal polling is the
noisy, often emotional American tradition of the
town meeting, or its stepchild, the public hearing.
Task Forces
A task force is an ad hoc agency-sponsored citizens’
committee with a well-defined problem-solving or
specific task and charge relating usually to a single
problem or subject (Gil and Lucchesi 1979). Such a
specific task may be establishing goals for a plan.
The existence of task forces is temporary. The di-
rected purpose of a task force means membership is
limited in number to allow all members to partici-
28CHAPTER 2
pate actively and effectively. Typical task forces vary
in size from 8 to 20 participants. Task forces usually
rely on planning agencies for technical assistance
and support but sometimes engage outside experts
(U.S. Department of Transportation 1976a, 1976b).
For example, a county board of commissioners
organizes a task force to explore the feasibility of es-
tablishing a goal to protect prime farmland from de-
velopment. The commissioners must first answer
two questions: Who should be appointed to the task
force, and what should be the scope of the task force’s
activities? The county is experiencing considerable
growth, so the commissioners seek to act as quickly
as possible. They select a six-person task force: a soil
conservationist, an extension specialist, two farmers
(one who already serves on the planning commis-
sion, and one who is on the board of the soil and wa-
ter conservation district), a banker, and a local envi-
ronmental activist (who is a retired high-school
history teacher). The commissioners direct the
county planning department and the county attor-
ney to provide staff support for the task force.
The commissioners request that the task force
answer a series of questions within a three-month
schedule. How serious is the issue of farmland con-
version in the county? What are the economic and
fiscal consequences of the conversion? What has
been the level of past public investment in agricul-
ture in the county? Are some lands better suited for
agriculture than others? What state laws and pro-
grams encourage agricultural land protection? Are
other counties in the state facing the same issue? If
so, what actions have those counties undertaken? By
focusing on such questions the task force can help
the county commissioners assess the farmland con-
version issue and determine if a protection goal is
warranted.
Citizens’ Advisory Committees and Technical
Advisory Committees
Citizens’ advisory committees are presumed to repre-
sent the ideas and attitudes of local groups. Their
purpose is to advise some decision-making body
such as a planning commission, an agency staff, or a
developer (Gil and Lucchesi 1979).
Citizens’ advisory committees have become in-
creasingly popular for goal setting and policymak-
ing by legislative bodies (Institute for Participatory
Planning 1978). Citizens’ advisory committee is a
generic term that covers a variety of committees and
councils differing in type, membership, and opera-
tions. Most, however, share the following character-
istics: limited power and authority, large member-
ship (50 to 100 members), agency staff providing
technical assistance, a life span that is tied to the par-
ticular program or project, and infrequent meetings
of full membership (U.S. Department of Trans-
portation 1976a).
Technical advisory committees are groups that
represent bodies of technical or scientific informa-
tion important to a planning commission, agency,
or developer. Often these groups are interdiscipli-
nary or multidisciplinary. Citizens’ and technical
advisory committees may be organized similar to
task forces. However, their role encompasses a
broader scope than an individual task. These groups
may be involved in identifying issues, setting goals,
and later establishing preferences as well as imple-
menting the plan. Sometimes, such committees call
themselves “collaboratives” to emphasize their co-
operative intentions.
Technical advisory committee is also a generic
term. It may be an intraagency committee made up
of representatives from various staffs involved with
or interested in a specific program or project, or it
may be a group outside an agency from universities
or consulting companies.
Neighborhood Planning Councils
Neighborhood planning councils are organizations
formed by citizens or an outside community orga-
nizer that engage in a number of neighborhood
programs as well as in advocacy and advice (Gil and
Lucchesi 1979). In some cities, these groups are
29IDENTIFYING ISSUES AND ESTABLISHING PLANNING GOALS
called village planning committees or community
planning councils. Neighborhood planning councils
came into wide use during the 1960s as a result of
federally funded programs such as urban renewal
and model cities. These locally based councils serve
as advisory bodies to elected officials and public
agencies in identifying neighborhood problems
and issues, formulating goals and priorities, and
implementing and evaluating plans (U.S. Depart-
ment of Transportation 1976a). Sometimes, they
may be used to assist in spending federal or state
community development grants. In such cases,
spending is linked to neighborhood issues and
goals. Neighborhood councils are usually purely
advisory in nature and seldom have any decision-
making authority.
Organizing neighborhood groups is a complex
task. Two approaches familiar to many planners are
the Alinsky approach and organization development.
The former was developed by the famous Chicago
organizer Saul Alinsky. The steps in the Alinsky
(1946) approach include entering the community,
sizing it up, making contacts, bringing people to-
gether, developing leadership, working with organi-
zations, setting priorities, developing power tactics,
building political power, working on self-help
strategies, and exiting from the community.
Organization development is a discipline that
evolved from group dynamics and field theory,
which were established by psychologist Kurt Lewin.
Students and followers of Lewin, including Chris
Argyris, Warren Bennis, Carl Rogers, Edgar Schein,
and other behavioral scientists, differ from tradi-
tional social scientists in that their role as practi-
tioners, or change agents, occurs in organizations
outside the academic environment. Organization
development has been used extensively in large cor-
porate structures. Some community planners have
adapted these techniques for neighborhood-level
organizing. Richard Bolan explains organization de-
velopment in the following way: “The change agent,
together with the client group, analyzes the forces
available in support of, and resistant to, change.
Such techniques stress awareness of the need for
change and levels of change, methods for develop-
ing the goals of change, and the overcoming of resis-
tance to change” (1979, 538). Dan Iacofano (1990)
identifies citizen participation as an organizational
development process for environmental and com-
munity planning.
Once organized, neighborhood-level planning
councils may assist in the setting of goals for larger
communities and provide public participation in
other stages of the planning process. Their effective-
ness is dependent on the skill with which they are
organized and the level of interest in the neighbor-
hood. Pitfalls include the inability of neighborhood
groups to connect local issues to the needs of the
larger society, and the ephemeral nature of some of
these groups.
Group Dynamics
Group dynamics is a generic term for a variety of
problem-solving techniques used to clarify goals,
encourage group interaction, and resolve conflicts
within citizen groups (Gil and Lucchesi 1979). The
many techniques vary in their level of sophistication
and degree of activity but share some common
characteristics, including:
• Small-group involvement. Techniques are de-
signed for small groups ranging from 5 to 25
members. If a larger membership is involved,
the participants are divided into small groups.
• Skilled leadership. Techniques require the di-
rection of a group leader knowledgeable in
and comfortable with the use of the particular
technique. The role of the leader involves set-
ting the stage for the technique by providing a
general introduction and rationale, directing
the process and specific activities that may be
required, and generally keeping the process
going to its conclusion.
30CHAPTER 2
• Structured process. Each technique involves a
controlled, specified activity or series of or-
dered activities and/or tasks for all members
of the group.
• Timing. Each technique covers a specific time
span ranging from 30 to 90 minutes for com-
pletion (U.S. Department of Transportation
1976a, 104–105).
Group dynamics can be employed at almost any
stage of the planning process, including issue identi-
fication and goal setting, in which the public is par-
ticipating in an advisory committee, a task force, or
a neighborhood council. Some strategies employed
through group dynamics include empathy, feed-
back, videotaped group interview, brainstorming,
nominal-group workshops, and role playing (U.S.
Department of Transportation 1976a).
Nominal-Group Workshops
Nominal-group workshops are one form of group
dynamics. The Institute for Participatory Manage-
ment and Planning (formerly the Institute for Par-
ticipatory Planning) of Monterey, California, ex-
plains the concept in the following way: “This
technique is built on the premise that any reason-
ably representative group of people who are con-
cerned with a project [or issue], identify virtually all
of the problems associated with a project [or issue]
and can make the individual compromises that are
necessary for coming up with a single list of priori-
ties or preferences” (1978, V-6).
The nominal-group technique works in the fol-
lowing manner. A large group is brought together
and given a balanced presentation of the project or
subject being addressed by the workshop. This large
group is then divided into nominally small groups of
5 to 12 people. Each person then fills out several
blank 3 × 5 cards without consulting others in the
group. On each card, the individual writes one major
issue and several reasons why this issue is important.
Afterward, each person presents one issue to the
small group and why he or she considers it to be im-
portant. These issues are listed on a blackboard or
on a large sheet of paper. Members of the group take
turns presenting issues until all issues are exhausted.
The nominal groups’ issues are then presented to
the whole body. Often only the top 5 or 10 issues
from the nominal groups are presented to the larger
group. Next, a vote is taken. Each person ranks what
he or she considers to be the most important issues.
Often the top 5 or 10 issues are listed on the ballot.
The voting may be done using paper ballots; it is
also becoming popular to vote using computers that
give an instant tally (Delbecq et al. 1975; Institute
for Participatory Planning 1978; Institute for Partic-
ipatory Management and Planning 1997).
Next, the ballots are counted and ranked. This
ranking is followed by general discussion. People
lobby for and against issues. Another vote is taken,
and the results are listed in priority. If the ranking
has drastically changed, then another round of dis-
cussion, lobbying, and voting ensues. This contin-
ues until a consensus is reached (Delbecq et al. 1975;
Institute for Participatory Planning 1978; Institute
for Participatory Management and Planning 1997).
Nominal-group workshops have been used effec-
tively first to identify problems and opportunities
for an area and then to set goals.
Focus Groups
Focus groups were developed by business to elicit
opinions and information about new or existing
products. Similarly, social scientists and planners
use focus groups to assess public opinion about is-
sues and to help set goals (Krueger 1988; Leach
1992). A focus group consists of between 7 and 10
people who are not acquainted with one another but
who share similar backgrounds. The focus group
participants are brought together, typically for a
two-hour session, in a quiet, private room. An expe-
rienced facilitator guides and focuses discussion by
31IDENTIFYING ISSUES AND ESTABLISHING PLANNING GOALS
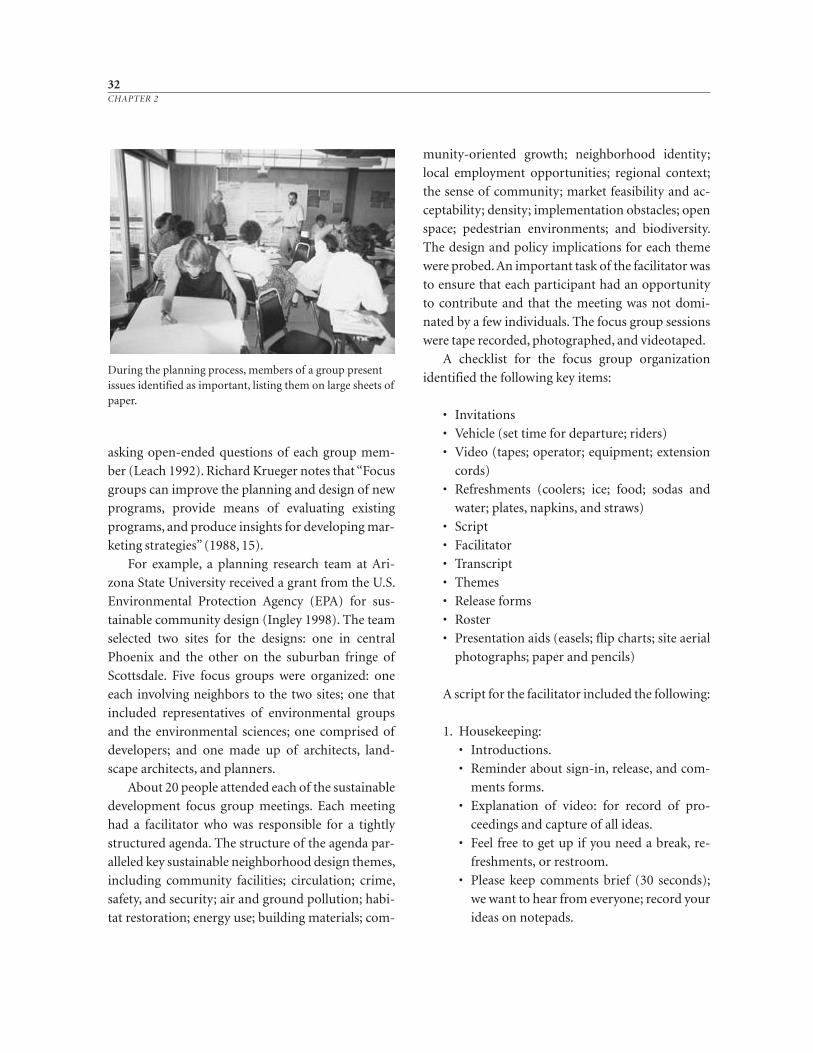
asking open-ended questions of each group mem-
ber (Leach 1992). Richard Krueger notes that “Focus
groups can improve the planning and design of new
programs, provide means of evaluating existing
programs, and produce insights for developing mar-
keting strategies” (1988, 15).
For example, a planning research team at Ari-
zona State University received a grant from the U.S.
Environmental Protection Agency (EPA) for sus-
tainable community design (Ingley 1998). The team
selected two sites for the designs: one in central
Phoenix and the other on the suburban fringe of
Scottsdale. Five focus groups were organized: one
each involving neighbors to the two sites; one that
included representatives of environmental groups
and the environmental sciences; one comprised of
developers; and one made up of architects, land-
scape architects, and planners.
About 20 people attended each of the sustainable
development focus group meetings. Each meeting
had a facilitator who was responsible for a tightly
structured agenda. The structure of the agenda par-
alleled key sustainable neighborhood design themes,
including community facilities; circulation; crime,
safety, and security; air and ground pollution; habi-
tat restoration; energy use; building materials; com-
munity-oriented growth; neighborhood identity;
local employment opportunities; regional context;
the sense of community; market feasibility and ac-
ceptability; density; implementation obstacles; open
space; pedestrian environments; and biodiversity.
The design and policy implications for each theme
were probed. An important task of the facilitator was
to ensure that each participant had an opportunity
to contribute and that the meeting was not domi-
nated by a few individuals. The focus group sessions
were tape recorded, photographed, and videotaped.
A checklist for the focus group organization
identified the following key items:
• Invitations
• Vehicle (set time for departure; riders)
• Video (tapes; operator; equipment; extension
cords)
• Refreshments (coolers; ice; food; sodas and
water; plates, napkins, and straws)
• Script
• Facilitator
• Transcript
• Themes
• Release forms
• Roster
• Presentation aids (easels; flip charts; site aerial
photographs; paper and pencils)
A script for the facilitator included the following:
1. Housekeeping:
• Introductions.
• Reminder about sign-in, release, and com-
ments forms.
• Explanation of video: for record of pro-
ceedings and capture of all ideas.
• Feel free to get up if you need a break, re-
freshments, or restroom.
• Please keep comments brief (30 seconds);
we want to hear from everyone; record your
ideas on notepads.
32CHAPTER 2
During the planning process, members of a group presentissues identified as important, listing them on large sheets ofpaper.
• As facilitator, I’m not here to share my
ideas, rather my role is to direct answers to
group; there are no right or wrong answers.
• This is not a debate about specifics. Site is
representative of fringe (or infill) develop-
ment in sensitive desert.
2. Objectives:
• Capture your visions for development on
the suburban fringe (or infill development).
• What do you think are the important ele-
ments for neighborhood design that con-
tribute to community well-being?
• Present your ideas for appropriate, sustain-
able development on the study site.
3. Discussion questions:
Tell the group briefly about yourself:
• Where you live.
• Your interest in the site, or in fringe devel-
opment in general.
How do you think the city is doing in terms of
environmentally sensitive development?
• What are the problems that need to be
fixed?
• What is appropriate with regard to: density;
open space; habitat protection; waste gen-
eration and disposal; energy consumption;
water consumption?
How does neighborhood design help to cre-
ate a sense of community? What elements
should it contain?
What are your views regarding “appropriate
development” for the site? Use the outline
maps in front of you or describe them in a se-
ries of statements.
What needs to be changed in order for your
vision to become reality?
Delphi
Delphi, developed in the 1950s by the RAND Cor-
poration, was originally used as a means of techno-
logical forecasting and is a technique that relies
strongly on experts. The name Delphi is taken from
the ancient Greek city where travelers went to con-
sult the oracle about the future (Linstone and Tur-
off 1975; U.S. Department of Transportation 1976a;
Institute for Participatory Management and Plan-
ning 1997). The idea is to conduct consecutive
rounds of argument, offering different points of
view about a project or issue, until finally reaching
a consensus. It is an indirect technique, compared
to the direct citizen participation approaches in-
volved in group dynamics.
Delphi works in the following manner. Experts
are chosen to form a Delphi panel. The Institute for
Participatory Management and Planning suggests
this may be done by conducting a survey among peo-
ple knowledgeable about a particular issue. This can
be accomplished, for example, through a biblio-
graphical search of the literature about the issue.
From the survey, well-informed individuals are
identified. These persons are contacted and asked to
nominate others who are also knowledgeable about
the subject. They are then contacted and asked to
nominate their own list of experts. After a while, the
same names keep reappearing. Experts representing
different points of view are sought. For instance, if
one is trying to establish land-use goals for a re-
claimed strip mine, one expert from the mining in-
dustry may be identified, while another may be from
a nature conservancy, another from agriculture, and
so on. The leading experts from the various points of
view become a Delphi panel that is never to meet or
know who the other members of the panel are (Insti-
tute for Participatory Planning 1978; Institute for
Participatory Management and Planning 1997).
This panel of 8 to 12 experts is asked to predict
the future of the project or issue. These predictions
are compiled and distributed to the panel without
identifying the authors. The panel reviews the
prophesies and each expert is given the opportunity
to change his or her own. If the predictions are
changed, then a second round is conducted. The
33IDENTIFYING ISSUES AND ESTABLISHING PLANNING GOALS
process is continued until the panel members reach
a consensus or remain firm in their forecasts. The
predictions may then be used by a citizens’ advisory
committee, technical advisory committee, neigh-
borhood council, planning commission, and/or
agency staff to establish goals and policy for the
project or issue.
Policy Delphi
Policy Delphi is an extension of traditional Delphi
techniques. It usually involves a 7- to 15-member
Delphi Expert Opinion Panel (Pease and Coughlin
1996; Steiner et al. 1994), although de Loë notes it
“can be used to facilitate interaction in groups of up
to 50 people” (1995, 53).
Like traditional Delphi, Policy Delphi is a multi-
ple-round, interactive technique. But whereas tradi-
tional Delphi is characterized by anonymity, the
Delphi Expert Opinion Panel meets and its mem-
bers interact. The group can consist of public em-
ployees with a technical knowledge of the planning
focus, representatives of business and industry, and
members of public-interest groups and the public.
Needham and de Loë observe that purposes of
Policy Delphi include identifying “problems and is-
sues or . . . to generate new information about prob-
lems and issues” (1990, 134). Policy Delphi is espe-
cially useful early in the planning process, when
issues and preliminary goals are being identified.
Robert de Loë (1995) argues that Policy Delphi be
employed as a precursor to more in-depth work-
shops or interviews.
De Loë identifies Policy Delphi an “idea-gener-
ating strategy.” The technique was first proposed by
Turoff (1970, 1975) and subsequently refined by de
Loë (1995, 1990 with Needham). Policy Delphi de-
sign includes the following six steps:
1. Formulation of the issues. What is the issue
that really should be under consideration?
How should it be stated?
2. Exposing the options. Given the issue, what are
the policy options available?
3. Determining initial positions on the issues.
Which are the ones everyone already agrees
upon and which are the unimportant ones to
be discarded? Which are the ones exhibiting
disagreement among the respondents?
4. Exploring and obtaining the reasons for dis-
agreements. What underlying assumptions,
views, or facts are being used by the individu-
als to support their respective positions?
5. Evaluating the underlying reasons. How does
the group view the separate arguments used
to defend various positions and how do they
compare to one another on a relative basis?
6. Reevaluating the options. Reevaluation is
based on the views of the underlying “evi-
dence” and the assessment of its relevance to
each position taken (adapted from Turoff
1975 by de Loë 1995, 58).
The foregoing techniques are the major ones
used for identifying issues and establishing goals.
These and others may be used in the subsequent
stages of the planning process. The Institute for Par-
ticipatory Management and Planning has developed
a matrix of citizen participation techniques and
their relative effectiveness (Figure 2.1). Each plan-
ning issue or project should help to determine the
appropriate participation technique. An effort
should be made to keep people involved in the sub-
sequent steps of the planning process. Sign-up
sheets should be collected at all meetings and those
lists used to keep people informed over time. Con-
tinual communication between the public and the
planning agency or consultant can create knowl-
edgeable citizens who will support decisions that re-
sult from the process. Some planners have found it
helpful to maintain a clipping file of newspaper arti-
cles about public meetings to document public in-
volvement and the planning process. For many
planning processes, these direct participation tech-
34CHAPTER 2
niques need to be augmented by public opinion
polls to ensure that diverse views are recognized.
Public Opinion Polls
Preference surveys, or public opinion polls as they are
more commonly known, have become a ubiquitous
part of American life. Surveys can be conducted
through the mail, over the telephone, or by face-to-
face interviews. Public opinion polls can be used to
identify issues and to set goals. One of the leading
practitioners of preference surveying, Don Dillman,
a professor of sociology at Washington State Univer-
sity, has suggested that there are three schools of
thought concerning public opinion polls. The first is
“do not conduct polls.” The second view is that sur-
veys are fundamental for community participation.
Finally, the third school of thought is that polls can
be useful—if done well.
Preference surveys are popular for several rea-
sons. They are convenient for planners and other re-
searchers; a researcher does not have to leave the
comforts of her or his office to write a survey or
compile the results. Moreover, results are relatively
simple to tabulate. In this age of computers it is im-
portant that research results can be tabulated for
statistical analysis. Finally, polls can be used to
demonstrate that the government pays attention to
what the people are saying; thus, “because the gov-
ernment is responsive, democracy is working.”
The first of the arguments used by people who
are pessimistic about the usefulness of polls is that
“people are not well enough informed or otherwise
capable of stating their real preferences” (Dillman
1977, 31). Dillman questions whether people who
never went to high school can effectively assess the
needs of higher education, or whether people whose
medical experience consists of an annual checkup
can accurately determine community health care
needs. Land-use and natural resource management
issues are equally complicated and may involve
technical issues difficult for the average citizen to
understand, as, for example, the siting of a nuclear
power plant or hazardous waste disposal. Social and
environmental issues are also becoming more com-
plex, requiring more specialized knowledge, and
may not lend themselves to simple yes, no, maybe,
or no-opinion responses.
The second basis of criticism raised by Dillman
concerning the use of surveys is the belief that “peo-
ple’s stated preferences are superficial and likely
to change; thus, they can provide an inadequate ba-
sis for making decisions with long-lasting conse-
quences” (1977, 32). A community’s perception of a
need for a service—a school, hospital, or highway—
may be higher than its willingness to pay for the
same service. A citizen may want the convenience of
cheap electrical power or plastic garbage bags but
resist the siting of a power generating plant or
chemical factory in her or his community.
The final criticism is a technical one: “The pro-
cedures used for assessing people’s preferences are
inevitably inadequate, leaving a very large gap be-
tween survey questions and policy questions they
were supposed to address” (Dillman 1977, 32). Dill-
man (1978) gives several examples. For instance, a
survey may ask very general questions, such as, “Do
you consider juvenile delinquency to be a serious,
moderate, slight, or no problem in this commu-
nity?” and then attempt to use them to address a
specific issue: “Should we increase the parks and
recreation budget by 25 percent?”
Dillman presents two models for policy surveys
(Figure 2.2). The first, the independent survey, is il-
lustrative of the typical, simplistic one-shot survey.
His alternative, the synchronized survey, is one that
can be used as an integral part of the entire planning
process. In Chapter 4, surveys are discussed as a com-
munity inventory technique, while in Chapter 6, the
synchronized survey is presented as a means for the
selection of preferences among various choices.
Another form of opinion polling is the com-
munity self-survey. In this less scientific approach,
the people of an area write and collect a survey
35IDENTIFYING ISSUES AND ESTABLISHING PLANNING GOALS
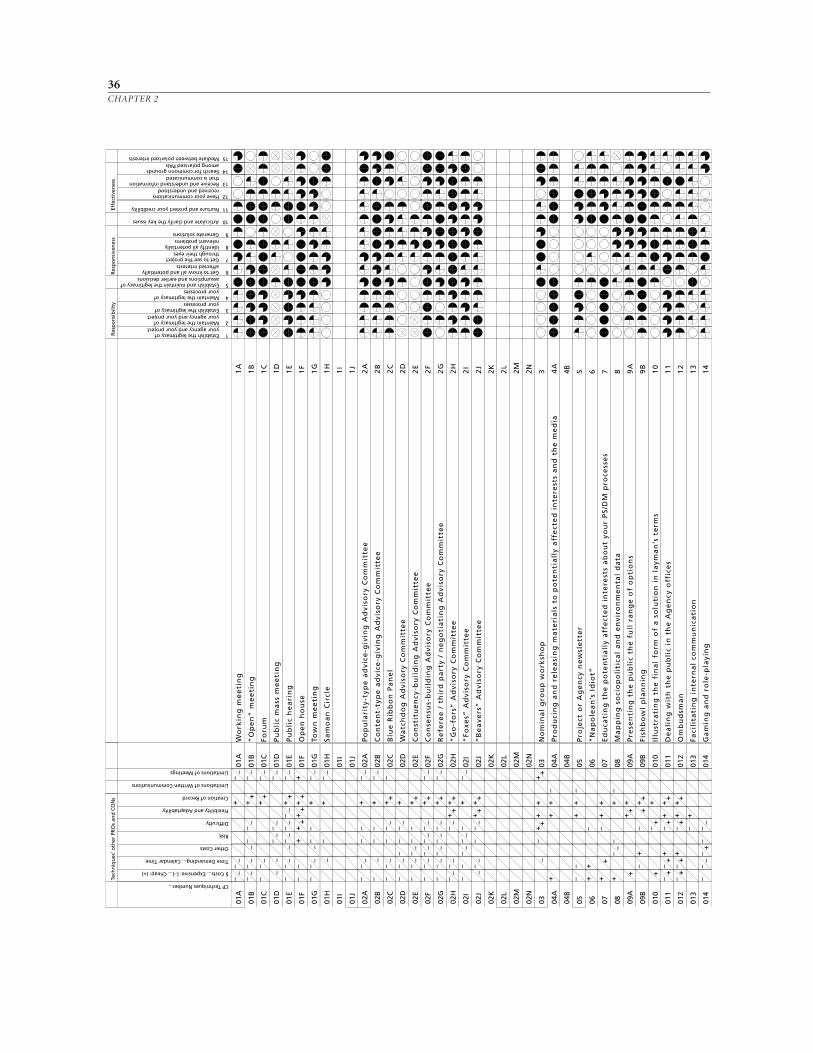
36CHAPTER 2
01A
– –
– –
+
– –
01A
Wo
rkin
g m
ee
tin
g
1
A
01B
– –
– –
–
– –
–+
+–
–01
B“
Op
en
” m
ee
tin
g
1
B
01C
–
– –
+ +
– –
01C
Foru
m
1C
01D
–
–
– –
– –
–
–01
DP
ub
lic
ma
ss m
ee
tin
g
1D
01E
– –
–
––
––
––
–+
+
– –
01E
Pu
bli
c h
ea
rin
g
1
E
01F
– –
+
+ +
+ +
+ +
+
01F
Op
en
ho
use
1
F
01G
– –
–
––
– +
–
–01
GTo
wn
me
eti
ng
1
G
01H
–
– +
–
–01
HSa
mo
an
Cir
cle
1
H
01I
01
I
1I
01J
01
J
1
J
02A
– –
––
– +
–
–02
AP
op
ula
rity
-typ
e a
dvi
ce-g
ivin
g A
dvi
sory
Co
mm
itte
e
2
A
02B
–
––
– +
–
–02
BC
on
ten
t-ty
pe
ad
vice
-giv
ing
Ad
viso
ry C
om
mit
tee
2
B
02C
– –
––
– –
++
–
02C
Blu
e R
ibb
on
Pa
ne
l
2
C
02D
– –
––
– –
–+
02
DW
atc
hd
og
Ad
viso
ry C
om
mit
tee
2
D
02E
– –
––
––
– +
+
02E
Co
nst
itu
en
cy-b
uil
din
g A
dvi
sory
Co
mm
itte
e
2E
02F
– –
––
––
––
–+
+
– –
02F
Co
nse
nsu
s-b
uil
din
g A
dvi
sory
Co
mm
itte
e
2F
02G
– –
––
––
––
–+
+
– –
02G
Re
fere
e /
th
ird
pa
rty
/ n
eg
oti
ati
ng
Ad
viso
ry C
om
mit
tee
2
G
02H
– –
– –
– –
++
++
02
H“
Go
-fo
rs”
Ad
viso
ry C
om
mit
tee
2
H
0 2I
– –
– –
– –
– +
–
–02
I“
Foxe
s” A
dvi
sory
Co
mm
itte
e
2I
02J
–
– –
– –
–+
++
+
02J
“B
ea
vers
” A
dvi
sory
Co
mm
itte
e
2J
02K
02
K
2K
02L
02
L
2L
02M
02
M
2M
02N
02
N
2N
04A
++
+
– 04
AP
rod
uci
ng
an
d r
ele
asi
ng
ma
teri
als
to
po
ten
tia
lly
aff
ect
ed
in
tere
sts
an
d t
he
me
dia
4
A
04B
04
B
4B
03
––
++
++
+
+03
No
min
al
gro
up
wo
rksh
op
3
05–
– +
+
– 05
Pro
ject
or
Ag
en
cy n
ew
sle
tte
r
5
07+
+
–+
+
07E
du
cati
ng
th
e p
ote
nti
all
y a
ffe
cte
d i
nte
rest
s a
bo
ut
you
r P
S/D
M p
roce
sse
s7
06+
+–
06
“N
ap
ole
an
’s I
dio
t”
6
08+
– –
– +
–
08M
ap
pin
g s
oci
op
oli
tica
l a
nd
en
viro
nm
en
tal
da
ta
8
09A
+
++
+
09A
Pre
sen
tin
g t
he
pu
bli
c th
e f
ull
ra
ng
e o
f o
pti
on
s
9
A
09B
– +
–
++
+
09B
Fish
bo
wl
pla
nn
ing
9
B
010
+
– +
+
010
Illu
stra
tin
g t
he
fin
al
form
of
a s
olu
tio
n i
n l
aym
an
’s t
erm
s
10
011
– +
– +
+–
++
++
01
1D
ea
lin
g w
ith
th
e p
ub
lic
in t
he
Ag
en
cy o
ffic
es
1
1
012
– +
– +
+–
++
++
01
2O
mb
ud
sma
n
12
013
–+
01
3Fa
cili
tati
ng
in
tern
al
com
mu
nic
ati
on
1
3
014
– –
––
+–
– –
01
4G
am
ing
an
d r
ole
-pla
yin
g
14
Tech
niq
ues
’ oth
er P
RO
s an
d C
ON
s
Res
po
nsi
bili
ty
Res
po
nsi
ven
ess
Eff
ecti
ven
ess
CP Techniques Number...
$ Costs... Expensive: (–)... Cheap: (+)
Time Demanding... Calendar Time
Other Costs
Risk
Difficulty
Flexibility and Adaptability
Creation of Record
Limitations of Written Communications
Limitations of Meetings
1Establish the legitimacy of your agency and your project
2Maintain the legitimacy ofyour agency and your project
3Establish the legitimacy ofyour processes
4Maintain the legitimacy ofyour processes
5Establish and maintain the legitimacy ofassumptions and earlier decisions
6Get to know all and potentially affected interests
7Get to see the project through their eyes
8Identify all potentially relevant problems
9Generate solutions
10Articulate and clarify the key issues
11Nurture and protect your credibility
12Have your communications received and understood
13Receive and understand information that is communicated
14Search for commonn grounds among polarized PAIs
15Mediate between polarized interests
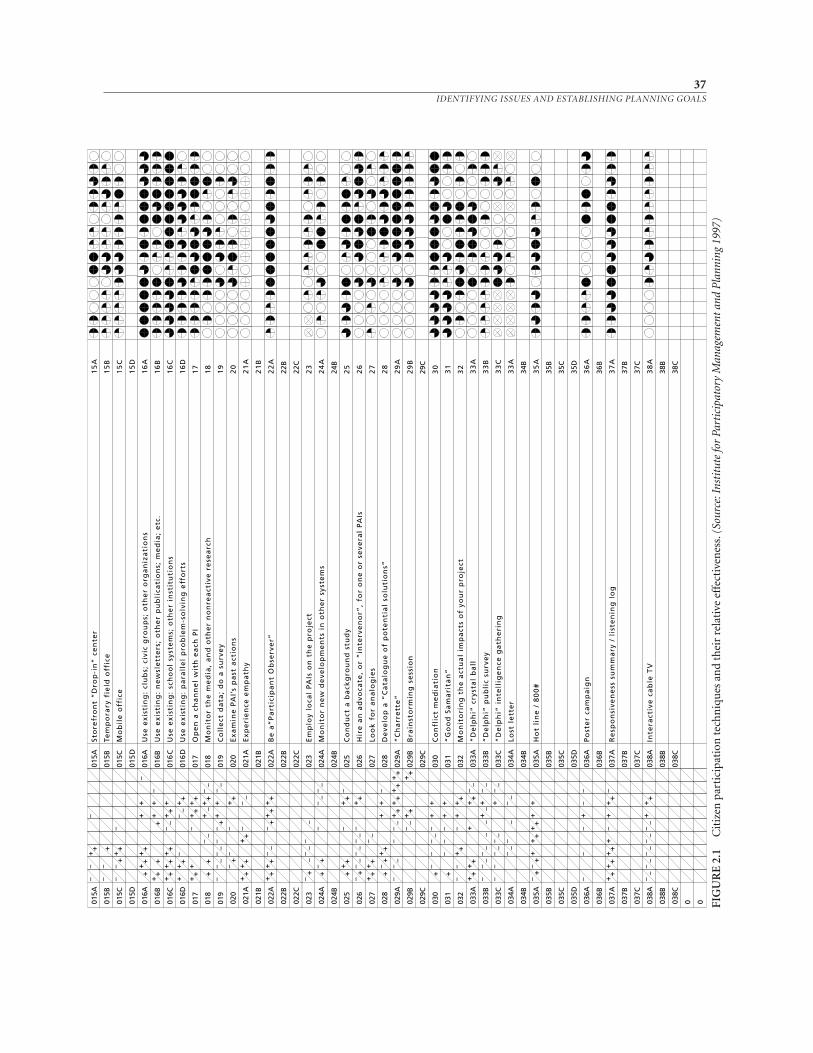
37IDENTIFYING ISSUES AND ESTABLISHING PLANNING GOALS
015A
– –
++
–
015A
Sto
refr
on
t “
Dro
p-i
n”
ce
nte
r
15
A
015B
– –
+
01
5BTe
mp
ora
ry f
ield
off
ice
15
B
015C
– –
++
+–
01
5CM
ob
ile
off
ice
1
5C
015D
01
5D
1
5D
016A
+
++
++
++
–
016A
Use
exi
stin
g:
clu
bs;
civ
ic g
rou
ps;
oth
er
org
an
iza
tio
ns
1
6A
016B
++
+
+
++
–
016B
Use
exi
stin
g:
ne
wsl
ett
ers
; o
the
r p
ub
lica
tio
ns;
me
dia
; e
tc.
16
B
016C
++
++
++
– –
++
+
016
CU
se e
xist
ing
: sc
ho
ol
syst
em
s; o
the
r in
stit
uti
on
s
1
6C
016D
++
+–
– –
++
01
6D
Use
exi
stin
g:
pa
rall
el
pro
ble
m-s
olv
ing
eff
ort
s
1
6D
017
++
+–
++
++
01
7O
pe
n a
ch
an
ne
l w
ith
ea
ch P
I
17
018
+
+
– –
+ –
++
– –
018
Mo
nit
or
the
me
dia
, a
nd
oth
er
no
nre
act
ive
re
sea
rch
1
8
019
– –
––
––
– +
++
–
–01
9C
oll
ect
da
ta;
do
a s
urv
ey
1
9
020
– +
– –
++
02
0E
xam
ine
PA
I’s
pa
st a
ctio
ns
2
0
021B
02
1B
21
B
021A
++
++
++
––
– 02
1AE
xpe
rie
nce
em
pa
thy
2
1A
022A
++
++
– –
– +
++
++
02
2AB
e a
“P
art
icip
an
t O
bse
rve
r”
22
A
022B
02
2B
22B
022C
02
2C
22C
023
– +
–
– –
–
–
023
Em
plo
y lo
cal
PA
Is o
n t
he
pro
ject
2
3
024A
+
– +
– –
– – –
024A
Mo
nit
or
ne
w d
eve
lop
me
nts
in
oth
er
syst
em
s
24
A
024B
02
4B
24B
025
+
++
–+
+ –
025
Co
nd
uct
a b
ack
gro
un
d s
tud
y
25
0 26
– +
– –
– –
– –
– +
+
026
Hir
e a
n a
dvo
cate
, o
r “
inte
rve
no
r”,
for
on
e o
r se
vera
l P
AIs
2
6
027
++
++
– –
02
7Lo
ok
fo
r a
na
log
ies
2
7
028
+
– +
++
++
–
028
De
velo
p a
“C
ata
log
ue
of
po
ten
tia
l so
luti
on
s”
28
029A
– –
––
– –
++
++
++
++
029A
“C
ha
rre
tte
”
29
A
029B
– –
++
+
+02
9BB
rain
sto
rmin
g s
ess
ion
2
9B
030
+
– –
– –
– +
+
030
Co
nfl
ict
me
dia
tio
n
30
029C
02
9C
29C
032
– –
++
–+
++
03
2M
on
ito
rin
g t
he
act
ua
l im
pa
cts
of
you
r p
roje
ct
32
031
+
–
– –
++
03
1“
Go
od
Sa
ma
rita
n”
3
1
033A
++
++
++
+ –
–03
3A“
De
lph
i” c
ryst
al
ba
ll
33
A
033B
– –
––
–
–
–+
–+
–
–03
3B“
De
lph
i” p
ub
lic
surv
ey
3
3B
033C
– –
– –
– –
+
– –
033C
“D
elp
hi”
in
tell
ige
nce
ga
the
rin
g
33
C
034A
– –
–
––
– 03
4ALo
st l
ett
er
3
3A
034B
03
4B
34B
035A
– +
– +
++
++
++
+
035A
Ho
t li
ne
/ 8
00
#
35
A
035B
03
5B
35B
035C
03
5C
35C
035D
03
5D
35D
036A
– –
–+
– –
036A
Po
ste
r ca
mp
aig
n
36
A
036B
03
6B
36B
037A
++
++
++
+–
++
+ –
037A
Re
spo
nsi
ven
ess
su
mm
ary
/ l
iste
nin
g l
og
3
7A
037C
03
7C
37C
037B
03
7B
37B
038A
– –
– –
– –
– –
– –
++
+
038A
Inte
ract
ive
ca
ble
TV
3
8A
038B
03
8B
38B
038C
03
8C
38C
0 0
5Fi
gu
re 2
.1C
itiz
en p
arti
cip
atio
n t
ech
niq
ues
an
d t
hei
r re
lati
ve e
ffec
tive
nes
s (S
ou
rce:
Inst
itu
te f
or
Part
icip
ato
ry M
anag
emen
t an
d P
lan
nin
g, 1
997)
FIG
UR
E 2
.1C
itiz
en p
arti
cipa
tion
tech
niq
ues
an
d th
eir
rela
tive
eff
ecti
ven
ess.
(So
urce
: Ins
titu
te fo
r Pa
rtic
ipat
ory
Man
agem
ent a
nd P
lann
ing
1997
)
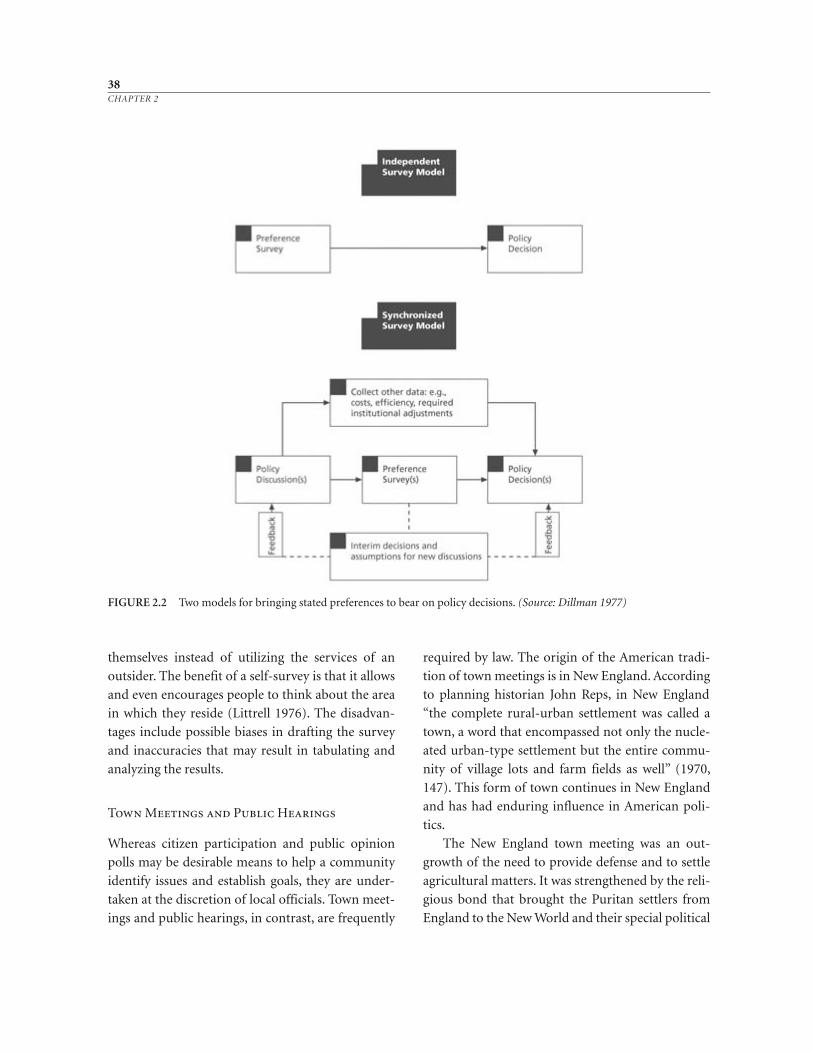
themselves instead of utilizing the services of an
outsider. The benefit of a self-survey is that it allows
and even encourages people to think about the area
in which they reside (Littrell 1976). The disadvan-
tages include possible biases in drafting the survey
and inaccuracies that may result in tabulating and
analyzing the results.
Town Meetings and Public Hearings
Whereas citizen participation and public opinion
polls may be desirable means to help a community
identify issues and establish goals, they are under-
taken at the discretion of local officials. Town meet-
ings and public hearings, in contrast, are frequently
required by law. The origin of the American tradi-
tion of town meetings is in New England. According
to planning historian John Reps, in New England
“the complete rural-urban settlement was called a
town, a word that encompassed not only the nucle-
ated urban-type settlement but the entire commu-
nity of village lots and farm fields as well” (1970,
147). This form of town continues in New England
and has had enduring influence in American poli-
tics.
The New England town meeting was an out-
growth of the need to provide defense and to settle
agricultural matters. It was strengthened by the reli-
gious bond that brought the Puritan settlers from
England to the New World and their special political
38CHAPTER 2
FIGURE 2.2 Two models for bringing stated preferences to bear on policy decisions. (Source: Dillman 1977)
adeptness. The topography and hostile native peo-
ple reinforced the group consciousness already
forged by religious persecution and military frater-
nity.
While the village became the focus of the New
England community, agriculture became its chief
occupation. Lots were drawn for house sites in the
village, and the surrounding farmland was divided
into long strips, also assigned by drawing lots. Reps
explains the unique farming structure:
While the strips themselves were not fenced, it was the
usual practice to enclose an entire field by a wooden
paling. Each farmer then became responsible for his
proportionate share of the fencing. . . . [The group
met to determine] what would be grown, when they
should be harvested and what land should be left in
fallow. Common cultivation was thus carried out
(1970, 148).
The Puritans who developed this system of com-
mon fields, or proprietor’s commons, were not a po-
litically naive group. They had risen in the sixteenth
century in the Church of England, demanding
greater strictness in religious discipline. During part
of the seventeenth century they constituted a pow-
erful political party, ruling England briefly after its
bloody civil war. As a result, the New England town
meeting was a sophisticated forum where defensive,
agricultural, and other political matters were de-
cided after open debate and discussion. Today town
meetings continue to be an integral part of local
government in New England.
Beginning with President Jimmy Carter, tele-
vised town meetings have become increasingly pop-
ular with politicians. He and other elected officials
have used these broadcasted town meetings “as a
tool to stay in touch with the grass roots” (Institute
for Participatory Management and Planning 1997,
V-15). Town meetings are usually semiformal in
their structure. The addition of television cameras
adds formality to the gatherings.
Another contemporary heir of the New England
town meeting for most of the United States is the
public hearing. City planners have advocated public
hearings as an essential part of good government
and comprehensive planning since the beginning of
the twentieth century. Hearings are now a part of
most municipal and county governments in the
United States and are often mandated by federal and
state law. Planning commissions as well as the local
legislative body—the city council or board of
county commissioners—are often required to hold
hearings in order to make plans and to amend them.
Nowadays, many local issues are debated at public
hearings and goals are discussed. A group of citizens
may raise an issue at a public hearing, and as a result
the planning commission, city council, or county
commission may resolve to address the issue.
Diori Kreske observes that public hearings “are
normally more formal than public meetings” (1996,
267). Many American states have strict laws that
govern the conduct of a hearing. According to
Kreske, a “hearing may have (1) a public official who
presides over the hearing, (2) ground rules on how
the hearing will be conducted, (3) a speaker’s micro-
phone and podium, and (4) a court reporter or tape
recording of the proceedings, or both” (1996, 267).
Often public hearings can provide the best en-
tertainment in town. Certainly they have more di-
mensions than the average television fare, but to
participate one must leave the comfortable confines
of one’s own home. Many local governments have
experimented with broadcasting hearings on cable
television public access stations, but such programs
seldom dent the Nielsen ratings. The result is that
public hearings become dominated by single-issue
adversary groups or special interests.
Efraim Gil and Enid Lucchesi explain this situa-
tion in the following way:
Citizen participation is most often stimulated by ex-
isting social problems coupled with a lack of con-
fidence in official solutions—and it varies with
39IDENTIFYING ISSUES AND ESTABLISHING PLANNING GOALS
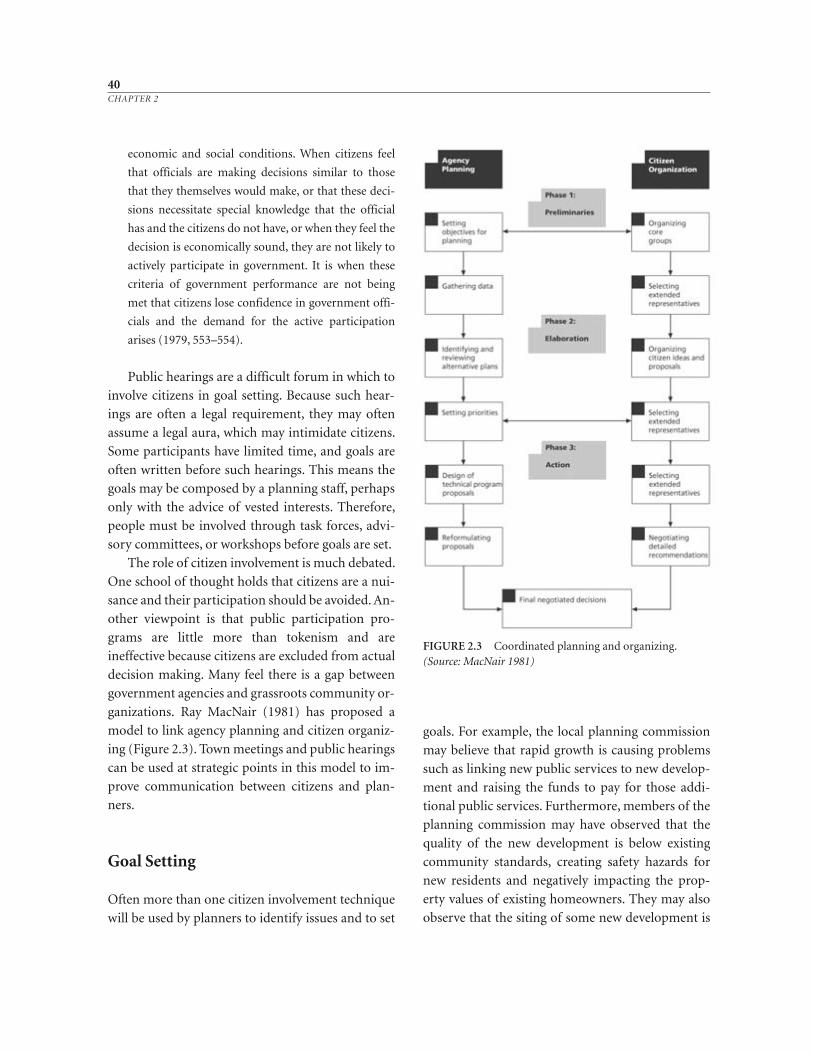
economic and social conditions. When citizens feel
that officials are making decisions similar to those
that they themselves would make, or that these deci-
sions necessitate special knowledge that the official
has and the citizens do not have, or when they feel the
decision is economically sound, they are not likely to
actively participate in government. It is when these
criteria of government performance are not being
met that citizens lose confidence in government offi-
cials and the demand for the active participation
arises (1979, 553–554).
Public hearings are a difficult forum in which to
involve citizens in goal setting. Because such hear-
ings are often a legal requirement, they may often
assume a legal aura, which may intimidate citizens.
Some participants have limited time, and goals are
often written before such hearings. This means the
goals may be composed by a planning staff, perhaps
only with the advice of vested interests. Therefore,
people must be involved through task forces, advi-
sory committees, or workshops before goals are set.
The role of citizen involvement is much debated.
One school of thought holds that citizens are a nui-
sance and their participation should be avoided. An-
other viewpoint is that public participation pro-
grams are little more than tokenism and are
ineffective because citizens are excluded from actual
decision making. Many feel there is a gap between
government agencies and grassroots community or-
ganizations. Ray MacNair (1981) has proposed a
model to link agency planning and citizen organiz-
ing (Figure 2.3). Town meetings and public hearings
can be used at strategic points in this model to im-
prove communication between citizens and plan-
ners.
Goal Setting
Often more than one citizen involvement technique
will be used by planners to identify issues and to set
goals. For example, the local planning commission
may believe that rapid growth is causing problems
such as linking new public services to new develop-
ment and raising the funds to pay for those addi-
tional public services. Furthermore, members of the
planning commission may have observed that the
quality of the new development is below existing
community standards, creating safety hazards for
new residents and negatively impacting the prop-
erty values of existing homeowners. They may also
observe that the siting of some new development is
40CHAPTER 2
FIGURE 2.3 Coordinated planning and organizing.(Source: MacNair 1981)
causing environmental damage and creating poten-
tial health and safety problems.
The planning commissioners may then request
the staff planner or a consultant to study the situa-
tion. The staff or consulting planner may conduct a
mail survey of the planning area to determine if in-
deed these perceptions are accurate. If the findings
of the survey are affirmative, a task force may be or-
ganized to recommend goals for addressing the
problems created by the growth. These suggested
goals are presented at hearings before the planning
commission, which can in turn recommend that
goals be established by the county commission or
city council. At this step in the planning process,
goals should be considered preliminary. Still there
should be some agreed-upon goal statement to
guide the rest of the process. To address the growth
issue, for instance, the goal could be “to provide for
planned and orderly development within the plan-
ning area, while balancing basic human needs of a
changing population and maintaining a healthy en-
vironment for future generations.”
In an ecological planning process, goals should
be approached in an evolutionary manner. At this
early step in the planning process, some consensus
should be reached about the direction to be taken to
address the problems and opportunities facing the
area. These aims should be debated and refined
throughout the planning process, as suggested by
the central position of Step 8 in Figure 1.1. At some
point, goals need to be adopted formally. In Chapter
7, it is recommended that goals become part of a
landscape plan.
Two Examples of Goal-Oriented Planning
Most plans include goals. Few plans link goals to
sustained action. Oregon and the New Jersey
Pinelands provide examples of planning efforts
where goals direct decision making. To borrow from
Michael Neuman, these plans “chart collective
hope.” Neuman argues that “we need to better un-
derstand the connection of people to place to plan,
if we want to respond to the needs of residents
rather than regulations” (1998a, 214).
The Oregon Comprehensive Planning Law
Beginning in the 1960s and continuing to the pres-
ent, several states adopted ambitious, new land-use
planning laws. These new laws often prescribe that
local governments adopt specific goals. Among the
most far-reaching statewide planning efforts are
those of Hawaii, Vermont, Oregon, and Florida
(Bosselman and Callies 1971; Bosselman et al. 1973;
Callies 1980; DeGrove 1984; Kelly 1993; Nelson and
Duncan 1995).
The Oregon comprehensive law provides one of
the best examples of statewide goal-oriented plan-
ning. The Oregon program began in 1969 with
Senate Bill 10 and expanded significantly with the
passage of Senate Bill 100 in 1973 (Carson 1998).
With Governor Tom McCall and state senators
Hector Macpherson and Ted Hallek providing the
leadership, Senate Bill 100 was created by the Ore-
gon legislature. The law established the Land Con-
servation and Development Commission (LCDC),
and authorized the governor to appoint citizen
members to the LCDC and the LCDC to coordi-
nate planning in Oregon. The Department of Land
Conservation and Development (DLCD) was
formed to administer the law. Nineteen goals
were set as regulations to be followed by city and
county governments throughout the state. (Since
some goals are specific to coastal counties or those
along the Willamette River, the number of goals
that local governments must follow varies with
their location.) The goals were established in 1975
after a program of 127 citizen workshops that
involved 10,000 participants (Pease 1984). Each
of these goals reveals much about the problems
and opportunities facing Oregon and the policies
41IDENTIFYING ISSUES AND ESTABLISHING PLANNING GOALS
established to address the planning issues raised by
those problems and opportunities.
The 19 statewide goals are printed in a 24-page
newsprint tabloid that has been continuously re -
printed and distributed throughout the state since
1975. More recently the goals have also become
available on DLCD’s website (www.lcd.state.or.us).
The tabloid and the website offer accessible easy-to-
read formats. Definitions of the technical terms are
provided. As a result, Oregon’s statewide goals are
familiar throughout the state. The goals are not a
thick technical report that has languished and been
forgotten on someone’s office bookshelf. Nor are
the goals a vapid “vision” statement printed on
glossy paper and soon forgotten. A review of several
of Oregon’s goals helps to illustrate the thrust of the
plan. There are three types of goals: process goals (1
and 2); conservation goals (3, 4, 5, 6, 7, 8, and 15);
and development goals (9, 10, 11, 12, 13, 14). The
coastal goals only apply to jurisdictions bordering
the ocean and are not applicable to most jurisdic-
tions, just as goal 15, the Willamette Greenway
Goal, only applies to that river corridor. The first
goal, a statewide goal, addresses citizen involve-
ment: “To develop a citizen involvement program
that [ensures] the opportunity for citizens to be in-
volved in all phases of the planning process” (Land
Conservation and Development Commission 1980,
3; Department of Land Conservation and Develop-
ment 1996).
This goal statement and the ones that follow are
accompanied by specific planning and implemen-
tation guidelines. The guidelines for the first goal
include standards for public involvement, commu-
nication, citizen influence, technical information,
feedback mechanisms, and financial support (see
Chapter 8). Citizens are to be involved throughout
the planning process in inventorying, recording,
mapping, describing, analyzing, and evaluating the
elements necessary for the development of local
plans. The public is to participate in the prepara-
tion of local plans and the adoption process, plus
the implementation, evaluation, and revision of
plans.
The second statewide goal addresses land-use
planning. It is the second goal of Oregon:
To establish a land-use planning process and policy
framework as a basis for all decisions and actions re-
lated to the use of land and to assure an adequate fac-
tual base for such decisions and actions. City, county,
state, and federal agency and special district plans and
actions related to land use shall be consistent with the
comprehensive plans of cities and counties and re-
gional plans (Land Conservation and Development
Commission 1980, 4; Department of Land Conserva-
tion and Development 1996).
The land-use planning goal is accompanied by a
statement explaining where exceptions could be
made under certain circumstances. An integrated
framework is required for the preparation of plans
and implementation measures; the conformance of
regional, state, and federal plans; the content of the
plan; the filing of plans; revisions during the plan-
ning process; implementation measures; and the
use of the statewide planning goals (Land Conser-
vation and Development Commission 1980) (see
Chapter 7).
The LCDC specifies how plans should be done,
and it mandates that plans must address the goals
and that plans must be based on findings of fact, but
what actually goes into the plan is up to the local ju-
risdiction. Oregon guidelines describe both the fac-
tual basis for the plan as well as planning elements.
The factual basis of the plan should include data as
they relate to the goals. These data address natural
resources, human-made structures and utilities,
population and economic characteristics, and the
roles and responsibilities of governmental units.
The elements of the plan include the applicable
statewide planning goals, any critical geographic
area designated by the Oregon legislature, specific
local issues, and time periods of the plan. These ele-
42CHAPTER 2
ments are to fit together and relate to one another to
form a consistent whole at all times (Department of
Land Conservation and Development 1996).
The suggested guidelines for land-use imple-
mentation include management measures like ordi-
nances controlling the use and construction on the
land, such as building codes, sign ordinances, subdi-
vision regulations, and zoning ordinances. Oregon
statutes require that subdivision and zoning ordi-
nances be used to implement the jurisdiction’s com-
prehensive plan. Additional management measures
are specific plans for public facilities, capital im-
provement budgeting, state and federal land-use
regulations, and annexations and other governmen-
tal boundary reorganizations. Site and specific area
implementation measures include building permits,
septic tank permits, driveway permits, subdivision
review, zone changes, conditional use permits, the
construction of public facilities, the provision of
land-related public services such as fire and police,
the awarding of state and federal grants to local gov-
ernments to provide these facilities and services, and
the leasing of public lands (Land Conservation and
Development Commission 1980). Plan implemen-
tation measures are discussed in greater detail in
Chapter 10.
Implementation, however, begins with the goals.
For example, the third statewide planning goal is to
preserve and maintain agricultural lands. This goal
states: “Agricultural lands shall be preserved and
maintained for farm use, consistent with existing
and future needs for agricultural products, forest,
and open space and with the state’s agricultural
land-use policy” (Land Conservation and Develop-
ment 1996).
Oregon counties authorize farm uses and those
nonfarm uses defined by LCDC rule that do not
have significant adverse impacts on farm or forest
practices. Agricultural zoning implements the goal.
Such zoning limits uses that can have significant ad-
verse effects on agricultural and forest land, farm
and forest uses, and accepted farming or forest prac-
tices. The Land Conservation and Development
Commission has directed counties to establish min-
imum sizes for new lots or parcels in each agricul-
tural zoning designation. These minimum sizes are
to be appropriate to sustain the existing commercial
agricultural enterprise within the area. The com-
mission authorizes counties to designate certain
agricultural land as “marginal” and to allow those
uses and divisions on these lands as permitted by
law (Department of Land Conservation and Devel-
opment 1996).
The NRCS land capability classification system
is used to define agricultural land in Oregon. In
western Oregon, agricultural land is predominantly
Class I, II, III, and IV soils, and in eastern Oregon
land is predominantly Class I, II, III, IV, V, and VI
soils (see Chapter 5). Guidelines are established for
both the planning and implementation of the agri-
cultural goal. The first planning guideline states that
urban growth should be separated from agricultural
lands by buffer, or transitional, areas of open space.
The second planning guideline states that plans pro-
viding for the preservation and maintenance of
farmland for agricultural use should consider as a
major determinant the carrying capacity of the air,
land, and waste resources of the planning area.
There are four guidelines for the implementation of
the agricultural lands goal. First, nonfarm uses per-
mitted within farm-use zones should be minimized
to allow for maximum agricultural productivity.
Subsequent to the initial passage of the statewide
planning goals, specific rules were adopted regulat-
ing nonfarm dwellings in agricultural zones. Sec-
ond, extension of services, such as sewer and water
supplies, into rural areas should be appropriate for
the needs of agriculture, farm use, and permitted
nonfarm use. Third, to protect the farm-use in-
tegrity of the area, special provisions are made for
services that need to pass through agricultural
lands. Finally, forest and open space uses are to be
permitted on farmlands that are set aside for future
agricultural development (Land Conservation and
43IDENTIFYING ISSUES AND ESTABLISHING PLANNING GOALS
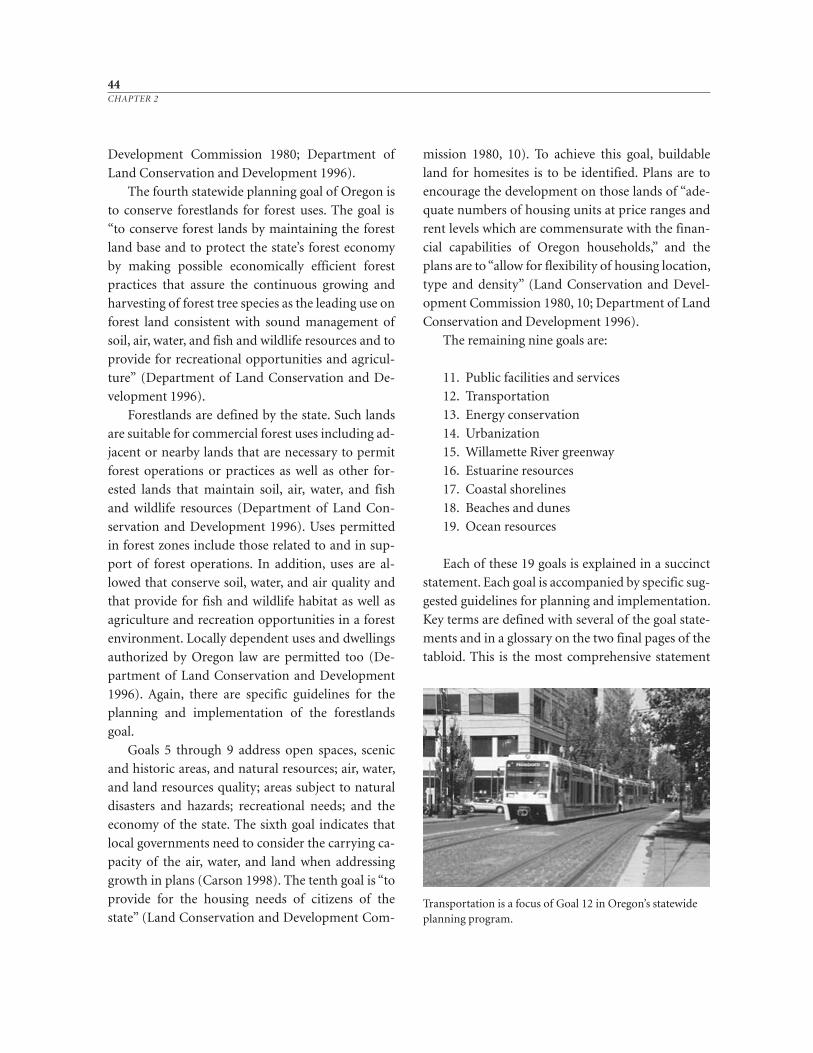
Development Commission 1980; Department of
Land Conservation and Development 1996).
The fourth statewide planning goal of Oregon is
to conserve forestlands for forest uses. The goal is
“to conserve forest lands by maintaining the forest
land base and to protect the state’s forest economy
by making possible economically efficient forest
practices that assure the continuous growing and
harvesting of forest tree species as the leading use on
forest land consistent with sound management of
soil, air, water, and fish and wildlife resources and to
provide for recreational opportunities and agricul-
ture” (Department of Land Conservation and De-
velopment 1996).
Forestlands are defined by the state. Such lands
are suitable for commercial forest uses including ad-
jacent or nearby lands that are necessary to permit
forest operations or practices as well as other for -
ested lands that maintain soil, air, water, and fish
and wildlife resources (Department of Land Con-
servation and Development 1996). Uses permitted
in forest zones include those related to and in sup-
port of forest operations. In addition, uses are al-
lowed that conserve soil, water, and air quality and
that provide for fish and wildlife habitat as well as
agriculture and recreation opportunities in a forest
environment. Locally dependent uses and dwellings
authorized by Oregon law are permitted too (De-
partment of Land Conservation and Development
1996). Again, there are specific guidelines for the
planning and implementation of the forestlands
goal.
Goals 5 through 9 address open spaces, scenic
and historic areas, and natural resources; air, water,
and land resources quality; areas subject to natural
disasters and hazards; recreational needs; and the
economy of the state. The sixth goal indicates that
local governments need to consider the carrying ca-
pacity of the air, water, and land when addressing
growth in plans (Carson 1998). The tenth goal is “to
provide for the housing needs of citizens of the
state” (Land Conservation and Development Com-
mission 1980, 10). To achieve this goal, buildable
land for homesites is to be identified. Plans are to
encourage the development on those lands of “ade-
quate numbers of housing units at price ranges and
rent levels which are commensurate with the finan-
cial capabilities of Oregon households,” and the
plans are to “allow for flexibility of housing location,
type and density” (Land Conservation and Devel-
opment Commission 1980, 10; Department of Land
Conservation and Development 1996).
The remaining nine goals are:
11. Public facilities and services
12. Transportation
13. Energy conservation
14. Urbanization
15. Willamette River greenway
16. Estuarine resources
17. Coastal shorelines
18. Beaches and dunes
19. Ocean resources
Each of these 19 goals is explained in a succinct
statement. Each goal is accompanied by specific sug-
gested guidelines for planning and implementation.
Key terms are defined with several of the goal state-
ments and in a glossary on the two final pages of the
tabloid. This is the most comprehensive statement
44CHAPTER 2
Transportation is a focus of Goal 12 in Oregon’s statewideplanning program.
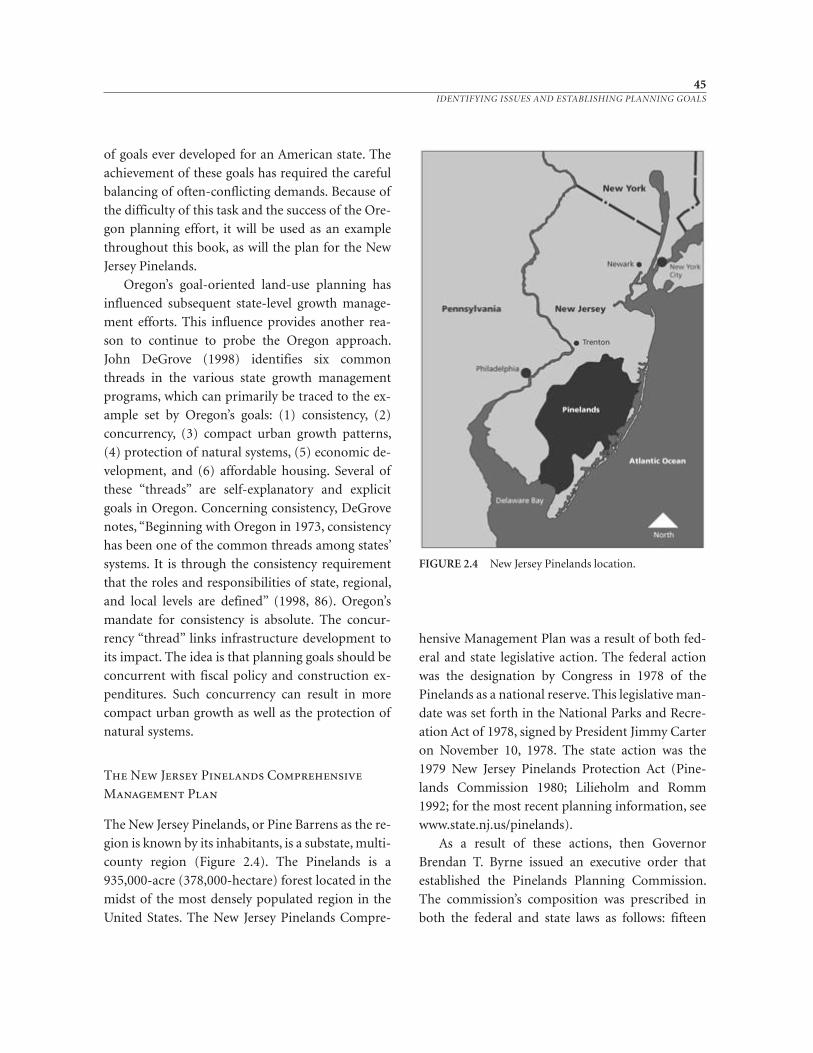
of goals ever developed for an American state. The
achievement of these goals has required the careful
balancing of often-conflicting demands. Because of
the difficulty of this task and the success of the Ore-
gon planning effort, it will be used as an example
throughout this book, as will the plan for the New
Jersey Pinelands.
Oregon’s goal-oriented land-use planning has
influenced subsequent state-level growth manage-
ment efforts. This influence provides another rea-
son to continue to probe the Oregon approach.
John DeGrove (1998) identifies six common
threads in the various state growth management
programs, which can primarily be traced to the ex-
ample set by Oregon’s goals: (1) consistency, (2)
concurrency, (3) compact urban growth patterns,
(4) protection of natural systems, (5) economic de-
velopment, and (6) affordable housing. Several of
these “threads” are self-explanatory and explicit
goals in Oregon. Concerning consistency, DeGrove
notes, “Beginning with Oregon in 1973, consistency
has been one of the common threads among states’
systems. It is through the consistency requirement
that the roles and responsibilities of state, regional,
and local levels are defined” (1998, 86). Oregon’s
mandate for consistency is absolute. The concur-
rency “thread” links infrastructure development to
its impact. The idea is that planning goals should be
concurrent with fiscal policy and construction ex-
penditures. Such concurrency can result in more
compact urban growth as well as the protection of
natural systems.
The New Jersey Pinelands Comprehensive
Management Plan
The New Jersey Pinelands, or Pine Barrens as the re-
gion is known by its inhabitants, is a substate, multi-
county region (Figure 2.4). The Pinelands is a
935,000-acre (378,000-hectare) forest located in the
midst of the most densely populated region in the
United States. The New Jersey Pinelands Compre-
hensive Management Plan was a result of both fed-
eral and state legislative action. The federal action
was the designation by Congress in 1978 of the
Pinelands as a national reserve. This legislative man-
date was set forth in the National Parks and Recre-
ation Act of 1978, signed by President Jimmy Carter
on November 10, 1978. The state action was the
1979 New Jersey Pinelands Protection Act (Pine-
lands Commission 1980; Lilieholm and Romm
1992; for the most recent planning information, see
www.state.nj.us/pinelands).
As a result of these actions, then Governor
Brendan T. Byrne issued an executive order that
established the Pinelands Planning Commission.
The commission’s composition was prescribed in
both the federal and state laws as follows: fifteen
45IDENTIFYING ISSUES AND ESTABLISHING PLANNING GOALS
FIGURE 2.4 New Jersey Pinelands location.
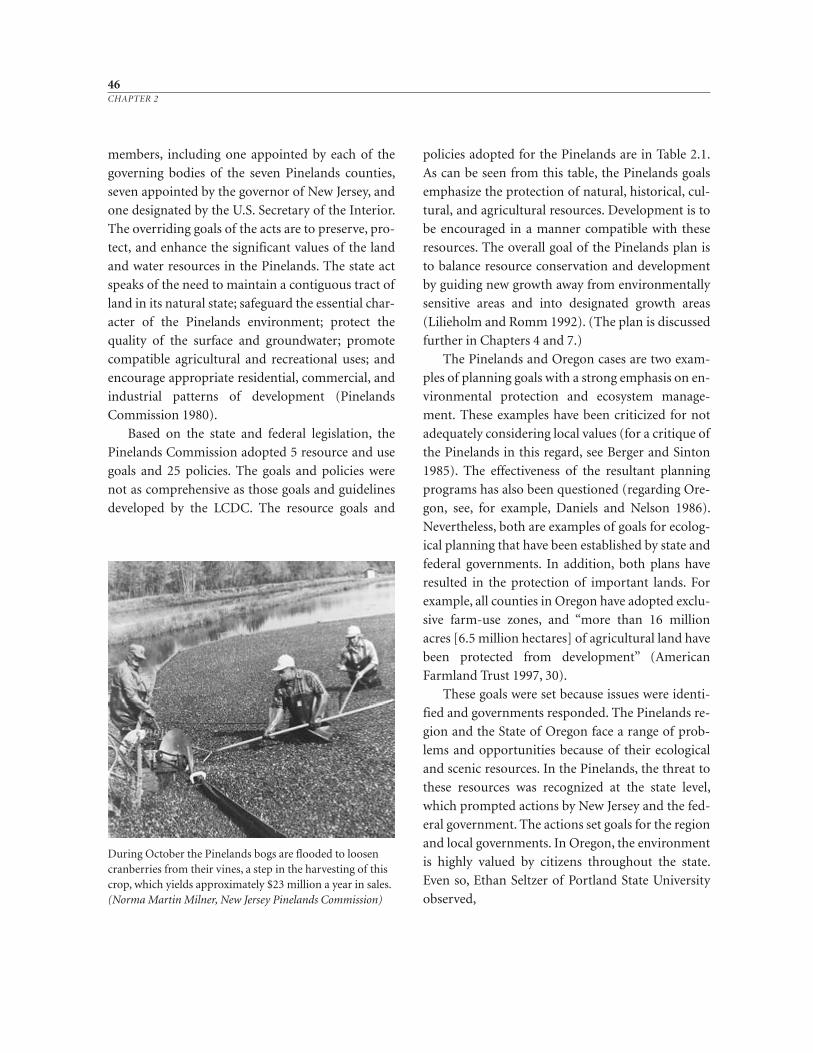
members, including one appointed by each of the
governing bodies of the seven Pinelands counties,
seven appointed by the governor of New Jersey, and
one designated by the U.S. Secretary of the Interior.
The overriding goals of the acts are to preserve, pro-
tect, and enhance the significant values of the land
and water resources in the Pinelands. The state act
speaks of the need to maintain a contiguous tract of
land in its natural state; safeguard the essential char-
acter of the Pinelands environment; protect the
quality of the surface and groundwater; promote
compatible agricultural and recreational uses; and
encourage appropriate residential, commercial, and
industrial patterns of development (Pinelands
Commission 1980).
Based on the state and federal legislation, the
Pinelands Commission adopted 5 resource and use
goals and 25 policies. The goals and policies were
not as comprehensive as those goals and guidelines
developed by the LCDC. The resource goals and
policies adopted for the Pinelands are in Table 2.1.
As can be seen from this table, the Pinelands goals
emphasize the protection of natural, historical, cul-
tural, and agricultural resources. Development is to
be encouraged in a manner compatible with these
resources. The overall goal of the Pinelands plan is
to balance resource conservation and development
by guiding new growth away from environmentally
sensitive areas and into designated growth areas
(Lilieholm and Romm 1992). (The plan is discussed
further in Chapters 4 and 7.)
The Pinelands and Oregon cases are two exam-
ples of planning goals with a strong emphasis on en-
vironmental protection and ecosystem manage-
ment. These examples have been criticized for not
adequately considering local values (for a critique of
the Pinelands in this regard, see Berger and Sinton
1985). The effectiveness of the resultant planning
programs has also been questioned (regarding Ore-
gon, see, for example, Daniels and Nelson 1986).
Nevertheless, both are examples of goals for ecolog-
ical planning that have been established by state and
federal governments. In addition, both plans have
resulted in the protection of important lands. For
example, all counties in Oregon have adopted exclu-
sive farm-use zones, and “more than 16 million
acres [6.5 million hectares] of agricultural land have
been protected from development” (American
Farmland Trust 1997, 30).
These goals were set because issues were identi-
fied and governments responded. The Pinelands re-
gion and the State of Oregon face a range of prob-
lems and opportunities because of their ecological
and scenic resources. In the Pinelands, the threat to
these resources was recognized at the state level,
which prompted actions by New Jersey and the fed-
eral government. The actions set goals for the region
and local governments. In Oregon, the environment
is highly valued by citizens throughout the state.
Even so, Ethan Seltzer of Portland State University
observed,
46CHAPTER 2
During October the Pinelands bogs are flooded to loosencranberries from their vines, a step in the harvesting of thiscrop, which yields approximately $23 million a year in sales.(Norma Martin Milner, New Jersey Pinelands Commission)
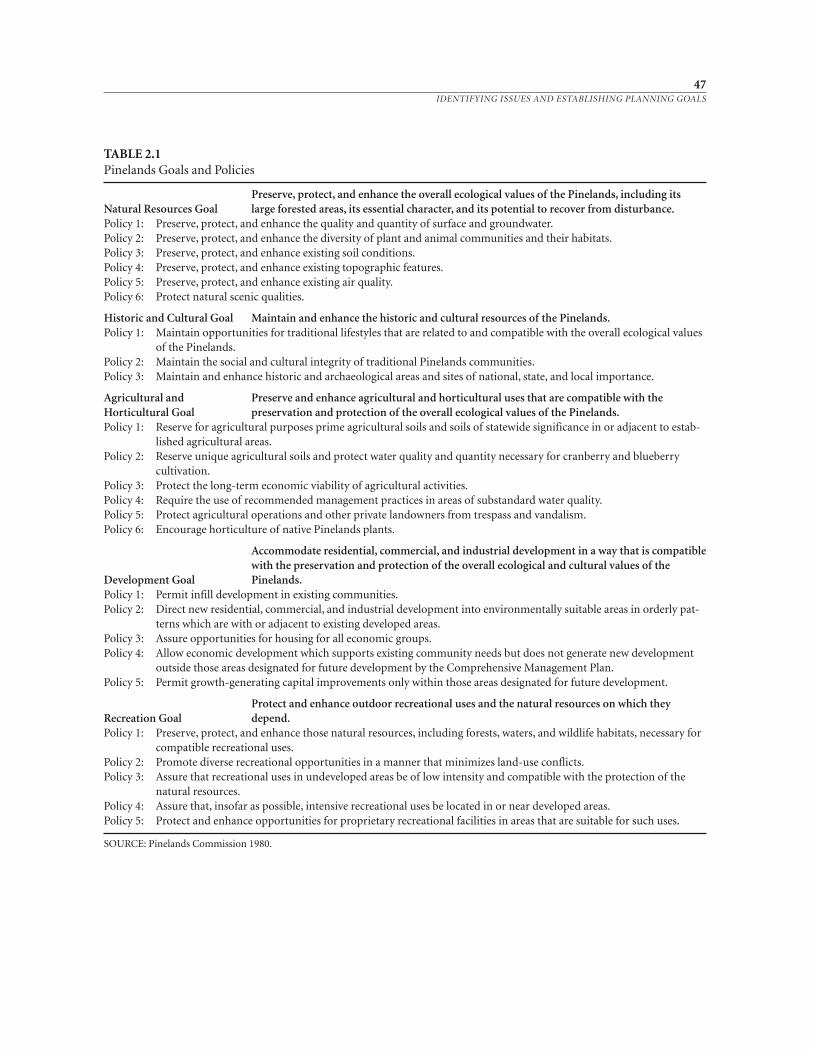
47IDENTIFYING ISSUES AND ESTABLISHING PLANNING GOALS
TABLE 2.1Pinelands Goals and Policies
Preserve, protect, and enhance the overall ecological values of the Pinelands, including its Natural Resources Goal large forested areas, its essential character, and its potential to recover from disturbance.Policy 1: Preserve, protect, and enhance the quality and quantity of surface and groundwater.Policy 2: Preserve, protect, and enhance the diversity of plant and animal communities and their habitats.Policy 3: Preserve, protect, and enhance existing soil conditions.Policy 4: Preserve, protect, and enhance existing topographic features.Policy 5: Preserve, protect, and enhance existing air quality.Policy 6: Protect natural scenic qualities.
Historic and Cultural Goal Maintain and enhance the historic and cultural resources of the Pinelands.Policy 1: Maintain opportunities for traditional lifestyles that are related to and compatible with the overall ecological values
of the Pinelands.Policy 2: Maintain the social and cultural integrity of traditional Pinelands communities.Policy 3: Maintain and enhance historic and archaeological areas and sites of national, state, and local importance.
Agricultural and Preserve and enhance agricultural and horticultural uses that are compatible with the Horticultural Goal preservation and protection of the overall ecological values of the Pinelands.Policy 1: Reserve for agricultural purposes prime agricultural soils and soils of statewide significance in or adjacent to estab-
lished agricultural areas.Policy 2: Reserve unique agricultural soils and protect water quality and quantity necessary for cranberry and blueberry
cultivation.Policy 3: Protect the long-term economic viability of agricultural activities.Policy 4: Require the use of recommended management practices in areas of substandard water quality.Policy 5: Protect agricultural operations and other private landowners from trespass and vandalism.Policy 6: Encourage horticulture of native Pinelands plants.
Accommodate residential, commercial, and industrial development in a way that is compatible with the preservation and protection of the overall ecological and cultural values of the
Development Goal Pinelands.Policy 1: Permit infill development in existing communities.Policy 2: Direct new residential, commercial, and industrial development into environmentally suitable areas in orderly pat-
terns which are with or adjacent to existing developed areas.Policy 3: Assure opportunities for housing for all economic groups.Policy 4: Allow economic development which supports existing community needs but does not generate new development
outside those areas designated for future development by the Comprehensive Management Plan.Policy 5: Permit growth-generating capital improvements only within those areas designated for future development.
Protect and enhance outdoor recreational uses and the natural resources on which they Recreation Goal depend.Policy 1: Preserve, protect, and enhance those natural resources, including forests, waters, and wildlife habitats, necessary for
compatible recreational uses.Policy 2: Promote diverse recreational opportunities in a manner that minimizes land-use conflicts.Policy 3: Assure that recreational uses in undeveloped areas be of low intensity and compatible with the protection of the
natural resources.Policy 4: Assure that, insofar as possible, intensive recreational uses be located in or near developed areas.Policy 5: Protect and enhance opportunities for proprietary recreational facilities in areas that are suitable for such uses.
SOURCE: Pinelands Commission 1980.
The Oregon land use planning program [was ini-
tially] primarily an agricultural land preservation
program. It grew from the rural parts of the state
looking into urban areas, not urban areas looking
outward. It had a lot to do with economy of the state,
and required strong rural area legislative support.
How grassroots it was is open for discussion. Never-
theless, the point is that it wasn’t motivated by general
concerns for environmental quality and it depended
on direct support from the governor and key leg-
islative leaders, rather than a grassroots citizens
movement (1998).
However, the environmental leadership and vi-
sion provided by Republican Governor Tom McCall
is undeniable. In his own words, when opening the
1973 Oregon legislature, Governor McCall warned
that “sagebrush subdivisions, coastal condomania,
and the ravenous rampage of suburbia in the
Willamette Valley all threaten to mock Oregon’s sta-
tus as an environmental model for the nation.” And
“the interest of Oregon for today and in the future
must be protected from the grasping wastrels of the
land” (McCall as quoted in Kellington 1998, 3).
This emphasis on ecological values differentiate
the Pinelands and Oregon goals from those of con-
ventional planning processes. As compared with
conventional programs, the Pinelands and Oregon
goals are linked more directly to specific policies
and implementation guidelines, which also empha-
size environmental protection and natural resource
management.
48CHAPTER 2


3INVENTORY AND ANALYSIS OF THE
BIOPHYSICAL ENVIRONMENT
51
After a community has identified the challenges and opportunities that it faces and
has reached some consensus concerning its goals to address those issues, then it is
necessary to collect the information needed to achieve community goals. An inven-
tory is a systematic acquisition of information needed to describe and characterize
a place. Inventories provide the basis for ecological analysis. Information about na-
ture has often been used in an ad hoc manner in American planning. Only that in-
formation needed to achieve a specific goal is collected—so too often it is discon-
nected information.
The basic premise of ecology is that everything is connected to everything else.
As a result, the ecological approach differs from more traditional methods. For ex-
ample, a flood frequently prompts community interests in planning, especially
when loss of life and property damage has occurred. With a conventional planning
response, only the flood-prone areas are identified. Also, this approach focuses pri-
marily on the negative consequences of flooding. Since flooding is recognized by a
community as a hazard to human safety, the responsible elected officials adopt a
goal to prevent buildings in flood-prone areas. These
areas are mapped and building restricted. The goal is
one-dimensional. In contrast, in ecological planning
the complex matrix of factors related to flooding
would be considered. Flooding is the result of the in-
teraction of several natural phenomena—rainfall,
bedrock, terrain, soils, temperature, and vegetation, for
instance. Since ecological planning rests on an under-
standing of relationships, broader-range information
about the biophysical processes of an area must be
collected and analyzed. In addition, an ecological
view acknowledges the benefits of natural flooding
events, such as the deposition of fertile soils. Moreover,
the sequence of collecting this information becomes
important.
Older, larger-scale components of the landscape
exert a strong influence on more ephemeral elements.
Regional climate and geology help to determine soils
and water drainage systems of an area, which in turn
affect what vegetation and animals will inhabit a place.
The challenge for the ecological planner is to think ge-
ologically in both space and time. One must think big,
because it is likely that the geologic events that occur in
a specific planning area or jurisdiction are probably
driven by plate tectonic interactions thousands of kilo-
meters away, and climatic events by processes working
on a global scale. The temporal scale is also quite large,
with the human time scale so much shorter than that
of the geologic events within a planning area. As a re-
sult, in ecological planning one begins to inventory the
older elements and proceeds to the youngest. The sys-
tematic survey of information should lead to an un-
derstanding of processes, not merely the collection of
data.
When conducting such an inventory, it is useful to
identify boundaries so that the various biophysical ele-
ments can be compared with each other over the same
spatial area and at the same scale. Often such a plan-
ning area is defined by legislative goals, as, for instance,
with the New Jersey Pinelands.
Ideally, several levels of inventories from regional
to local are undertaken. As Richard Forman has ad-
vised, we should “think globally, plan regionally, and
act locally” (1995, 435). A hierarchy of levels is identi-
fied so that the planning area may be understood as
part of a larger system and specific places may be seen
as parts of a whole. The large river drainage basin at
the regional level and the smaller stream watershed
more locally are ideal units of analysis for ecological
planning. A watershed is an area drained by a stream or
stream system, also called a catchment area or, in the
United States at a larger river scale, including all the
tributaries, a drainage basin.
A drainage basin, or watershed, “is the area of land
that drains water, sediment, and dissolved materials to
a common outlet at some point along a stream chan-
nel” (Dunne and Leopold 1978, 495). According to
Donald Satterlund and Paul Adams (1992, 51), “A wa-
tershed is defined by the stream that drains it.” The
drainageway, meanwhile, “refers to the principal areas
of water accumulation (i.e., channels)” (Briggs 1996,
17).
A watershed, or other landscape, may be under-
stood through a chorography—in other words, a sys-
tematic description and analysis. Ecology can be used
to order such a chorography since ecology addresses
interrelationships among living things and their envi-
ronments. The ecologist Eugene Odum has observed
the value of using watersheds in planning. Odum
noted that “it is the whole drainage basin, not just the
body of water, that must be considered as the mini-
mum ecosystem unit when it comes to man’s interests.
The ecosystem unit for practical management must
then include for every square meter or acre of water at
least 20 times an area of terrestrial watershed” (Odum
1971, 16).
Peter Quinby (1988) notes that watershed bound-
aries can be used as ecosystem boundaries. The water-
shed is a handy unit that contains biological, physical,
social, and economic processes. Watersheds have dis-
crete boundaries, yet they can vary in scale. This pro-
vides flexibility to adapt to social, economic, and polit-
52CHAPTER 3
ical issues. Watersheds also offer linkages between the
elements of regions. One reason they can be consid-
ered an ideal is that the flow of water, the linkage,
throughout the watershed may be easily visualized.
The use of watersheds for planning is not new.
John Wesley Powell, who introduced the term region to
North America, essentially suggested the use of water-
sheds in his 1879 plan for the American West. The use
of watersheds is also consistent with past efforts of wa-
tershed conservancies and river basin commissions,
such as the Delaware River Basin Commission, the Co-
lumbia River Basin Commission, and the Tennessee
Valley Authority, and with programs of the Natural Re-
sources Conservation Service, the Army Corps of En-
gineers, the National Park Service, and the U.S. Forest
Service. But, more often than not, units other than wa-
tersheds—political boundaries most frequently—are
used. Still the principle of hierarchy can apply to polit-
ical boundaries, with counties forming the regional
scale and cities or towns being used as the unit for local
landscape analysis.
In this chapter, a method for the inventory, analy-
sis, and synthesis of the biophysical components of the
landscape in the planning process is presented. This
approach to data collection can be used at the regional,
local, and even site-specific scales. To illustrate this
chapter, an example of the Desert View Tri-Villages
Area of Phoenix, Arizona, is used. This landscape was
formerly named “Planning Areas C & D” by city offi-
cials. This biophysical inventory and analysis was con-
ducted as a part of a larger city planning process. The
area encompasses approximately 20 percent of the city
and was largely undeveloped when ecological invento-
ries were initiated. Two slightly different boundaries
appear in the examples that follow because they were
drawn from different inventories conducted in the
space of three years (Ciekot et al. 1995; Brady et al.
1998). In the intervening years, the city of Phoenix an-
nexed more land, changing the study area boundaries.
This chapter presents methods for making base maps,
inventorying elements of the landscape, and analyzing
and synthesizing this information. Two examples, the
New Jersey Pinelands and the region of Camp Pendle-
ton, California, are also used as illustrations. Each ex-
ample employed an approach similar to the one pre-
sented here, but the specific methods were designed by
the responsible planning teams.
Making a Base Map and a Regional Context Map
The starting point for collecting information in a
graphic format is the base map, a map from which
copies are made or derived. The most convenient
source for a paper base map in the United States is
the USGS 7.5-minute quadrangle maps with a scale
of 1:24,000. USGS maps are available for most areas
in the United States in paper and, increasingly, digi-
tal formats. They give the location of all buildings
(except in urban areas), bodies of water, elevations,
contour lines, roads, rail lines, political boundaries,
and some woodlands. A portion of a quadrangle
map or several quadrangle maps pieced together
can be photographically reproduced on polyester
film. Additional information can be added to the
polyester film to form the base map. The most im-
portant information includes the map of the study
area, a north arrow, a proportional scale, a map title,
a legend, the source of the information displayed,
the name of the planning area, and the names of the
company, university group, and/or agency perform-
ing the study.
The same process can be undertaken with the
computer with geographic information systems
(GIS) technology (Figure 3.1). Planning teams de-
cide how to use the GIS. The data handling and
computation process can then be automated. The
use of GIS can provide an effective cartographic
presentation of the results in addition to creating
greater flexibility over paper maps (Xiang 1996, 8).
53INVENTORY AND ANALYSIS OF THE BIOPHYSICAL ENVIRONMENT
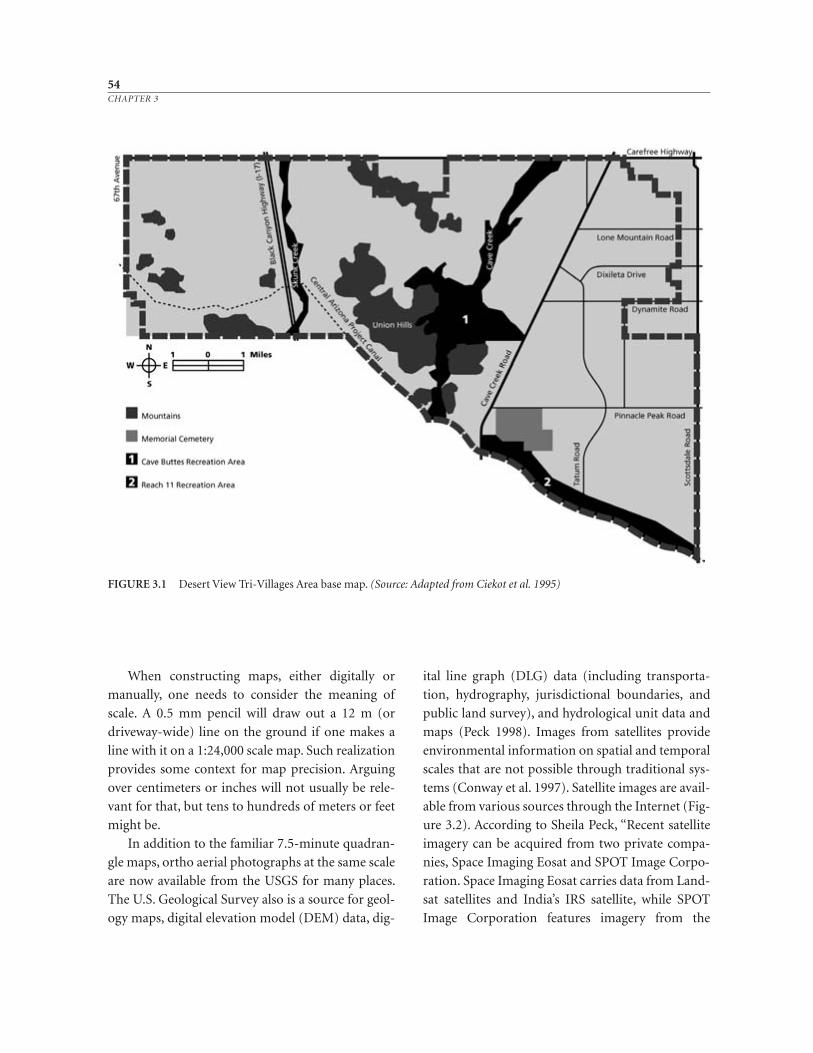
When constructing maps, either digitally or
manually, one needs to consider the meaning of
scale. A 0.5 mm pencil will draw out a 12 m (or
driveway-wide) line on the ground if one makes a
line with it on a 1:24,000 scale map. Such realization
provides some context for map precision. Arguing
over centimeters or inches will not usually be rele-
vant for that, but tens to hundreds of meters or feet
might be.
In addition to the familiar 7.5-minute quadran-
gle maps, ortho aerial photographs at the same scale
are now available from the USGS for many places.
The U.S. Geological Survey also is a source for geol-
ogy maps, digital elevation model (DEM) data, dig-
ital line graph (DLG) data (including transporta-
tion, hydrography, jurisdictional boundaries, and
public land survey), and hydrological unit data and
maps (Peck 1998). Images from satellites provide
environmental information on spatial and temporal
scales that are not possible through traditional sys-
tems (Conway et al. 1997). Satellite images are avail-
able from various sources through the Internet (Fig-
ure 3.2). According to Sheila Peck, “Recent satellite
imagery can be acquired from two private compa-
nies, Space Imaging Eosat and SPOT Image Corpo-
ration. Space Imaging Eosat carries data from Land-
sat satellites and India’s IRS satellite, while SPOT
Image Corporation features imagery from the
54CHAPTER 3
FIGURE 3.1 Desert View Tri-Villages Area base map. (Source: Adapted from Ciekot et al. 1995)
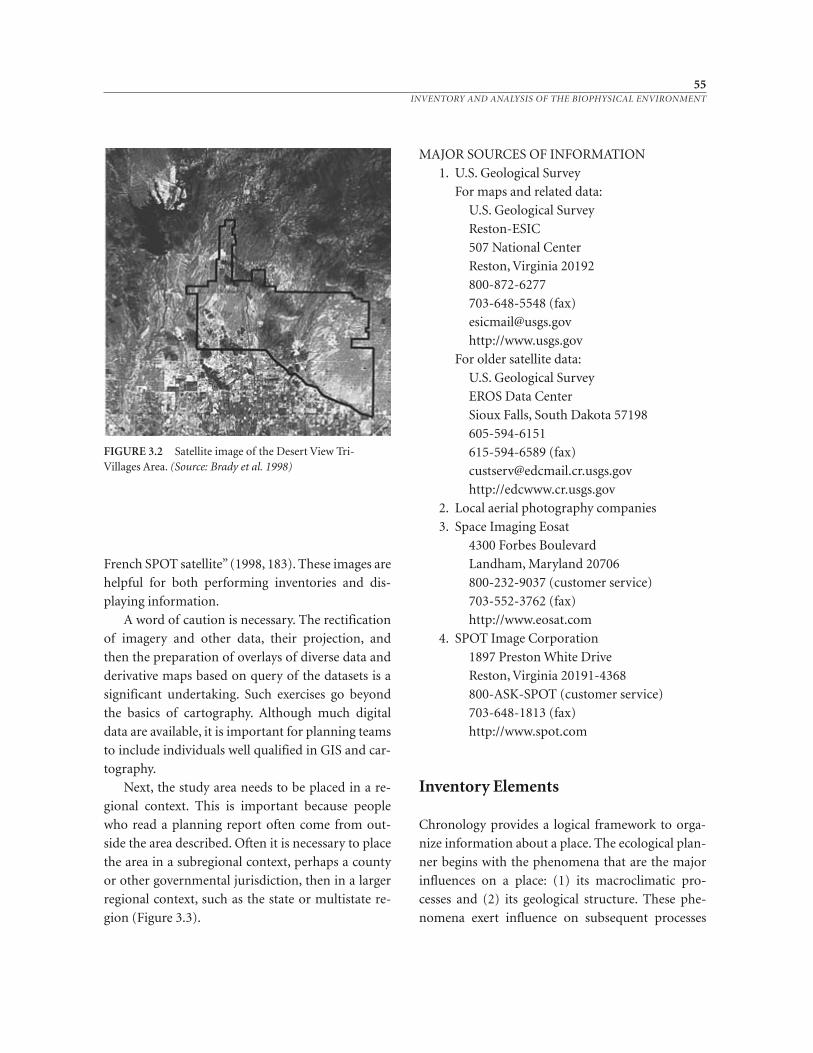
MAJOR SOURCES OF INFORMATION
1. U.S. Geological Survey
For maps and related data:
U.S. Geological Survey
Reston-ESIC
507 National Center
Reston, Virginia 20192
800-872-6277
703-648-5548 (fax)
http://www.usgs.gov
For older satellite data:
U.S. Geological Survey
EROS Data Center
Sioux Falls, South Dakota 57198
605-594-6151
615-594-6589 (fax)
http://edcwww.cr.usgs.gov
2. Local aerial photography companies
3. Space Imaging Eosat
4300 Forbes Boulevard
Landham, Maryland 20706
800-232-9037 (customer service)
703-552-3762 (fax)
http://www.eosat.com
4. SPOT Image Corporation
1897 Preston White Drive
Reston, Virginia 20191-4368
800-ASK-SPOT (customer service)
703-648-1813 (fax)
http://www.spot.com
Inventory Elements
Chronology provides a logical framework to orga-
nize information about a place. The ecological plan-
ner begins with the phenomena that are the major
influences on a place: (1) its macroclimatic pro -
cesses and (2) its geological structure. These phe-
nomena exert influence on subsequent processes
55INVENTORY AND ANALYSIS OF THE BIOPHYSICAL ENVIRONMENT
FIGURE 3.2 Satellite image of the Desert View Tri-Villages Area. (Source: Brady et al. 1998)
French SPOT satellite” (1998, 183). These images are
helpful for both performing inventories and dis-
playing information.
A word of caution is necessary. The rectification
of imagery and other data, their projection, and
then the preparation of overlays of diverse data and
derivative maps based on query of the datasets is a
significant undertaking. Such exercises go beyond
the basics of cartography. Although much digital
data are available, it is important for planning teams
to include individuals well qualified in GIS and car-
tography.
Next, the study area needs to be placed in a re-
gional context. This is important because people
who read a planning report often come from out-
side the area described. Often it is necessary to place
the area in a subregional context, perhaps a county
or other governmental jurisdiction, then in a larger
regional context, such as the state or multistate re-
gion (Figure 3.3).
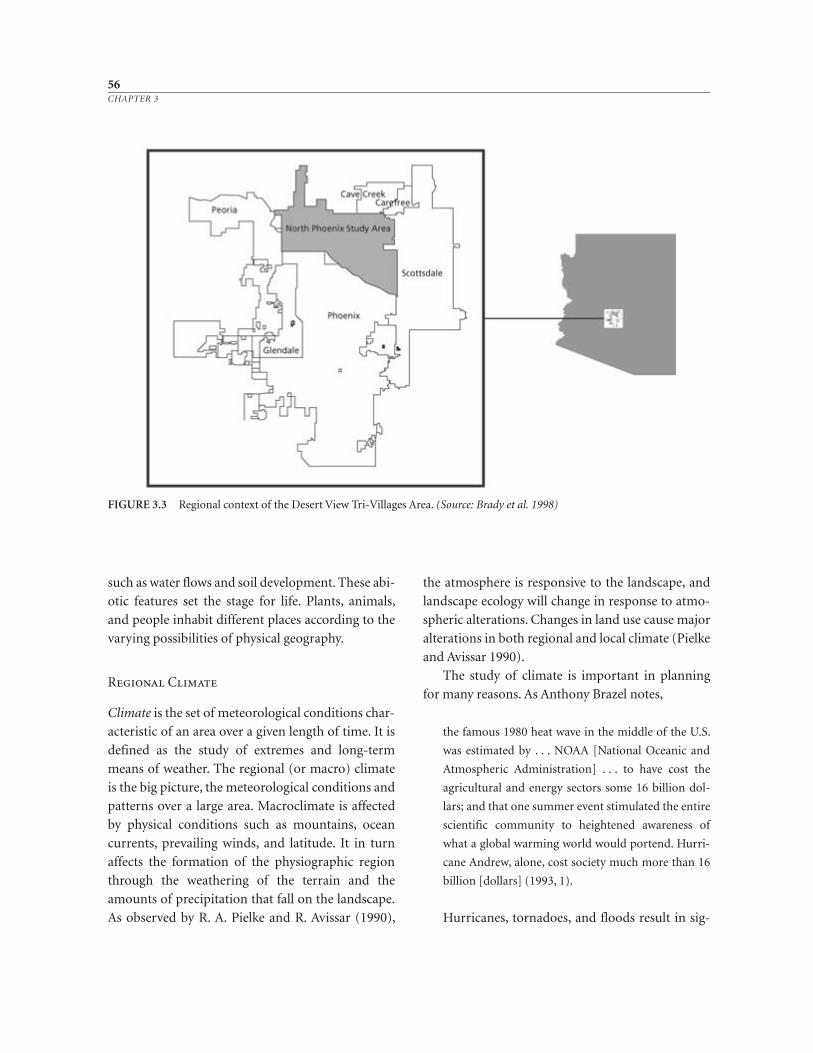
such as water flows and soil development. These abi-
otic features set the stage for life. Plants, animals,
and people inhabit different places according to the
varying possibilities of physical geography.
Regional Climate
Climate is the set of meteorological conditions char-
acteristic of an area over a given length of time. It is
defined as the study of extremes and long-term
means of weather. The regional (or macro) climate
is the big picture, the meteorological conditions and
patterns over a large area. Macroclimate is affected
by physical conditions such as mountains, ocean
currents, prevailing winds, and latitude. It in turn
affects the formation of the physiographic region
through the weathering of the terrain and the
amounts of precipitation that fall on the landscape.
As observed by R. A. Pielke and R. Avissar (1990),
the atmosphere is responsive to the landscape, and
landscape ecology will change in response to atmo-
spheric alterations. Changes in land use cause major
alterations in both regional and local climate (Pielke
and Avissar 1990).
The study of climate is important in planning
for many reasons. As Anthony Brazel notes,
the famous 1980 heat wave in the middle of the U.S.
was estimated by . . . NOAA [National Oceanic and
Atmospheric Administration] . . . to have cost the
agricultural and energy sectors some 16 billion dol-
lars; and that one summer event stimulated the entire
scientific community to heightened awareness of
what a global warming world would portend. Hurri-
cane Andrew, alone, cost society much more than 16
billion [dollars] (1993, 1).
Hurricanes, tornadoes, and floods result in sig-
56CHAPTER 3
FIGURE 3.3 Regional context of the Desert View Tri-Villages Area. (Source: Brady et al. 1998)
57INVENTORY AND ANALYSIS OF THE BIOPHYSICAL ENVIRONMENT
must frequently use the best available information
and interpolate to area studies. The Tri-Villages
Area, like much of the Phoenix region, is generally
hot and dry. According to the Köppen classification
system, the region is a desert. The adjacent town of
Carefree (where there is a weather station with the
code BW), with monthly average high temperatures
ranging from 62.6 to 101.9°F (17 to 38.8°C) and
monthly average low temperatures ranging from
37.9 to 75.1°F (3.3 to 23.9°C), is representative of a
planning area climate (Sellers et al. 1985). (See Ta-
bles 3.1 and 3.2.) These temperatures average 4.0°F
(2.2°C) lower than those of central Phoenix.
The Tri-Villages Area has a typical annual rain-
fall of 8 inches (20.3 centimeters) (Table 3.3). The
rainfall in the area to the north that feeds Cave and
Skunk Creek washes is approximately 50 percent
higher. There are two distinct rainy seasons. Winds
from the Gulf of California and the Gulf of Mexico
flow into the area from the south to produce dra-
matic summer thunderstorms from July to Septem-
ber (Figure 3.4). The thunderstorms cover small
areas, are brief, and cause significant runoff, and re-
sult in the potential for local flooding. Less intense
but widespread and steady winter rains associated
with cold fronts come from the Pacific Ocean and
the north. These rains, which occur from December
to March, rarely exceed infiltration capacity of the
soil and, therefore, flooding is less common. Be-
cause of the sparse rainfall and the lack of perennial
streams, the groundwater of the planning area is an
important source of drinking water for Phoenix.
The biennial rainfall supports a denser vegetation
cover than the other deserts of the United States
(i.e., the Great Basin, Mojave, and Chihuahuan).
Water and heat are two significant factors to con-
sider in the Phoenix metropolitan area. Climatolo-
gists have identified the emergence of a rapidly de-
veloping “urban heat island” in the region, which is
also being called an “urban heat archipelago.” Black
asphalt, concrete, and roof surfaces act as solar
collectors, emitting heat and increasing urban air
nificant economic costs, as well as causing injury
and the loss of life. Global climate change has stimu-
lated considerable interest in the study of weather
patterns. Local actions are linked in global and re-
gional weather patterns in numerous ways. Under-
standing climate, and planning communities ac-
cordingly, can result in conserving financial and
other resources as well as helping to protect public
health and safety.
The Desert View Tri-Villages Area, or the Tri-
Villages Area, illustrates the types of climate that
should be inventoried in its region. The Tri-Villages
Area is located in the Sonoran Desert in the Phoenix
metropolitan region (Figure 3.3). The Sonoran
Desert covers some 120,000 square miles (310,800
kilometers2) and comprises much of the states of
Sonora (Mexico) and Arizona as well as most of the
two states of Baja California (Norte and Sur) and a
small portion of California. This desert rings the
Gulf of California. In turn, the ocean arcs the desert
to the west and to the south, while mountains form
an arc to the north and the east. The Sonora, a cor-
ruption of Mary’s title, Señora, is a hot and dry
place. If aridity gives the West its character, then the
Sonora is among the most western of places.
According to Anthony Brazel,
Arizona has four “synoptic” or weather systems: (1)
the summer thunderstorm or monsoon season of July
through September; (2) the late summer-to-fall trop-
ical storm season of August through October; (3) the
variable winter low pressure storm season ranging
from early storms in November through even April;
and (4) spring-to-summer meanderings of the atmo-
sphere that may include late season storms, or the be-
ginning of a very dry spell of early summer, typically
from April to late June (1993, 3).
There is no weather station in the Tri-Villages
Area. As a result, nearby stations were used to com-
pile climate data (Ciekot et al. 1995; McCarthy et al.
1995). This situation is common. A planning team
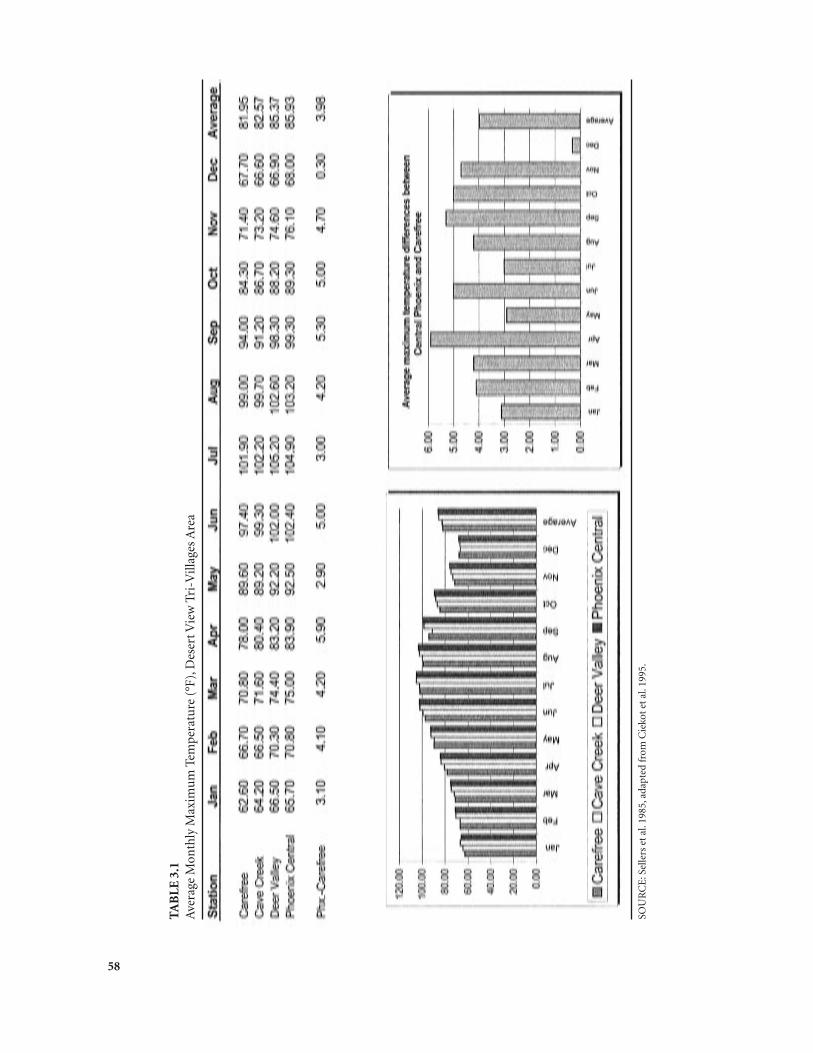
58
TAB
LE 3
.1A
vera
ge M
onth
ly M
axim
um
Tem
pera
ture
(°F
), D
eser
t Vie
w T
ri-V
illag
es A
rea
SOU
RC
E: S
elle
rs e
t al.
1985
, ada
pted
from
Cie
kot e
t al.
1995
.
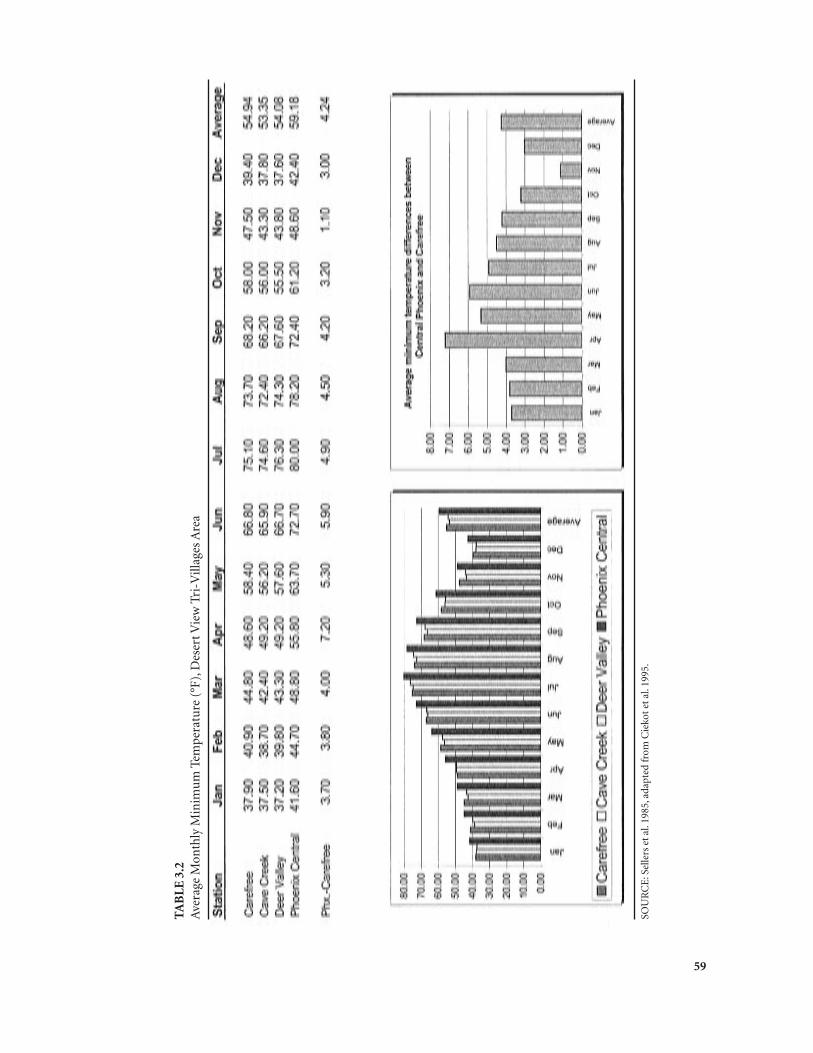
59
TAB
LE 3
.2A
vera
ge M
onth
ly M
inim
um
Tem
pera
ture
(°F
), D
eser
t Vie
w T
ri-V
illag
es A
rea
SOU
RC
E: S
elle
rs e
t al.
1985
, ada
pted
from
Cie
kot e
t al.
1995
.
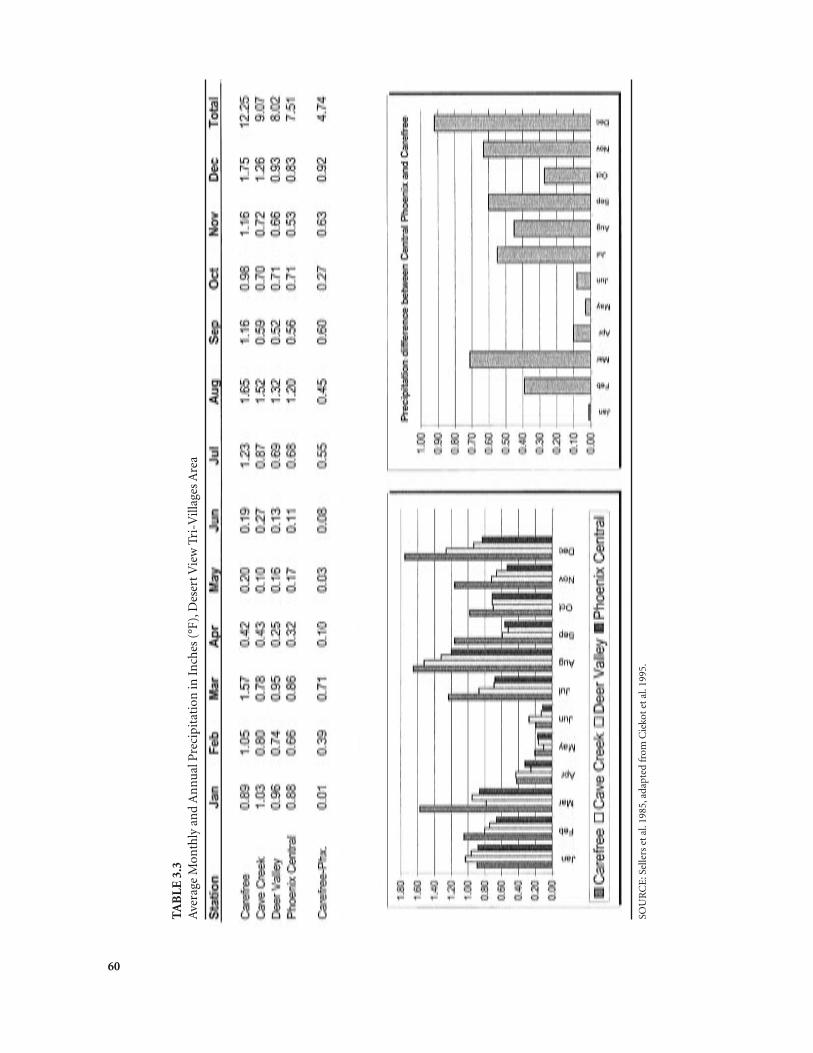
60
TAB
LE 3
.3A
vera
ge M
onth
ly a
nd
An
nu
al P
reci
pita
tion
in I
nch
es (
°F),
Des
ert V
iew
Tri
-Vill
ages
Are
a
SOU
RC
E: S
elle
rs e
t al.
1985
, ada
pted
from
Cie
kot e
t al.
1995
.
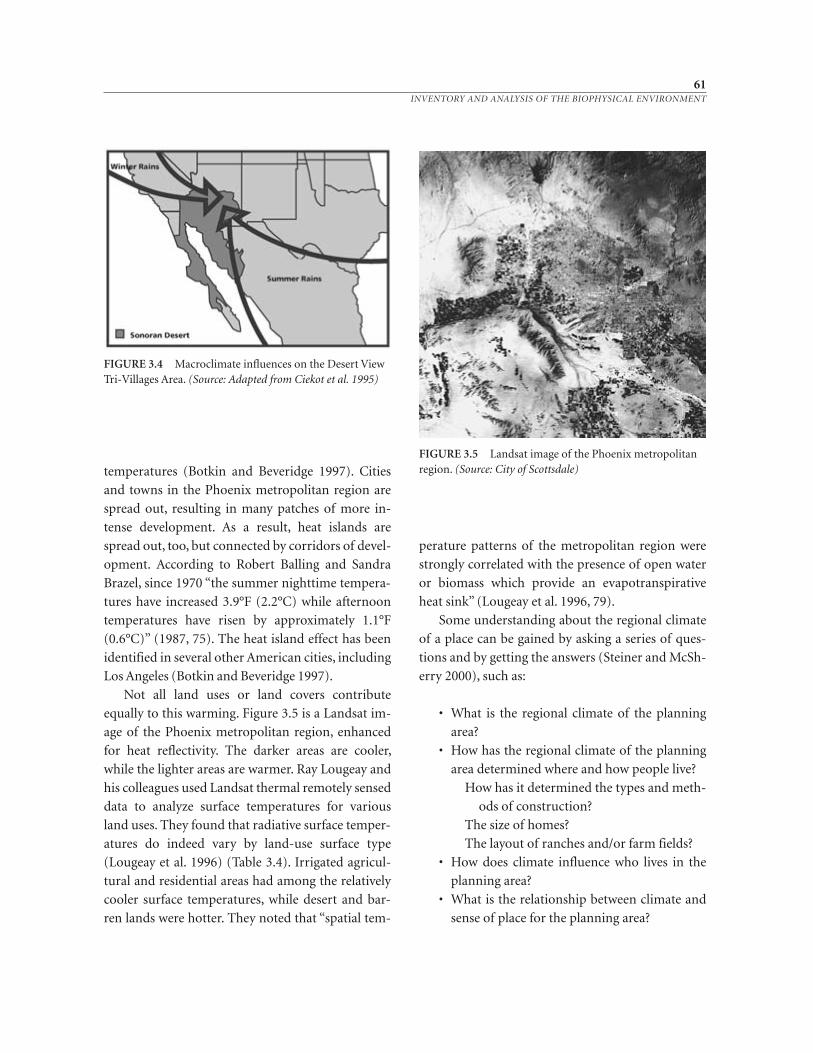
temperatures (Botkin and Beveridge 1997). Cities
and towns in the Phoenix metropolitan region are
spread out, resulting in many patches of more in-
tense development. As a result, heat islands are
spread out, too, but connected by corridors of devel-
opment. According to Robert Balling and Sandra
Brazel, since 1970 “the summer nighttime tempera-
tures have increased 3.9°F (2.2°C) while afternoon
temperatures have risen by approximately 1.1°F
(0.6°C)” (1987, 75). The heat island effect has been
identified in several other American cities, including
Los Angeles (Botkin and Beveridge 1997).
Not all land uses or land covers contribute
equally to this warming. Figure 3.5 is a Landsat im-
age of the Phoenix metropolitan region, enhanced
for heat reflectivity. The darker areas are cooler,
while the lighter areas are warmer. Ray Lougeay and
his colleagues used Landsat thermal remotely sensed
data to analyze surface temperatures for various
land uses. They found that radiative surface temper-
atures do indeed vary by land-use surface type
(Lougeay et al. 1996) (Table 3.4). Irrigated agricul-
tural and residential areas had among the relatively
cooler surface temperatures, while desert and bar-
ren lands were hotter. They noted that “spatial tem-
perature patterns of the metropolitan region were
strongly correlated with the presence of open water
or biomass which provide an evapotranspirative
heat sink” (Lougeay et al. 1996, 79).
Some understanding about the regional climate
of a place can be gained by asking a series of ques-
tions and by getting the answers (Steiner and McSh-
erry 2000), such as:
• What is the regional climate of the planning
area?
• How has the regional climate of the planning
area determined where and how people live?
How has it determined the types and meth-
ods of construction?
The size of homes?
The layout of ranches and/or farm fields?
• How does climate influence who lives in the
planning area?
• What is the relationship between climate and
sense of place for the planning area?
61INVENTORY AND ANALYSIS OF THE BIOPHYSICAL ENVIRONMENT
FIGURE 3.4 Macroclimate influences on the Desert ViewTri-Villages Area. (Source: Adapted from Ciekot et al. 1995)
FIGURE 3.5 Landsat image of the Phoenix metropolitanregion. (Source: City of Scottsdale)
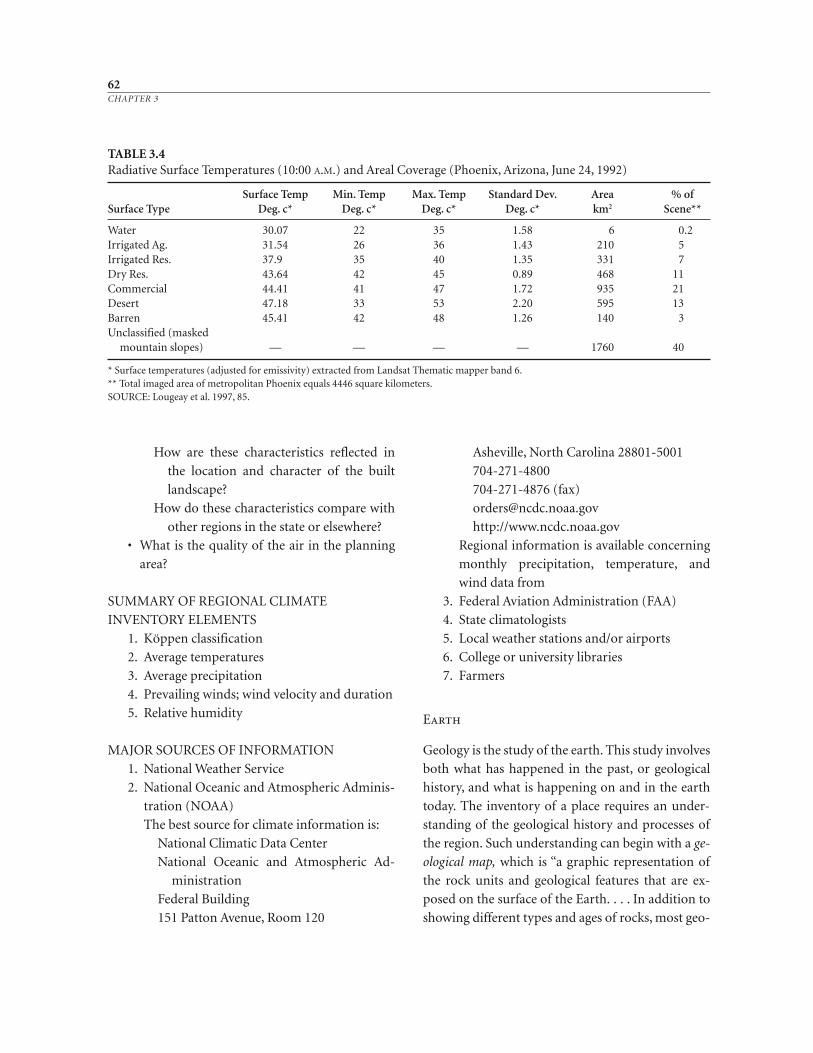
How are these characteristics reflected in
the location and character of the built
landscape?
How do these characteristics compare with
other regions in the state or elsewhere?
• What is the quality of the air in the planning
area?
SUMMARY OF REGIONAL CLIMATE
INVENTORY ELEMENTS
1. Köppen classification
2. Average temperatures
3. Average precipitation
4. Prevailing winds; wind velocity and duration
5. Relative humidity
MAJOR SOURCES OF INFORMATION
1. National Weather Service
2. National Oceanic and Atmospheric Adminis-
tration (NOAA)
The best source for climate information is:
National Climatic Data Center
National Oceanic and Atmospheric Ad-
ministration
Federal Building
151 Patton Avenue, Room 120
Asheville, North Carolina 28801-5001
704-271-4800
704-271-4876 (fax)
http://www.ncdc.noaa.gov
Regional information is available concerning
monthly precipitation, temperature, and
wind data from
3. Federal Aviation Administration (FAA)
4. State climatologists
5. Local weather stations and/or airports
6. College or university libraries
7. Farmers
Earth
Geology is the study of the earth. This study involves
both what has happened in the past, or geological
history, and what is happening on and in the earth
today. The inventory of a place requires an under-
standing of the geological history and processes of
the region. Such understanding can begin with a ge-
ological map, which is “a graphic representation of
the rock units and geological features that are ex-
posed on the surface of the Earth. . . . In addition to
showing different types and ages of rocks, most geo-
62CHAPTER 3
TABLE 3.4Radiative Surface Temperatures (10:00 A.M.) and Areal Coverage (Phoenix, Arizona, June 24, 1992)
Surface Temp Min. Temp Max. Temp Standard Dev. Area % of Surface Type Deg. c* Deg. c* Deg. c* Deg. c* km2 Scene**
Water 30.07 22 35 1.58 6 0.2Irrigated Ag. 31.54 26 36 1.43 210 5Irrigated Res. 37.90 35 40 1.35 331 7Dry Res. 43.64 42 45 0.89 468 11Commercial 44.41 41 47 1.72 935 21Desert 47.18 33 53 2.20 595 13Barren 45.41 42 48 1.26 140 3Unclassified (masked
mountain slopes) — — — — 1760 40
* Surface temperatures (adjusted for emissivity) extracted from Landsat Thematic mapper band 6.** Total imaged area of metropolitan Phoenix equals 4446 square kilometers.SOURCE: Lougeay et al. 1997, 85.
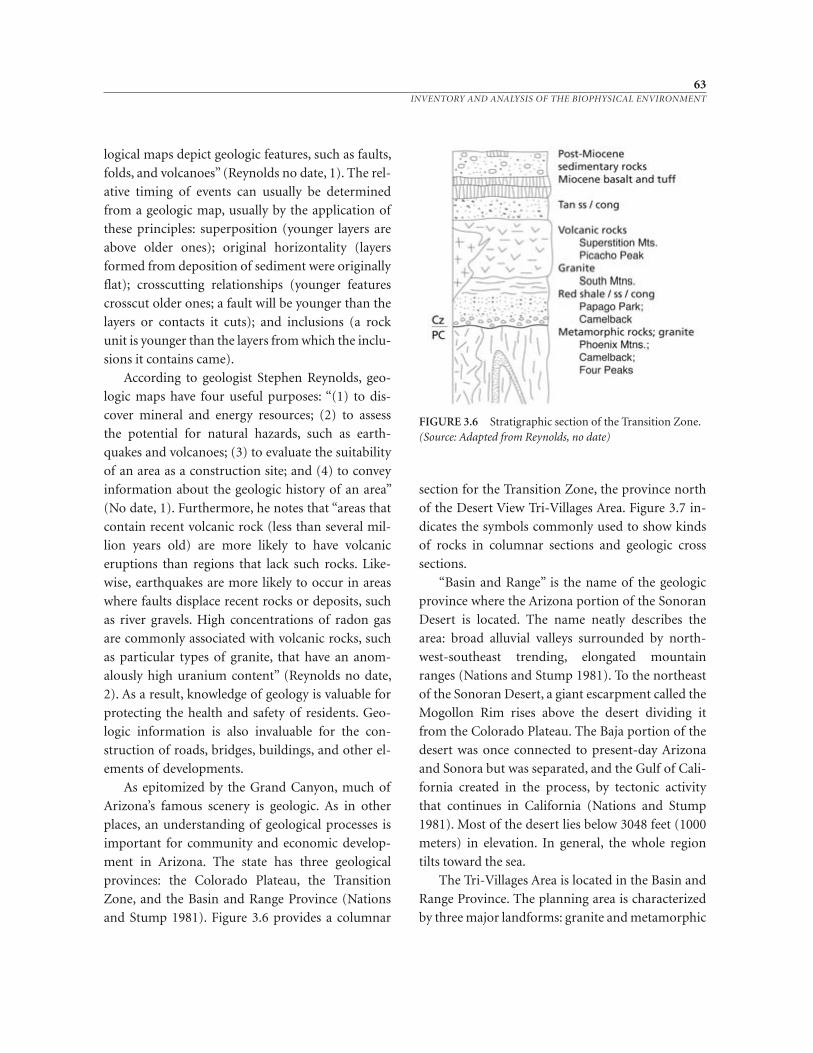
logical maps depict geologic features, such as faults,
folds, and volcanoes” (Reynolds no date, 1). The rel-
ative timing of events can usually be determined
from a geologic map, usually by the application of
these principles: superposition (younger layers are
above older ones); original horizontality (layers
formed from deposition of sediment were originally
flat); crosscutting relationships (younger features
crosscut older ones; a fault will be younger than the
layers or contacts it cuts); and inclusions (a rock
unit is younger than the layers from which the inclu-
sions it contains came).
According to geologist Stephen Reynolds, geo-
logic maps have four useful purposes: “(1) to dis-
cover mineral and energy resources; (2) to assess
the potential for natural hazards, such as earth-
quakes and volcanoes; (3) to evaluate the suitability
of an area as a construction site; and (4) to convey
information about the geologic history of an area”
(No date, 1). Furthermore, he notes that “areas that
contain recent volcanic rock (less than several mil-
lion years old) are more likely to have volcanic
eruptions than regions that lack such rocks. Like-
wise, earthquakes are more likely to occur in areas
where faults displace recent rocks or deposits, such
as river gravels. High concentrations of radon gas
are commonly associated with volcanic rocks, such
as particular types of granite, that have an anom-
alously high uranium content” (Rey nolds no date,
2). As a result, knowledge of geology is valuable for
protecting the health and safety of residents. Geo-
logic information is also invaluable for the con-
struction of roads, bridges, buildings, and other el-
ements of developments.
As epitomized by the Grand Canyon, much of
Arizona’s famous scenery is geologic. As in other
places, an understanding of geological processes is
important for community and economic develop-
ment in Arizona. The state has three geological
provinces: the Colorado Plateau, the Transition
Zone, and the Basin and Range Province (Nations
and Stump 1981). Figure 3.6 provides a columnar
section for the Transition Zone, the province north
of the Desert View Tri-Villages Area. Figure 3.7 in-
dicates the symbols commonly used to show kinds
of rocks in columnar sections and geologic cross
sections.
“Basin and Range” is the name of the geologic
province where the Arizona portion of the Sonoran
Desert is located. The name neatly describes the
area: broad alluvial valleys surrounded by north-
west-southeast trending, elongated mountain
ranges (Nations and Stump 1981). To the northeast
of the Sonoran Desert, a giant escarpment called the
Mogollon Rim rises above the desert dividing it
from the Colorado Plateau. The Baja portion of the
desert was once connected to present-day Arizona
and Sonora but was separated, and the Gulf of Cali-
fornia created in the process, by tectonic activity
that continues in California (Nations and Stump
1981). Most of the desert lies below 3048 feet (1000
meters) in elevation. In general, the whole region
tilts toward the sea.
The Tri-Villages Area is located in the Basin and
Range Province. The planning area is characterized
by three major landforms: granite and metamorphic
63INVENTORY AND ANALYSIS OF THE BIOPHYSICAL ENVIRONMENT
FIGURE 3.6 Stratigraphic section of the Transition Zone.(Source: Adapted from Reynolds, no date)
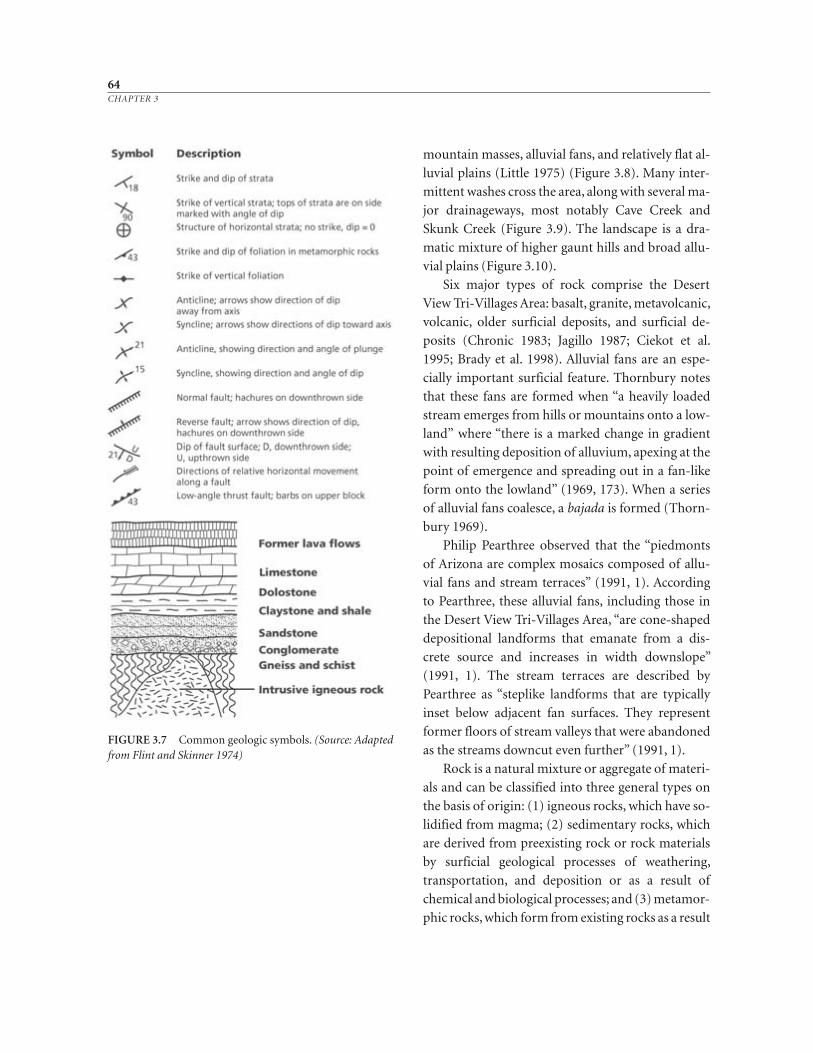
mountain masses, alluvial fans, and relatively flat al-
luvial plains (Little 1975) (Figure 3.8). Many inter-
mittent washes cross the area, along with several ma-
jor drainageways, most notably Cave Creek and
Skunk Creek (Figure 3.9). The landscape is a dra-
matic mixture of higher gaunt hills and broad allu-
vial plains (Figure 3.10).
Six major types of rock comprise the Desert
View Tri-Villages Area: basalt, granite, metavolcanic,
volcanic, older surficial deposits, and surficial de-
posits (Chronic 1983; Jagillo 1987; Ciekot et al.
1995; Brady et al. 1998). Alluvial fans are an espe-
cially important surficial feature. Thornbury notes
that these fans are formed when “a heavily loaded
stream emerges from hills or mountains onto a low-
land” where “there is a marked change in gradient
with resulting deposition of alluvium, apexing at the
point of emergence and spreading out in a fan-like
form onto the lowland” (1969, 173). When a series
of alluvial fans coalesce, a bajada is formed (Thorn-
bury 1969).
Philip Pearthree observed that the “piedmonts
of Arizona are complex mosaics composed of allu-
vial fans and stream terraces” (1991, 1). According
to Pearthree, these alluvial fans, including those in
the Desert View Tri-Villages Area, “are cone-shaped
depositional landforms that emanate from a dis-
crete source and increases in width downslope”
(1991, 1). The stream terraces are described by
Pearthree as “steplike landforms that are typically
inset below adjacent fan surfaces. They represent
former floors of stream valleys that were abandoned
as the streams downcut even further” (1991, 1).
Rock is a natural mixture or aggregate of materi-
als and can be classified into three general types on
the basis of origin: (1) igneous rocks, which have so-
lidified from magma; (2) sedimentary rocks, which
are derived from preexisting rock or rock materials
by surficial geological processes of weathering,
transportation, and deposition or as a result of
chemical and biological processes; and (3) metamor-
phic rocks, which form from existing rocks as a result
64CHAPTER 3
FIGURE 3.7 Common geologic symbols. (Source: Adaptedfrom Flint and Skinner 1974)
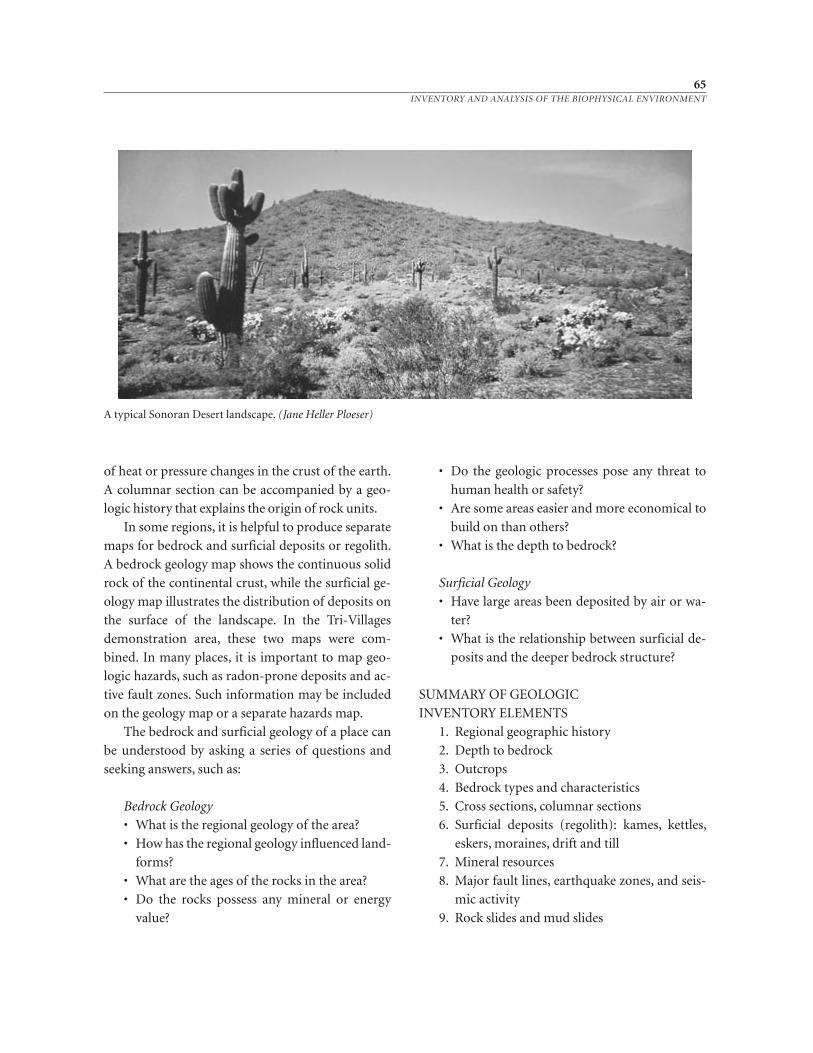
A typical Sonoran Desert landscape. (Jane Heller Ploeser)
65INVENTORY AND ANALYSIS OF THE BIOPHYSICAL ENVIRONMENT
of heat or pressure changes in the crust of the earth.
A columnar section can be accompanied by a geo-
logic history that explains the origin of rock units.
In some regions, it is helpful to produce separate
maps for bedrock and surficial deposits or regolith.
A bedrock geology map shows the continuous solid
rock of the continental crust, while the surficial ge-
ology map illustrates the distribution of deposits on
the surface of the landscape. In the Tri-Villages
demonstration area, these two maps were com-
bined. In many places, it is important to map geo-
logic hazards, such as radon-prone deposits and ac-
tive fault zones. Such information may be included
on the geology map or a separate hazards map.
The bedrock and surficial geology of a place can
be understood by asking a series of questions and
seeking answers, such as:
Bedrock Geology
• What is the regional geology of the area?
• How has the regional geology influenced land-
forms?
• What are the ages of the rocks in the area?
• Do the rocks possess any mineral or energy
value?
• Do the geologic processes pose any threat to
human health or safety?
• Are some areas easier and more economical to
build on than others?
• What is the depth to bedrock?
Surficial Geology
• Have large areas been deposited by air or wa-
ter?
• What is the relationship between surficial de-
posits and the deeper bedrock structure?
SUMMARY OF GEOLOGIC
INVENTORY ELEMENTS
1. Regional geographic history
2. Depth to bedrock
3. Outcrops
4. Bedrock types and characteristics
5. Cross sections, columnar sections
6. Surficial deposits (regolith): kames, kettles,
eskers, moraines, drift and till
7. Mineral resources
8. Major fault lines, earthquake zones, and seis-
mic activity
9. Rock slides and mud slides
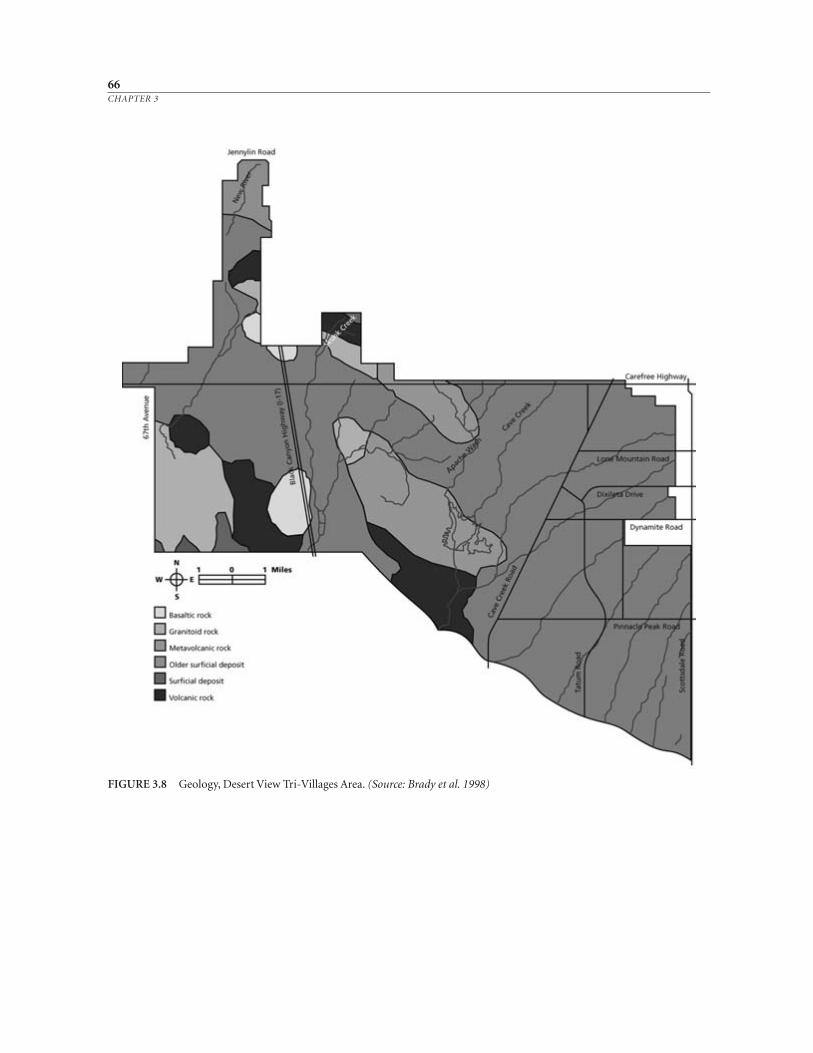
66CHAPTER 3
FIGURE 3.8 Geology, Desert View Tri-Villages Area. (Source: Brady et al. 1998)
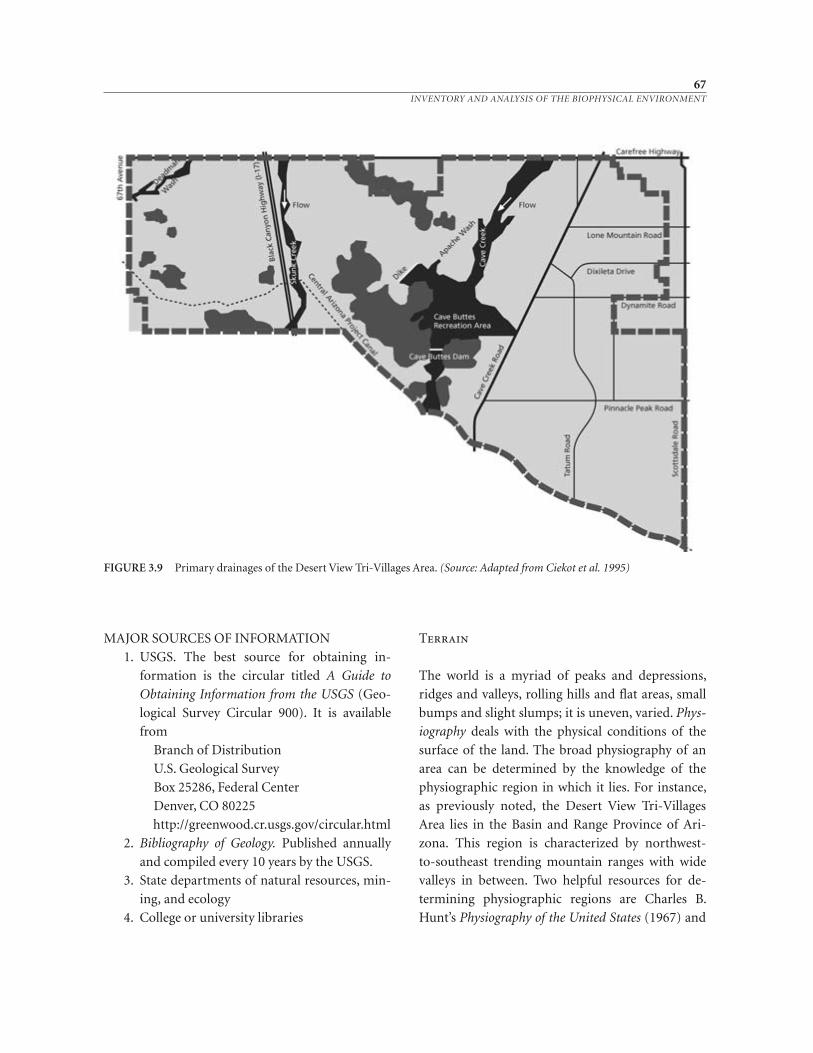
MAJOR SOURCES OF INFORMATION
1. USGS. The best source for obtaining in-
formation is the circular titled A Guide to
Obtaining Information from the USGS (Geo-
logical Survey Circular 900). It is available
from
Branch of Distribution
U.S. Geological Survey
Box 25286, Federal Center
Denver, CO 80225
http://greenwood.cr.usgs.gov/circular.html
2. Bibliography of Geology. Published annually
and compiled every 10 years by the USGS.
3. State departments of natural resources, min-
ing, and ecology
4. College or university libraries
Terrain
The world is a myriad of peaks and depressions,
ridges and valleys, rolling hills and flat areas, small
bumps and slight slumps; it is uneven, varied. Phys-
iography deals with the physical conditions of the
surface of the land. The broad physiography of an
area can be determined by the knowledge of the
physiographic region in which it lies. For instance,
as previously noted, the Desert View Tri-Villages
Area lies in the Basin and Range Province of Ari-
zona. This region is characterized by northwest-
to-southeast trending mountain ranges with wide
valleys in between. Two helpful resources for de-
termining physiographic regions are Charles B.
Hunt’s Physiography of the United States (1967) and
67INVENTORY AND ANALYSIS OF THE BIOPHYSICAL ENVIRONMENT
FIGURE 3.9 Primary drainages of the Desert View Tri-Villages Area. (Source: Adapted from Ciekot et al. 1995)
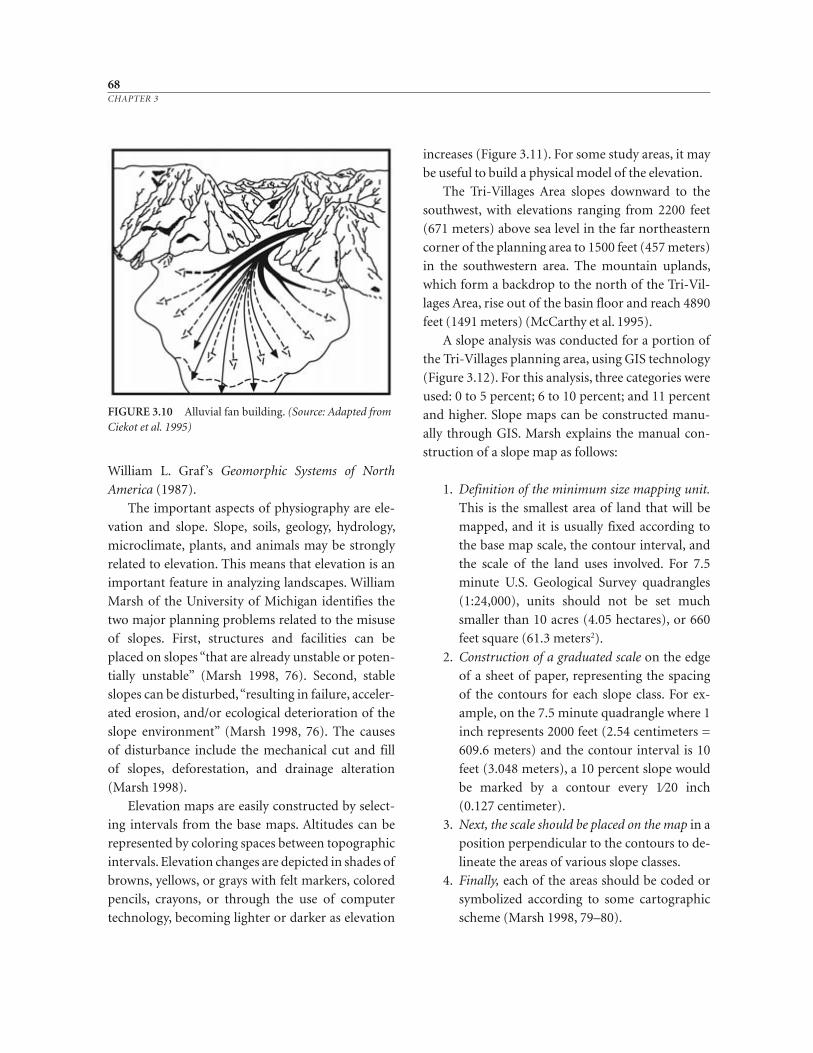
William L. Graf ’s Geomorphic Systems of North
America (1987).
The important aspects of physiography are ele-
vation and slope. Slope, soils, geology, hydrology,
microclimate, plants, and animals may be strongly
related to elevation. This means that elevation is an
important feature in analyzing landscapes. William
Marsh of the University of Michigan identifies the
two major planning problems related to the misuse
of slopes. First, structures and facilities can be
placed on slopes “that are already unstable or poten-
tially unstable” (Marsh 1998, 76). Second, stable
slopes can be disturbed, “resulting in failure, acceler-
ated erosion, and/or ecological deterioration of the
slope environment” (Marsh 1998, 76). The causes
of disturbance include the mechanical cut and fill
of slopes, deforestation, and drainage alteration
(Marsh 1998).
Elevation maps are easily constructed by select-
ing intervals from the base maps. Altitudes can be
represented by coloring spaces between topographic
intervals. Elevation changes are depicted in shades of
browns, yellows, or grays with felt markers, colored
pencils, crayons, or through the use of computer
technology, becoming lighter or darker as elevation
increases (Figure 3.11). For some study areas, it may
be useful to build a physical model of the elevation.
The Tri-Villages Area slopes downward to the
southwest, with elevations ranging from 2200 feet
(671 meters) above sea level in the far northeastern
corner of the planning area to 1500 feet (457 meters)
in the southwestern area. The mountain uplands,
which form a backdrop to the north of the Tri-Vil-
lages Area, rise out of the basin floor and reach 4890
feet (1491 meters) (McCarthy et al. 1995).
A slope analysis was conducted for a portion of
the Tri-Villages planning area, using GIS technology
(Figure 3.12). For this analysis, three categories were
used: 0 to 5 percent; 6 to 10 percent; and 11 percent
and higher. Slope maps can be constructed manu-
ally through GIS. Marsh explains the manual con-
struction of a slope map as follows:
1. Definition of the minimum size mapping unit.
This is the smallest area of land that will be
mapped, and it is usually fixed according to
the base map scale, the contour interval, and
the scale of the land uses involved. For 7.5
minute U.S. Geological Survey quadrangles
(1:24,000), units should not be set much
smaller than 10 acres (4.05 hectares), or 660
feet square (61.3 meters2).
2. Construction of a graduated scale on the edge
of a sheet of paper, representing the spacing
of the contours for each slope class. For ex-
ample, on the 7.5 minute quadrangle where 1
inch represents 2000 feet (2.54 centimeters =
609.6 meters) and the contour interval is 10
feet (3.048 meters), a 10 percent slope would
be marked by a contour every 1⁄20 inch
(0.127 centimeter).
3. Next, the scale should be placed on the map in a
position perpendicular to the contours to de-
lineate the areas of various slope classes.
4. Finally, each of the areas should be coded or
symbolized according to some cartographic
scheme (Marsh 1998, 79–80).
68CHAPTER 3
FIGURE 3.10 Alluvial fan building. (Source: Adapted fromCiekot et al. 1995)
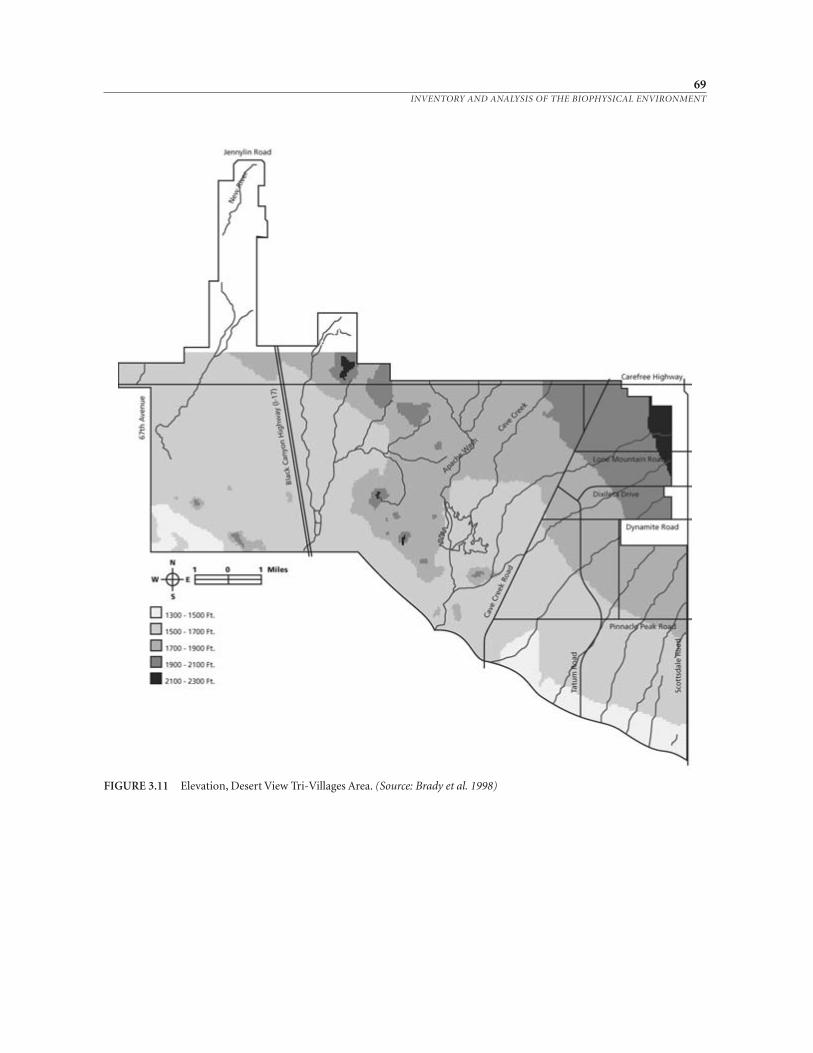
69INVENTORY AND ANALYSIS OF THE BIOPHYSICAL ENVIRONMENT
FIGURE 3.11 Elevation, Desert View Tri-Villages Area. (Source: Brady et al. 1998)
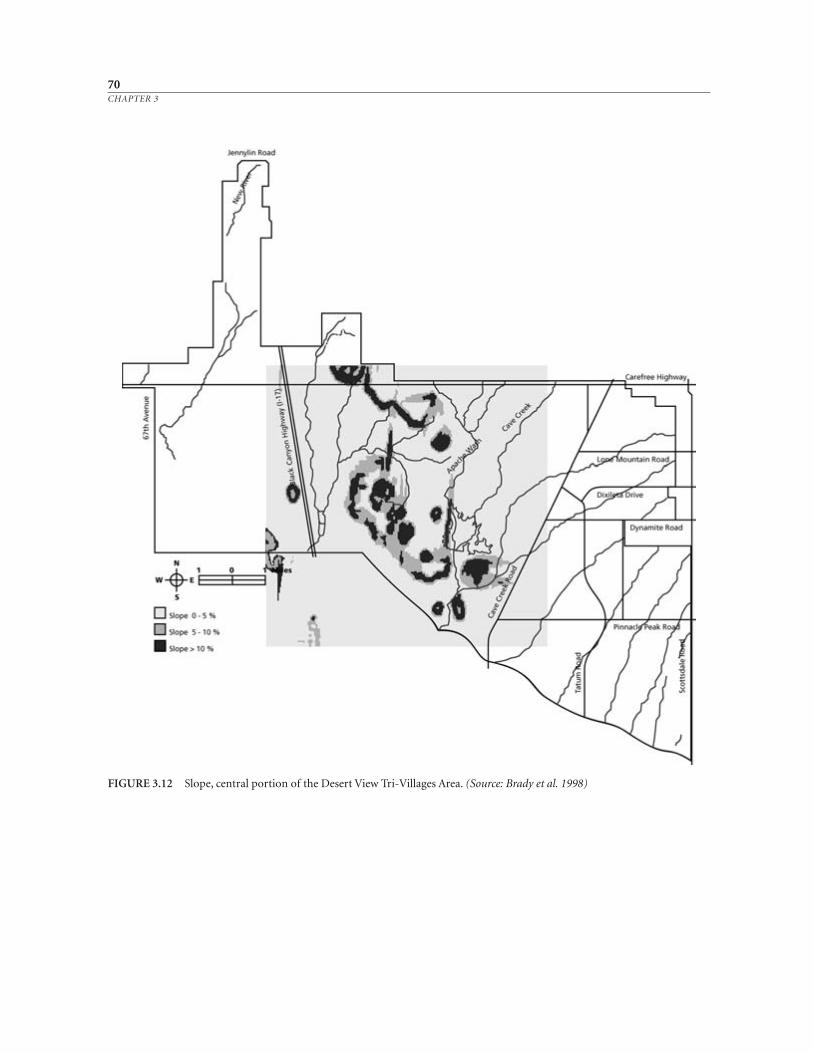
70CHAPTER 3
FIGURE 3.12 Slope, central portion of the Desert View Tri-Villages Area. (Source: Brady et al. 1998)
71INVENTORY AND ANALYSIS OF THE BIOPHYSICAL ENVIRONMENT
plied in conjunction to physiography, are building
form analysis and ground plan or town plan analy-
sis. For example, a team of environmental planning
graduate students at ASU constructed an urban
morphological cross section of central Phoenix
(Figure 3.16). The cross section relates to building
and ground elevations, exaggerating both to empha-
size variations (Andres et al. 1998). We will return to
the topic of urban morphology in the land-use por-
tions of this chapter and the next.
Answers to a few key questions can help with the
understanding of the planning area, including:
• What are the key features of the planning area,
including place names and major geographic
features?
• What are the highest and lowest places in the
area?
• Where are the other high spots and low spots?
• Where are the steeper areas?
• Why are some places steeper than others?
• In what directions do the slopes face?
SUMMARY OF PHYSIOGRAPHY
INVENTORY ELEMENTS
1. Physiographic region
2. Elevation
3. Slope: steepness and direction
4. Lithology
5. Digital terrain model
6. Figure–ground analysis
MAJOR SOURCES OF INFORMATION
1. U.S. Geological Survey
2. College or university libraries
3. Physiography of the United States (Hunt 1967)
and/or Geomorphic Systems of North America
(Graf 1987)
Water
Water is essential for all forms of life. It is also a fi-
nite resource. Most water in the hydrosphere is salt
Slopes may be subdivided according to steepness
and direction. Slope direction is referred to as as-
pect, or orientation. Steepness may be important for
such activities as agriculture or the construction of
buildings, while the direction of slopes is an impor-
tant factor for such activities as siting housing for
solar energy collection. Slope composition and re-
lated lithology needs to be determined. Lithology is
“the soil and rock material that comprise a slope”
(Marsh 1998, 80) or the physical characteristics of
sedimentary materials. As with the elevation map,
the division of slope categories will depend on the
study. In the Desert View Tri-Villages Area, three
categories were useful for the scale and issues ad-
dressed in the study. In another area or for more
specific studies or after the identification of addi-
tional issues, the changes in topography may require
different slope categories.
Computer technology presents many opportu-
nities to analyze the physiography of a planning
area. For example, a Landsat image was superim-
posed over a portion of the Tri-Villages Area (Figure
3.13). A topographic model was first constructed in
the computer, and then the Landsat image was com-
bined with it in three dimensions (Figure 3.14)
(Brady et al. 1998). In addition, digital terrain, or
digital elevation models, can be built (Figure 3.15)
(Burke and Ewan 1998a).
In urban locations, buildings can be considered
a physiographic feature. For such places, figure–
ground analyses are helpful. In a figure–ground
map, buildings are usually represented in black,
while the ground is white, but this pattern can be re-
versed (Trancik 1986). The field of urban morphol-
ogy may also be helpful in understanding the phys-
iography of a developed planning area. Urban
morphology is “the study of the city as human habi-
tat” (Moudon 1997, 3). The field was pioneered in
England by M. R. G. Conzen (Whitehand 1981;
Slater 1990) and in Italy by Saverio Muratori (1959;
Muratori et al. 1963). Two aspects of the Conzenian
urban morphological approach, which may be ap-
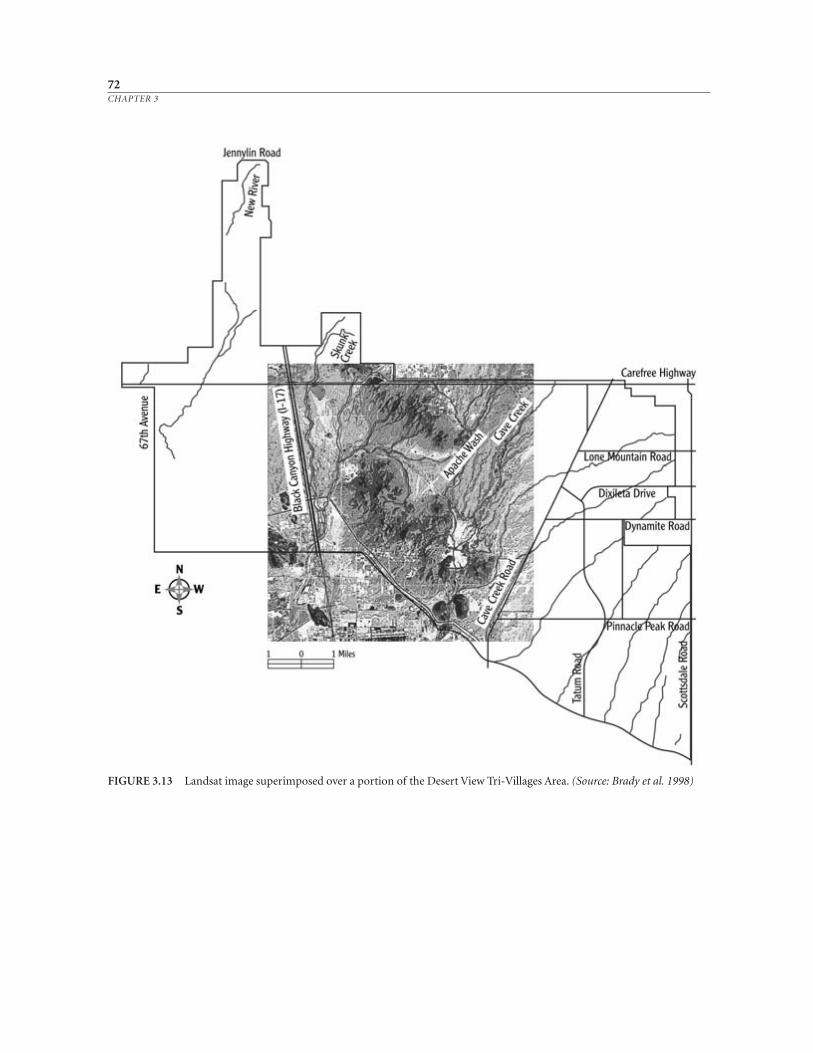
72CHAPTER 3
FIGURE 3.13 Landsat image superimposed over a portion of the Desert View Tri-Villages Area. (Source: Brady et al. 1998)
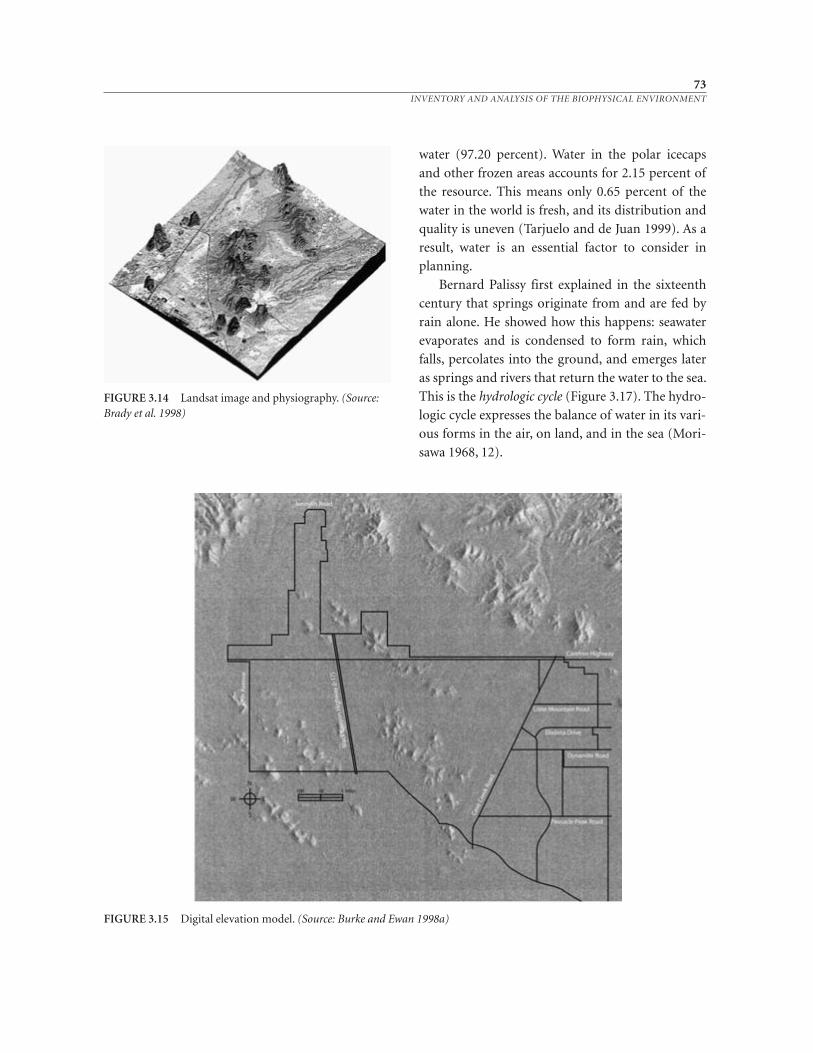
water (97.20 percent). Water in the polar icecaps
and other frozen areas accounts for 2.15 percent of
the resource. This means only 0.65 percent of the
water in the world is fresh, and its distribution and
quality is uneven (Tarjuelo and de Juan 1999). As a
result, water is an essential factor to consider in
planning.
Bernard Palissy first explained in the sixteenth
century that springs originate from and are fed by
rain alone. He showed how this happens: seawater
evaporates and is condensed to form rain, which
falls, percolates into the ground, and emerges later
as springs and rivers that return the water to the sea.
This is the hydrologic cycle (Figure 3.17). The hydro-
logic cycle expresses the balance of water in its vari-
ous forms in the air, on land, and in the sea (Mori-
sawa 1968, 12).
73INVENTORY AND ANALYSIS OF THE BIOPHYSICAL ENVIRONMENT
FIGURE 3.15 Digital elevation model. (Source: Burke and Ewan 1998a)
FIGURE 3.14 Landsat image and physiography. (Source:Brady et al. 1998)
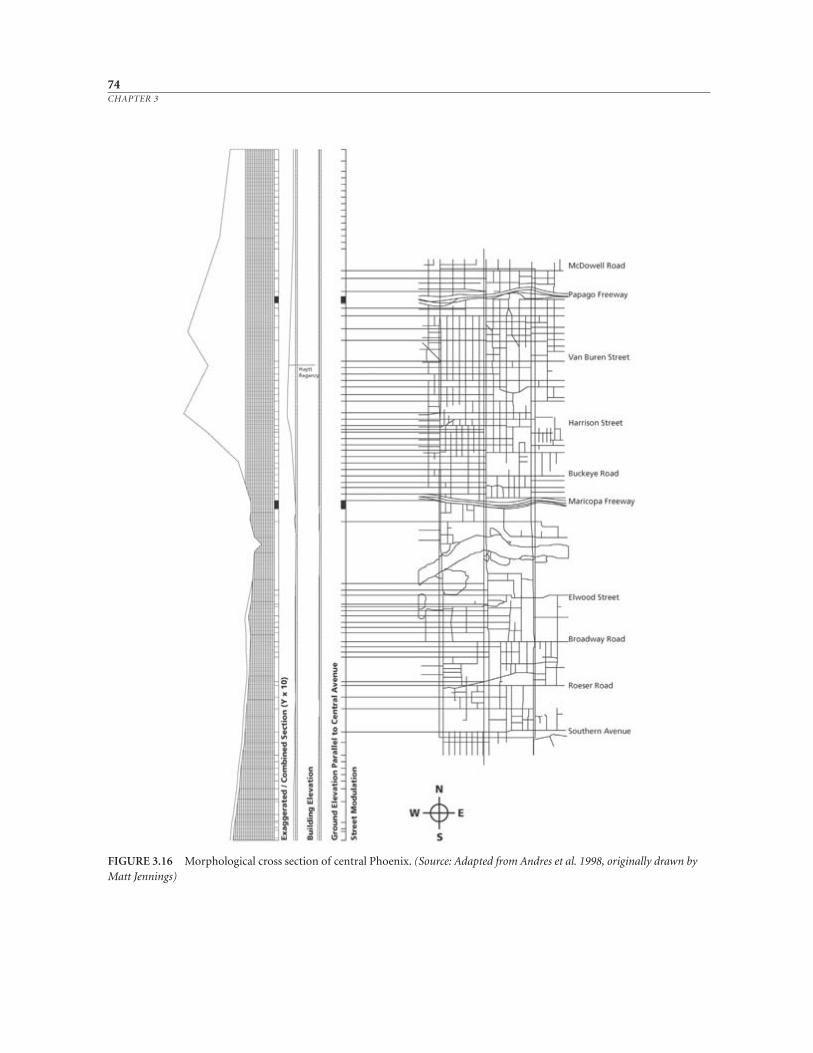
74CHAPTER 3
FIGURE 3.16 Morphological cross section of central Phoenix. (Source: Adapted from Andres et al. 1998, originally drawn byMatt Jennings)
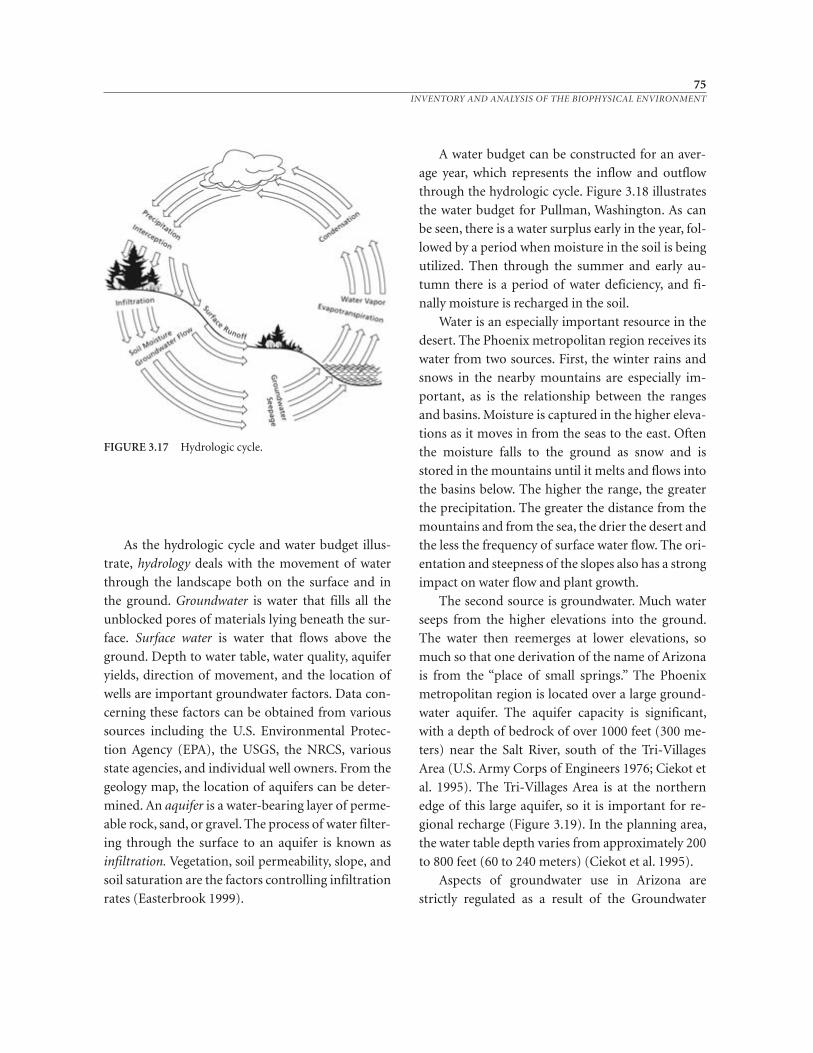
As the hydrologic cycle and water budget illus-
trate, hydrology deals with the movement of water
through the landscape both on the surface and in
the ground. Groundwater is water that fills all the
unblocked pores of materials lying beneath the sur-
face. Surface water is water that flows above the
ground. Depth to water table, water quality, aquifer
yields, direction of movement, and the location of
wells are important groundwater factors. Data con-
cerning these factors can be obtained from various
sources including the U.S. Environmental Protec-
tion Agency (EPA), the USGS, the NRCS, various
state agencies, and individual well owners. From the
geology map, the location of aquifers can be deter-
mined. An aquifer is a water-bearing layer of perme-
able rock, sand, or gravel. The process of water filter-
ing through the surface to an aquifer is known as
infiltration. Vegetation, soil permeability, slope, and
soil saturation are the factors controlling infiltration
rates (Easterbrook 1999).
A water budget can be constructed for an aver-
age year, which represents the inflow and outflow
through the hydrologic cycle. Figure 3.18 illustrates
the water budget for Pullman, Washington. As can
be seen, there is a water surplus early in the year, fol-
lowed by a period when moisture in the soil is being
utilized. Then through the summer and early au-
tumn there is a period of water deficiency, and fi-
nally moisture is recharged in the soil.
Water is an especially important resource in the
desert. The Phoenix metropolitan region receives its
water from two sources. First, the winter rains and
snows in the nearby mountains are especially im-
portant, as is the relationship between the ranges
and basins. Moisture is captured in the higher eleva-
tions as it moves in from the seas to the east. Often
the moisture falls to the ground as snow and is
stored in the mountains until it melts and flows into
the basins below. The higher the range, the greater
the precipitation. The greater the distance from the
mountains and from the sea, the drier the desert and
the less the frequency of surface water flow. The ori-
entation and steepness of the slopes also has a strong
impact on water flow and plant growth.
The second source is groundwater. Much water
seeps from the higher elevations into the ground.
The water then reemerges at lower elevations, so
much so that one derivation of the name of Arizona
is from the “place of small springs.” The Phoenix
metropolitan region is located over a large ground-
water aquifer. The aquifer capacity is significant,
with a depth of bedrock of over 1000 feet (300 me-
ters) near the Salt River, south of the Tri-Villages
Area (U.S. Army Corps of Engineers 1976; Ciekot et
al. 1995). The Tri-Villages Area is at the northern
edge of this large aquifer, so it is important for re-
gional recharge (Figure 3.19). In the planning area,
the water table depth varies from approximately 200
to 800 feet (60 to 240 meters) (Ciekot et al. 1995).
Aspects of groundwater use in Arizona are
strictly regulated as a result of the Groundwater
75INVENTORY AND ANALYSIS OF THE BIOPHYSICAL ENVIRONMENT
FIGURE 3.17 Hydrologic cycle.
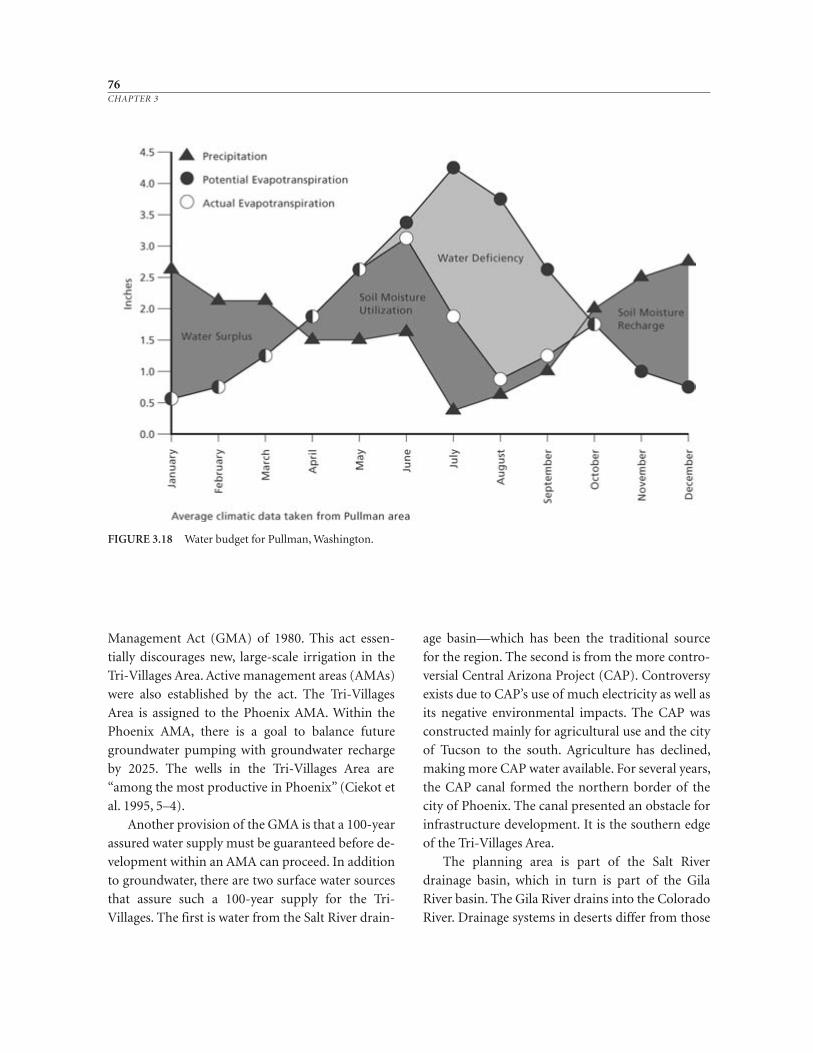
Management Act (GMA) of 1980. This act essen-
tially discourages new, large-scale irrigation in the
Tri-Villages Area. Active management areas (AMAs)
were also established by the act. The Tri-Villages
Area is assigned to the Phoenix AMA. Within the
Phoenix AMA, there is a goal to balance future
groundwater pumping with groundwater recharge
by 2025. The wells in the Tri-Villages Area are
“among the most productive in Phoenix” (Ciekot et
al. 1995, 5–4).
Another provision of the GMA is that a 100-year
assured water supply must be guaranteed before de-
velopment within an AMA can proceed. In addition
to groundwater, there are two surface water sources
that assure such a 100-year supply for the Tri-
Villages. The first is water from the Salt River drain -
age basin—which has been the traditional source
for the region. The second is from the more contro-
versial Central Arizona Project (CAP). Controversy
exists due to CAP’s use of much electricity as well as
its negative environmental impacts. The CAP was
constructed mainly for agricultural use and the city
of Tucson to the south. Agriculture has declined,
making more CAP water available. For several years,
the CAP canal formed the northern border of the
city of Phoenix. The canal presented an obstacle for
infrastructure development. It is the southern edge
of the Tri-Villages Area.
The planning area is part of the Salt River
drainage basin, which in turn is part of the Gila
River basin. The Gila River drains into the Colorado
River. Drainage systems in deserts differ from those
76CHAPTER 3
FIGURE 3.18 Water budget for Pullman, Washington.
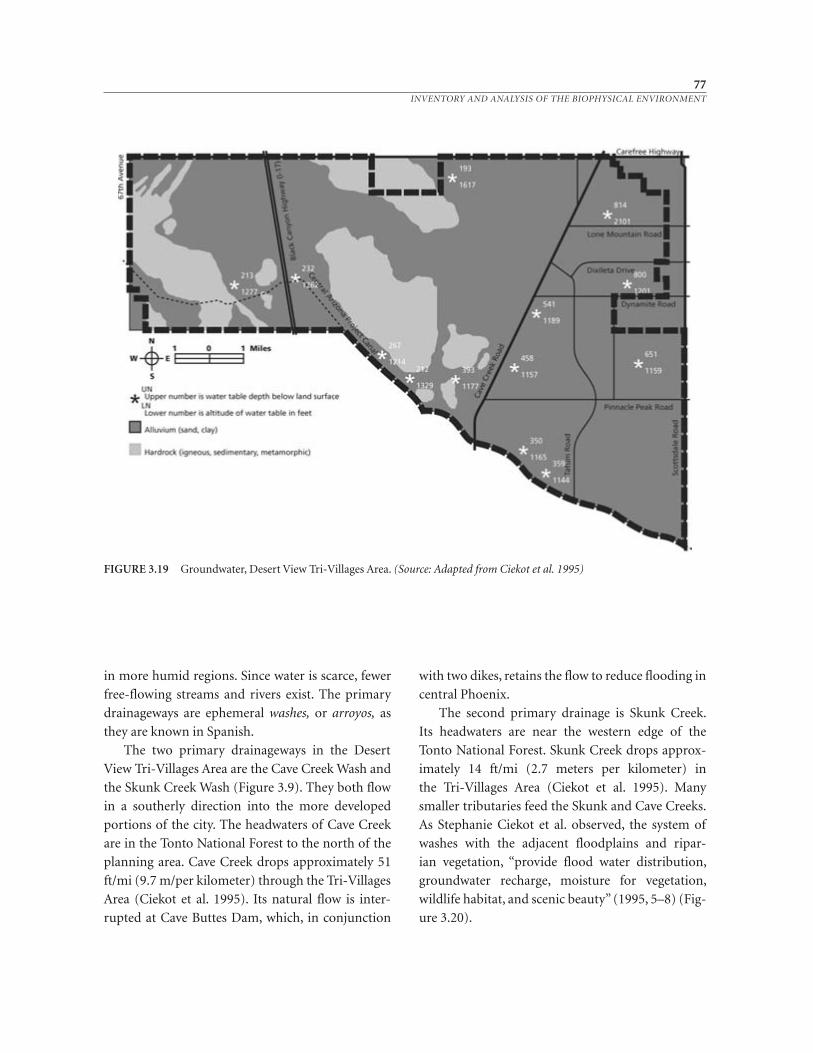
in more humid regions. Since water is scarce, fewer
free-flowing streams and rivers exist. The primary
drainageways are ephem eral washes, or arroyos, as
they are known in Spanish.
The two primary drainageways in the Desert
View Tri-Villages Area are the Cave Creek Wash and
the Skunk Creek Wash (Figure 3.9). They both flow
in a southerly direction into the more developed
portions of the city. The headwaters of Cave Creek
are in the Tonto National Forest to the north of the
planning area. Cave Creek drops approximately 51
ft/mi (9.7 m/per kilometer) through the Tri-Villages
Area (Ciekot et al. 1995). Its natural flow is inter-
rupted at Cave Buttes Dam, which, in conjunction
with two dikes, retains the flow to reduce flooding in
central Phoenix.
The second primary drainage is Skunk Creek.
Its headwaters are near the western edge of the
Tonto National Forest. Skunk Creek drops approx-
imately 14 ft/mi (2.7 meters per kilometer) in
the Tri-Villages Area (Ciekot et al. 1995). Many
smaller tributaries feed the Skunk and Cave Creeks.
As Stephanie Ciekot et al. observed, the system of
washes with the adjacent floodplains and ripar-
ian vegetation, “provide flood water distribution,
groundwater re charge, moisture for vegetation,
wildlife habitat, and scenic beauty” (1995, 5–8) (Fig-
ure 3.20).
77INVENTORY AND ANALYSIS OF THE BIOPHYSICAL ENVIRONMENT
FIGURE 3.19 Groundwater, Desert View Tri-Villages Area. (Source: Adapted from Ciekot et al. 1995)
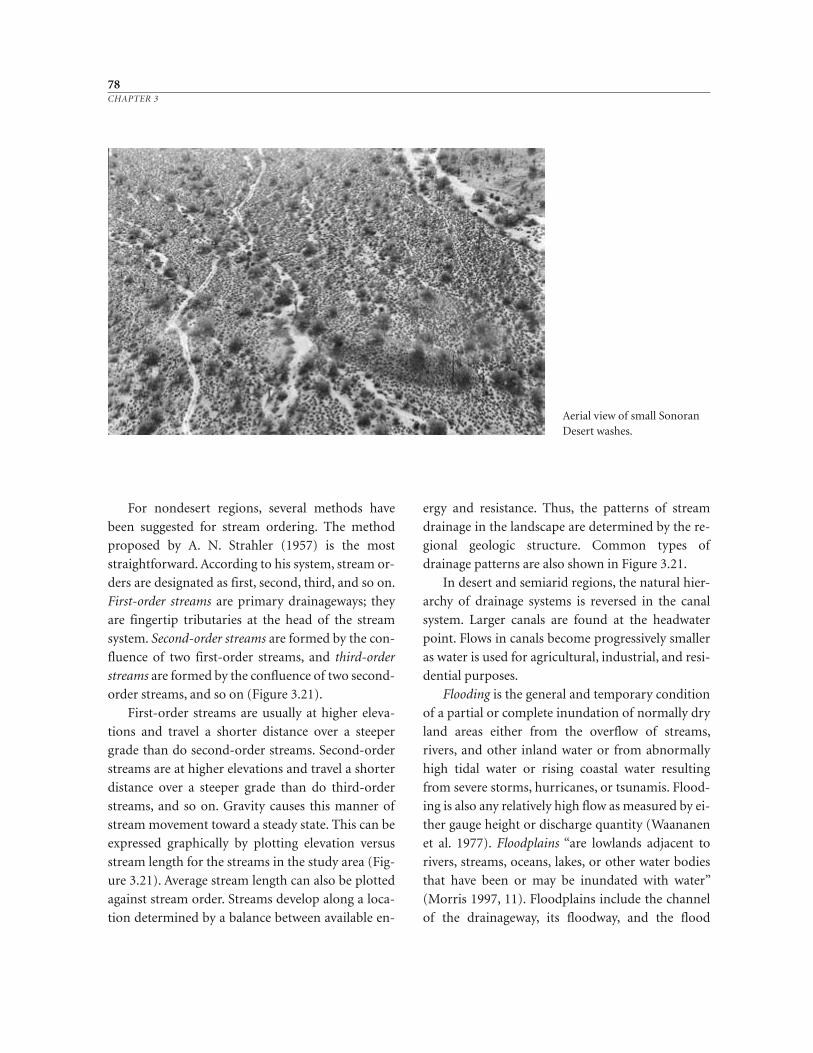
78CHAPTER 3
Aerial view of small SonoranDesert washes.
For nondesert regions, several methods have
been suggested for stream ordering. The method
proposed by A. N. Strahler (1957) is the most
straightforward. According to his system, stream or-
ders are designated as first, second, third, and so on.
First-order streams are primary drainageways; they
are fingertip tributaries at the head of the stream
system. Second-order streams are formed by the con-
fluence of two first-order streams, and third-order
streams are formed by the confluence of two second-
order streams, and so on (Figure 3.21).
First-order streams are usually at higher eleva-
tions and travel a shorter distance over a steeper
grade than do second-order streams. Second-order
streams are at higher elevations and travel a shorter
distance over a steeper grade than do third-order
streams, and so on. Gravity causes this manner of
stream movement toward a steady state. This can be
expressed graphically by plotting elevation versus
stream length for the streams in the study area (Fig-
ure 3.21). Average stream length can also be plotted
against stream order. Streams develop along a loca-
tion determined by a balance between available en-
ergy and resistance. Thus, the patterns of stream
drainage in the landscape are determined by the re-
gional geologic structure. Common types of
drainage patterns are also shown in Figure 3.21.
In desert and semiarid regions, the natural hier-
archy of drainage systems is reversed in the canal
system. Larger canals are found at the headwater
point. Flows in canals become progressively smaller
as water is used for agricultural, industrial, and resi-
dential purposes.
Flooding is the general and temporary condition
of a partial or complete inundation of normally dry
land areas either from the overflow of streams,
rivers, and other inland water or from abnormally
high tidal water or rising coastal water resulting
from severe storms, hurricanes, or tsunamis. Flood-
ing is also any relatively high flow as measured by ei-
ther gauge height or discharge quantity (Waananen
et al. 1977). Floodplains “are lowlands adjacent to
rivers, streams, oceans, lakes, or other water bodies
that have been or may be inundated with water”
(Morris 1997, 11). Floodplains include the channel
of the drainageway, its floodway, and the flood
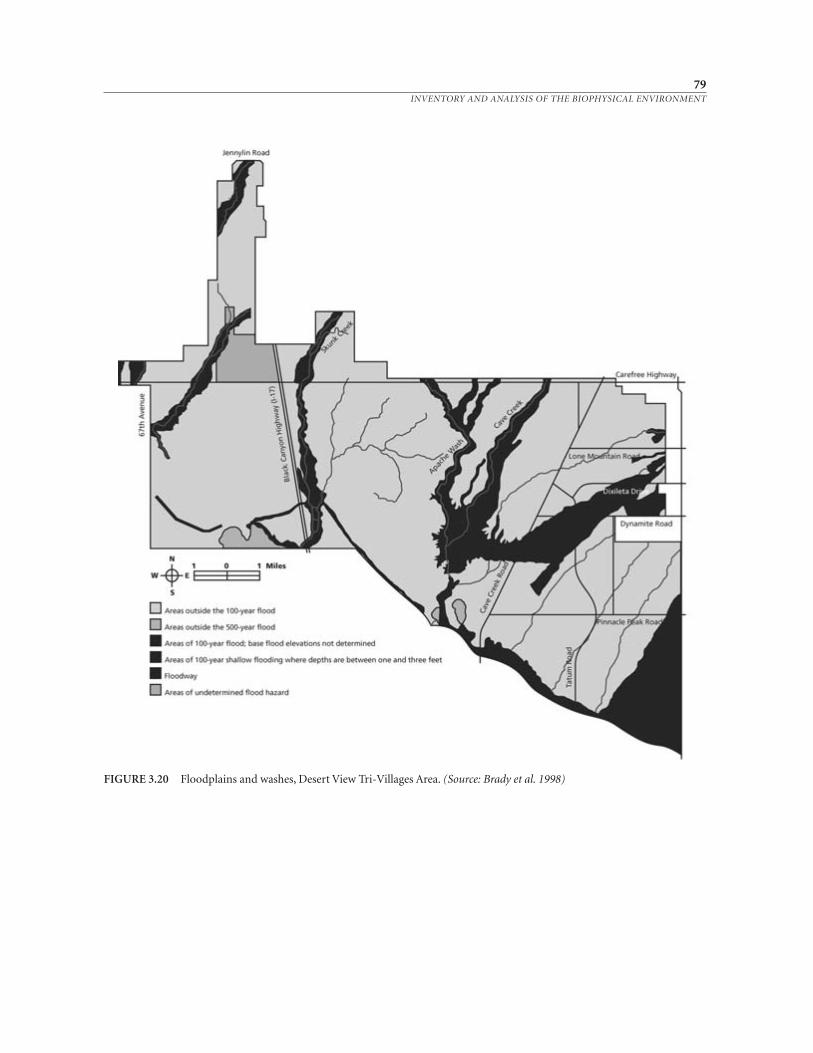
79INVENTORY AND ANALYSIS OF THE BIOPHYSICAL ENVIRONMENT
FIGURE 3.20 Floodplains and washes, Desert View Tri-Villages Area. (Source: Brady et al. 1998)
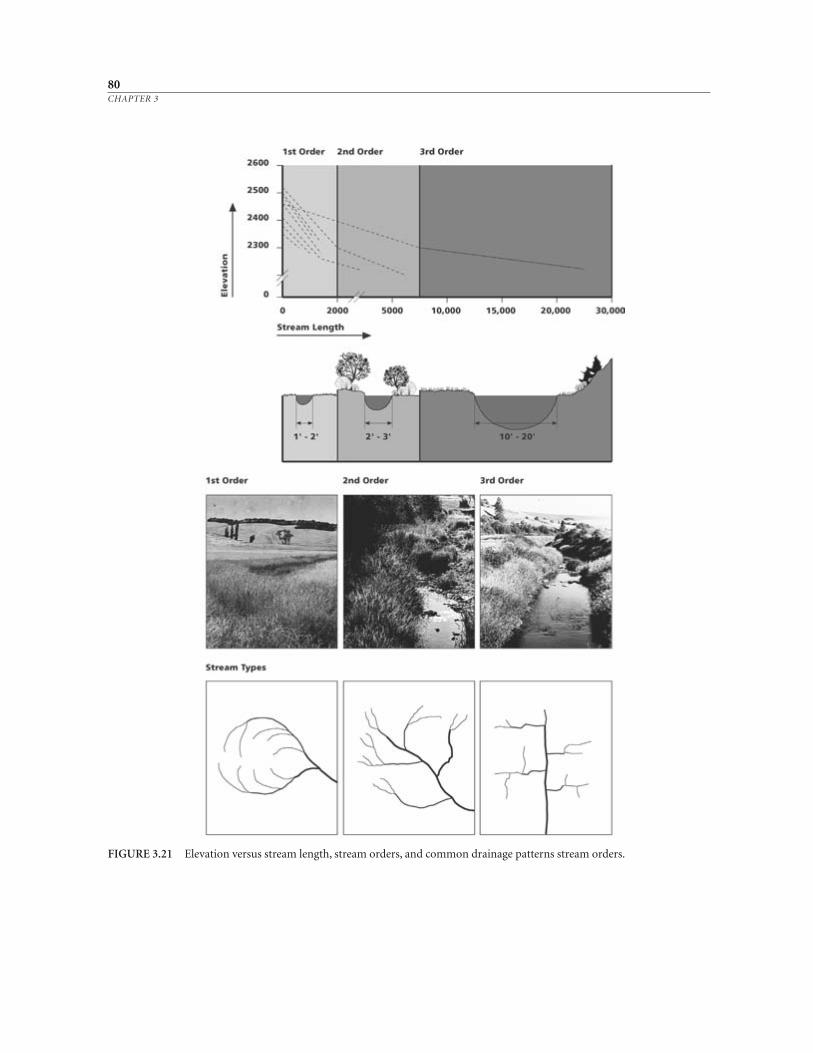
80CHAPTER 3
FIGURE 3.21 Elevation versus stream length, stream orders, and common drainage patterns stream orders.
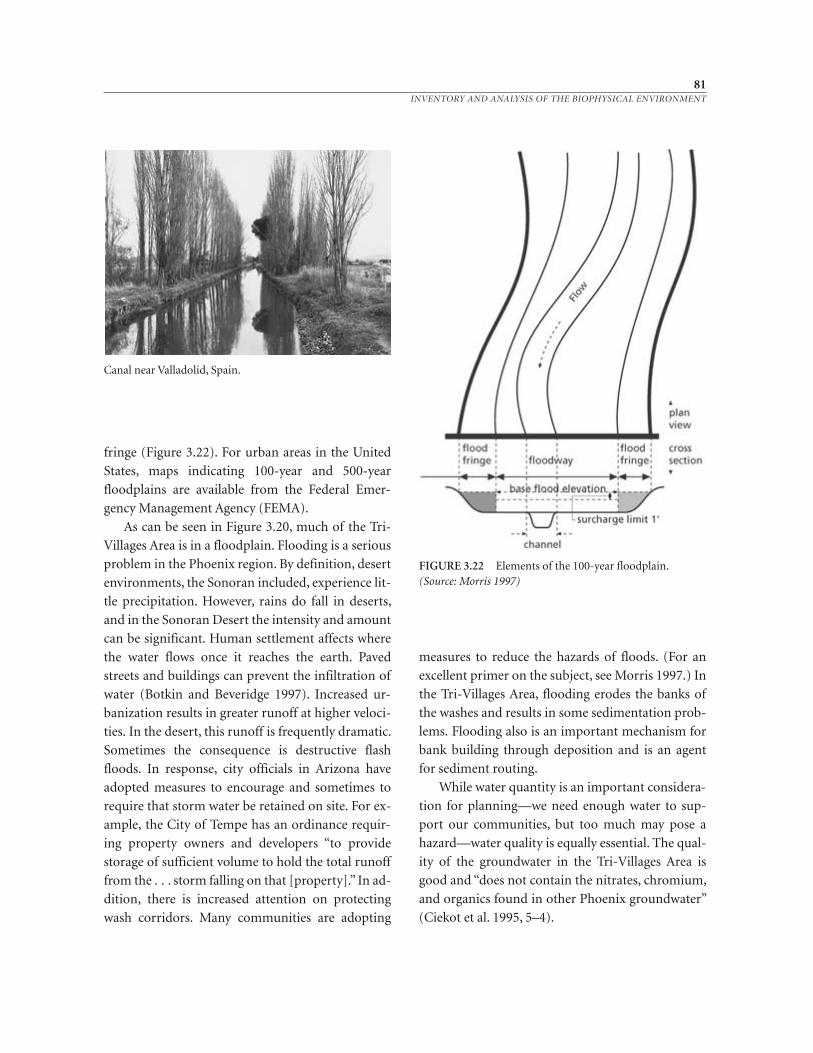
81INVENTORY AND ANALYSIS OF THE BIOPHYSICAL ENVIRONMENT
FIGURE 3.22 Elements of the 100-year floodplain.(Source: Morris 1997)
Canal near Valladolid, Spain.
fringe (Figure 3.22). For urban areas in the United
States, maps indicating 100-year and 500-year
floodplains are available from the Federal Emer-
gency Management Agency (FEMA).
As can be seen in Figure 3.20, much of the Tri-
Villages Area is in a floodplain. Flooding is a serious
problem in the Phoenix region. By definition, desert
environments, the Sonoran included, experience lit-
tle precipitation. However, rains do fall in deserts,
and in the Sonoran Desert the intensity and amount
can be significant. Human settlement affects where
the water flows once it reaches the earth. Paved
streets and buildings can prevent the infiltration of
water (Botkin and Beveridge 1997). Increased ur-
banization results in greater runoff at higher veloci-
ties. In the desert, this runoff is frequently dramatic.
Sometimes the consequence is destructive flash
floods. In response, city officials in Arizona have
adopted measures to encourage and sometimes to
require that storm water be retained on site. For ex-
ample, the City of Tempe has an ordinance requir-
ing property owners and developers “to provide
storage of sufficient volume to hold the total runoff
from the . . . storm falling on that [property].” In ad-
dition, there is increased attention on protecting
wash corridors. Many communities are adopting
measures to reduce the hazards of floods. (For an
excellent primer on the subject, see Morris 1997.) In
the Tri-Villages Area, flooding erodes the banks of
the washes and results in some sedimentation prob-
lems. Flooding also is an important mechanism for
bank building through deposition and is an agent
for sediment routing.
While water quantity is an important considera-
tion for planning—we need enough water to sup-
port our communities, but too much may pose a
hazard—water quality is equally essential. The qual-
ity of the groundwater in the Tri-Villages Area is
good and “does not contain the nitrates, chromium,
and organics found in other Phoenix groundwater”
(Ciekot et al. 1995, 5–4).
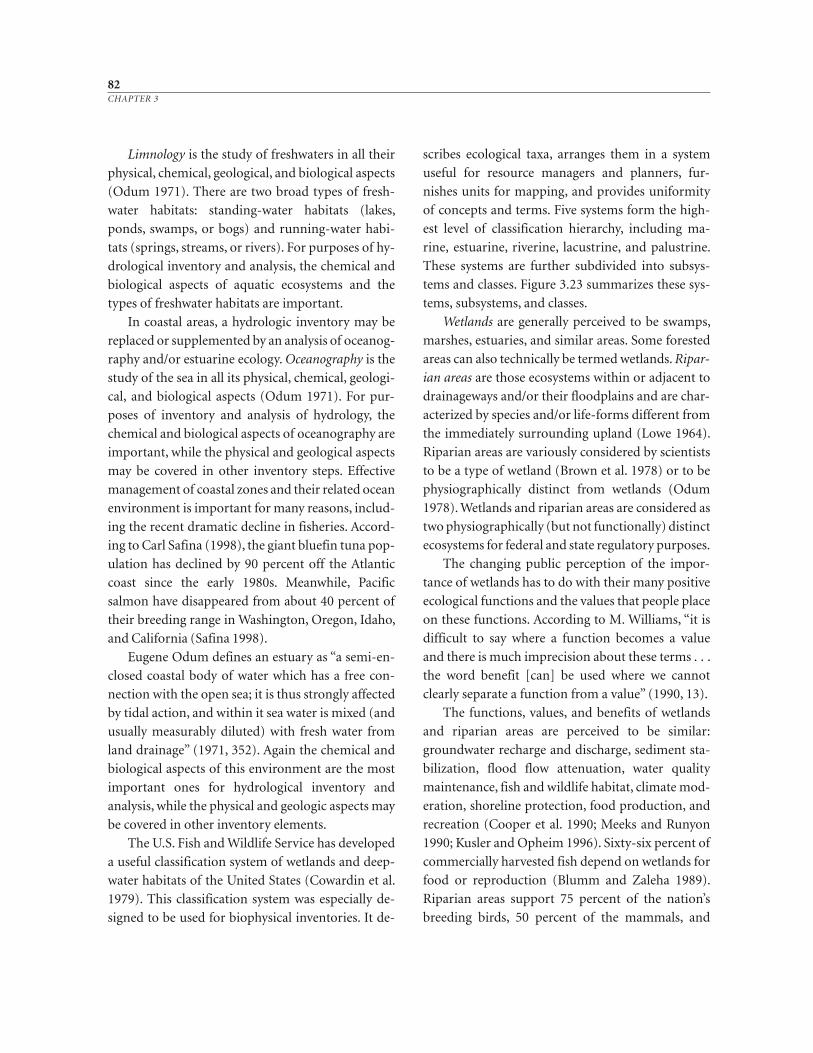
Limnology is the study of freshwaters in all their
physical, chemical, geological, and biological aspects
(Odum 1971). There are two broad types of fresh-
water habitats: standing-water habitats (lakes,
ponds, swamps, or bogs) and running-water habi-
tats (springs, streams, or rivers). For purposes of hy-
drological inventory and analysis, the chemical and
biological aspects of aquatic ecosystems and the
types of freshwater habitats are important.
In coastal areas, a hydrologic inventory may be
replaced or supplemented by an analysis of oceanog-
raphy and/or estuarine ecology. Oceanography is the
study of the sea in all its physical, chemical, geologi-
cal, and biological aspects (Odum 1971). For pur-
poses of inventory and analysis of hydrology, the
chemical and biological aspects of oceanography are
important, while the physical and geological aspects
may be covered in other inventory steps. Effective
management of coastal zones and their related ocean
environment is important for many reasons, includ-
ing the recent dramatic decline in fisheries. Accord-
ing to Carl Safina (1998), the giant bluefin tuna pop-
ulation has declined by 90 percent off the Atlantic
coast since the early 1980s. Meanwhile, Pacific
salmon have disappeared from about 40 percent of
their breeding range in Washington, Oregon, Idaho,
and California (Safina 1998).
Eugene Odum defines an estuary as “a semi-en-
closed coastal body of water which has a free con-
nection with the open sea; it is thus strongly affected
by tidal action, and within it sea water is mixed (and
usually measurably diluted) with fresh water from
land drainage” (1971, 352). Again the chemical and
biological aspects of this environment are the most
important ones for hydrological inventory and
analysis, while the physical and geologic aspects may
be covered in other inventory elements.
The U.S. Fish and Wildlife Service has developed
a useful classification system of wetlands and deep-
water habitats of the United States (Cowardin et al.
1979). This classification system was especially de-
signed to be used for biophysical inventories. It de-
scribes ecological taxa, arranges them in a system
useful for resource managers and planners, fur-
nishes units for mapping, and provides uniformity
of concepts and terms. Five systems form the high-
est level of classification hierarchy, including ma-
rine, estuarine, riverine, lacustrine, and palustrine.
These systems are further subdivided into subsys-
tems and classes. Figure 3.23 summarizes these sys-
tems, subsystems, and classes.
Wetlands are generally perceived to be swamps,
marshes, estuaries, and similar areas. Some forested
areas can also technically be termed wetlands. Ripar-
ian areas are those ecosystems within or adjacent to
drainageways and/or their floodplains and are char-
acterized by species and/or life-forms different from
the immediately surrounding upland (Lowe 1964).
Riparian areas are variously considered by scientists
to be a type of wetland (Brown et al. 1978) or to be
physiographically distinct from wetlands (Odum
1978). Wetlands and riparian areas are considered as
two physiographically (but not functionally) distinct
ecosystems for federal and state regulatory purposes.
The changing public perception of the impor-
tance of wetlands has to do with their many positive
ecological functions and the values that people place
on these functions. According to M. Williams, “it is
difficult to say where a function becomes a value
and there is much imprecision about these terms . . .
the word benefit [can] be used where we cannot
clearly separate a function from a value” (1990, 13).
The functions, values, and benefits of wetlands
and riparian areas are perceived to be similar:
groundwater recharge and discharge, sediment sta-
bilization, flood flow attenuation, water quality
maintenance, fish and wildlife habitat, climate mod-
eration, shoreline protection, food production, and
recreation (Cooper et al. 1990; Meeks and Runyon
1990; Kusler and Opheim 1996). Sixty-six percent of
commercially harvested fish depend on wetlands for
food or reproduction (Blumm and Zaleha 1989).
Riparian areas support 75 percent of the nation’s
breeding birds, 50 percent of the mammals, and
82CHAPTER 3
83INVENTORY AND ANALYSIS OF THE BIOPHYSICAL ENVIRONMENT
FIGURE 3.23 Classification hierarchy of wetlands and deep-water habitats, showing systems, subsystems, and classes. ThePalustrine system does not include deep-water habitats. (Source: Cowardin et al. 1979, courtesy of U.S. Fish and Wildlife Service)
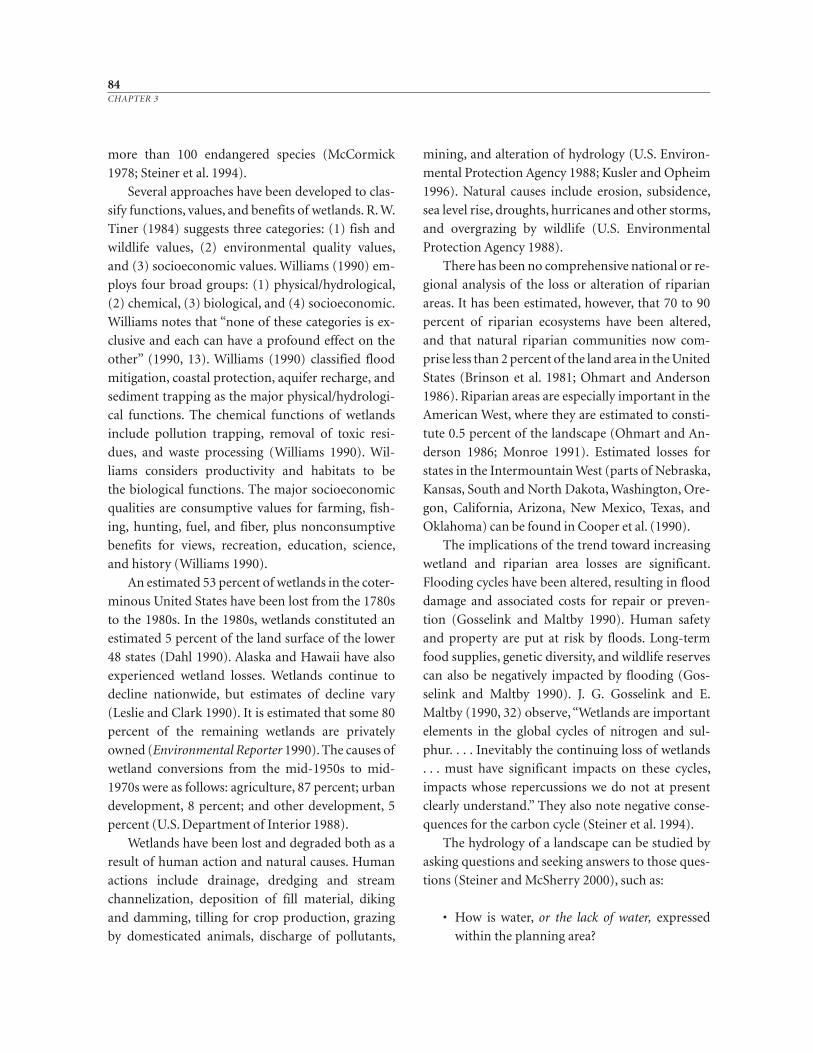
more than 100 endangered species (McCormick
1978; Steiner et al. 1994).
Several approaches have been developed to clas-
sify functions, values, and benefits of wetlands. R. W.
Tiner (1984) suggests three categories: (1) fish and
wildlife values, (2) environmental quality values,
and (3) socioeconomic values. Williams (1990) em-
ploys four broad groups: (1) physical/hydrological,
(2) chemical, (3) biological, and (4) socioeconomic.
Williams notes that “none of these categories is ex-
clusive and each can have a profound effect on the
other” (1990, 13). Wil liams (1990) classified flood
mitigation, coastal protection, aquifer recharge, and
sediment trapping as the major physical/hydrologi-
cal functions. The chemical functions of wetlands
include pollution trapping, removal of toxic resi-
dues, and waste processing (Wil liams 1990). Wil -
liams considers productivity and habitats to be
the biological functions. The major socioeconomic
qualities are consumptive values for farming, fish-
ing, hunting, fuel, and fiber, plus nonconsumptive
benefits for views, recreation, education, science,
and history (Williams 1990).
An estimated 53 percent of wetlands in the coter-
minous United States have been lost from the 1780s
to the 1980s. In the 1980s, wetlands constituted an
estimated 5 percent of the land surface of the lower
48 states (Dahl 1990). Alaska and Hawaii have also
experienced wetland losses. Wetlands continue to
decline nationwide, but estimates of decline vary
(Leslie and Clark 1990). It is estimated that some 80
percent of the remaining wetlands are privately
owned (Environmental Reporter 1990). The causes of
wetland conversions from the mid-1950s to mid-
1970s were as follows: agriculture, 87 percent; urban
development, 8 percent; and other development, 5
percent (U.S. Department of Interior 1988).
Wetlands have been lost and degraded both as a
result of human action and natural causes. Human
actions include drainage, dredging and stream
channelization, deposition of fill material, diking
and damming, tilling for crop production, grazing
by domesticated animals, discharge of pollutants,
mining, and alteration of hydrology (U.S. Environ-
mental Protection Agency 1988; Kusler and Opheim
1996). Natural causes include erosion, subsidence,
sea level rise, droughts, hurricanes and other storms,
and overgrazing by wildlife (U.S. Environmental
Protection Agency 1988).
There has been no comprehensive national or re-
gional analysis of the loss or alteration of riparian
areas. It has been estimated, however, that 70 to 90
percent of riparian ecosystems have been altered,
and that natural riparian communities now com-
prise less than 2 percent of the land area in the United
States (Brinson et al. 1981; Ohmart and Anderson
1986). Riparian areas are especially important in the
American West, where they are estimated to consti-
tute 0.5 percent of the landscape (Ohmart and An-
derson 1986; Monroe 1991). Estimated losses for
states in the Intermountain West (parts of Nebraska,
Kansas, South and North Dakota, Washington, Ore-
gon, California, Arizona, New Mexico, Texas, and
Oklahoma) can be found in Cooper et al. (1990).
The implications of the trend toward increasing
wetland and riparian area losses are significant.
Flooding cycles have been altered, resulting in flood
damage and associated costs for repair or preven-
tion (Gosselink and Maltby 1990). Human safety
and property are put at risk by floods. Long-term
food supplies, genetic diversity, and wildlife reserves
can also be negatively impacted by flooding (Gos-
selink and Maltby 1990). J. G. Gosselink and E.
Maltby (1990, 32) observe, “Wetlands are important
elements in the global cycles of nitrogen and sul-
phur. . . . Inevitably the continuing loss of wetlands
. . . must have significant impacts on these cycles,
impacts whose repercussions we do not at present
clearly understand.” They also note negative conse-
quences for the carbon cycle (Steiner et al. 1994).
The hydrology of a landscape can be studied by
asking questions and seeking answers to those ques-
tions (Steiner and McSherry 2000), such as:
• How is water, or the lack of water, expressed
within the planning area?
84CHAPTER 3
• Is there a regional connection?
• What is the visual connection to water?
• Is this visual connection limited to particular
places within the area?
• How has the presence of water determined the
location of land development, ranching, and
farming?
• What is the relationship between water and
sense of place in the planning area?
• Relative to the expression of water in the plan-
ning area:
Does water express itself through built
form?
Through the location of houses?
Schools?
Farms or ranches?
Roadways?
• What are the functions, values, and benefits of
wetlands and riparian areas?
• How does the spatial pattern of development
reflect water as either an abundant or a limited
resource?
SUMMARY OF HYDROLOGIC
INVENTORY ELEMENTS
A. Groundwater systems
1. Aquifer recharge areas
2. Consolidated and unconsolidated aquifer
location and yield
3. Well locations and yields
4. Water quantity and quality
5. Water table, artesian supplies
6. Seasonally high water table
7. Water-bearing characteristics of geologic
units
8. Infiltration rates
B. Surface water systems
1. Watershed and drainage basins
2. Stream, lake, estuary, coastline, and wet-
land locations
3. Stream volumes
4. Lake levels, tides
5. Floodplains, flood-hazard areas
6. Physical water-quality characteristics
(sediment loads and temperature)
7. Chemical water-quality characteristics
(such as pH, nitrogen, phosphorus, chlo-
rine, boron, and electrical conductivity)
8. Bacteriological water-quality characteris-
tics
9. Freshwater or marine flora and fauna
(may also be included in the vegetation
and wildlife parts of the inventory and
analysis process)
10. Eutrophication
11. Water supply systems
12. Sewage treatment systems
13. Existing industrial disposal and dis-
charge points
14. Existing solid-waste disposal sites affect-
ing water quality
15. Existing storm sewer systems and dis-
charge points
16. Algal bloom problems
17. Aquatic weed problem areas
18. Fish hatcheries and stocking areas (may
also be included in the land-use portion
of the inventory and analysis process)
MAJOR SOURCES OF INFORMATION
1. U.S. Geological Survey (USGS)
National Wetland Inventory
National Cartographic Information
Center
507 National Center
Reston, Virginia 22092
http://water.usgs.gov
2. U.S. Fish and Wildlife Service (USFWS)
National Wetland Inventory
9720 Executive Center Drive
Suite 101 Monroe Building
St. Petersburg, Florida 33702
3. Federal Emergency Management Agency
(FEMA)
Map Service Center
6730 Santa Barbara Court
85INVENTORY AND ANALYSIS OF THE BIOPHYSICAL ENVIRONMENT
Baltimore, Maryland 21227-5623
Phone 1-800-358-9616
Fax 1-800-358-9620
4. U.S. Natural Resources Conservation Ser-
vice (NRCS)
5. Agricultural Stabilization and Conservation
Service (ASCS)
6. U.S. Army Corps of Engineers
7. U.S. Department of Housing and Urban De-
velopment (National Flood Insurance Pro-
gram)
8. U.S. Forest Service (USFS)
9. Environmental Protection Agency (EPA)
10. National Marine Fisheries Service (U.S. De-
partment of Commerce)
11. Office of Coastal Zone Management
(NOAA, U.S. Department of Commerce)
12. Federal Aviation Administration (FAA)
13. U.S. Coast Guard
14. State departments of fisheries and coastal
management
15. State sea-grant universities
16. College and university libraries
17. River basin commissions
18. State departments of natural resources,
mining, and ecology
19. Individual well owners
Soils
Soils occupy a unique position in the lithosphere and
atmosphere. They are a transition zone that links the
biotic and abiotic environments. Soil is a natural
three-dimensional body on the surface of the earth
that is capable of supporting plants. Its properties re-
sult from the integrated effect of climate and living
matter acting upon parent material, as conditioned
by relief over periods of time. Many processes are
linked within the soil zone, so soils often can reveal
more about an area than any other natural factor.
Soils scientist William Broderson has noted,
“Much of our life’s activities and pursuits are related
and influenced by the behavior of the soil around
our houses, roads, septic and sewage disposal sys-
tems, airports, parks, recreation sites, farms, forests,
schools, and shopping centers. What is put on the
land should be guided by the soil that is beneath it”
(1994, 1).
Fortunately, many dedicated conservationists
have mapped soil information for most of the United
States. These conservationists, working for the U.S.
Natural Resources Conservation Service, an agency
of the U.S. Department of Agriculture (USDA), have
compiled map information in soil surveys for much
of the nation. The soil survey includes the informa-
tion necessary:
• To determine the important characteristics of
soils
• To classify soils into defined types and other
classificational units
• To establish and to plot on maps the bound-
aries among kinds of soils
• To correlate and to predict the adaptability of
soils to various crops, grasses, and trees, their
behavior and productivity under different
management systems, and the yields of
adapted crops under defined sets of manage-
ment practices
The principal purposes of the soil survey are:
• To make available all the specific information
about each kind of soil that is significant to its
use and behavior to those who must decide
how to manage it
• To provide descriptions of the mapping units
so the survey can be interpreted for land uses
that require the fundamental facts about soil
According to Broderson,
A soil survey generally contains soils data for one
county, parish, or other geographic area, such as a
major land resource area [MLRA]. During a soil sur-
vey, soil scientists walk over the landscapes, bore holes
86CHAPTER 3
with soil augers, and examine cross sections of soil
profiles. They determine the texture, color, structure,
and reaction of the soil and the relationship and
thickness of the different soil horizons. Some soils are
sampled and tested at soil survey laboratories for cer-
tain soil property determinations, such as cation-
exchange capacity and bulk density (1994, 1).
Soil surveys describe some of what is known
about the soil science, or pedology, of the area and
include information about soil associations, catenas,
series, phases, capability classes, profiles, erosion,
and drain age. A landscape has a distinctive charac-
teristic pattern of soils. Such a pattern is called an
association. It normally consists of one or more ma-
jor soils and at least one minor soil and is named for
the major soil or soils. A related but different group-
ing is a catena, a sequence of soils of about the same
age, derived from similar parent material, and oc-
curring under similar climate conditions but having
different characteristics due to variation in relief
and drainage.
A soil series is a group of soils having soil hori-
zons similar in characteristics and arrangement in
the soil profile, except for the texture of the soil, and
developed from a particular type of parent material.
Each soil series generally is named for a town or
other geographic feature near the place where a soil
of that series was first observed and mapped. Soils
of the same series name are essentially alike in those
characteristics that affect their behavior in the
undisturbed landscape.
Soils of one series can differ in texture from the
surface layer and in slope, stoniness, or some other
characteristic that affects human use of the soil. On
the basis of such differences, a soil series is divided
into phases. The name of a soil phase indicates a fea-
ture that affects management. For example, in the
Desert View Tri-Villages Area, the Gilman series is
divided into nine soil phases, such as, Gilman fine
sandy loam and Gilman loam, 1 to 3 percent slopes
(Hartman 1977) (Figure 3.24). A mapping unit is
usually equivalent to a phase. A phase is a division of
the series divided by properties that are important
to soil use, such as texture and slope (Broderson
1994). In a soil survey, these units are numbered.
Soil capability classification is a general way of
showing the suitability of soils for agricultural pur-
poses. Soils are grouped according to their limita-
tions, the risk of erosion under use, and the way they
respond to treatment. Capability classification is de-
scribed further in Chapter 5.
The soil profile is an important part of the de-
scription of each soil series and is defined as the se-
quence of layers (horizons) from the surface down-
ward to rock or other underlying material (Figure
3.25). These layers, or horizons, include:
O—Organic horizons (litter derived from dead
plants and animals)
A—Mineral horizons of maximum biological
activity
E—Eluvial horizons (mineral horizons that lie
at or near surface and are characterized as
zones of maximum leaching)
B—Illuvial horizons (the layers of accumulation
into which the above minerals are washed)
C—Unconsolidated material under A and B lay-
ers
R—Bedrock
Soil erosion is the searing away of the land surface by
running water, wind, ice, or other geologic agents
and by processes such as gravity. Erosion hazard
may be considered the susceptibility of soils to these
factors. The factors affecting erosion can be ex-
pressed in the following equation:
E = f (C, S, T, SS, M)
where
E = erosion,
f = function of (),
C = climate,
S = soil properties,
87INVENTORY AND ANALYSIS OF THE BIOPHYSICAL ENVIRONMENT
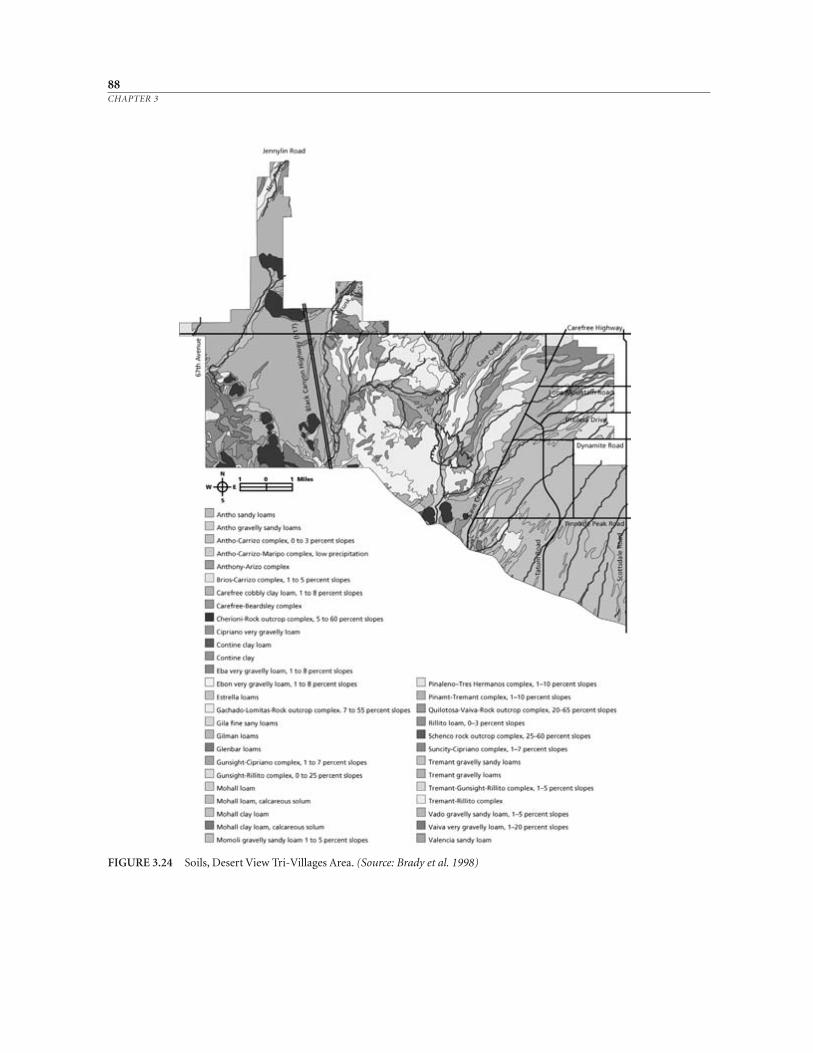
88CHAPTER 3
FIGURE 3.24 Soils, Desert View Tri-Villages Area. (Source: Brady et al. 1998)
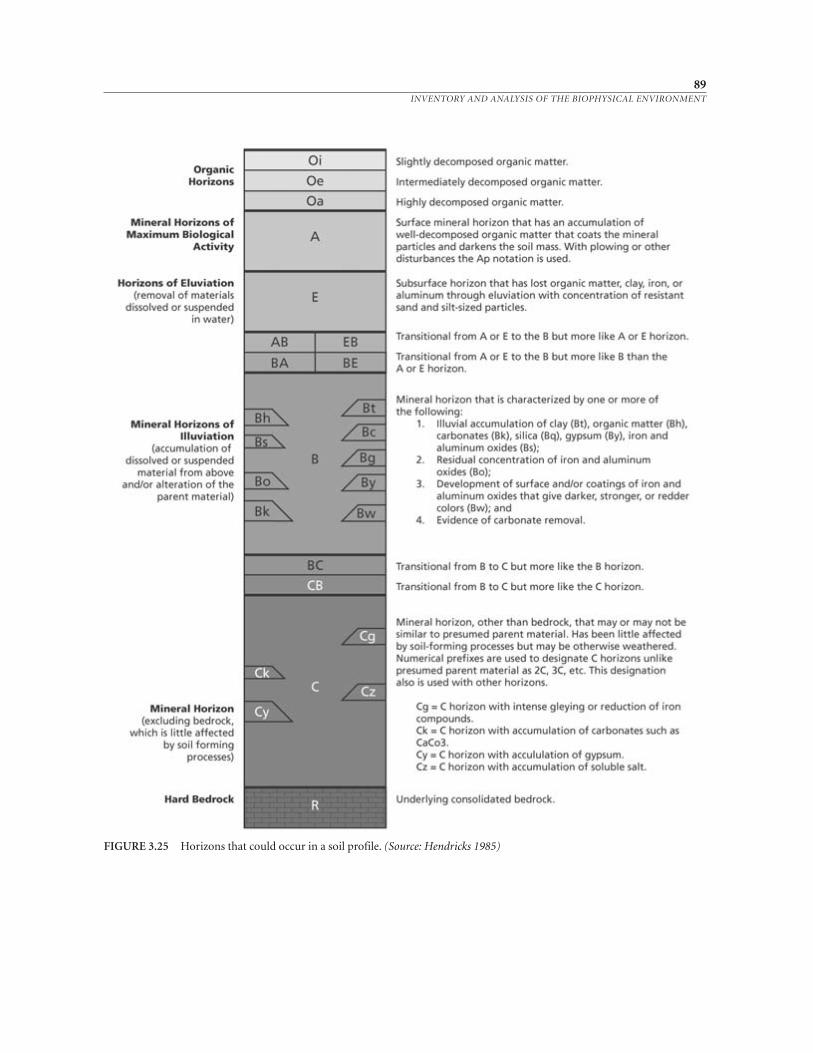
89INVENTORY AND ANALYSIS OF THE BIOPHYSICAL ENVIRONMENT
FIGURE 3.25 Horizons that could occur in a soil profile. (Source: Hendricks 1985)
T = topography,
SS= soil surface conditions, and
M = human activities (Renard and Foster 1983;
Renard et al. 1997).
Soil scientists developed an equation to express
the functional relationship among these factors. As
early as the 1930s, erosion prediction equations
were developed that came together as the universal
soil loss equation (USLE) originally in the late 1950s
and the early 1960s (Wischmeier and Smith 1965,
1978). Erosion prediction equations are improved
constantly, which has resulted in the revised univer-
sal soil loss equation (RUSLE). Both USLE and
RUSLE compute the average annual erosion ex-
pected on field slopes as
A = R · K · L · S · C · P
where
A = computed spatial average soil loss and
temporal average soil loss per unit of
area, expressed in the units selected for
K and for the period selected for R. In
practice, these are usually selected so
that A is expressed in ton · acre–1 · yr–1,
but other units can be selected (that is,
t · ha–1 · yr–1).
R = rainfall-runoff erosivity factor—the
rainfall erosion index plus a factor for
any significant runoff from snowmelt.
K = soil erodibility factor—the soil-loss
rate per erosion index unit for a speci-
fied soil as measured on a standard
plot, which is defined as a 72.6-ft
(22.1-m) length of uniform 9 percent
slope in continuous clean-tilled fallow.
L = slope length factor—the ratio of soil
loss from the field slope length to soil
loss from a 72.6-ft length under identi-
cal conditions.
S = slope steepness factor—the ratio of
soil loss from the field slope gradient
to soil loss from a 9 percent slope un-
der otherwise identical conditions.
C = cover-management factor—the ratio
of soil loss from an area with specified
cover and management to soil loss
from an identical area in tilled contin-
uous fallow.
P = support practice factor—the ratio of
soil loss with a support practice like
contouring, stripcropping, or terrac-
ing to soil loss with straight-row farm-
ing up and down the slope (Renard et
al. 1997).
There are also wind-erosion equations that con-
sider similar factors for wind erosion (see Skidmore
1994, for example). Some soil erosion occurs natu-
rally, so the question can be raised: What rate is tol-
erable? Tolerable soil loss can be defined as the maxi-
mum rate of annual soil erosion that will permit a
high level of crop productivity to be sustained eco-
nomically and indefinitely. These T values vary from
soil to soil, depending on how fast new topsoil can
be formed to replace the soil lost to erosion. Typi-
cally the universal soil-loss equation and the univer-
sal wind-erosion equation are used to determine
what cropping and tillage practices are necessary to
keep soil loss within a tolerable level.
Soil drainage may be defined as the relative ra-
pidity and the extent of the removal of water from
the surface and from within the soil under natural
conditions. Soil series in a soil survey will include a
description of drainage. Some of this soil survey in-
formation will be explored further, using the Desert
View Tri-Villages Area as an example.
The soils map (Figure 3.24) shows the mapping
units in the Desert View Tri-Villages Area. The soils
of the area vary in texture. Sands, silts, and clays are
present. Figure 3.26 shows the soil textural classes,
while Table 3.5 illustrates the various particle sizes
and the corresponding nomenclature. There are
four basic texture groups—sands, silts, clays, and
loams—that can be subdivided further to reflect var-
90CHAPTER 3
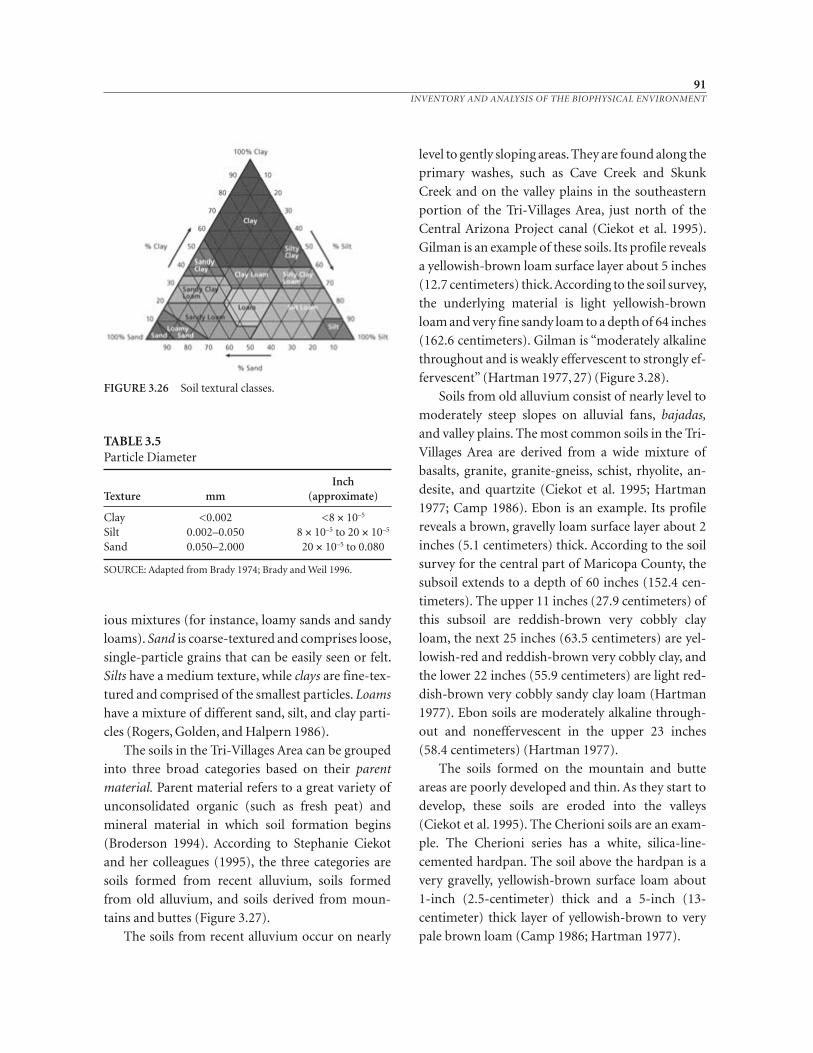
ious mixtures (for instance, loamy sands and sandy
loams). Sand is coarse-textured and comprises loose,
single-particle grains that can be easily seen or felt.
Silts have a medium texture, while clays are fine-tex-
tured and comprised of the smallest particles. Loams
have a mixture of different sand, silt, and clay parti-
cles (Rogers, Golden, and Halpern 1986).
The soils in the Tri-Villages Area can be grouped
into three broad categories based on their parent
material. Parent material refers to a great variety of
unconsolidated organic (such as fresh peat) and
mineral material in which soil formation begins
(Broderson 1994). According to Stephanie Ciekot
and her colleagues (1995), the three categories are
soils formed from recent alluvium, soils formed
from old alluvium, and soils derived from moun-
tains and buttes (Figure 3.27).
The soils from recent alluvium occur on nearly
level to gently sloping areas. They are found along the
primary washes, such as Cave Creek and Skunk
Creek and on the valley plains in the southeastern
portion of the Tri-Villages Area, just north of the
Central Arizona Project canal (Ciekot et al. 1995).
Gilman is an example of these soils. Its profile reveals
a yellowish-brown loam surface layer about 5 inches
(12.7 centimeters) thick. According to the soil survey,
the underlying material is light yellowish-brown
loam and very fine sandy loam to a depth of 64 inches
(162.6 centimeters). Gilman is “moderately alkaline
throughout and is weakly effervescent to strongly ef-
fervescent” (Hartman 1977, 27) (Figure 3.28).
Soils from old alluvium consist of nearly level to
moderately steep slopes on alluvial fans, bajadas,
and valley plains. The most common soils in the Tri-
Villages Area are derived from a wide mixture of
basalts, granite, granite-gneiss, schist, rhyolite, an-
desite, and quartzite (Ciekot et al. 1995; Hartman
1977; Camp 1986). Ebon is an example. Its profile
reveals a brown, gravelly loam surface layer about 2
inches (5.1 centimeters) thick. According to the soil
survey for the central part of Maricopa County, the
subsoil extends to a depth of 60 inches (152.4 cen-
timeters). The upper 11 inches (27.9 centimeters) of
this subsoil are reddish-brown very cobbly clay
loam, the next 25 inches (63.5 centimeters) are yel-
lowish-red and reddish-brown very cobbly clay, and
the lower 22 inches (55.9 centimeters) are light red-
dish-brown very cobbly sandy clay loam (Hartman
1977). Ebon soils are moderately alkaline through-
out and noneffervescent in the upper 23 inches
(58.4 centimeters) (Hartman 1977).
The soils formed on the mountain and butte
areas are poorly developed and thin. As they start to
develop, these soils are eroded into the valleys
(Ciekot et al. 1995). The Cherioni soils are an exam-
ple. The Cherioni series has a white, silica-line-
cemented hardpan. The soil above the hardpan is a
very gravelly, yellowish-brown surface loam about
1-inch (2.5-centimeter) thick and a 5-inch (13-
centimeter) thick layer of yellowish-brown to very
pale brown loam (Camp 1986; Hartman 1977).
91INVENTORY AND ANALYSIS OF THE BIOPHYSICAL ENVIRONMENT
FIGURE 3.26 Soil textural classes.
TABLE 3.5Particle Diameter
Inch Texture mm (approximate)
Clay <0.002 <8 × 10⁻⁵
Silt 0.002–0.050 8 × 10⁻⁵ to 20 × 10–5
Sand 0.050–2.000 20 × 10–5 to 0.080
SOURCE: Adapted from Brady 1974; Brady and Weil 1996.
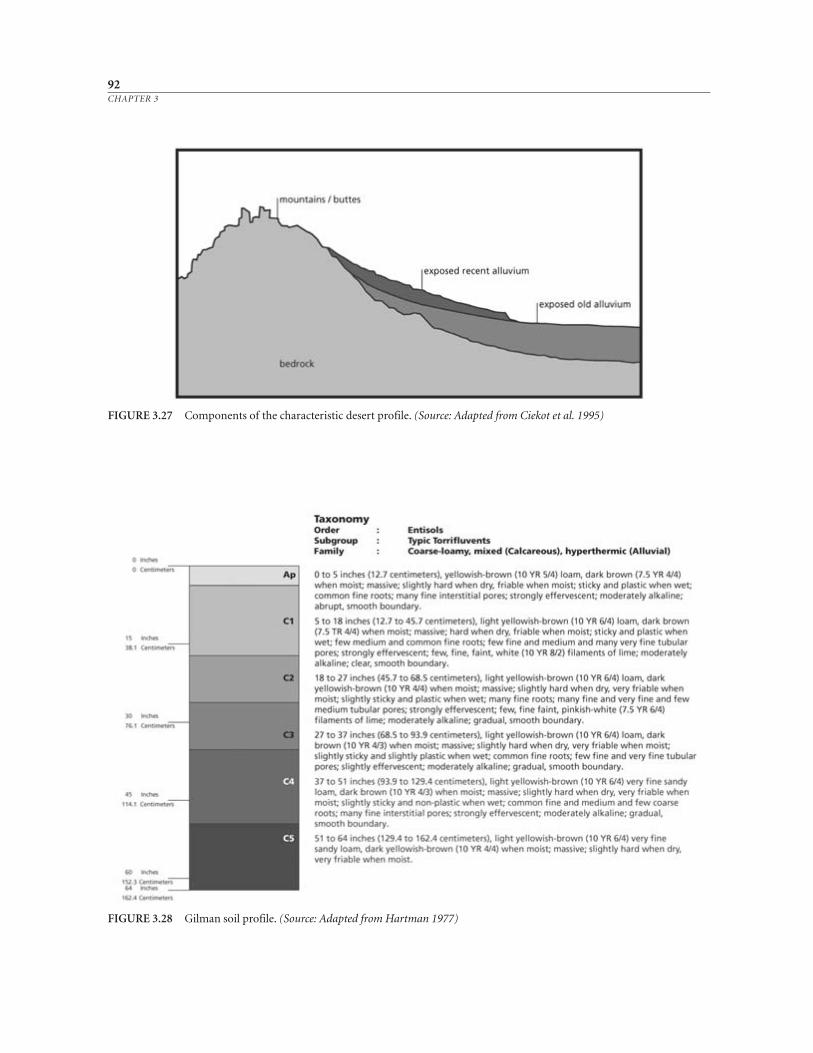
92CHAPTER 3
FIGURE 3.28 Gilman soil profile. (Source: Adapted from Hartman 1977)
FIGURE 3.27 Components of the characteristic desert profile. (Source: Adapted from Ciekot et al. 1995)
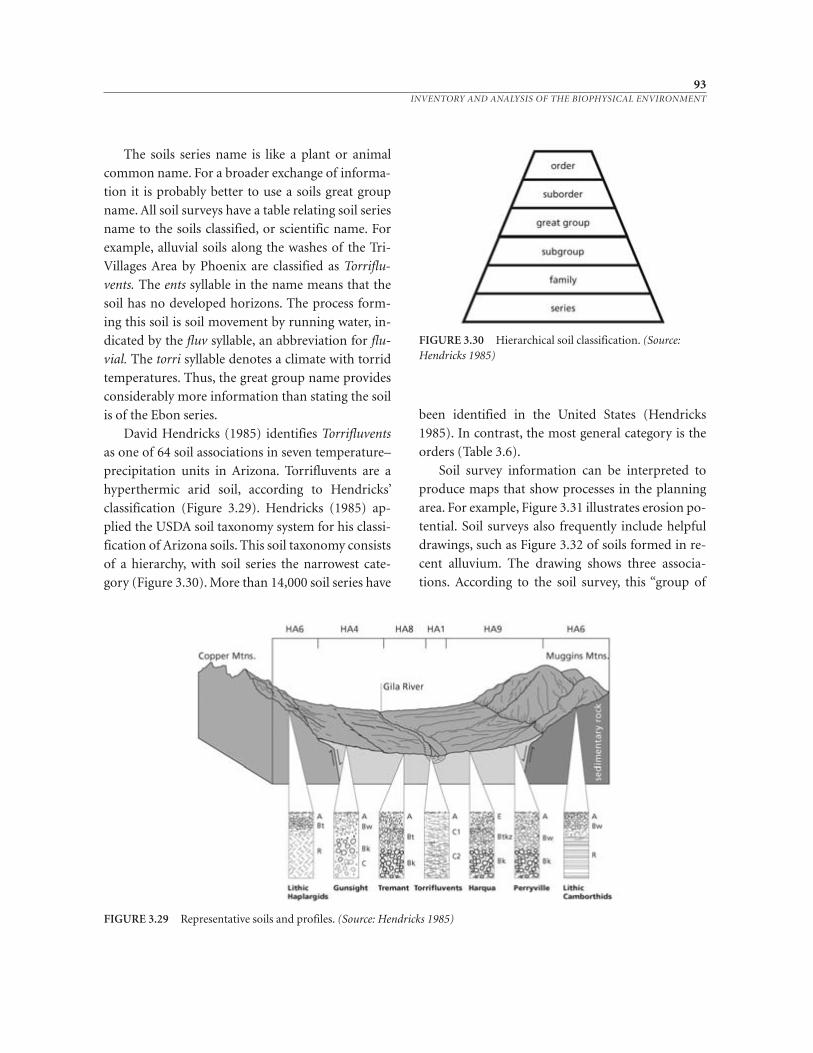
The soils series name is like a plant or animal
common name. For a broader exchange of informa-
tion it is probably better to use a soils great group
name. All soil surveys have a table relating soil series
name to the soils classified, or scientific name. For
example, alluvial soils along the washes of the Tri-
Villages Area by Phoenix are classified as Torriflu-
vents. The ents syllable in the name means that the
soil has no developed horizons. The process form-
ing this soil is soil movement by running water, in-
dicated by the fluv syllable, an abbreviation for flu-
vial. The torri syllable denotes a climate with torrid
temperatures. Thus, the great group name provides
considerably more information than stating the soil
is of the Ebon series.
David Hendricks (1985) identifies Torrifluvents
as one of 64 soil associations in seven temperature–
precipitation units in Arizona. Torrifluvents are a
hyperthermic arid soil, according to Hendricks’
classification (Figure 3.29). Hendricks (1985) ap-
plied the USDA soil taxonomy system for his classi-
fication of Arizona soils. This soil taxonomy consists
of a hierarchy, with soil series the narrowest cate-
gory (Figure 3.30). More than 14,000 soil series have
been identified in the United States (Hendricks
1985). In contrast, the most general category is the
orders (Table 3.6).
Soil survey information can be interpreted to
produce maps that show processes in the planning
area. For example, Figure 3.31 illustrates erosion po-
tential. Soil surveys also frequently include helpful
drawings, such as Figure 3.32 of soils formed in re-
cent alluvium. The drawing shows three associa-
tions. According to the soil survey, this “group of
93INVENTORY AND ANALYSIS OF THE BIOPHYSICAL ENVIRONMENT
FIGURE 3.30 Hierarchical soil classification. (Source:Hendricks 1985)
FIGURE 3.29 Representative soils and profiles. (Source: Hendricks 1985)
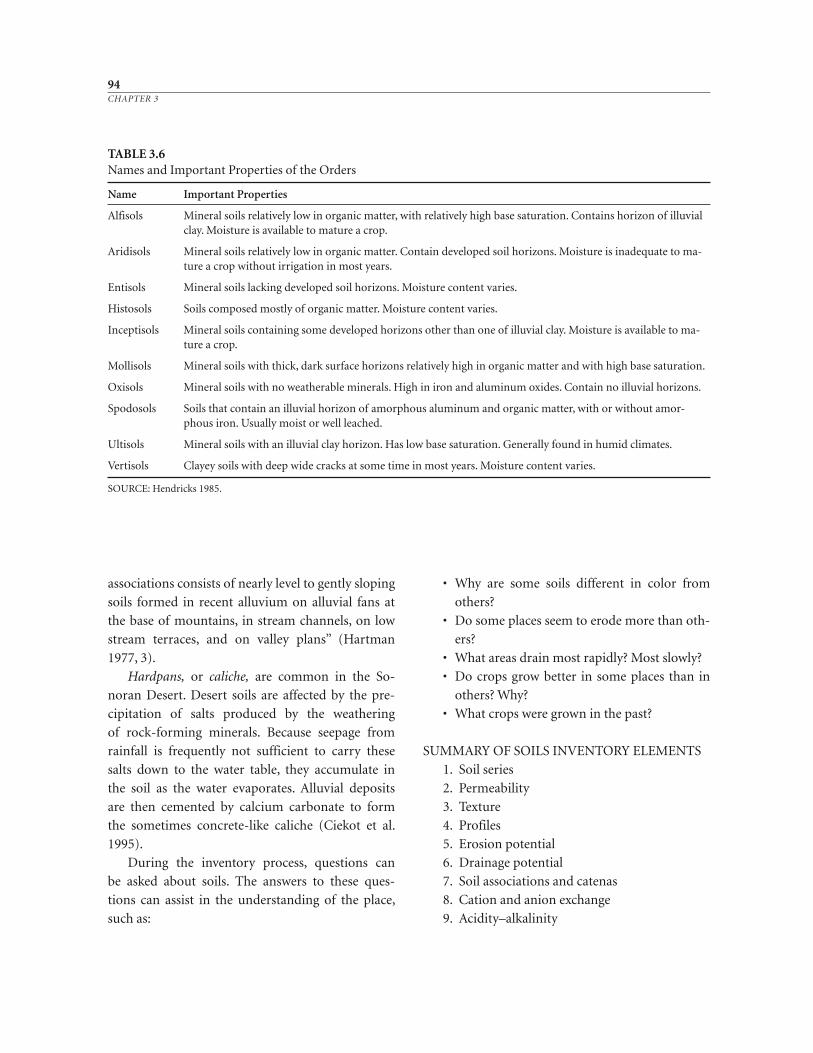
associations consists of nearly level to gently sloping
soils formed in recent alluvium on alluvial fans at
the base of mountains, in stream channels, on low
stream terraces, and on valley plans” (Hartman
1977, 3).
Hardpans, or caliche, are common in the So-
noran Desert. Desert soils are affected by the pre-
cipitation of salts produced by the weathering
of rock-forming minerals. Because seepage from
rainfall is frequently not sufficient to carry these
salts down to the water table, they accumulate in
the soil as the water evaporates. Alluvial deposits
are then cemented by calcium carbonate to form
the sometimes concrete-like caliche (Ciekot et al.
1995).
During the inventory process, questions can
be asked about soils. The answers to these ques-
tions can assist in the understanding of the place,
such as:
• Why are some soils different in color from
others?
• Do some places seem to erode more than oth-
ers?
• What areas drain most rapidly? Most slowly?
• Do crops grow better in some places than in
others? Why?
• What crops were grown in the past?
SUMMARY OF SOILS INVENTORY ELEMENTS
1. Soil series
2. Permeability
3. Texture
4. Profiles
5. Erosion potential
6. Drainage potential
7. Soil associations and catenas
8. Cation and anion exchange
9. Acidity–alkalinity
94CHAPTER 3
TABLE 3.6Names and Important Properties of the Orders
Name Important Properties
Alfisols Mineral soils relatively low in organic matter, with relatively high base saturation. Contains horizon of illuvial clay. Moisture is available to mature a crop.
Aridisols Mineral soils relatively low in organic matter. Contain developed soil horizons. Moisture is inadequate to ma-ture a crop without irrigation in most years.
Entisols Mineral soils lacking developed soil horizons. Moisture content varies.
Histosols Soils composed mostly of organic matter. Moisture content varies.
Inceptisols Mineral soils containing some developed horizons other than one of illuvial clay. Moisture is available to ma-ture a crop.
Mollisols Mineral soils with thick, dark surface horizons relatively high in organic matter and with high base saturation.
Oxisols Mineral soils with no weatherable minerals. High in iron and aluminum oxides. Contain no illuvial horizons.
Spodosols Soils that contain an illuvial horizon of amorphous aluminum and organic matter, with or without amor-phous iron. Usually moist or well leached.
Ultisols Mineral soils with an illuvial clay horizon. Has low base saturation. Generally found in humid climates.
Vertisols Clayey soils with deep wide cracks at some time in most years. Moisture content varies.
SOURCE: Hendricks 1985.
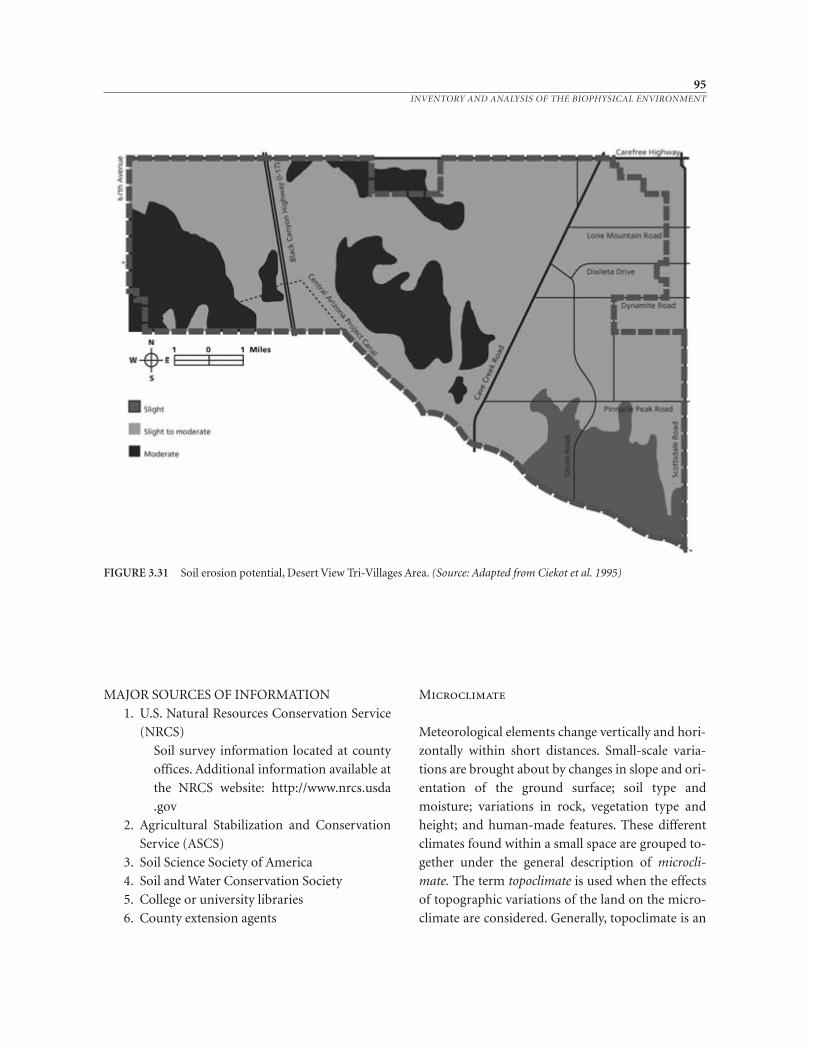
95INVENTORY AND ANALYSIS OF THE BIOPHYSICAL ENVIRONMENT
FIGURE 3.31 Soil erosion potential, Desert View Tri-Villages Area. (Source: Adapted from Ciekot et al. 1995)
MAJOR SOURCES OF INFORMATION
1. U.S. Natural Resources Conservation Service
(NRCS)
Soil survey information located at county
offices. Additional information available at
the NRCS website: http://www.nrcs.usda
.gov
2. Agricultural Stabilization and Conservation
Service (ASCS)
3. Soil Science Society of America
4. Soil and Water Conservation Society
5. College or university libraries
6. County extension agents
Microclimate
Meteorological elements change vertically and hori-
zontally within short distances. Small-scale varia-
tions are brought about by changes in slope and ori-
entation of the ground surface; soil type and
moisture; variations in rock, vegetation type and
height; and human-made features. These different
climates found within a small space are grouped to-
gether under the general description of microcli-
mate. The term topoclimate is used when the effects
of topographic variations of the land on the micro-
climate are considered. Generally, topoclimate is an
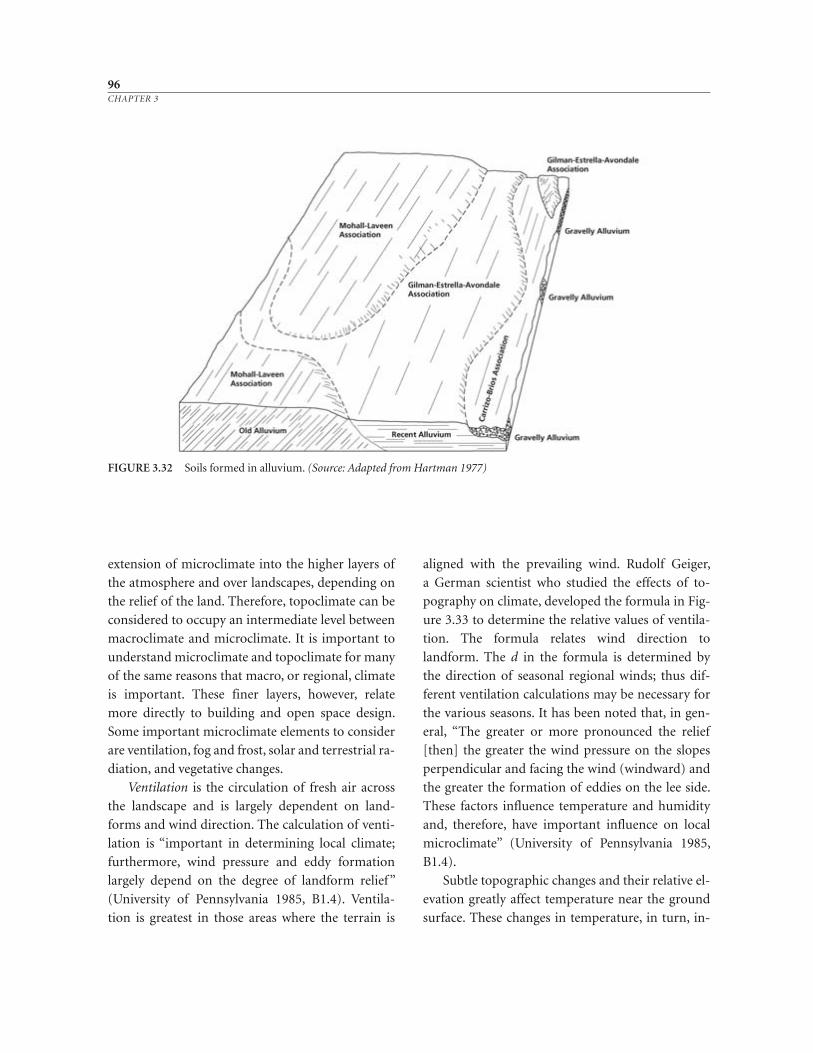
extension of microclimate into the higher layers of
the atmosphere and over landscapes, depending on
the relief of the land. Therefore, topoclimate can be
considered to occupy an intermediate level between
macroclimate and microclimate. It is important to
understand microclimate and topoclimate for many
of the same reasons that macro, or regional, climate
is important. These finer layers, however, relate
more directly to building and open space design.
Some important microclimate elements to consider
are ventilation, fog and frost, solar and terrestrial ra-
diation, and vegetative changes.
Ventilation is the circulation of fresh air across
the landscape and is largely dependent on land-
forms and wind direction. The calculation of venti-
lation is “important in determining local climate;
furthermore, wind pressure and eddy formation
largely depend on the degree of landform relief”
(University of Pennsylvania 1985, B1.4). Ventila-
tion is greatest in those areas where the terrain is
aligned with the prevailing wind. Rudolf Geiger,
a German scientist who studied the effects of to-
pography on climate, developed the formula in Fig-
ure 3.33 to determine the relative values of ventila-
tion. The formula relates wind direction to
landform. The d in the formula is determined by
the direction of seasonal regional winds; thus dif-
ferent ventilation calculations may be necessary for
the various seasons. It has been noted that, in gen-
eral, “The greater or more pronounced the relief
[then] the greater the wind pressure on the slopes
perpendicular and facing the wind (windward) and
the greater the formation of eddies on the lee side.
These factors influence temperature and humidity
and, therefore, have important influence on local
microclimate” (University of Pennsylvania 1985,
B1.4).
Subtle topographic changes and their relative el-
evation greatly affect temperature near the ground
surface. These changes in temperature, in turn, in-
96CHAPTER 3
FIGURE 3.32 Soils formed in alluvium. (Source: Adapted from Hartman 1977)
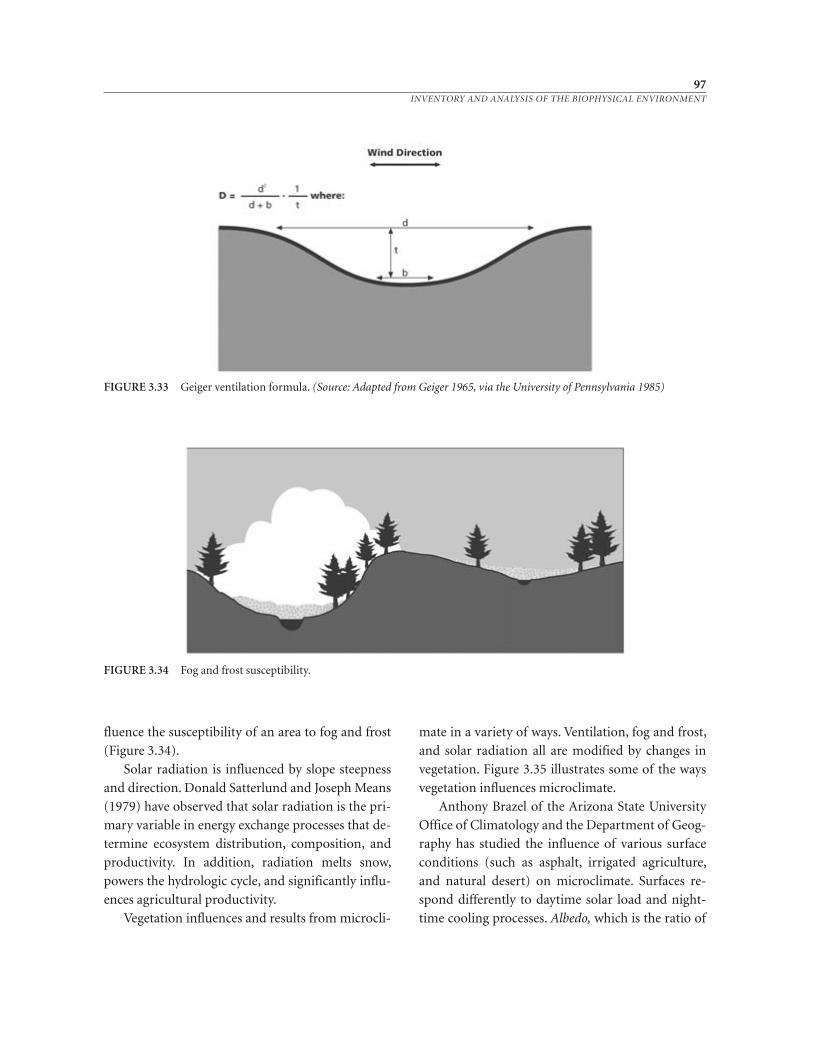
97INVENTORY AND ANALYSIS OF THE BIOPHYSICAL ENVIRONMENT
fluence the susceptibility of an area to fog and frost
(Figure 3.34).
Solar radiation is influenced by slope steepness
and direction. Donald Satterlund and Joseph Means
(1979) have observed that solar radiation is the pri-
mary variable in energy exchange processes that de-
termine ecosystem distribution, composition, and
productivity. In addition, radiation melts snow,
powers the hydrologic cycle, and significantly influ-
ences agricultural productivity.
Vegetation influences and results from microcli-
mate in a variety of ways. Ventilation, fog and frost,
and solar radiation all are modified by changes in
vegetation. Figure 3.35 illustrates some of the ways
vegetation influences microclimate.
Anthony Brazel of the Arizona State University
Office of Climatology and the Department of Geog-
raphy has studied the influence of various surface
conditions (such as asphalt, irrigated agriculture,
and natural desert) on microclimate. Surfaces re-
spond differently to daytime solar load and night-
time cooling processes. Albedo, which is the ratio of
FIGURE 3.34 Fog and frost susceptibility.
FIGURE 3.33 Geiger ventilation formula. (Source: Adapted from Geiger 1965, via the University of Pennsylvania 1985)
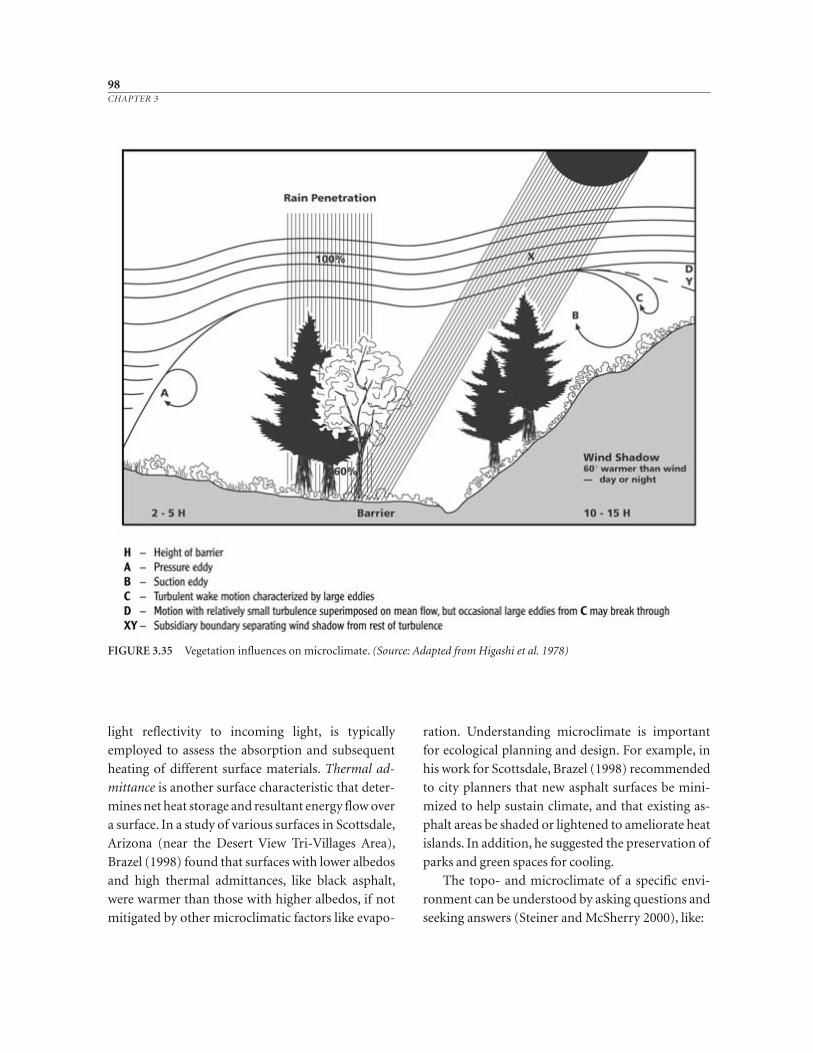
98CHAPTER 3
FIGURE 3.35 Vegetation influences on microclimate. (Source: Adapted from Higashi et al. 1978)
light reflectivity to incoming light, is typically
employed to assess the absorption and subsequent
heating of different surface materials. Thermal ad-
mittance is another surface characteristic that deter-
mines net heat storage and resultant energy flow over
a surface. In a study of various surfaces in Scottsdale,
Arizona (near the Desert View Tri- Villages Area),
Brazel (1998) found that surfaces with lower albedos
and high thermal admittances, like black asphalt,
were warmer than those with higher albedos, if not
mitigated by other microclimatic factors like evapo-
ration. Understanding microclimate is important
for ecological planning and design. For example, in
his work for Scottsdale, Brazel (1998) recommended
to city planners that new asphalt surfaces be mini-
mized to help sustain climate, and that existing as-
phalt areas be shaded or lightened to ameliorate heat
islands. In addition, he suggested the preservation of
parks and green spaces for cooling.
The topo- and microclimate of a specific envi-
ronment can be understood by asking questions and
seeking answers (Steiner and McSherry 2000), like:
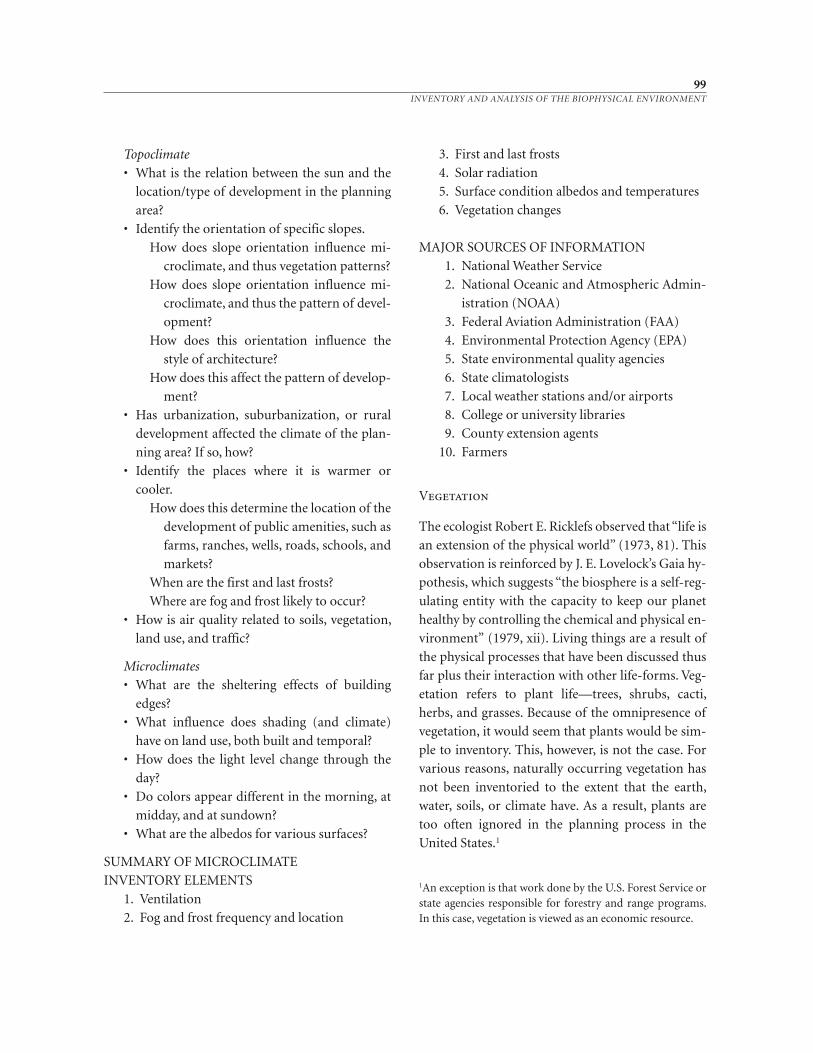
Topoclimate
• What is the relation between the sun and the
location/type of development in the planning
area?
• Identify the orientation of specific slopes.
How does slope orientation influence mi-
croclimate, and thus vegetation patterns?
How does slope orientation influence mi-
croclimate, and thus the pattern of devel-
opment?
How does this orientation influence the
style of architecture?
How does this affect the pattern of develop-
ment?
• Has urbanization, suburbanization, or rural
development affected the climate of the plan-
ning area? If so, how?
• Identify the places where it is warmer or
cooler.
How does this determine the location of the
development of public amenities, such as
farms, ranches, wells, roads, schools, and
markets?
When are the first and last frosts?
Where are fog and frost likely to occur?
• How is air quality related to soils, vegetation,
land use, and traffic?
Microclimates
• What are the sheltering effects of building
edges?
• What influence does shading (and climate)
have on land use, both built and temporal?
• How does the light level change through the
day?
• Do colors appear different in the morning, at
midday, and at sundown?
• What are the albedos for various surfaces?
SUMMARY OF MICROCLIMATE
INVENTORY ELEMENTS
1. Ventilation
2. Fog and frost frequency and location
3. First and last frosts
4. Solar radiation
5. Surface condition albedos and temperatures
6. Vegetation changes
MAJOR SOURCES OF INFORMATION
1. National Weather Service
2. National Oceanic and Atmospheric Admin-
istration (NOAA)
3. Federal Aviation Administration (FAA)
4. Environmental Protection Agency (EPA)
5. State environmental quality agencies
6. State climatologists
7. Local weather stations and/or airports
8. College or university libraries
9. County extension agents
10. Farmers
Vegetation
The ecologist Robert E. Ricklefs observed that “life is
an extension of the physical world” (1973, 81). This
observation is reinforced by J. E. Lovelock’s Gaia hy-
pothesis, which suggests “the biosphere is a self-reg-
ulating entity with the capacity to keep our planet
healthy by controlling the chemical and physical en-
vironment” (1979, xii). Living things are a result of
the physical processes that have been discussed thus
far plus their interaction with other life-forms. Veg-
etation refers to plant life—trees, shrubs, cacti,
herbs, and grasses. Because of the omnipresence of
vegetation, it would seem that plants would be sim-
ple to inventory. This, however, is not the case. For
various reasons, naturally occurring vegetation has
not been inventoried to the extent that the earth,
water, soils, or climate have. As a result, plants are
too often ignored in the planning process in the
United States.1
99INVENTORY AND ANALYSIS OF THE BIOPHYSICAL ENVIRONMENT
1An exception is that work done by the U.S. Forest Service orstate agencies responsible for forestry and range programs.In this case, vegetation is viewed as an economic resource.
Plants are important to study for many reasons.
They may have economic and medicinal value. They
provide habitat for wildlife. They have significant
influence on natural events like fires and floods and
may reduce the human consequences of such events.
Plants are beautiful and contribute to the scenic
quality of landscapes. Plants are the source of oxy-
gen, which humans need to survive.
In addition, native plant species are in decline
worldwide. According to a 1998 international study,
one in eight known plant species on Earth is either
threatened or nearly extinct (Suplee 1998). Curt
Suplee reports that the “results of a 20-year joint ef-
fort among 16 organizations show that habitat de-
struction and introduction of non-native species
have caused approximately 34,000 species to be-
come so rare that they could easily disappear. That
amounts to 12.5 percent of the 270,000 fern,
conifer, and flowering species known worldwide”
(1998, 1).
There are several ways to classify land cover. One
helpful system is the USGS Land-Use and Land-
Cover Classification System that was developed for
use with remote sensor data (Anderson et al. 1976)
(see Table 1.2). Once a system is selected, it is neces-
sary to identify the specific units. The most straight-
forward method is to use aerial or satellite images to
identify the homogeneous areas, then field-check
the units. Ward Brady developed a potential natural
vegetation map (Figure 3.36) and a more detailed
land-cover classification map (Figure 3.37) for the
Desert View Tri-Villages Area. The latter was derived
from Landsat imagery. Brady’s maps were influ-
enced in part by detailed wash vegetation studies led
by Joseph Ewan and Rebecca Fish Ewan (Ewan et al.
1996). A relatively abundant and specialized plant
community has evolved, especially in the northeast-
ern section of the Tri-Villages Area. Because of the
higher altitude and greater rainfall, the plant com-
munity is abundant in density and diversity when
compared to other areas of the Phoenix metropoli-
tan region.
In two detailed studies led by Professors Rebecca
Fish Ewan and Joseph Ewan of the ASU School of
Planning and Landscape Architecture for the City of
Phoenix, five vegetation types have been identified
in the Desert View Tri-Villages Area (Ewan et al.
1996, 1998). Wash vegetation is the first type and in-
cludes “the sandy, rocky, open channel and sand
bars and is characterized by annuals, big leaf bur-
sage (Ambrosia ambrosioides), desert broom (Bac-
charis sarothroides), and seep willow (Baccharis sali-
cifolia) (Ewan et al. 1998, x). Along the edges of the
washes are the richest concentrations of vegetation.
Ewan and his colleagues note that blue palo verde
(Cercidium floridum) and ironwood (Olneya tesota)
“are characteristic trees that grow along the wash
edges” (1998, x).
Creosote bush–bursage flats are the second type
and are “dominated by creosote bush (Larrea triden-
tata) and triangle-leaf bursage (Ambrosia del-
toidea)” (Ewan et al. 1998, x). This vegetation, ac-
cording to Ewan and his colleagues, is the most
widespread in the area “because it can tolerate saline
caliche soil and hot arid conditions of the desert
flats” (1998, x).
The third vegetation type in the Tri-Villages is
found on hillsides and slopes. Foothill palo verde
(Cercidium microphyllum), triangle-leaf bursage,
creosote, teddy bear cholla (Opuntia bigelovii),
buckthorn cholla (Opuntia acanthocarpa), and the
magnificent saguaro cacti (Carnegiea gigantea) are
the characteristic vegetation of the hillside type
(Ewan et al. 1998).
Tanks are cowboy watering holes and form the
fourth vegetation type. These artificial detention
areas support dense communities of mesquite (Pro-
sopis velutina) (Ewan et al. 1998). The final type oc-
curs in damaged areas. The main causes of the dam-
age are fire and cattle grazing (Ewan et al. 1998).
After the vegetation units are identified and
mapped, it is often helpful to list the individual spe-
cies in the area. (A comprehensive vegetation list for
the Desert View Tri-Villages Area is located in
100CHAPTER 3
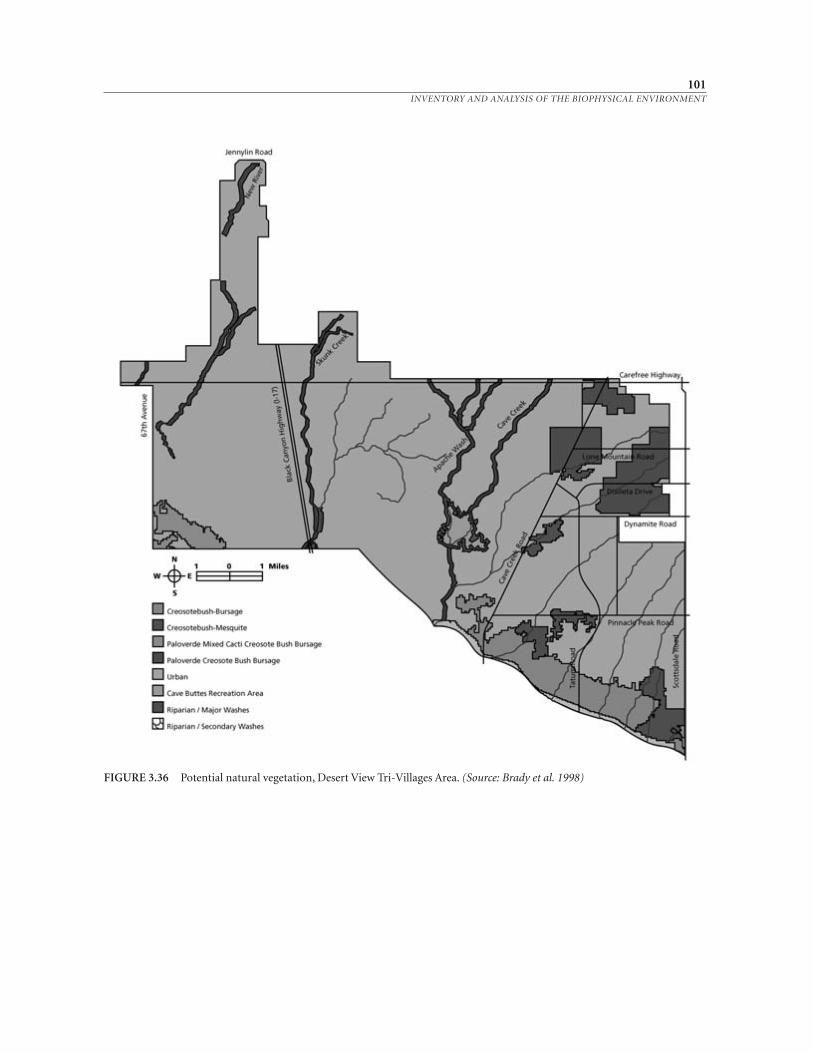
101INVENTORY AND ANALYSIS OF THE BIOPHYSICAL ENVIRONMENT
FIGURE 3.36 Potential natural vegetation, Desert View Tri-Villages Area. (Source: Brady et al. 1998)
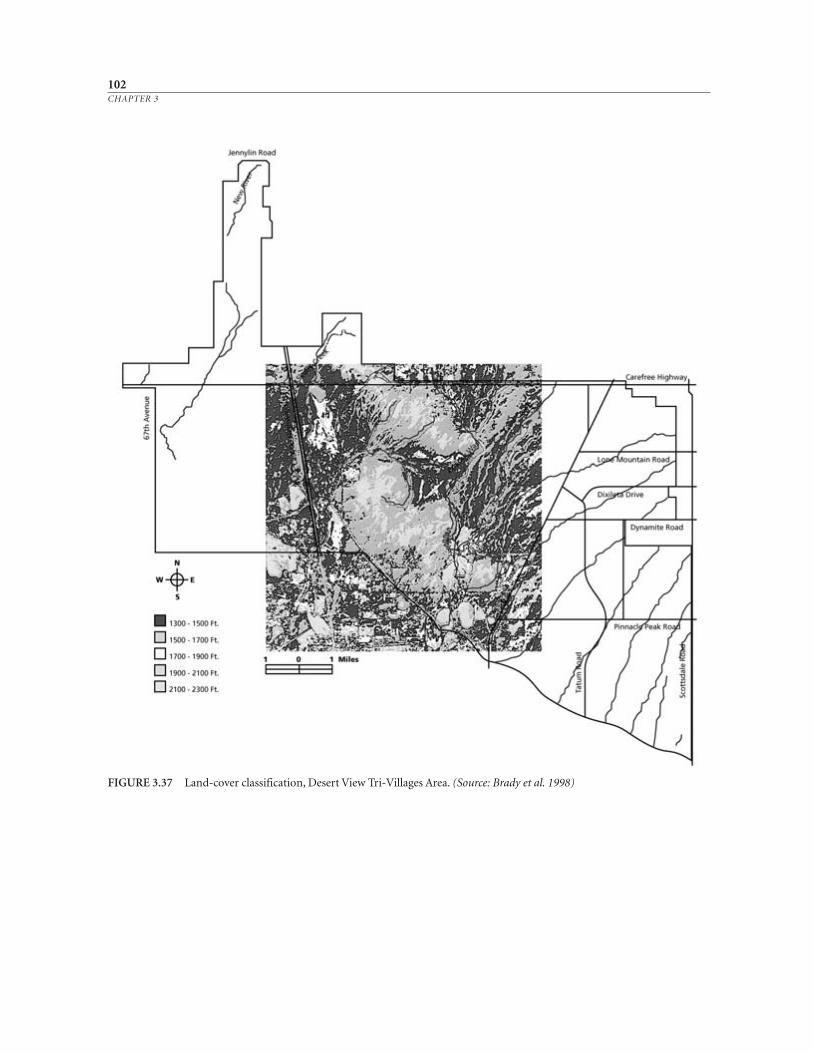
102CHAPTER 3
FIGURE 3.37 Land-cover classification, Desert View Tri-Villages Area. (Source: Brady et al. 1998)
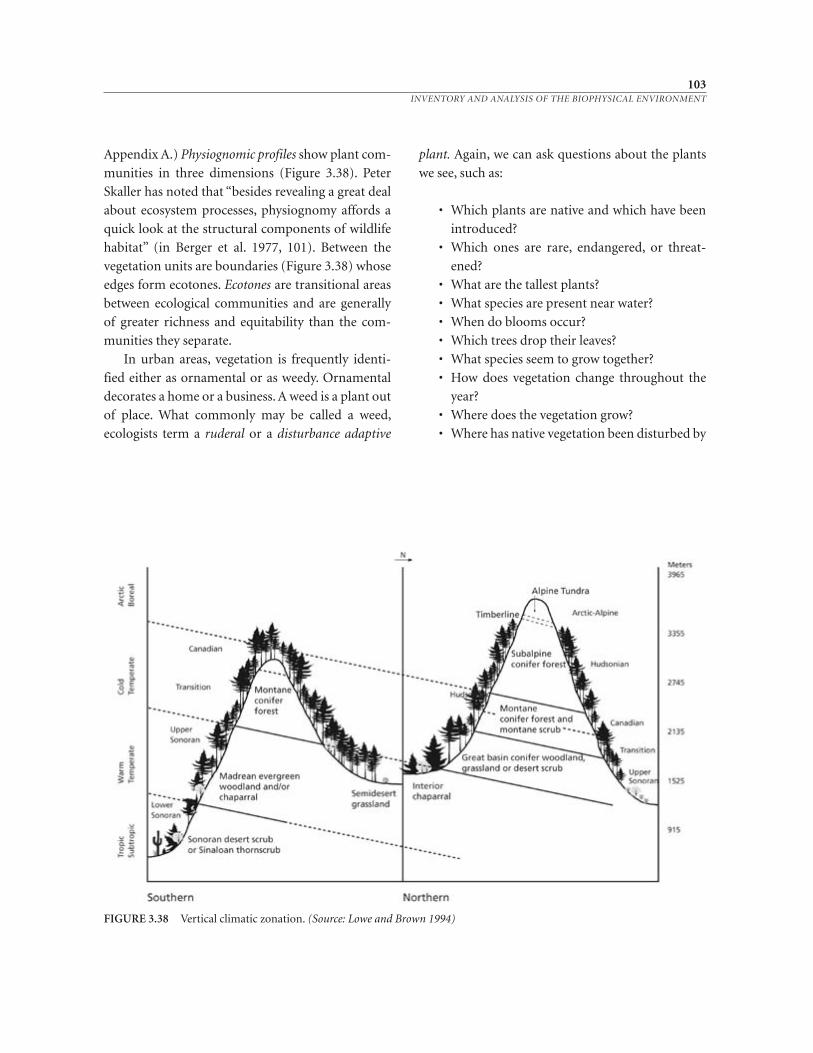
Appendix A.) Physiognomic profiles show plant com-
munities in three dimensions (Figure 3.38). Peter
Skaller has noted that “besides revealing a great deal
about ecosystem processes, physiognomy affords a
quick look at the structural components of wildlife
habitat” (in Berger et al. 1977, 101). Between the
vegetation units are boundaries (Figure 3.38) whose
edges form ecotones. Ecotones are transitional areas
between ecological communities and are generally
of greater richness and equitability than the com-
munities they separate.
In urban areas, vegetation is frequently identi-
fied either as ornamental or as weedy. Ornamental
decorates a home or a business. A weed is a plant out
of place. What commonly may be called a weed,
ecologists term a ruderal or a disturbance adaptive
plant. Again, we can ask questions about the plants
we see, such as:
• Which plants are native and which have been
introduced?
• Which ones are rare, endangered, or threat-
ened?
• What are the tallest plants?
• What species are present near water?
• When do blooms occur?
• Which trees drop their leaves?
• What species seem to grow together?
• How does vegetation change throughout the
year?
• Where does the vegetation grow?
• Where has native vegetation been disturbed by
103INVENTORY AND ANALYSIS OF THE BIOPHYSICAL ENVIRONMENT
FIGURE 3.38 Vertical climatic zonation. (Source: Lowe and Brown 1994)
human uses, such as grazing, mining, logging,
dumping, and development?
SUMMARY OF VEGETATION
INVENTORY ELEMENTS
1. Plant associations and communities
2. Vegetative units
3. Species list
4. Species composition and distribution
5. Physiognomic profiles
6. Ecotone and edge profiles
7. Rare, endangered, and threatened species
8. Fire history
MAJOR SOURCES OF INFORMATION
1. U.S. Geological Survey (USGS)
2. U.S. Natural Resources Conservation Service
(NRCS)
3. U.S. Forest Service (USFS)
4. Botanical gardens
5. Native plant societies
6. Nurseries and seed companies
7. National, state, and local conservation and
environmental groups
8. College or university libraries
Wildlife
Broadly, wildlife is considered to be animals that are
neither human nor domesticated. Insects, fish, am-
phibians, birds, and mammals are more mobile than
plants. While closely linked to vegetative units for
food and shelter, wildlife often use different areas to
reproduce, eat, and sleep. Like vegetation, wildlife
have not been extensively inventoried except where
the animals have some commercial value. Because
animals are mobile, they are even more difficult to
inventory than vegetation.
Planners are paying increased attention to wild-
life (Beatley 1994a; Duerksen et al. 1997; Peck 1998).
Christopher Duerksen and his colleagues note that
most “people realize that the presence and protec-
tion of wildlife improves their lives” (1997, 1). They
observe that in addition to enhancing the quality of
104CHAPTER 3
life, wildlife protection is important for ethical and
moral reasons, for recreational benefits, and for eco-
nomic and tourist values (Duerksen et al. 1997).
A starting point is to compile a list of species in
the area (Table 3.7). State departments of game are
useful sources of information for hunted or fished
species. Some state game departments conduct re-
search on some nongame species as well, but this is
still the exception rather than the rule. Conservation
groups and academic facilities are usually the best
resources for nongame species.
Once such a list is compiled (which can be a sub-
stantial task in itself), it is important to analyze
where the species live. One helpful tool is a matrix.
Figure 3.39 is a matrix for the Pullman, Washington,
area. Species were listed with both their common
and scientific names. The individual species were
then matched with the vegetative units they use for
breeding, living, and eating. It was noted whether
each species was common, uncommon, or rare, and
what its seasonal occurrence was. Additional re-
marks for each species were also included. For ex-
ample, the northwestern whitetail deer (Odocoileus
virginianus) is a common resident of the area. This
species uses a variety of habitats year-round and is a
vegetarian. Figure 3.40 is a similar matrix developed
for a regional plan in Valladolid, Spain, by Juan Luis
de las Rivas and his colleagues.
The dense plant life of the Tri-Villages Area gives
it a distinctive visual identity and forms the habitat
for the resident animal life. The palo verde, cacti,
and mixed scrubs support a rich bird life, with a va-
riety ranging from several species of hawks (e.g., Bu-
teo jamaicensis) to hummingbirds (Brown 1982).
Various doves, including the white-winged, mourn-
ing, and Inca are found, as are several varieties of
quail. Numerous colorful birds such as cardinals,
Gila woodpeckers, and flickers are also found. Birds
such as the cactus wren, the curved-bill thrasher, the
northern mockingbird, and quails and doves are no-
table because of the distinctive sound patterns that
they produce, which are as much a part of the desert
environment as the visual experience. Although not
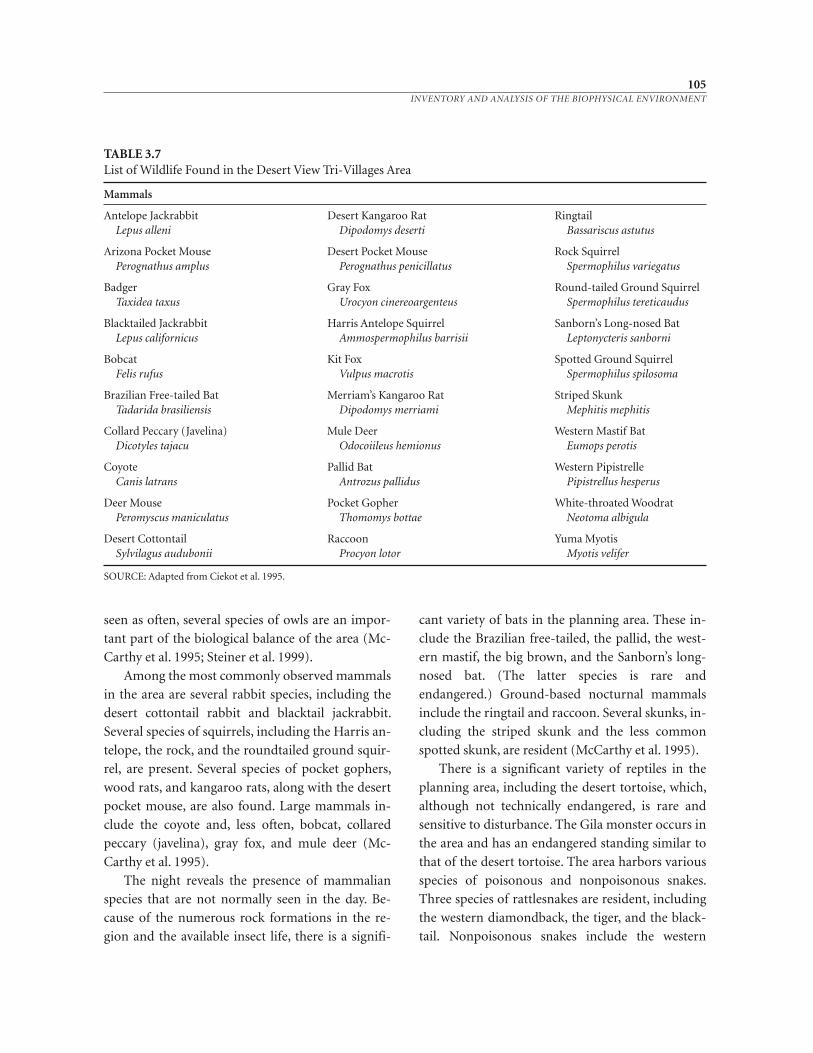
105INVENTORY AND ANALYSIS OF THE BIOPHYSICAL ENVIRONMENT
seen as often, several species of owls are an impor-
tant part of the biological balance of the area (Mc-
Carthy et al. 1995; Steiner et al. 1999).
Among the most commonly observed mammals
in the area are several rabbit species, including the
desert cottontail rabbit and blacktail jackrabbit.
Several species of squirrels, including the Harris an-
telope, the rock, and the roundtailed ground squir-
rel, are present. Several species of pocket gophers,
wood rats, and kangaroo rats, along with the desert
pocket mouse, are also found. Large mammals in-
clude the coyote and, less often, bobcat, collared
peccary (javelina), gray fox, and mule deer (Mc-
Carthy et al. 1995).
The night reveals the presence of mammalian
species that are not normally seen in the day. Be-
cause of the numerous rock formations in the re-
gion and the available insect life, there is a signifi-
cant variety of bats in the planning area. These in-
clude the Brazilian free-tailed, the pallid, the west-
ern mastif, the big brown, and the Sanborn’s long-
nosed bat. (The latter species is rare and
endangered.) Ground-based nocturnal mammals
include the ringtail and raccoon. Several skunks, in-
cluding the striped skunk and the less common
spotted skunk, are resident (McCarthy et al. 1995).
There is a significant variety of reptiles in the
planning area, including the desert tortoise, which,
although not technically endangered, is rare and
sensitive to disturbance. The Gila monster occurs in
the area and has an endangered standing similar to
that of the desert tortoise. The area harbors various
species of poisonous and nonpoisonous snakes.
Three species of rattlesnakes are resident, including
the western diamondback, the tiger, and the black-
tail. Nonpoisonous snakes include the western
TABLE 3.7List of Wildlife Found in the Desert View Tri-Villages Area
Mammals
Antelope Jackrabbit Desert Kangaroo Rat RingtailLepus alleni Dipodomys deserti Bassariscus astutus
Arizona Pocket Mouse Desert Pocket Mouse Rock SquirrelPerognathus amplus Perognathus penicillatus Spermophilus variegatus
Badger Gray Fox Round-tailed Ground SquirrelTaxidea taxus Urocyon cinereoargenteus Spermophilus tereticaudus
Blacktailed Jackrabbit Harris Antelope Squirrel Sanborn’s Long-nosed BatLepus californicus Ammospermophilus barrisii Leptonycteris sanborni
Bobcat Kit Fox Spotted Ground SquirrelFelis rufus Vulpus macrotis Spermophilus spilosoma
Brazilian Free-tailed Bat Merriam’s Kangaroo Rat Striped SkunkTadarida brasiliensis Dipodomys merriami Mephitis mephitis
Collard Peccary (Javelina) Mule Deer Western Mastif BatDicotyles tajacu Odocoiileus hemionus Eumops perotis
Coyote Pallid Bat Western PipistrelleCanis latrans Antrozus pallidus Pipistrellus hesperus
Deer Mouse Pocket Gopher White-throated WoodratPeromyscus maniculatus Thomomys bottae Neotoma albigula
Desert Cottontail Raccoon Yuma MyotisSylvilagus audubonii Procyon lotor Myotis velifer
SOURCE: Adapted from Ciekot et al. 1995.
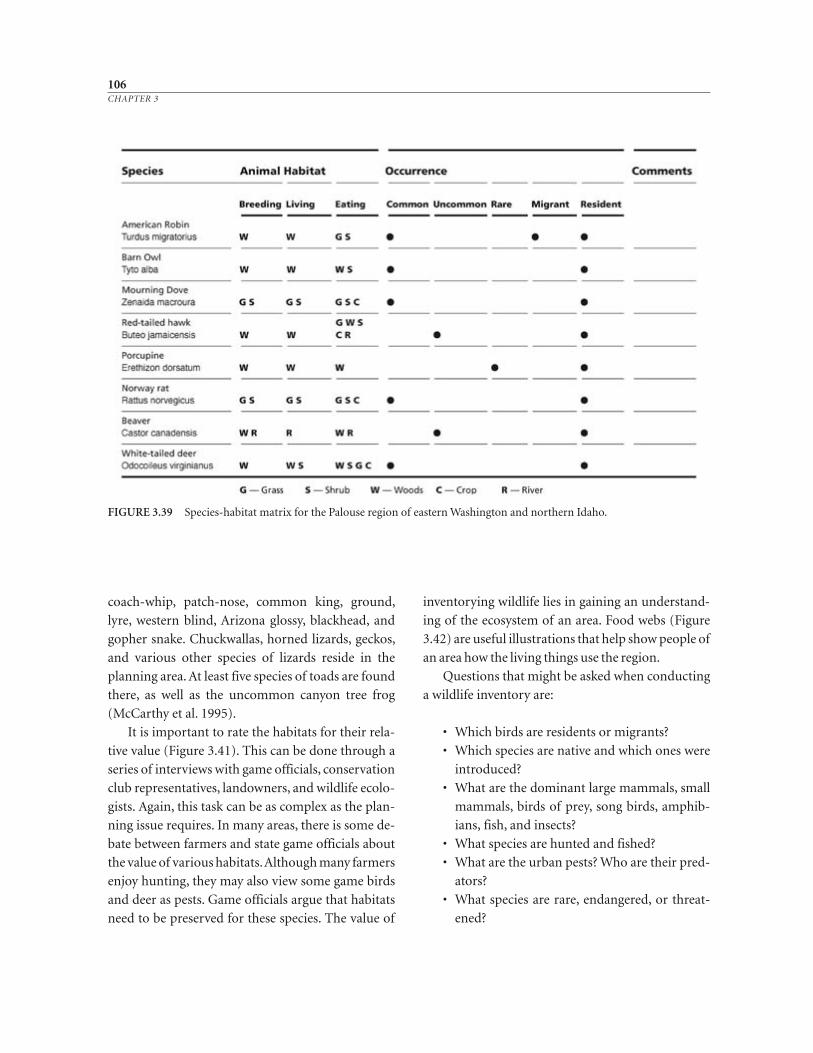
coach-whip, patch-nose, common king, ground,
lyre, western blind, Arizona glossy, blackhead, and
gopher snake. Chuckwallas, horned lizards, geckos,
and various other species of lizards reside in the
planning area. At least five species of toads are found
there, as well as the uncommon canyon tree frog
(McCarthy et al. 1995).
It is important to rate the habitats for their rela-
tive value (Figure 3.41). This can be done through a
series of interviews with game officials, conservation
club representatives, landowners, and wildlife ecolo-
gists. Again, this task can be as complex as the plan-
ning issue requires. In many areas, there is some de-
bate between farmers and state game officials about
the value of various habitats. Although many farmers
enjoy hunting, they may also view some game birds
and deer as pests. Game officials argue that habitats
need to be preserved for these species. The value of
inventorying wildlife lies in gaining an understand-
ing of the ecosystem of an area. Food webs (Figure
3.42) are useful illustrations that help show people of
an area how the living things use the region.
Questions that might be asked when conducting
a wildlife inventory are:
• Which birds are residents or migrants?
• Which species are native and which ones were
introduced?
• What are the dominant large mammals, small
mammals, birds of prey, song birds, amphib-
ians, fish, and insects?
• What species are hunted and fished?
• What are the urban pests? Who are their pred-
ators?
• What species are rare, endangered, or threat-
ened?
106CHAPTER 3
FIGURE 3.39 Species-habitat matrix for the Palouse region of eastern Washington and northern Idaho.
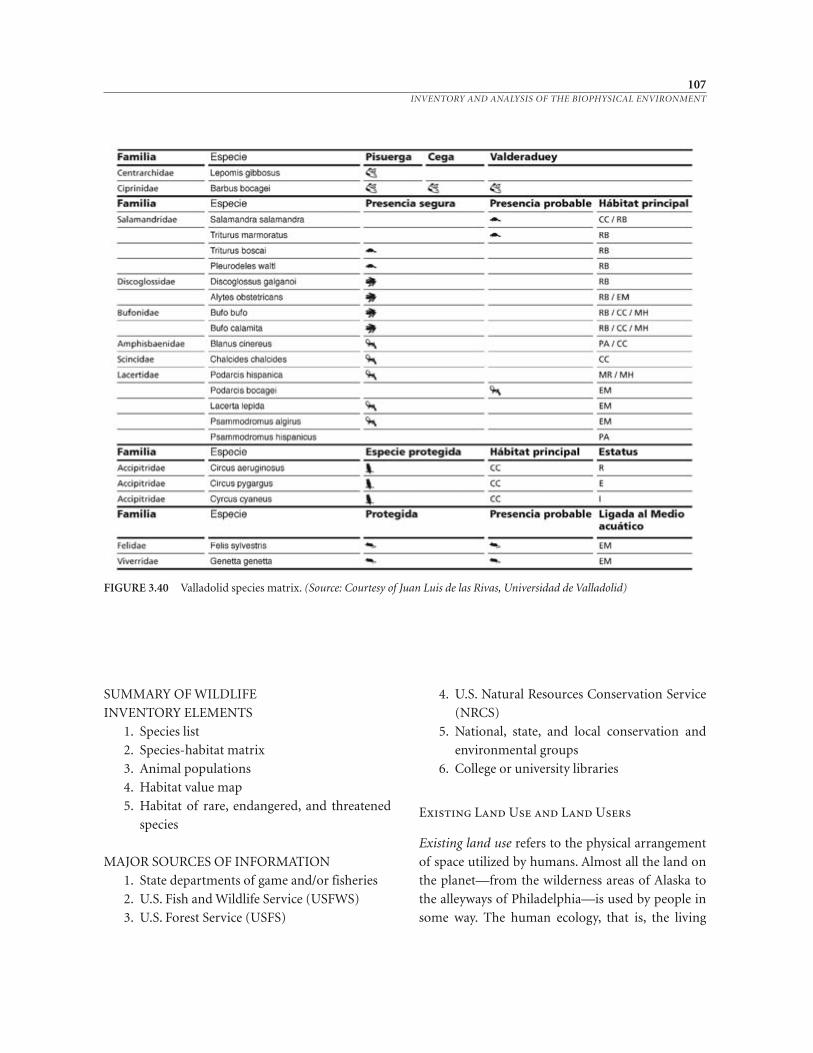
SUMMARY OF WILDLIFE
INVENTORY ELEMENTS
1. Species list
2. Species-habitat matrix
3. Animal populations
4. Habitat value map
5. Habitat of rare, endangered, and threatened
species
MAJOR SOURCES OF INFORMATION
1. State departments of game and/or fisheries
2. U.S. Fish and Wildlife Service (USFWS)
3. U.S. Forest Service (USFS)
4. U.S. Natural Resources Conservation Service
(NRCS)
5. National, state, and local conservation and
environmental groups
6. College or university libraries
Existing Land Use and Land Users
Existing land use refers to the physical arrangement
of space utilized by humans. Almost all the land on
the planet—from the wilderness areas of Alaska to
the alleyways of Philadelphia—is used by people in
some way. The human ecology, that is, the living
107INVENTORY AND ANALYSIS OF THE BIOPHYSICAL ENVIRONMENT
FIGURE 3.40 Valladolid species matrix. (Source: Courtesy of Juan Luis de las Rivas, Universidad de Valladolid)
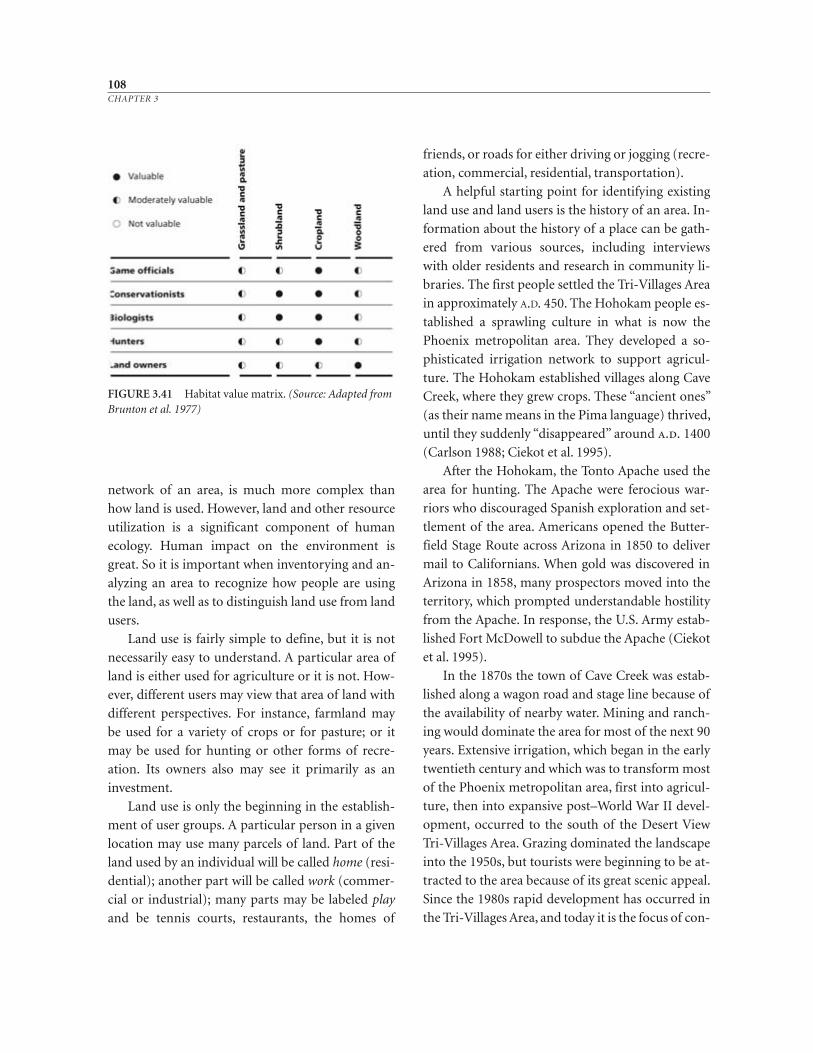
network of an area, is much more complex than
how land is used. However, land and other resource
utilization is a significant component of human
ecology. Human impact on the environment is
great. So it is important when inventorying and an-
alyzing an area to recognize how people are using
the land, as well as to distinguish land use from land
users.
Land use is fairly simple to define, but it is not
necessarily easy to understand. A particular area of
land is either used for agriculture or it is not. How-
ever, different users may view that area of land with
different perspectives. For instance, farmland may
be used for a variety of crops or for pasture; or it
may be used for hunting or other forms of recre-
ation. Its owners also may see it primarily as an
investment.
Land use is only the beginning in the establish-
ment of user groups. A particular person in a given
location may use many parcels of land. Part of the
land used by an individual will be called home (resi-
dential); another part will be called work (commer-
cial or industrial); many parts may be labeled play
and be tennis courts, restaurants, the homes of
friends, or roads for either driving or jogging (recre-
ation, commercial, residential, transportation).
A helpful starting point for identifying existing
land use and land users is the history of an area. In-
formation about the history of a place can be gath-
ered from various sources, including interviews
with older residents and research in community li-
braries. The first people settled the Tri-Villages Area
in approximately A.D. 450. The Hohokam people es-
tablished a sprawling culture in what is now the
Phoenix metropolitan area. They developed a so-
phisticated irrigation network to support agricul-
ture. The Hohokam established villages along Cave
Creek, where they grew crops. These “ancient ones”
(as their name means in the Pima language) thrived,
until they suddenly “disappeared” around a.d. 1400
(Carlson 1988; Ciekot et al. 1995).
After the Hohokam, the Tonto Apache used the
area for hunting. The Apache were ferocious war-
riors who discouraged Spanish exploration and set-
tlement of the area. Americans opened the Butter-
field Stage Route across Arizona in 1850 to deliver
mail to Californians. When gold was discovered in
Arizona in 1858, many prospectors moved into the
territory, which prompted understandable hostility
from the Apache. In response, the U.S. Army estab-
lished Fort McDowell to subdue the Apache (Ciekot
et al. 1995).
In the 1870s the town of Cave Creek was estab-
lished along a wagon road and stage line because of
the availability of nearby water. Mining and ranch-
ing would dominate the area for most of the next 90
years. Extensive irrigation, which began in the early
twentieth century and which was to transform most
of the Phoenix metropolitan area, first into agricul-
ture, then into expansive post–World War II devel-
opment, occurred to the south of the Desert View
Tri-Villages Area. Grazing dominated the landscape
into the 1950s, but tourists were beginning to be at-
tracted to the area because of its great scenic appeal.
Since the 1980s rapid development has occurred in
the Tri-Villages Area, and today it is the focus of con-
108CHAPTER 3
FIGURE 3.41 Habitat value matrix. (Source: Adapted fromBrunton et al. 1977)
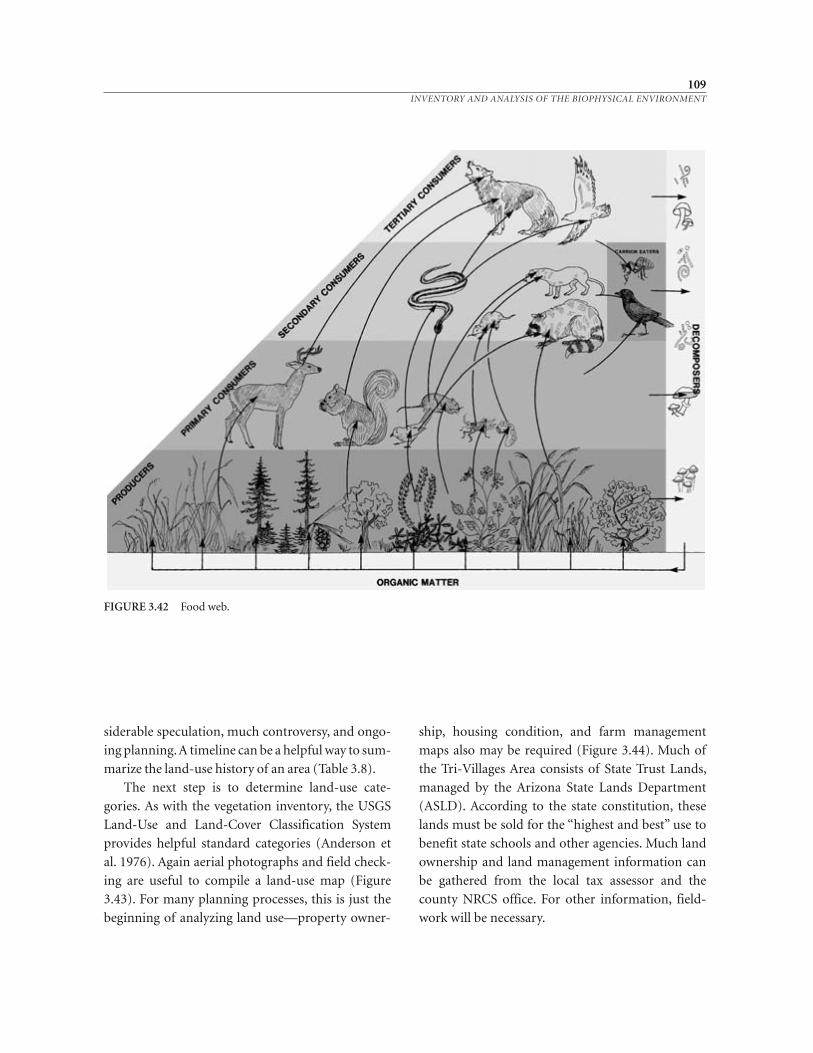
siderable speculation, much controversy, and ongo-
ing planning. A timeline can be a helpful way to sum-
marize the land-use history of an area (Table 3.8).
The next step is to determine land-use cate-
gories. As with the vegetation inventory, the USGS
Land-Use and Land-Cover Classification System
provides helpful standard categories (Anderson et
al. 1976). Again aerial photographs and field check-
ing are useful to compile a land-use map (Figure
3.43). For many planning processes, this is just the
beginning of analyzing land use—property owner-
ship, housing condition, and farm management
maps also may be required (Figure 3.44). Much of
the Tri-Villages Area consists of State Trust Lands,
managed by the Arizona State Lands Department
(ASLD). According to the state constitution, these
lands must be sold for the “highest and best” use to
benefit state schools and other agencies. Much land
ownership and land management information can
be gathered from the local tax assessor and the
county NRCS office. For other information, field-
work will be necessary.
109INVENTORY AND ANALYSIS OF THE BIOPHYSICAL ENVIRONMENT
FIGURE 3.42 Food web.
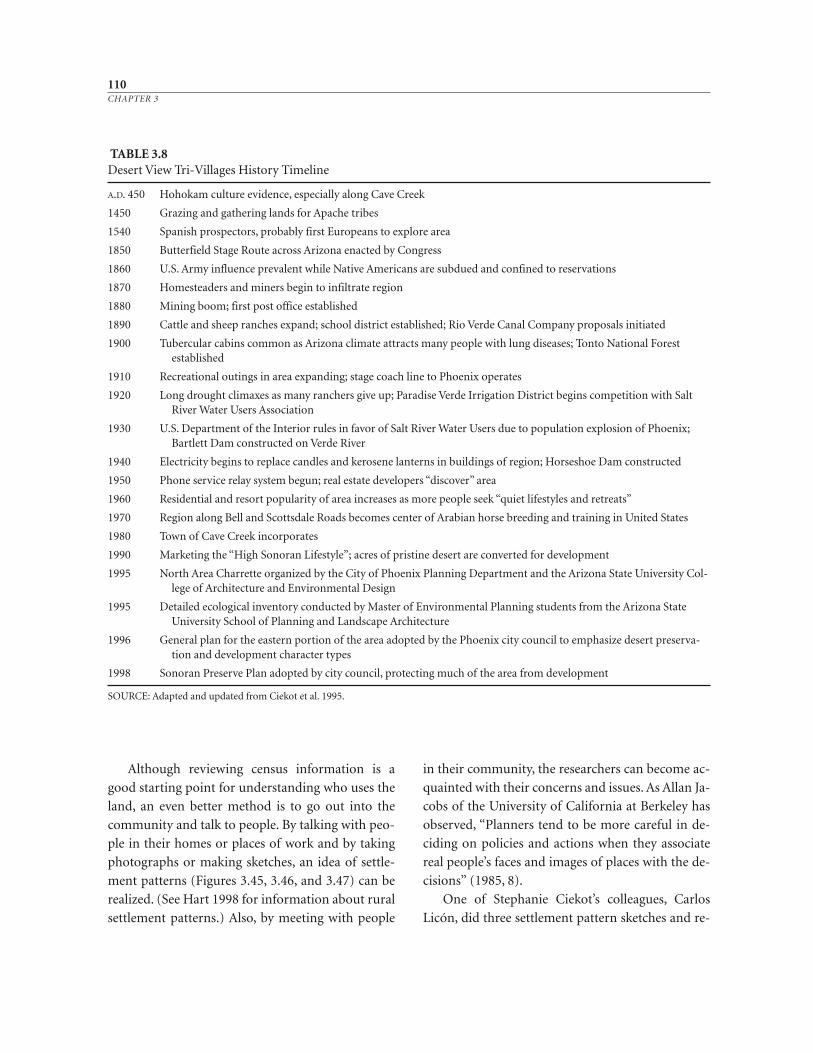
Although reviewing census information is a
good starting point for understanding who uses the
land, an even better method is to go out into the
community and talk to people. By talking with peo-
ple in their homes or places of work and by taking
photographs or making sketches, an idea of settle-
ment patterns (Figures 3.45, 3.46, and 3.47) can be
realized. (See Hart 1998 for information about rural
settlement patterns.) Also, by meeting with people
in their community, the researchers can become ac-
quainted with their concerns and issues. As Allan Ja-
cobs of the University of California at Berkeley has
observed, “Planners tend to be more careful in de-
ciding on policies and actions when they associate
real people’s faces and images of places with the de-
cisions” (1985, 8).
One of Stephanie Ciekot’s colleagues, Carlos
Licón, did three settlement pattern sketches and re-
110CHAPTER 3
TABLE 3.8Desert View Tri-Villages History Timeline
A.D. 450 Hohokam culture evidence, especially along Cave Creek
1450 Grazing and gathering lands for Apache tribes
1540 Spanish prospectors, probably first Europeans to explore area
1850 Butterfield Stage Route across Arizona enacted by Congress
1860 U.S. Army influence prevalent while Native Americans are subdued and confined to reservations
1870 Homesteaders and miners begin to infiltrate region
1880 Mining boom; first post office established
1890 Cattle and sheep ranches expand; school district established; Rio Verde Canal Company proposals initiated
1900 Tubercular cabins common as Arizona climate attracts many people with lung diseases; Tonto National Forest established
1910 Recreational outings in area expanding; stage coach line to Phoenix operates
1920 Long drought climaxes as many ranchers give up; Paradise Verde Irrigation District begins competition with Salt River Water Users Association
1930 U.S. Department of the Interior rules in favor of Salt River Water Users due to population explosion of Phoenix; Bartlett Dam constructed on Verde River
1940 Electricity begins to replace candles and kerosene lanterns in buildings of region; Horseshoe Dam constructed
1950 Phone service relay system begun; real estate developers “discover” area
1960 Residential and resort popularity of area increases as more people seek “quiet lifestyles and retreats”
1970 Region along Bell and Scottsdale Roads becomes center of Arabian horse breeding and training in United States
1980 Town of Cave Creek incorporates
1990 Marketing the “High Sonoran Lifestyle”; acres of pristine desert are converted for development
1995 North Area Charrette organized by the City of Phoenix Planning Department and the Arizona State University Col-lege of Architecture and Environmental Design
1995 Detailed ecological inventory conducted by Master of Environmental Planning students from the Arizona State University School of Planning and Landscape Architecture
1996 General plan for the eastern portion of the area adopted by the Phoenix city council to emphasize desert preserva-tion and development character types
1998 Sonoran Preserve Plan adopted by city council, protecting much of the area from development
SOURCE: Adapted and updated from Ciekot et al. 1995.
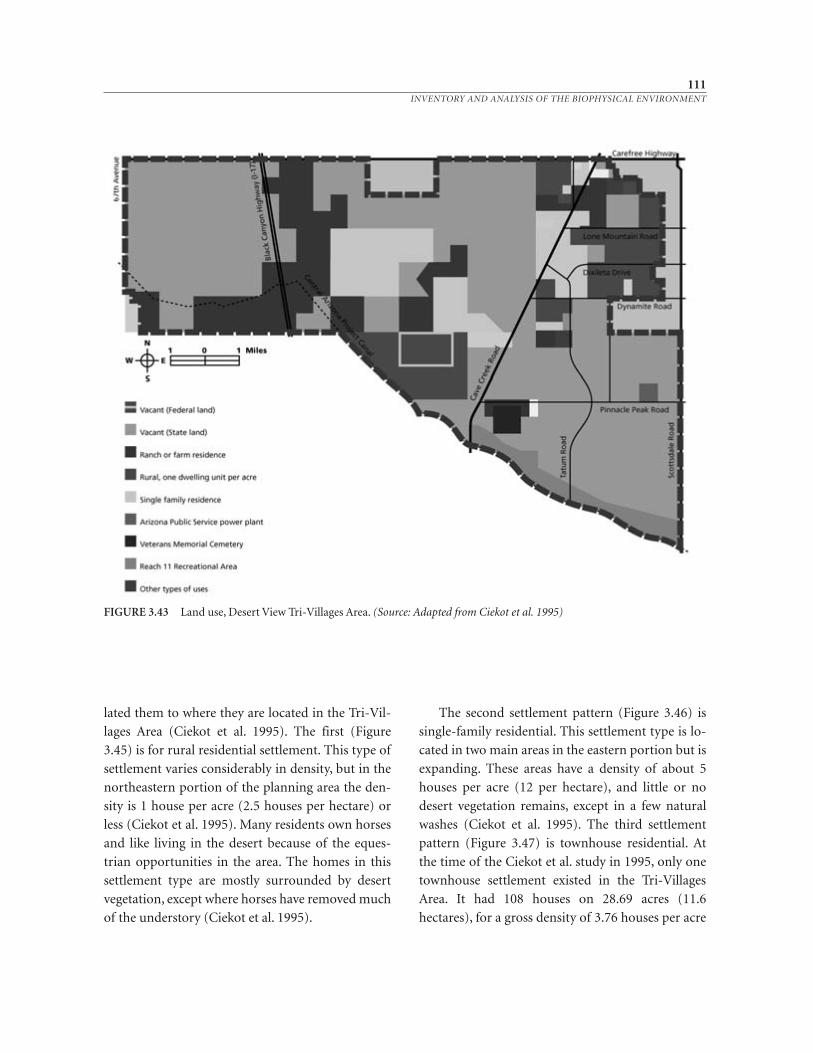
lated them to where they are located in the Tri-Vil-
lages Area (Ciekot et al. 1995). The first (Figure
3.45) is for rural residential settlement. This type of
settlement varies considerably in density, but in the
northeastern portion of the planning area the den-
sity is 1 house per acre (2.5 houses per hectare) or
less (Ciekot et al. 1995). Many residents own horses
and like living in the desert because of the eques-
trian opportunities in the area. The homes in this
settlement type are mostly surrounded by desert
vegetation, except where horses have removed much
of the understory (Ciekot et al. 1995).
The second settlement pattern (Figure 3.46) is
single-family residential. This settlement type is lo-
cated in two main areas in the eastern portion but is
expanding. These areas have a density of about 5
houses per acre (12 per hectare), and little or no
desert vegetation remains, except in a few natural
washes (Ciekot et al. 1995). The third settlement
pattern (Figure 3.47) is townhouse residential. At
the time of the Ciekot et al. study in 1995, only one
townhouse settlement existed in the Tri-Villages
Area. It had 108 houses on 28.69 acres (11.6
hectares), for a gross density of 3.76 houses per acre
111INVENTORY AND ANALYSIS OF THE BIOPHYSICAL ENVIRONMENT
FIGURE 3.43 Land use, Desert View Tri-Villages Area. (Source: Adapted from Ciekot et al. 1995)
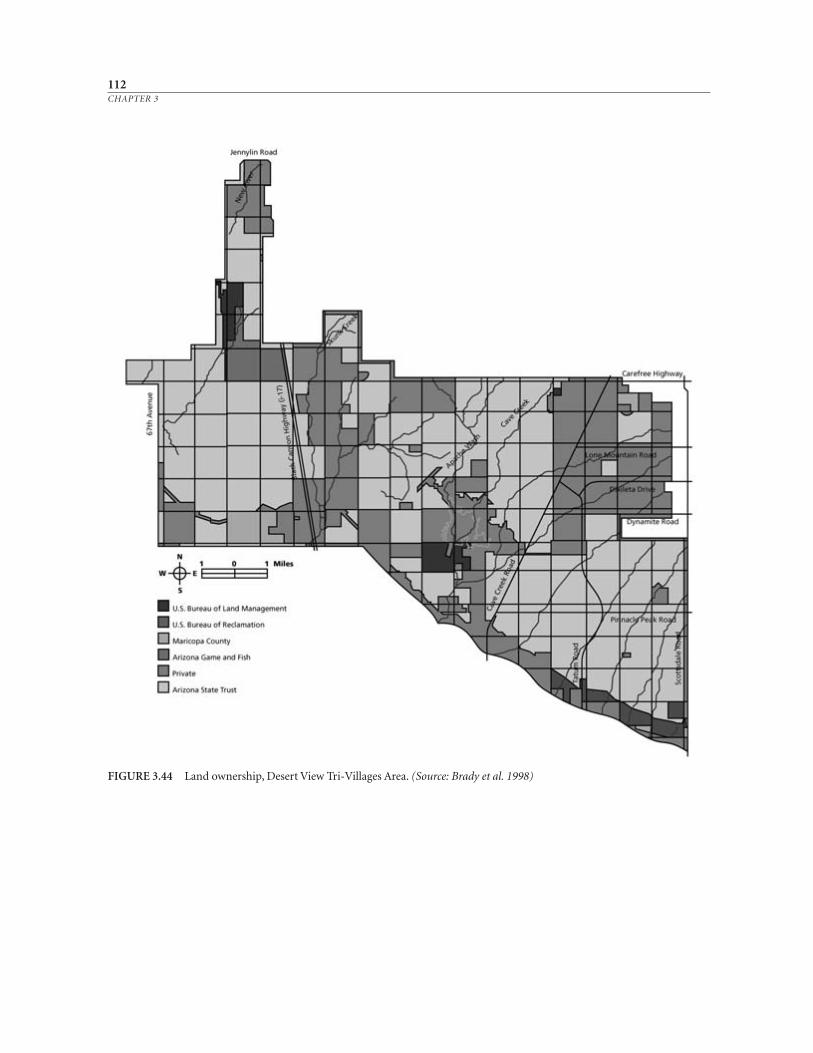
112CHAPTER 3
FIGURE 3.44 Land ownership, Desert View Tri-Villages Area. (Source: Brady et al. 1998)
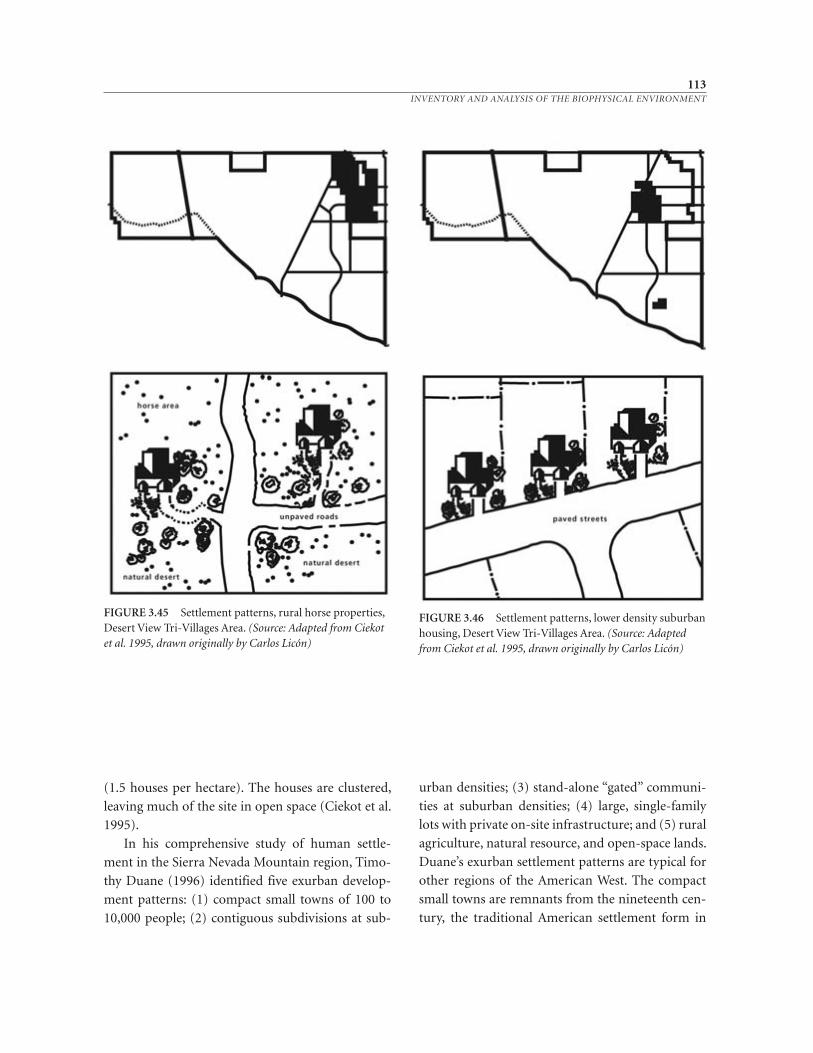
(1.5 houses per hectare). The houses are clustered,
leaving much of the site in open space (Ciekot et al.
1995).
In his comprehensive study of human settle-
ment in the Sierra Nevada Mountain region, Timo-
thy Duane (1996) identified five exurban develop-
ment patterns: (1) compact small towns of 100 to
10,000 people; (2) contiguous subdivisions at sub-
urban densities; (3) stand-alone “gated” communi-
ties at suburban densities; (4) large, single-family
lots with private on-site infrastructure; and (5) rural
agriculture, natural resource, and open-space lands.
Duane’s exurban settlement patterns are typical for
other regions of the American West. The compact
small towns are remnants from the nineteenth cen-
tury, the traditional American settlement form in
113INVENTORY AND ANALYSIS OF THE BIOPHYSICAL ENVIRONMENT
FIGURE 3.45 Settlement patterns, rural horse properties,Desert View Tri-Villages Area. (Source: Adapted from Ciekotet al. 1995, drawn originally by Carlos Licón)
FIGURE 3.46 Settlement patterns, lower density suburbanhousing, Desert View Tri-Villages Area. (Source: Adaptedfrom Ciekot et al. 1995, drawn originally by Carlos Licón)
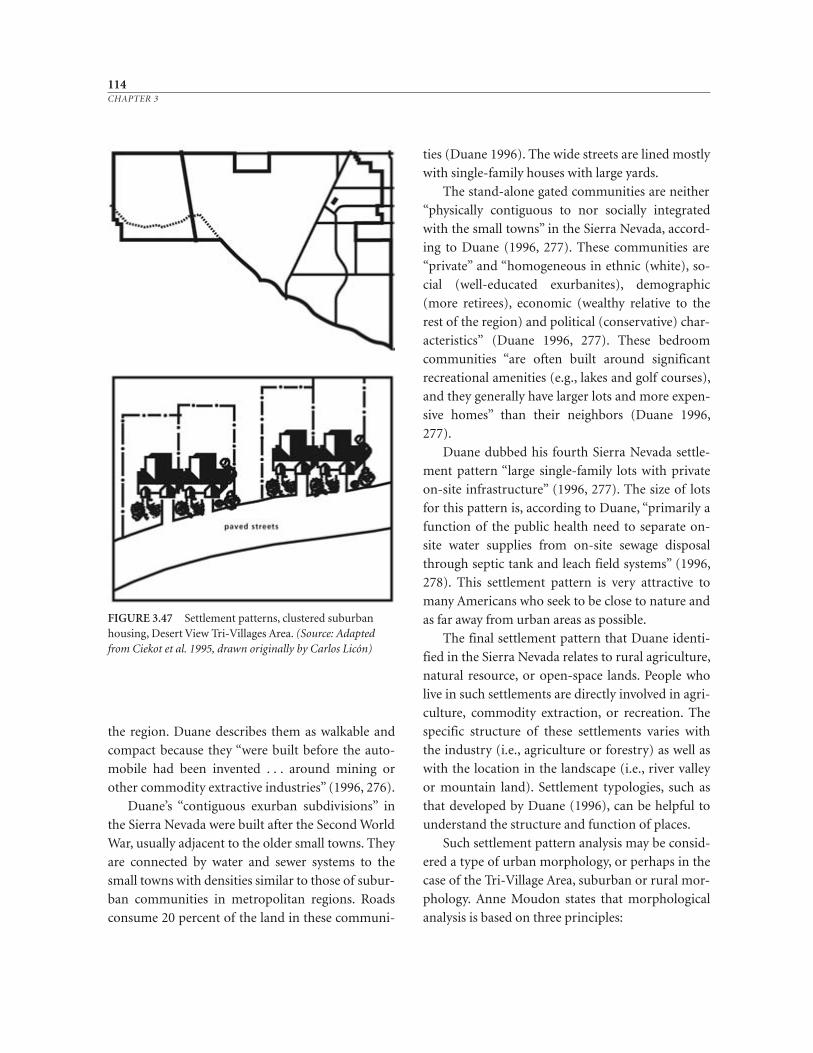
the region. Duane describes them as walkable and
compact because they “were built before the auto-
mobile had been invented . . . around mining or
other commodity extractive industries” (1996, 276).
Duane’s “contiguous exurban subdivisions” in
the Sierra Nevada were built after the Second World
War, usually adjacent to the older small towns. They
are connected by water and sewer systems to the
small towns with densities similar to those of subur-
ban communities in metropolitan regions. Roads
consume 20 percent of the land in these communi-
ties (Duane 1996). The wide streets are lined mostly
with single-family houses with large yards.
The stand-alone gated communities are neither
“physically contiguous to nor socially integrated
with the small towns” in the Sierra Nevada, accord-
ing to Duane (1996, 277). These communities are
“private” and “homogeneous in ethnic (white), so-
cial (well-educated exurbanites), demographic
(more retirees), economic (wealthy relative to the
rest of the region) and political (conservative) char-
acteristics” (Duane 1996, 277). These bedroom
communities “are often built around significant
recreational amenities (e.g., lakes and golf courses),
and they generally have larger lots and more expen-
sive homes” than their neighbors (Duane 1996,
277).
Duane dubbed his fourth Sierra Nevada settle-
ment pattern “large single-family lots with private
on-site infrastructure” (1996, 277). The size of lots
for this pattern is, according to Duane, “primarily a
function of the public health need to separate on-
site water supplies from on-site sewage disposal
through septic tank and leach field systems” (1996,
278). This settlement pattern is very attractive to
many Americans who seek to be close to nature and
as far away from urban areas as possible.
The final settlement pattern that Duane identi-
fied in the Sierra Nevada relates to rural agriculture,
natural resource, or open-space lands. People who
live in such settlements are directly involved in agri-
culture, commodity extraction, or recreation. The
specific structure of these settlements varies with
the industry (i.e., agriculture or forestry) as well as
with the location in the landscape (i.e., river valley
or mountain land). Settlement typologies, such as
that developed by Duane (1996), can be helpful to
understand the structure and function of places.
Such settlement pattern analysis may be consid-
ered a type of urban morphology, or perhaps in the
case of the Tri-Village Area, suburban or rural mor-
phology. Anne Moudon states that morphological
analysis is based on three principles:
114CHAPTER 3
FIGURE 3.47 Settlement patterns, clustered suburbanhousing, Desert View Tri-Villages Area. (Source: Adaptedfrom Ciekot et al. 1995, drawn originally by Carlos Licón)
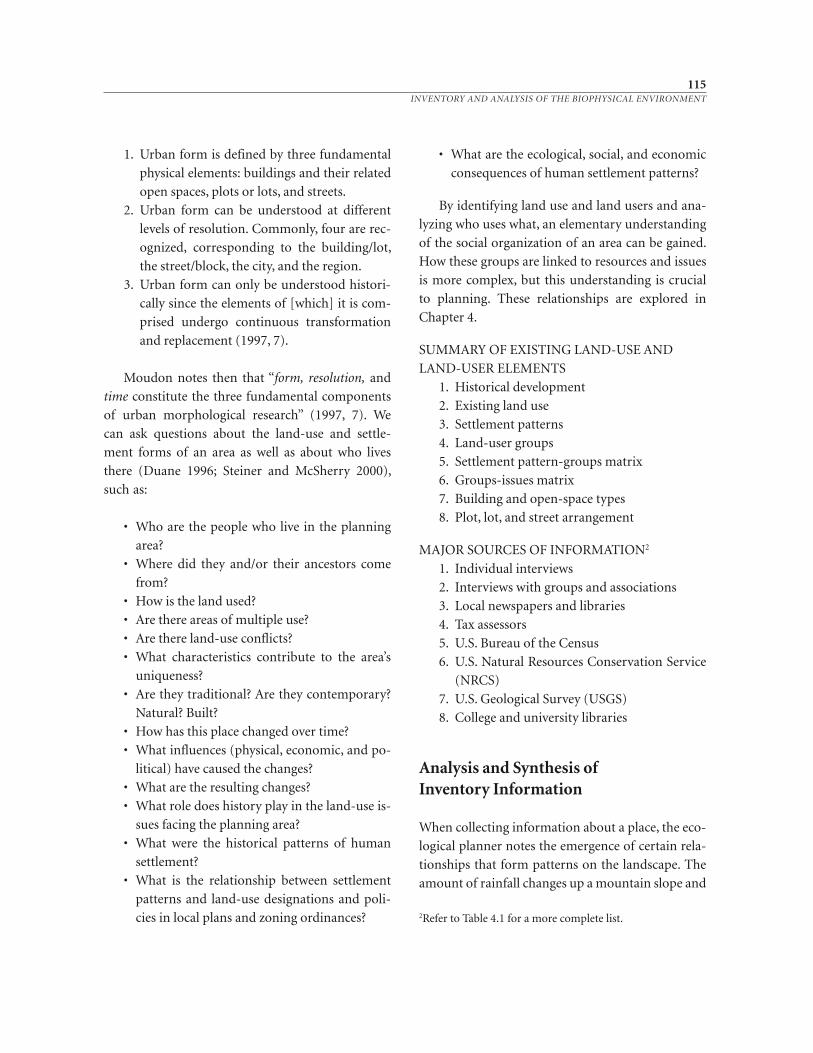
1. Urban form is defined by three fundamental
physical elements: buildings and their related
open spaces, plots or lots, and streets.
2. Urban form can be understood at different
levels of resolution. Commonly, four are rec-
ognized, corresponding to the building/lot,
the street/block, the city, and the region.
3. Urban form can only be understood histori-
cally since the elements of [which] it is com-
prised undergo continuous transformation
and replacement (1997, 7).
Moudon notes then that “form, resolution, and
time constitute the three fundamental components
of urban morphological research” (1997, 7). We
can ask questions about the land-use and settle-
ment forms of an area as well as about who lives
there (Duane 1996; Steiner and McSherry 2000),
such as:
• Who are the people who live in the planning
area?
• Where did they and/or their ancestors come
from?
• How is the land used?
• Are there areas of multiple use?
• Are there land-use conflicts?
• What characteristics contribute to the area’s
uniqueness?
• Are they traditional? Are they contemporary?
Natural? Built?
• How has this place changed over time?
• What influences (physical, economic, and po-
litical) have caused the changes?
• What are the resulting changes?
• What role does history play in the land-use is-
sues facing the planning area?
• What were the historical patterns of human
settlement?
• What is the relationship between settlement
patterns and land-use designations and poli-
cies in local plans and zoning ordinances?
115INVENTORY AND ANALYSIS OF THE BIOPHYSICAL ENVIRONMENT
• What are the ecological, social, and economic
consequences of human settlement patterns?
By identifying land use and land users and ana-
lyzing who uses what, an elementary understanding
of the social organization of an area can be gained.
How these groups are linked to resources and issues
is more complex, but this understanding is crucial
to planning. These relationships are explored in
Chapter 4.
SUMMARY OF EXISTING LAND-USE AND
LAND-USER ELEMENTS
1. Historical development
2. Existing land use
3. Settlement patterns
4. Land-user groups
5. Settlement pattern-groups matrix
6. Groups-issues matrix
7. Building and open-space types
8. Plot, lot, and street arrangement
MAJOR SOURCES OF INFORMATION2
1. Individual interviews
2. Interviews with groups and associations
3. Local newspapers and libraries
4. Tax assessors
5. U.S. Bureau of the Census
6. U.S. Natural Resources Conservation Service
(NRCS)
7. U.S. Geological Survey (USGS)
8. College and university libraries
Analysis and Synthesis of Inventory Information
When collecting information about a place, the eco-
logical planner notes the emergence of certain rela-
tionships that form patterns on the landscape. The
amount of rainfall changes up a mountain slope and
2Refer to Table 4.1 for a more complete list.
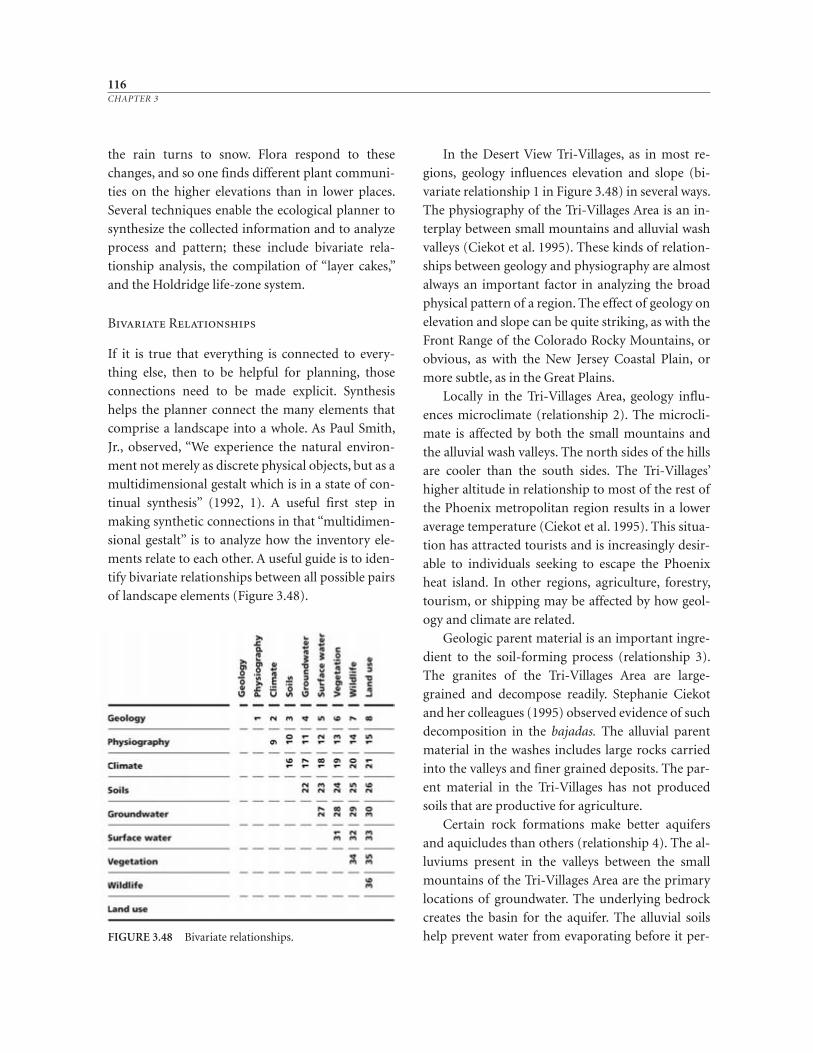
the rain turns to snow. Flora respond to these
changes, and so one finds different plant communi-
ties on the higher elevations than in lower places.
Several techniques enable the ecological planner to
synthesize the collected information and to analyze
process and pattern; these include bivariate rela-
tionship analysis, the compilation of “layer cakes,”
and the Holdridge life-zone system.
Bivariate Relationships
If it is true that everything is connected to every-
thing else, then to be helpful for planning, those
connections need to be made explicit. Synthesis
helps the planner connect the many elements that
comprise a landscape into a whole. As Paul Smith,
Jr., observed, “We experience the natural environ-
ment not merely as discrete physical objects, but as a
multidimensional gestalt which is in a state of con-
tinual synthesis” (1992, 1). A useful first step in
making synthetic connections in that “multidimen-
sional gestalt” is to analyze how the inventory ele-
ments relate to each other. A useful guide is to iden-
tify bivariate relationships between all possible pairs
of landscape elements (Figure 3.48).
In the Desert View Tri-Villages, as in most re-
gions, geology influences elevation and slope (bi-
variate relationship 1 in Figure 3.48) in several ways.
The physiography of the Tri-Villages Area is an in-
terplay between small mountains and alluvial wash
valleys (Ciekot et al. 1995). These kinds of relation-
ships between geology and physiography are almost
always an important factor in analyzing the broad
physical pattern of a region. The effect of geology on
elevation and slope can be quite striking, as with the
Front Range of the Colorado Rocky Mountains, or
obvious, as with the New Jersey Coastal Plain, or
more subtle, as in the Great Plains.
Locally in the Tri-Villages Area, geology influ-
ences microclimate (relationship 2). The microcli-
mate is affected by both the small mountains and
the alluvial wash valleys. The north sides of the hills
are cooler than the south sides. The Tri-Villages’
higher altitude in relationship to most of the rest of
the Phoenix metropolitan region results in a lower
average temperature (Ciekot et al. 1995). This situa-
tion has attracted tourists and is increasingly desir-
able to individuals seeking to escape the Phoenix
heat island. In other regions, agriculture, forestry,
tourism, or shipping may be affected by how geol-
ogy and climate are related.
Geologic parent material is an important ingre-
dient to the soil-forming process (relationship 3).
The granites of the Tri-Villages Area are large-
grained and decompose readily. Stephanie Ciekot
and her colleagues (1995) observed evidence of such
decomposition in the bajadas. The alluvial parent
material in the washes includes large rocks carried
into the valleys and finer grained deposits. The par-
ent material in the Tri-Villages has not produced
soils that are productive for agriculture.
Certain rock formations make better aquifers
and aquicludes than others (relationship 4). The al-
luviums present in the valleys between the small
mountains of the Tri-Villages Area are the primary
locations of groundwater. The underlying bedrock
creates the basin for the aquifer. The alluvial soils
help prevent water from evaporating before it per-
116CHAPTER 3
FIGURE 3.48 Bivariate relationships.
colates down to the aquifer. The granite-derived
soils are highly permeable, which also facilitates the
percolation of water to the groundwater basin
(Ciekot et al. 1995). The interrelationships between
geology and hydrology are important for determin-
ing available water supplies and understanding
stream flows.
Geology influences vegetation and wildlife (rela-
tionships 6 and 7) through its effect on physiogra-
phy, climate, and soils. Rocks affect soil type and
moisture distribution. The alluvial soils in the
washes are more fertile than the rest of the Tri-Vil-
lages Area. As a result, the number and diversity of
plant species is greater in the washes than elsewhere
in the area.
The rocks and surficial deposits are particularly
critical for reptiles. Snakes and lizards use rocks for
shelter and shade. The rock formations are also im-
portant for burrowing species, such as the kangaroo
rat. The walls along the washes, especially Cave
Creek Wash, are important for bats, owls, and other
cliff inhabitants (Ciekot et al. 1995; Ewan et al. 1996;
Burke and Ewan 1998a).
Land use is influenced in several ways by geol-
ogy (relationship 8). The rocky, mountainous por-
tions of the Tri-Villages Area pose difficulties for
construction, and generally, development has not
occurred there. The alluvial valleys have fewer con-
straints and have been used for grazing and scat-
tered rural (and increasingly suburban) housing. In
some regions, geologic conditions can cause haz-
ards to human settlement, as in the case of earth-
quakes and volcanoes, and thus can be important
when determining the location of various land
uses.
Physiography is the surface expression of geol-
ogy. As a result, the influence of physiography on
climate (relationship 9) is similar to that of geology.
In the Tri-Villages Area, rainstorms frequently orig-
inate in the nearby mountains to the north and east.
These storms move into the area, resulting in some-
what more rainfall than other portions of the met-
ropolitan region (Ciekot et al. 1995). Physiography
influences soils (relationship 10) in several ways. In
the Tri-Villages Area, the amounts and types of soil
are closely related to slope. In the small mountains,
soils are shallow or there are only rocky surfaces. As
slope angles decrease, the soils become deeper, be-
cause less soil is washed away and more is deposited
(Ciekot et al. 1995). In even steeper regions of the
United States, like the Rocky Mountains, such rela-
tionships will be more dramatic. In flat regions,
such as the New Jersey Coastal Plain, physiography
will exert a more subtle influence.
Physiography is related to groundwater through
recharge (relationship 11) especially in relationship
to steepness. Groundwater has accumulated in the
valley basins of the Tri-Villages Area. Surface water
flows at different levels in relationship to elevation
and slopes (relationship 12). Essentially, water runs
downhill, and it flows faster on steeper slopes than in
flatter areas. The floodplains along the washes are an
especially important feature of the physiography–
surface water relationship. In the Tri-Villages Area,
the water flows ephemerally, except where it has been
dammed by the Central Arizona Project. In such
places, small water pools exist along the CAP canal
bank (Ewan et al. 1998). Because the water flows in-
frequently but very dramatically, multiple braided
courses are formed.
Physiography influences plant community de-
velopment (relationship 13). Elevation exerts a sig-
nificant influence on vegetation because of its re-
lationship to water flows in the Desert View Tri-
Villages Area. Plant types, density, and canopy
change in response to elevation. In their wash stud-
ies, Joseph Ewan, Rebecca Fish Ewan, and their
colleagues identified four plant communities re-
lated to the terrain of the Tri-Villages Area. Their
wash vegetation type occurs in the lowest eleva-
tions, that is, in the wash bottoms and along the
edges. Both the hillside-slope and the creosote
bush–bursage flat types are defined mostly by
where they occur in the landscape. Tanks are found
at lower places, where they collect water (Ewan et
al. 1996, 1998).
117INVENTORY AND ANALYSIS OF THE BIOPHYSICAL ENVIRONMENT
118CHAPTER 3
Since physiography influences vegetation, it also
influences wildlife (relationship 14), since animals
depend on plants for their habitat and food supply.
The physiography–land-use (relationship 15) rela-
tionships are similar to those of geology and land
use. Development and grazing has occurred more in
the flat portions of the Tri-Villages Area than
steeper areas. In other regions of the country the in-
fluence of terrain on land use is also evident, as, for
example, in the San Francisco Bay area. Too often in
the United States land use has been poorly adapted
to physiography.
Climate plays a strong role in soil development
through a number of processes (relationship 16).
Weathering impacts soil formation through the
processes of deposition and erosion. Most of the
soils in the Tri-Villages Area have been deposited
and eroded by water processes. However, especially
in the small mountains, some of the clay constituent
of the soils is deposited by wind (Ciekot et al. 1995).
Wind also erodes the surface of the Tri-Villages and
contributes to particulate pollution.
Rainfall determines the moisture content of the
soil, which, in turn, influences the rate and manner
of its development. In addition, moisture affects
leaching characteristics, which is important for the
formation of the caliche in the area. Infrequent wet-
ting and rapid drying result. There are some second-
ary clay deposits in the soils of the desert floor.
These argillic horizons are the results of wet and dry
cycles, which transport clay colloids in the soil. The
hot dry temperature is an important factor for
desert soil development. The high temperatures ac-
celerate the rate of drying as well as the rate of
chemical reactions. As Stephanie Ciekot and her col-
leagues observe, “Consequently, the small amount
of organic material that is generated degrades very
rapidly and is quickly lost” (1995).
There are obvious relationships between climate
and hydrology (relationships 17 and 18). The fre-
quency and intensity of rains, when combined with
the high temperature, affect the groundwater level
and surface water flows. The dryness of the Tri-Vil-
lages Area means that water evaporates rapidly, lim-
iting both its percolation into the ground and its
surface flow. In the Sonoran Desert, flash floods and
dramatic sheet flows occur during rainstorms. Con-
versely, long periods of dry weather mean that
perennial flows do not occur in the Tri-Villages Area
(Ciekot et al. 1995).
Vegetation is also greatly affected by climate (re-
lationship 19). Water and solar radiation are the key
influences on plant development. The hot tempera-
ture and paucity of precipitation in the Tri-Villages
Area are the major determinants of its desert vegeta-
tion. The region’s two rainy seasons mean that it is a
more lush desert than most others (Ciekot et al.
1995). Every 10 to 15 years the desert experiences a
wildflower display during El Niño events. Frosts do
occur in the area, and the more frost-sensitive and
drought-tolerant plants appear in the lower eleva-
tions (Ciekot et al. 1995). The plants are mar-
velously adapted to the desert climate. Small shrubs
and trees such as creosote bush (Larrea tridentata)
and foothills or little-leaf palo verde (Cercidium mi-
crophyllum) grow close to the ground, with small,
thin leaves. Many plants, like the palo verde (which
means green stem) have green bark to aid with pho-
tosynthesis. Of course there are cacti too, including
the magnificent saguaro (Carnegiea gigantea). The
saguaro’s ribs are vertical, and the plant expands like
an accordion when water is available. During storm
seasons, the saguaro grows roots quickly to capture
every available drop.
Similarly, climate influences wildlife (relation-
ship 20) through precipitation and solar radiation.
Reproduction, migration, hibernation, and feeding
are all influenced by the variation in climate
through the seasons. Many mammals in the Tri-Vil-
lages “have adapted to high diurnal temperatures by
altering their behavior such as spending much of
the day underground or aestivating” (Ciekot et al.
1995). People are about the only animals who live in
the desert aboveground and during the day. Most
desert creatures are nocturnal; many bite and sting,
and several are venomous. With scarce resources,
desert animals are master recyclers and adapters.
The pack rat, as its name indicates, will collect and
store about anything. The pack rat binds its nest
with “urine cement,” which is capable of preserving
its junk pile for centuries. The kangaroo rat, which is
neither a kangaroo relative nor a rat, never drinks
water and eats its own excrement.
The major land uses in the Tri-Villages Area, and
in fact throughout the metropolitan region, are de-
pendent on climate (relationship 21). Until the in-
troduction of refrigeration and air-conditioning,
the Phoenix region was much more sparsely inhab-
ited by people. As refrigeration and air-conditioning
contributed to significant population growth since
World War Two, past lessons about how to build
more appropriately in the desert were abandoned.
An understanding of climate in planning and design
can help to conserve energy and water resources. In
the southwestern United States, such relationships
are especially dramatic, but land use is affected by
climate everywhere.
Soils influence the amount of water that flows
through the ground to feed aquifers (relationship
22). The sandy alluvium facilitates the flow of water
into the groundwater in the Tri-Villages Area. In ad-
dition the permeability of the sandy soils con-
tributes to the recharge of the aquifers (Ciekot et al.
1995). Water flowing across the land surface is a ma-
jor factor in erosion and drainage (relationship 23).
Water also deposits material that develops into allu-
vial soils, called fluvents.
Soil characteristics such as texture, pH level, and
cation-exchange capacity are interrelated with vege-
tation (relationship 24). Some plants have adapted
to the alkaline soils in the area, while the shallow
caliche limits the root growth of other plants
(Ciekot et al. 1995). Wildlife species use soil as a
habitat (relationship 25). Again, it is hard to sepa-
rate the influence of soil on vegetation from wildlife.
The soils have impacted past uses of the land in
the Desert View Tri-Villages Area (relationship 26).
Because of the poor quality of the soils, agriculture
crops were not grown there. Many soils in the area
are suitable for septic tanks, so scattered rural devel-
opment has occurred.
Groundwater recharge influences stream flow
(relationship 27). Surface flow is abundant after a
rainstorm; then it disappears. It also provides the
supply of water available for vegetation, wildlife,
and humans (relationships 28 to 30). Most existing
rural settlements in the area use well water, while
newer developments are using both well water and
water from remote surface sources. Except in low-
lying areas along the washes, vegetation in the Tri-
Villages is largely independent of groundwater
(phreatic water). Instead, it is dependent on soil
moisture (radose water). Rebecca Fish Ewan, Joseph
Ewan, and their colleagues note strong relationships
between water and vegetation. For example, the
wash beds are subject to scouring during floods,
“which inhibits growth of large trees and dense
patches of shrubs, and maintains a dynamic vegeta-
tion composition in which forbs are dominant”
(Ewan et al. 1998, x).
Surface water is related again to water supply for
animals and people (relationships 31 to 33), as well
as providing a habitat for certain types of plant and
animal life. Surface water is of concern to grazing in
the Tri-Villages because of erosion, and to other
land uses because of flooding. In other regions, irri-
gation or land drainage will be important.
The interrelationship between vegetation and
wildlife is strong (relationship 34). Vegetation pro-
vides food and shelter for animals. The saguaros
have been called “desert condominiums” because of
the number of bird species they house. Animals, in
turn, may affect the reproduction and growth
of plants. For example, long-nosed bats pollinate
saguaro cacti. Kangeroo rats cache seeds of plants
for food that can germinate before being eaten. En-
ergy-flow and food-web diagrams are good ways to
visualize these relationships. Plants and animals in-
fluence how land is used by people (relationships 35
and 36). Vegetation can provide energy-efficient
homesites that make pleasant places for people to
live. Certain wildlife species conflict with suburban
119INVENTORY AND ANALYSIS OF THE BIOPHYSICAL ENVIRONMENT
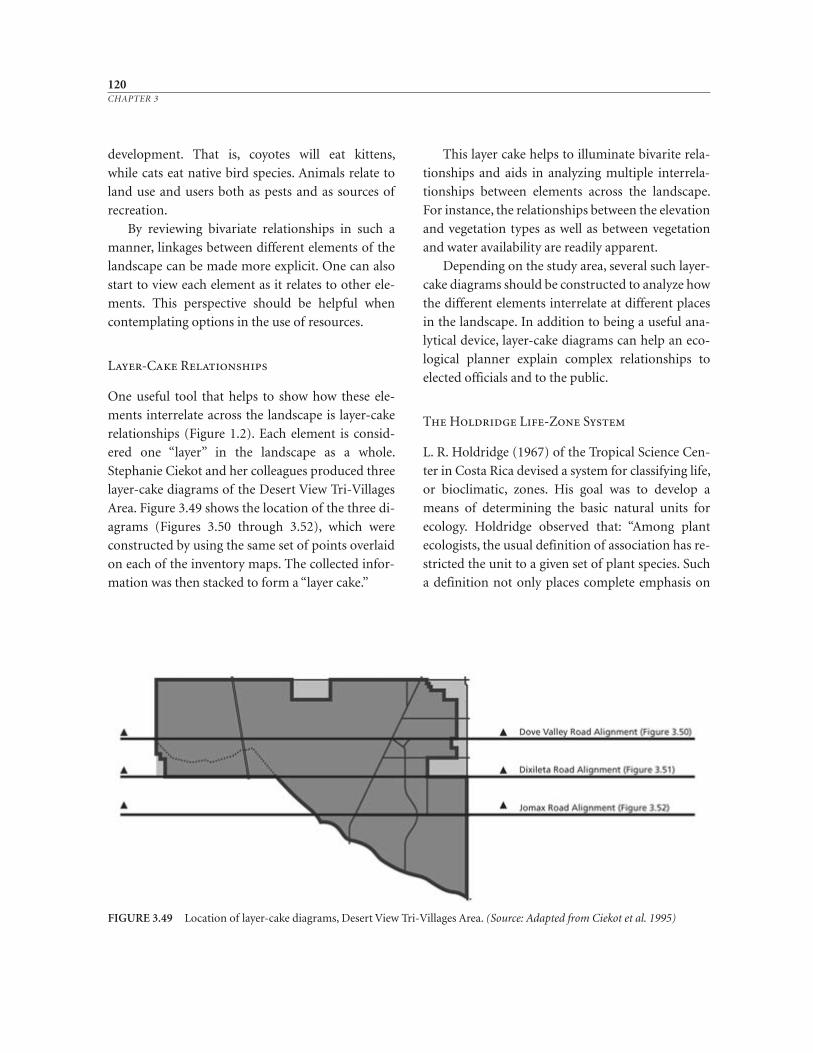
120CHAPTER 3
FIGURE 3.49 Location of layer-cake diagrams, Desert View Tri-Villages Area. (Source: Adapted from Ciekot et al. 1995)
development. That is, coyotes will eat kittens,
while cats eat native bird species. Animals relate to
land use and users both as pests and as sources of
recreation.
By reviewing bivariate relationships in such a
manner, linkages between different elements of the
landscape can be made more explicit. One can also
start to view each element as it relates to other ele-
ments. This perspective should be helpful when
contemplating options in the use of resources.
Layer-Cake Relationships
One useful tool that helps to show how these ele-
ments interrelate across the landscape is layer-cake
relationships (Figure 1.2). Each element is consid-
ered one “layer” in the landscape as a whole.
Stephanie Ciekot and her colleagues produced three
layer-cake diagrams of the Desert View Tri-Villages
Area. Figure 3.49 shows the location of the three di-
agrams (Figures 3.50 through 3.52), which were
constructed by using the same set of points overlaid
on each of the inventory maps. The collected infor-
mation was then stacked to form a “layer cake.”
This layer cake helps to illuminate bivarite rela-
tionships and aids in analyzing multiple interrela-
tionships between elements across the landscape.
For instance, the relationships between the elevation
and vegetation types as well as between vegetation
and water availability are readily apparent.
Depending on the study area, several such layer-
cake diagrams should be constructed to analyze how
the different elements interrelate at different places
in the landscape. In addition to being a useful ana-
lytical device, layer-cake diagrams can help an eco-
logical planner explain complex relationships to
elected officials and to the public.
The Holdridge Life-Zone System
L. R. Holdridge (1967) of the Tropical Science Cen-
ter in Costa Rica devised a system for classifying life,
or bioclimatic, zones. His goal was to develop a
means of determining the basic natural units for
ecology. Holdridge observed that: “Among plant
ecologists, the usual definition of association has re-
stricted the unit to a given set of plant species. Such
a definition not only places complete emphasis on
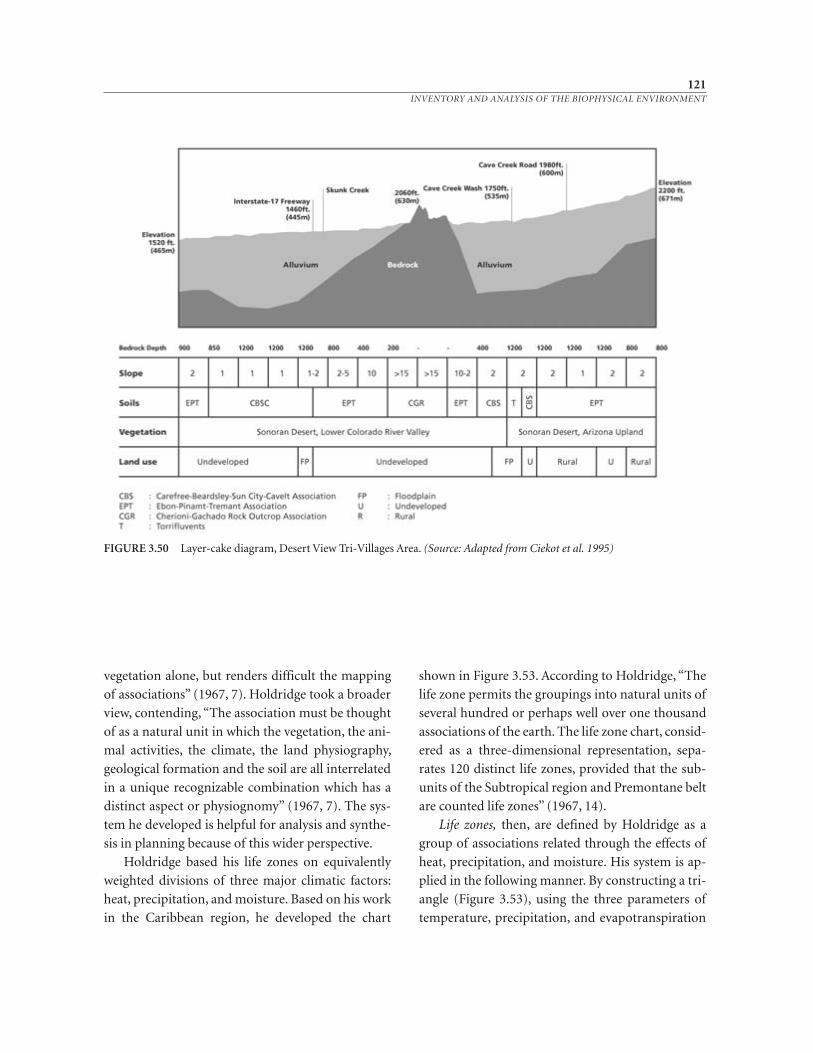
vegetation alone, but renders difficult the mapping
of associations” (1967, 7). Holdridge took a broader
view, contending, “The association must be thought
of as a natural unit in which the vegetation, the ani-
mal activities, the climate, the land physiography,
geological formation and the soil are all interrelated
in a unique recognizable combination which has a
distinct aspect or physiognomy” (1967, 7). The sys-
tem he developed is helpful for analysis and synthe-
sis in planning because of this wider perspective.
Holdridge based his life zones on equivalently
weighted divisions of three major climatic factors:
heat, precipitation, and moisture. Based on his work
in the Caribbean region, he developed the chart
shown in Figure 3.53. According to Holdridge, “The
life zone permits the groupings into natural units of
several hundred or perhaps well over one thousand
associations of the earth. The life zone chart, consid-
ered as a three-dimensional representation, sepa-
rates 120 distinct life zones, provided that the sub-
units of the Subtropical region and Premontane belt
are counted life zones” (1967, 14).
Life zones, then, are defined by Holdridge as a
group of associations related through the effects of
heat, precipitation, and moisture. His system is ap-
plied in the following manner. By constructing a tri-
angle (Figure 3.53), using the three parameters of
temperature, precipitation, and evapotranspiration
121INVENTORY AND ANALYSIS OF THE BIOPHYSICAL ENVIRONMENT
FIGURE 3.50 Layer-cake diagram, Desert View Tri-Villages Area. (Source: Adapted from Ciekot et al. 1995)
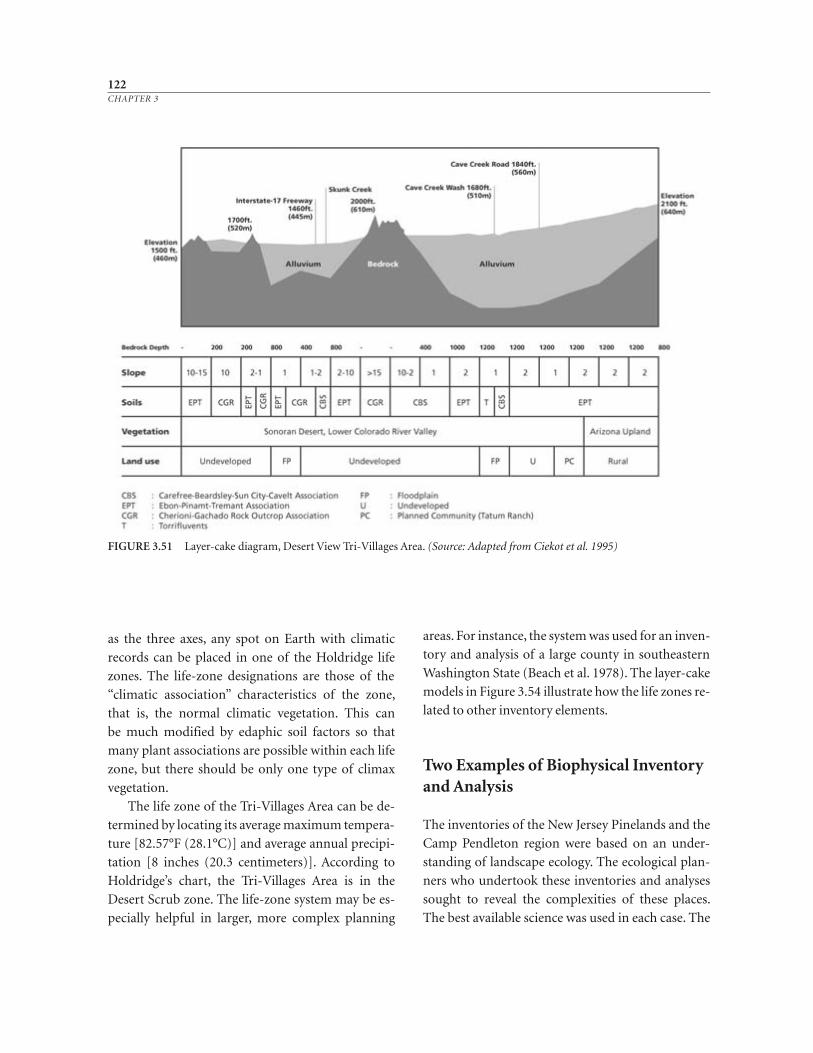
122CHAPTER 3
FIGURE 3.51 Layer-cake diagram, Desert View Tri-Villages Area. (Source: Adapted from Ciekot et al. 1995)
as the three axes, any spot on Earth with climatic
records can be placed in one of the Holdridge life
zones. The life-zone designations are those of the
“climatic association” characteristics of the zone,
that is, the normal climatic vegetation. This can
be much modified by edaphic soil factors so that
many plant associations are possible within each life
zone, but there should be only one type of climax
vegetation.
The life zone of the Tri-Villages Area can be de-
termined by locating its average maximum tempera-
ture [82.57°F (28.1°C)] and average annual precipi-
tation [8 inches (20.3 centimeters)]. According to
Holdridge’s chart, the Tri-Villages Area is in the
Desert Scrub zone. The life-zone system may be es-
pecially helpful in larger, more complex planning
areas. For instance, the system was used for an inven-
tory and analysis of a large county in southeastern
Washington State (Beach et al. 1978). The layer-cake
models in Figure 3.54 illustrate how the life zones re-
lated to other inventory elements.
Two Examples of Biophysical Inventory and Analysis
The inventories of the New Jersey Pinelands and the
Camp Pendleton region were based on an under-
standing of landscape ecology. The ecological plan-
ners who undertook these inventories and analyses
sought to reveal the complexities of these places.
The best available science was used in each case. The
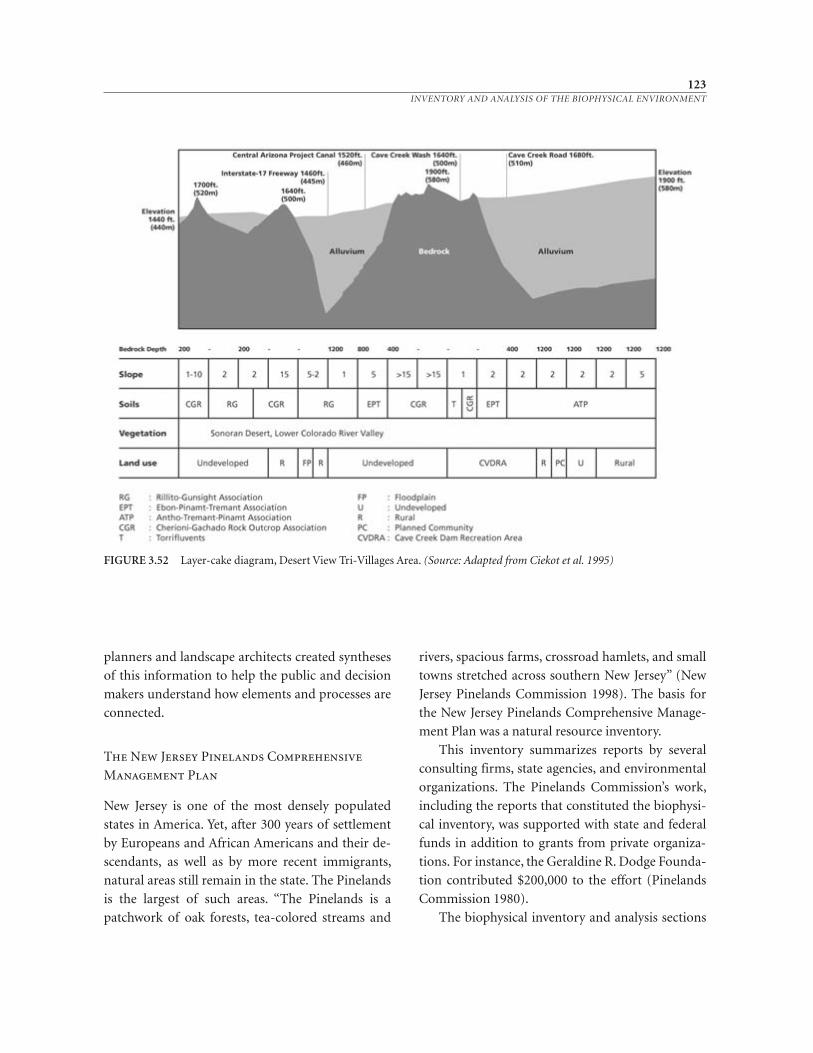
123INVENTORY AND ANALYSIS OF THE BIOPHYSICAL ENVIRONMENT
FIGURE 3.52 Layer-cake diagram, Desert View Tri-Villages Area. (Source: Adapted from Ciekot et al. 1995)
planners and landscape architects created syntheses
of this information to help the public and decision
makers understand how elements and processes are
connected.
The New Jersey Pinelands Comprehensive
Management Plan
New Jersey is one of the most densely populated
states in America. Yet, after 300 years of settlement
by Europeans and African Americans and their de-
scendants, as well as by more recent immigrants,
natural areas still remain in the state. The Pinelands
is the largest of such areas. “The Pinelands is a
patchwork of oak forests, tea-colored streams and
rivers, spacious farms, crossroad hamlets, and small
towns stretched across southern New Jersey” (New
Jersey Pinelands Commission 1998). The basis for
the New Jersey Pinelands Comprehensive Manage-
ment Plan was a natural resource inventory.
This inventory summarizes reports by several
consulting firms, state agencies, and environmental
organizations. The Pinelands Commission’s work,
including the reports that constituted the biophysi-
cal inventory, was supported with state and federal
funds in addition to grants from private organiza-
tions. For instance, the Geraldine R. Dodge Founda-
tion contributed $200,000 to the effort (Pinelands
Commission 1980).
The biophysical inventory and analysis sections
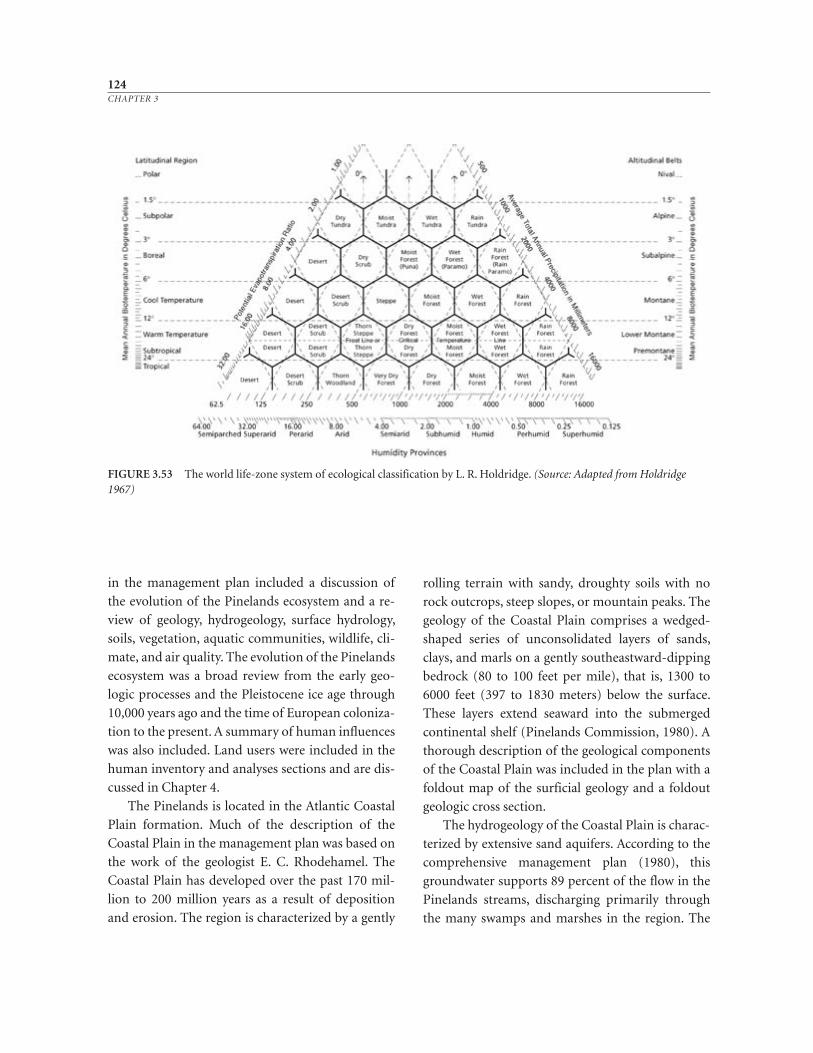
in the management plan included a discussion of
the evolution of the Pinelands ecosystem and a re-
view of geology, hydrogeology, surface hydrology,
soils, vegetation, aquatic communities, wildlife, cli-
mate, and air quality. The evolution of the Pinelands
ecosystem was a broad review from the early geo-
logic processes and the Pleistocene ice age through
10,000 years ago and the time of European coloniza-
tion to the present. A summary of human influences
was also included. Land users were included in the
human inventory and analyses sections and are dis-
cussed in Chapter 4.
The Pinelands is located in the Atlantic Coastal
Plain formation. Much of the description of the
Coastal Plain in the management plan was based on
the work of the geologist E. C. Rhodehamel. The
Coastal Plain has developed over the past 170 mil-
lion to 200 million years as a result of deposition
and erosion. The region is characterized by a gently
rolling terrain with sandy, droughty soils with no
rock outcrops, steep slopes, or mountain peaks. The
geology of the Coastal Plain comprises a wedged-
shaped series of unconsolidated layers of sands,
clays, and marls on a gently southeastward-dipping
bedrock (80 to 100 feet per mile), that is, 1300 to
6000 feet (397 to 1830 meters) below the surface.
These layers extend seaward into the submerged
continental shelf (Pinelands Commission, 1980). A
thorough description of the geological components
of the Coastal Plain was included in the plan with a
foldout map of the surficial geology and a foldout
geologic cross section.
The hydrogeology of the Coastal Plain is charac-
terized by extensive sand aquifers. According to the
comprehensive management plan (1980), this
groundwater supports 89 percent of the flow in the
Pinelands streams, discharging primarily through
the many swamps and marshes in the region. The
124CHAPTER 3
FIGURE 3.53 The world life-zone system of ecological classification by L. R. Holdridge. (Source: Adapted from Holdridge1967)
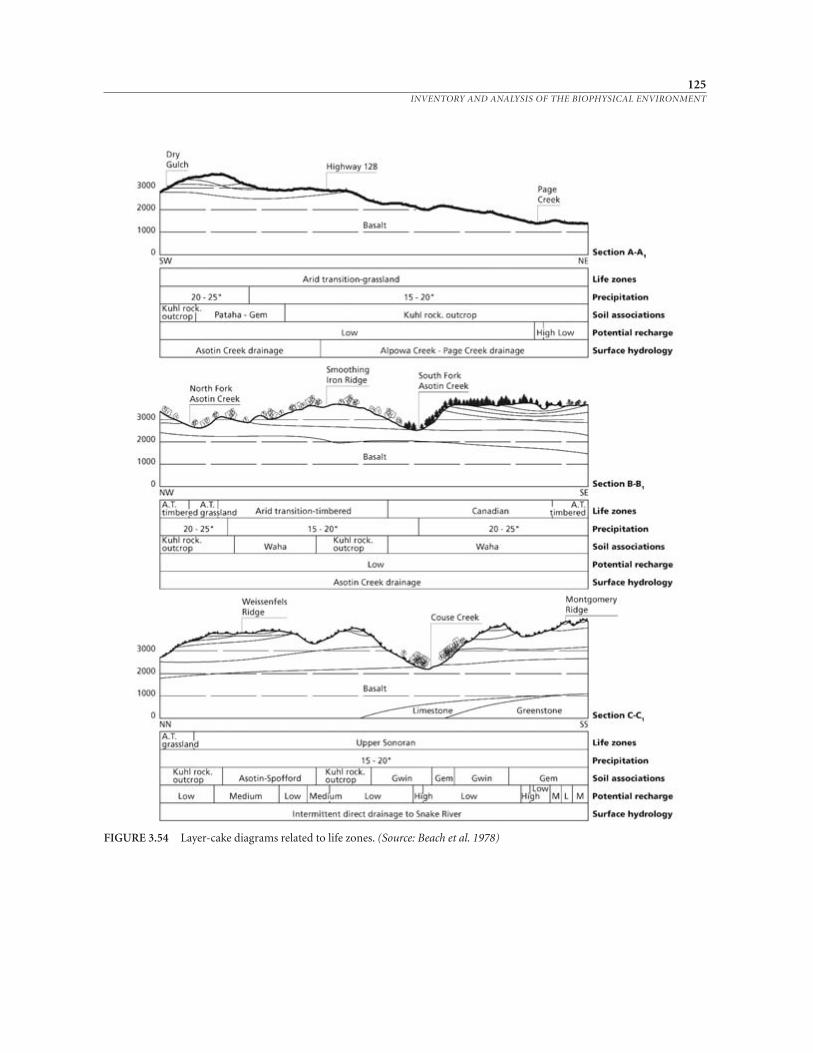
125INVENTORY AND ANALYSIS OF THE BIOPHYSICAL ENVIRONMENT
FIGURE 3.54 Layer-cake diagrams related to life zones. (Source: Beach et al. 1978)
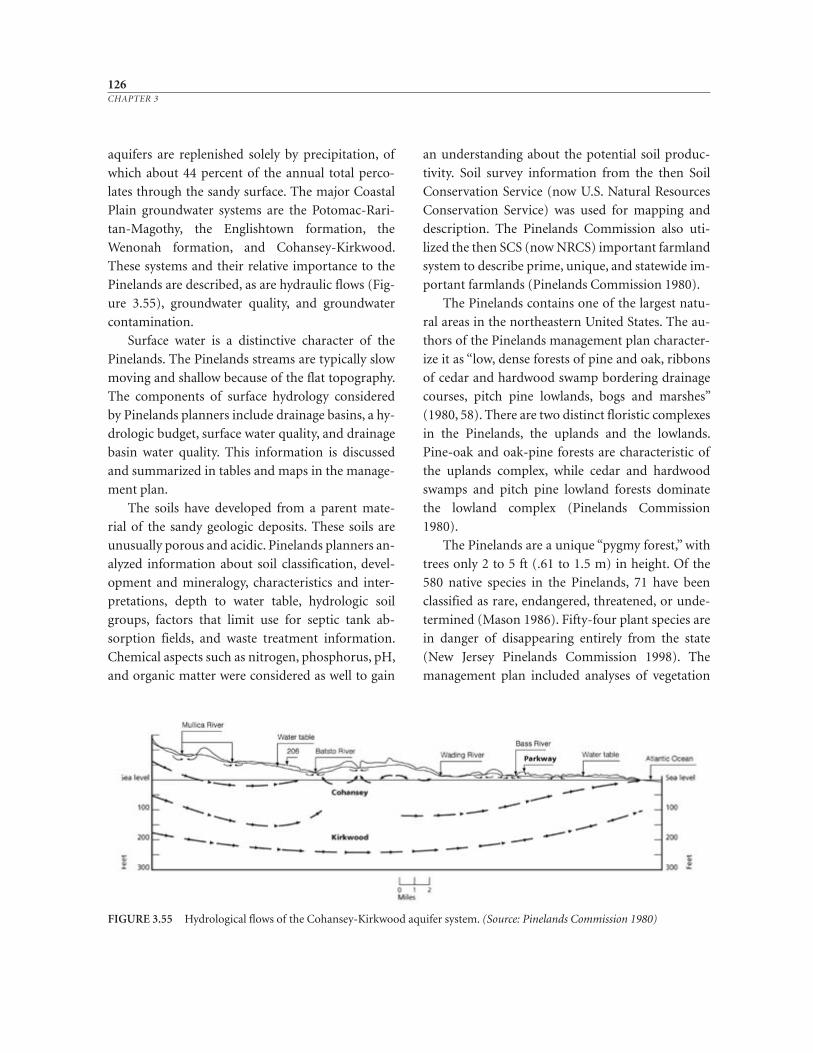
aquifers are replenished solely by precipitation, of
which about 44 percent of the annual total perco-
lates through the sandy surface. The major Coastal
Plain groundwater systems are the Potomac-Rari-
tan-Magothy, the Englishtown formation, the
Wenonah formation, and Cohansey-Kirkwood.
These systems and their relative importance to the
Pinelands are described, as are hydraulic flows (Fig-
ure 3.55), groundwater quality, and groundwater
contamination.
Surface water is a distinctive character of the
Pinelands. The Pinelands streams are typically slow
moving and shallow because of the flat topography.
The components of surface hydrology considered
by Pinelands planners include drainage basins, a hy-
drologic budget, surface water quality, and drainage
basin water quality. This information is discussed
and summarized in tables and maps in the manage-
ment plan.
The soils have developed from a parent mate-
rial of the sandy geologic deposits. These soils are
unusually porous and acidic. Pinelands planners an-
alyzed information about soil classification, devel-
opment and mineralogy, characteristics and inter-
pretations, depth to water table, hydrologic soil
groups, factors that limit use for septic tank ab-
sorption fields, and waste treatment information.
Chemical aspects such as nitrogen, phosphorus, pH,
and organic matter were considered as well to gain
an understanding about the potential soil produc-
tivity. Soil survey information from the then Soil
Conservation Service (now U.S. Natural Resources
Conservation Service) was used for mapping and
description. The Pinelands Commission also uti-
lized the then SCS (now NRCS) important farmland
system to describe prime, unique, and statewide im-
portant farmlands (Pinelands Commission 1980).
The Pinelands contains one of the largest natu-
ral areas in the northeastern United States. The au-
thors of the Pinelands management plan character-
ize it as “low, dense forests of pine and oak, ribbons
of cedar and hardwood swamp bordering drainage
courses, pitch pine lowlands, bogs and marshes”
(1980, 58). There are two distinct floristic complexes
in the Pinelands, the uplands and the lowlands.
Pine-oak and oak-pine forests are characteristic of
the uplands complex, while cedar and hardwood
swamps and pitch pine lowland forests dominate
the lowland complex (Pinelands Commission
1980).
The Pinelands are a unique “pygmy forest,” with
trees only 2 to 5 ft (.61 to 1.5 m) in height. Of the
580 native species in the Pinelands, 71 have been
classified as rare, endangered, threatened, or unde-
termined (Mason 1986). Fifty-four plant species are
in danger of disappearing entirely from the state
(New Jersey Pinelands Commission 1998). The
management plan included analyses of vegetation
126CHAPTER 3
FIGURE 3.55 Hydrological flows of the Cohansey-Kirkwood aquifer system. (Source: Pinelands Commission 1980)
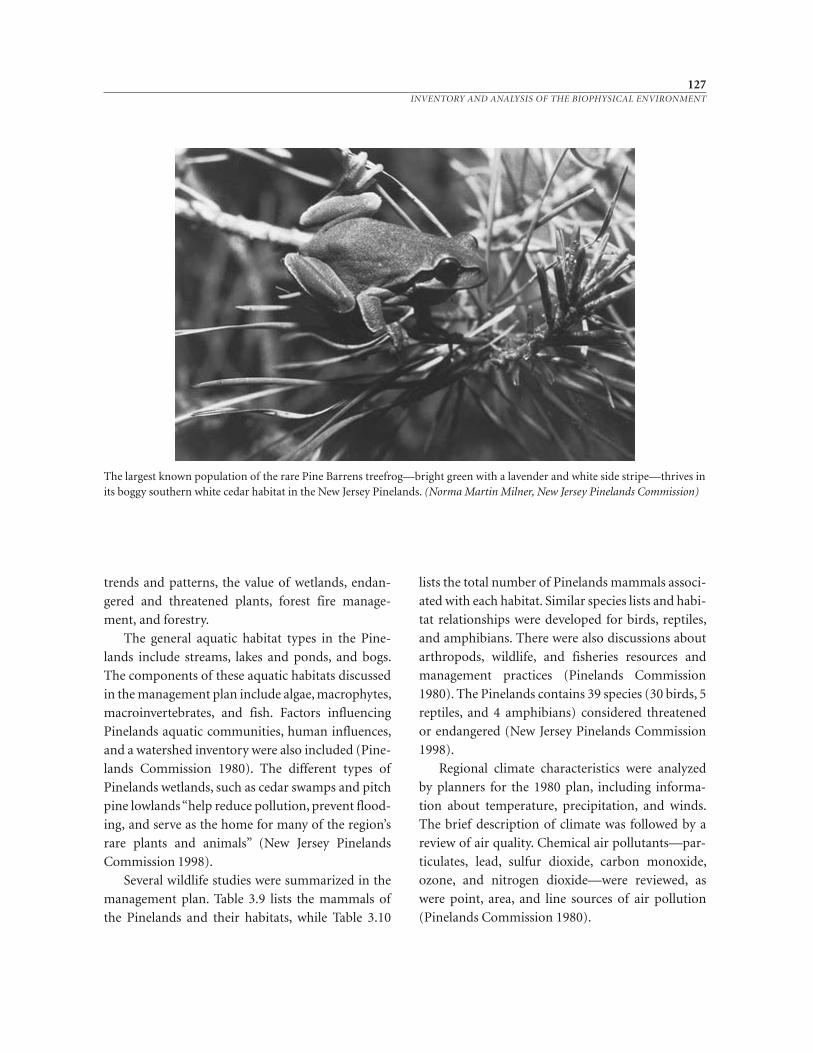
trends and patterns, the value of wetlands, endan-
gered and threatened plants, forest fire manage-
ment, and forestry.
The general aquatic habitat types in the Pine-
lands include streams, lakes and ponds, and bogs.
The components of these aquatic habitats discussed
in the management plan include algae, macrophytes,
macroinvertebrates, and fish. Factors influencing
Pinelands aquatic communities, human influences,
and a watershed inventory were also included (Pine-
lands Commission 1980). The different types of
Pinelands wetlands, such as cedar swamps and pitch
pine lowlands “help reduce pollution, prevent flood-
ing, and serve as the home for many of the region’s
rare plants and animals” (New Jersey Pinelands
Commission 1998).
Several wildlife studies were summarized in the
management plan. Table 3.9 lists the mammals of
the Pinelands and their habitats, while Table 3.10
lists the total number of Pinelands mammals associ-
ated with each habitat. Similar species lists and habi-
tat relationships were developed for birds, reptiles,
and amphibians. There were also discussions about
arthropods, wildlife, and fisheries resources and
management practices (Pinelands Commission
1980). The Pine lands contains 39 species (30 birds, 5
reptiles, and 4 amphibians) considered threatened
or endangered (New Jersey Pinelands Commission
1998).
Regional climate characteristics were analyzed
by planners for the 1980 plan, including informa-
tion about temperature, precipitation, and winds.
The brief description of climate was followed by a
review of air quality. Chemical air pollutants—par-
ticulates, lead, sulfur dioxide, carbon monoxide,
ozone, and nitrogen dioxide—were reviewed, as
were point, area, and line sources of air pollution
(Pinelands Commission 1980).
127INVENTORY AND ANALYSIS OF THE BIOPHYSICAL ENVIRONMENT
The largest known population of the rare Pine Barrens treefrog—bright green with a lavender and white side stripe—thrives inits boggy southern white cedar habitat in the New Jersey Pinelands. (Norma Martin Milner, New Jersey Pinelands Commission)
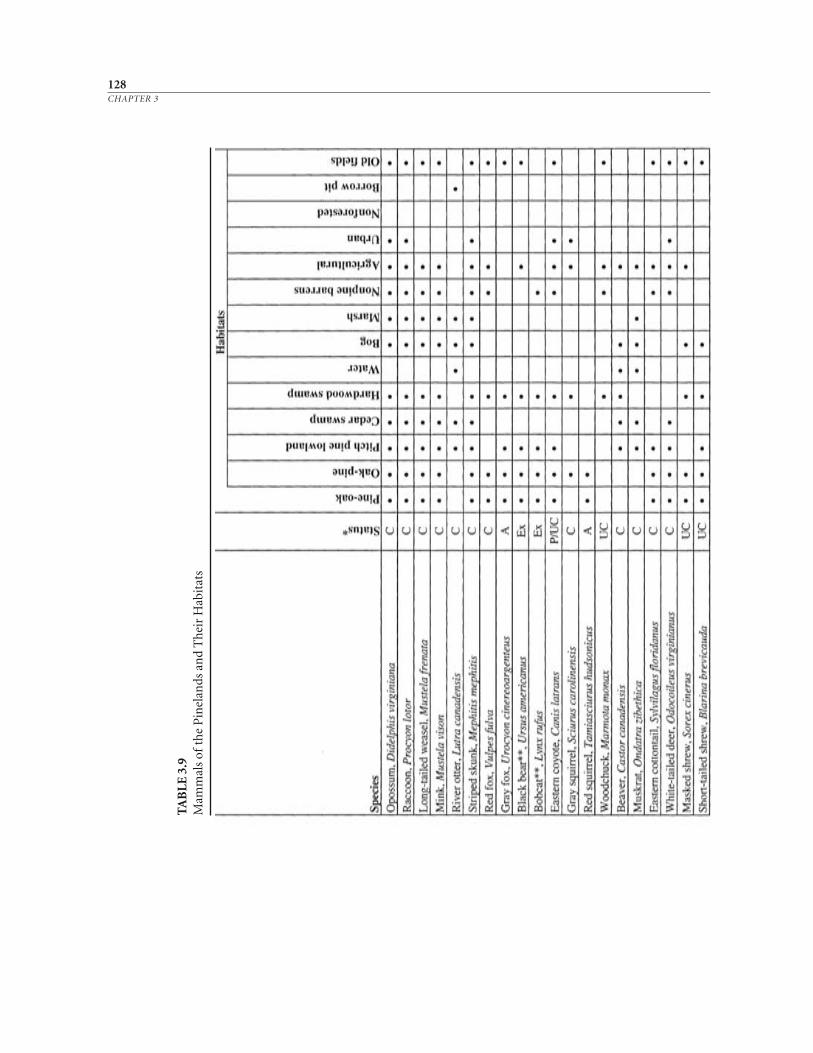
128CHAPTER 3
TAB
LE 3
.9M
amm
als
of th
e P
inel
ands
an
d T
hei
r H
abit
ats
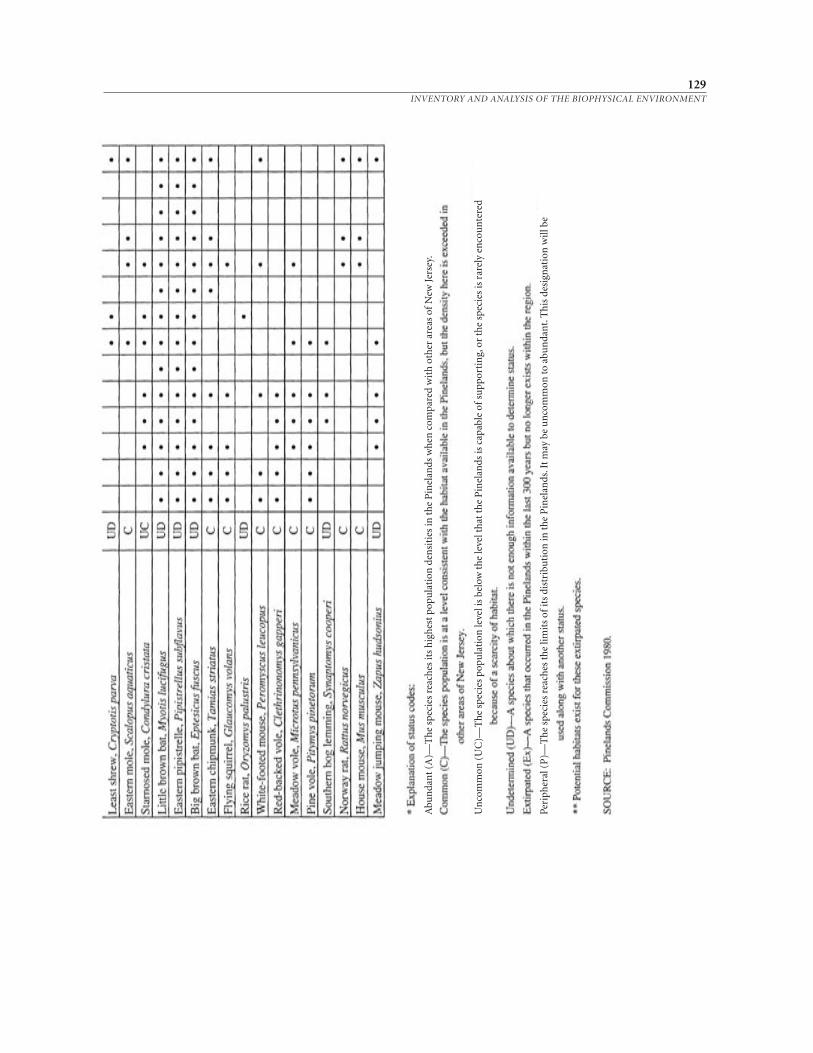
129INVENTORY AND ANALYSIS OF THE BIOPHYSICAL ENVIRONMENT
Abu
nda
nt (
A)—
Th
e sp
ecie
s re
ach
es it
s h
igh
est p
opu
lati
on d
ensi
ties
in th
e P
inel
ands
wh
en c
ompa
red
wit
h o
ther
are
as o
f N
ew Je
rsey
.
Un
com
mon
(U
C)—
Th
e sp
ecie
s po
pula
tion
leve
l is
belo
w th
e le
vel t
hat
th
e P
inel
ands
is c
apab
le o
f su
ppor
tin
g, o
r th
e sp
ecie
s is
rar
ely
enco
un
tere
d
Peri
pher
al (
P)—
Th
e sp
ecie
s re
ach
es th
e lim
its
of it
s di
stri
buti
on in
the
Pin
elan
ds. I
t may
be
un
com
mon
to a
bun
dan
t. T
his
des
ign
atio
n w
ill b
e
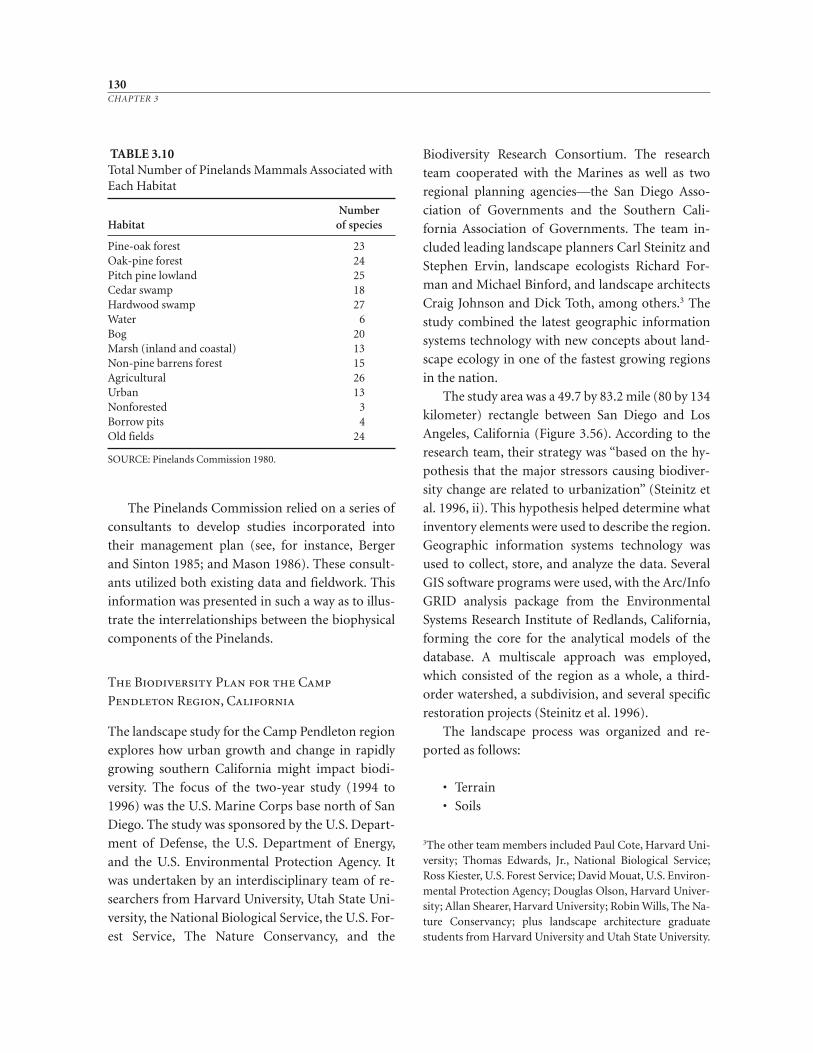
The Pinelands Commission relied on a series of
consultants to develop studies incorporated into
their management plan (see, for instance, Berger
and Sinton 1985; and Mason 1986). These consult-
ants utilized both existing data and fieldwork. This
information was presented in such a way as to illus-
trate the interrelationships between the biophysical
components of the Pinelands.
The Biodiversity Plan for the Camp
Pendleton Region, California
The landscape study for the Camp Pendleton region
explores how urban growth and change in rapidly
growing southern California might impact biodi-
versity. The focus of the two-year study (1994 to
1996) was the U.S. Marine Corps base north of San
Diego. The study was sponsored by the U.S. Depart-
ment of Defense, the U.S. Department of Energy,
and the U.S. Environmental Protection Agency. It
was undertaken by an interdisciplinary team of re-
searchers from Harvard University, Utah State Uni-
versity, the National Biological Service, the U.S. For-
est Service, The Nature Conservancy, and the
Biodiversity Research Consortium. The research
team cooperated with the Marines as well as two
regional planning agencies—the San Diego Asso-
ciation of Governments and the Southern Cali-
fornia Association of Governments. The team in-
cluded leading landscape planners Carl Steinitz and
Stephen Ervin, landscape ecologists Richard For-
man and Michael Binford, and landscape architects
Craig Johnson and Dick Toth, among others.3 The
study combined the latest geographic information
systems technology with new concepts about land-
scape ecology in one of the fastest growing regions
in the nation.
The study area was a 49.7 by 83.2 mile (80 by 134
kilometer) rectangle between San Diego and Los
Angeles, California (Figure 3.56). According to the
research team, their strategy was “based on the hy-
pothesis that the major stressors causing biodiver-
sity change are related to urbanization” (Steinitz et
al. 1996, ii). This hypothesis helped determine what
inventory elements were used to describe the region.
Geographic information systems technology was
used to collect, store, and analyze the data. Several
GIS software programs were used, with the Arc/Info
GRID analysis package from the Environmental
Systems Research Institute of Redlands, California,
forming the core for the analytical models of the
database. A multiscale approach was employed,
which consisted of the region as a whole, a third-
order watershed, a subdivision, and several specific
restoration projects (Steinitz et al. 1996).
The landscape process was organized and re-
ported as follows:
• Terrain
• Soils
130CHAPTER 3
3The other team members included Paul Cote, Harvard Uni-versity; Thomas Edwards, Jr., National Biological Service;Ross Kiester, U.S. Forest Service; David Mouat, U.S. Environ-mental Protection Agency; Douglas Olson, Harvard Univer-sity; Allan Shearer, Harvard University; Robin Wills, The Na-ture Conservancy; plus landscape architecture graduatestudents from Harvard University and Utah State University.
TABLE 3.10Total Number of Pinelands Mammals Associated with Each Habitat
NumberHabitat of species
Pine-oak forest 23Oak-pine forest 24Pitch pine lowland 25Cedar swamp 18Hardwood swamp 27Water 6Bog 20Marsh (inland and coastal) 13Non-pine barrens forest 15Agricultural 26Urban 13Nonforested 3Borrow pits 4Old fields 24
SOURCE: Pinelands Commission 1980.
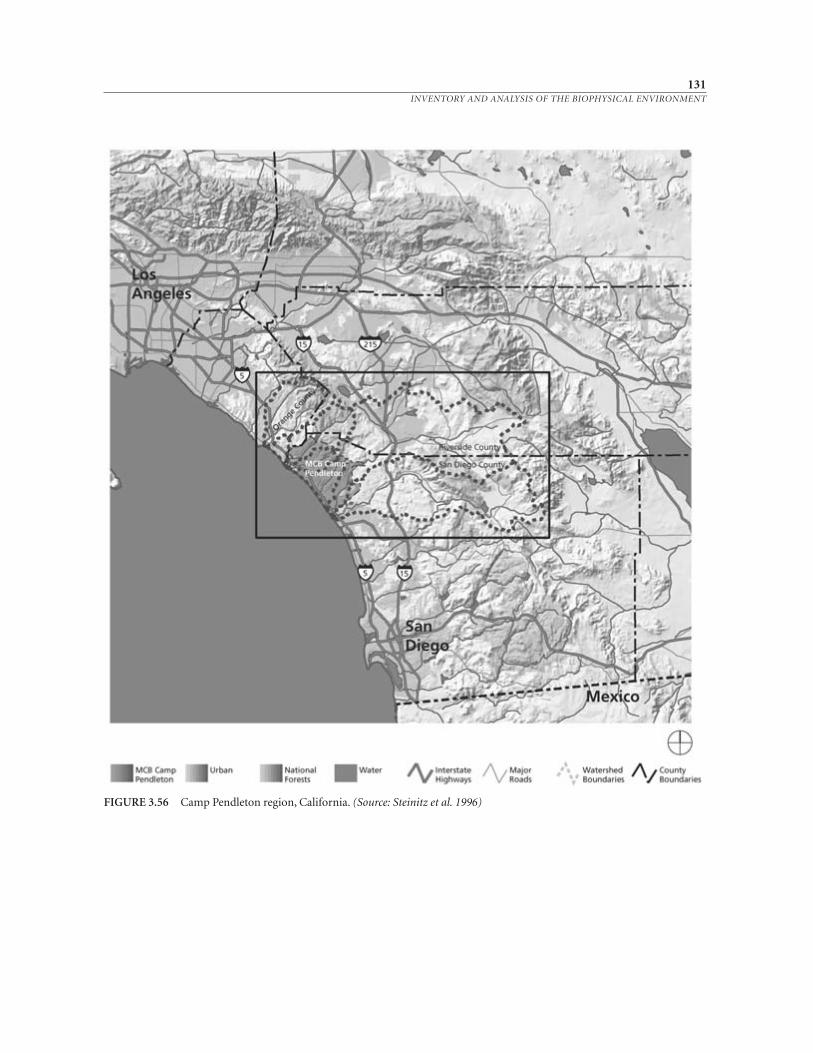
131INVENTORY AND ANALYSIS OF THE BIOPHYSICAL ENVIRONMENT
FIGURE 3.56 Camp Pendleton region, California. (Source: Steinitz et al. 1996)
• Hydrology
• Fire
• Vegetation
• Landscape ecological pattern
• Single-species potential habitat
Arroyo southwest toad
Orange-throated whiptail lizard
Coastal cactus wren
Least Bell’s vireo
California gnatcatcher
Western bluebird
Brown-headed cowbird
Gray fox
Mule deer
California cougar
• Species richness
• Visual preference (Steinitz et al. 1996)
These elements were used to address how the
landscape operated as a process (Figure 3.57)
(Steinitz et al. 1996; also see Steinitz 1990, 1993a). As
examples, the descriptive aspects of the terrain, soils,
hydrology, and vegetation will be summarized.
Then, the operational aspects of the landscape eco-
logical pattern and one of the single-species poten-
tial habitat analyses will be summarized.
The Pendleton research team employed GIS to
analyze different slope models and to calculate the
amount of land in each category (Figure 3.58). After
mapping soil types from NRCS data, prime agricul-
tural soils were located (Figure 3.59). For hydrology,
the team simulated “the relationships between land
cover and the hydrological regime” (Binford in
Steinitz et al. 1996, 32). The diagram in Figure 3.60
illustrates the procedures used for “simulating both
long-term hydrological and single-even regimes”
(Steinitz et al. 1996, 32). A drainage subbasin map
(Figure 3.61) was constructed showing the seven
river basins that are located on or adjacent to Camp
Pendleton. The vegetation map (Figure 3.62) was
developed with digital vegetation-type data, classi-
fied by the California Natural Diversity Database/
Holland Code (Holland 1986).
One type of synthesis used by Steinitz and his
colleagues was the development of a landscape eco-
logical pattern. The elements that comprised this
pattern were
• Contiguous natural vegetation: Areas larger
than 500 hectares (1235 acres) which cur-
rently form the pattern matrix and the princi-
pal source of biodiversity
• Isolated natural vegetation: Areas less than 500
hectares (1235 acres) which form natural
patches and stepping stones surrounded by
disturbed or built landscape
• Natural edges: A 90 meter (295.3 feet) wide
band that extends into the contiguous and iso-
lated natural vegetation from disturbed areas
• Stream corridors: Linear features up to 90 me-
ters (295.3 feet) across which can connect
patch elements
• Disturbed landscape: Primarily agriculture and
military impact zones, which have repeatedly
disturbed vegetation
• Built landscapes: All urban land and roads
• Water (Steinitz et al. 1996, 50)
These elements were identified following For-
man and Godron (1986) and mapped with GIS
technology (Figure 3.63). The research team ob-
served that the Camp Pendleton landscape “still re-
mains a set of natural patches and smaller ‘stepping
stones,’ connected by stream and riparian vegetation
corridors” (Steinitz et al. 1996, 52).
As part of their process and evaluation models
of the Camp Pendleton landscape, the research
team studied the specific habitats of ten species.
The Habitat Suitability Index (HSI) models of the
U.S. Fish and Wildlife Service was used (USFWS
1981). According to Craig Johnson, “HSI models
focus on spatially explicit habitat data, which in-
clude vegetation type, stand age, stand density, per-
cent cover, vertical and horizontal structure, patch
size, patch configuration, edge, juxtaposition of
plant community types, disturbance, elevation,
132CHAPTER 3
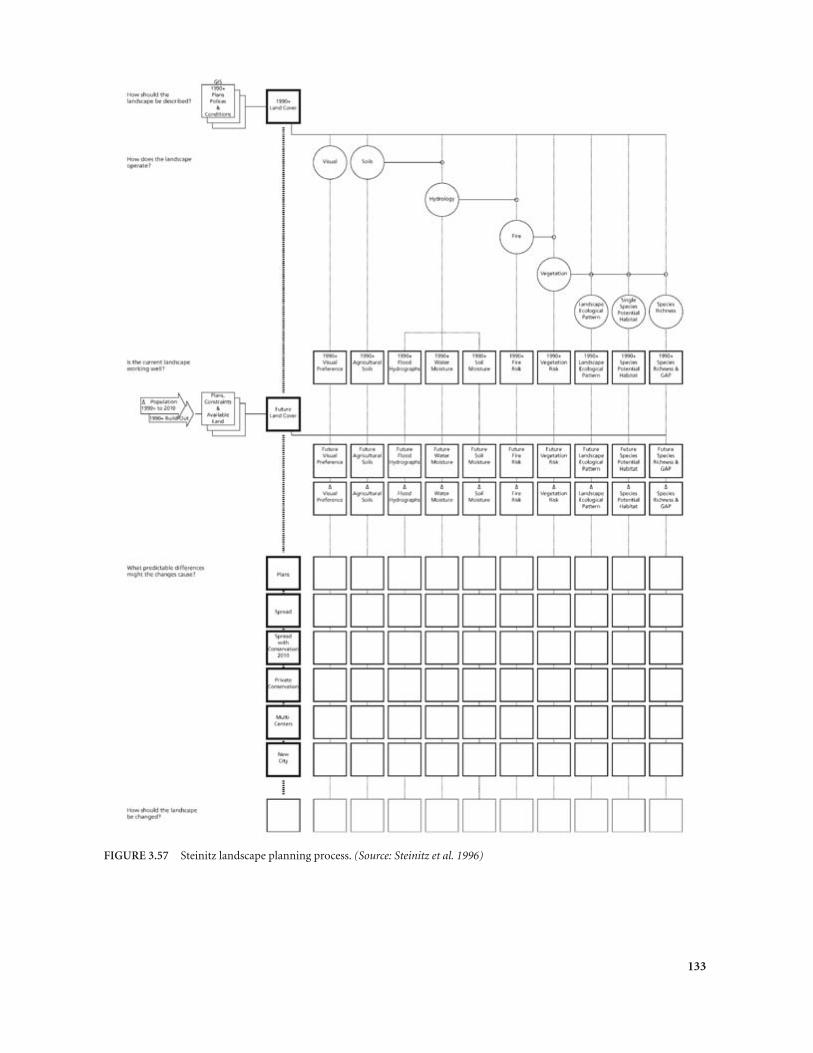
133
FIGURE 3.57 Steinitz landscape planning process. (Source: Steinitz et al. 1996)
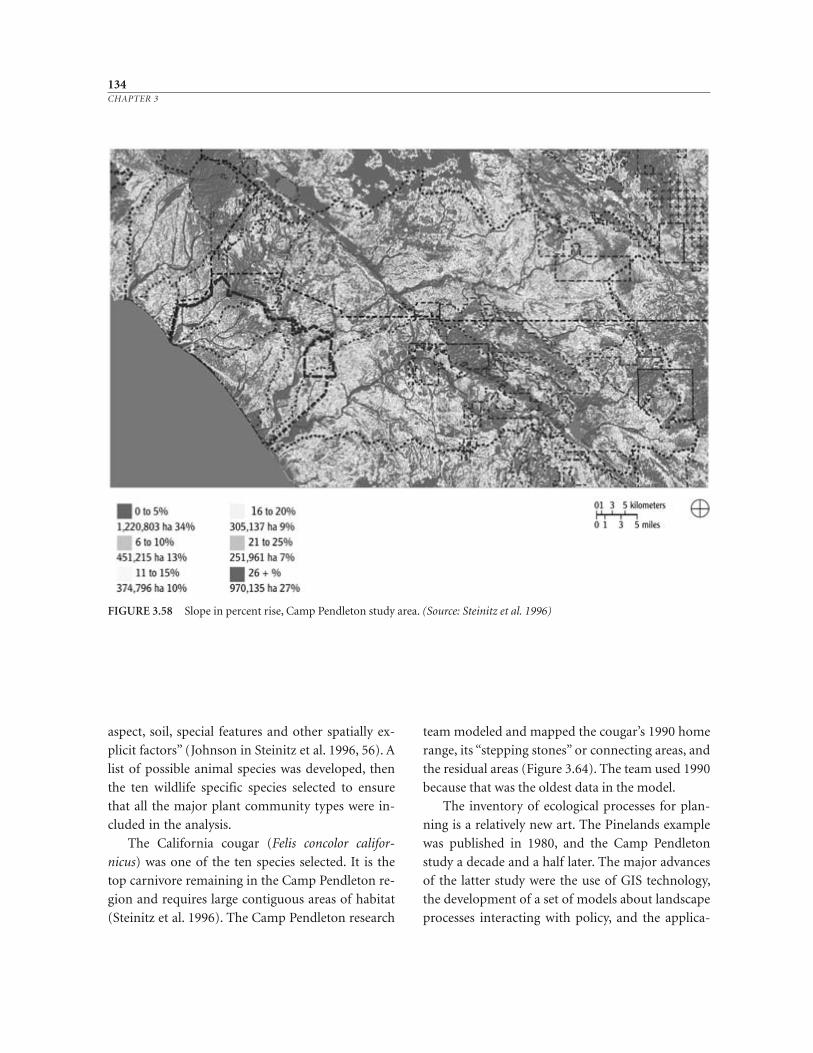
aspect, soil, special features and other spatially ex-
plicit factors” (Johnson in Steinitz et al. 1996, 56). A
list of possible animal species was developed, then
the ten wildlife specific species selected to ensure
that all the major plant community types were in-
cluded in the analysis.
The California cougar (Felis concolor califor -
nicus) was one of the ten species selected. It is the
top carnivore remaining in the Camp Pendleton re-
gion and requires large contiguous areas of habitat
(Steinitz et al. 1996). The Camp Pendleton research
team modeled and mapped the cougar’s 1990 home
range, its “stepping stones” or connecting areas, and
the residual areas (Figure 3.64). The team used 1990
because that was the oldest data in the model.
The inventory of ecological processes for plan-
ning is a relatively new art. The Pinelands example
was published in 1980, and the Camp Pendleton
study a decade and a half later. The major advances
of the latter study were the use of GIS technology,
the development of a set of models about landscape
processes interacting with policy, and the applica-
134CHAPTER 3
FIGURE 3.58 Slope in percent rise, Camp Pendleton study area. (Source: Steinitz et al. 1996)
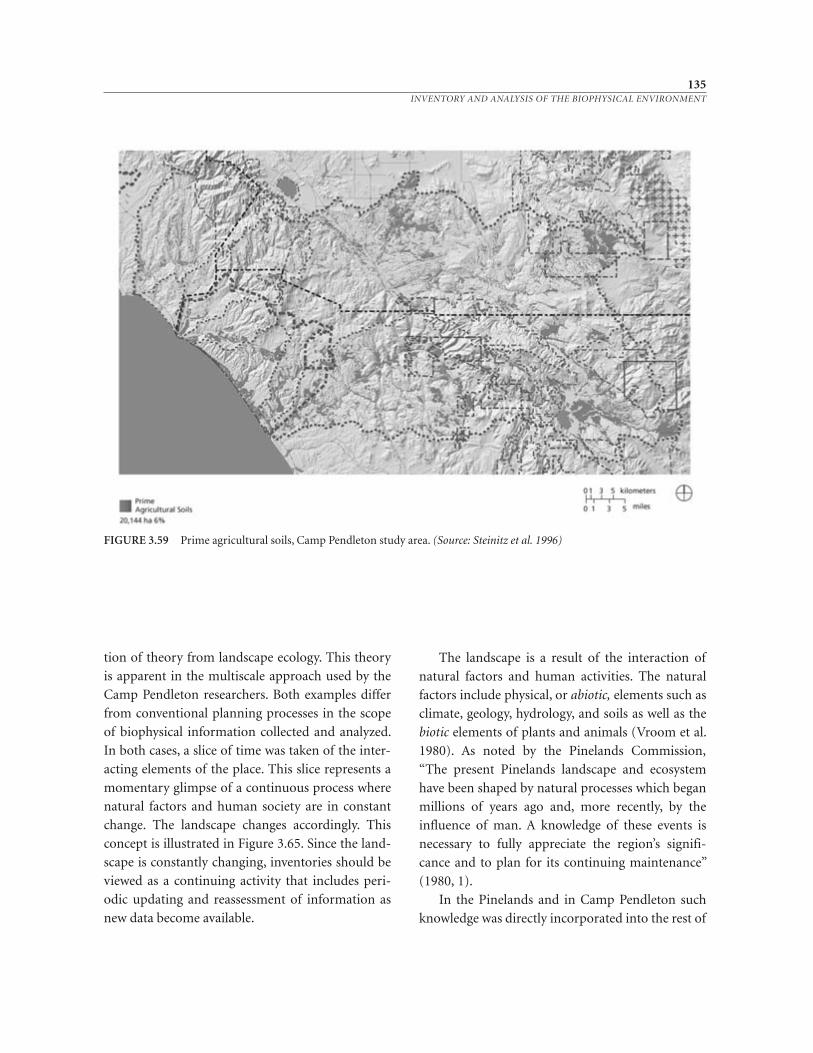
tion of theory from landscape ecology. This theory
is apparent in the multiscale approach used by the
Camp Pendleton researchers. Both examples differ
from conventional planning processes in the scope
of biophysical information collected and analyzed.
In both cases, a slice of time was taken of the inter-
acting elements of the place. This slice represents a
momentary glimpse of a continuous process where
natural factors and human society are in constant
change. The landscape changes accordingly. This
concept is illustrated in Figure 3.65. Since the land-
scape is constantly changing, inventories should be
viewed as a continuing activity that includes peri-
odic updating and reassessment of information as
new data become available.
The landscape is a result of the interaction of
natural factors and human activities. The natural
factors include physical, or abiotic, elements such as
climate, geology, hydrology, and soils as well as the
biotic elements of plants and animals (Vroom et al.
1980). As noted by the Pinelands Commission,
“The present Pinelands landscape and ecosystem
have been shaped by natural processes which began
millions of years ago and, more recently, by the
influence of man. A knowledge of these events is
necessary to fully appreciate the region’s signifi-
cance and to plan for its continuing maintenance”
(1980, 1).
In the Pinelands and in Camp Pendleton such
knowledge was directly incorporated into the rest of
135INVENTORY AND ANALYSIS OF THE BIOPHYSICAL ENVIRONMENT
FIGURE 3.59 Prime agricultural soils, Camp Pendleton study area. (Source: Steinitz et al. 1996)
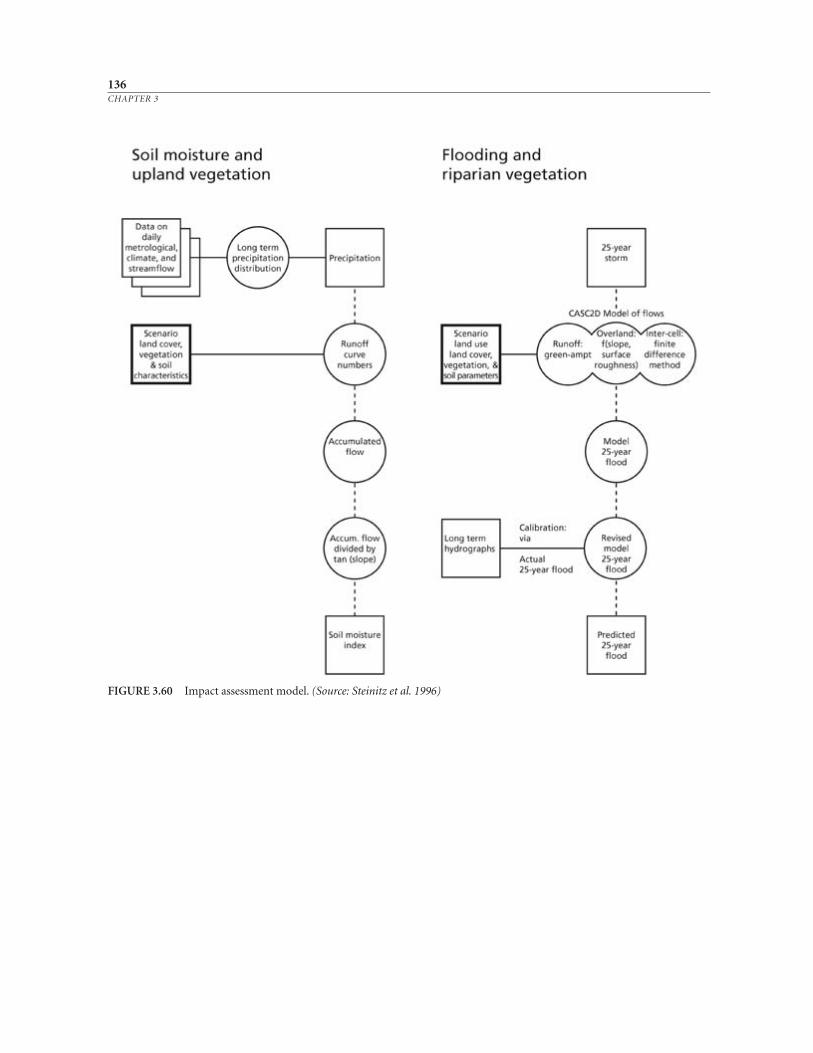
136CHAPTER 3
FIGURE 3.60 Impact assessment model. (Source: Steinitz et al. 1996)
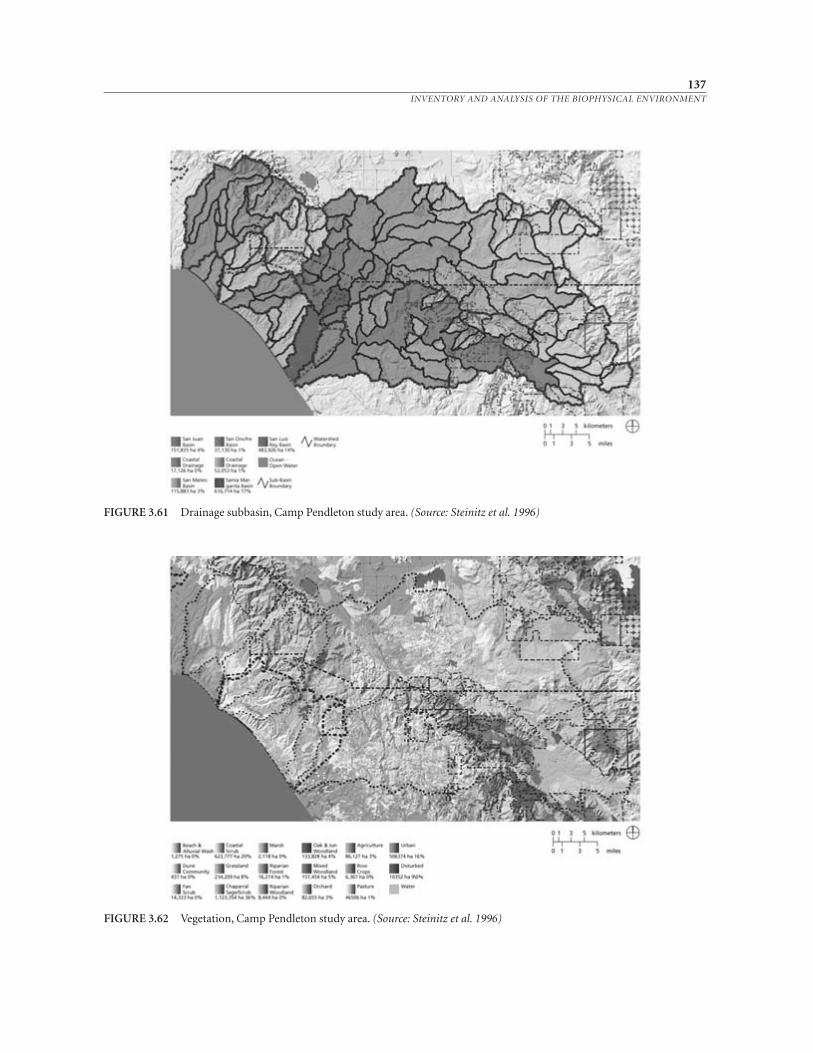
137INVENTORY AND ANALYSIS OF THE BIOPHYSICAL ENVIRONMENT
FIGURE 3.61 Drainage subbasin, Camp Pendleton study area. (Source: Steinitz et al. 1996)
FIGURE 3.62 Vegetation, Camp Pendleton study area. (Source: Steinitz et al. 1996)
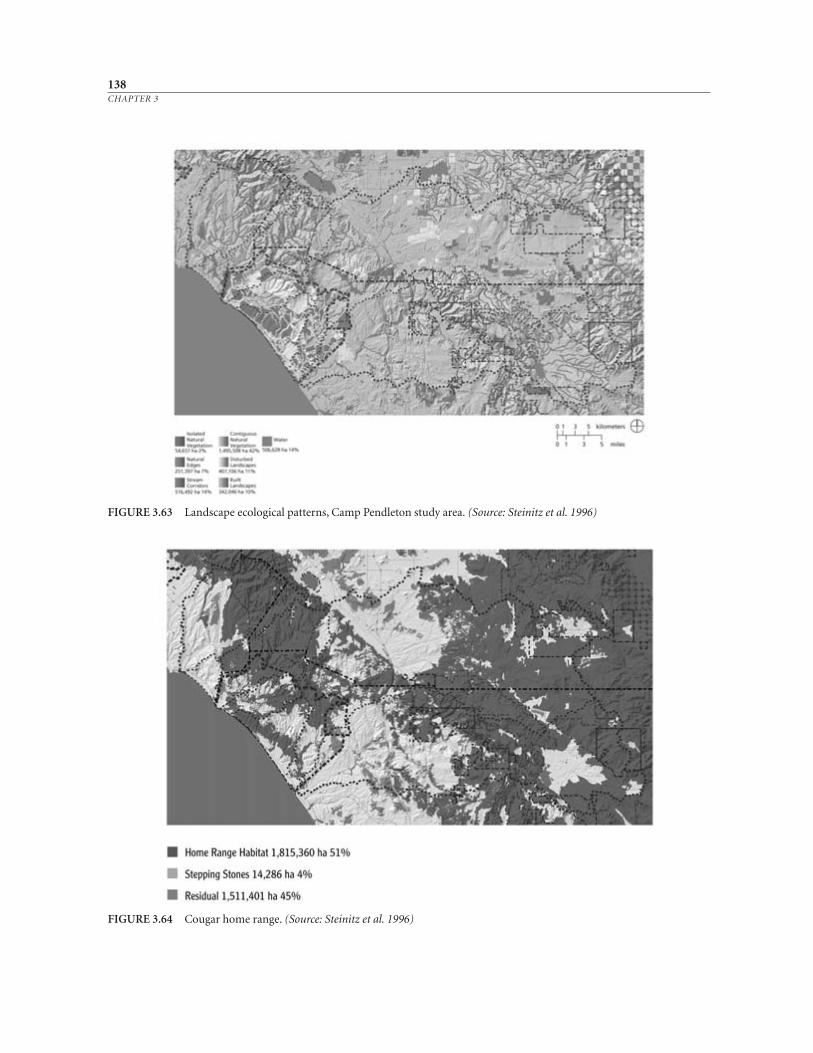
138CHAPTER 3
FIGURE 3.64 Cougar home range. (Source: Steinitz et al. 1996)
FIGURE 3.63 Landscape ecological patterns, Camp Pendleton study area. (Source: Steinitz et al. 1996)
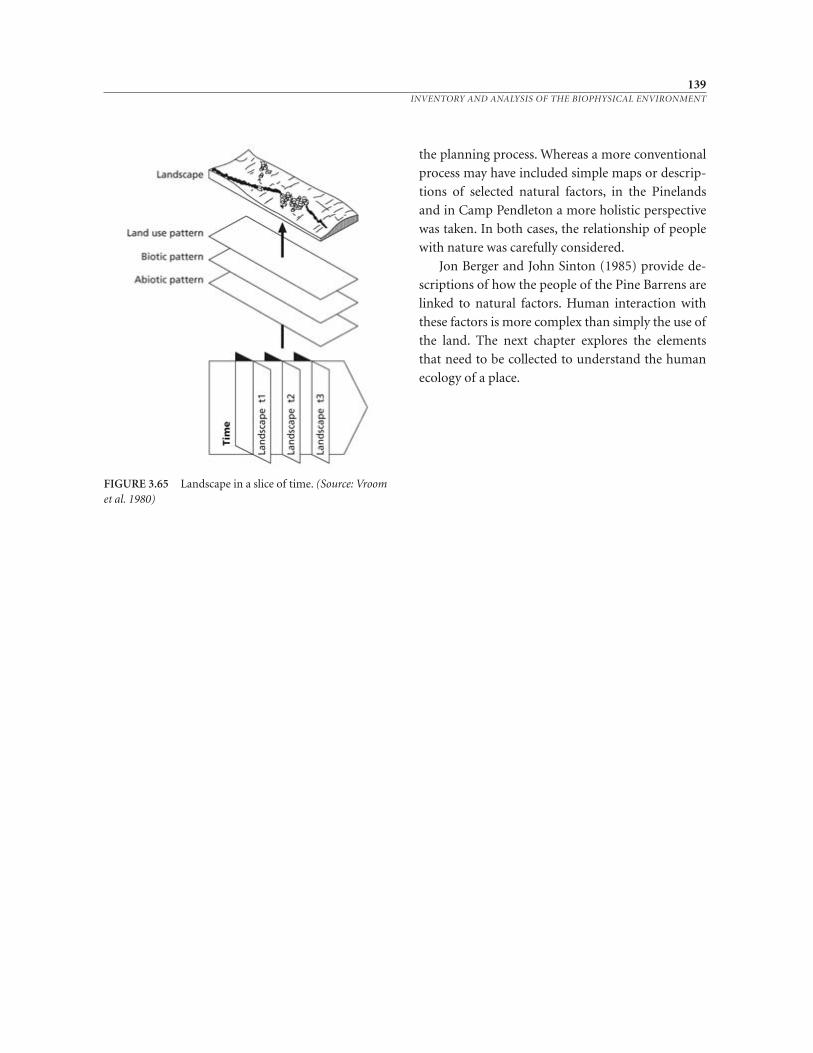
139INVENTORY AND ANALYSIS OF THE BIOPHYSICAL ENVIRONMENT
the planning process. Whereas a more conventional
process may have included simple maps or descrip-
tions of selected natural factors, in the Pinelands
and in Camp Pendleton a more holistic perspective
was taken. In both cases, the relationship of people
with nature was carefully considered.
Jon Berger and John Sinton (1985) provide de-
scriptions of how the people of the Pine Barrens are
linked to natural factors. Human interaction with
these factors is more complex than simply the use of
the land. The next chapter explores the elements
that need to be collected to understand the human
ecology of a place.
FIGURE 3.65 Landscape in a slice of time. (Source: Vroomet al. 1980)
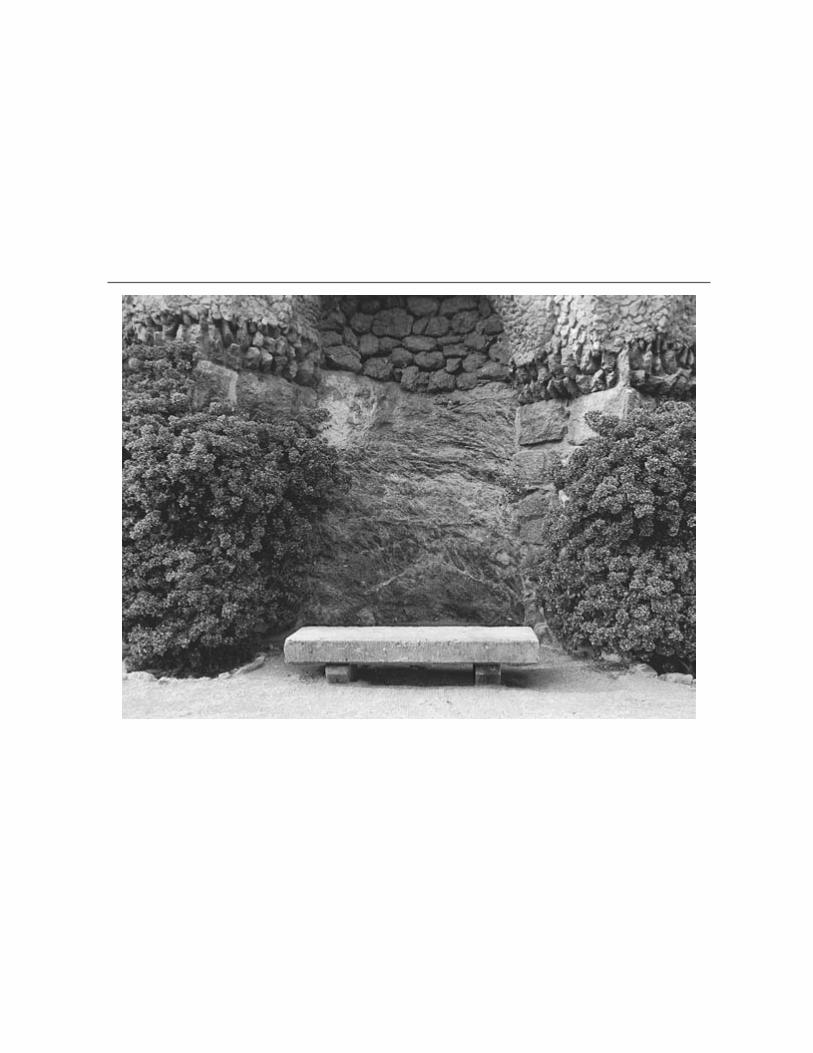
4HUMAN COMMUNITY
INVENTORY AND ANALYSIS
141
Conventional approaches to planning incorporate surveys of socioeconomic infor-
mation. However, connecting such studies to landscape ecological analysis for
planning is relatively new. In this chapter, those population and economic studies
familiar to planners are reviewed. In addition, a framework for integrating infor-
mation about people and nature is presented. Planners use a variety of types of so-
cial information, and, basically, these materials fall into three categories: existing
data, new information from existing data, and original information. These data in-
clude quantitative information—such as the number of people living in an area, as
counted by a census. Data also may be more qualitative—such as the perceptions of
people about the visual impacts of a new roadway or dam.
Different planning projects and programs require different types of social in-
formation. For example, a growth management plan requires an estimate of future
population, economic, and development trends. This information can be derived
from existing sources and is quantitative. Conversely, for the placement of a new
electric transmission line, planners need to collect original, qualitative information
about perceptions and reactions through interviews
with affected residents. Because of the wide variety of
planning projects and programs that are possible, a
blanket prescription cannot be given for the specific
social inventories that should be conducted. The issues
that have stimulated the planning process as well as the
goals that have been identified to resolve those prob-
lems and opportunities will determine the types of
data to be collected and analyzed.
An understanding of current and possible future
population trends and characteristics will probably be
essential for a community to achieve many of its goals.
In Oregon, for instance, local governments are re-
quired to address specific goals concerning agriculture
and housing. As a result, planners must inventory and
analyze information concerning trends in farm popu-
lation (e.g., is it growing or declining?) and character-
istics of the agricultural community (e.g., what is the
average age of farmers?). Planners must also analyze
population trends and characteristics and forecast fu-
ture possibilities to make recommendations about
housing needs.
To accomplish such tasks, planners need to under-
stand local economies. For agriculture, the percentage
that farming contributes to the economic base of a
community is important to know, as are the most im-
portant commodities and their markets. Through an
analysis of the local agricultural economy, planners
can determine how healthy it is, whether it is worth
protecting, and whether intervention is necessary to
improve local farming systems. Understanding the
economic base of a locality helps planners analyze
community needs. If the economic base comprises pri-
mary industries (such as farming, fishing, mining, and
logging) rather than those of the tertiary sector (such
as retail, wholesale, and services), then demands for
housing, for instance, will be different. Where primary
industries are involved, it may be necessary for
dwellings to be relatively close to farmland, the ocean,
the mountains, or forests. With tertiary industries, the
linkage between home and workplace may be less spa-
tially dependent.
Conventional planning processes have considered
and incorporated population and economic studies.
But in conventional planning the social characteristics
are not always related to the landscape—and this
marks a major distinction between conventional ap-
proaches and ecologically based planning. In an eco-
logical approach, social processes are connected to
landscape features. For instance, agriculture can be
related to specific combinations of biophysical ele-
ments that vary with crops. Raising wheat requires
different climate, water, and soil characteristics than
does raising cranberries. Rural housing units have dif-
ferent needs than do high-rise apartments. Different
users of the land—cranberry farmers or high-rise
apartment dwellers—place different demands on the
landscape.
Each human community must be viewed as having
unique characteristics. In a major Texas city (Dallas,
for instance), a population growth of 1500 people per
year may not be dramatic or even a source of concern.
But in a rural west-Texas county, the same number of
new residents may be quite significant and have conse-
quences for several land uses, especially agriculture
and housing. Ranching may have great symbolic value
in Dallas, but the number of real cowboys there may be
few, while in a west-Texas county, people actively en-
gaged in ranching may constitute the most important
economic sector. Certainly, the biophysical processes
are different in Dallas than in west Texas. As a re-
sult, each place, whether in Texas, Oregon, or New Jer-
sey, must be inventoried and analyzed for its special
qualities.
Planners can use many existing sources of infor-
mation to conduct social inventories. These sources
are summarized in the next several paragraphs, and a
discussion will follow about how such existing data
can be used to generate new information about popu-
lation, future development, and land users. Some plan-
ning efforts may require the generation of original
information. Three ways of collecting new informa-
tion are through surveys, interviews, and participant
observation.
142CHAPTER 4
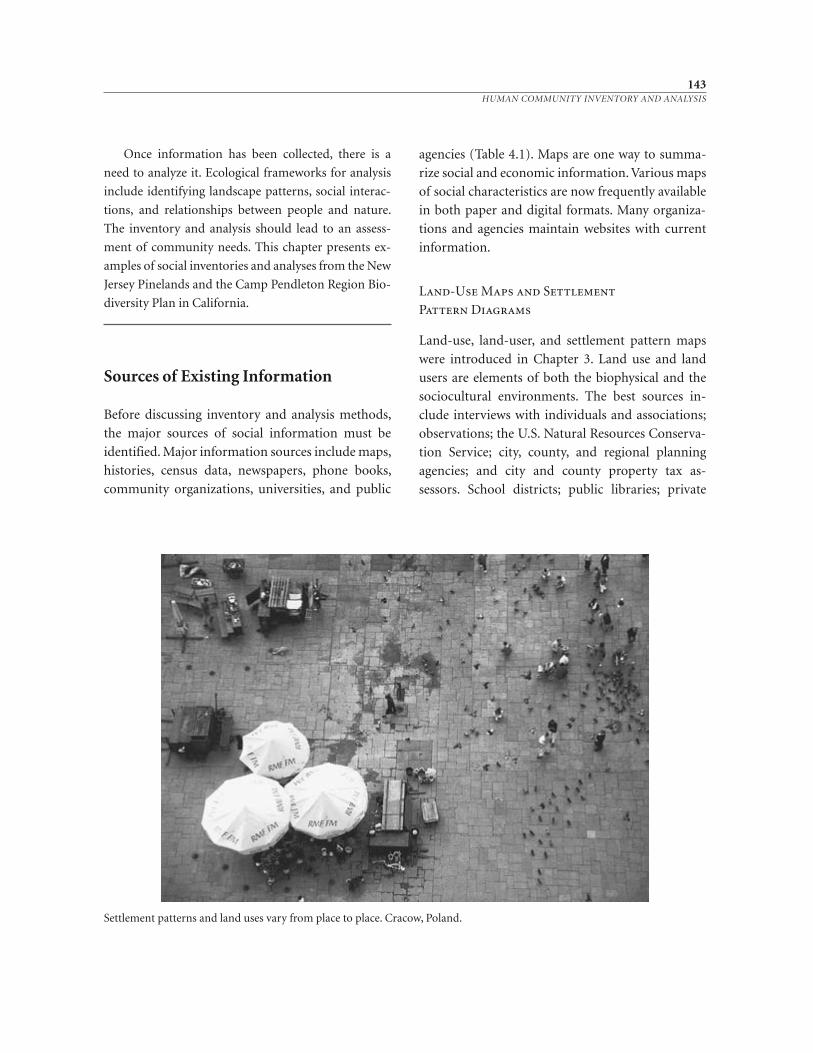
143HUMAN COMMUNITY INVENTORY AND ANALYSIS
Settlement patterns and land uses vary from place to place. Cracow, Poland.
Once information has been collected, there is a
need to analyze it. Ecological frameworks for analysis
include identifying landscape patterns, social interac-
tions, and relationships between people and nature.
The inventory and analysis should lead to an assess-
ment of community needs. This chapter presents ex-
amples of social inventories and analyses from the New
Jersey Pinelands and the Camp Pendleton Region Bio-
diversity Plan in California.
Sources of Existing Information
Before discussing inventory and analysis methods,
the major sources of social information must be
identified. Major information sources include maps,
histories, census data, newspapers, phone books,
community organizations, universities, and public
agencies (Table 4.1). Maps are one way to summa-
rize social and economic information. Various maps
of social characteristics are now frequently available
in both paper and digital formats. Many organiza-
tions and agencies maintain websites with current
information.
Land-Use Maps and Settlement
Pattern Diagrams
Land-use, land-user, and settlement pattern maps
were introduced in Chapter 3. Land use and land
users are elements of both the biophysical and the
sociocultural environments. The best sources in-
clude interviews with individuals and associations;
observations; the U.S. Natural Resources Conserva-
tion Service; city, county, and regional planning
agencies; and city and county property tax as-
sessors. School districts; public libraries; private
144CHAPTER 4
TABLE 4.1Summary of Sources of Information for Human Community Inventory, Analysis, and Synthesis
Newspapers and Periodicals1. Local newspapers2. City, regional, or state magazines and periodicals (for
example, Philadelphia, Boston, New York, Cincinnati,Sunset, Southern Living, Washington, California, HighCountry News)
3. Public libraries
Phone BooksThe numerous private-advertising phone directories
Community Clubs and Organizations1. Chambers of commerce2. League of Women Voters3. Service clubs4. Educational organizations5. Garden clubs6. Political parties7. Community or neighborhood associations8. Fraternal organizations9. Labor unions and guilds
10. Business and professional associations11. Scouts and other youth groups12. Arts associations13. Churches and synagogues14. Farmers organizations (for example, the Grange, the
Farm Bureau, commodity groups)15. Nature and conservancy groups16. Sports clubs17. Volunteer firemen18. United Way and Community Chest
Colleges and Universities
Government and Public Agencies1. City, township, county, and regional agencies
a. Planning commissions and/or staffsb. Councils of governmentc. School boards and administratorsd. County extension agentse. Utility companiesf. Special-use districts
Land-Use Maps and Settlement Pattern Diagrams1. Interviews with individuals and associations2. Observation3. NRCS, USGS4. City, county, and regional planning agencies5. City and county tax assessors6. School districts7. Public libraries8. Engineering, landscape architecture, architecture, and
planning consulting firms9. Gas stations
10. The Library of Congress11. Election boards12. State departments of commerce and finance13. Real estate agents14. Chambers of commerce
Histories1. Fire insurance maps2. Public libraries3. Interviews4. Local and state historical societies5. College and university libraries6. Community college, college, and university depart-
ments of history, folklore, geography, and anthropology7. The Library of Congress8. Local used-book shops9. Genealogical societies
Census Data1. U.S. Bureau of the Census, U.S. Department of
CommerceACSD Customer ServiceWashington, D.C. 20233301-457-1128301-457-3842 (fax)http://www.census.gov
2. Agricultural Census, U.S. Department of Agriculture3. Public utilities4. Telephone companies5. Hospital and newspaper birth and death records6. College and university departments of geography and
sociology
engineering, landscape architecture, and planning
consulting firms; gas stations; the Library of Con-
gress; election boards; state departments of state
and finance; and real estate agents may all be map-
ping sources. Aerial photographs constitute another
good source; these may be obtained from the
NRCS, U.S. Geological Survey, private pilots and air
survey companies, and state highway departments.
Histories
A sense of history is vital to the understanding of a
community or region. Fire insurance maps, notably
those from the Sanborn Map Company, are an espe-
cially rich source of information about the historical
land use of American communities. Sanborn maps
comprise over 300,000 maps of more than 3500
cities and towns in the United States. Sanborn maps
were created for the fire insurance industry for risk
assessment purposes and date from the early twenti-
eth century to the 1990s. The maps include many
land-use details, including street widths, land eleva-
tions, water pipes under streets, fire hydrants, open
waterways, parks, and railroad tracks.
Many communities have at least one unofficial
historian who has compiled an account of past
events. Local histories can be gathered through in-
terviews and discussions. Public libraries and local
historical societies frequently keep unpublished
manuscripts about local events in their archives. As
oral histories become more popular, these may often
be stored in local libraries or historical societies.
State libraries, college and university libraries, and
the Library of Congress are also good sources, as are
community college, college, and university depart-
ments of history, folklore, geography, American
studies, and anthropology.
Landscape ecological histories are especially
helpful. For example, the San Francisco Estuary In-
stitute spent four years (1994 to 1998) compiling a
historical view of the San Francisco Bay circa 1800,
as well as a current view (Figure 4.1). This historical
view of wetlands and other surface waters is based
on eighteenth-, nineteenth-, and twentieth-century
145HUMAN COMMUNITY INVENTORY AND ANALYSIS
TABLE 4.1(Continued)
g. County offices that record land tenure, titles, sales,marriages, divorces, deaths, criminal offenses, andemployment
h. Hospital registers and filesi. Fire department and emergency servicesj. Police and sheriff officesk. Welfare agenciesl. Health departmentsm. Water and sewer departments, departments of pub-
lic worksn. Juvenile delinquency centerso. Park and recreation departmentsp. Drug and alcohol counseling centersq. Councils on agingr. City and/or county prosecutorss. Public transit authoritiest. Recycling centers
2. State (or provincial) agenciesa. Elected officials and their staffs
b. Departments of planning, education, health, safety,welfare, and natural resources
3. Federal (or national) agenciesa. Elected officials and their staffsb. U.S. Department of Housing and Urban
Developmentc. U.S. Department of Energyd. U.S. Department of Educatione. U.S. Department of Health and Human Servicesf. U.S. Department of Commerceg. U.S. Department of Agricultureh. U.S. Department of Transportationi. Environmental Protection Agencyj. The Library of Congress
4. International organizations. The United Nations hasseveral programs that may provide helpful informationthat might be used to put local communities into aglobal perspective.
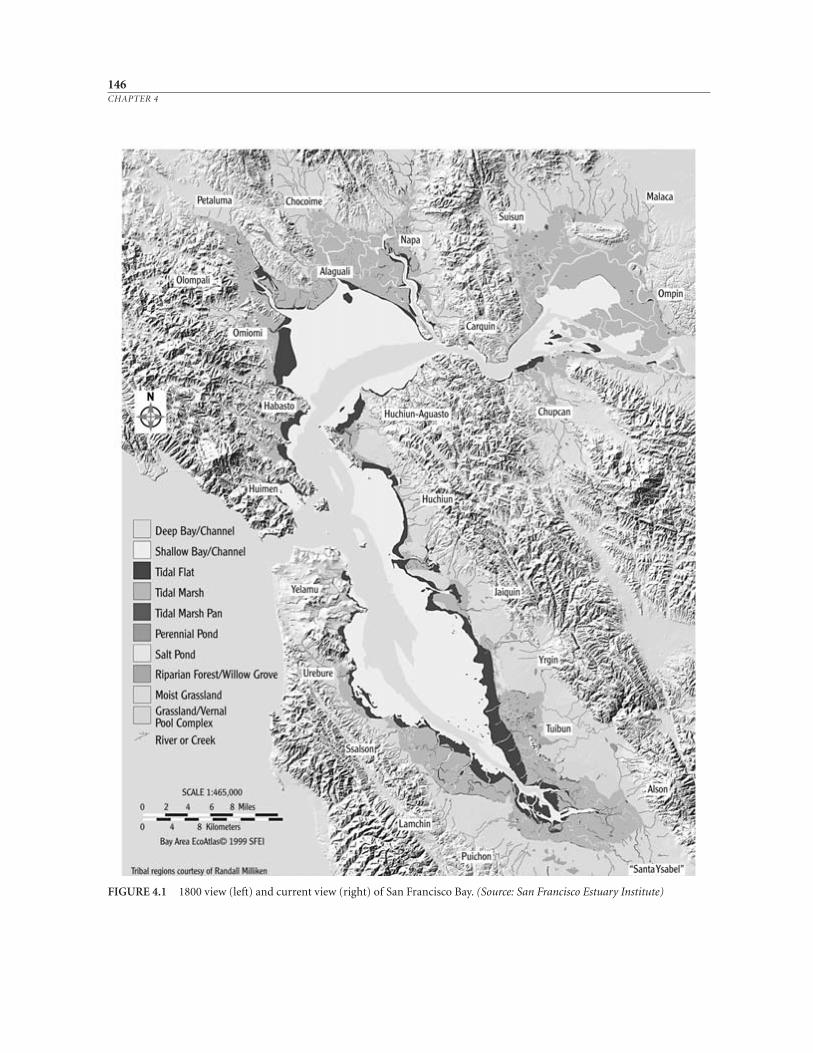
146CHAPTER 4
FIGURE 4.1 1800 view (left) and current view (right) of San Francisco Bay. (Source: San Francisco Estuary Institute)
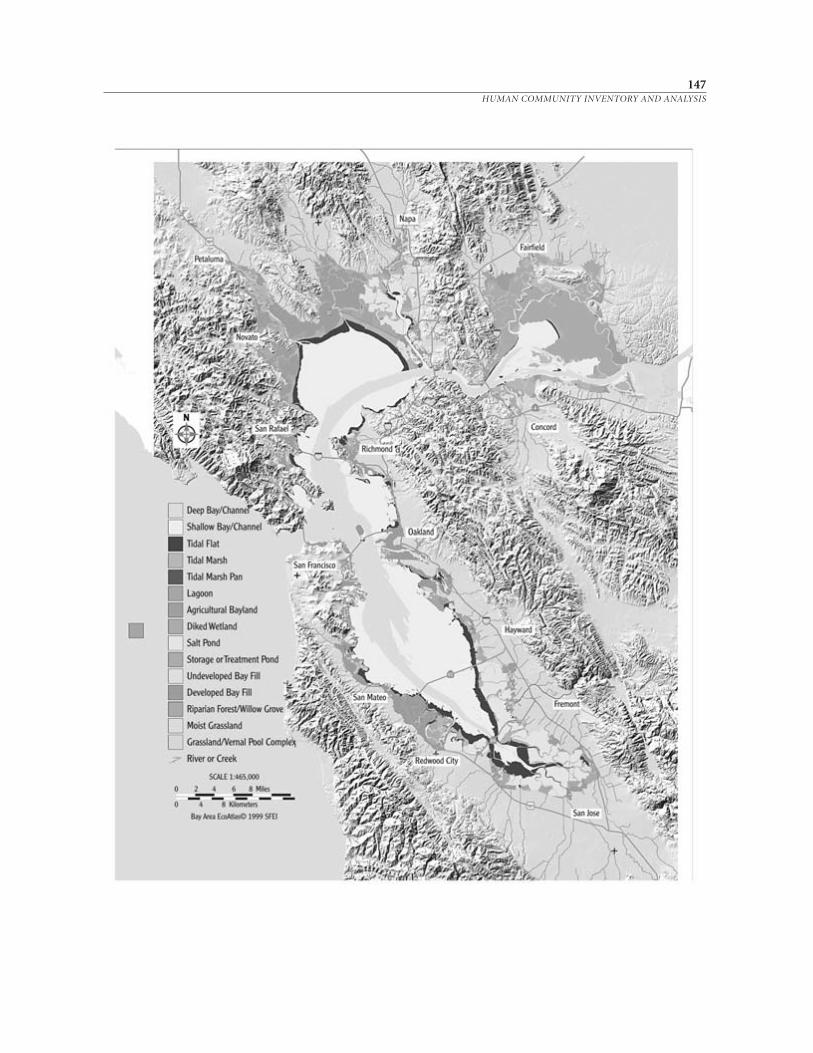
147HUMAN COMMUNITY INVENTORY AND ANALYSIS
maps, sketches, paintings, photographs, engineering
reports, oral histories, explorers’ journals, mission-
ary texts, hunting magazines, interviews with living
elders, and other sources (Grossinger et al. 1998).
A similar approach has been taken by Paola
Falini in Italy (Falini et al. 1980; Falini 1997). She
has adapted the urban morphological approach of
Saverio Muratori for landscapes and produced his-
torical maps documenting Italian cities from the
times of the Romans through the Renaissance and
Industrial Revolution to the present. Such landscape
histories can help illustrate how humans have mod-
ified places through time.
Census Data
The Bureau of the Census, administered by the U.S.
Department of Commerce, is the finest single
source of demographic information in the United
States. A national census is undertaken the first year
of every decade. These censuses include vital infor-
mation about age and sex composition, birth and
death statistics, ethnic composition, rural/urban
distribution, migration, general population charac-
teristics, housing, and general economic character-
istics, such as employment and income. There is
more thorough information available for metropol-
itan statistical areas (MSAs) than for rural regions.
Census information is available in published reports
and over the Internet.
A review of specialized census information,
Census Catalog and Guide, is published annually by
the Bureau of the Census. The Census Bureau also
provides computerized geographical data. These
TIGER line files include information about streets,
rivers, railroads, jurisdictional boundaries, and cen-
sus tracts (Peck 1998). Geographically, census in-
formation is organized by blocks, block groups, and
tracts. Additional socioeconomic information may
be obtained from the agricultural census of the U.S.
Department of Agriculture. State and regional
agencies as well as colleges and universities act as
clearinghouses or storage centers for census data.
The use of census data is discussed later in this
chapter.
Newspapers and Periodicals
Local newspapers and regional magazines can reveal
much about a community or region. Both daily and
weekly newspapers can be rich sources of informa-
tion about local happenings. Some of the informa-
tion that can be found in local newspapers includes
different perspectives on local issues, employment
opportunities, the availability of real estate, and the
activities of voluntary organizations and civic
groups. By reading past newspaper articles and
keeping an ongoing clipping file, a planner can track
opinions about issues and learn something about
trends in employment and real estate.
An ever-growing number of magazines may
help to establish the vernacular character of regions.
Some of these magazines, such as Philadelphia, New
York, Boston, and Cincinnati, focus on an individual
city. Others, like California, Washington, Sunset,
Southern Living, New West, and Rocky Mountain, ad-
dress a state or broader region. A wonderful bi-
weekly newspaper focusing on western environ-
mental issues is High Country News of Paonia,
Colorado. If a planner is new to a region or is a con-
sultant from some other place, then this type of pe-
riodical can provide some information about the
character of the planning area.
Phone Books
The yellow, white, and blue pages of phone books
each contain much information about the commu-
nities they serve. The yellow pages provide an index
of industry, commerce, and services in the area. The
white pages provide a source for family names,
which may reveal some information about ethnic
heritage. The locations of ethnic neighborhoods
may also be identified. The blue pages, which in-
clude government listings, often include a map of
the area served by the phone book and a brief his-
148CHAPTER 4
tory of the area. In addition, local place and street
names can be learned from phone books.
Community Organizations and Clubs
Many people join organizations or clubs to associate
with people of similar interests. They may also at-
tend a particular church, synagogue, mosque, or
temple. Thus the social and religious clubs and or-
ganizations found in a community reveal much
about how the people there spend their leisure time,
what their political and religious beliefs are, and
what the nature of their employment is. In addition
to the phone book, good sources of lists of commu-
nity organizations and clubs are usually the local
chamber of commerce, the League of Women Vot-
ers, and religious institutions. A list of community
organizations and clubs with names and addresses
may be useful if the planner is developing a mailing
list to send newsletters or other information about
the planning program. Such a list can offer informa-
tion about the scope of community activities in the
planning area. For some planning programs and
projects, it may be necessary to interview represen-
tatives from these groups, which is discussed later in
this chapter.
Colleges and Universities
The two main sources of cultural information in
colleges and universities are their libraries and indi-
vidual faculty members. Faculty in departments of
sociology, anthropology, economics, planning, geog-
raphy, business, African American studies, ethnic
studies, education, home economics, history, politi-
cal science, landscape architecture, and law should
be able to provide information about the sociocultu-
ral characteristics of an area. Other members of aca-
demic communities, such as librarians and regis-
trars, may be helpful additional information sources.
The extension services of land-grant and sea-grant
universities often publish bulletins with socioeco-
nomic profiles of counties and cities.
Government and Public Agencies
Government and public agencies collect and store a
wealth of material about communities. Usually,
however, there is a lack of coordination between the
various agencies, which means that information
must be collected, analyzed, and put into a format
with meaning for the particular studies. All levels of
government—local, regional, state, and national—
are good sources. International organizations may
be a useful resource for some planning studies.
Synopsis of Information Sources
Paper and digital maps, histories, census data, news-
papers and periodicals, phone books, community
organizations and clubs, colleges and universities,
and government agencies can yield much informa-
tion for inventories of human communities. Maps
are important for understanding the spatial organi-
zation of the planning area. Planners also may need
maps to study the relationship of social systems to
natural patterns. Histories inform the planner about
the past of the place—when it was settled and why.
Newspapers and periodicals can help the planner to
confirm or deny the issues that have been identified
as well as to learn what individuals or groups have
an interest in the issue. Phone books reveal much
about who lives and works in the area. Community
and government organizations represent the official
social structure of the planning area. Universities
and colleges provide a bank of information about
the place—its history, its social organization, and its
culture.
Use of Existing Data to Generate New Information
The identification of existing sources of informa-
tion is just the beginning of a social inventory and
analysis. These existing data form the basis for the
generation of new information about the people
149HUMAN COMMUNITY INVENTORY AND ANALYSIS
and economy of a community. Information that is
widely available includes population data, develop-
ment projections, economic analyses, and land-use
classification, all of which suggest who is using the
land.
Population Trends, Characteristics,
and Projections
Three types of population studies are important in
planning for the future: trends, characteristics, and
projections. Population trends include changes in
numbers, location, and components of people. Pop-
ulation characteristics include age and gender com-
position, birth statistics, death statistics, ethnic
composition, distribution, migration, and popula-
tion pyramids. Generally, this information is avail-
able from the U.S. Census. Other sources may also
need to be studied; these include the records of
county and city governments, hospitals, newspa-
pers, phone companies, public utilities, councils of
government, and state agencies. Projection tech-
niques include the cohort-survival model, geomet-
ric interpolation, and simulation models. In this
section, the Desert View Tri-Villages is used as an
example of population studies that were conducted
as part of a planning process.
Trends. Planners study population trends to
learn how the planning area has changed over time.
Whether the population has been growing or de-
clining will be important to know in many planning
programs and projects. If a goal of the planning ef-
fort is to encourage economic development, then
the planner will want to know whether the area is
growing or declining, in order to devise business re-
cruitment strategies. If growth management is a
goal, then trends give an indication of how many
people have moved to the area and when. If the de-
velopment of new facilities is involved (schools and
parks, for instance), then population trends reveal
past demand for these services.
Phoenix is located in Maricopa County, Arizona,
one of the fastest-growing regions in the United
States. At the end of the Second World War, Phoenix
had 100,000 residents; now it has well over a million
and is the sixth-largest city in the nation. From 1980
to 1997, the population of Phoenix increased from
798,704 to 1,205,285, a 53 percent increase. In the
1940s Maricopa County was home to 186,193 resi-
dents; by 1995 over 2.4 million people lived there.
Table 4.2 illustrates population trends in Maricopa
County from 1940 to 1990, as interpreted from the
1990 census. This table includes the city of Phoenix
and the three census tracts that comprise the Desert
View Tri-Villages Area. Comparisons with neigh-
boring jurisdictions, in this case nearby cities and
towns, and with a larger entity, in this case the city of
Phoenix, help to show how the planning area relates
to other places. The table shows a slower growth for
the Tri-Villages than other areas of the metropolitan
regions, but this situation has changed dramatically
since 1990 and will continue to change into the fu-
ture.
Population trends may also show shifts in the lo-
cation of people from urban to rural or from rural
to urban areas. These changes have been dramatic
since the Second World War. As demographers and
planners have noted, continued suburbanization,
regional redistribution, and rural repopulation are
the three major trends shaping population settle-
ment in the United States and other developed na-
tions (Nelson 1992; Long 1981; Wardwell and
Gilchrist 1980). For example, whereas Maricopa
County grew by 41 percent between 1980 and 1990
(and another 22.7 percent between 1990 and 1997,
according to Gober 1998), rural population growth
was only 7 percent, while urban areas grew by 42
percent (Table 4.3). Globally, the redistribution of
people in nonmetropolitan areas has a dramatic im-
pact on energy use, the conversion of important
farmland, coastal management, and the protection
of environmentally sensitive areas. In Maricopa
County, the dramatic population growth has come
150CHAPTER 4
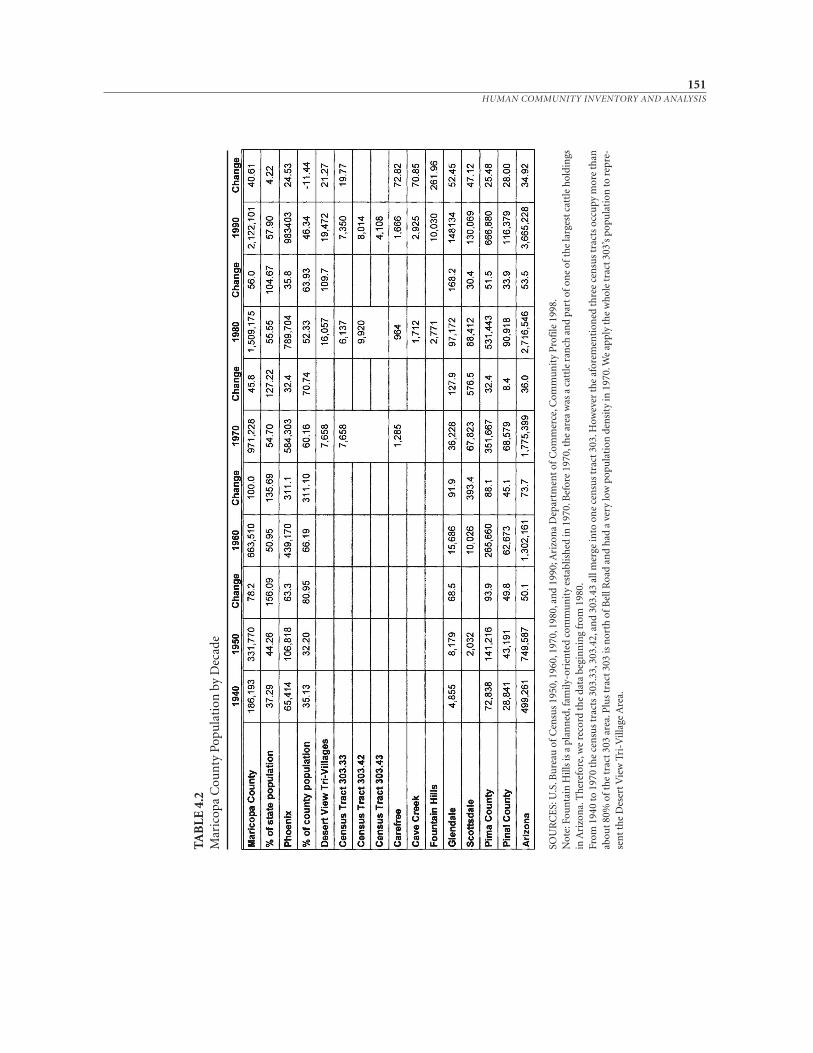
151HUMAN COMMUNITY INVENTORY AND ANALYSIS
TAB
LE 4
.2M
aric
opa
Cou
nty
Pop
ula
tion
by
Dec
ade
SOU
RC
ES:
U.S
. Bu
reau
of
Cen
sus
1950
, 196
0, 1
970,
198
0, a
nd
1990
; Ari
zon
a D
epar
tmen
t of
Com
mer
ce, C
omm
un
ity
Pro
file
199
8.N
ote:
Fou
nta
in H
ills
is a
pla
nn
ed, f
amily
-ori
ente
d co
mm
un
ity
esta
blis
hed
in 1
970.
Bef
ore
1970
, th
e ar
ea w
as a
cat
tle
ran
ch a
nd
part
of o
ne
of th
e la
rges
t cat
tle
hol
din
gsin
Ari
zon
a. T
her
efor
e, w
e re
cord
the
data
beg
inn
ing
from
198
0.Fr
om 1
940
to 1
970
the
cen
sus
trac
ts 3
03.3
3, 3
03.4
2, a
nd
303.
43 a
ll m
erge
into
on
e ce
nsu
s tr
act 3
03. H
owev
er th
e af
orem
enti
oned
thre
e ce
nsu
s tr
acts
occ
upy
mor
e th
anab
out 8
0% o
f th
e tr
act 3
03 a
rea.
Plu
s tr
act 3
03 is
nor
th o
f Bel
l Roa
d an
d h
ad a
ver
y lo
w p
opu
lati
on d
ensi
ty in
197
0. W
e ap
ply
the
wh
ole
trac
t 303
’s p
opu
lati
on to
rep
re-
sen
t th
e D
eser
t Vie
w T
ri-V
illag
e A
rea.
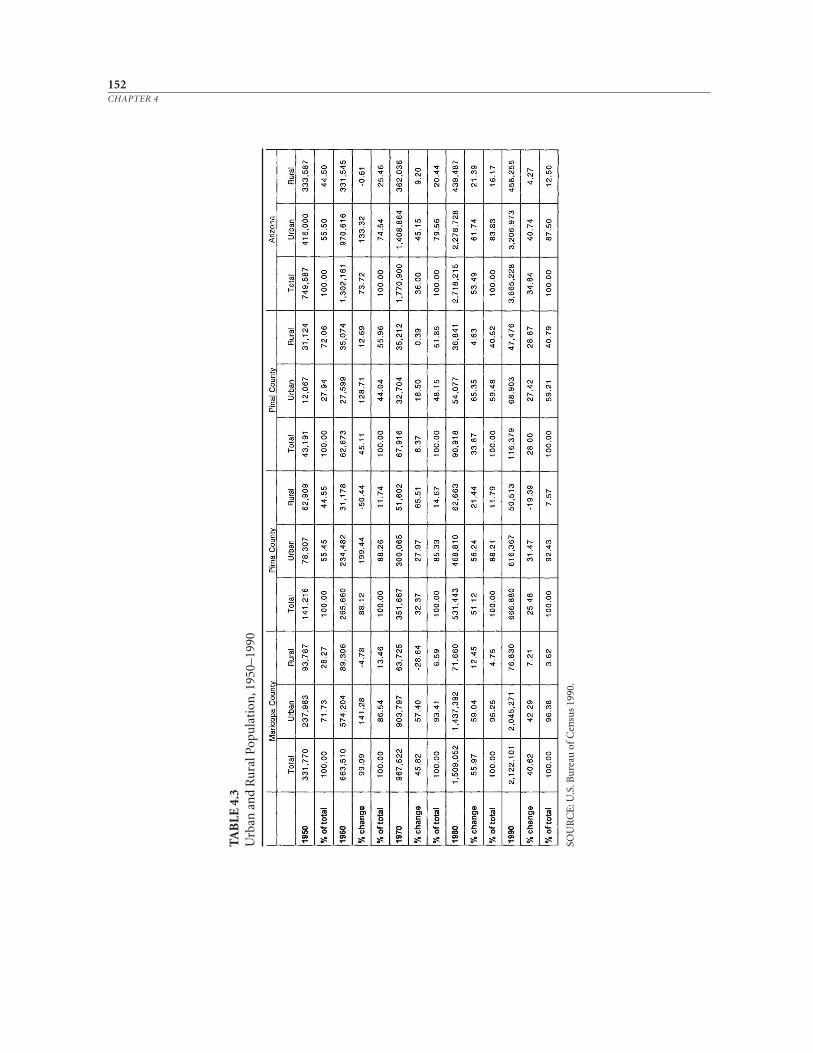
152CHAPTER 4
TAB
LE 4
.3U
rban
an
d R
ura
l Pop
ula
tion
, 195
0–19
90
SOU
RC
E: U
.S. B
ure
au o
f C
ensu
s 19
90.
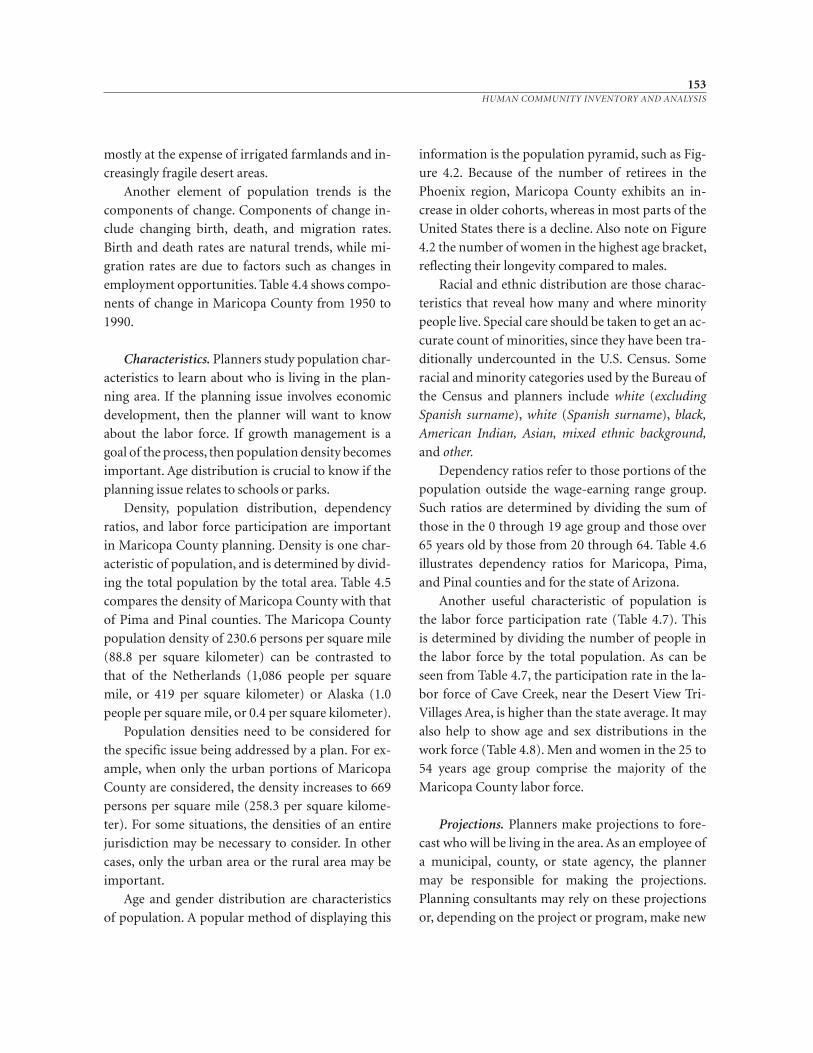
153HUMAN COMMUNITY INVENTORY AND ANALYSIS
mostly at the expense of irrigated farmlands and in-
creasingly fragile desert areas.
Another element of population trends is the
components of change. Components of change in-
clude changing birth, death, and migration rates.
Birth and death rates are natural trends, while mi-
gration rates are due to factors such as changes in
employment opportunities. Table 4.4 shows compo-
nents of change in Maricopa County from 1950 to
1990.
Characteristics. Planners study population char-
acteristics to learn about who is living in the plan-
ning area. If the planning issue involves economic
development, then the planner will want to know
about the labor force. If growth management is a
goal of the process, then population density becomes
important. Age distribution is crucial to know if the
planning issue relates to schools or parks.
Density, population distribution, dependency
ratios, and labor force participation are important
in Maricopa County planning. Density is one char-
acteristic of population, and is determined by divid-
ing the total population by the total area. Table 4.5
compares the density of Maricopa County with that
of Pima and Pinal counties. The Maricopa County
population density of 230.6 persons per square mile
(88.8 per square kilometer) can be contrasted to
that of the Netherlands (1,086 people per square
mile, or 419 per square kilometer) or Alaska (1.0
people per square mile, or 0.4 per square kilometer).
Population densities need to be considered for
the specific issue being addressed by a plan. For ex-
ample, when only the urban portions of Maricopa
County are considered, the density increases to 669
persons per square mile (258.3 per square kilome-
ter). For some situations, the densities of an entire
jurisdiction may be necessary to consider. In other
cases, only the urban area or the rural area may be
important.
Age and gender distribution are characteristics
of population. A popular method of displaying this
information is the population pyramid, such as Fig-
ure 4.2. Because of the number of retirees in the
Phoenix region, Maricopa County exhibits an in-
crease in older cohorts, whereas in most parts of the
United States there is a decline. Also note on Figure
4.2 the number of women in the highest age bracket,
reflecting their longevity compared to males.
Racial and ethnic distribution are those charac-
teristics that reveal how many and where minority
people live. Special care should be taken to get an ac-
curate count of minorities, since they have been tra-
ditionally undercounted in the U.S. Census. Some
racial and minority categories used by the Bureau of
the Census and planners include white (excluding
Spanish surname), white (Spanish surname), black,
American Indian, Asian, mixed ethnic background,
and other.
Dependency ratios refer to those portions of the
population outside the wage-earning range group.
Such ratios are determined by dividing the sum of
those in the 0 through 19 age group and those over
65 years old by those from 20 through 64. Table 4.6
illustrates dependency ratios for Maricopa, Pima,
and Pinal counties and for the state of Arizona.
Another useful characteristic of population is
the labor force participation rate (Table 4.7). This
is determined by dividing the number of people in
the labor force by the total population. As can be
seen from Table 4.7, the participation rate in the la-
bor force of Cave Creek, near the Desert View Tri-
Villages Area, is higher than the state average. It may
also help to show age and sex distributions in the
work force (Table 4.8). Men and women in the 25 to
54 years age group comprise the majority of the
Maricopa County labor force.
Projections. Planners make projections to fore-
cast who will be living in the area. As an employee of
a municipal, county, or state agency, the planner
may be responsible for making the projections.
Planning consultants may rely on these projections
or, depending on the project or program, make new
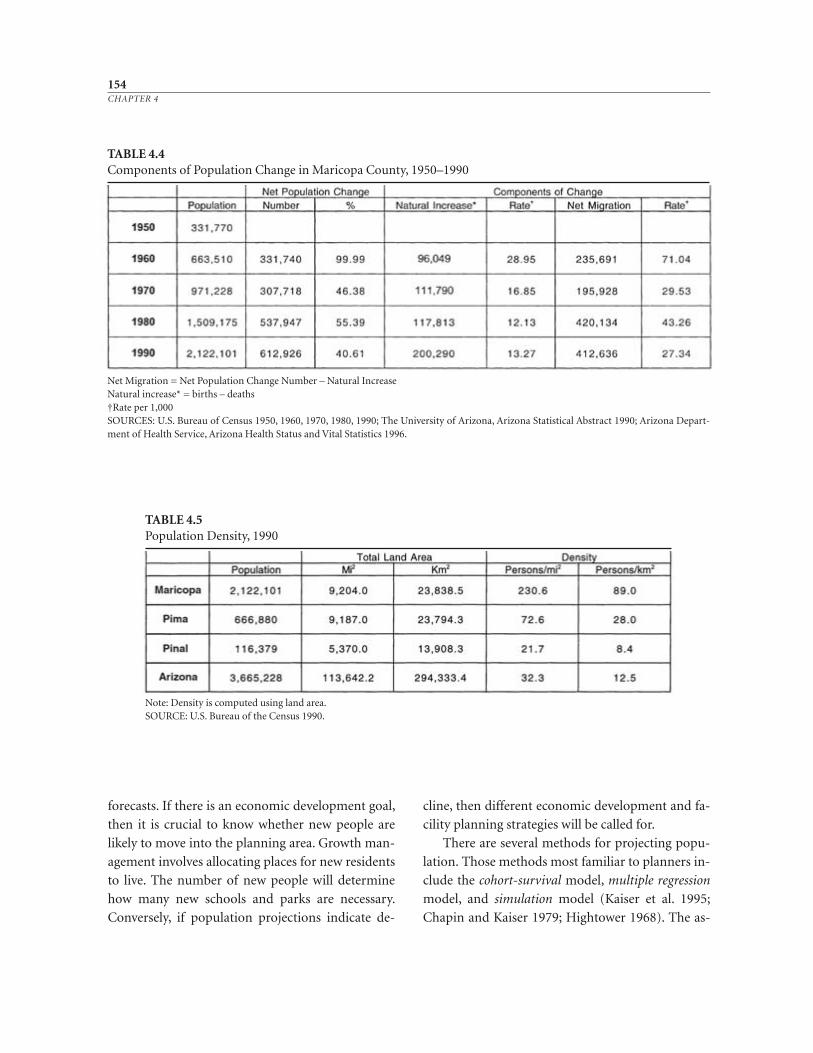
forecasts. If there is an economic development goal,
then it is crucial to know whether new people are
likely to move into the planning area. Growth man-
agement involves allocating places for new residents
to live. The number of new people will determine
how many new schools and parks are necessary.
Conversely, if population projections indicate de-
cline, then different economic development and fa-
cility planning strategies will be called for.
There are several methods for projecting popu-
lation. Those methods most familiar to planners in-
clude the cohort-survival model, multiple regression
model, and simulation model (Kaiser et al. 1995;
Chapin and Kaiser 1979; Hightower 1968). The as-
154CHAPTER 4
TABLE 4.5Population Density, 1990
Note: Density is computed using land area.SOURCE: U.S. Bureau of the Census 1990.
TABLE 4.4Components of Population Change in Maricopa County, 1950–1990
Net Migration = Net Population Change Number – Natural IncreaseNatural increase* = births – deaths†Rate per 1,000SOURCES: U.S. Bureau of Census 1950, 1960, 1970, 1980, 1990; The University of Arizona, Arizona Statistical Abstract 1990; Arizona Depart-ment of Health Service, Arizona Health Status and Vital Statistics 1996.
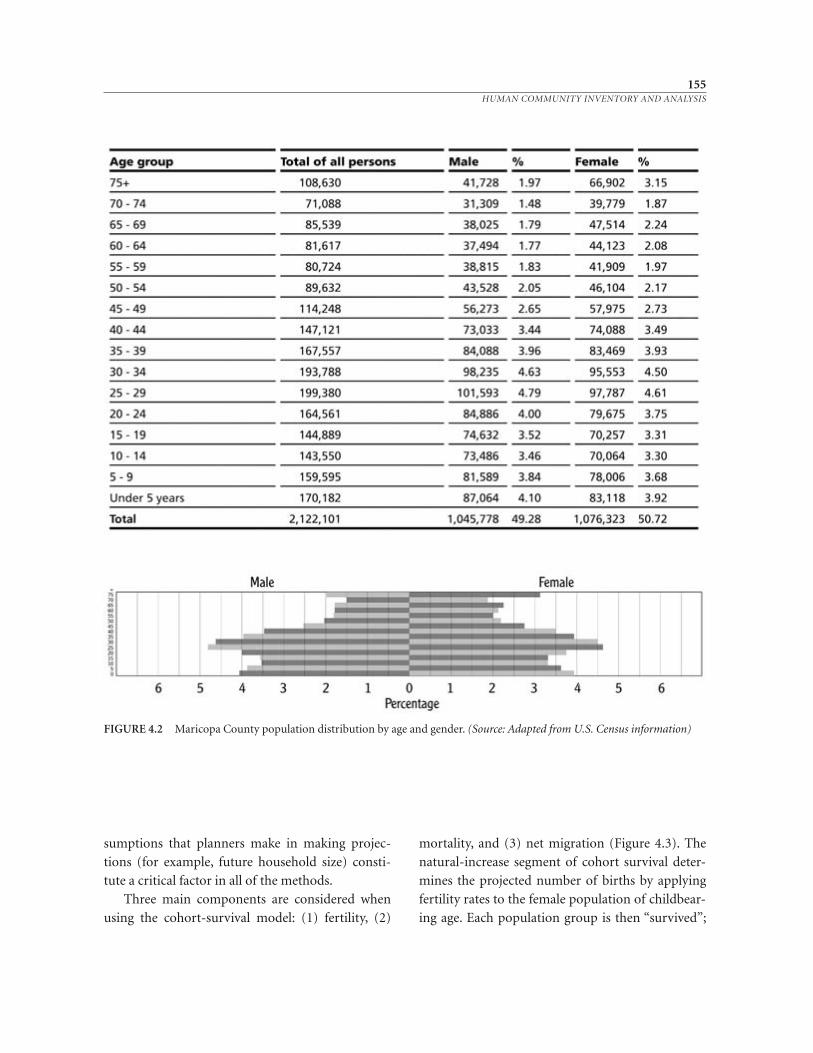
FIGURE 4.2 Maricopa County population distribution by age and gender. (Source: Adapted from U.S. Census information)
155HUMAN COMMUNITY INVENTORY AND ANALYSIS
sumptions that planners make in making projec-
tions (for example, future household size) consti-
tute a critical factor in all of the methods.
Three main components are considered when
using the cohort-survival model: (1) fertility, (2)
mortality, and (3) net migration (Figure 4.3). The
natural-increase segment of cohort survival deter-
mines the projected number of births by applying
fertility rates to the female population of childbear-
ing age. Each population group is then “survived”;
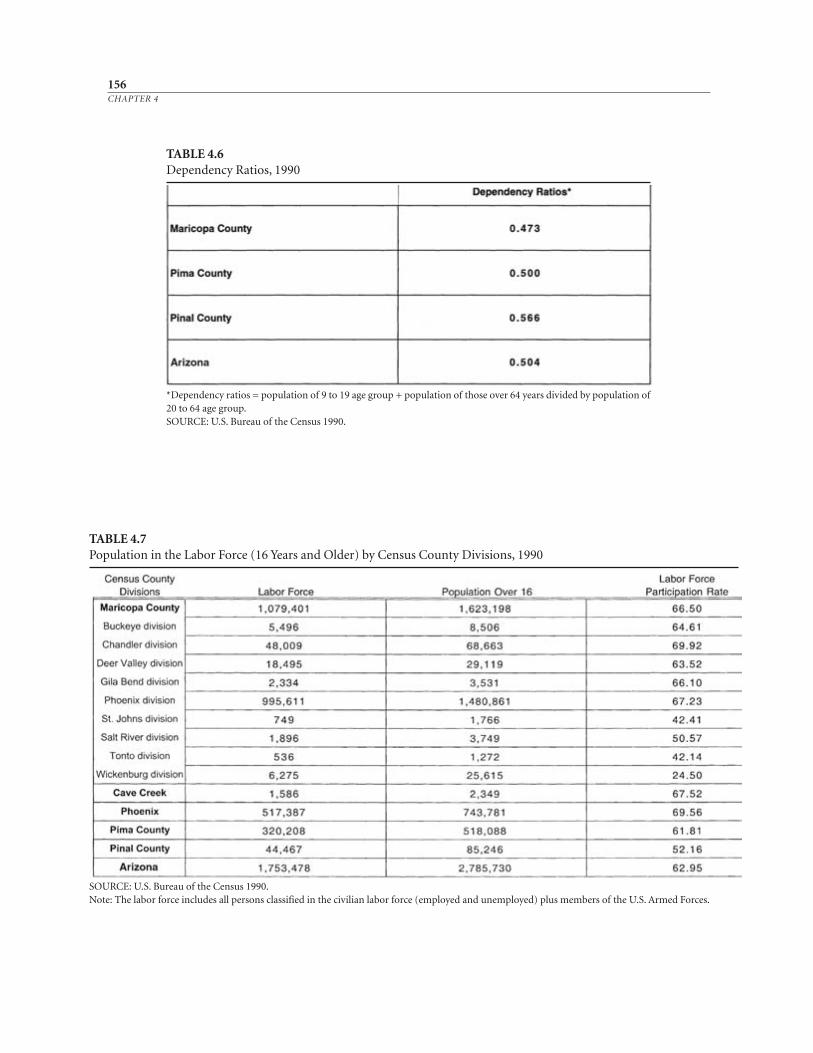
156CHAPTER 4
TABLE 4.7Population in the Labor Force (16 Years and Older) by Census County Divisions, 1990
SOURCE: U.S. Bureau of the Census 1990.Note: The labor force includes all persons classified in the civilian labor force (employed and unemployed) plus members of the U.S. Armed Forces.
TABLE 4.6Dependency Ratios, 1990
*Dependency ratios = population of 9 to 19 age group + population of those over 64 years divided by population of20 to 64 age group.SOURCE: U.S. Bureau of the Census 1990.
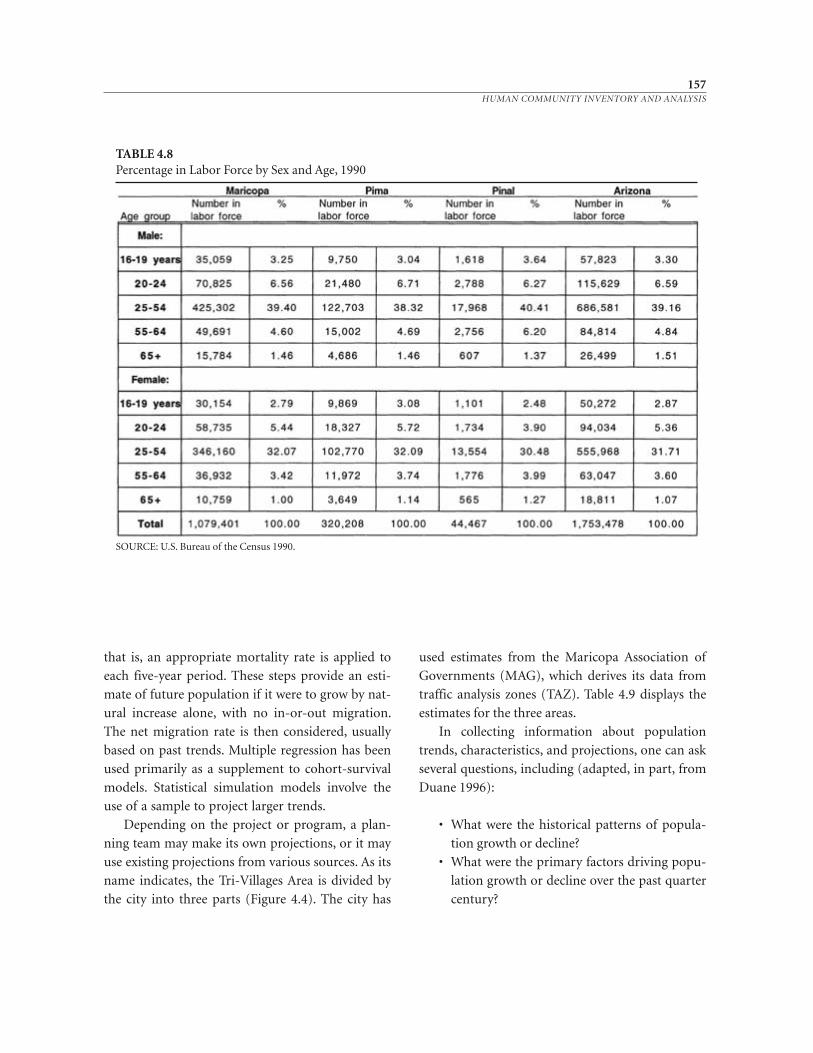
157HUMAN COMMUNITY INVENTORY AND ANALYSIS
that is, an appropriate mortality rate is applied to
each five-year period. These steps provide an esti-
mate of future population if it were to grow by nat-
ural increase alone, with no in-or-out migration.
The net migration rate is then considered, usually
based on past trends. Multiple regression has been
used primarily as a supplement to cohort-survival
models. Statistical simulation models involve the
use of a sample to project larger trends.
Depending on the project or program, a plan-
ning team may make its own projections, or it may
use existing projections from various sources. As its
name indicates, the Tri-Villages Area is divided by
the city into three parts (Figure 4.4). The city has
used estimates from the Maricopa Association of
Governments (MAG), which derives its data from
traffic analysis zones (TAZ). Table 4.9 displays the
estimates for the three areas.
In collecting information about population
trends, characteristics, and projections, one can ask
several questions, including (adapted, in part, from
Duane 1996):
• What were the historical patterns of popula-
tion growth or decline?
• What were the primary factors driving popu-
lation growth or decline over the past quarter
century?
TABLE 4.8Percentage in Labor Force by Sex and Age, 1990
SOURCE: U.S. Bureau of the Census 1990.
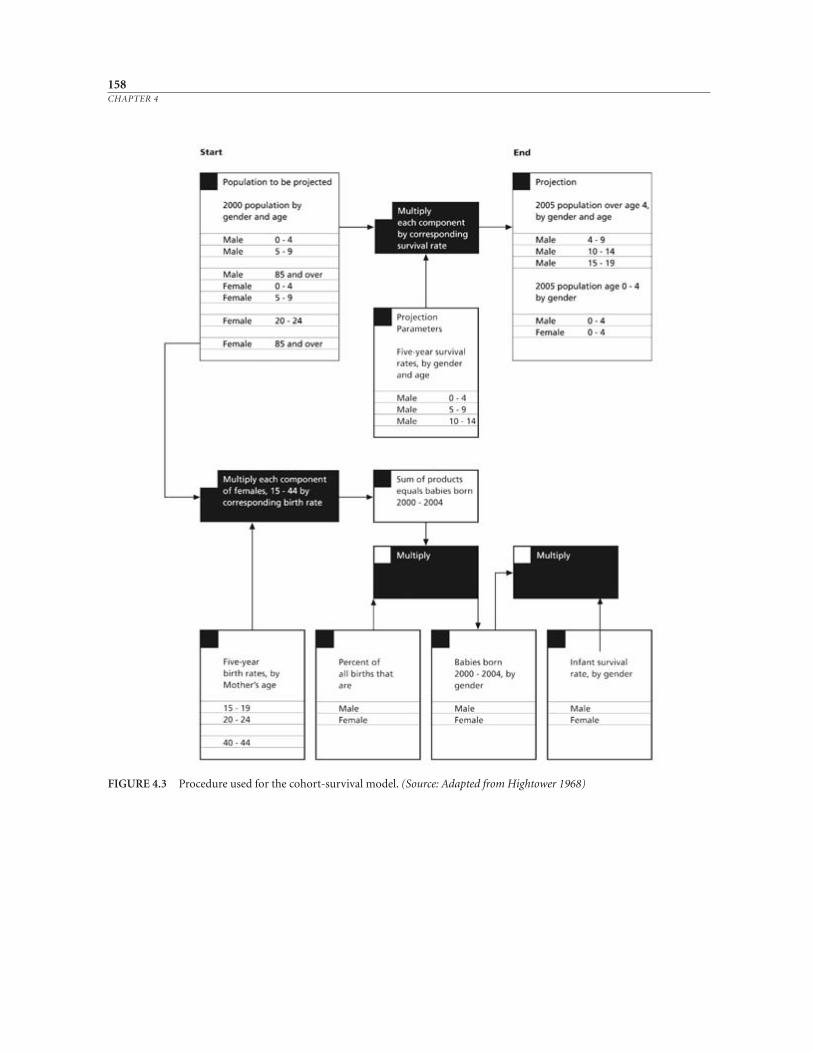
158CHAPTER 4
FIGURE 4.3 Procedure used for the cohort-survival model. (Source: Adapted from Hightower 1968)
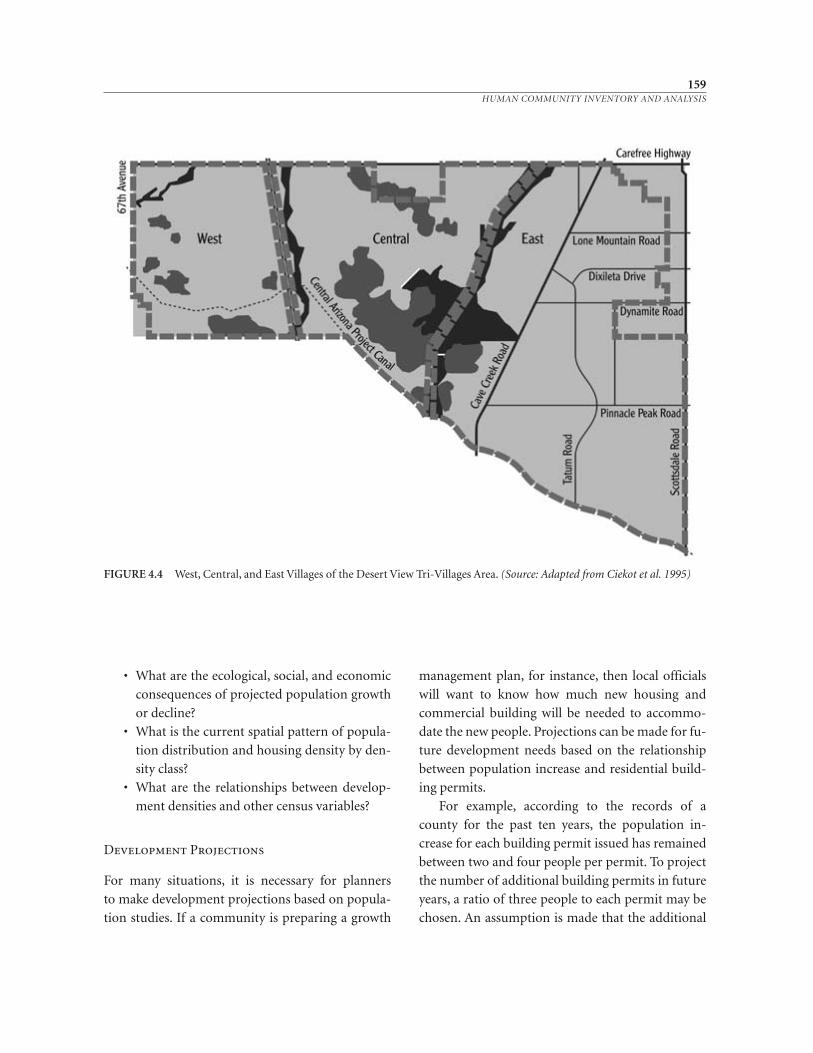
FIGURE 4.4 West, Central, and East Villages of the Desert View Tri-Villages Area. (Source: Adapted from Ciekot et al. 1995)
• What are the ecological, social, and economic
consequences of projected population growth
or decline?
• What is the current spatial pattern of popula-
tion distribution and housing density by den-
sity class?
• What are the relationships between develop-
ment densities and other census variables?
Development Projections
For many situations, it is necessary for planners
to make development projections based on popula-
tion studies. If a community is preparing a growth
management plan, for instance, then local officials
will want to know how much new housing and
commercial building will be needed to accommo-
date the new people. Projections can be made for fu-
ture development needs based on the relationship
between population increase and residential build-
ing permits.
For example, according to the records of a
county for the past ten years, the population in-
crease for each building permit issued has remained
between two and four people per permit. To project
the number of additional building permits in future
years, a ratio of three people to each permit may be
chosen. An assumption is made that the additional
159HUMAN COMMUNITY INVENTORY AND ANALYSIS
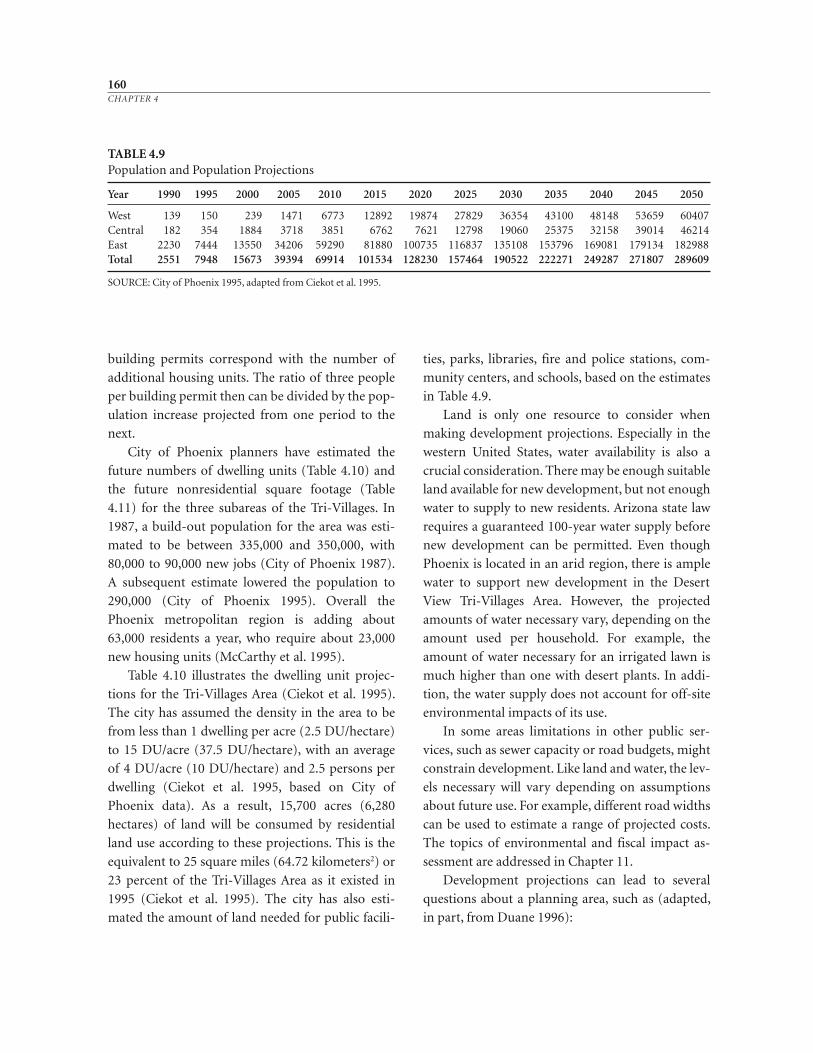
building permits correspond with the number of
additional housing units. The ratio of three people
per building permit then can be divided by the pop-
ulation increase projected from one period to the
next.
City of Phoenix planners have estimated the
future numbers of dwelling units (Table 4.10) and
the future nonresidential square footage (Table
4.11) for the three subareas of the Tri-Villages. In
1987, a build-out population for the area was esti-
mated to be between 335,000 and 350,000, with
80,000 to 90,000 new jobs (City of Phoenix 1987).
A subsequent estimate lowered the population to
290,000 (City of Phoenix 1995). Overall the
Phoenix metropolitan region is adding about
63,000 residents a year, who require about 23,000
new housing units (McCarthy et al. 1995).
Table 4.10 illustrates the dwelling unit projec-
tions for the Tri-Villages Area (Ciekot et al. 1995).
The city has assumed the density in the area to be
from less than 1 dwelling per acre (2.5 DU/hectare)
to 15 DU/acre (37.5 DU/hectare), with an average
of 4 DU/acre (10 DU/hectare) and 2.5 persons per
dwelling (Ciekot et al. 1995, based on City of
Phoenix data). As a result, 15,700 acres (6,280
hectares) of land will be consumed by residential
land use according to these projections. This is the
equivalent to 25 square miles (64.72 kilometers2) or
23 percent of the Tri-Villages Area as it existed in
1995 (Ciekot et al. 1995). The city has also esti-
mated the amount of land needed for public facili-
ties, parks, libraries, fire and police stations, com-
munity centers, and schools, based on the estimates
in Table 4.9.
Land is only one resource to consider when
making development projections. Especially in the
western United States, water availability is also a
crucial consideration. There may be enough suitable
land available for new development, but not enough
water to supply to new residents. Arizona state law
requires a guaranteed 100-year water supply before
new development can be permitted. Even though
Phoenix is located in an arid region, there is ample
water to support new development in the Desert
View Tri-Villages Area. However, the projected
amounts of water necessary vary, depending on the
amount used per household. For example, the
amount of water necessary for an irrigated lawn is
much higher than one with desert plants. In addi-
tion, the water supply does not account for off-site
environmental impacts of its use.
In some areas limitations in other public ser-
vices, such as sewer capacity or road budgets, might
constrain development. Like land and water, the lev-
els necessary will vary depending on assumptions
about future use. For example, different road widths
can be used to estimate a range of projected costs.
The topics of environmental and fiscal impact as-
sessment are addressed in Chapter 11.
Development projections can lead to several
questions about a planning area, such as (adapted,
in part, from Duane 1996):
160CHAPTER 4
TABLE 4.9Population and Population Projections
Year 1990 1995 2000 2005 2010 2015 2020 2025 2030 2035 2040 2045 2050
West 139 150 239 1471 6773 12892 19874 27829 36354 43100 48148 53659 60407Central 182 354 1884 3718 3851 6762 7621 12798 19060 25375 32158 39014 46214East 2230 7444 13550 34206 59290 81880 100735 116837 135108 153796 169081 179134 182988Total 2551 7948 15673 39394 69914 101534 128230 157464 190522 222271 249287 271807 289609
SOURCE: City of Phoenix 1995, adapted from Ciekot et al. 1995.
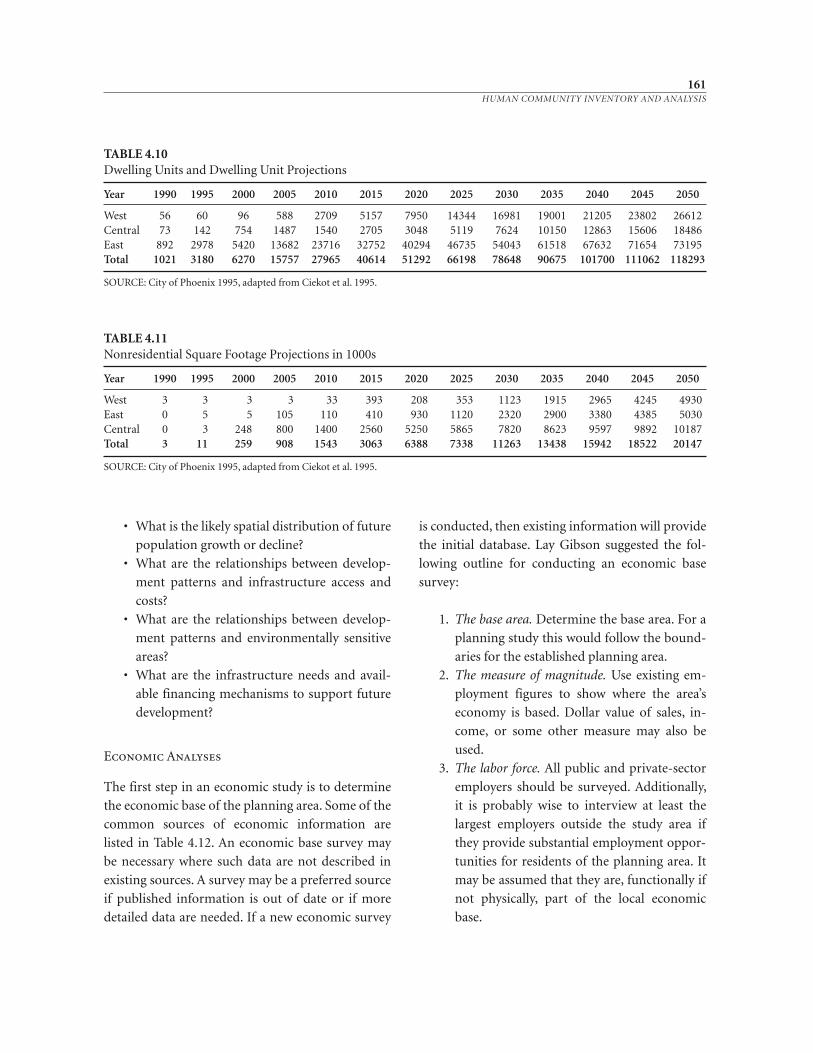
• What is the likely spatial distribution of future
population growth or decline?
• What are the relationships between develop-
ment patterns and infrastructure access and
costs?
• What are the relationships between develop-
ment patterns and environmentally sensitive
areas?
• What are the infrastructure needs and avail-
able financing mechanisms to support future
development?
Economic Analyses
The first step in an economic study is to determine
the economic base of the planning area. Some of the
common sources of economic information are
listed in Table 4.12. An economic base survey may
be necessary where such data are not described in
existing sources. A survey may be a preferred source
if published information is out of date or if more
detailed data are needed. If a new economic survey
is conducted, then existing information will provide
the initial database. Lay Gibson suggested the fol-
lowing outline for conducting an economic base
survey:
1. The base area. Determine the base area. For a
planning study this would follow the bound-
aries for the established planning area.
2. The measure of magnitude. Use existing em-
ployment figures to show where the area’s
economy is based. Dollar value of sales, in-
come, or some other measure may also be
used.
3. The labor force. All public and private-sector
employers should be surveyed. Additionally,
it is probably wise to interview at least the
largest employers outside the study area if
they provide substantial employment oppor-
tunities for residents of the planning area. It
may be assumed that they are, functionally if
not physically, part of the local economic
base.
161HUMAN COMMUNITY INVENTORY AND ANALYSIS
TABLE 4.11Nonresidential Square Footage Projections in 1000s
Year 1990 1995 2000 2005 2010 2015 2020 2025 2030 2035 2040 2045 2050
West 3 3 3 3 33 393 208 353 1123 1915 2965 4245 4930East 0 5 5 105 110 410 930 1120 2320 2900 3380 4385 5030Central 0 3 248 800 1400 2560 5250 5865 7820 8623 9597 9892 10187Total 3 11 259 908 1543 3063 6388 7338 11263 13438 15942 18522 20147
SOURCE: City of Phoenix 1995, adapted from Ciekot et al. 1995.
TABLE 4.10Dwelling Units and Dwelling Unit Projections
Year 1990 1995 2000 2005 2010 2015 2020 2025 2030 2035 2040 2045 2050
West 56 60 96 588 2709 5157 7950 14344 16981 19001 21205 23802 26612Central 73 142 754 1487 1540 2705 3048 5119 7624 10150 12863 15606 18486East 892 2978 5420 13682 23716 32752 40294 46735 54043 61518 67632 71654 73195Total 1021 3180 6270 15757 27965 40614 51292 66198 78648 90675 101700 111062 118293
SOURCE: City of Phoenix 1995, adapted from Ciekot et al. 1995.
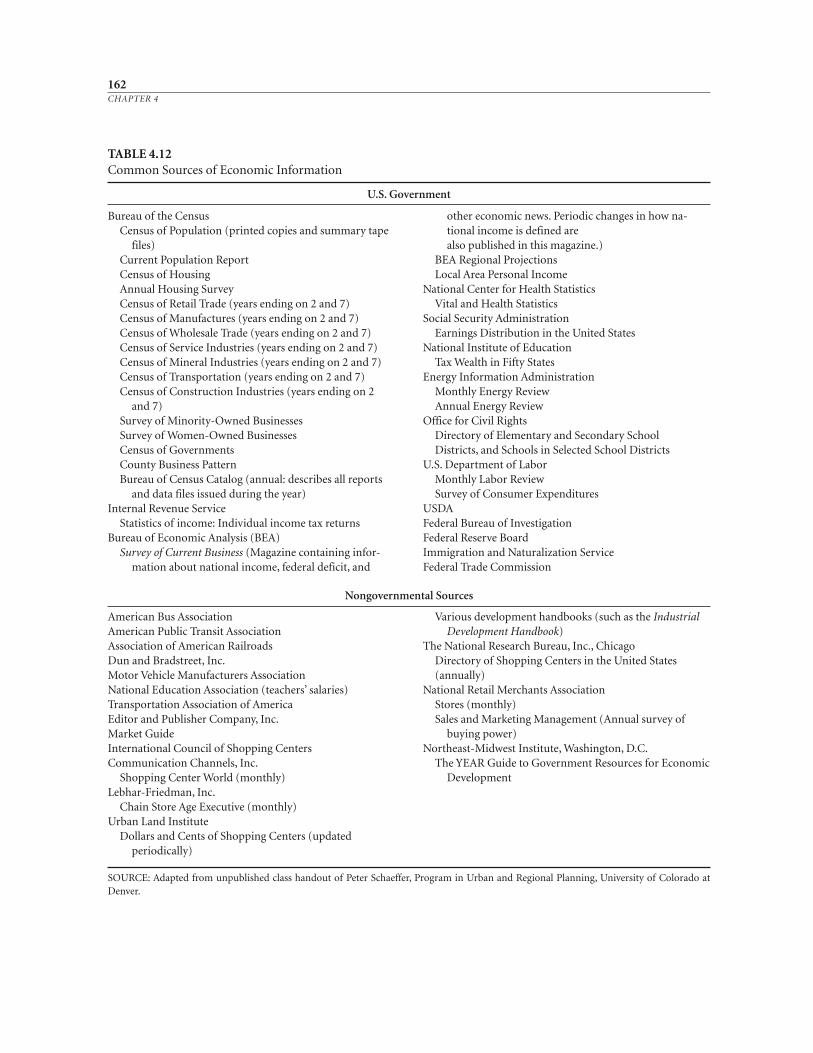
162CHAPTER 4
TABLE 4.12Common Sources of Economic Information
U.S. Government
Bureau of the CensusCensus of Population (printed copies and summary tape
files)Current Population ReportCensus of HousingAnnual Housing SurveyCensus of Retail Trade (years ending on 2 and 7)Census of Manufactures (years ending on 2 and 7)Census of Wholesale Trade (years ending on 2 and 7)Census of Service Industries (years ending on 2 and 7)Census of Mineral Industries (years ending on 2 and 7)Census of Transportation (years ending on 2 and 7)Census of Construction Industries (years ending on 2
and 7)Survey of Minority-Owned BusinessesSurvey of Women-Owned BusinessesCensus of GovernmentsCounty Business PatternBureau of Census Catalog (annual: describes all reports
and data files issued during the year)Internal Revenue Service
Statistics of income: Individual income tax returnsBureau of Economic Analysis (BEA)
Survey of Current Business (Magazine containing infor-mation about national income, federal deficit, and
other economic news. Periodic changes in how na-tional income is defined are also published in this magazine.)
BEA Regional ProjectionsLocal Area Personal Income
National Center for Health StatisticsVital and Health Statistics
Social Security AdministrationEarnings Distribution in the United States
National Institute of EducationTax Wealth in Fifty States
Energy Information AdministrationMonthly Energy ReviewAnnual Energy Review
Office for Civil RightsDirectory of Elementary and Secondary SchoolDistricts, and Schools in Selected School Districts
U.S. Department of LaborMonthly Labor ReviewSurvey of Consumer Expenditures
USDAFederal Bureau of InvestigationFederal Reserve BoardImmigration and Naturalization ServiceFederal Trade Commission
Nongovernmental Sources
American Bus AssociationAmerican Public Transit AssociationAssociation of American RailroadsDun and Bradstreet, Inc.Motor Vehicle Manufacturers AssociationNational Education Association (teachers’ salaries)Transportation Association of AmericaEditor and Publisher Company, Inc.Market GuideInternational Council of Shopping CentersCommunication Channels, Inc.
Shopping Center World (monthly)Lebhar-Friedman, Inc.
Chain Store Age Executive (monthly)Urban Land Institute
Dollars and Cents of Shopping Centers (updated periodically)
Various development handbooks (such as the Industrial Development Handbook)
The National Research Bureau, Inc., ChicagoDirectory of Shopping Centers in the United States (annually)
National Retail Merchants AssociationStores (monthly)Sales and Marketing Management (Annual survey of
buying power)Northeast-Midwest Institute, Washington, D.C.
The YEAR Guide to Government Resources for Economic Development
SOURCE: Adapted from unpublished class handout of Peter Schaeffer, Program in Urban and Regional Planning, University of Colorado atDenver.
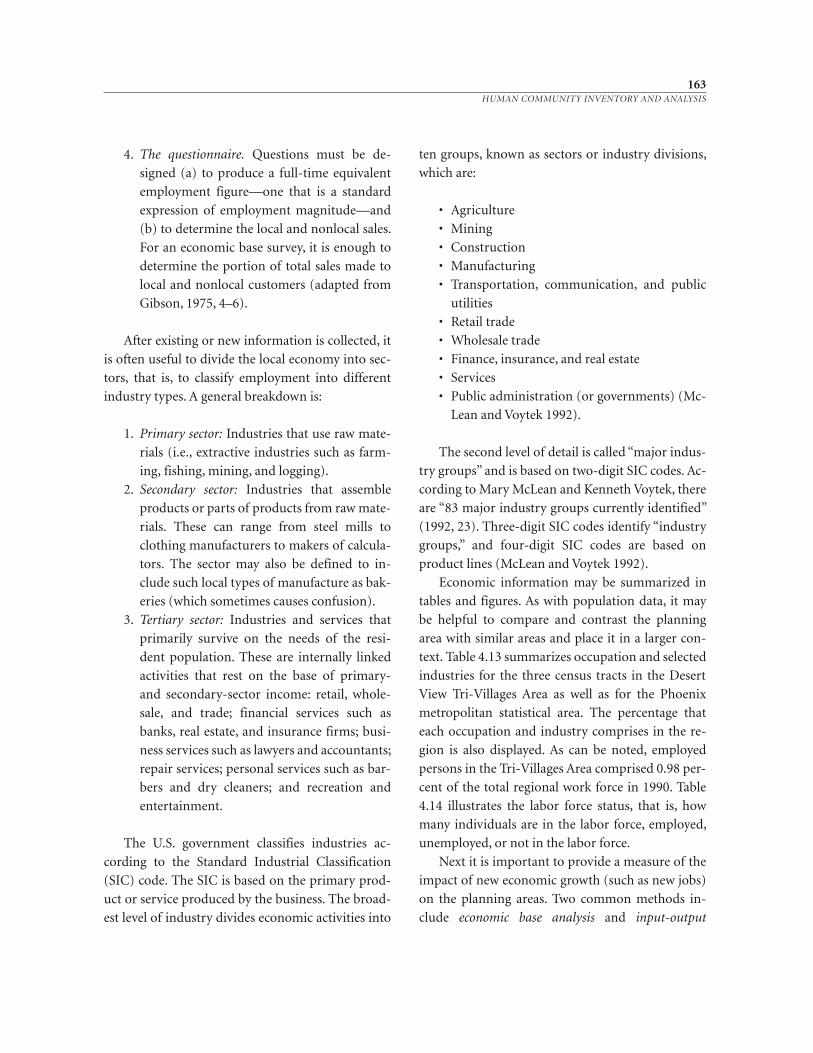
163HUMAN COMMUNITY INVENTORY AND ANALYSIS
4. The questionnaire. Questions must be de-
signed (a) to produce a full-time equivalent
employment figure—one that is a standard
expression of employment magnitude—and
(b) to determine the local and nonlocal sales.
For an economic base survey, it is enough to
determine the portion of total sales made to
local and nonlocal customers (adapted from
Gibson, 1975, 4–6).
After existing or new information is collected, it
is often useful to divide the local economy into sec-
tors, that is, to classify employment into different
industry types. A general breakdown is:
1. Primary sector: Industries that use raw mate-
rials (i.e., extractive industries such as farm-
ing, fishing, mining, and logging).
2. Secondary sector: Industries that assemble
products or parts of products from raw mate-
rials. These can range from steel mills to
clothing manufacturers to makers of calcula-
tors. The sector may also be defined to in-
clude such local types of manufacture as bak-
eries (which sometimes causes confusion).
3. Tertiary sector: Industries and services that
primarily survive on the needs of the resi-
dent population. These are internally linked
activities that rest on the base of primary-
and secondary-sector income: retail, whole-
sale, and trade; financial services such as
banks, real estate, and insurance firms; busi-
ness services such as lawyers and accountants;
repair services; personal services such as bar-
bers and dry cleaners; and recreation and
entertainment.
The U.S. government classifies industries ac-
cording to the Standard Industrial Classification
(SIC) code. The SIC is based on the primary prod-
uct or service produced by the business. The broad-
est level of industry divides economic activities into
ten groups, known as sectors or industry divisions,
which are:
• Agriculture
• Mining
• Construction
• Manufacturing
• Transportation, communication, and public
utilities
• Retail trade
• Wholesale trade
• Finance, insurance, and real estate
• Services
• Public administration (or governments) (Mc -
Lean and Voytek 1992).
The second level of detail is called “major indus-
try groups” and is based on two-digit SIC codes. Ac-
cording to Mary McLean and Kenneth Voytek, there
are “83 major industry groups currently identified”
(1992, 23). Three-digit SIC codes identify “industry
groups,” and four-digit SIC codes are based on
product lines (McLean and Voytek 1992).
Economic information may be summarized in
tables and figures. As with population data, it may
be helpful to compare and contrast the planning
area with similar areas and place it in a larger con-
text. Table 4.13 summarizes occupation and selected
industries for the three census tracts in the Desert
View Tri-Villages Area as well as for the Phoenix
metropolitan statistical area. The percentage that
each occupation and industry comprises in the re-
gion is also displayed. As can be noted, employed
persons in the Tri-Villages Area comprised 0.98 per-
cent of the total regional work force in 1990. Table
4.14 illustrates the labor force status, that is, how
many individuals are in the labor force, employed,
unemployed, or not in the labor force.
Next it is important to provide a measure of the
impact of new economic growth (such as new jobs)
on the planning areas. Two common methods in-
clude economic base analysis and input-output
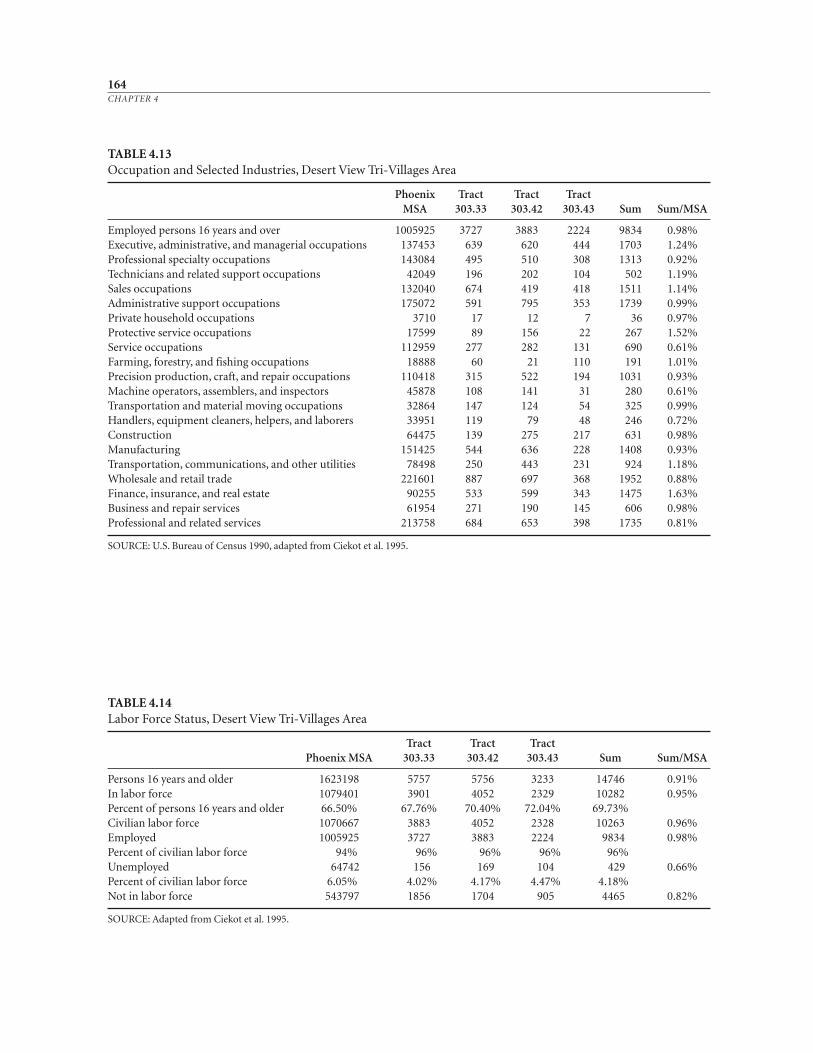
164CHAPTER 4
TABLE 4.14Labor Force Status, Desert View Tri-Villages Area
Tract Tract TractPhoenix MSA 303.33 303.42 303.43 Sum Sum/MSA
Persons 16 years and older 1623198 5757 5756 3233 14746 0.91%In labor force 1079401 3901 4052 2329 10282 0.95%Percent of persons 16 years and older 66.50% 67.76% 70.40% 72.04% 69.73%Civilian labor force 1070667 3883 4052 2328 10263 0.96%Employed 1005925 3727 3883 2224 9834 0.98%Percent of civilian labor force 94% 96% 96% 96% 96%Unemployed 64742 156 169 104 429 0.66%Percent of civilian labor force 6.05% 4.02% 4.17% 4.47% 4.18%Not in labor force 543797 1856 1704 905 4465 0.82%
SOURCE: Adapted from Ciekot et al. 1995.
TABLE 4.13Occupation and Selected Industries, Desert View Tri-Villages Area
Phoenix Tract Tract TractMSA 303.33 303.42 303.43 Sum Sum/MSA
Employed persons 16 years and over 1005925 3727 3883 2224 9834 0.98%Executive, administrative, and managerial occupations 137453 639 620 444 1703 1.24%Professional specialty occupations 143084 495 510 308 1313 0.92%Technicians and related support occupations 42049 196 202 104 502 1.19%Sales occupations 132040 674 419 418 1511 1.14%Administrative support occupations 175072 591 795 353 1739 0.99%Private household occupations 3710 17 12 7 36 0.97%Protective service occupations 17599 89 156 22 267 1.52%Service occupations 112959 277 282 131 690 0.61%Farming, forestry, and fishing occupations 18888 60 21 110 191 1.01%Precision production, craft, and repair occupations 110418 315 522 194 1031 0.93%Machine operators, assemblers, and inspectors 45878 108 141 31 280 0.61%Transportation and material moving occupations 32864 147 124 54 325 0.99%Handlers, equipment cleaners, helpers, and laborers 33951 119 79 48 246 0.72%Construction 64475 139 275 217 631 0.98%Manufacturing 151425 544 636 228 1408 0.93%Transportation, communications, and other utilities 78498 250 443 231 924 1.18%Wholesale and retail trade 221601 887 697 368 1952 0.88%Finance, insurance, and real estate 90255 533 599 343 1475 1.63%Business and repair services 61954 271 190 145 606 0.98%Professional and related services 213758 684 653 398 1735 0.81%
SOURCE: U.S. Bureau of Census 1990, adapted from Ciekot et al. 1995.
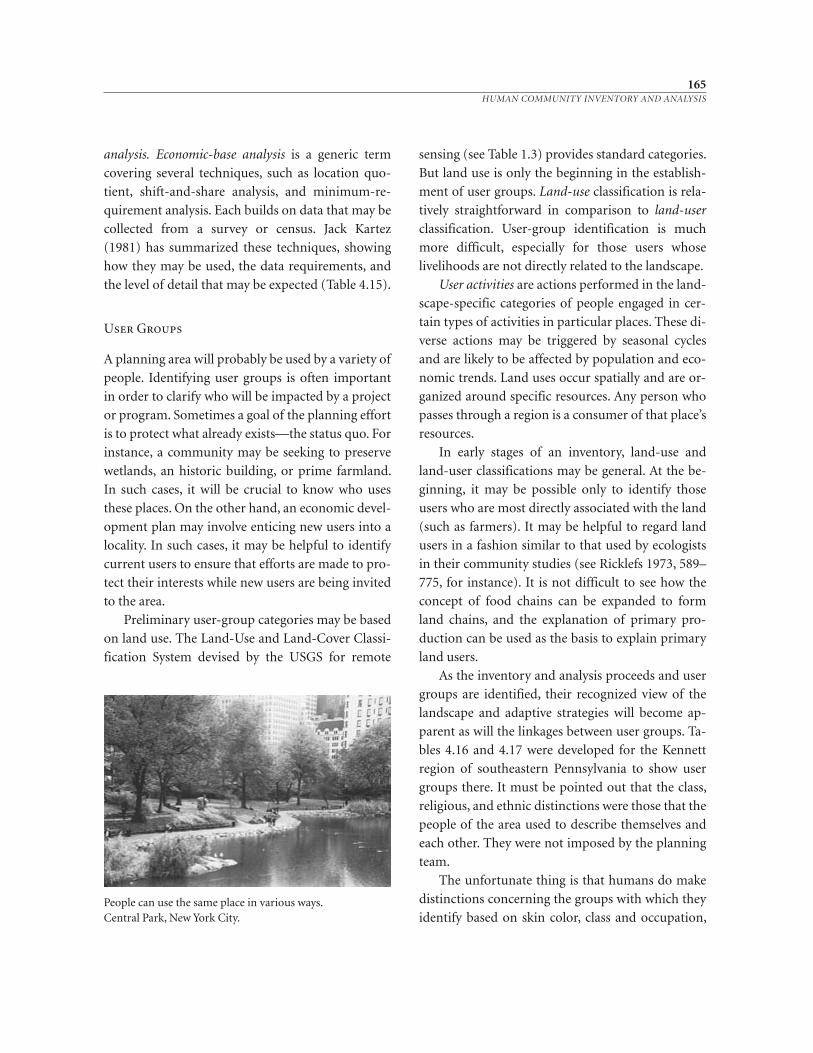
165HUMAN COMMUNITY INVENTORY AND ANALYSIS
analysis. Economic-base analysis is a generic term
covering several techniques, such as location quo-
tient, shift-and-share analysis, and minimum-re-
quirement analysis. Each builds on data that may be
collected from a survey or census. Jack Kartez
(1981) has summarized these techniques, showing
how they may be used, the data requirements, and
the level of detail that may be expected (Table 4.15).
User Groups
A planning area will probably be used by a variety of
people. Identifying user groups is often important
in order to clarify who will be impacted by a project
or program. Sometimes a goal of the planning effort
is to protect what already exists—the status quo. For
instance, a community may be seeking to preserve
wetlands, an historic building, or prime farmland.
In such cases, it will be crucial to know who uses
these places. On the other hand, an economic devel-
opment plan may involve enticing new users into a
locality. In such cases, it may be helpful to identify
current users to ensure that efforts are made to pro-
tect their interests while new users are being invited
to the area.
Preliminary user-group categories may be based
on land use. The Land-Use and Land-Cover Classi-
fication System devised by the USGS for remote
sensing (see Table 1.3) provides standard categories.
But land use is only the beginning in the establish-
ment of user groups. Land-use classification is rela-
tively straightforward in comparison to land-user
classification. User-group identification is much
more difficult, especially for those users whose
livelihoods are not directly related to the landscape.
User activities are actions performed in the land-
scape-specific categories of people engaged in cer-
tain types of activities in particular places. These di-
verse actions may be triggered by seasonal cycles
and are likely to be affected by population and eco-
nomic trends. Land uses occur spatially and are or-
ganized around specific resources. Any person who
passes through a region is a consumer of that place’s
resources.
In early stages of an inventory, land-use and
land-user classifications may be general. At the be-
ginning, it may be possible only to identify those
users who are most directly associated with the land
(such as farmers). It may be helpful to regard land
users in a fashion similar to that used by ecologists
in their community studies (see Ricklefs 1973, 589–
775, for instance). It is not difficult to see how the
concept of food chains can be expanded to form
land chains, and the explanation of primary pro-
duction can be used as the basis to explain primary
land users.
As the inventory and analysis proceeds and user
groups are identified, their recognized view of the
landscape and adaptive strategies will become ap-
parent as will the linkages between user groups. Ta-
bles 4.16 and 4.17 were developed for the Kennett
region of southeastern Pennsylvania to show user
groups there. It must be pointed out that the class,
religious, and ethnic distinctions were those that the
people of the area used to describe themselves and
each other. They were not imposed by the planning
team.
The unfortunate thing is that humans do make
distinctions concerning the groups with which they
identify based on skin color, class and occupation,People can use the same place in various ways. Central Park, New York City.
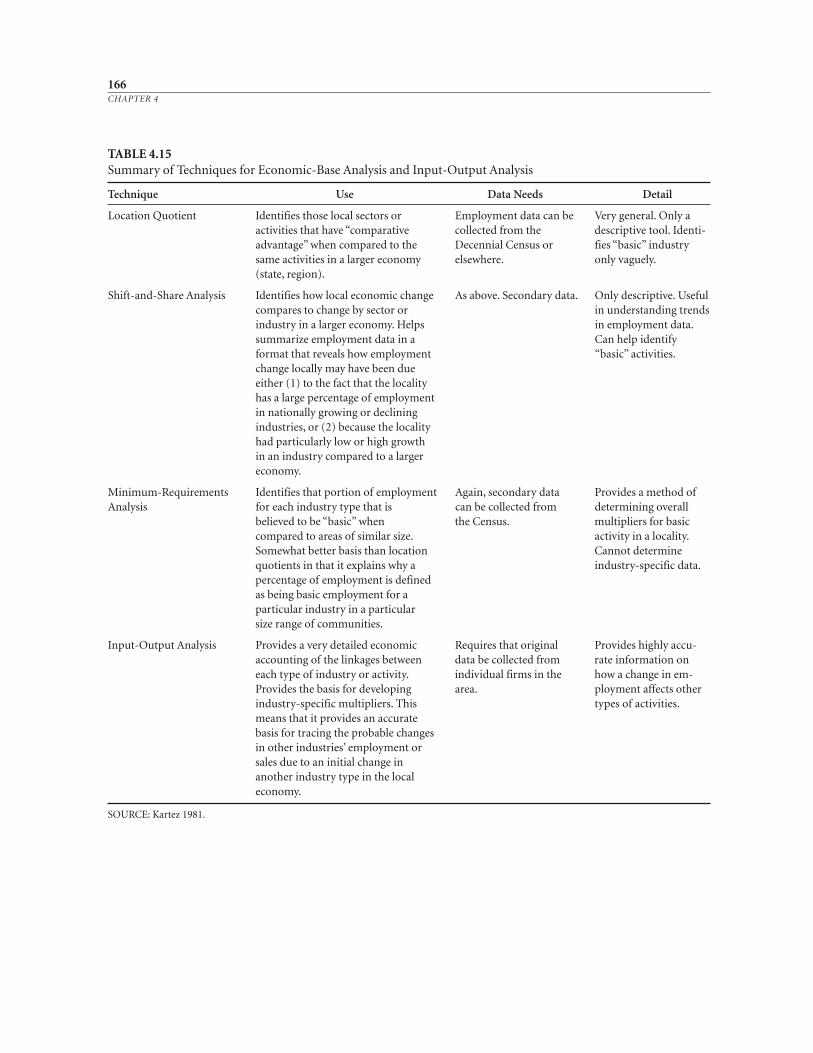
166CHAPTER 4
TABLE 4.15Summary of Techniques for Economic-Base Analysis and Input-Output Analysis
Technique Use Data Needs Detail
Location Quotient Identifies those local sectors or Employment data can be Very general. Only aactivities that have “comparative collected from the descriptive tool. Identi-advantage” when compared to the Decennial Census or fies “basic” industry same activities in a larger economy elsewhere. only vaguely.(state, region).
Shift-and-Share Analysis Identifies how local economic change As above. Secondary data. Only descriptive. Useful compares to change by sector or in understanding trends industry in a larger economy. Helps in employment data. summarize employment data in a Can help identify format that reveals how employment “basic” activities.change locally may have been due either (1) to the fact that the locality has a large percentage of employment in nationally growing or decliningindustries, or (2) because the localityhad particularly low or high growthin an industry compared to a largereconomy.
Minimum-Requirements Identifies that portion of employment Again, secondary data Provides a method ofAnalysis for each industry type that is can be collected from determining overall
believed to be “basic” when the Census. multipliers for basiccompared to areas of similar size. activity in a locality.Somewhat better basis than location Cannot determinequotients in that it explains why a industry-specific data.percentage of employment is definedas being basic employment for aparticular industry in a particular size range of communities.
Input-Output Analysis Provides a very detailed economic Requires that original Provides highly accu-accounting of the linkages between data be collected from rate information on each type of industry or activity. individual firms in the how a change in em-Provides the basis for developing area. ployment affects other industry-specific multipliers. This types of activities.means that it provides an accuratebasis for tracing the probable changesin other industries’ employment orsales due to an initial change inanother industry type in the localeconomy.
SOURCE: Kartez 1981.
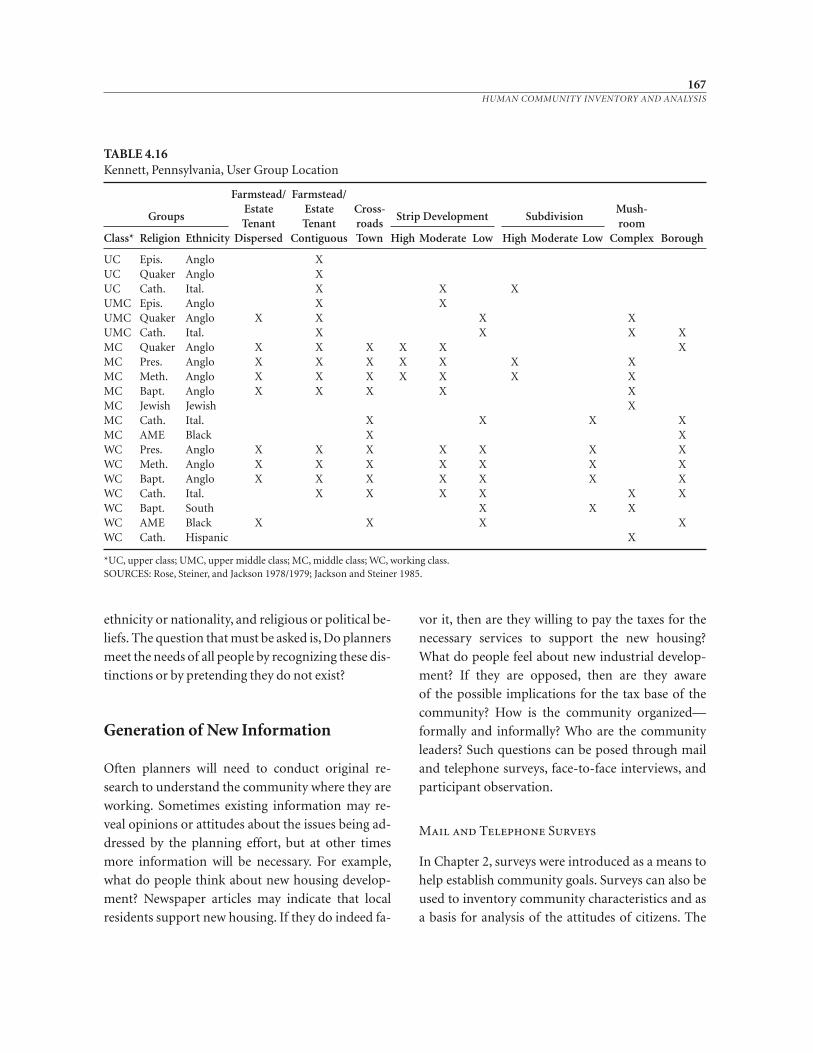
ethnicity or nationality, and religious or political be-
liefs. The question that must be asked is, Do planners
meet the needs of all people by recognizing these dis-
tinctions or by pretending they do not exist?
Generation of New Information
Often planners will need to conduct original re-
search to understand the community where they are
working. Sometimes existing information may re-
veal opinions or attitudes about the issues being ad-
dressed by the planning effort, but at other times
more information will be necessary. For example,
what do people think about new housing develop-
ment? Newspaper articles may indicate that local
residents support new housing. If they do indeed fa-
vor it, then are they willing to pay the taxes for the
necessary services to support the new housing?
What do people feel about new industrial develop-
ment? If they are opposed, then are they aware
of the possible implications for the tax base of the
community? How is the community organized—
formally and informally? Who are the community
leaders? Such questions can be posed through mail
and telephone surveys, face-to-face interviews, and
participant observation.
Mail and Telephone Surveys
In Chapter 2, surveys were introduced as a means to
help establish community goals. Surveys can also be
used to inventory community characteristics and as
a basis for analysis of the attitudes of citizens. The
167HUMAN COMMUNITY INVENTORY AND ANALYSIS
TABLE 4.16Kennett, Pennsylvania, User Group Location
Farmstead/ Farmstead/
GroupsEstate Estate Cross-
Strip Development SubdivisionMush-
Tenant Tenant roads roomClass* Religion Ethnicity Dispersed Contiguous Town High Moderate Low High Moderate Low Complex Borough
UC Epis. Anglo XUC Quaker Anglo XUC Cath. Ital. X X XUMC Epis. Anglo X XUMC Quaker Anglo X X X XUMC Cath. Ital. X X X XMC Quaker Anglo X X X X X XMC Pres. Anglo X X X X X X XMC Meth. Anglo X X X X X X XMC Bapt. Anglo X X X X XMC Jewish Jewish XMC Cath. Ital. X X X XMC AME Black X XWC Pres. Anglo X X X X X X XWC Meth. Anglo X X X X X X XWC Bapt. Anglo X X X X X X XWC Cath. Ital. X X X X X XWC Bapt. South X X XWC AME Black X X X XWC Cath. Hispanic X
*UC, upper class; UMC, upper middle class; MC, middle class; WC, working class.SOURCES: Rose, Steiner, and Jackson 1978/1979; Jackson and Steiner 1985.
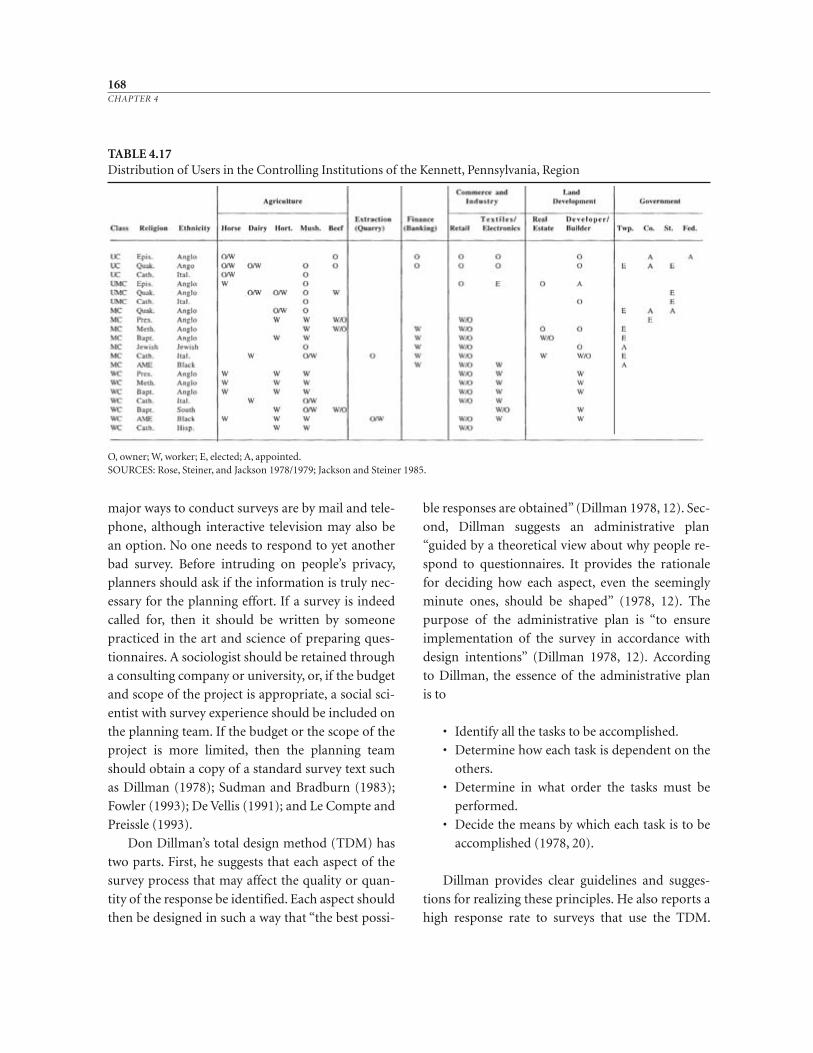
major ways to conduct surveys are by mail and tele-
phone, although interactive television may also be
an option. No one needs to respond to yet another
bad survey. Before intruding on people’s privacy,
planners should ask if the information is truly nec-
essary for the planning effort. If a survey is indeed
called for, then it should be written by someone
practiced in the art and science of preparing ques-
tionnaires. A sociologist should be retained through
a consulting company or university, or, if the budget
and scope of the project is appropriate, a social sci-
entist with survey experience should be included on
the planning team. If the budget or the scope of the
project is more limited, then the planning team
should obtain a copy of a standard survey text such
as Dillman (1978); Sudman and Bradburn (1983);
Fowler (1993); De Vellis (1991); and Le Compte and
Preissle (1993).
Don Dillman’s total design method (TDM) has
two parts. First, he suggests that each aspect of the
survey process that may affect the quality or quan-
tity of the response be identified. Each aspect should
then be designed in such a way that “the best possi-
ble responses are obtained” (Dillman 1978, 12). Sec-
ond, Dillman suggests an administrative plan
“guided by a theoretical view about why people re-
spond to questionnaires. It provides the rationale
for deciding how each aspect, even the seemingly
minute ones, should be shaped” (1978, 12). The
purpose of the administrative plan is “to ensure
implementation of the survey in accordance with
design intentions” (Dillman 1978, 12). According
to Dillman, the essence of the administrative plan
is to
• Identify all the tasks to be accomplished.
• Determine how each task is dependent on the
others.
• Determine in what order the tasks must be
performed.
• Decide the means by which each task is to be
accomplished (1978, 20).
Dillman provides clear guidelines and sugges-
tions for realizing these principles. He also reports a
high response rate to surveys that use the TDM.
168CHAPTER 4
TABLE 4.17Distribution of Users in the Controlling Institutions of the Kennett, Pennsylvania, Region
O, owner; W, worker; E, elected; A, appointed.SOURCES: Rose, Steiner, and Jackson 1978/1979; Jackson and Steiner 1985.
Essentially, there are eight steps in conducting a
survey:
1. Define the purpose of the survey.
2. Choose the study design.
3. Select the sample.
4. Construct and pretest the questionnaire.
5. Implement the questionnaire by mail, over
the telephone, or in person (mail surveys may
require a follow-up step).
6. Code the interviews.
7. Tabulate and analyze the results.
8. Write a report (steps adapted from Survey
Research Center 1976).
The Survey Research Center of the University of
Michigan’s Institute for Social Research has pre-
pared a manual to follow these eight steps for inter-
views (Survey Research Center 1976). A good ques-
tionnaire is dependent on the quality of the
questions asked. The text by Seymour Sudman and
Norman Bradburn (1983) provides especially help-
ful suggestions about how to ask questions. To-
gether, the Dillman, Sudman and Bradburn, and
Survey Research Center books provide much guid-
ance for the preparation of surveys.
When designing a survey to provide inventory
information, it is useful to remember other steps of
the planning process. Synchronized surveys, intro-
duced in Chapter 2 and discussed again in Chapter
6, may be used throughout the process to integrate
the steps. Integrated, synchronized surveys can as-
sist planners to identify issues, establish goals, col-
lect information, and select options for realizing
planning goals.
Face-to-Face Interviews
Face-to-face interviews are a personal alternative to
the mail and telephone. Through personal inter-
views, the planner “can enter the mental world of
the individual, to glimpse the categories and the
logic by which he or she sees the world” so that the
planner can see “into the life world of the individual,
to see the content and pattern of daily experience”
(McCracken 1988, 9). Face-to-face interviews may
be conducted at random, or individuals may be pre-
selected, depending on the nature of the planning
project or program. For random interviews, it will
be important to select representative neighbor-
hoods of the planning area. Interviews should be
conducted in a variety of settlement types and with
people of various income levels and ethnic back-
grounds. At a minimum the planner should record
the date, time, and place of the interview and ask
questions about the age of the resident; the size of
the family; the occupations of the husband, wife,
and children; the place of work; and the length of
residence in the planning area (Berger et al. 1977).
Planners should explain the purpose of the inter-
view and, if appropriate, ensure confidentiality.
If interviewees are selected at random, then there
is the possibility that the person may not be a resi-
dent. In such cases, it is important to ask why the in-
dividual is visiting the planning area. For planning
efforts with tourism and recreation issues involved,
visitors may be targeted for interviews. Planners may
interview people at rest stops or gas stations to learn
more about why visitors are attracted to the area.
Interviews can also be conducted with what
ethnographers call key informants. Carl Patton and
David Sawicki (1993) call this approach the elite or
intensive interviewing process. A list of organizations
and clubs can be compiled (see Table 4.1). Officers
of these associations can then be contacted and in-
terviewed. In addition to recording the date, time,
and place of the meeting, the planner should note
the name of the organization and of the person be-
ing interviewed. The planner should try to obtain an
official statement of the purpose of the group, an or-
ganizational chart, and a written biography of the
association. The planner should try to learn about
the committee structure, scheduled meetings, mem-
bership, and dues and funds.
169HUMAN COMMUNITY INVENTORY AND ANALYSIS
The specific questions asked during the inter-
view will depend on the planning effort. Face-to-
face interviews with association officers should yield
information about community leadership, how is-
sues are perceived in the planning area, and the use
of natural resources by various groups of people.
Participant Observation
Participant observation involves actually living in a
community, becoming involved in its activities, and
carefully recording events. Many agency staff plan-
ners live in the community where they work and are
participants in its affairs; however this technique for
generating new information about a community
goes beyond living in a place. Participant observa-
tion is used by ethnographers in their fieldwork.
The technique involves active listening, supple-
mented by taking careful field notes. A journal can
be used to record observations. Such observations
should be carefully recorded and include the date
and the places and people involved.
If a team of planners is involved, then they will
meet to discuss their observations. One approach is
to place individual planning team members in areas
and homes of representative individuals from vari-
ous segments of the community. For instance, one
planner may live in a neighborhood with a high-in-
come family; another with a middle-income family;
and a third with a low-income family. One person
could live in a neighborhood of an ethnic minority,
another in a majority neighborhood. In this way a
cross section of observations can be compiled.
Allan Jacobs (1985) suggests a framework for or-
ganizing observations about the built environment.
He recommends that the planner first walk the en-
tire planning area. A checklist can be prepared prior
to such a walk to help with note taking and observa-
tion. The checklist should include spaces for visit-
specific information such as the date, time of day,
and weather, as well as detailed information about
streets, sidewalks, curbs, street trees, maintenance,
building arrangement, and topography (Morrell
1989). A map that can be written on should also be
taken so that the planner can record the route and
mark points of interest. Sketches can also be made
during the first visit, but a camera should be left in
the office. Sketching encourages looking closely,
whereas when taking pictures details may be over-
looked.
A second site visit can then be made with a cam-
era, photographing the area and verifying initial ob-
servations (Jacobs 1985; Morrell 1989). A third visit
can then be made with a local expert, a key informant
in ethnographic terms. The observations from these
visits can be recorded in the journal and compared
with published information about the study area.
During such observation, Jacobs urges planners “to
constantly question what one sees as well as the con-
clusions one comes to” (1985, 28). Because planners
bring their own cultural values to any observation, it
is, according to Jacobs, “necessary to constantly
question and refine one’s definition of what is really
being seen” (1985, 28; see also Jacobs 1993).
Reading the landscape is an art. Planners can
learn to look for visual clues that can reveal much
about a human community. For instance, the date
that some buildings were constructed may be dis-
played on their facades. By looking at a place a plan-
ner can start to understand something about the
history of the community and the people who dwell
there. Participant observation can yield rich, per-
sonal insights about communities that cannot be
gained by reading existing information or by col-
lecting new data through surveys and interviews.
The observation of the built environment is only
part of what a planner should study. Planners
should also attend meetings of community organi-
zations and clubs to learn more about the people
who live in the planning area. These meetings may
be with the same associations whose officers have
been interviewed. Agenda and membership lists
should be collected. In this way, active members of
the community can be identified and issues con-
170CHAPTER 4
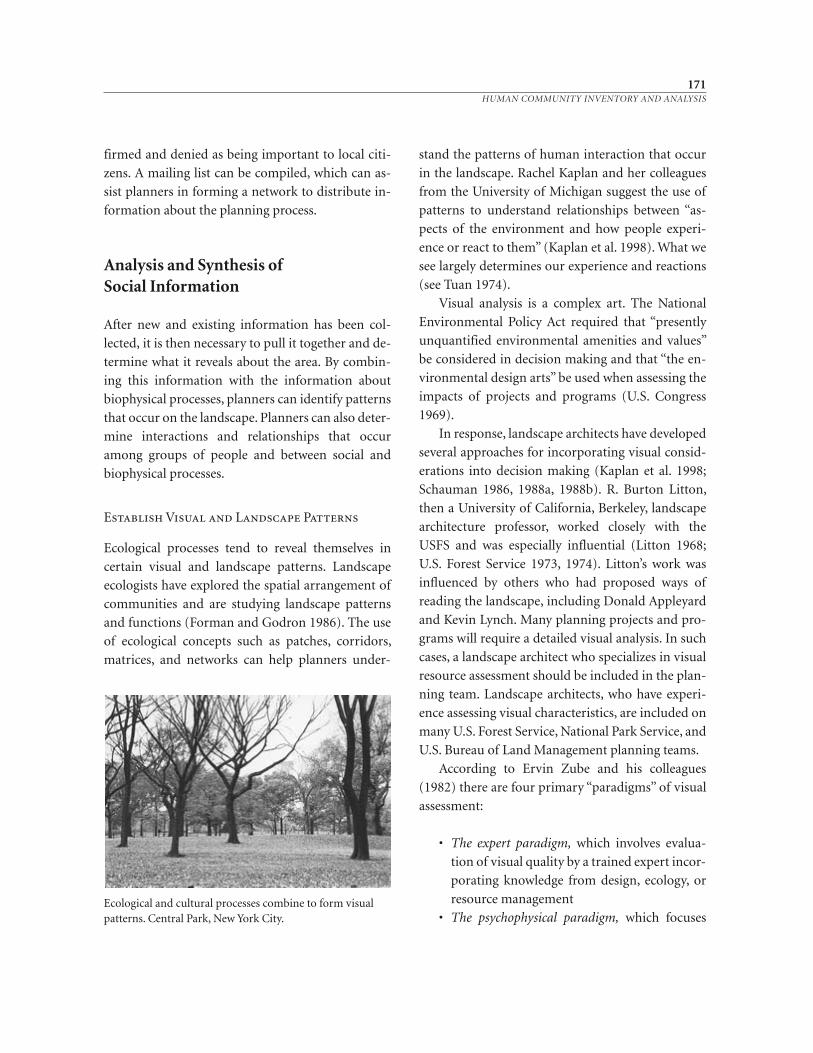
171HUMAN COMMUNITY INVENTORY AND ANALYSIS
firmed and denied as being important to local citi-
zens. A mailing list can be compiled, which can as-
sist planners in forming a network to distribute in-
formation about the planning process.
Analysis and Synthesis of Social Information
After new and existing information has been col-
lected, it is then necessary to pull it together and de-
termine what it reveals about the area. By combin-
ing this information with the information about
biophysical processes, planners can identify patterns
that occur on the landscape. Planners can also deter-
mine interactions and relationships that occur
among groups of people and between social and
biophysical processes.
Establish Visual and Landscape Patterns
Ecological processes tend to reveal themselves in
certain visual and landscape patterns. Landscape
ecologists have explored the spatial arrangement of
communities and are studying landscape patterns
and functions (Forman and Godron 1986). The use
of ecological concepts such as patches, corridors,
matrices, and networks can help planners under-
stand the patterns of human interaction that occur
in the landscape. Rachel Kaplan and her colleagues
from the University of Michigan suggest the use of
patterns to understand relationships between “as-
pects of the environment and how people experi-
ence or react to them” (Kaplan et al. 1998). What we
see largely determines our experience and reactions
(see Tuan 1974).
Visual analysis is a complex art. The National
Environmental Policy Act required that “presently
unquantified environmental amenities and values”
be considered in decision making and that “the en-
vironmental design arts” be used when assessing the
impacts of projects and programs (U.S. Congress
1969).
In response, landscape architects have developed
several approaches for incorporating visual consid-
erations into decision making (Kaplan et al. 1998;
Schauman 1986, 1988a, 1988b). R. Burton Litton,
then a University of California, Berkeley, landscape
architecture professor, worked closely with the
USFS and was especially influential (Litton 1968;
U.S. Forest Service 1973, 1974). Litton’s work was
influenced by others who had proposed ways of
reading the landscape, including Donald Appleyard
and Kevin Lynch. Many planning projects and pro-
grams will require a detailed visual analysis. In such
cases, a landscape architect who specializes in visual
resource assessment should be included in the plan-
ning team. Landscape architects, who have experi-
ence assessing visual characteristics, are included on
many U.S. Forest Service, National Park Service, and
U.S. Bureau of Land Management planning teams.
According to Ervin Zube and his colleagues
(1982) there are four primary “paradigms” of visual
assessment:
• The expert paradigm, which involves evalua-
tion of visual quality by a trained expert incor-
porating knowledge from design, ecology, or
resource management
• The psychophysical paradigm, which focusesEcological and cultural processes combine to form visualpatterns. Central Park, New York City.
on a population’s preference for specific land-
scape qualities based primarily on physical
characteristics in the landscape
• The cognitive paradigm, which emphasizes hu-
man meaning associated with landscape prop-
erties based on past experience, future expec-
tation, and sociocultural conditioning of the
observer
• The experiential paradigm, which considers
landscape values based on interaction of peo-
ple with the landscape (as adapted by Whit-
more et al. 1995, 29)
In the context of human community analysis,
some of the techniques developed for visual resource
assessment can be adapted to help identify landscape
patterns. Many of these approaches to assess the vi-
sual attributes of a place have been developed from
the perspective of an outsider, an expert, according
to the classification system developed by Zube and
his colleagues (1982). Viewing the landscape from
the road, areas are mapped and evaluated. Such an
approach can be helpful in the determination of vi-
sual sensitivity to change. (See Tables 10.4 and 10.15
for examples of how this type of information can be
used in classifying environmentally sensitive areas.)
The view-from-the-road approach is an out-
growth of windshield surveys. These surveys are
undertaken by systematically driving throughout
the planning area. The planning researcher takes
photographs, draws sketches, and writes notes
about her or his observations. Another general ap-
proach to visual analysis is to try to learn the in-
sider, or land-user, view of the landscape. Several
techniques have been developed to attempt to gain
such a perspective. Photographs are a common
tool. One option is to give cameras to land users in
the planning area and ask them to take pictures of
things that they like and do not like about their
landscape. These photographs are then collected,
compared, and analyzed. Another option is for the
researcher to take photographs. These photographs
can then be used to conduct preference surveys.
Preferences can be determined by showing the pho-
tographs at public meetings, through one-on-one
interviews, or by mail surveys. Visual surveys from
either the expert or user perspective can be inte-
grated with the participant-observation efforts.
The visual and participant-observation findings
should enable the planner or the planning team to
identify visual patterns that reflect cultural values.
Such patterns can be identified using rather simple
land-use terms (e.g., agricultural, commercial, resi-
dential, industrial, natural). Ideally, however, the
patterns should reveal more complex relationships
between biophysical and sociocultural processes
that are visually apparent and that are specific to the
area (e.g., rolling wheatland, old town center, lake -
shore suburb, old stream-bank industry, valley conifer
woodland).
The “language of landscape,” as suggested by
Anne Spirn (1998), includes a vocabulary to describe
both the visual patterns and the ecology of places.
For instance, where Kevin Lynch (1960) used node,
path, and district, Forman and Godron (1986) use
patch, corridor, and matrix (Hirschman, 1988, after
Steinitz, 1988). Such terms are helpful for describing
the visual and cultural patterns observed in a place.
Several methods, paralleling roughly the Zube et
al. classification, were employed by a team of plan-
ners in the planning of the Verde Valley greenway in
Arizona (Cook et al. 1991; Whitmore et al. 1995).
The team determined that three methods of visual
assessment would be used in the study, with a goal
to involve the public in the visual assessment. First,
an expert evaluation method involved trained ob-
servers, in this case landscape architects and plan-
ners, without public interaction. Second, a public
valuation method incorporated images selected by
the same experts, which were then reviewed at pub-
lic meetings. (This method followed procedures de-
veloped by Ricki McKenzie for the New Jersey Pine -
lands, discussed later in this chapter.) Third, the
team used a public nomination method that was
172CHAPTER 4
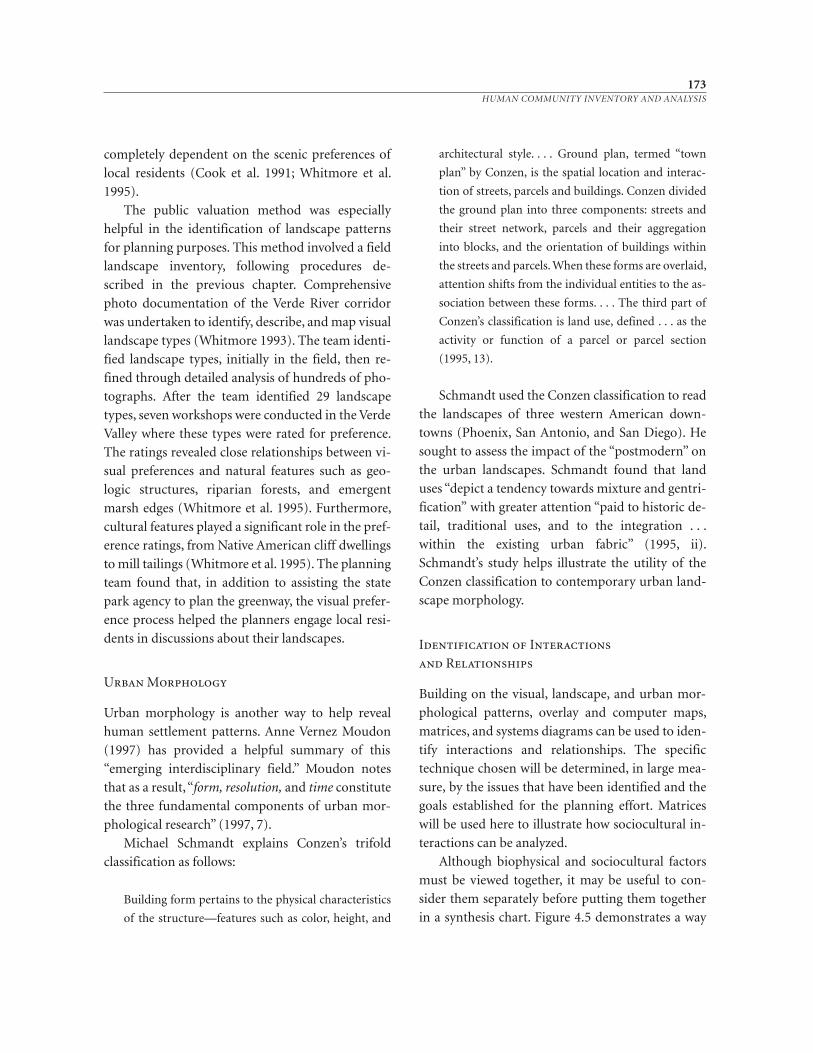
completely dependent on the scenic preferences of
local residents (Cook et al. 1991; Whitmore et al.
1995).
The public valuation method was especially
helpful in the identification of landscape patterns
for planning purposes. This method involved a field
landscape inventory, following procedures de-
scribed in the previous chapter. Comprehensive
photo documentation of the Verde River corridor
was undertaken to identify, describe, and map visual
landscape types (Whitmore 1993). The team identi-
fied landscape types, initially in the field, then re-
fined through detailed analysis of hundreds of pho-
tographs. After the team identified 29 landscape
types, seven workshops were conducted in the Verde
Valley where these types were rated for preference.
The ratings revealed close relationships between vi-
sual preferences and natural features such as geo-
logic structures, riparian forests, and emergent
marsh edges (Whitmore et al. 1995). Furthermore,
cultural features played a significant role in the pref-
erence ratings, from Native American cliff dwellings
to mill tailings (Whitmore et al. 1995). The planning
team found that, in addition to assisting the state
park agency to plan the greenway, the visual prefer-
ence process helped the planners engage local resi-
dents in discussions about their landscapes.
Urban Morphology
Urban morphology is another way to help reveal
human settlement patterns. Anne Vernez Moudon
(1997) has provided a helpful summary of this
“emerging interdisciplinary field.” Moudon notes
that as a result, “form, resolution, and time constitute
the three fundamental components of urban mor-
phological research” (1997, 7).
Michael Schmandt explains Conzen’s trifold
classification as follows:
Building form pertains to the physical characteristics
of the structure—features such as color, height, and
architectural style. . . . Ground plan, termed “town
plan” by Conzen, is the spatial location and interac-
tion of streets, parcels and buildings. Conzen divided
the ground plan into three components: streets and
their street network, parcels and their aggregation
into blocks, and the orientation of buildings within
the streets and parcels. When these forms are overlaid,
attention shifts from the individual entities to the as-
sociation between these forms. . . . The third part of
Conzen’s classification is land use, defined . . . as the
activity or function of a parcel or parcel section
(1995, 13).
Schmandt used the Conzen classification to read
the landscapes of three western American down-
towns (Phoenix, San Antonio, and San Diego). He
sought to assess the impact of the “postmodern” on
the urban landscapes. Schmandt found that land
uses “depict a tendency towards mixture and gentri-
fication” with greater attention “paid to historic de-
tail, traditional uses, and to the integration . . .
within the existing urban fabric” (1995, ii).
Schmandt’s study helps illustrate the utility of the
Conzen classification to contemporary urban land-
scape morphology.
Identification of Interactions
and Relationships
Building on the visual, landscape, and urban mor-
phological patterns, overlay and computer maps,
matrices, and systems diagrams can be used to iden-
tify interactions and relationships. The specific
technique chosen will be determined, in large mea-
sure, by the issues that have been identified and the
goals established for the planning effort. Matrices
will be used here to illustrate how sociocultural in-
teractions can be analyzed.
Although biophysical and sociocultural factors
must be viewed together, it may be useful to con-
sider them separately before putting them together
in a synthesis chart. Figure 4.5 demonstrates a way
173HUMAN COMMUNITY INVENTORY AND ANALYSIS
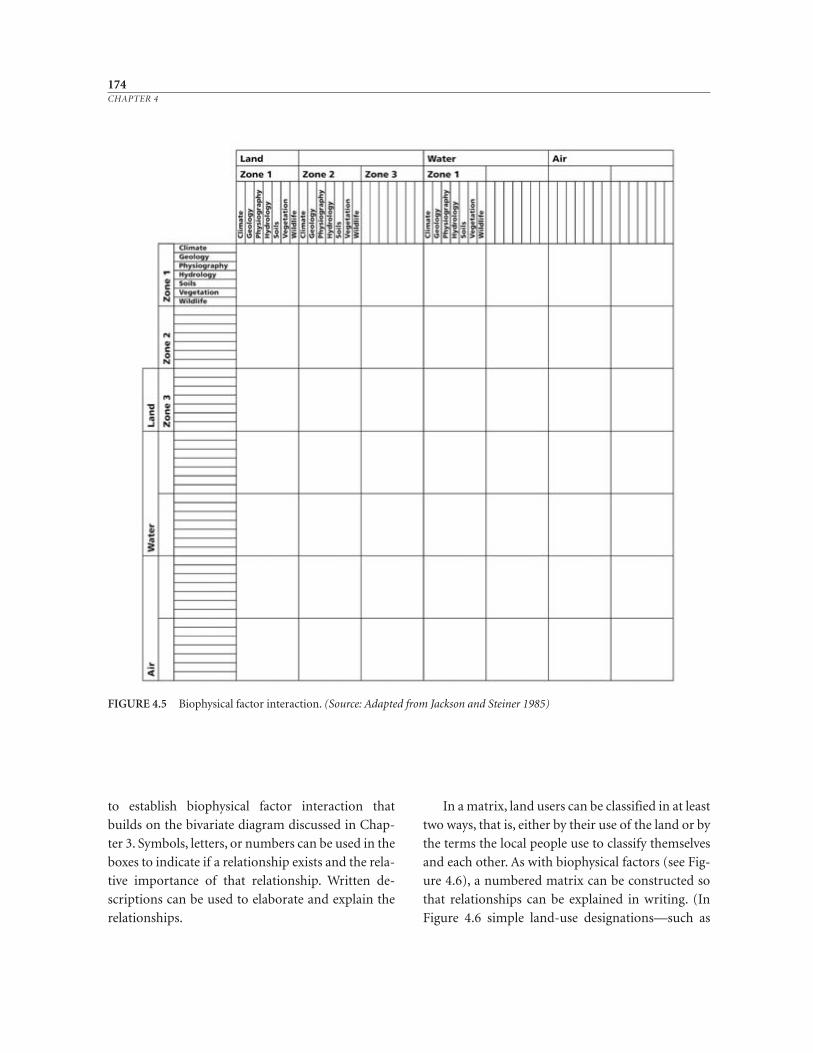
to establish biophysical factor interaction that
builds on the bivariate diagram discussed in Chap-
ter 3. Symbols, letters, or numbers can be used in the
boxes to indicate if a relationship exists and the rela-
tive importance of that relationship. Written de-
scriptions can be used to elaborate and explain the
relationships.
In a matrix, land users can be classified in at least
two ways, that is, either by their use of the land or by
the terms the local people use to classify themselves
and each other. As with biophysical factors (see Fig-
ure 4.6), a numbered matrix can be constructed so
that relationships can be explained in writing. (In
Figure 4.6 simple land-use designations—such as
174CHAPTER 4
FIGURE 4.5 Biophysical factor interaction. (Source: Adapted from Jackson and Steiner 1985)
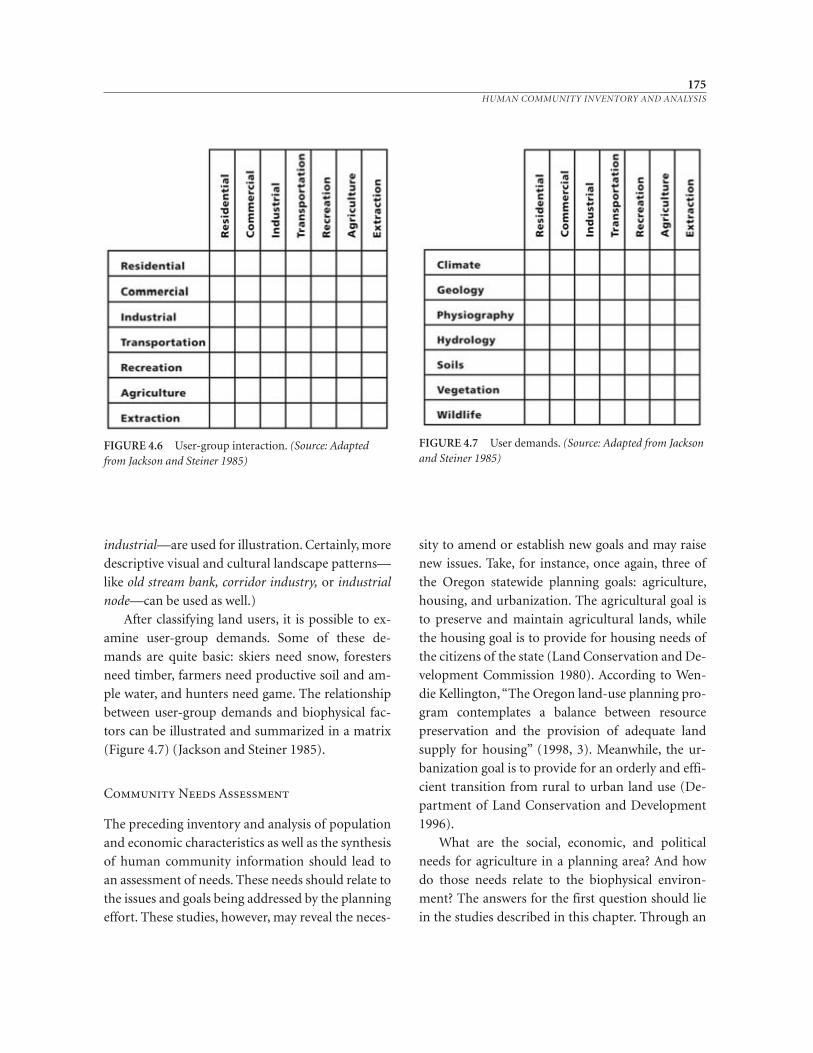
industrial—are used for illustration. Certainly, more
descriptive visual and cultural landscape patterns—
like old stream bank, corridor industry, or industrial
node—can be used as well.)
After classifying land users, it is possible to ex-
amine user-group demands. Some of these de-
mands are quite basic: skiers need snow, foresters
need timber, farmers need productive soil and am-
ple water, and hunters need game. The relationship
between user-group demands and biophysical fac-
tors can be illustrated and summarized in a matrix
(Figure 4.7) (Jackson and Steiner 1985).
Community Needs Assessment
The preceding inventory and analysis of population
and economic characteristics as well as the synthesis
of human community information should lead to
an assessment of needs. These needs should relate to
the issues and goals being addressed by the planning
effort. These studies, however, may reveal the neces-
sity to amend or establish new goals and may raise
new issues. Take, for instance, once again, three of
the Oregon statewide planning goals: agriculture,
housing, and urbanization. The agricultural goal is
to preserve and maintain agricultural lands, while
the housing goal is to provide for housing needs of
the citizens of the state (Land Conservation and De-
velopment Commission 1980). According to Wen -
die Kellington, “The Oregon land-use planning pro-
gram contemplates a balance between resource
preservation and the provision of adequate land
supply for housing” (1998, 3). Meanwhile, the ur-
banization goal is to provide for an orderly and effi-
cient transition from rural to urban land use (De-
partment of Land Conservation and Development
1996).
What are the social, economic, and political
needs for agriculture in a planning area? And how
do those needs relate to the biophysical environ-
ment? The answers for the first question should lie
in the studies described in this chapter. Through an
175HUMAN COMMUNITY INVENTORY AND ANALYSIS
FIGURE 4.7 User demands. (Source: Adapted from Jacksonand Steiner 1985)
FIGURE 4.6 User-group interaction. (Source: Adaptedfrom Jackson and Steiner 1985)
ecological analysis, linkages should start to be made
between the human community and the biophysical
environment. Population and economic studies
should reveal trends in the agricultural sector and
what the needs are to continue to support farming
in the planning area. These needs can be quantified.
For instance, one can determine the number of
cows, farmers, and land needed to support a milk-
processing plant. These numbers may vary if the
cows graze on the farm or if feed is imported. They
may also vary if technology, such as milking ma-
chines or the cost of energy, changes the labor re-
quired to maintain a dairy.
As outlined in the Oregon statewide planning
goal, housing needs may be affected by (1) the
amount of buildable land; (2) the distribution of ex-
isting population by income compared with the dis-
tribution of available housing units by costs; (3) a de-
termination of vacancy rates, both overall and at
varying rent ranges and cost levels; (4) a determina-
tion of expected housing demands at varying rent
ranges and cost levels; (5) an analysis of a variety of
densities and types of residences; and (6) the amount
of sound housing units capable of being rehabili-
tated (Land Conservation and Development Com-
mission 1980). Some obvious conflicts exist between
the needs for agriculture and housing. Oregon’s ur-
banization goal attempts to address these conflicts.
Preference in Oregon is given to agricultural land
protection. Consequently, jurisdictions need to jus-
tify how much land should be contained within the
urban growth boundary and how much of the rural
land is either unsuited for resource use or already too
developed or too fragmented to be returned to farm
use. As a result, in Oregon, the challenge is not in es-
timating how much agriculture there should be, but
in determining how much of everything else there
would be in the plan. Oregon’s emphasis on farm-
land protection is unique. Elsewhere in the United
States, it is common to decide on every possible
other use first, and then dedicating what is left over
to farm use. Chapter 5 addresses how to determine
the potential allocation of land uses.
Two Examples of Human CommunityInventory and Analysis
Collecting information about people is not new,
but connecting such data to natural systems and to
planning the future of places is a relatively new art.
Planners in the New Jersey Pinelands and at Camp
Pendleton, California, have sought to make such
connections.
New Jersey Pinelands Comprehensive
Management Plan
The human community inventory and analysis of
the Pinelands were accomplished in the same man-
ner as the biophysical studies (see Chapter 3), that is,
through the use of consultants. The management
plan first reviewed prehistorical, historical, and cul-
tural resources and then land use. The Pinelands has
been inhabited and used by humans for approxi-
mately 10,000 years. The management plan pro-
vides a synopsis of what is known about the prehis-
tory of the region. There is an inventory of sites of
archaeological significance and an historical review,
beginning with the people who called themselves
the “Lenni-Lenape” who inhabited the area at the
time of the initial European contact. The historic ac-
tivities of Europeans and their American descen-
dants are described in the plan. These include
forestry; shipbuilding and seafaring; hunting, gath-
ering, trapping, and fishing; agriculture; iron pro-
duction; glassmaking; and tourism and recreation
(Pinelands Commission 1980).
Jon Berger and John Sinton interviewed 300
Pineland residents and analyzed the cultural re-
sources and attitudes about the Pinelands. They
found settlement of the Pinelands taking place in
three general patterns, and they grouped these into
three major cultural regions: forest, agricultural and
rural suburban, and coastal. Then they identified a
number of distinct cultural and ethnic groups, in-
cluding baymen, blacks, Germans, Italians, Jews,
mixed urbanizing, Puerto Ricans, Quakers, rural
176CHAPTER 4
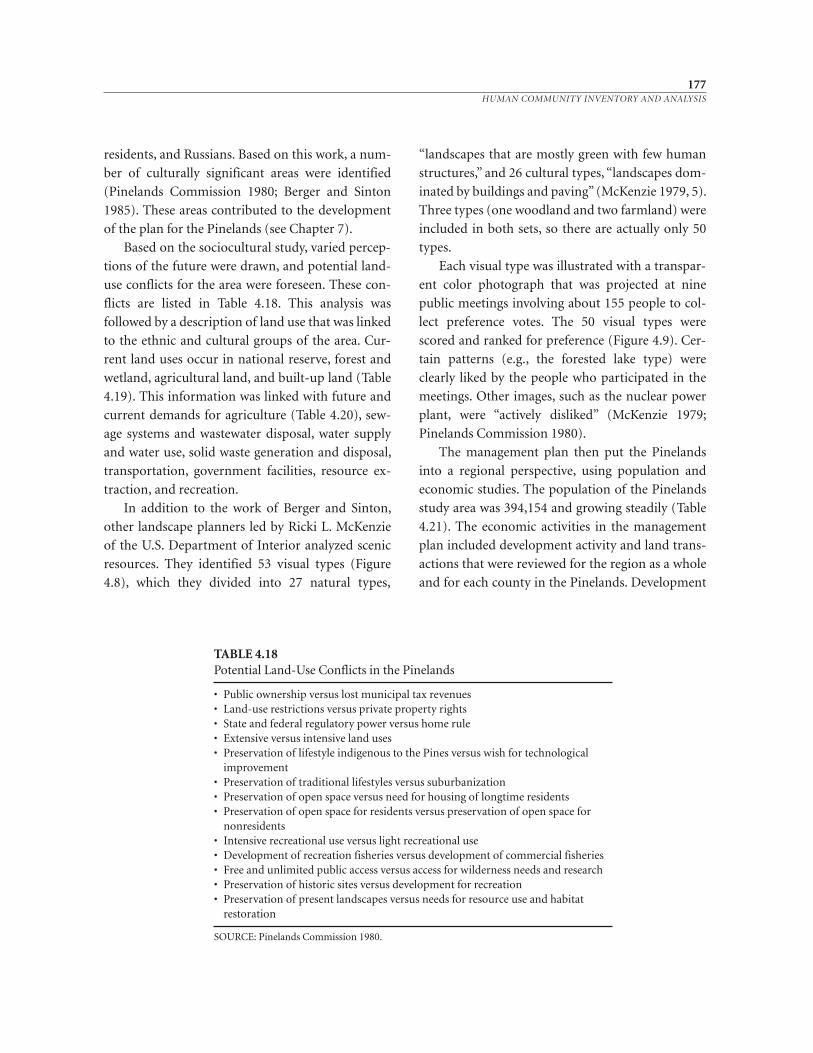
residents, and Russians. Based on this work, a num-
ber of culturally significant areas were identified
(Pinelands Commission 1980; Berger and Sinton
1985). These areas contributed to the development
of the plan for the Pinelands (see Chapter 7).
Based on the sociocultural study, varied percep-
tions of the future were drawn, and potential land-
use conflicts for the area were foreseen. These con-
flicts are listed in Table 4.18. This analysis was
followed by a description of land use that was linked
to the ethnic and cultural groups of the area. Cur-
rent land uses occur in national reserve, forest and
wetland, agricultural land, and built-up land (Table
4.19). This information was linked with future and
current demands for agriculture (Table 4.20), sew -
age systems and wastewater disposal, water supply
and water use, solid waste generation and disposal,
transportation, government facilities, resource ex-
traction, and recreation.
In addition to the work of Berger and Sinton,
other landscape planners led by Ricki L. McKenzie
of the U.S. Department of Interior analyzed scenic
resources. They identified 53 visual types (Figure
4.8), which they divided into 27 natural types,
“landscapes that are mostly green with few human
structures,” and 26 cultural types, “landscapes dom-
inated by buildings and paving” (McKenzie 1979, 5).
Three types (one woodland and two farmland) were
included in both sets, so there are actually only 50
types.
Each visual type was illustrated with a transpar-
ent color photograph that was projected at nine
public meetings involving about 155 people to col-
lect preference votes. The 50 visual types were
scored and ranked for preference (Figure 4.9). Cer-
tain patterns (e.g., the forested lake type) were
clearly liked by the people who participated in the
meetings. Other images, such as the nuclear power
plant, were “actively disliked” (McKenzie 1979;
Pinelands Commission 1980).
The management plan then put the Pinelands
into a regional perspective, using population and
economic studies. The population of the Pinelands
study area was 394,154 and growing steadily (Table
4.21). The economic activities in the management
plan included development activity and land trans-
actions that were reviewed for the region as a whole
and for each county in the Pinelands. Development
177HUMAN COMMUNITY INVENTORY AND ANALYSIS
TABLE 4.18Potential Land-Use Conflicts in the Pinelands
• Public ownership versus lost municipal tax revenues• Land-use restrictions versus private property rights• State and federal regulatory power versus home rule• Extensive versus intensive land uses• Preservation of lifestyle indigenous to the Pines versus wish for technological
improvement• Preservation of traditional lifestyles versus suburbanization• Preservation of open space versus need for housing of longtime residents• Preservation of open space for residents versus preservation of open space for
nonresidents• Intensive recreational use versus light recreational use• Development of recreation fisheries versus development of commercial fisheries• Free and unlimited public access versus access for wilderness needs and research• Preservation of historic sites versus development for recreation• Preservation of present landscapes versus needs for resource use and habitat
restoration
SOURCE: Pinelands Commission 1980.
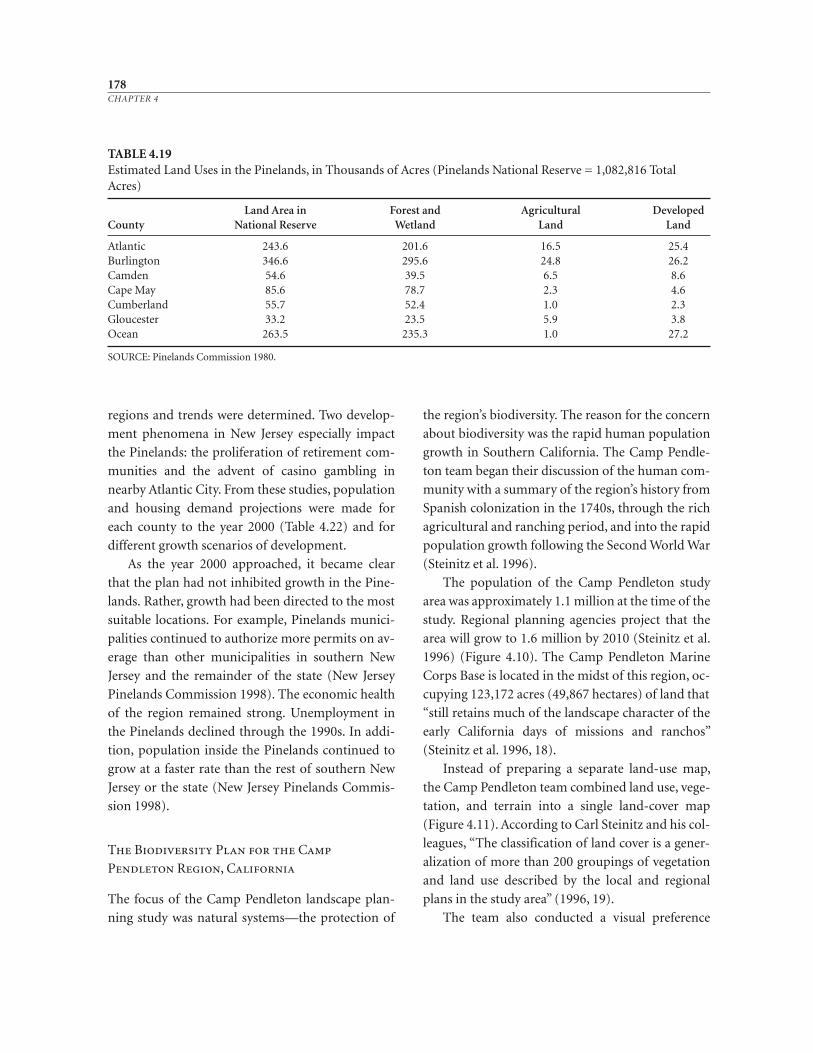
178CHAPTER 4
TABLE 4.19Estimated Land Uses in the Pinelands, in Thousands of Acres (Pinelands National Reserve = 1,082,816 TotalAcres)
Land Area in Forest and Agricultural DevelopedCounty National Reserve Wetland Land Land
Atlantic 243.6 201.6 16.5 25.4Burlington 346.6 295.6 24.8 26.2Camden 54.6 39.5 6.5 8.6Cape May 85.6 78.7 2.3 4.6Cumberland 55.7 52.4 1.0 2.3Gloucester 33.2 23.5 5.9 3.8Ocean 263.5 235.3 1.0 27.2
SOURCE: Pinelands Commission 1980.
regions and trends were determined. Two develop-
ment phenomena in New Jersey especially impact
the Pinelands: the proliferation of retirement com-
munities and the advent of casino gambling in
nearby Atlantic City. From these studies, population
and housing demand projections were made for
each county to the year 2000 (Table 4.22) and for
different growth scenarios of development.
As the year 2000 approached, it became clear
that the plan had not inhibited growth in the Pine -
lands. Rather, growth had been directed to the most
suitable locations. For example, Pinelands munici-
palities continued to authorize more permits on av-
erage than other municipalities in southern New
Jersey and the remainder of the state (New Jersey
Pinelands Commission 1998). The economic health
of the region remained strong. Unemployment in
the Pinelands declined through the 1990s. In addi-
tion, population inside the Pinelands continued to
grow at a faster rate than the rest of southern New
Jersey or the state (New Jersey Pinelands Commis-
sion 1998).
The Biodiversity Plan for the Camp
Pendleton Region, California
The focus of the Camp Pendleton landscape plan-
ning study was natural systems—the protection of
the region’s biodiversity. The reason for the concern
about biodiversity was the rapid human population
growth in Southern California. The Camp Pendle-
ton team began their discussion of the human com-
munity with a summary of the region’s history from
Spanish colonization in the 1740s, through the rich
agricultural and ranching period, and into the rapid
population growth following the Second World War
(Steinitz et al. 1996).
The population of the Camp Pendleton study
area was approximately 1.1 million at the time of the
study. Regional planning agencies project that the
area will grow to 1.6 million by 2010 (Steinitz et al.
1996) (Figure 4.10). The Camp Pendleton Marine
Corps Base is located in the midst of this region, oc-
cupying 123,172 acres (49,867 hectares) of land that
“still retains much of the landscape character of the
early California days of missions and ranchos”
(Steinitz et al. 1996, 18).
Instead of preparing a separate land-use map,
the Camp Pendleton team combined land use, vege-
tation, and terrain into a single land-cover map
(Figure 4.11). According to Carl Steinitz and his col-
leagues, “The classification of land cover is a gener-
alization of more than 200 groupings of vegetation
and land use described by the local and regional
plans in the study area” (1996, 19).
The team also conducted a visual preference
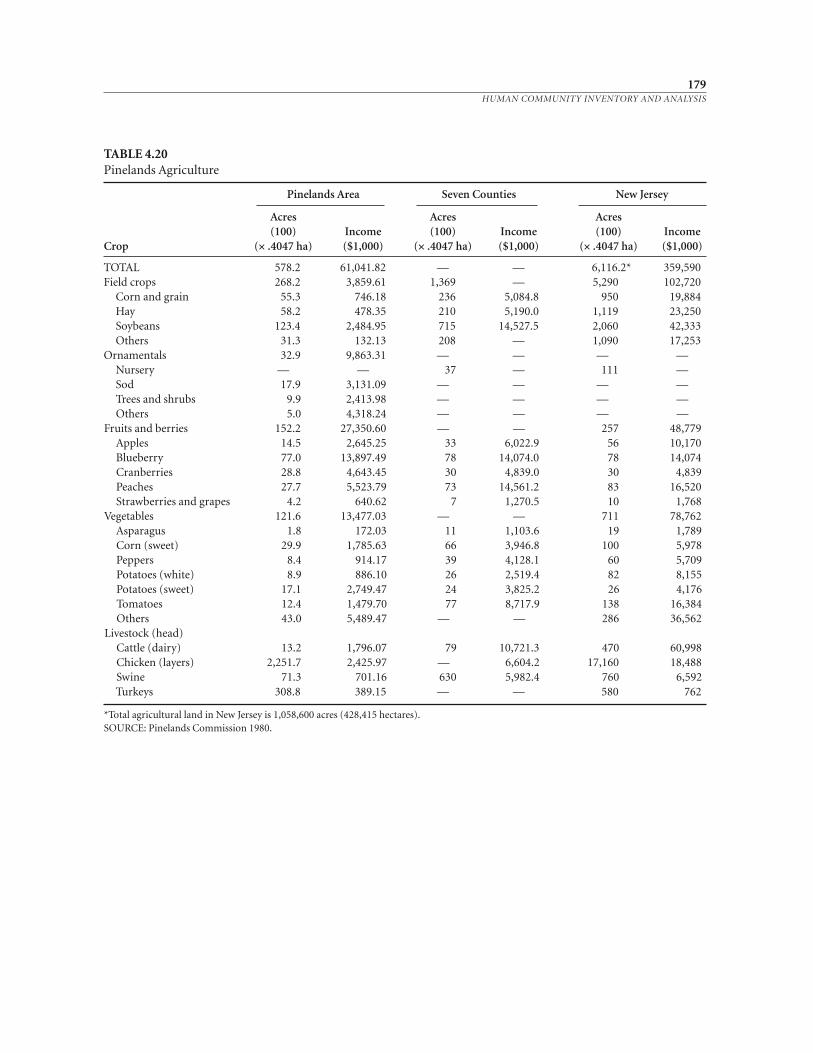
179HUMAN COMMUNITY INVENTORY AND ANALYSIS
TABLE 4.20Pinelands Agriculture
Pinelands Area Seven Counties New Jersey
Acres Acres Acres(100) Income (100) Income (100) Income
Crop (× .4047 ha) ($1,000) (× .4047 ha) ($1,000) (× .4047 ha) ($1,000)
TOTAL 578.2 61,041.82 — — 6,116.2* 359,590Field crops 268.2 3,859.61 1,369 — 5,290 102,720
Corn and grain 55.3 746.18 236 5,084.8 950 19,884Hay 58.2 478.35 210 5,190.0 1,119 23,250Soybeans 123.4 2,484.95 715 14,527.5 2,060 42,333Others 31.3 132.13 208 — 1,090 17,253
Ornamentals 32.9 9,863.31 — — — —Nursery — — 37 — 111 —Sod 17.9 3,131.09 — — — —Trees and shrubs 9.9 2,413.98 — — — —Others 5.0 4,318.24 — — — —
Fruits and berries 152.2 27,350.60 — — 257 48,779Apples 14.5 2,645.25 33 6,022.9 56 10,170Blueberry 77.0 13,897.49 78 14,074.0 78 14,074Cranberries 28.8 4,643.45 30 4,839.0 30 4,839Peaches 27.7 5,523.79 73 14,561.2 83 16,520Strawberries and grapes 4.2 640.62 7 1,270.5 10 1,768
Vegetables 121.6 13,477.03 — — 711 78,762Asparagus 1.8 172.03 11 1,103.6 19 1,789Corn (sweet) 29.9 1,785.63 66 3,946.8 100 5,978Peppers 8.4 914.17 39 4,128.1 60 5,709Potatoes (white) 8.9 886.10 26 2,519.4 82 8,155Potatoes (sweet) 17.1 2,749.47 24 3,825.2 26 4,176Tomatoes 12.4 1,479.70 77 8,717.9 138 16,384Others 43.0 5,489.47 — — 286 36,562
Livestock (head)Cattle (dairy) 13.2 1,796.07 79 10,721.3 470 60,998Chicken (layers) 2,251.7 2,425.97 — 6,604.2 17,160 18,488Swine 71.3 701.16 630 5,982.4 760 6,592Turkeys 308.8 389.15 — — 580 762
*Total agricultural land in New Jersey is 1,058,600 acres (428,415 hectares).SOURCE: Pinelands Commission 1980.
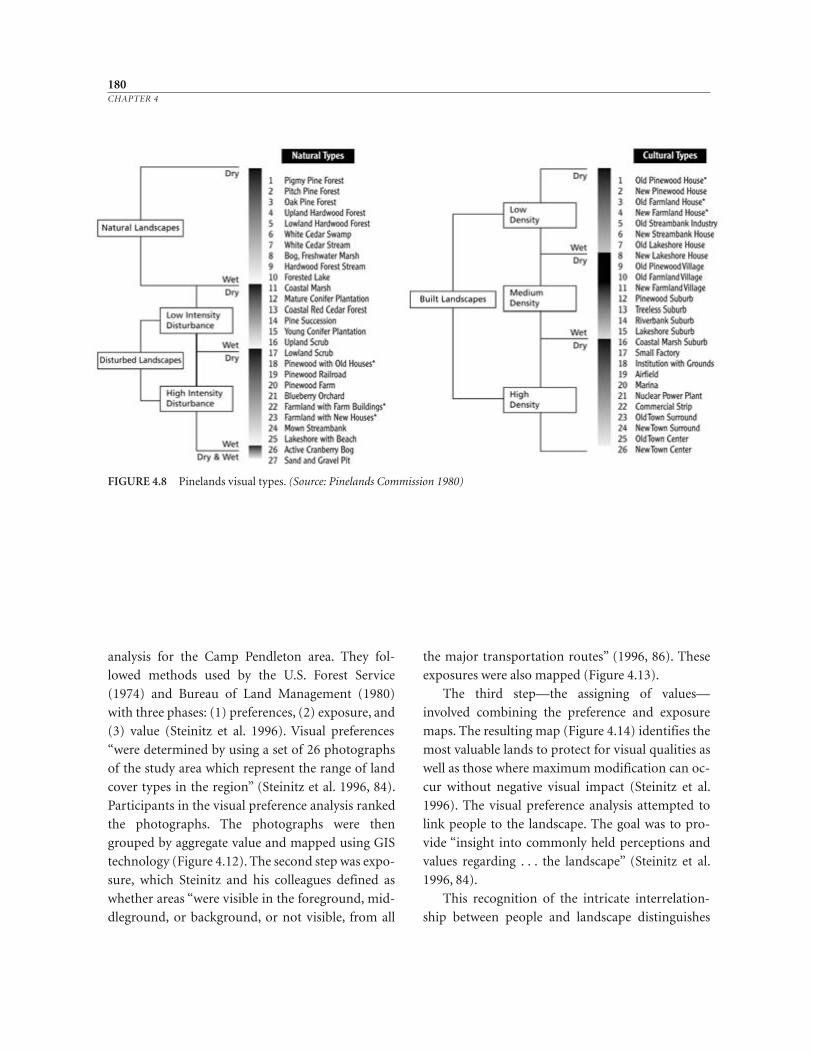
180CHAPTER 4
FIGURE 4.8 Pinelands visual types. (Source: Pinelands Commission 1980)
analysis for the Camp Pendleton area. They fol-
lowed methods used by the U.S. Forest Service
(1974) and Bureau of Land Management (1980)
with three phases: (1) preferences, (2) exposure, and
(3) value (Steinitz et al. 1996). Visual preferences
“were determined by using a set of 26 photographs
of the study area which represent the range of land
cover types in the region” (Steinitz et al. 1996, 84).
Participants in the visual preference analysis ranked
the photographs. The photographs were then
grouped by aggregate value and mapped using GIS
technology (Figure 4.12). The second step was expo-
sure, which Steinitz and his colleagues defined as
whether areas “were visible in the foreground, mid-
dleground, or background, or not visible, from all
the major transportation routes” (1996, 86). These
exposures were also mapped (Figure 4.13).
The third step—the assigning of values—
involved combining the preference and exposure
maps. The resulting map (Figure 4.14) identifies the
most valuable lands to protect for visual qualities as
well as those where maximum modification can oc-
cur without negative visual impact (Steinitz et al.
1996). The visual preference analysis attempted to
link people to the landscape. The goal was to pro-
vide “insight into commonly held perceptions and
values regarding . . . the landscape” (Steinitz et al.
1996, 84).
This recognition of the intricate interrelation-
ship between people and landscape distinguishes
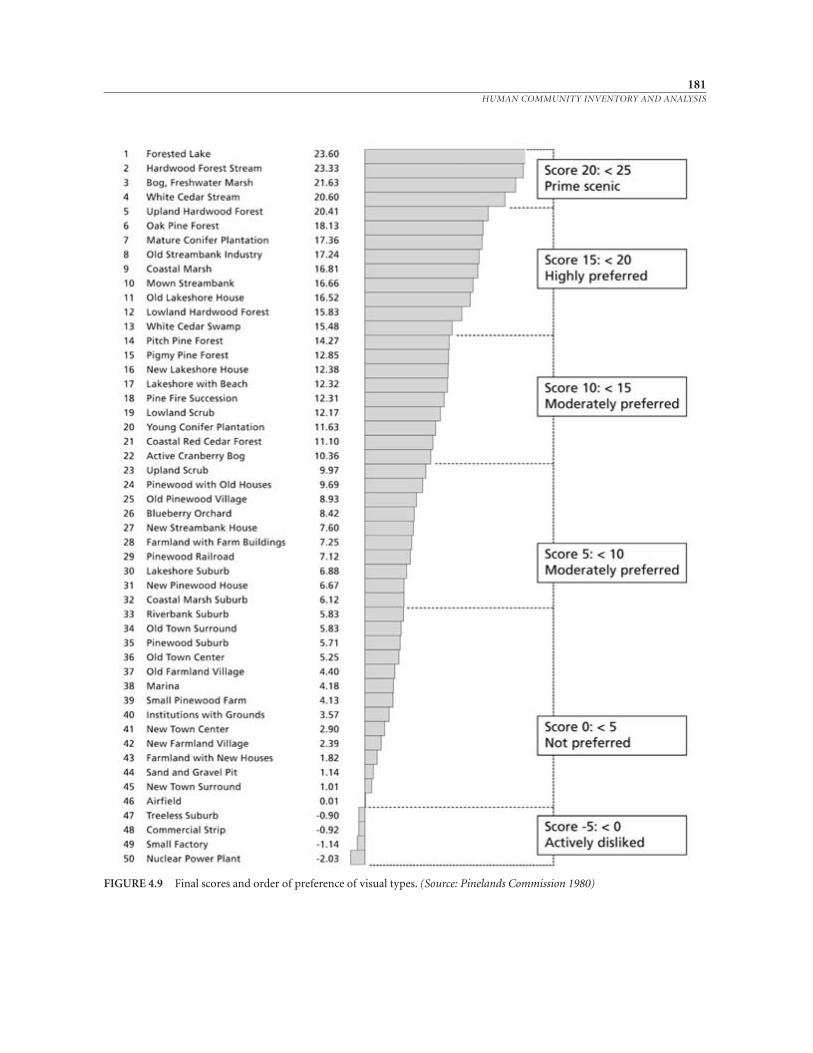
181HUMAN COMMUNITY INVENTORY AND ANALYSIS
FIGURE 4.9 Final scores and order of preference of visual types. (Source: Pinelands Commission 1980)
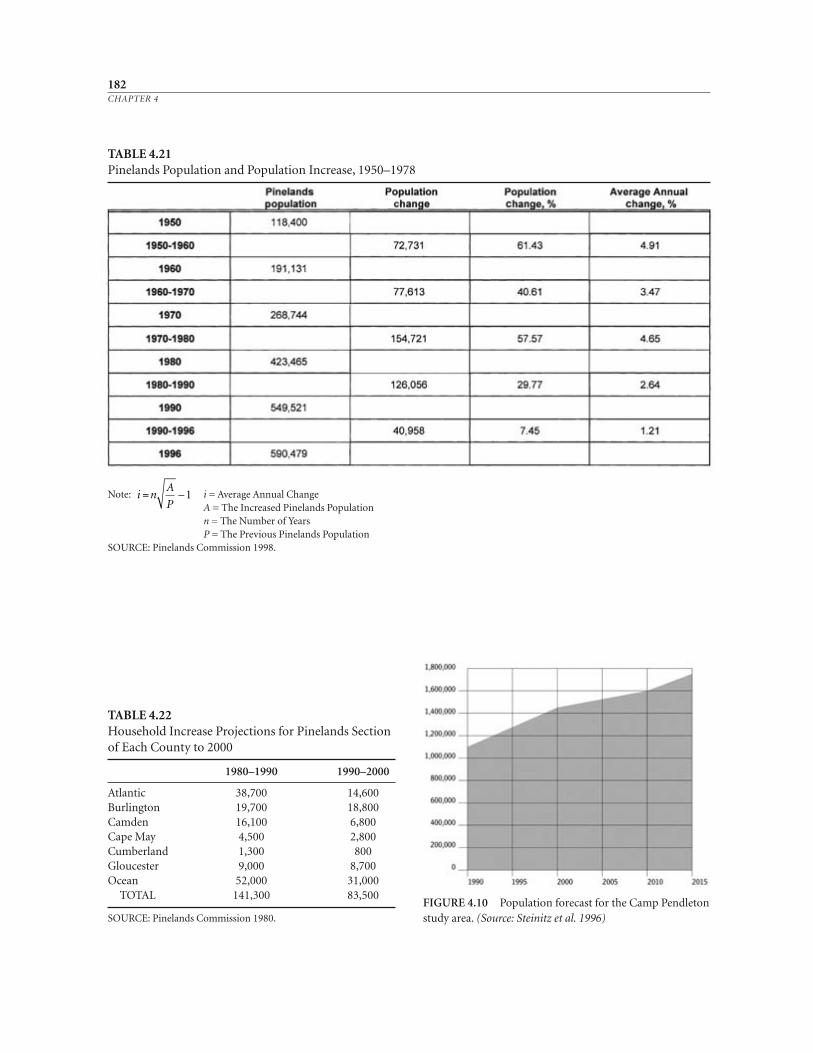
182CHAPTER 4
FIGURE 4.10 Population forecast for the Camp Pendletonstudy area. (Source: Steinitz et al. 1996)
TABLE 4.22Household Increase Projections for Pinelands Sectionof Each County to 2000
1980–1990 1990–2000
Atlantic 38,700 14,600Burlington 19,700 18,800Camden 16,100 6,800Cape May 4,500 2,800Cumberland 1,300 800Gloucester 9,000 8,700Ocean 52,000 31,000
TOTAL 141,300 83,500
SOURCE: Pinelands Commission 1980.
TABLE 4.21Pinelands Population and Population Increase, 1950–1978
Note: i = Average Annual ChangeA = The Increased Pinelands Populationn = The Number of YearsP = The Previous Pinelands Population
SOURCE: Pinelands Commission 1998.
i nA
P= – 1
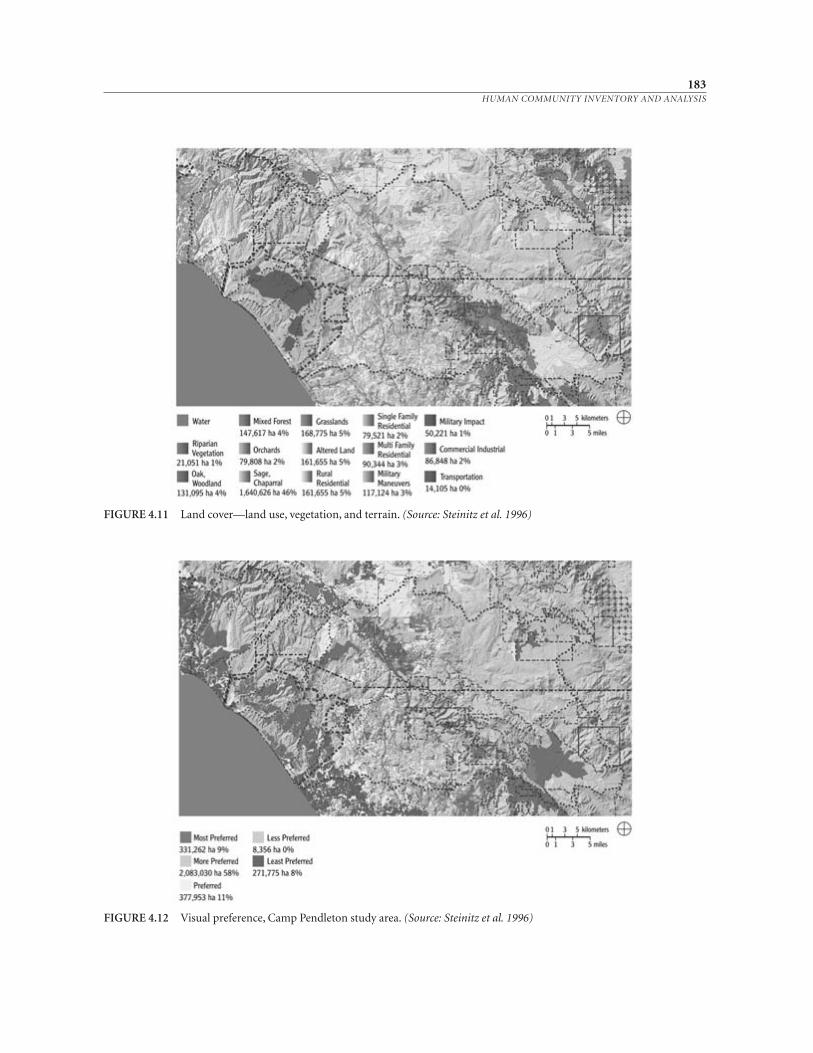
183HUMAN COMMUNITY INVENTORY AND ANALYSIS
FIGURE 4.11 Land cover—land use, vegetation, and terrain. (Source: Steinitz et al. 1996)
FIGURE 4.12 Visual preference, Camp Pendleton study area. (Source: Steinitz et al. 1996)
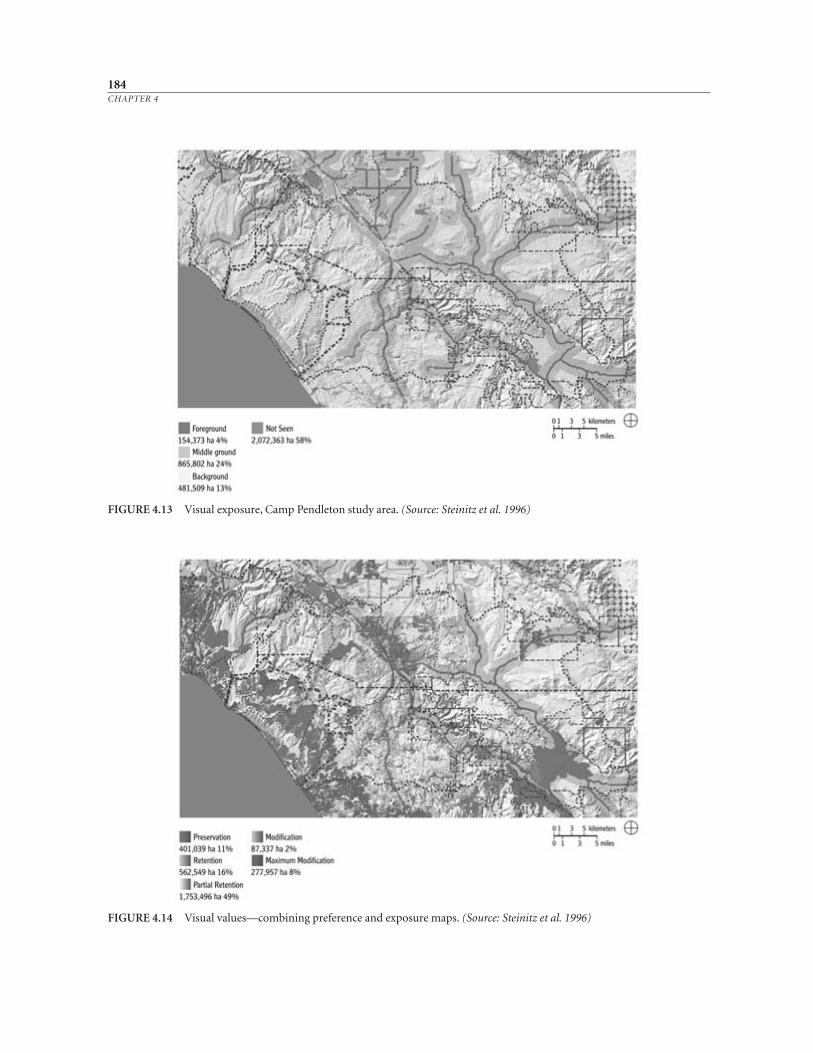
184CHAPTER 4
FIGURE 4.14 Visual values—combining preference and exposure maps. (Source: Steinitz et al. 1996)
FIGURE 4.13 Visual exposure, Camp Pendleton study area. (Source: Steinitz et al. 1996)
the Camp Pendleton and Pinelands planning stud-
ies from more conventional efforts. Furthermore,
Jon Berger and John Sinton (1985) have provided
lively sketches of people from the Pine Barrens who
spend their days and nights clamming, crabbing,
trapping, oystering, fishing, hunting, farming cran-
berries and blueberries, truck farming fruits and
vegetables, and controlling the fires that are much a
part of the ecosystem. Both the Pinelands and the
Camp Pendleton plans include accounts of regional
histories. Both planning studies also conducted de-
tailed visual quality analyses. Such knowledge about
how people live and relate to their environment is
too often absent from the information-collection
phase of planning processes. This information is
crucial for the planning process to be humanized.
185HUMAN COMMUNITY INVENTORY AND ANALYSIS
5SUITABILITY ANALYSIS
187
Once an ecological inventory of a place has been conducted, and some understand-
ing of the relationships between people and environment has been achieved, it is
then necessary to make more detailed studies of these interactions to present op-
tions for future use. One such type of detailed study is a suitability analysis.“Consult
the Genius of the place in all,” Alexander Pope suggested, and this is an apt definition
of suitability analysis.
There are also several more recent (and rather more wordy and cumbersome)
definitions. Often, capability and suitability are two words that are used interchange-
ably; however, there is enough subtle variation in how these terms have been
adapted for the purpose of land classification that it would be useful to define each.
To be capable is to have the ability or strength to be qualified or fitted for or to be sus-
ceptible or open to the influence or effect of. To be suitable is to be appropriate, fit-
ting, or becoming (Barnhart 1953).
Various definitions for land- capability analysis have been proposed. Land-
capability classification has been defined by soil scientists as a grouping of kinds of
soil into special units, subclasses, and classes according
to their potential uses and the treatments required for
their sustained use (Brady 1974; Brady and Weil 1996).
An alternate definition is evaluation based on an inher-
ent, natural, or intrinsic ability of the resource to pro-
vide for use, which includes abilities that result from
past alterations or current management practices. A
third definition, suggested by the U.S. Geological Sur-
vey, relies solely on geologic and hydrologic informa-
tion. According to this definition, land- capability
analysis measures the ability of land to support differ-
ent types of development with a given level of geologic
and hydrologic costs (Laird et al. 1979, 2). A fourth def-
inition has been developed by the U.S. Forest Service to
implement the Forest and Rangeland Renewable Re-
sources Planning Act of 1974. According to the USFS,
capability is “the potential of an area of land to produce
resources, supply goods and services and allow resource
uses under an assumed set of management practices
and at a given level of management intensity” (U.S.
Congress 1979, 53984).
Land suitability may be defined as the fitness of a
given tract of land for a defined use (Food and Agri-
culture Organization of the United Nations 1977).
Differences in the degree of suitability are determined
by the relationship, actual or anticipated, between
benefits and the required changes associated with the
use on the tract in question (Brinkman and Smyth
1973). Another definition for suitability analysis, pro-
vided by the USFS, is “the resource management prac-
tices to a particular area of land, as determined by an
analysis of the economic and environmental conse-
quences” (U.S. Congress 1979, 53985). For this chap-
ter, suitability analysis is considered to be the process
of determining the fitness, or the appropriateness, of a
given tract of land for a specified use.
In this chapter, three specific suitability approaches,
computer applications, and the carrying- capacity con-
cept are reviewed. Two applications of suitability analy-
sis are discussed as examples: Medford Township, New
Jersey; and Whitman County, Washington.
Approaches to Suitability Analysis—Methods
Three approaches to suitability analysis that merit
closer review include (1) several NRCS systems, (2)
the McHarg suitability analysis method, and (3)
suitability analysis methods developed in the
Netherlands.
Natural Resources Conservation
Service Systems
The oldest, most established system for defining the
ability of soil to support agronomic uses is the U.S.
Soil Conservation Service capability classification.
As a result of the disastrous effects of the dust bowl
era, the Soil Erosion Service was established in 1933
by the Franklin Roosevelt administration. The
agency was reorganized and named the Soil Conser-
vation Service in 1935, which in turn was renamed
the Natural Resources Conservation Service in 1994.
The NRCS works closely with a system of locally
elected conservation district boards responsible for
soil and water conservation policy in almost every
county of the United States. The conservation dis-
tricts receive technical assistance locally from pro-
fessional NRCS conservationists.
The capability classification is one of several in-
terpretive groupings made by the NRCS in standard
soil surveys. Capability classes are based on soil
types as mapped and interpreted by the NRCS. They
were developed to assist farmers with agricultural
management practices. While there are other sys-
tems that have also been developed to classify soils
for agriculture (Donahue et al. 1977; Reganold and
Singer 1978, 1979), the NRCS system is the most
common one in the United States. Groupings are
made according to the limitations of the soils when
they are used for field crops, the risk of damage
when they are used, and the manner in which they
respond to management. The classification does not
take into account major construction activity that
188CHAPTER 5
would alter slope, soil depth, or other soil character-
istics. Nor does it take into account reclamation
projects or apply to rice, cranberries, horticultural
crops, or other crops requiring special management
(Davis et al. 1976).
In the capability system, all kinds of soils are
grouped at three levels: the capability class, the sub-
class, and the unit (Soil Conservation Service 1975;
Soil Survey Staff 1951, 1975a, 1975b). The following
description of three major categories of capability
classification was adopted from Klingebiel and
Montgomery (1961), Singer et al. (1979), and Davis
et al. (1976). Capability classes are the broadest
groups and are designated by Roman numerals I to
VIII. The numerals indicate progressively greater
limitations and narrower choices for practical agri-
cultural use, defined as follows: Class I soils have few
limitations that restrict their use. Class II soils have
moderate limitations that reduce the choice of
plants that can be grown or require moderate con-
servation practices. Class III soils have severe limita-
tions that reduce the choice of plants that can be
grown, require special conservation practices, or
both. Class IV soils have very severe limitations that
reduce the choice of plants that can be grown, re-
quire very careful management, or both. Class V
soils are not likely to erode but have other limita-
tions that limit their use mainly to pasture or range,
woodland, or wildlife habitat. Class VI soils have se-
vere limitations that make them generally unsuited
to cultivation and limit their use mainly to pasture
or range, woodland, or wildlife habitat. Class VII
soils have very severe limitations that make them
unsuited for commercial crop production and re-
strict their use to recreation, wildlife habitat, water
supply, or aesthetic purposes. Class VIII soils and
land-forms have limitations that preclude their use
for commercial plant production and restrict their
use to recreation, wildlife habitat, water supply, or
aesthetic uses (Klingebiel and Montgomery 1961;
Singer et al. 1979; Davis et al. 1976).
Capability subclasses are soil groups within one
class. They are identified by adding the lowercase
letters e, w, s, or c to the Roman numeral; for exam-
ple, IIe. The letter e indicates that the chief limita-
tion is risk of erosion unless close- growing plant
cover is maintained. The letter w indicates that wa-
ter in or on the soil interferes with plant growth or
cultivation. The letter s shows that the soil is limited
primarily because it is shallow, droughty, or stony;
while c shows that the major limitation is that the
climate is too cold or too dry. In class I there are no
subclasses because there are no limitations on this
class. On the other hand, subsequent classes may
contain several subclasses (Singer et al. 1979; Davis
et al. 1976; Broderson 1994).
Capability units are further distinctions of soil
groups within the subclasses. The soils in one capa-
bility unit are sufficiently similar to be suited to the
same crops and pasture plants, to require similar
management, and to have similar productivity and
other responses to management. Capability units
are identified by the addition of an Arabic numeral
to the subclass symbol; for example, IIe- 2 or IIIe- 3
(Singer et al. 1979; Davis et al. 1976).
In addition to capability classification for agro-
nomic uses, soil surveys also include interpretation
of limitations for such land uses as septic tanks,
sewage lagoons, homesites, lawns, streets and park-
ing lots, athletic fields, parks and play areas, camp-
sites, sanitary landfills, and cemeteries. Soil conser-
vationists have long stressed that the main purpose
of soil survey information is for agriculture and that
capability classes were developed specifically for row
crops. Nevertheless, soil survey information has
been increasingly utilized by planners, landscape ar-
chitects, and civil engineers, because it is the most
ubiquitous standard source of information about
the natural environment in the United States avail-
able on the local level.
Soil surveys are seen to be useful for community
and regional planning by their authors. Take, for
example, this statement from the Montgomery
County (Dayton), Ohio, soil survey:
189SUITABILITY ANALYSIS
The expansion of nonfarm uses of land can remove
many acres from farming in a short time. Freeways
and super highways can displace up to about 50 acres
per mile [20.25 hectares per mile; 31.25 acres or 12.66
hectares per kilometer]. A shopping center can easily
replace 50 to 100 acres of farmland [20.25 to 40.5
hectares]. These uses tend to permanently remove
land from farm use.
The rapid suburban expansion has emphasized
soil- related problems that builders must deal with. For
example, some of the soils have severe limitations for
use as septic tank disposal fields, some are shallow to
hard limestone bedrock, some are underlain by a
porous substratum and are droughty, some are easily
eroded, and a few soils have no serious limitations.
Two of the most serious concerns in community de-
velopment are the limitations of the soils for septic
tank disposal fields and the erosion hazard. Improp-
erly functioning septic tank systems are a threat to
health in areas where the soils have severe limitations
for this use. Erosion losses in developing areas are
commonly much higher than on comparable farm-
land, particularly during periods of construction. Ero-
sion control practices, therefore, become very impor-
tant in areas undergoing development. Specific
erosion control practices for use in rural- fringe areas
have been developed by the Soil Conservation Service.
City officials and developers interested in these prac-
tices can obtain information about them from the of-
fice of the Montgomery Soil and Water Conservation
District (Davis et al. 1976, 34–35).
Several researchers have illustrated how soil sur-
vey information can be applied to planning and re-
source management (Bartelli et al. 1966; Lynch
1971; McCormack 1974; Meyers et al. 1979; and
Lynch and Hack 1984). Fred Miller (1978) has de-
scribed how soil surveys have been criticized be-
cause of the limitations of information for urban
land- use planning. According to the research of
Steven Gordon and Gaybrielle Gordon (1981), soil
survey information was found to be accurate for
septic tank limitations but very inconsistent for
homesites and roads. They warn that “this implies
that planners must use these published ratings with
extreme caution in making environmental and
land- use planning decisions and that consultation
with state and local soil experts should be sought”
(Gordon and Gordon 1981, 301).
As a result of the shortcomings of the soil sur-
veys, a dilemma is faced by conservationists and
planners alike. Soil conservationists have done an
excellent job mapping and classifying land in the
United States and have generated the most uni-
formly available source of physical science informa-
tion. Planners faced with tight budgets must use soil
survey information because they lack the time
and/or money and expertise to generate original
data.
The NRCS has met the growing demand for its
products with new systems to assist planners and re-
source managers. One such effort is the NRCS im-
portant farmland mapping program. This classifica-
tion system identifies two major categories of
farmland of national importance, prime and unique
lands, and two other categories, farmlands of
statewide and of local importance. There are na-
tional criteria for the first two categories, while the
latter have criteria established on the state level
(Dideriksen 1984).
The important farmland mapping program
(coupled with the publication of the National Agri-
cultural Lands Study [1981] that documented a loss
in the prime cropland base of the nation) presented
new problems for both planners and soil conserva-
tionists. For instance, in DeKalb County, Illinois, 97
percent of the land is prime farmland. Obviously
not all this land can be preempted for agricultural
use, because there are demands for other uses also.
On the other hand, in Whitman County, Washing-
ton, only 2.8 percent of the land is prime. Most of
the land is excluded from the prime category be-
cause of steep slopes and high erosion potential. Yet
Whitman is the most productive winter white wheat
190CHAPTER 5
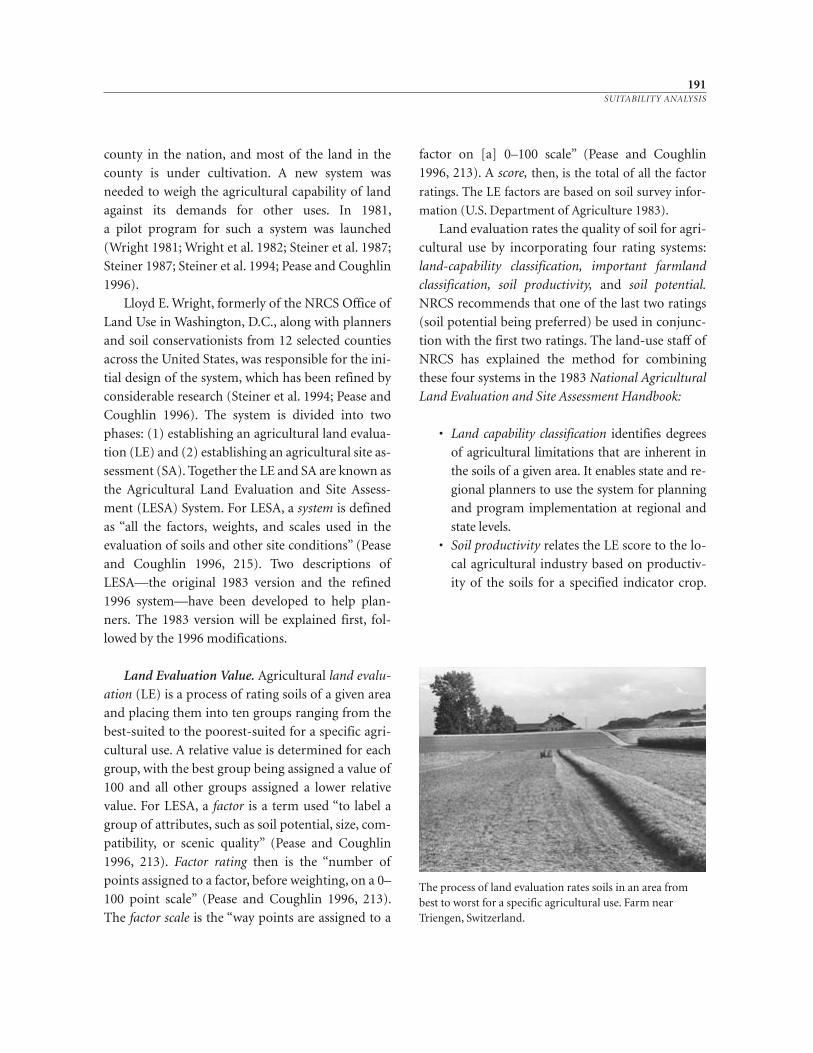
county in the nation, and most of the land in the
county is under cultivation. A new system was
needed to weigh the agricultural capability of land
against its demands for other uses. In 1981,
a pilot program for such a system was launched
(Wright 1981; Wright et al. 1982; Steiner et al. 1987;
Steiner 1987; Steiner et al. 1994; Pease and Coughlin
1996).
Lloyd E. Wright, formerly of the NRCS Office of
Land Use in Washington, D.C., along with planners
and soil conservationists from 12 selected counties
across the United States, was responsible for the ini-
tial design of the system, which has been refined by
considerable research (Steiner et al. 1994; Pease and
Coughlin 1996). The system is divided into two
phases: (1) establishing an agricultural land evalua-
tion (LE) and (2) establishing an agricultural site as-
sessment (SA). Together the LE and SA are known as
the Agricultural Land Evaluation and Site Assess-
ment (LESA) System. For LESA, a system is defined
as “all the factors, weights, and scales used in the
evaluation of soils and other site conditions” (Pease
and Coughlin 1996, 215). Two descriptions of
LESA—the original 1983 version and the refined
1996 system—have been developed to help plan-
ners. The 1983 version will be explained first, fol-
lowed by the 1996 modifications.
Land Evaluation Value. Agricultural land evalu-
ation (LE) is a process of rating soils of a given area
and placing them into ten groups ranging from the
best- suited to the poorest- suited for a specific agri-
cultural use. A relative value is determined for each
group, with the best group being assigned a value of
100 and all other groups assigned a lower relative
value. For LESA, a factor is a term used “to label a
group of attributes, such as soil potential, size, com-
patibility, or scenic quality” (Pease and Coughlin
1996, 213). Factor rating then is the “number of
points assigned to a factor, before weighting, on a 0–
100 point scale” (Pease and Coughlin 1996, 213).
The factor scale is the “way points are assigned to a
factor on [a] 0–100 scale” (Pease and Coughlin
1996, 213). A score, then, is the total of all the factor
ratings. The LE factors are based on soil survey infor-
mation (U.S. Department of Agriculture 1983).
Land evaluation rates the quality of soil for agri-
cultural use by incorporating four rating systems:
land- capability classification, important farmland
classification, soil productivity, and soil potential.
NRCS recommends that one of the last two ratings
(soil potential being preferred) be used in conjunc-
tion with the first two ratings. The land- use staff of
NRCS has explained the method for combining
these four systems in the 1983 National Agricultural
Land Evaluation and Site Assessment Handbook:
• Land capability classification identifies degrees
of agricultural limitations that are inherent in
the soils of a given area. It enables state and re-
gional planners to use the system for planning
and program implementation at regional and
state levels.
• Soil productivity relates the LE score to the lo-
cal agricultural industry based on productiv-
ity of the soils for a specified indicator crop.
191SUITABILITY ANALYSIS
The process of land evaluation rates soils in an area frombest to worst for a specific agricultural use. Farm near Triengen, Switzerland.
The use of both soil productivity and land ca-
pability classification should provide some in-
dication of relative net income expected from
each category of soils.
• Soil potentials for specified indicator crops are
preferred in place of soil productivity in the
LE system. Soil potential ratings classify soils
based on a standard of performance and
recognition of the costs of overcoming soil
limitations, plus the cost of continuing limita-
tions if any exist. These classes enable planners
to understand the local agricultural industry.
• Important farmland classification enables
planners to identify prime and other impor-
tant farmlands at the local level. Use of the na-
tional criteria for definition of prime farm-
land provides a consistent basis for
comparison of local farmland with farmland
in other areas (Adapted from U.S. Department
of Agriculture 1983).
The NRCS recommends that soils be arrayed
into ten groups ranging from the best- to the worst-
suited for the agricultural use considered (cropland,
rangeland, forest). Each group should contain ap-
proximately 10 percent of the total planning area
(U.S. Department of Agriculture 1983). The num-
ber of soils in each group may vary depending on
the soil composition in the area. Three evaluation
systems are used in the ranking to prevent the possi-
bility that any one method would have an undue ef-
fect on the final outcome. For example, soil produc-
tivity may be used to establish the initial groupings.
These groupings are then modified based on the
other evaluation systems. Specifically, two soils may
have the same productivity rating but different land
capability ratings. In this case, the soil type with the
better land capability rating would be placed in a
higher grouping. Similarly, prime soils (according to
the important farmland classification) would be
placed in a higher grouping than soils of statewide
importance even though both soils may have the
same productivity rating.
A relative value is determined for each agricul-
tural grouping based on adjusted average yields.
That is, a weighted- average yield is calculated for
each soil type within the grouping. The weighted-
average yield for each grouping is then expressed
as a percentage of the highest weighted- average
yield. This percentage becomes the relative value
for each agricultural grouping, and the relative
value is the LE value that is combined with the
site assessment value (U.S. Department of Agri-
culture 1983). Table 5.1 gives an example of the
worksheet from which the LE relative values are
determined.
Site Assessment Value. Although the value from
the LE system provides a good indication of the rel-
ative quality of a soil for a particular agricultural
use, it does not take into account the effect of loca-
tion, distance to market, adjacent land uses, zoning,
and other considerations that determine land suit-
ability. In other words, relative agricultural value is
only one of many site attributes, or factors, that
may be considered by planners and land- use deci-
sion makers. Consequently, NRCS has created the
site assessment (SA) system to incorporate some
of these other factors into the decision- making
process.
The factors that are included in the SA system
form seven groups: agricultural land use; agricul-
tural viability factors; land- use regulations and tax
concessions; options to proposed use; impact of
proposed use; compatibility with, and importance
to, comprehensive development plans; and urban
infrastructure. The following listed factors were
identified in the 1983 LESA handbook for use in site
assessment procedures:
Agricultural land use
• Percentage of area in agriculture use within 1
mile
• Percentage of site farmed in two of the last ten
years
• Land use adjacent to site
192CHAPTER 5
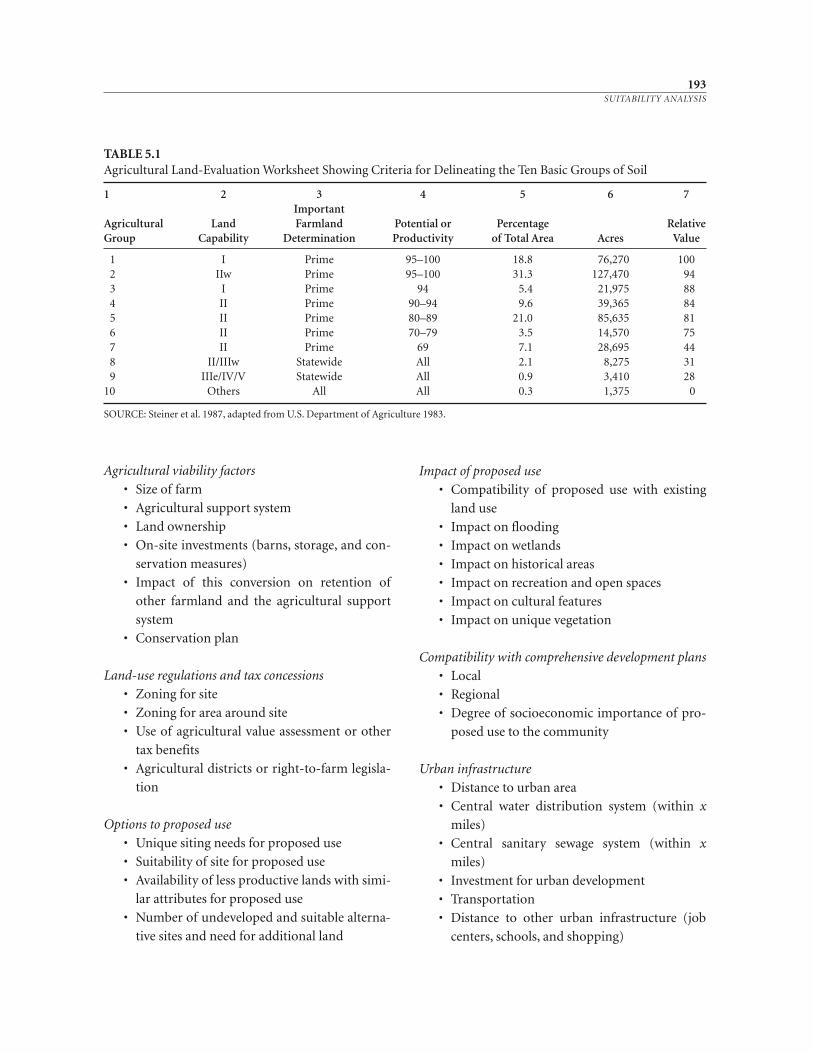
Agricultural viability factors
• Size of farm
• Agricultural support system
• Land ownership
• On- site investments (barns, storage, and con-
servation measures)
• Impact of this conversion on retention of
other farmland and the agricultural support
system
• Conservation plan
Land- use regulations and tax concessions
• Zoning for site
• Zoning for area around site
• Use of agricultural value assessment or other
tax benefits
• Agricultural districts or right- to- farm legisla-
tion
Options to proposed use
• Unique siting needs for proposed use
• Suitability of site for proposed use
• Availability of less productive lands with simi-
lar attributes for proposed use
• Number of undeveloped and suitable alterna-
tive sites and need for additional land
Impact of proposed use
• Compatibility of proposed use with existing
land use
• Impact on flooding
• Impact on wetlands
• Impact on historical areas
• Impact on recreation and open spaces
• Impact on cultural features
• Impact on unique vegetation
Compatibility with comprehensive development plans
• Local
• Regional
• Degree of socioeconomic importance of pro-
posed use to the community
Urban infrastructure
• Distance to urban area
• Central water distribution system (within x
miles)
• Central sanitary sewage system (within x
miles)
• Investment for urban development
• Transportation
• Distance to other urban infrastructure (job
centers, schools, and shopping)
193SUITABILITY ANALYSIS
TABLE 5.1Agricultural Land- Evaluation Worksheet Showing Criteria for Delineating the Ten Basic Groups of Soil
1 2 3 4 5 6 7Important
Agricultural Land Farmland Potential or Percentage RelativeGroup Capability Determination Productivity of Total Area Acres Value
1 I Prime 95–100 18.8 76,270 1002 IIw Prime 95–100 31.3 127,470 943 I Prime 94 5.4 21,975 884 II Prime 90–94 9.6 39,365 845 II Prime 80–89 21.0 85,635 816 II Prime 70–79 3.5 14,570 757 II Prime 69 7.1 28,695 448 II/IIIw Statewide All 2.1 8,275 319 IIIe/IV/V Statewide All 0.9 3,410 28
10 Others All All 0.3 1,375 0
SOURCE: Steiner et al. 1987, adapted from U.S. Department of Agriculture 1983.
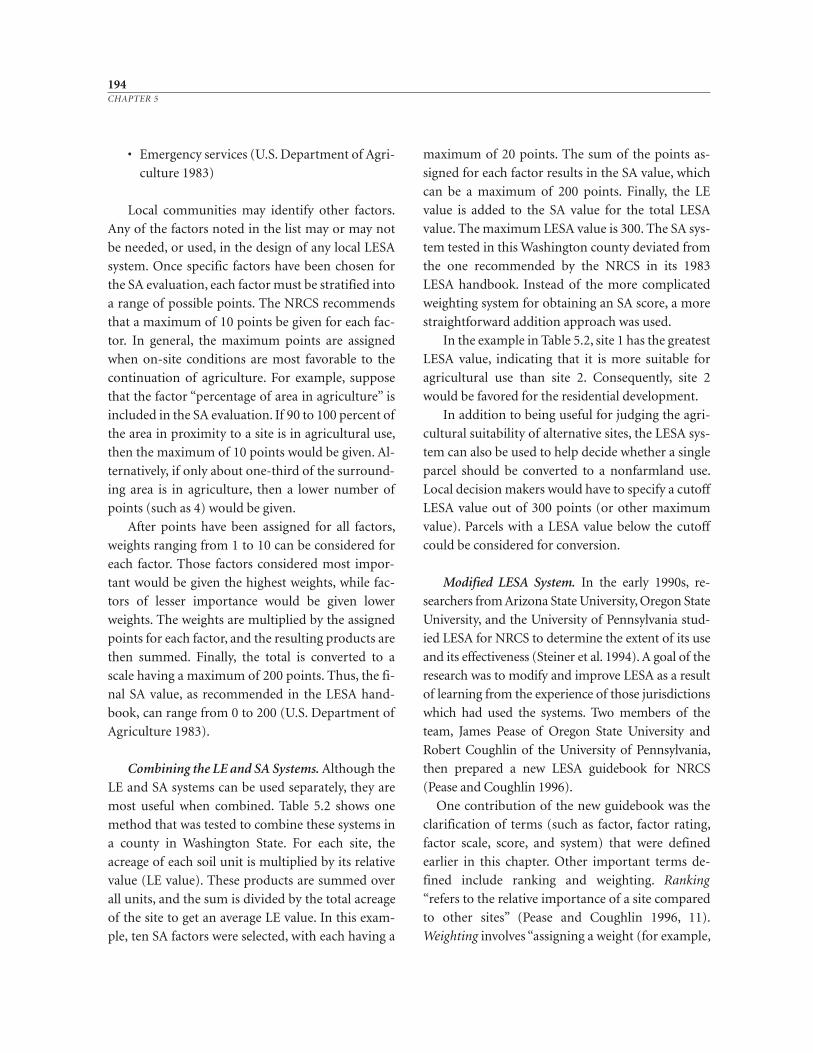
• Emergency services (U.S. Department of Agri-
culture 1983)
Local communities may identify other factors.
Any of the factors noted in the list may or may not
be needed, or used, in the design of any local LESA
system. Once specific factors have been chosen for
the SA evaluation, each factor must be stratified into
a range of possible points. The NRCS recommends
that a maximum of 10 points be given for each fac-
tor. In general, the maximum points are assigned
when on- site conditions are most favorable to the
continuation of agriculture. For example, suppose
that the factor “percentage of area in agriculture” is
included in the SA evaluation. If 90 to 100 percent of
the area in proximity to a site is in agricultural use,
then the maximum of 10 points would be given. Al-
ternatively, if only about one- third of the surround-
ing area is in agriculture, then a lower number of
points (such as 4) would be given.
After points have been assigned for all factors,
weights ranging from 1 to 10 can be considered for
each factor. Those factors considered most impor-
tant would be given the highest weights, while fac-
tors of lesser importance would be given lower
weights. The weights are multiplied by the assigned
points for each factor, and the resulting products are
then summed. Finally, the total is converted to a
scale having a maximum of 200 points. Thus, the fi-
nal SA value, as recommended in the LESA hand-
book, can range from 0 to 200 (U.S. Department of
Agriculture 1983).
Combining the LE and SA Systems. Although the
LE and SA systems can be used separately, they are
most useful when combined. Table 5.2 shows one
method that was tested to combine these systems in
a county in Washington State. For each site, the
acreage of each soil unit is multiplied by its relative
value (LE value). These products are summed over
all units, and the sum is divided by the total acreage
of the site to get an average LE value. In this exam-
ple, ten SA factors were selected, with each having a
maximum of 20 points. The sum of the points as-
signed for each factor results in the SA value, which
can be a maximum of 200 points. Finally, the LE
value is added to the SA value for the total LESA
value. The maximum LESA value is 300. The SA sys-
tem tested in this Washington county deviated from
the one recommended by the NRCS in its 1983
LESA handbook. Instead of the more complicated
weighting system for obtaining an SA score, a more
straightforward addition approach was used.
In the example in Table 5.2, site 1 has the greatest
LESA value, indicating that it is more suitable for
agricultural use than site 2. Consequently, site 2
would be favored for the residential development.
In addition to being useful for judging the agri-
cultural suitability of alternative sites, the LESA sys-
tem can also be used to help decide whether a single
parcel should be converted to a nonfarmland use.
Local decision makers would have to specify a cutoff
LESA value out of 300 points (or other maximum
value). Parcels with a LESA value below the cutoff
could be considered for conversion.
Modified LESA System. In the early 1990s, re-
searchers from Arizona State University, Oregon State
University, and the University of Pennsylvania stud-
ied LESA for NRCS to determine the extent of its use
and its effectiveness (Steiner et al. 1994). A goal of the
research was to modify and improve LESA as a result
of learning from the experience of those jurisdictions
which had used the systems. Two members of the
team, James Pease of Oregon State University and
Robert Coughlin of the University of Pennsylvania,
then prepared a new LESA guidebook for NRCS
(Pease and Coughlin 1996).
One contribution of the new guidebook was the
clarification of terms (such as factor, factor rating,
factor scale, score, and system) that were defined
earlier in this chapter. Other important terms de-
fined include ranking and weighting. Ranking
“refers to the relative importance of a site compared
to other sites” (Pease and Coughlin 1996, 11).
Weighting involves “assigning a weight (for example,
194CHAPTER 5
0–1.0) to each factor in order to recognize the rela-
tive importance of the factor in the LESA system”
(Pease and Coughlin 1996, 11).
Pease and Coughlin developed a flowchart to ex-
plain how to develop a local LESA system (Figure
5.1). They suggest the formation of a local LESA
committee, which may be divided into separate LE
and SA committees, to choose and scale factors
(Pease and Coughlin 1996). The LE factors in the
modified LESA remain relatively similar to the orig-
inal 1983 version, although Pease and Coughlin
stress that they should be “soil- based factors” (1996,
13).
Much innovation has occurred when using the
SA factors in place of the original system. Pease and
Coughlin recommend three levels of site assess-
ment:
• SA- 1: Factors other than soil- based qualities
measuring limitations on agricultural produc-
tivity or farm practices.
• SA- 2: Factors measuring development pres-
sure or land conversion.
• SA- 3: Factors measuring other public val-
ues, such as historic or scenic values (1996,
13).
195SUITABILITY ANALYSIS
TABLE 5.2Hypothetical Example Demonstrating a Possible Use of the Combined LE and SA Systems in a Washington State County
Proposed land use: single- family residential developmentSite 1: 23 acres of Palouse silt loam, 7–25% slope with LE of 87
37 acres of Anders silt loam, 3–15% slope with LE of 48
Site 2: 32 acres of Cheney silt loam, 0–7% slope with LE of 8023 acres of Staley silt loam, 7–25% slope with LE of 63
Land evaluation:Site 1 Site 223 × 87 = 2,001 32 × 80 = 2,56037 × 48 = 1,776 23 × 63 = 1,449
3,777 4,009
Average LE rating = = 63 Average LE rating = = 73
Site assessment factors Max.pts. Site 1 Site 2
1. Percentage of area in agriculture within 1 mile 20 20 102. Land use adjacent to site 20 20 103. Wasting agricultural land 20 20 154. Availability of nonagricultural land for proposal 20 20 155. Compatibility with comprehensive plan and zoning 20 17 156. Availability of public services 20 15 107. Compatibility of proposed use with surrounding use 20 20 158. Environmental factors 20 20 159. Open- space taxation 20 15 10
10. Other factors unique to the site 20 15 13Total site assessment points 200 182 128Average land evaluation rating 100 63 73Total points (total of previous two lines) 300 245 201Choice for development: Site 2
SOURCE: Steiner et al. 1987.
4,00932 + 23
3,77723 + 37
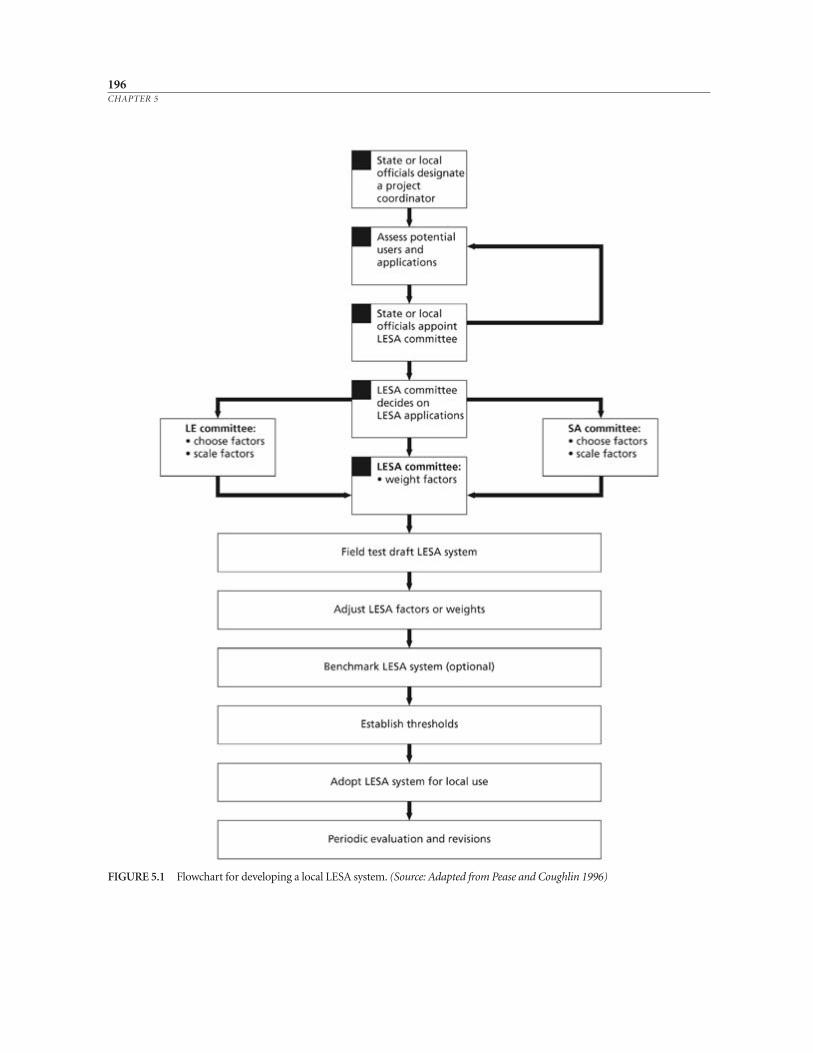
196CHAPTER 5
FIGURE 5.1 Flowchart for developing a local LESA system. (Source: Adapted from Pease and Coughlin 1996)
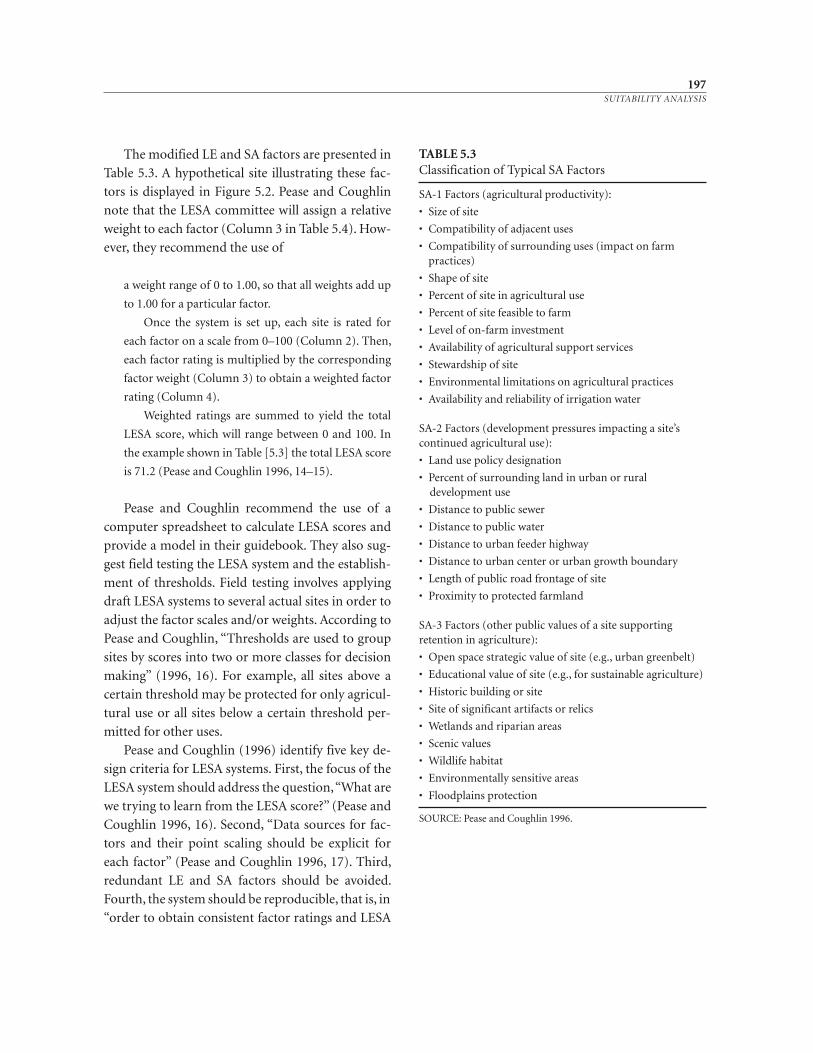
The modified LE and SA factors are presented in
Table 5.3. A hypothetical site illustrating these fac-
tors is displayed in Figure 5.2. Pease and Coughlin
note that the LESA committee will assign a relative
weight to each factor (Column 3 in Table 5.4). How-
ever, they recommend the use of
a weight range of 0 to 1.00, so that all weights add up
to 1.00 for a particular factor.
Once the system is set up, each site is rated for
each factor on a scale from 0–100 (Column 2). Then,
each factor rating is multiplied by the corresponding
factor weight (Column 3) to obtain a weighted factor
rating (Column 4).
Weighted ratings are summed to yield the total
LESA score, which will range between 0 and 100. In
the example shown in Table [5.3] the total LESA score
is 71.2 (Pease and Coughlin 1996, 14–15).
Pease and Coughlin recommend the use of a
computer spreadsheet to calculate LESA scores and
provide a model in their guidebook. They also sug-
gest field testing the LESA system and the establish-
ment of thresholds. Field testing involves applying
draft LESA systems to several actual sites in order to
adjust the factor scales and/or weights. According to
Pease and Coughlin, “Thresholds are used to group
sites by scores into two or more classes for decision
making” (1996, 16). For example, all sites above a
certain threshold may be protected for only agricul-
tural use or all sites below a certain threshold per-
mitted for other uses.
Pease and Coughlin (1996) identify five key de-
sign criteria for LESA systems. First, the focus of the
LESA system should address the question, “What are
we trying to learn from the LESA score?” (Pease and
Coughlin 1996, 16). Second, “Data sources for fac-
tors and their point scaling should be explicit for
each factor” (Pease and Coughlin 1996, 17). Third,
redundant LE and SA factors should be avoided.
Fourth, the system should be reproducible, that is, in
“order to obtain consistent factor ratings and LESA
197SUITABILITY ANALYSIS
TABLE 5.3Classification of Typical SA Factors
SA- 1 Factors (agricultural productivity):
• Size of site
• Compatibility of adjacent uses
• Compatibility of surrounding uses (impact on farm practices)
• Shape of site
• Percent of site in agricultural use
• Percent of site feasible to farm
• Level of on- farm investment
• Availability of agricultural support services
• Stewardship of site
• Environmental limitations on agricultural practices
• Availability and reliability of irrigation water
SA- 2 Factors (development pressures impacting a site’scontinued agricultural use):
• Land use policy designation
• Percent of surrounding land in urban or ruraldevelopment use
• Distance to public sewer
• Distance to public water
• Distance to urban feeder highway
• Distance to urban center or urban growth boundary
• Length of public road frontage of site
• Proximity to protected farmland
SA- 3 Factors (other public values of a site supportingretention in agriculture):
• Open space strategic value of site (e.g., urban greenbelt)
• Educational value of site (e.g., for sustainable agriculture)
• Historic building or site
• Site of significant artifacts or relics
• Wetlands and riparian areas
• Scenic values
• Wildlife habitat
• Environmentally sensitive areas
• Floodplains protection
SOURCE: Pease and Coughlin 1996.
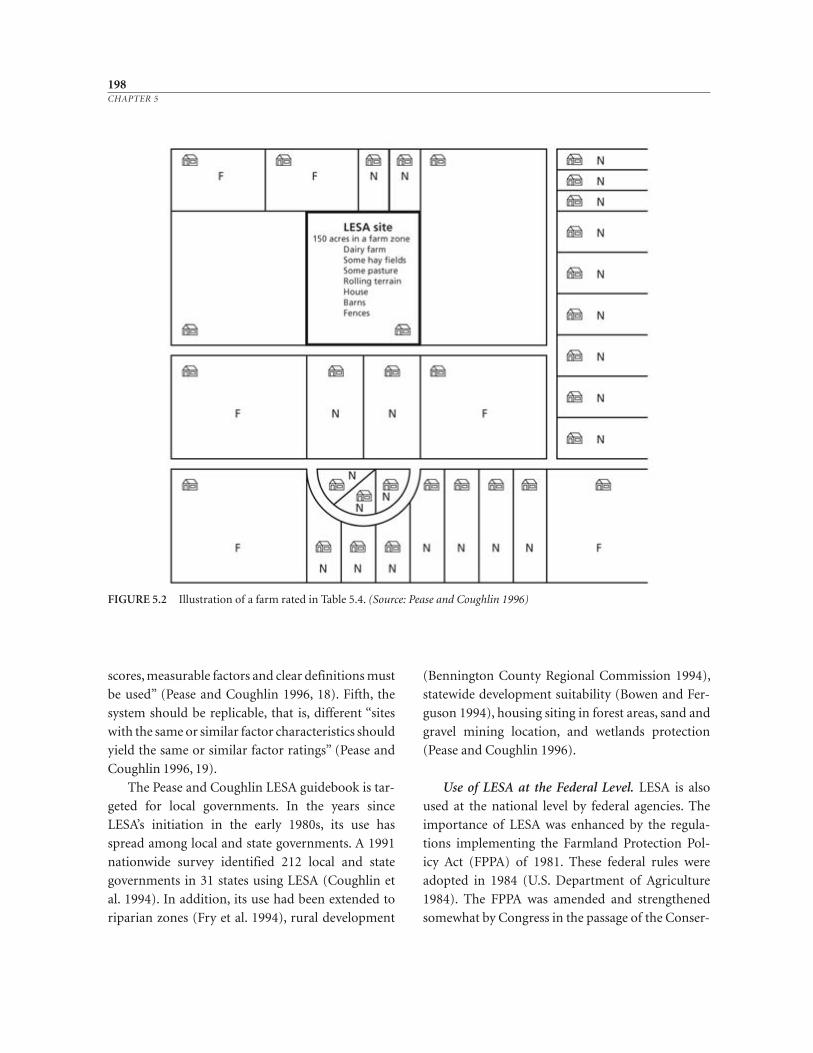
scores, measurable factors and clear definitions must
be used” (Pease and Coughlin 1996, 18). Fifth, the
system should be replicable, that is, different “sites
with the same or similar factor characteristics should
yield the same or similar factor ratings” (Pease and
Coughlin 1996, 19).
The Pease and Coughlin LESA guidebook is tar-
geted for local governments. In the years since
LESA’s initiation in the early 1980s, its use has
spread among local and state governments. A 1991
nationwide survey identified 212 local and state
governments in 31 states using LESA (Coughlin et
al. 1994). In addition, its use had been extended to
riparian zones (Fry et al. 1994), rural development
(Bennington County Regional Commission 1994),
statewide development suitability (Bowen and Fer-
guson 1994), housing siting in forest areas, sand and
gravel mining location, and wetlands protection
(Pease and Coughlin 1996).
Use of LESA at the Federal Level. LESA is also
used at the national level by federal agencies. The
importance of LESA was enhanced by the regula-
tions implementing the Farmland Protection Pol-
icy Act (FPPA) of 1981. These federal rules were
adopted in 1984 (U.S. Department of Agriculture
1984). The FPPA was amended and strengthened
somewhat by Congress in the passage of the Conser-
198CHAPTER 5
FIGURE 5.2 Illustration of a farm rated in Table 5.4. (Source: Pease and Coughlin 1996)
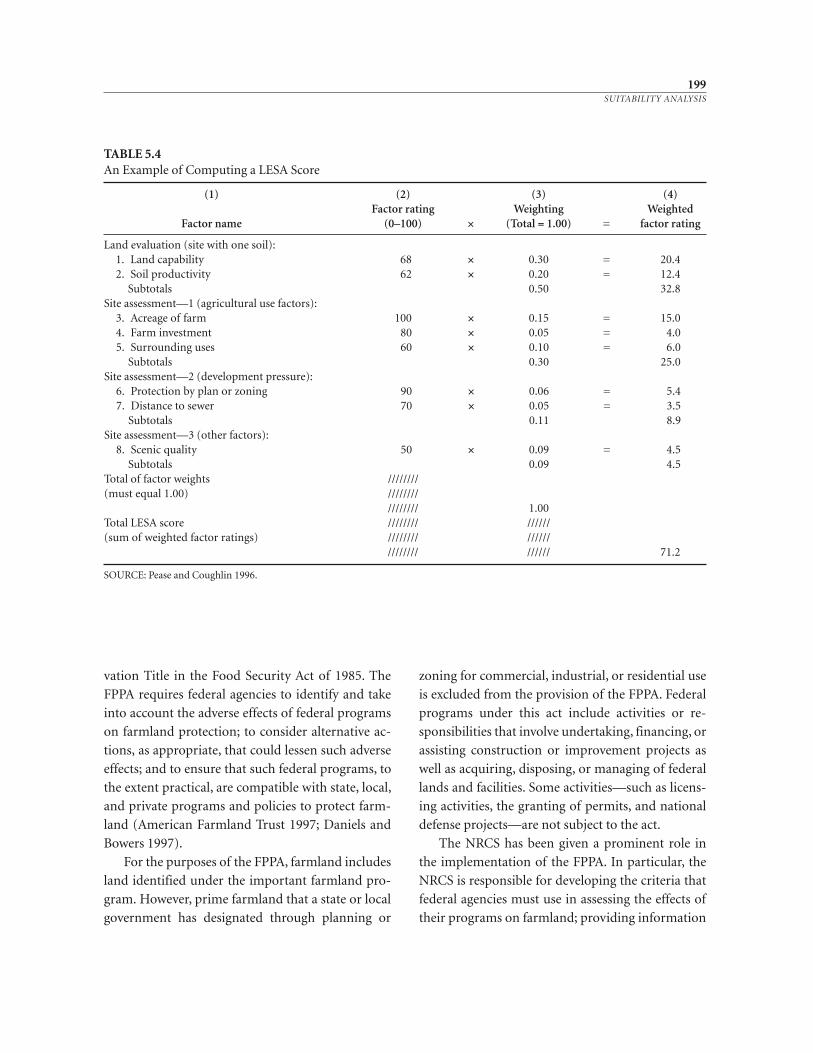
vation Title in the Food Security Act of 1985. The
FPPA requires federal agencies to identify and take
into account the adverse effects of federal programs
on farmland protection; to consider alternative ac-
tions, as appropriate, that could lessen such adverse
effects; and to ensure that such federal programs, to
the extent practical, are compatible with state, local,
and private programs and policies to protect farm-
land (American Farmland Trust 1997; Daniels and
Bowers 1997).
For the purposes of the FPPA, farmland includes
land identified under the important farmland pro-
gram. However, prime farmland that a state or local
government has designated through planning or
zoning for commercial, industrial, or residential use
is excluded from the provision of the FPPA. Federal
programs under this act include activities or re-
sponsibilities that involve under taking, financing, or
assisting construction or improvement projects as
well as acquiring, disposing, or managing of federal
lands and facilities. Some activities—such as licens-
ing activities, the granting of permits, and national
defense projects—are not subject to the act.
The NRCS has been given a prominent role in
the implementation of the FPPA. In particular, the
NRCS is responsible for developing the criteria that
federal agencies must use in assessing the effects of
their programs on farmland; providing information
199SUITABILITY ANALYSIS
TABLE 5.4An Example of Computing a LESA Score
(1) (2) (3) (4)Factor rating Weighting Weighted
Factor name (0–100) × (Total = 1.00) = factor rating
Land evaluation (site with one soil):1. Land capability 68 × 0.30 = 20.42. Soil productivity 62 × 0.20 = 12.4
Subtotals 0.50 32.8Site assessment—1 (agricultural use factors):
3. Acreage of farm 100 × 0.15 = 15.04. Farm investment 80 × 0.05 = 4.05. Surrounding uses 60 × 0.10 = 6.0
Subtotals 0.30 25.0Site assessment—2 (development pressure):
6. Protection by plan or zoning 90 × 0.06 = 5.47. Distance to sewer 70 × 0.05 = 3.5
Subtotals 0.11 8.9Site assessment—3 (other factors):
8. Scenic quality 50 × 0.09 = 4.5Subtotals 0.09 4.5
Total of factor weights ////////(must equal 1.00) ////////
//////// 1.00Total LESA score //////// //////(sum of weighted factor ratings) //////// //////
//////// ////// 71.2
SOURCE: Pease and Coughlin 1996.
to states, local governments, individuals, organiza-
tions, and other federal agencies useful in farmland
protection; and providing technical assistance to
states, local governments, and nonprofit organi-
zations wanting to develop farmland protection
programs.
Regarding criteria for assessing farmland effects,
the NRCS has mandated that federal agencies use
LESA. The LE value is determined by the NRCS on
the form (AD- 1006) shown in Figure 5.3. Federal
agencies must then determine the SA value and
combine it with the LE value as specified in the reg-
ulations implementing the FPPA. As can be seen
from Figure 5.3, the NRCS chose not to use the
more complex weighting system that it had recom-
mended for SA in its 1983 handbook. In addition,
the maximum SA value that can be obtained by fed-
eral agencies is 160 from the twelve SA factors rather
than the 200 maximum that the NRCS recommends
in its LESA handbook. Thus, the maximum LESA
value is 260 in Form AD- 1006, compared to the 300
maximum in the 1983 handbook and the 100 maxi-
mum in the 1996 guidebook. In cases where a state
or local government has adopted a LESA system and
this system has been certified by the NRCS state
conservationist, it is recommended that the federal
agencies use that system to make their evaluation of
the farmland conversion effects on their programs.
The McHarg, or University of Pennsylvania,
Suitability Analysis Method
The seminal explanation of suitability analysis was
provided by Ian McHarg (1969), based on his work
with colleagues and students at the University of
Pennsylvania, where he was an influential teacher.
Many of his colleagues and former students have
contributed to his suitability analysis method, so it
may be considered the “University of Pennsylvania
method.”
McHarg developed his method on a solid
bedrock of work in overlays by other landscape ar-
chitects, but McHarg’s contributions were unique
and important. Landscape architects began using
hand- drawn, sieve- mapping overlays in the late
nineteenth century. Pennsylvania State University
professor emeritus Lynn Miller (1996) credits
Charles Eliot and his associates in the office of Olm-
sted, Olmsted, and Eliot with pioneering overlays
through sun prints produced on their office win-
dows. Both Miller and McHarg acknowledge the
early contributions of Charles Eliot, an Olmsted
protégé, who worked systematically with scientists
to collect and map information to be used in plan-
ning and design. Warren Manning, an apprentice of
both Olmsted and Eliot, used soil and vegetation in-
formation with topography and their combined re-
lationship to land use to prepare four different maps
of the town of Billerica, Massachusetts, in 1912.
Manning’s Billerica Plan displayed recommenda-
tions and changes in the town’s circulation routes
and land use (Steinitz et al. 1976; Neckar 1989;
Manning 1913).
Eliot left the most explicit explanation about
why and how the overlays were employed. After
Eliot’s death, his father, Charles W. Eliot, the presi-
dent of Harvard, published the biography Charles
Eliot, Landscape Architect (1902), which was an in-
terpretation of his son’s work. This book provides
perhaps the first account of the overlay technique.
The Boston Metropolitan Park work undertaken by
Olmsted, Olmsted, and Eliot, with Eliot in charge,
involved six months of “diligent researches” (1902,
496). Eliot used a variety of consultants, including a
Massachusetts Institute of Technology professor, as
well as Olmsted staff members such as Manning, to
conduct surveys of the metropolitan region’s geol-
ogy, topography, and vegetation. These maps pro-
vided the basis for the overlay process, which Eliot
describes as follows:
By making use of sun- prints of the recorded bound-
ary plans, by measuring compass lines along the nu-
merous woodpaths, and by sketching the outlines of
200CHAPTER 5
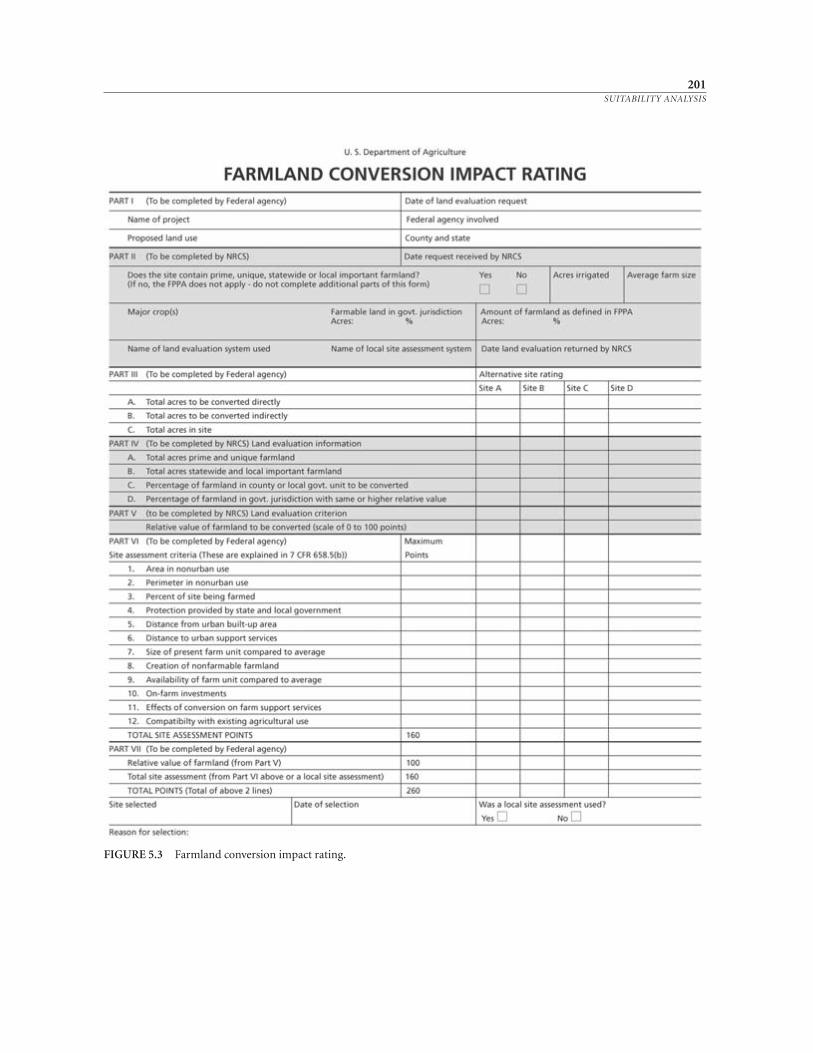
201SUITABILITY ANALYSIS
FIGURE 5.3 Farmland conversion impact rating.
swamps, clearings, ponds, hills, and valleys, extremely
serviceable maps were soon produced. The draught-
ing of the several sheets was done in our office. Upon
one sheet of tracing- cloth were drawn the bound-
aries, the roads and paths, and the lettering . . . on an-
other sheet were drawn the streams, ponds and
swamps; and on a third the hill shading was roughly
indicated by pen and pencil. Gray sun- prints ob-
tained from the three sheets superimposed in the
printing frame, when mounted on cloth, served very
well for all purposes of study. Photo- lithographed in
three colors, namely, black, blue, and brown, the same
sheets will serve as guide maps for the use of the pub-
lic and the illustration of reports.
Equipped with these maps, we have made good
progress, as before remarked, in familiarizing our-
selves with the “lay of the land” (1902, 496).
After Eliot and Manning there were several
studies in which the use of the overlay technique is
apparent, but a theoretical explanation about the
rationale for using the technique as an orderly
planning method was missing. The city plan for
Dusseldorf, Germany, in 1912; the Doncaster, Eng-
land, regional plan in 1922 (Abercrombie and
Johnson 1922); the 1929 regional plan of New York
and its environment (Regional Planning Staff
1929); and the 1943 London County plan (Forshaw
and Abercrombie 1943) incorporate typical charac-
teristics of the overlay process (Steinitz et al. 1976).
Thomas Adams, who directed the extensive 1929
New York regional planning study, addressed suit-
ability in his 1934 The Design of Residential Areas,
but mostly from an economic perspective. An aca-
demic discussion of the overlay technique did not
surface until 1950 and publication of the Town and
Country Planning Textbook containing an article by
Jacqueline Tyrwhitt that dealt explicitly with the
overlay technique (Steinitz et al. 1976; see also
Collins et al. 2000).
In an example given by Tyrwhitt (1950), four
maps (relief, hydrology, rock types, and soil
drainage) were drawn on transparent papers at the
same scale, and referenced to common control fea-
tures. These data maps were then combined into
one land characteristics map that provided a syn-
thesis, an interpretation, and a judicious blending of
the first four maps (Tyrwhitt 1950; Steinitz et al.
1976). This sieve- mapping, overlay method was
widely accepted and incorporated in the large- scale
planning of the British new towns and other devel-
opment projects after World War II (Lyle and Stutz
1983; McSheffrey 1999). At the end of the war Ian
McHarg took a correspondence course offered by
Tyrwhitt and others. McHarg was also involved in
new town planning in the early 1950s in Scotland, so
he was quite aware of the British new town pro-
gram. As a result, he was introduced to the concept
of overlay mapping early in his career.
George Angus Hills’s plan for Ontario Province
(1961) is a pioneering North American example
that employed a well- documented data- overlay
technique (Belknap and Furtado 1967, 1968; Naveh
and Lieberman 1994; Ndubisi 1997). Hills was on
the staff of the Ontario Department of Lands and
Forests. His technique divides regions into consecu-
tively smaller units of physiographic similarity
based on a gradient scale of climate and land-form
features. Through a process of comparing each
physiographic site type or homogeneous land unit
to a predetermined set of general land- use cate-
gories and rankings of potential or limitation for
each use or activity, the resulting units were re-
grouped into larger geographic patterns called land-
scape units and again ranked to determine their rel-
ative potentials for dominant and multiple uses. The
land- use activity with the highest feasibility ranking
within a landscape unit was recommended as a ma-
jor use (Belknap and Furtado 1967; Collins et al.
2000). The Hills method has been influential in the
development of the Canadian Land Inventory Sys-
tem (Coombs and Thie 1979).
202CHAPTER 5
The year after Hills’s Ontario plan, Philip Lewis, a
landscape architect at the University of Wisconsin–
Madison and principal consultant to the Wisconsin
Department of Resource Development, ap plied an
overlay analysis technique to evaluate natural re-
sources for the entire state of Wisconsin (Lewis 1964,
1969, 1996). Lewis had been recruited to Wisconsin
by Gaylord Nelson to start environmental planning
in the state. Lewis’s work was a direct response to the
growth and demand for outdoor recreation across
Wisconsin. According to Forster Ndubisi, “Unlike
Hills, whose work was based primarily on examining
biological and physical (biophysical) systems such as
landforms and soils, Lewis was concerned more with
perceptual features such as vegetation and outstand-
ing scenery” (1997, 21). Lewis stressed the impor-
tance of the patterns, both natural and cultural,
within the landscape. He combined individual land-
scape elements of water, wetlands, vegetation, and
significant topography through overlays onto a com-
posite map depicting Wisconsin’s areas of prime en-
vironmental importance (Belknap and Furtado 1967,
1968; Steinitz et al. 1976). By combining resource in-
ventory data and soil survey data, Lewis was able to
create maps that identified intrinsic (natural) pat-
terns. Once additional resources were grouped by
patterns and mapped, points were assigned to major
and additional resources and totaled to identify rela-
tive priority areas. Demand for planned uses and lim-
itations of each priority area for specific uses were
then combined to assign specific uses to each priority
area (Collins et al. 2000).
McHarg, Lewis, and Hills refined their ap-
proaches during the 1960s and built their work on
all these earlier efforts. McHarg especially advanced
previous methods significantly by linking suitability
analysis with theory. He provided a theoretical basis
for overlaying information. McHarg’s approach fo-
cused on mapping information on both natural and
human- made attributes of the study area and pho-
tographing them initially as individual transparent
maps (Belknap and Furtado 1967, 1968; McHarg
1969; Gordon 1985; McHarg and Steiner 1998). The
transparent prints of light and dark values were su-
perimposed over each other to construct the neces-
sary suitability maps for each land use. These X- ray-
like composite maps illustrated intrinsic suitabilities
for land- use classifications, such as conservation,
urbanization, and recreation for the specific plan-
ning area. These maps were then combined with
each other as overlays to produce an overall com-
posite suitability map (McHarg 1969).
McHarg’s inventory process provides one of the
first examples of methodological documentation
for the overlay technique (with those by Hills and
Lewis). McHarg was also the first to advocate the use
of the overlay technique to gain an ecological under-
standing of a place. He noted that “a region is under-
stood as a biophysical and social process compre-
hensible through the operation of [natural] laws
and time. This can be reinterpreted as having ex-
plicit opportunities and constraints for any particu-
lar human use. A survey will reveal the most fit loca-
tions and processes” (1997a, 321). As a result, he was
explicit about the range and sequence of mapped
information to be collected. McHarg also observed
that the phenomena represented by the maps were
valued differently by various groups of people and
thus could be weighted differently, depending on
the circumstance.
The emergence of documentation in general lit-
erature as well as in specific projects and studies in
the late 1960s and early 1970s provides an indica-
tion of the formal acceptance of the overlay tech-
nique as a means to spatially relate environmental
factors and provide a composite and comprehensive
view of factor and land- use relationships (see, for
example, McHarg 1968; Wallace, McHarg, Roberts,
and Todd 1969, 1972, 1976; Juneja 1974). Whereas
Hills worked in public service for the Canadian gov-
ernment and Lewis was a professor, McHarg was in-
volved in both academia and private practice. He
203SUITABILITY ANALYSIS
and his colleagues at the University of Pennsylvania
developed suitability analysis theory. Meanwhile, in
Wallace- McHarg Associates and Wallace, McHarg,
Roberts, and Todd, the technique was refined
through practice. (See McHarg 1996 for a discussion
of this work.)
In Design with Nature, McHarg explained suit-
ability analysis in the following manner:
In essence, the method consists of identifying the area
of concern as consisting of certain processes, in land,
water, and air—which represent values. These can be
ranked—the most valuable land and the least, the
most valuable water resources and the least, the most
and least productive agricultural land, the richest
wildlife habitats and those of no value, the areas of
great or little scenic beauty, historic buildings and
their absence, and so on (1969, 34).
Lewis Hopkins has explained this method as
follows:
The output of land suitability analysis is a set of maps,
one for each land use, showing which level of suitabil-
ity characterizes each parcel of land. This output re-
quirement leads directly to two necessary components
of any method: (1) a procedure for identifying parcels
of land that are homogeneous and (2) a procedure for
rating these parcels with respect to suitability for each
land use (1977, 386–387).
A simplified illustration of how the suitability
analysis procedure works is provided in Figure 5.4.
Jon Berger and his colleagues (1977) have developed
an outline of the method, which is summarized in
Table 5.5. These seven steps are dependent on a de-
tailed ecological inventory and analysis. Step 1 is to
identify potential land uses and define the needs for
each. Berger and his colleagues have suggested the
use of matrices for the first and other steps. Figure
5.4 and the following matrices used for illustration
were taken from an ecological inventory and land-
use suitability analysis of Asotin County, Washing-
ton (Beach et al. 1978). These matrices were the
working documents of a student project and so con-
tain a few imperfections. However, they illustrate
the process by which this method was thought
through. Figure 5.5 illustrates the land- use needs for
agricultural, recreational, residential, commercial,
and industrial uses.
Step 2 covers the relationship of these land- use
needs to natural factors (Figure 5.6). Next, in Step 3,
specific mapped phenomena must be related to the
land- use needs (Figure 5.7). Step 4 is to map the
congruences of desired phenomena and formulate
rules of combination to express a gradient of suit-
ability. Rules of combination are the rankings used to
weight the relative importance of mapped phenom-
ena. Rules of combination assign suitabilities to sets
of criteria rather than to a single criterion and are
expressed “in terms of verbal logic rather than in
terms of numbers and arithmetic” (Hopkins 1977,
394–395). The result of this step should be a series
of maps of opportunities for various land uses.
Step 5 involves an identification of constraints
between potential land uses and biophysical pro -
cesses (Figure 5.8). Constraints are environmentally
204CHAPTER 5
TABLE 5.5Steps in Suitability Analysis
1. Identify land uses and define the needs for each use.2. Relate land- use needs to natural factors.3. Identify the relationship between specific mapped phe-
nomena concerning the biophysical environment andland- use needs.
4. Map the congruences of desired phenomena and formu-late rules of combination to express a gradient of suit-ability. This step should result in maps of land- useopportunities.
5. Identify the constraints between potential land uses andbiophysical processes.
6. Overlay maps of constraints and opportunities, andthrough rules of combination develop a map of intrinsicsuitabilities for various land uses.
7. Develop a composite map of the highest suitabilities ofthe various land uses.
SOURCE: Adapted from Berger et al. 1977.
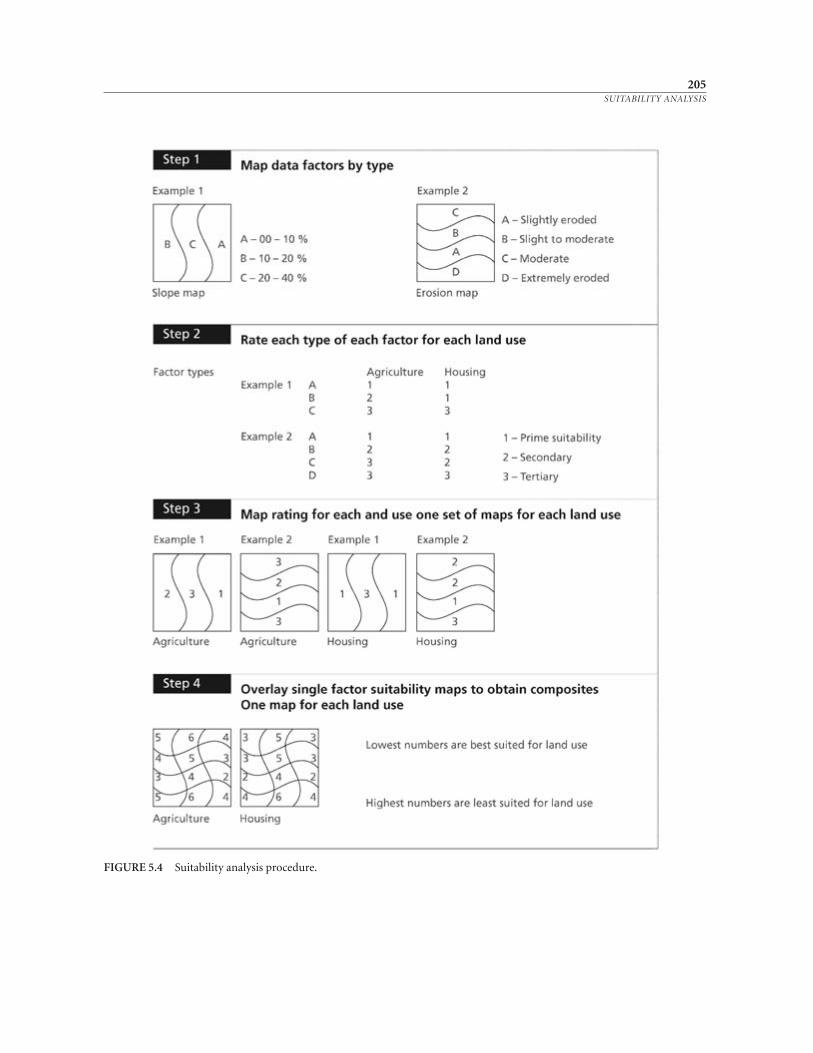
205SUITABILITY ANALYSIS
FIGURE 5.4 Suitability analysis procedure.
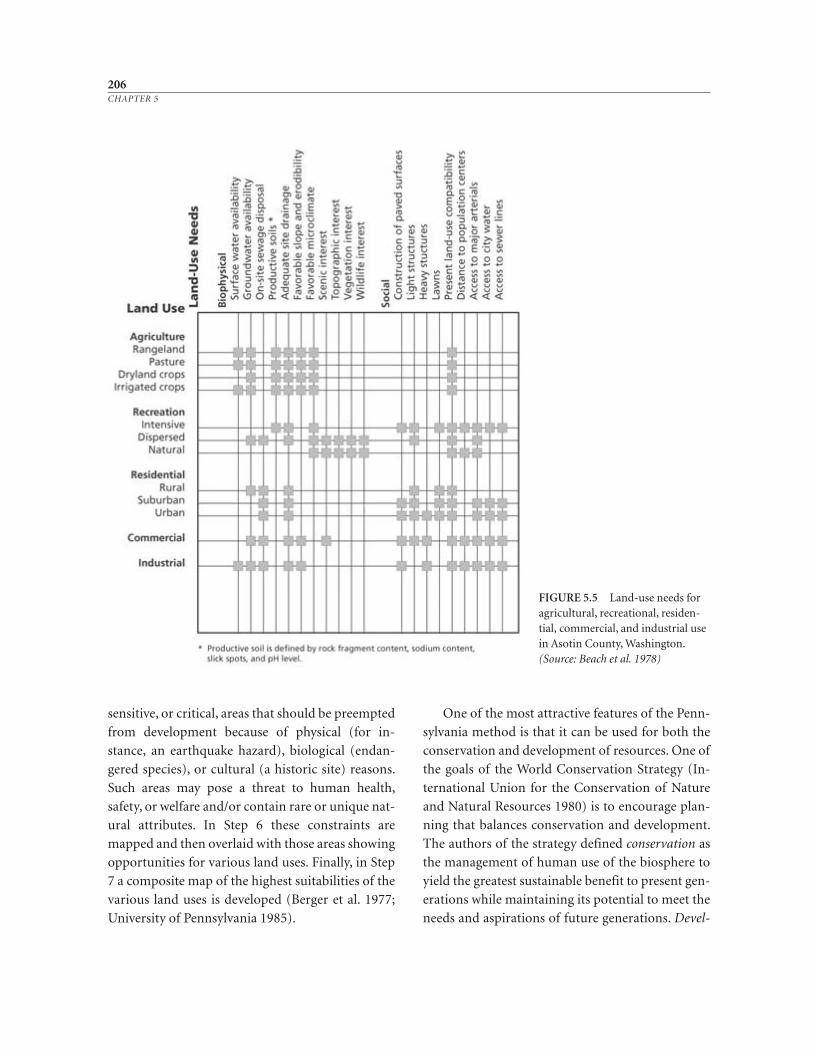
sensitive, or critical, areas that should be preempted
from development because of physical (for in-
stance, an earthquake hazard), biological (endan-
gered species), or cultural (a historic site) reasons.
Such areas may pose a threat to human health,
safety, or welfare and/or contain rare or unique nat-
ural attributes. In Step 6 these constraints are
mapped and then overlaid with those areas showing
opportunities for various land uses. Finally, in Step
7 a composite map of the highest suitabilities of the
various land uses is developed (Berger et al. 1977;
University of Pennsylvania 1985).
One of the most attractive features of the Penn-
sylvania method is that it can be used for both the
conservation and development of resources. One of
the goals of the World Conservation Strategy (In-
ternational Union for the Conservation of Nature
and Natural Resources 1980) is to encourage plan-
ning that balances conservation and development.
The authors of the strategy defined conservation as
the management of human use of the biosphere to
yield the greatest sustainable benefit to present gen-
erations while maintaining its potential to meet the
needs and aspirations of future generations. Devel-
206CHAPTER 5
FIGURE 5.5 Land- use needs foragricultural, recreational, residen-tial, commercial, and industrial usein Asotin County, Washington.(Source: Beach et al. 1978)
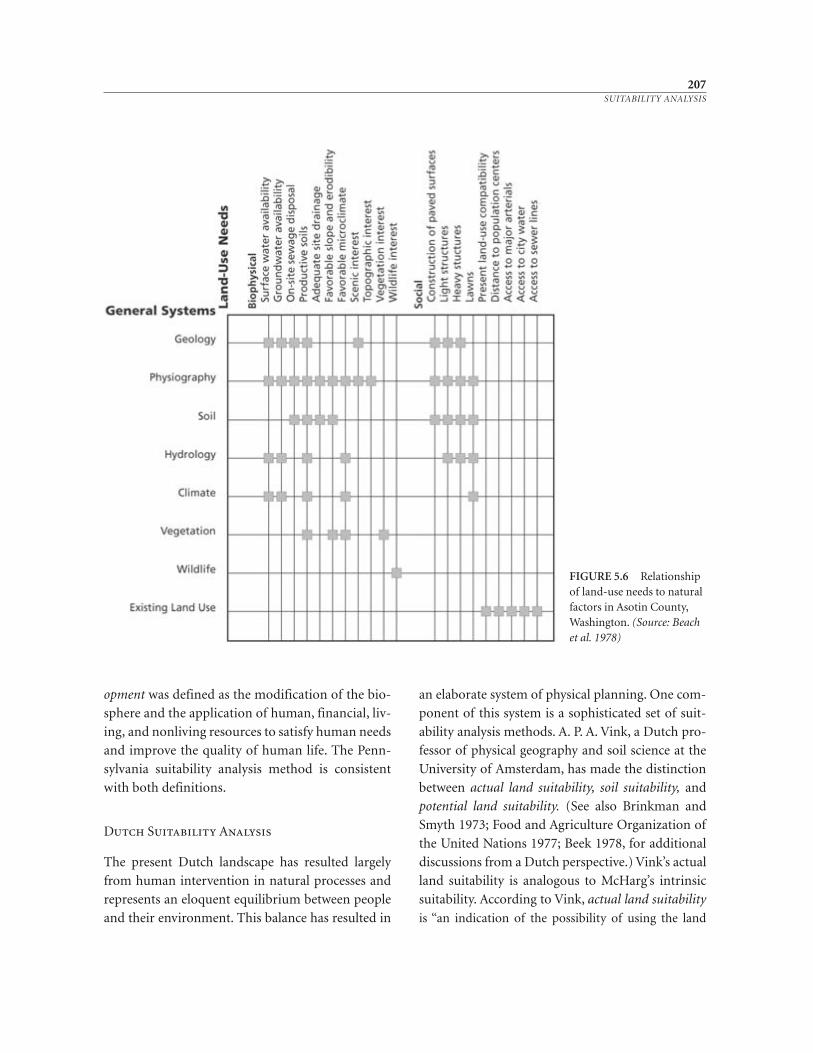
opment was defined as the modification of the bio-
sphere and the application of human, financial, liv-
ing, and nonliving resources to satisfy human needs
and improve the quality of human life. The Penn-
sylvania suitability analysis method is consistent
with both definitions.
Dutch Suitability Analysis
The present Dutch landscape has resulted largely
from human intervention in natural processes and
represents an eloquent equilibrium between people
and their environment. This balance has resulted in
an elaborate system of physical planning. One com-
ponent of this system is a sophisticated set of suit-
ability analysis methods. A. P. A. Vink, a Dutch pro-
fessor of physical geography and soil science at the
University of Amsterdam, has made the distinction
between actual land suitability, soil suitability, and
potential land suitability. (See also Brinkman and
Smyth 1973; Food and Agriculture Organization of
the United Nations 1977; Beek 1978, for additional
discussions from a Dutch perspective.) Vink’s actual
land suitability is analogous to McHarg’s intrinsic
suitability. According to Vink, actual land suitability
is “an indication of the possibility of using the land
207SUITABILITY ANALYSIS
FIGURE 5.6 Relationshipof land- use needs to naturalfactors in Asotin County,Washington. (Source: Beachet al. 1978)
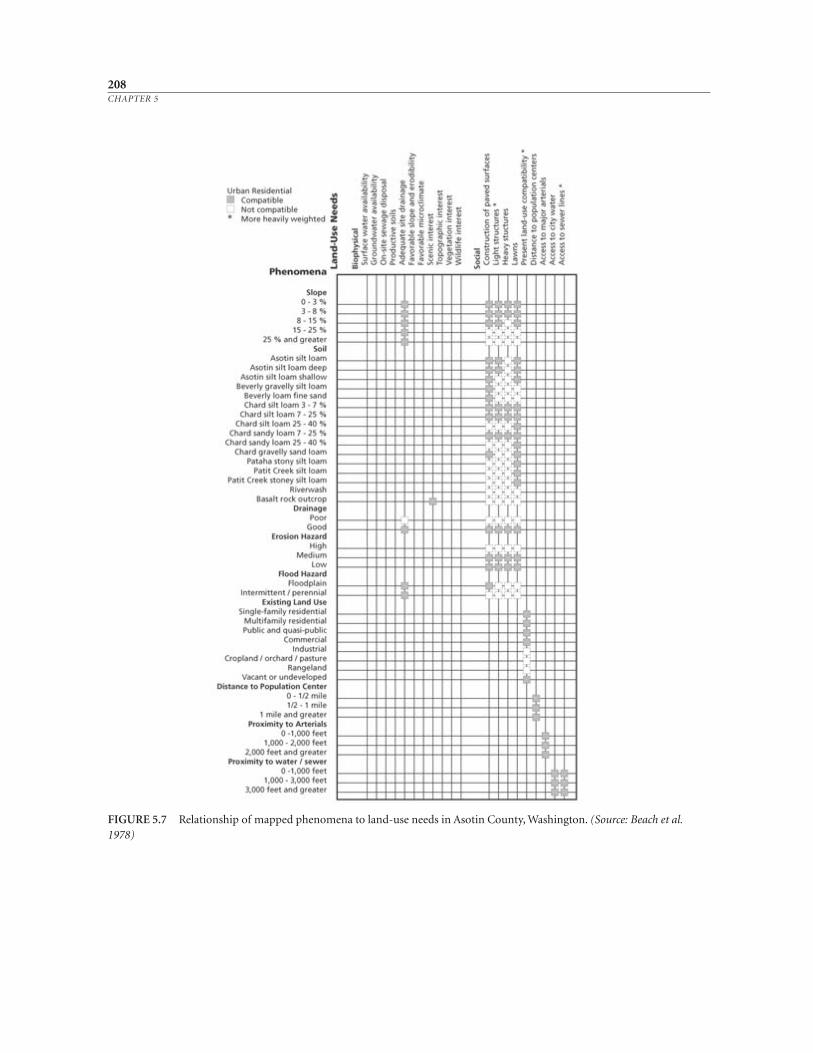
208CHAPTER 5
FIGURE 5.7 Relationship of mapped phenomena to land- use needs in Asotin County, Washington. (Source: Beach et al.1978)
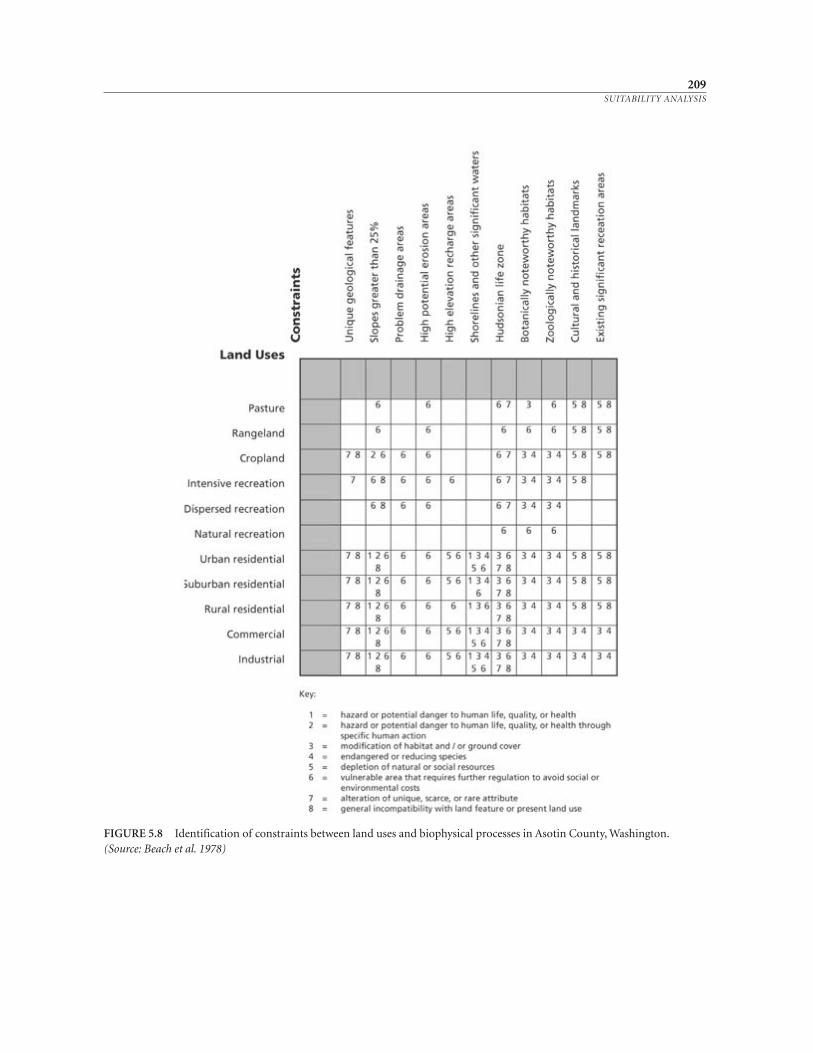
209SUITABILITY ANALYSIS
FIGURE 5.8 Identification of constraints between land uses and biophysical processes in Asotin County, Washington.(Source: Beach et al. 1978)
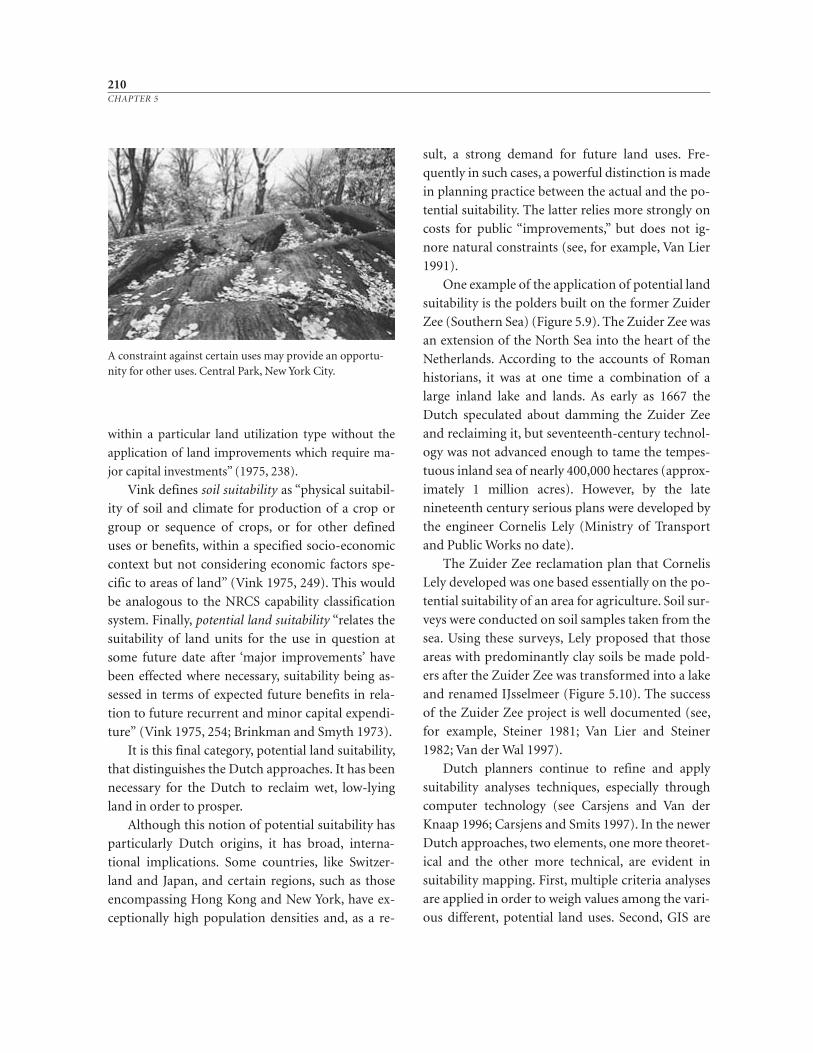
within a particular land utilization type without the
application of land improvements which require ma-
jor capital investments” (1975, 238).
Vink defines soil suitability as “physical suitabil-
ity of soil and climate for production of a crop or
group or sequence of crops, or for other defined
uses or benefits, within a specified socio- economic
context but not considering economic factors spe-
cific to areas of land” (Vink 1975, 249). This would
be analogous to the NRCS capability classification
system. Finally, potential land suitability “relates the
suitability of land units for the use in question at
some future date after ‘major improvements’ have
been effected where necessary, suitability being as-
sessed in terms of expected future benefits in rela-
tion to future recurrent and minor capital expendi-
ture” (Vink 1975, 254; Brinkman and Smyth 1973).
It is this final category, potential land suitability,
that distinguishes the Dutch approaches. It has been
necessary for the Dutch to reclaim wet, low- lying
land in order to prosper.
Although this notion of potential suitability has
particularly Dutch origins, it has broad, interna-
tional implications. Some countries, like Switzer-
land and Japan, and certain regions, such as those
encompassing Hong Kong and New York, have ex-
ceptionally high population densities and, as a re-
sult, a strong demand for future land uses. Fre-
quently in such cases, a powerful distinction is made
in planning practice between the actual and the po-
tential suitability. The latter relies more strongly on
costs for public “improvements,” but does not ig-
nore natural constraints (see, for example, Van Lier
1991).
One example of the application of potential land
suitability is the polders built on the former Zuider
Zee (Southern Sea) (Figure 5.9). The Zuider Zee was
an extension of the North Sea into the heart of the
Netherlands. According to the accounts of Roman
historians, it was at one time a combination of a
large inland lake and lands. As early as 1667 the
Dutch speculated about damming the Zuider Zee
and reclaiming it, but seventeenth- century technol-
ogy was not advanced enough to tame the tempes-
tuous inland sea of nearly 400,000 hectares (approx-
imately 1 million acres). However, by the late
nineteenth century serious plans were developed by
the engineer Cornelis Lely (Ministry of Transport
and Public Works no date).
The Zuider Zee reclamation plan that Cornelis
Lely developed was one based essentially on the po-
tential suitability of an area for agriculture. Soil sur-
veys were conducted on soil samples taken from the
sea. Using these surveys, Lely proposed that those
areas with predominantly clay soils be made pold-
ers after the Zuider Zee was transformed into a lake
and renamed IJsselmeer (Figure 5.10). The success
of the Zuider Zee project is well documented (see,
for example, Steiner 1981; Van Lier and Steiner
1982; Van der Wal 1997).
Dutch planners continue to refine and apply
suitability analyses techniques, especially through
computer technology (see Carsjens and Van der
Knaap 1996; Carsjens and Smits 1997). In the newer
Dutch approaches, two elements, one more theoret-
ical and the other more technical, are evident in
suitability mapping. First, multiple criteria analyses
are applied in order to weigh values among the vari-
ous different, potential land uses. Second, GIS are
210CHAPTER 5
A constraint against certain uses may provide an opportu-nity for other uses. Central Park, New York City.
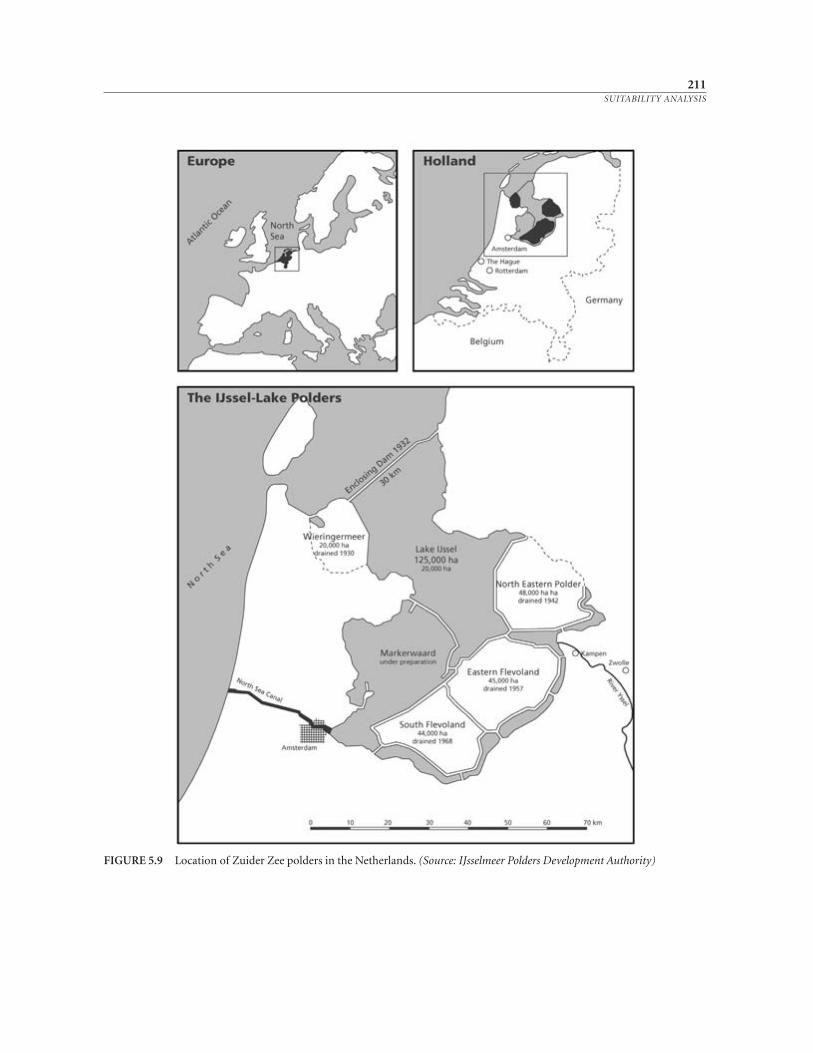
211SUITABILITY ANALYSIS
FIGURE 5.9 Location of Zuider Zee polders in the Netherlands. (Source: IJsselmeer Polders Development Authority)
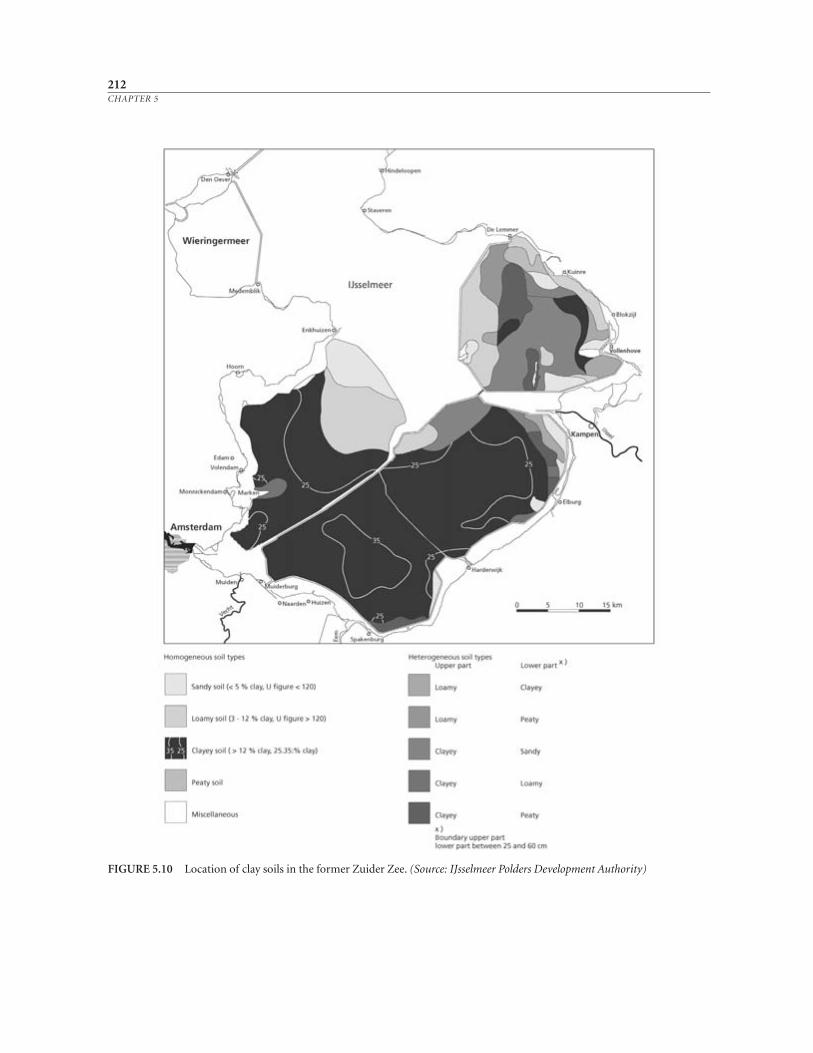
212CHAPTER 5
FIGURE 5.10 Location of clay soils in the former Zuider Zee. (Source: IJsselmeer Polders Development Authority)
employed in the analyses, making them more flexi-
ble and quick and easily applicable. These two ele-
ments enable Dutch planners to present a wider
range of land- use possibilities, with varying suit-
abilities, to decision makers.
Computer Applications
Several techniques may be used to accomplish suit-
ability analysis. Ian McHarg popularized the “over-
lay technique” (1969). Transparent maps with infor-
mation about landscape elements are placed on top
of each other to reveal areas of opportunity and
constraints. This technique is used to develop the
opportunities maps of Step 4, the constraints map
in Step 5, the intrinsic suitability maps of Step 6, and
the composite of Step 7 in Table 5.5. Bruce Mac-
Dougall (1975) criticized the accuracy of map over-
lays and made suggestions for improved accuracy.
For instance, if there are more than three or four
overlays, the map may appear opaque; there are ac-
curacy questions raised by MacDougall (1975) and
others that are especially pressing with hand- drawn
maps; and there are limitations for weighting vari-
ous values represented by map units. Geographic
information systems computer technology has
helped to overcome these limitations. Sheila Peck
explains this technology as follows: “A GIS is a data-
base for geographically referenced information. The
geographic data are organized in thematic layers
and linked to many other nonspatial data” (1998,
124).
Many practical difficulties exist in manually su-
perimposing a large number of maps (Steinitz
1993b; MacDougall 1975). This limitation became
the focus for much planning and land- use- related
research from the 1960s to the present (Collins
1996; Collins et al. 2000). The Laboratory for Com-
puter Graphics at the Harvard University Graduate
School of Design was a prominent center for the de-
velopment of new, computer- based techniques and
methods of land- use suitability analysis. Many early
examples of georeferenced computer mapping and
suitability analysis, as well as modern computer
mapping theory, can be traced back to the Harvard
laboratory. Perhaps the very first application of
computer overlay mapping to a large geographic re-
gion came from this lab in the fall of 1966. Carl
Steinitz, at that time an associate professor at Har-
vard’s Graduate School of Design, taught a planning
studio that created DELMARVA, a landscape plan-
ning study of the Delaware, Maryland, and Virginia
Peninsula. While working on his dissertation,
Steinitz convinced Howard Fisher, another associate
professor at Harvard’s Graduate School of Design,
to allow him to incorporate an early, general-
purpose line printer mapping program called
SYMAP (for SYnagraphic MAPping), which was de-
veloped by Fisher initially at the University of
Chicago in 1964, as a descriptive presentation of ob-
jects in geographic space. Steinitz and his students
applied SYMAP to analyze the effect of one map fac-
tor upon another and to incorporate weighted in-
dexes such as the capability of the area to support
grain agriculture (Steinitz 1993b).
Another of the more widely documented Harvard
predecessors to contemporary computer- based land-
use suitability was the Honey Hill study (Murray et al.
1971), named after its location in New Hampshire. In
this study,Steinitz and colleagues used SYMAP to eval-
uatea largeproposedflood- control reservoirandpark-
way for recreation and other land uses.The Honey Hill
study offered important insight into the power of com-
puters to combine different land- use modeling tech-
niques to create a composite, fiscally optimal plan
(Steinitz 1993b). Steinitz’s early work provided an im-
portant and invaluable example of the successful mar-
riage of computers and land- use suitability, which
other researchers and practitioners continued to build
upon(Steinitzetal.1994;Collinsetal.2000;Milleretal.
1998). Steinitz and his Harvard colleagues continue to
refine this technology, as the Camp Pendleton Biodi-
versity study illustrates (see Chapters 3, 4, and 6).
213SUITABILITY ANALYSIS
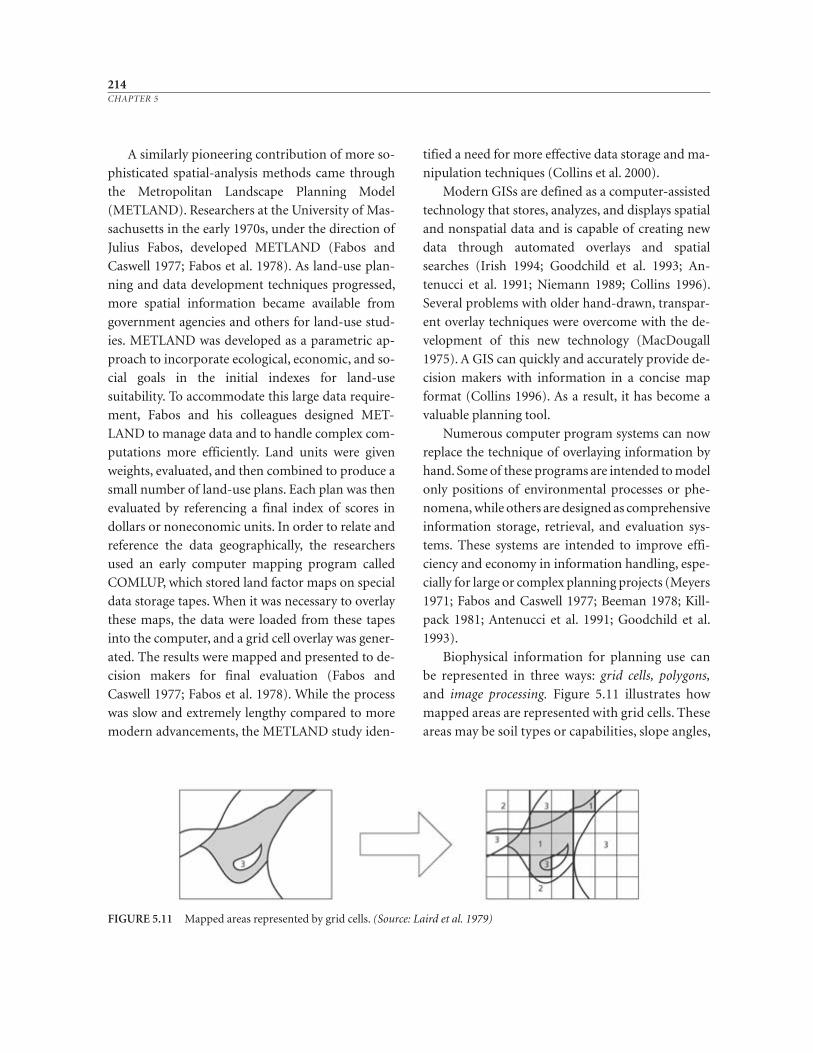
A similarly pioneering contribution of more so-
phisticated spatial- analysis methods came through
the Metropolitan Landscape Planning Model
(METLAND). Researchers at the University of Mas-
sachusetts in the early 1970s, under the direction of
Julius Fabos, developed METLAND (Fabos and
Caswell 1977; Fabos et al. 1978). As land- use plan-
ning and data development techniques progressed,
more spatial information became available from
government agencies and others for land- use stud-
ies. METLAND was developed as a parametric ap-
proach to incorporate ecological, economic, and so-
cial goals in the initial indexes for land- use
suitability. To accommodate this large data require-
ment, Fabos and his colleagues designed MET-
LAND to manage data and to handle complex com-
putations more efficiently. Land units were given
weights, evaluated, and then combined to produce a
small number of land- use plans. Each plan was then
evaluated by referencing a final index of scores in
dollars or noneconomic units. In order to relate and
reference the data geographically, the researchers
used an early computer mapping program called
COMLUP, which stored land factor maps on special
data storage tapes. When it was necessary to overlay
these maps, the data were loaded from these tapes
into the computer, and a grid cell overlay was gener-
ated. The results were mapped and presented to de-
cision makers for final evaluation (Fabos and
Caswell 1977; Fabos et al. 1978). While the process
was slow and extremely lengthy compared to more
modern advancements, the METLAND study iden-
tified a need for more effective data storage and ma-
nipulation techniques (Collins et al. 2000).
Modern GISs are defined as a computer- assisted
technology that stores, analyzes, and displays spatial
and nonspatial data and is capable of creating new
data through automated overlays and spatial
searches (Irish 1994; Goodchild et al. 1993; An-
tenucci et al. 1991; Niemann 1989; Collins 1996).
Several problems with older hand- drawn, transpar-
ent overlay techniques were overcome with the de-
velopment of this new technology (MacDougall
1975). A GIS can quickly and accurately provide de-
cision makers with information in a concise map
format (Collins 1996). As a result, it has become a
valuable planning tool.
Numerous computer program systems can now
replace the technique of overlaying information by
hand. Some of these programs are intended to model
only positions of environmental processes or phe-
nomena, while others are designed as comprehensive
information storage, retrieval, and evaluation sys-
tems. These systems are intended to improve effi-
ciency and economy in information handling, espe-
cially for large or complex planning projects (Meyers
1971; Fabos and Caswell 1977; Beeman 1978; Kill-
pack 1981; Antenucci et al. 1991; Goodchild et al.
1993).
Biophysical information for planning use can
be represented in three ways: grid cells, polygons,
and image processing. Figure 5.11 illustrates how
mapped areas are represented with grid cells. These
areas may be soil types or capabilities, slope angles,
214CHAPTER 5
FIGURE 5.11 Mapped areas represented by grid cells. (Source: Laird et al. 1979)
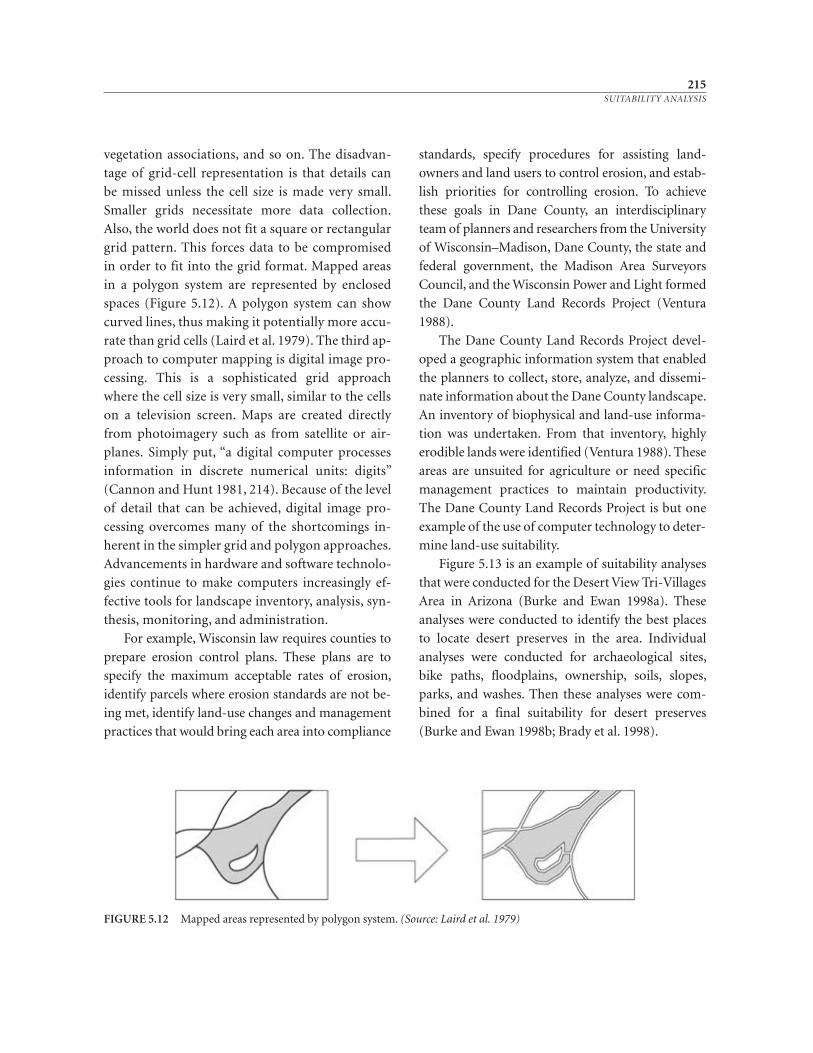
vegetation associations, and so on. The disadvan-
tage of grid- cell representation is that details can
be missed unless the cell size is made very small.
Smaller grids necessitate more data collection.
Also, the world does not fit a square or rectangular
grid pattern. This forces data to be compromised
in order to fit into the grid format. Mapped areas
in a polygon system are represented by enclosed
spaces (Figure 5.12). A polygon system can show
curved lines, thus making it potentially more accu-
rate than grid cells (Laird et al. 1979). The third ap-
proach to computer mapping is digital image pro-
cessing. This is a sophisticated grid approach
where the cell size is very small, similar to the cells
on a television screen. Maps are created directly
from photoimagery such as from satellite or air-
planes. Simply put, “a digital computer processes
information in discrete numerical units: digits”
(Cannon and Hunt 1981, 214). Because of the level
of detail that can be achieved, digital image pro-
cessing overcomes many of the shortcomings in-
herent in the simpler grid and polygon approaches.
Advancements in hardware and software technolo-
gies continue to make computers increasingly ef-
fective tools for landscape inventory, analysis, syn-
thesis, monitoring, and administration.
For example, Wisconsin law requires counties to
prepare erosion control plans. These plans are to
specify the maximum acceptable rates of erosion,
identify parcels where erosion standards are not be-
ing met, identify land- use changes and management
practices that would bring each area into compliance
standards, specify procedures for assisting land-
owners and land users to control erosion, and estab-
lish priorities for controlling erosion. To achieve
these goals in Dane County, an interdisciplinary
team of planners and researchers from the University
of Wisconsin–Madison, Dane County, the state and
federal government, the Madison Area Surveyors
Council, and the Wis consin Power and Light formed
the Dane County Land Records Project (Ventura
1988).
The Dane County Land Records Project devel-
oped a geographic information system that enabled
the planners to collect, store, analyze, and dissemi-
nate information about the Dane County landscape.
An inventory of biophysical and land- use informa-
tion was undertaken. From that inventory, highly
erodible lands were identified (Ventura 1988). These
areas are unsuited for agriculture or need specific
management practices to maintain productivity.
The Dane County Land Records Project is but one
example of the use of computer technology to deter-
mine land- use suitability.
Figure 5.13 is an example of suitability analyses
that were conducted for the Desert View Tri- Villages
Area in Arizona (Burke and Ewan 1998a). These
analyses were conducted to identify the best places
to locate desert preserves in the area. Individual
analyses were conducted for archaeological sites,
bike paths, floodplains, ownership, soils, slopes,
parks, and washes. Then these analyses were com-
bined for a final suitability for desert preserves
(Burke and Ewan 1998b; Brady et al. 1998).
215SUITABILITY ANALYSIS
FIGURE 5.12 Mapped areas represented by polygon system. (Source: Laird et al. 1979)
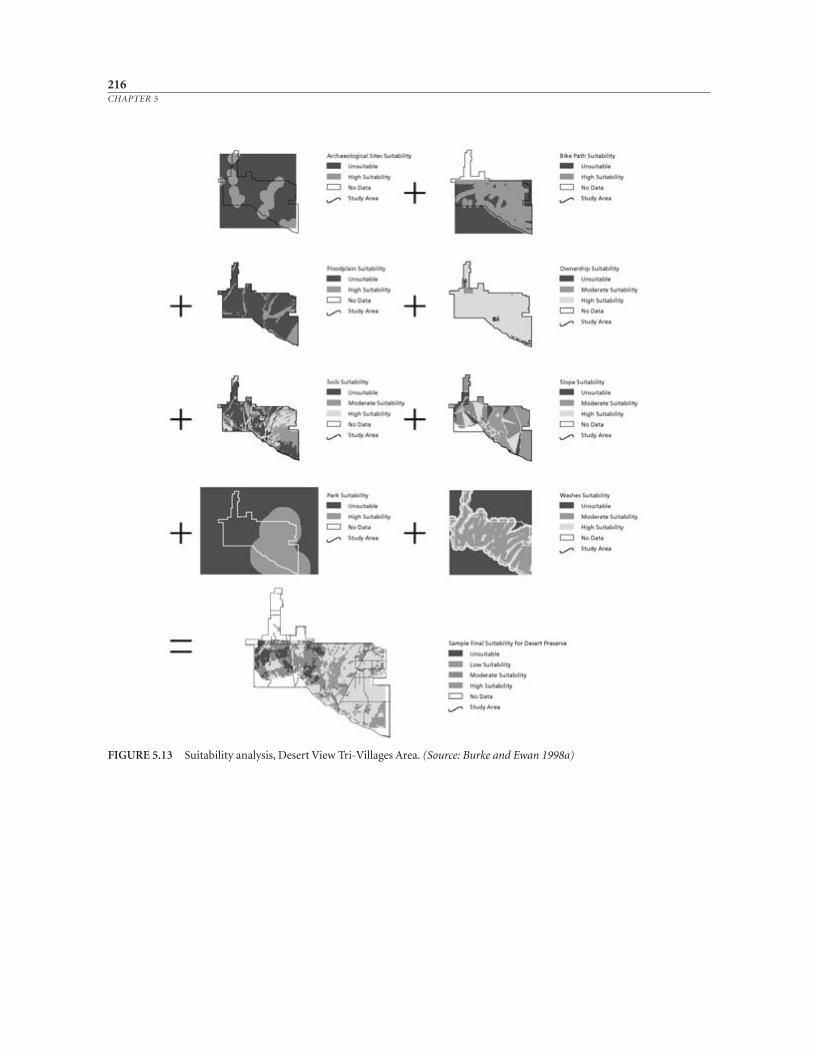
216CHAPTER 5
FIGURE 5.13 Suitability analysis, Desert View Tri- Villages Area. (Source: Burke and Ewan 1998a)
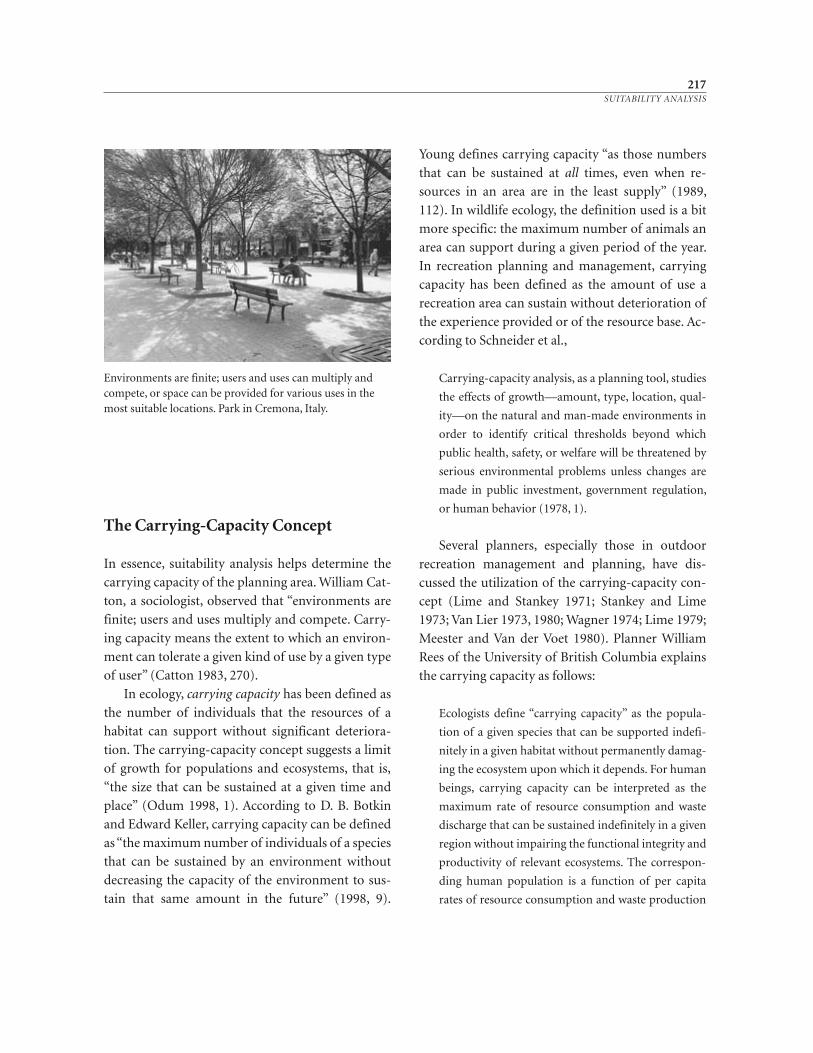
The Carrying- Capacity Concept
In essence, suitability analysis helps determine the
carrying capacity of the planning area. William Cat-
ton, a sociologist, observed that “environments are
finite; users and uses multiply and compete. Carry-
ing capacity means the extent to which an environ-
ment can tolerate a given kind of use by a given type
of user” (Catton 1983, 270).
In ecology, carrying capacity has been defined as
the number of individuals that the resources of a
habitat can support without significant deteriora-
tion. The carrying-capacity concept suggests a limit
of growth for populations and ecosystems, that is,
“the size that can be sustained at a given time and
place” (Odum 1998, 1). According to D. B. Botkin
and Edward Keller, carrying capacity can be defined
as “the maximum number of individuals of a species
that can be sustained by an environment without
decreasing the capacity of the environment to sus-
tain that same amount in the future” (1998, 9).
Young defines carrying capacity “as those numbers
that can be sustained at all times, even when re-
sources in an area are in the least supply” (1989,
112). In wildlife ecology, the definition used is a bit
more specific: the maximum number of animals an
area can support during a given period of the year.
In recreation planning and management, carrying
capacity has been defined as the amount of use a
recreation area can sustain without deterioration of
the experience provided or of the resource base. Ac-
cording to Schneider et al.,
Carrying- capacity analysis, as a planning tool, studies
the effects of growth—amount, type, location, qual-
ity—on the natural and man- made environments in
order to identify critical thresholds beyond which
public health, safety, or welfare will be threatened by
serious environmental problems unless changes are
made in public investment, government regulation,
or human behavior (1978, 1).
Several planners, especially those in outdoor
recreation management and planning, have dis-
cussed the utilization of the carrying- capacity con-
cept (Lime and Stankey 1971; Stankey and Lime
1973; Van Lier 1973, 1980; Wagner 1974; Lime 1979;
Meester and Van der Voet 1980). Planner William
Rees of the University of British Columbia explains
the carrying capacity as follows:
Ecologists define “carrying capacity” as the popula-
tion of a given species that can be supported indefi-
nitely in a given habitat without permanently damag-
ing the ecosystem upon which it depends. For human
beings, carrying capacity can be interpreted as the
maximum rate of resource consumption and waste
discharge that can be sustained indefinitely in a given
region without impairing the functional integrity and
productivity of relevant ecosystems. The correspon-
ding human population is a function of per capita
rates of resource consumption and waste production
217SUITABILITY ANALYSIS
Environments are finite; users and uses can multiply andcompete, or space can be provided for various uses in themost suitable locations. Park in Cremona, Italy.
(i.e., sustainable production divided by per capita de-
mand) (1992, 125; see also Rees 1990a, 1990b).
Rees furthermore stated that carrying capacity
for the human population “is finite and declining
and should become a fundamental component of
demographic and planning analysis” (1995, 346).
The outdoor recreation specialists’ interest in
this concept may be traced to two sources. First,
they have been historically involved with forest and
range ecologists, and are thus familiar with ecolog-
ical terms. Second, they work within discrete
boundaries where there are clear demands on and
conflicts over resources. The public patronage of
state and federal parks in the United States has in-
creased dramatically since the Second World War,
partly because of the interstate highway system and
the increase in automobile ownership and also be-
cause of population shifts from eastern to western
states and from metropolitan to nonmetropolitan
regions.
D. W. Lime and G. H. Stankey (1971) distin-
guished three aspects of outdoor recreational carry-
ing capacity: management objectives, visitor atti-
tudes, and impact on biophysical resources. The three
aspects are viewed as interdependent, no single fac-
tor being necessarily more important than the oth-
ers. Suitability analysis offers a framework to study
in detail these three aspects.
While the concept has enjoyed relatively wide
application in outdoor recreation, carrying capacity
had more limited use by community and regional
planning agencies until planners became more in-
terested in sustainability. With the rise of interest in
sustainability, more planners have explored the car-
rying capacity concept. One early exception is the
Tahoe Regional Planning Agency, which adopted an
environmental threshold approach based on carry-
ing capacities. The Tahoe Regional Planning Agency
defined these threshold carrying capacities as “an
environmental standard necessary to maintain a sig-
nificant scenic, recreational, educational, scientific,
or natural value of the region or to maintain public
health and safety within the region” (1982, vii).
Thomas Dickert and Andrea Tuttle of the Uni-
versity of California, Berkeley, advocated the use of
thresholds, such as those developed by the Tahoe
Regional Planning Agency, as a means to control cu-
mulative environmental impacts. Such thresholds
would be based on “an assumed acceptable amount
of land- use change over time” (Dickert and Tuttle
1985, 38). They observe a problem with conven-
tional planning in that it is often incremental, and,
thus, does not address cumulative impacts. In the
words of Dickert and Tuttle, “Cumulative impacts
are those that result from the interactions of many
incremental activities, each of which may have an
insignificant effect when viewed alone, but which
become cumulatively significant when seen in the
aggregate” (1985, 39). They suggest an alternative
approach whereby the “rate or total amount of de-
velopment is managed to stay below prestated
threshold levels, and halted when such thresholds
are reached” (1985, 39). Such thresholds can be de-
termined by an analysis of the suitability of re-
sources for various uses.
An extension of carrying capacity is the ecologi-
cal footprint concept developed by William Rees
(1992, 1995, 1997; Wackernagel and Rees 1996).
Rees suggests that “our shelter, energy, food, and
other resource demands can be translated into esti-
mates of the land and water areas needed to meet
them” (as quoted in Beatley and Manning 1997, 8).
According to Rees, an ecological footprint can be
“defined as the aggregate area of land required con-
tinuously to produce the resource inputs and to as-
similate the waste outputs of that population or
economy wherever the land may be located” (1995,
351). Wackernagel and Rees (1996) proposed quan-
titative indicators to measure the impacts of an eco-
nomic system on the ecological load supporting ca-
pacity of a given planning area. They consider the
flows of energy and materials entering and leaving
the planning area in order to assess the total re-
218CHAPTER 5
sources impacted by use (see Wackernagel and Rees
1996; Rees 1995; Treu and Magoni 1998). The eco-
logical footprint approach suggests the need for
ecological inventories for places beyond the imme-
diate planning area and for detailed studies of envi-
ronmental consequences inside and outside the
planning area.
Several Italian scholars have also explored the
application of the carrying capacity concept to
planning. Ornella Piscopo (1999) brought together
much of this work in her dissertation at the Univer-
sity of Rome (under the mentorship of Professor
Enzo Scandurra). She advocates a broader, more
metaphorical interpretation and use of the concept,
arguing that carrying capacity as “limit” or “thresh-
old” is limiting. Instead Piscopo (1999) suggests
that “carrying capacity can be considered as a tool
for understanding the environmental conditions of
a certain area.” She pursued this approach through
a case study of the Sarno River basin in southern
Italy.
Two Applications of Suitability Analysis
The suitability analysis for Medford Township, New
Jersey, involved several of the originators of the
method, including Ian McHarg and Narendra
Juneja. Their ideas were extended in the late 1970s
into the Pacific Northwest, in Whitman County,
Washington.
The Development of Performance
Requirements in Medford Township,
New Jersey
The officials of Medford Township, New Jersey,
sought to develop an alternative system to tradi-
tional zoning. A study exploring the use of perfor-
mance requirements was undertaken for Medford
by the Center for Ecological Research in Planning
and Design at the University of Pennsylvania under
the direction of Ian McHarg and Narendra Juneja.
The performance requirements were based on the
social values and natural environment of the town-
ship. (For a comprehensive description of the plan-
ning process in Medford Township, see Palmer
1981.)
Medford Township is located on the edge of the
New Jersey Pinelands, within commuting distance
of the Philadelphia metropolitan area (Figure 5.14).
This is an area that, on the one hand, grew from the
great suburban explosion of the 1950s and 1960s,
but, on the other, is part of one of the few remaining
natural ecosystems in the eastern United States.
After a detailed ecological inventory of the
township, the planning team related the biophysi-
cal phenomena to their values to society and in-
dividuals. Juneja explained this in the following
manner:
The values assigned vary depending upon the indi-
vidual’s interest. For example, a farmer is concerned
about sustained productivity from his land; a home-
owner seeks a healthy delightful setting; and a devel-
oper searches for sites where he can build to get the
most return for his money. The operative value sys-
tems employed by individuals are as likely to be dis-
crete and mutually exclusive as to be competitive and
conflicting. To deal with the latter exigency and to en-
sure sustained health, welfare, and prosperity for all, it
is important to identify those values which are com-
mon to all present and future residents of the town-
ship. This can best be accomplished by interpreting
the available understanding of the extant phenomena
and processes in terms which are clearly definable and
about which agreement can be reached by all those af-
fected (1974, 11).
Juneja and colleagues accomplished this by a
system of matrices linked to mapped phenomena.
Figure 5.15 is an example of one such matrix for
vegetation. Along the horizontal axis, the values
of society and individuals, as determined by the
219SUITABILITY ANALYSIS
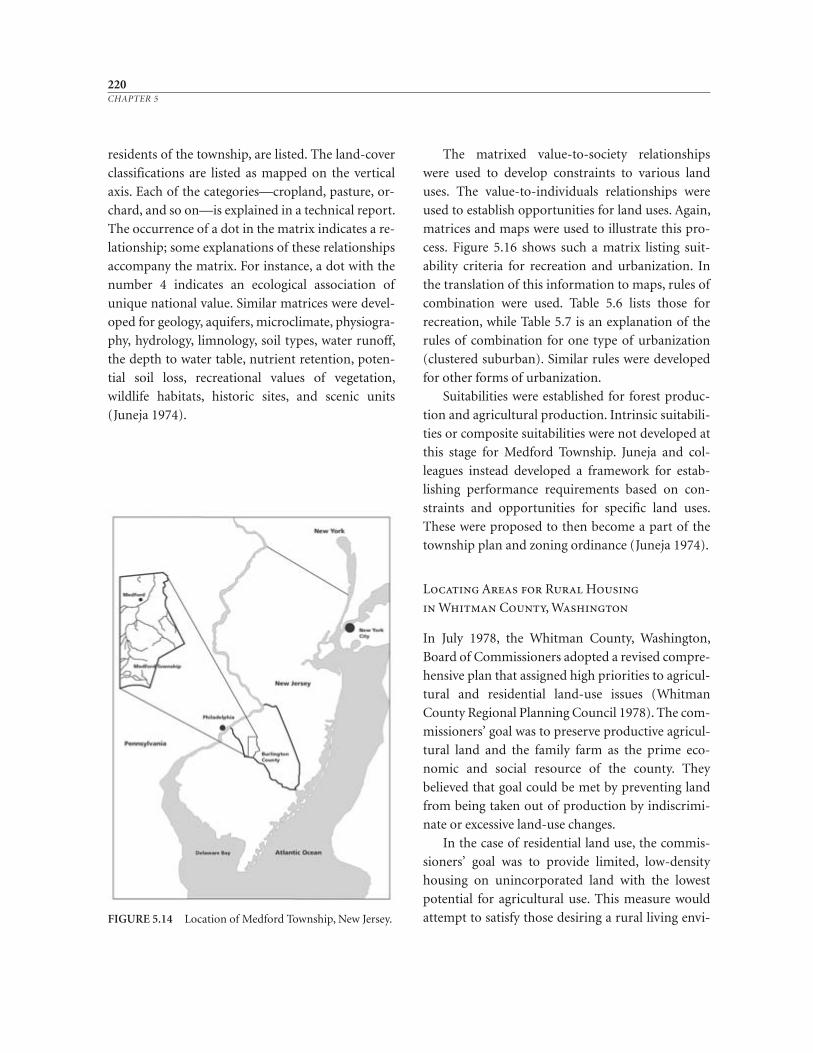
residents of the township, are listed. The land- cover
classifications are listed as mapped on the vertical
axis. Each of the categories—cropland, pasture, or-
chard, and so on—is explained in a technical report.
The occurrence of a dot in the matrix indicates a re-
lationship; some explanations of these relationships
accompany the matrix. For instance, a dot with the
number 4 indicates an ecological association of
unique national value. Similar matrices were devel-
oped for geology, aquifers, microclimate, physiogra-
phy, hydrology, limnology, soil types, water runoff,
the depth to water table, nutrient retention, poten-
tial soil loss, recreational values of vegetation,
wildlife habitats, historic sites, and scenic units
(Juneja 1974).
The matrixed value- to- society relationships
were used to develop constraints to various land
uses. The value- to- individuals relationships were
used to establish opportunities for land uses. Again,
matrices and maps were used to illustrate this pro-
cess. Figure 5.16 shows such a matrix listing suit-
ability criteria for recreation and urbanization. In
the translation of this information to maps, rules of
combination were used. Table 5.6 lists those for
recreation, while Table 5.7 is an explanation of the
rules of combination for one type of urbanization
(clustered suburban). Similar rules were developed
for other forms of urbanization.
Suitabilities were established for forest produc-
tion and agricultural production. Intrinsic suitabili-
ties or composite suitabilities were not developed at
this stage for Medford Township. Juneja and col-
leagues instead developed a framework for estab-
lishing performance requirements based on con-
straints and opportunities for specific land uses.
These were proposed to then become a part of the
township plan and zoning ordinance (Juneja 1974).
Locating Areas for Rural Housing
in Whitman County, Washington
In July 1978, the Whitman County, Washington,
Board of Commissioners adopted a revised compre-
hensive plan that assigned high priorities to agricul-
tural and residential land- use issues (Whitman
County Regional Planning Council 1978). The com-
missioners’ goal was to preserve productive agricul-
tural land and the family farm as the prime eco-
nomic and social resource of the county. They
believed that goal could be met by preventing land
from being taken out of production by indiscrimi-
nate or excessive land- use changes.
In the case of residential land use, the commis-
sioners’ goal was to provide limited, low- density
housing on unincorporated land with the lowest
potential for agricultural use. This measure would
attempt to satisfy those desiring a rural living envi-
220CHAPTER 5
FIGURE 5.14 Location of Medford Township, New Jersey.
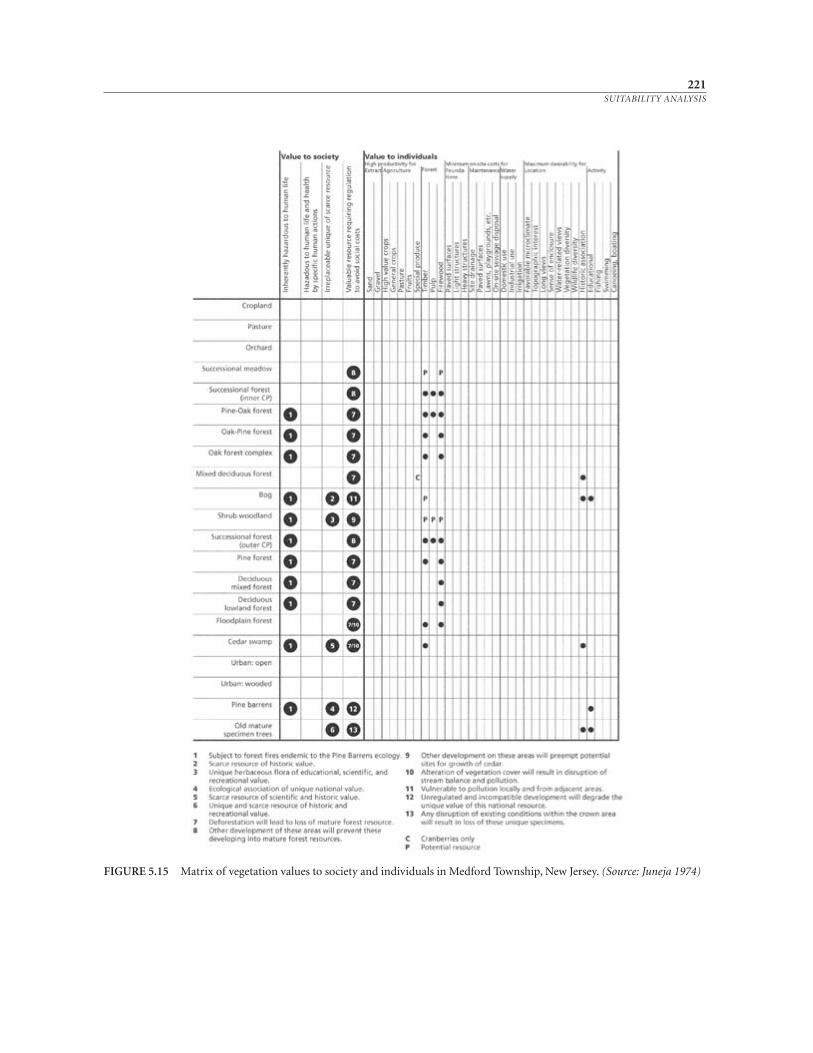
221SUITABILITY ANALYSIS
FIGURE 5.15 Matrix of vegetation values to society and individuals in Medford Township, New Jersey. (Source: Juneja 1974)
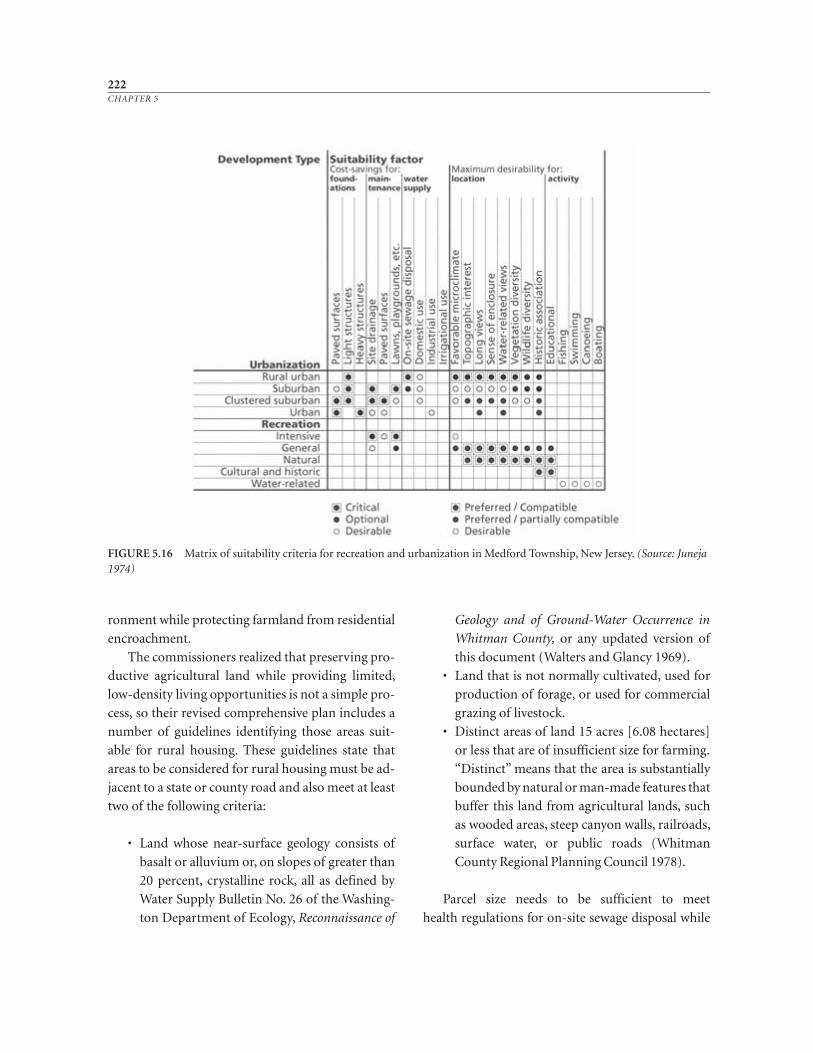
ronment while protecting farmland from residential
encroachment.
The commissioners realized that preserving pro-
ductive agricultural land while providing limited,
low- density living opportunities is not a simple pro-
cess, so their revised comprehensive plan includes a
number of guidelines identifying those areas suit-
able for rural housing. These guidelines state that
areas to be considered for rural housing must be ad-
jacent to a state or county road and also meet at least
two of the following criteria:
• Land whose near- surface geology consists of
basalt or alluvium or, on slopes of greater than
20 percent, crystalline rock, all as defined by
Water Supply Bulletin No. 26 of the Washing-
ton Department of Ecology, Reconnaissance of
Geology and of Ground- Water Occurrence in
Whitman County, or any updated version of
this document (Walters and Glancy 1969).
• Land that is not normally cultivated, used for
production of forage, or used for commercial
grazing of livestock.
• Distinct areas of land 15 acres [6.08 hectares]
or less that are of insufficient size for farming.
“Distinct” means that the area is substantially
bounded by natural or man- made features that
buffer this land from agricultural lands, such
as wooded areas, steep canyon walls, railroads,
surface water, or public roads (Whitman
County Regional Planning Council 1978).
Parcel size needs to be sufficient to meet
health regulations for on- site sewage disposal while
222CHAPTER 5
FIGURE 5.16 Matrix of suitability criteria for recreation and urbanization in Medford Township, New Jersey. (Source: Juneja1974)
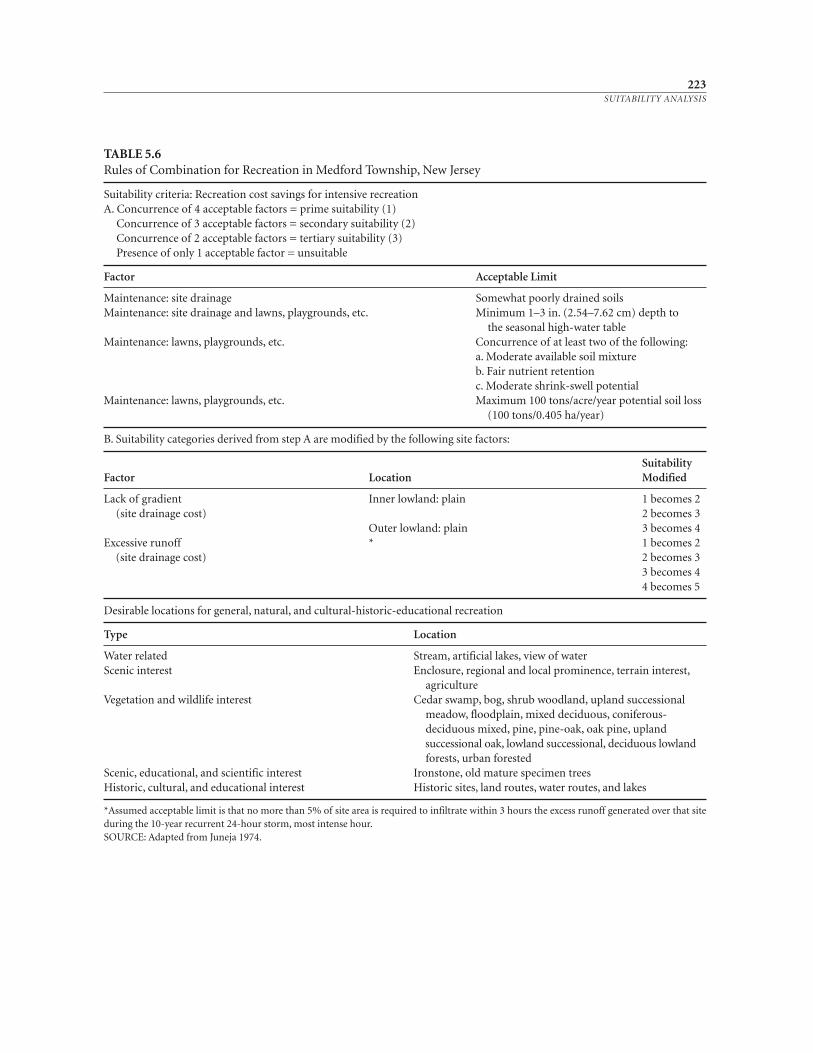
223SUITABILITY ANALYSIS
TABLE 5.6Rules of Combination for Recreation in Medford Township, New Jersey
Suitability criteria: Recreation cost savings for intensive recreationA. Concurrence of 4 acceptable factors = prime suitability (1)
Concurrence of 3 acceptable factors = secondary suitability (2)Concurrence of 2 acceptable factors = tertiary suitability (3)Presence of only 1 acceptable factor = unsuitable
Factor Acceptable Limit
Maintenance: site drainage Somewhat poorly drained soilsMaintenance: site drainage and lawns, playgrounds, etc. Minimum 1–3 in. (2.54–7.62 cm) depth to
the seasonal high- water tableMaintenance: lawns, playgrounds, etc. Concurrence of at least two of the following:
a. Moderate available soil mixtureb. Fair nutrient retentionc. Moderate shrink- swell potential
Maintenance: lawns, playgrounds, etc. Maximum 100 tons/acre/year potential soil loss(100 tons/0.405 ha/year)
B. Suitability categories derived from step A are modified by the following site factors:
SuitabilityFactor Location Modified
Lack of gradient Inner lowland: plain 1 becomes 2(site drainage cost) 2 becomes 3
Outer lowland: plain 3 becomes 4Excessive runoff * 1 becomes 2
(site drainage cost) 2 becomes 33 becomes 44 becomes 5
Desirable locations for general, natural, and cultural- historic- educational recreation
Type Location
Water related Stream, artificial lakes, view of waterScenic interest Enclosure, regional and local prominence, terrain interest,
agricultureVegetation and wildlife interest Cedar swamp, bog, shrub woodland, upland successional
meadow, floodplain, mixed deciduous, coniferous- deciduous mixed, pine, pine- oak, oak pine, uplandsuccessional oak, lowland successional, deciduous lowlandforests, urban forested
Scenic, educational, and scientific interest Ironstone, old mature specimen treesHistoric, cultural, and educational interest Historic sites, land routes, water routes, and lakes
*Assumed acceptable limit is that no more than 5% of site area is required to infiltrate within 3 hours the excess runoff generated over that siteduring the 10- year recurrent 24- hour storm, most intense hour.SOURCE: Adapted from Juneja 1974.
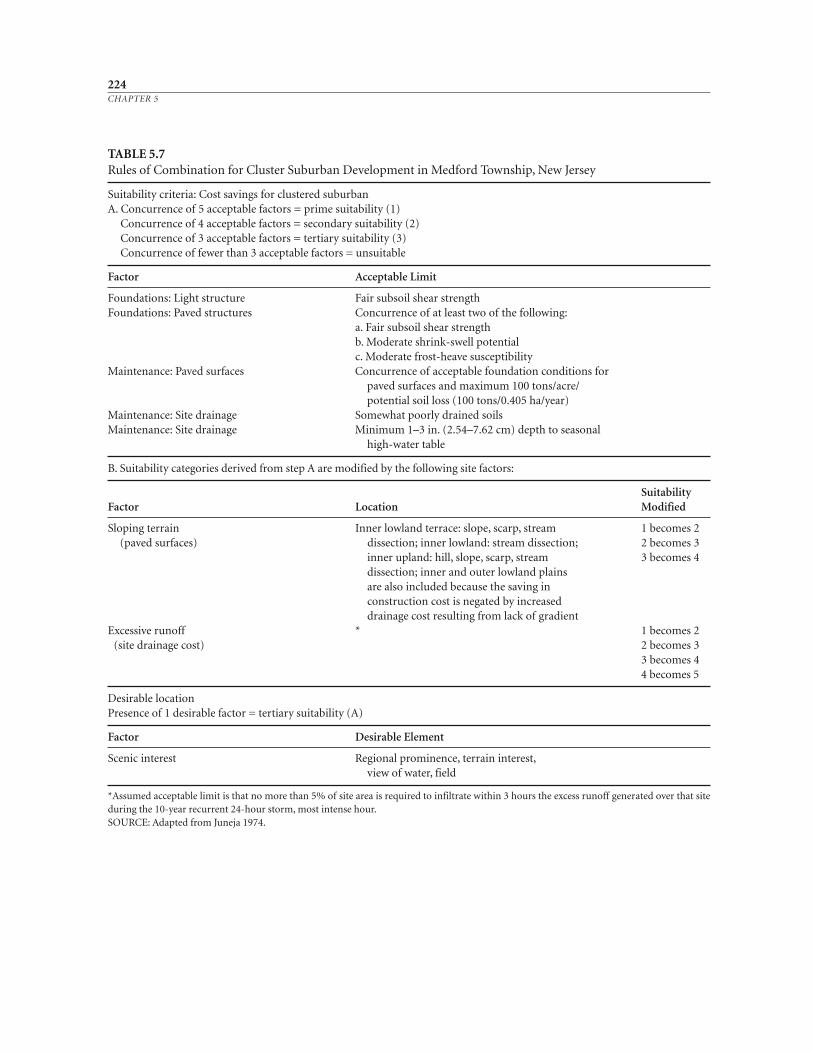
224CHAPTER 5
TABLE 5.7Rules of Combination for Cluster Suburban Development in Medford Township, New Jersey
Suitability criteria: Cost savings for clustered suburbanA. Concurrence of 5 acceptable factors = prime suitability (1)
Concurrence of 4 acceptable factors = secondary suitability (2)Concurrence of 3 acceptable factors = tertiary suitability (3)Concurrence of fewer than 3 acceptable factors = unsuitable
Factor Acceptable Limit
Foundations: Light structure Fair subsoil shear strengthFoundations: Paved structures Concurrence of at least two of the following:
a. Fair subsoil shear strengthb. Moderate shrink- swell potentialc. Moderate frost- heave susceptibility
Maintenance: Paved surfaces Concurrence of acceptable foundation conditions forpaved surfaces and maximum 100 tons/acre/potential soil loss (100 tons/0.405 ha/year)
Maintenance: Site drainage Somewhat poorly drained soilsMaintenance: Site drainage Minimum 1–3 in. (2.54–7.62 cm) depth to seasonal
high-water table
B. Suitability categories derived from step A are modified by the following site factors:
SuitabilityFactor Location Modified
Sloping terrain Inner lowland terrace: slope, scarp, stream 1 becomes 2(paved surfaces) dissection; inner lowland: stream dissection; 2 becomes 3
inner upland: hill, slope, scarp, stream 3 becomes 4dissection; inner and outer lowland plainsare also included because the saving inconstruction cost is negated by increaseddrainage cost resulting from lack of gradient
Excessive runoff * 1 becomes 2(site drainage cost) 2 becomes 3
3 becomes 44 becomes 5
Desirable locationPresence of 1 desirable factor = tertiary suitability (A)
Factor Desirable Element
Scenic interest Regional prominence, terrain interest,view of water, field
*Assumed acceptable limit is that no more than 5% of site area is required to infiltrate within 3 hours the excess runoff generated over that siteduring the 10- year recurrent 24- hour storm, most intense hour.SOURCE: Adapted from Juneja 1974.
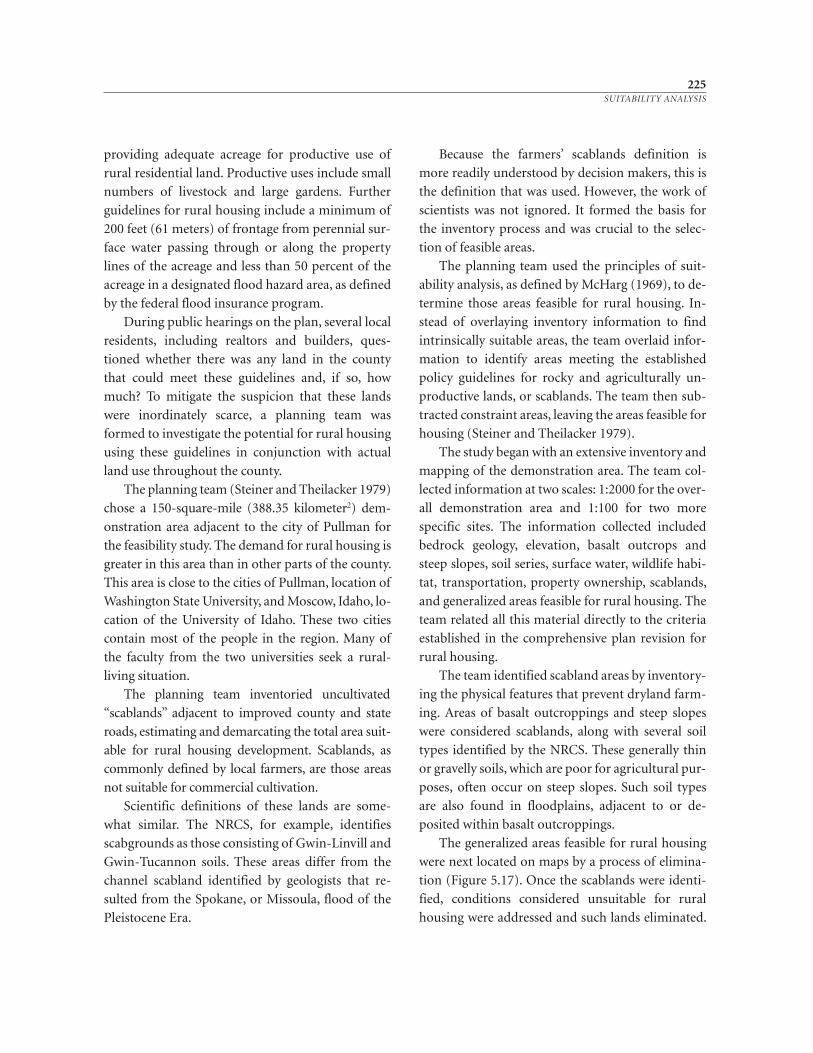
providing adequate acreage for productive use of
rural residential land. Productive uses include small
numbers of livestock and large gardens. Further
guidelines for rural housing include a minimum of
200 feet (61 meters) of frontage from perennial sur-
face water passing through or along the property
lines of the acreage and less than 50 percent of the
acreage in a designated flood hazard area, as defined
by the federal flood insurance program.
During public hearings on the plan, several local
residents, including realtors and builders, ques-
tioned whether there was any land in the county
that could meet these guidelines and, if so, how
much? To mitigate the suspicion that these lands
were inordinately scarce, a planning team was
formed to investigate the potential for rural housing
using these guidelines in conjunction with actual
land use throughout the county.
The planning team (Steiner and Theilacker 1979)
chose a 150- square- mile (388.35 kilometer2) dem -
onstration area adjacent to the city of Pullman for
the feasibility study. The demand for rural housing is
greater in this area than in other parts of the county.
This area is close to the cities of Pullman, location of
Washington State University, and Moscow, Idaho, lo-
cation of the University of Idaho. These two cities
contain most of the people in the region. Many of
the faculty from the two universities seek a rural-
living situation.
The planning team inventoried uncultivated
“scab lands” adjacent to improved county and state
roads, estimating and demarcating the total area suit-
able for rural housing development. Scablands, as
commonly defined by local farmers, are those areas
not suitable for commercial cultivation.
Scientific definitions of these lands are some-
what similar. The NRCS, for example, identifies
scabgrounds as those consisting of Gwin- Linvill and
Gwin- Tucannon soils. These areas differ from the
channel scabland identified by geologists that re-
sulted from the Spokane, or Missoula, flood of the
Pleistocene Era.
Because the farmers’ scablands definition is
more readily understood by decision makers, this is
the definition that was used. However, the work of
scientists was not ignored. It formed the basis for
the inventory process and was crucial to the selec-
tion of feasible areas.
The planning team used the principles of suit-
ability analysis, as defined by McHarg (1969), to de-
termine those areas feasible for rural housing. In-
stead of overlaying inventory information to find
intrinsically suitable areas, the team overlaid infor-
mation to identify areas meeting the established
policy guidelines for rocky and agriculturally un-
productive lands, or scablands. The team then sub-
tracted constraint areas, leaving the areas feasible for
housing (Steiner and Theilacker 1979).
The study began with an extensive inventory and
mapping of the demonstration area. The team col-
lected information at two scales: 1:2000 for the over-
all demonstration area and 1:100 for two more
specific sites. The information collected included
bedrock geology, elevation, basalt outcrops and
steep slopes, soil series, surface water, wildlife habi-
tat, transportation, property ownership, scablands,
and generalized areas feasible for rural housing. The
team related all this material directly to the criteria
established in the comprehensive plan revision for
rural housing.
The team identified scabland areas by inventory-
ing the physical features that prevent dryland farm-
ing. Areas of basalt outcroppings and steep slopes
were considered scablands, along with several soil
types identified by the NRCS. These generally thin
or gravelly soils, which are poor for agricultural pur-
poses, often occur on steep slopes. Such soil types
are also found in floodplains, adjacent to or de-
posited within basalt outcroppings.
The generalized areas feasible for rural housing
were next located on maps by a process of elimina-
tion (Figure 5.17). Once the scablands were identi-
fied, conditions considered unsuitable for rural
housing were addressed and such lands eliminated.
225SUITABILITY ANALYSIS
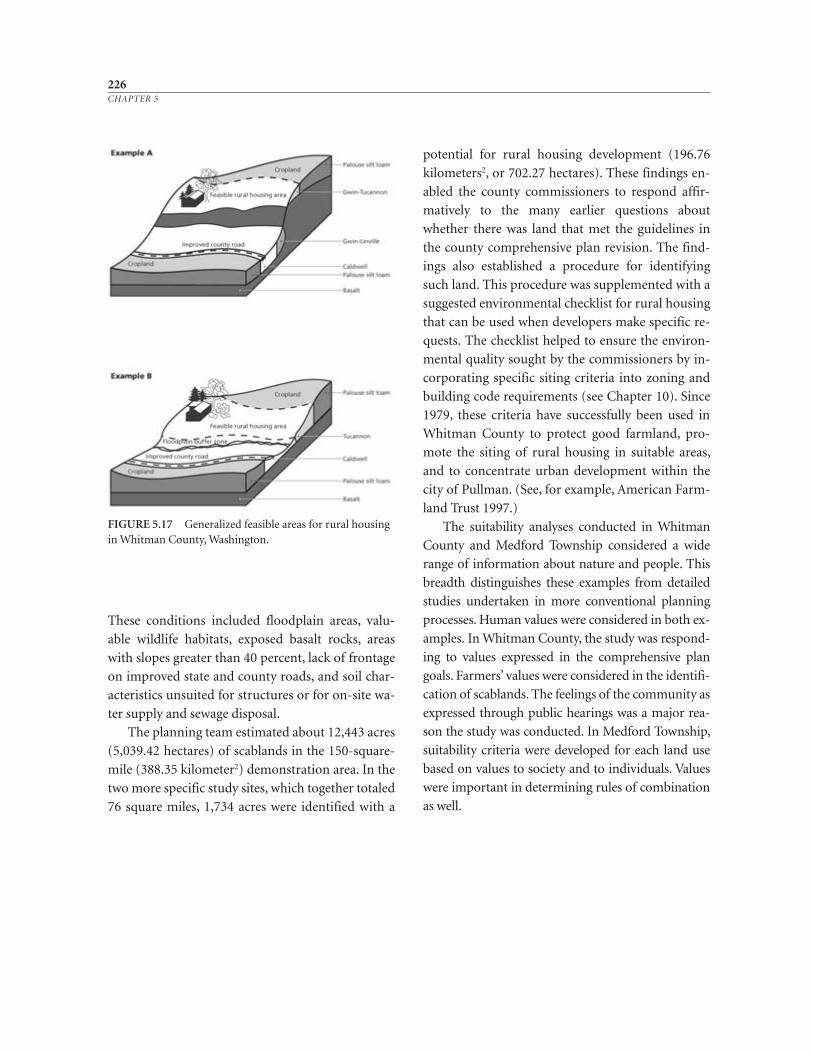
These conditions included floodplain areas, valu-
able wildlife habitats, exposed basalt rocks, areas
with slopes greater than 40 percent, lack of frontage
on improved state and county roads, and soil char-
acteristics unsuited for structures or for on- site wa-
ter supply and sewage disposal.
The planning team estimated about 12,443 acres
(5,039.42 hectares) of scablands in the 150- square-
mile (388.35 kilometer2) demonstration area. In the
two more specific study sites, which together totaled
76 square miles, 1,734 acres were identified with a
potential for rural housing development (196.76
kilometers2, or 702.27 hectares). These findings en-
abled the county commissioners to respond affir-
matively to the many earlier questions about
whether there was land that met the guidelines in
the county comprehensive plan revision. The find-
ings also established a procedure for identifying
such land. This procedure was supplemented with a
suggested environmental checklist for rural housing
that can be used when developers make specific re-
quests. The checklist helped to ensure the environ-
mental quality sought by the commissioners by in-
corporating specific siting criteria into zoning and
building code requirements (see Chapter 10). Since
1979, these criteria have successfully been used in
Whitman County to protect good farmland, pro-
mote the siting of rural housing in suitable areas,
and to concentrate urban development within the
city of Pullman. (See, for example, American Farm-
land Trust 1997.)
The suitability analyses conducted in Whitman
County and Medford Township considered a wide
range of information about nature and people. This
breadth distinguishes these examples from detailed
studies undertaken in more conventional planning
processes. Human values were considered in both ex-
amples. In Whitman County, the study was respond-
ing to values expressed in the comprehensive plan
goals. Farmers’ values were considered in the identifi-
cation of scablands. The feelings of the community as
expressed through public hearings was a major rea-
son the study was conducted. In Medford Township,
suitability criteria were developed for each land use
based on values to society and to individuals. Values
were important in determining rules of combination
as well.
226CHAPTER 5
FIGURE 5.17 Generalized feasible areas for rural housingin Whitman County, Washington.


6PLANNING OPTIONS AND CHOICES
229
To a large extent, every step in the planning process, like life itself, requires that choices
be made. Planning may be viewed as a “process for determining appropriate future ac-
tion through a sequence of choices” (Davidoff and Reiner 1962, 103). Throughout this
sequence, questions arise. What goals should a community adopt? What information
about biophysical and sociocultural processes of a planning area should be collected?
What are the boundaries of the planning area and at what scale or in what format
should information be collected and presented? In ecological planning, once detailed
studies such as suitability analyses have been performed, the community will have a
number of choices. The planning area may be faced with a growing population. Sev-
eral specific parcels of land may be intrinsically suited for several uses—possibly agri-
culture, housing, and recreation. Which use should the community encourage?
The purpose of this step in the process is to attempt to answer such questions by
presenting a series of options to the people of the area. Conceptual visions should be
presented that link planning decisions to actions and then actions to impacts in the
landscape. Such visions can be presented in a series of models or scenarios that
depict the future possibilities for the planning area.
Rachel Kaplan and her colleagues explain, “The pur-
pose of providing alternatives is not to force a choice or
pick a ‘winner.’ Rather, alternatives should provide
some notions of what is feasible; they can help to com-
municate the range of issues that need to be considered.
The final solution is likely to incorporate pieces of sev-
eral alternatives” (Kaplan et al. 1998, 132).
Many techniques can assist a community in making
choices among planning options. The techniques are
similar to those used to identify issues and to establish
planning goals, discussed in Chapter 2. A few of the
more popular techniques include the charrette, task
forces, citizens’ advisory committees, technical advi-
sory committees, public hearings, citizen referendum
and synchronized surveys, and goals- achievement ma-
trices. Two good examples of selecting preferences in-
clude the land- use alternatives for the Portland, Ore-
gon, comprehensive plan; and the alternative futures
for the Camp Pendleton, California, region. The Ore-
gon case shows how options were derived from existing
goals. The Camp Pendleton work displays a tie between
alternative futures and biodiversity.
Optional Plans
Suitability analyses may present a number of
choices to a community. For instance, a community
may have established goals both to provide for
housing and to protect prime farmland. A parcel of
land may be highly suited for both uses. To assist
elected and appointed officials in decision making,
it can be helpful to develop a number of optional
landscape plans that would enable officials to see the
spatial impacts of their decisions.
Two examples from the Desert View Tri- Villages
Area in Arizona are used for illus tration. In the
first example, Professors Rebecca Fish Ewan and
Joseph Ewan led a team of landscape architects,
planners, environmental scientists, and architects
in an exploration of possible widths for the protec-
tion of the Cave Creek Wash. As was noted in
Chapter 3, this wash is a major landscape feature in
the area. In the second example, Jim Burke and Jim
Coffman of the Phoenix Parks, Recreation, and Li-
brary Department developed three concepts for
the creation of a Sonoran preserve in the area.
They presented these concepts to village planning
committees and many others. The concepts
formed the basis of the Sonoran Preserve Master
Plan, created by a team led by Burke and Ewan.
The Arizona State University (ASU) School of
Planning and Landscape Architecture faculty began
cooperating with the City of Phoenix in 1994 in the
Desert View Tri- Villages Area. An interdisciplinary
group of environmental scientists, landscape archi-
tects, environmental planners, and architects meet
monthly with city planners. This informal group,
which calls itself the North Sonoran Collaborative,
expanded to include state environmental manage-
ment and local consultants. These meetings led to
student studio projects and faculty research and
other activities (including the charrette discussed
later in this chapter). These meetings were held in a
context of both interest in more appropriate devel-
opment in the Tri- Villages as well as desert protec-
tion. Very early in the cooperation, the notion that
large areas of desert should be protected was raised.
At the same time, the Design Workshop (1995) and
others produced a regional open space plan for the
Maricopa Association of Governments that indi-
cated that environmentally sensitive areas such as the
Cave Creek Wash should be included as open spaces.
Soon the mayor of Phoenix was advocating desert
preservation. He was joined by the governor and leg-
islature, which passed the Arizona Preserve Initia-
tive, permitting certain State Trust Lands to be used
as open space. But funding was limited, so the ques-
tion of what lands to preserve became important to
address.
A team of researchers from the ASU School of
Planning and Landscape Architecture and the ASU-
230CHAPTER 6
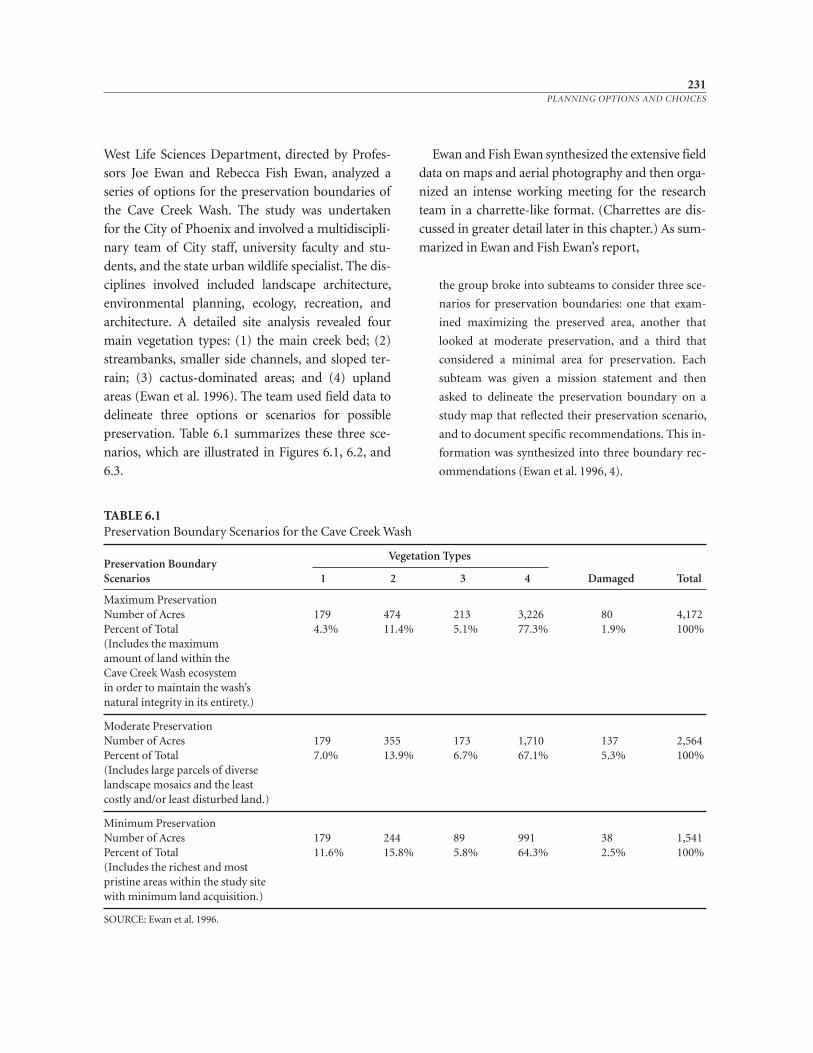
West Life Sciences Department, directed by Profes-
sors Joe Ewan and Rebecca Fish Ewan, analyzed a
series of options for the preservation boundaries of
the Cave Creek Wash. The study was undertaken
for the City of Phoenix and involved a multidiscipli-
nary team of City staff, university faculty and stu-
dents, and the state urban wildlife specialist. The dis-
ciplines involved included landscape architecture,
environmental planning, ecology, recreation, and
architecture. A detailed site analysis revealed four
main vegetation types: (1) the main creek bed; (2)
streambanks, smaller side channels, and sloped ter-
rain; (3) cactus- dominated areas; and (4) upland
areas (Ewan et al. 1996). The team used field data to
delineate three options or scenarios for possible
preservation. Table 6.1 summarizes these three sce-
narios, which are illustrated in Figures 6.1, 6.2, and
6.3.
Ewan and Fish Ewan synthesized the extensive field
data on maps and aerial photography and then orga-
nized an intense working meeting for the research
team in a charrette- like format. (Charrettes are dis-
cussed in greater detail later in this chapter.) As sum-
marized in Ewan and Fish Ewan’s report,
the group broke into subteams to consider three sce-
narios for preservation boundaries: one that exam-
ined maximizing the preserved area, another that
looked at moderate preservation, and a third that
considered a minimal area for preservation. Each
subteam was given a mission statement and then
asked to delineate the preservation boundary on a
study map that reflected their preservation scenario,
and to document specific recommendations. This in-
formation was synthesized into three boundary rec-
ommendations (Ewan et al. 1996, 4).
231PLANNING OPTIONS AND CHOICES
TABLE 6.1Preservation Boundary Scenarios for the Cave Creek Wash
Preservation BoundaryVegetation Types
Scenarios 1 2 3 4 Damaged Total
Maximum PreservationNumber of Acres 179 474 213 3,226 80 4,172Percent of Total 4.3% 11.4% 5.1% 77.3% 1.9% 100%(Includes the maximumamount of land within theCave Creek Wash ecosystemin order to maintain the wash’snatural integrity in its entirety.)
Moderate PreservationNumber of Acres 179 355 173 1,710 137 2,564Percent of Total 7.0% 13.9% 6.7% 67.1% 5.3% 100%(Includes large parcels of diverselandscape mosaics and the leastcostly and/or least disturbed land.)
Minimum PreservationNumber of Acres 179 244 89 991 38 1,541Percent of Total 11.6% 15.8% 5.8% 64.3% 2.5% 100%(Includes the richest and mostpristine areas within the study sitewith minimum land acquisition.)
SOURCE: Ewan et al. 1996.
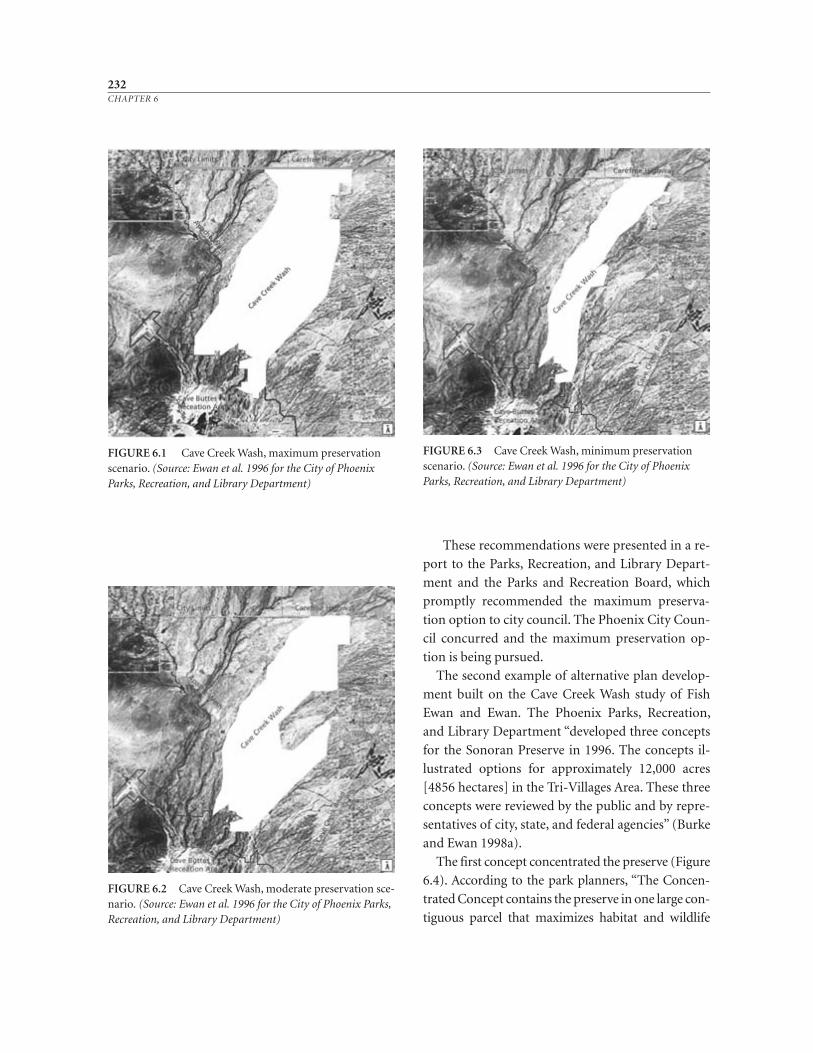
These recommendations were presented in a re-
port to the Parks, Recreation, and Library Depart-
ment and the Parks and Recreation Board, which
promptly recommended the maximum preserva-
tion option to city council. The Phoenix City Coun-
cil concurred and the maximum preservation op-
tion is being pursued.
The second example of alternative plan develop-
ment built on the Cave Creek Wash study of Fish
Ewan and Ewan. The Phoenix Parks, Recreation,
and Library Department “developed three concepts
for the Sonoran Preserve in 1996. The concepts il-
lustrated options for approximately 12,000 acres
[4856 hectares] in the Tri- Villages Area. These three
concepts were reviewed by the public and by repre-
sentatives of city, state, and federal agencies” (Burke
and Ewan 1998a).
The first concept concentrated the preserve (Figure
6.4). According to the park planners, “The Concen-
trated Concept contains the preserve in one large con-
tiguous parcel that maximizes habitat and wildlife
232CHAPTER 6
FIGURE 6.2 Cave Creek Wash, moderate preserva tion sce-nario. (Source: Ewan et al. 1996 for the City of Phoenix Parks,Recreation, and Library Department)
FIGURE 6.1 Cave Creek Wash, maximum preserva tionscenario. (Source: Ewan et al. 1996 for the City of PhoenixParks, Recreation, and Library Department)
FIGURE 6.3 Cave Creek Wash, minimum preserva tionscenario. (Source: Ewan et al. 1996 for the City of PhoenixParks, Recreation, and Library Department)
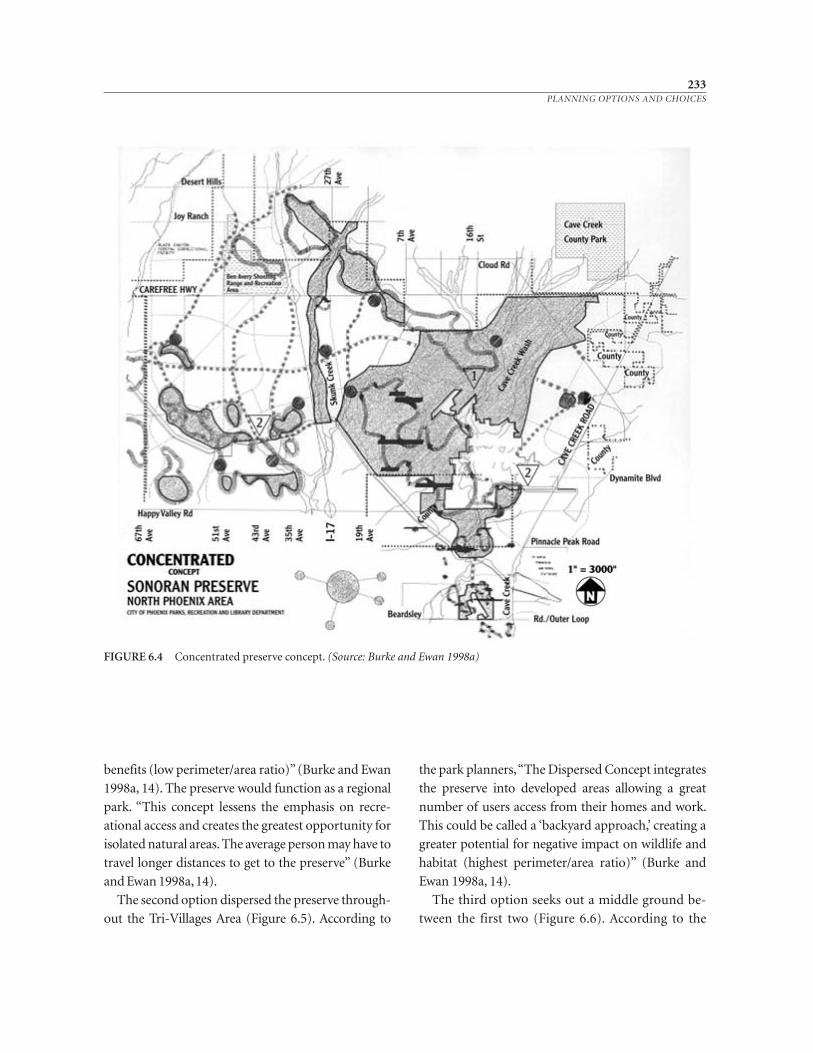
benefits (low perimeter/area ratio)” (Burke and Ewan
1998a, 14). The preserve would function as a regional
park. “This concept lessens the empha sis on recre-
ational access and creates the greatest opportunity for
isolated natural areas. The average person may have to
travel longer distances to get to the preserve” (Burke
and Ewan 1998a,14).
The second option dispersed the preserve through-
out the Tri- Villages Area (Figure 6.5). According to
the park planners, “The Dispersed Concept integrates
the preserve into developed areas allowing a great
number of users access from their homes and work.
This could be called a ‘backyard approach,’ creating a
greater potential for negative impact on wildlife and
habitat (highest perimeter/area ratio)” (Burke and
Ewan 1998a, 14).
The third option seeks out a middle ground be-
tween the first two (Figure 6.6). According to the
233PLANNING OPTIONS AND CHOICES
FIGURE 6.4 Concentrated preserve concept. (Source: Burke and Ewan 1998a)
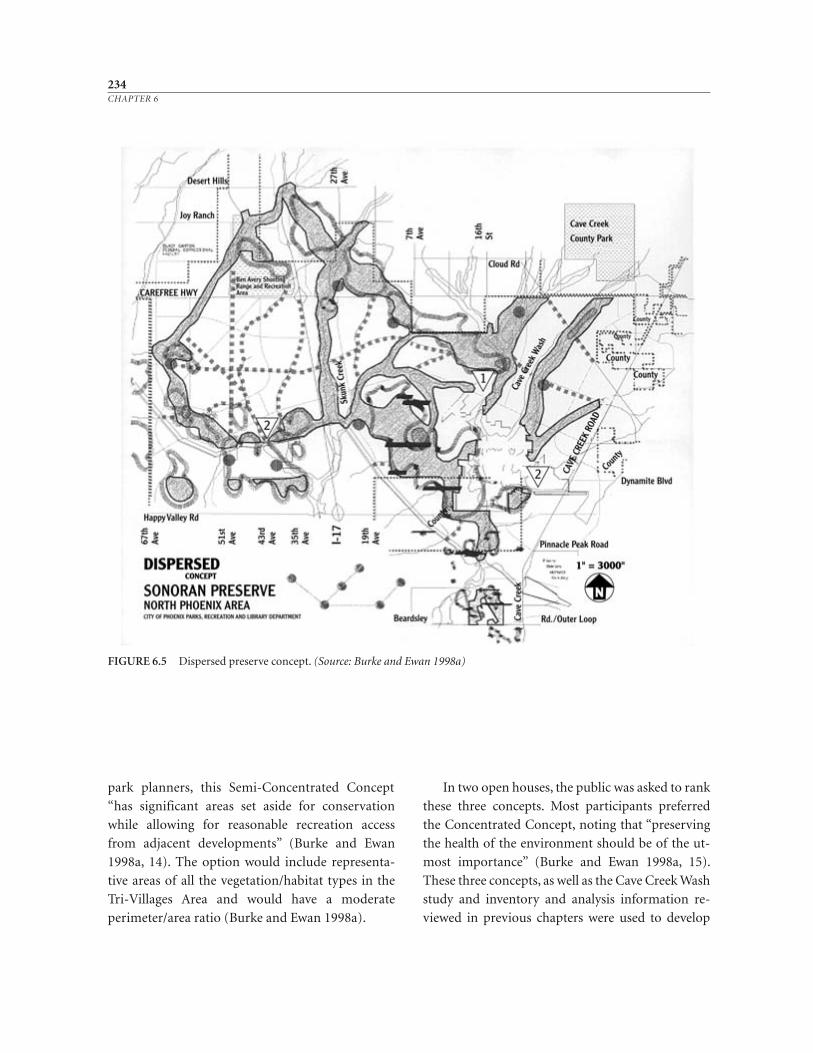
park planners, this Semi- Concentrated Concept
“has significant areas set aside for conservation
while allowing for reasonable recreation access
from adjacent developments” (Burke and Ewan
1998a, 14). The option would include representa-
tive areas of all the vegetation/habitat types in the
Tri- Villages Area and would have a moderate
perimeter/area ratio (Burke and Ewan 1998a).
In two open houses, the public was asked to rank
these three concepts. Most participants preferred
the Concentrated Concept, noting that “preserving
the health of the environment should be of the ut-
most importance” (Burke and Ewan 1998a, 15).
These three concepts, as well as the Cave Creek Wash
study and inventory and analysis information re-
viewed in previous chapters were used to develop
234CHAPTER 6
FIGURE 6.5 Dispersed preserve concept. (Source: Burke and Ewan 1998a)
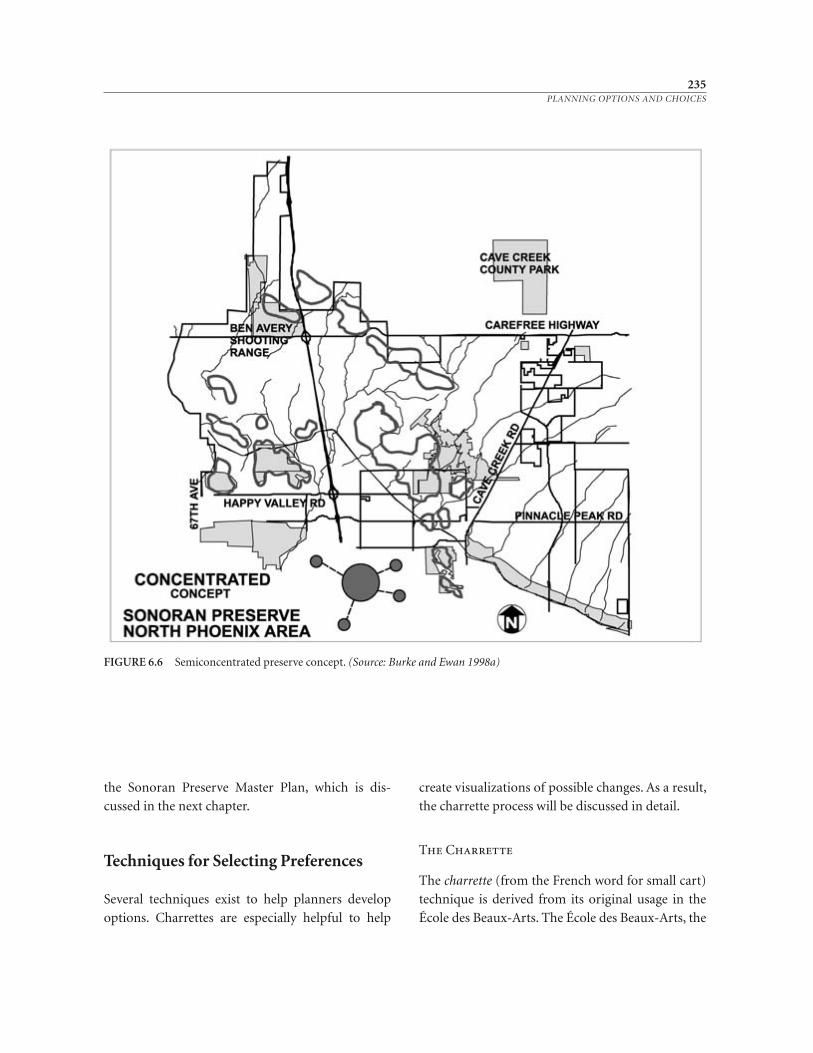
the Sonoran Preserve Master Plan, which is dis-
cussed in the next chapter.
Techniques for Selecting Preferences
Several techniques exist to help planners develop
options. Charrettes are especially helpful to help
create visualizations of possible changes. As a result,
the charrette process will be discussed in detail.
The Charrette
The charrette (from the French word for small cart)
technique is derived from its original usage in the
École des Beaux- Arts. The École des Beaux- Arts, the
235PLANNING OPTIONS AND CHOICES
FIGURE 6.6 Semiconcentrated preserve concept. (Source: Burke and Ewan 1998a)
French academy of fine arts, was founded in Paris in
1617, incorporating several older art schools. The
purpose was to give instruction in drawing, paint-
ing, sculpture, architecture, and engraving to a fixed
number of students selected by a highly competitive
examination. The training process consisted of lec-
tures on diverse subjects, such as anatomy and his-
tory, and practice in studios under the direction of
eminent master artists. Charrettes were the carts on
which students of the École des Beaux- Arts carried
their paintings. The paintings were criticized by
those who watched the carts pass. This method of
criticism was institutionalized first by the French
school and later in American art, design, and plan-
ning education.
A charrette may be used to present a series of
conceptual plans based on suitability analyses for
various land uses. Much preparation is necessary
before a session is held. Each of the plans may in-
volve different organizations of the planning areas,
with each optimizing a different use, such as agricul-
ture, recreation, housing, nature conservation, and
industry. The participants may also represent
groups advocating various uses. The emphasis is
placed on discussing the merits of each plan.
The Charrette Process. The charrette process can
be defined as “a brief period of intense activity, if
not round- the- clock work to accomplish a given
task” (Riddick 1971, 1). W. L. Riddick (1971) identi-
fies four essential ingredients for a charrette:
1. Identification of a specific community prob-
lem to study, understand, and hopefully
resolve.
2. Participation of interested citizens, particu-
larly those experiencing the problem (or its
effects), who are willing to be involved in the
decision- making process. This is a funda-
mental component of the charrette.
3. Involvement of professional experts from
within and outside the community. Initially
these experts listen and learn as citizens
express their concerns. Later, one of the
strengths of the charrette process lies in con-
sensus building as citizens and experts brain-
storm together to find solutions. Resource
material is typically made available to assist in
this process.
4. Commitment from the relevant power struc-
ture to put into effect the plans and recom-
mendations of the charrette. Representatives
of the power structure are to be present to
hear the concerns expressed by the citizens.
Originally focusing on the design of physical
structures, the charrette is now used for land- use
planning in a number of countries. American archi-
tects and new urbanists Andres Duany and Eliza-
beth Plater- Zyberk and the U.S. Office of Education
were early users of charrettes in the United States
(Riddick 1971; Meyer 1994). For example, Plater-
Zyberk and her colleagues used a charrette to de-
velop visions for the redevelopment of south
Florida after Hurricane Andrew in the early 1990s
(Alvarez et al. no date).
Charrettes can be used during the goal- setting
phase of the planning process. The City of Phoenix,
however, has found that charrettes are most effective
when clear goals have been set before the charrette
participants are brought together. Charrettes pro-
vide an opportunity to bring together expertise to
evaluate options and synthesize ideas, which is best
done when the focus of the participants is clear. Ad-
ditionally, support of the charrette participants is
enthusiastic only when political action is considered
possible. If the likelihood of immediate action on
the charrette recommendations is high, it is more
likely that charrette participants will be productive.
Phoenix has conducted several successful char-
rettes, frequently in cooperation with the ASU fac-
ulty and staff. In 1989 the city conducted the Camel-
back East Primary Core Urban Design Charrette,
which led to a specific plan for the Camelback Road
236CHAPTER 6
Corridor (City of Phoenix and ASU 1989) and re-
sulted in the plan subsequently adopted for that area
of Phoenix. In 1990, the City conducted the South
Central Avenue Streetscape Charrette, and in 1993 it
conducted a charrette on scenic corridors in the
Desert View Tri- Villages Area (City of Phoenix
1994). In 1992 the Phoenix City Zoo conducted a
charrette to design animal enclosures. Other exam-
ples of charrettes in the United States include one
for school design in New York City (En Charrette
1993); architecture student projects in Chicago
(Paris Prize 1993); urban design and energy effi-
ciency in downtown South Miami (D’Ambrosi and
Thomas 1993); landscape architecture in San Fran-
cisco (Thompson 1993); identifying crucial city
problems in York, Pennsylvania (Shumway 1973);
and a series of urban designs for Seattle and the
Puget Sound region (Kelbaugh 1997).
The charrette process is used frequently in Aus-
tralia for land- use planning. For instance, the City of
Rockdale in New South Wales conducted a one- week
charrette in 1994 to formulate multiple master plans
for a 43- hectare (106- acre) established industrial
area of metropolitan Sydney (Meyer 1994). The
Western Australia Department of Planning and Ur-
ban Development conducted a two- day charrette in
March 1993 “to provide a clear picture of what an ur-
ban village would be in the [city of] Perth context”
and how this could be applied in metropolitan fringe
growth corridors (Adams et al. 1993, 1). In 1992, the
City of Cranbourne in the outer southeastern area of
metropolitan Melbourne (Victoria, Australia) con-
ducted a charrette to plan for the growth of newly
designated residential areas (Taylor 1992). A Cana-
dian example is the Surrey Design Charrette in
British Columbia (Condon 1996); a charrette for the
Leidsche Rijn region near Utrecht is a Dutch exam-
ple (Koekebakker 1996); and the EDAW/Pei work-
shop for Suzhou is a Chinese effort (Prentice 1998).
The example of a charrette for the Desert View
Tri- Villages Area—the Sonoran North Land Use
Character Charrette of September 1995 (McCarthy
et al. 1995)—is explored in some detail here. ASU
master of environmental planning graduate student
James McCarthy and Lizi McGeorge, a visiting
scholar from Australia, were the main organizers of
the charrette. A complete list of the participants is
provided in Appendix B of this book.
Charrette Groundwork. The cooperation that
led to the Sonoran North Land Use Character Char-
rette involved over a year of discussions between city
staff and university faculty in a technical working
group, as well as a series of student projects (e.g.,
Bagley et al. 1995) and a comprehensive inventory
of environmental data sources by a student intern
(Coomer 1995). These discussions and projects con-
tributed significant background information. Con-
currently, the City of Phoenix and local residents
engaged in dialogue and various planning activities.
Many charrettes go on for several days, nearly 24
hours per day. The Sonoran North charrette was de-
signed to keep the spirit of intense work, but with a
less rigid three- day schedule, as shown in Table 6.2.
The charrette was held at Arizona State University–
West.
Introduction to Planning Area, Introduction toParticipants. The core team members met Friday af-
ternoon to tour the planning area. The tour route
and stops were chosen to maximize exposure to the
various landscape types, both natural and built. An
overview at the Central Arizona Project canal, the
southern boundary of the planning area, gave the
team members an opportunity to see the developed
area to the south and the abutting largely undevel-
oped area to the north (McCarthy et al. 1995).
The firsthand knowledge gained during the Fri-
day afternoon tour was supplemented by a presenta-
tion from a City of Phoenix planner. He projected
photographic slides and gave the charrette partici-
pants additional information concerning the pres-
ent conditions of the planning area. An outside de-
sign expert was also used to place the charrette in a
237PLANNING OPTIONS AND CHOICES
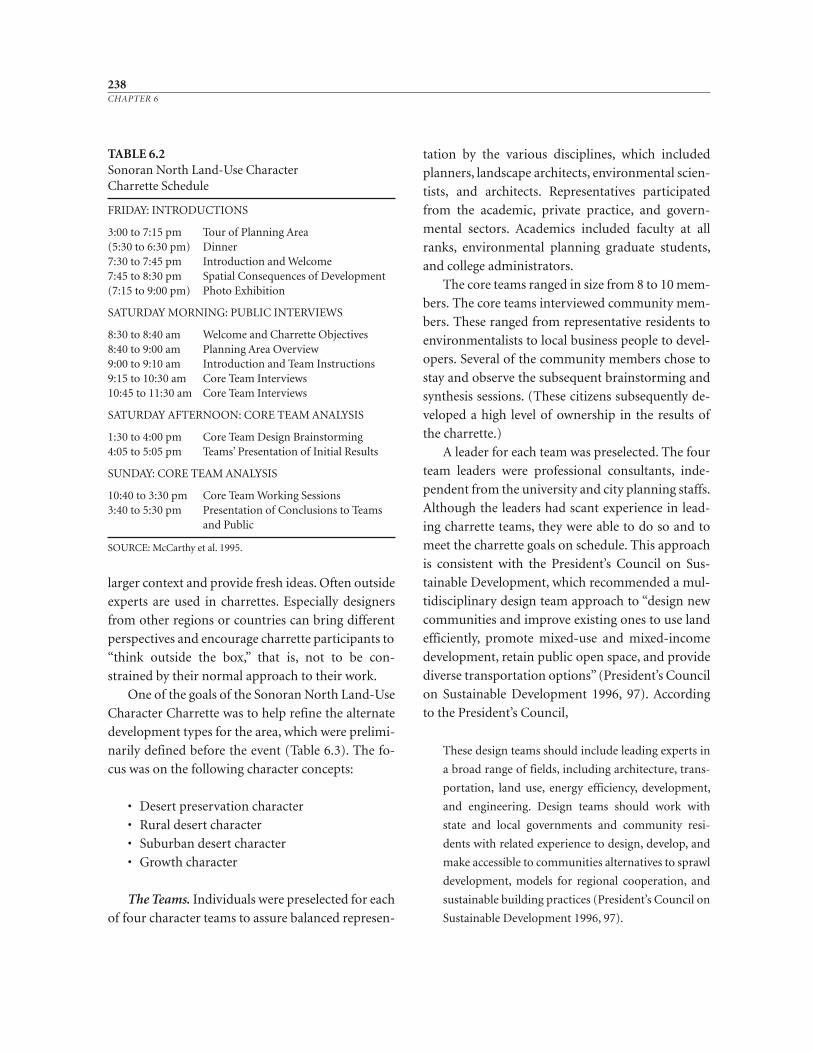
larger context and provide fresh ideas. Often outside
experts are used in charrettes. Especially designers
from other regions or countries can bring different
perspectives and encourage charrette participants to
“think outside the box,” that is, not to be con-
strained by their normal approach to their work.
One of the goals of the Sonoran North Land-Use
Character Charrette was to help refine the alternate
development types for the area, which were prelimi-
narily defined before the event (Table 6.3). The fo-
cus was on the following character concepts:
• Desert preservation character
• Rural desert character
• Suburban desert character
• Growth character
The Teams. Individuals were preselected for each
of four character teams to assure balanced represen-
tation by the various disciplines, which included
planners, landscape architects, environmental scien-
tists, and architects. Representatives participated
from the academic, private practice, and govern-
mental sectors. Academics included faculty at all
ranks, environmental planning graduate students,
and college administrators.
The core teams ranged in size from 8 to 10 mem-
bers. The core teams interviewed community mem-
bers. These ranged from representative residents to
environmentalists to local business people to devel-
opers. Several of the community members chose to
stay and observe the subsequent brainstorming and
synthesis sessions. (These citizens subsequently de-
veloped a high level of ownership in the results of
the charrette.)
A leader for each team was preselected. The four
team leaders were professional consultants, inde-
pendent from the university and city planning staffs.
Although the leaders had scant experience in lead-
ing charrette teams, they were able to do so and to
meet the charrette goals on schedule. This approach
is consistent with the President’s Council on Sus-
tainable Development, which recommended a mul-
tidisciplinary design team approach to “design new
communities and improve existing ones to use land
efficiently, promote mixed- use and mixed- income
development, retain public open space, and provide
diverse transportation options” (President’s Council
on Sustainable Development 1996, 97). According
to the President’s Council,
These design teams should include leading experts in
a broad range of fields, including architecture, trans-
portation, land use, energy efficiency, development,
and engineering. Design teams should work with
state and local governments and community resi-
dents with related experience to design, develop, and
make accessible to communities alternatives to sprawl
development, models for regional cooperation, and
sustainable building practices (President’s Council on
Sustainable Development 1996, 97).
238CHAPTER 6
TABLE 6.2Sonoran North Land- Use Character Charrette Schedule
FRIDAY: INTRODUCTIONS
3:00 to 7:15 pm Tour of Planning Area(5:30 to 6:30 pm) Dinner7:30 to 7:45 pm Introduction and Welcome7:45 to 8:30 pm Spatial Consequences of Development(7:15 to 9:00 pm) Photo Exhibition
SATURDAY MORNING: PUBLIC INTERVIEWS
8:30 to 8:40 am Welcome and Charrette Objectives8:40 to 9:00 am Planning Area Overview9:00 to 9:10 am Introduction and Team Instructions9:15 to 10:30 am Core Team Interviews10:45 to 11:30 am Core Team Interviews
SATURDAY AFTERNOON: CORE TEAM ANALYSIS
1:30 to 4:00 pm Core Team Design Brainstorming4:05 to 5:05 pm Teams’ Presentation of Initial Results
SUNDAY: CORE TEAM ANALYSIS
10:40 to 3:30 pm Core Team Working Sessions3:40 to 5:30 pm Presentation of Conclusions to Teams
and Public
SOURCE: McCarthy et al. 1995.
239PLANNING OPTIONS AND CHOICES
TABLE 6.3City of Phoenix Preliminary Land-Use Character Descriptions for the Desert View Tri- Villages Area
Desert Preservation CharacterThis conceptual pattern forever preserves large enough parcels of desert to maintain an ecosystem. Patterns of desert preserva-tion also may occur at smaller scales, perhaps relating to the other three patterns through interconnecting fingers of naturaldesert space, gateways, or boundary definitions. A realm of options exists for implementing this pattern, including transfer ofdevelopment densities, cluster development, land trusts, fee- simple purchase, purchase of development rights, conservationeasement, and dedications.
Rural Desert CharacterFor many people, living in the desert environment means living a rural way of life. This way of life is very much oriented to theoutdoors; space and immediate access to the natural environment are important. Large open lots, single- story ranch- stylehomes with accessory barns or garages, little night- lighting, livestock and horses, unpaved roadways and drives, and othertraits symbolize this rurality.
Presently, two differing visions exist among advocates of the Rural Desert Character Development pattern: (1) Those whodesire continued equestrian privileges, thus allowing for the development of horse properties and related facilities; and(2) those who want to minimize future horse property development, instead requiring maximum building envelope standardsto minimize grading and encourage the retention of undisturbed desert.
Suburban Desert CharacterBased on the city’s Peripheral Areas C & D Plan, the following development philosophies guide this conceptual pattern of de-velopment in the North Area:
Preserve wash corridors, mountain slopes, and native vegetation
Provide views of mountains and surrounding desert
Encourage cluster development and building envelopes
Identify scenic desert parkways
Approve plans and designs prior to site disturbance
Protect natural desert areas before development
Encourage development that is harmonious with overall environment and appearance of the area
Encourage water conservation
Growth Corridor/Core Development CharacterThis conceptual pattern foresees the layout of future development along major transportation corridors. Generally, this patternrecognizes that areas of activity within corridors depend on access to transportation. Two primary growth corridor/core areasexist within the area; the I- 17 Corridor and the General Plan- designated Primary Core located in the vicinity of Tatum Boule-vard and Cave Creek Road.
Although many linear forms of development often lack a core or center, growth corridor/core development is envisioned tohave central activity nodes. The presence of a nucleus or focal point of activity within the growth corridor/core developmentfacilitates the creation of a “sense of place.”
Typically a linear type of development is synonymous with strip development, which is an undesirable type of urban formthat is based primarily on automobile access and lacks the elements necessary for establishing community identity. Character-istics of the conceptual growth corridor/core pattern differ significantly from those associated with generic linear- type development.
SOURCE: McCarthy et al. 1995.
Team Instructions. Broad guidelines for the
structure of the working sessions were provided.
With their areas of concern defined, the teams were
given a schedule that set the time periods for citizen
interviews, brainstorming, and synthesis of find-
ings. Their product, to be delivered on Sunday after-
noon, was a list of overriding principles that the
team thought would define their character theme.
The principles were then to be expanded into more
specific guidelines, and finally into a list of recom-
mendations for further action. Additionally, the
teams were requested to prepare graphic representa-
tions of the principles and guidelines for their char-
acter theme (McCarthy et al. 1995).
Citizen Interviews. After the Saturday morning
introductions and instructions, the teams split up
and reassembled in four separate meeting rooms.
They devoted several hours to interviewing citizen
and developer representatives about their concerns,
experiences, and ideas. The City of Phoenix also
provided reference materials such as maps and ex-
isting planning documents to stimulate discussion.
The citizens’ comments and ideas were documented
on flip charts. Area residents, developers, realtors,
neighborhood organizations, and environmental
organizations were represented. Besides the invited
citizens, wider public involvement was encouraged
by issuing a press release to the area newspapers
about the charrette (McCarthy et al. 1995). The in-
terviews helped the teams to identify issues. For ex-
ample, Table 6.4 summarizes the suburban develop-
ment issues in the area.
Brainstorming and Synthesis. The interviews
completed the data- gathering segment of the char-
rette. Next followed the brainstorming and synthe-
sis segment, with a ground rule that any idea would
be considered. After listing all the ideas and recom-
mendations, the teams organized and synthesized
the ideas to make preliminary recommendations.
All charrette participants met Saturday evening to
review the progress of the day. When each of the
four teams presented their preliminary recommen-
dations to the reassembled charrette group, certain
themes began to emerge.
The themes were focused and organized during
the Sunday sessions. The personalities of each team
were becoming clear by Sunday. For example, while
most teams worked through the lunches, eating as
they worked, one team thought a brief break would
be more beneficial. As the deadline for the Sunday
summary meeting approached, subteams emerged.
Some participants concentrated on graphics, while
others concentrated on the wording of principles,
guidelines, and recommendations.
The original plan was to reassemble in the audi-
torium for the final team presentations on Sunday
afternoon. But as the day progressed, it became ap-
parent that the substantial quantity of flip charts,
tracing paper overlays, and drawings that had been
generated made assembling in the auditorium im-
practical. It was decided that meeting in the individ-
ual workrooms was more efficient, and that doing
so would add a personal touch to the presentations
and a sense of product ownership for each team.
Thus each team made a presentation to the assem-
bled charrette in their own room. As can be seen in
Figure 6.7, the conditions were somewhat cramped,
but this seemed to add to the positive atmosphere
felt over the weekend (McCarthy et al. 1995).
240CHAPTER 6
TABLE 6.4Suburban Desert Character Issues
• Existing drainage regulations, which were adopted to pro-tect natural washes and to meet flood insurance require-ments, may actually result in much damage.
• Existing suburban development lacks a sense of commu-nity and has inadequate bicycle and pedestrian linkages toremote shopping and public facilities.
• New development threatens the visual quality and ecolog-ical integrity of the area.
• Current development and design review procedures arecostly and unpredictable.
SOURCE: McCarthy et al. 1995.
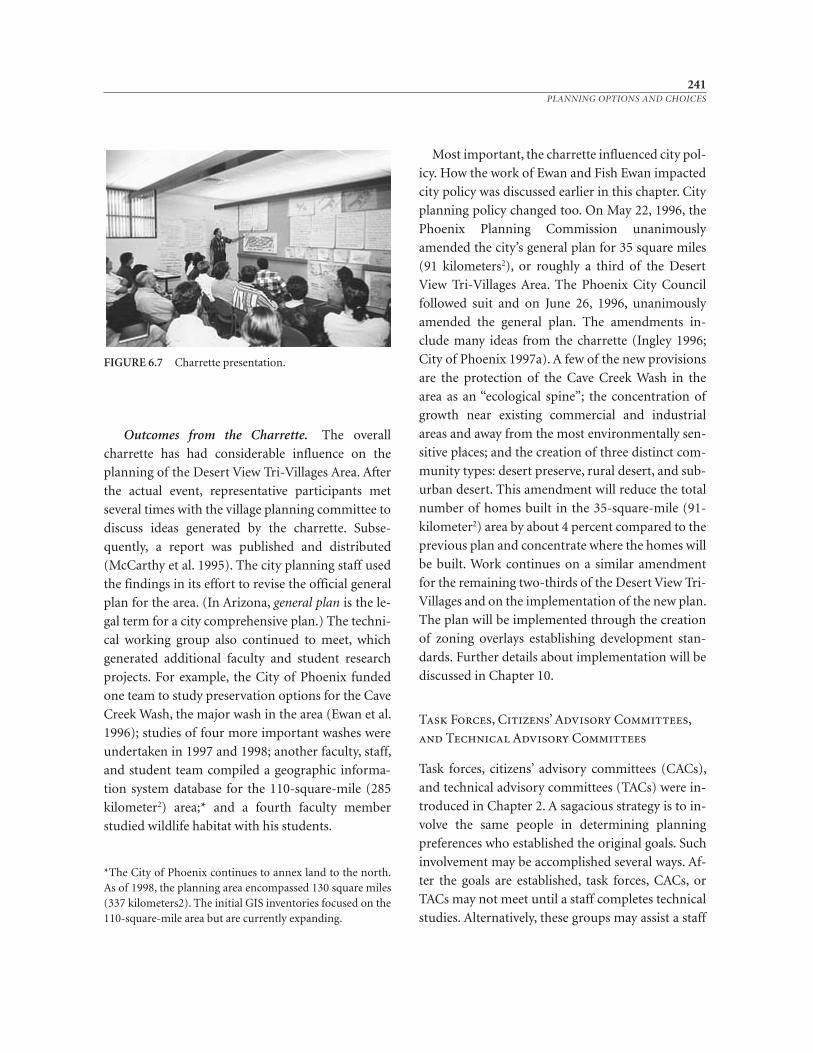
Outcomes from the Charrette. The overall
charrette has had considerable influence on the
planning of the Desert View Tri- Villages Area. After
the actual event, representative participants met
several times with the village planning committee to
discuss ideas generated by the charrette. Subse-
quently, a report was published and distributed
(McCarthy et al. 1995). The city planning staff used
the findings in its effort to revise the official general
plan for the area. (In Arizona, general plan is the le-
gal term for a city comprehensive plan.) The techni-
cal working group also continued to meet, which
generated additional faculty and student research
projects. For example, the City of Phoenix funded
one team to study preservation options for the Cave
Creek Wash, the major wash in the area (Ewan et al.
1996); studies of four more important washes were
undertaken in 1997 and 1998; another faculty, staff,
and student team compiled a geographic informa-
tion system database for the 110- square- mile (285
kilometer2) area;* and a fourth faculty member
studied wildlife habitat with his students.
Most important, the charrette influenced city pol-
icy. How the work of Ewan and Fish Ewan impacted
city policy was discussed earlier in this chapter. City
planning policy changed too. On May 22, 1996, the
Phoenix Planning Commission unanimously
amended the city’s general plan for 35 square miles
(91 kilometers2), or roughly a third of the Desert
View Tri- Villages Area. The Phoenix City Council
followed suit and on June 26, 1996, unanimously
amended the general plan. The amendments in -
clude many ideas from the charrette (Ingley 1996;
City of Phoenix 1997a). A few of the new provisions
are the protection of the Cave Creek Wash in the
area as an “ecological spine”; the concentration of
growth near existing commercial and industrial
areas and away from the most environmentally sen-
sitive places; and the creation of three distinct com-
munity types: desert preserve, rural desert, and sub-
urban desert. This amendment will reduce the total
number of homes built in the 35- square- mile (91-
kilometer2) area by about 4 percent compared to the
previous plan and concentrate where the homes will
be built. Work continues on a similar amendment
for the remaining two- thirds of the Desert View Tri-
Villages and on the implementation of the new plan.
The plan will be implemented through the creation
of zoning overlays establishing development stan-
dards. Further details about implementation will be
discussed in Chapter 10.
Task Forces, Citizens’ Advisory Committees,
and Technical Advisory Committees
Task forces, citizens’ advisory committees (CACs),
and technical advisory committees (TACs) were in-
troduced in Chapter 2. A sagacious strategy is to in-
volve the same people in determining planning
preferences who established the original goals. Such
involvement may be accomplished several ways. Af-
ter the goals are established, task forces, CACs, or
TACs may not meet until a staff completes technical
studies. Alternatively, these groups may assist a staff
241PLANNING OPTIONS AND CHOICES
FIGURE 6.7 Charrette presentation.
*The City of Phoenix continues to annex land to the north.As of 1998, the planning area encompassed 130 square miles(337 kilometers2). The initial GIS inventories focused on the110- square- mile area but are currently expanding.
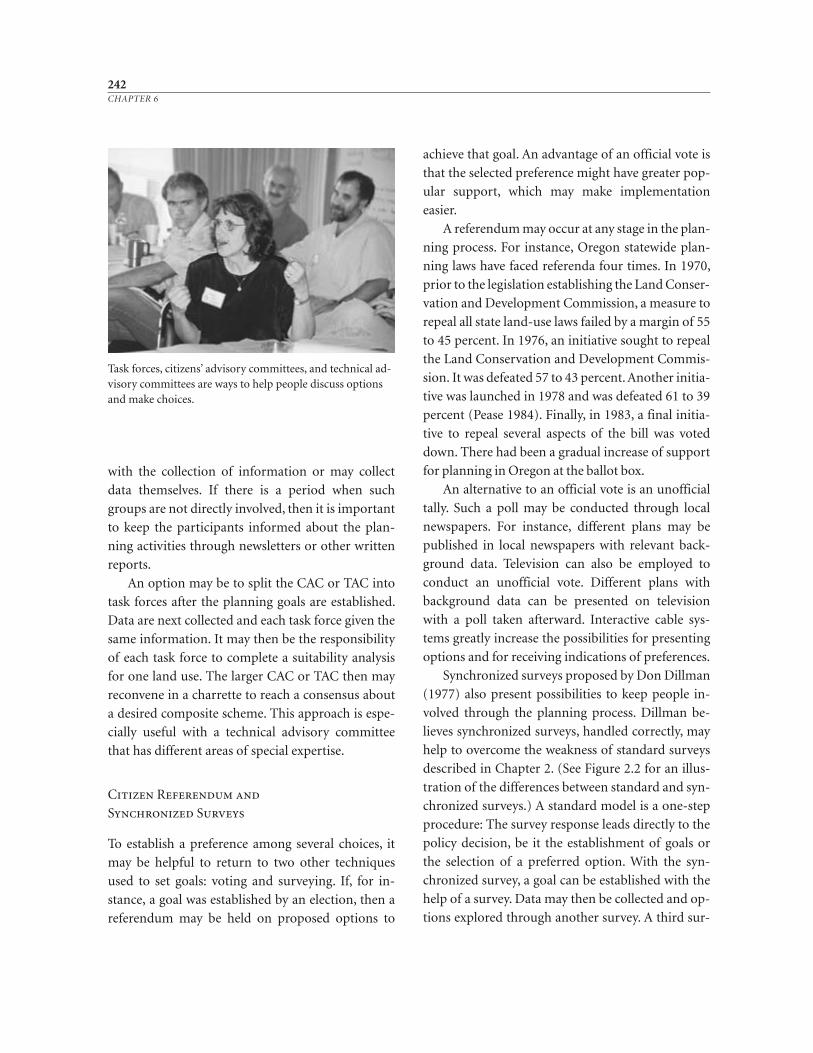
with the collection of information or may collect
data themselves. If there is a period when such
groups are not directly involved, then it is important
to keep the participants informed about the plan-
ning activities through newsletters or other written
reports.
An option may be to split the CAC or TAC into
task forces after the planning goals are established.
Data are next collected and each task force given the
same information. It may then be the responsibility
of each task force to complete a suitability analysis
for one land use. The larger CAC or TAC then may
reconvene in a charrette to reach a consensus about
a desired composite scheme. This approach is espe-
cially useful with a technical advisory committee
that has different areas of special expertise.
Citizen Referendum and
Synchronized Surveys
To establish a preference among several choices, it
may be helpful to return to two other techniques
used to set goals: voting and surveying. If, for in-
stance, a goal was established by an election, then a
referendum may be held on proposed options to
achieve that goal. An advantage of an official vote is
that the selected preference might have greater pop-
ular support, which may make implementation
easier.
A referendum may occur at any stage in the plan-
ning process. For instance, Oregon statewide plan-
ning laws have faced referenda four times. In 1970,
prior to the legislation establishing the Land Conser-
vation and Development Commission, a measure to
repeal all state land- use laws failed by a margin of 55
to 45 percent. In 1976, an initiative sought to repeal
the Land Conservation and Development Commis-
sion. It was defeated 57 to 43 percent. Another initia-
tive was launched in 1978 and was defeated 61 to 39
percent (Pease 1984). Finally, in 1983, a final initia-
tive to repeal several aspects of the bill was voted
down. There had been a gradual increase of support
for planning in Oregon at the ballot box.
An alternative to an official vote is an unofficial
tally. Such a poll may be conducted through local
newspapers. For instance, different plans may be
published in local newspapers with relevant back-
ground data. Television can also be employed to
conduct an unofficial vote. Different plans with
background data can be presented on television
with a poll taken afterward. Interactive cable sys-
tems greatly increase the possibilities for presenting
options and for receiving indications of preferences.
Synchronized surveys proposed by Don Dillman
(1977) also present possibilities to keep people in-
volved through the planning process. Dillman be-
lieves synchronized surveys, handled correctly, may
help to overcome the weakness of standard surveys
described in Chapter 2. (See Figure 2.2 for an illus-
tration of the differences between standard and syn-
chronized surveys.) A standard model is a one- step
procedure: The survey response leads directly to the
policy decision, be it the establishment of goals or
the selection of a preferred option. With the syn-
chronized survey, a goal can be established with the
help of a survey. Data may then be collected and op-
tions explored through another survey. A third sur-
242CHAPTER 6
Task forces, citizens’ advisory committees, and technical ad-visory committees are ways to help people discuss optionsand make choices.
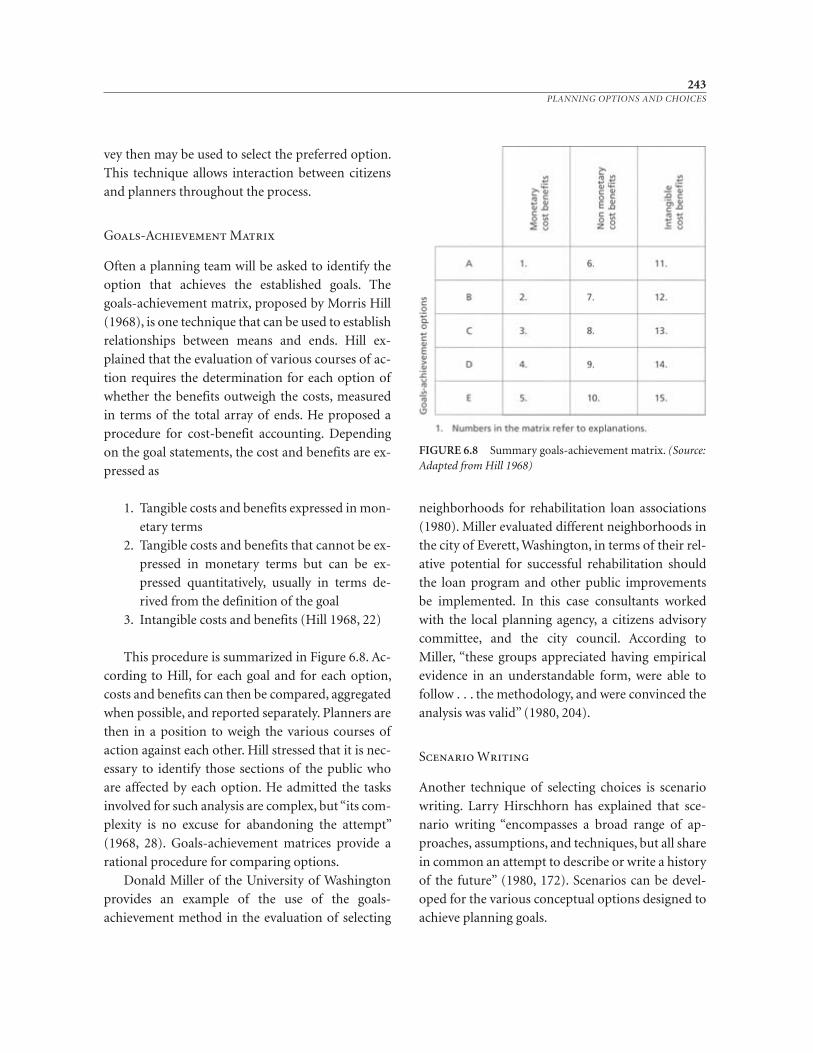
vey then may be used to select the preferred option.
This technique allows interaction between citizens
and planners throughout the process.
Goals- Achievement Matrix
Often a planning team will be asked to identify the
option that achieves the established goals. The
goals- achievement matrix, proposed by Morris Hill
(1968), is one technique that can be used to establish
relationships between means and ends. Hill ex-
plained that the evaluation of various courses of ac-
tion requires the determination for each option of
whether the benefits outweigh the costs, measured
in terms of the total array of ends. He proposed a
procedure for cost- benefit accounting. Depending
on the goal statements, the cost and benefits are ex-
pressed as
1. Tangible costs and benefits expressed in mon-
etary terms
2. Tangible costs and benefits that cannot be ex-
pressed in monetary terms but can be ex-
pressed quantitatively, usually in terms de-
rived from the definition of the goal
3. Intangible costs and benefits (Hill 1968, 22)
This procedure is summarized in Figure 6.8. Ac-
cording to Hill, for each goal and for each option,
costs and benefits can then be compared, aggregated
when possible, and reported separately. Planners are
then in a position to weigh the various courses of
action against each other. Hill stressed that it is nec-
essary to identify those sections of the public who
are affected by each option. He admitted the tasks
involved for such analysis are complex, but “its com-
plexity is no excuse for abandoning the attempt”
(1968, 28). Goals- achievement matrices provide a
rational procedure for comparing options.
Donald Miller of the University of Washington
provides an example of the use of the goals-
achievement method in the evaluation of selecting
neighborhoods for rehabilitation loan associations
(1980). Miller evaluated different neighborhoods in
the city of Everett, Washington, in terms of their rel-
ative potential for successful rehabilitation should
the loan program and other public improvements
be implemented. In this case consultants worked
with the local planning agency, a citizens advisory
committee, and the city council. According to
Miller, “these groups appreciated having empirical
evidence in an understandable form, were able to
follow . . . the methodology, and were convinced the
analysis was valid” (1980, 204).
Scenario Writing
Another technique of selecting choices is scenario
writing. Larry Hirschhorn has explained that sce-
nario writing “encompasses a broad range of ap-
proaches, assumptions, and techniques, but all share
in common an attempt to describe or write a history
of the future” (1980, 172). Scenarios can be devel-
oped for the various conceptual options designed to
achieve planning goals.
243PLANNING OPTIONS AND CHOICES
FIGURE 6.8 Summary goals- achievement matrix. (Source:Adapted from Hill 1968)
Hirschhorn (1980) distinguishes between state
scenarios and process scenarios. State scenarios de-
scribe what the planning area will be like at some
date in the future without explaining how that situ-
ation is achieved. Process scenarios discuss the events
that may lead to a future situation. Both can be used
to explain the potential consequences of various
planning options.
Hirschhorn (1980) furthermore examines four
types of process scenarios. The first is the idealiza-
tion process, whereby ideal scenarios are envi-
sioned. The second are the prophecy scenarios, in
which Hirschhorn notes “the prophet has a com-
pelling vision of how the world will and must be
in the future” (174). The third type is simulation,
which Hirschhorn describes as “state driven, pro-
cess based, and used for predictive purposes”
(174). The final type is the developmental scenario,
which begins “with an initial state and describes a
process through which a particular social system
can arrive at one or a series of end states that are
not specified prior to the construction of the sce-
nario itself ” (175).
Hirschhorn makes a compelling argument for
the benefits of developmental scenario writing and
explains how such a scenario can be constructed
in an article in the Journal of the American Plan-
ning Association (1980). Scenario writing presents a
useful way to create a framework to discuss the
consequences of various planning options by a
planning commission or staff, CAC, TAC, or task
force.
Public Hearings
Public hearings will probably be a legal require-
ment for making planning choices. As a result,
planners must keep accurate accounts of the pro-
ceedings. The Institute for Participatory Manage-
ment and Planning (1997) notes that the hearings
proceedings consist of three parts, often called the
“findings”:
● A summary of the main points of the planning
issue being addressed
• The range of solutions, including the recom-
mended option
• The reactions of the various interest groups to
the proposed course of action
Those who have been involved in public hear-
ings will attest that such events are not noted for
their rationality. As a result, it is essential for plan-
ners to make clear, thorough presentations of the
various options available to achieve community
goals. Summaries of inventories, suitability analyses,
surveys, and goals- achievement matrices can be pre-
sented. It is also good to involve citizens who have
participated in advisory committees and task forces,
as well as expert testimony.
For example, the Yakima County, Washington,
planning commission and staff worked for over
a year exploring ways to slow down the con version
of prime farmland to urban uses and to direct
growth near existing cities and towns. The effort
had been well publicized and involved hundreds of
people. Yet, at the first public hearing where the op-
tions were presented, several individuals claimed
that they had heard nothing about the program and
that only a few citizens had been involved in devel-
oping the various choices.
At the second hearing the planning staff posted
the numerous newspaper accounts of the program
along the long hallway leading to the meeting room.
All those who attended the hearing passed by this
extensive account. In addition, the many people
who had been involved in the process were asked to
attend the hearing to testify concerning their in-
volvement. As a result, no one raised the issue that
they knew nothing about the program, and there
was substantial testimony about citizen involve-
ment. This format continued through subsequent
hearings, and debate was focused on the merits of
the various options available to the community to
achieve its goals.
244CHAPTER 6
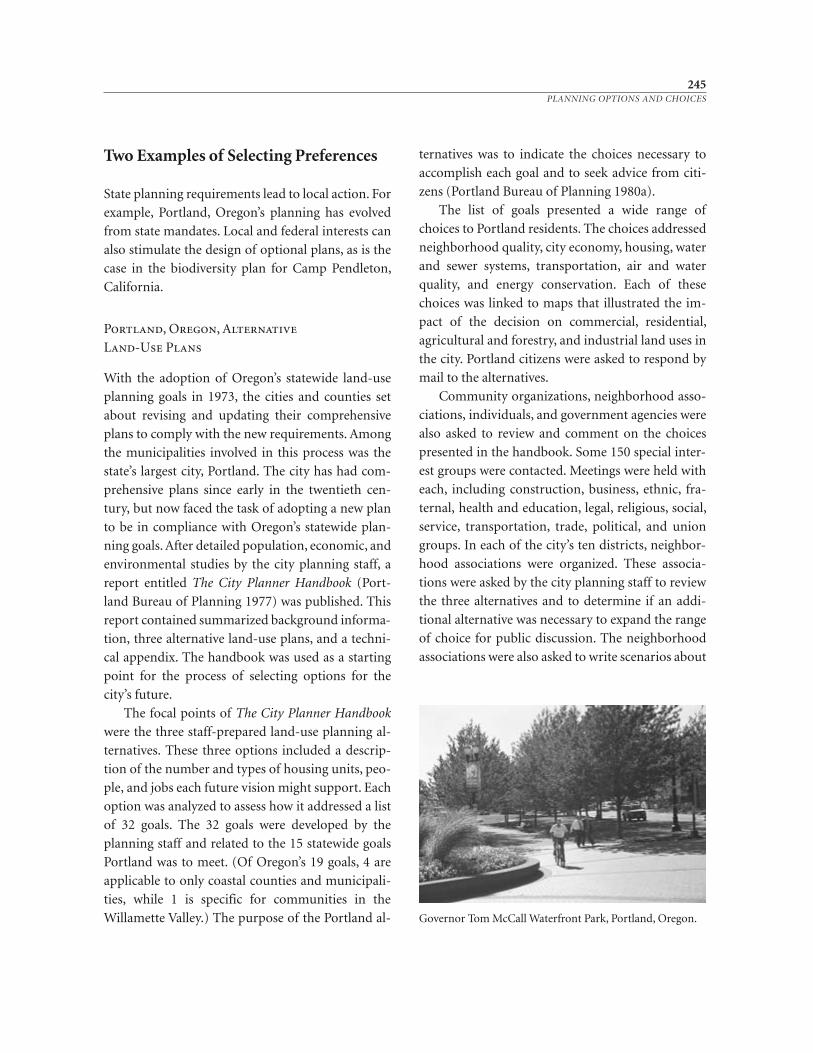
Two Examples of Selecting Preferences
State planning requirements lead to local action. For
example, Portland, Oregon’s planning has evolved
from state mandates. Local and federal interests can
also stimulate the design of optional plans, as is the
case in the biodiversity plan for Camp Pendleton,
California.
Portland, Oregon, Alternative
Land- Use Plans
With the adoption of Oregon’s statewide land- use
planning goals in 1973, the cities and counties set
about revising and updating their comprehensive
plans to comply with the new requirements. Among
the municipalities involved in this process was the
state’s largest city, Portland. The city has had com-
prehensive plans since early in the twentieth cen-
tury, but now faced the task of adopting a new plan
to be in compliance with Oregon’s statewide plan-
ning goals. After detailed population, economic, and
environmental studies by the city planning staff, a
report entitled The City Planner Handbook (Port-
land Bureau of Planning 1977) was published. This
report contained summarized background informa-
tion, three alternative land- use plans, and a techni-
cal appendix. The handbook was used as a starting
point for the process of selecting options for the
city’s future.
The focal points of The City Planner Handbook
were the three staff- prepared land- use planning al-
ternatives. These three options included a descrip-
tion of the number and types of housing units, peo-
ple, and jobs each future vision might support. Each
option was analyzed to assess how it addressed a list
of 32 goals. The 32 goals were developed by the
planning staff and related to the 15 statewide goals
Portland was to meet. (Of Oregon’s 19 goals, 4 are
applicable to only coastal counties and municipali-
ties, while 1 is specific for communities in the
Willamette Valley.) The purpose of the Portland al-
ternatives was to indicate the choices necessary to
accomplish each goal and to seek advice from citi-
zens (Portland Bureau of Planning 1980a).
The list of goals presented a wide range of
choices to Portland residents. The choices addressed
neighborhood quality, city economy, housing, water
and sewer systems, transportation, air and water
quality, and energy conservation. Each of these
choices was linked to maps that illustrated the im-
pact of the decision on commercial, residential,
agricultural and forestry, and industrial land uses in
the city. Portland citizens were asked to respond by
mail to the alternatives.
Community organizations, neighborhood asso-
ciations, individuals, and government agencies were
also asked to review and comment on the choices
presented in the handbook. Some 150 special inter-
est groups were contacted. Meetings were held with
each, including construction, business, ethnic, fra-
ternal, health and education, legal, religious, social,
service, transportation, trade, political, and union
groups. In each of the city’s ten districts, neighbor-
hood associations were organized. These associa-
tions were asked by the city planning staff to review
the three alternatives and to determine if an addi-
tional alternative was necessary to expand the range
of choice for public discussion. The neighborhood
associations were also asked to write scenarios about
245PLANNING OPTIONS AND CHOICES
Governor Tom McCall Waterfront Park, Portland, Oregon.
the implication of each alternative (Portland Bureau
of Planning 1980a).
There was a strong emphasis placed on neigh-
borhood review of the options. The process of
planning in Portland was used to strengthen its
neighborhoods. According to a former planning
commission president, Joan Smith, “If the planning
process did nothing else for this city, it made many
of the neighborhoods more articulate and better or-
ganized” (Sistrom 1979, 1).
From this process each planning district devel-
oped a new alternative. Evening town meetings were
then held in each of the ten districts, where testi-
mony was heard on the scenarios developed for each
option. Two citywide meetings, one during the day
and one at night, were also held downtown to dis-
cuss the alternatives.
Next the city hired a consulting firm to conduct
a random survey consisting of 450 in- home inter-
views during April and May 1978. Those inter-
viewed were asked to evaluate each of the options.
At the same time all the alternatives, including those
developed by the ten planning districts, were dis-
tributed to over 33,000 people. Again citizens were
asked to review each alternative and rank the list of
32 goals (Portland Bureau of Planning 1980a). In a
sense, this was a form of a goals- achievement matrix
combined with synchronized survey.
These surveys and the testimony from the town
hall meetings were analyzed and tabulated by the
Center for Population Research at Portland State
University. The results of this analysis were incorpo-
rated into the first draft of a comprehensive plan,
called a discussion draft. The publication of this dis-
cussion draft initiated another round of citizen re-
view lasting six months (Portland Bureau of Plan-
ning 1980a).
During this period, over 80 neighborhood asso-
ciation meetings, many business and service group
meetings, 2 citywide conferences, and 9 planning
district town hall meetings were held, as concur-
rently the planning staff conducted additional sur-
veys. Over 800 suggestions were received, of which
65 percent were used in a second draft called the
proposed comprehensive plan. This proposed plan
was taken to the city planning commission in Sep-
tember 1979. The planning commission held 8 pub-
lic hearings during the next two months. At the
same time, the proposed plan was distributed to
neighborhood associations; civic, environmental,
and business groups; and other government agen-
cies. In addition, a total of 10,000 proposed plan
maps were mailed out to groups and individuals
(Portland Bureau of Planning 1980a).
Responses to the mailing and testimony from the
hearings were compiled in summary notebooks.
These notebooks were used by the planning com-
mission and staff to write a third draft, the recom-
mended comprehensive plan. The recommended plan
was submitted to the city council in January 1980. At
this time nearly 14,000 recommended plans were
mailed to groups and individuals. The city council
then held a series of 33 more public hearings, during
which time about 400 amendments were made. On
August 21, 1980, the city council adopted the plan
(Portland Bureau of Planning 1980b).
This was a lengthy process of reviewing planning
options. In the end, Portland adopted its new com-
prehensive plan. In 1981, the Oregon Land Conser-
vation and Development Commission acknowl-
edged that the plan was in compliance with the 15
statewide planning goals. Since 1981, Portland lead-
ers have continued to respond to Oregon’s evolving
land- use requirements (Department of Land Con-
servation and Development 1996). For example,
Portland must comply with Metro goals in addition
to those of LCDC. Metro (the Metropolitan Service
District) is a “unique type” of legislative regional
planning authority (Carson 1998). Metro’s jurisdic-
tion covers 24 cities and 3 county urban areas in the
Portland Metropolitan region. Its authority ad-
dresses air quality, water quality, transportation,
solid waste, and the regional urban growth bound-
ary (Carson 1998).
246CHAPTER 6
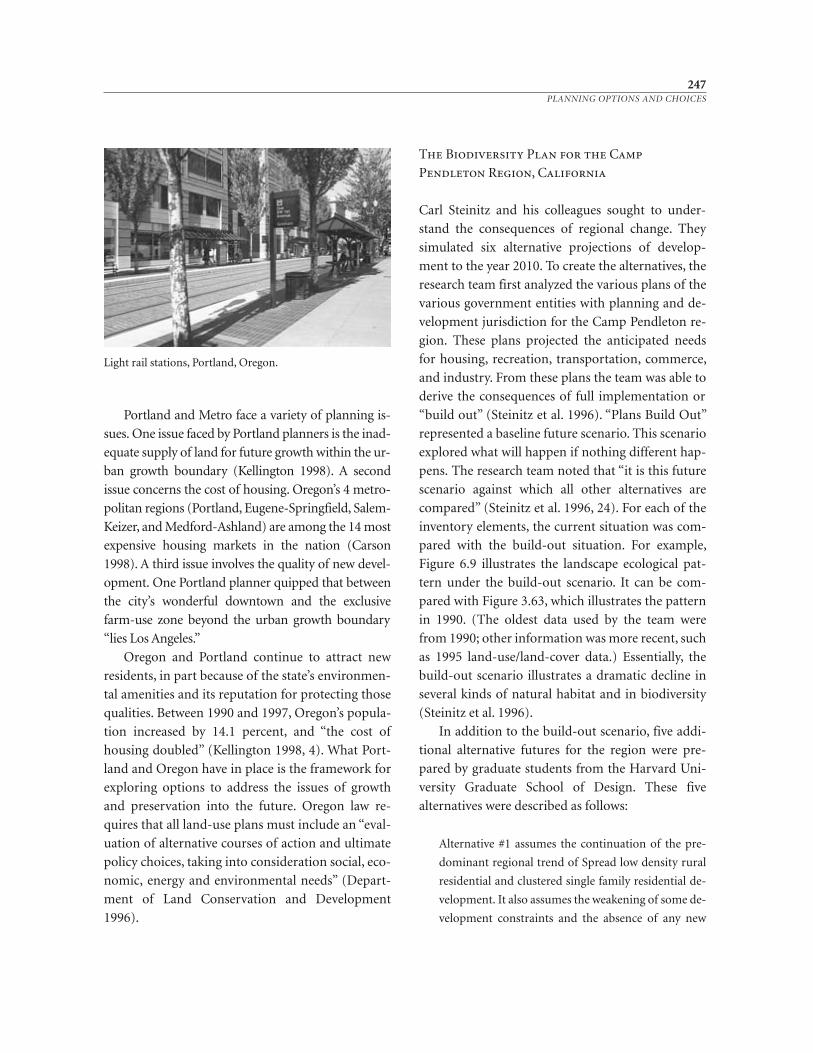
Portland and Metro face a variety of planning is-
sues. One issue faced by Portland planners is the inad-
equate supply of land for future growth within the ur-
ban growth boundary (Kellington 1998). A second
issue concerns the cost of housing. Oregon’s 4 metro-
politan regions (Portland, Eugene- Springfield, Salem-
Keizer, and Medford- Ashland) are among the 14 most
expensive housing markets in the nation (Carson
1998). A third issue involves the quality of new devel-
opment. One Portland planner quipped that between
the city’s wonderful downtown and the exclusive
farm- use zone beyond the urban growth boundary
“lies Los Angeles.”
Oregon and Portland continue to attract new
residents, in part because of the state’s environmen-
tal amenities and its reputation for protecting those
qualities. Between 1990 and 1997, Oregon’s popula-
tion increased by 14.1 percent, and “the cost of
housing doubled” (Kellington 1998, 4). What Port-
land and Oregon have in place is the framework for
exploring options to address the issues of growth
and preservation into the future. Oregon law re-
quires that all land- use plans must include an “eval-
uation of alternative courses of action and ultimate
policy choices, taking into consideration social, eco-
nomic, energy and environmental needs” (Depart-
ment of Land Conservation and Development
1996).
The Biodiversity Plan for the Camp
Pendleton Region, California
Carl Steinitz and his colleagues sought to under-
stand the consequences of regional change. They
simulated six alternative projections of develop-
ment to the year 2010. To create the alternatives, the
research team first analyzed the various plans of the
various government entities with planning and de-
velopment jurisdiction for the Camp Pendleton re-
gion. These plans projected the anticipated needs
for housing, recreation, transportation, commerce,
and industry. From these plans the team was able to
derive the consequences of full implementation or
“build out” (Steinitz et al. 1996). “Plans Build Out”
represented a baseline future scenario. This scenario
explored what will happen if nothing different hap-
pens. The research team noted that “it is this future
scenario against which all other alternatives are
compared” (Steinitz et al. 1996, 24). For each of the
inventory elements, the current situation was com-
pared with the build- out situation. For example,
Figure 6.9 illustrates the landscape ecological pat-
tern under the build- out scenario. It can be com-
pared with Figure 3.63, which illustrates the pattern
in 1990. (The oldest data used by the team were
from 1990; other information was more recent, such
as 1995 land-use/land-cover data.) Essentially, the
build- out scenario illustrates a dramatic decline in
several kinds of natural habitat and in biodiversity
(Steinitz et al. 1996).
In addition to the build- out scenario, five addi-
tional alternative futures for the region were pre-
pared by graduate students from the Harvard Uni-
versity Graduate School of Design. These five
alternatives were described as follows:
Alternative #1 assumes the continuation of the pre-
dominant regional trend of Spread low density rural
residential and clustered single family residential de-
velopment. It also assumes the weakening of some de-
velopment constraints and the absence of any new
247PLANNING OPTIONS AND CHOICES
Light rail stations, Portland, Oregon.
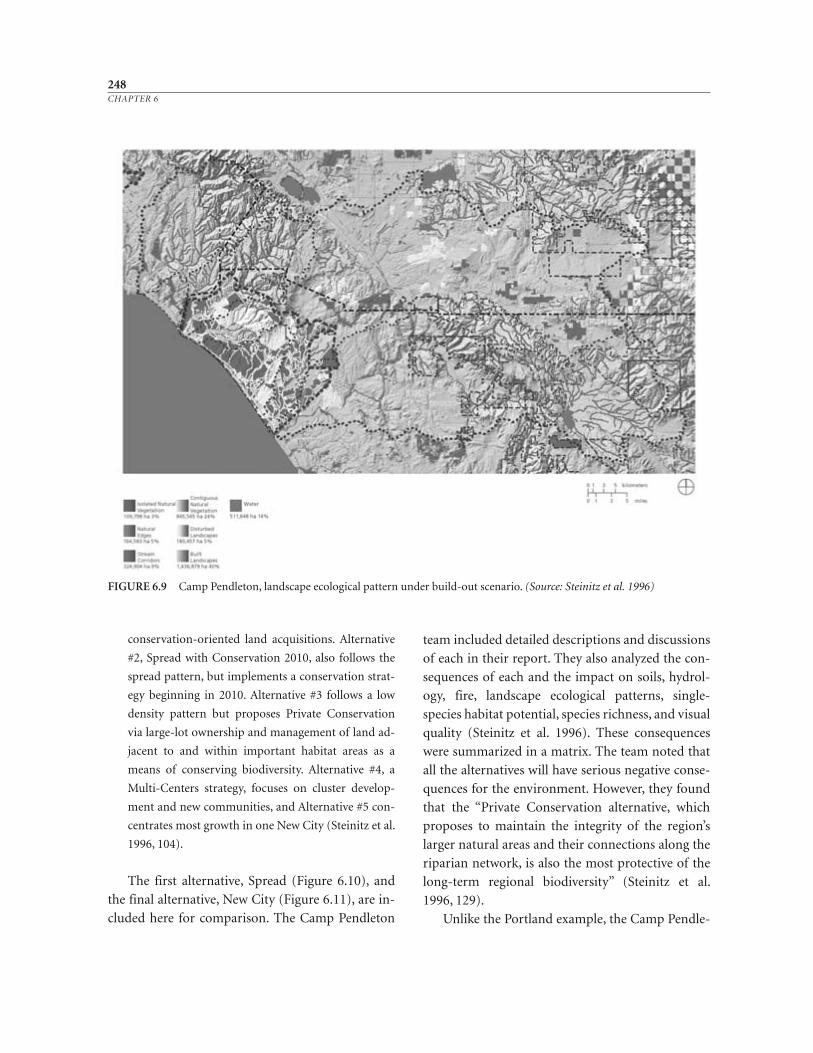
conservation- oriented land acquisitions. Alternative
#2, Spread with Conservation 2010, also follows the
spread pattern, but implements a conservation strat-
egy beginning in 2010. Alternative #3 follows a low
density pattern but proposes Private Conservation
via large- lot ownership and management of land ad-
jacent to and within important habitat areas as a
means of conserving biodiversity. Alternative #4, a
Multi- Centers strategy, focuses on cluster develop-
ment and new communities, and Alternative #5 con-
centrates most growth in one New City (Steinitz et al.
1996, 104).
The first alternative, Spread (Figure 6.10), and
the final alternative, New City (Figure 6.11), are in-
cluded here for comparison. The Camp Pendleton
team included detailed descriptions and discussions
of each in their report. They also analyzed the con-
sequences of each and the impact on soils, hydrol-
ogy, fire, landscape ecological patterns, single-
species habitat potential, species richness, and visual
quality (Steinitz et al. 1996). These consequences
were summarized in a matrix. The team noted that
all the alternatives will have serious negative conse-
quences for the environment. However, they found
that the “Private Conservation alternative, which
proposes to maintain the integrity of the region’s
larger natural areas and their connections along the
riparian network, is also the most protective of the
long- term regional biodiversity” (Steinitz et al.
1996, 129).
Unlike the Portland example, the Camp Pendle-
248CHAPTER 6
FIGURE 6.9 Camp Pendleton, landscape ecological pattern under build- out scenario. (Source: Steinitz et al. 1996)
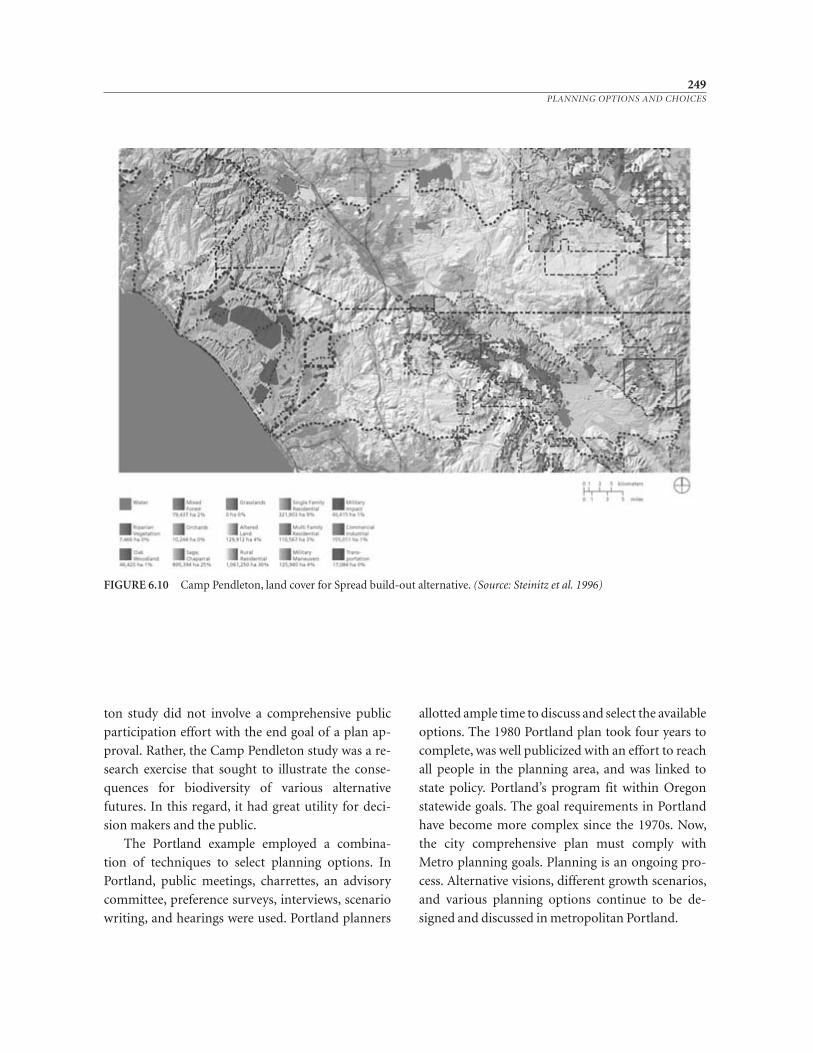
ton study did not involve a comprehensive public
participation effort with the end goal of a plan ap-
proval. Rather, the Camp Pendleton study was a re-
search exercise that sought to illustrate the conse-
quences for biodiversity of various alternative
futures. In this regard, it had great utility for deci-
sion makers and the public.
The Portland example employed a combina-
tion of techniques to select planning options. In
Portland, public meetings, charrettes, an advisory
committee, preference surveys, interviews, scenario
writing, and hearings were used. Portland planners
allotted ample time to discuss and select the available
options. The 1980 Portland plan took four years to
complete, was well publicized with an effort to reach
all people in the planning area, and was linked to
state policy. Portland’s program fit within Oregon
statewide goals. The goal requirements in Portland
have become more complex since the 1970s. Now,
the city comprehensive plan must comply with
Metro planning goals. Planning is an ongoing pro-
cess. Alternative visions, different growth scenarios,
and various planning options continue to be de-
signed and discussed in metropolitan Portland.
249PLANNING OPTIONS AND CHOICES
FIGURE 6.10 Camp Pendleton, land cover for Spread build-out alternative. (Source: Steinitz et al. 1996)
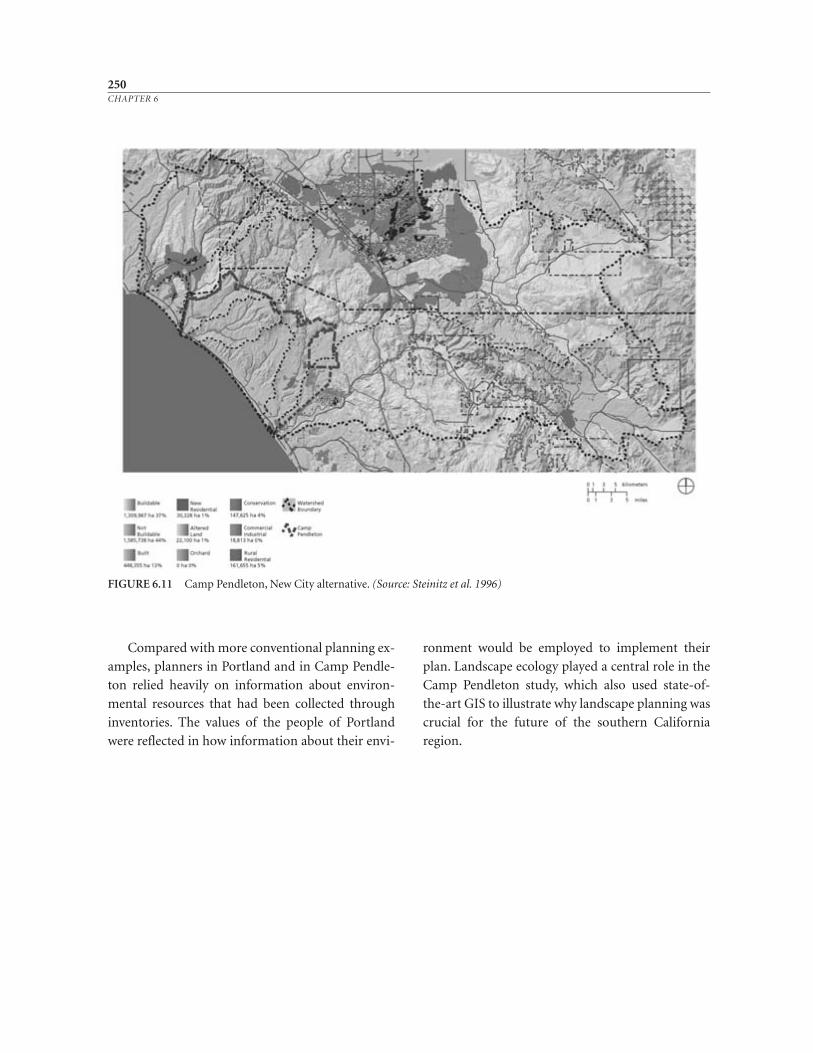
Compared with more conventional planning ex-
amples, planners in Portland and in Camp Pendle-
ton relied heavily on information about environ-
mental resources that had been collected through
inventories. The values of the people of Portland
were reflected in how information about their envi-
ronment would be employed to implement their
plan. Landscape ecology played a central role in the
Camp Pendleton study, which also used state- of-
the- art GIS to illustrate why landscape planning was
crucial for the future of the southern California
region.
250CHAPTER 6
FIGURE 6.11 Camp Pendleton, New City alternative. (Source: Steinitz et al. 1996)

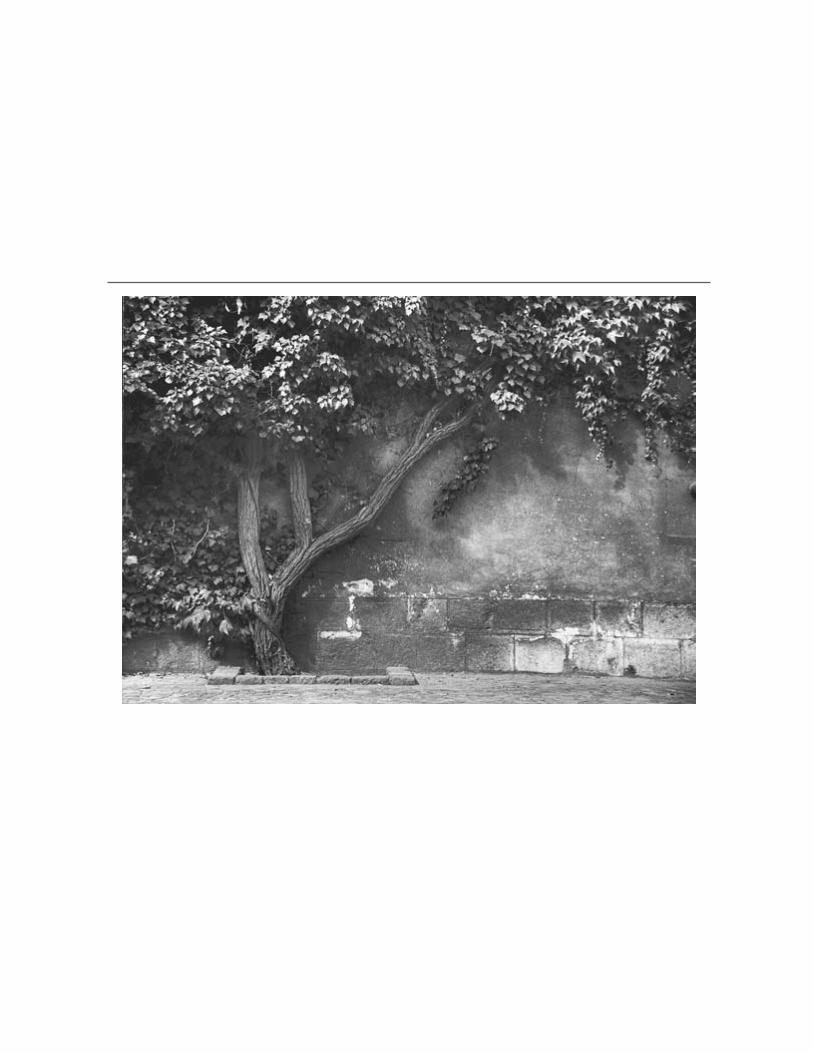
7LANDSCAPE PLANS
253
Plans can take many forms. Early American plans were quite specific about the lay-
out of cities and towns—the location of streets and the division of land—from
colonial times through the nineteenth century. These early plans were utilitarian
when used as part of a land speculation venture, or utopian when developed for set-
tlement by religious sects. City planning practitioners of the late nineteenth and
early twentieth centuries produced master plans that reflected the influence of
landscape architecture, architecture, and engineering. In master plans, uses were
prescribed for each place in the city or town. Comprehensive plans in cities and mul-
tiple- use plans in national forests, both advocated beginning in the early twentieth
century, attempt to address competing demands for land and other resources. Be-
ginning in the 1960s, policy plans became popular. Rather than specifying uses of
space, policies are established for the planning area that address the goals and as-
pirations of its inhabitants and/or users. During the 1970s, management plans be-
gan to appear. Management plans present guidelines for administrators to con-
sider when making decisions. Due to the influence of the business community,
contingency plans and strategic planning became more
popular in the 1980s and 1990s. Contingency plans ad-
dress the uncertainty of the future and pose “what if”
possibilities. A strategy is the means of deploying re-
sources to achieve goals and objectives.
Landscape plans combine elements of all these
other types of plans. Like master and comprehensive
plans, they consider the physical ordering of space, a
feature often not addressed in policy plans. Landscape
plans also reflect policy and management strategies and
should provide for contingencies. More than a land- use
plan, a landscape plan recognizes the overlap and inte-
gration of land uses. Landscape plans provide a flexible
framework for ordering the physical elements of a
place. Such a plan is one product of the planning pro-
cess. The plan provides both a documentation of the
process and an image for the future of the landscape.
Federal land management agencies and some state
governments have specific standards for plans, which
vary in what the plans are called and what they are to
contain, but include common elements. The National
Park Service calls the major planning document for all
parks a general management plan. Like other federal
land resource agencies—the U.S. Forest Service and
the Bureau of Land Management—the NPS combines
its plan with the environmental document, either an
environmental impact statement or an environmental
assessment, which is required by the NEPA (see Chap-
ter 11). Every NPS general management plan contains:
• Purpose and need for the plan: a discussion of
planning issues, park purpose, legislative man-
dates, and management objectives
• Management zoning: prescribed land classifica-
tions to designate where various strategies for
management and use will best fulfill manage-
ment objectives and achieve park purposes
• Proposal: interrelated proposals for preservation
of resources, land protection, interpretation, vis-
itor use, carrying capacities, park operations,
and a general indication of location, size, capac-
ity, and function of physical development
• Alternatives to the proposal: different manage-
ment approaches for dealing with issues, includ-
ing no action and minimum requirements
• Plan implementation schedule and cost estimates
• Description of the affected environment: back-
ground inventory information
• Environmental consequences: discussion of the
proposal and alternatives (adapted from de-
Franceaux 1987, 15–16)
According to Cynthia deFranceaux (1987), there are
several other elements that may be included in a NPS
general management plan. These other components in-
clude land suitability analyses, visitor carrying- capacity
analyses, a land protection component, discussion of
necessary legislative actions, a transportation- access-
circulation component, and wilderness studies. Al-
though historically most national park land has been
publicly owned, park planners have long had to consider
inholdings and adjacent lands. Increasingly, the NPS is
responsible for places that include large areas of privately
owned lands. As a result, it is important for park service
planners to understand traditional city and county plan-
ning. There is also much that city and county planners
can learn from the long- standing planning efforts of the
NPS and other federal land management agencies.
The contents of local government plans and the pro-
cedures for adopting them vary from state to state and in
some cases from community to community. In some
states, enabling legislation defines the minimal scope of
local plans and the adoption process. In others, explicit
contents for local plans and for implementation are
mandated in state law. Often local governments will en-
act local ordinances that expand on state requirements.
As with many other elements of planning, the state of
Oregon has been quite clear about what constitutes a
comprehensive plan.
A comprehensive plan is a set of public decisions
dealing with how the land, air, and water resources of
an area are to be used or not used. These decisions are
reached after considering the present and future of an
area.
254CHAPTER 7
Being comprehensive in scope, the plan provides
for all of the resources, uses, public facilities and ser-
vices in an area. It also incorporates the plans and
programs of various governmental units into a single
management tool for the planning area (Land Con-
servation and Development Commission 1980, 1)
The local comprehensive plan “guides a commu-
nity’s land use, conservation of natural resources, eco-
nomic development, and public services” (Depart-
ment of Land Conservation and Development 1996).
In Oregon, land-use plans are to include an “identifi-
cation of issues and problems, inventories and other
factual information for each . . . goal” (Land Conser-
vation and Development Commission 1980, 4; De-
partment of Land Conservation and Development
1996). The guidelines for the contents of the plan are
quite specific. First, they are to include the factual
bases for the plan: the natural re sources, their capabil-
ities and limitations; human- made structures and
utilities, their location and conditions; population
and economic characteristics; and the identified roles
and responsibilities. Second, the elements of the plan
are to be included: the applicable statewide goals, any
critical geographic area designated by the state legisla-
ture, elements that address any special needs and de-
sires of the people, and the temporal phasing of the
plan. These elements are to “fit together and relate to
one another to form a consistent whole at all times”
(Land Conservation and Development Commission
1980, 4; Department of Land Conservation and De-
velopment 1996).
In Oregon, plans are to be the basis for specific im-
plementation measures (Department of Land Conser-
vation and Development 1996). Once these findings
and elements are compiled in Oregon, the plan and its
implementing ordinances are to be adopted by the
county or city after a public hearing. Oregon law re-
quires that the plans be filed with the county recorder
and that they be approved by the state. The state recog-
nizes the impermanent nature of plans and requires
that they be revised periodically.
Whether the planners are addressing private or
public lands or both in a federal agency or for a local
government, a landscape plan should include at least
four key elements: (1) the formal recognition and
adoption of the previous steps in the planning process;
(2) a statement of policies; (3) the identification of
strategies to achieve those policies; and (4) some indi-
cation of the physical realization of those policies and
strategies. These components are illustrated here by
using parts of two general plan amendments for the
Desert View Tri- Villages Area and the Sonoran Pre-
serve Master Plan. At the end of the chapter, the plans
of the New Jersey Pinelands and Teller County, Col-
orado, are used as examples.
Recognition and Adoption of Plan
A key component of the plan is the formal recogni-
tion of the findings of the previous steps of the pro-
cess. The legislative body—the county commission
or the city council—adopts a statement summariz-
ing the issues facing the area. Policies are enacted that
include the goals to address the problems and oppor-
tunities that have been detailed through the process.
The biophysical and sociocultural elements are doc-
umented in the plan, as are the detailed studies.
Two general plan amendments have been
adopted by the City of Phoenix for the Desert View
Tri- Villages Area. As was noted earlier, city planners
have divided the Tri- Villages into three subareas.
The planning that has occurred in the area has been
strongly influenced by the four character types in-
troduced earlier; that is, desert preservation, rural
desert, suburban desert, and growth corridor/core de-
velopment (see Table 6.3). At the North Sonoran
charrette, principles were developed for each. Table
7.1 provides the principles for suburban desert
development.
The two general plan amendments recognized
and adopted these character types. The first
255LANDSCAPE PLANS
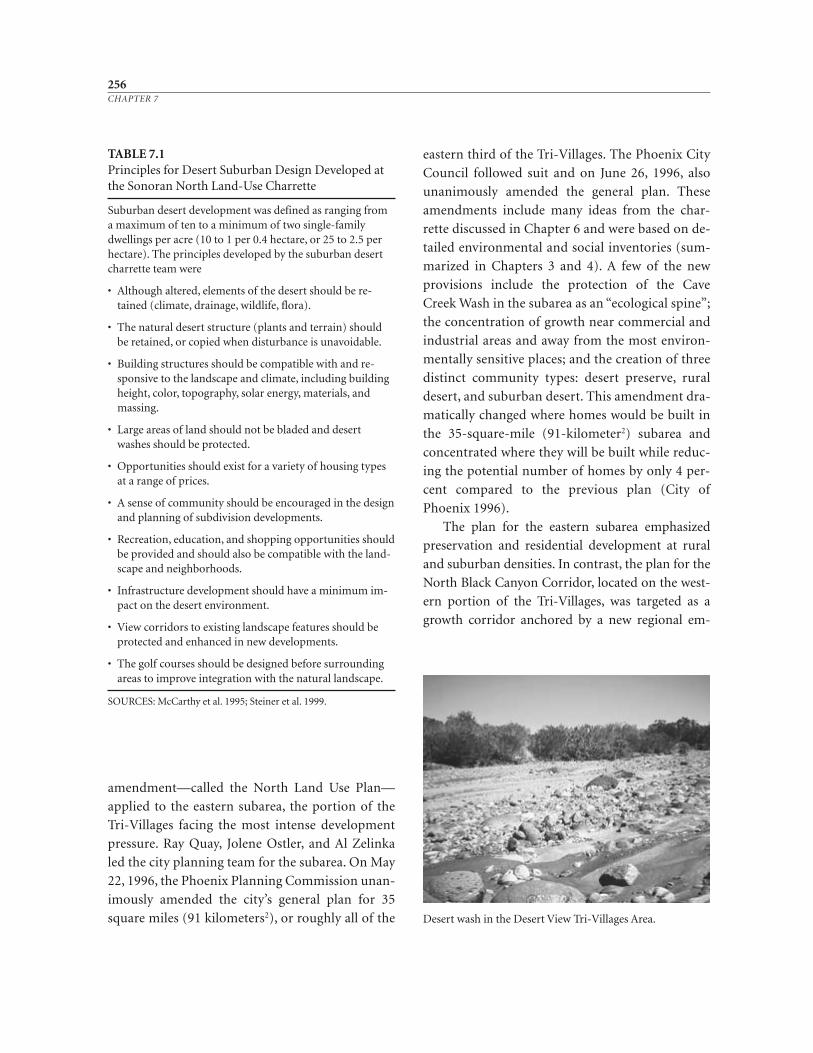
256CHAPTER 7
Desert wash in the Desert View Tri- Villages Area.
amendment—called the North Land Use Plan—
applied to the eastern subarea, the portion of the
Tri- Villages facing the most intense development
pressure. Ray Quay, Jolene Ostler, and Al Zelinka
led the city planning team for the subarea. On May
22, 1996, the Phoenix Planning Commission unan-
imously amended the city’s general plan for 35
square miles (91 kilometers2), or roughly all of the
eastern third of the Tri- Villages. The Phoenix City
Council followed suit and on June 26, 1996, also
unanimously amended the general plan. These
amendments include many ideas from the char-
rette discussed in Chapter 6 and were based on de-
tailed environmental and social inventories (sum-
marized in Chapters 3 and 4). A few of the new
provisions include the protection of the Cave
Creek Wash in the subarea as an “ecological spine”;
the concentration of growth near commercial and
industrial areas and away from the most environ-
mentally sensitive places; and the creation of three
distinct community types: desert preserve, rural
desert, and suburban desert. This amendment dra-
matically changed where homes would be built in
the 35- square- mile (91- kilometer2) subarea and
concentrated where they will be built while reduc-
ing the potential number of homes by only 4 per-
cent compared to the previous plan (City of
Phoenix 1996).
The plan for the eastern subarea emphasized
preservation and residential development at rural
and suburban densities. In contrast, the plan for the
North Black Canyon Corridor, located on the west-
ern portion of the Tri- Villages, was targeted as a
growth corridor anchored by a new regional em-
TABLE 7.1Principles for Desert Suburban Design Developed atthe Sonoran North Land-Use Charrette
Suburban desert development was defined as ranging froma maximum of ten to a minimum of two single- familydwellings per acre (10 to 1 per 0.4 hectare, or 25 to 2.5 perhectare). The principles developed by the suburban desertcharrette team were
• Although altered, elements of the desert should be re-tained (climate, drainage, wildlife, flora).
• The natural desert structure (plants and terrain) shouldbe retained, or copied when disturbance is unavoidable.
• Building structures should be compatible with and re-sponsive to the landscape and climate, including buildingheight, color, topography, solar energy, materials, andmassing.
• Large areas of land should not be bladed and desertwashes should be protected.
• Opportunities should exist for a variety of housing typesat a range of prices.
• A sense of community should be encouraged in the designand planning of subdivision developments.
• Recreation, education, and shopping opportunities shouldbe provided and should also be compatible with the land-scape and neighborhoods.
• Infrastructure development should have a minimum im-pact on the desert environment.
• View corridors to existing landscape features should beprotected and enhanced in new developments.
• The golf courses should be designed before surroundingareas to improve integration with the natural landscape.
SOURCES: McCarthy et al. 1995; Steiner et al. 1999.
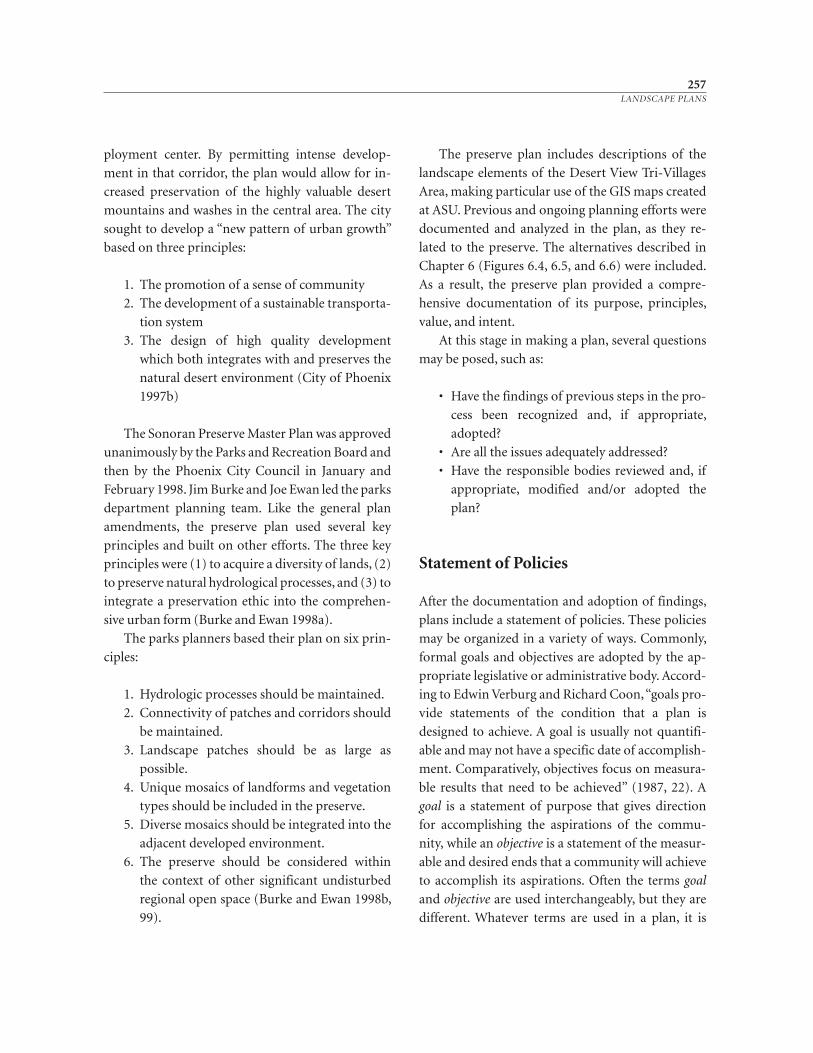
ployment center. By permitting intense develop-
ment in that corridor, the plan would allow for in-
creased preservation of the highly valuable desert
mountains and washes in the central area. The city
sought to develop a “new pattern of urban growth”
based on three principles:
1. The promotion of a sense of community
2. The development of a sustainable transporta-
tion system
3. The design of high quality development
which both integrates with and preserves the
natural desert environment (City of Phoenix
1997b)
The Sonoran Preserve Master Plan was approved
unanimously by the Parks and Recreation Board and
then by the Phoenix City Council in January and
February 1998. Jim Burke and Joe Ewan led the parks
department planning team. Like the general plan
amendments, the preserve plan used several key
principles and built on other efforts. The three key
principles were (1) to acquire a diversity of lands, (2)
to preserve natural hydrological processes, and (3) to
integrate a preservation ethic into the comprehen-
sive urban form (Burke and Ewan 1998a).
The parks planners based their plan on six prin-
ciples:
1. Hydrologic processes should be maintained.
2. Connectivity of patches and corridors should
be maintained.
3. Landscape patches should be as large as
possible.
4. Unique mosaics of landforms and vegetation
types should be included in the preserve.
5. Diverse mosaics should be integrated into the
adjacent developed environment.
6. The preserve should be considered within
the context of other significant undisturbed
regional open space (Burke and Ewan 1998b,
99).
The preserve plan includes descriptions of the
landscape elements of the Desert View Tri- Villages
Area, making particular use of the GIS maps created
at ASU. Previous and ongoing planning efforts were
documented and analyzed in the plan, as they re-
lated to the preserve. The alternatives described in
Chapter 6 (Figures 6.4, 6.5, and 6.6) were included.
As a result, the preserve plan provided a compre-
hensive documentation of its purpose, principles,
value, and intent.
At this stage in making a plan, several questions
may be posed, such as:
• Have the findings of previous steps in the pro-
cess been recognized and, if appropriate,
adopted?
• Are all the issues adequately addressed?
• Have the responsible bodies reviewed and, if
appropriate, modified and/or adopted the
plan?
Statement of Policies
After the documentation and adoption of findings,
plans include a statement of policies. These policies
may be organized in a variety of ways. Commonly,
formal goals and objectives are adopted by the ap-
propriate legislative or administrative body. Accord-
ing to Edwin Verburg and Richard Coon, “goals pro-
vide statements of the condition that a plan is
designed to achieve. A goal is usually not quantifi-
able and may not have a specific date of accomplish-
ment. Comparatively, objectives focus on measura-
ble results that need to be achieved” (1987, 22). A
goal is a statement of purpose that gives direction
for accomplishing the aspirations of the commu-
nity, while an objective is a statement of the measur-
able and desired ends that a community will achieve
to accomplish its aspirations. Often the terms goal
and objective are used interchangeably, but they are
different. Whatever terms are used in a plan, it is
257LANDSCAPE PLANS
important to link broad policies with specific strate-
gies to achieve the goals.
The Phoenix city planning staff developed six
concepts for the eastern subarea of the Desert View
Tri- Villages. Their intent was “to refine the existing
policies” that guide development for the area. The
first concept was to plan for strategic land uses; that
is, to identify economic development opportunities
that only come with a major travel corridor and
desert preservation opportunities that only nature
can provide. The second concept again emphasized
the need to preserve Cave Creek Wash as an ecologi-
cal spine in the desert (also addressed in greater de-
tail in the separate parks plan). Third, the plan rec-
ognized washes as a development constraint
because of their flooding and the preference to allow
natural drainage over extensive engineering. The
fourth concept addressed the cost effectiveness as
well as the ineffectiveness of providing public infra-
structure. The fifth concept was to maintain estab-
lished character in the area, which was the existing
community residents’ desire. The final concept rec-
ognized property rights already established in the
area (City of Phoenix 1996).
The North Black Canyon Corridor Plan estab-
lished four goals and nine associated policy action
steps, which are:
Goal 1.0 Promote the North Black Canyon Cor-
ridor as a regional employment center but
not at the expense of growth within the exist-
ing city.
Policy action steps:
1.1 Design employment centers to meet
market niches not provided for in adja-
cent village employment centers or cen-
tral city employment areas.
1.2 Design employment areas that recognize
the long-term development cycle of em-
ployment and retail in the corridor.
Goal 2.0 Achieve a balance between employ-
ment and housing.
Policy action steps:
2.1 Regulate a jobs- to- housing ratio.
2.2 Plan for housing quality ranges to match
employment income ranges.
Goal 3.0 Concentrate growth within a defined
corridor.
Policy action steps:
3.1 Establish a regulatory infrastructure
growth line for initial development with
general boundaries of I- 17, Cloud Road,
19th Avenue, and Jomax Road.
3.2 Plan an efficient auto and transit circula-
tion system.
3.3 Restructure and expand the city’s infra-
structure fee program for the corridor
that recognizes the long-term phasing of
development within a corridor.
Goal 4.0 Preserve North Sonoran desert ameni-
ties and use these features to define commu-
nity form and identity.
Policy action steps:
4.1 Create a North Sonoran Desert Preserve.
4.2 Provide urban desert public places that
are defined by a combination of natural
features and human- made features such
as streets and buildings (City of Phoenix
1997b).
The preserve plan established the goal of acquir-
ing 20,000 acres [8094 hectares] within the Tri-
Villages Area. This amount of land would make it
the largest park in the city of Phoenix.
At this point in plan- making, it is important to
ensure that clear goals and objectives are estab-
lished. A common problem occurs with goals and
objectives prepared by a team or a group of citizens.
In order to ensure equal participation, words and
phrases of all involved may be included. This may be
democratic, but the result can be unintelligible.
Since such goals and objectives will have significant
influence, it is often helpful to let a few days pass
after they are written before they are formally
258CHAPTER 7
adopted. In the interim, the wording can be refined.
Care should be given not to lose the intent of the
goals and objectives, but to make them more under-
standable to the broadest possible public.
Strategies to Achieve Policies
Strategies outline the approach and/or methods
through which problems are solved or minimized
and objectives are achieved (Verburg and Coon
1987). A strategy is the broadly stated means of de-
ploying resources to achieve the community’s goals
and objectives. The plan should specify what actions
are necessary to achieve its objectives. For each plan-
ning element, there should be clear definitions of
terms so that there is no confusion, for example, be-
tween light or heavy industrial use or low- density or
high- density residential use. Each strategy should
contain specific actions, for instance, “the county
or city shall adopt land- use ordinances to imple-
ment its policies.” There should also be target dates
associated with specific ac tions; for instance, “soil
erosion shall be reduced to tolerable levels by the
year 2010.” Thus, strategies should be linked to out-
come measures that are specific means of deter-
mining whether goals and objectives are being
accomplished.
Strategies involve priorities, schedules, targets,
and budgets. Priorities establish the criteria to deter-
mine the order of tasks necessary to achieve commu-
nity goals. Schedules chart tasks and products. Targets
involve work plans and responsibilities. The budget
identifies the needs for staffing, equipment, consult-
ants, and potential sources of revenue (Arizona De-
partment of Commerce 1998).
The eastern subarea plan for the Desert View
Tri- Villages identifies three strategies for implemen-
tation. First, the revised general plan for the area will
guide the rezoning process. Second, desert preserva-
tion areas will be acquired through either purchas-
ing or leasing the land. (The parks plan addresses
this strategy in great detail, which is discussed later.)
Third, overlay districts for the three character areas
will provide performance development standards
(City of Phoenix 1996). The plan for North Black
Canyon Corridor also contains four strategies:
adoption of a concept plan that includes basic
growth management policies; the revision of the
general plan map; the adoption of specific develop-
ment regulations; and the production of informa-
tion providing principles and guidelines for new de-
velopment (City of Phoenix 1997b).
The key strategies for the preserve are detailed in
its acquisition plan. This plan presents “the various
methods of acquiring or protecting land for the
Sonoran Preserve, potential funding sources, esti-
mated amounts of funding available, timing of
funding sources and scenarios that explore the im-
plications of different acquisition strategies” (Burke
and Ewan 1998a, 34). The strategies seek to achieve
the goal of acquiring 20,000 acres (8094 hectares).
The methods and techniques for acquisition and
protection available to the City of Phoenix include
• Methods of city acquisition of land
Fee simple purchase
Purchase of development rights
Purchase of rights- of- way/easements
Leases
Condemnation/eminent domain
Donations and gifts
• Governmental regulation protection tech-
niques
Planned community district
Planned residential district
Hillside ordinance
Special overlay district
Design guidelines
Performance zoning
Dedications/exactions
Transfer of development rights
Potential funding sources available include:
259LANDSCAPE PLANS
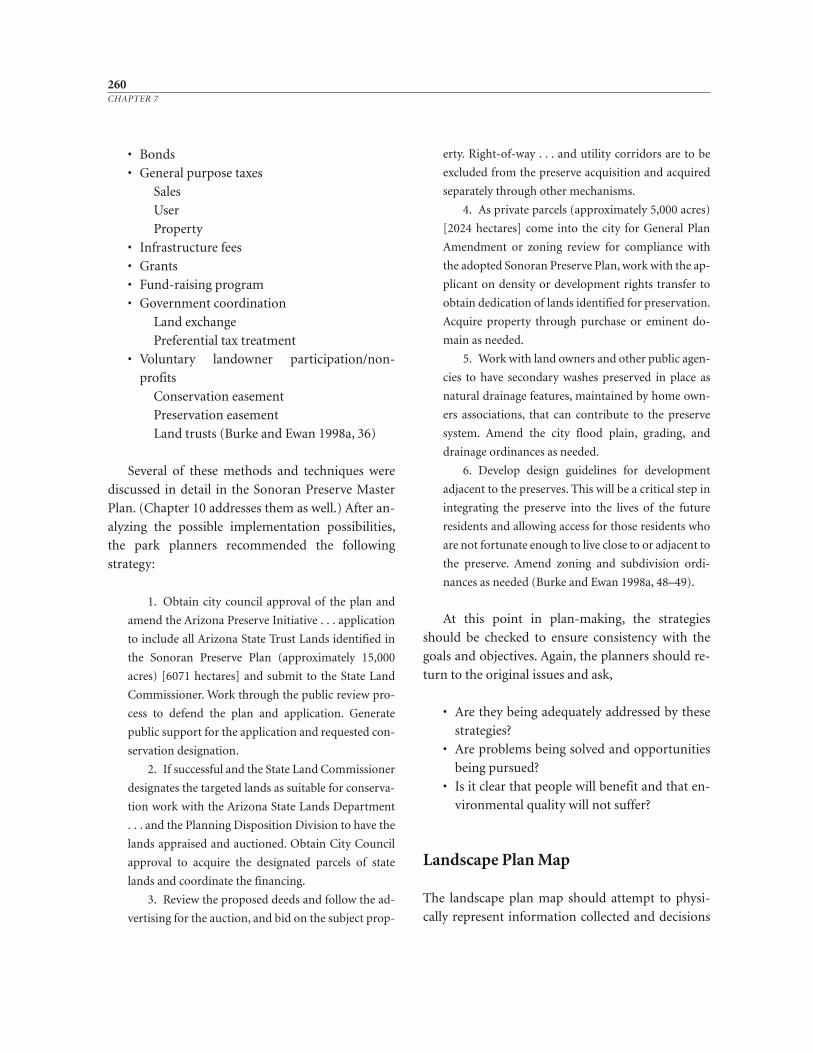
• Bonds
• General purpose taxes
Sales
User
Property
• Infrastructure fees
• Grants
• Fund- raising program
• Government coordination
Land exchange
Preferential tax treatment
• Voluntary landowner participation/non-
profits
Conservation easement
Preservation easement
Land trusts (Burke and Ewan 1998a, 36)
Several of these methods and techniques were
discussed in detail in the Sonoran Preserve Master
Plan. (Chapter 10 addresses them as well.) After an-
alyzing the possible implementation possibilities,
the park planners recommended the following
strategy:
1. Obtain city council approval of the plan and
amend the Arizona Preserve Initiative . . . application
to include all Arizona State Trust Lands identified in
the Sonoran Preserve Plan (approximately 15,000
acres) [6071 hectares] and submit to the State Land
Commissioner. Work through the public review pro-
cess to defend the plan and application. Generate
public support for the application and requested con-
servation designation.
2. If successful and the State Land Commissioner
designates the targeted lands as suitable for conserva-
tion work with the Arizona State Lands Department
. . . and the Planning Disposition Division to have the
lands appraised and auctioned. Obtain City Council
approval to acquire the designated parcels of state
lands and coordinate the financing.
3. Review the proposed deeds and follow the ad-
vertising for the auction, and bid on the subject prop-
erty. Right- of- way . . . and utility corridors are to be
excluded from the preserve acquisition and acquired
separately through other mechanisms.
4. As private parcels (approximately 5,000 acres)
[2024 hectares] come into the city for General Plan
Amendment or zoning review for compliance with
the adopted Sonoran Preserve Plan, work with the ap-
plicant on density or development rights transfer to
obtain dedication of lands identified for preservation.
Acquire property through purchase or eminent do-
main as needed.
5. Work with land owners and other public agen-
cies to have secondary washes preserved in place as
natural drainage features, maintained by home own-
ers associations, that can contribute to the preserve
system. Amend the city flood plain, grading, and
drainage ordinances as needed.
6. Develop design guidelines for development
adjacent to the preserves. This will be a critical step in
integrating the preserve into the lives of the future
residents and allowing access for those residents who
are not fortunate enough to live close to or adjacent to
the preserve. Amend zoning and sub division ordi-
nances as needed (Burke and Ewan 1998a, 48–49).
At this point in plan- making, the strategies
should be checked to ensure consistency with the
goals and objectives. Again, the planners should re-
turn to the original issues and ask,
• Are they being adequately addressed by these
strategies?
• Are problems being solved and opportunities
being pursued?
• Is it clear that people will benefit and that en-
vironmental quality will not suffer?
Landscape Plan Map
The landscape plan map should attempt to physi-
cally represent information collected and decisions
260CHAPTER 7
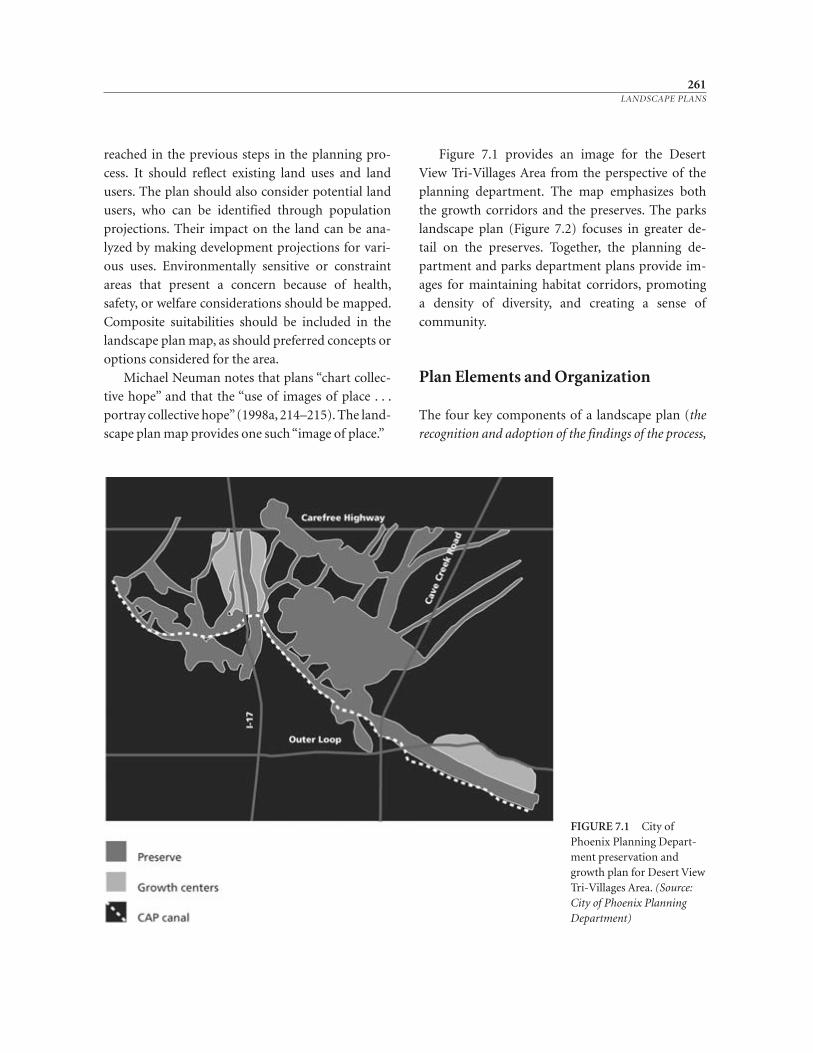
reached in the previous steps in the planning pro-
cess. It should reflect existing land uses and land
users. The plan should also consider potential land
users, who can be identified through population
projections. Their impact on the land can be ana-
lyzed by making development projections for vari-
ous uses. Environmentally sensitive or constraint
areas that present a concern because of health,
safety, or welfare considerations should be mapped.
Composite suitabilities should be included in the
landscape plan map, as should preferred concepts or
options considered for the area.
Michael Neuman notes that plans “chart col lec-
tive hope” and that the “use of images of place . . .
portray collective hope” (1998a, 214–215). The land-
scape plan map provides one such “image of place.”
Figure 7.1 provides an image for the Desert
View Tri- Villages Area from the perspective of the
planning department. The map emphasizes both
the growth corridors and the preserves. The parks
landscape plan (Figure 7.2) focuses in greater de-
tail on the preserves. Together, the planning de-
partment and parks department plans provide im-
ages for maintaining habitat corridors, promoting
a density of diversity, and creating a sense of
community.
Plan Elements and Organization
The four key components of a landscape plan (the
recognition and adoption of the findings of the process,
261LANDSCAPE PLANS
FIGURE 7.1 City ofPhoenix Planning Depart-ment preservation andgrowth plan for Desert ViewTri- Villages Area. (Source:City of Phoenix PlanningDepartment)
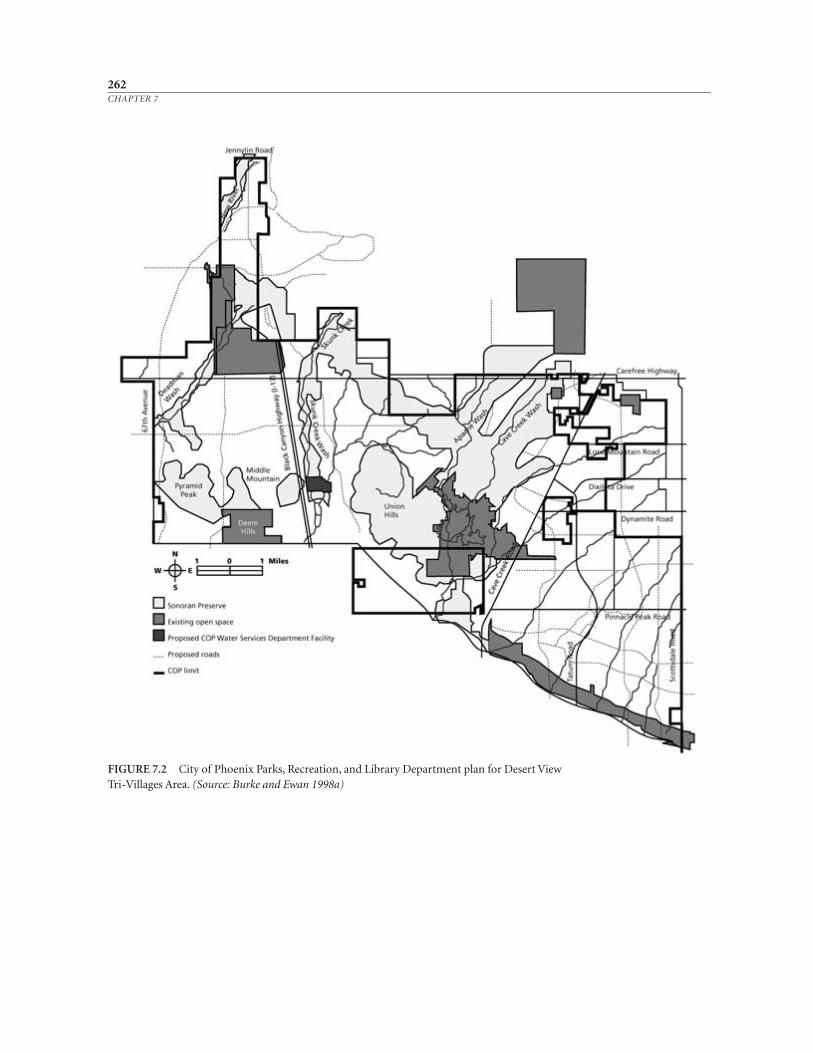
262CHAPTER 7
FIGURE 7.2 City of Phoenix Parks, Recreation, and Library Department plan for Desert View Tri- Villages Area. (Source: Burke and Ewan 1998a)
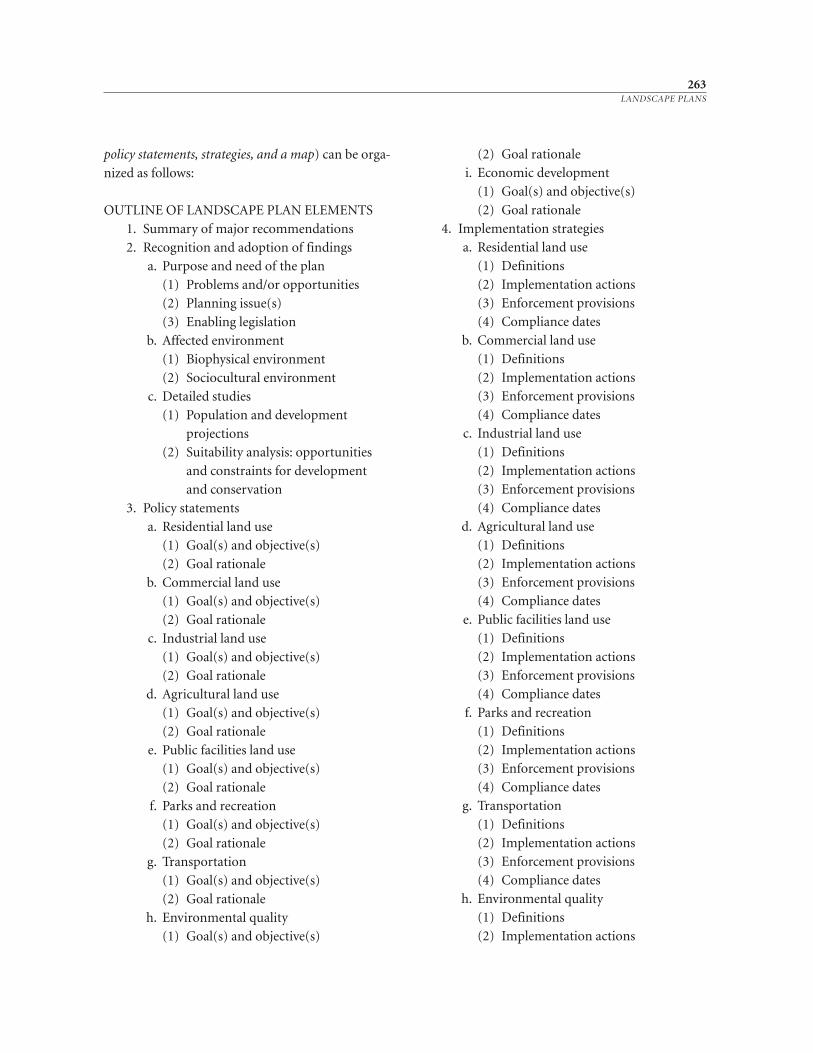
policy statements, strategies, and a map) can be orga-
nized as follows:
OUTLINE OF LANDSCAPE PLAN ELEMENTS
1. Summary of major recommendations
2. Recognition and adoption of findings
a. Purpose and need of the plan
(1) Problems and/or opportunities
(2) Planning issue(s)
(3) Enabling legislation
b. Affected environment
(1) Biophysical environment
(2) Sociocultural environment
c. Detailed studies
(1) Population and development
projections
(2) Suitability analysis: opportunities
and constraints for development
and conservation
3. Policy statements
a. Residential land use
(1) Goal(s) and objective(s)
(2) Goal rationale
b. Commercial land use
(1) Goal(s) and objective(s)
(2) Goal rationale
c. Industrial land use
(1) Goal(s) and objective(s)
(2) Goal rationale
d. Agricultural land use
(1) Goal(s) and objective(s)
(2) Goal rationale
e. Public facilities land use
(1) Goal(s) and objective(s)
(2) Goal rationale
f. Parks and recreation
(1) Goal(s) and objective(s)
(2) Goal rationale
g. Transportation
(1) Goal(s) and objective(s)
(2) Goal rationale
h. Environmental quality
(1) Goal(s) and objective(s)
(2) Goal rationale
i. Economic development
(1) Goal(s) and objective(s)
(2) Goal rationale
4. Implementation strategies
a. Residential land use
(1) Definitions
(2) Implementation actions
(3) Enforcement provisions
(4) Compliance dates
b. Commercial land use
(1) Definitions
(2) Implementation actions
(3) Enforcement provisions
(4) Compliance dates
c. Industrial land use
(1) Definitions
(2) Implementation actions
(3) Enforcement provisions
(4) Compliance dates
d. Agricultural land use
(1) Definitions
(2) Implementation actions
(3) Enforcement provisions
(4) Compliance dates
e. Public facilities land use
(1) Definitions
(2) Implementation actions
(3) Enforcement provisions
(4) Compliance dates
f. Parks and recreation
(1) Definitions
(2) Implementation actions
(3) Enforcement provisions
(4) Compliance dates
g. Transportation
(1) Definitions
(2) Implementation actions
(3) Enforcement provisions
(4) Compliance dates
h. Environmental quality
(1) Definitions
(2) Implementation actions
263LANDSCAPE PLANS
(3) Enforcement provisions
(4) Compliance dates
i. Economic development
(1) Definitions
(2) Implementation actions
(3) Enforcement provisions
(4) Compliance dates
5. Landscape plan map
List of responsible individuals and parties
Bibliography
Glossary
Plans take time to prepare. Usually, they are col-
laborative undertakings involving many individuals
and several agencies. The authors and participants
in the process should be acknowledged. For a city-
or county- level plan, the normal participants in-
clude the planning staff, the planning commission,
and the city council or the county board of supervi-
sors. Additional city or county departments and
commissions, as well as consultants and citizens’
groups, may also be involved.
Two Examples of Plans
Michael Neuman (1998a, 1998b) asserts that plans
provide valuable instruments for governance. They
link aspirations to actions through prose and im-
agery. “Plans can be used,” according to Neuman
(1998a, 215), “to set agendas and resolve conflicts,
because they are ideal ‘single texts’ that the partici-
pants in plan- making rely on to make decisions.” The
comprehensive plan for the New Jersey Pinelands
and the growth management plan for Teller County
and Woodland Park, Colorado, offer examples of
collective hopes of their citizens embodied in plans.
Comprehensive Management Plan for the
New Jersey Pinelands
The comprehensive management plan for the New
Jersey Pinelands has been used in earlier chapters as
an example of establishing planning goals (Chapter
2) and inventory and analysis (Chapters 3 and 4).
The process undertaken by state, federal, and local
officials resulted in an exemplary plan. (For the
most up- to- date infor mation about the plan, see the
New Jersey Pine lands Commission’s website:
www.state.nj.us/pinelands.) The plan is divided into
two parts. The first part documents the natural and
human history of the Pine Barrens, describes re-
gional growth factors, identifies ecologically critical
areas, establishes goals and policies, lays out the
structure for intergovernmental coordination, and
establishes the financial and public participation
programs. The second part contains the legal, sub-
stantive land- use programs and development stan-
dards that implement the plan. This part sets forth
the procedures under which the Pine lands Commis-
sion certifies that county and local master plans and
implementing ordinances are consistent with the
plan (Pinelands Commission 1980). As in Oregon,
all county and local plans in the Pinelands region
must be consistent with the goals for the larger area.
Resource goals and policies comprise the heart
of the Pinelands plan. The goals in Table 2.1 were es-
tablished by the Pinelands Commission, based on its
analysis and on provisions of state and federal legis-
lation. These goals and policies also reflect the land
capability of the area. The land capability map iden-
tifies those areas that are most suited for preserva-
tion, forestry, agriculture, rural development, and
growth, as well as existing towns and villages and
military and federal installations. From the capabili-
ties for these uses, eight allocation areas are defined
in the plan as follows:
The Preservation Area District represents that area
found by the New Jersey Legislature to be “especially
vulnerable to the environmental degradation of sur-
face and ground waters which would be [negatively
impacted] by the improper development or use
thereof”; and “which constitutes an extensive and
contiguous area of land in its natural state.”
264CHAPTER 7
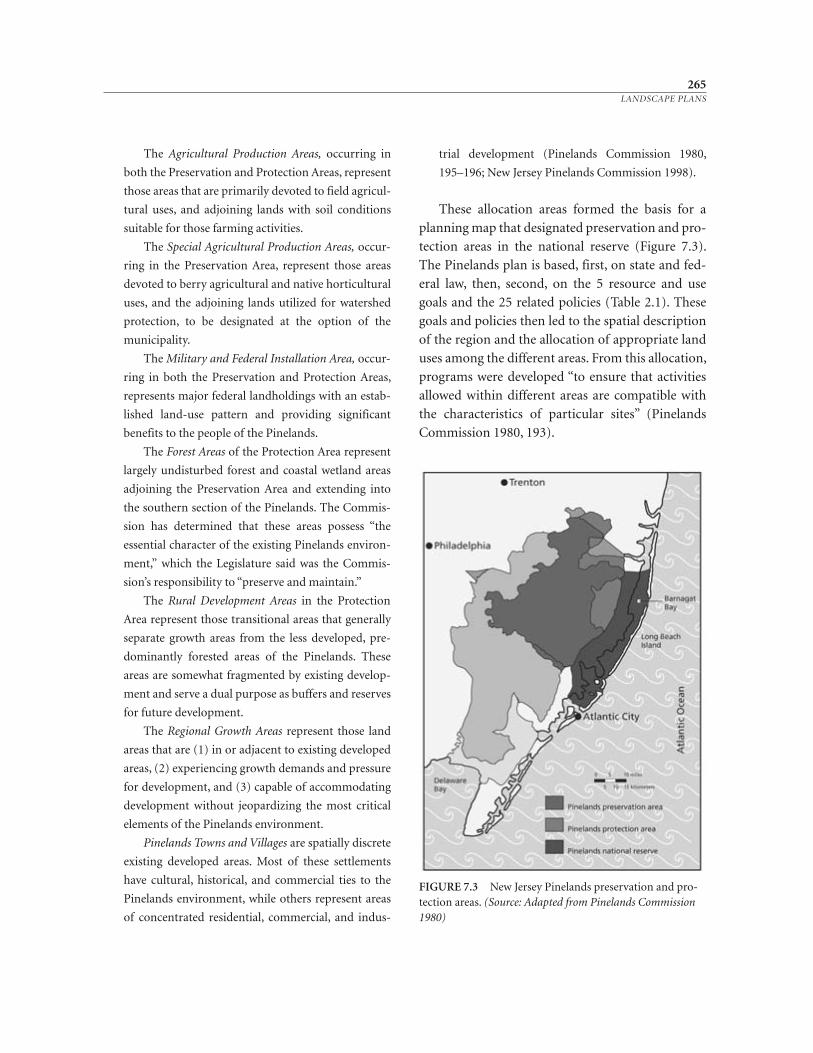
The Agricultural Production Areas, occurring in
both the Preservation and Protection Areas, represent
those areas that are primarily devoted to field agricul-
tural uses, and adjoining lands with soil conditions
suitable for those farming activities.
The Special Agricultural Production Areas, occur-
ring in the Preservation Area, represent those areas
devoted to berry agricultural and native horticultural
uses, and the adjoining lands utilized for watershed
protection, to be designated at the option of the
municipality.
The Military and Federal Installation Area, occur-
ring in both the Preservation and Protection Areas,
represents major federal landholdings with an estab-
lished land- use pattern and providing significant
benefits to the people of the Pinelands.
The Forest Areas of the Protection Area represent
largely undisturbed forest and coastal wetland areas
adjoining the Preservation Area and extending into
the southern section of the Pinelands. The Commis-
sion has determined that these areas possess “the
essential character of the existing Pinelands environ-
ment,” which the Legislature said was the Commis-
sion’s responsibility to “preserve and maintain.”
The Rural Development Areas in the Protection
Area represent those transitional areas that generally
separate growth areas from the less developed, pre-
dominantly forested areas of the Pinelands. These
areas are somewhat fragmented by existing develop-
ment and serve a dual purpose as buffers and reserves
for future development.
The Regional Growth Areas represent those land
areas that are (1) in or adjacent to existing developed
areas, (2) experiencing growth demands and pressure
for development, and (3) capable of accommodating
development without jeopardizing the most critical
elements of the Pinelands environment.
Pinelands Towns and Villages are spatially discrete
existing developed areas. Most of these settlements
have cultural, historical, and commercial ties to the
Pinelands environment, while others represent areas
of concentrated residential, commercial, and indus-
trial development (Pinelands Commission 1980,
195–196; New Jersey Pinelands Commission 1998).
These allocation areas formed the basis for a
planning map that designated preservation and pro-
tection areas in the national reserve (Figure 7.3).
The Pinelands plan is based, first, on state and fed-
eral law, then, second, on the 5 resource and use
goals and the 25 related policies (Table 2.1). These
goals and policies then led to the spatial description
of the region and the allocation of appropriate land
uses among the different areas. From this allocation,
programs were developed “to ensure that activities
allowed within different areas are compatible with
the characteristics of particular sites” (Pinelands
Commission 1980, 193).
265LANDSCAPE PLANS
FIGURE 7.3 New Jersey Pinelands preservation and pro-tection areas. (Source: Adapted from Pinelands Commission1980)
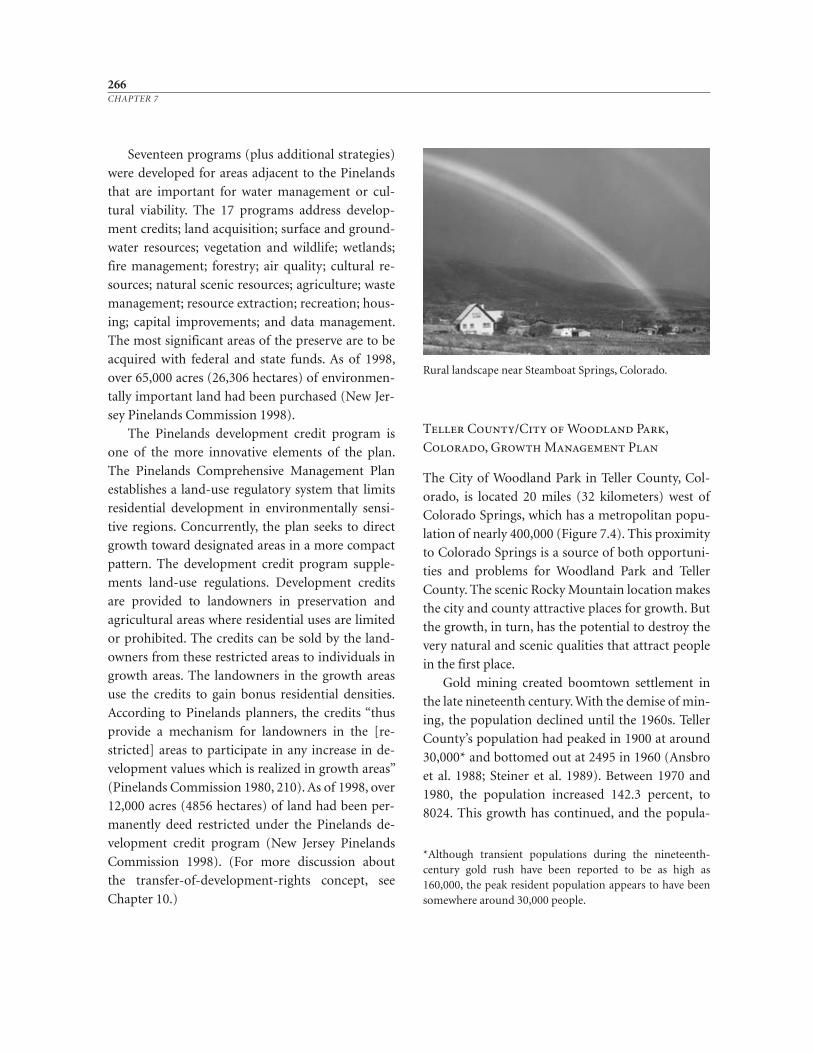
Seventeen programs (plus additional strategies)
were developed for areas adjacent to the Pine lands
that are important for water management or cul-
tural viability. The 17 programs address develop-
ment credits; land acquisition; surface and ground-
water resources; vegetation and wildlife; wetlands;
fire management; forestry; air quality; cultural re-
sources; natural scenic resources; agriculture; waste
management; resource extraction; recreation; hous-
ing; capital improvements; and data management.
The most significant areas of the preserve are to be
acquired with federal and state funds. As of 1998,
over 65,000 acres (26,306 hectares) of environmen-
tally important land had been purchased (New Jer-
sey Pinelands Commission 1998).
The Pinelands development credit program is
one of the more innovative elements of the plan.
The Pinelands Comprehensive Management Plan
establishes a land- use regulatory system that limits
residential development in environmentally sensi-
tive regions. Concurrently, the plan seeks to direct
growth toward designated areas in a more compact
pattern. The development credit program supple-
ments land- use regulations. Development credits
are provided to landowners in preservation and
agricultural areas where residential uses are limited
or prohibited. The credits can be sold by the land-
owners from these restricted areas to individuals in
growth areas. The landowners in the growth areas
use the credits to gain bonus residential densities.
According to Pinelands planners, the credits “thus
provide a mechanism for landowners in the [re-
stricted] areas to participate in any increase in de-
velopment values which is realized in growth areas”
(Pinelands Commission 1980, 210). As of 1998, over
12,000 acres (4856 hectares) of land had been per-
manently deed restricted under the Pinelands de-
velopment credit program (New Jersey Pinelands
Commission 1998). (For more discussion about
the transfer- of- development- rights concept, see
Chapter 10.)
Teller County/City of Woodland Park,
Colorado, Growth Management Plan
The City of Woodland Park in Teller County, Col-
orado, is located 20 miles (32 kilometers) west of
Colorado Springs, which has a metropolitan popu-
lation of nearly 400,000 (Figure 7.4). This proximity
to Colorado Springs is a source of both opportuni-
ties and problems for Woodland Park and Teller
County. The scenic Rocky Mountain location makes
the city and county attractive places for growth. But
the growth, in turn, has the potential to destroy the
very natural and scenic qualities that attract people
in the first place.
Gold mining created boomtown settlement in
the late nineteenth century. With the demise of min-
ing, the population declined until the 1960s. Teller
County’s population had peaked in 1900 at around
30,000* and bottomed out at 2495 in 1960 (Ansbro
et al. 1988; Steiner et al. 1989). Between 1970 and
1980, the population increased 142.3 percent, to
8024. This growth has continued, and the popula-
266CHAPTER 7
Rural landscape near Steamboat Springs, Colorado.
*Although transient populations during the nineteenth- century gold rush have been reported to be as high as160,000, the peak resident population appears to have beensomewhere around 30,000 people.
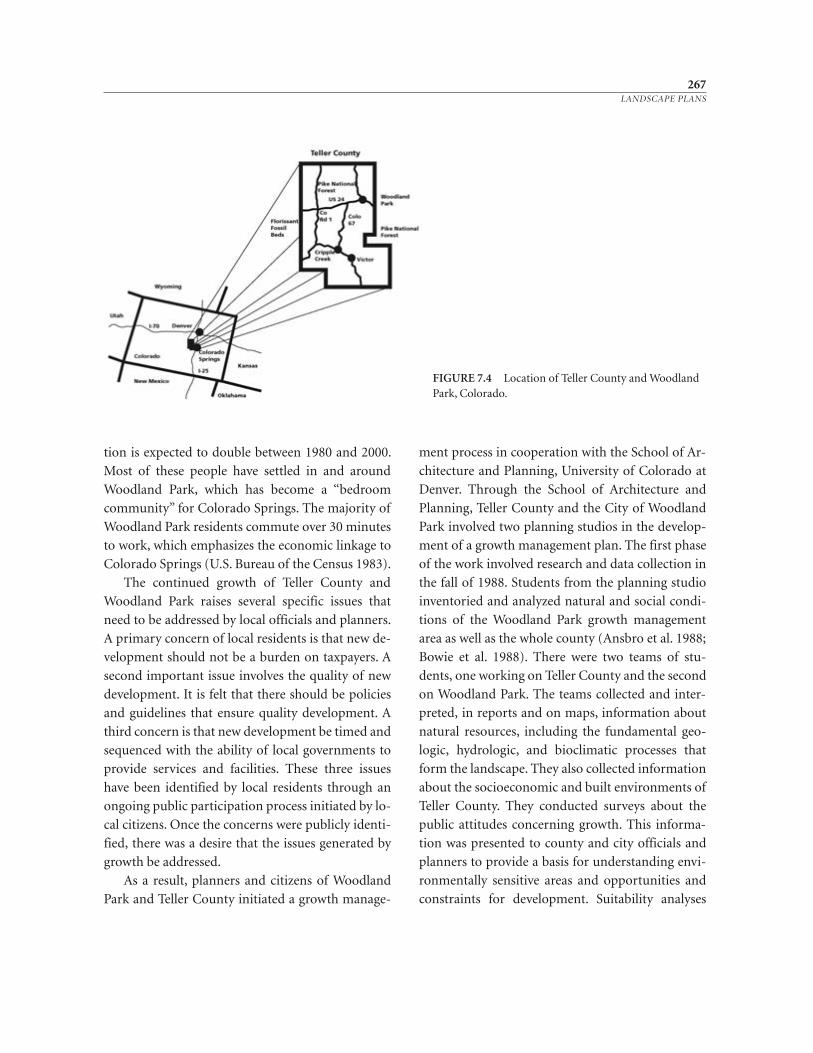
tion is expected to double between 1980 and 2000.
Most of these people have settled in and around
Woodland Park, which has become a “bedroom
community” for Colorado Springs. The majority of
Woodland Park residents commute over 30 minutes
to work, which emphasizes the economic linkage to
Colorado Springs (U.S. Bureau of the Census 1983).
The continued growth of Teller County and
Woodland Park raises several specific issues that
need to be addressed by local officials and planners.
A primary concern of local residents is that new de-
velopment should not be a burden on taxpayers. A
second important issue involves the quality of new
development. It is felt that there should be policies
and guidelines that ensure quality development. A
third concern is that new development be timed and
sequenced with the ability of local governments to
provide services and facilities. These three issues
have been identified by local residents through an
ongoing public participation process initiated by lo-
cal citizens. Once the concerns were publicly identi-
fied, there was a desire that the issues generated by
growth be addressed.
As a result, planners and citizens of Woodland
Park and Teller County initiated a growth manage-
ment process in cooperation with the School of Ar-
chitecture and Planning, University of Colorado at
Denver. Through the School of Architecture and
Planning, Teller County and the City of Woodland
Park involved two planning studios in the develop-
ment of a growth management plan. The first phase
of the work involved research and data collection in
the fall of 1988. Students from the planning studio
inventoried and analyzed natural and social condi-
tions of the Woodland Park growth management
area as well as the whole county (Ansbro et al. 1988;
Bowie et al. 1988). There were two teams of stu-
dents, one working on Teller County and the second
on Woodland Park. The teams collected and inter-
preted, in reports and on maps, information about
natural resources, including the fundamental geo-
logic, hydrologic, and bioclimatic processes that
form the landscape. They also collected information
about the socioeconomic and built environments of
Teller County. They conducted surveys about the
public attitudes concerning growth. This informa-
tion was presented to county and city officials and
planners to provide a basis for understanding envi-
ronmentally sensitive areas and opportunities and
constraints for development. Suitability analyses
267LANDSCAPE PLANS
FIGURE 7.4 Location of Teller County and WoodlandPark, Colorado.
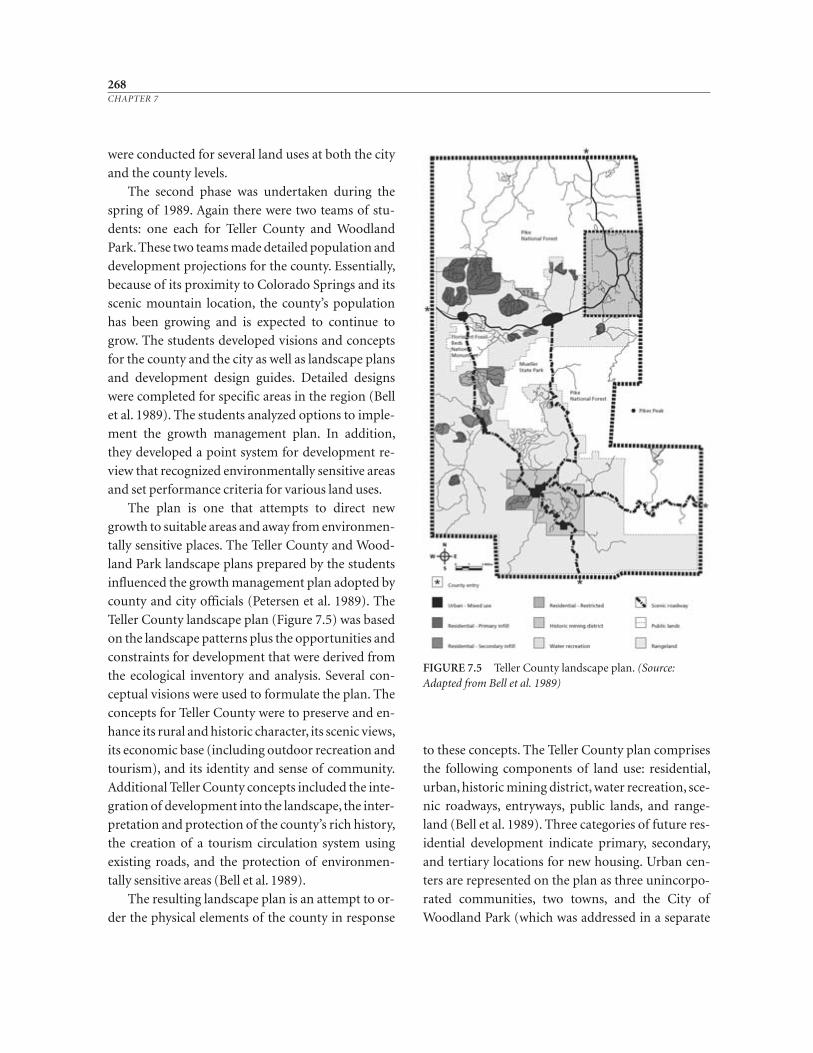
were conducted for several land uses at both the city
and the county levels.
The second phase was undertaken during the
spring of 1989. Again there were two teams of stu-
dents: one each for Teller County and Woodland
Park. These two teams made detailed population and
development projections for the county. Essentially,
because of its proximity to Colorado Springs and its
scenic mountain location, the county’s population
has been growing and is expected to continue to
grow. The students developed visions and concepts
for the county and the city as well as landscape plans
and development design guides. Detailed designs
were completed for specific areas in the region (Bell
et al. 1989). The students analyzed options to imple-
ment the growth management plan. In addition,
they developed a point system for development re-
view that recognized environmentally sensitive areas
and set performance criteria for various land uses.
The plan is one that attempts to direct new
growth to suitable areas and away from environmen-
tally sensitive places. The Teller County and Wood-
land Park landscape plans prepared by the students
influenced the growth management plan adopted by
county and city officials (Petersen et al. 1989). The
Teller County landscape plan (Figure 7.5) was based
on the landscape patterns plus the opportunities and
constraints for development that were derived from
the ecological inventory and analysis. Several con-
ceptual visions were used to formulate the plan. The
concepts for Teller County were to preserve and en-
hance its rural and historic character, its scenic views,
its economic base (including outdoor recreation and
tourism), and its identity and sense of community.
Additional Teller County concepts included the inte-
gration of development into the landscape, the inter-
pretation and protection of the county’s rich history,
the creation of a tourism circulation system using
existing roads, and the protection of environmen-
tally sensitive areas (Bell et al. 1989).
The resulting landscape plan is an attempt to or-
der the physical elements of the county in response
to these concepts. The Teller County plan comprises
the following components of land use: residential,
urban, historic mining district, water recreation, sce-
nic roadways, entryways, public lands, and range-
land (Bell et al. 1989). Three categories of future res-
idential development indicate primary, secondary,
and tertiary locations for new housing. Urban cen-
ters are represented on the plan as three unincorpo-
rated communities, two towns, and the City of
Woodland Park (which was addressed in a separate
268CHAPTER 7
FIGURE 7.5 Teller County landscape plan. (Source:Adapted from Bell et al. 1989)
landscape plan). Within these centers, the land uses
involve a combination of commercial, office, indus-
trial, recreational, and residential properties. Two of
the centers—Cripple Creek and Victor—are further
recognized for their historic value. The two towns are
part of a historic district listed on the National Regis-
ter of Historic Places (Bell et al. 1989).
Eight areas are designated in the plan for future
water recreation use, currently an underutilized re-
source in the county. The plan also suggested the
creation of a scenic tourism circulation system that
would include improving the quality of entryways
into the county. These scenic roadways would take
advantage of the stunning visual resources in the
area. Since public lands constitute almost half the
county, the lands managed by the state and federal
government provide an additional resource for
tourism and recreation. Finally, the landscape plan
designated rangeland areas that are important as
open space and as a reminder of the cowboy her-
itage of the county (Bell et al. 1989).
In 1990, Teller County adopted its official
master plan based in large part on the growth man-
agement planning process, including the landscape
plans (Teller County Planning Commission 1990).
After the growth management plan was prepared
and the county plan adopted, the voters of Colorado
approved gambling for Cripple Creek in Teller
County. The growth management plan helped miti-
gate some of the negative impacts that resulted from
the gaming industry. In addition, following adop-
tion of the growth management plans, gold mining
experienced a renewal. The plans also helped to di-
minish the negative consequences of the mining.
The growth plan formed the basis for six regional
action plans. The University of Colorado study also
influenced city and town plans. These regional and
municipal plans continue to direct growth in the
county (Teller County Planning Commission 1995,
1998a, 1998b; City of Woodland Park 1996).
For example, the intent of the 4- Mile regional ac-
tion plan “is to preserve the character and environ-
ment . . . while recognizing population growth in the
area will occur (Teller County Planning Commission
1995, 1). In accordance with the growth management
plan, resource protection, historical, and cultural over-
lays are used to protect specific and unique landscape
features. The Divide regional plan recognizes “scenic
and highly valued landscapes,” “sensitive areas,” and
the “carrying capacity of land” (Teller County Plan-
ning Commission 1998a, 2–3). Meanwhile, the Floris-
sant regional action plan identifies “critical areas,” in-
cluding cultural sites, natural hazard areas, and natural
resource areas. Cultural sites “include areas of historic
or archaeological significance,” while natural hazard
areas are defined to “include flood plains, steep slopes,
wildlife lands, and geological hazards” (Teller County
Planning Commission 1998b, 4).
The Pinelands and Teller County plans differ
from conventional comprehensive plans in their
recognition of landscape ecology. In the Pine Bar-
rens, where the protective document is called a com-
prehensive management plan, critical landscape fea-
tures are documented, recognized, and protected. In
the Pinelands plan, the goal is established to “pre-
serve, protect, and enhance the overall ecological
values of the Pinelands.” This goal is backed up both
by specific policies and by detailed implementation
strategies. These policies and programs are con-
cerned with soil, water, biotic, air, and human ele-
ments. The areas most suited for protection and for
growth are identified both on a map and in writing.
The plan seeks to achieve a balance between preser-
vation and development.
In Teller County, landscape processes were
linked to the planning process. Landscape analyses
were conducted at two scales to reveal patterns.
These patterns were recognized first in a set of con-
cepts for Teller County and Woodland Park and
then in landscape plans for each. The landscape
plans differ from conventional land- use plans in
their recognition of integrated, rather than sepa-
rated, uses.
269LANDSCAPE PLANS

8CONTINUING CITIZEN
INVOLVEMENT AND COMMUNITY EDUCATION
271
Education is a lifelong process that should seek to achieve awareness, balanced per-
ception, learning, and decision making. To accomplish these goals, individuals must
develop a functional understanding of their cultural inheritance as well as the ability
to contribute in a positive manner to society. Education occurs through the tradi-
tional institutions identified for that purpose, through continuing involvement in a
discipline, through community programs, and, in the broadest sense, through popu-
lar culture. Community education increases both citizens’ and planners’ knowledge
about a place.
Many planners have urged that public education and involvement efforts be in-
tegrated thoroughly into each step of the planning process. For instance, according
to William Lassey,
If planning is to be successful, a major reordering of public education, involvement,
and communication processes may be necessary. Existing scientific knowledge about
effective communication processes, and knowledge about human learning provide
vastly increased potential for public understanding,
ap preciation, and involvement in significant societal
decisions. Formal education methods for diffusing in-
formation and internalizing knowledge are archaic
compared with potential learning capability of the hu-
man population. It is increasingly clear that lifelong
educational processes are essential for adequate hu-
man adjustment to changing job requirements and
life- styles, but effective communication of knowledge
crucial to public decision making is equally important
if the planet is to survive (1977, 74).
As a result, community education must be both
future- oriented and ongoing. Continuing education
should assist people in making linkages between their
individual skills and interests and larger public is-
sues. Without such linkages, the rules and regula-
tions developed to protect people’s health, safety, and
welfare will be treated with suspicion by those whom
they were meant to protect. Although community
education and citizen involvement should be consid-
ered central and integral to each step in the plan-
ning process as indicated by Figure 1.1, they are placed
here in the process as a reminder that even after a
landscape plan has been developed, continued expla-
nation about the plan is often necessary before it is
implemented.
Rachel Kaplan and her colleagues argue that “gen-
uine participation needs to start early and reach the di-
verse segments of the population” (Kaplan et al. 1998,
126). They also note that “meaningful participation re-
quires information that is readily understood” (Kaplan
et al. 1998, 128). A strategy that combines these two
points would be to involve people early, then collect and
synthesize the relevant information so that it may be un-
derstood, and then reengage the public. However, citi-
zens can be involved in even the most technical steps of
the planning process. For example, in the early 1970s,
Ian McHarg worked with the people of Wilmington and
Dover, Vermont, to compile a detailed ecological inven-
tory and analysis of their region (McHarg and Steiner
1998).
Planners, politicians, architects, landscape archi-
tects, and other community leaders have much to gain
from citizen participation. A public involvement pro-
gram can guarantee the success of a policy or project. It
is also democratic. When viewed as part of ongoing
community education, citizens and planners widen
their planning knowledge as a result of participatory
efforts.
Citizen involvement techniques can be classified as
information dissemination, information collection, ini-
tiative planning, reactive planning, decision making, and
participation process support. Community organiza-
tions, publications, and television and radio can be
used in a community education program. Two exam-
ples of planning efforts that have included an educa-
tional element include the University of Wisconsin
Community Development Program and the Blueprint
for a Sustainable San Francisco Bay Area.
Citizen Involvement
One of the major purposes of planning is to involve
citizens in their government. A program should be
developed that seeks to involve all citizens in each
step of the planning process. There is no formula as
to how to involve citizens in all phases of planning.
However, the characteristics of such an open plan-
ning process are easy to identify. According to the
U.S. Department of Transportation,
Openness means that the purpose and the content of
the process as well as the schedule for doing it, are de-
scribed as clearly and concretely as possible—the de-
cisions that have to be made, the information that will
be used to make them, the choices which are and are
not open for consideration and why, and the time
when different steps are necessary and desirable
(1976b, 8).
Many state laws and legislation for federal land
management agencies mandate such involvement.
272CHAPTER 8
In Oregon, for instance, county and city govern-
ments, which are responsible for preparing and
adopting comprehensive plans, must have a pro-
gram that involves the public in an iterative way.
The Oregon citizen involvement program has six
components:
1. Citizen involvement
2. Communication
3. Citizen influence
4. Technical information
5. Feedback mechanisms
6. Financial support (Department of Land Con-
servation and Development 1996).
The guidelines for the citizen involvement com-
ponent stipulate that the program should use a
range of media, including television, radio, newspa-
pers, mailings, and meetings. Oregon universities,
colleges, community colleges, high schools, and
grade schools are to provide information and
courses about land- use planning. The program is
also to include an officially recognized committee
for citizen involvement. This committee is responsi-
ble for assisting the county commission or city
council in the involvement effort (Land Conser -
vation and Development Commission 1980; De-
partment of Land Conservation and Development
1996).
Two- way communication between the govern-
ing body and the public is to be assured in Oregon
cities and counties. Mechanisms such as newslet-
ters, mailings, posters, and mail- back question-
naires are recommended. The purpose of the in-
volvement and the communication is to give
Oregon citizens direct influence in the planning
process. Citizens are to be involved in data col-
lection, plan preparation, the adoption process,
implementation, evaluation, and revision (Land
Conservation and Development Commission 1980;
Department of Land Conservation and Develop-
ment 1996).
Planners in Oregon are responsible to “assure
that technical information is available in an under-
standable form.” There is also a requirement that
“feedback mechanisms” exist to “assure that citizens
will receive a response” from policymakers. Finally,
Oregon law requires that there be adequate financial
support to ensure “funding for the citizen involve-
ment program” (Land Conservation and Develop-
ment Commission 1980, 3; Department of Land
Conservation and Development 1996).
Other states have followed Oregon’s lead. For ex-
ample, Arizona’s 1998 “Growing Smarter” law pro-
motes citizen participation in general plan adoption
and amendment. Local governments in Arizona are
required “to adopt written procedures to provide ef-
fective, early and continuous public participation
from all geographic, ethnic, and economic areas of
the municipality” (Arizona Department of Com-
merce 1998, 3). These procedures must include “(a)
broad dissemination of proposals and alternatives;
(b) opportunity for written comments; (c) public
hearings after effective notice; (d) open discussions,
communications programs and information ser-
vices; and consideration of public comment” (Ari-
zona Department of Commerce 1998, 3).
All federal land management agencies have
guidelines for public participation, but the require-
ments vary. For instance, the intent of public partic-
ipation in the National Forest System is to
• Ensure that the U.S. Forest Service under-
stands the needs and concerns of the public
• Inform the public of U.S. Forest Service land
and resource planning activities
• Provide the public with an understanding of
U.S. Forest Service programs and proposed
actions
• Broaden the information base upon which
land and resource management planning de-
cisions are made
• Demonstrate that public issues and inputs
are considered and evaluated in reaching
273CONTINUING CITIZEN INVOLVEMENT AND COMMUNITY EDUCATION
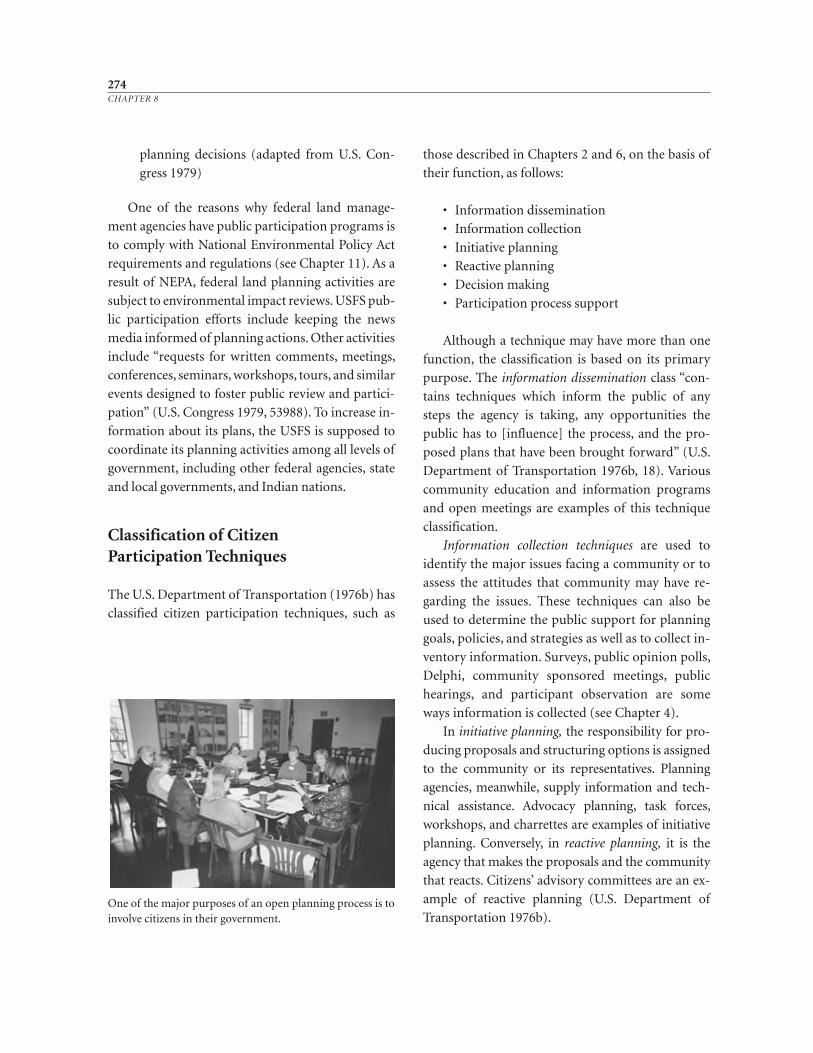
planning decisions (adapted from U.S. Con-
gress 1979)
One of the reasons why federal land manage-
ment agencies have public participation programs is
to comply with National Environmental Policy Act
requirements and regulations (see Chapter 11). As a
result of NEPA, federal land planning activities are
subject to environmental impact reviews. USFS pub-
lic participation efforts include keeping the news
media informed of planning actions. Other activities
include “requests for written comments, meetings,
conferences, seminars, workshops, tours, and similar
events designed to foster public review and partici-
pation” (U.S. Congress 1979, 53988). To increase in-
formation about its plans, the USFS is supposed to
coordinate its planning activities among all levels of
government, including other federal agencies, state
and local governments, and Indian nations.
Classification of Citizen Participation Techniques
The U.S. Department of Transportation (1976b) has
classified citizen participation techniques, such as
those described in Chapters 2 and 6, on the basis of
their function, as follows:
• Information dissemination
• Information collection
• Initiative planning
• Reactive planning
• Decision making
• Participation process support
Although a technique may have more than one
function, the classification is based on its primary
purpose. The information dissemination class “con-
tains techniques which inform the public of any
steps the agency is taking, any opportunities the
public has to [influence] the process, and the pro-
posed plans that have been brought forward” (U.S.
Department of Transportation 1976b, 18). Various
community education and information programs
and open meetings are examples of this technique
classification.
Information collection techniques are used to
identify the major issues facing a community or to
assess the attitudes that community may have re-
garding the issues. These techniques can also be
used to determine the public support for planning
goals, policies, and strategies as well as to collect in-
ventory information. Surveys, public opinion polls,
Delphi, community sponsored meetings, public
hearings, and participant observation are some
ways information is collected (see Chapter 4).
In initiative planning, the responsibility for pro-
ducing proposals and structuring options is assigned
to the community or its representatives. Planning
agencies, meanwhile, supply information and tech-
nical assistance. Advocacy planning, task forces,
workshops, and charrettes are examples of initiative
planning. Conversely, in reactive planning, it is the
agency that makes the proposals and the community
that reacts. Citizens’ advisory committees are an ex-
ample of reactive planning (U.S. Department of
Transportation 1976b).
274CHAPTER 8
One of the major purposes of an open planning process is toinvolve citizens in their government.
Decision- making techniques are designed to help
a community develop a consensus on an issue, a
goal, an option, or a plan. Such techniques do not
replace the responsibilities of elected or appointed
officials but are intended to augment them. Refer-
enda, which may in fact be binding, and citizen re-
view boards are two decision- making techniques
(U.S. Department of Transportation 1976b).
The final classification is participation process
support techniques. According to the Department of
Transportation (1976b), these methods serve to
make other types of techniques more effective and to
cut across all of the other categories. Citizen hono-
raria may be used, for instance, to compensate peo-
ple for being involved in the process. Such payment
may permit people to become active who would not
otherwise be able to pa r ticipate. But paying people to
be citizens raises important ethical questions about
the responsibilities of people in a democracy. An-
other technique is citizen training, where individuals
are taught leadership and planning skills (U.S. De-
partment of Transportation 1976b).
Continuing Community Education
Public participation is concerned both with involv-
ing people in the process and then continuing to in-
form citizens about changes and adjustments to the
plan and its implementation and administration.
Once a community is organized for the process,
some form of that organization can continue. For
example, in the New Jersey Pinelands a commission
was established that is responsible for involving
people in the planning process and establishing a
continuing information effort. The public partici-
pation program included activities like workshops
and conferences, public workshops on specific top-
ics, personal communications and meetings, and
the use of knowledgeable private individuals for
guidance in research areas of interests to the Pine -
lands Commission (Pinelands Commission 1980).
Means to keep people informed included newslet-
ters, television, radio, and websites.
Information and Education
In addition to being a means for establishing goals
and for selecting preferences, community organiza-
tions can provide information and education and
can keep people involved. As reviewed in Chapters 2
and 6, there are various types of or ganizations that
can be used in a community, including task forces,
advisory committees, and neighborhood councils.
Such groups might sponsor a lecture by an expert
and/or the showing of a film or a slide presentation.
Other meetings may take the form of a workshop
where the group interacts with facilitators or with a
two- way television connected with an individual or
individuals or another group or groups.
Information can also be presented to communi-
ties through conferences and symposia. Community
colleges, universities, or the Cooperative Extension
Service may be used to help organize such gather-
ings. Professional and academic associations may be
contacted for involvement as well. Since many mem-
bers of associations are required to receive a certain
number of hours of continuing education credit an-
nually, conference organizers may want to arrange to
offer credit when appropriate. The content of con-
ferences and symposia may range from that of a gen-
eral nature to very advanced. In the Pinelands, for ex-
ample, conferences and workshops have been
organized ranging from rather simple question- and-
answer sessions to academic conferences on the ecol-
ogy and culture of the Pine Barrens.
Planners are often invited to community orga -
nizations and clubs, such as those listed in Table 4.1,
to make presentations. These are good opportuni-
ties to explain the planning process. Youth groups
such as the Scouts and 4- H also often invite speakers
to their meetings.
Many planning agencies and commissions, in-
cluding the Pinelands Commission and the Oregon
275CONTINUING CITIZEN INVOLVEMENT AND COMMUNITY EDUCATION
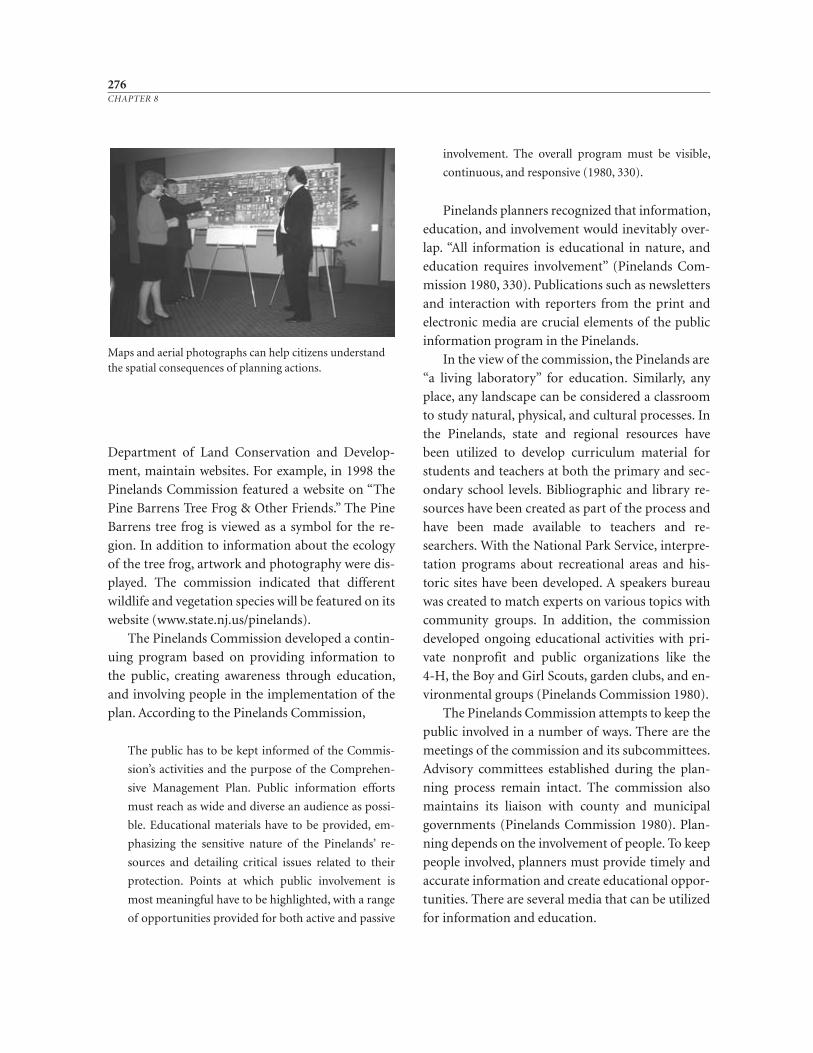
Department of Land Conservation and Develop-
ment, maintain websites. For example, in 1998 the
Pinelands Commission featured a website on “The
Pine Barrens Tree Frog & Other Friends.” The Pine
Barrens tree frog is viewed as a symbol for the re-
gion. In addition to information about the ecology
of the tree frog, artwork and photography were dis-
played. The commission indicated that different
wildlife and vegetation species will be featured on its
website (www.state.nj.us/pinelands).
The Pinelands Commission developed a contin-
uing program based on providing information to
the public, creating awareness through education,
and involving people in the implementation of the
plan. According to the Pinelands Commission,
The public has to be kept informed of the Commis-
sion’s activities and the purpose of the Comprehen-
sive Management Plan. Public information efforts
must reach as wide and diverse an audience as possi-
ble. Educational materials have to be provided, em-
phasizing the sensitive nature of the Pinelands’ re-
sources and detailing critical issues related to their
protection. Points at which public involvement is
most meaningful have to be highlighted, with a range
of opportunities provided for both active and passive
involvement. The overall program must be visible,
continuous, and responsive (1980, 330).
Pinelands planners recognized that information,
education, and involvement would inevitably over-
lap. “All information is educational in nature, and
education requires involvement” (Pinelands Com-
mission 1980, 330). Publications such as newsletters
and interaction with reporters from the print and
electronic media are crucial elements of the public
information program in the Pinelands.
In the view of the commission, the Pinelands are
“a living laboratory” for education. Similarly, any
place, any landscape can be considered a classroom
to study natural, physical, and cultural processes. In
the Pinelands, state and re gional resources have
been utilized to develop curriculum material for
students and teachers at both the primary and sec-
ondary school levels. Bibliographic and library re-
sources have been created as part of the process and
have been made available to teachers and re-
searchers. With the National Park Service, interpre-
tation programs about recreational areas and his-
toric sites have been developed. A speakers bureau
was created to match experts on various topics with
community groups. In addition, the commission
developed ongoing educational activities with pri-
vate nonprofit and public organizations like the
4- H, the Boy and Girl Scouts, garden clubs, and en-
vironmental groups (Pinelands Commission 1980).
The Pinelands Commission attempts to keep the
public involved in a number of ways. There are the
meetings of the commission and its subcommittees.
Advisory committees established during the plan-
ning process remain intact. The commission also
maintains its liaison with county and municipal
governments (Pinelands Commission 1980). Plan-
ning depends on the involvement of people. To keep
people involved, planners must provide timely and
accurate information and create educational oppor-
tunities. There are several media that can be utilized
for information and education.
276CHAPTER 8
Maps and aerial photographs can help citizens understandthe spatial consequences of planning actions.
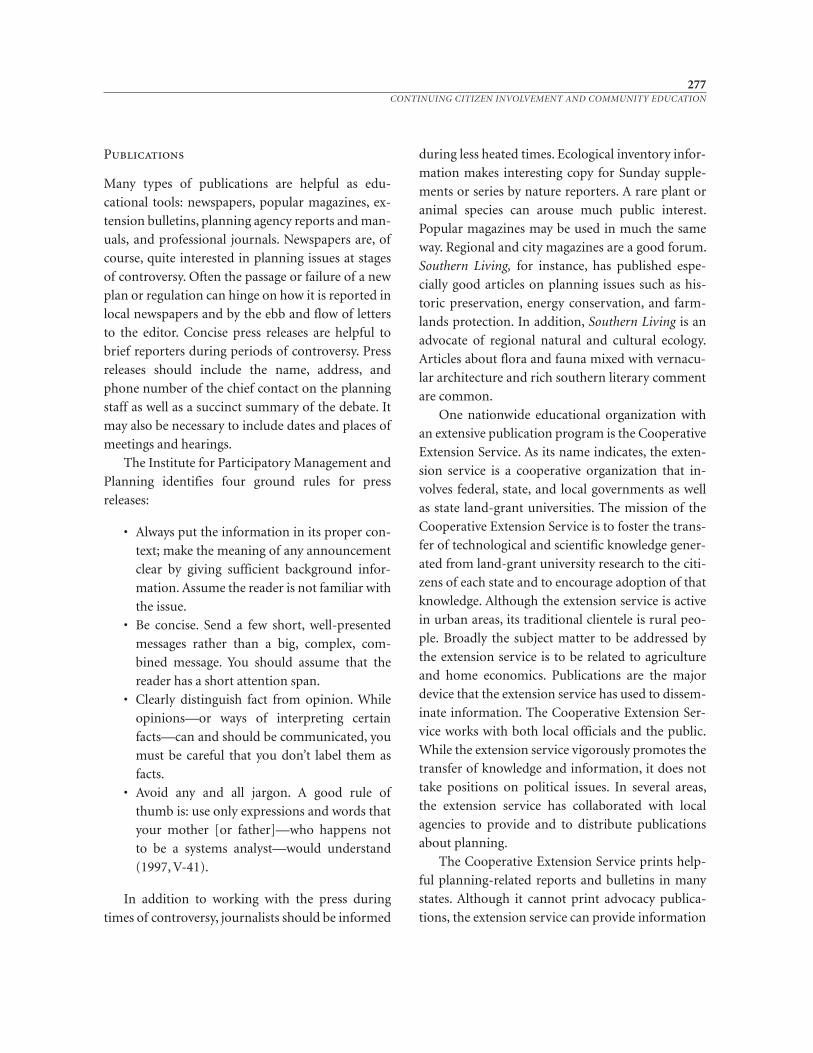
Publications
Many types of publications are helpful as edu -
cational tools: newspapers, popular magazines, ex-
tension bulletins, planning agency reports and man-
uals, and professional journals. Newspapers are, of
course, quite interested in planning issues at stages
of controversy. Often the passage or failure of a new
plan or regulation can hinge on how it is reported in
local newspapers and by the ebb and flow of letters
to the editor. Concise press releases are helpful to
brief reporters during periods of controversy. Press
releases should include the name, address, and
phone number of the chief contact on the planning
staff as well as a succinct summary of the debate. It
may also be necessary to include dates and places of
meetings and hearings.
The Institute for Participatory Management and
Planning identifies four ground rules for press
releases:
• Always put the information in its proper con-
text; make the meaning of any announcement
clear by giving sufficient background infor-
mation. Assume the reader is not familiar with
the issue.
• Be concise. Send a few short, well- presented
messages rather than a big, complex, com-
bined message. You should assume that the
reader has a short attention span.
• Clearly distinguish fact from opinion. While
opinions—or ways of interpreting certain
facts—can and should be communicated, you
must be careful that you don’t label them as
facts.
• Avoid any and all jargon. A good rule of
thumb is: use only expressions and words that
your mother [or father]—who happens not
to be a systems analyst—would understand
(1997, V-41).
In addition to working with the press during
times of controversy, journalists should be informed
during less heated times. Ecological inventory infor-
mation makes interesting copy for Sunday supple-
ments or series by nature reporters. A rare plant or
animal species can arouse much public interest.
Popular magazines may be used in much the same
way. Regional and city magazines are a good forum.
Southern Living, for instance, has published espe-
cially good articles on planning issues such as his-
toric preservation, energy conservation, and farm-
lands protection. In addition, Southern Living is an
advocate of regional natural and cultural ecology.
Articles about flora and fauna mixed with vernacu-
lar architecture and rich southern literary comment
are common.
One nationwide educational organization with
an extensive publication program is the Cooperative
Extension Service. As its name indicates, the exten-
sion service is a cooperative organization that in-
volves federal, state, and local governments as well
as state land- grant universities. The mission of the
Cooperative Extension Service is to foster the trans-
fer of technological and scientific knowledge gener-
ated from land- grant university research to the citi-
zens of each state and to en courage adoption of that
knowledge. Although the extension service is active
in urban areas, its traditional clientele is rural peo-
ple. Broadly the subject matter to be addressed by
the extension service is to be related to agriculture
and home economics. Publications are the major
device that the extension service has used to dissem-
inate information. The Cooperative Extension Ser-
vice works with both local officials and the public.
While the extension service vigorously promotes the
transfer of knowledge and information, it does not
take positions on political issues. In several areas,
the extension service has collaborated with local
agencies to provide and to distribute publications
about planning.
The Cooperative Extension Service prints help-
ful planning- related reports and bulletins in many
states. Although it cannot print advocacy publica-
tions, the extension service can provide information
277CONTINUING CITIZEN INVOLVEMENT AND COMMUNITY EDUCATION
helpful for citizens to gain a better understanding
about planning issues and techniques. One notewor-
thy example is the Coping with Growth series pub-
lished by the Western Rural Development Center, a
consortium of western land- grant universities. This
informative series addresses topics such as commu-
nity needs assessment, population studies, fiscal and
social impacts, and citizen involvement, and is avail-
able through the Western Rural Development Cen-
ter, Oregon State University, Corvallis, Oregon. Sim-
ilar rural development consortia of land- grant
universities exist in the northeast at Pennsylvania
State University, in the midwest at Iowa State Univer-
sity, and in the south at Mississippi State University.
Non- land- grant universities also provide com-
munity service through design and outreach
centers. For example, the Herberger Center for De-
sign Excellence coordinates research and outreach
activities for the ASU College of Architecture and
Environmental Design. The Joint Urban Design
Program, part of the Herberger Center headquar-
tered in downtown Phoenix, leads the outreach mis-
sion. Charrettes, often in collaboration with the City
of Phoenix, are one outreach activity (see Chapter
6). The Herberger Center also disseminates infor-
mation through publications. Two- and four- page
newsletter- like reports summarize charrette and
other community events. The Herberger Center
publishes longer, more technical reports as well.
Most Amer ican colleges of architecture, planning,
and landscape architecture have similar centers.
Increasingly, teaching, research, and service ac-
tivities are becoming more intermingled at universi-
ties. This approach is consistent with Ernest Boyer’s
(1990) call to replace the traditional teaching-
research- service triad for higher education with the
scholarship of discovery, the scholarship of integra-
tion, the scholarship of application, and the scholar-
ship of teaching.
Planning agency reports and manuals are im-
portant educational tools. Some of these reports
must be technical and thus will have a limited read-
ership; others, however, should be written for a
broader audience. Manuals in plain English that ex-
plain regulatory procedures are especially helpful
for real estate agents, home builders, and developers.
Packets and websites explaining a community com-
prehensive plan, zoning ordinance, subdivision reg-
ulations, public services, cultural activities, and nat-
ural and social histories are interesting to new
residents of an area.
Professional and academic journals address a
narrower audience. Such publications are invaluable
forums for sharing experiences. But planners should
not be constricted by disciplinary territorialism.
They should read—and publish in—journals of the
many related disciplines. This is a way to build
needed linkages among people trained or educated
in various fields.
Television and Radio
Television is a ubiquitous part of American life,
while radio provides an ongoing narration of public
events. Commercial television and radio news are
interested in controversial local issues in the same
way as newspapers. Television and radio reporters
can be approached in the same way as print journal-
ists, although commercial stations will seldom ex-
plore issues in much depth during news programs.
Television “magazine” and talkshow programs offer
opportunities to explore issues in greater detail.
Public television and radio may even devote
more time to certain issues than will their news print
colleagues. Many planners cooperate with public
broadcast journalists to develop in- depth analyses of
issues and explanations of legislation. The Coopera-
tive Extension Service frequently works with public
broadcasting stations and provides background in-
formation through television and radio similar to
that found in its printed bulletins and reports.
The continued extension of cable television sys-
tems offers expanded opportunities for conveying
planning information. Because of the increase in the
278CHAPTER 8
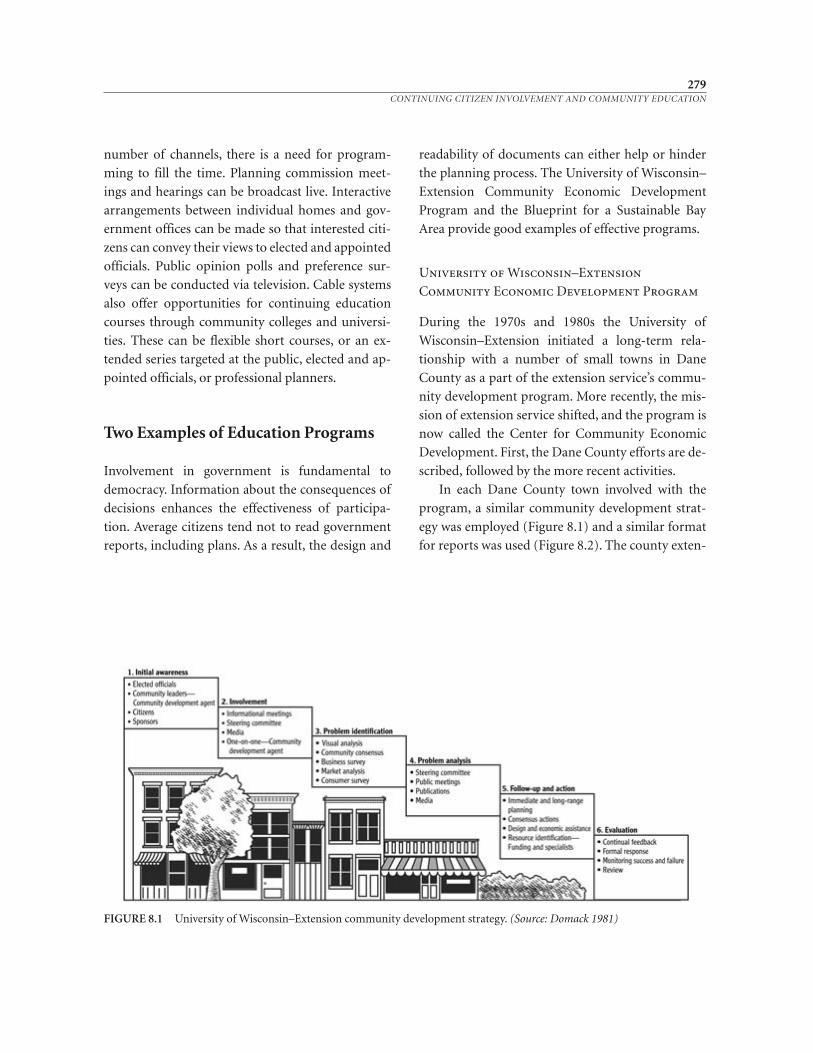
number of channels, there is a need for program-
ming to fill the time. Planning commission meet-
ings and hearings can be broadcast live. Interactive
arrangements between individual homes and gov-
ernment offices can be made so that interested citi-
zens can convey their views to elected and appointed
officials. Public opinion polls and preference sur-
veys can be conducted via television. Cable systems
also offer opportu nities for continuing education
courses through community colleges and universi-
ties. These can be flexible short courses, or an ex-
tended series targeted at the public, elected and ap-
pointed officials, or professional planners.
Two Examples of Education Programs
Involvement in government is fundamental to
democracy. Information about the consequences of
decisions enhances the effectiveness of participa-
tion. Average citizens tend not to read government
reports, including plans. As a result, the design and
readability of documents can either help or hinder
the planning process. The University of Wisconsin–
Extension Community Economic Development
Program and the Blueprint for a Sustainable Bay
Area provide good examples of effective programs.
University of Wisconsin– Extension
Community Economic Development Program
During the 1970s and 1980s the University of
Wisconsin– Extension initiated a long- term rela-
tionship with a number of small towns in Dane
County as a part of the extension service’s commu-
nity development program. More recently, the mis-
sion of extension service shifted, and the program is
now called the Center for Community Economic
Development. First, the Dane County efforts are de-
scribed, followed by the more recent activities.
In each Dane County town involved with the
program, a similar community development strat-
egy was employed (Figure 8.1) and a similar format
for reports was used (Figure 8.2). The county exten-
279CONTINUING CITIZEN INVOLVEMENT AND COMMUNITY EDUCATION
FIGURE 8.1 University of Wisconsin–Extension community development strategy. (Source: Domack 1981)
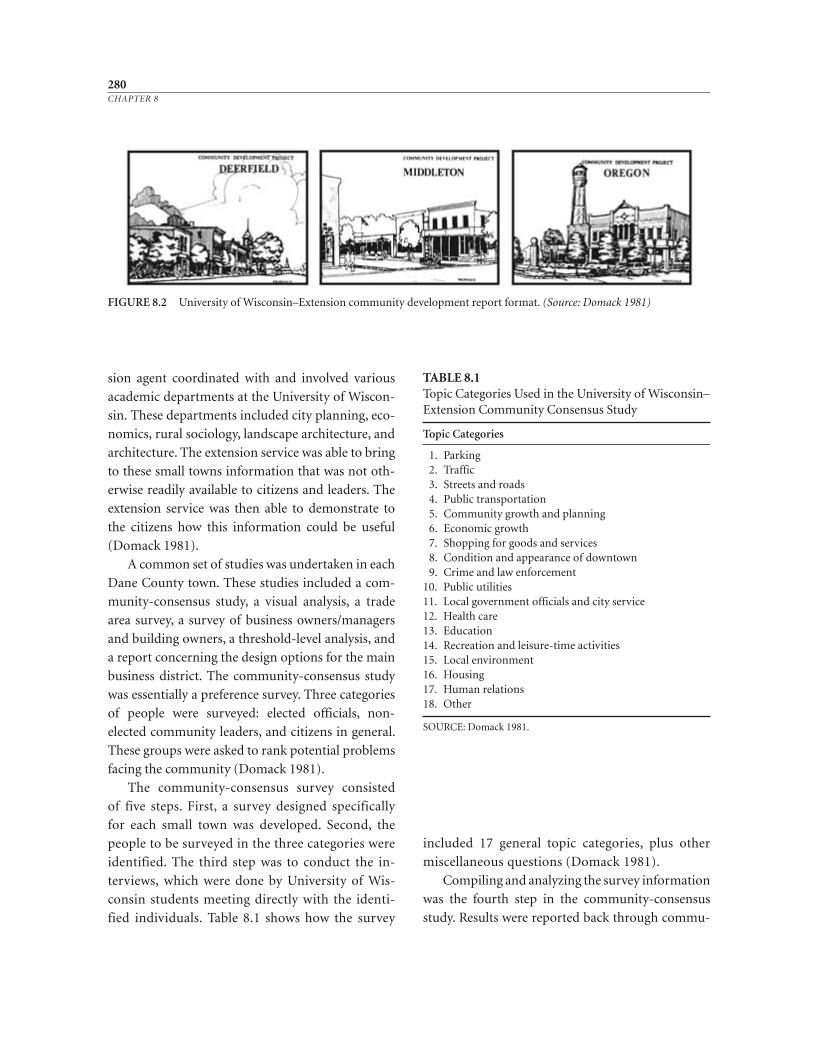
sion agent coordinated with and involved various
academic departments at the University of Wiscon-
sin. These departments included city planning, eco-
nomics, rural sociology, landscape architecture, and
architecture. The extension service was able to bring
to these small towns information that was not oth-
erwise readily available to citizens and leaders. The
extension service was then able to demonstrate to
the citizens how this information could be useful
(Domack 1981).
A common set of studies was undertaken in each
Dane County town. These studies included a com-
munity- consensus study, a visual analysis, a trade
area survey, a survey of business owners/managers
and building owners, a threshold- level analysis, and
a report concerning the design op tions for the main
business district. The community- consensus study
was essentially a preference survey. Three categories
of people were surveyed: elected officials, non-
elected community leaders, and citizens in general.
These groups were asked to rank potential problems
facing the community (Domack 1981).
The community- consensus survey consisted
of five steps. First, a survey designed specifically
for each small town was developed. Second, the
people to be surveyed in the three categories were
identified. The third step was to conduct the in-
terviews, which were done by University of Wis-
consin students meeting directly with the identi-
fied individuals. Table 8.1 shows how the survey
included 17 general topic categories, plus other
miscellaneous questions (Domack 1981).
Compiling and analyzing the survey information
was the fourth step in the community- consensus
study. Results were reported back through commu-
280CHAPTER 8
FIGURE 8.2 University of Wisconsin–Extension community development report format. (Source: Domack 1981)
TABLE 8.1Topic Categories Used in the University of Wisconsin–Extension Community Consensus Study
Topic Categories
1. Parking2. Traffic3. Streets and roads4. Public transportation5. Community growth and planning6. Economic growth7. Shopping for goods and services8. Condition and appearance of downtown9. Crime and law enforcement
10. Public utilities11. Local government officials and city service12. Health care13. Education14. Recreation and leisure- time activities15. Local environment16. Housing17. Human relations18. Other
SOURCE: Domack 1981.
nity meetings, local news media, and publications.
After about ten weeks, once the survey results were
reported, the fifth step was taken. This involved again
surveying the elected officials, community leaders,
and the sampling of citizens to ascertain if any
change may have occurred as a result or a reaction to
the original survey (Domack 1981).
The downtown areas of smaller towns deterio-
rate slowly, in a process that is often unnoticed by
local residents. The purpose of the visual analysis
portion of the University of Wisconsin–Extension
program was to help each community see how their
town looked to outsiders. This was accomplished
through an extensive photographic effort, in which
between 600 and 800 slides were taken. The effort
concentrated on important gathering areas such as
the downtown, parks, schools, and churches. The re-
sults of the visual analysis were presented at com-
munity meetings (Domack 1981).
According to the University of Wisconsin–
Extension, a trade area is the economic region from
which community businesses draw their customers.
It comprised both rural and built- up areas. In the
University of Wisconsin–Extension trade area sur-
vey, a consumer questionnaire was utilized to pro-
vide local businesses with information about their
current and potential customers. In this survey the
following information was sought from local con-
sumers:
• Where do they shop (what towns and shop-
ping centers)?
• What influence does media advertising (news-
papers, radio, television, and/or direct mail
fliers) have on their shopping decisions?
• What are their main considerations (price,
quality, and/or brand name) when they pur-
chase a particular product?
• Where do they purchase specialized goods and
services most often?
• Are existing store hours compatible with their
schedules?
• What additional services and facilities do they
think the community needs?
• How can government officials better serve the
needs of downtown businesspeople (Domack
1981, 12)?
The survey of business owners/managers and
building owners was used to determine what these
people thought about potential economic devel-
opment in their downtown area. The survey
helped to gauge the willingness of the business
community to participate in change. This survey
also provided an overview about how the busi-
nesspeople viewed economic opportunities and
problems in their towns (Domack 1981).
The final survey used in the extension program
was the threshold- level analysis. This was a market
survey used to determine whether a particular
type of new business could be a success in the
town. According to the University of Wisconsin–
Extension, a threshold is the minimum number of
people needed to support one business of a partic-
ular type. The extension service has developed
thresholds through the study of 100 small Wiscon-
sin communities. Table 8.2 illustrates threshold
populations, hierarchical marginal goods, and the
rank of selected central functions for central place
hierarchy in Wis consin. Figure 8.3 illustrates the
relationship between community size and the
number of businesses that can be supported, while
Table 8.3 shows the number of people required to
support various businesses in Wisconsin.
Threshold- level analysis helps local businesspeo-
ple and investors create an accurate picture of the
economic potential of their town (Figure 8.4) (Do-
mack 1981).
The purpose of all these studies—the commu-
nity consensus, visual analysis, trade- area survey,
survey of business owners/managers and build-
ing owners, and threshold- level analysis—was to
help small- town residents better understand their
community, and particularly its limitations and
281CONTINUING CITIZEN INVOLVEMENT AND COMMUNITY EDUCATION
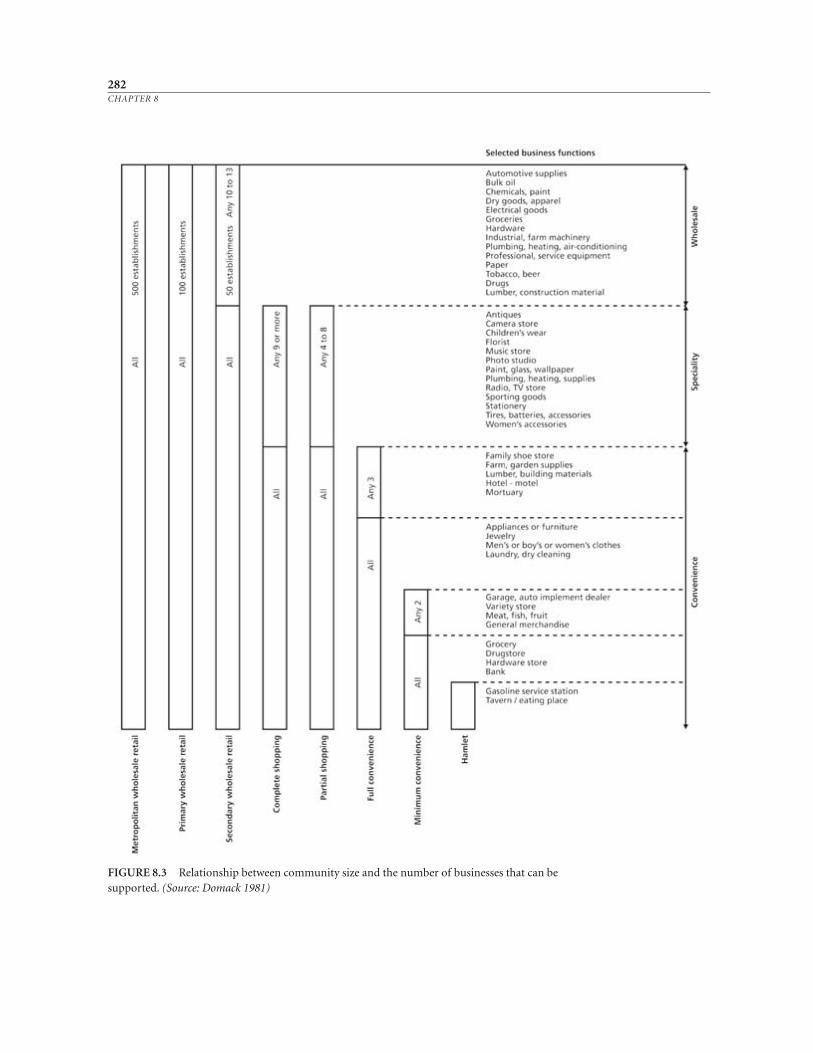
282CHAPTER 8
FIGURE 8.3 Relationship between community size and the number of businesses that can be supported. (Source: Domack 1981)
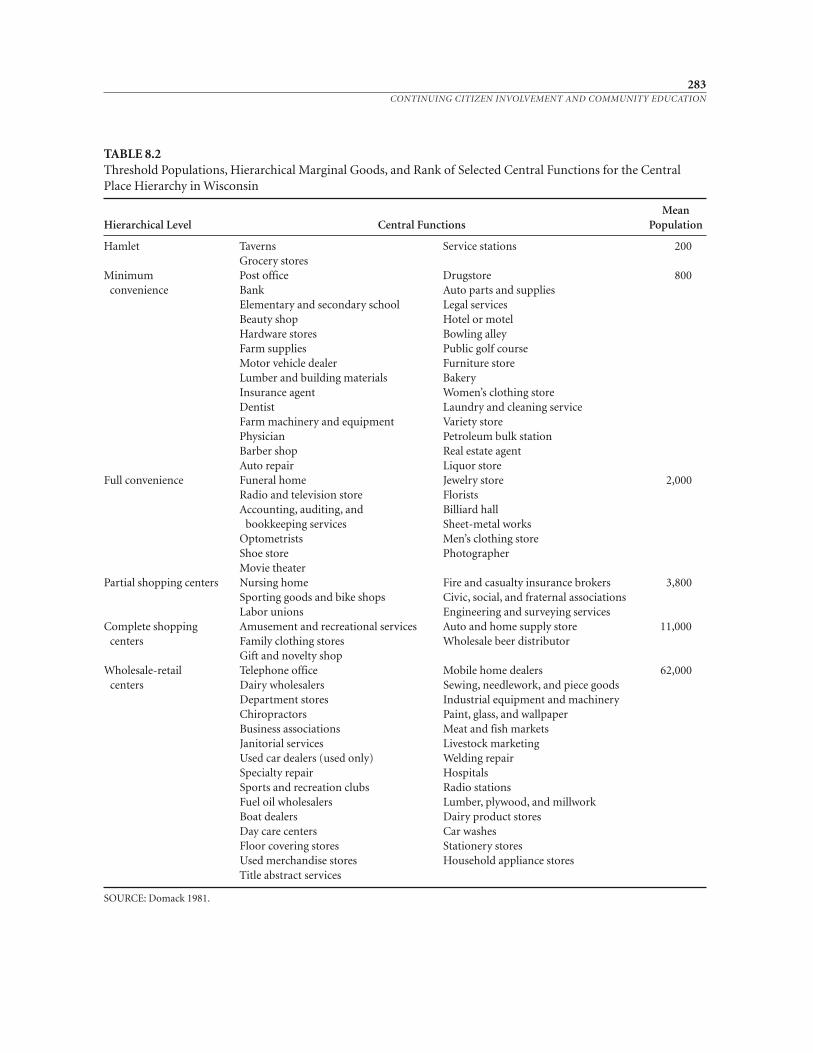
283CONTINUING CITIZEN INVOLVEMENT AND COMMUNITY EDUCATION
TABLE 8.2Threshold Populations, Hierarchical Marginal Goods, and Rank of Selected Central Functions for the CentralPlace Hierarchy in Wisconsin
MeanHierarchical Level Central Functions Population
Hamlet Taverns Service stations 200Grocery stores
Minimum Post office Drugstore 800convenience Bank Auto parts and supplies
Elementary and secondary school Legal servicesBeauty shop Hotel or motelHardware stores Bowling alleyFarm supplies Public golf courseMotor vehicle dealer Furniture storeLumber and building materials BakeryInsurance agent Women’s clothing storeDentist Laundry and cleaning serviceFarm machinery and equipment Variety storePhysician Petroleum bulk stationBarber shop Real estate agentAuto repair Liquor store
Full convenience Funeral home Jewelry store 2,000Radio and television store FloristsAccounting, auditing, and Billiard hall
bookkeeping services Sheet- metal worksOptometrists Men’s clothing storeShoe store PhotographerMovie theater
Partial shopping centers Nursing home Fire and casualty insurance brokers 3,800Sporting goods and bike shops Civic, social, and fraternal associationsLabor unions Engineering and surveying services
Complete shopping Amusement and recreational services Auto and home supply store 11,000centers Family clothing stores Wholesale beer distributor
Gift and novelty shopWholesale- retail Telephone office Mobile home dealers 62,000
centers Dairy wholesalers Sewing, needlework, and piece goodsDepartment stores Industrial equipment and machineryChiropractors Paint, glass, and wallpaperBusiness associations Meat and fish marketsJanitorial services Livestock marketingUsed car dealers (used only) Welding repairSpecialty repair HospitalsSports and recreation clubs Radio stationsFuel oil wholesalers Lumber, plywood, and millworkBoat dealers Dairy product storesDay care centers Car washesFloor covering stores Stationery storesUsed merchandise stores Household appliance storesTitle abstract services
SOURCE: Domack 1981.
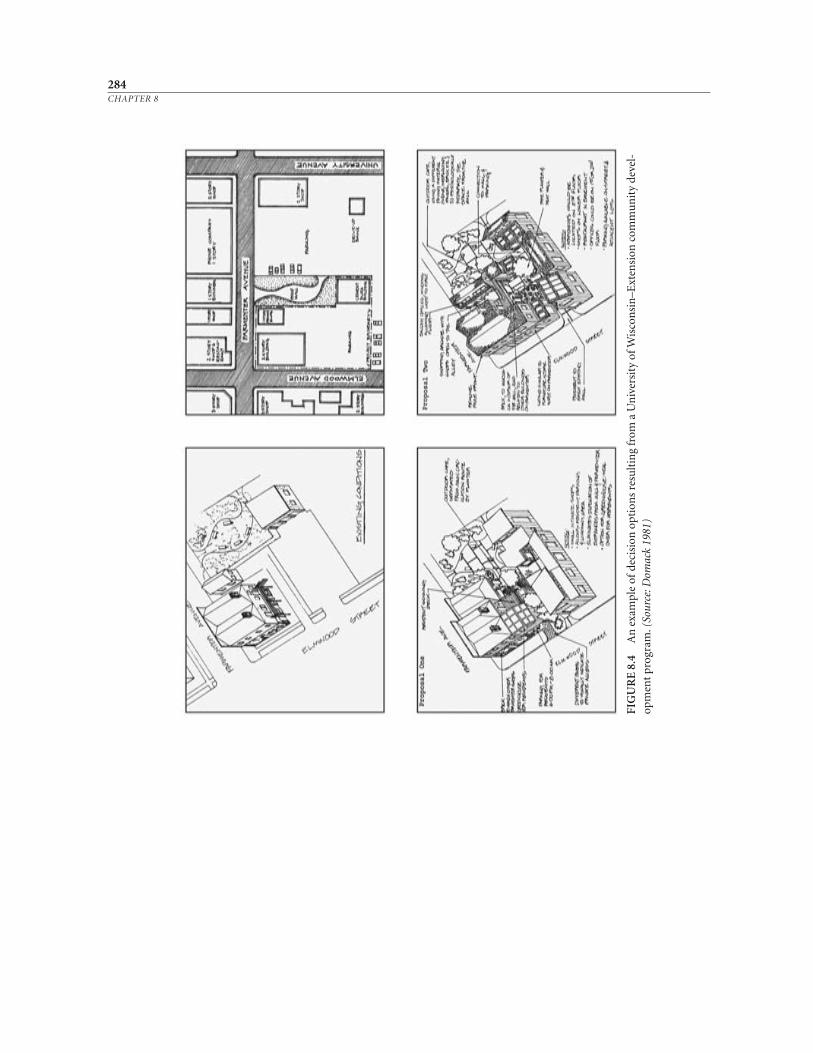
284CHAPTER 8
FIG
UR
E 8
.4A
n e
xam
ple
of d
ecis
ion
opt
ion
s re
sult
ing
from
a U
niv
ersi
ty o
f Wis
con
sin
– Ext
ensi
on c
omm
un
ity
deve
l-op
men
t pro
gram
. (So
urce
: Dom
ack
1981
)
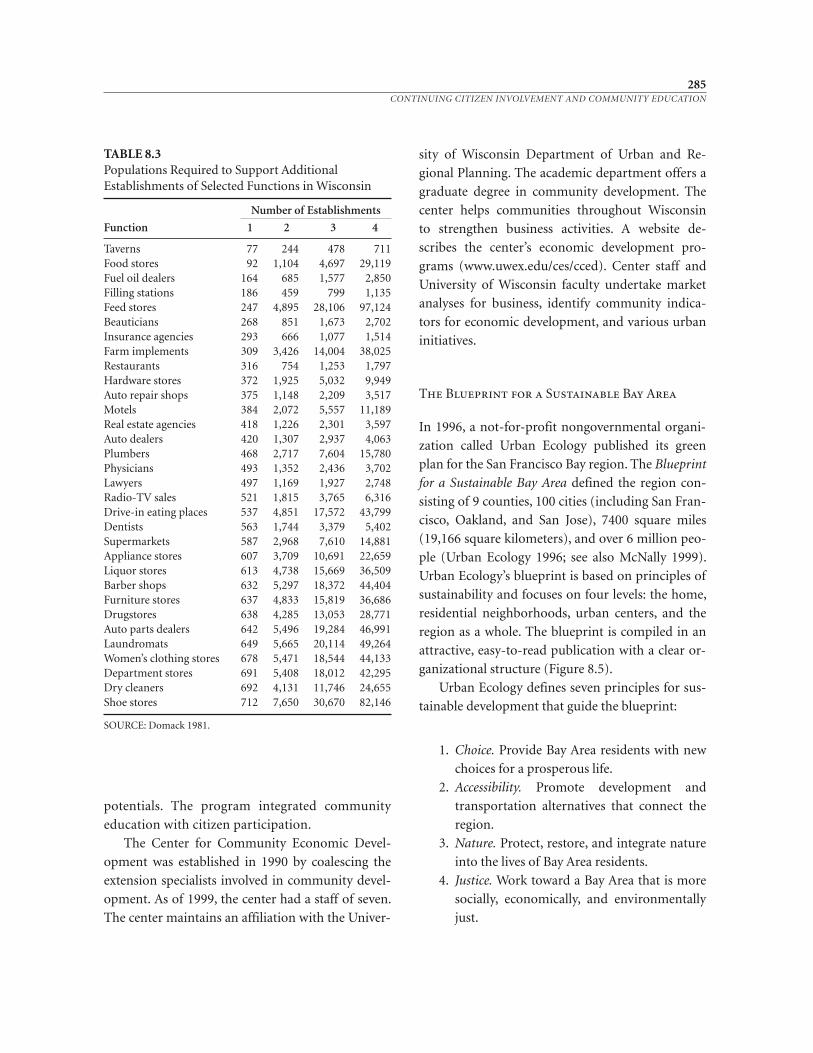
potentials. The program integrated community
education with citizen participation.
The Center for Community Economic Devel-
opment was established in 1990 by coalescing the
extension specialists involved in community devel-
opment. As of 1999, the center had a staff of seven.
The center maintains an affiliation with the Univer-
sity of Wisconsin Department of Urban and Re-
gional Planning. The academic department offers a
graduate degree in com munity development. The
center helps communities throughout Wisconsin
to strengthen business activities. A website de-
scribes the center’s economic development pro-
grams (www.uwex.edu/ces/cced). Center staff and
University of Wisconsin faculty undertake market
analyses for business, identify community indica-
tors for economic development, and various urban
initiatives.
The Blueprint for a Sustainable Bay Area
In 1996, a not- for- profit nongovernmental organi-
zation called Urban Ecology published its green
plan for the San Francisco Bay region. The Blueprint
for a Sustainable Bay Area defined the region con-
sisting of 9 counties, 100 cities (including San Fran-
cisco, Oakland, and San Jose), 7400 square miles
(19,166 square kilometers), and over 6 million peo-
ple (Urban Ecology 1996; see also McNally 1999).
Urban Ecology’s blueprint is based on principles of
sustainability and focuses on four levels: the home,
residential neighborhoods, urban centers, and the
region as a whole. The blueprint is compiled in an
attractive, easy- to- read publication with a clear or-
ganizational structure (Figure 8.5).
Urban Ecology defines seven principles for sus-
tainable development that guide the blueprint:
1. Choice. Provide Bay Area residents with new
choices for a prosperous life.
2. Accessibility. Promote development and
transportation alternatives that connect the
region.
3. Nature. Protect, restore, and integrate nature
into the lives of Bay Area residents.
4. Justice. Work toward a Bay Area that is more
socially, economically, and environmentally
just.
285CONTINUING CITIZEN INVOLVEMENT AND COMMUNITY EDUCATION
TABLE 8.3Populations Required to Support AdditionalEstablishments of Selected Functions in Wisconsin
Number of Establishments
Function 1 2 3 4
Taverns 77 244 478 711Food stores 92 1,104 4,697 29,119Fuel oil dealers 164 685 1,577 2,850Filling stations 186 459 799 1,135Feed stores 247 4,895 28,106 97,124Beauticians 268 851 1,673 2,702Insurance agencies 293 666 1,077 1,514Farm implements 309 3,426 14,004 38,025Restaurants 316 754 1,253 1,797Hardware stores 372 1,925 5,032 9,949Auto repair shops 375 1,148 2,209 3,517Motels 384 2,072 5,557 11,189Real estate agencies 418 1,226 2,301 3,597Auto dealers 420 1,307 2,937 4,063Plumbers 468 2,717 7,604 15,780Physicians 493 1,352 2,436 3,702Lawyers 497 1,169 1,927 2,748Radio- TV sales 521 1,815 3,765 6,316Drive- in eating places 537 4,851 17,572 43,799Dentists 563 1,744 3,379 5,402Supermarkets 587 2,968 7,610 14,881Appliance stores 607 3,709 10,691 22,659Liquor stores 613 4,738 15,669 36,509Barber shops 632 5,297 18,372 44,404Furniture stores 637 4,833 15,819 36,686Drugstores 638 4,285 13,053 28,771Auto parts dealers 642 5,496 19,284 46,991Laundromats 649 5,665 20,114 49,264Women’s clothing stores 678 5,471 18,544 44,133Department stores 691 5,408 18,012 42,295Dry cleaners 692 4,131 11,746 24,655Shoe stores 712 7,650 30,670 82,146
SOURCE: Domack 1981.
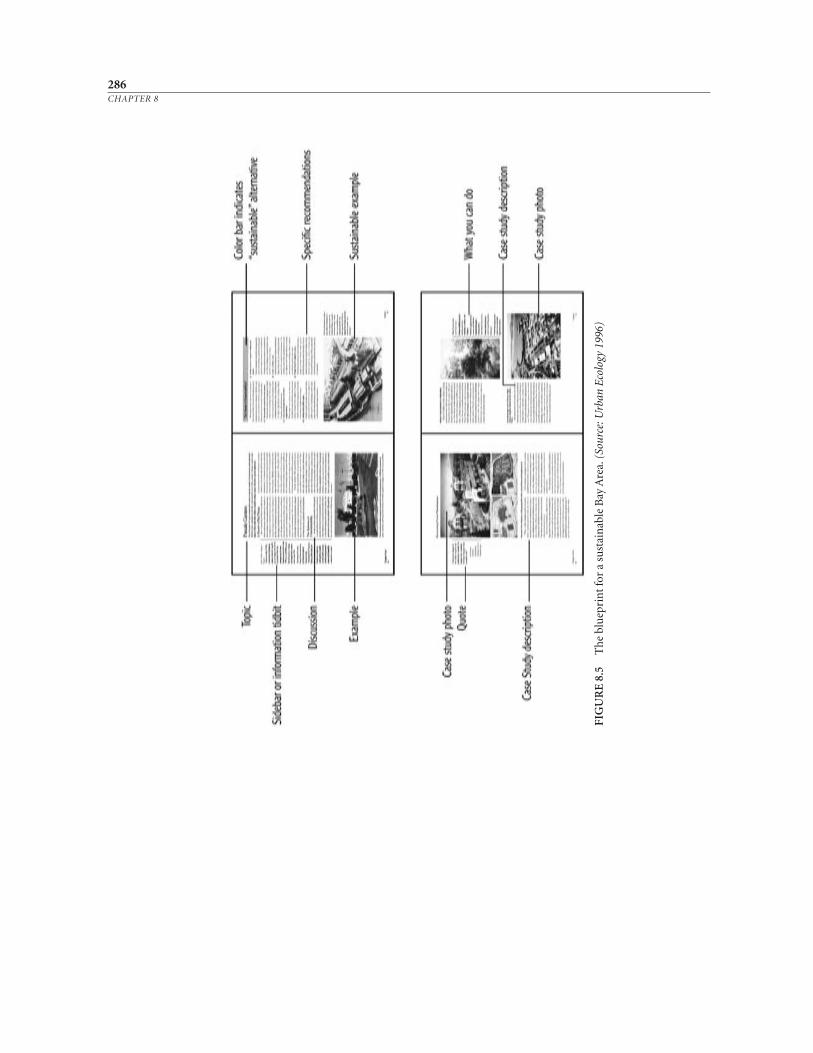
286CHAPTER 8
FIG
UR
E 8
.5T
he
blu
epri
nt f
or a
su
stai
nab
le B
ay A
rea.
(So
urce
: Urb
an E
colo
gy 1
996)
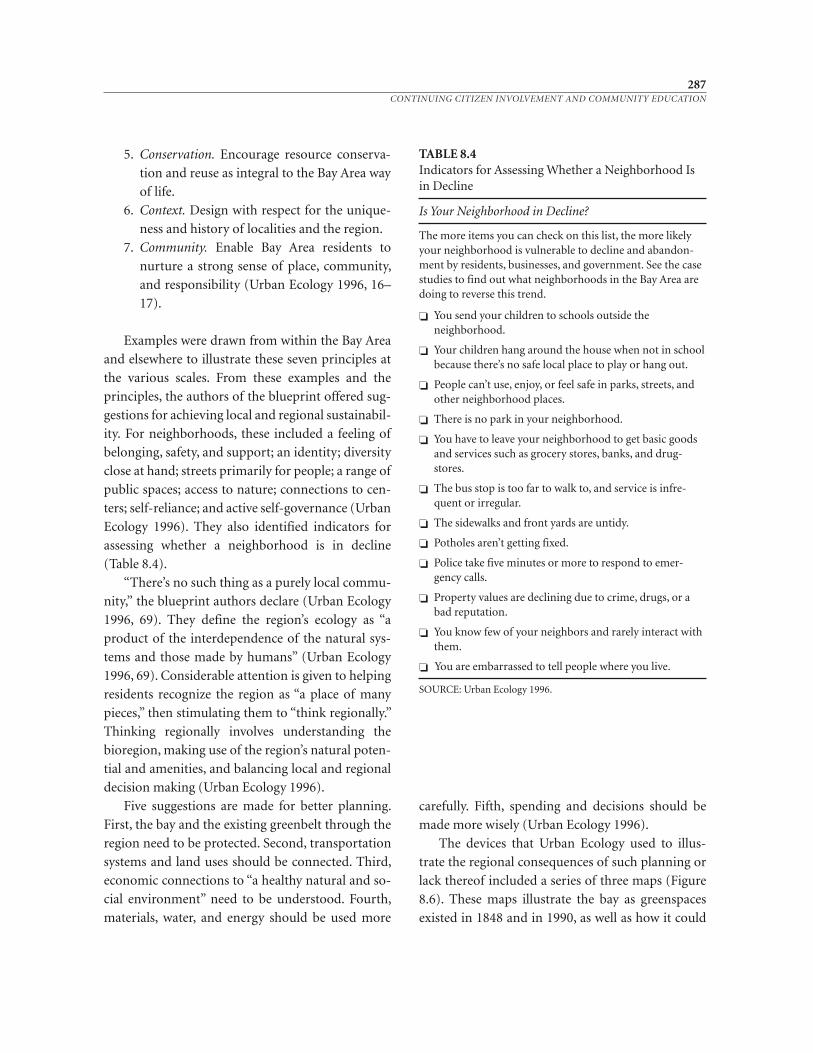
5. Conservation. Encourage resource conserva-
tion and reuse as integral to the Bay Area way
of life.
6. Context. Design with respect for the unique-
ness and history of localities and the region.
7. Community. Enable Bay Area residents to
nurture a strong sense of place, community,
and responsibility (Urban Ecology 1996, 16–
17).
Examples were drawn from within the Bay Area
and elsewhere to illustrate these seven principles at
the various scales. From these examples and the
principles, the authors of the blueprint offered sug-
gestions for achieving local and re gional sustainabil-
ity. For neighborhoods, these included a feeling of
belonging, safety, and support; an identity; diversity
close at hand; streets primarily for people; a range of
public spaces; access to nature; connections to cen-
ters; self- reliance; and active self- governance (Urban
Ecology 1996). They also identified indicators for
assessing whether a neighborhood is in decline
(Table 8.4).
“There’s no such thing as a purely local commu-
nity,” the blueprint authors declare (Urban Ecology
1996, 69). They define the region’s ecology as “a
product of the interdependence of the natural sys-
tems and those made by humans” (Urban Ecology
1996, 69). Considerable attention is given to helping
residents recognize the region as “a place of many
pieces,” then stimulating them to “think regionally.”
Thinking regionally involves understanding the
bioregion, making use of the region’s natural poten-
tial and amenities, and balancing local and regional
decision making (Urban Ecology 1996).
Five suggestions are made for better planning.
First, the bay and the existing greenbelt through the
region need to be protected. Second, transportation
systems and land uses should be connected. Third,
economic connections to “a healthy natural and so-
cial environment” need to be understood. Fourth,
materials, water, and energy should be used more
carefully. Fifth, spending and decisions should be
made more wisely (Urban Ecology 1996).
The devices that Urban Ecology used to illus-
trate the regional consequences of such planning or
lack thereof included a series of three maps (Figure
8.6). These maps illustrate the bay as greenspaces
existed in 1848 and in 1990, as well as how it could
287CONTINUING CITIZEN INVOLVEMENT AND COMMUNITY EDUCATION
TABLE 8.4Indicators for Assessing Whether a Neighborhood Isin Decline
Is Your Neighborhood in Decline?
The more items you can check on this list, the more likelyyour neighborhood is vulnerable to decline and abandon-ment by residents, businesses, and government. See the casestudies to find out what neighborhoods in the Bay Area aredoing to reverse this trend.
❏ You send your children to schools outside the neighborhood.
❏ Your children hang around the house when not in schoolbecause there’s no safe local place to play or hang out.
❏ People can’t use, enjoy, or feel safe in parks, streets, andother neighborhood places.
❏ There is no park in your neighborhood.
❏ You have to leave your neighborhood to get basic goodsand services such as grocery stores, banks, and drug-stores.
❏ The bus stop is too far to walk to, and service is infre-quent or irregular.
❏ The sidewalks and front yards are untidy.
❏ Potholes aren’t getting fixed.
❏ Police take five minutes or more to respond to emer-gency calls.
❏ Property values are declining due to crime, drugs, or abad reputation.
❏ You know few of your neighbors and rarely interact withthem.
❏ You are embarrassed to tell people where you live.
SOURCE: Urban Ecology 1996.
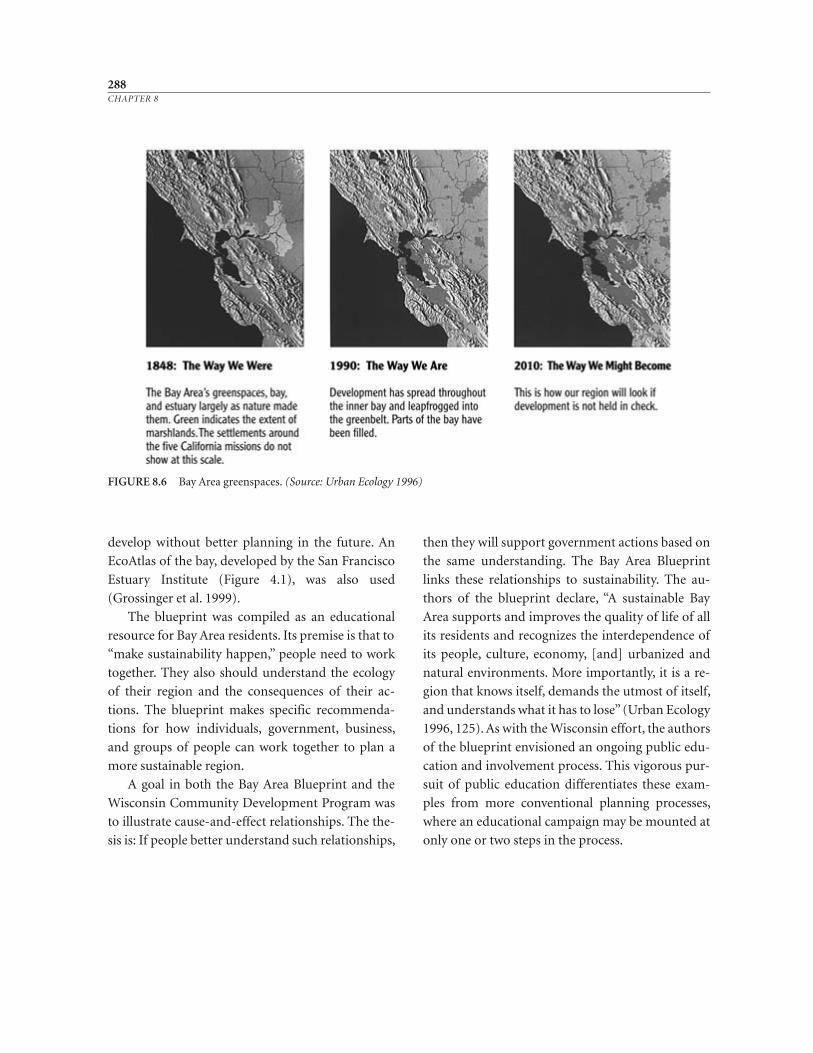
288CHAPTER 8
FIGURE 8.6 Bay Area greenspaces. (Source: Urban Ecology 1996)
develop without better planning in the future. An
EcoAtlas of the bay, developed by the San Francisco
Estuary Institute (Figure 4.1), was also used
(Grossinger et al. 1999).
The blueprint was compiled as an educational
resource for Bay Area residents. Its premise is that to
“make sustainability happen,” people need to work
together. They also should understand the ecology
of their region and the consequences of their ac-
tions. The blueprint makes specific recommenda-
tions for how individuals, government, business,
and groups of people can work together to plan a
more sustainable region.
A goal in both the Bay Area Blueprint and the
Wisconsin Community Development Program was
to illustrate cause- and- effect relationships. The the-
sis is: If people better understand such relationships,
then they will support government actions based on
the same understanding. The Bay Area Blueprint
links these relationships to sustainability. The au-
thors of the blueprint declare, “A sustainable Bay
Area supports and improves the quality of life of all
its residents and recognizes the interdependence of
its people, culture, economy, [and] urbanized and
natural environments. More importantly, it is a re-
gion that knows itself, demands the utmost of itself,
and understands what it has to lose” (Urban Ecology
1996, 125). As with the Wisconsin effort, the authors
of the blueprint envisioned an ongoing public edu-
cation and involvement process. This vigorous pur-
suit of public education differentiates these exam-
ples from more conventional planning processes,
where an educational campaign may be mounted at
only one or two steps in the process.


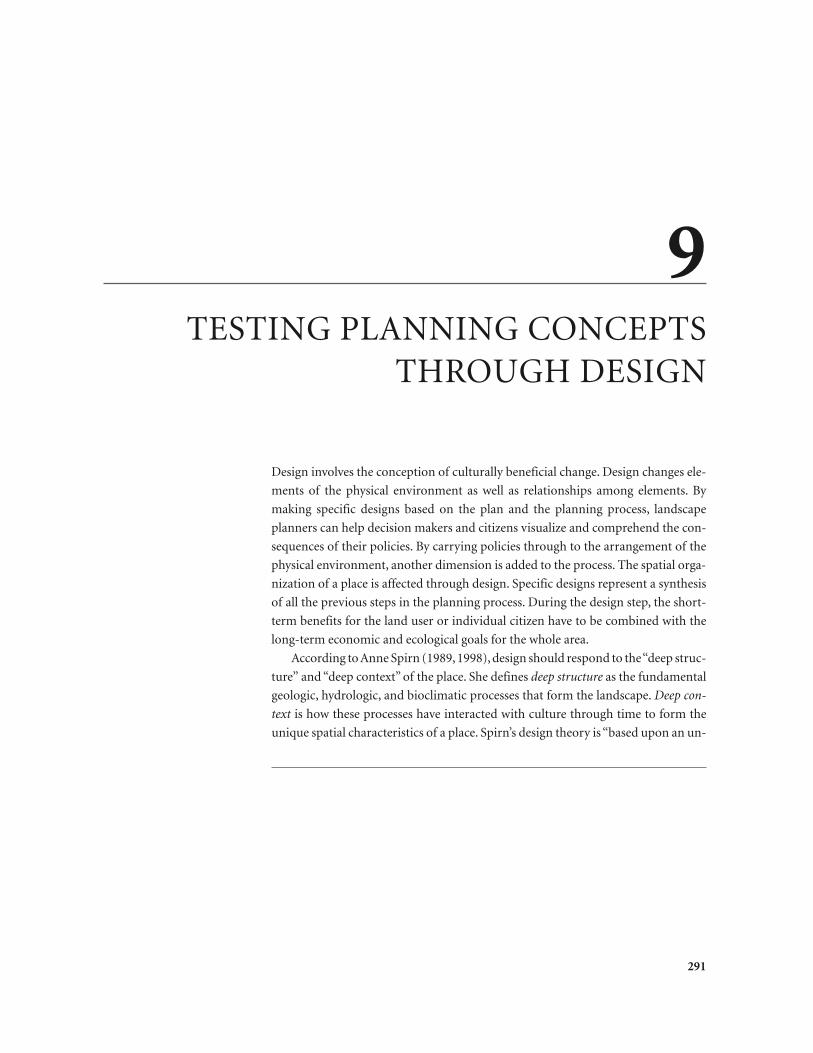
9TESTING PLANNING CONCEPTS
THROUGH DESIGN
291
Design involves the conception of culturally beneficial change. Design changes ele-
ments of the physical en vironment as well as relationships among elements. By
making specific designs based on the plan and the planning process, landscape
planners can help decision makers and citizens visualize and comprehend the con-
sequences of their policies. By carrying policies through to the arrangement of the
physical environment, another dimension is added to the process. The spatial orga-
nization of a place is affected through design. Specific designs represent a synthesis
of all the previous steps in the planning process. During the design step, the short-
term benefits for the land user or individual citizen have to be combined with the
long- term economic and ecological goals for the whole area.
According to Anne Spirn (1989, 1998), design should respond to the “deep struc-
ture” and “deep context” of the place. She defines deep structure as the fundamental
geologic, hydrologic, and bioclimatic processes that form the landscape. Deep con-
text is how these pro cesses have interacted with culture through time to form the
unique spatial characteristics of a place. Spirn’s design theory is “based upon an un-
derstanding of nature and culture as comprising inter-
woven processes that exhibit a complex, underlying or-
der that holds across vast scales of space and time”
(1988, 108). The purpose of making designs a part of
planning is to manifest an understanding of these fun-
damental processes and their capacity to accommodate
change as well as to illuminate the underlying order so
that it will be helpful in decision making. Design should
make the interrelationships between natural and cul-
tural processes and political choices less abstract. De-
sign should make visible “natural pro cesses and their
temporal cycles,” according to Spirn (1988, 108).
Designs may be presented in various formats. The
design may involve individual site or land- user plans
that form parts of the overall landscape plan. Examples
of such specific designs are the farm and ranch conser-
vation plans completed for individual land users by the
U.S. Natural Resources Conservation Service. A design
simulation may be done that compares the existing sit-
uation with various scenarios, such as one based on the
landscape plan and one with no action, or one based
on preservation versus another on development.
There may be specific designs for new facilities to illus-
trate the implications of plan implementation. Such
designs can be derived through charrettes or other
public participatory techniques, and they may be done
by landscape architects and architects. Demonstration
projects can be built as prototypes to exemplify the
consequences of the plan. Innovative design projects
can also influence public policy. Ideas about sustain-
able design and the new urbanism are especially rele-
vant to ecological planning. Two examples of specific
landscape design are presented here, one from the
Connecticut River Valley in Massachusetts, and the
other from the New York City region.
Site Design
Site design is concerned with the physical arrange-
ment of the built and natural elements of a specific
land parcel. A single house or group of houses, an
office park, a commercial shopping center, or a
combination of uses may be involved. Kevin Lynch
and Gary Hack define site planning as “the art of ar-
ranging structures on the land and shaping the
spacing between, an art linked to architecture, engi-
neering, landscape architecture and city planning”
(1984, 1). Site design may be viewed as the applica-
tion of the planning process to a specific parcel of
land. Kevin Lynch, who wrote the standard text on
the topic, identified the eight stages of site planning
proper:
1. Defining the problem
2. Programming and the analysis of site and
user
3. Schematic design and the preliminary cost es-
timate
4. Developed design and detailed costing
5. Contract documents
6. Bidding and contracting
7. Construction
8. Occupation and management (Lynch and
Hack 1984, 11)
Lynch recognized this process as a standard or-
ganizing tool but one that seldom occurs in a step-
by- step fashion. “Reciting these stages makes them
sound logical and linear, but the recital is only con-
ventional; the real process is looping and cyclical”
(Lynch and Hack 1984, 11). Design, according to
Lynch, is the “search for forms” that “deals with par-
ticular solutions” (Lynch and Hack 1984, 127).
Lynch and Hack observe that “site design deals with
three elements: the pattern of activity, the pattern of
circulation, and the pattern of sensible form that
supports them” (1984, 127).
The conventional Lynch site planning process
has many strengths, but design is not part of broader
planning concerns, except in its response to govern-
ment restrictions, nor is the site linked to its larger
context. Lynch wrote elsewhere about “the sense of
292CHAPTER 9
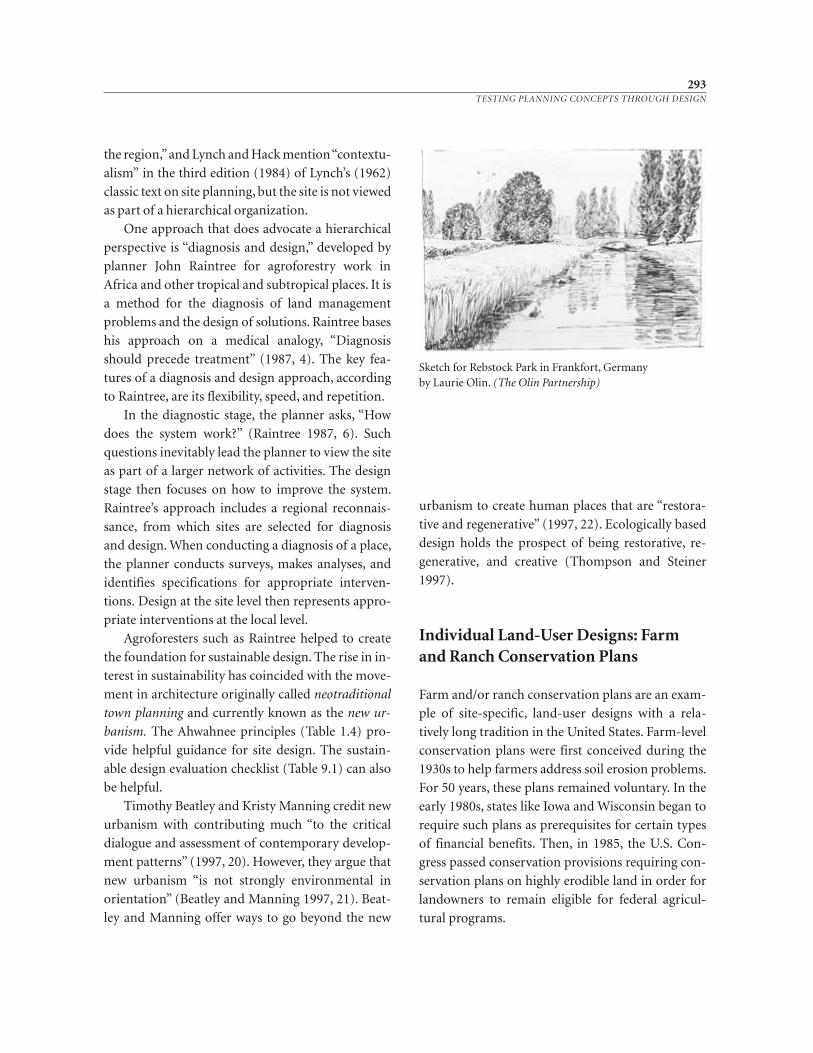
293TESTING PLANNING CONCEPTS THROUGH DESIGN
Sketch for Rebstock Park in Frankfort, Germany by Laurie Olin. (The Olin Partnership)
the region,” and Lynch and Hack mention “contextu-
alism” in the third edition (1984) of Lynch’s (1962)
classic text on site planning, but the site is not viewed
as part of a hierarchical organization.
One approach that does advocate a hierarchical
perspective is “diagnosis and design,” developed by
planner John Raintree for agroforestry work in
Africa and other tropical and subtropical places. It is
a method for the diagnosis of land management
problems and the design of solutions. Raintree bases
his approach on a medical analogy, “Diagnosis
should precede treatment” (1987, 4). The key fea-
tures of a diagnosis and design approach, according
to Raintree, are its flexibility, speed, and repetition.
In the diagnostic stage, the planner asks, “How
does the system work?” (Raintree 1987, 6). Such
questions inevitably lead the planner to view the site
as part of a larger network of activities. The design
stage then focuses on how to improve the system.
Raintree’s approach includes a regional reconnais-
sance, from which sites are selected for diagnosis
and design. When conducting a diag nosis of a place,
the planner conducts surveys, makes analyses, and
identifies specifications for appropriate interven-
tions. Design at the site level then represents appro-
priate interventions at the local level.
Agroforesters such as Raintree helped to create
the foundation for sustainable design. The rise in in-
terest in sustainability has coincided with the move-
ment in architecture originally called neotraditional
town planning and currently known as the new ur-
banism. The Ahwahnee principles (Table 1.4) pro-
vide helpful guidance for site design. The sustain-
able design evaluation checklist (Table 9.1) can also
be helpful.
Timothy Beatley and Kristy Manning credit new
urbanism with contributing much “to the critical
dialogue and assessment of contemporary develop-
ment patterns” (1997, 20). However, they argue that
new urbanism “is not strongly environmental in
orientation” (Beatley and Manning 1997, 21). Beat-
ley and Manning offer ways to go beyond the new
urbanism to create human places that are “restora-
tive and regenerative” (1997, 22). Ecologically based
design holds the prospect of being restorative, re-
generative, and creative (Thompson and Steiner
1997).
Individual Land- User Designs: Farmand Ranch Conservation Plans
Farm and/or ranch conservation plans are an exam-
ple of site- specific, land- user designs with a rela-
tively long tradition in the United States. Farm- level
conservation plans were first conceived during the
1930s to help farmers address soil erosion problems.
For 50 years, these plans remained voluntary. In the
early 1980s, states like Iowa and Wisconsin began to
require such plans as prerequisites for certain types
of financial benefits. Then, in 1985, the U.S. Con-
gress passed conservation provisions requiring con-
servation plans on highly erodible land in order for
land owners to remain eligible for federal agricul-
tural programs.
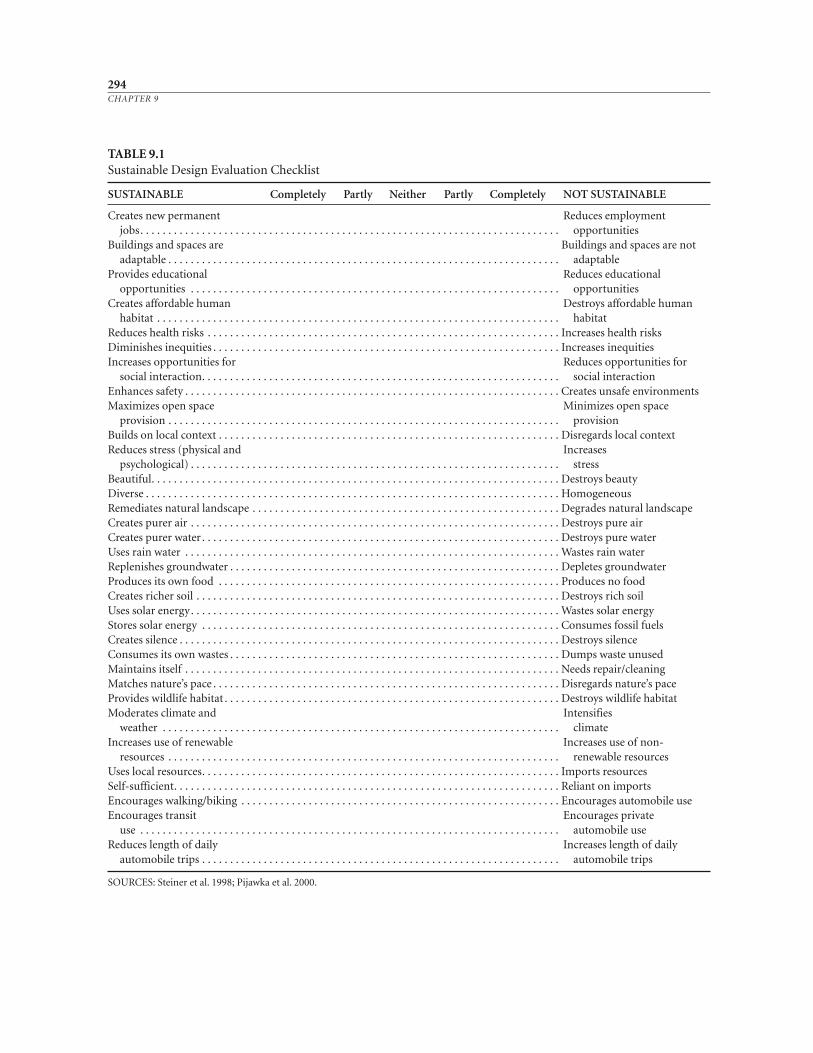
294CHAPTER 9
TABLE 9.1Sustainable Design Evaluation Checklist
SUSTAINABLE Completely Partly Neither Partly Completely NOT SUSTAINABLE
Creates new permanent Reduces employmentjobs. . . . . . . . . . . . . . . . . . . . . . . . . . . . . . . . . . . . . . . . . . . . . . . . . . . . . . . . . . . . . . . . . . . . . . . . . . . opportunities
Buildings and spaces are Buildings and spaces are notadaptable . . . . . . . . . . . . . . . . . . . . . . . . . . . . . . . . . . . . . . . . . . . . . . . . . . . . . . . . . . . . . . . . . . . . . . adaptable
Provides educational Reduces educationalopportunities . . . . . . . . . . . . . . . . . . . . . . . . . . . . . . . . . . . . . . . . . . . . . . . . . . . . . . . . . . . . . . . . . . opportunities
Creates affordable human Destroys affordable humanhabitat . . . . . . . . . . . . . . . . . . . . . . . . . . . . . . . . . . . . . . . . . . . . . . . . . . . . . . . . . . . . . . . . . . . . . . . . habitat
Reduces health risks . . . . . . . . . . . . . . . . . . . . . . . . . . . . . . . . . . . . . . . . . . . . . . . . . . . . . . . . . . . . . . . Increases health risksDiminishes inequities . . . . . . . . . . . . . . . . . . . . . . . . . . . . . . . . . . . . . . . . . . . . . . . . . . . . . . . . . . . . . . Increases inequitiesIncreases opportunities for Reduces opportunities for
social interaction. . . . . . . . . . . . . . . . . . . . . . . . . . . . . . . . . . . . . . . . . . . . . . . . . . . . . . . . . . . . . . . . social interactionEnhances safety . . . . . . . . . . . . . . . . . . . . . . . . . . . . . . . . . . . . . . . . . . . . . . . . . . . . . . . . . . . . . . . . . . . Creates unsafe environmentsMaximizes open space Minimizes open space
provision . . . . . . . . . . . . . . . . . . . . . . . . . . . . . . . . . . . . . . . . . . . . . . . . . . . . . . . . . . . . . . . . . . . . . . provisionBuilds on local context . . . . . . . . . . . . . . . . . . . . . . . . . . . . . . . . . . . . . . . . . . . . . . . . . . . . . . . . . . . . . Disregards local contextReduces stress (physical and Increases
psychological) . . . . . . . . . . . . . . . . . . . . . . . . . . . . . . . . . . . . . . . . . . . . . . . . . . . . . . . . . . . . . . . . . . stressBeautiful. . . . . . . . . . . . . . . . . . . . . . . . . . . . . . . . . . . . . . . . . . . . . . . . . . . . . . . . . . . . . . . . . . . . . . . . . Destroys beautyDiverse . . . . . . . . . . . . . . . . . . . . . . . . . . . . . . . . . . . . . . . . . . . . . . . . . . . . . . . . . . . . . . . . . . . . . . . . . . HomogeneousRemediates natural landscape . . . . . . . . . . . . . . . . . . . . . . . . . . . . . . . . . . . . . . . . . . . . . . . . . . . . . . . Degrades natural landscapeCreates purer air . . . . . . . . . . . . . . . . . . . . . . . . . . . . . . . . . . . . . . . . . . . . . . . . . . . . . . . . . . . . . . . . . . Destroys pure airCreates purer water . . . . . . . . . . . . . . . . . . . . . . . . . . . . . . . . . . . . . . . . . . . . . . . . . . . . . . . . . . . . . . . . Destroys pure waterUses rain water . . . . . . . . . . . . . . . . . . . . . . . . . . . . . . . . . . . . . . . . . . . . . . . . . . . . . . . . . . . . . . . . . . . Wastes rain waterReplenishes groundwater . . . . . . . . . . . . . . . . . . . . . . . . . . . . . . . . . . . . . . . . . . . . . . . . . . . . . . . . . . . Depletes groundwaterProduces its own food . . . . . . . . . . . . . . . . . . . . . . . . . . . . . . . . . . . . . . . . . . . . . . . . . . . . . . . . . . . . . Produces no foodCreates richer soil . . . . . . . . . . . . . . . . . . . . . . . . . . . . . . . . . . . . . . . . . . . . . . . . . . . . . . . . . . . . . . . . . Destroys rich soilUses solar energy. . . . . . . . . . . . . . . . . . . . . . . . . . . . . . . . . . . . . . . . . . . . . . . . . . . . . . . . . . . . . . . . . . Wastes solar energyStores solar energy . . . . . . . . . . . . . . . . . . . . . . . . . . . . . . . . . . . . . . . . . . . . . . . . . . . . . . . . . . . . . . . . Consumes fossil fuelsCreates silence . . . . . . . . . . . . . . . . . . . . . . . . . . . . . . . . . . . . . . . . . . . . . . . . . . . . . . . . . . . . . . . . . . . . Destroys silenceConsumes its own wastes . . . . . . . . . . . . . . . . . . . . . . . . . . . . . . . . . . . . . . . . . . . . . . . . . . . . . . . . . . . Dumps waste unusedMaintains itself . . . . . . . . . . . . . . . . . . . . . . . . . . . . . . . . . . . . . . . . . . . . . . . . . . . . . . . . . . . . . . . . . . . Needs repair/cleaningMatches nature’s pace . . . . . . . . . . . . . . . . . . . . . . . . . . . . . . . . . . . . . . . . . . . . . . . . . . . . . . . . . . . . . . Disregards nature’s paceProvides wildlife habitat . . . . . . . . . . . . . . . . . . . . . . . . . . . . . . . . . . . . . . . . . . . . . . . . . . . . . . . . . . . . Destroys wildlife habitatModerates climate and Intensifies
weather . . . . . . . . . . . . . . . . . . . . . . . . . . . . . . . . . . . . . . . . . . . . . . . . . . . . . . . . . . . . . . . . . . . . . . . climateIncreases use of renewable Increases use of non-
resources . . . . . . . . . . . . . . . . . . . . . . . . . . . . . . . . . . . . . . . . . . . . . . . . . . . . . . . . . . . . . . . . . . . . . . renewable resourcesUses local resources. . . . . . . . . . . . . . . . . . . . . . . . . . . . . . . . . . . . . . . . . . . . . . . . . . . . . . . . . . . . . . . . Imports resourcesSelf- sufficient. . . . . . . . . . . . . . . . . . . . . . . . . . . . . . . . . . . . . . . . . . . . . . . . . . . . . . . . . . . . . . . . . . . . . Reliant on importsEncourages walking/biking . . . . . . . . . . . . . . . . . . . . . . . . . . . . . . . . . . . . . . . . . . . . . . . . . . . . . . . . . Encourages automobile useEncourages transit Encourages private
use . . . . . . . . . . . . . . . . . . . . . . . . . . . . . . . . . . . . . . . . . . . . . . . . . . . . . . . . . . . . . . . . . . . . . . . . . . . automobile useReduces length of daily Increases length of daily
automobile trips . . . . . . . . . . . . . . . . . . . . . . . . . . . . . . . . . . . . . . . . . . . . . . . . . . . . . . . . . . . . . . . . automobile trips
SOURCES: Steiner et al. 1998; Pijawka et al. 2000.
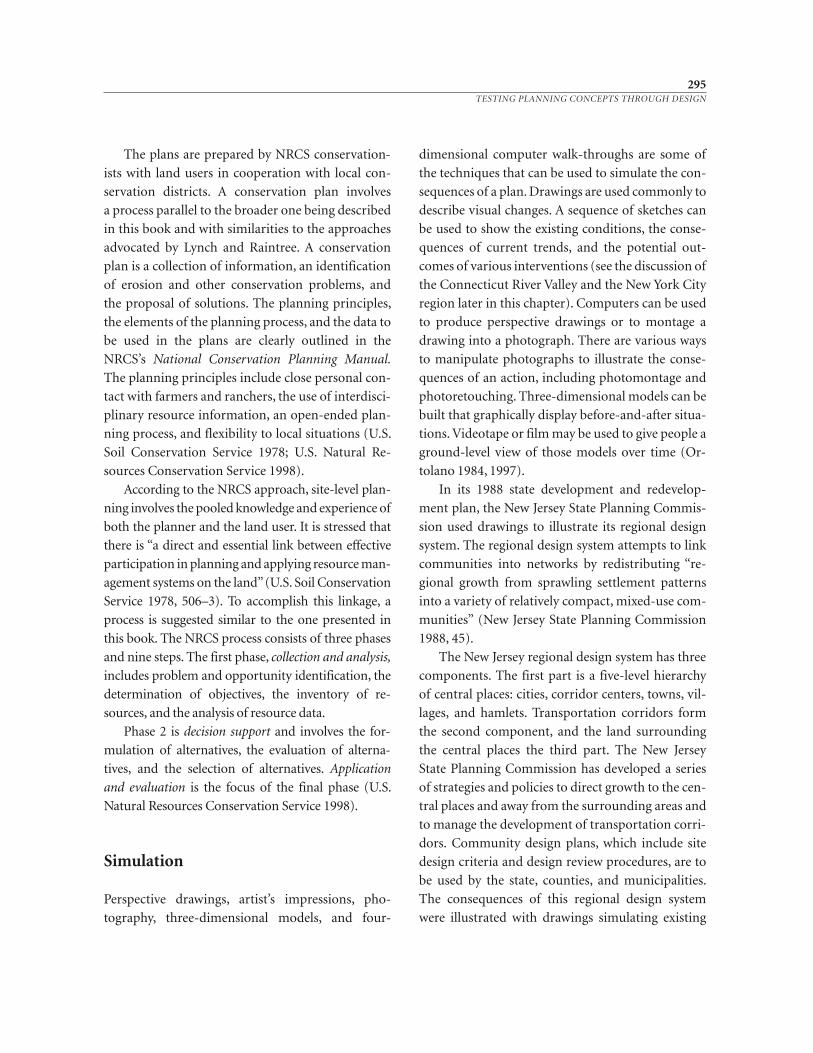
The plans are prepared by NRCS conservation-
ists with land users in cooperation with local con-
servation districts. A conservation plan involves
a process parallel to the broader one being described
in this book and with similarities to the approaches
advocated by Lynch and Raintree. A conservation
plan is a collection of information, an identification
of erosion and other conservation problems, and
the proposal of solutions. The planning principles,
the elements of the planning process, and the data to
be used in the plans are clearly outlined in the
NRCS’s National Conservation Planning Manual.
The planning principles include close personal con-
tact with farmers and ranchers, the use of interdisci-
plinary resource information, an open- ended plan-
ning process, and flexibility to local situations (U.S.
Soil Conservation Service 1978; U.S. Natural Re-
sources Conservation Service 1998).
According to the NRCS approach, site- level plan-
ning involves the pooled knowledge and experience of
both the planner and the land user. It is stressed that
there is “a direct and essential link between effective
participation in planning and applying resource man-
agement systems on the land” (U.S. Soil Conservation
Service 1978, 506–3). To accomplish this linkage, a
process is suggested similar to the one presented in
this book. The NRCS process consists of three phases
and nine steps. The first phase, collection and analysis,
includes problem and opportunity identification, the
determination of objectives, the inventory of re-
sources, and the analysis of resource data.
Phase 2 is decision support and involves the for-
mulation of alternatives, the evaluation of alterna-
tives, and the selection of alternatives. Application
and evaluation is the focus of the final phase (U.S.
Natural Resources Conservation Service 1998).
Simulation
Perspective drawings, artist’s impressions, pho-
tography, three- dimensional models, and four-
dimensional computer walk- throughs are some of
the techniques that can be used to simulate the con-
sequences of a plan. Drawings are used commonly to
describe visual changes. A sequence of sketches can
be used to show the existing conditions, the conse-
quences of current trends, and the potential out-
comes of various interventions (see the discussion of
the Connecticut River Valley and the New York City
region later in this chapter). Computers can be used
to produce perspective drawings or to montage a
drawing into a photograph. There are various ways
to manipulate photographs to illustrate the conse-
quences of an action, including photomontage and
photo retouching. Three- dimensional models can be
built that graphically display before- and- after situa-
tions. Videotape or film may be used to give people a
ground- level view of those models over time (Or-
tolano 1984, 1997).
In its 1988 state development and redevelop-
ment plan, the New Jersey State Planning Commis-
sion used drawings to illustrate its regional design
system. The regional design system attempts to link
communities into networks by redistributing “re-
gional growth from sprawling settlement patterns
into a variety of relatively compact, mixed- use com-
munities” (New Jersey State Planning Commission
1988, 45).
The New Jersey regional design system has three
components. The first part is a five- level hierarchy
of central places: cities, corridor centers, towns, vil-
lages, and hamlets. Transportation corridors form
the second component, and the land surrounding
the central places the third part. The New Jersey
State Planning Commission has developed a series
of strategies and policies to direct growth to the cen-
tral places and away from the surrounding areas and
to manage the development of transportation corri-
dors. Community design plans, which include site
design criteria and design review procedures, are to
be used by the state, counties, and municipalities.
The con sequences of this regional design system
were illustrated with drawings simulating existing
295TESTING PLANNING CONCEPTS THROUGH DESIGN
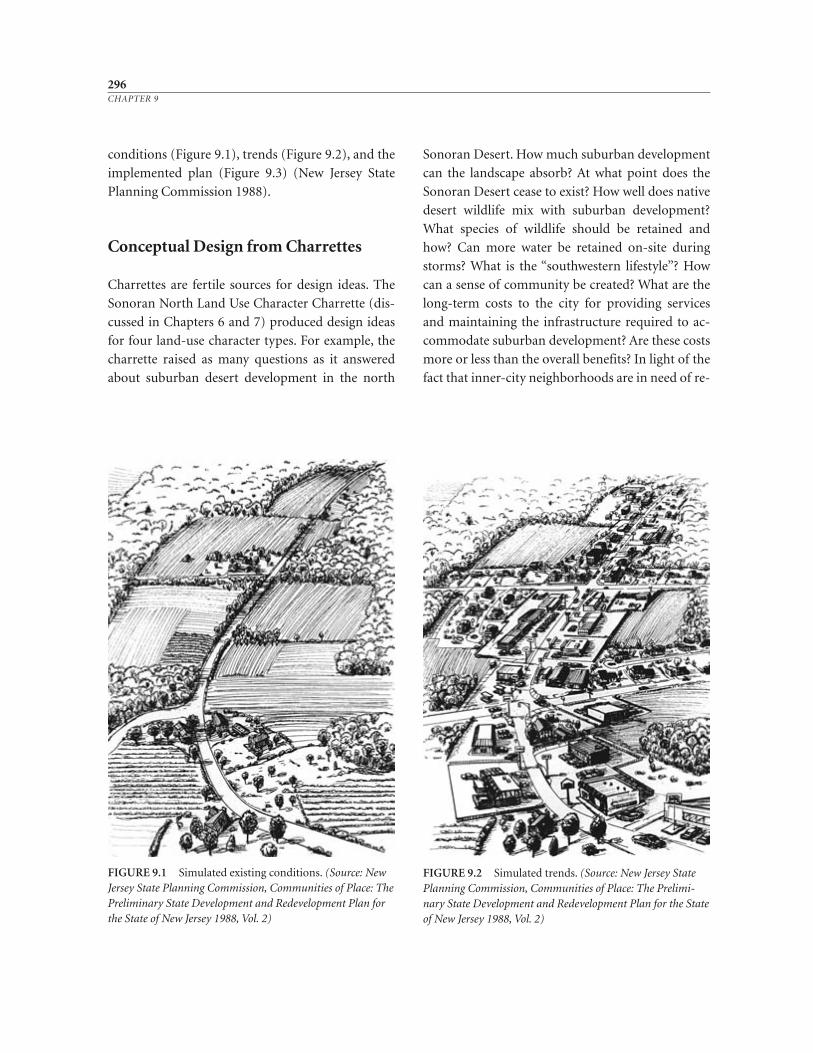
conditions (Figure 9.1), trends (Figure 9.2), and the
implemented plan (Figure 9.3) (New Jersey State
Planning Commission 1988).
Conceptual Design from Charrettes
Charrettes are fertile sources for design ideas. The
Sonoran North Land Use Character Charrette (dis-
cussed in Chapters 6 and 7) produced design ideas
for four land- use character types. For example, the
charrette raised as many questions as it answered
about suburban desert development in the north
Sonoran Desert. How much suburban development
can the landscape absorb? At what point does the
Sonoran Desert cease to exist? How well does native
desert wildlife mix with suburban development?
What species of wildlife should be retained and
how? Can more water be retained on- site during
storms? What is the “southwestern lifestyle”? How
can a sense of community be created? What are the
long- term costs to the city for providing services
and maintaining the infrastructure required to ac-
commodate suburban development? Are these costs
more or less than the overall benefits? In light of the
fact that inner-city neighborhoods are in need of re-
296CHAPTER 9
FIGURE 9.1 Simulated existing conditions. (Source: NewJersey State Planning Commission, Communities of Place: ThePreliminary State Development and Redevelopment Plan forthe State of New Jersey 1988, Vol. 2)
FIGURE 9.2 Simulated trends. (Source: New Jersey StatePlanning Commission, Communities of Place: The Prelimi-nary State Development and Redevelopment Plan for the Stateof New Jersey 1988, Vol. 2)
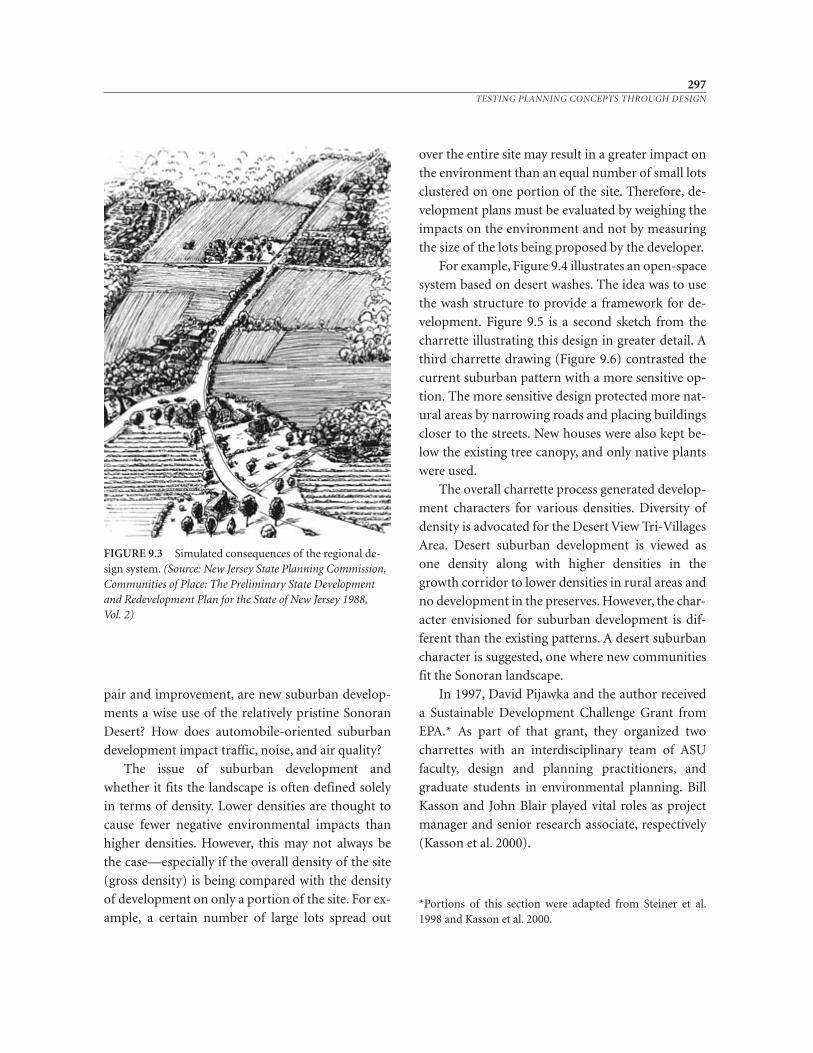
pair and improvement, are new suburban develop-
ments a wise use of the relatively pristine Sonoran
Desert? How does automobile- oriented suburban
development impact traffic, noise, and air quality?
The issue of suburban development and
whether it fits the landscape is often defined solely
in terms of density. Lower densities are thought to
cause fewer negative environmental impacts than
higher densities. However, this may not always be
the case—especially if the overall density of the site
(gross density) is being compared with the density
of development on only a portion of the site. For ex-
ample, a certain number of large lots spread out
over the entire site may result in a greater impact on
the environment than an equal number of small lots
clustered on one portion of the site. Therefore, de-
velopment plans must be evaluated by weighing the
impacts on the environment and not by measuring
the size of the lots being proposed by the developer.
For example, Figure 9.4 illustrates an open-space
system based on desert washes. The idea was to use
the wash structure to provide a framework for de-
velopment. Figure 9.5 is a second sketch from the
charrette illustrating this design in greater detail. A
third charrette drawing (Figure 9.6) contrasted the
current suburban pattern with a more sensitive op-
tion. The more sensitive design protected more nat-
ural areas by narrowing roads and placing buildings
closer to the streets. New houses were also kept be-
low the existing tree canopy, and only native plants
were used.
The overall charrette process generated develop-
ment characters for various densities. Diversity of
density is advocated for the Desert View Tri- Villages
Area. Desert suburban development is viewed as
one density along with higher densities in the
growth corridor to lower densities in rural areas and
no development in the preserves. However, the char-
acter envisioned for suburban development is dif-
ferent than the existing patterns. A desert suburban
character is suggested, one where new communities
fit the Sonoran landscape.
In 1997, David Pijawka and the author received
a Sustainable Development Challenge Grant from
EPA.* As part of that grant, they organized two
charrettes with an interdisciplinary team of ASU
faculty, design and planning practitioners, and
graduate students in environmental planning. Bill
Kasson and John Blair played vital roles as project
manager and senior research associate, respectively
(Kasson et al. 2000).
297TESTING PLANNING CONCEPTS THROUGH DESIGN
FIGURE 9.3 Simulated consequences of the regional de-sign system. (Source: New Jersey State Planning Commission,Communities of Place: The Preliminary State Developmentand Redevelopment Plan for the State of New Jersey 1988, Vol. 2)
*Portions of this section were adapted from Steiner et al.1998 and Kasson et al. 2000.
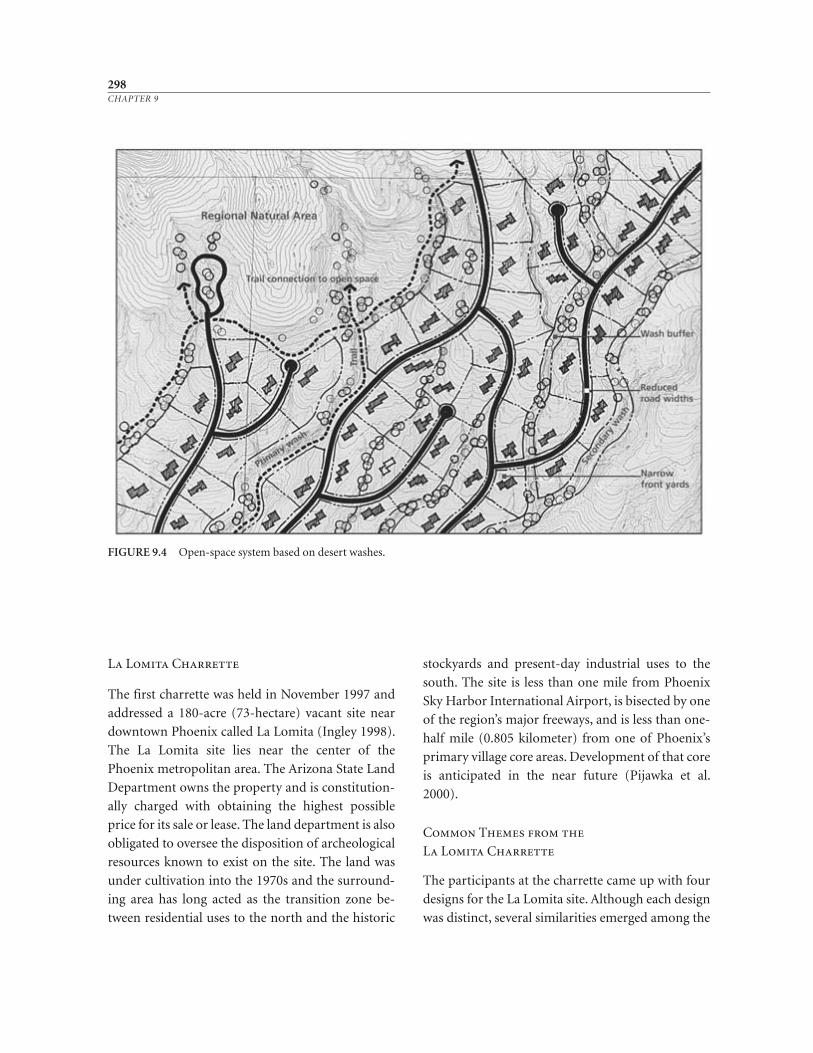
La Lomita Charrette
The first charrette was held in November 1997 and
addressed a 180- acre (73- hectare) vacant site near
downtown Phoenix called La Lomita (Ingley 1998).
The La Lomita site lies near the center of the
Phoenix metropolitan area. The Arizona State Land
Department owns the property and is constitution-
ally charged with obtaining the highest possible
price for its sale or lease. The land department is also
obligated to oversee the disposition of archeological
resources known to exist on the site. The land was
under cultivation into the 1970s and the surround-
ing area has long acted as the transition zone be-
tween residential uses to the north and the historic
stockyards and present- day industrial uses to the
south. The site is less than one mile from Phoenix
Sky Harbor International Airport, is bisected by one
of the region’s major freeways, and is less than one-
half mile (0.805 kilometer) from one of Phoenix’s
primary village core areas. Development of that core
is anticipated in the near future (Pijawka et al.
2000).
Common Themes from the
La Lomita Charrette
The participants at the charrette came up with four
designs for the La Lomita site. Although each design
was distinct, several similarities emerged among the
298CHAPTER 9
FIGURE 9.4 Open- space system based on desert washes.
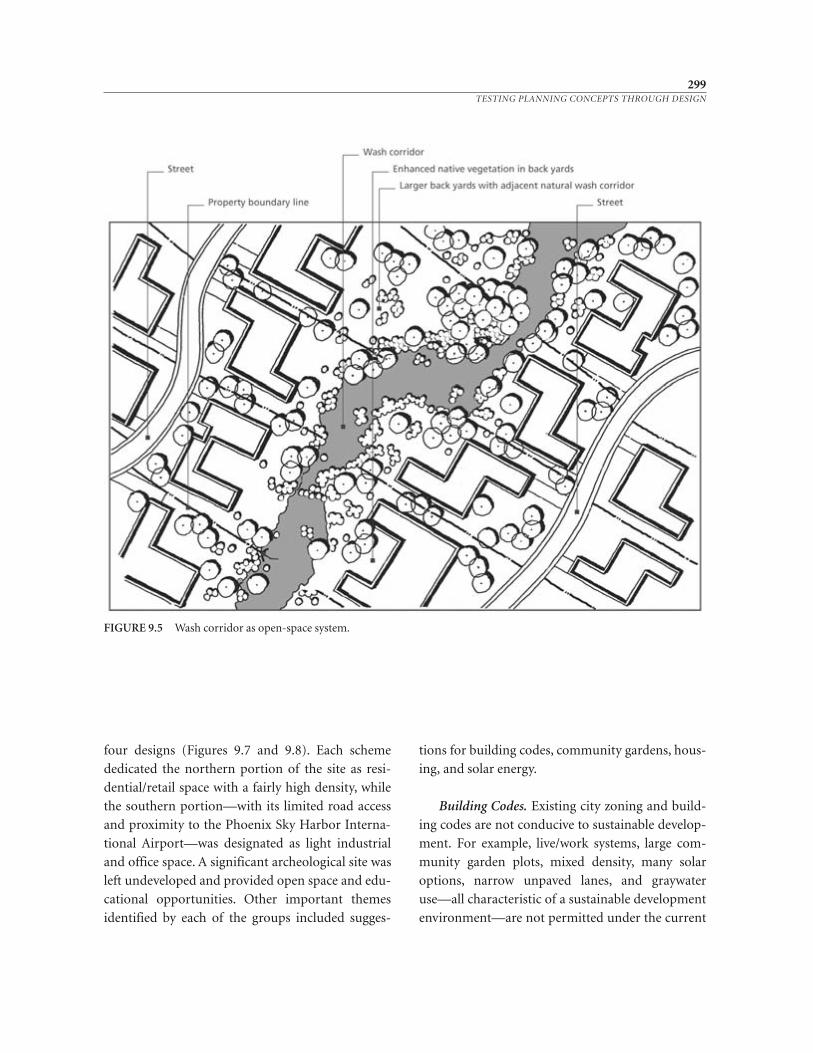
four designs (Figures 9.7 and 9.8). Each scheme
dedicated the northern portion of the site as resi-
dential/retail space with a fairly high density, while
the southern portion—with its limited road access
and proximity to the Phoenix Sky Harbor Interna-
tional Airport—was designated as light industrial
and office space. A significant archeological site was
left undeveloped and provided open space and edu-
cational opportunities. Other important themes
identified by each of the groups included sugges-
tions for building codes, community gardens, hous-
ing, and solar energy.
Building Codes. Existing city zoning and build-
ing codes are not conducive to sustainable develop-
ment. For example, live/work systems, large com-
munity garden plots, mixed density, many solar
options, narrow unpaved lanes, and graywater
use—all characteristic of a sustainable development
environment—are not permitted under the current
299TESTING PLANNING CONCEPTS THROUGH DESIGN
FIGURE 9.5 Wash corridor as open- space system.
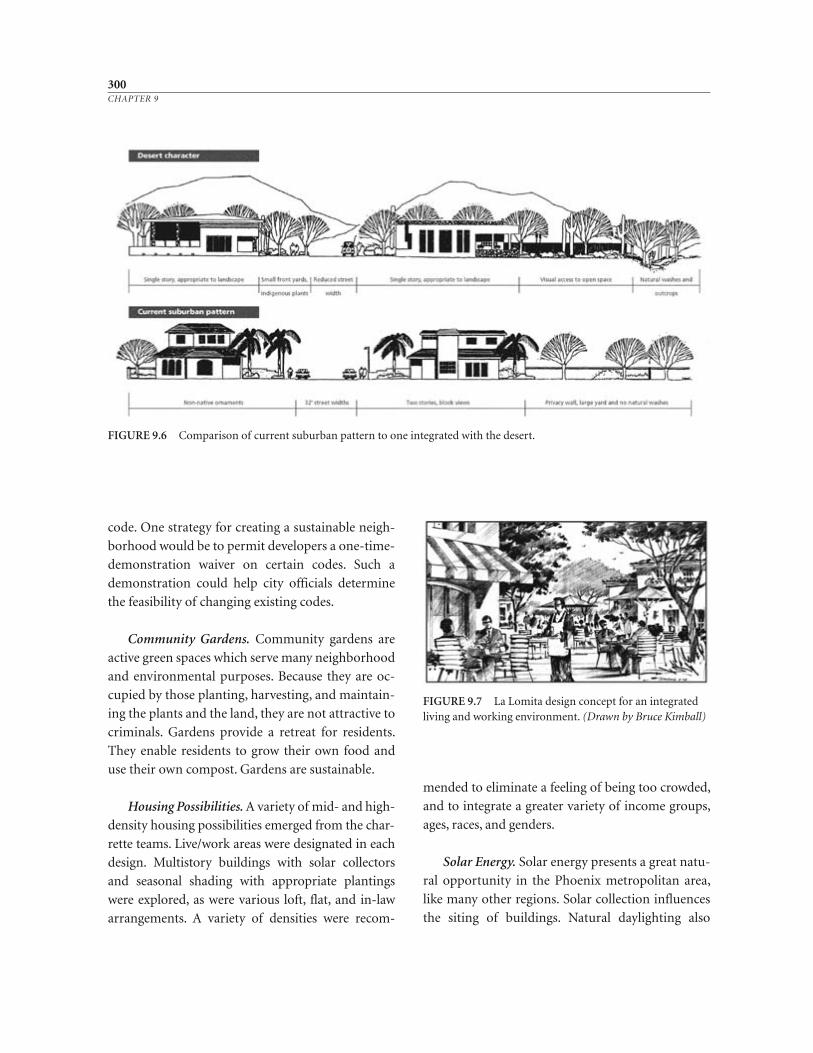
code. One strategy for creating a sustainable neigh-
borhood would be to permit developers a one- time-
demonstration waiver on certain codes. Such a
demonstration could help city officials determine
the feasibility of changing existing codes.
Community Gardens. Community gardens are
active green spaces which serve many neighborhood
and environmental purposes. Because they are oc-
cupied by those planting, harvesting, and maintain-
ing the plants and the land, they are not attractive to
criminals. Gardens provide a retreat for residents.
They enable residents to grow their own food and
use their own compost. Gardens are sustainable.
Housing Possibilities. A variety of mid- and high-
density housing possibilities emerged from the char-
rette teams. Live/work areas were designated in each
design. Multistory buildings with solar collectors
and seasonal shading with appropriate plantings
were explored, as were various loft, flat, and in- law
arrangements. A variety of densities were recom-
mended to eliminate a feeling of being too crowded,
and to integrate a greater variety of income groups,
ages, races, and genders.
Solar Energy. Solar energy presents a great natu-
ral opportunity in the Phoenix metropolitan area,
like many other regions. Solar collection influences
the siting of buildings. Natural daylighting also
300CHAPTER 9
FIGURE 9.6 Comparison of current suburban pattern to one integrated with the desert.
FIGURE 9.7 La Lomita design concept for an integratedliving and working environment. (Drawn by Bruce Kimball)
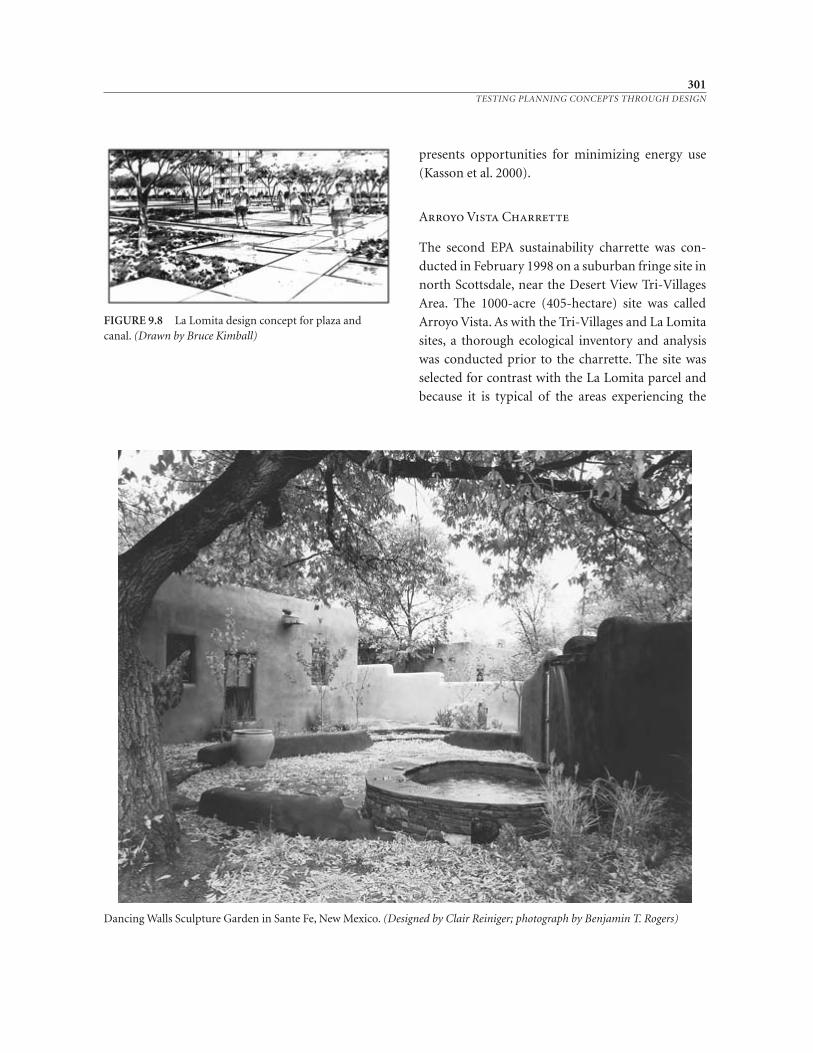
presents opportunities for minimizing energy use
(Kasson et al. 2000).
Arroyo Vista Charrette
The second EPA sustainability charrette was con-
ducted in February 1998 on a suburban fringe site in
north Scottsdale, near the Desert View Tri- Villages
Area. The 1000- acre (405- hectare) site was called
Arroyo Vista. As with the Tri- Villages and La Lomita
sites, a thorough ecological inventory and analysis
was conducted prior to the charrette. The site was
selected for contrast with the La Lomita parcel and
because it is typical of the areas experiencing the
301TESTING PLANNING CONCEPTS THROUGH DESIGN
Dancing Walls Sculpture Garden in Sante Fe, New Mexico. (Designed by Clair Reiniger; photo graph by Benjamin T. Rogers)
FIGURE 9.8 La Lomita design concept for plaza andcanal. (Drawn by Bruce Kimball)
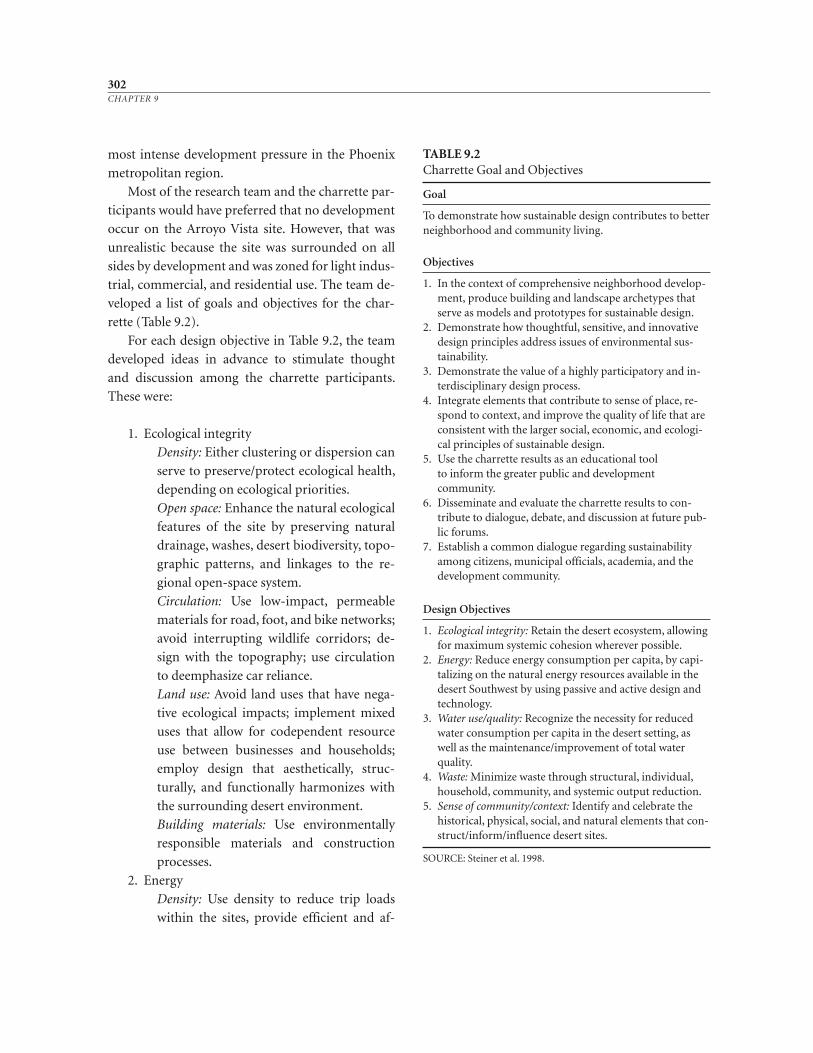
most intense development pressure in the Phoenix
metropolitan region.
Most of the research team and the charrette par-
ticipants would have preferred that no development
occur on the Arroyo Vista site. However, that was
unrealistic because the site was surrounded on all
sides by development and was zoned for light indus-
trial, commercial, and residential use. The team de-
veloped a list of goals and objectives for the char-
rette (Table 9.2).
For each design objective in Table 9.2, the team
developed ideas in advance to stimulate thought
and discussion among the charrette participants.
These were:
1. Ecological integrity
Density: Either clustering or dispersion can
serve to preserve/protect ecological health,
depending on ecological priorities.
Open space: Enhance the natural ecological
features of the site by preserving natural
drainage, washes, desert biodiversity, topo-
graphic patterns, and linkages to the re-
gional open-space system.
Circulation: Use low-impact, permeable
materials for road, foot, and bike networks;
avoid interrupting wildlife corridors; de-
sign with the topography; use circulation
to deemphasize car reliance.
Land use: Avoid land uses that have nega-
tive ecological impacts; implement mixed
uses that allow for codependent resource
use between businesses and households;
employ design that aesthetically, struc-
turally, and functionally harmonizes with
the surrounding desert environment.
Building materials: Use environmentally
responsible materials and construction
processes.
2. Energy
Density: Use density to reduce trip loads
within the sites, provide efficient and af-
302CHAPTER 9
TABLE 9.2Charrette Goal and Objectives
Goal
To demonstrate how sustainable design contributes to betterneighborhood and community living.
Objectives
1. In the context of comprehensive neighborhood develop-ment, produce building and landscape archetypes thatserve as models and prototypes for sustainable design.
2. Demonstrate how thoughtful, sensitive, and innovativedesign principles address issues of environmental sus-tainability.
3. Demonstrate the value of a highly participatory and in-terdisciplinary design process.
4. Integrate elements that contribute to sense of place, re-spond to context, and improve the quality of life that areconsistent with the larger social, economic, and ecologi-cal principles of sustainable design.
5. Use the charrette results as an educational tool to inform the greater public and development community.
6. Disseminate and evaluate the charrette results to con-tribute to dialogue, debate, and discussion at future pub-lic forums.
7. Establish a common dialogue regarding sustainabilityamong citizens, municipal officials, academia, and thedevelopment community.
Design Objectives
1. Ecological integrity: Retain the desert ecosystem, allowingfor maximum systemic cohesion wherever possible.
2. Energy: Reduce energy consumption per capita, by capi-talizing on the natural energy resources available in thedesert Southwest by using passive and active design andtechnology.
3. Water use/quality: Recognize the necessity for reducedwater consumption per capita in the desert setting, aswell as the maintenance/improvement of total waterquality.
4. Waste: Minimize waste through structural, individual,household, community, and systemic output reduction.
5. Sense of community/context: Identify and celebrate thehistorical, physical, social, and natural elements that con-struct/inform/influence desert sites.
SOURCE: Steiner et al. 1998.
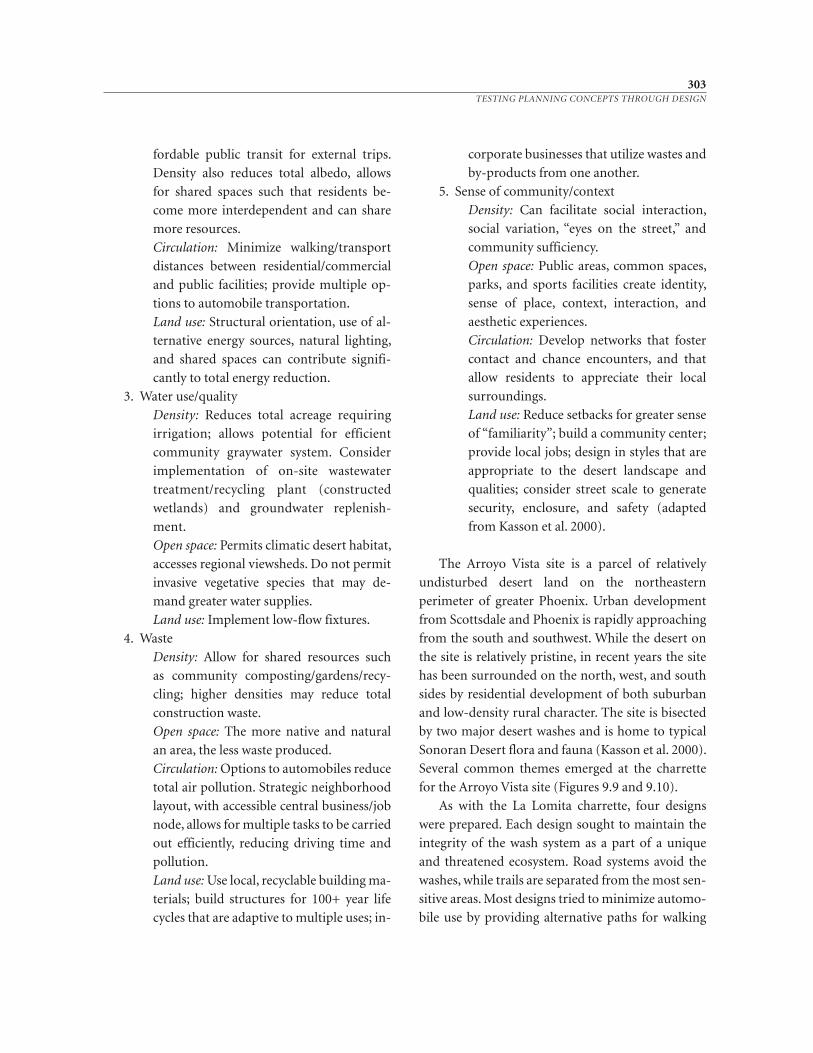
fordable public transit for external trips.
Density also reduces total albedo, allows
for shared spaces such that residents be-
come more interdependent and can share
more resources.
Circulation: Minimize walking/transport
distances between residential/commercial
and public facilities; provide multiple op-
tions to automobile transportation.
Land use: Structural orientation, use of al-
ternative energy sources, natural lighting,
and shared spaces can contribute signifi-
cantly to total energy reduction.
3. Water use/quality
Density: Reduces total acreage requiring
irrigation; allows potential for efficient
community graywater system. Consider
implementation of on- site wastewater
treatment/recycling plant (constructed
wetlands) and groundwater replenish-
ment.
Open space: Permits climatic desert habitat,
accesses regional viewsheds. Do not permit
invasive vegetative species that may de-
mand greater water supplies.
Land use: Implement low- flow fixtures.
4. Waste
Density: Allow for shared resources such
as community composting/gardens/recy-
cling; higher densities may reduce total
construction waste.
Open space: The more native and natural
an area, the less waste produced.
Circulation: Options to automobiles reduce
total air pollution. Strategic neighborhood
layout, with accessible central business/job
node, allows for multiple tasks to be carried
out efficiently, reducing driving time and
pollution.
Land use: Use local, recyclable building ma-
terials; build structures for 100+ year life
cycles that are adaptive to multiple uses; in-
corporate businesses that utilize wastes and
by-products from one another.
5. Sense of community/context
Density: Can facilitate social interaction,
social variation, “eyes on the street,” and
community sufficiency.
Open space: Public areas, common spaces,
parks, and sports facilities create identity,
sense of place, context, interaction, and
aesthetic experiences.
Circulation: Develop networks that foster
contact and chance encounters, and that
allow residents to appreciate their local
surroundings.
Land use: Reduce setbacks for greater sense
of “familiarity”; build a community center;
provide local jobs; design in styles that are
appropriate to the desert landscape and
qualities; consider street scale to generate
security, enclosure, and safety (adapted
from Kasson et al. 2000).
The Arroyo Vista site is a parcel of relatively
undisturbed desert land on the northeastern
perimeter of greater Phoenix. Urban development
from Scottsdale and Phoenix is rapidly approaching
from the south and southwest. While the desert on
the site is relatively pristine, in recent years the site
has been surrounded on the north, west, and south
sides by residential development of both suburban
and low- density rural character. The site is bisected
by two major desert washes and is home to typical
Sonoran Desert flora and fauna (Kasson et al. 2000).
Several common themes emerged at the charrette
for the Arroyo Vista site (Figures 9.9 and 9.10).
As with the La Lomita charrette, four designs
were prepared. Each design sought to maintain the
integrity of the wash system as a part of a unique
and threatened ecosystem. Road systems avoid the
washes, while trails are separated from the most sen-
sitive areas. Most designs tried to minimize automo-
bile use by providing alternative paths for walking
303TESTING PLANNING CONCEPTS THROUGH DESIGN
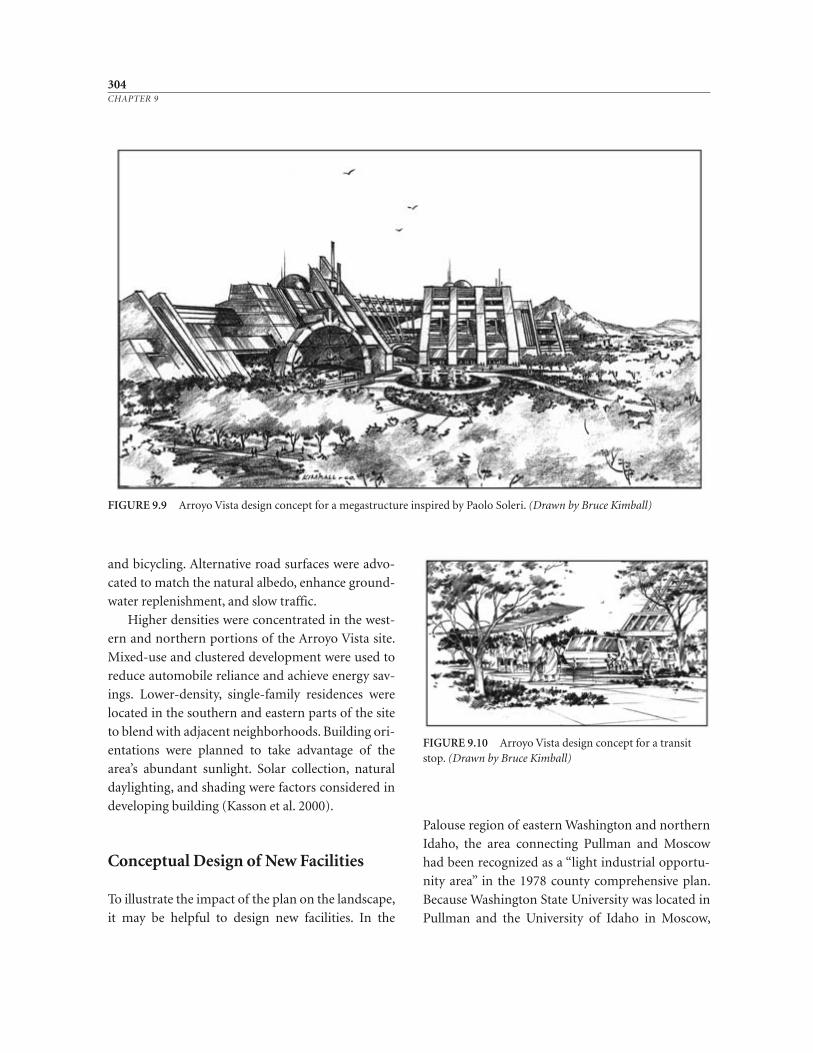
and bicycling. Alternative road surfaces were advo-
cated to match the natural albedo, enhance ground-
water replenishment, and slow traffic.
Higher densities were concentrated in the west-
ern and northern portions of the Arroyo Vista site.
Mixed- use and clustered development were used to
reduce automobile reliance and achieve energy sav-
ings. Lower- density, single- family residences were
located in the southern and eastern parts of the site
to blend with adjacent neighborhoods. Building ori-
entations were planned to take advantage of the
area’s abundant sunlight. Solar collection, natural
daylighting, and shading were factors considered in
developing building (Kasson et al. 2000).
Conceptual Design of New Facilities
To illustrate the impact of the plan on the landscape,
it may be helpful to design new facilities. In the
Palouse region of eastern Washington and northern
Idaho, the area connecting Pullman and Moscow
had been recognized as a “light industrial opportu-
nity area” in the 1978 county comprehensive plan.
Because Washington State University was located in
Pullman and the University of Idaho in Moscow,
304CHAPTER 9
FIGURE 9.9 Arroyo Vista design concept for a megastructure inspired by Paolo Soleri. (Drawn by Bruce Kimball)
FIGURE 9.10 Arroyo Vista design concept for a transitstop. (Drawn by Bruce Kimball)
there were also strong demands on the 10- mile
(16.09- kilometer) corridor for transportation and
recreational use. There are also established goals in
the region and state for the conservation of soil and
water resources as well as the protection of environ-
mentally sensitive areas. The design of a new facil-
ity—a recreational path—was used to show how all
these conflicting goals could be achieved. Planner
Dennis Canty and landscape architect Christine
Carlson from the National Park Service cooperated
with local citizens, elected officials, and county, city,
and university planners in 1986 to prepare such a
design.*
The Concept Design
There were two major interests in the design of the
path. The first was to provide a safe, attractive recre-
ational link between the communities of Pullman
and Moscow. The second was to conserve the natu-
ral and cultural features in the corridor area be-
tween the two communities. The concept design
that follows was developed directly from these inter-
ests by Canty, Carlson, Washington State University
faculty, and the local residents.
The central element of the concept is a pathway
designed to meet recreation and conservation needs
that physically links Pullman and Moscow and is the
backbone of a broader enhancement program for
the local landscape. The path is a way for the com-
munity as a whole to assume responsibility for the
shape and quality of the corridor area between Pull-
man and Moscow.
The basic ingredients of the concept plan are de-
sign components of the path—the function, form,
and character it manifests as it passes through the
landscape. To be successful, any path must flow
from place to place, and sometimes back again, in a
continuous manner, like a stream or river. It must
connect places with each other. And it must begin
some place and end somewhere else; it must have a
clear origin and destination and provide a strong
sense of direction. These characteristics—continu-
ity, connection, and an origin and destination—are
fundamental to the development of any path. The
function, form, and character of the path are the
physical means by which these intrinsic require-
ments are met (Carlson and Canty 1986).
The Palouse path was to have a variety of func-
tions. It was to be used for safe transportation and
recreation and for fostering understanding of the
intricate relationships between the natural and cul-
tural resources of the Palouse landscape. The path
was to capture the ambiance of the Palouse and
present it in ways that are interesting, educational,
and satisfying for all who use the Pullman- Moscow
corridor.
The implementation of the concept plan is di-
vided into two phases that develop the function,
form, and character of the path. Phase 1 provides a
response to the immediate need for safe travel for
bicyclists and, consequently, motorists between
Pullman and Moscow. It also establishes a physical
and planning framework for future development of
the path. Phase 2 supplements the development ac-
tions of Phase 1. It outlines options for more exten-
sive, formalized development and for use by a
broader constituency of users. The following sec-
tions review how the function, form, and character
of the path are developed in each phase.
Phase 1. Important features of Phase 1 are the
incorporation of the path into existing circulation
patterns, the development of roadside recreation
sites and conservation areas, and the promotion of
safe transportation for bicyclists between Pullman
and Moscow by upgrading bicycle-use areas.
The emphasis in Phase 1 is on upgrading bicycle
use on all established routes in the corridor area
(Figure 9.11). These roads are an integrated trans-
portation network between Pullman and Moscow
305TESTING PLANNING CONCEPTS THROUGH DESIGN
*This section has been adapted from Carlson and Canty1986, and Carlson et al. 1989.
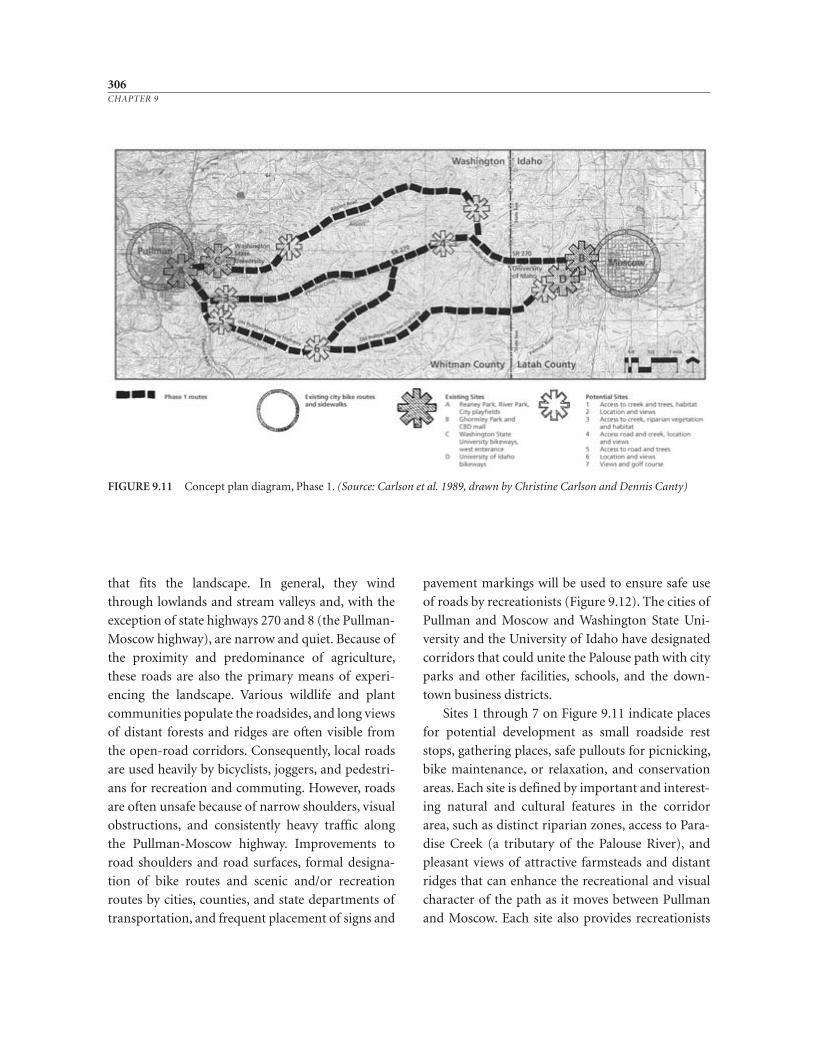
that fits the landscape. In general, they wind
through lowlands and stream valleys and, with the
exception of state highways 270 and 8 (the Pullman-
Moscow highway), are narrow and quiet. Because of
the proximity and predominance of agriculture,
these roads are also the primary means of experi-
encing the landscape. Various wildlife and plant
communities populate the roadsides, and long views
of distant forests and ridges are often visible from
the open- road corridors. Consequently, local roads
are used heavily by bicyclists, joggers, and pedestri-
ans for recreation and commuting. However, roads
are often unsafe because of narrow shoulders, visual
obstructions, and consistently heavy traffic along
the Pullman- Moscow highway. Improvements to
road shoulders and road surfaces, formal designa-
tion of bike routes and scenic and/or recreation
routes by cities, counties, and state departments of
transportation, and frequent placement of signs and
pavement markings will be used to ensure safe use
of roads by recreationists (Figure 9.12). The cities of
Pullman and Moscow and Washington State Uni-
versity and the University of Idaho have designated
corridors that could unite the Palouse path with city
parks and other facilities, schools, and the down-
town business districts.
Sites 1 through 7 on Figure 9.11 indicate places
for potential development as small roadside rest
stops, gathering places, safe pullouts for picnicking,
bike maintenance, or relaxation, and conservation
areas. Each site is defined by important and interest-
ing natural and cultural features in the corridor
area, such as distinct riparian zones, access to Para-
dise Creek (a tributary of the Palouse River), and
pleasant views of attractive farmsteads and distant
ridges that can enhance the recreational and visual
character of the path as it moves between Pullman
and Moscow. Each site also provides recreationists
306CHAPTER 9
FIGURE 9.11 Concept plan diagram, Phase 1. (Source: Carlson et al. 1989, drawn by Christine Carlson and Dennis Canty)
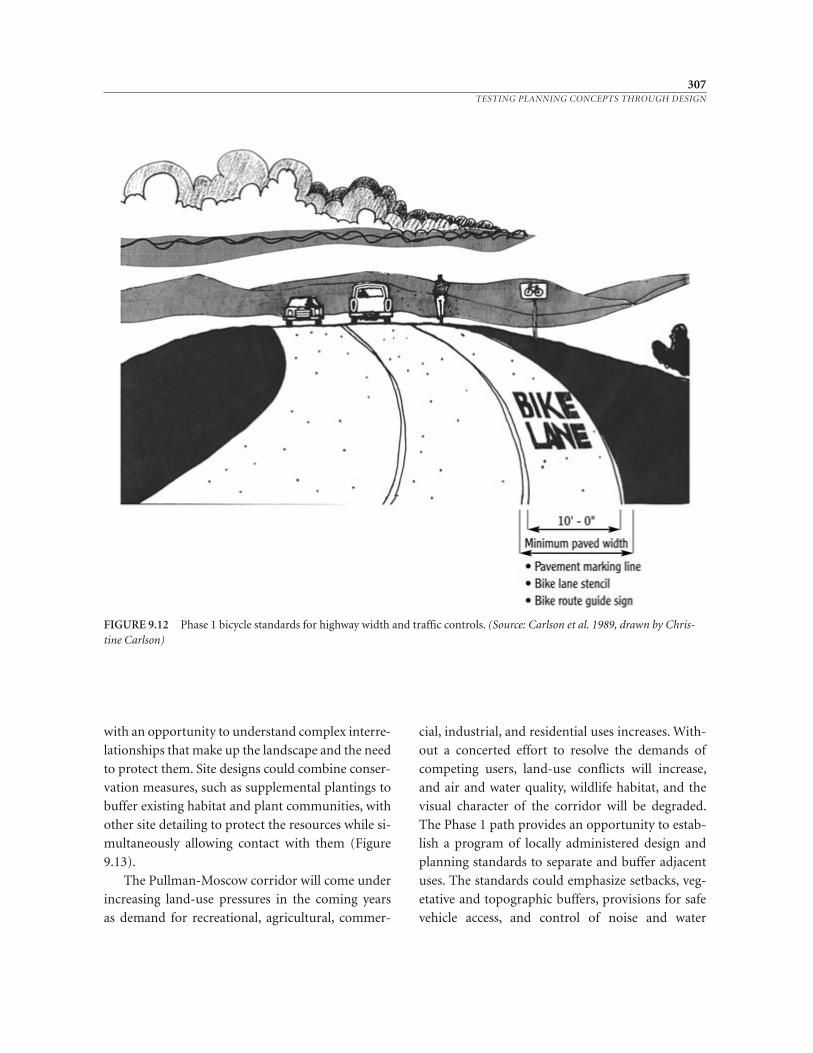
with an opportunity to understand complex interre-
lationships that make up the landscape and the need
to protect them. Site designs could combine conser-
vation measures, such as supplemental plantings to
buffer existing habitat and plant communities, with
other site detailing to protect the resources while si-
multaneously allowing contact with them (Figure
9.13).
The Pullman- Moscow corridor will come under
increasing land- use pressures in the coming years
as demand for recreational, agricultural, commer-
cial, industrial, and residential uses increases. With-
out a concerted effort to resolve the demands of
competing users, land- use conflicts will increase,
and air and water quality, wildlife habitat, and the
visual character of the corridor will be degraded.
The Phase 1 path provides an opportunity to estab-
lish a program of locally administered design and
planning standards to separate and buffer adjacent
uses. The standards could emphasize setbacks, veg-
etative and topographic buffers, provisions for safe
vehicle access, and control of noise and water
307TESTING PLANNING CONCEPTS THROUGH DESIGN
FIGURE 9.12 Phase 1 bicycle standards for highway width and traffic controls. (Source: Carlson et al. 1989, drawn by Chris-tine Carlson)
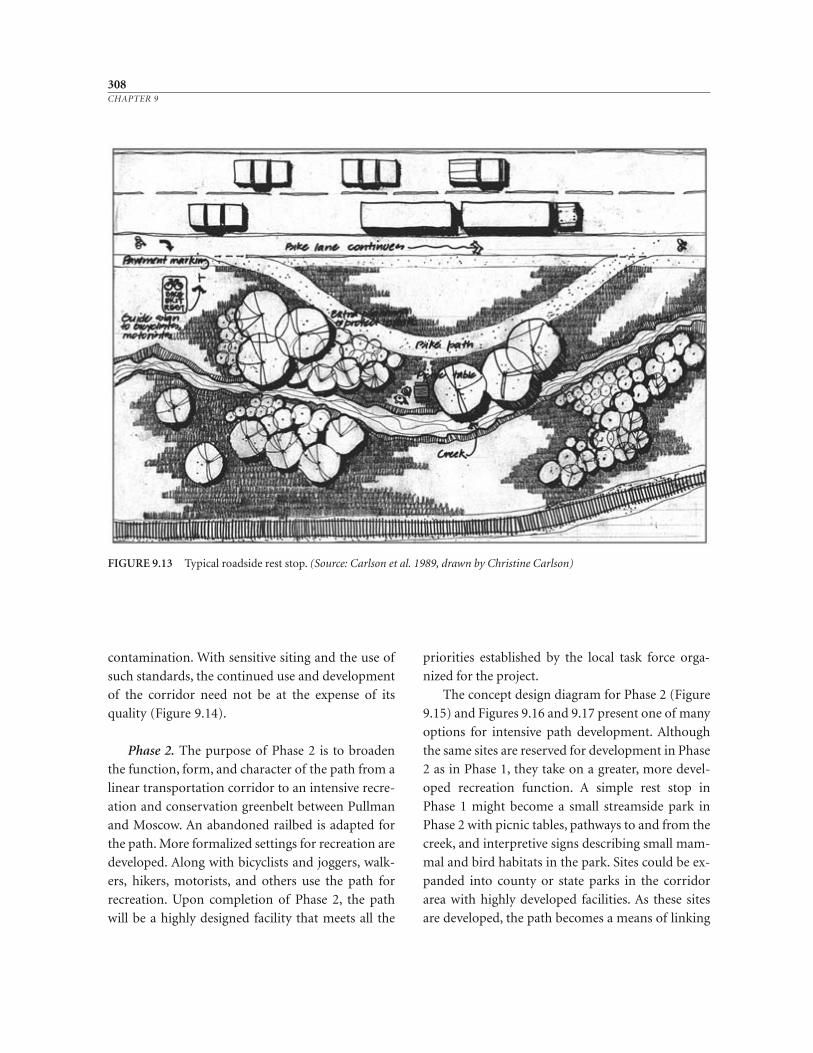
contamination. With sensitive siting and the use of
such standards, the continued use and development
of the corridor need not be at the expense of its
quality (Figure 9.14).
Phase 2. The purpose of Phase 2 is to broaden
the function, form, and character of the path from a
linear transportation corridor to an intensive recre-
ation and conservation greenbelt between Pullman
and Moscow. An abandoned railbed is adapted for
the path. More formalized settings for recreation are
developed. Along with bicyclists and joggers, walk-
ers, hikers, motorists, and others use the path for
recreation. Upon completion of Phase 2, the path
will be a highly designed facility that meets all the
priorities established by the local task force orga-
nized for the project.
The concept design diagram for Phase 2 (Figure
9.15) and Figures 9.16 and 9.17 present one of many
options for intensive path development. Although
the same sites are reserved for development in Phase
2 as in Phase 1, they take on a greater, more devel-
oped recreation function. A simple rest stop in
Phase 1 might become a small streamside park in
Phase 2 with picnic tables, pathways to and from the
creek, and interpretive signs describing small mam-
mal and bird habitats in the park. Sites could be ex-
panded into county or state parks in the corridor
area with highly developed facilities. As these sites
are developed, the path becomes a means of linking
308CHAPTER 9
FIGURE 9.13 Typical roadside rest stop. (Source: Carlson et al. 1989, drawn by Christine Carlson)
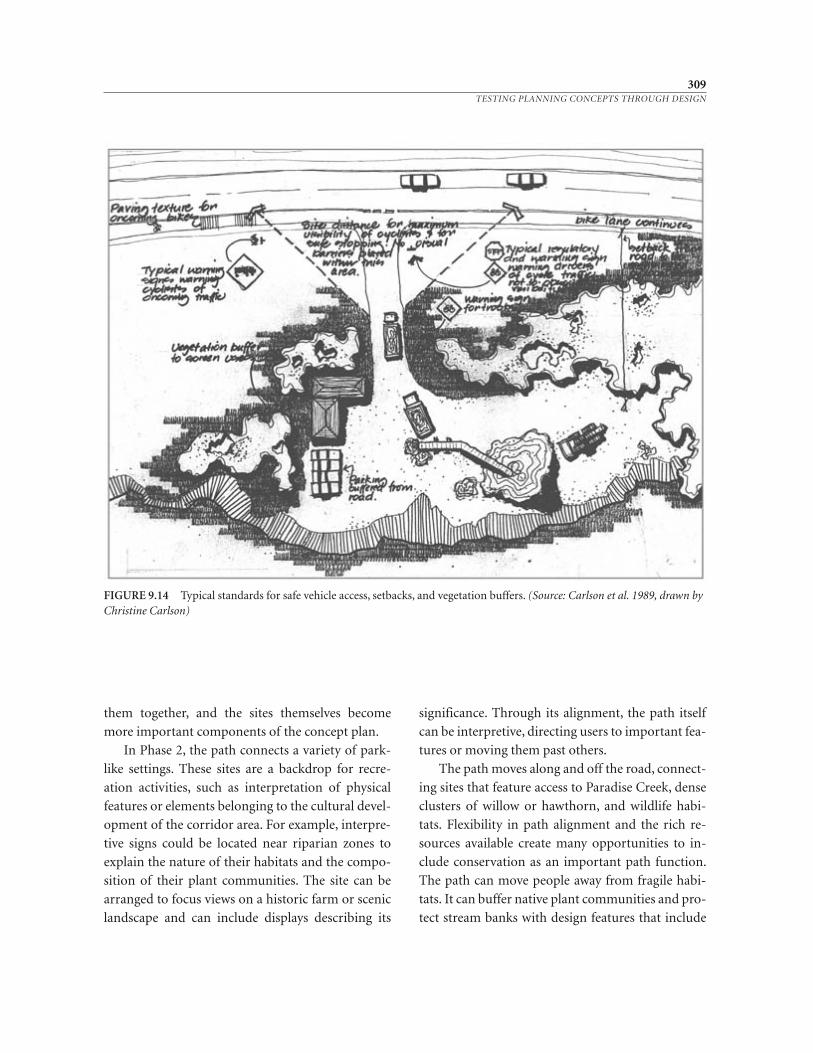
them together, and the sites themselves become
more important components of the concept plan.
In Phase 2, the path connects a variety of park-
like settings. These sites are a backdrop for recre-
ation activities, such as interpretation of physical
features or elements belonging to the cultural devel-
opment of the corridor area. For example, interpre-
tive signs could be located near riparian zones to
explain the nature of their habitats and the compo-
sition of their plant communities. The site can be
arranged to focus views on a historic farm or scenic
landscape and can include displays describing its
significance. Through its alignment, the path itself
can be interpretive, directing users to important fea-
tures or moving them past others.
The path moves along and off the road, connect-
ing sites that feature access to Paradise Creek, dense
clusters of willow or hawthorn, and wildlife habi-
tats. Flexibility in path alignment and the rich re-
sources available create many opportunities to in-
clude conservation as an important path function.
The path can move people away from fragile habi-
tats. It can buffer native plant communities and pro-
tect stream banks with design features that include
309TESTING PLANNING CONCEPTS THROUGH DESIGN
FIGURE 9.14 Typical standards for safe vehicle access, setbacks, and vegetation buffers. (Source: Carlson et al. 1989, drawn byChristine Carlson)
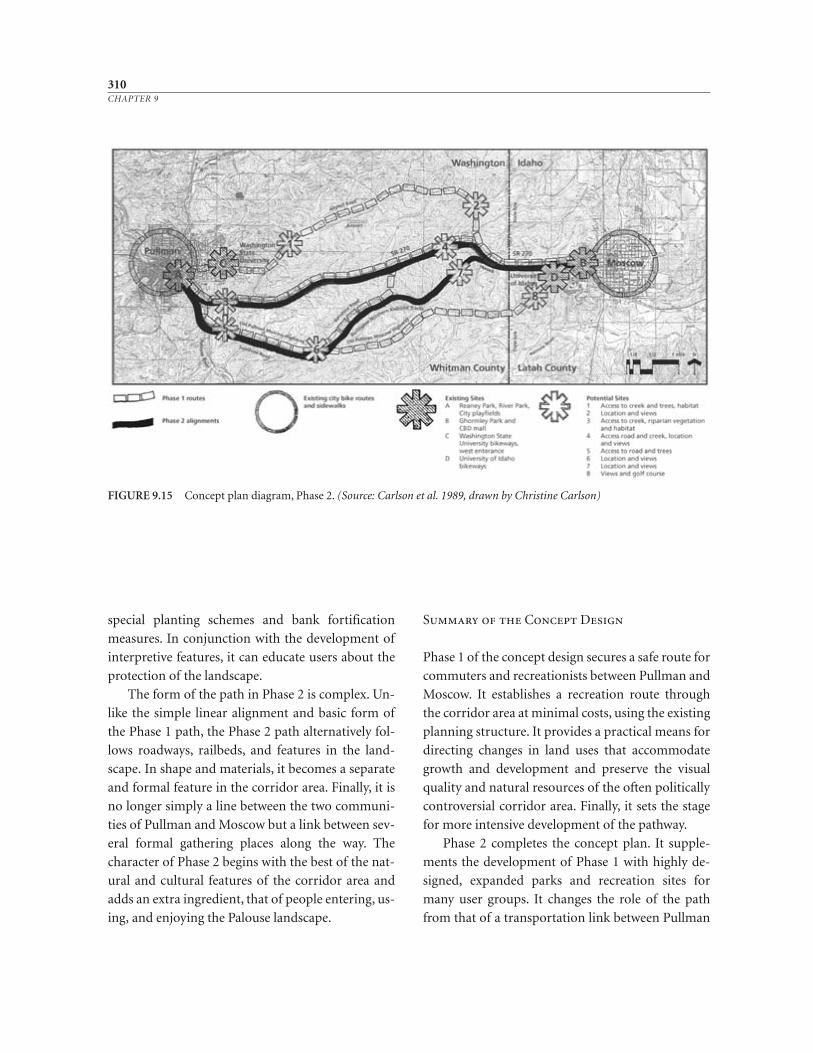
special planting schemes and bank fortification
measures. In conjunction with the development of
interpretive features, it can educate users about the
protection of the landscape.
The form of the path in Phase 2 is complex. Un-
like the simple linear alignment and basic form of
the Phase 1 path, the Phase 2 path alternatively fol-
lows roadways, railbeds, and features in the land-
scape. In shape and materials, it becomes a separate
and formal feature in the corridor area. Finally, it is
no longer simply a line between the two communi-
ties of Pullman and Moscow but a link between sev-
eral formal gathering places along the way. The
character of Phase 2 begins with the best of the nat-
ural and cultural features of the corridor area and
adds an extra ingredient, that of people entering, us-
ing, and enjoying the Palouse landscape.
Summary of the Concept Design
Phase 1 of the concept design secures a safe route for
commuters and recreationists between Pullman and
Moscow. It establishes a recreation route through
the corridor area at minimal costs, using the existing
planning structure. It provides a practical means for
directing changes in land uses that accommodate
growth and development and preserve the visual
quality and natural resources of the often politically
controversial corridor area. Finally, it sets the stage
for more intensive development of the pathway.
Phase 2 completes the concept plan. It supple-
ments the development of Phase 1 with highly de-
signed, expanded parks and recreation sites for
many user groups. It changes the role of the path
from that of a transportation link between Pullman
310CHAPTER 9
FIGURE 9.15 Concept plan diagram, Phase 2. (Source: Carlson et al. 1989, drawn by Christine Carlson)
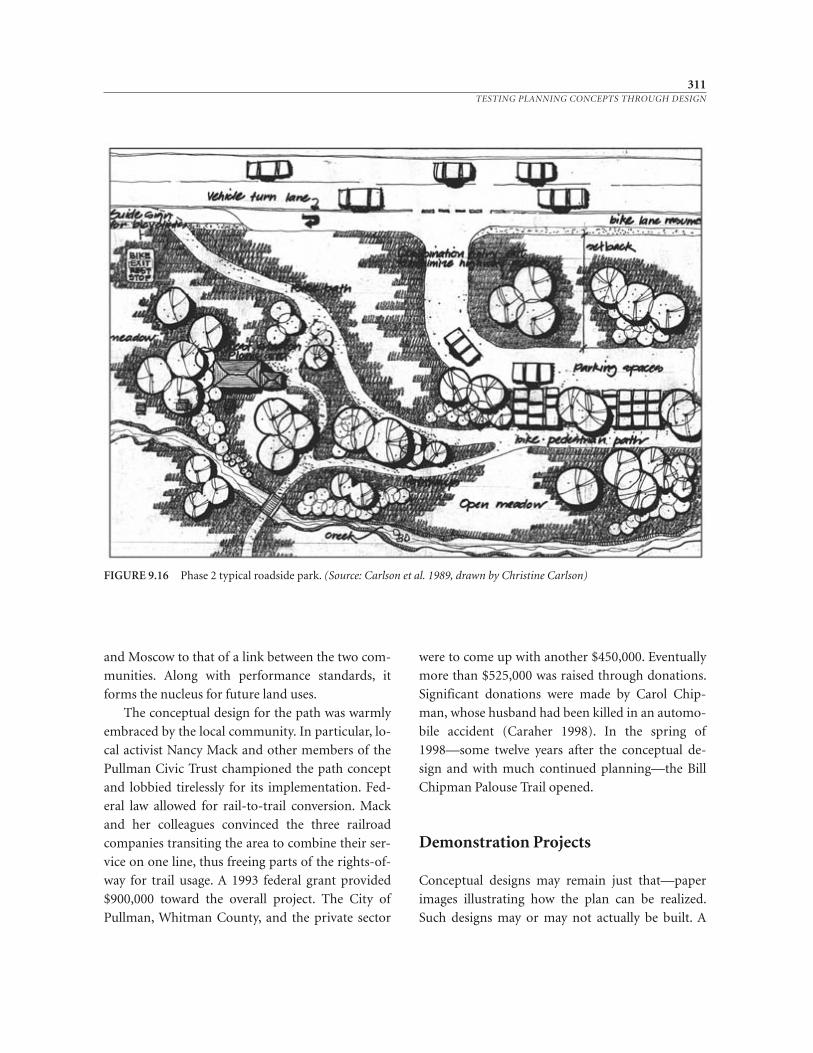
and Moscow to that of a link between the two com-
munities. Along with performance standards, it
forms the nucleus for future land uses.
The conceptual design for the path was warmly
embraced by the local community. In particular, lo-
cal activist Nancy Mack and other members of the
Pullman Civic Trust championed the path concept
and lobbied tirelessly for its implementation. Fed-
eral law allowed for rail- to- trail conversion. Mack
and her colleagues convinced the three railroad
companies transiting the area to combine their ser-
vice on one line, thus freeing parts of the rights-of-
way for trail usage. A 1993 federal grant provided
$900,000 toward the overall project. The City of
Pullman, Whitman County, and the private sector
were to come up with another $450,000. Eventually
more than $525,000 was raised through donations.
Significant donations were made by Carol Chip-
man, whose husband had been killed in an automo-
bile accident (Caraher 1998). In the spring of
1998—some twelve years after the conceptual de-
sign and with much continued planning—the Bill
Chipman Palouse Trail opened.
Demonstration Projects
Conceptual designs may remain just that—paper
images illustrating how the plan can be realized.
Such designs may or may not actually be built. A
311TESTING PLANNING CONCEPTS THROUGH DESIGN
FIGURE 9.16 Phase 2 typical roadside park. (Source: Carlson et al. 1989, drawn by Christine Carlson)
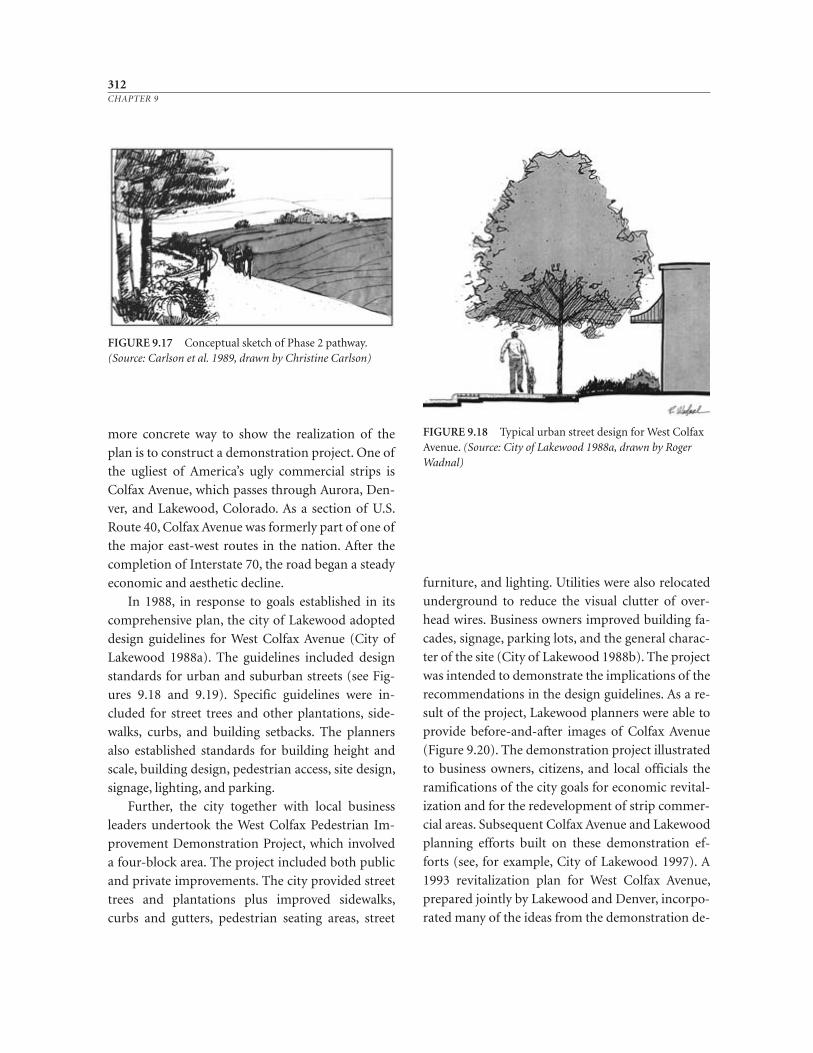
more concrete way to show the realization of the
plan is to construct a demonstration project. One of
the ugliest of America’s ugly commercial strips is
Colfax Avenue, which passes through Aurora, Den-
ver, and Lakewood, Colorado. As a section of U.S.
Route 40, Colfax Avenue was formerly part of one of
the major east- west routes in the nation. After the
completion of Interstate 70, the road began a steady
economic and aesthetic decline.
In 1988, in response to goals established in its
comprehensive plan, the city of Lakewood adopted
design guidelines for West Colfax Avenue (City of
Lakewood 1988a). The guidelines included design
standards for urban and suburban streets (see Fig-
ures 9.18 and 9.19). Specific guidelines were in-
cluded for street trees and other plantations, side-
walks, curbs, and building setbacks. The planners
also established standards for building height and
scale, building design, pedestrian access, site design,
signage, lighting, and parking.
Further, the city together with local business
leaders undertook the West Colfax Pedestrian Im-
provement Demonstration Project, which involved
a four- block area. The project included both public
and private improvements. The city provided street
trees and plantations plus improved sidewalks,
curbs and gutters, pedestrian seating areas, street
furniture, and lighting. Utilities were also relocated
underground to reduce the visual clutter of over-
head wires. Business owners improved building fa-
cades, signage, parking lots, and the general charac-
ter of the site (City of Lakewood 1988b). The project
was intended to demonstrate the implications of the
recommendations in the design guidelines. As a re-
sult of the project, Lakewood planners were able to
provide before- and- after images of Colfax Avenue
(Figure 9.20). The demonstration project illustrated
to business owners, citizens, and local officials the
ramifications of the city goals for economic revital-
ization and for the redevelopment of strip commer-
cial areas. Subsequent Colfax Avenue and Lakewood
planning efforts built on these demonstration ef-
forts (see, for example, City of Lakewood 1997). A
1993 revitalization plan for West Colfax Avenue,
prepared jointly by Lakewood and Denver, incorpo-
rated many of the ideas from the demonstration de-
312CHAPTER 9
FIGURE 9.17 Conceptual sketch of Phase 2 pathway.(Source: Carlson et al. 1989, drawn by Christine Carlson)
FIGURE 9.18 Typical urban street design for West ColfaxAvenue. (Source: City of Lakewood 1988a, drawn by RogerWadnal)

sign (City of Lakewood, and City and County of
Denver 1993).
In another demonstration project, in 1995 the
Arizona Public Service sought to provide an exam-
ple of energy efficiency, water conservation, appro-
priate building materials, and sustainable design. As
a result, the Phoenix Environmental Showcase
Home was designed by Eddie Jones of Jones Studio
(Figure 9.21). As David Pijawka and Kim Shetter
observed, “in addition to saving energy, water, and
materials, the home is designed to create less pollu-
tion than a standard production home does, from
the manufacture of the construction materials to
the final walk- through and beyond” (1995, 3).
313TESTING PLANNING CONCEPTS THROUGH DESIGN
FIGURE 9.19 Typical suburban street design for West Colfax Avenue, Lakewood, Colorado. (Source: City of Lakewood 1988a,drawn by Roger Wadnal)
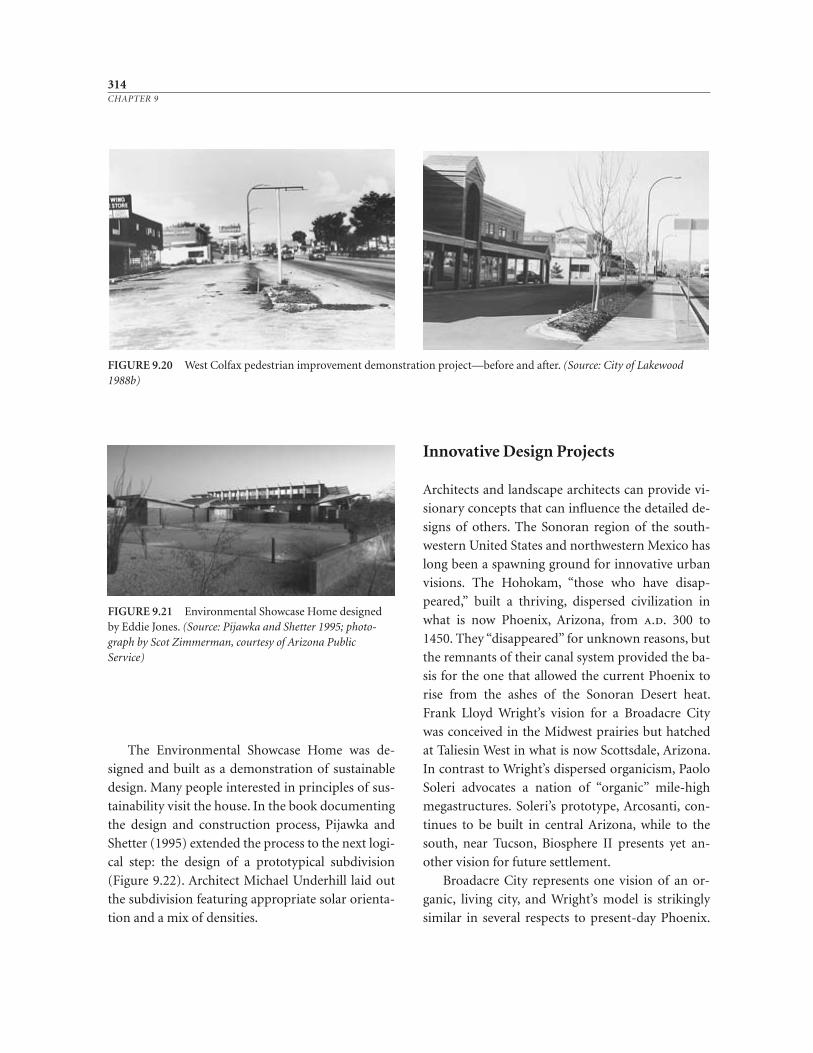
The Environmental Showcase Home was de-
signed and built as a demonstration of sustainable
design. Many people interested in principles of sus-
tainability visit the house. In the book documenting
the design and construction process, Pijawka and
Shetter (1995) extended the process to the next logi-
cal step: the design of a prototypical subdivision
(Figure 9.22). Architect Michael Underhill laid out
the subdivision featuring appropriate solar orienta-
tion and a mix of densities.
Innovative Design Projects
Architects and landscape architects can provide vi-
sionary concepts that can influence the detailed de-
signs of others. The Sonoran region of the south-
western United States and northwestern Mexico has
long been a spawning ground for innovative urban
visions. The Hohokam, “those who have disap-
peared,” built a thriving, dispersed civilization in
what is now Phoenix, Arizona, from a.d. 300 to
1450. They “disappeared” for unknown reasons, but
the remnants of their canal system provided the ba-
sis for the one that allowed the current Phoenix to
rise from the ashes of the Sonoran Desert heat.
Frank Lloyd Wright’s vision for a Broadacre City
was conceived in the Midwest prairies but hatched
at Taliesin West in what is now Scottsdale, Arizona.
In contrast to Wright’s dispersed organicism, Paolo
Soleri advocates a nation of “organic” mile- high
megastructures. Soleri’s prototype, Arcosanti, con-
tinues to be built in central Arizona, while to the
south, near Tucson, Biosphere II presents yet an-
other vision for future settlement.
Broadacre City represents one vision of an or-
ganic, living city, and Wright’s model is strikingly
similar in several respects to present- day Phoenix.
314CHAPTER 9
FIGURE 9.20 West Colfax pedestrian improvement demonstration project—before and after. (Source: City of Lakewood1988b)
FIGURE 9.21 Environmental Showcase Home designedby Eddie Jones. (Source: Pijawka and Shetter 1995; photo-graph by Scot Zimmerman, courtesy of Arizona Public Service)
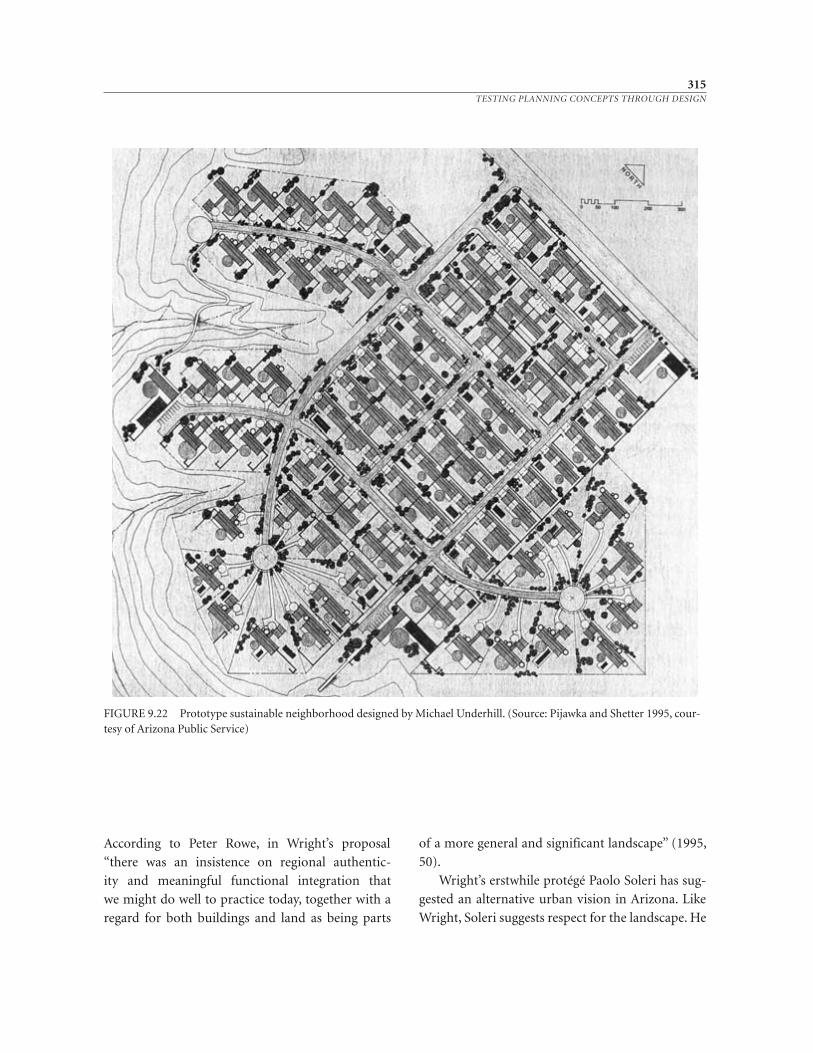
According to Peter Rowe, in Wright’s proposal
“there was an insistence on regional authentic-
ity and meaningful functional integration that
we might do well to practice today, together with a
regard for both buildings and land as being parts
of a more general and significant landscape” (1995,
50).
Wright’s erstwhile protégé Paolo Soleri has sug-
gested an alternative urban vision in Arizona. Like
Wright, Soleri suggests respect for the landscape. He
315TESTING PLANNING CONCEPTS THROUGH DESIGN
FIGURE 9.22 Prototype sustainable neighborhood designed by Michael Underhill. (Source: Pijawka and Shetter 1995, cour-tesy of Arizona Public Service)
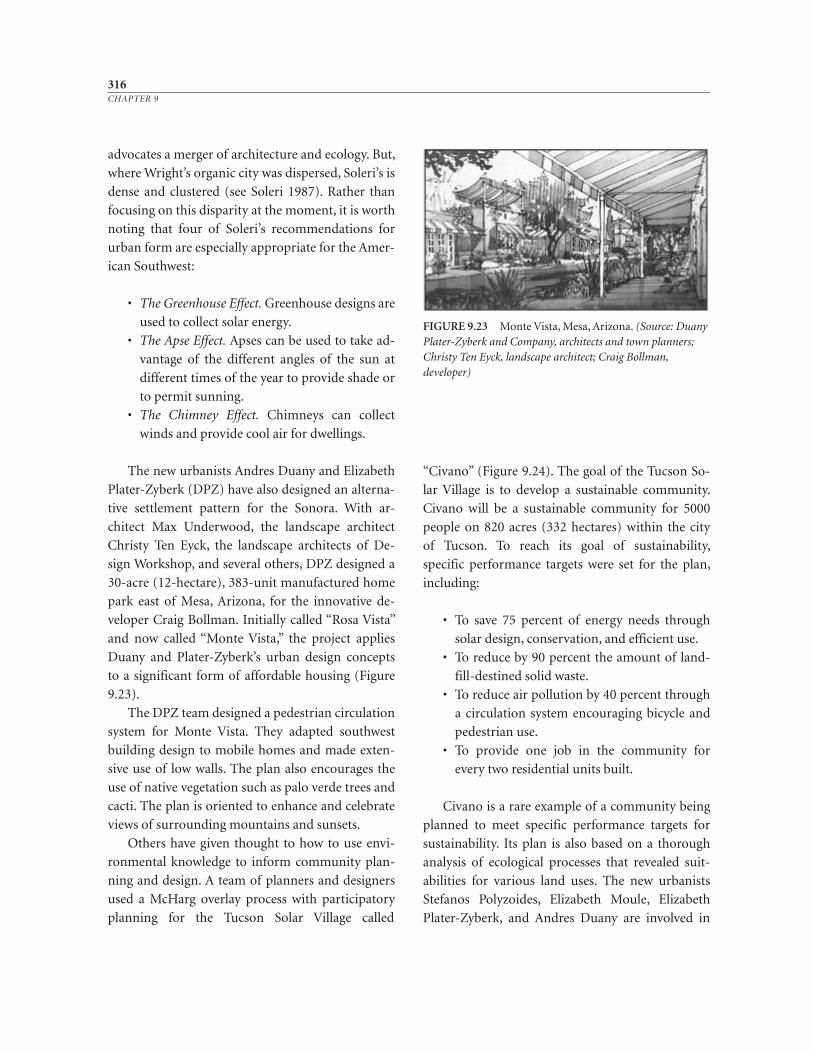
advocates a merger of architecture and ecology. But,
where Wright’s organic city was dispersed, Soleri’s is
dense and clustered (see Soleri 1987). Rather than
focusing on this disparity at the moment, it is worth
noting that four of Soleri’s recommendations for
urban form are especially appropriate for the Amer-
ican Southwest:
• The Greenhouse Effect. Greenhouse designs are
used to collect solar energy.
• The Apse Effect. Apses can be used to take ad-
vantage of the different angles of the sun at
different times of the year to provide shade or
to permit sunning.
• The Chimney Effect. Chimneys can collect
winds and provide cool air for dwellings.
The new urbanists Andres Duany and Elizabeth
Plater- Zyberk (DPZ) have also designed an alterna-
tive settlement pattern for the Sonora. With ar-
chitect Max Underwood, the landscape architect
Christy Ten Eyck, the landscape architects of De-
sign Workshop, and several others, DPZ designed a
30- acre (12- hectare), 383- unit manufactured home
park east of Mesa, Arizona, for the innovative de-
veloper Craig Bollman. Initially called “Rosa Vista”
and now called “Monte Vista,” the project applies
Duany and Plater- Zyberk’s urban design concepts
to a significant form of affordable housing (Figure
9.23).
The DPZ team designed a pedestrian circulation
system for Monte Vista. They adapted southwest
building design to mobile homes and made exten-
sive use of low walls. The plan also encourages the
use of native vegetation such as palo verde trees and
cacti. The plan is oriented to enhance and celebrate
views of surrounding mountains and sunsets.
Others have given thought to how to use envi-
ronmental knowledge to inform community plan-
ning and design. A team of planners and designers
used a McHarg overlay process with participatory
planning for the Tucson Solar Village called
“Civano” (Figure 9.24). The goal of the Tucson So-
lar Village is to develop a sustainable community.
Civano will be a sustainable community for 5000
people on 820 acres (332 hectares) within the city
of Tucson. To reach its goal of sustainability,
specific performance targets were set for the plan,
including:
• To save 75 percent of energy needs through
solar design, conservation, and efficient use.
• To reduce by 90 percent the amount of land-
fill- destined solid waste.
• To reduce air pollution by 40 percent through
a circulation system encouraging bicycle and
pedestrian use.
• To provide one job in the community for
every two residential units built.
Civano is a rare example of a community being
planned to meet specific performance targets for
sustainability. Its plan is also based on a thorough
analysis of ecological processes that revealed suit-
abilities for various land uses. The new urbanists
Stefanos Polyzoides, Elizabeth Moule, Elizabeth
Plater- Zyberk, and Andres Duany are involved in
316CHAPTER 9
FIGURE 9.23 Monte Vista, Mesa, Arizona. (Source: DuanyPlater- Zyberk and Company, architects and town planners;Christy Ten Eyck, landscape architect; Craig Bollman, developer)
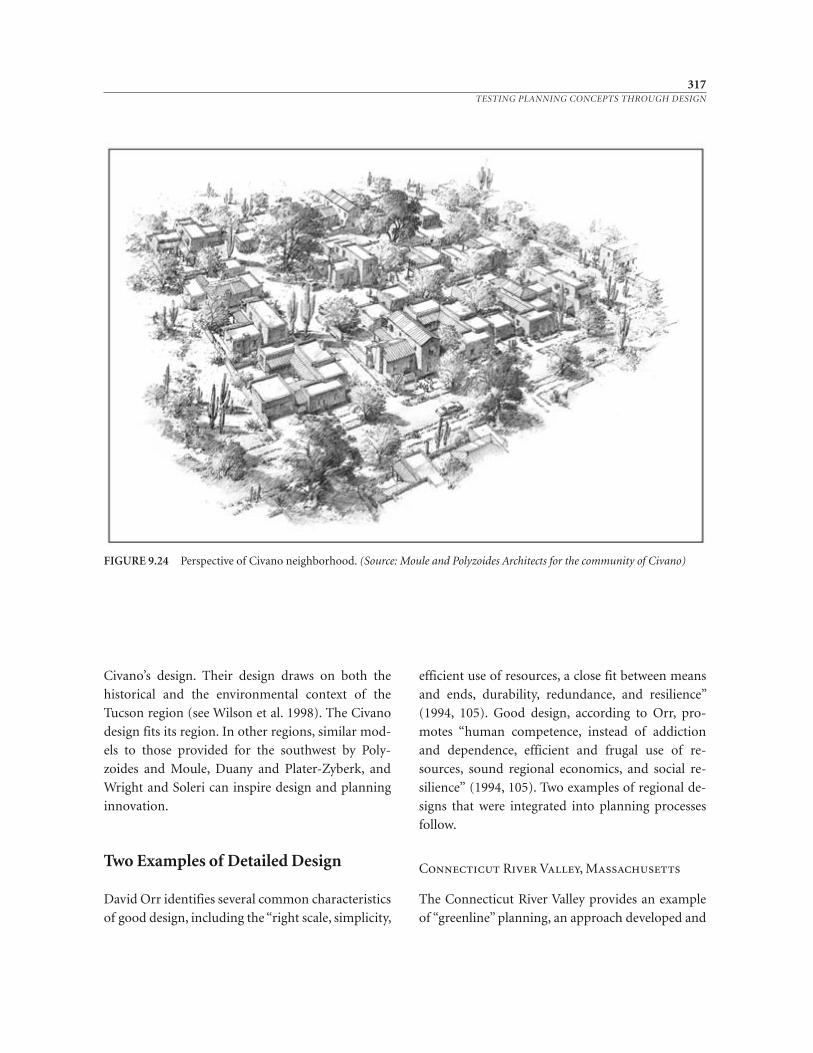
Civano’s design. Their design draws on both the
historical and the environmental context of the
Tucson region (see Wilson et al. 1998). The Civano
design fits its region. In other regions, similar mod-
els to those provided for the southwest by Poly-
zoides and Moule, Duany and Plater- Zyberk, and
Wright and Soleri can inspire design and planning
innovation.
Two Examples of Detailed Design
David Orr identifies several common characteristics
of good design, including the “right scale, simplicity,
efficient use of resources, a close fit between means
and ends, durability, redundance, and resilience”
(1994, 105). Good design, according to Orr, pro-
motes “human competence, instead of addiction
and dependence, efficient and frugal use of re-
sources, sound regional economics, and social re-
silience” (1994, 105). Two examples of regional de-
signs that were integrated into planning processes
follow.
Connecticut River Valley, Massachusetts
The Connecticut River Valley provides an example
of “greenline” planning, an approach developed and
317TESTING PLANNING CONCEPTS THROUGH DESIGN
FIGURE 9.24 Perspective of Civano neighborhood. (Source: Moule and Polyzoides Architects for the community of Civano)
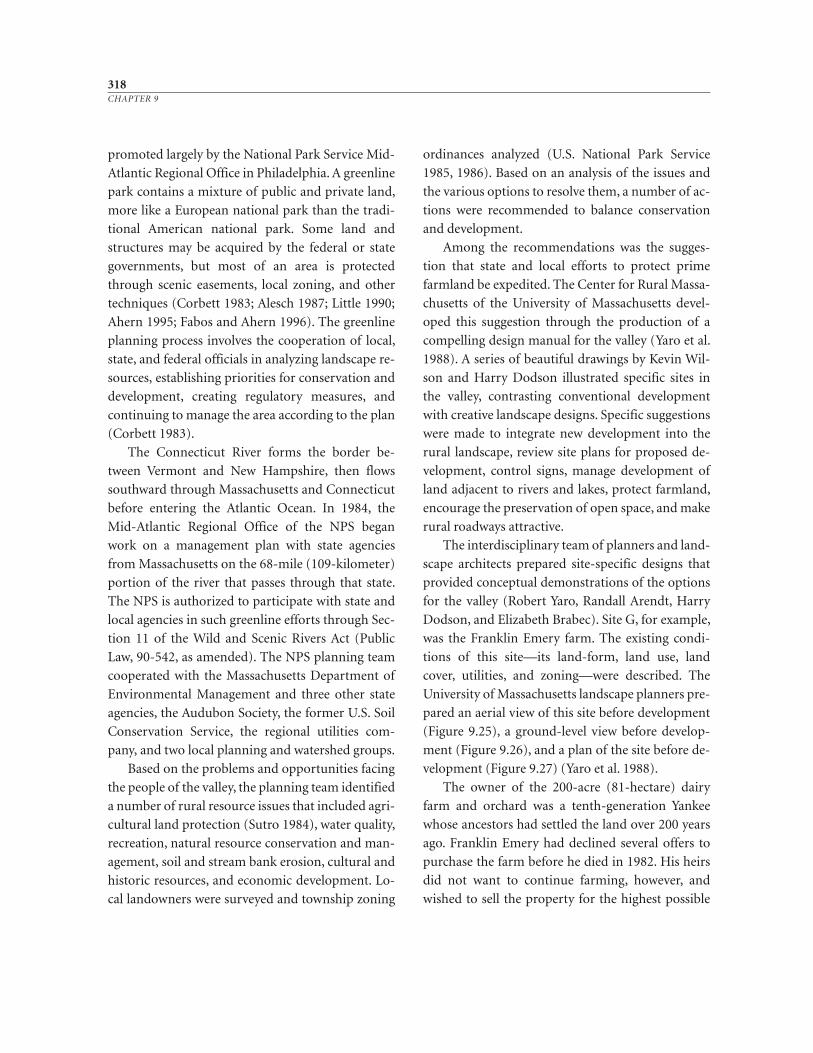
promoted largely by the National Park Service Mid-
Atlantic Regional Office in Philadelphia. A greenline
park contains a mixture of public and private land,
more like a European national park than the tradi-
tional American national park. Some land and
structures may be acquired by the federal or state
governments, but most of an area is protected
through scenic easements, local zoning, and other
techniques (Corbett 1983; Alesch 1987; Little 1990;
Ahern 1995; Fabos and Ahern 1996). The greenline
planning process involves the cooperation of local,
state, and federal officials in analyzing landscape re-
sources, establishing priorities for conservation and
development, creating regulatory measures, and
continuing to manage the area according to the plan
(Corbett 1983).
The Connecticut River forms the border be-
tween Vermont and New Hampshire, then flows
southward through Massachusetts and Connecticut
before entering the Atlantic Ocean. In 1984, the
Mid- Atlantic Regional Office of the NPS began
work on a management plan with state agencies
from Massachusetts on the 68- mile (109- kilometer)
portion of the river that passes through that state.
The NPS is authorized to participate with state and
local agencies in such greenline efforts through Sec-
tion 11 of the Wild and Scenic Rivers Act (Public
Law, 90- 542, as amended). The NPS planning team
cooperated with the Massachusetts Department of
Environmental Management and three other state
agencies, the Audubon Society, the former U.S. Soil
Conservation Service, the regional utilities com-
pany, and two local planning and watershed groups.
Based on the problems and opportunities facing
the people of the valley, the planning team identified
a number of rural resource issues that included agri-
cultural land protection (Sutro 1984), water quality,
recreation, natural resource conservation and man-
agement, soil and stream bank erosion, cultural and
historic resources, and economic development. Lo-
cal landowners were surveyed and township zoning
ordinances analyzed (U.S. National Park Service
1985, 1986). Based on an analysis of the issues and
the various options to resolve them, a number of ac-
tions were recommended to balance conservation
and development.
Among the recommendations was the sugges-
tion that state and local efforts to protect prime
farmland be expedited. The Center for Rural Massa-
chusetts of the University of Massachusetts devel-
oped this suggestion through the production of a
compelling design manual for the valley (Yaro et al.
1988). A series of beautiful drawings by Kevin Wil-
son and Harry Dodson illustrated specific sites in
the valley, contrasting conventional development
with creative landscape designs. Specific suggestions
were made to integrate new development into the
rural landscape, review site plans for proposed de-
velopment, control signs, manage development of
land adjacent to rivers and lakes, protect farmland,
encourage the preservation of open space, and make
rural roadways attractive.
The interdisciplinary team of planners and land-
scape architects prepared site- specific designs that
provided conceptual demonstrations of the options
for the valley (Robert Yaro, Randall Arendt, Harry
Dodson, and Elizabeth Brabec). Site G, for example,
was the Franklin Emery farm. The existing condi-
tions of this site—its land-form, land use, land
cover, utilities, and zoning—were described. The
University of Massachusetts landscape planners pre-
pared an aerial view of this site before development
(Figure 9.25), a ground- level view before develop-
ment (Figure 9.26), and a plan of the site before de-
velopment (Figure 9.27) (Yaro et al. 1988).
The owner of the 200- acre (81- hectare) dairy
farm and orchard was a tenth- generation Yankee
whose ancestors had settled the land over 200 years
ago. Franklin Emery had declined several offers to
purchase the farm before he died in 1982. His heirs
did not want to continue farming, however, and
wished to sell the property for the highest possible
318CHAPTER 9
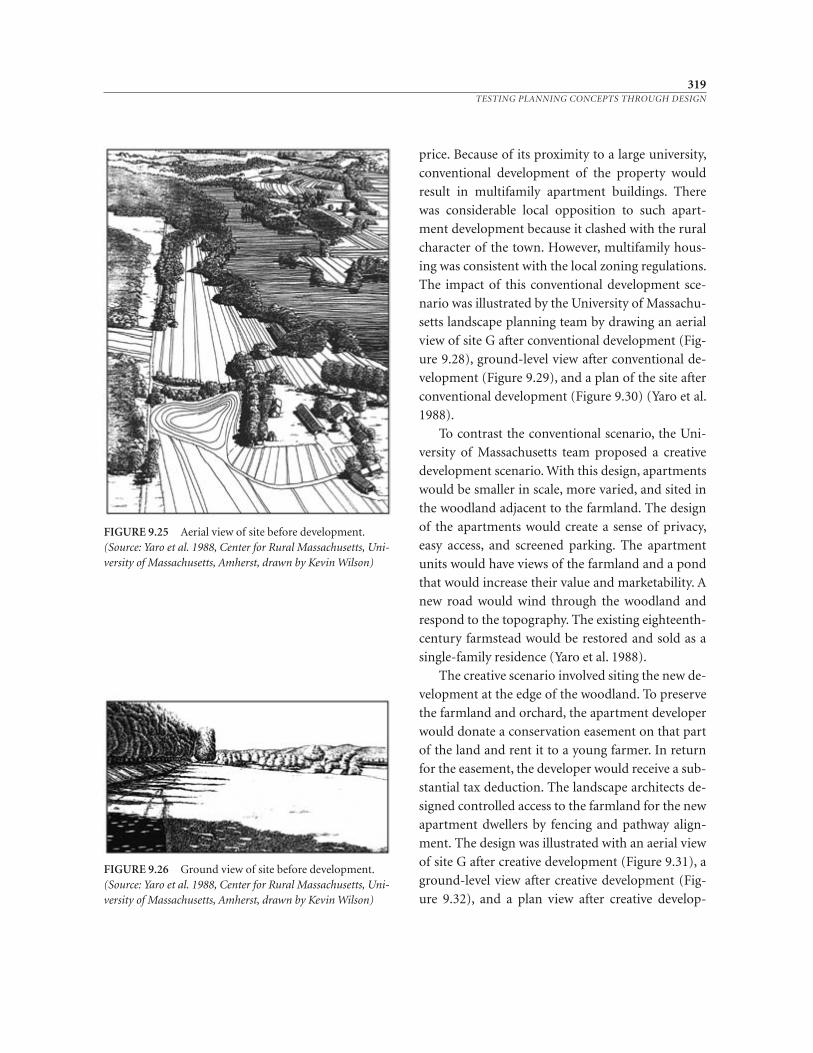
price. Because of its proximity to a large university,
conventional development of the property would
result in multifamily apartment buildings. There
was considerable local opposition to such apart-
ment development because it clashed with the rural
character of the town. However, multifamily hous-
ing was consistent with the local zoning regulations.
The impact of this conventional development sce-
nario was illustrated by the University of Massachu-
setts landscape planning team by drawing an aerial
view of site G after conventional development (Fig-
ure 9.28), ground- level view after conventional de-
velopment (Figure 9.29), and a plan of the site after
conventional development (Figure 9.30) (Yaro et al.
1988).
To contrast the conventional scenario, the Uni-
versity of Massachusetts team proposed a creative
development scenario. With this design, apartments
would be smaller in scale, more varied, and sited in
the woodland adjacent to the farmland. The design
of the apartments would create a sense of privacy,
easy access, and screened parking. The apartment
units would have views of the farmland and a pond
that would increase their value and marketability. A
new road would wind through the woodland and
respond to the topography. The existing eighteenth-
century farmstead would be restored and sold as a
single- family residence (Yaro et al. 1988).
The creative scenario involved siting the new de-
velopment at the edge of the woodland. To preserve
the farmland and orchard, the apartment developer
would donate a conservation easement on that part
of the land and rent it to a young farmer. In return
for the easement, the developer would receive a sub-
stantial tax deduction. The landscape architects de-
signed controlled access to the farmland for the new
apartment dwellers by fencing and pathway align-
ment. The design was illustrated with an aerial view
of site G after creative development (Figure 9.31), a
ground- level view after creative development (Fig-
ure 9.32), and a plan view after creative develop-
319TESTING PLANNING CONCEPTS THROUGH DESIGN
FIGURE 9.26 Ground view of site before development.(Source: Yaro et al. 1988, Center for Rural Massachusetts, Uni-versity of Massachusetts, Amherst, drawn by Kevin Wilson)
FIGURE 9.25 Aerial view of site before development.(Source: Yaro et al. 1988, Center for Rural Massachusetts, Uni-versity of Massachusetts, Amherst, drawn by Kevin Wilson)
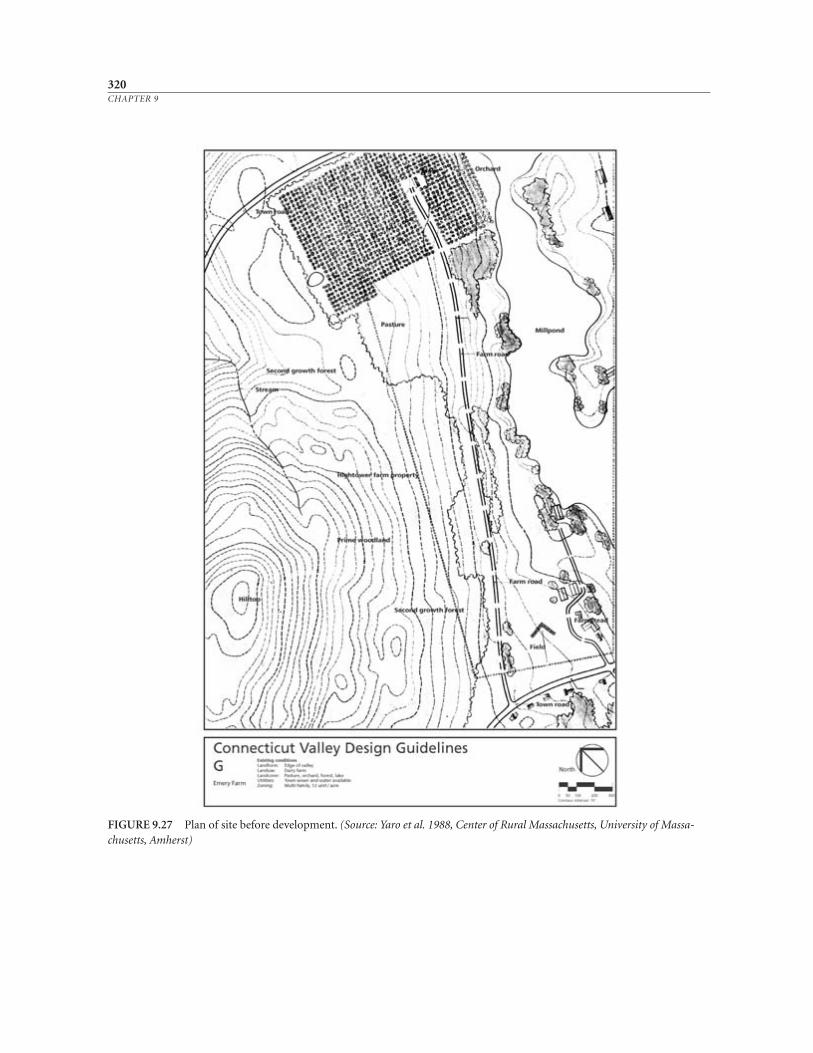
320CHAPTER 9
FIGURE 9.27 Plan of site before development. (Source: Yaro et al. 1988, Center of Rural Massachusetts, University of Massa-chusetts, Amherst)
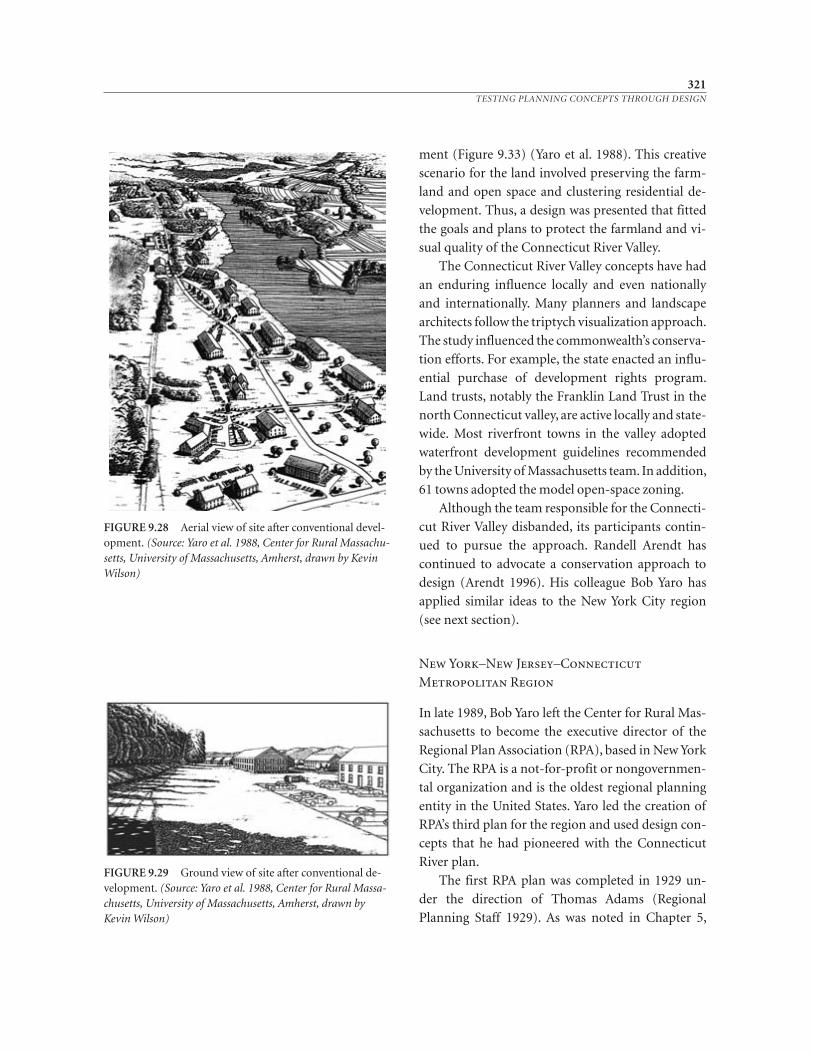
ment (Figure 9.33) (Yaro et al. 1988). This creative
scenario for the land involved preserving the farm-
land and open space and clustering residential de-
velopment. Thus, a design was presented that fitted
the goals and plans to protect the farmland and vi-
sual quality of the Connecticut River Valley.
The Connecticut River Valley concepts have had
an enduring influence locally and even nationally
and internationally. Many planners and landscape
architects follow the triptych visualization approach.
The study influenced the commonwealth’s conserva-
tion efforts. For example, the state enacted an influ-
ential purchase of development rights program.
Land trusts, notably the Franklin Land Trust in the
north Connecticut valley, are active locally and state -
wide. Most riverfront towns in the valley adopted
waterfront development guidelines recommended
by the University of Massachusetts team. In addition,
61 towns adopted the model open-space zoning.
Although the team responsible for the Connecti-
cut River Valley disbanded, its participants contin-
ued to pursue the approach. Randell Arendt has
continued to advocate a conservation approach to
design (Arendt 1996). His colleague Bob Yaro has
applied similar ideas to the New York City region
(see next section).
New York– New Jersey– Connecticut
Metropolitan Region
In late 1989, Bob Yaro left the Center for Rural Mas-
sachusetts to become the executive director of the
Regional Plan Association (RPA), based in New York
City. The RPA is a not- for- profit or nongovernmen-
tal organization and is the oldest regional planning
entity in the United States. Yaro led the creation of
RPA’s third plan for the region and used design con-
cepts that he had pioneered with the Connecticut
River plan.
The first RPA plan was completed in 1929 un-
der the direction of Thomas Adams (Regional
Planning Staff 1929). As was noted in Chapter 5,
321TESTING PLANNING CONCEPTS THROUGH DESIGN
FIGURE 9.29 Ground view of site after conventional de-velopment. (Source: Yaro et al. 1988, Center for Rural Massa-chusetts, University of Massachusetts, Amherst, drawn byKevin Wilson)
FIGURE 9.28 Aerial view of site after conventional devel-opment. (Source: Yaro et al. 1988, Center for Rural Massachu-setts, University of Massachusetts, Amherst, drawn by KevinWilson)
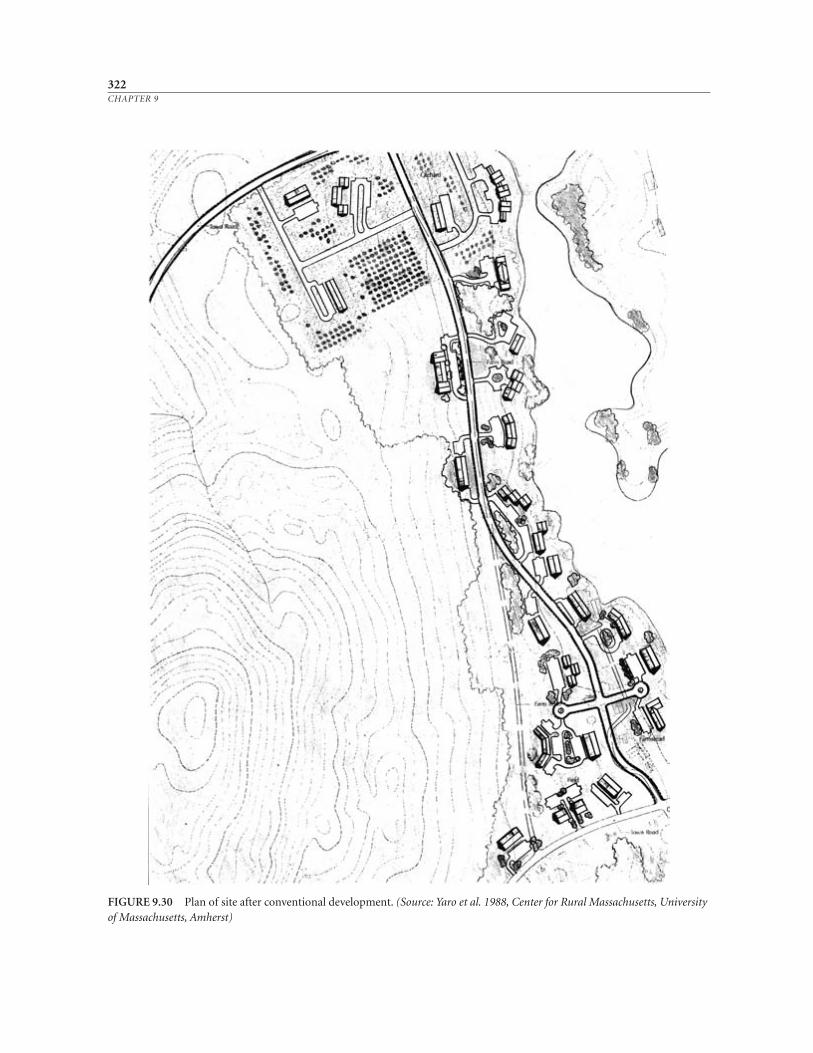
322CHAPTER 9
FIGURE 9.30 Plan of site after conventional development. (Source: Yaro et al. 1988, Center for Rural Massachusetts, Universityof Massachusetts, Amherst)

323TESTING PLANNING CONCEPTS THROUGH DESIGN
FIGURE 9.32 Ground-level view of site after creative de-velopment. (Source: Yaro et al. 1988, Center for Rural Massa-chusetts, University of Massachusetts, Amherst, drawn byKevin Wilson)
FIGURE 9.31 Aerial view of site after creative develop-ment. (Source: Yaro et al. 1988, Center for Rural Massachu-setts, University of Massachusetts, Amherst, drawn by KevinWilson)
the 1929 plan was an early example of the overlay
technique. The second RPA plan was presented in
1968. That plan attempted to address the issues of
suburban sprawl and inner- city decay. The third
plan of 1996 attempts “to reconnect the regions to
its basic foundations.” RPA calls these interlocking
foundations the “Three E’s—economy, environ-
ment, and equity” (Yaro and Hiss 1996, 6). Where
these three foundations coincide, positive quality of
life results. The diagram that RPA developed to il-
lustrate this point (Figure 9.34) has subsequently
been used to illustrate the principles of sustainable
development.
Yaro turned to his former Connecticut River
Valley colleague Harry Dodson and illustrator Kevin
Wilson to develop regional simulations of the future
development patterns for the cities, suburbs, and
countryside. As with the Connecticut River Valley,
drawings were made of alternative futures. For ex-
ample, Figure 9.35 illustrates a view of an exurban
highway cloverleaf at present, which is compared to
what it will look like with current development pat-
terns (Figure 9.36) and how it could look if reori-
ented around a village center and rail station (Figure
9.37) (Yaro and Hiss 1996). Meanwhile, Figure 9.38
shows an urban industrial waterfront at present,
while Figure 9.39 illustrates what it could look like
with creative design (Yaro and Hiss 1996).
The technique for making the drawings for the
New York region differed slightly from its precedent.
In the Connecticut River Valley, Dodson and Wilson
had relied on slide traces. For RPA, a computer-
aided design (CAD) system created perspectives
that were then rendered to illustrate the scenarios.
Yaro and Dodson also involved a broader group of
design talent—including Jonathan Barnett, Robert
Geddes, and Ray Gastil—to create the images.
Anne Spirn advocates ecological design that rec-
ognizes the deep structure of the place. The detailed
designs for the Connecticut River Valley in Massa-
chusetts and the New York City region respond to
the natural and cultural processes, the landscape
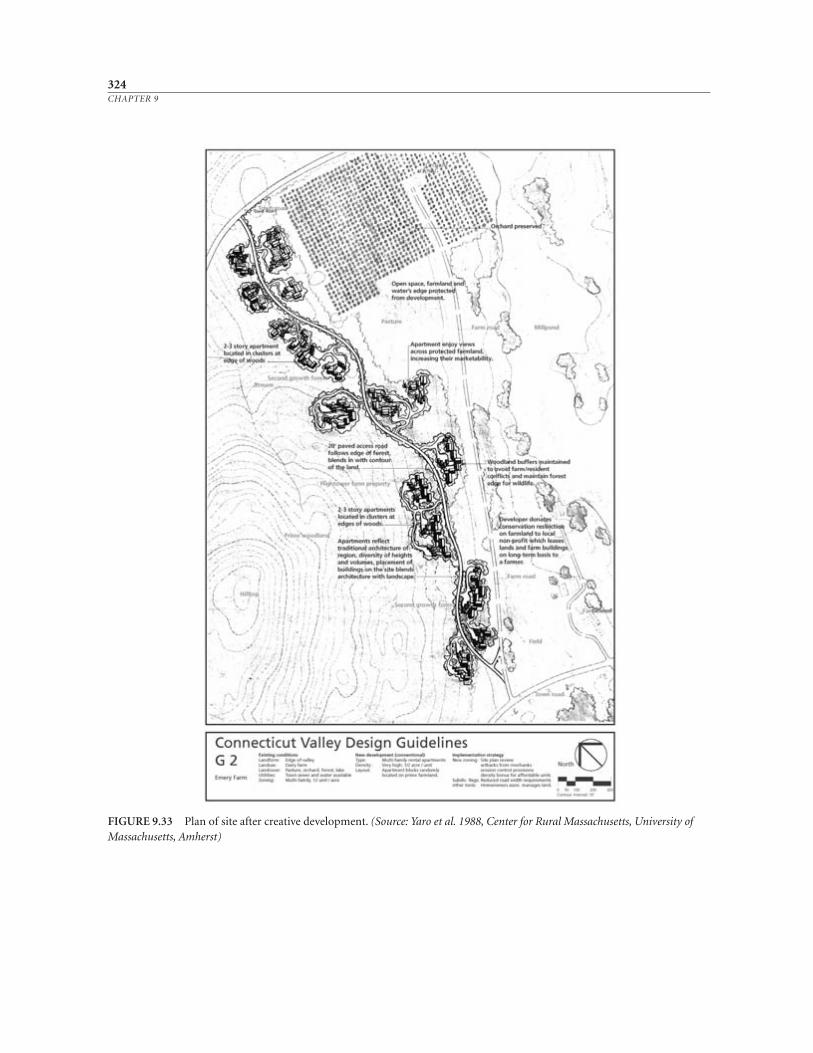
324CHAPTER 9
FIGURE 9.33 Plan of site after creative development. (Source: Yaro et al. 1988, Center for Rural Massachusetts, University ofMassachusetts, Amherst)
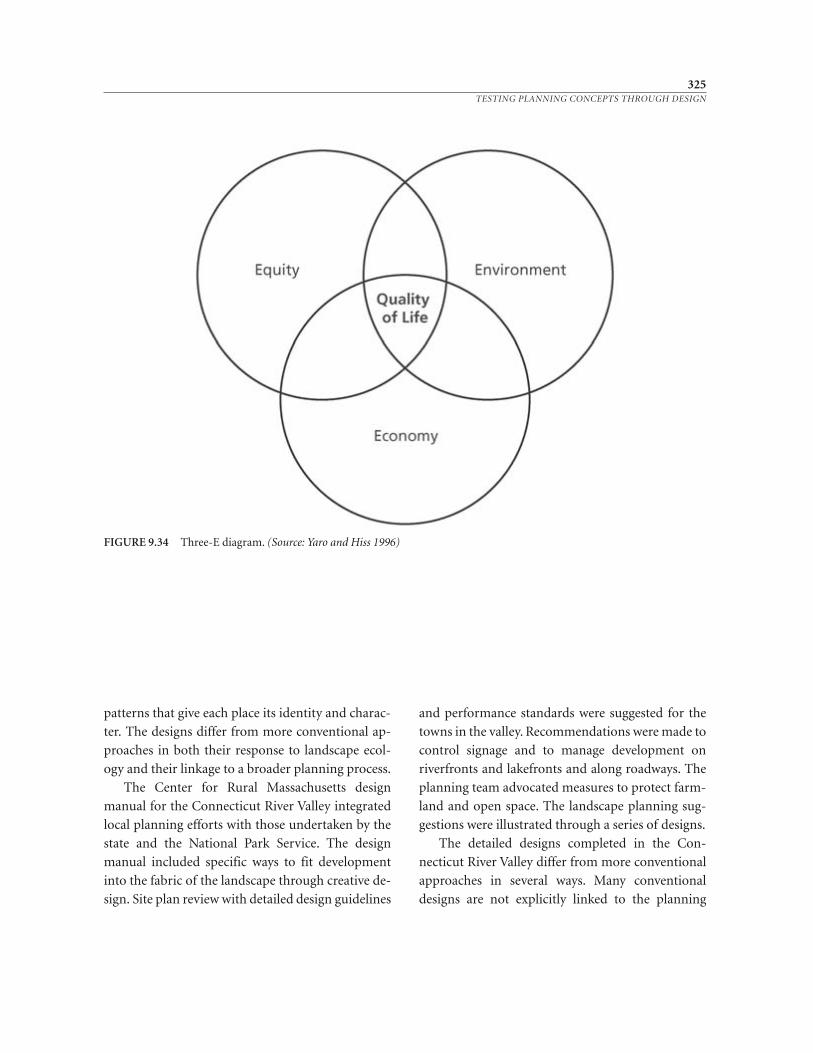
325TESTING PLANNING CONCEPTS THROUGH DESIGN
FIGURE 9.34 Three-E diagram. (Source: Yaro and Hiss 1996)
patterns that give each place its identity and charac-
ter. The designs differ from more conventional ap-
proaches in both their response to landscape ecol-
ogy and their linkage to a broader planning process.
The Center for Rural Massachusetts design
manual for the Connecticut River Valley integrated
local planning efforts with those undertaken by the
state and the National Park Service. The design
manual included specific ways to fit development
into the fabric of the landscape through creative de-
sign. Site plan review with detailed design guidelines
and performance standards were suggested for the
towns in the valley. Recommendations were made to
control signage and to manage development on
riverfronts and lakefronts and along roadways. The
planning team advocated measures to protect farm-
land and open space. The landscape planning sug-
gestions were illustrated through a series of designs.
The detailed designs completed in the Con-
necticut River Valley differ from more conventional
approaches in several ways. Many conventional
designs are not explicitly linked to the planning
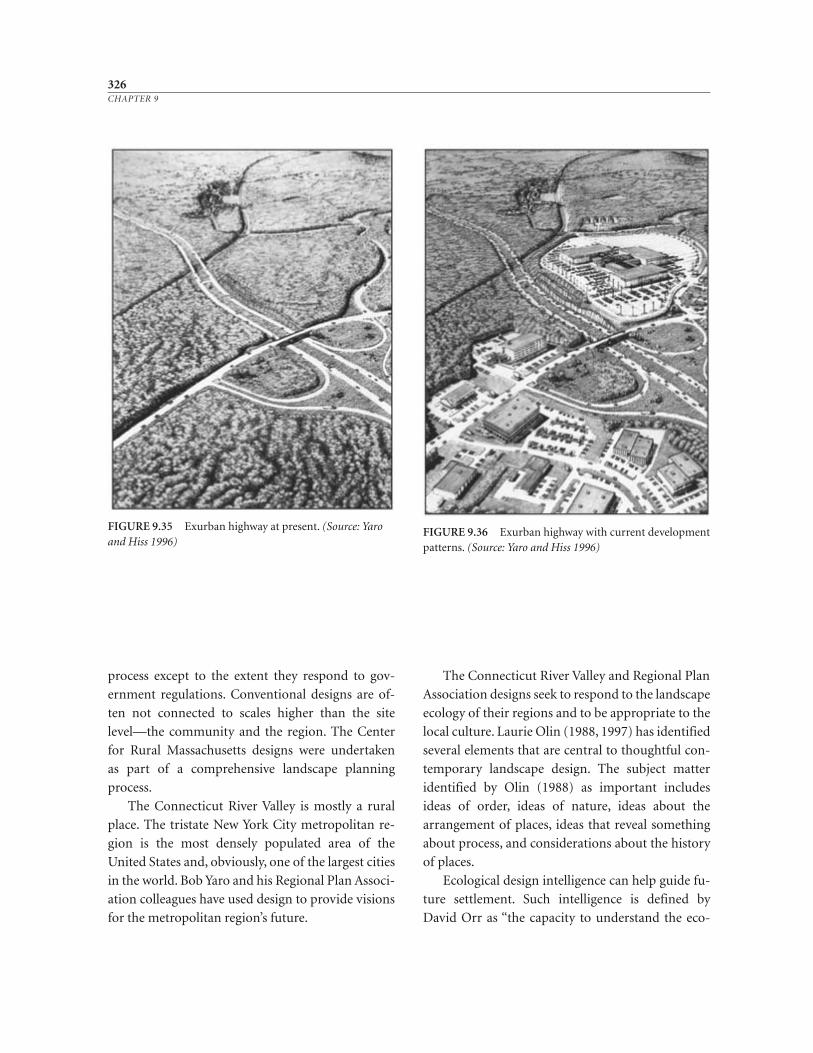
326CHAPTER 9
FIGURE 9.35 Exurban highway at present. (Source: Yaroand Hiss 1996)
FIGURE 9.36 Exurban highway with current developmentpatterns. (Source: Yaro and Hiss 1996)
process except to the extent they respond to gov-
ernment regulations. Conventional designs are of-
ten not connected to scales higher than the site
level—the community and the region. The Center
for Rural Massachusetts designs were undertaken
as part of a comprehensive landscape planning
process.
The Connecticut River Valley is mostly a rural
place. The tristate New York City metropolitan re-
gion is the most densely populated area of the
United States and, obviously, one of the largest cities
in the world. Bob Yaro and his Regional Plan Associ-
ation colleagues have used design to provide visions
for the metropolitan region’s future.
The Connecticut River Valley and Regional Plan
Association designs seek to respond to the landscape
ecology of their regions and to be appropriate to the
local culture. Laurie Olin (1988, 1997) has identified
several elements that are central to thoughtful con-
temporary landscape design. The subject matter
identified by Olin (1988) as important includes
ideas of order, ideas of nature, ideas about the
arrangement of places, ideas that reveal something
about process, and considerations about the history
of places.
Ecological design intelligence can help guide fu-
ture settlement. Such intelligence is defined by
David Orr as “the capacity to understand the eco-
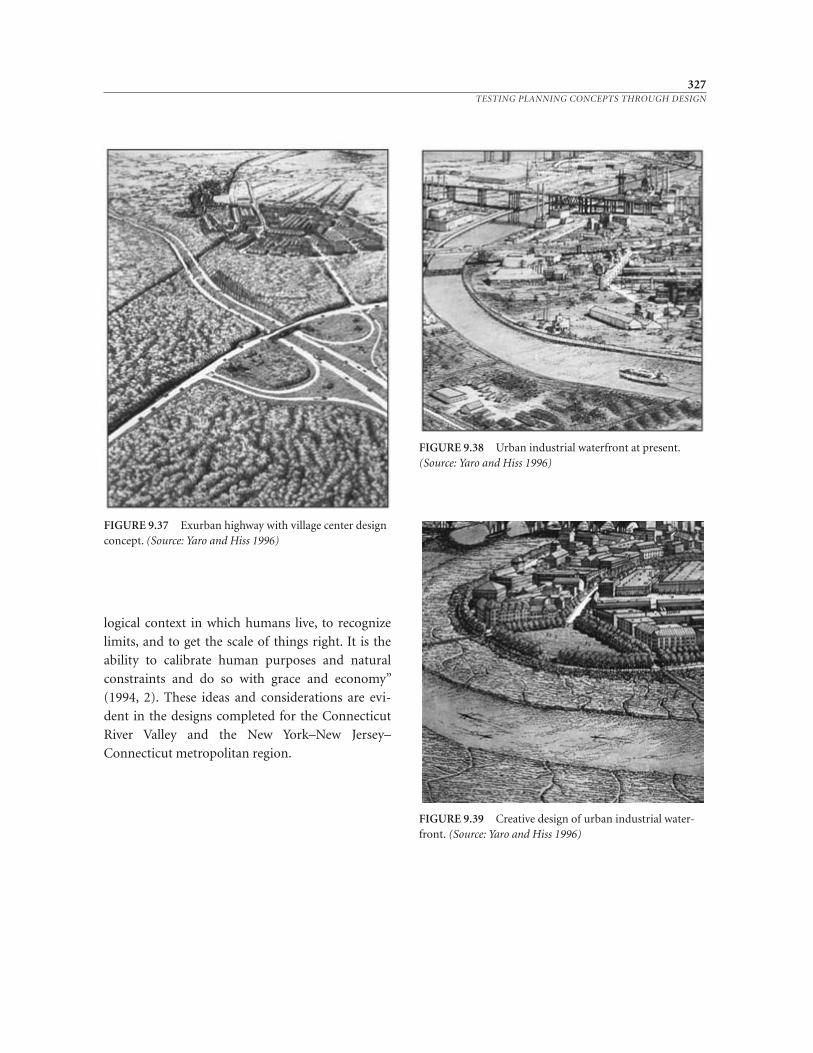
327TESTING PLANNING CONCEPTS THROUGH DESIGN
FIGURE 9.37 Exurban highway with village center designconcept. (Source: Yaro and Hiss 1996)
FIGURE 9.39 Creative design of urban industrial water-front. (Source: Yaro and Hiss 1996)
FIGURE 9.38 Urban industrial waterfront at present.(Source: Yaro and Hiss 1996)
logical context in which humans live, to recognize
limits, and to get the scale of things right. It is the
ability to calibrate human purposes and natural
constraints and do so with grace and economy”
(1994, 2). These ideas and considerations are evi-
dent in the designs completed for the Connecticut
River Valley and the New York–New Jersey–
Connecticut metropolitan region.
10PLAN AND DESIGNIMPLEMENTATION
329
Politicians, planners, lawyers, and public administrators have been quite resource-
ful in developing a wide array of techniques to realize plans. Once a plan has been
prepared and adopted, then it is necessary to develop the means for implementa-
tion. Often the selection of an implementation strategy coincides with the selection
of a preferred option, the development of a landscape plan, and/or the preparation
of a detailed design. For this discussion, it is helpful to separate the steps in the
planning process to illustrate the intricacies involved in each.
Local governments possess four general kinds of authority that can be used to
implement plans: the power to regulate, the power to condemn and exact, the power
to spend, and the power to tax. Regulation derives from the police powers to protect
public health, safety, welfare, and morals. The most common, and perhaps least
popular, regulatory technique used in the United States is zoning. Other tech-
niques, which may be used in conjunction with zoning, include planned unit devel-
opments (PUDs), performance standards, design guidelines, critical (or environ-
mentally sensitive) areas protection, wetland and riparian area protection, habitat
conservation plans, historic preservation, subdivision
regulations, and building codes. Covenants are private
contracts that can be used to regulate many of the same
features as zoning, design guidelines, and subdivision
ordinances.
The power to require private individuals to turn
over property or money is the second authority. Con-
demnation and exactions are examples. Condemnation
involves the seizure of property through eminent do-
main power. Eminent domain can be used for a public
purpose, such as the removal of blight. Obviously the
use of such power can be controversial.
Governments may spend money in a variety of ways
to implement plans. Governments can buy full or par-
tial rights to a parcel of property. Governments may
manage major expenditures through capital improve-
ment programs and through the administration of
public lands.
The power to tax is the fourth general kind of au-
thority. Taxing can be selective—rewarding some
kinds of development and penalizing others. Refer-
enda and state caps limit the extent of local taxation.
All four powers may be used in concert. The activi-
ties and programs of agencies can be coordinated to
manage growth. In addition to government activities,
there are also nongovernment strategies that can be
used to implement plans. For example, voluntary
neighborhood or homeowners’ associations can help
realize plans. These nongovernmental strategies can be
employed in coordination with the efforts of govern-
ments, or at deliberate variance.
Whatever means is selected to implement commu-
nity goals, it is crucial to assign responsibilities, re-
sources, and authority for the selected measure(s).
One device to help organize such responsibilities is an
implementation ma trix. After presenting an example
of this matrix, three examples of planning implemen-
tation are described: the York County, Pennsylvania,
sliding- scale zoning; the Black Hawk County, Iowa,
agricultural zoning; and the Scottsdale, Arizona, envi-
ronmentally sensitive lands ordinance.
Power to Regulate
The government power to regulate human activity
is carefully balanced against fundamental freedoms
of the individual. Cities and counties derive limited
regulatory power from the states, but local govern-
ments must use those powers in reasonable ways to
achieve public goals without infringing on basic in-
dividual rights. Regulations involve rules and re-
strictions that are used to control what an individ-
ual, a family, or a business can do with its property.
Such rules and restrictions may also involve how
land use on one property affects neighboring areas.
Regulations can direct activities from ones with
negative consequences to those with positive results.
Restrictions and rules help reinforce the responsi-
bilities that accompany property ownership.
Zoning
The planning profession is a fickle friend to zoning.
Since the 1960s, there has been a continual stream of
criticism about zoning in the planning community.
The noted historian John Reps called for a “requiem
for zoning” as early as 1964. Such diverse individuals
as Herbert Gans, Richard Babcock, Ada Louise
Huxtable, and Andres Duany joined the chorus of
criticism. Much of this criticism was justified; zon-
ing is an imperfect device.
Because of this criticism, the curricula of many
university planning programs do not address zoning
in much depth. For three reasons, academic plan-
ning programs have been in error for not addressing
zoning more fully in their curricula. First, the use of
zoning is incredibly widespread in the United States.
Although cities or counties are not required to use it
as a tool, nearly all do. Second, other professions—
law, civil engineering, geography, public administra-
tion, and landscape architecture—have continued to
incorporate zoning into their education and practice
(Platt 1996; Cullingworth 1997). Third, zoning has
remained an important tool for the practice of plan-
330CHAPTER 10
ning. With weak comprehensive planning statutes in
most states, planners must rely on case law for imple-
mentation. Zoning is used because of the strong
body of case law to support it. Zoning has been up-
held continually in the courts. The first zoning ordi-
nances in the United States were adopted in Califor-
nia in the late nineteenth century for repugnant
reasons (Hagman and Juergensmeyer 1986). The
purpose was to discriminate against Chinese immi-
grant businesses, specifically laundries, which were
considered fire risks and public nuisances. These or-
dinances were upheld in the California courts.
At about the same time in the eastern and Great
Lakes states and cities, similar devices were being
used to regulate the height and bulk of buildings. For
example, early in the twentieth century, Boston en-
acted building height controls because of shadowing.
The first comprehensive zoning ordinance, written
largely by attorney Edward M. Bassett, was adopted in
New York City in 1916. Because of the interest in zon-
ing created by Bassett and other lawyers (such as Al-
fred Bettman, James Metzenbaum, and F. B. Wil -
liams), the U.S. Department of Commerce published
the Standard Zoning Enabling Act in 1922. Zoning
was found to be constitutional in 1926 as a result of
the U.S. Supreme Court’s landmark decision Euclid
vs. Ambler Realty Co. (272 U.S. 365). As a result, even
more local interest was generated, and states contin-
ued to adopt the standard zoning enabling act.
The power to zone is derived from the police
power of government to ensure the welfare of a com-
munity. Zoning aims to reduce the negative impacts
that one land use will impose on surrounding land-
owners or occupants (e.g., the impacts of heavy
commercial traffic or loud industrial noises on
nearby residences). Such negative impacts are called
“externalities” by economists, although “positive” ex-
ternalities are also possible.
A well- prepared zoning ordinance, based on a
plan, seeks to secure the most appropriate use of
land and facilitate adequate but economical provi-
sion of public improvements. The authority for lo-
cal governments to adopt zoning ordinances is con-
tained in state enabling legislation. For example, ac-
cording to the Alabama enabling law, the specific
purposes of zoning regulations include to lessen
congestion in the streets, to secure safety from fire
and panic, to provide adequate light and air, to pre-
vent overcrowding of the land, to avoid undue con-
centration of population, to facilitate the provision
of public services, and to provide for the health and
general welfare (Juster 1994). Ideally, and as re-
quired by law in some states, a comprehensive or
general plan is a prerequisite for the preparation of a
zoning ordinance.
Zoning refers to the land- use controls that
limit the use to which land in an area may be put.
Zoning includes variances, special- use permits, and
other devices that allow regulatory flexibility. Ac-
cording to Robert Leary, “zoning is a means of [en-
suring] that the land uses of a community are prop-
erly situated in relation to one another, providing
adequate space for each type of development”
(1968, 403). Zoning ordinances address five general
sets of issues, according to Eric Kelly (1993) and
Robert Juster (1994): land use, the intensity of that
use, the bulk and form of buildings, the size of yards
and other open spaces around structures, and the den-
sity of population.
The basic idea of zoning is to separate poten-
tially conflicting land uses. Through such separa-
tion, property owners’ investments are protected
and land values are stabilized. Zoning ordinances
usually include a statement of purpose, definitions,
and a description of districts. Zoning districts com-
monly include specific uses like residential (R), agri-
culture (A), commercial (C), and industrial (I), as
well as areas like floodplains (FP) and open space
(OS). Uses are further specified by intensity like R1
(low- density residential) and R3 (high- density resi-
dential). Some rural counties have adopted similar
hierarchies for agricultural land use (e.g., A1 [or-
chards] to A3 [pastureland]). Each zone is regulated
by specific provisions, including permitted uses,
331PLAN AND DESIGN IMPLEMENTATION
accessory uses, provisional uses, height restrictions,
yard regulations, land- to- building ratio, parking re-
quirements, fencing and screening requirements,
sign requirements, and ingress and egress require-
ments. The districts are designated in a map that
is part of the ordinance. Ideally, these zoning dis-
tricts should relate to the suitability of the land for
such use. Ordinances also include provisions for
nonconforming uses, variances, enforcement, and
penalties.
Zoning overlay districts offer a means to protect
certain resources within a more traditional ordi-
nance. A district recognizing a valuable resource,
usually prime farmland, an historic place, or an en-
vironmentally sensitive area, overlays the other un-
derlying zoning categories. Such areas then receive
special protection. Specific places may also be recog-
nized in separate zoning categories, rather than
overlays. Agricultural protection zoning (APZ) pro-
vides an example (American Farmland Trust 1997;
Daniels and Bowers 1997). APZ ordinances “protect
the agricultural land base by limiting non- farm
uses, prohibiting high- density development, requir-
ing houses to be built on small lots and restricting
subdivision of land into parcels that are too small to
farm” (American Farmland Trust 1997, 317). The
types of APZ include exclusive agriculture zoning,
large minimum lot sizes, and area- based allowances.
Exclusive agricultural zoning “prohibits non-
farm residents and most non- agricultural activities;
exceptions are made for parcels of land that are not
suitable for farming” (American Farmland Trust
1997, 317). Large minimum lot size APZ require a
certain amount of land for every nonfarm dwelling
in the zone. Area- based allowance ordinances “es-
tablish a formula for the number of permitted non-
farm dwellings” (American Farmland Trust 1997,
317). Such ordinances can establish either fixed
area– based allowances or sliding-scale area–based
allowances. (See examples later in this chapter.)
There are a number of requirements that zoning
ordinances must follow. They are summarized by
Leary:
• While regulations may vary for different zon-
ing districts, they must be uniform within each
district for each class and kind of building.
• State legislatures and the courts have insisted
that there be a reasonable basis for classifying
particular areas differently from others.
• The courts have insisted that an ordinance
cover the entire jurisdictional area of a city or
county [or township], rather than singling out
a small area for regulation and leaving the re-
mainder unrestricted.
• The courts insist that the zoning regulations
be reasonable in their application to particular
properties. In other words, there should be a
relationship between the physical character of
an area and its zoning classification (1968,
404).
Four common criticisms of zoning are inconsis-
tency between the zoning ordinance and planning
goals and policies; the relative ease of zone changes
or rezoning; the case of obtaining variances; and the
vulnerability of ordinances to ephemeral political
changes. From the late 1960s and through the 1970s
there have been a number of gradual changes that
somewhat ameliorate these past weaknesses. Three
court decisions especially important in this regard
include:
• Udell vs. Haas (21 N.Y. 2d 46, 1968), in which
the New York Supreme Court in 1968 struck
down zoning provisions as contrary to the
comprehensive plan
• Fasano vs. Board of County Commissioners of
Washington County (507 P. 2d 23, 1973), in
which the Oregon Supreme Court in 1973 de-
termined that zone changes must be in con-
formance with the local comprehensive plan
• Baker vs. City of Milwaukie (P. 2d 772, 1975),
in which the Oregon Supreme Court in 1975
held that zoning decisions must be in accor-
dance with the comprehensive plan (Callies
1980).
332CHAPTER 10
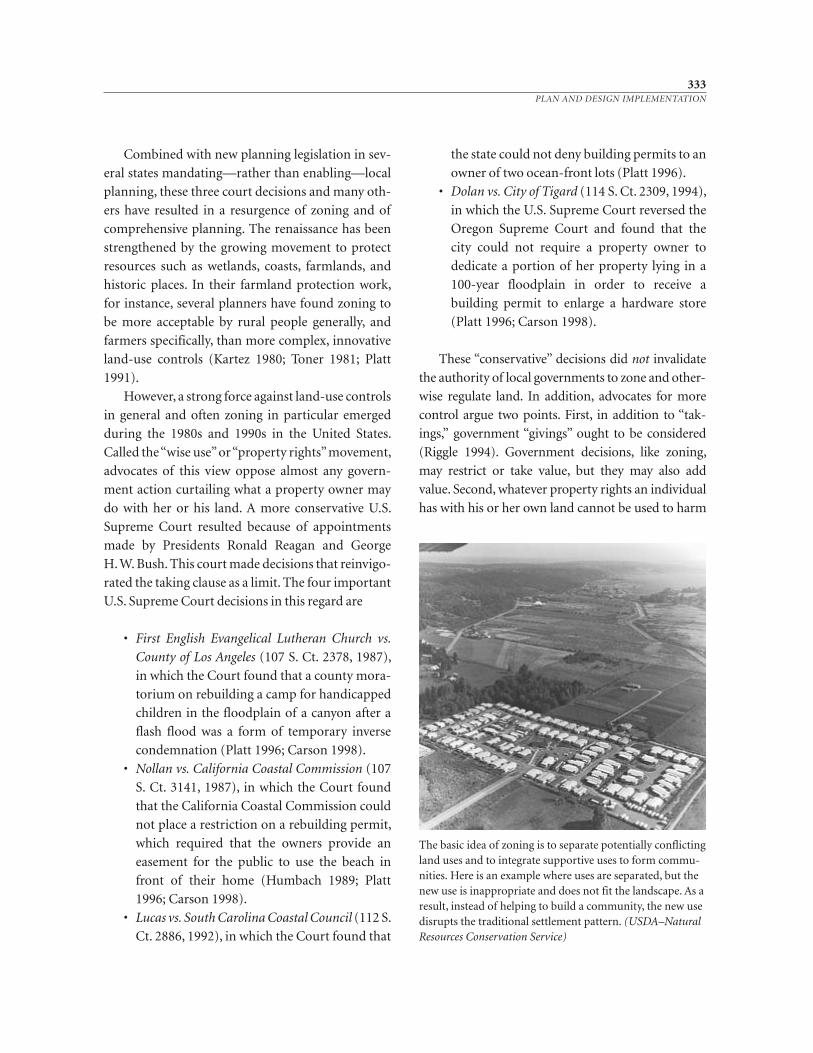
Combined with new planning legislation in sev-
eral states mandating—rather than enabling—local
planning, these three court decisions and many oth-
ers have resulted in a resurgence of zoning and of
comprehensive planning. The renaissance has been
strengthened by the growing movement to protect
resources such as wetlands, coasts, farmlands, and
historic places. In their farmland protection work,
for instance, several planners have found zoning to
be more acceptable by rural people generally, and
farmers specifically, than more complex, innovative
land- use controls (Kartez 1980; Toner 1981; Platt
1991).
However, a strong force against land- use controls
in general and often zoning in particular emerged
during the 1980s and 1990s in the United States.
Called the “wise use” or “property rights” movement,
advocates of this view oppose almost any govern-
ment action curtailing what a property owner may
do with her or his land. A more conservative U.S.
Supreme Court resulted because of appointments
made by Presidents Ronald Reagan and George
H. W. Bush. This court made decisions that reinvigo-
rated the taking clause as a limit. The four important
U.S. Supreme Court decisions in this regard are
• First English Evangelical Lutheran Church vs.
County of Los Angeles (107 S. Ct. 2378, 1987),
in which the Court found that a county mora-
torium on rebuilding a camp for handicapped
children in the floodplain of a canyon after a
flash flood was a form of temporary inverse
condemnation (Platt 1996; Carson 1998).
• Nollan vs. California Coastal Commission (107
S. Ct. 3141, 1987), in which the Court found
that the California Coastal Commission could
not place a restriction on a rebuilding permit,
which required that the owners provide an
easement for the public to use the beach in
front of their home (Humbach 1989; Platt
1996; Carson 1998).
• Lucas vs. South Carolina Coastal Council (112 S.
Ct. 2886, 1992), in which the Court found that
the state could not deny building permits to an
owner of two ocean- front lots (Platt 1996).
• Dolan vs. City of Tigard (114 S. Ct. 2309, 1994),
in which the U.S. Supreme Court reversed the
Oregon Supreme Court and found that the
city could not require a property owner to
dedicate a portion of her property lying in a
100- year floodplain in order to receive a
building permit to enlarge a hardware store
(Platt 1996; Carson 1998).
These “conservative” decisions did not invalidate
the authority of local governments to zone and other-
wise regulate land. In addition, advocates for more
control argue two points. First, in addition to “tak-
ings,” government “givings” ought to be considered
(Riggle 1994). Government decisions, like zoning,
may restrict or take value, but they may also add
value. Second, whatever property rights an individual
has with his or her own land cannot be used to harm
333PLAN AND DESIGN IMPLEMENTATION
The basic idea of zoning is to separate potentially conflictingland uses and to integrate supportive uses to form commu-nities. Here is an example where uses are separated, but thenew use is inappropriate and does not fit the landscape. As aresult, instead of helping to build a community, the new usedisrupts the traditional settlement pattern. (USDA–NaturalResources Conservation Service)
others. This good- neighborliness is at the essence of
zoning; that is, uses that negatively impact one an-
other should be separated.
Three principles emerge for planners from the
“property rights” cases. First, land- use controls can-
not remove all of the economic value from a parcel
of property. Second, the conditions or measures re-
quired for landowners must bear a clear relation to
the public purpose on which the government bases
its justification for the ordinance. Third, the amount
of burden or loss imposed on the landowner must
be roughly proportional to the size of the problem
that the land use might cause. If a planner follows
these three guidelines, zoning controls remain
workable, even under the rules set by the most con-
servative courts.
Planned Unit Developments (PUDs)
A planned unit development (PUD) is comprehen-
sively conceived and contains some mix of residen-
tial, commercial, industrial, institutional, and recre-
ational land uses on a single tract of land. Sometimes
a PUD ordinance is included as a part of zoning reg-
ulations, while at other times it is addressed under
separate rules. PUD ordinances offer benefits to both
developers and communities.
Under PUDs, developers are allowed greater de-
sign flexibility and greater densities, while commu-
nities are able to protect environmentally sensitive
areas or enforce design standards. For instance, a
tract of land may include areas with steep slopes and
unique vegetation. Part of the land may be located
inside a floodplain. These steep- sloped, vegetated,
flood- prone places could be left in open space, al-
lowing the developer to cluster denser housing or
commercial structures in a more suitable location.
PUD ordinances usually require a developer to
submit a complete development plan for review.
Such a plan usually includes a combination of maps,
drawings, site designs, charts, and supportive narra-
tive material that portray the development to be
achieved in the overall project. The PUD documents
provide sufficiently detailed information to both il-
lustrate and describe the intended character and
configuration of the proposed development. These
proposals are reviewed by the city or county staff,
the planning commission, and the elected officials.
Early PUDs have had three major characteris-
tics, according to Joseph De Chiara and Lee Koppel-
man (1975):
1. PUDs have usually involved areas and under-
takings of a relatively large scale, encompass-
ing at least 100 acres (40.5 hectares) and occa-
sionally smaller, but usually larger, up to
1,000 acres (405 hectares).
2. PUDs have usually involved a mixture of land
uses, building types, and densities.
3. PUDs have usually involved stage- by- stage
development over a relatively long period of
time (5 to 15 years) during which buildings,
arrangements, and uses may have to be re-
designed to meet changes in market condi-
tions, technology, financing, or even design
concepts.
Through time, PUDs have evolved. Today, PUDs
tend to address smaller areas of land, often 10 to 50
acres (4.05 to 20.25 hectares).
PUDs can result in the protection of impor-
tant or sensitive lands. Such lands sometimes are
transferred to public ownership or to a not- for-
profit conservancy organization. Frequently, home-
owners’ associations become responsible. Barry
Cullingworth (1997) notes that such associations
play an important role in managing commonly held
property. Homeowners’ associations also become
responsible for restrictions and covenants placed on
the PUD by the developer. Such restrictions can re-
quire, for example, that homeowners use only native
plants on their lawns and paint their houses certain
colors for compatibility. (See further discussion
about covenants later in this chapter.)
334CHAPTER 10
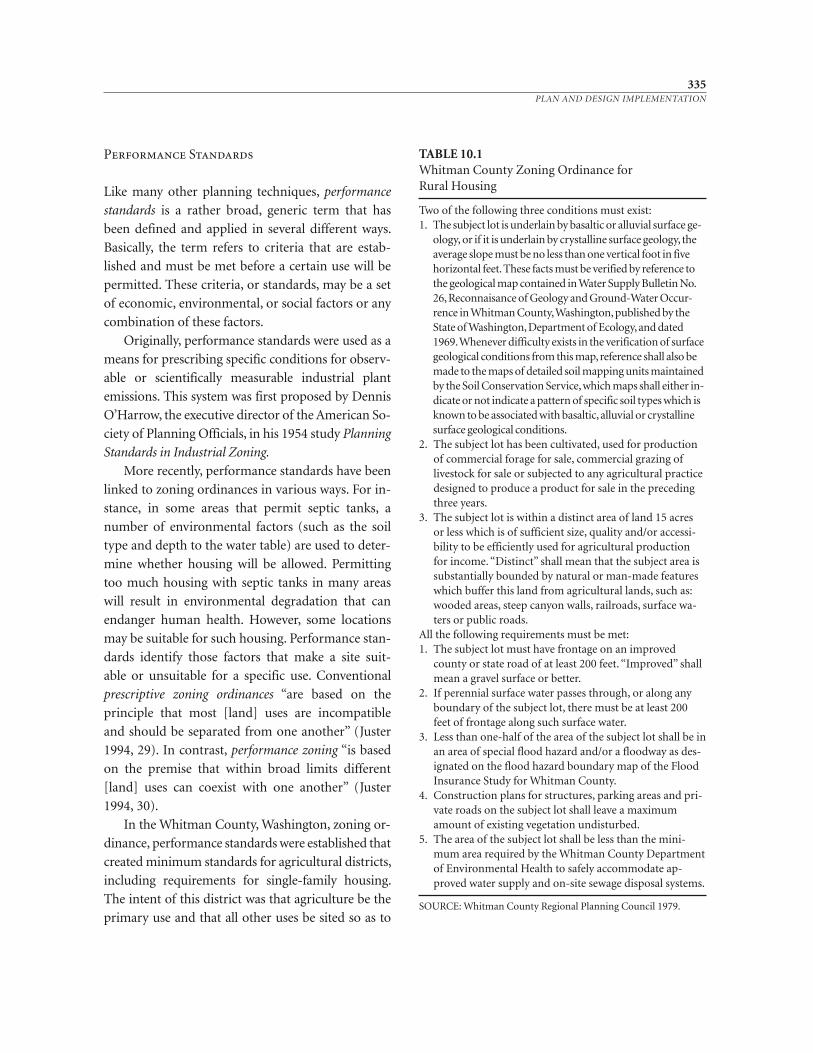
Performance Standards
Like many other planning techniques, performance
standards is a rather broad, generic term that has
been defined and applied in several different ways.
Basically, the term refers to criteria that are estab-
lished and must be met before a certain use will be
permitted. These criteria, or standards, may be a set
of economic, environmental, or social factors or any
combination of these factors.
Originally, performance standards were used as a
means for prescribing specific conditions for observ-
able or scientifically measurable industrial plant
emissions. This system was first proposed by Dennis
O’Harrow, the executive director of the American So-
ciety of Planning Officials, in his 1954 study Planning
Standards in Industrial Zoning.
More recently, performance standards have been
linked to zoning ordinances in various ways. For in-
stance, in some areas that permit septic tanks, a
number of environmental factors (such as the soil
type and depth to the water table) are used to deter-
mine whether housing will be allowed. Permitting
too much housing with septic tanks in many areas
will result in environmental degradation that can
endanger human health. However, some locations
may be suitable for such housing. Performance stan-
dards identify those factors that make a site suit-
able or unsuitable for a specific use. Conventional
prescriptive zoning ordinances “are based on the
principle that most [land] uses are incompatible
and should be separated from one another” (Juster
1994, 29). In contrast, performance zoning “is based
on the premise that within broad limits different
[land] uses can coexist with one another” (Juster
1994, 30).
In the Whitman County, Washington, zoning or-
dinance, performance standards were established that
created minimum standards for agricultural districts,
including requirements for single- family housing.
The intent of this district was that agriculture be the
primary use and that all other uses be sited so as to
335PLAN AND DESIGN IMPLEMENTATION
TABLE 10.1Whitman County Zoning Ordinance for Rural Housing
Two of the following three conditions must exist:1. The subject lot is underlain by basaltic or alluvial surface ge-
ology, or if it is underlain by crystalline surface geology, theaverage slope must be no less than one vertical foot in fivehorizontal feet.These facts must be verified by reference tothe geological map contained in Water Supply Bulletin No.26,Reconnaisance of Geology and Ground- Water Occur-rence in Whitman County,Washington,published by theState of Washington,Department of Ecology,and dated1969.Whenever difficulty exists in the verification of surfacegeological conditions from this map,reference shall also bemade to the maps of detailed soil mapping units maintainedby the Soil Conservation Service,which maps shall either in-dicate or not indicate a pattern of specific soil types which isknown to be associated with basaltic,alluvial or crystallinesurface geological conditions.
2. The subject lot has been cultivated, used for productionof commercial forage for sale, commercial grazing oflivestock for sale or subjected to any agricultural practicedesigned to produce a product for sale in the precedingthree years.
3. The subject lot is within a distinct area of land 15 acresor less which is of sufficient size, quality and/or accessi-bility to be efficiently used for agricultural productionfor income. “Distinct” shall mean that the subject area issubstantially bounded by natural or man- made featureswhich buffer this land from agricultural lands, such as:wooded areas, steep canyon walls, railroads, surface wa-ters or public roads.
All the following requirements must be met:1. The subject lot must have frontage on an improved
county or state road of at least 200 feet. “Improved” shallmean a gravel surface or better.
2. If perennial surface water passes through, or along anyboundary of the subject lot, there must be at least 200feet of frontage along such surface water.
3. Less than one- half of the area of the subject lot shall be inan area of special flood hazard and/or a floodway as des-ignated on the flood hazard boundary map of the FloodInsurance Study for Whitman County.
4. Construction plans for structures, parking areas and pri-vate roads on the subject lot shall leave a maximumamount of existing vegetation undisturbed.
5. The area of the subject lot shall be less than the mini-mum area required by the Whitman County Departmentof Environmental Health to safely accommodate ap-proved water supply and on- site sewage disposal systems.
SOURCE: Whitman County Regional Planning Council 1979.
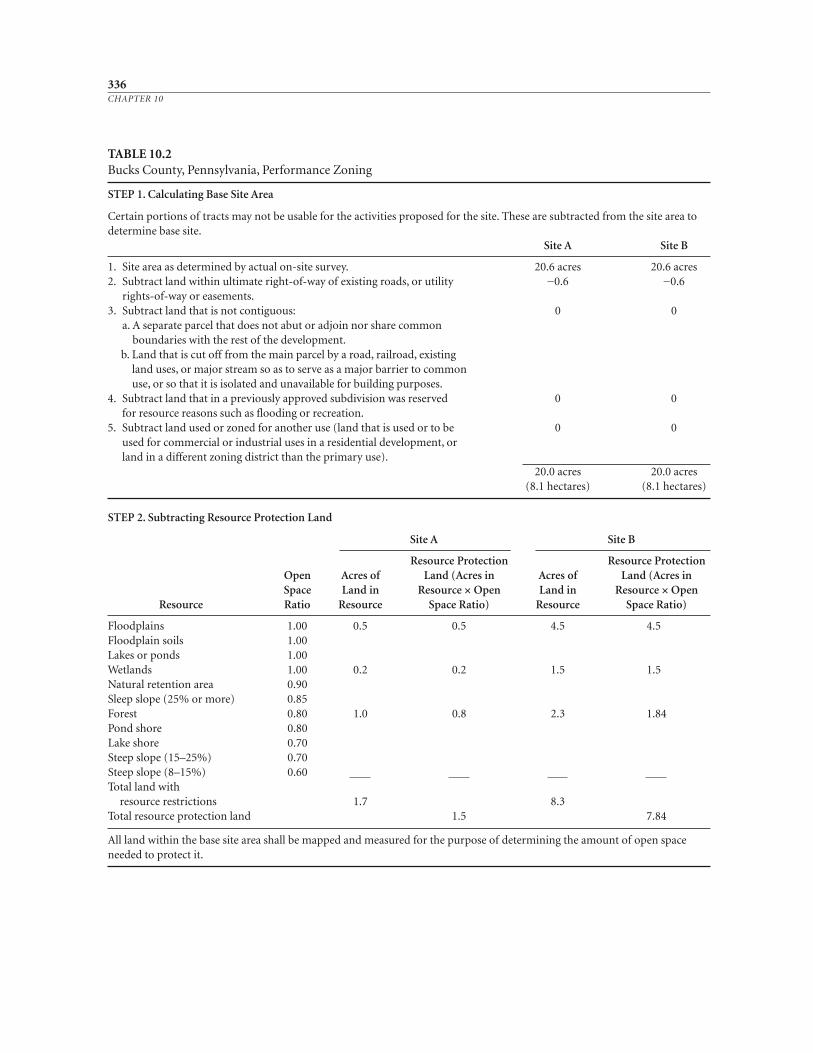
336CHAPTER 10
TABLE 10.2Bucks County, Pennsylvania, Performance Zoning
STEP 1. Calculating Base Site Area
Certain portions of tracts may not be usable for the activities proposed for the site. These are subtracted from the site area todetermine base site.
Site A Site B
1. Site area as determined by actual on- site survey. 20.6 acres 20.6 acres2. Subtract land within ultimate right- of- way of existing roads, or utility −0.6 −0.6
rights- of- way or easements.3. Subtract land that is not contiguous: 0 0
a. A separate parcel that does not abut or adjoin nor share commonboundaries with the rest of the development.
b. Land that is cut off from the main parcel by a road, railroad, existingland uses, or major stream so as to serve as a major barrier to commonuse, or so that it is isolated and unavailable for building purposes.
4. Subtract land that in a previously approved subdivision was reserved 0 0for resource reasons such as flooding or recreation.
5. Subtract land used or zoned for another use (land that is used or to be 0 0used for commercial or industrial uses in a residential development, orland in a different zoning district than the primary use).
20.0 acres 20.0 acres(8.1 hectares) (8.1 hectares)
STEP 2. Subtracting Resource Protection Land
Site A Site B
Resource Protection Resource ProtectionOpen Acres of Land (Acres in Acres of Land (Acres inSpace Land in Resource × Open Land in Resource × Open
Resource Ratio Resource Space Ratio) Resource Space Ratio)
Floodplains 1.00 0.5 0.5 4.5 4.5Floodplain soils 1.00Lakes or ponds 1.00Wetlands 1.00 0.2 0.2 1.5 1.5Natural retention area 0.90Sleep slope (25% or more) 0.85Forest 0.80 1.0 0.8 2.3 1.84Pond shore 0.80Lake shore 0.70Steep slope (15–25%) 0.70Steep slope (8–15%) 0.60 Total land with
resource restrictions 1.7 8.3Total resource protection land 1.5 7.84
All land within the base site area shall be mapped and measured for the purpose of determining the amount of open spaceneeded to protect it.
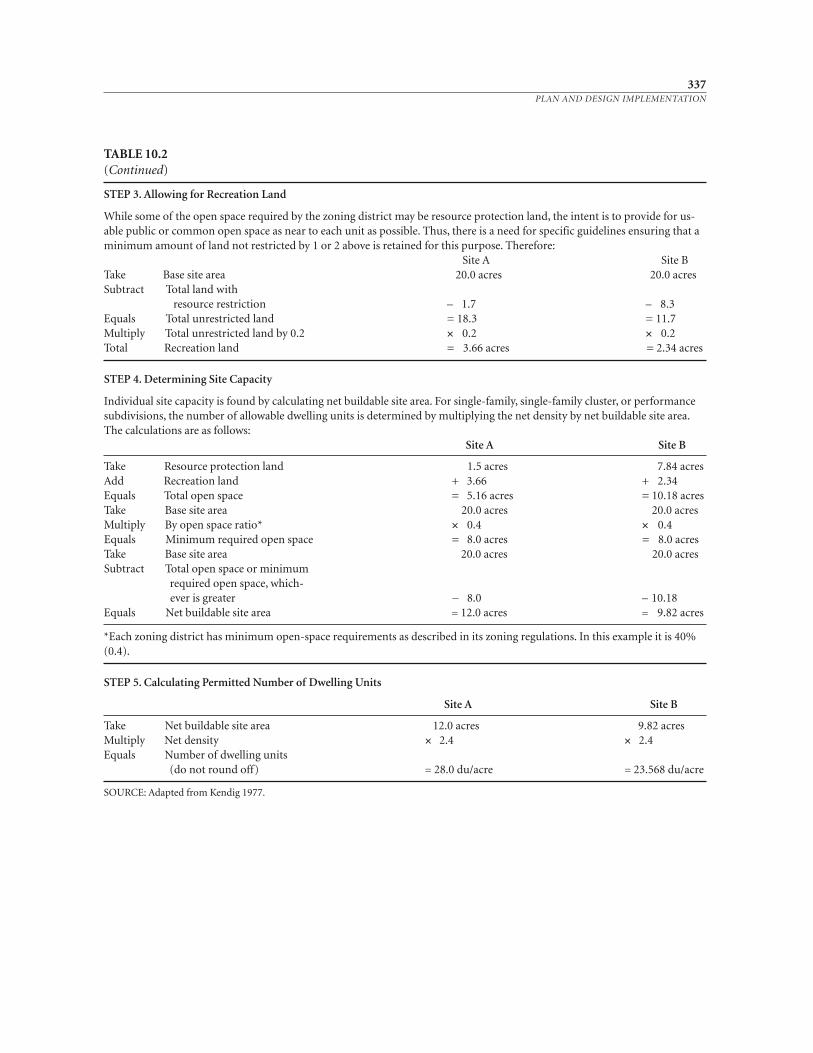
337PLAN AND DESIGN IMPLEMENTATION
TABLE 10.2(Continued)
STEP 3. Allowing for Recreation Land
While some of the open space required by the zoning district may be resource protection land, the intent is to provide for us-able public or common open space as near to each unit as possible. Thus, there is a need for specific guidelines ensuring that aminimum amount of land not restricted by 1 or 2 above is retained for this purpose. Therefore:
Site A Site BTake Base site area 20.0 acres 20.0 acresSubtract Total land with
resource restriction – 1.7 – 8.3Equals Total unrestricted land = 18.3 = 11.7Multiply Total unrestricted land by 0.2 × 0.2 × 0.2Total Recreation land = 3.66 acres = 2.34 acres
STEP 4. Determining Site Capacity
Individual site capacity is found by calculating net buildable site area. For single- family, single- family cluster, or performancesubdivisions, the number of allowable dwelling units is determined by multiplying the net density by net buildable site area.The calculations are as follows:
Site A Site B
Take Resource protection land 1.5 acres 7.84 acresAdd Recreation land + 3.66 + 2.34Equals Total open space = 5.16 acres = 10.18 acresTake Base site area 20.0 acres 20.0 acresMultiply By open space ratio* × 0.4 × 0.4Equals Minimum required open space = 8.0 acres = 8.0 acresTake Base site area 20.0 acres 20.0 acresSubtract Total open space or minimum
required open space, which-ever is greater − 8.0 – 10.18
Equals Net buildable site area = 12.0 acres = 9.82 acres
*Each zoning district has minimum open-space requirements as described in its zoning regulations. In this example it is 40%(0.4).
STEP 5. Calculating Permitted Number of Dwelling Units
Site A Site B
Take Net buildable site area 12.0 acres 9.82 acresMultiply Net density × 2.4 × 2.4Equals Number of dwelling units
(do not round off) = 28.0 du/acre = 23.568 du/acre
SOURCE: Adapted from Kendig 1977.
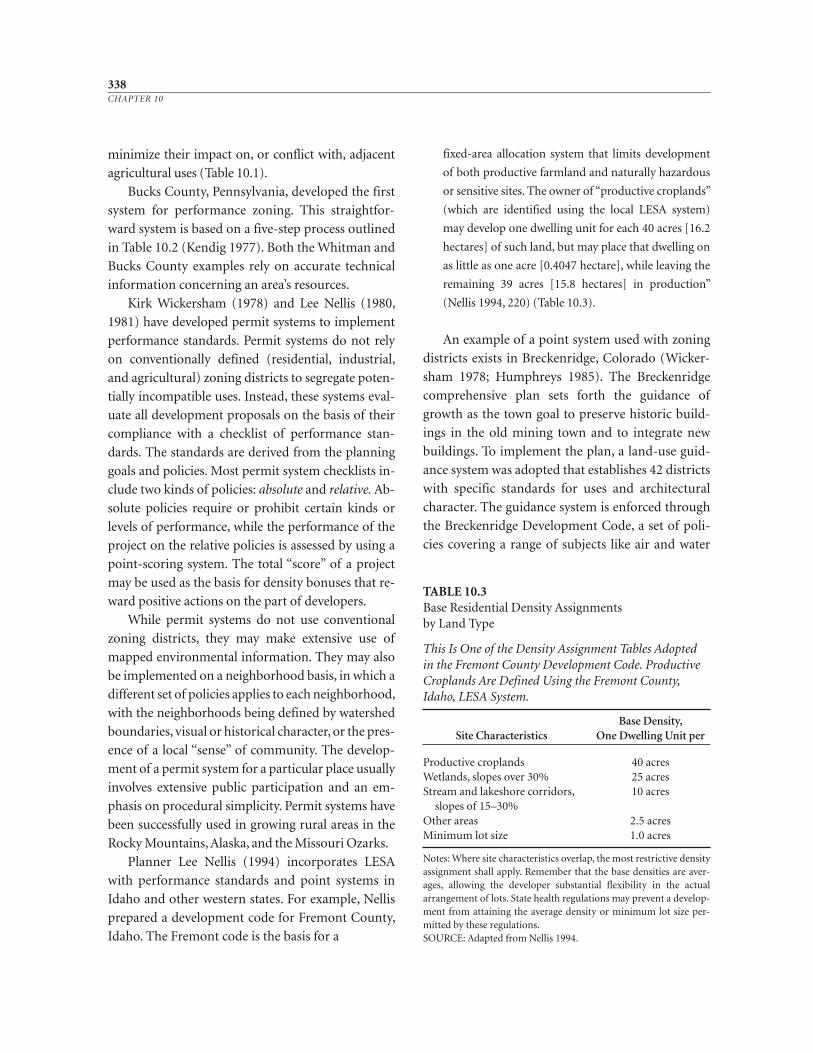
minimize their impact on, or conflict with, adjacent
agricultural uses (Table 10.1).
Bucks County, Pennsylvania, developed the first
system for performance zoning. This straightfor-
ward system is based on a five- step process outlined
in Table 10.2 (Kendig 1977). Both the Whitman and
Bucks County examples rely on accurate technical
information concerning an area’s resources.
Kirk Wickersham (1978) and Lee Nellis (1980,
1981) have developed permit systems to implement
performance standards. Permit systems do not rely
on conventionally defined (residential, industrial,
and agricultural) zoning districts to segregate poten-
tially incompatible uses. Instead, these systems eval-
uate all development proposals on the basis of their
compliance with a checklist of performance stan-
dards. The standards are derived from the planning
goals and policies. Most permit system checklists in-
clude two kinds of policies: absolute and relative. Ab-
solute policies require or prohibit certain kinds or
levels of performance, while the performance of the
project on the relative policies is assessed by using a
point- scoring system. The total “score” of a project
may be used as the basis for density bonuses that re-
ward positive actions on the part of developers.
While permit systems do not use conventional
zoning districts, they may make extensive use of
mapped environmental information. They may also
be implemented on a neighborhood basis, in which a
different set of policies applies to each neighborhood,
with the neighborhoods being defined by watershed
boundaries, visual or historical character, or the pres-
ence of a local “sense” of community. The develop-
ment of a permit system for a particular place usually
involves extensive public participation and an em-
phasis on procedural simplicity. Permit systems have
been successfully used in growing rural areas in the
Rocky Mountains, Alaska, and the Missouri Ozarks.
Planner Lee Nellis (1994) incorporates LESA
with performance standards and point systems in
Idaho and other western states. For example, Nellis
prepared a development code for Fremont County,
Idaho. The Fremont code is the basis for a
fixed- area allocation system that limits development
of both productive farmland and naturally hazardous
or sensitive sites. The owner of “productive croplands”
(which are identified using the local LESA system)
may develop one dwelling unit for each 40 acres [16.2
hectares] of such land, but may place that dwelling on
as little as one acre [0.4047 hectare], while leaving the
remaining 39 acres [15.8 hectares] in production”
(Nellis 1994, 220) (Table 10.3).
An example of a point system used with zoning
districts exists in Breckenridge, Colorado (Wicker-
sham 1978; Humphreys 1985). The Breckenridge
comprehensive plan sets forth the guidance of
growth as the town goal to preserve historic build-
ings in the old mining town and to integrate new
buildings. To implement the plan, a land- use guid-
ance system was adopted that establishes 42 districts
with specific standards for uses and architectural
character. The guidance system is enforced through
the Breckenridge Development Code, a set of poli-
cies covering a range of subjects like air and water
338CHAPTER 10
TABLE 10.3Base Residential Density Assignments by Land Type
This Is One of the Density Assignment Tables Adoptedin the Fremont County Development Code. ProductiveCroplands Are Defined Using the Fremont County,Idaho, LESA System.
Base Density, Site Characteristics One Dwelling Unit per
Productive croplands 40 acresWetlands, slopes over 30% 25 acresStream and lakeshore corridors, 10 acres
slopes of 15–30%Other areas 2.5 acresMinimum lot size 1.0 acres
Notes: Where site characteristics overlap, the most restrictive densityassignment shall apply. Remember that the base densities are aver-ages, allowing the developer substantial flexibility in the actualarrangement of lots. State health regulations may prevent a develop-ment from attaining the average density or minimum lot size per-mitted by these regulations.SOURCE: Adapted from Nellis 1994.
quality, the restoration of historic artifacts, and
housing (Humphreys 1985).
The Breckenridge code contains both absolute
and relative policies. Projects are analyzed by plan-
ners based on a point system to determine how well
the proposed development meets both absolute and
relative criteria. A proposed project must be ap-
proved by the town of Breckenridge when it meets
all of the absolute policies or has no negative effect
on those policies and when it receives a positive
score for its compliance with relative policies. Ac-
cording to Humphreys, the point analysis “is the
quantitative backbone of the development code sys-
tem” (1985, 23). He noted that “over the past three
years, I have watched over some 1,200 reviews, and,
in that time, I have come to believe that the develop-
ment code has major strengths in flexibility, com-
prehensiveness, and capacity for negotiation and re-
vision” (Humphreys 1985, 24).
Similar point systems, added on top of tradi-
tional zoning regulations, have also been used to
help manage growth on a competitive basis in Peta -
luma, California; Boulder, Colorado; and Ramapo,
New York. In competitive systems added to zoning
ordinances, a fixed number of permitted develop-
ments within each zone is allowed each year. Devel-
opment proposals are measured against fixed stan-
dards and permitted or denied on their merits.
Design Guidelines and Controls
Design guidelines and controls establish standards for
architecture and landscape architecture features of
new development. Samuel Stokes and his colleagues
note that design guidelines “can illustrate what ac-
ceptable development in the community should
look like, and they can be published by citizens’
groups or governmental bodies” (1997, 199). Design
review processes can be either voluntary or required.
When voluntary, the applicable standards are usually
referred to as design guidelines. Mandatory review
standards are called design controls. The guideline or
control standards are published by the municipality
or the county. A proponent for a new development
or a change of a building’s use must present designs
illustrating how they are in compliance with the
standards. Usually a design review board, comprised
of local experts, is responsible for checking whether
the designs are in compliance.
The standards address requirements for the site,
for proposed structure(s), and often for off- site
features (Shirvani 1990). Site standards usually in-
clude guidelines for parking, circulation, paving,
lawns, plantings, drainage, irrigation, signs, fencing,
setbacks, and building envelopes. Building stan-
dards address elements such as height, color, materi-
als, roofing, floor- area ratios, and building foot-
prints. The off- site elements may include views,
buffers, roadways, and adjacent land uses.
Critical or Environmentally
Sensitive Areas
Performance standards and design guidelines are
tools to encourage as well as control development. In
contrast, critical or environmentally sensitive areas
protection are a way to prohibit or minimize devel-
opment. Critical and environmentally sensitive areas
are terms and concepts often used interchangeably.
Critical areas were proposed by the American Law
Institute’s Model Land Development Code, which de-
scribed them as follows:
• An area significantly affected by, or having an
effect upon, an existing or proposed major
public facility or other areas of major public
investment
• An area containing or having a significant im-
pact upon historical, natural or environmen-
tal resources of regional or statewide impor-
tance (American Law Institute 1974)
The Washington State Environmental Policy Act
(SEPA) describes environmentally sensitive areas as
“[those that] could have a significant adverse envi-
ronmental impact, including but not limited to,
339PLAN AND DESIGN IMPLEMENTATION
areas with unstable soils, steep slopes, unusual or
unique plants or animals, wetlands, or areas which
lie within flood plains” (State of Washington 1984,
section 908, see also Washington Department of
Ecology 1995).
Adapting the Washington State definition, envi-
ronmentally sensitive areas can be thus defined as
places vulnerable to negative environmental im-
pacts. These could include areas such as unstable
soils, steep slopes, floodplains, wetlands, and certain
plant and animal habitats. Forster Ndubisi and his
colleagues define environmentally sensitive areas as
“landscape elements or places which are vital to the
long- term maintenance of biological diversity, soil,
water, or other natural resources both on the site
and the regional context. They include wildlife habi-
tat areas, steep slopes, wetlands, and prime agricul-
tural lands” (1995, 159).
Certain states (such as Washington) and local ju-
risdictions (such as Scottsdale, Arizona, and Water-
loo, Ontario) require the protection of environmen-
tally sensitive areas. The State of Washington
protects environmentally sensitive areas through its
state environmental policy act provisions. SEPA pro-
visions in Washington enable city and county gov-
ernments to designate areas within their jurisdic-
tions that are environmentally sensitive. As a result
of SEPA, a procedural review is required for pro-
posed actions that may impact the environment.
Some actions, however, are specifically exempt from
the environmental review process. Because these ac-
tions still may have a significant impact on environ-
mental quality, the SEPA law includes the provision
allowing the local designation of environmentally
sensitive areas. Within locally designated areas, pro-
posals, programs, and actions are subject to environ-
mental review procedures (Jennings and Reganold
1988; see also City of Everett 1994). Furthermore, the
Washington Growth Management Act requires cities
and counties to identify and protect critical areas.
(See Kitsap County Department of Community De-
velopment 1998, for example.) These Washington
provisions are consistent with the suggestions of the
American Law Institute (1974) that critical area pol-
icy be adopted on the state level.
On the local level, such an area may be separated
by zoning districts or overlay several zones. For ex-
ample, the city of Scottsdale defines and regulates
“land slopes of 15 percent or more in the moun-
tains, unstable slopes, special features, water
courses, geologic conditions, and native vegetation”
as environmentally sensitive (City of Scottsdale
1991a, 4). The Regional Municipality of Waterloo in
Ontario, Canada, identifies an environmentally sen-
sitive policy area as a place demonstrating one or
more of the following characteristics:
1. The occurrence of significant, rare, or endan-
gered indigenous species within the desig-
nated area
2. The identification of plant and/or animal as-
sociations and/or land-forms that are un-
usual or of high quality, regionally, provin-
cially, or nationally
3. The classification of the area as one that is
large and undisturbed, thereby potentially af-
fording a habitat to species that are intolerant
of human disturbance
4. The classification of the area as one that is
unique with limited representation in the re-
gion, or a small remnant of once- larger habi-
tats that have virtually disappeared
5. The classification of the area as one contain-
ing an unusual diversity of plant and animal
communities due to a variety of geomorpho-
logical features, soils, water, and microcli-
matic effects
6. The identification of the area as one that pro-
vides a linking system of undisturbed forest
or other natural refuge for the movement of
wildlife over a considerable distance
7. The performance of the area in serving a vital
ecological function, such as maintaining the
hydrological balance over a widespread area
acting as a natural water storage or recharge
area
340CHAPTER 10
8. The recognition of the area as one demon-
strating any of the above qualities but suffer-
ing from a minor reduction of its uniqueness
or rareness by intrusion of human activities
(Smith et al. 1997)
The courts have generally taken a favorable view
toward protecting critical or environmentally sensi-
tive areas. For instance, in the classic 1972 case Just
vs. Marinette County (56 Wisc. 2d 7), the Wisconsin
Supreme Court upheld county restrictions on wet-
lands. According to the Wisconsin court, “[Mari -
nette County’s] ordinance that re quires a wetland
owner to obtain a permit before filling, draining, or
dredging is consti tutional, since restrictions on use
of privately owned wetlands serve to protect the
state’s natural resources and constitute reasonable
application of police power” (Wisconsin Supreme
Court 1972).
In this case, wetlands were clearly identified
through state policy and local ordinance. According
to the Marinette County shorelines ordinance, such
wetlands needed protection because “un controlled
use of shorelines and pollution of navigable waters
adversely affect public health, safety, convenience,
general welfare, and impair the tax base” (Wisconsin
Supreme Court 1972).
George Newman (1982) suggested a system for
classifying environmentally sensitive areas adapted
from those developed by the New Jersey Pinelands
Commission and the Smithsonian Institution
(Table 10.4). The Pinelands Commission divides
environmentally sensitive areas into four categories:
ecologically critical areas, perceptually and culturally
critical areas, economically critical areas, and natural
hazard critical areas. Newman renamed economi-
cally critical areas “resource production critical
areas” and developed the following definitions:
1. Ecologically critical areas contain one or more
significant natural elements that could be de-
graded or lost as a result of uncontrolled or
incompatible development. Significant ele-
ments are those that are identified as being
necessary to maintain the essential character
and integrity of the existing environment.
They are based on the quality, the scarcity, or
the role the element plays in the ecosystem.
These areas can provide many amenities and
services to the public and to private land-
owners. Maintaining the natural system helps
to provide flood control, water purification,
water supply, pollution abatement, wildlife
habitat, and a pleasing and visually diversified
landscape. Ecologically critical areas provide
sites for outdoor education or scientific study,
or habitat for the spawning and rearing of
anadromous fish. Such areas also have psy-
chological or philosophical value for those
who gain comfort from knowing that open
semiwilderness areas and rare and endan-
gered species and habitats still exist.
2. Perceptually and culturally critical areas that
contain one or more significant scenic, recre-
ational, archaeological, historical, or cultural
resources that could be degraded or lost as a
result of uncontrolled or incompatible devel-
opment. They have features such as access
341PLAN AND DESIGN IMPLEMENTATION
TABLE 10.4Environmentally Sensitive Area Classification System
Class Subclass
Ecologically 1. Natural wildlife habitat areascritical areas 2. Natural ecological areas
3. Scientific areasPerceptually and 4. Scenic areas
culturally critical 5. Wilderness recreation areasareas 6. Historic, archaeological, and
cultural areasResource production 7. Agricultural lands
critical areas 8. Water quality areas9. Mineral extraction areas
Natural hazard 10. Flood- prone areascritical areas 11. Fire hazard areas
12. Geologic hazard areas13. Air pollution areas
SOURCES: Column 1 is adapted from Pinelands Commission 1980;column 2 is adapted from Center for Natural Areas, Smithsonian In-stitution 1974.
and proximity to water, special recreational
resources, or buildings possessing significant
historical or archaeological values.
3. Resource production critical areas provide es-
sential products supporting either the local
economy or economies of a larger scale. The
significant resources can be either the essen-
tial products (e.g., agricultural crops, timber
products, or sand and gravel) or the elements
necessary for the production of such essential
products (e.g., soil and water). These re-
sources are primarily economically valuable;
however secondary values may include recre-
ational values or cultural or life support val-
ues associated with local communities. These
resources can be renewable, like timber, or
nonrenewable, like mineral resources.
4. Natural hazard critical areas may result in the
loss of life and/or property due to incom-
patible development. These places include
areas prone to landslide, flood, earthquake,
avalanche, or fire hazard (Adapted from the
Pinelands Commission 1980; Newman 1982).
Newman suggested the use of the definitions de-
veloped by the Smithsonian Institution for use in
the subclasses of his system:
1. Natural wildlife habitat areas are essential to
the preservation of game species and rare,
threatened, or endangered species. They
provide food, shelter, and breeding areas
and must be large enough to fulfill the spe-
cies needs. Such areas include sites where
animals seasonally concentrate, such as deer
yards, migratory stop- over spots, aquatic
spawning pools, and nesting places for birds.
It is important that the area is inherently sta-
ble, which is more likely if it contains a high
diversity of flora or fauna. Additionally, a
greater variety of animal species is associ-
ated with a diversity of vegetation types. The
uses of these areas will vary according to
wildlife. Habitats of endangered species may
have to be strictly protected, while recre-
ational hunting can be permitted in areas
supporting game species.
2. Natural ecological areas have ecosystem units
that are either superlative examples of their
type or locations that perform a vital func-
tion in maintaining the ecological integrity
and environmental quality of a larger region.
These are areas containing an unusual diver-
sity of plant and animal communities due to
a variety of geomorphological features, soils,
water, and microclimate conditions. Fur-
thermore, natural ecological areas may be an
important component of the human life
support system, such as flood control, water
purification, water supply, pollution abate-
ment, and oxygen regeneration. Examples
include wetlands and riparian areas.
3. Scientific areas are of geological interest or
present ecological processes warranting
study. Most of these areas have been studied,
and they can be identified by experts within
the local scientific and academic commu-
nity. Scarcity of geological or ecological fea-
tures on regional, state, and national levels is
an important factor.
4. Wilderness recreation areas are tracts of land
large enough to support recreational activi-
ties such as camping, hiking, birdwatching,
and canoeing. Isolated wilderness areas close
to population centers are especially valuable.
5. Scenic areas contain natural features of suffi-
cient aesthetic quality to warrant their
preservation. Several methods have been de-
veloped for determining scenic values, but
the determination of aesthetic quality re-
mains subjective. Some methods attempt to
survey the public’s values of various land-
scapes and geological formations, while
other methods review such factors as vegeta-
tive type, composition, and texture; topog-
raphy; and geographic features. The scarcity
342CHAPTER 10
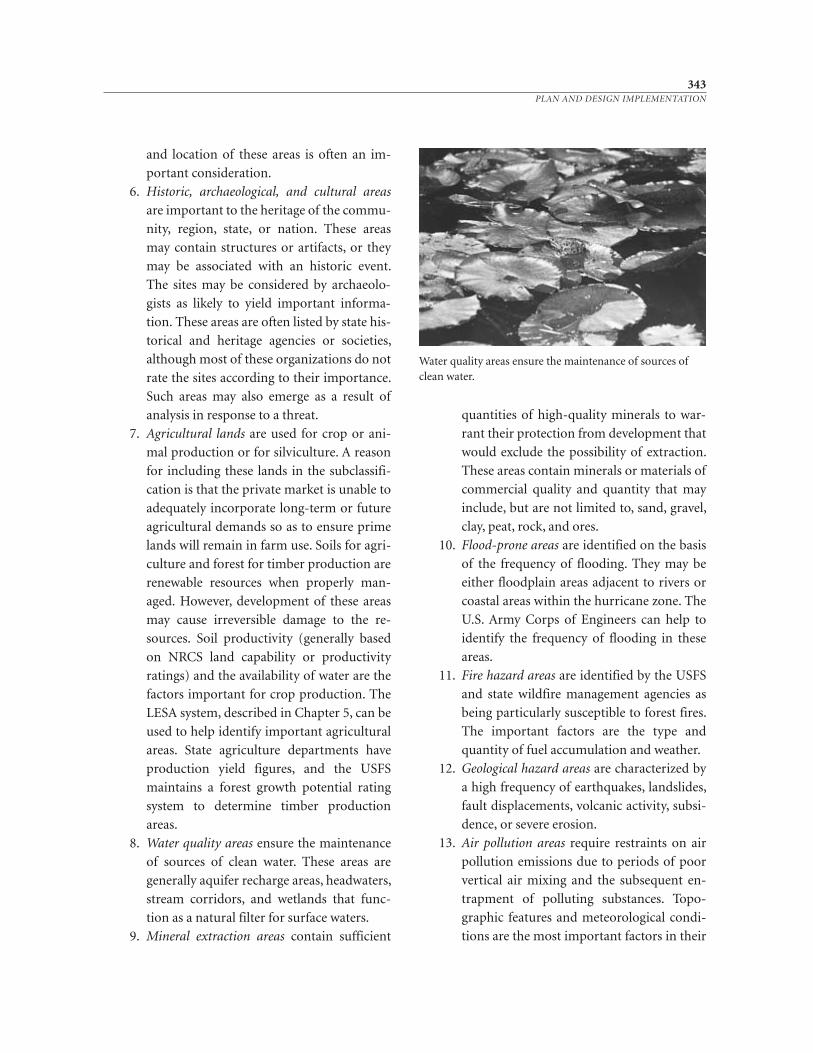
343PLAN AND DESIGN IMPLEMENTATION
Water quality areas ensure the maintenance of sources ofclean water.
and location of these areas is often an im-
portant consideration.
6. Historic, archaeological, and cultural areas
are important to the heritage of the commu-
nity, region, state, or nation. These areas
may contain structures or artifacts, or they
may be associated with an historic event.
The sites may be considered by archaeolo-
gists as likely to yield important informa-
tion. These areas are often listed by state his-
torical and heritage agencies or societies,
although most of these organizations do not
rate the sites according to their importance.
Such areas may also emerge as a result of
analysis in response to a threat.
7. Agricultural lands are used for crop or ani-
mal production or for silviculture. A reason
for including these lands in the subclassifi-
cation is that the private market is unable to
adequately incorporate long- term or future
agricultural demands so as to ensure prime
lands will remain in farm use. Soils for agri-
culture and forest for timber production are
renewable resources when properly man-
aged. However, development of these areas
may cause irreversible damage to the re-
sources. Soil productivity (generally based
on NRCS land capability or productivity
ratings) and the availability of water are the
factors important for crop production. The
LESA system, described in Chapter 5, can be
used to help identify important agricultural
areas. State agriculture departments have
production yield figures, and the USFS
maintains a forest growth potential rating
system to determine timber production
areas.
8. Water quality areas ensure the maintenance
of sources of clean water. These areas are
generally aquifer recharge areas, headwaters,
stream corridors, and wetlands that func-
tion as a natural filter for surface waters.
9. Mineral extraction areas contain sufficient
quantities of high- quality minerals to war-
rant their protection from development that
would exclude the possibility of extraction.
These areas contain minerals or materials of
commercial quality and quantity that may
include, but are not limited to, sand, gravel,
clay, peat, rock, and ores.
10. Flood-prone areas are identified on the basis
of the frequency of flooding. They may be
either floodplain areas adjacent to rivers or
coastal areas within the hurricane zone. The
U.S. Army Corps of Engineers can help to
identify the frequency of flooding in these
areas.
11. Fire hazard areas are identified by the USFS
and state wildfire management agencies as
being particularly susceptible to forest fires.
The important factors are the type and
quantity of fuel accumulation and weather.
12. Geological hazard areas are characterized by
a high frequency of earthquakes, landslides,
fault displacements, volcanic activity, subsi-
dence, or severe erosion.
13. Air pollution areas require restraints on air
pollution emissions due to periods of poor
vertical air mixing and the subsequent en-
trapment of polluting substances. Topo-
graphic features and meteorological condi-
tions are the most important factors in their
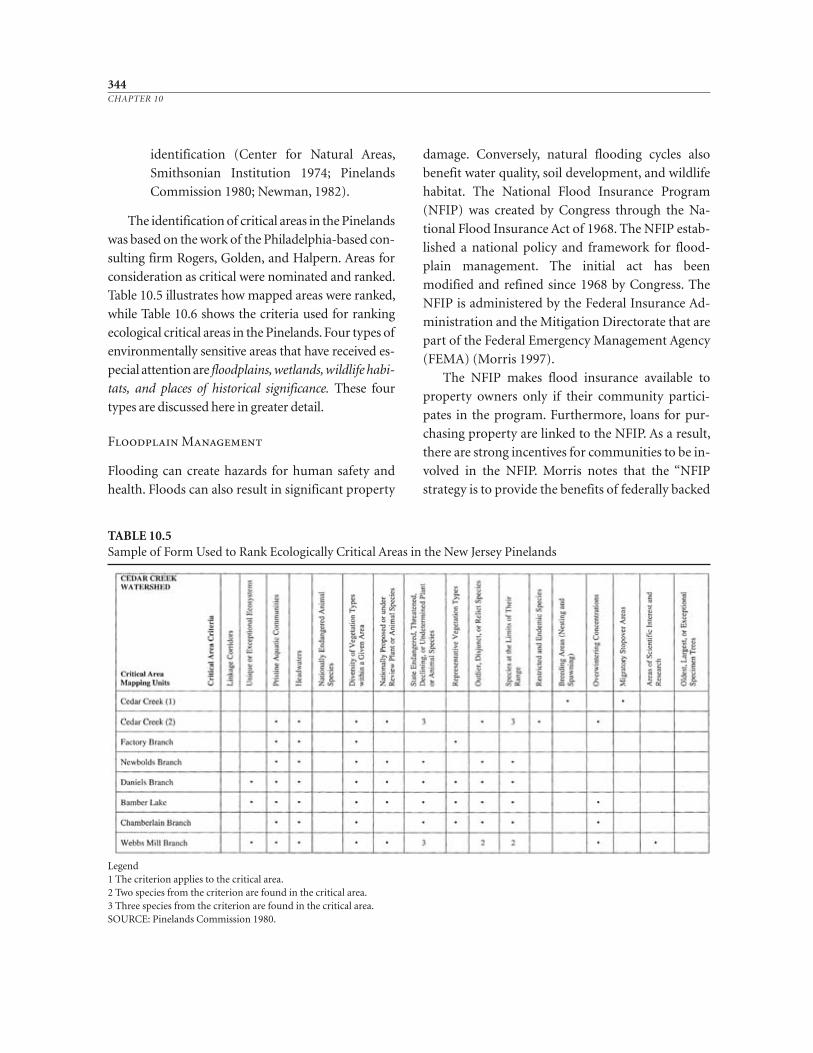
identification (Center for Natural Areas,
Smithsonian Institution 1974; Pinelands
Commission 1980; Newman, 1982).
The identification of critical areas in the Pine lands
was based on the work of the Philadelphia- based con-
sulting firm Rogers, Golden, and Halpern. Areas for
consideration as critical were nominated and ranked.
Table 10.5 illustrates how mapped areas were ranked,
while Table 10.6 shows the criteria used for ranking
ecological critical areas in the Pinelands. Four types of
environmentally sensitive areas that have received es-
pecial attention are floodplains, wetlands, wildlife habi-
tats, and places of historical significance. These four
types are discussed here in greater detail.
Floodplain Management
Flooding can create hazards for human safety and
health. Floods can also result in significant property
damage. Conversely, natural flooding cycles also
benefit water quality, soil development, and wildlife
habitat. The National Flood Insurance Program
(NFIP) was created by Congress through the Na-
tional Flood Insurance Act of 1968. The NFIP estab-
lished a national policy and framework for flood-
plain management. The initial act has been
modified and refined since 1968 by Congress. The
NFIP is administered by the Federal Insurance Ad-
ministration and the Mitigation Directorate that are
part of the Federal Emergency Management Agency
(FEMA) (Morris 1997).
The NFIP makes flood insurance available to
property owners only if their community partici-
pates in the program. Furthermore, loans for pur-
chasing property are linked to the NFIP. As a result,
there are strong incentives for communities to be in-
volved in the NFIP. Morris notes that the “NFIP
strategy is to provide the benefits of federally backed
344CHAPTER 10
TABLE 10.5Sample of Form Used to Rank Ecologically Critical Areas in the New Jersey Pinelands
Legend1 The criterion applies to the critical area.2 Two species from the criterion are found in the critical area.3 Three species from the criterion are found in the critical area.SOURCE: Pinelands Commission 1980.
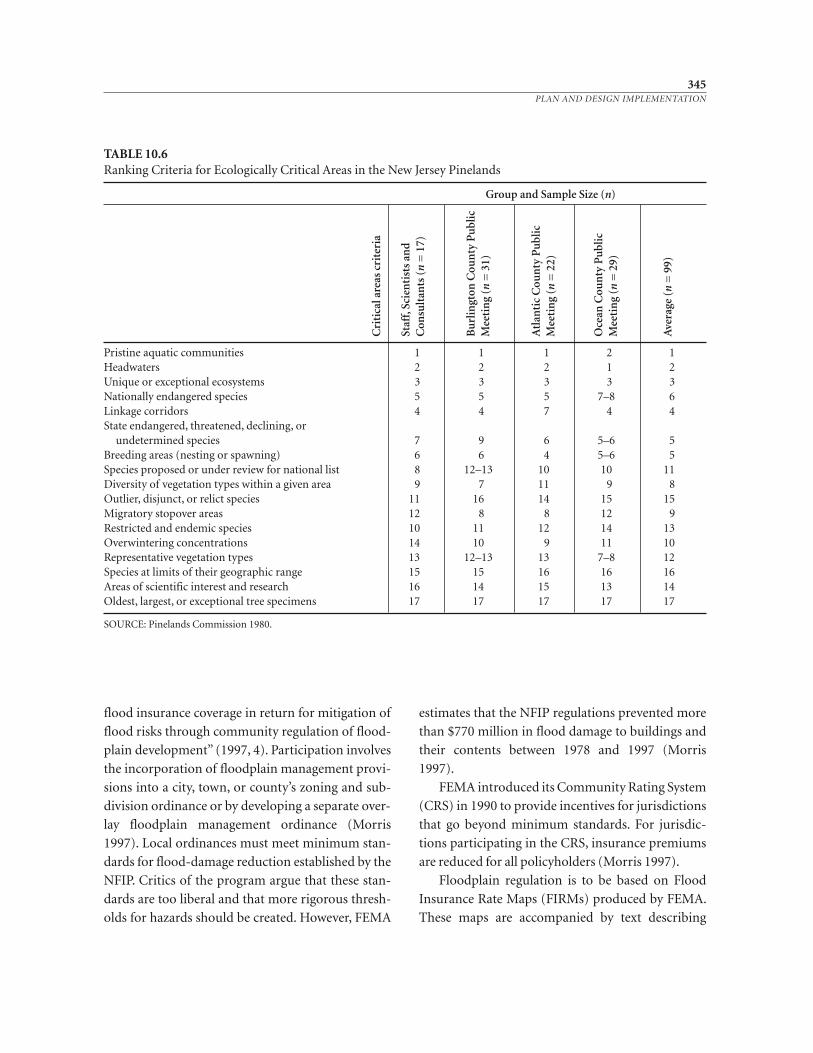
flood insurance coverage in return for mitigation of
flood risks through community regulation of flood-
plain development” (1997, 4). Participation involves
the incorporation of floodplain management provi-
sions into a city, town, or county’s zoning and sub-
division ordinance or by developing a separate over-
lay floodplain management ordinance (Morris
1997). Local ordinances must meet minimum stan-
dards for flood- damage reduction established by the
NFIP. Critics of the program argue that these stan-
dards are too liberal and that more rigorous thresh-
olds for hazards should be created. However, FEMA
estimates that the NFIP regulations prevented more
than $770 million in flood damage to buildings and
their contents between 1978 and 1997 (Morris
1997).
FEMA introduced its Community Rating System
(CRS) in 1990 to provide incentives for jurisdictions
that go beyond minimum standards. For jurisdic-
tions participating in the CRS, insurance premiums
are reduced for all policyholders (Morris 1997).
Floodplain regulation is to be based on Flood
Insurance Rate Maps (FIRMs) produced by FEMA.
These maps are accompanied by text describing
345PLAN AND DESIGN IMPLEMENTATION
TABLE 10.6Ranking Criteria for Ecologically Critical Areas in the New Jersey Pinelands
Group and Sample Size (n)
Pristine aquatic communities 1 1 1 2 1Headwaters 2 2 2 1 2Unique or exceptional ecosystems 3 3 3 3 3Nationally endangered species 5 5 5 7–8 6Linkage corridors 4 4 7 4 4State endangered, threatened, declining, or
undetermined species 7 9 6 5–6 5Breeding areas (nesting or spawning) 6 6 4 5–6 5Species proposed or under review for national list 8 12–13 10 10 11Diversity of vegetation types within a given area 9 7 11 9 8Outlier, disjunct, or relict species 11 16 14 15 15Migratory stopover areas 12 8 8 12 9Restricted and endemic species 10 11 12 14 13Overwintering concentrations 14 10 9 11 10Representative vegetation types 13 12–13 13 7–8 12Species at limits of their geographic range 15 15 16 16 16Areas of scientific interest and research 16 14 15 13 14Oldest, largest, or exceptional tree specimens 17 17 17 17 17
SOURCE: Pinelands Commission 1980.
Cri
tica
l are
as c
rite
ria
Staf
f, Sc
ien
tist
s an
dC
onsu
ltan
ts (
n=
17)
Bu
rlin
gton
Cou
nty
Pu
blic
Mee
tin
g (n
= 3
1)
Atl
anti
c C
oun
ty P
ubl
icM
eeti
ng
(n=
22)
Oce
an C
oun
ty P
ubl
icM
eeti
ng
(n=
29)
Ave
rage
(n
= 9
9)
flood areas and related hazards. One- hundred- year
flood boundaries are delineated on FIRMs. “A ‘100-
year flood,’ or base flood, is the flood that has a one
percent or greater chance of being equaled or ex-
ceeded in any given year” (Morris 1997, 6). FIRMs
also show the location of floodways and often 500-
year flood boundaries. The NFIP requires that all
lands within the 100- year floodplain be regulated.
As a result, it is important to include FEMA, FIRM,
and related data in the ecological inventories dis-
cussed in Chapter 3. Marya Morris (1997) provides
an excellent detailed discussion about how flood in-
formation can be incorporated into subdivision and
other local ordinances.
Wetland and Riparian Area Protection
The protection of wetlands and riparian areas has
emerged as an important environmental planning
issue. In the United States, several federal, state, and
local laws have been enacted to protect wetlands and
riparian areas. Specifically, the federal Clean Water
Act (CWA) includes protection requirements in
Sections 301 and 303 for state water quality stan-
dards, Section 401 for state certification of federal
actions (projects, permits, and licenses), and Section
404 for dredge and fill permits. The Section 401 wa-
ter quality state certification element has been called
the “sleeping giant” of wetlands protection because
it empowers state officials to veto or condition fed-
erally permitted or licensed activities that do not
comply with state water quality standards. State offi-
cials have used this power infrequently, although
considerable potential exists for stronger state and
local wetlands protection efforts (World Wildlife
Fund 1992).
Historically, wetlands and riparian areas were
viewed differently than they are today. Throughout
human history people have located their settlements
near rivers and lakes for water supply and waste dis-
posal. As a result, most cities and towns are near, or
have replaced, wetlands and riparian areas. Prior to
1970, wetlands and riparian corridors were gener-
ally viewed as waste areas that had minimal value for
urban uses such as housing and commerce. Because
of flooding dangers, areas adjacent to rivers and
streams can be dangerous places to locate homes
and businesses. As a result, wetlands and riparian
areas often became sites for unwanted or undesir-
able uses such as heavy industry and landfills. But
with the growth of metropolitan regions, wetland
and riparian areas have become more desirable for
development. As William Reilly, the former EPA di-
rector, noted before a U.S. Senate panel, “Wetlands
are where the country is going. [Population is con-
centrated] on the coasts; on rivers; around lakes; on
flat, undeveloped, cheap and developable land. Wet-
lands are, and will continue to be, under stress”
(Lawson 1991, 77–78).
Since 1970, there has been a change in the public
perception of wetlands and riparian areas. Increas-
ingly, these areas have become recognized for their
positive values for flood protection, water quality
and supply, recreation, and as wildlife and fish habi-
tats. As a result, a few states, then the federal govern-
ment, and finally several more states and localities
implemented programs encouraging the protection
of wetlands and riparian areas. Beginning in the late
1960s and throughout the 1970s, there was a host of
such laws addressing clean water, floodplains, wild
and scenic rivers, the coastal zone, endangered spe-
cies, and mining reclamation (U.S. Department of
the Interior 1988). Beginning in 1985, the preserva-
tion of wetlands on farms was required as a prereq-
uisite for federal agricultural subsidies. These fed-
eral laws and associated state laws are dynamic and
continue to evolve (Steiner et al. 1994). The federal
and state laws have prompted, and even required,
local regulation.
States have adopted various protection strate-
gies, including:
• Assumption of the CWA, Section 404 permit-
ting program
346CHAPTER 10
• Involvement in implementation of a federal
CWA, Section 404 permitting program
• Implementation of a CWA, Section 401 certi-
fication program
• Promulgation of narrative or numeric stan-
dards and/or use of antidegradation standards
to protect wetland/riparian areas
• Other natural resource protection programs
that protect riparian areas
• Establishment of voluntary or mandatory wa-
tercourse alteration or streamside forestry best
management practices
• Establishment of protection mandates
through executive orders
• Creation of opportunities for protection
through tax incentives, easements, recognition
programs, technical assistance, and education
• Protection by acquisition
• Inclusion of riparian areas and wetlands in
definitions of “waters of the state” for regula-
tory purposes (Steiner et al. 1994)
Federal Wetlands Protection. As observed by
William Want, “Most wetlands regulation has been
done at the federal level and the federal program of
regulation has become very complex” (1990, 1–1).
Historically, federal and state governments were
concerned about waterways for their navigational
values, principally for defense and commerce. Water
was relatively plentiful and abundant in the eastern
United States. With increased knowledge about san-
itation and disease in the nineteenth century, cou-
pled with the growth of industrial cities, there began
to be concern about water quality. As the people of
the nation moved west, wetlands were viewed as a
nuisance to be converted to productive use as water
irrigation systems were developed for agriculture
and urban uses. In the late 1960s, the status quo be-
gan to change as federal agencies began to protect
wetlands for their ecological values (Want 1990). In
1972, with the passage of the Federal Water Pollu-
tion Control Act Amendments (the Clean Water Act
[CWA]), a new era of water quality protection be-
gan that included valuing wetlands differently.
The CWA is the principal law authorizing wet-
lands regulation (33 USC 1251–1376). A major reg-
ulatory program is the National Pollution Discharge
Elimination System (NPDES), which is adminis-
tered by the EPA. Want notes, “Section 301 of the
Act prohibits the discharge of any pollutant without
a permit. Section 402 of the [Act] authorizes EPA
[or an approved state] to issue such permits. Section
404 of the Act carves out from the general EPA per-
mit authority a special authority for the [U.S. Army
Corps of Engineers] to issue permits for the dis-
charge of two types of pollutants: dredged material
and fill material” (1990, 2–7). As a result, the EPA
and Corps jointly administer the 404 program. EPA
has veto authority over the issuance by the Corps of
the 404 permits. However, EPA has seldom used this
power. According to former EPA administrator
William K. Reilly, the “Corps issues over 10,000 per-
mits every year, and in the 18- year history of the
program, EPA has vetoed only 11 projects” (1991,
193).
The main purpose of the CWA “is to restore and
maintain the chemical, physical, and biological in-
tegrity of the Nation’s water.” In the 1987 amend-
ments to the act, Congress established the policy “to
recognize, preserve, and protect the primary re-
sponsibilities and rights of states to prevent, reduce,
and eliminate pollution, to plan the development
and use (including restoration, preservation, and
enhancement) of land and water resources. . . .” The
1987 amendments also established the policy of
state implementation of Sections 402 and 404 per-
mit programs.
Section 401 of the CWA allows the states “to veto
federally permitted or licensed activities that do not
comply with state water quality standards” (Ransel
and Meyers 1988, 340). The states have the responsi-
bility for setting these standards, subject to EPA ap-
proval. Section 303 of the CWA gives states “great lat-
itude in formulating their water quality standards”
347PLAN AND DESIGN IMPLEMENTATION
(Ransel and Meyers 1988, 344). States may establish
designated water uses and water quality standards
criteria sufficient to “protect the public health or
welfare, enhance the quality of the water and serve
the purposes of the Act” [33 USC 1313 (c)(2)(A)].
According to K. Ransel and E. Meyers, quoting
partially from the CWA, “any applicant for a
Federal license or permit for conducting any activ-
ity . . . which may result in any discharge to the nav-
igable waters [is required] to secure from the state in
which the discharge originates a certification that
the discharge will comply with several provisions of
the CWA related to effluent discharge limitations
and water quality standards” (1988, 342). Thus, a
denial of Section 401 certification “operates as an
absolute veto” and “the state’s decision is not review-
able by the federal permitting agency or the federal
courts” (Ransel and Meyers 1988, 342). As a result,
Ransel and Meyers observe, “the states’ most impor-
tant role in the Section 401 certification process is to
determine whether an applicant for a federal license
or permit has demonstrated compliance with state
water quality standards and, if not, to deny or ‘con-
dition’ certification so that the activity will comply
with those standards” (1988, 343).
General State Responses. States have responded
to federal law in a variety of ways. For instance, as a
result of the CWA, states “may assume responsibility
for issuing [404] permits in certain waters under
their jurisdiction in accordance with criteria devel-
oped by EPA” (U.S. General Accounting Office
[GAO] 1988, 10). Thus far, only Michigan and New
Jersey have assumed primacy for issuing 404 per-
mits, although several other states have considered
or are considering the possibility (World Wildlife
Fund 1992). Most states have obtained primacy
from EPA for the Section 402 NPDES permit
program.
According to D. Salvesen, “The resulting pro-
grams [of the states], no two of which are identical,
vary from those that regulate a wide range of activi-
ties such as dredging and draining, to programs that
provide tax incentives to protect wetlands perma-
nently” (1990, 43). Salvesen notes that, in general,
states regulate wetlands in two ways: “indirectly, as
part of broad regulatory programs such as the
coastal zone management program or the water
quality certification provisions under Section 401 of
the Clean Water Act, and directly, by enacting laws
specifically to regulate activities in wetlands” (1990,
43).
Although California, Oregon, and Washington
have noteworthy wetlands programs built on coastal
protection laws, western states have been slow in de-
veloping overall protection policies. In 1985 J. A.
Kusler noted that “no state west of the Mississippi
has adopted a comprehensive wetland or riparian
habitat protection program for public or private
lands, unlike the coastal states which have all
adopted some protection for their coastal wetlands
and 11 eastern states which have adopted freshwater
protection statutes” (1985, 6). Western states face a
special opportunity and challenge because of the
large blocks of public lands. Kusler notes that six
western states have adopted floodplain regulatory
laws, but “these are narrowly aimed at reducing
flood losses and have no provision for vegetation”
(1985, 6). Conversely, Oregon has adopted statewide
planning guidelines for riverside lands and a state
tax credit program, while Washington includes in-
land shorelines as part of its coastal zone program.
According to C. R. Griffin, “nearly half of the 50
states regulate wetlands uses to varying degrees;
however, many of these states protect only coastal
wetlands, with inland wetlands being largely unpro-
tected except by federal regulations” (1989, 25).
These inland areas are significant because they rep-
resent the majority of the wetlands remaining in the
lower 48 states. Much of this inland wetland is
closely associated, physically and biologically, with
riparian areas. Griffin (1989) has identified only 13
states nationwide with comprehensive inland wet-
lands protection laws, while the World Wildlife
348CHAPTER 10
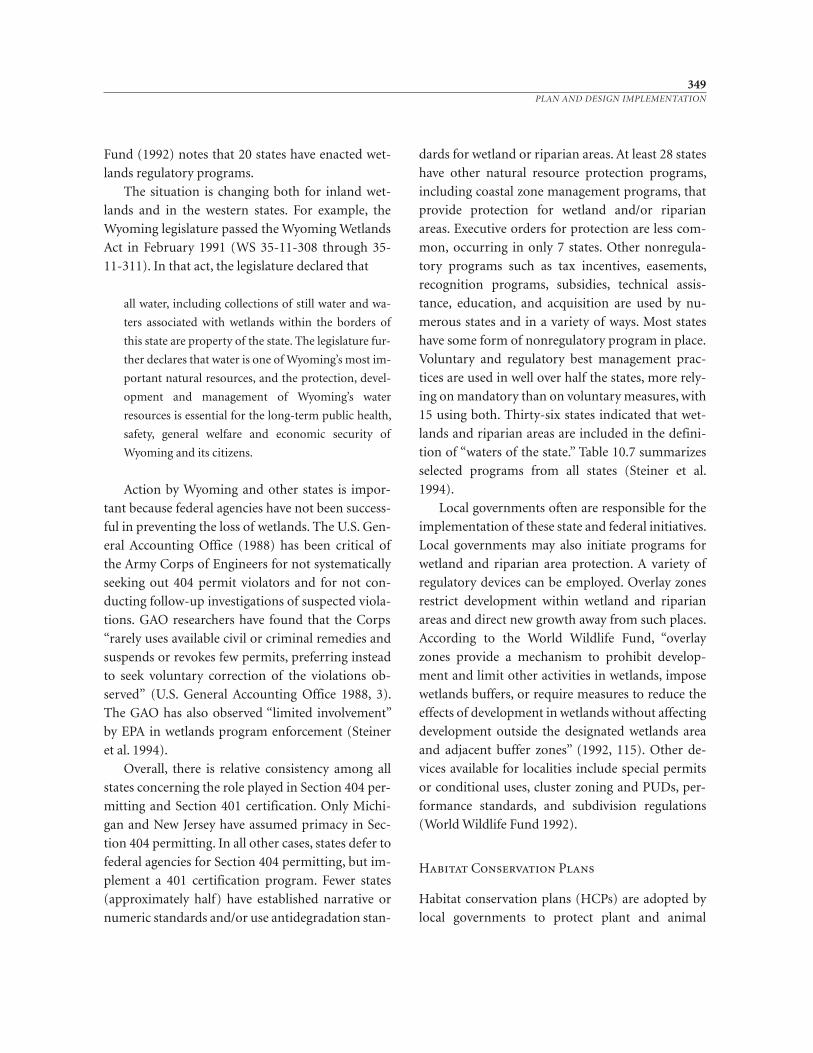
Fund (1992) notes that 20 states have enacted wet-
lands regulatory programs.
The situation is changing both for inland wet-
lands and in the western states. For example, the
Wyoming legislature passed the Wyoming Wetlands
Act in February 1991 (WS 35- 11- 308 through 35-
11- 311). In that act, the legislature declared that
all water, including collections of still water and wa-
ters associated with wetlands within the borders of
this state are property of the state. The legislature fur-
ther declares that water is one of Wyoming’s most im-
portant natural resources, and the protection, devel-
opment and management of Wyoming’s water
resources is essential for the long- term public health,
safety, general welfare and economic security of
Wyoming and its citizens.
Action by Wyoming and other states is impor-
tant because federal agencies have not been success-
ful in preventing the loss of wetlands. The U.S. Gen-
eral Accounting Office (1988) has been critical of
the Army Corps of Engineers for not systematically
seeking out 404 permit violators and for not con-
ducting follow- up investigations of suspected viola-
tions. GAO researchers have found that the Corps
“rarely uses available civil or criminal remedies and
suspends or revokes few permits, preferring instead
to seek voluntary correction of the violations ob-
served” (U.S. General Accounting Office 1988, 3).
The GAO has also observed “limited involvement”
by EPA in wetlands program enforcement (Steiner
et al. 1994).
Overall, there is relative consistency among all
states concerning the role played in Section 404 per-
mitting and Section 401 certification. Only Michi-
gan and New Jersey have assumed primacy in Sec-
tion 404 permitting. In all other cases, states defer to
federal agencies for Section 404 permitting, but im-
plement a 401 certification program. Fewer states
(approximately half) have established narrative or
numeric standards and/or use antidegradation stan-
dards for wetland or riparian areas. At least 28 states
have other natural resource protection programs,
including coastal zone management programs, that
provide protection for wetland and/or riparian
areas. Executive orders for protection are less com-
mon, occurring in only 7 states. Other nonregula-
tory programs such as tax incentives, easements,
recognition programs, subsidies, technical assis-
tance, education, and acquisition are used by nu-
merous states and in a variety of ways. Most states
have some form of nonregulatory program in place.
Voluntary and regulatory best management prac-
tices are used in well over half the states, more rely-
ing on mandatory than on voluntary measures, with
15 using both. Thirty- six states indicated that wet-
lands and riparian areas are included in the defini-
tion of “waters of the state.” Table 10.7 summarizes
selected programs from all states (Steiner et al.
1994).
Local governments often are responsible for the
implementation of these state and federal initiatives.
Local governments may also initiate programs for
wetland and riparian area protection. A variety of
regulatory devices can be employed. Overlay zones
restrict development within wetland and riparian
areas and direct new growth away from such places.
According to the World Wildlife Fund, “overlay
zones provide a mechanism to prohibit develop-
ment and limit other activities in wetlands, impose
wetlands buffers, or require measures to reduce the
effects of development in wetlands without affecting
development outside the designated wetlands area
and adjacent buffer zones” (1992, 115). Other de-
vices available for localities include special permits
or conditional uses, cluster zoning and PUDs, per-
formance standards, and subdivision regulations
(World Wildlife Fund 1992).
Habitat Conservation Plans
Habitat conservation plans (HCPs) are adopted by
local governments to protect plant and animal
349PLAN AND DESIGN IMPLEMENTATION
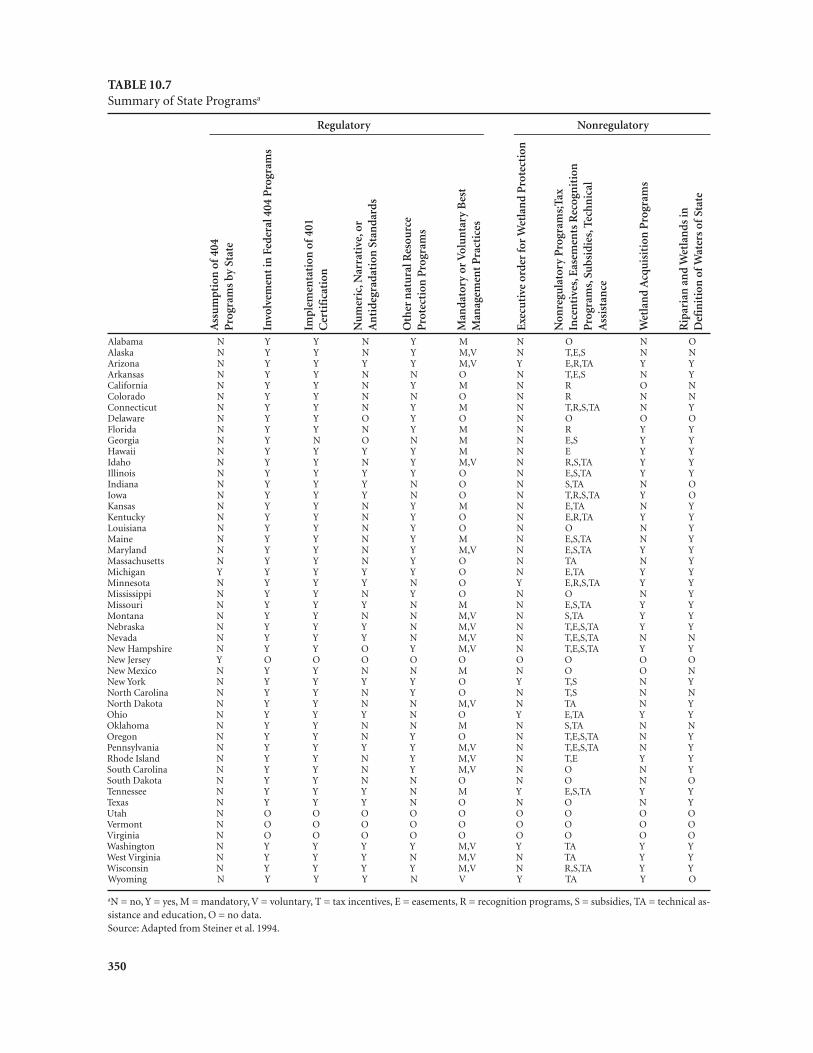
350
TABLE 10.7Summary of State Programsa
Regulatory Nonregulatory
Alabama N Y Y N Y M N O N OAlaska N Y Y N Y M,V N T,E,S N NArizona N Y Y Y Y M,V Y E,R,TA Y YArkansas N Y Y N N O N T,E,S N YCalifornia N Y Y N Y M N R O NColorado N Y Y N N O N R N NConnecticut N Y Y N Y M N T,R,S,TA N YDelaware N Y Y O Y O N O O OFlorida N Y Y N Y M N R Y YGeorgia N Y N O N M N E,S Y YHawaii N Y Y Y Y M N E Y YIdaho N Y Y N Y M,V N R,S,TA Y YIllinois N Y Y Y Y O N E,S,TA Y YIndiana N Y Y Y N O N S,TA N OIowa N Y Y Y N O N T,R,S,TA Y OKansas N Y Y N Y M N E,TA N YKentucky N Y Y N Y O N E,R,TA Y YLouisiana N Y Y N Y O N O N YMaine N Y Y N Y M N E,S,TA N YMaryland N Y Y N Y M,V N E,S,TA Y YMassachusetts N Y Y N Y O N TA N YMichigan Y Y Y Y Y O N E,TA Y YMinnesota N Y Y Y N O Y E,R,S,TA Y YMississippi N Y Y N Y O N O N YMissouri N Y Y Y N M N E,S,TA Y YMontana N Y Y N N M,V N S,TA Y YNebraska N Y Y Y N M,V N T,E,S,TA Y YNevada N Y Y Y N M,V N T,E,S,TA N NNew Hampshire N Y Y O Y M,V N T,E,S,TA Y YNew Jersey Y O O O O O O O O ONew Mexico N Y Y N N M N O O NNew York N Y Y Y Y O Y T,S N YNorth Carolina N Y Y N Y O N T,S N NNorth Dakota N Y Y N N M,V N TA N YOhio N Y Y Y N O Y E,TA Y YOklahoma N Y Y N N M N S,TA N NOregon N Y Y N Y O N T,E,S,TA N YPennsylvania N Y Y Y Y M,V N T,E,S,TA N YRhode Island N Y Y N Y M,V N T,E Y YSouth Carolina N Y Y N Y M,V N O N YSouth Dakota N Y Y N N O N O N OTennessee N Y Y Y N M Y E,S,TA Y YTexas N Y Y Y N O N O N YUtah N O O O O O O O O OVermont N O O O O O O O O OVirginia N O O O O O O O O OWashington N Y Y Y Y M,V Y TA Y YWest Virginia N Y Y Y N M,V N TA Y YWisconsin N Y Y Y Y M,V N R,S,TA Y YWyoming N Y Y Y N V Y TA Y O
aN = no, Y = yes, M = mandatory, V = voluntary, T = tax incentives, E = easements, R = recognition programs, S = subsidies, TA = technical as-sistance and education, O = no data.Source: Adapted from Steiner et al. 1994.
Ass
um
ptio
n o
f 40
4P
rogr
ams
by S
tate
Invo
lvem
ent i
n F
eder
al 4
04 P
rogr
ams
Impl
emen
tati
on o
f 40
1C
erti
fica
tion
Nu
mer
ic, N
arra
tive
, or
An
tide
grad
atio
n S
tan
dard
s
Oth
er n
atu
ral R
esou
rce
Pro
tect
ion
Pro
gram
s
Man
dato
ry o
r V
olu
nta
ry B
est
Man
agem
ent P
ract
ices
Exe
cuti
ve o
rder
for
Wet
lan
d P
rote
ctio
n
Non
regu
lato
ry P
rogr
ams;
Tax
Ince
nti
ves,
Eas
emen
ts R
ecog
nit
ion
P
rogr
ams,
Su
bsid
ies,
Tec
hnic
al
Ass
ista
nce
Wet
lan
d A
cqu
isit
ion
Pro
gram
s
Rip
aria
n a
nd
Wet
lan
ds in
Def
init
ion
of W
ater
s of
Sta
te
species and to promote biodiversity. The basic con-
cept is that a species’ habitat, its home, must be pro-
tected in order for it to survive. HCPs are made in
the United States under the framework created by
the Endangered Species Act (ESA) of 1973 (Beatley
1994a, 1994b). The original 1973 act has been
amended by Congress several times. Timothy Beat-
ley calls the ESA “perhaps the strictest environmen-
tal protection statute in the world” (1994a, 10). Es-
sentially, the federal government through the U.S.
Fish and Wildlife Service identifies protected species
and conservation standards. Once species are iden-
tified, the state and local governments negotiate
HCPs with all the interested “stakeholders” and then
the USFWS must approve the negotiated HCP. Al-
though the USFWS must approve the HCP, the
agency also is usually heavily involved throughout
the usually very lengthy negotiation process.
Christopher Duerksen and his colleagues (1997)
suggest several implementation tools that can
be used in a HCP (Table 10.8). They provide use-
ful, detailed descriptions of how HCPs can be
351PLAN AND DESIGN IMPLEMENTATION
TABLE 10.8The Scale/Tool Matrix
Landscape- Scale Site- ScaleTools Tools
Zoning texts and maps X XSpecial overlay districts X XAgricultural and open space zoning XPerformance zoning X
Regulatory tools Phasing of development XSubdivision review standards X XSanctuary regulations XUrban growth boundaries XTargeted growth strategies X
Density bonuses X XClustering X
Incentive toolsTransferrable development rights XPreferential treatment X
Fee-simple purchase X XSellbacks and leasebacks X X
Acquisition programs Options and rights of first refusal X XEasements and purchases of development rights X XLand dedications and impact fees X X
Development agreements XControl of public investments X XTaxing and assessment districts X X
Land trusts XPrivate- sector initiatives Limited conservation development X
Industrial restoration showcase projects X
Intergovernmental agreements XEducation, citizen involvement,and technical assistance X X
SOURCE: Duerksen et al. 1997.
incorporated with many of the implementation
tools reviewed in this chapter including zoning, per-
formance standards, and subdivision regulations
(Duerksen et al. 1997). Whatever the tool or combi-
nation of measures used in a HCP, it should be
based on a thorough ecological inventory and analy-
sis of the planning area.
Sheila Peck (1998) discusses the use of habitat
conservation areas (HCAs), transitional areas, and
removal areas in HCPs. In the Northern Spotted Owl
Conservation Plan in the Pacific Northwest, for ex-
ample, the HCAs were developed “from maps de-
picting the range of the owls, the distribution of their
old- growth habitat, locations where they now occur,
and lands suitable for the establishment of HCAs”
(Peck 1998, 104–105). The idea is to protect large
enough habitats for rare or endangered species to en-
able them to thrive. Transitional areas are areas that
possess good habitat but for some reason are not fea-
sible to include in a preserve area. Removal areas have
low- quality habitat or are located in places where
habitat conflicts with adjacent uses. Species in re-
moval areas are moved to HCAs (Peck 1998).
A federal- state program that can assist in habitat
conservation planning is the Gap Analysis Program
(GAP), part of the U.S. Geological Survey. GAP
seeks to identify the degree to which species and
natural communities are represented in protected
areas. Species and habitats not adequately repre-
sented in such areas are identified as “gaps.” The Co-
operative Fish and Wildlife Research Units imple-
ment the GAP in partnership with universities,
private business corporations, nonprofit conserva-
tion groups, state game and fisheries departments,
and other governmental agencies (Zube et al. 1994).
A strength of GAP is its emphasis on partner-
ships. High technology satellite imagery and com-
puter mapping information are available to state
and local governments to implement habitat con-
servation plans. GAP is not, Noss and Cooperrider
observe, “directly involved in the process of land-
scape design and zoning. Rather, it provides data
and assessments that allow planners to conduct
these activities intelligently” (1993, 5).
Historic Preservation
Places can be especially sensitive to change because
of their archaeological or historical significance. As a
result, many communities have adopted special dis-
tricts to protect these cultural resources. Often this is
accomplished by an “overlay zone,” that is, a special
designation in addition to the regular zoning. His-
toric properties within such a zone receive special
protection but are subject to specific regulations.
The National Environmental Policy Act indi-
cated that it is the responsibility of the federal gov-
ernment to “preserve important historic, cultural
and natural aspects of our national heritage. . . .”
NEPA is one of several federal laws, regulations, and
executive orders designed to protect historical and
archaeological sites, including the Antiquities Act of
1906; the Historic Sites, Buildings, and Antiquities
Act of 1935; the National Trust Act of 1949, which
established the National Trust for Historic Preserva-
tion; and the National Historic Preservation Act of
1966, as amended in 1980 and 1992 (Canter 1996).
The National Historic Preservation Act provisions
are especially important for planning implementa-
tion. This act states that any “federal undertaking”
has to evaluate potential impacts on historic and ar-
chaeological resources. Projects involving federal
funds or any federal permits are subject to this law.
As a result, local road- building projects using fed-
eral highway funds, local community development
block grant projects, undertakings on federal lands,
and many other efforts result in a review of their im-
pact on historic and archaeological resources.
The 1935 law established the National Register
of Historic Places, which was expanded by the Na-
tional Historic Preservation Act for districts, sites,
buildings, structures, and objects significant in
American history, architecture, archaeology, and
culture (Canter 1996). The act provides funding to
352CHAPTER 10
states for historical surveys and planning as well as
for preservation, acquisition, restoration, and devel-
opment projects. These programs are administered
through state historic preservation officers, or
SHPOs. Certified local government historic preser-
vation programs can work with SHPOs to nominate
properties to the National Register, which is admin-
istered by the U.S. Department of Interior. Once a
property is listed on the National Register, it is eligi-
ble for special protection and benefits. The act only
protects sites against federal actions.
Additional opportunities exist through the Na-
tional Trust for Historic Preservation’s Main Street
Program and Your Town Workshops. Beginning in
1977, the Main Street Program has been active in 37
states and 900 communities (Stokes et al. 1997). Fo-
cused on smaller cities and towns, the program uses
a four- point approach: promotion, economic re-
structuring, design, and organization. These are
coupled with eight principles: comprehensiveness,
incremental change, self- help, public- private part-
nerships, identifying and capitalizing on existing as-
sets, quality, change, and action- orientation (Stokes
et al. 1997). The Main Street Program can con-
tribute much to the preservation of historic down-
towns as well as their revitalization.
The National Trust initiated the Your Town
Workshops in 1991 with the Faculty of Landscape
Architecture at the State University of New York at
Syracuse, with funding from the National Endow-
ment for the Arts. The program brings together ru-
ral decision makers in intense three- day charrette-
like workshops to explain the potential for design to
improve their communities. The workshops teach
decision makers how to value the assets of their
communities, including their history (Hawks and
Mastran 1997).
Subdivision Regulations
In contrast to performance standards and critical
areas, subdivision regulations and building codes are
much older forms of land- use controls. In the Old
Testament there is a description of the proposals
made by Ezekiel for the building of Jerusalem. The
first recorded regulations on the division of land in
the Western Hemisphere were the Laws of the Indies
of 1573 used in Spanish colonization. According to
John Reps, “in 1573, Phillip II proclaimed the Laws
of the Indies to establish uniform standards and pro-
cedures for planning of towns and their surrounding
lands as well as for all other details of colonial settle-
ment” (1970, 41). The Laws of the Indies were based
on older European laws dating back to the time of
the Romans. Modern American subdivision regula-
tions are, according to Philip Green,
locally adopted laws governing the process of con-
verting raw land into building sites. They normally
accomplish this through plat approval procedures,
under which a developer is not permitted to make
improvements or to divide and sell [the] land until
the planning commission has approved a plat (map)
of the proposed design of [the] subdivision. The ap-
proval or disapproval of the commission is based
upon compliance or noncompliance of the proposal
set forth in the subdivision regulations. In the event
that the developer attempts to record an unapproved
plat in the local registry of deeds (or county record’s
office) or sell lots by reference to such a plat, [the de-
veloper] may be subject to various civil and criminal
penalties (1968, 445).
There is a strong enforcement capability in such
regulations, but also significant loopholes in many
places. The purpose of subdivision regulations is to
protect the public interest during the laying out of
land and the construction of public and private im-
provements. Like comprehensive or general plans
and zoning ordinances, local governments have the
authority to enact subdivision regulations through
state enabling legislation. Subdivision regulations
usually have strong enforcement provisions: Deeds
to subdivided land may not be recorded or
353PLAN AND DESIGN IMPLEMENTATION
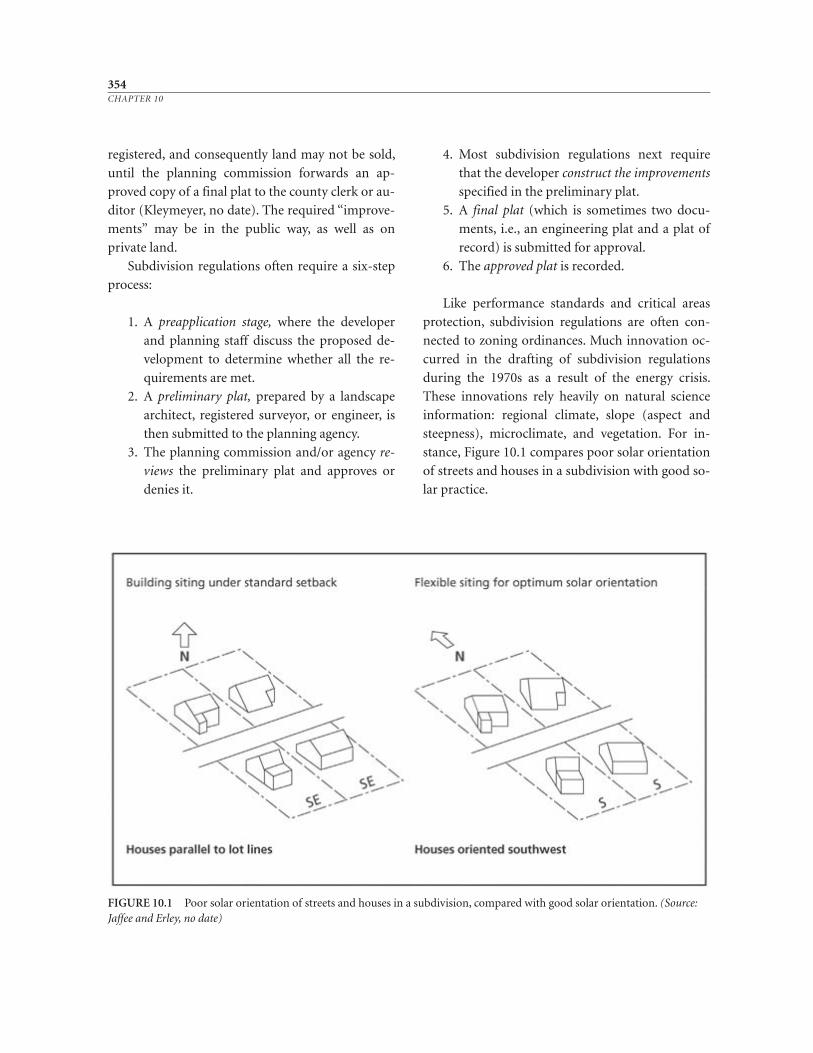
354CHAPTER 10
FIGURE 10.1 Poor solar orientation of streets and houses in a subdivision, compared with good solar orientation. (Source:Jaffee and Erley, no date)
registered, and consequently land may not be sold,
until the planning commission forwards an ap-
proved copy of a final plat to the county clerk or au-
ditor (Kleymeyer, no date). The required “improve-
ments” may be in the public way, as well as on
private land.
Subdivision regulations often require a six- step
process:
1. A preapplication stage, where the developer
and planning staff discuss the proposed de-
velopment to determine whether all the re-
quirements are met.
2. A preliminary plat, prepared by a landscape
architect, registered surveyor, or engineer, is
then submitted to the planning agency.
3. The planning commission and/or agency re-
views the preliminary plat and approves or
denies it.
4. Most subdivision regulations next require
that the developer construct the improvements
specified in the preliminary plat.
5. A final plat (which is sometimes two docu-
ments, i.e., an engineering plat and a plat of
record) is submitted for approval.
6. The approved plat is recorded.
Like performance standards and critical areas
protection, subdivision regulations are often con-
nected to zoning ordinances. Much innovation oc-
curred in the drafting of subdivision regulations
during the 1970s as a result of the energy crisis.
These innovations rely heavily on natural science
information: regional climate, slope (aspect and
steepness), microclimate, and vegetation. For in-
stance, Figure 10.1 compares poor solar orientation
of streets and houses in a subdivision with good so-
lar practice.
Building Codes
Building codes have a long history. The code of the
Babylonian King Hammurabi is the first written ref-
erence to building codes. The code of Hammurabi
sets forth the principle of compensatory justice for
damages and punishment for faulty construction.
There are biblical references to building specifica-
tions that were used to construct the ark and the
temple. Poor natural conditions and overcrowding
in ancient Rome necessitated the development of
tenement codes that were adopted in Roman new
towns. There are numerous examples of codes in
European cities after the Renaissance, such as those
in Munich, Kiev, and London.
Building codes in North America began in
Boston in 1629 and continued with English colonial
activity in the middle Atlantic and southern states.
After the American Revolution, height limitations
were imposed on the new federal capital in Wash-
ington, D.C. The overcrowding and new building
technology that resulted during the Industrial Revo-
lution led to new codes, including the development
of a national electrical code and uniform building
code early in the twentieth century.
Building codes help to standardize construction
practices and expedite the spread of new materials
and practices. Codes specify the size and use of ma-
terials as well as help protect the safety of the public
through ensuring structural soundness and fire pre-
vention and control. Health is protected through
specifications for water and sewage systems. Build-
ing codes are often used with zoning ordinances and
subdivision regulations to control population den-
sity. The purpose of building and other codes is to
secure the general public safety, health, and welfare
through structure strength, stability, sanitation, ade-
quate light, and ventilation. Codes also ensure safety
to life and property from fire hazards incident to the
construction, alteration, repair, removal, demoli-
tion, use, and occupancy of buildings or premises.
As with zoning ordinances and subdivision regula-
tions, the authority for codes is derived from state
enabling legislation with local governmental adop-
tion (Kleymeyer, no date).
The major codes include the Uniform Building
Code (UBC) (Table 10.9) used in the western United
States; the Council of American Building Officials
(CABO) code, used in the northern United States;
and the Standard Building Code (SBC), utilized in
southern states. The International Conference of
Building Officials (ICBO) is currently developing a
new consolidated national code for the United States
called the International Building Code, which will
include recognition in sustainable building practices
and plumbing, electrical, mechanical, fire, and (re-
cently) solar codes. These codes are usually enforced
through a permit process. Plans are approved by in-
spection of new construction and remodeling. Con-
tinuing inspections are made during construction by
the building, fire, plumbing, electrical, or elevator
inspectors as well as other specialists employed by
the building or health department of the jurisdic-
tion. Violations are noted by these inspectors and are
written as “building orders” against the owners of the
properties in violation. Owners are given a specified
time to correct the deficiencies or face a court action.
A building official checks the structure to ensure that
it complies to the codes before an occupancy permit
is granted. Those not making the necessary correc-
tions are cited to court, where they may be fined or
imprisoned under the terms of the codes (Kley -
meyer, no date).
There is much room for creative innovation in
the linkage between the natural environment, new
building materials, and codes. Davis, California, is
an example of a city that completely revised and up-
dated its codes to encourage energy conservation.
The revised codes take into account the climate, hy-
drology, and vegetation of Davis. For instance, it was
hypothesized that light- colored roofing materials
might serve to reflect heat in the intense summer
climate of central California and therefore keep
buildings cooler. Davis officials experimented with
355PLAN AND DESIGN IMPLEMENTATION
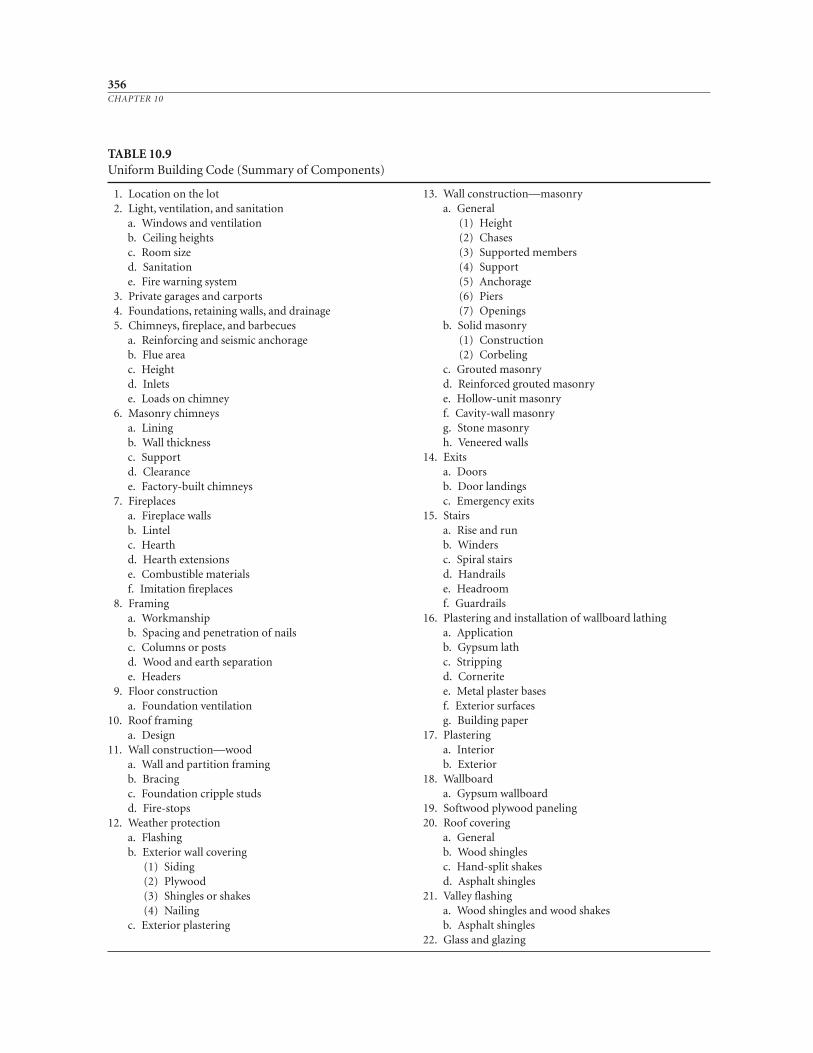
356CHAPTER 10
TABLE 10.9Uniform Building Code (Summary of Components)
1. Location on the lot2. Light, ventilation, and sanitation
a. Windows and ventilationb. Ceiling heightsc. Room sized. Sanitatione. Fire warning system
3. Private garages and carports4. Foundations, retaining walls, and drainage5. Chimneys, fireplace, and barbecues
a. Reinforcing and seismic anchorageb. Flue areac. Heightd. Inletse. Loads on chimney
6. Masonry chimneysa. Liningb. Wall thicknessc. Supportd. Clearancee. Factory- built chimneys
7. Fireplacesa. Fireplace wallsb. Lintelc. Hearthd. Hearth extensionse. Combustible materialsf. Imitation fireplaces
8. Framinga. Workmanshipb. Spacing and penetration of nailsc. Columns or postsd. Wood and earth separatione. Headers
9. Floor constructiona. Foundation ventilation
10. Roof framinga. Design
11. Wall construction—wooda. Wall and partition framingb. Bracingc. Foundation cripple studsd. Fire- stops
12. Weather protectiona. Flashingb. Exterior wall covering
(1) Siding(2) Plywood(3) Shingles or shakes(4) Nailing
c. Exterior plastering
13. Wall construction—masonrya. General
(1) Height(2) Chases(3) Supported members(4) Support(5) Anchorage(6) Piers(7) Openings
b. Solid masonry(1) Construction(2) Corbeling
c. Grouted masonryd. Reinforced grouted masonrye. Hollow- unit masonryf. Cavity- wall masonryg. Stone masonryh. Veneered walls
14. Exitsa. Doorsb. Door landingsc. Emergency exits
15. Stairsa. Rise and runb. Windersc. Spiral stairsd. Handrailse. Headroomf. Guardrails
16. Plastering and installation of wallboard lathinga. Applicationb. Gypsum lathc. Strippingd. Corneritee. Metal plaster basesf. Exterior surfacesg. Building paper
17. Plasteringa. Interiorb. Exterior
18. Wallboarda. Gypsum wallboard
19. Softwood plywood paneling20. Roof covering
a. Generalb. Wood shinglesc. Hand- split shakesd. Asphalt shingles
21. Valley flashinga. Wood shingles and wood shakesb. Asphalt shingles
22. Glass and glazing
numerous roofing materials, found their theory
substantiated, and then incorporated their findings
into the building code.
Building codes can address the use of natural
ventilation and natural sunlight. For example,
building orientation and configuration can be re-
lated to wind flows and solar orientation. Specific
design elements such as window design and surface
colors can be specified in codes. Interest in sustain-
able development is prompting cities to enact spe-
cific environmental standards for buildings.
For example, Barcelona, Spain, has required spe-
cific environmental construction standards, such as
giving priority to the use of recyclable materials. Ad-
ditional building elements that Barcelona officials
have mandated for developers include:
• Good orientation and natural lighting
• The incorporation of traditional systems for
sun and temperature control
• Limited use of exotic timber or timber from
mature forests
• Alternatives to the use of plastics
• Elimination of CFCs, HCFs, and HFCs in re-
frigeration systems
• Shutters on all external glass apertures in main
rooms
• Predominant use of low polluting forms of
energy from existing suppliers
• Treatment of flow at all water consumption
points
• Collective antenna
• Double- glazing in exterior windows of main
rooms
Furthermore, Barcelona officials have required
that air-conditioning systems be designed to reduce
environmental contamination in a way that the
noise level is 5 percent below established norms.
Barcelona has required developers to supply infor-
mation about buildings to their occupants regard-
ing the installations and the sustainability, recycling
possibility, and origin of the materials.
Covenants
Covenants are agreements, usually voluntary, that
restrict what can be done with private property.
Generally, for a covenant to be imposed, property
has to change hands, at which time these agree-
ments appear in the new deed. Typically, covenants
are placed on a property by an owner prior to sale.
Usually private parties, rather than governments,
impose covenants. Covenants are usually backed up
by government authority and may be called volun-
tary covenants, restrictive covenants, or deed restric-
tions. The purpose of covenants is to place addi-
tional rules, regulations and/or restrictions on the
use of land over and above, or not capable of being
implemented, in the zoning ordinances, subdivi-
sion regulations, or building codes; or in the ab-
sence of such ordinances, regulations, or codes. The
authority for covenants is derived from real estate
laws that have been codified by the various states,
based on English common law and additionally in-
terpreted by the state and federal courts (Kley -
meyer, no date).
Often all lots within a subdivision will have
covenants attached to the land title that describe
and design limitations on houses or other structures
such as outbuildings and fences. The same principle
has been used to a limited extent to control the use
of land in the larger community. For instance, a lo-
cal government may choose to implement its land-
use plan through covenants rather than zoning. An-
other example may be the use of covenants by a
citizen group to implement a plan. Farmers in a wa-
tershed could agree to keep their land in agricultural
production rather than convert it to urban or indus-
trial use.
If a covenant is broken, then other landowners
affected by the action can bring suit to restore the
original covenant- specified condition or receive
compensation for damages. Covenants specify who
can bring suit, sometimes including local munici-
palities. Since neighbors find it very difficult to
bring suit against each other, often covenants are
357PLAN AND DESIGN IMPLEMENTATION
not enforced. Therefore, the use of voluntary cov -
enants would only be a reasonable means to control
the use of land as long as the parties affected by the
covenants are willing to see that they are enforced.
One way covenants could be made more efficient in
land- use control is for a homeowners’ or watershed
association to be formed, so that complaints are a
result of collective, rather than individual, action.
Power to Condemn and to Exact
As previously mentioned, the government can di-
rectly purchase private property. If property is
needed for a public purpose and the owner is un-
willing to sell it, then it may be obtained through
condemnation. The Fifth Amendment to the U.S.
Constitution states “nor shall private property be
taken for public use without just compensation.”
Condemnation is the process of legally appropriat-
ing property for public use. To condemn property in
the United States, the public purpose must be clearly
defined, and “just compensation” must be awarded
the property owner. Through condemnation, the
public entity acquires any property interest, includ-
ing full ownership, an easement, or a lesser estate.
The use of condemnation in the United States is re-
ferred to as eminent domain. The federal govern-
ment, each state, and municipalities have the power
of eminent domain within their jurisdiction (Hag-
man and Juergensmeyer 1986).
Christopher Duerksen and his colleagues
(1997), note that “one of the most effective ways of
preserving wildlife habitat is to buy it” (1997, 42)
(which can occur voluntarily or through condem-
nation). They identify several types of acquisition
programs (Table 10.8). Fee- simple purchase gives
“the purchaser full title to and possession of all
rights associated with the purchased property, sub-
ject only to the constraints imposed by nuisance
laws and valid public regulations, including zoning
and subdivision” (Duerksen et al. 1997, 42). Impor-
tant lands can be purchased by park departments or
private conservancies and incorporated into exist-
ing parks, open space, or preserve areas.
From a government point of view, there are ob-
vious benefits to owning the property outright. The
government has a freer reign on the possibilities for
its use. A highway, hydroelectric plant, or flood-
control project can be more easily constructed.
Conversely, the fiscal, social, and political costs can
be high. People value their property highly and re-
sist its taking, even for a clearly defined public use.
The costs of condemnation, in particular, can be
high. This resistance can result in financial costs be-
cause of project delays and lawsuits. Social costs can
be caused by the destruction of established neigh-
borhoods, even if the larger community benefits.
Political costs may result from the emotional and
bitter struggles that accompany many projects in-
volving condemnation. These costs may be avoided
through other, voluntary forms of acquisition, such
as fee- simple purchase and integration into other
open-space purchase programs.
Impact Fees and Land Dedications
Local governments may require developers to pay
for the costs of facilities and services resulting from
their projects. Such a requirement is called an exac-
tion. Service costs can be related to the time required
by planners and other public officials to process
plan and zone changes, subdivision reviews, and
permits. Affected facilities can include parks, roads,
sidewalks, and schools. Such payments are called
impact fees. The courts have required that the costs
imposed must be related to those resulting from the
development. In other words, local governments
cannot impose additional costs for services or facili-
ties on a developer beyond those of the project. As a
result, costs need to be carefully calculated by local
planners to ensure a nexus between the fees im-
posed and the scale of the development. (For a good
discussion of the legal issues involved, see Duerksen
358CHAPTER 10
et al. 1997). J. C. Nicholas and his colleagues (1991)
provide a useful guide for calculating impact fees
(Table 10.10).
Local governments can also require developers
to dedicate land necessary to provide public services
related to their projects. Such land is necessary for
parks, open space, roads, and schools. According to
Christopher Duerksen and his colleagues, “Land
dedications are conveyances of land from a private
owner, either voluntarily or to offset the anticipated
impact of a proposed development. An increasing
number of local governments are imposing land
dedication requirements or fees in lieu of dedication
as conditions for permit approvals” (1997, 46).
Impact fee and land dedication programs can be
used to support the preservation of environmentally
sensitive areas through parks and open spaces. Im-
pact fees can be used to help implement plans by fi-
nancing projects consistent with local goals in suit-
able locations. A danger of impact fees is that local
planning agencies can become too dependent on
developers to finance necessary public programs.
The use of impact fees and land dedications
varies widely in the United States. The variation is
related to the diversity of state laws relating to im-
pact fee and land dedication programs. For exam-
ple, Washington State’s Growth Management Act
requires the fastest- growing cities and counties to
have comprehensive plans. Cities and counties are
required to follow these plans and to identify how all
the implementing programs will be financed. The
growth management law also requires that zoning
be brought into conformance with comprehensive
plans and that the plans establish “urban growth
areas” as well as the designation of important agri-
cultural and forest lands (Kelly 1993). The City of
Olympia collects impact fees for several categories
of facilities, including parks and transportation.
Each new residential unit in Olympia pays about
$6700 in impact fees, of which about $1800 is dedi-
cated for parks, trails, open space, and recreation
(McQuary 1998, personal communication).
Power to Spend
The most direct way that a government may exert its
power to spend is by purchasing land fee simple.
This can be an expensive option in terms of both the
initial price and the long- term management. Other
options available include easements and develop-
ment rights purchases and transfers. As previously
noted, governments also have the power to gain
ownership, for compensation and for a public pur-
pose, through condemnation. Governments can im-
plement plans through capital expenditures and
through public property management.
Easements
The ancient Romans created the first easements
for rural areas. The Roman easements provided a
means for an owner to voluntarily share benefits de-
rived from his private property. In contemporary
359PLAN AND DESIGN IMPLEMENTATION
TABLE 10.10The Basis for Calculating Impact Fees
1. The cost of existing facilities2. The means by which existing facilities have been financed3. The extent to which new development has already con-
tributed, through tax assessments, to the cost of provid-ing existing excess capacity
4. The extent to which new development will, in the future,contribute to the cost of constructing currently existingfacilities used by everyone in the community or by peo-ple who do not occupy the new development (by payingtaxes in the future to pay off bonds used to build thosefacilities in the past)
5. The extent to which new development should receivecredit for providing common facilities that communitieshave provided in the past without charge to other devel-opments in the service area
6. Extraordinary costs incurred in serving the new development
7. The time–price differential in fair comparisons ofamounts paid at different times
SOURCE: Adapted from Nicholas et al. 1991, 91.
terms, an easement is the purchase of partial rights
to a piece of land. It is enacted through an agree-
ment between two parties for the purpose of a spe-
cific use. The most common form of easement oc-
curs when a property owner agrees to let a utility
company cross the land with a service line. Ease-
ments can also be made to provide access across one
property to another. The right to the limited use
specified in the easement is usually purchased for a
specified period of time, which can be indefinite.
Governments have purchased easements for sce-
nic or aesthetic purposes. In this case, the seller of the
easement agrees not to alter the land in a way that
would change its scenic value. For example, a grove
of trees may be of sufficient historic, aesthetic, or
ecologic value to warrant a local, state, or federal
government purchase of an easement that would
prohibit the removal of the grove.
Similarly, it is possible for the government or a
nonprofit organization to purchase an easement
that would limit the owner’s use of land in order to
preserve its usefulness for conservation purposes.
This limitation could apply for a specified period of
time or be perpetual, and it could be paid for at a
mutually agreeable price. The purchase controls and
limits use of the land for a specified period, a num-
ber of years, or in perpetuity. However, the land and
all its associated rights ultimately rest with the prop-
erty owner. Therefore, such a conservation ease-
ment, especially if it is donated, might make the
property owner eligible for certain tax benefits.
Land trusts have been active in pioneering and
promoting conservation easements. Charles Eliot
originated the land trust concept in the establishment
of the Massachusetts’ Trustees of Public Reservations
in 1891. The Massachusetts effort became the model
for subsequent conservation and historic preservation
organization in the United States and abroad (Mor-
gan 1991). As Keith Morgan writes, “Now known sim-
ply as the Trustees of Reservations, this private- sector,
not- for- profit organization continues to acquire and
maintain lands significant for their natural beauty,
unique resources and cultural associates throughout
the Commonwealth of Massachusetts” (1991, 6).
According to the Land Trust Exchange (now the
Land Trust Alliance), in 1985 more than 500 gov-
ernment agencies and nonprofit organizations were
using conservation easements. These easements,
both purchased and donated, protect more than 1.7
million acres (688,500 hectares) of land in the
United States (Emory 1985). By 1998, land trusts
were protecting 3 million acres (1,214,100 hectares)
more of land, or approximately 4.7 million acres
(1,902,090 hectares). According to the Land Trust
Alliance, there were 1,213 nonprofit land trusts in
the United States, Puerto Rico, and the Virgin Is-
lands (Planning 1998). The amount of land pro-
tected by these groups (the 4.7 million acres) is an
area larger than the states of Connecticut and
Rhode Island combined. This total does not include
the lands protected by national conservation orga-
nizations (Planning 1998).
The major public goals implemented by these
easements are
• Permanent protection of beautiful scenery
visible from a public road or waterway
• Protection of pure drinking water in urban
areas
• Preservation of the rural character of a town
• Maintenance of critical wildlife habitat
• Conservation of farm, forest, or grazing land
(Emory 1985; see also Wright 1993)
Development Rights Purchase and Transfers
Some local and state governments separate property
ownership and the rights to the development of
property. One person can own the land while an-
other can own the right to develop the same parcel
of land. In essence, development rights are among
those rights that can be controlled by easements.
Through the purchase of development rights
(PDR), the property owner’s development interests
360CHAPTER 10
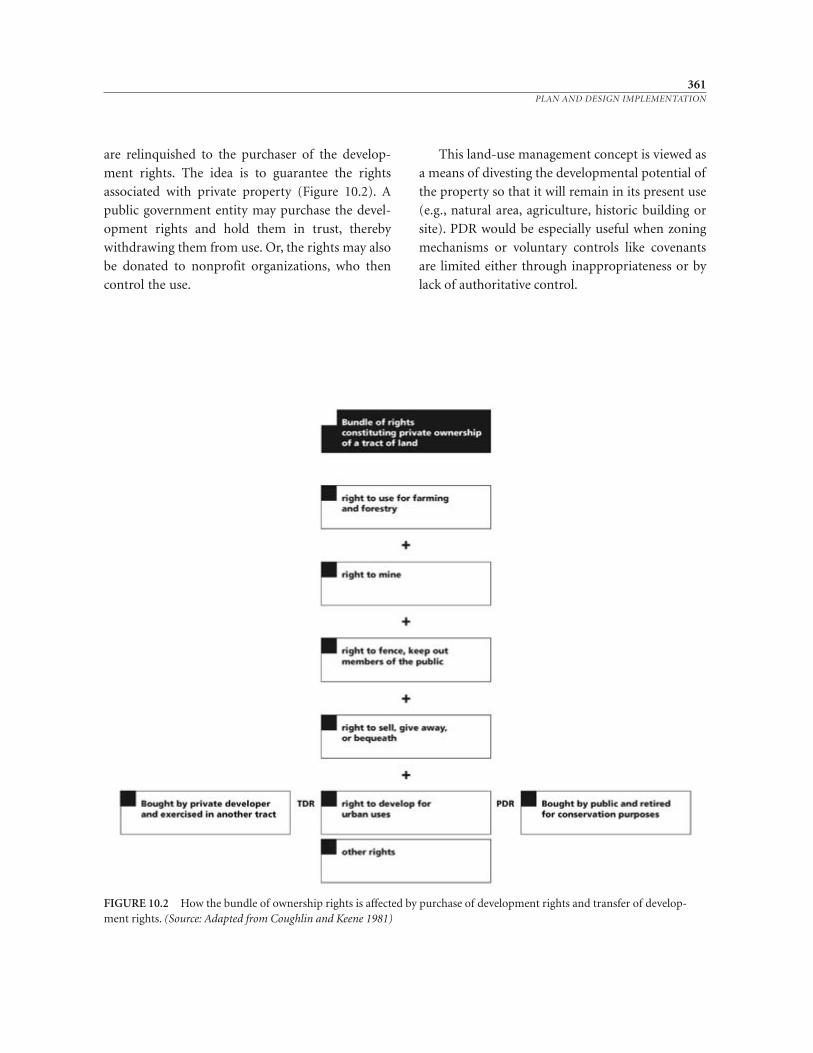
are relinquished to the purchaser of the develop-
ment rights. The idea is to guarantee the rights
associated with private property (Figure 10.2). A
public government entity may purchase the devel-
opment rights and hold them in trust, thereby
withdrawing them from use. Or, the rights may also
be donated to nonprofit organizations, who then
control the use.
This land- use management concept is viewed as
a means of divesting the developmental potential of
the property so that it will remain in its present use
(e.g., natural area, agriculture, historic building or
site). PDR would be especially useful when zoning
mechanisms or voluntary controls like covenants
are limited either through inappropriateness or by
lack of authoritative control.
361PLAN AND DESIGN IMPLEMENTATION
FIGURE 10.2 How the bundle of ownership rights is affected by purchase of development rights and transfer of develop-ment rights. (Source: Adapted from Coughlin and Keene 1981)
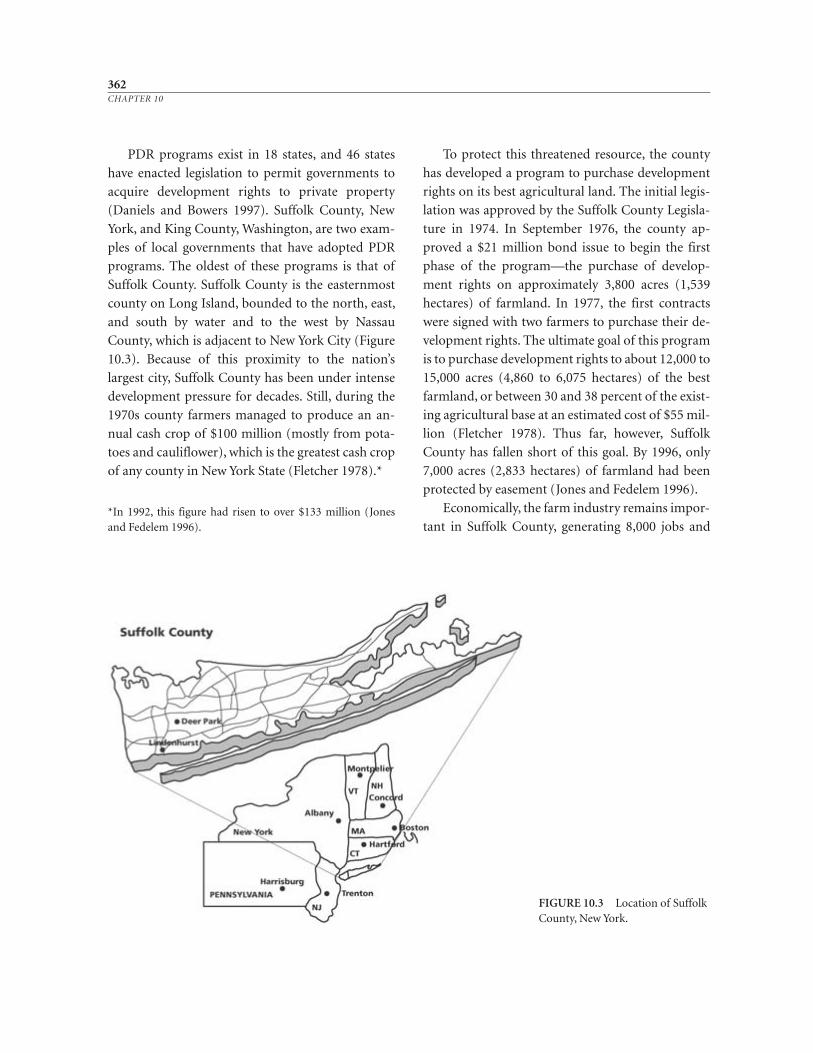
PDR programs exist in 18 states, and 46 states
have enacted legislation to permit governments to
acquire development rights to private property
(Daniels and Bowers 1997). Suffolk County, New
York, and King County, Washington, are two exam-
ples of local governments that have adopted PDR
programs. The oldest of these programs is that of
Suffolk County. Suffolk County is the easternmost
county on Long Island, bounded to the north, east,
and south by water and to the west by Nassau
County, which is adjacent to New York City (Figure
10.3). Because of this proximity to the nation’s
largest city, Suffolk County has been under intense
development pressure for decades. Still, during the
1970s county farmers managed to produce an an-
nual cash crop of $100 million (mostly from pota-
toes and cauliflower), which is the greatest cash crop
of any county in New York State (Fletcher 1978).*
To protect this threatened resource, the county
has developed a program to purchase development
rights on its best agricultural land. The initial legis-
lation was approved by the Suffolk County Legisla-
ture in 1974. In September 1976, the county ap-
proved a $21 million bond issue to begin the first
phase of the program—the purchase of develop-
ment rights on approximately 3,800 acres (1,539
hectares) of farmland. In 1977, the first contracts
were signed with two farmers to purchase their de-
velopment rights. The ultimate goal of this program
is to purchase development rights to about 12,000 to
15,000 acres (4,860 to 6,075 hectares) of the best
farmland, or between 30 and 38 percent of the exist-
ing agricultural base at an estimated cost of $55 mil-
lion (Fletcher 1978). Thus far, however, Suffolk
County has fallen short of this goal. By 1996, only
7,000 acres (2,833 hectares) of farmland had been
protected by easement (Jones and Fedelem 1996).
Economically, the farm industry remains impor-
tant in Suffolk County, generating 8,000 jobs and
362CHAPTER 10
FIGURE 10.3 Location of SuffolkCounty, New York.
*In 1992, this figure had risen to over $133 million (Jonesand Fedelem 1996).
contributing a quarter of a billion dollars to the lo-
cal community (Jones and Fedelem 1996). However,
farmland declines continue—from 123,000 acres
(49,778 hectares) in 1950 to about 31,000 acres
(12,546 hectares) in 1996 (Jones and Fedelem 1996).
As a result, in 1996 the county established a new
goal to achieve 20,000 acres (8,694 hectares) of pro-
tected farmland (Jones and Fedelem 1996). PDR re-
mains the principal mechanism to achieve this goal.
The cost of protecting the additional 13,000 acres
(5,261 hectares) had risen since the 1970s, with the
1990s price tag at $100 million (Jones and Fedelem
1996). The county now had allies in this effort. Sev-
eral NGOs are actively involved, and New York State
supports PDR programs.
One variation on easement and development
rights programs is to simply purchase the land out-
right, then lease it for a specified use. This is a strat-
egy used by several public- interest trusts. A criticism
used against easements or development rights and
fee-simple purchases is that they are expensive.
A related implementation technique is the trans-
fer of development rights (TDR). This technique
involves the same development rights as PDR. How-
ever, in this case the development rights are pur-
chased to be used in another location, rather than to
be retired. Development rights are sold in a sending
or preservation zone to be used in a receiving or de-
velopment zone. Generally, the private market is the
transfer mechanism, although often transfer banks,
such as in the Pinelands, are established to facilitate
the process.
The TDR concept was developed to help miti-
gate the problem of zoning windfalls and wipeouts.
For example, the rezoning of an owner’s property
from agricultural to urban use could cause an in-
crease in value that could financially benefit the
landowner, thus creating a windfall. However, a
property owner whose land remains in an agricul-
tural zone may be deprived of the increased value
that may be derived from an urban-use zone. This
could cause the property owner economic hard-
ship—a wipeout situation. The transfer of develop-
ment rights attempts to distribute economic gains
created by development from all property owners in
an area, not just those who receive a windfall from a
favorable zoning decision (Barron 1975).
One of the first examples of this concept was
provided in the Wallace- McHarg Plan for the Val-
leys, described by Ian McHarg in Design with Nature
(1969). Developed in 1963 for an area northwest of
Baltimore, Maryland, the plan addressed the issue of
how to fairly compensate owners whose land was
being proposed for a less intensive use. McHarg and
David Wallace proposed a syndicate to both develop
and preserve the land involved. Through this
scheme, the profits from land transactions and de-
velopments would be used to compensate land-
owners whose property was not planned for devel-
opment (McHarg 1969).
TDR can be described through the following
example. A county commission designates two 100-
acre (40.5- hectare) parcels of land, A and B. Each
parcel is zoned for residential development at one
unit per acre. The commissioners later decide that
parcel A should remain in its current agricultural
use. As a result, to ensure the continued agricul-
tural use, the county permits the transferring of the
one unit per acre development rights to parcel B.
The property owner can then use those rights to
develop parcel B at one unit per 1⁄2 acre (0.203
hectare), which amounts to the original one unit
per acre plus the transferred unit per acre (Figure
10.4).
Tom Daniels and Deborah Bowers indicate
that successful TDR programs require four basic
elements:
1. A designated preservation zone, usually
called the sending zone, from which develop-
ment is sent away or transferred
2. A designated growth area, usually called the
receiving area, to which development rights
are transferred
363PLAN AND DESIGN IMPLEMENTATION
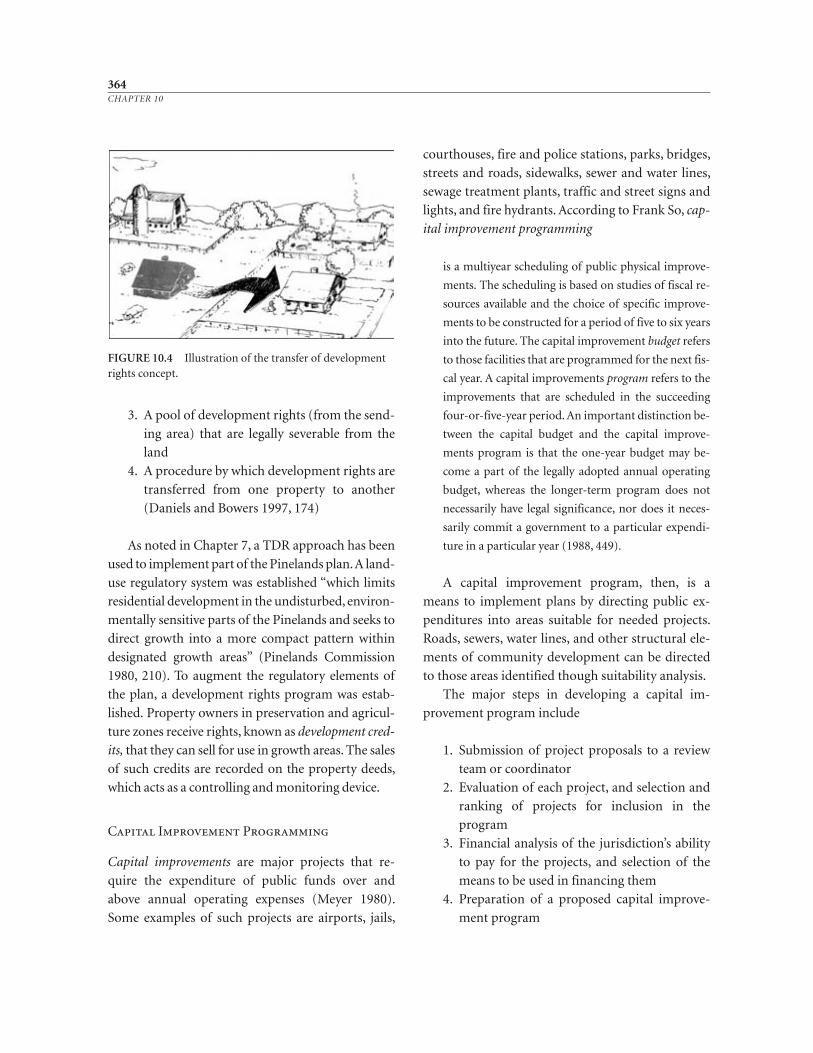
3. A pool of development rights (from the send-
ing area) that are legally severable from the
land
4. A procedure by which development rights are
transferred from one property to another
(Daniels and Bowers 1997, 174)
As noted in Chapter 7, a TDR approach has been
used to implement part of the Pinelands plan. A land-
use regulatory system was established “which limits
residential development in the undisturbed, environ-
mentally sensitive parts of the Pinelands and seeks to
direct growth into a more compact pattern within
designated growth areas” (Pinelands Commission
1980, 210). To augment the regulatory elements of
the plan, a development rights program was estab-
lished. Property owners in preservation and agricul-
ture zones receive rights, known as development cred-
its, that they can sell for use in growth areas. The sales
of such credits are recorded on the property deeds,
which acts as a controlling and monitoring device.
Capital Improvement Programming
Capital improvements are major projects that re-
quire the expenditure of public funds over and
above annual operating expenses (Meyer 1980).
Some examples of such projects are airports, jails,
courthouses, fire and police stations, parks, bridges,
streets and roads, sidewalks, sewer and water lines,
sewage treatment plants, traffic and street signs and
lights, and fire hydrants. According to Frank So, cap-
ital improvement programming
is a multiyear scheduling of public physical improve-
ments. The scheduling is based on studies of fiscal re-
sources available and the choice of specific improve-
ments to be constructed for a period of five to six years
into the future. The capital improvement budget refers
to those facilities that are programmed for the next fis-
cal year. A capital improvements program refers to the
improvements that are scheduled in the succeeding
four- or- five- year period. An important distinction be-
tween the capital budget and the capital improve-
ments program is that the one- year budget may be-
come a part of the legally adopted annual operating
budget, whereas the longer- term program does not
necessarily have legal significance, nor does it neces-
sarily commit a government to a particular expendi-
ture in a particular year (1988, 449).
A capital improvement program, then, is a
means to implement plans by directing public ex-
penditures into areas suitable for needed proj ects.
Roads, sewers, water lines, and other structural ele-
ments of community development can be directed
to those areas identified though suitability analysis.
The major steps in developing a capital im-
provement program include
1. Submission of project proposals to a review
team or coordinator
2. Evaluation of each project, and selection and
ranking of projects for inclusion in the
program
3. Financial analysis of the jurisdiction’s ability
to pay for the projects, and selection of the
means to be used in financing them
4. Preparation of a proposed capital improve-
ment program
364CHAPTER 10
FIGURE 10.4 Illustration of the transfer of developmentrights concept.
5. Consideration and final approval of the pro-
gram by the responsible governing body
6. Public approval of financing arrangements
for individual projects
7. Annual review and revision of the program
(adapted from Meyer 1980)
Advocates of “smart growth” contend that pub-
lic services, especially infrastructure, should be in
place before development can occur. This “concur-
rency” concept is used in Florida and Oregon “to
promote orderly development that will not overbur-
den a community” budget (Daniels and Bowers
1997, 51). Many communities require that specific
public services be provided before new development
occurs. Tom Daniels and Deborah Bowers suggest
that “a community must join its land- use goals and
objectives with the capital improvement program so
that public facilities that are known to induce
growth are available in areas where the community
wants growth and kept out of those areas, such as
farm and forest lands, that the community wants to
protect” (1997, 51).
Public Land Management
About a third of the land in the United States is
owned by federal, state, and local governments
(Lewis 1980; U.S. Bureau of Land Management
1998). In the 1980s, the federal government alone
administered 32 percent of the 2.3 billion acres (932
million hectares) of land in the nation (U.S. Bureau
of Land Management 1988). Because of large trans-
fers of federal land to the public sector during the
1980s and early 1990s, this amount had dropped to
about 24 percent of the total area of the country by
1997 (U.S. Bureau of Land Management 1998).
Most the federal land is in the western states and in-
cludes national parks, forests, resource lands,
wildlife refuges, designated wildernesses, wild and
scenic rivers, national trails, and military installa-
tions. All federal land management agencies are
subject to environmental planning laws, notably
NEPA. Agencies that are especially large and impor-
tant landholders include the U.S. Forest Service, Na-
tional Park Service, Bureau of Land Management,
and the Department of Defense. Each federal agency
has its own planning procedures. Many federal
agencies use planning processes with similarities to
the one described in this book. Communities can
influence federal and state property management to
achieve local goals.
One way that communities can influence the use
of public property is by encouraging federal and
state agencies to adopt plans consistent with local
goals. Conversely, federal and state agencies can en-
courage local governments to do the same. This may
require that plans be amended or modified. Cooper-
ation can be accomplished between governments
through memorandums of understanding or agree-
ment. Military base operations and closures signifi-
cantly impact local communities. Base closures dur-
ing the early 1990s promoted much cooperation to
manage the transition. Many former military bases
have been transformed into community assets such
as schools and open space. Housing has been
adapted for lower income groups. Military bases are
important economic assets to many communities.
As a result, local planners often implement pro-
grams to ensure that other land uses do not conflict
with military operations.
365PLAN AND DESIGN IMPLEMENTATION
Central Park, New York City.
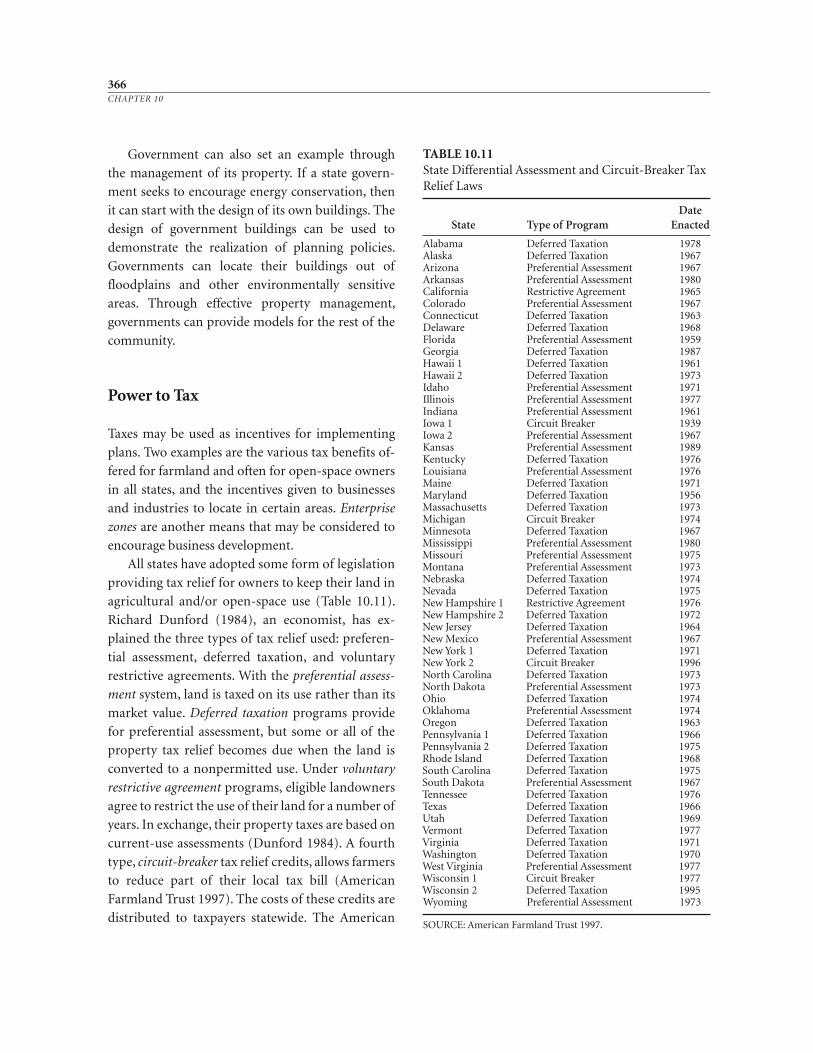
Government can also set an example through
the management of its property. If a state govern-
ment seeks to encourage energy conservation, then
it can start with the design of its own buildings. The
design of government buildings can be used to
demonstrate the realization of planning policies.
Governments can locate their buildings out of
floodplains and other environmentally sensitive
areas. Through effective property management,
governments can provide models for the rest of the
community.
Power to Tax
Taxes may be used as incentives for implementing
plans. Two examples are the various tax benefits of-
fered for farmland and often for open- space owners
in all states, and the incentives given to businesses
and industries to locate in certain areas. Enterprise
zones are another means that may be considered to
encourage business development.
All states have adopted some form of legislation
providing tax relief for owners to keep their land in
agricultural and/or open-space use (Table 10.11).
Richard Dunford (1984), an economist, has ex-
plained the three types of tax relief used: preferen-
tial assessment, deferred taxation, and voluntary
restrictive agreements. With the preferential assess-
ment system, land is taxed on its use rather than its
market value. Deferred taxation programs provide
for preferential assessment, but some or all of the
property tax relief becomes due when the land is
converted to a nonpermitted use. Under voluntary
restrictive agreement programs, eligible landowners
agree to restrict the use of their land for a number of
years. In exchange, their property taxes are based on
current- use assessments (Dunford 1984). A fourth
type, circuit-breaker tax relief credits, allows farmers
to reduce part of their local tax bill (American
Farmland Trust 1997). The costs of these credits are
distributed to taxpayers state wide. The American
366CHAPTER 10
TABLE 10.11State Differential Assessment and Circuit- Breaker TaxRelief Laws
Date State Type of Program Enacted
Alabama Deferred Taxation 1978Alaska Deferred Taxation 1967Arizona Preferential Assessment 1967Arkansas Preferential Assessment 1980California Restrictive Agreement 1965Colorado Preferential Assessment 1967Connecticut Deferred Taxation 1963Delaware Deferred Taxation 1968Florida Preferential Assessment 1959Georgia Deferred Taxation 1987Hawaii 1 Deferred Taxation 1961Hawaii 2 Deferred Taxation 1973Idaho Preferential Assessment 1971Illinois Preferential Assessment 1977Indiana Preferential Assessment 1961Iowa 1 Circuit Breaker 1939Iowa 2 Preferential Assessment 1967Kansas Preferential Assessment 1989Kentucky Deferred Taxation 1976Louisiana Preferential Assessment 1976Maine Deferred Taxation 1971Maryland Deferred Taxation 1956Massachusetts Deferred Taxation 1973Michigan Circuit Breaker 1974Minnesota Deferred Taxation 1967Mississippi Preferential Assessment 1980Missouri Preferential Assessment 1975Montana Preferential Assessment 1973Nebraska Deferred Taxation 1974Nevada Deferred Taxation 1975New Hampshire 1 Restrictive Agreement 1976New Hampshire 2 Deferred Taxation 1972New Jersey Deferred Taxation 1964New Mexico Preferential Assessment 1967New York 1 Deferred Taxation 1971New York 2 Circuit Breaker 1996North Carolina Deferred Taxation 1973North Dakota Preferential Assessment 1973Ohio Deferred Taxation 1974Oklahoma Preferential Assessment 1974Oregon Deferred Taxation 1963Pennsylvania 1 Deferred Taxation 1966Pennsylvania 2 Deferred Taxation 1975Rhode Island Deferred Taxation 1968South Carolina Deferred Taxation 1975South Dakota Preferential Assessment 1967Tennessee Deferred Taxation 1976Texas Deferred Taxation 1966Utah Deferred Taxation 1969Vermont Deferred Taxation 1977Virginia Deferred Taxation 1971Washington Deferred Taxation 1970West Virginia Preferential Assessment 1977Wisconsin 1 Circuit Breaker 1977Wisconsin 2 Deferred Taxation 1995Wyoming Preferential Assessment 1973
SOURCE: American Farmland Trust 1997.
Farmland Trust (1997) identifies Michigan, Wis-
consin, and New York as states with income tax
circuit-breaker programs, and Iowa as a state that
offers a credit against local school tax credits for
agricultural land.
Numerous criticisms have been levied against
such programs. The programs are often abused by
speculators and developers in order to avoid taxes.
Penalties under deferred taxation programs may be
minor when compared to inflated land values. Also,
unequal tax shifts, or perceived inequalities, can oc-
cur as a result of such programs. Yet another weak-
ness is that with the exception of a few states there is
no connection between state tax- relief programs
and local planning and zoning.
Another type of tax program involves offering
incentives to businesses and industries to locate in
certain areas. One such type of program is tax-
increment financing. Wisconsin has a typical pro-
gram (Huddleston 1981), which permits incorpo-
rated cities and villages to create tax- increment
districts to eliminate blight, rehabilitate declining
areas, and promote industrial growth.
In these districts, for a period of time, all the
increase in tax revenue from the property will go
only to the municipality involved. The property
owners will be free of tax increases from various
other local taxing entities, such as school districts
and the county. All of the increased revenue must
be spent for public facilities in the district: roads,
sidewalks, parking areas, sewers, water lines, street
trees, and so on. Bonds may be sold first in order to
rebuild an area to make it more attractive to in-
vestors. The dedicated revenue from the tax-
increment district in turn is used to repay the
bonds.
Another approach, originated by the British
Conservative Party, is the enterprise zone concept.
The underlying thesis is that the incentive for entre-
preneurship must be restored in the inner city. Stu-
art M. Butler, a proponent of the concept, explained
it in the following manner:
Small businesses would be encouraged to start up by
drastic cuts in regulation and taxes (e.g., abating prop-
erty taxes, reducing Social Security taxes, and changing
depreciation schedules). Mixing land uses would be fa-
cilitated by relaxing zoning. In short, a climate for en-
terprise would be established by cutting the cost and
complexity of going into business and by allowing en-
trepreneurs to make do with whatever is available. No
grants, no special loans, no expensive plans. It would be
an exercise in unplanning (1981, 6).
The enterprise zone concept is based on the
opinion that the costs of government inhibit small
business. An alternative view is that private- sector
costs such as interest on loans and fees for services
(legal, insurance, health care, and so on) inhibit
small businesses. An opposing concept to enterprise
zones is that new businesses and industries should
pay their share of the services they need—sewer, wa-
ter, transportation, and so on—and that businesses
and industries are responsible for the health, safety,
and welfare of their neighbors. Indeed, in some
communities, growth-impact fees are assessed on
new developments for certain public services.
Empowerment zones build on the enterprise
zone concept, targeting especially low- income or
so- called “brownfields” areas. Brownfield sites are
underused urban areas, generally resulting from
abandoned industrial, commercial, or even agricul-
tural uses. Many advocate that it is wiser to reuse
brownfields than create new uses in so- called
“greenfields.” Enterprise and empowerment zones
are two approaches to help implement brownfields
redevelopment.
Interagency Coordination for Growth Management
Government agencies can coordinate their activities
to implement plans and manage growth. To manage
growth, it may be necessary to use some or all of the
367PLAN AND DESIGN IMPLEMENTATION
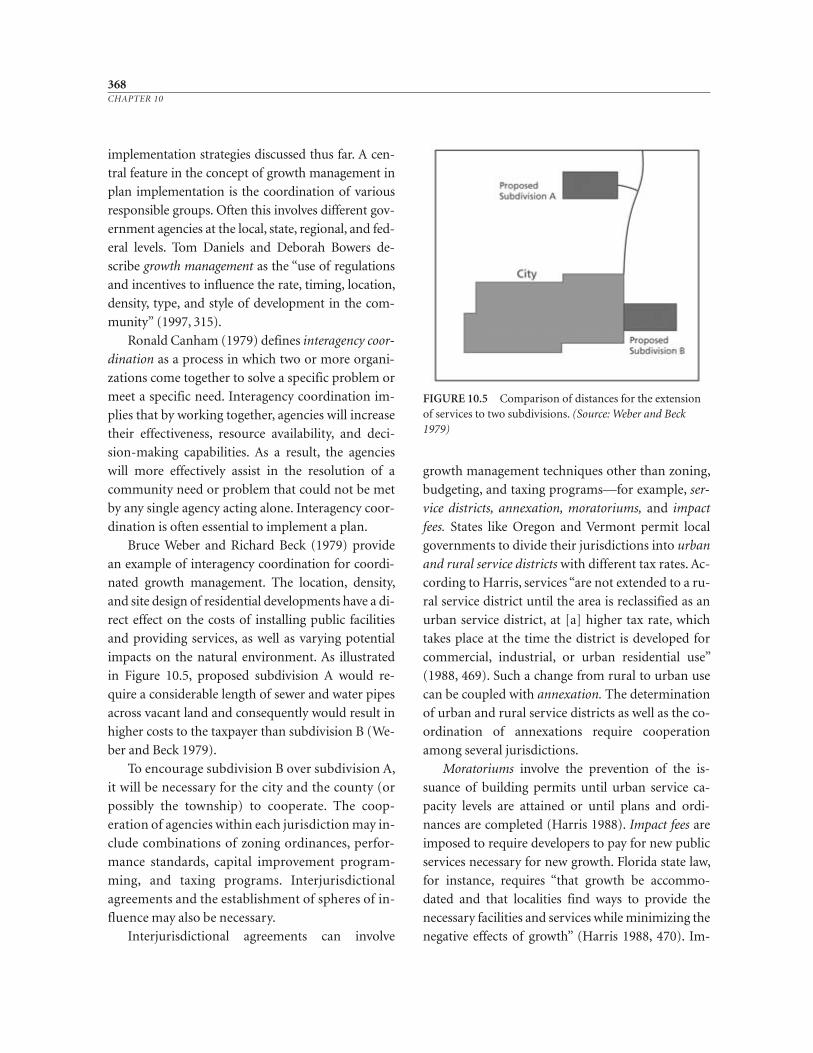
implementation strategies discussed thus far. A cen-
tral feature in the concept of growth management in
plan implementation is the coordination of various
responsible groups. Often this involves different gov-
ernment agencies at the local, state, regional, and fed-
eral levels. Tom Daniels and Deborah Bowers de-
scribe growth management as the “use of regulations
and incentives to influence the rate, timing, location,
density, type, and style of development in the com-
munity” (1997, 315).
Ronald Canham (1979) defines interagency coor-
dination as a process in which two or more organi-
zations come together to solve a specific problem or
meet a specific need. Interagency coordination im-
plies that by working together, agencies will increase
their effectiveness, resource availability, and deci-
sion- making capabilities. As a result, the agencies
will more effectively assist in the resolution of a
community need or problem that could not be met
by any single agency acting alone. Interagency coor-
dination is often essential to implement a plan.
Bruce Weber and Richard Beck (1979) provide
an example of interagency coordination for coordi-
nated growth management. The location, density,
and site design of residential developments have a di-
rect effect on the costs of installing public facilities
and providing services, as well as varying potential
impacts on the natural environment. As illustrated
in Figure 10.5, proposed subdivision A would re-
quire a considerable length of sewer and water pipes
across vacant land and consequently would result in
higher costs to the taxpayer than subdivision B (We-
ber and Beck 1979).
To encourage subdivision B over subdivision A,
it will be necessary for the city and the county (or
possibly the township) to cooperate. The coop-
eration of agencies within each jurisdiction may in-
clude combinations of zoning ordinances, perfor-
mance standards, capital improvement program-
ming, and taxing programs. Interjuris dictional
agreements and the establishment of spheres of in-
fluence may also be necessary.
Interjurisdictional agreements can involve
growth management techniques other than zoning,
budgeting, and taxing programs—for example, ser-
vice districts, annexation, moratoriums, and impact
fees. States like Oregon and Vermont permit local
governments to divide their jurisdictions into urban
and rural service districts with different tax rates. Ac-
cording to Harris, services “are not extended to a ru-
ral service district until the area is reclassified as an
urban service district, at [a] higher tax rate, which
takes place at the time the district is developed for
commercial, industrial, or urban residential use”
(1988, 469). Such a change from rural to urban use
can be coupled with annexation. The determination
of urban and rural service districts as well as the co-
ordination of annexations require cooperation
among several jurisdictions.
Moratoriums involve the prevention of the is-
suance of building permits until urban service ca-
pacity levels are attained or until plans and ordi-
nances are completed (Harris 1988). Impact fees are
imposed to require developers to pay for new public
services necessary for new growth. Florida state law,
for instance, requires “that growth be accommo-
dated and that localities find ways to provide the
necessary facilities and services while minimizing the
negative effects of growth” (Harris 1988, 470). Im-
368CHAPTER 10
FIGURE 10.5 Comparison of distances for the extensionof services to two subdivisions. (Source: Weber and Beck1979)
pact fees can be linked to local policy related to low-
and moderate- income housing, recreation facilities,
or open-space protection.
Program Linkage and Cross- Compliance
Certain government benefits (the “carrots”) can be
linked to requirements (the “sticks”) for specific ac-
tions. For instance, preferential property taxation
can be tied to zoning. For a landowner to receive
property taxes at current use rates, like for open
space or agriculture for example, a county may re-
quire that the land be zoned for open space or agri-
cultural use. Sometimes a government, a nongovern-
mental organization, or private developer can link
several implementation measures in a new planned
community. Such a package is often referred to as
codes, covenants, and restrictions (CC&Rs).
The U.S. government has adopted such a linkage
strategy to implement soil conservation goals. As a
result of the 1985 Food Security Act, land owners
wishing to remain eligible for federal agricultural
benefits are required to have a conservation plan,
prepared by the NRCS, for highly erodible lands.
The federal programs affected include price support
payments, storage facility loans, crop insurance, dis-
aster payments, and other loans and subsidies.
Many farmers participate in these programs, so
there is a strong incentive to comply with the re-
quirement. The concept of cross- compliance
among various programs is that private citizens
should not receive windfalls or support from the
government without taking actions that promote
public objectives.
Nongovernmental Strategies
Implementation need not rest on the actions of gov-
ernment alone. Nongovernmental organizations
(NGOs) can use some of the same implementation
strategies that have been described in this chapter.
Several national organizations—such as the Na-
tional Trust for Historic Preservation, the American
Farmland Trust, the National Audubon Society, The
Nature Conservancy, and the Trust for Public
Land—are active in land planning. Numerous local
land trusts and conservancies make fee-simple pur-
chases of land. Such groups buy and receive donated
easements. They may be involved in developing or
overseeing restrictive covenants. NGOs consult with
citizens about the tax aspects of land use. NGOs can
play an important role in community education
(see Chapter 8). They can also be watchdogs, moni-
toring government agencies to ensure that plans are
followed.
One example of a local NGO is the Brandywine
Valley Association, a local group organized in 1945
in Chester County in eastern Pennsylvania. Its dues-
paying members are interested in improving, con-
serving, and restoring the natural resources of the
Brandywine River Valley. This group is a model of a
locally based group with a long- term commitment
to preserving its rural heritage. With a small profes-
sional staff, it urges and helps the people of Chester
County unite their efforts to make the Brandywine
Valley a more pleasant and profitable place in which
to work and live. The Brandywine Valley Association
accomplishes this goal through a variety of educa-
tional programs and through lobbying with local
governments. Many such local groups are active in
neighborhoods and at the community or watershed
level.
The 1000 Friends of Oregon is an example of a
statewide, nongovernmental organization that has
been highly instrumental in planning implementa-
tion. The group was organized to ensure that local
governments comply with the Oregon land- use law
(see Chapters 2 and 6 as well as the case study sec-
tion of the next chapter). The 1000 Friends of Ore-
gon has been active in ensuring implementation by
providing continuing citizen support for planning.
The 1000 Friends of Oregon, with its dedicated, pro-
fessional staff, has taken numerous cities and coun-
ties to court over noncompliance with the statewide
369PLAN AND DESIGN IMPLEMENTATION
laws. The organization has had an excellent success
rate with these suits. The result is that Oregon has
not only a good planning enabling act and well-
defined statewide goals but a record of case law that
supports plan implementation. The organization’s
influence transcends the state borders, as it spawned
similar groups like 1000 Friends of Florida, 1000
Friends of Washington, and 1000 Friends of New
Mexico.
Desert View Tri- VillagesImplementation
From the principles reviewed in Chapters 7 and 9
(see Table 7.1), a series of actions were recom-
mended for new developments. The focus here will
be on desert character overlay districts developed by
Phoenix planners with the Desert View Village Plan-
ning Committee in 1998. The planners and planning
committee designed three overlay districts: desert
preserve, rural desert, and suburban desert. Each over-
lay district applied to specific areas. Provisions were
made in each for previously developed property.
Certain uses were specified for each district.
Desert Overlay
The desert overlay district lies adjacent to the Sono-
ran Desert Preserve and other previously designated
park areas. Single- family detached dwellings are
permitted in the desert overlay but not in the Sono-
ran Desert Preserve (planned by the Phoenix Parks,
Recreation, and Library Department). In selected,
suitable areas, attached dwelling units are allowed.
Topography and other natural features determine
the lot size and building envelope in the district.
“The building envelope is to be surveyed and made
part of the public record by recording of a Natural
Area Easement with the City of Phoenix over the
portion of the lot outside the building envelope with
the final plat approval process” (Desert View Village
Planning Committee 1998, 3).
A 25- foot (7.6- meter) setback from any property
line is required in undisturbed natural desert, except
for the area necessary for a driveway. Building “en-
velopes” are used to keep permanent undisturbed
open space on private land. That is, certain activities
are permitted on either side of a line around the
building called its envelope. Building heights are
limited to one story or 22 feet (6.7 meters), measured
to the top of the parapet or to the top of the ridge on
sloping roofs. Specific guidelines regulate density,
parking, access points, driveways, street widths,
lighting standards, and perimeter walls and fences.
The staff planners and village planning commis-
sion designated four wash types: scenic vista wash
corridors, primary washes, secondary washes, and
minor washes. The scenic vista wash is a regional
drainage, such as Cave Creek Wash, and must meet
minimum flow requirements. Each wash type re-
lated to flood flows. Specific conservation measures
for vegetation and views are required depending on
the wash type.
The city requires a detailed site analysis for any
proposed development in this district. The analysis
is to include a current aerial photograph at the scale
of 1 inch (2.54 centimeter) equals 100 feet (30.5 me-
ters), with the following information included on
overlays:
• Land contours at 2- foot [.6- meter] intervals
• Wash corridors and preliminary hydrological
information ([cubic feet per second] flows,
on- site and off- site, velocity)
• Identify specimen plants and significant
stands of vegetation
• Identify potential view corridors
• Identify potential development areas
• Identify potential street alignments
• Identify the 100- year floodplain boundary
• Provide evidence of a record check for archeo-
logical sites if any (Desert View Village Plan-
ning Committee 1998, 6)
Clustering is encouraged for certain locations in
370CHAPTER 10
the district to preserve undisturbed natural areas.
Design guidelines and standards apply to the desert
preserve overlay district. These guidelines empha-
size “developments which blend with rather than
dominate the undisturbed desert environment”
(Desert View Village Planning Committee 1998, 10).
The guidelines link development proposals to de-
tailed site analyses. Sites are to be designed to pro-
tect the washes and other natural features, to use
materials and colors that blend with the environ-
ment, to minimize erosion, to minimize distur-
bance, and to consider views.
Suburban Desert Overlay
Arizona State University researchers recommended
similar guidelines for suburban and rural desert de-
velopment. Phoenix planners are designing new
overlay districts for these characters with the village
planning committee. The ideas for the suburban
character follow. The City of Phoenix should re-
quire developers to submit a site analysis and a
landscape plan with the rezoning application. Both
written descriptions and maps should be required.
The maps for site analysis should include the re-
gional context, existing topography, slope analysis,
hydrological features of the site and its context
(pre- and postdevelopment), existing vegetation,
views, environmentally sensitive areas, and solar
orientation (McCarthy et al. 1995; Steiner et al.
1999).
The recommended landscape plan maps for the
suburban desert overlay district should include
postdevelopment vegetation, drainage, topography,
views, and lot layout. The landscape plan should in-
clude conservation and revegetation. The site analy-
sis and landscape plan should be prepared by a li-
censed landscape architect. The city should have an
adequate staff of landscape architects and environ-
mental specialists to review site analyses and land-
scape plans. Furthermore, the city should develop
an integrated trail system that is connected to
schools and community recreation facilities.
City regulations need to be modified to include
and/or permit
• Creative approaches to retaining water on-site
that emphasize natural hydrologic functions
of the Sonoran Desert ecosystems
• Design standards for southwest desert subdi-
vision elements in the area (i.e., walls, lighting,
plants, trails, signs, and retention basins)
• Alternative paving surfaces (as long as they do
not produce too much noise)
• Alternative street standards (local, collector,
arterials) in an effort to reduce impervious
surfaces, lighting, noise, and speeds of auto-
mobiles
• New standards regarding parking (on- street
and off- street) and sidewalks. Alternative
zoning ordinances to allow greater flexibility
regarding setbacks and site plan review
standards
• Use of solar energy and building design re-
sponsive to the southwestern solar environ-
ment
• Use of reclaimed water to create wetland/ri-
parian areas (McCarthy et al. 1995; Steiner et
al. 1999)
The Phoenix overall districts depart from con-
ventional planning implementation. Planners em-
phasize character over land use. Detailed design
guidelines link community concerns about preser-
vation to new forms for development based on nat-
ural process. The measures implement community
goals and reflect much public involvement, espe-
cially on the part of the village planning committee.
Implementation Matrix
Often a community will select more than one
means to implement its goals. Because of the poten-
tial complexity and confusion in overlapping or
conflicting responsibilities, it is helpful to clarify
roles of involved groups. One way to assist in such
371PLAN AND DESIGN IMPLEMENTATION
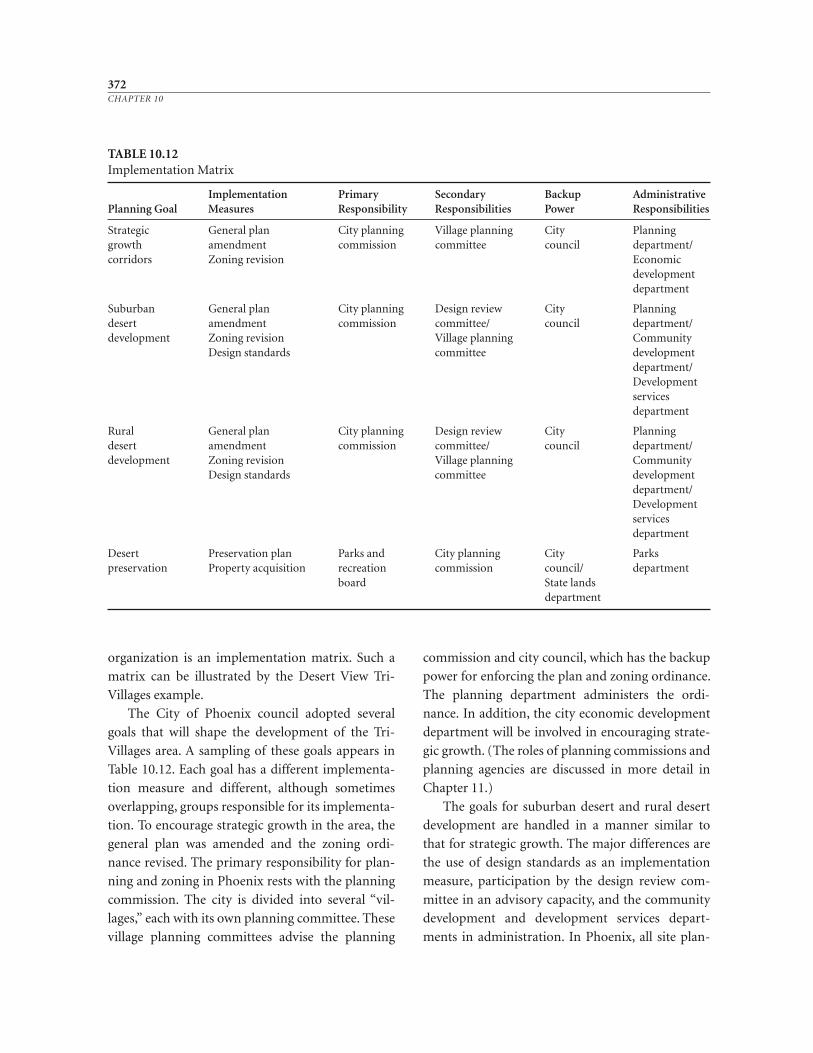
organization is an implementation matrix. Such a
matrix can be illustrated by the Desert View Tri-
Villages example.
The City of Phoenix council adopted several
goals that will shape the development of the Tri-
Villages area. A sampling of these goals appears in
Table 10.12. Each goal has a different implementa-
tion measure and different, although sometimes
overlapping, groups responsible for its implementa-
tion. To encourage strategic growth in the area, the
general plan was amended and the zoning ordi-
nance revised. The primary responsibility for plan-
ning and zoning in Phoenix rests with the planning
commission. The city is divided into several “vil-
lages,” each with its own planning committee. These
village planning committees advise the planning
commission and city council, which has the backup
power for enforcing the plan and zoning ordinance.
The planning department administers the ordi-
nance. In addition, the city economic development
department will be involved in encouraging strate-
gic growth. (The roles of planning commissions and
planning agencies are discussed in more detail in
Chapter 11.)
The goals for suburban desert and rural desert
development are handled in a manner similar to
that for strategic growth. The major differences are
the use of design standards as an implementation
measure, participation by the design review com-
mittee in an advisory capacity, and the community
development and development services depart-
ments in administration. In Phoenix, all site plan-
372CHAPTER 10
TABLE 10.12Implementation Matrix
Implementation Primary Secondary Backup AdministrativePlanning Goal Measures Responsibility Responsibilities Power Responsibilities
Strategic General plan City planning Village planning City Planninggrowth amendment commission committee council department/corridors Zoning revision Economic
developmentdepartment
Suburban General plan City planning Design review City Planningdesert amendment commission committee/ council department/development Zoning revision Village planning Community
Design standards committee developmentdepartment/Developmentservicesdepartment
Rural General plan City planning Design review City Planningdesert amendment commission committee/ council department/development Zoning revision Village planning Community
Design standards committee developmentdepartment/Developmentservicesdepartment
Desert Preservation plan Parks and City planning City Parkspreservation Property acquisition recreation commission council/ department
board State landsdepartment
ning and permitting is done by the development
services department in cooperation with the plan-
ning and community development departments.
Desert preservation involves different measures
and responsibilities. A specific plan for the preserve
was adopted and an acquisition strategy authorized.
The primary responsibility for the plan rests with
the parks and recreation board. The planning com-
mission has secondary responsibility, while the city
council still provides the backup power. In this case,
since state lands are involved and the state legisla-
ture created the Arizona Preserve Initiative to facili-
tate the transfer of significant open- space lands
from the state to the city, the state land department
also has considerable backup power. The parks de-
partment will administer the preserve.
Three Examples of Planning Implementation
In the examples that follow, different issues and
concerns prompted local planning. In York County,
Pennsylvania, and Black Hawk County, Iowa, the
loss of important agricultural land protection initi-
ated the planning process. Farmland preservation is
central to the implementation measures. In Scotts-
dale, Arizona, the major issue involved the preserva-
tion of environmentally sensitive lands. The Scotts-
dale program resulted from local initiatives as well
as a state court decision.
Innovative Zoning for Agricultural Land
Protection in York County, Pennsylvania,
and Black Hawk County, Iowa
The concern about the conversion of agricultural
land to other uses was an emergent issue during the
1970s. The National Agricultural Lands Study, an
interagency project, was initiated by President
Jimmy Carter in 1979 to address the issue. A conclu-
sion of the study was that the problem was a “crisis
in the making.” One of the suggestions made by the
participants in the study was that farmland protec-
tion was best addressed by state and local govern-
ments (National Agricultural Lands Study 1981).
Two local governments that have developed innova-
tive programs include York County, Pennsylvania,
and Black Hawk County, Iowa.*
York County is located in south- central Pennsyl-
vania, 25 miles (40 kilometers) south of Harrisburg
(Figure 10.6). The county had a population of just
under 313,000 people living on 911 square miles
(2,360 square kilometers) in 1980. The county is in
one of the richest agricultural regions in the United
States, yet is within a half- hour’s drive to Harris-
burg, an hour to Baltimore, and an hour and a half
to Philadelphia.
According to planner William Conn (1984), the
York County Planning Commission became con-
cerned about the problem of declining farmland in
1975. The commission reviewed various options to
reverse this trend. Among the techniques reviewed
were the transfer and purchase of development
rights, easements, and tax benefits. The planning
commission selected zoning as the best way to pro-
tect the farmland in the county.
The majority of the county municipalities using
zoning adopted a novel sliding- scale approach. As
described by William Toner, under sliding- scale
zoning “each landowner is entitled to a certain num-
ber of buildable lots according to the size of the par-
cel—permitted density varies inversely with the size
of the parcel. Thus, small landowners are permitted
to develop a higher percentage of their property
than are large landowners” (1978, 15).
According to Toner (1978), the rationale sup-
porting this inverse relationship between size of a
parcel and permitted density is that large landhold-
ings must be retained in agricultural use if the com-
munity is to retain its agricultural base. Officials in
Peach Bottom Township of York County decided to
373PLAN AND DESIGN IMPLEMENTATION
*More complete descriptions of both the York and BlackHawk County examples are provided by officials from thosecounties in Steiner and Theilacker (1984). See also AmericanFarmland Trust (1997).
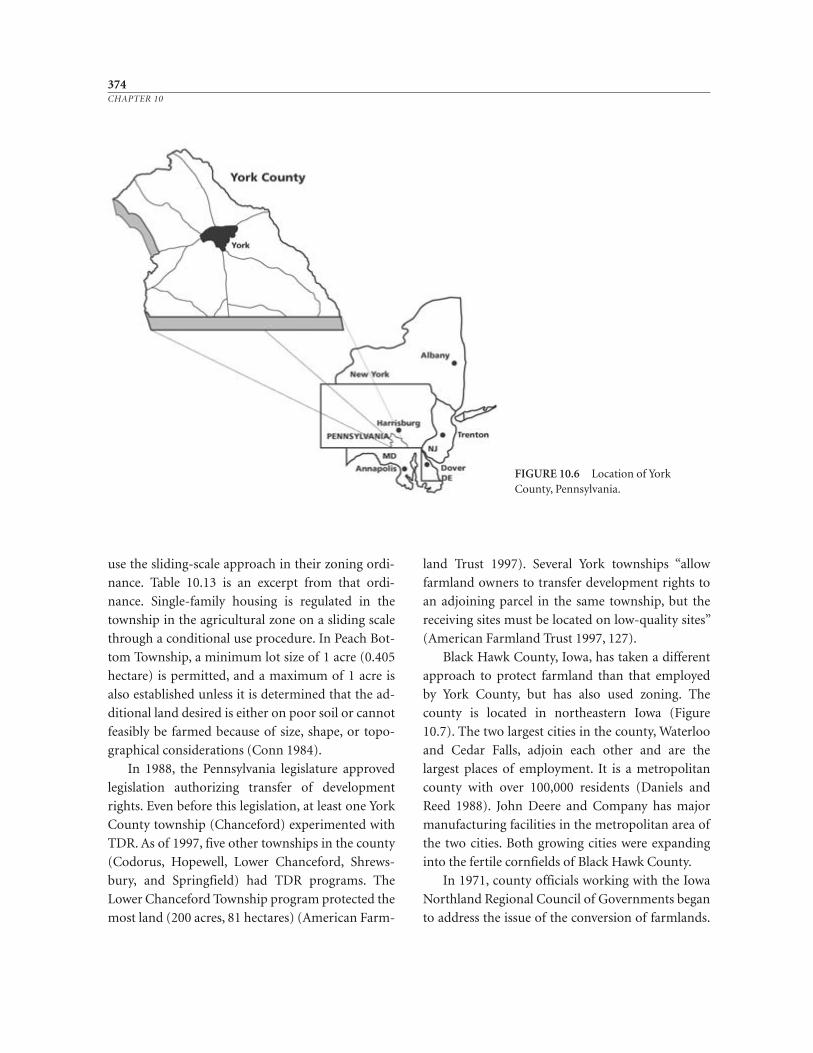
use the sliding- scale approach in their zoning ordi-
nance. Table 10.13 is an excerpt from that ordi-
nance. Single- family housing is regulated in the
township in the agricultural zone on a sliding scale
through a conditional use procedure. In Peach Bot-
tom Township, a minimum lot size of 1 acre (0.405
hectare) is permitted, and a maximum of 1 acre is
also established unless it is determined that the ad-
ditional land desired is either on poor soil or cannot
feasibly be farmed because of size, shape, or topo-
graphical considerations (Conn 1984).
In 1988, the Pennsylvania legislature approved
legislation authorizing transfer of development
rights. Even before this legislation, at least one York
County township (Chanceford) experimented with
TDR. As of 1997, five other townships in the county
(Codorus, Hopewell, Lower Chanceford, Shrews-
bury, and Springfield) had TDR programs. The
Lower Chanceford Township program protected the
most land (200 acres, 81 hectares) (American Farm-
land Trust 1997). Several York townships “allow
farmland owners to transfer development rights to
an adjoining parcel in the same township, but the
receiving sites must be located on low- quality sites”
(American Farmland Trust 1997, 127).
Black Hawk County, Iowa, has taken a different
approach to protect farmland than that employed
by York County, but has also used zoning. The
county is located in northeastern Iowa (Figure
10.7). The two largest cities in the county, Waterloo
and Cedar Falls, adjoin each other and are the
largest places of employment. It is a metropolitan
county with over 100,000 residents (Daniels and
Reed 1988). John Deere and Company has major
manufacturing facilities in the metropolitan area of
the two cities. Both growing cities were expanding
into the fertile cornfields of Black Hawk County.
In 1971, county officials working with the Iowa
Northland Regional Council of Governments began
to address the issue of the conversion of farmlands.
374CHAPTER 10
FIGURE 10.6 Location of YorkCounty, Pennsylvania.
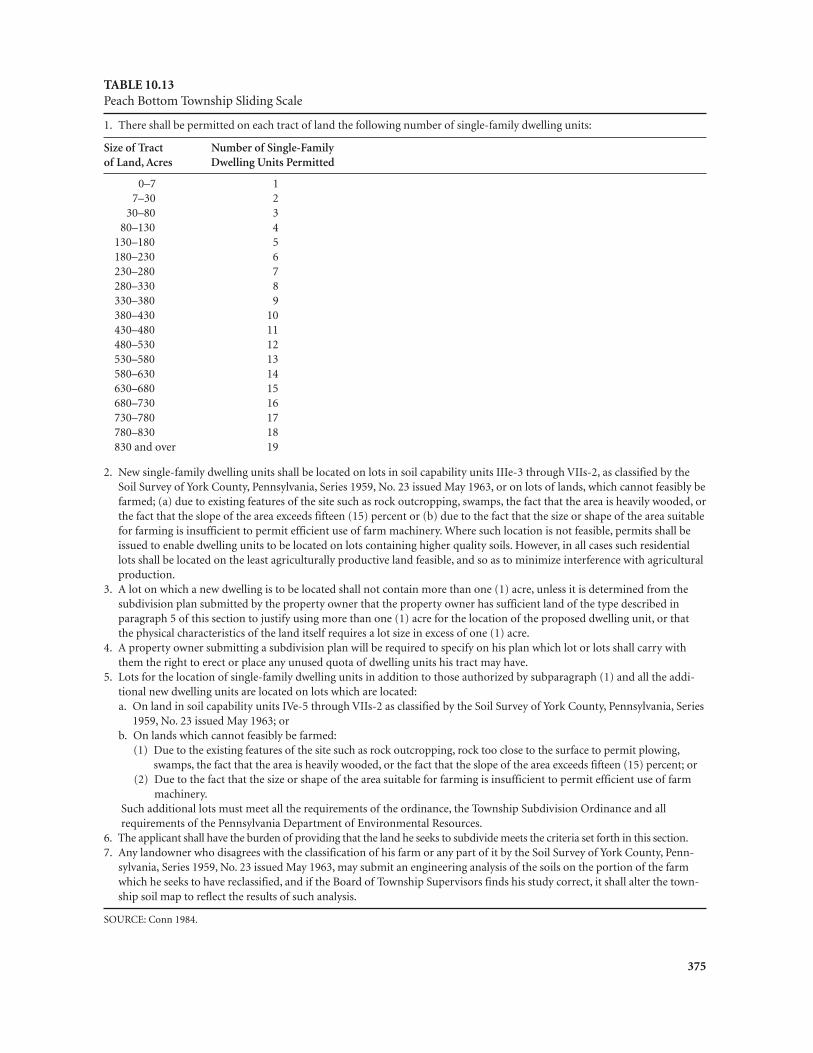
375
TABLE 10.13Peach Bottom Township Sliding Scale
1. There shall be permitted on each tract of land the following number of single- family dwelling units:
Size of Tract Number of Single- Familyof Land, Acres Dwelling Units Permitted
0–7 17–30 2
30–80 380–130 4
130–180 5180–230 6230–280 7280–330 8330–380 9380–430 10430–480 11480–530 12530–580 13580–630 14630–680 15680–730 16730–780 17780–830 18830 and over 19
2. New single- family dwelling units shall be located on lots in soil capability units IIIe- 3 through VIIs- 2, as classified by theSoil Survey of York County, Pennsylvania, Series 1959, No. 23 issued May 1963, or on lots of lands, which cannot feasibly befarmed; (a) due to existing features of the site such as rock outcropping, swamps, the fact that the area is heavily wooded, orthe fact that the slope of the area exceeds fifteen (15) percent or (b) due to the fact that the size or shape of the area suitablefor farming is insufficient to permit efficient use of farm machinery. Where such location is not feasible, permits shall beissued to enable dwelling units to be located on lots containing higher quality soils. However, in all cases such residentiallots shall be located on the least agriculturally productive land feasible, and so as to minimize interference with agriculturalproduction.
3. A lot on which a new dwelling is to be located shall not contain more than one (1) acre, unless it is determined from thesubdivision plan submitted by the property owner that the property owner has sufficient land of the type described inparagraph 5 of this section to justify using more than one (1) acre for the location of the proposed dwelling unit, or thatthe physical characteristics of the land itself requires a lot size in excess of one (1) acre.
4. A property owner submitting a subdivision plan will be required to specify on his plan which lot or lots shall carry withthem the right to erect or place any unused quota of dwelling units his tract may have.
5. Lots for the location of single- family dwelling units in addition to those authorized by subparagraph (1) and all the addi-tional new dwelling units are located on lots which are located:a. On land in soil capability units IVe- 5 through VIIs- 2 as classified by the Soil Survey of York County, Pennsylvania, Series
1959, No. 23 issued May 1963; orb. On lands which cannot feasibly be farmed:
(1) Due to the existing features of the site such as rock outcropping, rock too close to the surface to permit plowing,swamps, the fact that the area is heavily wooded, or the fact that the slope of the area exceeds fifteen (15) percent; or
(2) Due to the fact that the size or shape of the area suitable for farming is insufficient to permit efficient use of farmmachinery.
Such additional lots must meet all the requirements of the ordinance, the Township Subdivision Ordinance and allrequirements of the Pennsylvania Department of Environmental Resources.
6. The applicant shall have the burden of providing that the land he seeks to subdivide meets the criteria set forth in this section.7. Any landowner who disagrees with the classification of his farm or any part of it by the Soil Survey of York County, Penn-
sylvania, Series 1959, No. 23 issued May 1963, may submit an engineering analysis of the soils on the portion of the farmwhich he seeks to have reclassified, and if the Board of Township Supervisors finds his study correct, it shall alter the town-ship soil map to reflect the results of such analysis.
SOURCE: Conn 1984.
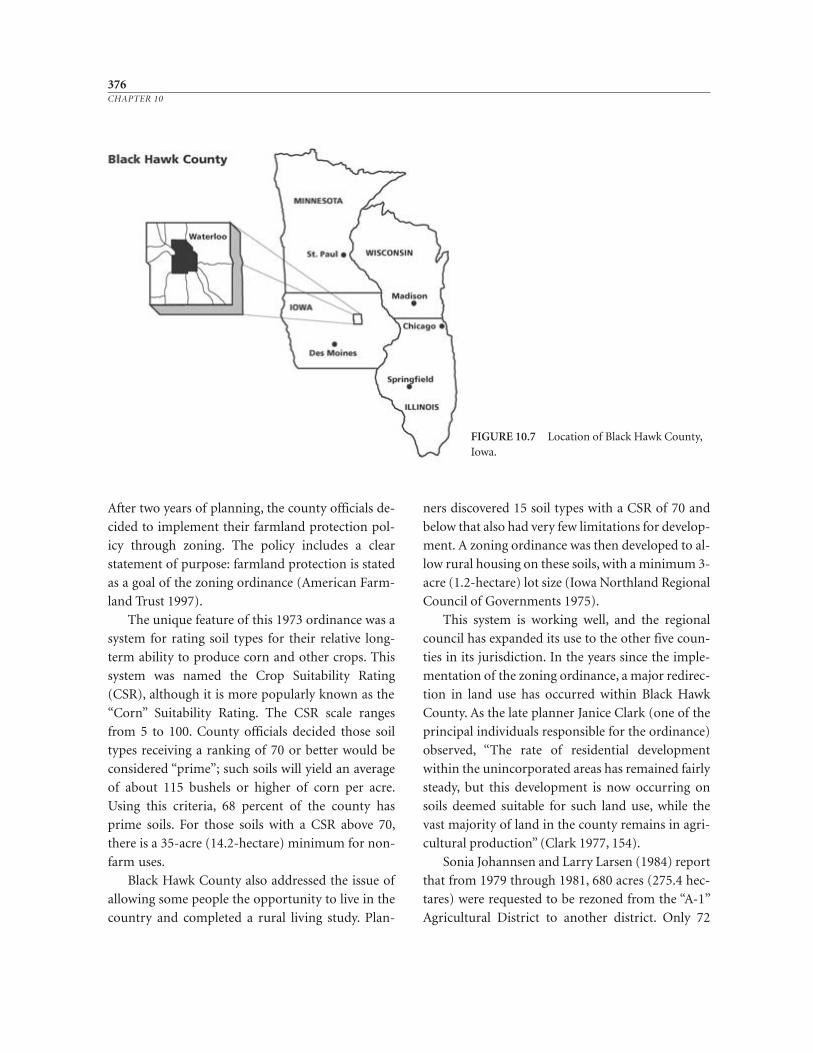
After two years of planning, the county officials de-
cided to implement their farmland protection pol-
icy through zoning. The policy includes a clear
statement of purpose: farmland protection is stated
as a goal of the zoning ordinance (American Farm-
land Trust 1997).
The unique feature of this 1973 ordinance was a
system for rating soil types for their relative long-
term ability to produce corn and other crops. This
system was named the Crop Suitability Rating
(CSR), although it is more popularly known as the
“Corn” Suitability Rating. The CSR scale ranges
from 5 to 100. County officials decided those soil
types receiving a ranking of 70 or better would be
considered “prime”; such soils will yield an average
of about 115 bushels or higher of corn per acre.
Using this criteria, 68 percent of the county has
prime soils. For those soils with a CSR above 70,
there is a 35- acre (14.2- hectare) minimum for non-
farm uses.
Black Hawk County also addressed the issue of
allowing some people the opportunity to live in the
country and completed a rural living study. Plan-
ners discovered 15 soil types with a CSR of 70 and
below that also had very few limitations for develop-
ment. A zoning ordinance was then developed to al-
low rural housing on these soils, with a minimum 3-
acre (1.2- hectare) lot size (Iowa Northland Regional
Council of Governments 1975).
This system is working well, and the regional
council has expanded its use to the other five coun-
ties in its jurisdiction. In the years since the im ple-
mentation of the zoning ordinance, a major re direc-
tion in land use has occurred within Black Hawk
County. As the late planner Janice Clark (one of the
principal individuals responsible for the ordinance)
observed, “The rate of residential development
within the unincorporated areas has remained fairly
steady, but this development is now occurring on
soils deemed suitable for such land use, while the
vast majority of land in the county remains in agri-
cultural production” (Clark 1977, 154).
Sonia Johannsen and Larry Larsen (1984) report
that from 1979 through 1981, 680 acres (275.4 hec -
tares) were requested to be rezoned from the “A- 1”
Agricultural District to another district. Only 72
376CHAPTER 10
FIGURE 10.7 Location of Black Hawk County,Iowa.
acres (29.2 hectares) were approved, of which only
42 acres (17 hectares) were on land that had a ma-
jority of its soils rated prime by the CSR process.
The lands that were approved for rezoning had al-
ready been committed to other uses by subdivision
approval or were difficult sites to farm. Johannsen
and Larsen concluded that the CSR is working and
that “many potential requests for rezoning of farm-
land have been discouraged by the county’s reputa-
tion for preserving these lands” (1984, 124).
An analysis of zoning decisions between 1975
and 1985 by Tom Daniels and David Reed (1988) in-
dicates that the administration of the Black Hawk
County program has continued to improve. Rela-
tively little farmland has been rezoned in the county
“for nonfarm uses, and several proposals for non-
farm uses have been denied” (Daniels and Reed 1988,
303). According to Daniels and Reed, the “local farm
economy appears stable, given the slight decline both
in the number of farms and the amount of farmland.
The large majority of nonfarmland transfers have
occurred near urban boundaries. About one- quarter
of the farmland transfers have also occurred near
cities. These figures suggest urban sprawl is being
fairly well contained” (1988, 303). They also observe
that the best farmland in the county is in quite stable
ownership and is not likely to be developed.
According to the American Farmland Trust, the
Black Hawk ordinance “is strongly supported by the
county’s farmers, despite the fact that it restricts
their ability to sell land for development” (1997, 70).
The agriculture zoning ordinance in Black Hawk
County “was enacted when agriculture was the
dominant land use, development pressure was min-
imal to moderate, and the price of land in rural
areas was close to its value for farming” (American
Farmland Trust 1997, 71).
One unique aspect about both York and Black
Hawk counties is the use of information about na-
ture in implementation ordinances. Most zoning or-
dinances before the 1970s were based primarily on
economic determinants. In York and Black Hawk
counties, information about the physical suitability
for a specific use (agriculture) and natural limita-
tions of the land were used to implement a commu-
nity goal.
Scottsdale, Arizona, Environmentally
Sensitive Lands Ordinance
In 1977, the City of Scottsdale adopted its Hillside
Ordinance. This overlay zone applied to approxi-
mately 24 square miles (62 kilometers2) in the
city’s northeastern area. Conservation zones were
designed for lands above 25 percent slopes, where
development was prohibited. Only limited devel-
opment was permitted in other places, and open
space was protected through easements. In areas
with less than 25 percent slopes, development re-
quired a special review process. Land owners were
required to transfer the residential units allowed in
the underlying district from the conservation zone
to development zones (Burns and Onderdonk
1993). This system was similar to the TDR pro-
gram in the New Jersey Pinelands.
In 1985, the Arizona Court of Appeals found that
the Scottsdale required transfer of development
rights was “a taking of private property without just
compensation instead of a regulation permitted un-
der the city’s police power” (Burns and Onderdonk
1993, 136). As a result, the Hillside Ordinance was
considered unconstitutional in Arizona, and Scotts-
dale planners began to search for an alternative
means to implement their goal of protecting environ-
mentally sensitive lands. A comprehensive “McHar-
gian” ecological inventory and analysis was con-
ducted for the northern portions of Scottsdale. A
citizens’ advisory committee considered various op-
tions and developed an Environmentally Sensitive
Lands Ordinance (ESLO), which was adopted by the
city council in 1991.
The ESLO covers 134 square miles (347 kilo-
meters2) with an overlay zone. Scottsdale plan-
ners designed the new ordinance to meet Arizona
377PLAN AND DESIGN IMPLEMENTATION
constitutional requirements while addressing two
main goals: preserving the mountains and maintain-
ing the desert character. The ESLO defines six types
of sensitive lands: land slopes, unstable slopes, spe-
cial features, watercourses, geologic conditions, and
native vegetation. Land slopes are defined by the
steepness of the gradient. Unstable slopes are places
where rocks or soils may move under certain condi-
tions, causing risk to people or property. Special fea-
tures are large boulder piles, highly visible peaks and
ridges, natural landmarks, and historical and archae-
ological sites. Watercourses flood and possess impor-
tant riparian habitat. Geologic conditions refer to
places where rock is exposed or soil is thin and where
building is expensive. Native vegetation refers to
unique Sonoran species that contribute to the scenic
beauty of the region (City of Scottsdale 1991a).
The method for achieving the first goal is based
on the steepness of the land. Slope is calculated by
how high the ground rises compared to the hori-
zontal distance. The ESLO establishes four slope
categories (less than 15 percent, 15 to 25 percent, 25
to 35 percent, and above 35 percent). Restrictions
increase with greater slopes. Landowners have two
options. The first is a voluntary density transfer.
The second possibility involves very large homesites
with specific design restrictions. The size of the
homesites increase with the slope gradient. The de-
sign restrictions involve average 300- foot (91-
meter) and 200- foot (61- meter) setbacks from
peaks and ridges; the limitation of nonindigenous
plants to a 20- foot (6.1- meter) maximum height;
building colors that blend with the landscape; and
limitations on cuts and fills (City of Scottsdale
1991b).
The second ESLO goal is to maintain the charac-
ter of the desert spaces surrounding the mountains.
To achieve this goal, development restrictions are im-
posed to protect washes, natural landmarks, and na-
tive vegetation. Scottsdale calls these restrictions nat-
ural area open spaces, which are based on slopes and
land-forms. The city divided its northern areas into
three land-form classes: hillside, upper desert, and
lower desert. Hillsides include peaks and ridges, un-
stable and steep slopes, boulder features, and deep-
cut washes. Upper desert land-forms are characterized
by rock outcrops, boulder fields, lush desert habitat,
and deep- cut washes. The lower deserts have shallow
washes with unpredictable, braided flows and lush
vegetation (City of Scottsdale 1991b).
The city requires varying degrees of natural area
open spaces for new development, based on land-
form. The most open space is required in the hillside
land-form; the least in the lower desert. The city re-
views all construction plans to ensure that the re-
quired open space is met on each site. The city also
encourages clustering.
Applications for development projects in areas
covered by the ESLO are to be submitted to a develop-
ment review board. This board is responsible for re-
viewing site plans for compliance with ESLO before
the application is presented to the planning commis-
sion and city council public hearings. All applications
need to include the following:
Base submittal requirements
• Topographic map
• Slope analysis for natural area open-space and
intensity calculation
• Number of proposed dwelling units and pro-
posed density
• Map and figures showing the slopes and eleva-
tions or other data used for natural area open-
space calculation and the total open space
• Proposed building materials, paint colors, and
landscape plants
Environmental analysis
• Soil and geology report
• Special features and viewshed report
• Survey of significant archaeological and his-
toric sites
• Floodplain identification and analysis
• Map of areas of human “scarring”
378CHAPTER 10
• Identification of plant communities (City of
Scottsdale 1991c)
In addition, the ESLO requires specific informa-
tion in applications for single- family development;
rezoning, use permits, and preliminary plat applica-
tions; and master development plans. For example,
master-planned developments require
• General location map
• Size of the entire development
• Development site information
The size of each development site
The land use of each development site
The density of all sites
The zoning of each site
Vista and scenic corridors within the de-
velopment project
• Circulation master plan
• Phasing master plan
• Open space master plan
• Parking master plan
• Drainage master plan
• Water and wastewater master plans
• Environmental design concept master plan
(City of Scottsdale 1991c)
The Scottsdale ordinance represents a shift away
from traditional zoning. The typical ordinance fo-
cuses on land use. The ESLO instead stresses the
suitability of the land and how its constraints place
limitations on possible uses. The ordinance contains
detailed performance standards for land use. These
standards were derived from an understanding of
the landscape. As Donna Gelfand has observed,
“The ESLO was a result of changing community val-
ues [toward] protection of the fragile desert envi-
ronment and the unstable, erodible hillsides” (1992,
50).
The York and Black Hawk Counties and City of
Scottsdale examples illustrate how planning goals
are carried through to implementation. All three
rely more on biophysical information than on con-
ventional planning processes. The York County slid-
ing- scale system utilizes information about soils, ge-
ology, surface water, and vegetation. Suitability
analysis played a central role in the implementation
of the Black Hawk County zoning ordinance. Both
the York and Black Hawk programs were under-
taken to implement goals to protect farmland.
In the City of Scottsdale, growth is managed to
help protect environmentally sensitive areas. The
identification of the environmentally sensitive areas
evolved from a comprehensive ecological inventory
and considerable public participation. The philoso-
phy is not antigrowth or no- growth, but rather
managed growth, managed in such a way as to pro-
tect the environment and valuable natural re-
sources. Development and conservation need not be
viewed as competing interests, but rather as ulti-
mately mutually dependent. Such a perspective re-
quires the careful balancing of interests to adminis-
ter implementation measures through time.
379PLAN AND DESIGN IMPLEMENTATION
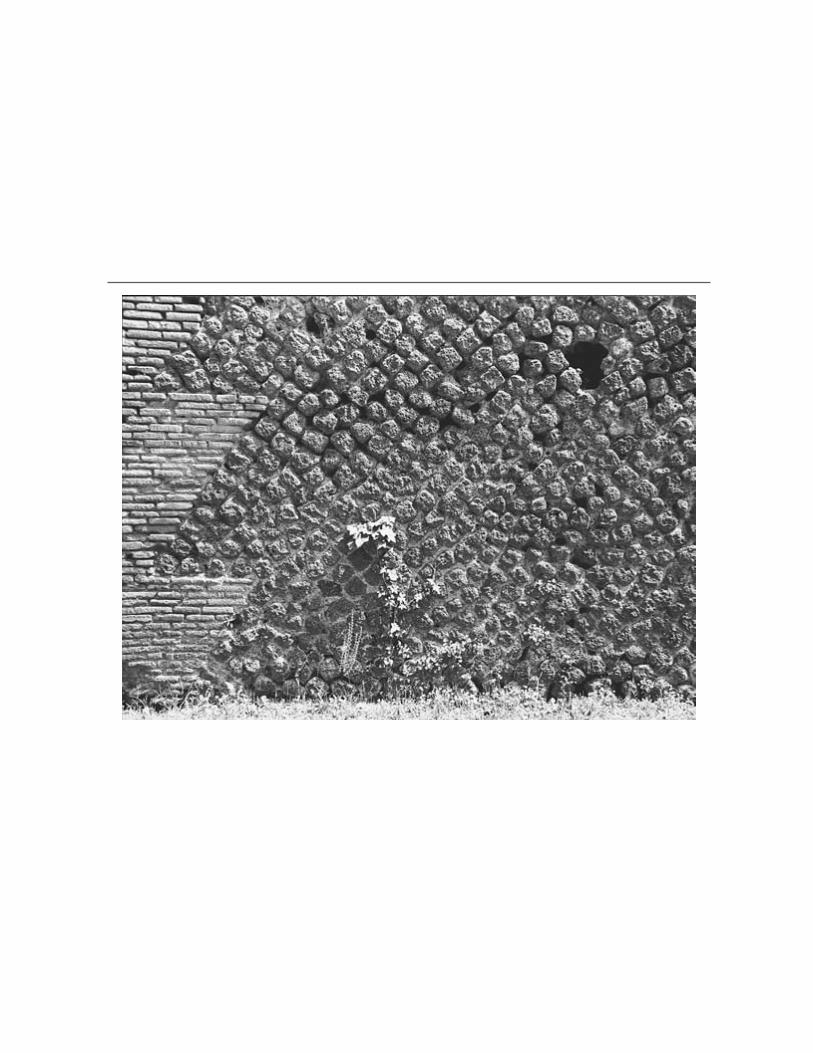
11ADMINISTRATION OF
PLANNING PROGRAMS
381
Once a plan and implementing measures have been adopted by the appropriate leg-
islative body, it is usually necessary to establish some form of ongoing administration.
This may be accomplished in several ways. One way to administer a plan and its im-
plementing measures is through the use of commissions and review boards compris-
ing elected or appointed citizens. Such groups often require technical assistance from
a professional staff.
Administration presents many challenges for planners. As planning goals are
institutionalized, a greater distance grows between the excitement of creation and
the routine of everyday management. The typical office is isolated from the living
landscape. Yet, for the landscape to be managed effectively there must be some set
of rules for management and for those who are responsible to ensure that the rules
are indeed obeyed. Rules should not inhibit the creation of sustainable places.
Rather, they should provide the framework for regenerative community design and
place making. Flexibility is often necessary, so that plans can adjust to changing
conditions, while continuing to achieve its goals.
Local governments can effectively manage many
land- use programs. However, local communities must
be viewed in terms of larger and more complex interact-
ing regions. The technological potentials for the ex-
ploitation of nature and the increase in knowledge
about biophysical and sociocultural processes have re-
sulted in the necessity for continued innovation in the
administration of planning programs. Many efforts
need to be addressed by multiple levels of government
and by partnerships between government and non-
government organizations. To be most effective and eq-
uitable, administration must be a two- way street—
managers and planners must understand the people
they serve, and citizens must appreciate and monitor the
bureaucrats. Such communication and interaction form
the basis of “results- based government.”
This chapter explores the current systems used
to administer plans. The role of planning commis-
sions, review boards, and planning staffs are de-
scribed. The impact of procedural requirements are
discussed briefly. One administrative tool is the
budget. Three budgeting techniques are described: the
planning, programming, and budget system (PPBS);
program strategies; and capital improvement pro-
gramming (CIP). Impact statements are an ap-
proach to evaluate government programs and projects.
Two examples of planning administration are pre-
sented: regional growth management planning in
Portland, Oregon; and the Tucson, Arizona, WASH
ordinance.
Current Planning
Local planning commissions and agencies adminis-
ter a myriad of activities. They address long- term,
midrange, and current plans. The scales of such
plans range from the neighborhood to the metro-
politan region. Many basic urban functions are in-
cluded in these plans, including utilities, drainage,
circulation, and public facilities. Planning agencies
and commissions address a broad range of topics in-
cluding budgets, annexations, brownfields redevel-
opment, in-fill, freeway mitigation, and historic
preservation. Planning commissions, review boards,
and planning staffs are thus central to the functions
and forms of contemporary settlement patterns.
The Role of Planning Commissions and
Review Boards
Planning commissions originated in the early twen-
tieth century. The idea was promulgated by munici-
pal reformers dismayed by the corruption of big- city
politics. Planning commissions were proposed as in-
dependent advisory boards of honest, civic- spirited
citizens. The commissions were to make recommen-
dations to elected officials. The concept was embod-
ied in the model Planning Enabling Act of 1928 pub-
lished by the U.S. Department of Commerce and
adopted by many state legislatures. Such commis-
sions are created by ordinance by the appropriate
city, special- use, county, regional, state, or federal ju-
risdiction. Usually planning commissions consist of
five to nine members. The members are typically ap-
pointed by an elected official for a specific period of
time.
Planning commissions usually have two func-
tions. The first is advisory. They assist elected offi-
cials in establishing goals, objectives, and policy for
the jurisdiction. In this capacity, they may conduct
research and review options facing the planning
area. Sometimes a jurisdiction may be subdivided
into smaller areas, each with its own planning com-
mittee. In such cases, these committees may also
conduct research and advise the planning commis-
sion. The second function of the planning commis-
sion is administrative. In cities and counties, plan-
ning commissions review subdivision proposals to
assure that they conform to regulations.
Planning commissions may also hold hearings
to review proposed changes in zoning ordinances
and comprehensive plans. Such hearings are quasi-
382CHAPTER 11
judicial proceedings in some states and take on a
courtlike format. Planning commission findings
from hearings are passed on as recom mendations to
elected officials. If those people proposing changes
are not pleased with the decision of the elected body,
then they may appeal it to the court.
The relative ease of rezoning and amending
comprehensive plans has been criticized as a weak
link in the American planning process. Political
pressure can be used to force appointed and elected
bodies to approve such changes even if they are con-
trary to established goals and the conclusion of sci-
entific and technical research. Anyone who has been
involved in such hearings will testify that they are a
very human procedure—with the outcome often
based more on the persuasive power of key individ-
uals and emotion than on logic.
Another type of citizen body involved in plan-
ning administration is the review board. These are
usually special- purpose groups. Examples include
zoning review boards, boundary review boards,
design review boards, and environmental quality
councils. Zoning review boards, also called boards of
adjustments, administer variances from zoning ordi-
nances and conditional uses that may be permitted
in the ordinances with special permission. Boundary
review boards may be involved in such matters as an-
nexations and capital improvements. Design boards
may arbitrate aesthetic matters in a community and
are often composed of architects, landscape archi-
tects, artists, and designers. Environmental boards re-
view matters of environmental quality and are made
up of individuals with an interest or training in the
relevant sciences. Some review boards include some
or all members who are elected officials or profes-
sionals rather than appointed citizens.
The Role of Planning Staffs
Many planning agencies are split into two divisions
to separately handle long- range and current func-
tions. The long- range division is responsible for re-
search, projections, comprehensive planning, and
special functions that may arise as a result of a spe-
cific issue. The current planning division is respon-
sible for the administration of regulations. This
function may be shifted to another department of
government such as that responsible for public
works.
The current planning staff is generally responsi-
ble for processing applications of those who want
to change the use of their property or develop it for
some purpose. The current planning staff often
works with the property owner to ensure the appli-
cation meets all the necessary requirements of the
commission or review board. The staff may be re-
sponsible for presenting its findings to the commis-
sion or review board. They may also be responsible
for the public notice of hearings to review such
proposals. In many jurisdictions the current plan-
ning staff has the authority to process applications
that meet specified requirements. In these munici-
palities and counties, commissions or boards re-
view only those applications where a variance is
needed.
The Phoenix planning department moved away
from the current and long- range structure to a more
issue and geographically based team approach. The
city planning department adopted a vision to “pro-
vide excellent customer service and consistent pol-
icy advice that guides the physical, economic and
social growth of Phoenix to achieve a better quality
of life.” The staff organization reflects this vision
(Figure 11.1). The city is divided into three parts:
north, south, and south, each with an associated
team. The north area team is responsible for the
Desert View Tri- Villages Area planning described
throughout this book. Other teams address specific
topics like growth, freeways, and research as well as
current planning (hearings and zoning).
The weaknesses involved in rezoning through
commissions and the sheer number of applications
for zone changes have prompted some jurisdictions
to make this function a staff responsibility. These
383ADMINISTRATION OF PLANNING PROGRAMS
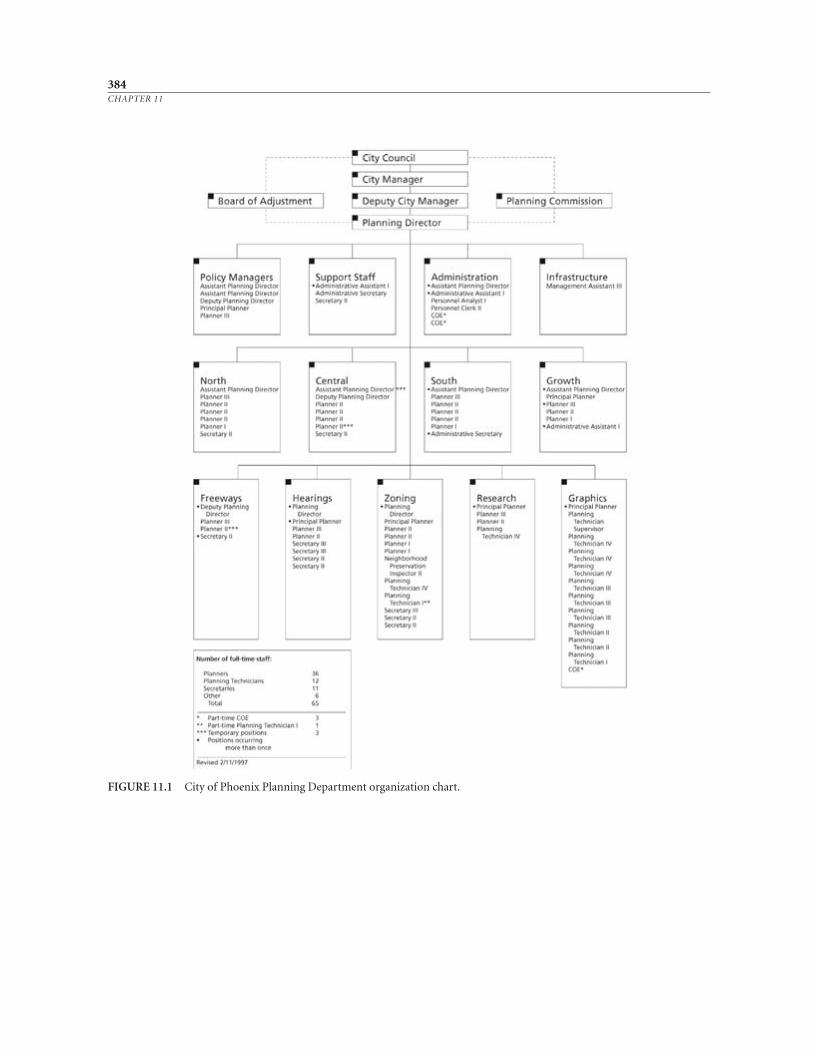
384CHAPTER 11
FIGURE 11.1 City of Phoenix Planning Department organization chart.
hearings examiners or zoning adjusters have the ad-
ministrative responsibility to approve zone changes
on the merits of the case. Presumably, these deci-
sions may be made in a more unbiased, professional
manner than by a citizen board or commission. The
rulings of hearings examiners, or zoning adjusters,
are subject to appeal if the applicant or other party
is not satisfied with the results.
In areas where performance standards have been
adopted, it may be necessary for a team to visit sites
to ensure the criteria have been met. For instance,
for a proposed residential development in an agri-
cultural area, such a team may comprise a staff plan-
ner, a soil scientist from the NRCS, an engineer, and
a health officer. These individuals are responsible
for making a report of their findings concerning the
conformance of the site to the standards.
The Impact of Procedural Requirements
The process that individuals must go through to
meet the legal requirements of a jurisdiction obvi-
ously has an impact on their personal plans for the
use of property. Procedural requirements should
ensure that the laws of the jurisdiction are met, yet
be fair and swift to minimize unnecessary costs to
individuals proposing changes.
Generally, regulatory systems have three basic el-
ements in common. First, there is a preapplication
stage, during which proponents of a land- use
change discuss ideas with the planning staff. Second,
there is a technical staff review. At this stage, propo-
nents submit a formal application, often accompa-
nied by plans and drawings. The planning staff re-
views the application and makes recommendations
to elected officials. Finally, there is the official review
made by the appointed and/or elected officials or
possibly by an administrator. Often proponents of a
change are responsible for the costs involved in the
technical and official reviews.
For those responsible for such reviews, it would
be wise to remember that the word administration
in its original Latin form meant to give help or ser-
vice. Mission and vision statements for planning
commissions and planning department staffs can
reinforce the importance of public service. There are
numerous ways that these administrators can help
people through the regulatory process. One way is
to minimize the number of required permits. An-
other is to publish the procedural requirements in a
straightforward format. (Figure 11.2 is an example
of the application procedure for a certificate of zon-
ing compliance in Whitman County, Washington.)
Also, the application forms should be easy for all to
understand. (Figure 11.3 is an example of an appli-
cation for a certificate of zoning compliance in
Whitman County, Washington.) Finally, it is impor-
tant for administrators to be courteous and friendly.
We need to listen to those we serve (see, for example,
McClendon 1992).
The Budget
Planners and public administrators seek more effec-
tive ways to link policy objectives and government
expenditures. Too often goals to protect environ-
mental quality become disconnected from day- to-
day decision making. Actions can be taken, often
with public funds, which result in the very environ-
mental amenities valued by the public. The budget
can be administered to ensure a connection between
goals and actions.
Planning, Programming, and Budget
System (PPBS)
The budget is perhaps the most effective way to ad-
minister planning programs. There are numerous
techniques to manage budgets. In the early 1960s,
the planning, programming, and budget system
(PPBS) was initiated in the U.S. Department of
385ADMINISTRATION OF PLANNING PROGRAMS
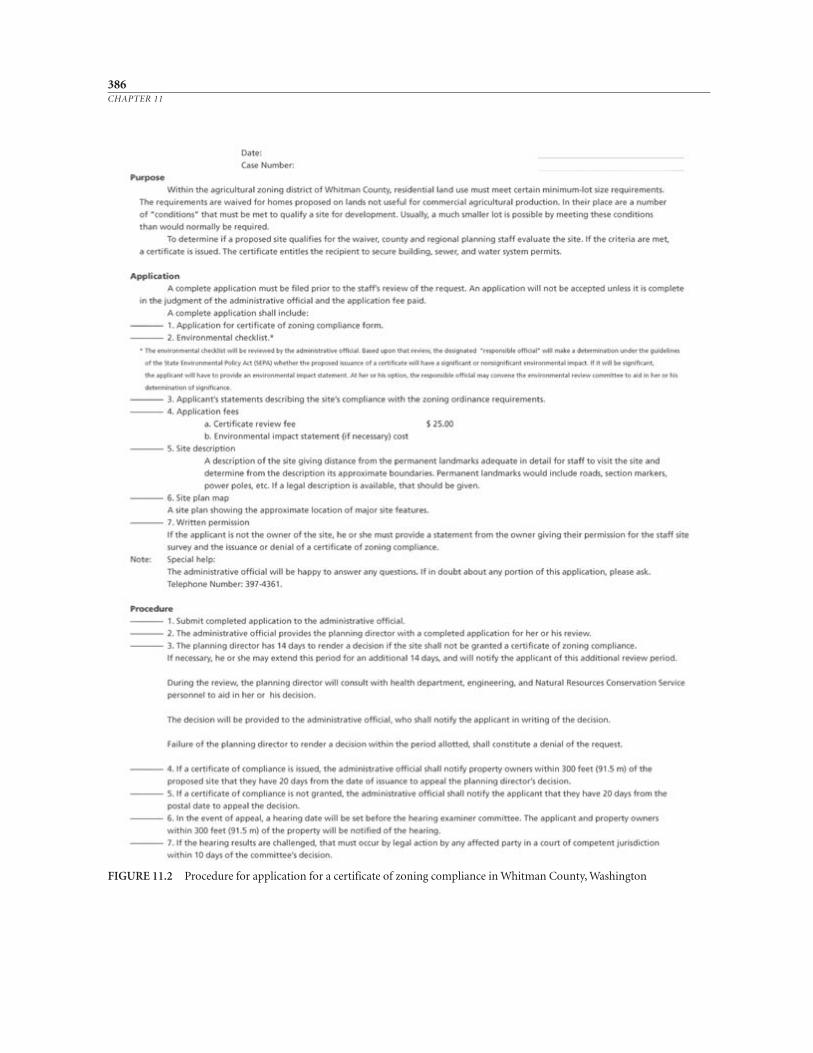
386CHAPTER 11
FIGURE 11.2 Procedure for application for a certificate of zoning compliance in Whitman County, Washington
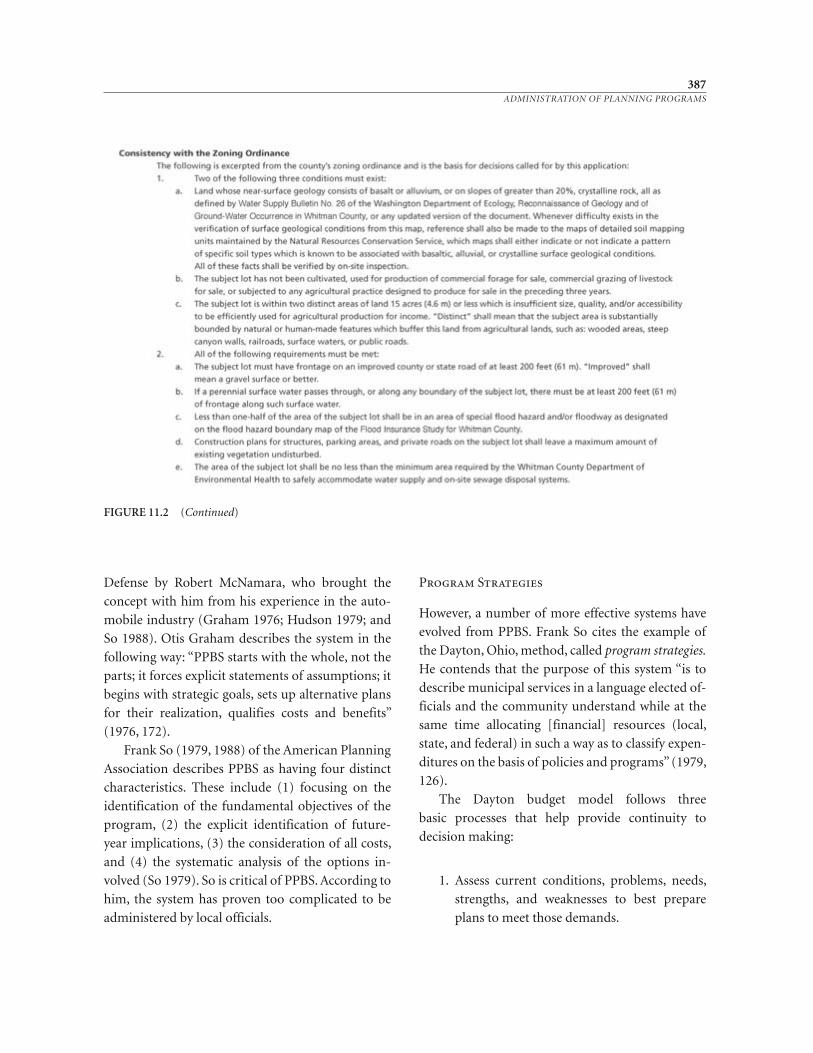
Defense by Robert McNamara, who brought the
concept with him from his experience in the auto-
mobile industry (Graham 1976; Hudson 1979; and
So 1988). Otis Graham describes the system in the
following way: “PPBS starts with the whole, not the
parts; it forces explicit statements of assumptions; it
begins with strategic goals, sets up alternative plans
for their realization, qualifies costs and benefits”
(1976, 172).
Frank So (1979, 1988) of the American Planning
Association describes PPBS as having four distinct
characteristics. These include (1) focusing on the
identification of the fundamental objectives of the
program, (2) the explicit identification of future-
year implications, (3) the consideration of all costs,
and (4) the systematic analysis of the options in-
volved (So 1979). So is critical of PPBS. According to
him, the system has proven too complicated to be
administered by local officials.
Program Strategies
However, a number of more effective systems have
evolved from PPBS. Frank So cites the example of
the Dayton, Ohio, method, called program strategies.
He contends that the purpose of this system “is to
describe municipal services in a language elected of-
ficials and the community understand while at the
same time allocating [financial] resources (local,
state, and federal) in such a way as to classify expen-
ditures on the basis of policies and programs” (1979,
126).
The Dayton budget model follows three
basic processes that help provide continuity to
decision making:
1. Assess current conditions, problems, needs,
strengths, and weaknesses to best prepare
plans to meet those demands.
387ADMINISTRATION OF PLANNING PROGRAMS
FIGURE 11.2 (Continued)
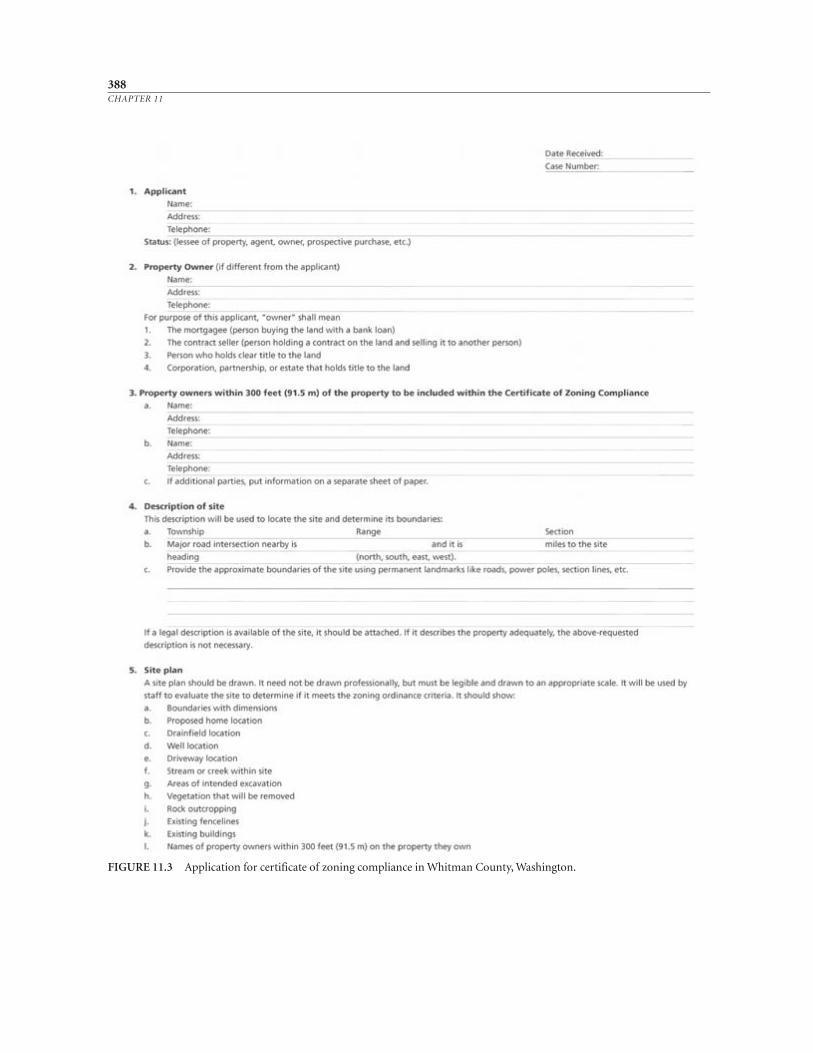
388CHAPTER 11
FIGURE 11.3 Application for certificate of zoning compliance in Whitman County, Washington.
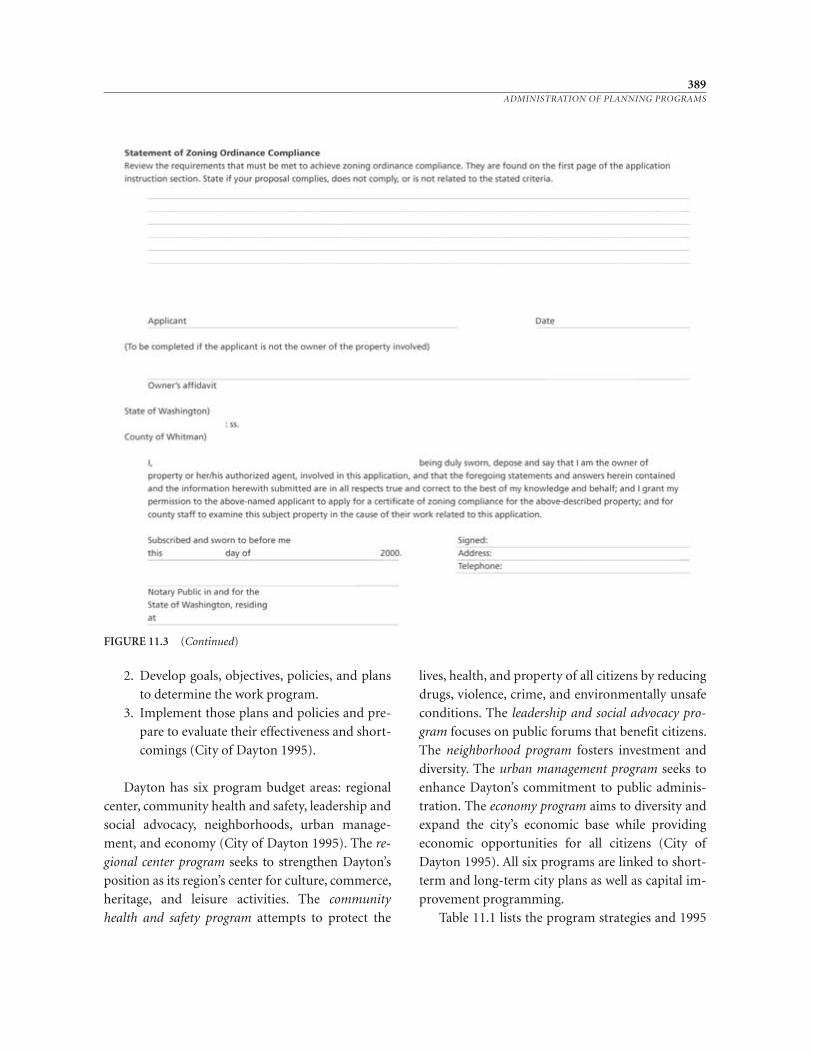
389ADMINISTRATION OF PLANNING PROGRAMS
FIGURE 11.3 (Continued)
2. Develop goals, objectives, policies, and plans
to determine the work program.
3. Implement those plans and policies and pre-
pare to evaluate their effectiveness and short-
comings (City of Dayton 1995).
Dayton has six program budget areas: regional
center, community health and safety, leadership and
social advocacy, neighborhoods, urban manage-
ment, and economy (City of Dayton 1995). The re-
gional center program seeks to strengthen Dayton’s
position as its region’s center for culture, commerce,
heritage, and leisure activities. The community
health and safety program attempts to protect the
lives, health, and property of all citizens by reducing
drugs, violence, crime, and environmentally unsafe
conditions. The leadership and social advocacy pro-
gram focuses on public forums that benefit citizens.
The neighborhood program fosters investment and
diversity. The urban management program seeks to
enhance Dayton’s commitment to public adminis-
tration. The economy program aims to diversity and
expand the city’s economic base while providing
economic opportunities for all citizens (City of
Dayton 1995). All six programs are linked to short-
term and long- term city plans as well as capital im-
provement programming.
Table 11.1 lists the program strategies and 1995
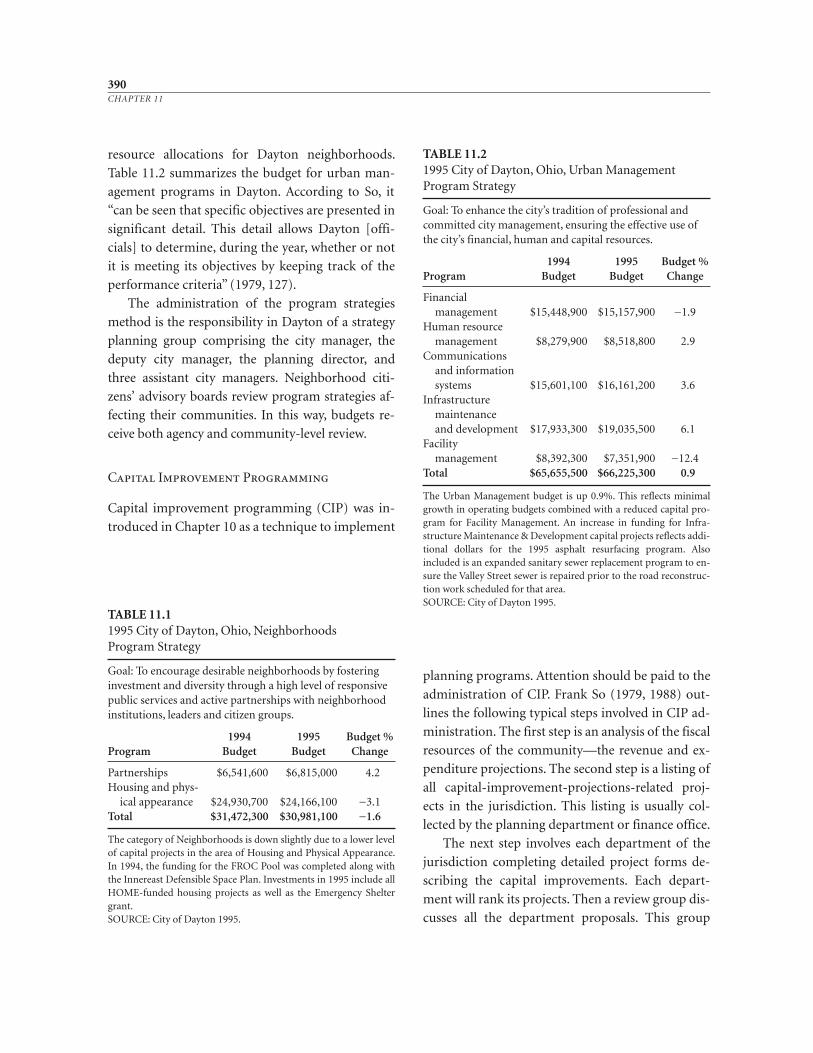
resource allocations for Dayton neighborhoods.
Table 11.2 summarizes the budget for urban man-
agement programs in Dayton. According to So, it
“can be seen that specific objectives are presented in
significant detail. This detail allows Dayton [offi-
cials] to determine, during the year, whether or not
it is meeting its objectives by keeping track of the
performance criteria” (1979, 127).
The administration of the program strategies
method is the responsibility in Dayton of a strategy
planning group comprising the city manager, the
deputy city manager, the planning director, and
three assistant city managers. Neighborhood citi-
zens’ advisory boards review program strategies af-
fecting their communities. In this way, budgets re-
ceive both agency and community- level review.
Capital Improvement Programming
Capital improvement programming (CIP) was in-
troduced in Chapter 10 as a technique to implement
planning programs. Attention should be paid to the
administration of CIP. Frank So (1979, 1988) out-
lines the following typical steps involved in CIP ad-
ministration. The first step is an analysis of the fiscal
resources of the community—the revenue and ex-
penditure projections. The second step is a listing of
all capital- improvement- projections- related proj-
ects in the jurisdiction. This listing is usually col-
lected by the planning department or finance office.
The next step involves each department of the
jurisdiction completing detailed project forms de-
scribing the capital improvements. Each depart-
ment will rank its projects. Then a review group dis-
cusses all the department proposals. This group
390CHAPTER 11
TABLE 11.11995 City of Dayton, Ohio, Neighborhoods Program Strategy
Goal: To encourage desirable neighborhoods by fosteringinvestment and diversity through a high level of responsivepublic services and active partnerships with neighborhoodinstitutions, leaders and citizen groups.
1994 1995 Budget %Program Budget Budget Change
Partnerships $6,541,600 $6,815,000 4.2Housing and phys-
ical appearance $24,930,700 $24,166,100 −3.1Total $31,472,300 $30,981,100 −1.6
The category of Neighborhoods is down slightly due to a lower levelof capital projects in the area of Housing and Physical Appearance.In 1994, the funding for the FROC Pool was completed along withthe Innereast Defensible Space Plan. Investments in 1995 include allHOME- funded housing proj ects as well as the Emergency Sheltergrant.SOURCE: City of Dayton 1995.
TABLE 11.21995 City of Dayton, Ohio, Urban ManagementProgram Strategy
Goal: To enhance the city’s tradition of professional andcommitted city management, ensuring the effective use ofthe city’s financial, human and capital resources.
1994 1995 Budget %Program Budget Budget Change
Financial management $15,448,900 $15,157,900 −1.9
Human resource management $8,279,900 $8,518,800 2.9
Communicationsand informationsystems $15,601,100 $16,161,200 3.6
Infrastructure maintenance and development $17,933,300 $19,035,500 6.1
Facility management $8,392,300 $7,351,900 −12.4
Total $65,655,500 $66,225,300 0.9
The Urban Management budget is up 0.9%. This reflects minimalgrowth in operating budgets combined with a reduced capital pro-gram for Facility Management. An increase in funding for Infra-structure Maintenance & Development capital projects reflects addi-tional dollars for the 1995 asphalt resurfacing program. Alsoincluded is an expanded sanitary sewer replacement program to en-sure the Valley Street sewer is repaired prior to the road reconstruc-tion work scheduled for that area.SOURCE: City of Dayton 1995.
includes the planning director, finance officer, the
local government manager, top elected officials, and
department heads. Often public hearings are held
concerning the proposed expenditures. From this
stage a priority ranking of the projects is achieved.
The CIP is then presented to the appropriate leg-
islative body. After this body determines its own ex-
penditure priorities and choices, the CIP is adopted
(So 1979). Budgeting is a cyclical process, usually
occurring annually. One of the strengths of CIP is
that projects and programs can be linked to com-
munity goals and the ability of an area to sustain
proposed capital improvements.
Environmental Impact Assessments
As a result of NEPA, a national policy for the envi-
ronment and the Council on Environmental Qual-
ity (CEQ) were established. The central purposes of
the act were
to declare a national policy which will encourage pro-
ductive and enjoyable harmony between man and his
environment; to promote efforts which will prevent
or eliminate damage to the environment and bio-
sphere and stimulate the health and welfare of man;
to enrich the understanding of the ecological systems
and natural resources important to the Nation and to
establish a Council on Environmental Quality (U.S.
Congress 1969).
The requirements for environmental impact
statements (EISs) were established by Section 102(2)
of the National Environmental Policy Act as follows:
All agencies of the federal government shall—
A. Utilize a systematic, interdisciplinary ap-
proach which will insure the integrated use
of the natural and social sciences and envi-
ronmental design arts in planning and in
decision making which may have an impact
on man’s environment;
B. Identify and develop methods and proce-
dures in consultation with the Council on
Environmental Quality . . . which will insure
that presently unquantified environmental
amenities and values may be given appropri-
ate consideration in decision making along
with economic and technical considerations;
C. Include in every recommendation or report
on proposals for legislation and other major
federal actions significantly affecting the
quality of the human environment, a de-
tailed statement by the responsible official
on—
i. The environmental impact of the pro-
posed action,
ii. Any adverse environmental effects which
cannot be avoided should the proposal
be implemented,
iii. Alternatives to the proposed action,
iv. The relationship between local short-
term uses of man’s environment and the
maintenance and enhancement of long-
term productivity, and
v. Any irreversible and irretrievable com-
mitments of resources which would be
involved in the proposed action should it
be implemented (U.S. Congress 1969).
The purpose of an EIS is to serve as “an action-
forcing device to insure that the policies and goals”
defined in the National Environmental Policy Act
“are infused into the ongoing programs and ac-
tions” of the federal government. The EIS is to pro-
vide “full and fair discussion of significant environ-
mental impacts” and is to “inform decision- makers
and the public of reasonable alternatives which
would avoid or minimize adverse impacts or en-
hance the quality of the human environment.”
According to the Council on Environmental Qual-
ity, “An environmental impact statement is more
than a disclosure document. It shall be used by Fed-
eral officials in conjunction with other relevant
391ADMINISTRATION OF PLANNING PROGRAMS
material to plan actions and make decisions” (1986,
791).
Often the EIS (or a less comprehensive review
known as an environmental assessment) is prepared
jointly between a federal agency and state or local gov-
ernments. Since NEPA states that “major Federal ac-
tions significantly affecting the quality of the human
environment” require an EIS, both federally funded
projects and federal permits and licenses are subject to
the law. The approval process for projects, permits, or
licenses may affect how a local plan is implemented or
administered. If, for instance, a county has a policy to
protect farmland and environmentally sensitive lands,
and a federal project is proposed, such as a dam or
highway, then county officials may object during the
EIS process.On the other hand, it may be county pol-
icy to provide new sources of water or transporta-
tion. In this case, the county may work with a federal
agency to advocate water- supply and transportation
options which would be studied through the EIS pro-
cess. A developer may propose a project that requires
a permit (e.g., Section 404 dredge and fill permits re-
quired through clean water legislation for wetlands).
In such a case, county officials can comment during
the EIS process concerning the consistency of such a
proposal with local plans.
The CEQ has developed a recommended format
for EISs that is similar to the ecological planning
process being described in this text. The following
standard format is to be used by federal agencies to
prepare EISs:
• Cover sheet
• Summary
• Table of contents
• Purpose of and need for action
• Alternatives including the proposed action
• Affected environment
• Environmental consequences
• List of preparers
• List of agencies
• Index
• Appendixes
The cover sheet includes relevant information
about the proposal, such as the responsible agencies,
the title of the proposed action, contact people, the
designation of the EIS as draft or final, an abstract,
and the date by which comments must be received.
The summary provides a synopsis of major conclu-
sions, areas of controversy, and the issues to be re-
solved. The EIS is then to briefly specify the underly-
ing purpose and need to which the agency is
responding (Council on Environmental Quality
1986).
The heart of the EIS is the description of the al-
ternatives including the proposed action. Planners
are to rigorously “explore and objectively evaluate
all reasonable alternatives.” Each alternative is to be
considered in detail. An “alternative of no action” is
to be included in the analysis. The agency is to iden-
tify its preferred alternative or alternatives and to in-
clude appropriate mitigation measures to address
environmental impacts (Council on Environmental
Quality 1986).
The EIS is to describe “the environment of the
area(s) to be affected or created by the alternatives
under consideration.” The affected environment
section of an EIS is an inventory and analysis of the
planning area, such as what was described in Chap-
ters 3 and 4. The affected environment section is to
be followed by detailed studies of the environmental
consequences. The environmental consequences
section “forms the scientific and analytic basis” for
comparisons of alternatives. The consequences are
to include discussions of direct effects of the alterna-
tives and their significance; indirect effects and their
significance; energy requirements and conservation
potential of various alternatives; natural or de-
pletable resource requirements and conservation
potentials; urban quality, historic and cultural re-
sources, and the design of the built environment, in-
cluding reuse and conservation potentials; and
means to mitigate adverse environmental impacts.
This section is also to address possible conflicts be-
tween the proposed actions and the objectives of
federal, regional, state, local, and Indian land- use
392CHAPTER 11
plans, policies, and controls for the area concerned
(Council on Environmental Quality 1986).
In addition to the federal environmental protec-
tion law, 27 states, the Commonwealth of Puerto
Rico, and many local governments have adopted
impact statement or assessment requirements. Ac-
cording to Leonard Ortolano (1984), 14 states use
comprehensive statutory requirements, 4 have com-
prehensive executive or administrative orders, and 9
have special- purpose EIS requirements. For exam-
ple, the Washington State Environmental Policy Act
(SEPA) has four primary purposes:
1. To declare a state policy which will encourage
productive and enjoyable harmony between
people and their environment
2. To promote efforts which will present or
eliminate damage to the environment and
bio sphere
3. To stimulate the health and welfare of people
4. To enrich the understanding of ecological
systems and natural resources important to
the state and the nation (Washington Depart-
ment of Ecology 1995, as listed in Chapter
43.21C Revised Code of Washington)
As many as 80 other nations also have environ-
mental impact assessment requirements (Westman
1985; Canter 1996; Ortolano 1997). The United Na-
tions, the World Bank, the U.S. Agency for Interna-
tional Development, and the aid agencies of many
European nations have played important roles in
encouraging developing nations to adopt environ-
mental review procedures. As of 1992, “37 out of the
51 countries in Africa had established ‘Ministries of
Environment, Natural Resources, or Nature Con-
servations/Protection’ ” (Ortolano 1997, 62, citing
Tolba et al. 1992, 724–725).
In 1985, the European Union (EU) approved a
directive (85/337) that requires member states to
undertake environmental impact assessments. Eu-
ropean nations that previous to the EU directive
did not have environmental review requirements
subsequently adopted measures. For example, the
1986 Italian law that created the Ministero dell’Am-
biente (Department of Environment) also accepted
the EU directive. Then, in 1988, two Italian laws
were enacted that defined environmental review re-
quirements. Like environmental review procedures
in the United States, Italian studies are required to
assess the consequences of government actions. The
Italian law includes a procedural framework, a
project framework, and an environmental frame-
work. The Netherlands, another EU member, has a
similar law. The Dutch law requires that one of the
possible alternatives focus on the best environmen-
tal consequences. The Dutch law also establishes
an independent scientific review board to verify
the accuracy of environmental impact assessment
documents.
A major criticism of environmental impact re-
view at the federal level in the United States is that
essentially the process is procedural rather than sub-
stantive (Ortolano 1997). For instance, the Natural
Resources Defense Council has observed,
Environmentalists today are turning more attention
toward the substantive quality of the NEPA state-
ments which are prepared. Unfortunately, far too fre-
quently the quality of these impact statements leaves
much to be desired. For example, NEPA statements
are sometimes silent on the most severe environmen-
tal effects caused by a proposed project (1977, 28).
Critics argue that NEPA has been little more
than a bureaucratic exercise that requires federal
agencies to complete paperwork that they sub se-
quently file and ignore. Valerie Fogleman declared,
“as NEPA is presently written, agencies that comply
with its procedures by spending millions of dollars
analyzing proposed actions, do not violate NEPA if
they proceed with environmentally destructive ac-
tions contrary to NEPA’s policies and purposes”
(1990, 245).
In some states with comprehensive statutory re-
quirements, the EIS process has become somewhat
393ADMINISTRATION OF PLANNING PROGRAMS
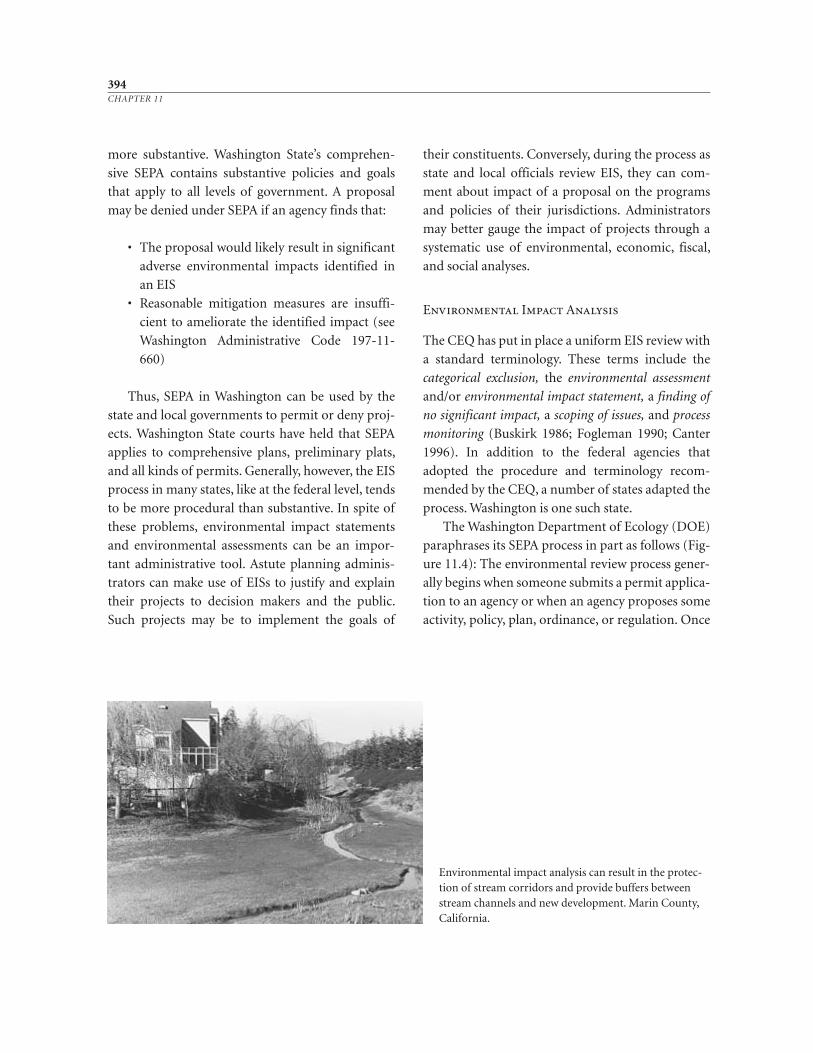
more substantive. Washington State’s comprehen-
sive SEPA contains substantive policies and goals
that apply to all levels of government. A proposal
may be denied under SEPA if an agency finds that:
• The proposal would likely result in significant
adverse environmental impacts identified in
an EIS
• Reasonable mitigation measures are insuffi-
cient to ameliorate the identified impact (see
Washington Administrative Code 197- 11-
660)
Thus, SEPA in Washington can be used by the
state and local governments to permit or deny proj-
ects. Washington State courts have held that SEPA
applies to comprehensive plans, preliminary plats,
and all kinds of permits. Generally, however, the EIS
process in many states, like at the federal level, tends
to be more procedural than substantive. In spite of
these problems, environmental impact statements
and environmental assessments can be an impor-
tant administrative tool. Astute planning adminis-
trators can make use of EISs to justify and explain
their projects to decision makers and the public.
Such projects may be to implement the goals of
their constituents. Conversely, during the process as
state and local officials review EIS, they can com-
ment about impact of a proposal on the programs
and policies of their jurisdictions. Administrators
may better gauge the impact of projects through a
systematic use of environmental, economic, fiscal,
and social analyses.
Environmental Impact Analysis
The CEQ has put in place a uniform EIS review with
a standard terminology. These terms include the
categorical exclusion, the environmental assessment
and/or environmental impact statement, a finding of
no significant impact, a scoping of issues, and process
monitoring (Buskirk 1986; Fogleman 1990; Canter
1996). In addition to the federal agencies that
adopted the procedure and terminology recom-
mended by the CEQ, a number of states adapted the
process. Washington is one such state.
The Washington Department of Ecology (DOE)
paraphrases its SEPA process in part as follows (Fig-
ure 11.4): The environmental review process gener-
ally begins when someone submits a permit applica-
tion to an agency or when an agency proposes some
activity, policy, plan, ordinance, or regulation. Once
394CHAPTER 11
Environmental impact analysis can result in the protec-tion of stream corridors and provide buffers betweenstream channels and new development. Marin County,California.
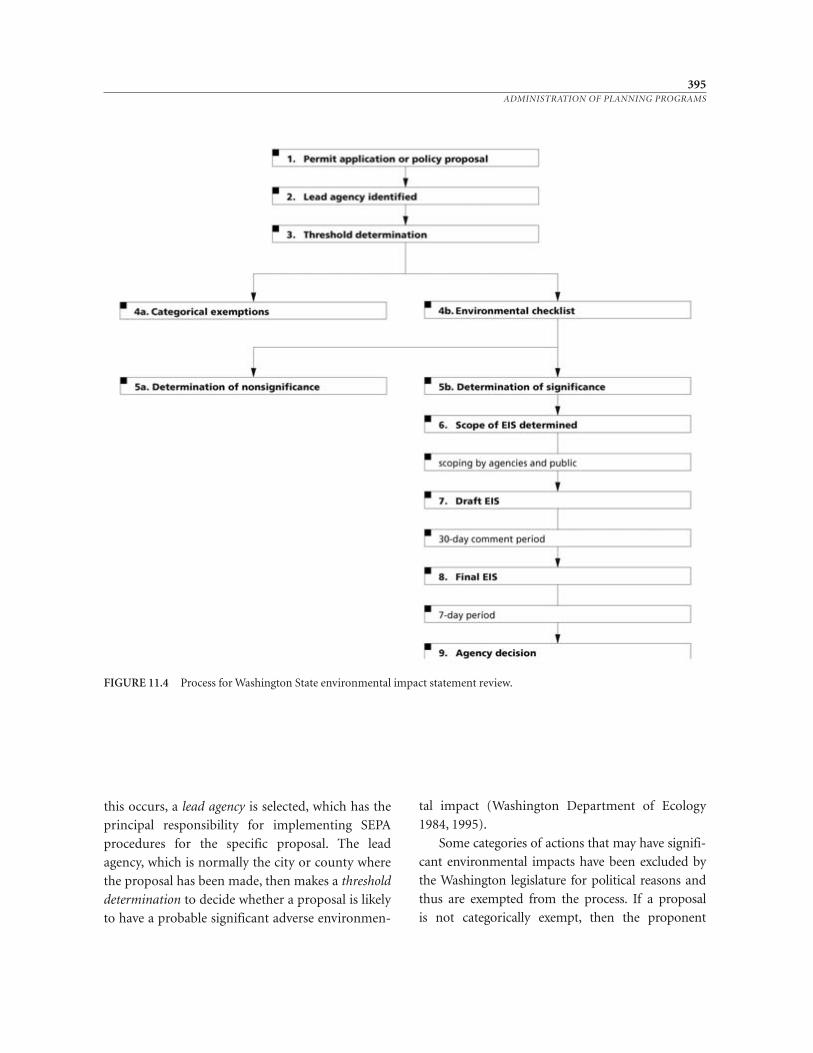
this occurs, a lead agency is selected, which has the
principal responsibility for implementing SEPA
procedures for the specific proposal. The lead
agency, which is normally the city or county where
the proposal has been made, then makes a threshold
determination to decide whether a proposal is likely
to have a probable significant adverse environmen-
tal impact (Washington Department of Ecology
1984, 1995).
Some categories of actions that may have signifi-
cant environmental impacts have been excluded by
the Washington legislature for political reasons and
thus are exempted from the process. If a proposal
is not categorically exempt, then the proponent
395ADMINISTRATION OF PLANNING PROGRAMS
FIGURE 11.4 Process for Washington State environmental impact statement review.
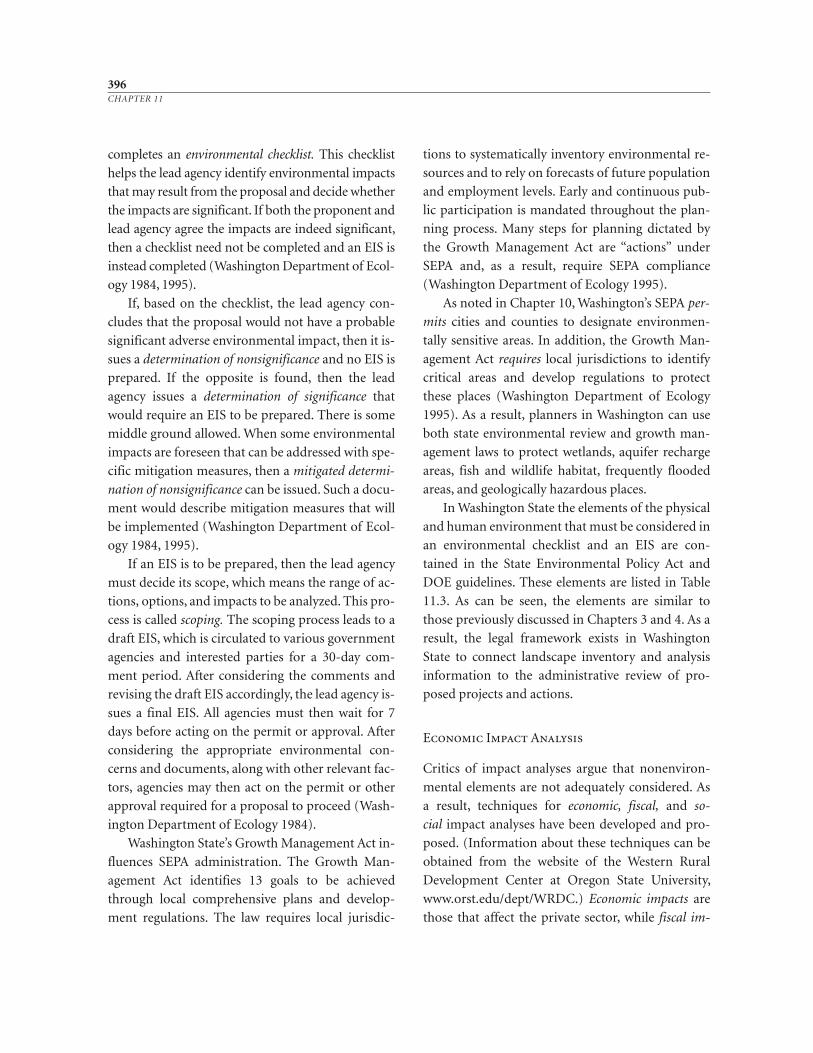
completes an environmental checklist. This checklist
helps the lead agency identify environmental impacts
that may result from the proposal and decide whether
the impacts are significant. If both the proponent and
lead agency agree the impacts are indeed significant,
then a checklist need not be completed and an EIS is
instead completed (Washington Department of Ecol-
ogy 1984, 1995).
If, based on the checklist, the lead agency con-
cludes that the proposal would not have a probable
significant adverse environmental impact, then it is-
sues a determination of nonsignificance and no EIS is
prepared. If the opposite is found, then the lead
agency issues a determination of significance that
would require an EIS to be prepared. There is some
middle ground allowed. When some environmental
impacts are foreseen that can be addressed with spe-
cific mitigation measures, then a mitigated determi-
nation of nonsignificance can be issued. Such a docu-
ment would describe mitigation measures that will
be implemented (Washington Department of Ecol-
ogy 1984, 1995).
If an EIS is to be prepared, then the lead agency
must decide its scope, which means the range of ac-
tions, options, and impacts to be analyzed. This pro-
cess is called scoping. The scoping process leads to a
draft EIS, which is circulated to various government
agencies and interested parties for a 30- day com-
ment period. After considering the comments and
revising the draft EIS accordingly, the lead agency is-
sues a final EIS. All agencies must then wait for 7
days before acting on the permit or approval. After
considering the appropriate environmental con-
cerns and documents, along with other relevant fac-
tors, agencies may then act on the permit or other
approval required for a proposal to proceed (Wash-
ington Department of Ecology 1984).
Washington State’s Growth Management Act in-
fluences SEPA administration. The Growth Man-
agement Act identifies 13 goals to be achieved
through local comprehensive plans and develop-
ment regulations. The law requires local jurisdic-
tions to systematically inventory environmental re-
sources and to rely on forecasts of future population
and employment levels. Early and continuous pub-
lic participation is mandated throughout the plan-
ning process. Many steps for planning dictated by
the Growth Management Act are “actions” under
SEPA and, as a result, require SEPA compliance
(Washington Department of Ecology 1995).
As noted in Chapter 10, Washington’s SEPA per-
mits cities and counties to designate environmen-
tally sensitive areas. In addition, the Growth Man-
agement Act requires local jurisdictions to identify
critical areas and develop regulations to protect
these places (Washington Department of Ecology
1995). As a result, planners in Washington can use
both state environmental review and growth man-
agement laws to protect wetlands, aquifer recharge
areas, fish and wildlife habitat, frequently flooded
areas, and geologically hazardous places.
In Washington State the elements of the physical
and human environment that must be considered in
an environmental checklist and an EIS are con-
tained in the State Environmental Policy Act and
DOE guidelines. These elements are listed in Table
11.3. As can be seen, the elements are similar to
those previously discussed in Chapters 3 and 4. As a
result, the legal framework exists in Washington
State to connect landscape inventory and analysis
information to the administrative review of pro-
posed projects and actions.
Economic Impact Analysis
Critics of impact analyses argue that nonenviron-
mental elements are not adequately considered. As
a result, techniques for economic, fiscal, and so-
cial impact analyses have been developed and pro-
posed. (Information about these techniques can be
obtained from the website of the Western Rural
Development Center at Oregon State University,
www.orst.edu/dept/WRDC.) Economic impacts are
those that affect the private sector, while fiscal im-
396CHAPTER 11
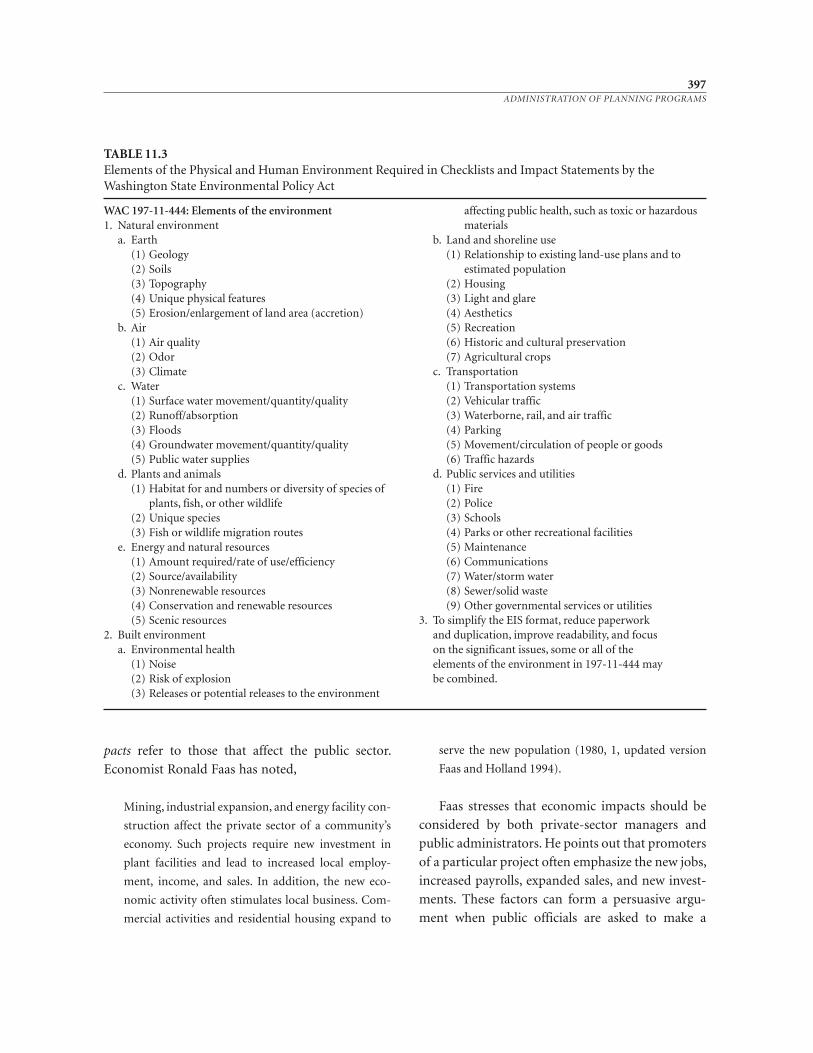
pacts refer to those that affect the public sector.
Economist Ronald Faas has noted,
Mining, industrial expansion, and energy facility con-
struction affect the private sector of a community’s
economy. Such projects require new investment in
plant facilities and lead to increased local employ-
ment, income, and sales. In addition, the new eco-
nomic activity often stimulates local business. Com-
mercial activities and residential housing expand to
serve the new population (1980, 1, updated version
Faas and Holland 1994).
Faas stresses that economic impacts should be
considered by both private- sector managers and
public administrators. He points out that promoters
of a particular project often emphasize the new jobs,
increased payrolls, expanded sales, and new invest-
ments. These factors can form a persuasive argu-
ment when public officials are asked to make a
397ADMINISTRATION OF PLANNING PROGRAMS
TABLE 11.3Elements of the Physical and Human Environment Required in Checklists and Impact Statements by theWashington State Environmental Policy Act
WAC 197- 11- 444: Elements of the environment1. Natural environment
a. Earth(1) Geology(2) Soils(3) Topography(4) Unique physical features(5) Erosion/enlargement of land area (accretion)
b. Air(1) Air quality(2) Odor(3) Climate
c. Water(1) Surface water movement/quantity/quality(2) Runoff/absorption(3) Floods(4) Groundwater movement/quantity/quality(5) Public water supplies
d. Plants and animals(1) Habitat for and numbers or diversity of species of
plants, fish, or other wildlife(2) Unique species(3) Fish or wildlife migration routes
e. Energy and natural resources(1) Amount required/rate of use/efficiency(2) Source/availability(3) Nonrenewable resources(4) Conservation and renewable resources(5) Scenic resources
2. Built environmenta. Environmental health
(1) Noise(2) Risk of explosion(3) Releases or potential releases to the environment
affecting public health, such as toxic or hazardousmaterials
b. Land and shoreline use(1) Relationship to existing land- use plans and to
estimated population(2) Housing(3) Light and glare(4) Aesthetics(5) Recreation(6) Historic and cultural preservation(7) Agricultural crops
c. Transportation(1) Transportation systems(2) Vehicular traffic(3) Waterborne, rail, and air traffic(4) Parking(5) Movement/circulation of people or goods(6) Traffic hazards
d. Public services and utilities(1) Fire(2) Police(3) Schools(4) Parks or other recreational facilities(5) Maintenance(6) Communications(7) Water/storm water(8) Sewer/solid waste(9) Other governmental services or utilities
3. To simplify the EIS format, reduce paperwork and duplication, improve readability, and focus on the significant issues, some or all of the elements of the environment in 197- 11- 444 may be combined.
zoning change, grant a variance, or allow a tax con-
cession. But these claims should not be accepted at
face value; rather, an objective evaluation of the eco-
nomic impacts should be made.
Economists have developed techniques that can
be helpful in measuring such impacts. One tool is
the economic multiplier. Multipliers are based on the
interdependency between two types of businesses in
the local economy—the export (or basic) and ser-
vice (or nonbasic) sectors. Export activities produce
goods and services for outside the local economy,
while service activities sell goods and services within
the local economy. An expansion of sales in the basic
sector generally has a multiplier effect on the local
service sector. Economic multipliers may be defined
then, as the numerical relationship between an orig-
inal change in economic activity and the ultimate
change in activity that results as the money is spent
and respent through various sectors of the economy
(Faas 1980; Faas and Holland 1994). This concept is
illustrated in Figure 11.5. Of $1 in wages, half may
be spent locally, of which half again goes to wages.
As a result, the original dollar generates another
$.25 of income the first time it is respent.
Several types of multipliers have been identified,
including employment multipliers, income multi-
pliers, and output multipliers. An employment mul-
tiplier is the total change in full- time equivalent em-
ployment (FTE) generated in the local economy for
each change of one FTE in an export sector of the
local economy. A household income (or earnings)
multiplier is the total change in household income
throughout the local economy from a $1 change in
household income payments by an export sector. An
output (or business) multiplier is the total change in
sales generated throughout the local economy by a
$1 change in export sales (Faas 1980; Faas and Hol-
land 1994).
There are many techniques for estimating eco-
nomic multipliers. Two such techniques include the
export- base approach and the input- output model
(see Chapter 4). The amount of income generated in
the local economy for the actual dollars spent will
vary. The sophistication and type of technique used
398CHAPTER 11
Canada geese on the Clearwater River, Idaho. (Barry Kough, The Lewiston Morning Tribune)
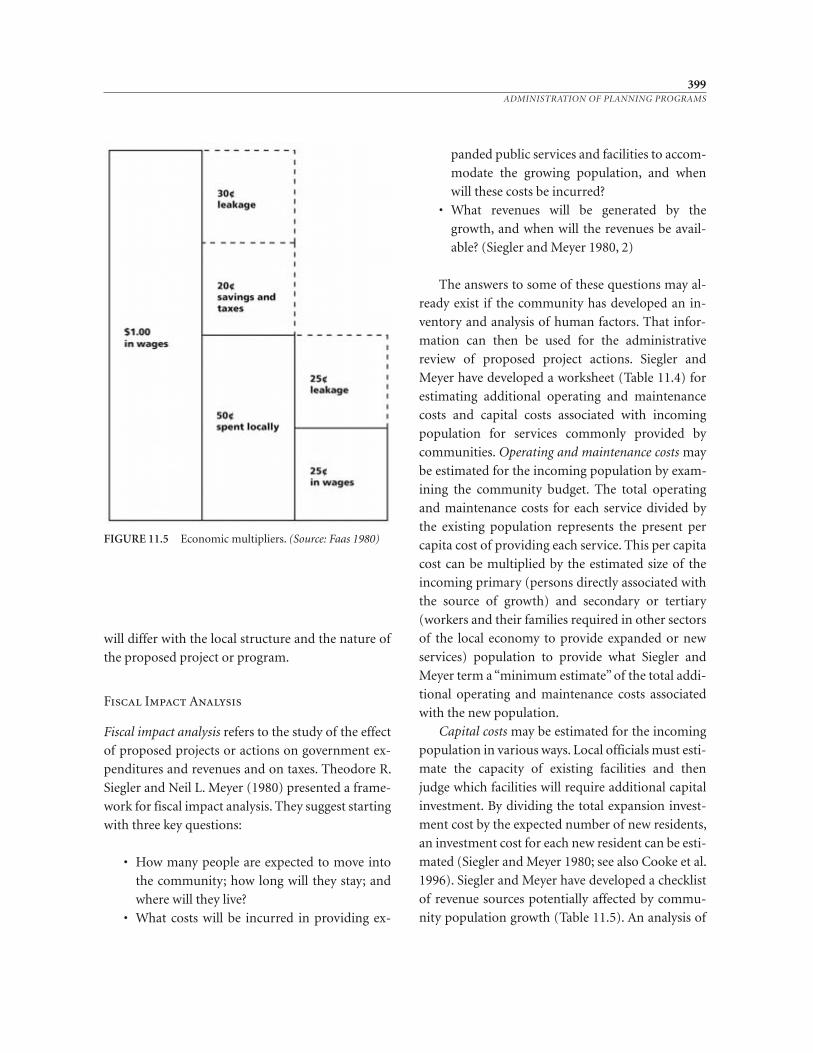
will differ with the local structure and the nature of
the proposed project or program.
Fiscal Impact Analysis
Fiscal impact analysis refers to the study of the effect
of proposed projects or actions on government ex-
penditures and revenues and on taxes. Theodore R.
Siegler and Neil L. Meyer (1980) presented a frame-
work for fiscal impact analysis. They suggest starting
with three key questions:
• How many people are expected to move into
the community; how long will they stay; and
where will they live?
• What costs will be incurred in providing ex-
panded public services and facilities to accom-
modate the growing population, and when
will these costs be incurred?
• What revenues will be generated by the
growth, and when will the revenues be avail-
able? (Siegler and Meyer 1980, 2)
The answers to some of these questions may al-
ready exist if the community has developed an in-
ventory and analysis of human factors. That infor-
mation can then be used for the administrative
review of proposed project actions. Siegler and
Meyer have developed a worksheet (Table 11.4) for
estimating additional operating and maintenance
costs and capital costs associated with incoming
population for services commonly provided by
communities. Operating and maintenance costs may
be estimated for the incoming population by exam-
ining the community budget. The total operating
and maintenance costs for each service divided by
the existing population represents the present per
capita cost of providing each service. This per capita
cost can be multiplied by the estimated size of the
incoming primary (persons directly associated with
the source of growth) and secondary or tertiary
(workers and their families required in other sectors
of the local economy to provide expanded or new
services) population to provide what Siegler and
Meyer term a “minimum estimate” of the total addi-
tional operating and maintenance costs associated
with the new population.
Capital costs may be estimated for the incoming
population in various ways. Local officials must esti-
mate the capacity of existing facilities and then
judge which facilities will require additional capital
investment. By dividing the total expansion invest-
ment cost by the expected number of new residents,
an investment cost for each new resident can be esti-
mated (Siegler and Meyer 1980; see also Cooke et al.
1996). Siegler and Meyer have developed a checklist
of revenue sources potentially affected by commu-
nity population growth (Table 11.5). An analysis of
399ADMINISTRATION OF PLANNING PROGRAMS
FIGURE 11.5 Economic multipliers. (Source: Faas 1980)
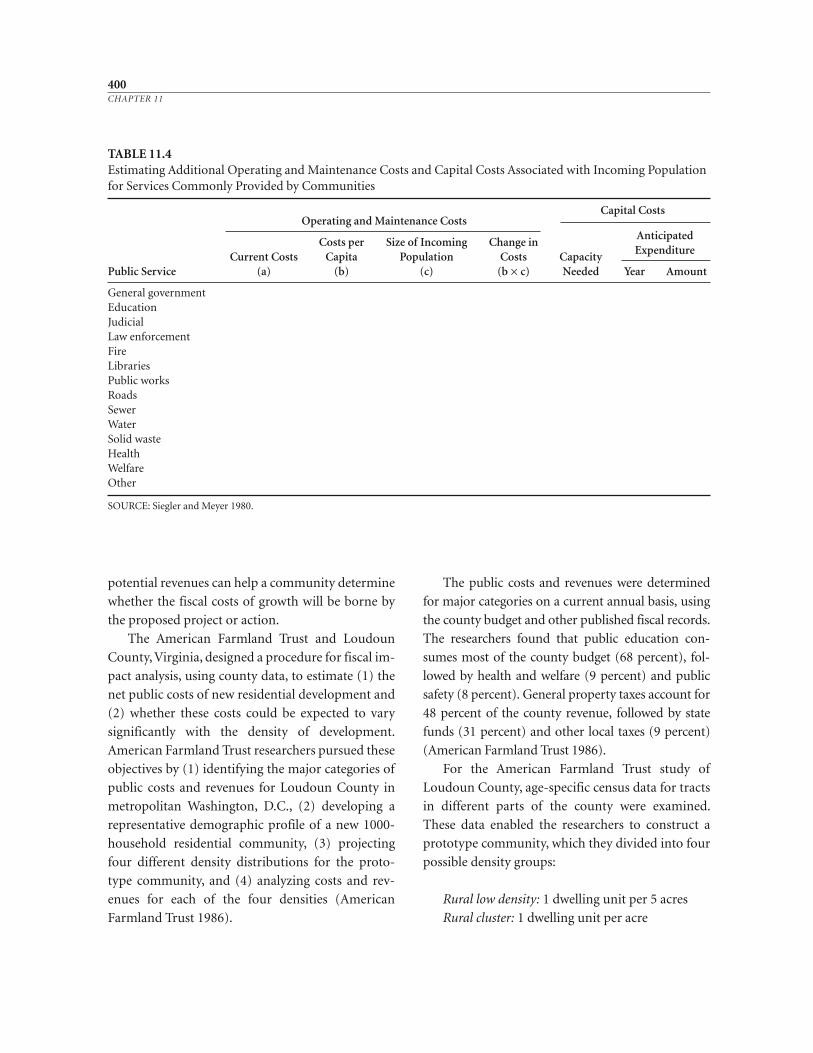
potential revenues can help a community determine
whether the fiscal costs of growth will be borne by
the proposed project or action.
The American Farmland Trust and Loudoun
County, Virginia, designed a procedure for fiscal im-
pact analysis, using county data, to estimate (1) the
net public costs of new residential development and
(2) whether these costs could be expected to vary
significantly with the density of development.
American Farmland Trust researchers pursued these
objectives by (1) identifying the major categories of
public costs and revenues for Loudoun County in
metropolitan Washington, D.C., (2) developing a
representative demographic profile of a new 1000-
household residential community, (3) projecting
four different density distributions for the proto-
type community, and (4) analyzing costs and rev-
enues for each of the four densities (American
Farmland Trust 1986).
The public costs and revenues were determined
for major categories on a current annual basis, using
the county budget and other published fiscal records.
The researchers found that public education con-
sumes most of the county budget (68 percent), fol-
lowed by health and welfare (9 percent) and public
safety (8 percent). General property taxes account for
48 percent of the county revenue, followed by state
funds (31 percent) and other local taxes (9 percent)
(American Farmland Trust 1986).
For the American Farmland Trust study of
Loudoun County, age- specific census data for tracts
in different parts of the county were examined.
These data enabled the researchers to construct a
prototype community, which they divided into four
possible density groups:
Rural low density: 1 dwelling unit per 5 acres
Rural cluster: 1 dwelling unit per acre
400CHAPTER 11
TABLE 11.4Estimating Additional Operating and Maintenance Costs and Capital Costs Associated with Incoming Populationfor Services Commonly Provided by Communities
Capital CostsOperating and Maintenance Costs
Costs per Size of Incoming Change in Anticipated
Current Costs Capita Population Costs CapacityExpenditure
Public Service (a) (b) (c) (b × c) Needed Year Amount
General governmentEducationJudicialLaw enforcementFireLibrariesPublic worksRoadsSewerWaterSolid wasteHealthWelfareOther
SOURCE: Siegler and Meyer 1980.
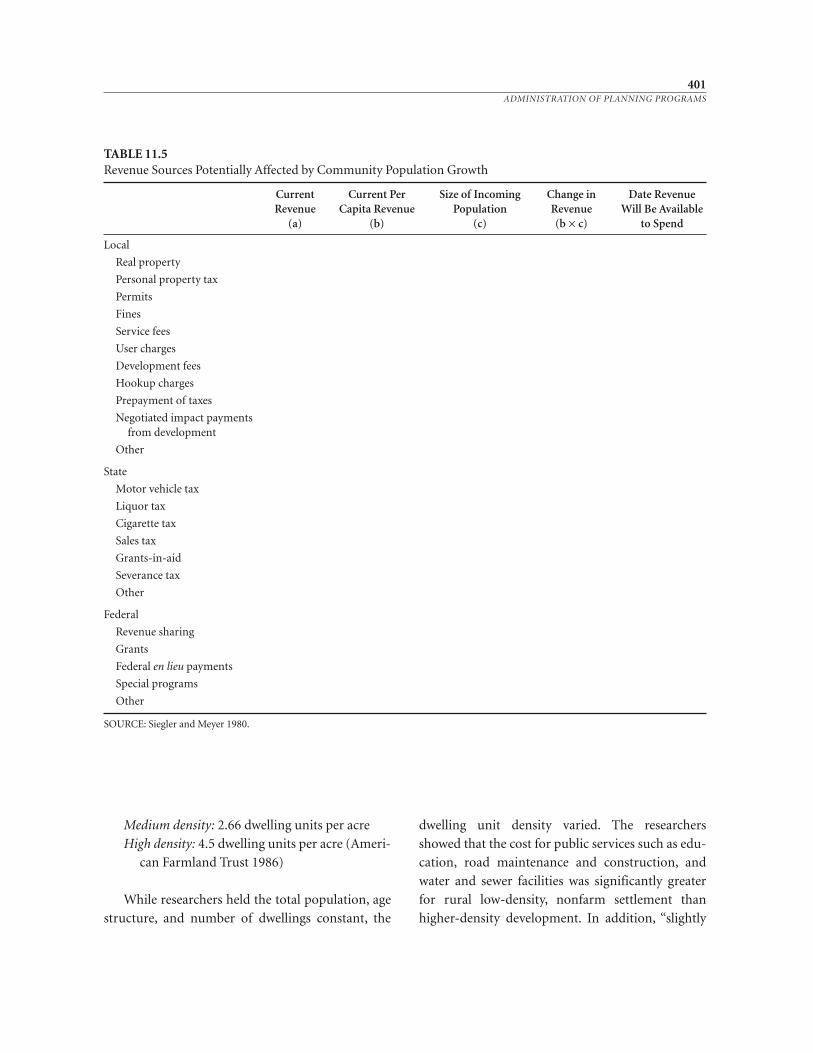
Medium density: 2.66 dwelling units per acre
High density: 4.5 dwelling units per acre (Ameri-
can Farmland Trust 1986)
While researchers held the total population, age
structure, and number of dwellings constant, the
dwelling unit density varied. The researchers
showed that the cost for public services such as edu-
cation, road maintenance and construction, and
water and sewer facilities was significantly greater
for rural low- density, nonfarm settlement than
higher- density development. In addition, “slightly
401ADMINISTRATION OF PLANNING PROGRAMS
TABLE 11.5Revenue Sources Potentially Affected by Community Population Growth
Current Current Per Size of Incoming Change in Date RevenueRevenue Capita Revenue Population Revenue Will Be Available
(a) (b) (c) (b × c) to Spend
Local
Real property
Personal property tax
Permits
Fines
Service fees
User charges
Development fees
Hookup charges
Prepayment of taxes
Negotiated impact paymentsfrom development
Other
State
Motor vehicle tax
Liquor tax
Cigarette tax
Sales tax
Grants- in- aid
Severance tax
Other
Federal
Revenue sharing
Grants
Federal en lieu payments
Special programs
Other
SOURCE: Siegler and Meyer 1980.
higher revenues were projected from the higher-
density communities” (American Farmland Trust
1986, 4). In addition, the American Farmland Trust
research indicated that farms were less costly to ser-
vice.
Following the Loudoun County study, the
American Farmland Trust (1997) repeated the ap-
proach elsewhere and other researchers adapted the
method (see, for example, Crane et al. 1996). Ac-
cording to the American Farmland Trust:
It costs local government much less to serve one or
two families living on a 200- acre [81- hectare] farm
than it does to provide education, roads, water, sew-
ers, and police and fire protection to 400 families liv-
ing on half- acre [0.2- hectare] lots in a 200- acre [81-
hectare] subdivision (1997, 149).
In more than 40 “cost of community service studies”
undertaken or compiled by the American Farmland
Trust, various researchers have shown “that farm-
land owners pay more in taxes than local govern-
ments pay to provide them with services, while
homeowners receive more services than their taxes
pay for” (1997, 149) (Table 11.6). Ratios on Table
11.6 display the “relationship between revenues gen-
erated by each land use category and the cost of pro-
viding municipal services to that category” (Ameri-
can Farmland Trust 1997, 149).
In a study for the Potawatomi Land Trust, Uni-
versity of Michigan researchers reported similar
findings (Crane et al. 1996). Adapting the American
Farmland Trust’s “cost of community services”
method, the Michigan researchers asked: Does de-
velopment pay for itself, and has developed land
contributed enough to local government to cover
costs that accompany such development? The study
focused on Scio Township in Wash tenaw County,
Michigan. The researchers concluded “that resi-
dential land did not contribute enough revenue to
pay for the services that it received” (Crane et al.
1996, iv).
Cost of community services studies, such as
those undertaken by the American Farmland Trust
and by others who have adapted their method, can
help local planners assess fiscal impacts of new de-
velopment. Such fiscal impact analyses can provide
justification to protect important natural resource
lands, such as those used for farming, as well as envi-
ronmentally sensitive lands.
Overall, the American Farmland Trust studies
find “that higher net public costs are associated with
lower- density residential development” (1986, 4).
The Loudoun County study illustrates that fiscal
impact analyses can be constructed “at the county
level for a given residential development at different
densities, using existing data for major categories of
public costs and revenues.” Furthermore, the re-
search shows that for many densities “the ongoing
public costs of new residential development will ex-
ceed the revenues from such development” (Ameri-
can Farmland Trust 1986, 5). Research independent
of the American Farmland Trust supports the find-
ings about the public costs of single- family housing.
For example, an Oregon study determined that the
cost of growth for a single- family residence was
$23,013 (Carson 1998). As a result, once a plan has
been adopted and its implementing measures put in
place, planning administrators should carefully ana-
lyze the fiscal impacts of proposed new develop-
ment, especially those that require amending the
adopted plan and implementing ordinances.
Social Impact Analysis
A straightforward way of assessing social impacts of
a project is to ask who suffers and who benefits as a
result of the proposal? One tool to analyze who suf-
fers and who benefits is a matrix. The matrices in-
troduced in Chapter 4 may provide a starting point.
For example, a western city proposes the construc-
tion of a dam and reservoir in a mountain environ-
ment to supply water. Several groups will suffer and
benefit from the proposal (Table 11.7).
402CHAPTER 11
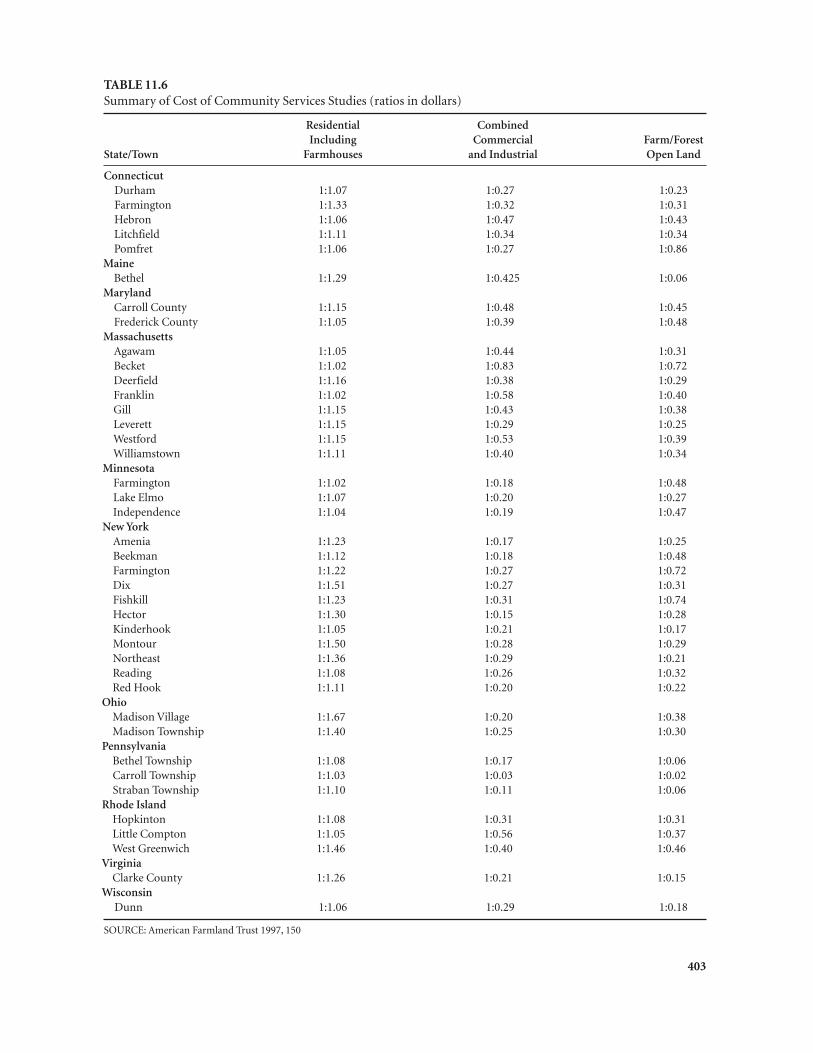
TABLE 11.6Summary of Cost of Community Services Studies (ratios in dollars)
Residential CombinedIncluding Commercial Farm/Forest
State/Town Farmhouses and Industrial Open Land
ConnecticutDurham 1:1.07 1:0.27 1:0.23Farmington 1:1.33 1:0.32 1:0.31Hebron 1:1.06 1:0.47 1:0.43Litchfield 1:1.11 1:0.34 1:0.34Pomfret 1:1.06 1:0.27 1:0.86
MaineBethel 1:1.29 1:0.425 1:0.06
MarylandCarroll County 1:1.15 1:0.48 1:0.45Frederick County 1:1.05 1:0.39 1:0.48
MassachusettsAgawam 1:1.05 1:0.44 1:0.31Becket 1:1.02 1:0.83 1:0.72Deerfield 1:1.16 1:0.38 1:0.29Franklin 1:1.02 1:0.58 1:0.40Gill 1:1.15 1:0.43 1:0.38Leverett 1:1.15 1:0.29 1:0.25Westford 1:1.15 1:0.53 1:0.39Williamstown 1:1.11 1:0.40 1:0.34
MinnesotaFarmington 1:1.02 1:0.18 1:0.48Lake Elmo 1:1.07 1:0.20 1:0.27Independence 1:1.04 1:0.19 1:0.47
New YorkAmenia 1:1.23 1:0.17 1:0.25Beekman 1:1.12 1:0.18 1:0.48Farmington 1:1.22 1:0.27 1:0.72Dix 1:1.51 1:0.27 1:0.31Fishkill 1:1.23 1:0.31 1:0.74Hector 1:1.30 1:0.15 1:0.28Kinderhook 1:1.05 1:0.21 1:0.17Montour 1:1.50 1:0.28 1:0.29Northeast 1:1.36 1:0.29 1:0.21Reading 1:1.08 1:0.26 1:0.32Red Hook 1:1.11 1:0.20 1:0.22
OhioMadison Village 1:1.67 1:0.20 1:0.38Madison Township 1:1.40 1:0.25 1:0.30
PennsylvaniaBethel Township 1:1.08 1:0.17 1:0.06Carroll Township 1:1.03 1:0.03 1:0.02Straban Township 1:1.10 1:0.11 1:0.06
Rhode IslandHopkinton 1:1.08 1:0.31 1:0.31Little Compton 1:1.05 1:0.56 1:0.37West Greenwich 1:1.46 1:0.40 1:0.46
VirginiaClarke County 1:1.26 1:0.21 1:0.15
WisconsinDunn 1:1.06 1:0.29 1:0.18
SOURCE: American Farmland Trust 1997, 150
403
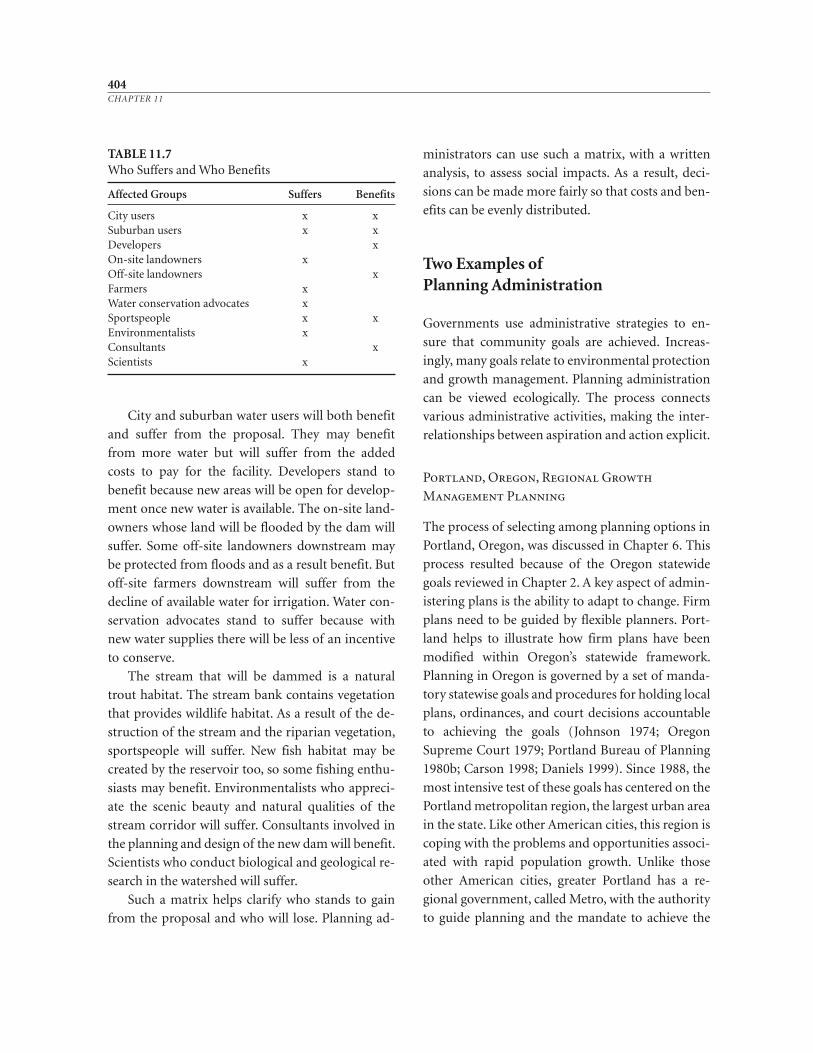
City and suburban water users will both benefit
and suffer from the proposal. They may benefit
from more water but will suffer from the added
costs to pay for the facility. Developers stand to
benefit because new areas will be open for develop-
ment once new water is available. The on- site land-
owners whose land will be flooded by the dam will
suffer. Some off- site landowners downstream may
be protected from floods and as a result benefit. But
off- site farmers downstream will suffer from the
decline of available water for irrigation. Water con-
servation advocates stand to suffer because with
new water supplies there will be less of an incentive
to conserve.
The stream that will be dammed is a natural
trout habitat. The stream bank contains vegetation
that provides wildlife habitat. As a result of the de-
struction of the stream and the riparian vegetation,
sportspeople will suffer. New fish habitat may be
created by the reservoir too, so some fishing enthu-
siasts may benefit. Environmentalists who appreci-
ate the scenic beauty and natural qualities of the
stream corridor will suffer. Consultants involved in
the planning and design of the new dam will benefit.
Scientists who conduct biological and geological re-
search in the watershed will suffer.
Such a matrix helps clarify who stands to gain
from the proposal and who will lose. Planning ad-
ministrators can use such a matrix, with a written
analysis, to assess social impacts. As a result, deci-
sions can be made more fairly so that costs and ben-
efits can be evenly distributed.
Two Examples of Planning Administration
Governments use administrative strategies to en-
sure that community goals are achieved. Increas-
ingly, many goals relate to environmental protection
and growth management. Planning administration
can be viewed ecologically. The process connects
various administrative activities, making the inter-
relationships between aspiration and action explicit.
Portland, Oregon, Regional Growth
Management Planning
The process of selecting among planning options in
Portland, Oregon, was discussed in Chapter 6. This
process resulted because of the Oregon statewide
goals reviewed in Chapter 2. A key aspect of admin-
istering plans is the ability to adapt to change. Firm
plans need to be guided by flexible planners. Port-
land helps to illustrate how firm plans have been
modified within Oregon’s statewide framework.
Planning in Oregon is governed by a set of manda-
tory statewise goals and procedures for holding local
plans, ordinances, and court decisions accountable
to achieving the goals (Johnson 1974; Oregon
Supreme Court 1979; Portland Bureau of Planning
1980b; Carson 1998; Daniels 1999). Since 1988, the
most intensive test of these goals has centered on the
Portland metropolitan region, the largest urban area
in the state. Like other American cities, this region is
coping with the problems and opportunities associ-
ated with rapid population growth. Unlike those
other American cities, greater Portland has a re-
gional government, called Metro, with the authority
to guide planning and the mandate to achieve the
404CHAPTER 11
TABLE 11.7Who Suffers and Who Benefits
Affected Groups Suffers Benefits
City users x xSuburban users x xDevelopers xOn- site landowners xOff- site landowners xFarmers xWater conservation advocates xSportspeople x xEnvironmentalists xConsultants xScientists x
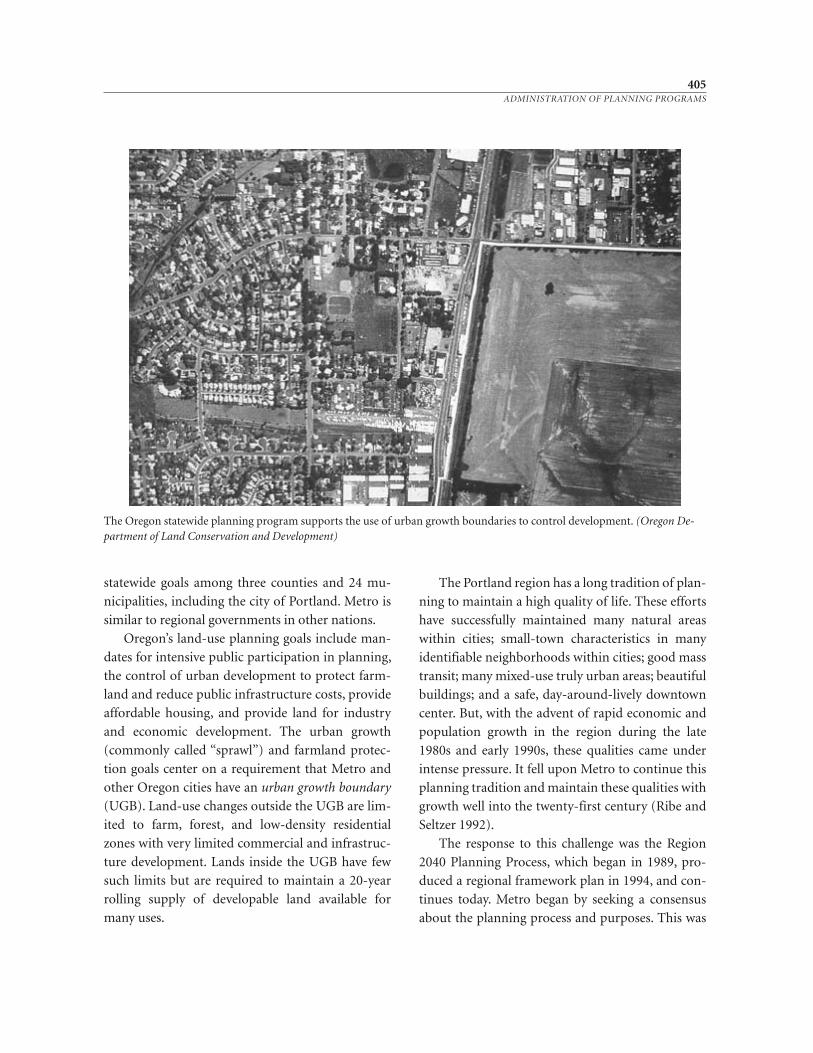
statewide goals among three counties and 24 mu-
nicipalities, including the city of Portland. Metro is
similar to regional governments in other nations.
Oregon’s land-use planning goals include man-
dates for intensive public participation in planning,
the control of urban development to protect farm-
land and reduce public infrastructure costs, provide
affordable housing, and provide land for industry
and economic development. The urban growth
(commonly called “sprawl”) and farmland protec-
tion goals center on a requirement that Metro and
other Oregon cities have an urban growth boundary
(UGB). Land- use changes outside the UGB are lim-
ited to farm, forest, and low- density residential
zones with very limited commercial and infrastruc-
ture development. Lands inside the UGB have few
such limits but are required to maintain a 20- year
rolling supply of developable land available for
many uses.
The Portland region has a long tradition of plan-
ning to maintain a high quality of life. These efforts
have successfully maintained many natural areas
within cities; small- town characteristics in many
identifiable neighborhoods within cities; good mass
transit; many mixed- use truly urban areas; beautiful
buildings; and a safe, day- around- lively downtown
center. But, with the advent of rapid economic and
population growth in the region during the late
1980s and early 1990s, these qualities came under
intense pressure. It fell upon Metro to continue this
planning tradition and maintain these qualities with
growth well into the twenty- first century (Ribe and
Seltzer 1992).
The response to this challenge was the Region
2040 Planning Process, which began in 1989, pro-
duced a regional framework plan in 1994, and con-
tinues today. Metro began by seeking a consensus
about the planning process and purposes. This was
405ADMINISTRATION OF PLANNING PROGRAMS
The Oregon statewide planning program supports the use of urban growth boundaries to control development. (Oregon De-partment of Land Conservation and Development)
found through a complex, intensive set of public
meetings and negotiations among the numerous ju-
risdictions and private interests with roles and po-
tential veto powers in finding and successfully
promulgating a regional plan. The final results were
documented in the Regional Growth Goals and Ob-
jectives (RGGOs) (Metro 1991). The RGGOs docu-
ment constituted an agreement about general goals
and processes to maintain a comprehensive regional
planning partnership, and it provided a sketchbook
about the attributes that the region would seek to
achieve by the year 2040. It also sought to clarify the
relationship between within- jurisdiction planning
efforts and the regional plan’s formulation and en-
forcement.
Region 2040 planning began by taking stock of
the region’s social values, historical development
patterns, resources, trends, and essential qualities
that make for a uniquely livable and attractive land-
scape. Portland State University and the University
of Oregon helped this effort (Ribe and Seltzer 1992;
Abbott 1994). This basic information was then used
to begin to develop alternative regional patterns for
growth. The consulting firms Eco- Northwest,
Walker- Macy, and others aided this task. Through
many public meetings around the region, four alter-
native patterns were proposed. The first was a base-
case describing roughly what would happen if exist-
ing growth patterns continued. One alternative
emphasized densification of commercial and hous-
ing development along mass- transit- intensified cor-
ridors with modest expansion of the UGB. Another
alternative called for more generalized densification
of land uses focusing on town centers inside existing
cities, a more intensive expansion of transportation
systems, and no expansion of the UGB. A third op-
tion advocated small expansions of the existing
UGB, lots of new mass transit, and the creation of
new satellite cities outside current urbanized areas.
These alternatives formed the basis for a public
participation and education process that developed
the criteria for evaluating the future options for the
region. The process included mailing a newspaper-
style description of the various alternatives’ virtues
and trade- offs to more than half a million house-
holds, which elicited over 17,000 citizen responses.
The planners also sent out more formal question-
naires and organized public meetings, workshops,
newsletters, presentations to civic groups, and tele-
vision and radio call- in programs. At the same time,
modeling efforts sought to predict traffic, air qual-
ity, and land-use consequences of the alternatives,
and this information was incorporated into the
public participation efforts as they progressed (Ribe
and Seltzer 1992).
Public opinion was especially sought about cer-
tain issues (Metro 1994a). One was average regional
residential lot sizes, which seemed amenable to a
slight reduction from about five dwelling units per
acre to seven. Another was reducing average re-
gional parking spaces per dwelling unit and per
square foot of commercial or office space, which
had some modest support, in principle, provided
quality alternative transit options and improved
pedestrian systems were available. The densification
of existing town centers around mass transit gained
general support as an alternative to UGB expansion
and as a way to reduce traffic congestion. Urban
growth boundary expansion garnered considerable
opposition (and some support provided it was lim-
ited as much as possible and well- planned). Parks
and greenspaces were desired in and near urban
areas for both recreation and habitat.
The draft Region 2040 plan underwent another
extensive public review process during 1994. This
included a video describing the plan, which Block-
buster Video made available free of charge, and a se-
ries of before- and- after illustrations at many scales
by architect Peter Calthorpe. At this stage consider-
able opposition to UGB expansion still remained,
along with concern that growth management plan-
ning would only encourage more growth.
The final plan was adopted in December 1994
(Metro 1994b). It mixed elements of all the alterna-
406CHAPTER 11
tives and some new ideas from the public. It called
for UGB expansion amounting to 7 percent by 2040.
(This amount has since increased slightly due to
new state laws and higher- than- expected growth
rates.) The expansions of the UGB were carefully lo-
cated to avoid prime and viable farmlands and to fo-
cus on areas already disturbed by rural residences
and otherwise more suitable for development. The
plan called for densified regional town centers
served by improved mass transit and pedestrian sys-
tems, as well as general increases in housing densi-
ties wherever possible throughout the region and
including fair shares of affordable housing in all ju-
risdictions. It called for expansion of the region’s
light rail system and more greenspaces inside and
just outside urban areas.
This was a lengthy and complex process of de-
veloping regional plan options. In the end, the Port-
land region adopted its first unified and legally en-
forceable growth management plan in response to
many difficult challenges. It attempts to preserve el-
ements from the past valued by the region’s resi-
dents and to create a future in ways that all the indi-
vidual jurisdictions could accept and write their
own plans to implement. The plan got off to a good
start as voters approved bond measures for light rail
and greenspaces acquisition in the two years after its
adoption.
The Tucson WASH Ordinance and
Environmental Resource Zone
Tucson, Arizona, has enacted two measures to pro-
tect environmentally sensitive areas within its city
boundaries. Its watercourse amenities, safety and
habitat (WASH) ordinance was adopted by city
council in 1991 and is administered by the city engi-
neer’s office. The environmental resource zone (ERZ)
is administered by the Tucson planning department.
The WASH ordinance includes specific develop-
ment requirements for channels and banks of
washes. The ordinance prohibits alteration without
a mitigation plan. This plan is submitted to the city
engineer. The ordinance details specific require-
ments for the mitigation plan as well as the review
and approval process. The review process involves
both the city planning and the city engineering de-
partments (City of Tucson 1991).
The planning director is responsible for the re-
view of a required plant and habitat plan as well as a
required preservation and revegetation plan. The
planning director has five working days either to ac-
cept the inventory and plan or to request further in-
formation. After acceptance, the director has 15
working days to approve or to reject the inventory
and the plan. The decision notice is sent to both the
applicant and the city engineer. The engineer is then
required to incorporate these findings into the deci-
sion on a hydrology study and a mitigation plan
(City of Tucson 1991).
In making the review, the planning director con-
siders several specific standards, including the exist-
ing condition of the site; the existing character of
vegetation upstream and downstream in the chan-
nel, on the banks, and 50 feet (15 meters) from the
banks; the amount, type, and characteristics of the
vegetation upstream and downstream of the site;
linkages to open-space systems; and critical and sen-
sitive wildlife habitat (City of Tucson 1991).
The city engineer must review a required hy-
drology/hydraulic study and the mitigation plan.
The engineer has five working days after receiving
the study and the plan to accept them or request
more information. After acceptance, the city engi-
neer has 20 working days to approve or reject the
study and the plan. Notice of the engineer’s decision
is provided to the applicant, the planning director,
and all property owners within 200 feet (61 meters)
of the site (City of Tucson 1991).
The city council set specific standards for the
city engineer’s review. These standards address
drainage, erosion, flooding, utility lines and road-
way improvements, consistency with the regulatory
intent, and whether restoration is possible. The city
407ADMINISTRATION OF PLANNING PROGRAMS
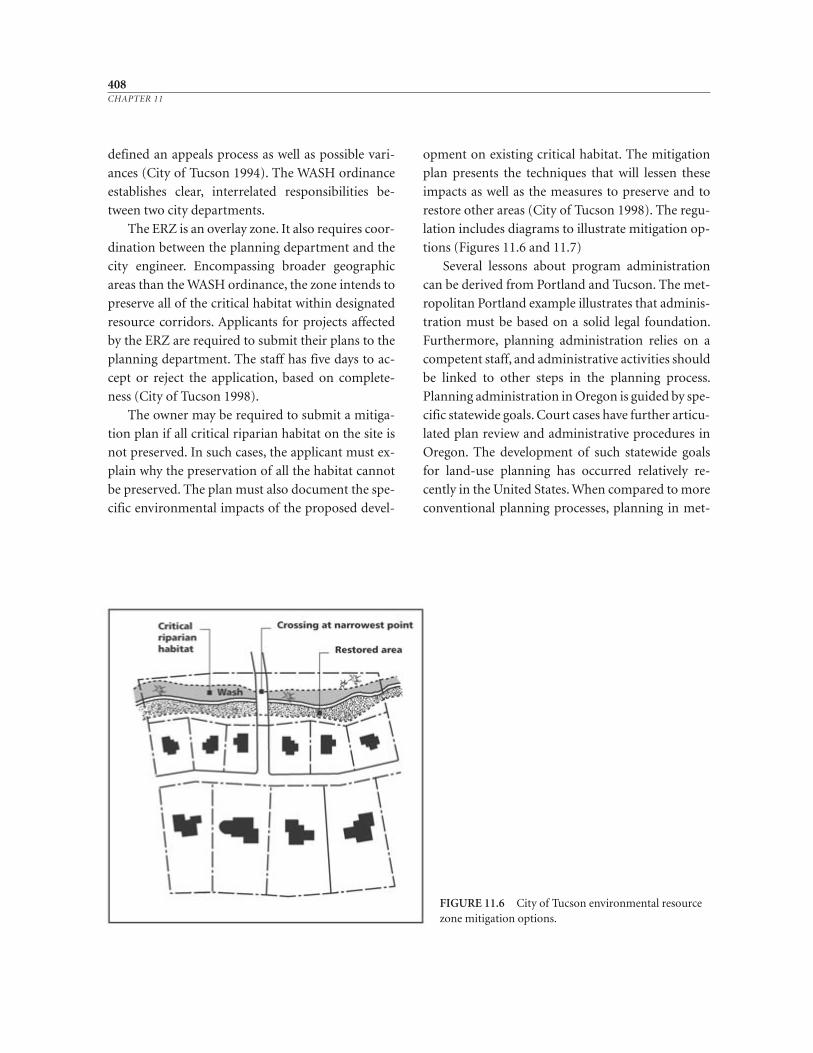
408CHAPTER 11
FIGURE 11.6 City of Tucson environmental resourcezone mitigation options.
defined an appeals process as well as possible vari-
ances (City of Tucson 1994). The WASH ordinance
establishes clear, interrelated responsibilities be-
tween two city departments.
The ERZ is an overlay zone. It also requires coor-
dination between the planning department and the
city engineer. Encompassing broader geographic
areas than the WASH ordinance, the zone intends to
preserve all of the critical habitat within designated
resource corridors. Applicants for projects affected
by the ERZ are required to submit their plans to the
planning department. The staff has five days to ac-
cept or reject the application, based on complete-
ness (City of Tucson 1998).
The owner may be required to submit a mitiga-
tion plan if all critical riparian habitat on the site is
not preserved. In such cases, the applicant must ex-
plain why the preservation of all the habitat cannot
be preserved. The plan must also document the spe-
cific environmental impacts of the proposed devel-
opment on existing critical habitat. The mitigation
plan presents the techniques that will lessen these
impacts as well as the measures to preserve and to
restore other areas (City of Tucson 1998). The regu-
lation includes diagrams to illustrate mitigation op-
tions (Figures 11.6 and 11.7)
Several lessons about program administration
can be derived from Portland and Tucson. The met-
ropolitan Portland example illustrates that adminis-
tration must be based on a solid legal foundation.
Furthermore, planning administration relies on a
competent staff, and administrative activities should
be linked to other steps in the planning process.
Planning administration in Oregon is guided by spe-
cific statewide goals. Court cases have further articu-
lated plan review and administrative procedures in
Oregon. The development of such statewide goals
for land- use planning has occurred relatively re-
cently in the United States. When compared to more
conventional planning processes, planning in met-
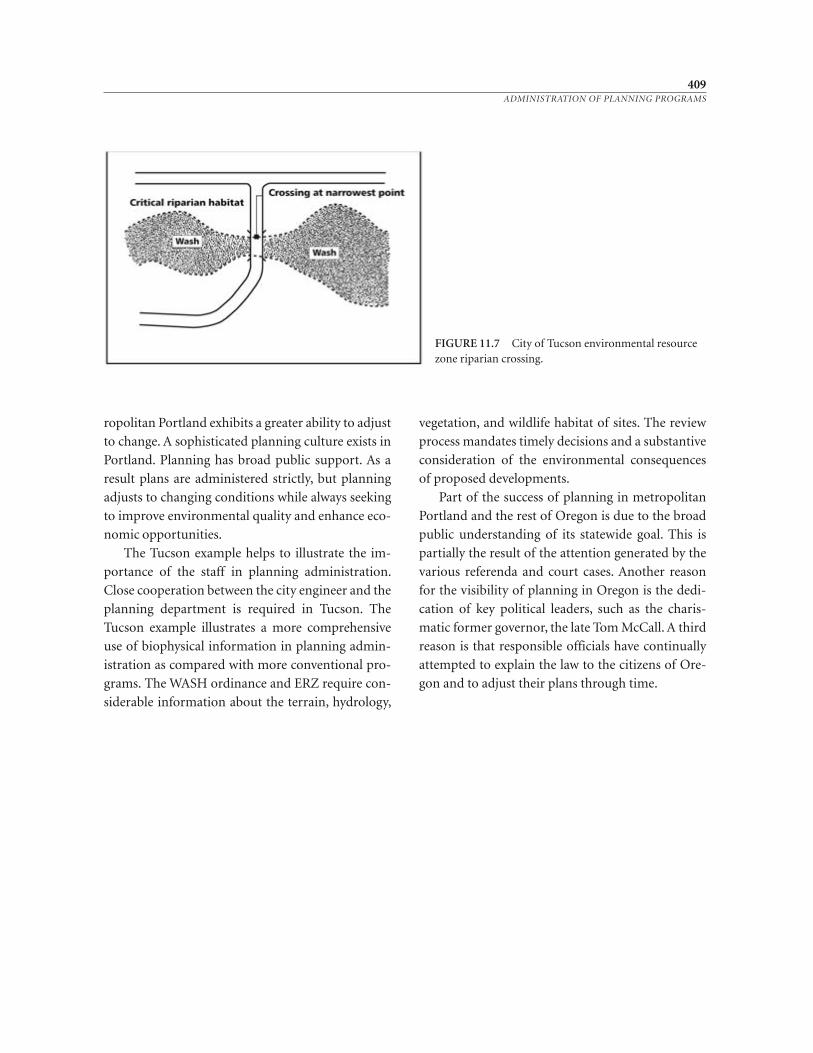
ropolitan Portland exhibits a greater ability to adjust
to change. A sophisticated planning culture exists in
Portland. Planning has broad public support. As a
result plans are administered strictly, but planning
adjusts to changing conditions while always seeking
to improve environmental quality and enhance eco-
nomic opportunities.
The Tucson example helps to illustrate the im-
portance of the staff in planning administration.
Close cooperation between the city engineer and the
planning department is required in Tucson. The
Tucson example illustrates a more comprehensive
use of biophysical information in planning admin-
istration as compared with more conventional pro-
grams. The WASH ordinance and ERZ require con-
siderable information about the terrain, hydrology,
vegetation, and wildlife habitat of sites. The review
process mandates timely decisions and a substantive
consideration of the environmental consequences
of proposed developments.
Part of the success of planning in metropolitan
Portland and the rest of Oregon is due to the broad
public understanding of its statewide goal. This is
partially the result of the attention generated by the
various referenda and court cases. Another reason
for the visibility of planning in Oregon is the dedi-
cation of key political leaders, such as the charis-
matic former governor, the late Tom McCall. A third
reason is that responsible officials have continually
attempted to explain the law to the citizens of Ore-
gon and to adjust their plans through time.
409ADMINISTRATION OF PLANNING PROGRAMS
FIGURE 11.7 City of Tucson environmental resourcezone riparian crossing.

12CONCLUSION
411
From within the planning community, there have been many critics of a norma-
tive, rationalist approach to planning. The normative perspective suggests a stan-
dard, model, or pattern of conduct for planners. Normative planning is where
“planners subject both the ends and means of public policy to rational considera-
tion” (Klosterman 1978, 38). Critics of this rational approach contend that it fo-
cuses on problem solving: “Take the problem, break it down into its component
parts, and let’s see what we can do about it” (Forester 1982, 61). They argue that
“this may serve well for relatively routine, conventional, stable problems—but
perhaps not for most planning and policy problems” (Forester 1982, 61).
Rationalists believe that “reason, independent of the senses, constitutes a su-
perior source of knowledge” (Lai 1988, 19). This belief leads to a model that
should be applied a priori to any situation or setting. A rationalist tradition un-
derlies the planning profession because of its foundation in the fields of architec-
ture, landscape architecture, engineering, and law. In addition, the very defini-
tion of the word planning suggests rationality.
A sustainable approach to planning also im-
plies rationality or, at least, pragmatism. John
Dewey, William James, and other pragmatists
recommend that philosophy works best when eter-
nal questions are connected to everyday practice.
How best to live on Earth in a sustainable or, bet-
ter yet, regenerative way provides such an eternal
question.
Herbert Gans was especially critical of the phys-
ical bias of planning prior to the 1960s. Yet, Gans es-
poused a rationalist perspective: “Planning must be
and can be rational—rationality being achieved
when planners develop plans or programs which
can be proved to implement the goals that are being
sought” (1968, ix). Gans was largely successful in his
effort to wean planners from their architectural and
site-planning roots and lay the foundation for a so-
cial rationalist approach. Although Gans believes
that “planning and social policy must and can be ra-
tional,” he also recognized that goals cannot “be ra-
tional, or rationally selected. . . . They must reflect
values about which people differ—and about which
they therefore have to argue so as to persuade one
another or achieve a viable compromise” (Gans
1993, x).
Lewis Mumford, who was certainly critical of
the architectural rationalists, was nevertheless an
advocate of the spatial, physical concepts of plan-
ning. He proposed an organic approach to plan-
ning: “Organic planning does not begin with a
preconceived goal: it moves from need to need,
from opportunity to opportunity, in a series of
adaptations that themselves become increasingly
coherent and purposeful, so that they generate a
complex, final design” (1961, 302).
Mumford’s organic approach foreshadows a
contingency view. Contingency is the condition of
being subject to chance. The concept of contin-
gency has been explored by theorists in manage-
ment, organization behavior, and planning. Ac-
cording to Fremont Kast and James Rosenzweig,
The contingency view seeks to understand the inter-
relationships within and among subsystems as well as
between the organization and its environment and
define patterns of relationships or configurations of
variables. It emphasizes the multivariate nature of or-
ganizations and attempts to understand how organi-
zations operate under varying conditions and specific
circumstances (1979, ix).
Human organizations and their interactions
with each other and their settings are complex. The
postmodern condition would lead some to con-
clude that humans are doomed to exist in chaos.
Students of chaos, however, have detected that or-
der exists in apparently chaotic situations (Pri-
gogine and Stengers 1984). Planners face the task of
making order out of chaos; they must be able to
adapt to changing conditions and to act in a contin-
gent manner. Chaos theory emphasizes the com-
plexity of our planet and its natural and social sys-
tems. Planning and planners should accept the fact
that the world presents a complex array of possibil-
ities. Such acceptance is fundamental in the search
for a “new rationality” in planning (Verma 1998).
New rationalism is not “independent of the senses”;
rather, it is based on the need for pragmatism in a
complex world. A. Budoni and S. Macchi observe,
“The thought of complexity defines a ‘new ration-
ality’ which negates any correspondence between
science and certainty, between probability and ig-
norance, and opens the ‘necessary’ world of nature
to possibility, to unpredictability, to multiple
choices” (1998, 1). The “necessary world of nature”
is physical and biological and social; it is ecological.
In spite of the criticisms made by Herbert Gans
over three decades ago, many planners, or at least in-
dividuals who hold that title in local and even
higher levels of government, are faced with situa-
tions concerning the physical ordering of the built
and natural environments. Planners must address
issues concerning the use of land and other natural
412CHAPTER 12
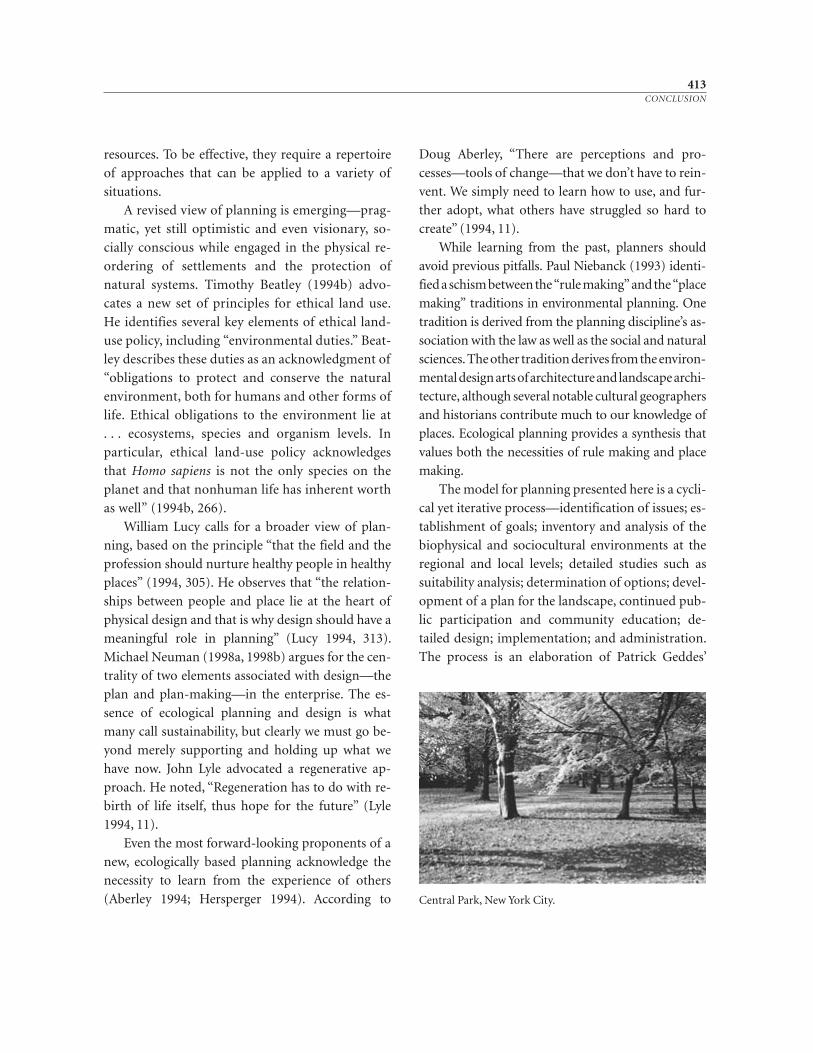
413CONCLUSION
Central Park, New York City.
resources. To be effective, they require a repertoire
of approaches that can be applied to a variety of
situations.
A revised view of planning is emerging—prag-
matic, yet still optimistic and even visionary, so-
cially conscious while engaged in the physical re-
ordering of settlements and the protection of
natural systems. Timothy Beatley (1994b) advo-
cates a new set of principles for ethical land use.
He identifies several key elements of ethical land-
use policy, including “environmental duties.” Beat-
ley describes these duties as an acknowledgment of
“obligations to protect and conserve the natural
environment, both for humans and other forms of
life. Ethical obligations to the environment lie at
. . . ecosystems, species and organism levels. In
particular, ethical land- use policy acknowledges
that Homo sapiens is not the only species on the
planet and that nonhuman life has inherent worth
as well” (1994b, 266).
William Lucy calls for a broader view of plan-
ning, based on the principle “that the field and the
profession should nurture healthy people in healthy
places” (1994, 305). He observes that “the relation-
ships between people and place lie at the heart of
physical design and that is why design should have a
meaningful role in planning” (Lucy 1994, 313).
Michael Neuman (1998a, 1998b) argues for the cen-
trality of two elements associated with design—the
plan and plan- making—in the enterprise. The es -
sence of ecological planning and design is what
many call sustainability, but clearly we must go be-
yond merely supporting and holding up what we
have now. John Lyle advocated a regenerative ap-
proach. He noted, “Regeneration has to do with re-
birth of life itself, thus hope for the future” (Lyle
1994, 11).
Even the most forward- looking proponents of a
new, ecologically based planning acknowledge the
necessity to learn from the experience of others
(Aberley 1994; Hersperger 1994). According to
Doug Aberley, “There are perceptions and pro -
cesses—tools of change—that we don’t have to rein-
vent. We simply need to learn how to use, and fur-
ther adopt, what others have struggled so hard to
create” (1994, 11).
While learning from the past, planners should
avoid previous pitfalls. Paul Niebanck (1993) identi-
fiedaschismbetweenthe“rulemaking”andthe“place
making” traditions in environmental planning. One
tradition is derived from the planning discipline’s as-
sociation with the law as well as the social and natural
sciences.Theother traditionderives fromtheenviron-
mentaldesignartsofarchitectureandlandscapearchi-
tecture, although several notable cultural geographers
and historians contribute much to our knowledge of
places. Ecological planning provides a synthesis that
values both the necessities of rule making and place
making.
The model for planning presented here is a cycli-
cal yet iterative process—identification of issues; es-
tablishment of goals; inventory and analysis of the
biophysical and sociocultural environments at the
regional and local levels; detailed studies such as
suitability analysis; determination of options; devel-
opment of a plan for the landscape, continued pub-
lic participation and community education; de-
tailed design; implementation; and administration.
The process is an elaboration of Patrick Geddes’
survey → plan → action, to a more cyclical survey
→ action → plan → action → survey. Action may
precede a plan and even a survey, but understand-
ing the place and creating a vision remain integral
to the process. A linear approach is inadequate for
most situations—after starting to implement a
plan, the original goals may change or there may be
new information discovered about the environ-
ment. A feedback process is necessary to reformu-
late and restudy issues. In many cases, this process
of review may occur repeatedly. As a result, instead
of having a linear planning process, in many cases
one experiences a cyclic form of planning, review-
ing previous stages again and again.
Such a cyclical process occurred in the Desert
View Tri- Villages Area of Arizona, which has been
used as an example in several sections of this book.
The Tri- Villages example helps to illustrate how an
ecological approach can be integrated into conven-
tional planning processes. The Tri- Villages Area is
located in the Sonoran Desert region, which covers
much of Arizona, the Mexican states of Sonora, Baja
Nord, and Baja Sur, plus a small part of California.
The first general plan for the Tri- Villages Area was
adopted in 1987, when it was called Peripheral Areas
C and D by City of Phoenix planners. The Phoenix
metropolitan region is one of the most rapidly
growing parts of the United States. New develop-
ment is progressing at a pace of over an acre (.4047
hectare) an hour.
After 1987, several events caused city officials to
revise and update the general plan for the area. The
concern focused on the growth and the impact of
that growth on beautiful desert lands. As a result, by
the early 1990s the Desert View Tri- Villages Area
faced several development- related problems and
opportunities. The problems included how to pro-
tect environmentally sensitive areas and where to lo-
cate new development. Every five years, there is a
demand for 5000 new homes in the Tri- Villages—
which, with current development patterns, will con-
sume 2000 acres (810 hectares) of land. Meanwhile,
the current residents want to maintain their rural
way of life.
An overriding issue was the rising concern about
the very nature of suburban sprawl in the Phoenix
metropolitan region. The Phoenix, Arizona, metro-
politan area is a late- twentieth- century place, largely
suburban in character. Its development occurred as
a result of improved automobile and air transporta-
tion as well as the invention of air- conditioning
technology. Large national government subsidies
for water, highway, and housing development, plus
significant national military investments in the re-
gion, stimulated much growth, especially after the
Second World War. Phoenix had only slightly over
65,000 residents in 1940; today it is the seventh-
largest city in the United States, with a population of
over 1 million. Meanwhile the metropolitan area
grew from just over 186,000 people in 1940 to over
2.4 million people by 1995. According to City of
Phoenix Planning Department data, the region is
adding about 63,000 residents per year, who require
about 23,000 new housing units (Tempe Daily News
Tribune 1995, A9). The region’s population is ex-
pected to double by 2020.
The region is a challenging place to inhabit.
Frank Lloyd Wright defined the Sonoran Desert as a
place “where plants exist between hell and high wa-
ter.” Although challenging to inhabit, the Sonoran
Desert is the location of one of the fastest- growing
regions in the United States. People move to this
challenging place because they like it. They enjoy
their backyard swimming pools and barbecues.
They like the perceived safety and access to open
space. They enjoy the climate. The price of homes is
reasonable for lower- and middle-income residents.
Phoenix has one of the highest percentages of home
ownership of any major city in the nation. If wide-
spread property ownership is a route to both per-
sonal freedom and democratic government, as John
Locke and Thomas Jefferson believed, then the
Phoenix region is the embodiment of the American
dream (or perhaps the American nightmare). As
414CHAPTER 12
Herbert Gans illustrated in his classic 1967 study of
Levittown, Americans like suburban life. But subur-
ban development poses many challenges for land-
scape planning, such as the loss of environmentally
sensitive areas, prime farmlands, and wonderful
views as well as rising fiscal and energy costs and
worsening air quality.
As a result of these problems and opportunities,
Phoenix city planners decided to revise the general
plan for the area and with the village planning com-
mittee set some preliminary goals. Current desert
rural ways of living should be maintained. Property
rights should be protected. Fragile deserts should be
preserved. New growth should be accommodated in
the most suitable places.
The city planners turned to the Arizona State
University School of Planning and Landscape Ar-
chitecture for help with understanding the ecology
of the area. In addition to environmental planners
and landscape architects, an environmental re-
source program had been recently added to the
school. This program included faculty and students
with expertise in plant and wildlife ecology, soils sci-
ence, GIS, and remote sensing. An informal techni-
cal working group was formed in 1994. The North
Sonoran Collaborative consists of environmental
scientists, planners, landscape architects, and archi-
tects from ASU, the City of Phoenix, consulting
companies, and the State of Arizona. Initially, the
collaborative met monthly for two years and more
sporadically since to discuss the environment of the
Desert View Tri- Villages Area and to speculate
about the future. As a result of the collaboration,
several ASU student projects were undertaken that
studied the landscape ecology of the area and possi-
ble environmental impacts of its development.
These studies provided much of the ground-
work for the examples described in Chapters 3, 4,
and 5. However, planning is seldom as neat and lin-
ear as chapters in a book. The process is, and was in
this case, more iterative. Initial, large- scale ecologi-
cal inventories and suitability analyses were con-
ducted, but these raised more questions and dem -
onstrated gaps in the knowledge about the ecology
of the Desert View Tri- Villages Area and the Sono-
ran Desert in general.
Very early in the process, strong political sup-
port developed for protecting large areas of desert in
the Tri- Villages. But what areas should be protected?
The Phoenix Parks, Recreation, and Library Depart-
ment (PRLD) funded a detailed study of the Cave
Creek Wash, headed by ASU landscape architecture
professors Rebecca Fish Ewan and Joe Ewan (Ewan
et al. 1996), to answer this question. Their research
contributed to the proposed protection of a signifi-
cant portion of the Cave Creek Wash drainage way.
The work was so compelling that the PRLD decided
to fund additional studies of other major washes in
the area, also headed by Fish Ewan and Ewan (Ewan
et al. 1998). These studies indicated a paucity of
knowledge about wildlife along the washes. As a re-
sult, the PRLD funded research directed by ASU en-
vironmental scientist professor Bill Miller to study
wildlife habitats.
The student inventories, suitability analyses, and
other research had provided a good beginning, but a
richer database was needed. As a result, the PRLD
supported the development of a GIS database for
the Desert View Tri- Villages Area (Brady et al. 1998).
Also used as an example in Chapters 3 and 5, this ef-
fort was headed by ASU environmental scientist
professor Ward Brady and involved GIS specialists
Jana Fry and Mike Collins, among others.
Meanwhile, the North Sonoran Collaborative
developed four character concepts—desert preser-
vation, rural desert, suburban desert, and growth—
that would later serve as the organizational elements
for the formation of four teams in a 1995 charrette
organized by ASU and the City of Phoenix. This
charrette, discussed in Chapter 6, helped to refine
concepts and visions for the area. The process led to
general plan revisions for the eastern portion of the
Tri- Villages (adopted in 1996), the Interstate 17
corridor in the west (proposed in 1998), and the
415CONCLUSION
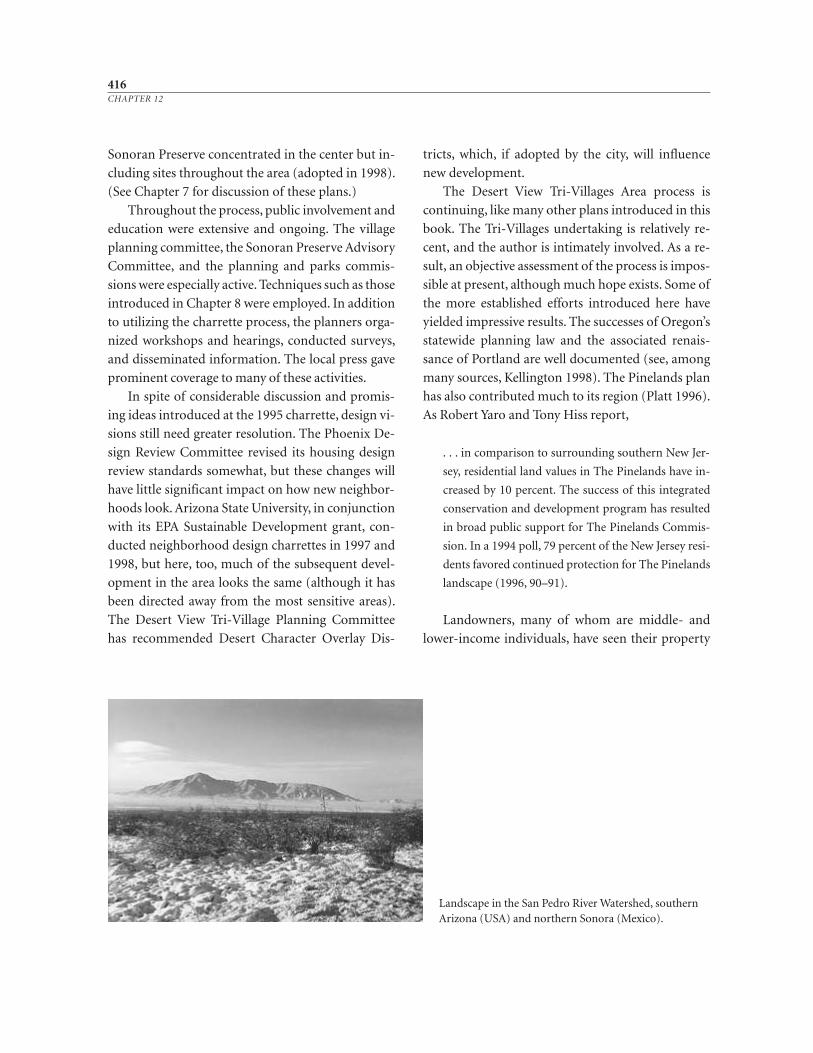
Sonoran Preserve concentrated in the center but in-
cluding sites throughout the area (adopted in 1998).
(See Chapter 7 for discussion of these plans.)
Throughout the process, public involvement and
education were extensive and ongoing. The village
planning committee, the Sonoran Preserve Advisory
Committee, and the planning and parks commis-
sions were especially active. Techniques such as those
introduced in Chapter 8 were employed. In addition
to utilizing the charrette process, the planners orga-
nized workshops and hearings, conducted surveys,
and disseminated information. The local press gave
prominent coverage to many of these activities.
In spite of considerable discussion and promis-
ing ideas introduced at the 1995 charrette, design vi-
sions still need greater resolution. The Phoenix De-
sign Review Committee revised its housing design
review standards somewhat, but these changes will
have little significant impact on how new neighbor-
hoods look. Arizona State University, in conjunction
with its EPA Sustainable Development grant, con-
ducted neighborhood design charrettes in 1997 and
1998, but here, too, much of the subsequent devel-
opment in the area looks the same (although it has
been directed away from the most sensitive areas).
The Desert View Tri- Village Planning Committee
has recommended Desert Character Overlay Dis-
tricts, which, if adopted by the city, will influence
new development.
The Desert View Tri- Villages Area process is
continuing, like many other plans introduced in this
book. The Tri- Villages undertaking is relatively re-
cent, and the author is intimately involved. As a re-
sult, an objective assessment of the process is impos-
sible at present, although much hope exists. Some of
the more established efforts introduced here have
yielded impressive results. The successes of Oregon’s
statewide planning law and the associated renais-
sance of Portland are well documented (see, among
many sources, Kellington 1998). The Pinelands plan
has also contributed much to its region (Platt 1996).
As Robert Yaro and Tony Hiss report,
. . . in comparison to surrounding southern New Jer-
sey, residential land values in The Pinelands have in-
creased by 10 percent. The success of this integrated
conservation and development program has resulted
in broad public support for The Pinelands Commis-
sion. In a 1994 poll, 79 percent of the New Jersey resi-
dents favored continued protection for The Pinelands
landscape (1996, 90–91).
Landowners, many of whom are middle- and
lower-income individuals, have seen their property
416CHAPTER 12
Landscape in the San Pedro River Watershed, southernArizona (USA) and northern Sonora (Mexico).
values increase in the Pinelands. This fact illustrates
that environmental protection need not negatively
impact property rights and, indeed, can enhance
them. Meanwhile, the New Jersey Pinelands Com-
mission has made allocation for affordable housing
opportunities, ensuring access to a broad range of
people.
As the previous quote illustrates, the Regional
Plan Association planners sought to learn from the
work of others, those in the Pinelands as well as
from Portland and other places. Bob Yaro and his
Regional Plan Association colleagues also brought
experience gained from other places, such as the
Connecticut River Valley. Planning remains funda-
mentally an art, built from experience, applied to
the specifics of the place.
The method described in this book reflects a
middle- ground approach to landscape planning
that is somewhere between a purely organic and a
truly rational one. Ecology is central to the method,
as it should be for our future. As Lynton Caldwell
and Kristin Shrader- Frechette note, “Ecological lit-
eracy has not always been characteristic of modern
authors [or planners and designers]. It will be an
unavoidable feature of postmodern society” (1993,
5). The method presented here is not suggested as a
rigid, lockstep approach that is appropriate for
every situation, but rather a flexible, iterative
method that can be used when a group of people
identify an issue or set of issues. The method is a
framework for problem solving. As the feedback ar-
rows in Figure 1.1 indicate, there are many steps in
the process where it may be adjusted or modified.
Certainly, the steps may be reordered or skipped en-
tirely depending on the situation. For instance, in
some cases it may be appropriate to conduct inven-
tories and analyses (Steps 3 and 4) before establish-
ing goals (Step 2). In Mumford’s words, the method
represents “a series of adaptations.”
The issue or set of issues may be viewed as symp-
toms of the problems and opportunities facing the
planning area. In order to prescribe an appropriate
intervention, the landscape planner then may make
a diagnosis about the situation based on an under-
standing of the nature of the place.
417CONCLUSION

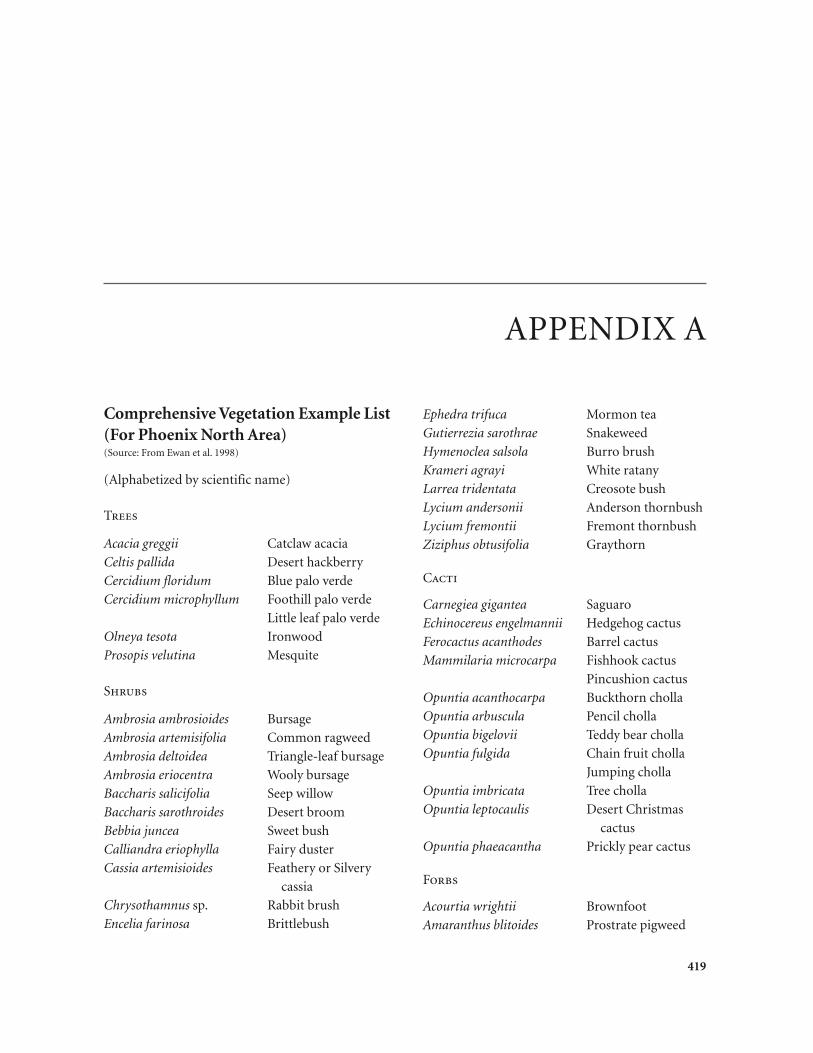
APPENDIX A
419
Comprehensive Vegetation Example List(For Phoenix North Area) (Source: From Ewan et al. 1998)
(Alphabetized by scientific name)
Trees
Acacia greggii Catclaw acacia
Celtis pallida Desert hackberry
Cercidium floridum Blue palo verde
Cercidium microphyllum Foothill palo verde
Little leaf palo verde
Olneya tesota Ironwood
Prosopis velutina Mesquite
Shrubs
Ambrosia ambrosioides Bursage
Ambrosia artemisifolia Common ragweed
Ambrosia deltoidea Triangle- leaf bursage
Ambrosia eriocentra Wooly bursage
Baccharis salicifolia Seep willow
Baccharis sarothroides Desert broom
Bebbia juncea Sweet bush
Calliandra eriophylla Fairy duster
Cassia artemisioides Feathery or Silvery
cassia
Chrysothamnus sp. Rabbit brush
Encelia farinosa Brittlebush
Ephedra trifuca Mormon tea
Gutierrezia sarothrae Snakeweed
Hymenoclea salsola Burro brush
Krameri agrayi White ratany
Larrea tridentata Creosote bush
Lycium andersonii Anderson thornbush
Lycium fremontii Fremont thornbush
Ziziphus obtusifolia Graythorn
Cacti
Carnegiea gigantea Saguaro
Echinocereus engelmannii Hedgehog cactus
Ferocactus acanthodes Barrel cactus
Mammilaria microcarpa Fishhook cactus
Pincushion cactus
Opuntia acanthocarpa Buckthorn cholla
Opuntia arbuscula Pencil cholla
Opuntia bigelovii Teddy bear cholla
Opuntia fulgida Chain fruit cholla
Jumping cholla
Opuntia imbricata Tree cholla
Opuntia leptocaulis Desert Christmas
cactus
Opuntia phaeacantha Prickly pear cactus
Forbs
Acourtia wrightii Brownfoot
Amaranthus blitoides Prostrate pigweed
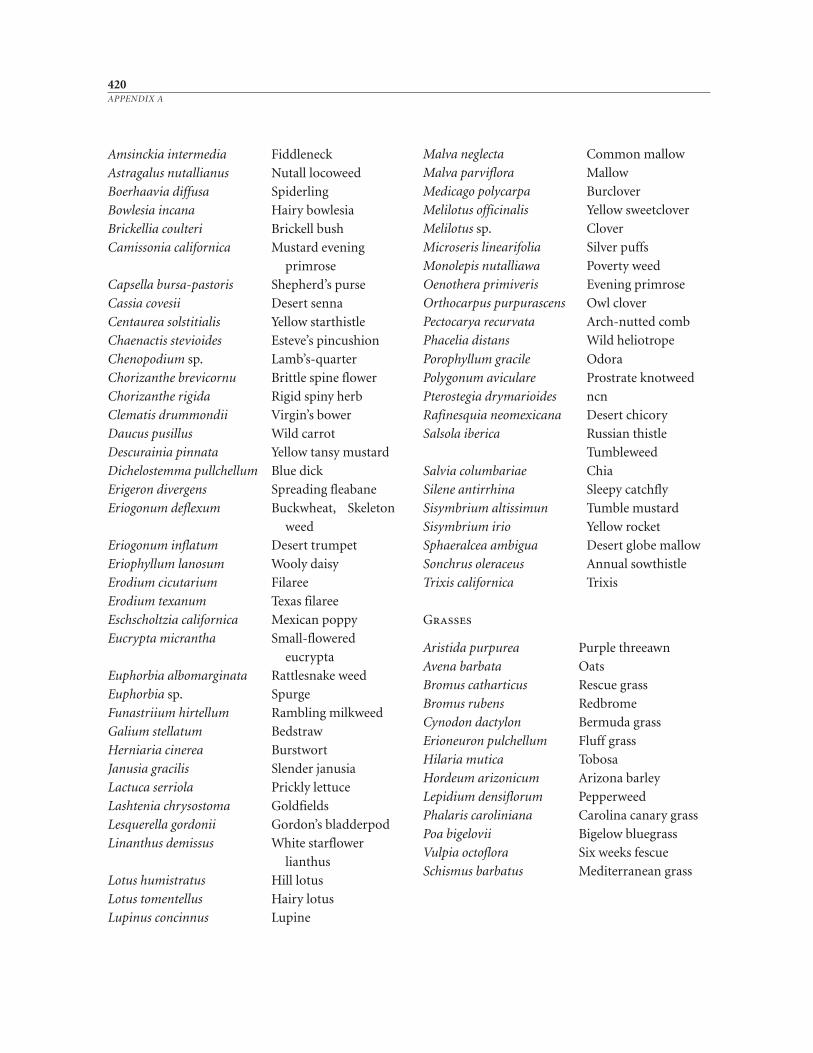
Amsinckia intermedia Fiddleneck
Astragalus nutallianus Nutall locoweed
Boerhaavia diffusa Spiderling
Bowlesia incana Hairy bowlesia
Brickellia coulteri Brickell bush
Camissonia californica Mustard evening
primrose
Capsella bursa- pastoris Shepherd’s purse
Cassia covesii Desert senna
Centaurea solstitialis Yellow starthistle
Chaenactis stevioides Esteve’s pincushion
Chenopodium sp. Lamb’s-quarter
Chorizanthe brevicornu Brittle spine flower
Chorizanthe rigida Rigid spiny herb
Clematis drummondii Virgin’s bower
Daucus pusillus Wild carrot
Descurainia pinnata Yellow tansy mustard
Dichelostemma pullchellum Blue dick
Erigeron divergens Spreading fleabane
Eriogonum deflexum Buckwheat, Skeleton
weed
Eriogonum inflatum Desert trumpet
Eriophyllum lanosum Wooly daisy
Erodium cicutarium Filaree
Erodium texanum Texas filaree
Eschscholtzia californica Mexican poppy
Eucrypta micrantha Small- flowered
eucrypta
Euphorbia albomarginata Rattlesnake weed
Euphorbia sp. Spurge
Funastriium hirtellum Rambling milkweed
Galium stellatum Bedstraw
Herniaria cinerea Burstwort
Janusia gracilis Slender janusia
Lactuca serriola Prickly lettuce
Lashtenia chrysostoma Goldfields
Lesquerella gordonii Gordon’s bladderpod
Linanthus demissus White starflower
lianthus
Lotus humistratus Hill lotus
Lotus tomentellus Hairy lotus
Lupinus concinnus Lupine
Malva neglecta Common mallow
Malva parviflora Mallow
Medicago polycarpa Burclover
Melilotus officinalis Yellow sweetclover
Melilotus sp. Clover
Microseris linearifolia Silver puffs
Monolepis nutalliawa Poverty weed
Oenothera primiveris Evening primrose
Orthocarpus purpurascens Owl clover
Pectocarya recurvata Arch- nutted comb
Phacelia distans Wild heliotrope
Porophyllum gracile Odora
Polygonum aviculare Prostrate knotweed
Pterostegia drymarioides ncn
Rafinesquia neomexicana Desert chicory
Salsola iberica Russian thistle
Tumbleweed
Salvia columbariae Chia
Silene antirrhina Sleepy catchfly
Sisymbrium altissimun Tumble mustard
Sisymbrium irio Yellow rocket
Sphaeralcea ambigua Desert globe mallow
Sonchrus oleraceus Annual sowthistle
Trixis californica Trixis
Grasses
Aristida purpurea Purple threeawn
Avena barbata Oats
Bromus catharticus Rescue grass
Bromus rubens Redbrome
Cynodon dactylon Bermuda grass
Erioneuron pulchellum Fluff grass
Hilaria mutica Tobosa
Hordeum arizonicum Arizona barley
Lepidium densiflorum Pepperweed
Phalaris caroliniana Carolina canary grass
Poa bigelovii Bigelow bluegrass
Vulpia octoflora Six weeks fescue
Schismus barbatus Mediterranean grass
420APPENDIX A
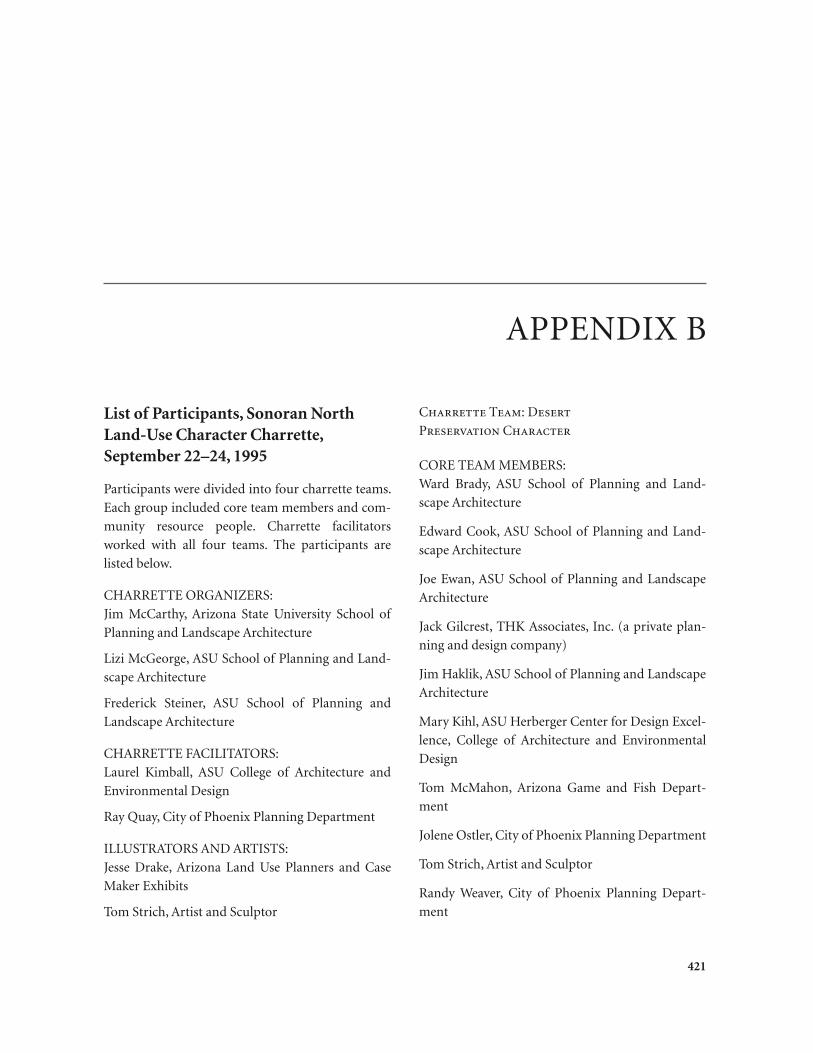
APPENDIX B
421
List of Participants, Sonoran NorthLand-Use Character Charrette,September 22–24, 1995
Participants were divided into four charrette teams.
Each group included core team members and com-
munity resource people. Charrette facilitators
worked with all four teams. The participants are
listed below.
CHARRETTE ORGANIZERS:
Jim McCarthy, Arizona State University School of
Planning and Landscape Architecture
Lizi McGeorge, ASU School of Planning and Land-
scape Architecture
Frederick Steiner, ASU School of Planning and
Landscape Architecture
CHARRETTE FACILITATORS:
Laurel Kimball, ASU College of Architecture and
Environmental Design
Ray Quay, City of Phoenix Planning Department
ILLUSTRATORS AND ARTISTS:
Jesse Drake, Arizona Land Use Planners and Case
Maker Exhibits
Tom Strich, Artist and Sculptor
Charrette Team: Desert
Preservation Character
CORE TEAM MEMBERS:
Ward Brady, ASU School of Planning and Land-
scape Architecture
Edward Cook, ASU School of Planning and Land-
scape Architecture
Joe Ewan, ASU School of Planning and Landscape
Architecture
Jack Gilcrest, THK Associates, Inc. (a private plan-
ning and design company)
Jim Haklik, ASU School of Planning and Landscape
Architecture
Mary Kihl, ASU Herberger Center for Design Excel-
lence, College of Architecture and Environmental
Design
Tom McMahon, Arizona Game and Fish Depart-
ment
Jolene Ostler, City of Phoenix Planning Department
Tom Strich, Artist and Sculptor
Randy Weaver, City of Phoenix Planning Depart-
ment
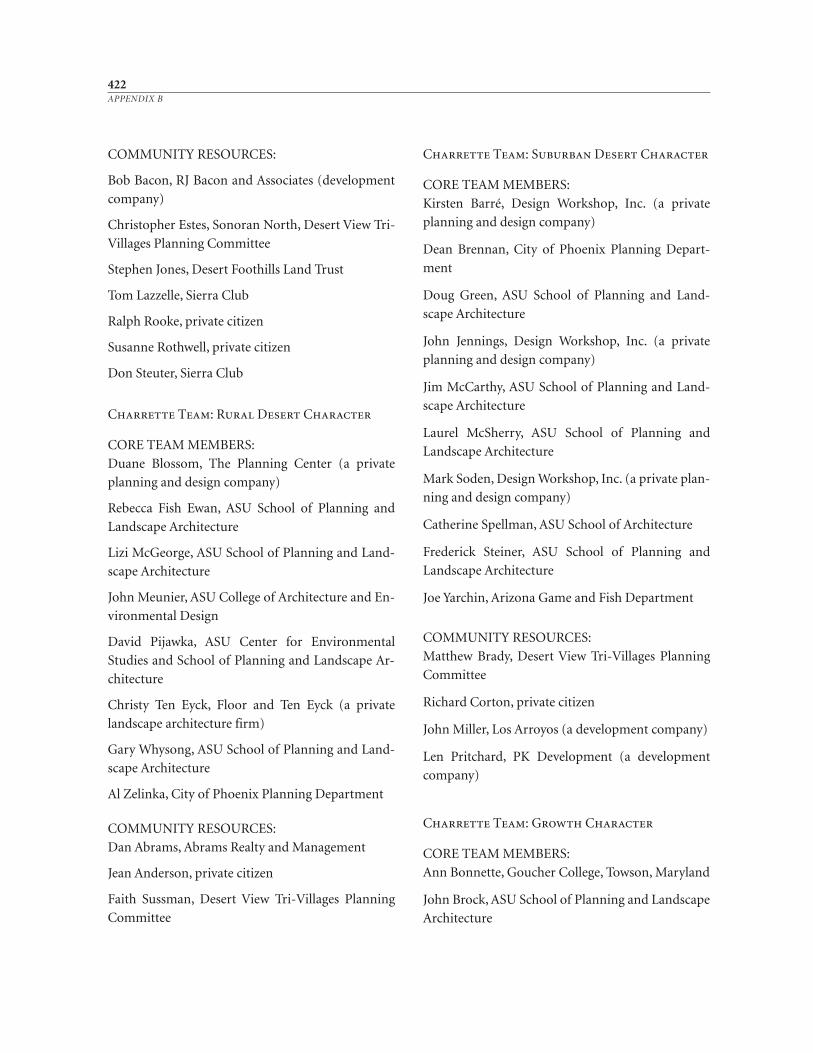
COMMUNITY RESOURCES:
Bob Bacon, RJ Bacon and Associates (development
company)
Christopher Estes, Sonoran North, Desert View Tri-
Villages Planning Committee
Stephen Jones, Desert Foothills Land Trust
Tom Lazzelle, Sierra Club
Ralph Rooke, private citizen
Susanne Rothwell, private citizen
Don Steuter, Sierra Club
Charrette Team: Rural Desert Character
CORE TEAM MEMBERS:
Duane Blossom, The Planning Center (a private
planning and design company)
Rebecca Fish Ewan, ASU School of Planning and
Landscape Architecture
Lizi McGeorge, ASU School of Planning and Land-
scape Architecture
John Meunier, ASU College of Architecture and En-
vironmental Design
David Pijawka, ASU Center for Environmental
Studies and School of Planning and Landscape Ar-
chitecture
Christy Ten Eyck, Floor and Ten Eyck (a private
landscape architecture firm)
Gary Whysong, ASU School of Planning and Land-
scape Architecture
Al Zelinka, City of Phoenix Planning Department
COMMUNITY RESOURCES:
Dan Abrams, Abrams Realty and Management
Jean Anderson, private citizen
Faith Sussman, Desert View Tri- Villages Planning
Committee
Charrette Team: Suburban Desert Character
CORE TEAM MEMBERS:
Kirsten Barré, Design Workshop, Inc. (a private
planning and design company)
Dean Brennan, City of Phoenix Planning Depart-
ment
Doug Green, ASU School of Planning and Land-
scape Architecture
John Jennings, Design Workshop, Inc. (a private
planning and design company)
Jim McCarthy, ASU School of Planning and Land-
scape Architecture
Laurel McSherry, ASU School of Planning and
Landscape Architecture
Mark Soden, Design Workshop, Inc. (a private plan-
ning and design company)
Catherine Spellman, ASU School of Architecture
Frederick Steiner, ASU School of Planning and
Landscape Architecture
Joe Yarchin, Arizona Game and Fish Department
COMMUNITY RESOURCES:
Matthew Brady, Desert View Tri- Villages Planning
Committee
Richard Corton, private citizen
John Miller, Los Arroyos (a development company)
Len Pritchard, PK Development (a development
company)
Charrette Team: Growth Character
CORE TEAM MEMBERS:
Ann Bonnette, Goucher College, Towson, Maryland
John Brock, ASU School of Planning and Landscape
Architecture
422APPENDIX B
Tim Campbell, BRW (a private planning and design
company)
Michael Dollin, Urban Earth Design (a private plan-
ning and design company) and ASU Joint Urban
Design Program
Subhrajit Guhathakurta, ASU School of Planning
and Landscape Architecture
Dave Longey, private consultant in landscape archi-
tecture and planning
Lionel March, University of California at Los Ange-
les, School of Arts and Architecture
Jim Mathien, City of Phoenix Planning Department
John McNamara, BRW (a private planning and de-
sign company)
COMMUNITY RESOURCES:
Curt Nelson, Continental Homes
Price Nosky, Sunbelt Holdings
423APPENDIX B

GLOSSARY
425
The glossary was compiled from many sources. For the second edition the following publications were especiallyhelpful:
American Farmland Trust. 1997. Saving American farmland:what works. Northampton, Massachusetts: AmericanFarmland Trust.
Daniels, Tom, and Deborah Bowers. 1997. Holding ourground: protecting America’s farms and farmland. Washing-ton, D.C.: Island Press.
Pease, James R., and Robert E. Coughlin. 1996. Land evalua-tion and site assessment: a guidebook for rating agriculturallands (2nd ed.). Ankeny, Iowa: Soil and Water Conserva-tion Society.
Duerksen, Christopher J., Donald L. Elliott, N. ThompsonHobbs, Erin Johnson, and James R. Miller. 1997. Habitatprotection planning: where the wild things are. Chicago, Illi-nois: American Planning Association.
abiotic Those aspects dealing with nonliving matter.adaptation A genetically determined characteristic that
enhances the ability of an organism to better adjust to itssurroundings.
adiabatic lapse rate A variation in temperature of a parcelof air up or down a change in elevation. This does not takeinto account exchanges of heat between the air parcel andthe environment.
administration Execution of an organizational policy toreach predetermined objectives.
advection The transfer of an atmospheric property due tomass air motion along a gradient of the property in ques-tion; the horizontal spreading of local effects by wind.
agricultural district A legally recognized geographic areaformed by one or more landowners and approved by oneor more government agencies, designed to keep land inagriculture. Agricultural districts are created for fixed, re-
newable terms. Enrollment is voluntary; landowners re-ceive a variety of benefits that may include eligibility fordifferential assessment, limits on annexation and eminentdomain, protection against unreasonable government reg-ulation and private nuisance lawsuits, and eligibility forpurchase of agricultural conservation easement programs.Agricultural districts are also known as agricultural pre-serves, agricultural security areas, agricultural preserva-tion districts, agricultural areas, agricultural incentiveareas, agricultural development areas, and agriculturalprotection areas.
agricultural lands Places used for crop or animal produc-tion or for silviculture.
agricultural zoning A zoning ordinance or zoning districtdesigned to protect farmland from incompatible nonfarmuses. There are several types of agricultural zoning, whichvary according to (1) the uses allowed in the zone (i.e., ex-clusive or nonexclusive farm use); (2) the minimum farmsize allowed, such as a 50- acre (20.2- hectare) minimumlot size; (3) the number of nonfarm dwellings allowed,such as one building lot per 25 acres (10.1 hectares); and(4) the size of setbacks or buffer areas between farms andnonfarm properties.
air mass A widespread body of air that gains certain char-acteristics while set in one location. The characteristicschange as it moves away.
air parcel A space of air over a certain area of land.air pollution areas Places that require restraints on air pol-
lution emissions due to periods of poor vertical air mixingand the subsequent entrapment of polluting substances.
albedo Reflected solar radiation factor.alluvium The soil material deposited by running water.analysis The examination of individual parts to find out
their nature, function, and interrelationship with otherparts.
annexation The incorporation of land into an existingcommunity that results in a change in the community’sboundary. Annexation generally refers to the inclusion ofnewly incorporated land but can also involve the transferof land from one municipality to another.
aquifer A water- bearing layer of permeable rock, sand, orgravel.
aspect Orientation toward some direction.basalt A hard, fine- grained igneous rock caused by volcan-
ism.base map A reproducible map used to display various
types of information.biodiversity (biological diversity) The variety and abun-
dance of all life-forms considered at all levels of organiza-tion, from the genetic level through the species and higherlevels of taxonomic organization, and including the vari-ety of habitats, communities, landscapes, and ecosystems.
biogeochemical cycles Mineral and nutrient cycles that areimportant to the biological community.
biological Those aspects dealing with living matter.biomass The amount of living matter in a given unit of the
environment.biophysical Biological and physical factors.biosphere The portion of earth and its atmosphere that
can support life.biota All living organisms that exist in an area.biotic community An assemblage of plants and animals
living in the same community, forming a system that ismutually sustaining and interdependent and influencedby the abiotic factors of the ecosystem. A biotic commu-nity is generally characterized by the dominant vegetation.
board of adjustment An independent board created tohandle conditional uses, variances, and special applica-tions of regulations established by a zoning ordinance andto hear and act on appeals.
building code The legal requirements pertaining to thebuilding of structures.
canopy layer The uppermost layer of forest vegetation.capability An evaluation based on a resource’s inherent,
natural, or intrinsic ability to provide for use and includesthat existing ability that is the result of past alterations orcurrent management practices. Often capability is used in-terchangeably with suitability.
capability class An evaluation made by the U.S. NaturalResources Conservation Service concerning the agricul-tural management of a soil type.
capital improvement programming (CIP) The multiyearscheduling of public physical improvements. The schedul-ing is based on studies of fiscal resources available and thechoice of specific improvements to be constructed for aperiod of five or six years in the future.
carnivores Organisms that feed on animal tissue.carrying capacity (1) In ecology, the number of individu-
als that the resources of a habitat can support. (2) In
wildlife, the maximum number of animals an area cansupport during a given period of the year. (3) In recre-ation, the amount of use a recreation area can sustainwithout deterioration of its quality.
circuit breaker tax relief A tax abatement program thatpermits eligible landowners to take some or all of theproperty tax they pay on farmland and farm buildings as acredit to offset their state income tax. Generally, farmersare eligible for a credit when property taxes exceed a setpercentage of their income.
citizen participation The involvement of the public in theplanning process.
citizens’ advisory committee (CAC) A group of citizenscalled together by an agency to represent the ideas and at-titudes of their community in advising and giving consul-tation to the agency.
clay Soil particles smaller than 0.002 millimeters in diameter.
climate The set of meteorological conditions characteristicof an area over a given length of time.
cluster development Grouping houses on part of a prop-erty while maintaining a large amount of open space onthe remaining land. Cluster development should be seenas an open- space protection tool rather than a farmlandprotection tool.
cognitive mapping A process by which people acquire,code, store, recall, and decode information about the rela-tive locations and attributes of phenomena in the every-day spatial environment.
cohort- survival method A popular method for makingpopulation projections based on fertility, mortality, andnet migration.
community (1) In sociology, a variety of physical and so-cial areas and institutions within which and with whichpeople live. (2) In ecology, an association of interactingpopulations, usually determined by their interactions orby spatial occurrence.
compensating wind Wind originating above plains andflowing toward nearby mountains along a pressure gradi-ent.
competition The use or defense of a resource by one indi-vidual that reduces the availability of that resource toother individuals.
comprehensive plan A document setting forth official gov-ernmental policy for the long- term future development ofan area that considers all major determinants of growthand change—economic, political, social, and biophysical.
comprehensive planning A process for coordinating andestablishing the policies set forth in a comprehensive plan.
conditional use A permitted use allowed in zoning ordi-nances that requires review by a board of adjustment orsimilar review agency.
conifer A cone- bearing plant whose needles remain on thetree all year.
426GLOSSARY
conservation The management of human use of thebiosphere to yield the greatest sustainable benefit topresent generations while maintaining its potential tomeet the needs and aspirations of future generations.
conservation easement A nonpossessory interest of aholder in real property imposing limitations or affirmativeobligations the purposes of which include retaining orprotecting natural, scenic, or open- space values of realproperty, assuring its availability for agricultural, forest,recreational, or open- space use, protecting natural re-sources, maintaining or enhancing air or water quality, orpreserving the historical, architectural, archaeological, orcultural aspects of real property. Most are permanent;term easements impose restrictions for a limited numberof years.
corn suitability rating (CSR) A numerical system for rat-ing the productivity of farmland, used primarily in Iowa.
critical areas Places significantly affected by, or having aneffect on, an existing or proposed major facility or otherareas of major public investment; or containing or havinga significant impact on historical, natural, or environmen-tal resources of regional or statewide importance.
cropland Land regularly used for production of crops, except forestland and rangeland, including permanentpasture.
cross section A graphic tool that illustrates a vertical sec-tion of land.
cumulative impact assessment A comprehensive planningprocess whereby the rate or total amount of developmentis managed to stay below prestated threshold levels and ishalted when such thresholds are reached.
deadwater Unflowing stream or river water.decomposers Organisms responsible for breaking down
matter.deferred taxation A form of differential assessment that
permits eligible land to be assessed at its value for agricul-ture. Taxes are based on how much money the land couldproduce in crops or livestock, instead of its speculativevalue for development. Deferred taxation is similar topreferential assessment, but landowners must pay some orall of the taxes that were excused if they later convert landto ineligible uses. Rollback taxes assess the difference be-tween taxes paid under differential assessment and taxesthat would have been due if the land was assessed at fairmarket value.
Delphi A method for systematically developing and ex-pressing the views of a panel of experts.
design guidelines Local ordinances that establish stan-dards for architecture and landscape architecture featuresof new development.
detritus Freshly dead or partially decomposed organicmatter.
detritus- feeding animals Animals that ingest and breakdown fragments of organic matter.
detrivores Animals that obtain energy from decaying plantand animal matter.
development The modification of the biosphere and theapplication of human, financial, living, and nonliving re-sources to satisfy human needs and improve the quality ofhuman life.
development rights Development rights entitle propertyowners to develop land in accordance with local land-useregulations. These rights may be sold to public agencies or qualified nonprofit organizations. Sale of develop-ment rights to a government agency or land trust generallydoes not pass any affirmative interest in the prop-erty. Rather than the right to develop the land, the buyeracquires the responsibility to enforce the negative cov -enants or restrictions stipulated in the development rightsagreement.
differential assessment An agricultural property tax reliefprogram that allows eligible farmland to be assessed at itsvalue for agriculture rather than its fair market value, whichreflects “highest and best” use. The tax takes three differentforms: preferential assessment, deferred taxation, and re-strictive agreements. This approach is also known ascurrent-use assessment, current-use valuation, farm-usevaluation, and use assessment.
dike Hardened lava extending in a direction other thanthat of the flow. Also, earthen elevated barrier erected toprevent land from uncontrolled flooding.
dominant species A species that has a controlling influenceon the local environment.
downzoning A change in the zoning for a particular areathat results in lower residential densities. For example, achange from a zoning ordinance that requires 10 acres(4.05 hectares) per dwelling to an ordinance that requires40 acres (16.2 hectares) per dwelling is a downzoning.
drainage basin A part of the earth’s surface that is occupiedby a drainage system, which consists of a surface stream ora body of impounded surface water together with all trib-utary surface streams and bodies of impounded surfacewater.
drainage class The relative terms used to describe naturaldrainage as follows:Excessive: Commonly very porous and rapidly permeable
soils that have low water- holding capacity.Somewhat excessive: Very permeable soils that are free
from mottling throughout their profile.Good: Well- drained soils that are nearly free of mottling
and are commonly of intermediate texture.Moderately good: Moderately well- drained soils that
commonly have a slow permeable layer in or immedi-ately beneath the solum. They have uniform color inthe surface layers and upper subsoil and mottling inthe lower subsoils and substrata.
Somewhat poor: Soils wet for significant periods but notall the time. They commonly have a slowly permeable
427GLOSSARY
layer in the profile, a high water table, additionsthrough seepage, or a combination of these conditions.
Poor: Soils wet for long periods of time. They are lightgray and generally are mottled from the surface down-ward, although mottling may be absent or nearly so insome soils.
drainage wind A wind flowing from a higher elevation to alower elevation.
duplex A detached structure containing two dwellingunits.
dwelling unit An independent living space within a struc-ture designed and intended for occupancy by not morethan one family and having its own housekeeping andkitchen facilities.
easement The purchase of partial rights in a piece of land.ecologically critical areas Places containing one or more
significant natural resources that could be degraded or lost as a result of uncontrolled or incompatible development.
ecological planning The application of ecological knowl-edge to community, regional, and resource planning.
ecology The reciprocal relationship of living things to oneanother and to their physical and biological environment.
economic Of or having to do with the management of theincome and expenditures of a household, business, com-munity, or government.
economic multiplier The numerical relationship between anoriginal change in economic activity and the ultimate changein activity that results as the money is spent and respentthrough various sectors of the economy.
ecosystem The interacting system of a biological commu-nity and its nonliving surroundings.
ecotone Transitional areas between two ecological com-munities, generally of greater richness than either of thecommunities it separates.
elevation The height of land (in feet or meters) above sealevel.
energy That which does or is capable of doing work.environment The sum of all external influences that affect
the life, development, and survival of an organism.environmental impact statement (EIS) A document re-
quired of federal agencies by the National EnvironmentalPolicy Act for major projects or legislative proposals. It is used in making decisions about the positive and neg-ative effects of the undertaking and lists alternatives. Some states and several other nations also require impactstatements.
environmentally sensitive areas Places vulnerable to nega-tive environmental impacts, such as unstable soils, steepslopes, floodplains, wetlands, and certain plant and animalhabitats.
environmental thresholds The level beyond which addi-tional stress to an ecosystem results in a marked decrease
in the system’s performance or an adaptive change in thesystem’s structure or both.
eolian soils Soils deposited by the wind.erosion The process of diminishing the land by degrees by
running water, wind, ice, or other geological agents.erosion, bank The destruction of land areas by active cut-
ting of stream banks.erosion, beach The retrogression of the shoreline of large
lakes and coastal waters caused by wave action, shore cur-rents, or natural causes other than subsidence.
erosion, gully The widening, deepening, and headcuttingof small channels and waterways due to erosion.
erosion, rill The removal of soil by running water with for-mation of shallow channels that can be smoothed outcompletely by normal cultivation.
erosion, sheet The removal of a fairly uniform layer of soilor materials from the land surface by the action of rainfalland runoff water.
estuary A semienclosed coastal body of water that has afree connection with the open sea; it is thus strongly af-fected by tidal action, and within it seawater is mixed (andusually measurably diluted) with fresh water from landdrainage.
evaporation The loss of water to the atmosphere from thesurface of a soil or a body of water.
evapotranspiration The sum of evaporation and transpi-ration during a specific time period.
exotics Plants or animals introduced into a communitythat are not normally constituents of that community.
factor The term used to label a group of attributes, such assoil potential, size, compatibility, or scenic quality.
factor rating The number of points assigned to a factor,before weighting.
factor scale The way points are assigned to a factor.fault A fracture line along which movements have oc-
curred, causing the geologic units on either side to be mis-matched.
fauna Animal life.fee simple A form of land ownership that includes all
property rights, including the right to develop the land.fire hazard areas Places identified by the U.S. Forest Ser-
vice and state wildfire management agencies as being par-ticularly susceptible to forest fires.
first- order stream See stream orders.flooding The general and temporary condition of par-
tial or complete inundation of normal dryland areas from the overflow of streams, rivers, and other inland water or from abnormally high tidal water resulting fromsevere storms, hurricanes, or tsunamis. Also, any rela-tively high stream flow overtopping the natural or arti-ficial banks in any reach of a stream, or a relatively highflow as measured by either gauge height or dischargequantity.
428GLOSSARY
floodplain The area of land adjoining a body of water thathas been or may be covered by floodwater.
flood- prone areas Places identified on the basis of the fre-quency of flooding.
floodway The channel of a river or other watercourse andthe adjacent land areas required to carry and discharge aflood of a given magnitude.
flora Plant life.fog Suspended liquid particles formed by condensation of
vapor.food chain The interconnected feeding relationships of
various species that transfer energy from an initial sourcethrough a series of organisms.
forb Herbs other than true grasses, sedges, and rushes andnongrasslike plants having little or no woody material.
forestland Land that is at least 10 percent stocked by treesof any size, and land from which the trees have been re-moved to less than 10 percent stocking but that has notbeen developed for other use.
fragmentation The breaking up of continuous areas ofhabitat into smaller parcels. For example, a forest be-comes fragmented when sections are cleared for agricul-ture or when trees are cleared to build roads.
frost pocket A hollow in the topography into which coldair will flow, thereby lowering temperatures in the bottomof the hollow.
geographic information system (GIS) A method of stor-ing geographic information on computers to create amap or a series of maps. Geographic information can beobtained from a variety of sources, including topo-graphical maps, soil maps, aerial and satellite photo-graphs, and remote sensing technology. This informa-tion can then be used to create special maps forrecordkeeping and decision- making purposes. GIS maybe used to maintain maps of protected land or make de-cisions about which farmland to protect.
geologic map A graphic representation of the rock unitsand geologic features that are exposed on the surface ofthe earth.
geological hazard areas Places characterized by a high fre-quency of earthquake shaking, landslides, fault displace -ments, volcanic activity, subsidence, or severe erosion.
geology The science dealing with the study of rocks, oftenin an attempt to learn more about the history of the earth.
geomorphology The science dealing with the interpreta-tion of the relief features of the surface of the earth.
givings The adding to the value of private propertythrough a government action or actions. Givings includepublic investments, outright subsidies, tax breaks, andeven regulations that give some land uses a competitiveedge over others.
goal A concise statement of a community or organization’scentral aspirations in addressing a problem or an opportu-
nity expressed in terms of a desired state or process thatoperating programs are designed to achieve.
grass Plant species with narrow leaves and jointed stems.greenbelt An area of protected open space around a city or
town, or an area that separates two built- up places.ground cover Plants grown to keep soil from eroding.groundwater Water that fills all the unblocked pores of
material lying beneath the water table.groundwater recharge areas Areas where additions are
made to an aquifer by infiltration of water through theland surface.
group dynamics A generic term classifying a variety of in-terpersonal techniques used to foster group interactionand achievement of group goals and problem- solving tech-niques designed to clarify substantive issues.
growth management The use of regulations and incentivesto influence the rate, timing, location, density, type, andstyle of development in the community.
habitat The sum of environmental conditions in a specificplace that is occupied by an organism, population, orcommunity.
hedgerow A group or row of trees and shrubs separatingtwo grassy areas.
herb Any flowering plant that does not develop a persistentwoody stem above ground, including forbs, grasses, andgrasslike plants.
herbicide A chemical that controls or destroys undesirableplants.
herbivores Primary consumers or animals that obtain en-ergy from plants.
historic, archaeological, and cultural areas Sites importantto the heritage of the community, region, state, or nation.
human ecology The interdisciplinary study of human- ecosystem relationships.
humus The semistable fraction of the soil organic matterremaining after the major portion of added plant and ani-mal residues has decomposed, usually dark- colored.
hydrograph A graph showing the volume of water thatpasses a point of a stream over a certain period of time.
hydrologic cycle A recurring series of events involving thecirculation of water through the environment. The cycleincludes precipitation, storage, and evaporation.
hydrology The science dealing with the study of ground-water and surface water and the changes that occur duringthe hydrologic cycle.
impact fees A growth management technique that requiresa developer to pay for public services necessary for new ur-ban development.
indicator species A species (either plant or animal) gener-ally limited to a particular environment so that its pres-ence will usually indicate that environment or life zone.
infiltration rate The rate of speed at which water flows intosoil through small pores.
429GLOSSARY
insolation Incoming solar radiation that is absorbed by theland, largely dependent on land-forms and wind direction.
intrinsic suitability The inherent capability of an area tosupport a particular land use with the least detriment tothe economy and the environment.
introduced species A species brought into an area by peo-ple; one that is not a native.
inventory The gathering of data for future use.inversion An atmospheric condition caused by a layer of
warm air preventing the rise of cool air trapped beneath it.land evaluation and site assessment (LESA) A numerical
system that measures the quality of farmland. It is gener-ally used to select tracts of land to be protected or devel-oped.
land trust A private, nonprofit conservation organizationformed to protect natural resources such as productivefarm and forest land, natural areas, historic structures, andrecreational areas. Land trusts purchase and accept dona-tions of conservation easements. They educate the publicabout the need to conserve land, and some provide landuse and estate planning services to local governments andindividual citizens.
landscape All the natural and cultural features such as set-tlements, fields, hills, buildings, deserts, forests, and waterbodies that distinguish one part of the surface of the earthfrom another part. Usually a landscape is that portion ofland or territory which the eye can comprehend in a singleview, including all its natural and cultural characteristics.
landscape architecture The art and science of arrangingland so as to adapt it most conveniently, economically,functionally, and gracefully to any of the varied wants ofpeople.
landscape ecology A study of the structure, function, andchange in a heterogeneous land area composed of inter-acting ecosystems.
landscape plan A written and graphic documentation of acommunity’s goals, the strategies to achieve those goals,and the spatial consequences of the implementationstrategies.
land use The occupation of an area for a particular pur-pose, such as rangeland or industrial areas.
land- use need A factor that is essential or beneficial for aparticular land use.
land user A person using a land resource who may or maynot own title to that land.
langley A measurement of solar radiation equivalent toone calorie per square centimeter over some increment oftime.
leaching The process by which nutrient chemicals or con-taminants are dissolved and carried away by water or aremoved into a lower layer of soil.
life cycle The stages an organism passes through during itsexistence.
life zone A biotic region with a distinctive flora and fauna.The region is based on climatic conditions, elevation, andother natural factors.
limestone A metamorphic rock formed from organic re-mains.
limnology The study of the physical, chemical, meteoro-logical, and biological aspects of fresh water.
loam A soil mixture of sand, clay, and silt.loess Predominately silt- sized particles that have been
transported and deposited by the wind.lot A parcel of land under one ownership, used or capable
of being used under the subdivision regulations of a zon-ing ordinance, including both the building site and all re-quired yards and open spaces.
matrix A graphic tool that plots two groups of interdepen-dent factors against each other (one in rows and one incolumns) to help illustrate their relationships.
meandering stream A stream that follows many S- shapedcurves.
metamorphic rock A previously igneous or sedimentaryrock that was exposed to conditions that entirely alteredits original condition.
metropolitan statistical area (MSA) Following the 1980U.S. Census, the term standard metropolitan statisticalarea (SMSA) was shortened to metropolitan statisticalarea (MSA). If any area has more than 1 million popula-tion and meets certain other specified requirements, thenit is termed a consolidated metropolitan statistical area(CMSA), consisting of major components recognized asprimary metropolitan statistical areas (PMSAs). In addi-tion there are special New England county metropolitanareas (NECMAs) in that region of the United States.MSAs, PMSAs, and NECMAs are categorized by theirpopulation size, as follows:Level A: Areas of 1 million or moreLevel B: Areas of 250,000 to 1 millionLevel C: Areas of 100,000 to 250,000Level D: Areas of less than 100,000Metropolitan statistical areas are defined in two ways: acity of at least 50,000 population or an urbanized area ofat least 50,000 population with a total metropolitan areapopulation of at least 100,000. MSAs are defined in termsof whole counties, except in the six New England stateswhere they are defined in terms of cities and towns. In ad-dition to the county containing the main city, an MSA alsoincludes additional counties having strong economic andsocial ties to the central county.
microclimate The climate from the surface of the earth to aheight at which the local effects of the earth can no longerbe distinguished from the general climate.
migratory animals Animals that periodically pass fromone region or climate to another for feeding or breedingpurposes.
430GLOSSARY
mineral extraction areas Places that contain minerals ormaterials of commercial quality and quantity that include,but are not limited to, sand, gravel, clay, peat, rock, andores.
mission statement A brief declaration of the purpose forwhich a unit exists and functions. A mission statement canhelp define the purpose of a plan.
moratoriums The prevention of the issuance of buildingpermits until urban service capacity levels are attained oruntil plans and ordinances are completed.
morphology The study of surfaces and forms.multifamily dwelling A building containing three or more
dwelling units.multiple use Harmonious use of land for more than one
purpose, such as grazing of livestock, wildlife production,recreation, and timber production. It is not necessarily thecombination that will yield the highest economic returnor greatest unit output.
natural ecological areas Places with ecosystem units thatare either superlative examples of their type or areas thatperform a vital function in maintaining the ecological in-tegrity and environmental quality of a larger region.
natural hazard critical areas Places in which incompatibledevelopment may result in the loss of life or property orboth.
natural selection The process of survival of the fittest bywhich organisms that adapt to their environment surviveand those that do not disappear.
natural system The biophysical factors, such as geology,soils, and wildlife.
natural wildlife habitat areas Places essential to the preser-vation of game species or unique, rare, or endangered species.
neighborhood planning council A locally based organiza-tion that permits citizen participation in policy decisionsand in planning issues affecting their immediate geo-graphic area.
niche An area that provides the necessary elements for theexistence of a particular organism.
nominal- group workshop A citizen- participation tech-nique based on the concept that people think most cre-atively while working in a group.
nonconforming use Any lawful use of activity involving abuilding or land occupied or in existence at the effectivedate of a zoning ordinance that does not conform to theprincipal, accessory, or conditional uses permitted in, orthe density provisions of, the zoning district in which it islocated.
non- point- source pollution Caused by residuals carriedinto streams, lakes, and estuaries by surface water as well asto groundwater zones by infiltration and percolation.These pollutants do not result from a direct release from apipe or channel.
nutrients Elements or compounds essential to the growthand development of living things: carbon, oxygen, nitro-gen, potassium, and phosphorus.
objective A clear and specific statement of planned resultsto be achieved within a stated time period.
oceanography The study of the sea in all its physical,chemical, geological, and biological aspects.
omnivores Animals that obtain energy from plants andother animals.
open space A relatively undeveloped green or wooded areaprovided usually within an urban development to mini-mize the feeling of congested living.
organic Referring to or derived from living organisms. Inchemistry, it is any compound containing carbon.
organic matter Matter derived from living matter.organism Any living things.organization development A discipline involved in inter-
vening in social networks to foster higher levels of cohe-sion and effectiveness.
osmosis The tendency of a fluid to pass through a perme-able membrane (such as the wall of a living cell) into a lessconcentrated solution so as to equalize concentrations onboth sides of the membrane.
parent material The unconsolidated and chemicallyweathered mineral or organic matter from which soils aredeveloped.
patch A spatially separate instance of a given type of habitat.
pedology The study of soils.pedon A three- dimensional soil sampling unit from 1 to
10 square meters, large enough so the nature of its soilhorizons can be studied and the range of its propertiesidentified.
perceptually and culturally critical areas Places containingone or more significant scenic, recreational, archaeologi-cal, historical, or cultural resources that could be degradedor lost as a result of uncontrolled or incompatible devel-opment.
perched water table condition A layer of soil separatedabove the saturated zone by an impermeable layer.
percolation The downward movement of water in a soil.perennial plant A species of plant that lives longer than 2
years.performance standards Criteria that are established and
must be met before a certain use will be permitted. Thesecriteria, or standards, may be a set of economic, environ-mental, or social factors or any combination of these fac-tors.
permeability The rate at which water can move throughsoil.
pesticide Any substance used to control pests ranging fromrats, weeds, and insects to algae and fungi.
pH A measure of the acidity or alkalinity of a material,
431GLOSSARY
solid, or liquid. pH is represented on a scale of 0 to 14, with7 being a neutral state, 0 most acid, and 14 most alkaline.
photogrammetry The art or science of obtaining reliablemeasurements through photography.
phyllite A rock similar in composition to silt and schist.physical In ecological planning, the abiotic elements of the
environment, including geology, physiography, soils, hy-drology, and climate.
physiography The science dealing with the study of physi-cal features of the land, in particular slope and elevation.
planned unit development (PUD) A tract of land that iscontrolled by one entity and is planned and developed as awhole, either all at once or in programmed stages. PUDsare developed according to detailed site plans and may in-corporate both residential and commercial land uses.They generally include improvements such as roads andutilities.
planning The use of scientific, technical, and other orga-nized knowledge to provide choices for decision making aswell as a process for considering and reaching consensuson a range of options.
planning commission An appointed citizen body that ad-vises elected officials on such matters as the comprehen-sive plan, zoning ordinances, and subdivision regulations.
planning, programming, and budget system (PPBS) Acomplex annual budget system that involves the linkage ofprograms to the budgeting process.
planning staff The professional staff for the planning com-mission.
plant community An association of plants characterizedby certain species occupying similar habitats.
plat A map or plan, especially of a piece of land dividedinto building lots.
plateau A large, flat area of land that is higher in elevationthan some adjacent land.
police power The right of government to restrict anowner’s use of property to protect the public health, safety,and welfare. Restrictions must be reasonable and be con-ducted according to due process.
policy A definite course or method of action selected by agovernmental agency, institution, group, or individualfrom among options and in light of given conditions toguide and usually determine present and future decisions.
preferential tax policies Favorable taxation of land in ex-change for an agreement to use that land for a certain use,such as agriculture, or for open spaces.
prime agricultural land Farmland that has a gentle slopeand well- drained soils and requires a minimum of con-servation practices. It is the easiest land to farm. Class Iand II soils, as defined by the Natural Resources Conser-vation Service of the U.S. Department of Agriculture,are considered prime agricultural soils.
process The action of moving forward progressively fromone point to another on the way to completion.
primary consumers Herbivores or animals that obtain en-ergy from plants.
pristine Pure and untouched.producers Organisms that can use solar energy to convert
inorganic substances into organic substances.profile A graphic tool that shows a portion of the surface
of the earth and the features on this portion.project planning Designing a solution to a specific prob-
lem such as a dam, highway, harbor, or a single building orgroup of buildings.
public hearing An open forum where statements becomepart of official records. Public hearings are often requiredby law.
public opinion poll (preference survey) A means of gath-ering information, attitudes, and opinions from a largenumber of people.
purchase of agricultural conservation easements (PACE)PACE programs pay farmers to keep their land availablefor agriculture. Landowners sell an agricultural conserva-tion easement to a qualified government agency or privateconservation organization. Landowners retain full owner-ship and use of their land for agricultural purposes. PACEprograms do not give government agencies the right to de-velop land. Development rights are extinguished in ex-change for compensation. PACE is also known as purchaseof development rights (PDR) and as agricultural preserva-tion restriction (APR) in Massachusetts.
purchase of development rights (PDR) The propertyowner’s development interests are relinquished to the pur-chaser of the rights, who can be a government or non-governmental entity, such as a land trust. The purchaserthen can limit the development of the property to encour-age agricultural, open space, or environmental uses.
putative species The species expected to occur in an areabased on habitat requirements.
rain shadow An area that has decreased precipitation be-cause it is to the leeward side of mountains.
rangeland Land in grass or other long- term forage growthof native species used primarily for grazing. It may containshade trees or scattered timber trees with less than 10 per-cent canopy. It includes grassland, land in perennial forbs,sagebrush land, and brushland other than sage. The termnonforest range is used to differentiate the nonforest rangefrom the forest range when both are being discussed.
receiving area Areas designated to accommodate develop-ment transferred from agricultural or natural areasthrough a transfer of development rights program.
recharge Process by which water is added to the zone ofsaturation, as recharge of an aquifer.
recharge areas See groundwater recharge areas.recreation Any experience voluntarily engaged in largely
during leisure (discretionary time) from which the indi-vidual derives satisfaction.
region (1) An uninterrupted area possessing some kind of
432GLOSSARY
homogeneity in its core but lacking clearly defined limits.(2) A governmental jurisdiction or designation. (3) Aframe for multidisciplinary research: a demand for the in-tegration of data from many realms of ecological realityand, therefore, an opportunity for specialists to work to-gether on theoretical conceptions of human ecology as asynthesis.
regolith The predominantly loose surficial material over-laying bedrock. It is roughly equivalent to what engineersterm soil and may contain or be capped by a true soil pedon, as used by soil scientists.
remote sensing The detection, identification, and analysisof objects or features through the use of imaging deviceslocated at positions remote from the objects of investiga-tion.
resident Animals that remain in one region or climatethrough the year.
residium Unconsolidated and partly weathered mineralmaterials accumulated by disintegration of consolidatedrock in place.
resource A substance or object required by an organism fornormal maintenance, growth, and reproduction. If a re-source is scarce relative to demand, then it is referred to asa limited resource. Nonrenewable resources (such as space)occur in fixed amounts and can be fully utilized; renewableresources (such as food) are produced at a fixed rate withwhich the rate of exploitation attains an equilibrium.
resource production critical areas Places that provide es-sential products supporting either the local economy oreconomies of a larger scale.
restrictive agreement A type of differential assessment thatrequires a landowner to sign a contract to keep land inagricultural use for 10 years or more as a condition of eli-gibility for tax relief. If the landowner gives notice of in-tent to terminate the contract, assessed value of the prop-erty increases during the balance of the term to the full fairmarket value.
riparian Relating to a habitat on the banks of streams,rivers, and lakes.
river basin The land area drained by a river and its tribu-taries.
rubble A mass of broken stones and rocks, often at the baseof a cliff.
runoff Water from rain, snowmelt, or irrigation that flowsover the ground surface and returns to streams.
sand Soil particles between 0.05 and 2.0 millimeters in di-ameter.
scale The relative size of an area of interest. If the focus onrelatively small areas (for example, the area around ahouse or a single subdivision), the focus is fine scale. If thefocus is on a much larger area (i.e., a county or watershed),than it is a coarse scale.
scenic areas Places that contain natural features of suffi-cient aesthetic quality to warrant their preservation.
scientific areas Places of geological interest or places thatpresent ecological processes warranting study.
score This term is used for the total of all factor ratings.secondary consumer Carnivore or animals that obtain en-
ergy from other animals.second- order stream See stream orders.septic tank An enclosure in which the organic solid mat-
ter of continuously flowing wastewater is deposited andretained until it has been disintegrated by anaerobic bacteria.
service districts The division of a jurisdiction into areasbased on the level of urban and rural services, with differ-ent rates of taxation.
setback A zoning provision requiring new homes to beseparated from existing farms by a specified distance andvice versa.
shale A sedimentary rock formed from tightly packed claysand silts.
silt Fine soil particles between 0.05 and 0.002 millimeter indiameter that can be picked up by air or water and de-posited as sediment.
single- family dwelling A detached building containing onedwelling unit.
slope The incline of the land surface, usually expressed inpercentage of slope. Often slopes are expressed as follows:0–3 percent nearly level3–7 percent gently sloping7–12 percent moderately sloping12–25 percent strongly sloping25–40 percent steeply sloping40–70 percent very steeply sloping70–100 percent and above extremely steeply sloping
slope wind Winds flowing up or down slopes along a tem-perature gradient.
social Relating to human society and the interactions ofthe community.
sociocultural A combination of the social and the culturalcharacteristics of an area.
soil A natural, three- dimensional body on the surface ofthe earth that supports plants and has properties resultingfrom the integrated effect of climate and living matter act-ing upon parent material as conditioned by relief over pe-riods of time.
soil association Soils of different series found in the samearea.
soil catena A group of related soils that have developedfrom the same parent material but differ in drainage classdue to different locations on a slope.
soil depth The depth of soil material that plant roots canpenetrate readily to obtain water and nutrients. It is thedepth to a layer that, in physical or chemical properties,differs from the overlying material to such an extent as toprevent or seriously retard the growth of roots or penetra-tion of water. The depth classes are (1) very deep, more
433GLOSSARY
than 60 inches (1,500 millimeters); (2) deep, 40 to 60inches (1,000 to 1,500 millimeters); (3) moderately deep,20 to 40 inches (500 to 1,000 millimeters); (4) shallow, 10to 20 inches (250 to 500 millimeters); and (5) very shallow,1 to 10 inches (25 to 250 millimeters).
soil profile A vertical section of the soil through all its hori-zons and extending into the parent material.
soil series Soils from the same parent material having sim-ilar horizon characteristics.
soil texture The relative proportions of sand, silt, and clayparticles in a mass of soil. The basic textural classes, in or-der of increasing proportion of fine particles, are shown inthe following chart.
SOIL TEXTURE
General Terms Basic Soil Textural Class Names
Sandy soilsCoarse- textured soils SandModerately coarse- Sandy loam
textured soils Fine sandy loamLoamy soils
Medium- textured soils Very fine sandy loamLoamSilt loamSilt
Moderately fine- Clay loamtextured soils Sandy clay loam
Silty clay loamClayey soil
Fine- textured soils Sandy claySilty clayClay
soil types Soils within a series having the same texture.solar radiation The energy from the sun that reaches the
earth.solum The upper and most weathered part of the soil pro-
file; and A and B horizons.species A group of closely related organisms potentially
able to reproduce viable offspring.species diversity The number of different species occur-
ring in a location or under the same conditions.sprawl Unplanned development of open land.standard A statement that describes a condition when job
is done properly. Standards show how well somethingshould be done rather than what should be done.
strategy The approach and/or methods through whichproblems are solved or minimized and objectives areachieved.
stream A general term for a body of flowing water. In hy-drology, the term is generally applied to the water flowingin a natural channel as distinct from a canal. More gener-ally, as in the term stream gauging, it is applied to the waterflowing in any natural or artificial channel.
stream, ephemeral A stream that flows only in response toprecipitation.
stream, intermittent A stream that flows only part of thetime or through only part of its reach.
stream orders First- order streams are primary drainage-ways. Second- order streams are the confluence of twofirst- order streams. Third- order streams are the conflu-ence of two second- order streams, and so on.
stream, perennial A stream that flows continuously.street The entire width between property boundary lines
of every way that provides for public use for the purposeof vehicular and pedestrian traffic and the placement ofutilities.
strip- cropping Growing crops in a systematic arrangementof strips or bands that serve as barriers to wind and watererosion.
structures, heavy A building of generally great weight andsize, such as a mill or factory.
structures, light A building of generally slight weight andsize, such as a residence.
subdivision The division of a lot, tract, or parcel of landinto two or more lots, plats, sites, or other divisions of landfor the purpose, whether immediate or future, of sale orbuilding development.
subdivision regulation The legal requirements pertainingto the subdivision of land.
subsoil The B soil horizon; the layer of soil below the layerin which grass roots normally grow.
succession The orderly progressive replacement of onecommunity by another until a relatively stable communityoccupies an area.
suitability analysis The process of determining the fitnessof a given tract of land for a defined use. Suitability is oftenused interchangeably with capability.
surface water Water that remains on the top of land, suchas lakes, rivers, streams, and seas.
sustainability The maintenance of the health and produc-tivity of ecosystems, which provide a variety of benefitsover time.
sustainable development Development that meets theneeds of the present without compromising the ability offuture generations to meet their own needs.
swale An elongated depression in the land.synthesis The combining of all the parts to form an inter-
relating whole.taking An illegal government appropriation of private
property or property rights. Traditionally, takings law hasaddressed physical seizures of land, but regulations thatdeprive landowners of certain property rights may also re-sult in a taking in special circumstances. Courts decidewhether a particular government action constitutes a taking.
task force An agency- sponsored citizens’ committee with a
434GLOSSARY
specific task and charge usually related to a single problemor subject.
technical advisory committee (TAC) A group of individu-als with specific expertise, usually from various disci-plines, brought together by an agency for giving adviceand consultation.
temperature gradient The difference in temperature alongsome horizontal distance or up a vertical parcel of air.
terracing Dikes built along the contour of agricultural landto hold runoff and sediment, thus reducing erosion.
third- order streams See stream orders.topoclimate The term used when the topographic varia-
tions of the land on microclimate are considered.topography The physical features of a surface area, includ-
ing relative elevations and the position of natural and arti-ficial features.
town meeting The traditional New England meeting of thepeople of a town.
transfer of development rights (TDR) program A pro-gram that allows landowners to transfer the right to de-velop one parcel of land to a different parcel of land to pre-vent farmland conversion. TDR programs establish“sending areas” where land is to be protected by agricul-tural conservation easements and “receiving areas” whereland may be developed at a higher density than would oth-erwise be allowed by local zoning. Landowners in thesending area sell development rights to landowners in thereceiving area, generally through the private market.When the development rights are sold on a parcel, a con-servation easement is recorded and enforced by the localgovernment. In some cases, the local government may es-tablish a “TDR bank” to buy and sell development rights.The development rights created by TDR programs are re-ferred to as transferable development rights (TDRs) ortransferable development credits (TDCs).
transpiration The loss of water to the atmosphere fromplants.
tree A woody, perennial plant with a single main stem.trophic levels The different levels through which energy
flows from producers to consumers.understory Herbs and shrubs that grow beneath a forest
canopy.upzoning A change in the zoning for a particular area
that results in higher residential densities. For example, achange from a zoning ordinance that requires 100 acres(40.47 hectares) per dwelling to an ordinance that requires25 acres (10.1 hectares) per dwelling is an upzoning.
urban growth boundary Line to which urban areas maygrow based on population projections and physical condi-tions of the area.
urban morphology The study of the city as human habitat.USGS map U.S. Department of Interior Geological Survey
map.
valley wind Winds flowing up or down valleys along tem-perature gradients.
variance A special situation that creates a need to deviatefrom the established zoning ordinances and requires re-view by a board of adjustment or similar review agency.
vegetation Plant life: trees, shrubs, herbs, and grasses.vegetation type A classification given to plants that are
found in the same place on a landscape.ventilation The circulation of fresh air across the land,
largely dependent on land-forms and wind direction.voluntary covenants Agreements that limit what can be
done with property.wash An ephemeral stream; that is, one that flows only dur-
ing or after rainstorms. Called an arroyo in Spanish.water A transparent, odorless, tasteless liquid; a compound
of hydrogen and oxygen (H2O) that freezes at 32°F (0°C)and boils at 212°F (100°C). Most water is more or less inan impure state, and constitutes rain, oceans, lakes, rivers,and other such bodies. It contains 11.188 percent hydro-gen and 88.812 percent oxygen by weight.
water balance The ratio of water lost from a system andbrought into a system.
water quality areas Aquifer recharge areas, headwaters,stream corridors, and wetlands that function as a naturalfilter for surface waters.
watershed A drainage area separated from other drainageareas by a dividing ridge.
water table The upper surface of groundwater or that levelbelow which the soil is saturated with water.
weighted factor rating This term is used to denote the fac-tor rating after weighting.
weighting This term refers to assigning a weight (for exam-ple, 0–1.0) to each factor in order to recognize the relativeimportance of each factor.
wilderness recreation areas Isolated tracts of land that arelarge enough to support recreational activities like camp-ing, hiking, and canoeing.
wildlife Animals that are neither human nor domesticated.windchill The relationship between body heat loss and the
cooling power of different wind and temperature combi-nations.
zone An area or areas of the community or county inwhich certain land uses are permitted and other uses areprohibited by the zoning ordinance. Common zones areresidential, commercial, industrial, and agricultural.
zone change An action taken by the local governing bodyto change the type of zoning on one or more pieces ofland. For example, a zone change or rezoning could befrom A- 1, agricultural, to C- 2, medium- density commer-cial. A zone change for specific properties can happen intwo ways. A property owner may ask for a zone change,which is a quasi- judicial action. Otherwise, either theplanning commission or the governing body may seek a
435GLOSSARY

zone change through a legislative action. If a zone changeis approved, the zoning map must also be amended. Somezone changes may require amending the comprehensiveplan map.
zoning Land- use controls such as limiting the use to which
land in each area may be put, minimum lot size, andbuilding types.
zoning ordinance The legal document establishing the di-vision of a municipality or other governmental unit intodistricts and the regulation within those districts.
436GLOSSARY
ACRONYMS
437
ADEQ Arizona Department of Environmental QualityAMA Active management areasAPR Agricultural preservation restrictionAPZ Agricultural protection zoningASCS Agricultural Stabilization and Conservation
ServiceASLD Arizona State Lands DepartmentBLM Bureau of Land ManagementCABO Council of American Building OfficialsCAC Citizens’ Advisory CommitteeCAD Computer- aided designCAP Central Arizona ProjectCC & Rs Codes, covenants, and restrictionsCEQ Council on Environmental QualityCIP Capital improvement programmingCMSA Consolidated metropolitan statistical areaCRS Community Rating SystemCSR Crop suitability rating (corn suitability rating)CWA Clean Water ActCZMA Coastal Zone Management ActDEM Digital elevation modelDLCD Department of Land Conservation and Devel-
opment (Oregon)DLG Digital line graphDOE Department of Ecology (Washington)DPZ Duany and Plater- ZyberkEIS Environmental impact statementEPA Environmental Protection AgencyERZ Environmental resource zoneESA Endangered Species ActESLO Environmentally sensitive lands ordinanceEU European UnionFAA Federal Aviation AdministrationFEMA Federal Emergency Management AgencyFIRM Flood Insurance Rate MapFPPA Farmland Protection Policy Act
FTE Full- time equivalent employmentGAO U.S. General Accounting OfficeGAP Gap Analysis ProgramGIS Geographic information systemsGMA Groundwater Management ActHCA Habitat conservation areasHCP Habitat conservation planHSI Habitat suitability indexICBO International Conference of Building OfficialsLCDC Land Conservation and Development Commis-
sion (Oregon)LE Land evaluationLESA Agricultural Land Evaluation and Site Assess-
ment SystemMAG Maricopa Association of Governments
(Arizona)MLRA Major land resource areaMSA Metropolitan statistical areaNECMA New England County Metropolitan AreaNEPA National Environmental Policy ActNFIP National Flood Insurance ProgramNGO Nongovernmental organizationNOAA National Oceanic and Atmospheric
AdministrationNPDES National Pollution Discharge Elimination
SystemNPS National Park ServiceNRCS Natural Resources Conservation ServicePACE Purchase of agricultural conservation easementsPCD Planned community districtPDR Purchase of development rightsPMSA Primary metropolitan statistical areaPPBS Planning, programming, and budget systemPRD Planned residential districtPRLD Phoenix Parks, Recreation, and Library
Department
PUD Planned unit developmentRGGO Regional Growth Goal and ObjectiveRPA Regional Plan AssociationRUSLE Revised universal soil loss equationSA Site assessmentSBC Standard Building CodeSCS Soil Conservation ServiceSEPA State Environmental Policy ActSHPO State historic preservation officerSIC Standard Industrial ClassificationSMSA Standard metropolitan statistical areaTAC Technical Advisory CommitteeTAZ Traffic analysis zonesTDC Transferable development credit
TDM Donald Dillman’s total design methodTDR Transfer of development rightsUBC Uniform Building CodeUGB Urban growth boundaryUNESCO United Nations Educational, Scientific, and Cul-
tural OrganizationUSDA U.S. Department of AgricultureUSFS U.S. Forest ServiceUSFWS U.S. Fish and Wildlife ServiceUSGS U.S. Geological SurveyUSLE Universal soil loss equationWCED World Commission on Environment and
Development
438ACRONYMS

BIBLIOGRAPHY
439
Abbott, Carl. 1994. Settlement patterns in the Portland re-gion: a historical overview (January). Portland, Oregon:Metro.
Abercrombie, P., and T. H. Johnson. 1922. The Doncasterplanning scheme. London: University Press of Liverpool.
Aberley, Doug (ed.). 1994. Futures by design: the practice ofecological planning. Gabriola Island, British Columbia:New Society Publishers.
Adams, Rob, Bill Chandler, Wendy Morris, and Bruce Ech-berg. 1993. “Urban villages workshop, Western Australiastyle.” Urban Design Forum 23:1.
Adams, Thomas. 1934. The design of residential areas. Cam-bridge, Massachusetts: Harvard University Press.
Ahern, Jack. 1995. “Greenways as a planning strategy.” Land-scape and Urban Planning 33:131–155.
Alesch, Richard. 1987. “Evaluating and managing culturallandscapes in the national park system.” In Aesthetics of therural renaissance conference proceedings. San Luis Obispo,California: California Polytechnic State University.
Alinsky, Saul D. 1946. Reveille for radicals. Chicago, Illinois:University of Chicago Press.
Alvarez, Leonardo, Jorge Hernández, Cathy Leff, DanielWilliams, Juan Antonio Bueno, Joseph Dillion Ford, Eliza-beth Plater- Zyberk, Sonia Cháo, and Richard Wes lund(eds.). No date. The new South Dade planning charrette:from adversity to opportunity. Coral Gables, Florida: Uni-versity of Miami School of Architecture.
American Farmland Trust. 1986. Density- related public costs.Washington, D.C.
American Farmland Trust. 1997. Saving American farm-land: what works. Northampton, Massachusetts: AmericanFarmland Trust.
American Law Institute. 1974. A model land developmentcode. Philadelphia, Pennsylvania.
Anderson, James R., Ernest E. Hardy, John T. Roach, andRichard E. Witmer. 1976. A land use and land cover classifi-
cation system for use with remote sensor data (U.S. Geolog-ical Survey Professional Paper 964).
Andres, Chris, Jodie Brown, Donna Gadbois, Matt Jennings,and Kasandra Torres. 1998. “Recovering the urban fron-tier: Phoenix brownfield and underutilized land study”(studio class project). Tempe, Arizona: Arizona State Uni-versity School of Planning and Landscape Architecture.
Ansbro, John, Joseph Bell, Meghan Gallione, Karen Kar-powich, Johnny Patta, Michael Reis, Gretchen Schalge,Maria Valdez, and David Wood. 1988. “Ecological inven-tory and analysis, Teller County, Colorado” (studio classproject). Denver, Colorado: University of Colorado Schoolof Architecture and Planning.
Antenucci, John C., Kay Brown, Peter L. Croswell, Michael J.Kevany, with Hugh Archer. 1991. Geographic informationsystems: a guide to the technology. New York: Van NostrandReinhold.
Arendt, Randall G. 1996. Conservation design for subdivisions:a practical guide to creating open space networks. Washing-ton, D.C.: Island Press.
Arizona Department of Commerce. 1998. Growing smarterlegislation: a summary for cities and towns. Phoenix, Ari-zona: Community Planning Program, Community Assis-tance Division.
Bagley, Anubhav, Ann Bonnette, Jim Haklik, Harold Housley,Jim McCarthy, and Lizi McGeorge. 1995. “Draft environ-mental impact statement, northeast portion of peripheralareas C and D, Phoenix, Arizona” (class project). Tempe,Arizona: Arizona State University School of Planning andLandscape Architecture.
Balling, Robert C., and Sandra W. Brazel. 1987. “Time andspace characteristics of the Phoenix urban heat island.”Journal of the Arizona- Nevada Academy of Science 21:75–81.
Barnhart, Clarence L. (ed.). 1953. The American college dic-tionary. New York: Harper & Brothers.
Barron, James C. 1975. Transferable development rights (E.M.3939). Pullman, Washington: Washington State UniversityCooperative Extension Service.
Bartelli, L. J., A. A. Klingebiel, J. V. Baird, and M. R. Heddle-ston (eds.). 1966. Soil surveys and land- use planning.Madison, Wisconsin: Soil Science Society of America.
Beach, Richard, Don Benson, Dave Brunton, Karen L. John-son, Julie Knowles, Joanne Michalovic, Harry GeorgeNewman, Betsy J. Tripp, and Cheryl Wunschel. 1978.Asotin County ecological inventory and land- use suitabilityanalysis. Pullman, Washington: Washington State Univer-sity Cooperative Extension Service.
Beatley, Timothy. 1994a. Habitat conservation planning: en-dangered species and urban growth. Austin, Texas: Univer-sity of Texas Press.
Beatley, Timothy. 1994b. Ethical land use: principles and pol-icy of planning. Baltimore, Maryland: Johns Hopkins Uni-versity Press.
Beatley, Timothy, and Kristy Manning. 1997. The ecology ofplace: planning for environment, economy, and community.Washington, D.C.: Island Press.
Beek, K. J. 1978. Land evaluation for agricultural development(Publication 23). Wageningen, The Netherlands: Interna-tional Institute for Land Reclamation and Improvement.
Beeman, Larry E. 1978. “Computer- assisted resource man-agement.” In Integrated inventories of renewable natural re-sources: proceedings of the workshop, H. G. Lund, V. J.LaBau, P. F. Ffolliot, and D. W. Robinson eds., pp. 375–381.Tucson, Arizona: U.S. Forest Service.
Belknap, Raymond K., and John G. Furtado. 1967. Three ap-proaches to environmental resource analysis. Washington,D.C.: The Conservation Foundation.
Belknap, Raymond K., and John G. Furtado. 1968. “The nat-ural land unit as a planning base, Hills, Lewis, McHargmethods compared.” Landscape Architecture 58(2):145–147.
Bell, Joseph, Meghan Gallione, Gretchen Schalge, and DavidWood. 1989. “Visions for the Teller County landscape”(studio class project). Denver, Colorado: University ofColorado School of Architecture and Planning.
Bennington County Regional Commission. 1994. Regionalforest land evaluation and site assessment for the TaconicMountains. Bennington, Vermont.
Bentham, Jeremy. 1887. Theory of legislation (5th ed.).Berger, Jon, Arthur Johnson, Dan Rose, and Peter Skaller.
1977. Regional planning notebook (course guidelines).Philadelphia, Pennsylvania: University of PennsylvaniaDepartment of Landscape Architecture and RegionalPlanning.
Berger, Jonathan, and John W. Sinton. 1985. Water, earth, and fire. Baltimore, Maryland: Johns Hopkins UniversityPress.
Berry, Wendell. 1972. A continuous harmony, essays culturaland agricultural. New York: Harcourt Brace Jovanovich.
Blumm, Michael C., and D. Bernard Zaleha. 1989. “Federalwetlands: protection under the clean water act: regulatoryambivalence, intergovernmental tension, and a call for re-form.” University of Colorado Law Review 60(4):695–772.
Bolan, Richard S. 1979. “Social planning and policy develop-ment.” In The practice of local government planning, FrankS. So, Israel Stollman, Frank Beal, and David S. Arnoldeds., pp. 521–551. Washington, D.C.: International CityManagement Association.
Bosselman, Fred, and David Callies. 1971. The quiet revolu-tion in land use control. Washington, D.C.: U.S. Govern-ment Printing Office.
Bosselman, Fred, David Callies, and John Banta. 1973. Thetaking issue. Washington, D.C.: U.S. Government PrintingOffice.
Botkin, D. B., and C. E. Beveridge. 1997. “Cities as environ-ments.” Urban Ecosystems 1:3–19.
Botkin, D. B., and Edward A. Keller. 1998. Environmental sci-ence: earth as a living planet (2nd ed.). New York: John Wi-ley & Sons.
Bowen, Richard L., and Carol Ferguson. 1994. “Hawaii’sLESA experience in a changing policy environment.” In Adecade with LESA: the evolution of land evaluation and siteassessment, Frederick Steiner, James Pease, and RobertCoughlin eds., pp. 160–177. Ankeny, Iowa: Soil and WaterConservation Society.
Bowie, Robert, Cathy Chin, Jim Estus, Rita Gerou, BruceGuerard, Jeff Hardcastle, George Hernandez, Judith Kari-nen, and Susan Maxberry. 1988. “Woodland Park, Col-orado: ecological inventory and analysis” (studio classproject). Denver, Colorado: University of Colorado Schoolof Architecture and Planning.
Boyden, Stephen. 1979. An integrative ecological approach tothe study of human settlements (MAB Technical Notes 12).UNESCO, Paris.
Boyer, Ernest. 1990. Scholarship reconsidered: priorities of theprofessoriate. Princeton, New Jersey: Carnegie Foundation.
Brady, Nyle C. 1974. The nature and properties of soils (8thed.). New York: MacMillan.
Brady, Nyle C., and Raymond R. Weil. 1996. The nature andproperty of soils (11th ed.). Upper Saddle River, New Jersey:Prentice- Hall.
Brady, Ward, Michael Collins, Jana Fry, Jack Gilcrest, WilliamMiller, Nancy Osborn, and Frederick Steiner. 1998. A geo-graphic information system application for park planning inthe Desert View Tri- Villages Area, City of Phoenix. A reportfor the Parks, Recreation, and Library and InformationTechnology Departments, City of Phoenix. Tempe, Ari-zona: Arizona State University School of Planning andLandscape Architecture.
Brazel, Anthony J. 1993. “The role of climatology in environ-ment.” Invited paper presentation, Indian Town Hall An-nual Meeting. Tempe, Arizona: Arizona State UniversityDepartment of Geography.
440BIBLIOGRAPHY
Brazel, Anthony J. 1998. “Surface climate and remote sensingof Scottsdale, Arizona.” Tempe, Arizona: Arizona StateUniversity Department of Geography.
Briggs, Mark K. 1996. Riparian ecosystem recovery in aridlands: strategies and references. Tucson, Arizona: Universityof Arizona Press.
Brinkman, R., and A. J. Smyth (eds.). 1973. Land evaluationfor rural purposes (Publication 17). Wageningen, TheNetherlands: International Institute for Land Reclamationand Improvement.
Brinson, M. M., L. Swift, C. Plantico, and S. Barclay. 1981.“Riparian ecosystems: their ecology and status.”FWS/OBS- 81/17. Washington, D.C.: U.S. Fish and WildlifeService.
Broderson, William D. 1994. From the surface down: an in-troduction to soil surveys for agronomic use. Washington,D.C.: Soil Conservation Service, U.S. Department of Agri-culture.
Brown, David E. 1982. “Biotic communities of the AmericanSouthwest—United States and Mexico.” Desert Plants 4(1–4):3–341.
Brown, S., M. M. Brinson, and A. E. Lugo. 1978. “Structureand function of riparian wetlands.” In Strategies for protec-tion and management of floodplain wetlands and other ri-parian ecosystems: proceedings, R. R. Johnson and J. F. McCormick technical coordinators, pp. 17–31. USDA, FS, GTR- WO- 12. Washington, D.C.: U.S. Department ofAgriculture.
Brunton, Dave, Theda Scheibner, Jill Stanton, Tom Blan-chard, and Julie Knowles. 1977. “Albion ecological inven-tory” (class project). Pullman, Washington: WashingtonState University Department of Horticulture and Land-scape Architecture and Program in Environmental Scienceand Regional Planning.
Budoni, A., and S. Macchi. 1998. “An analytical model for de-signing territorial sustainability: reality as a socio- technical network” (unpublished paper). Roma, Italia: Di-partimento di Architettura e Urbanistica per l’Ingegneria,Università degli Studi di Roma “La Sapienza.”
Bureau of Land Management. 1980. Visual resources pro-gram. Washington, D.C.: U.S. Department of Interior.
Burke, James, and Joseph Ewan. 1998a. Sonoran preservemaster plan. Phoenix, Arizona: Department of Parks,Recreation, and Library.
Burke, James, and Joseph M. Ewan. 1998b. “Sonoran desertpreservation: an open space plan for the City of Phoenix,Arizona.” In 1998 Annual meetings proceedings of the Amer-ican Society of Landscape Architects, pp. 98–102. Washing-ton, D.C.: American Society of Landscape Architects.
Burns, Elizabeth K., and Dudley Onderdonk. 1993. “Urbangrowth and environmental protection at the local level.” InGrowth management: the planning challenge of the 1990s,Jay Stein ed., pp. 129–142. Newbury Park, California: SagePublications.
Buskirk, E. Drannon, Jr. 1986. “Environmental impact analy-sis.” In The practice of state and regional planning, Frank S.So, Irving Hand, and Bruce D. McDowell eds., pp. 238–254. Chicago, Illinois: American Planning Association.
Butler, Stuart M. 1981. “Enterprise zone theorist calls for un-planning.” Planning 47(2):6.
Caldwell, Lynton Keith, and Kristin Shrader- Frechette. 1993.Policy for land: law and ethics. Lanham, Maryland: Row-man & Littlefield.
Callies, David L. 1980. “The quiet revolution revisited.” Jour-nal of the American Planning Association 46(2):135–144.
Calthorpe, Peter. 1993. The next American metropolis: ecology,community and the American dream. Princeton, New Jer-sey: Princeton Architectural Press.
Calthorpe, Peter, Michael Corbett, Andres Duany, ElizabethPlater- Zyberk, Stefanos Polyzoides, Elizabeth Moule withJudy Corbett, Peter Katz, and Steve Weissman. 1998. “TheAhwahnee Principles.” In Creating sustainable places sym-posium, Audrey Brichetto Morris ed., pp. 3–6. Tempe, Ari-zona: Herberger Center for Design Excellence, ArizonaState University.
Camp, Philip D. 1986. Soil survey of Aguila—Carefree Area,parts of Maricopa and Pinal Counties, Arizona. Washing-ton, D.C.: U.S. Government Printing Office.
Canham, Ronald R. 1979. Interagency coordination and rapidcommunity growth (WREP 22). Corvallis, Oregon: West-ern Rural Development Center, Oregon State University.
Cannon, T. M., and B. R. Hunt. 1981. “Image processing bycomputer.” Scientific American 245(4):214–225.
Canter, Larry W. 1996. Environmental impact assessment(2nd ed). New York: McGraw- Hill.
Caraher, Pat. 1998. “New Palouse recreation trail links uni-versity communities.” Hilltopics (August):19.
Carlson, Christine, and Dennis Canty. 1986. A path for thePalouse. Seattle, Washington: National Park Service, U.S.Department of Interior.
Carlson, Christine, Dennis Canty, Frederick Steiner, andNancy Mack. 1989. “A path for the Palouse: an example ofconservation and recreation planning.” Landscape and Ur-ban Planning 17(1):1–19.
Carlson, Frances C. 1988. The history of the Desert Foothills.Scottsdale, Arizona: Encanto Press.
Carsjens, Gerrit J., and Jam F. J. M. Smits. 1997. “Topograph-ical relationships integrated in land use allocation.” Geo-graphic Information 758–767.
Carsjens, Gerrit J., and Wim G. M. van der Knaap. 1996.“Multi- criteria techniques integrated in GIS applied forland use allocation problems.” Geographic Information575–578.
Carson, Richard H. 1998. Paying for our growth in Oregon.Beaverton, Oregon: New Oregon Meridan Press.
Catton, William. 1983. “Social and behavioral aspects ofthe carrying capacity of natural environments.” In Behaviorand natural environment (Vol. VI of Human behavior and
441BIBLIOGRAPHY
environment), Irwin Altman and Joachim F. Wohwill eds.,pp. 269–306. New York: Plenum.
Center for Natural Areas, Smithsonian Institution. 1974.Planning conservation for statewide inventories of criticalareas: a reference guide, report 3. Washington, D.C.: U.S.Army Corps of Engineers.
Chapin, F. Stuart, and Edward J. Kaiser. 1979. Urban land useplanning. Urbana, Illinois: University of Illinois Press.
Chronic, Halka. 1983. Roadside geology of Arizona. Missoula,Montana: Mountain Press.
Ciekot, Stephanie, Carol Hayden, Carlos Licón, Gary Mason,Jim McCarthy, and Jane Ploeser. 1995. “Desert View Tri- Villages, ecological inventory and analysis” (studio classproject). Tempe, Arizona: Arizona State University Schoolof Planning and Landscape Architecture.
City of Dayton. 1995. Policy budget. Dayton, Ohio: Office ofManagement and Budget.
City of Everett, 1994. Environmental policy. Everett, Wash-ington.
City of Lakewood. 1988a. West Colfax Avenue design guide-lines. Lakewood, Colorado: Planning Division.
City of Lakewood. 1988b. West Colfax Avenue pedestrianstreetscape demonstration project. Lakewood, Colorado:Planning Division.
City of Lakewood. 1997. Wadsworth Boulevard strategic plan.Lakewood, Colorado: Strategic Planning Division.
City of Lakewood, and City and County of Denver. 1993.West Colfax revitalization plan. Lakewood, Colorado,Planning Commission and Denver, Colorado, PlanningBoard.
City of Phoenix. 1987. General plan: peripheral areas C andD. Phoenix, Arizona: Planning Department.
City of Phoenix. 1994. Desert View Tri- Villages scenic corridordesign charrette summary report. Phoenix, Arizona.
City of Phoenix. 1995. Phoenix growth. Phoenix, Arizona:Planning Department.
City of Phoenix. 1996. North land use plan (draft). Phoenix,Arizona: Planning Department.
City of Phoenix. 1997a. North land use plan. Phoenix, Ari-zona: Planning Department.
City of Phoenix. 1997b. North Black Canyon corridor conceptplan. Phoenix, Arizona: Planning Department.
City of Phoenix, and ASU. 1989. Camelback east primary coreurban design charrette team report. Tempe, Arizona: JointASU–City of Phoenix Urban Design Studio.
City of Scottsdale. 1991a. ESLO users’ manual. Scottsdale,Arizona.
City of Scottsdale. 1991b. Environmentally sensitive lands or-dinance citizen’s guide. Scottsdale, Arizona.
City of Scottsdale. 1991c. Approved environmentally sensitivelands ordinance. Scottsdale, Arizona.
City of Tucson. 1991. “Watercourse amenities, safety, andhabitat.” Ordinance No. 7579. Article VIII. Tucson, Arizona.
City of Tucson. 1994. “Watercourse amenities, safety, andhabitat.” Ordinance No. 8303. Article VIII. Tucson, Arizona.
City of Tucson. 1998. “Overlay zones, environmental re-source zone (ERZ).” Land use code, Article II. Zones, Divi-sion 8. Tucson, Arizona.
City of Woodland Park. 1996. Master plan. Woodland Park,Colorado.
Clark, Janice M. 1977. “Agricultural zoning in Black HawkCounty, Iowa.” In Land use: tough choices in today’s world,pp. 149–154. Ankeny, Iowa: Soil Conservation Society ofAmerica.
Collins, Michael G. 1996. An integrative approach to multi- objective greenway suitability analysis (unpublished masterof environmental planning thesis). Tempe, Arizona: Ari-zona State University School of Planning and LandscapeArchitecture.
Collins, Michael G., Frederick R. Steiner, and MichaelRushman. 2000. “Land- use suitability analysis in theUnited States.” Tempe, Arizona: Arizona State UniversitySchool of Planning and Landscape Architecture.
Condon, Patrick (ed.). 1996. Sustainable urban landscapes: thesurrey design charrette. Vancouver, British Columbia: Uni-versity of British Columbia Press.
Conn, William J. 1984. “Techniques for protecting primeagricultural land, zoning applications in York County,Pennsylvania.” In Protecting farmlands, Frederick Steinerand John Theilacker eds., pp. 97–108. Westport, Connecti-cut: AVI Publishing.
Conway, Eric D., and the Maryland Space Grant Consor-tium. 1997. An introduction to satellite image interpreta-tion. Baltimore, Maryland: Johns Hopkins UniversityPress.
Cook, Edward, William Whitmore, and Frederick Steiner.1991. Verde Valley visual assessment: Verde River corridorstudy, Tapco to Beasley Flat. Phoenix, Arizona: ArizonaState Parks.
Cooke, Stephen, Bruce Weber, and George Goldman. 1996.Evaluating fiscal impact studies: community guidelines(WREP 16). Corvallis, Oregon: Western Rural Develop-ment Center, Oregon State University.
Coombs, Donald B., and J. Thie. 1979. “The Canadian landinventory system.” In Planning the uses and the manage-ment of the land, Marvin T. Beatty, Gary W. Petersen, andLester R. Swindale eds., pp. 909–933. Madison, Wisconsin:American Society of Agronomy, Crop Science Society ofAmerica, and Soil Science Society of America.
Coomer, Dawn. 1995. Peripheral areas C and D resourceguide. Phoenix, Arizona: City of Phoenix Planning Department.
Cooper, D., K. Mutz, B. Van Daveren, A. Allen, and G. Jacob.1990. Intermountain riparian lands evaluation methodol-ogy (draft). Washington, D.C.: U.S. Environmental Protec-tion Agency.
442BIBLIOGRAPHY
Corbett, Marjorie J. (ed.). 1983. Greenline parks. Washington,D.C.: National Parks and Conservation Association.
Coughlin, Robert E., and John C. Keene (senior authors andeds.). 1981. The protection of farmland: a reference guide-book for state and local governments (National AgriculturalLands Study). Washington, D.C.: U.S. Government Print-ing Office.
Coughlin, Robert E., James R. Pease, Frederick Steiner, LyssaPapazian, Joyce Ann Pressley, Adam Sussman, and John C.Leach. 1994. “The status of state and local LESA pro-grams.” Journal of Soil and Water Conservation 49(1):7–13.
Council on Environmental Quality. 1986. “Environmentalimpact statement.” Code of federal regulations 40. Ch. V (7- 1- 86 ed.).
Cowardin, Lewis M., Virginia Carter, Francis C. Golet, and Edward T. LaRoe. 1979. Classification of wetlands and deepwater habitats in the United States. Washington,D.C.: U.S. Department of Interior, Fish and Wildlife Service.
Crane, Laura Priedeman, Michelle M. Manion, and Karl F.Spiecker. 1996. A cost of community services study of ScioTownship. Ann Arbor, Michigan: Potawatomi Land Trust.
Creighton, James L. 1992. Involving citizens in community de-cision making: a guidebook. Washington, D.C.: Program forCommunity Problem Solving.
Cullingworth, Barry. 1997. Planning in the USA: policies, is-sues and processes. London: Routledge.
Dahl, T. E. 1990. Wetlands losses in the United States 1780s to1980s. Washington, D.C.: U.S. Fish and Wildlife Service.
D’Ambrosi, C., and T. D. Thomas. 1993. “Urban design andenergy efficiency in downtown South Miami: building onthe charrette process.” Environmental and Urban Issues:Florida 20, 3.
Daniels, Tom. 1999. When city and county collide: managinggrowth in the metropolitan fringe. Washington, D.C.: IslandPress.
Daniels, Tom, and Deborah Bowers. 1997. Holding ourground: protecting America’s farms and farmland. Washing-ton, D.C.: Island Press.
Daniels, Tom, and Arthur C. Nelson. 1986. “Is Oregon’sfarmland preservation program working?” Journal of theAmerican Planning Association 52(1):22–32.
Daniels, Tom, and David E. Reed. 1988. “Agricultural zoningin a metropolitan county: an evaluation of the Black HawkCounty, Iowa program.” Landscape and Urban Planning16(4):303–310.
Davidoff, Paul, and Thomas Reiner. 1962. “A choice theory ofplanning.” Journal of the American Institute of Planners28(May):103–115.
Davis, Paul E., Norbert Lerch, Larry Tornes, JosephSteiger, Neil Smeck, Howard Andrus, John Trimmer,and George Bottrell. 1976. Soil survey of MontgomeryCounty, Ohio. Washington, D.C.: Soil ConservationService, U.S. Department of Agriculture.
De Chiara, Joseph, and Lee Koppelman. 1975. Urban plan-ning and design criteria. New York: Van Nostrand Rein-hold.
deFranceaux, Cynthia. 1987. “National Park Service plan-ning.” Trends 24(2):13–19.
DeGrove, John M. 1984. Land, growth and politics. Chicago:Planners Press.
DeGrove, John M., 1992. The new state frontier for land- usepolicy: planning and growth management in the States.Cambridge: Massachusetts: Lincoln Institute of Land Policy.
DeGrove, John M., 1998. “State responses to urban growth:lessons for Arizona.” In Growth in Arizona: the machine inthe garden, John Stuart Hall, N. Joseph Cayer, and NancyWelch eds., pp. 85–94. Tempe, Arizona: Morrison Institutefor Public Policy, Arizona State University.
Delbecq, André L., Andrew H. Van de Ven, and David H.Gustafson. 1975. Group techniques for program planning, aguide to nominal group and Delphi processes. Glenview, Illi-nois: Scott, Foresman.
Department of Land Conservation and Development. 1996.Oregon’s statewide planning goals & guidelines. Salem, Oregon.
Desert View Village Planning Committee. 1998. Desert char-acter overall districts, desert preserve overlay sub- districts A& B. Phoenix, Arizona: Planning Department.
Design Workshop. 1995. Desert spaces: an open space plan forthe Maricopa Association of Governments. Phoenix, Ari-zona: Maricopa Association of Governments.
De Vellis, Robert F. 1991. Scale development: theory and appli-cation. Newbury Park, California: Sage.
Dickert, Thomas, and Robert B. Olshansky. 1986. “Eval-uating erosion susceptibility for land- use planning incoastal watersheds.” Coastal Zone Management 13(3⁄4):309–333.
Dickert, Thomas, and Andrea E. Tuttle. 1985. “Cumulativeimpact assessment in environmental planning, a coastalwetland watershed example.” Environmental Impact As-sessment Review 5:37–64.
Dideriksen, Raymond I. 1984. “SCS important farmlandsmapping program.” In Protecting farmlands, FrederickSteiner and John Theilacker eds., pp. 233–240. Westport,Connecticut: AVI Publishing.
Dillman, Don A. 1977. “Preference surveys and policy deci-sion: our new tools need not be used in the same old ways.”Journal of the Community Development Society 8(1):30–43.
Dillman, Don A. 1978. Mail and telephone surveys, the totaldesign method. New York: Wiley- Interscience.
Domack, Dennis. 1981. The art of community development.Madison, Wisconsin: University of Wisconsin- Extension.
Donahue, Roy, Raymond W. Miller, and John C. Schickluna.1977. Soils: an introduction to soils and plant growth. En-glewood Cliffs, New Jersey: Prentice- Hall.
Doornkamp, John C. 1982. “The physical basis for planning
443BIBLIOGRAPHY
in the Third World, IV: regional planning.” Third WorldPlanning Review 4(2):111–118.
Duane, Timothy P. 1996. “Human settlement, 1850–2040.” InSierra Nevada ecosystem project: final report to Congress,Vol. II: Assessments and scientific basis for management op-tions, pp. 235–360. Davis, California: University of Califor-nia Centers for Water and Wildland Resources.
Duchhart, Ingrid. 1989. Manual on environment and urbandevelopment. Nairobi, Kenya: Ministry of Local Govern-ment and Physical Planning.
Duerksen, Christopher J., Donald L. Elliot, N. ThompsonHobbs, Erin Johnson, and James R. Miller. 1997. Habitatprotection planning: where the wild things are. Chicago, Illi-nois: American Planning Association.
Dunford, Richard W. 1984. “Property tax relief programs topreserve farmlands.” In Protecting farmlands. FrederickSteiner and John Theilacker eds., pp. 183–194. Westport,Connecticut: AVI Publishing.
Dunne, Thomas, and Luna B. Leopold. 1978. Water in envi-ronmental planning. New York: W. H. Freeman.
Easter, William K., John A. Dixon, and Maynard M. Huf-schmidt (eds.). 1986. Watershed resource management.Boulder, Colorado: Westview Press.
Easterbrook, Don J. 1999. Surface processes and landforms(2nd ed.). Upper Saddle River, New Jersey: Prentice- Hall.
Eber, Ronald. 1984. “Oregon’s agricultural land protectionprogram.” In Protecting farmlands, Frederick R. Steinerand John E. Theilacker eds., pp. 161–171. Westport, Con-necticut: AVI Publishing Company.
Eber, Ronald. 1999. (Telephone interview, 13 January.)Salem, Oregon: Department of Land Conservation andDevelopment.
Eliot, Charles. 1902. Charles Eliot, landscape architect.Boston, Massachusetts: Houghton, Mifflin.
Emory, Benjamin R. 1985. “Report on 1985 national surveyof government and non- profit easement programs: execu-tive summary.” Land Trusts’ Exchange 4(3):2.
En Charrette Exhibition of Selected Projects from the Schoolof Architecture, University of Illinois at Urbana- Champaign. 1993. Reflections 9, 58.
Environmental Reporter. 1990. “Federal wetland conservationpolicy may collide with constitutional rights.” 21(19):377–378.
Erickson, Donna L. 1995. “Rural land- use and land- coverchange: implications for local planning in the River Raisinwatershed (USA).” Land Use Policy 12:223–236.
Ewan, Joseph, Rebecca Fish Ewan, John Brock, MatthewBucchin, Jill Cohen, Nancy Osborne, and Laura Sy-chowski. 1998. North Phoenix wash vegetation study.Tempe, Arizona: Herberger Center for Design Excellence,Arizona State University.
Ewan, Joseph, Rebecca Fish Ewan, Timothy Craig, and SamScheiner. 1996. Cave Creek wash preservation boundary
study. Tempe and Phoenix, Arizona: School of Planningand Landscape Architecture of Arizona State University- Main, and Life Sciences Department of Arizona State Uni-versity- West.
Faas, Ronald C. 1980. What does the impact statement sayabout economic impacts? (WREP 31). Corvallis, Oregon:Western Rural Development Center, Oregon State Univer-sity.
Faas, Ronald C., and Dave Holland. 1994. Economic impacts:what an impact statement says (WREP 31). Corvallis, Ore-gon: Western Rural Development Center, Oregon StateUniversity.
Fabos, Julius Gy., 1979. Planning the total landscape. Boulder,Colorado: Westview Press.
Fabos, Julius Gy., and Jack Ahern (eds.). 1996. Greenways: thebeginnings of an international movement. Amsterdam, TheNetherlands: Elsevier.
Fabos, Julius Gy., and Stephanie J. Caswell. 1977. Compositelandscape assessment: assessment procedures for special re-sources hazards, and development suitability. Research Bul-letin Number 637. Amherst, Massachusetts: MassachusettsAgricultural Experiment Station, University of Massachu-setts.
Fabos, Julius Gy, C. M. Green, and S. A. Joyner. 1978. TheMETLAND landscape planning process: composite land-scape assessment. Alternative plan formulation and planevaluation. Part 3, metropolitan landscape planning model.Amherst, Massachusetts: Massachusetts Agricultural Ex-perimental Station.
Falini, Paola E. 1997. “Il territorio storico di Assisi: ‘una de-scrizione di sfondo’ per il nuovo PRG.” Rassegina di Ar-chitettura and Urbanistica 80:140–156.
Falini, Paola E., Cristina Grifoni, and Annarita Lomoro.1980. “Conservation planning for the countryside: a pre-liminary report of an experimental study of the TerniBasin (Italy).” Landscape Planning 7:345–367.
Fletcher, W. Wendell. 1978. Agricultural land retention: ananalysis of the issue. A study of recent state and local farm-land retention programs and discussion of proposed federallegislation. Washington, D.C.: Congressional ResearchService, Library of Congress.
Flint, Richard F., and Brian J. Skinner. 1974. Physical geology.New York: John Wiley & Sons, Inc.
Fogleman, Valerie M. 1990. Guide to the National Environ-mental Policy Act: interpretations, applications, and compli-ance. New York: Quorum Books.
Food and Agriculture Organization of the United Nations.1977. A framework for land evaluation (Publication 22).Wageningen, The Netherlands: International Institute forLand Reclamation and Improvement.
Forester, John. 1982. “Understanding planning practice: anempirical, practical, and normative account.” Journal ofPlanning Education and Research 1(2):59–71.
444BIBLIOGRAPHY
Forman, Richard T. T. 1995. Land mosaics: the ecology of land-scapes and regions. Cambridge, England: Cambridge Uni-versity Press.
Forman, Richard T. T., and Michel Godron. 1986. Landscapeecology. New York: John Wiley & Sons.
Forshaw, J. H., and Patrick Abercrombie. 1943. County ofLondon plan. London: MacMillan.
Fowler, Floyd J. 1993. Survey research methods (2nd ed.).Newbury Park, California: Sage.
Fox, Jeff. 1987. “Two roles for natural scientists in the man-agement of tropical watersheds: examples from Nepal andIndonesia.” Environmental Professional 9:59–66.
Friedmann, John. 1973. Retracking America. Garden City,New York: Anchor Press/Doubleday.
Fry, Jana, Frederick Steiner, and Douglas Green. 1994. “Ri-parian evaluation and site assessment in Arizona.” Land-scape and Urban Planning 28(2–3):179–199.
Gans, Herbert J. 1967. The Levittowners. New York: RandomHouse.
Gans, Herbert J., 1968. People and plans. New York: BasicBooks.
Gans, Herbert J., 1993. People, plans, and policies. New York:Columbia University Press.
Geiger, Rudolph. 1965. The climate near the Grand (translatedfrom the German by Scripta Technica, Inc.). Cambridge,Massachusetts: Harvard University Press.
Gelfand, Donna Issac. 1992. “Citizen participation in envi-ronmental decisionmaking: a study of two Arizona cities”(unpublished master of environmental planning thesis).Tempe, Arizona: Arizona State University Department ofPlanning.
Gibson, Lay James. 1975. “Local impact analysis: an Arizonacase study.” Arizona Research 24(1):1–10.
Gil, Efraim, and Enid Lucchesi. 1979. “Citizen participationin planning.” In The practice of local government planning,Frank S. So, Israel Stollman, Frank Beal, and David S.Arnold eds., pp. 552–575. Washington, D.C.: InternationalCity Management Association.
Glikson, Artur. 1971. The ecological basis of planning. TheHague, The Netherlands: Matinus Nijhoff.
Gober, Patricia. 1998. “The demographics of urban growthin Phoenix.” In Growth in Arizona: the machine in the gar-den, John Stuart Hall, N. Joseph Cayer, and Nancy Welcheds. Tempe, Arizona: Morrison Institute, Arizona StateUniversity.
Golley, Frank B. 1998. A primer for environmental literacy.New Haven, Connecticut: Yale University Press.
Goodchild, Michael F., Bradley Parks, and Louis Steyaert(eds.). 1993. Environmental modeling with GIS. New York:Oxford University Press.
Gordon, Steven I. 1985. Computer models in environmentalplanning. New York: Van Nostrand Reinhold.
Gordon, Steven I., and Gaybrielle E. Gordon. 1981. “The ac-
curacy of soil survey information for urban land- use plan-ning.” Journal of the American Planning Association47(3):301–312.
Gore, Al. 1992. Earth in the balance: ecology and the humanspirit. New York: Houghton Mifflin Company.
Gosselink, J. G., and E. Maltby. 1990. “Wetland losses andgains.” In Wetlands, a threatened landscape, M. Williamsed., pp. 296–322. Oxford, U.K.: Basil Blackwell.
Graf, William L. (ed.). 1987. Geomorphic systems of NorthAmerica. Boulder, Colorado: Geological Society of America.
Graham, Otis L., Jr. 1976. Toward a planned society. London:Oxford University Press.
Grant, Jill, Patricia Manuel, and Darrell Joudrey. 1996. “Aframework for planning sustainable residential land-scapes.” Journal of the American Planning Association62(3):331–344.
Green, Philip P., Jr. 1968. “Land subdivision.” In Principlesand practice of urban planning, William I. Goodman andEric C. Freund eds., pp. 443–484. Washington, D.C.: Inter-national City Manager’s Association.
Griffin, C. R. 1989. “Protection of wildlife habitat by statewetland regulations: the Massachusetts initiative.” InTransactions 54th North American wildlife and natural re-source conference, R. E. McCabe ed., pp. 22–31. Washing-ton, D.C.: Wildlife Management Institute.
Grossinger, R. M., J. N. Collins, E. Brewster, and Z. Der. 1999.“Where did today come from? (And where is it headed?):an example of historical ecology research from the SanFrancisco Estuary, California.” Richmond, California: SanFrancisco Estuary Institute.
Grossinger, R. M., Zoltan Der, and Elise Brewster. 1998. “Bayarea historical project” (unpublished summary). Rich-mond, California: San Francisco Estuary Institute.
Hagman, Donald G., and Julian Conrad Juergensmeyer.1986. Urban planning and land development control law(2nd ed). St. Paul, Minnesota: West.
Hall, Peter. 1975. Urban and regional planning. New York:Halsted Press/John Wiley & Sons.
Harris, Dianne Chandler. 1988. “Growth management reconsidered.” Journal of Planning Literature 3(4):466–482.
Hart, John Fraser. 1998. The rural landscape. Baltimore:Johns Hopkins University Press.
Hartman, George W. 1977. Soil survey of Maricopa County:central part. Washington, D.C.: U.S. Government PrintingOffice.
Hawks, Richard, and Shelley Mastran. 1997. Your town: de-signing its future. Washington, D.C., and Syracuse, NewYork: National Trust for Historic Preservation, and StateUniversity of New York at Syracuse.
Hendricks, David M. 1985. Arizona soils. Tucson, Arizona:University of Arizona College of Agriculture.
445BIBLIOGRAPHY
Hersperger, Anna M. 1994. “Landscape ecology and its po-tential application to planning.” Journal of Planning Litera-ture 9(1):14–29.
Higashi, Irvin, Nancy Hopkins, Rick Nishi, Jani Raymond,and Susan Vogt. 1978. “Parvin ecological study” (classproject). Pullman, Washington: Department of Horticul-ture and Landscape Architecture and Program in Environ-mental Science and Regional Planning, Washington StateUniversity.
Hightower, Henry C. 1968. “Population studies.” In Princi-ples and practice of urban planning, William I. Goodmanand Eric C. Freund eds., pp. 51–75. Washington, D.C.: In-ternational City Manager’s Association.
Hill, Morris. 1968. “A goals- achievement matrix for evaluat-ing alternative plans.” Journal of the American Institute ofPlanners 34(1):19–29.
Hills, G. A. 1961. The ecological basis for land- use planning(Research Report No. 46). Toronto, Ontario: Ontario De-partment of Lands and Forests.
Hirschhorn, Larry. 1980. “Scenario writing: a developmentalapproach.” Journal of the American Planning Association46(2):172–183.
Hirschman, Joan. 1988. “Bird habitat design for people: alandscape ecological approach” (unpublished master oflandscape architecture thesis). Denver, Colorado: Univer-sity of Colorado Program in Landscape Architecture andUrban Design.
Holdridge, L. R. 1967. Life zone ecology. San Jose, Costa Rica:Tropical Science Center.
Holland, R. F. 1986. Preliminary descriptions of the terrestrialnatural communities of California. Sacramento, California:State of California Department of Fish and Game.
Hopkins, Lewis D. 1977. “Methods for generating land suit-ability maps: a comparative evaluation.” Journal of theAmerican Institute of Planners 43(4):386–400.
Hough, Michael. 1995. Cities and natural processes. Londonand New York: Routledge.
Huddleston, Jack. 1981. “Tax increment financing in Wis-consin.” Planning 47(11):14–17.
Hudson, Barclay M. 1979. “Comparison of current planningtheories: counterparts and contradictions.” Journal of theAmerican Planning Association 45(4):387–398.
Humbach, John A. 1989. “Law and a new land ethic.” Min-nesota Law Review 74:339–370.
Humphreys, John A. 1985. “Breckenridge, point systems:keeping score.” Planning 51(10):23–25.
Hunt, Charles. 1967. Physiography of the United States. SanFrancisco, California: W. H. Freeman.
Iacofano, Daniel S. 1990. Public involvement as an organiza-tional development process. A proactive theory for environ-mental planning program management. New York: Garland.
Ingley, Kathleen. 1996. “A ‘community vision’ for Phoenixwould protect northern desert areas.” Arizona RepublicMay 20:A1.
Ingley, Kathleen, 1998. “Designs on the desert.” Planning64(2, February):18–21.
Institute for Participatory Management and Planning. 1997.Citizen participation handbook for public officials and otherprofessionals serving the public (10th ed.). Monterey, California.
Institute for Participatory Planning. 1978. Citizen participa-tion handbook. Laramie, Wyoming.
International Union for the Conservation of Nature andNatural Resources. 1980. World conservation strategy(published in cooperation with the United Nations Envi-ronment Programme and The World Wildlife Fund).Gland, Switzerland.
Iowa Northland Regional Council of Governments. 1975. County living study. Waterloo, Iowa: Black HawkCounty.
Irish, Gary. 1994. GIS overview: Joint Legislative Budget Com-mittee, December 1, 1994. Phoenix, Arizona: Arizona LandResources Information System.
Jackson, Joanne Barnes, and Frederick R. Steiner. 1985. “Hu-man ecology for land- use planning.” Urban Ecology 9:177–194.
Jacobs, Allan B. 1985. Looking at cities. Cambridge, Massa-chusetts: Harvard University Press.
Jacobs, Allan B. 1993. Great streets. Cambridge, Massachu-setts: MIT Press.
Jaffee, Martin, and Duncan Erley. No date. Protecting solaraccess for residential development. Washington, D.C.: U.S.Government Printing Office.
Jagillo, Keith J. 1987. “Structural evolution of the PhoenixBasin, Arizona” (unpublished master of science thesis).Tempe, Arizona: Arizona State University Department ofGeology.
Jennings, Michael D., and John P. Reganold. 1988. “Policyand reality of environmentally sensitive areas in WhitmanCounty, Washington, USA.” Environmental Management12(3):369–380.
Johannsen, Sonia A., and Larry C. Larsen. 1984. “Corn suit-ability ratings: a method of rating soils for identifying andpreserving prime agricultural land in Black Hawk County,Iowa.” In Protecting farmland, Frederick Steiner and JohnTheilacker eds., pp. 109–127. Westport, Connecticut: AVIPublishing.
Johnson, Arthur H. 1981. “Guest editorial: human ecologi-cal planning—methods and studies.” Landscape Planning8:107–108.
Johnson, Arthur H., Jonathan Berger, and Ian L. McHarg.1979. “A case study in ecological planning: the Woodlands,Texas.” In Planning the uses and management of land, Mar-vin T. Beatty, Gary W. Petersen, and Lester D. Swindaleeds., pp. 935–955. Madison, Wisconsin: American Societyof Agronomy, Crop Science Society of America, and SoilScience Society of America.
Johnson, Lee. 1974. Attorney General’s opinion on Fasano
446BIBLIOGRAPHY
v. Board of County Commissioners of Washington County.Salem, Oregon: State of Oregon, Department of Justice.
Jones, Stephen M., and Roy Fedelem. 1996. Agricultural andfarmland protection plan. Hauppauge, New York: SuffolkCounty Planning Department.
Juneja, Narenda. 1974. Medford: performance requirements forthe maintenance of social values represented by the naturalenvironment of Medford Township, New Jersey. Philadel-phia, Pennsylvania: Department of Landscape Architec-ture and Regional Planning, Center for Ecological Researchin Planning and Design, University of Pennsylvania.
Juster, Robert J. 1994. Municipal planning in Alabama.Auburn, Alabama: The Alabama Planning Institute.
Kaiser, Edward J., David R. Godschalk, and F. Stuart Chapin.1995. Urban land use planning (4th ed). Urbana, Illinois:University of Illinois Press.
Kaplan, Rachel, Stephen Kaplan, and Robert L. Ryan. 1998.With people in mind. Washington, D.C.: Island Press.
Kartez, Jack D. 1980. “A zoning administrator’s view of farm-land zoning.” Journal of Soil and Water Conservation35(6):265–266.
Kartez, Jack D. 1981. “Community economic base analysis”(mimeograph). Pullman, Washington: Washington StateUniversity Program in Environmental Science and Re-gional Planning.
Kasson, William K., David Pijawka, and Frederick Steiner.2000. Sustainable neighborhood design. Tempe, Arizona:Arizona State University School of Planning and Land-scape Architecture.
Kast, Fremont E., and James E. Rosenzweig. 1979. Organiza-tion and management: a systems and contingency approach(3rd ed.). New York: McGraw- Hill.
Kelbaugh, Douglas. 1997. Common place: toward neighbor-hood and regional design. Seattle, Washington: Universityof Washington Press.
Kellington, Wendie. 1998. “Oregon’s land use program comesof age: the next 25 years.” Land Use Law & Zoning Digest50(10):3–6.
Kelly, Eric Damian. 1993. Managing community growth: poli-cies, techniques and impacts. Westport, Connecticut:Praeger.
Kendig, Lane. 1977. “Carrying capacity: how it can work foryou.” Environmental comment (December):4–6.
Killpack, Charles. 1981. “Computer mapping, spatial analy-sis, and landscape architecture.” Landscape Journal1(1):41–48.
Kitsap County Department of Community Development.1998. Kitsap County critical areas ordinance. Port Orchard,Washington.
Kleymeyer, John E. No date. “Some aspects of land- use con-trol” (class notes). Cincinnati, Ohio: University of Cincin-nati Department of Community Planning.
Klingebiel, A. A., and P. H. Montgomery. 1961. Land capabil-ity classification (Agricultural Handbook No. 210). Wash-
ington, D.C.: Soil Conservation Service, U.S. Departmentof Agriculture.
Klosterman, Richard E. 1978. “Foundations for normativeplanning.” Journal of the American Institute of Planners44(1):37–46.
Koekebakker, Olof. 1996. Charrettes voor Leidsche RijnUtrecht. Rotterdam, The Netherlands: NA; Uitgevers.
Kreske, Diori L. 1996. Environmental impact statements: apractical guide for agencies, citizens, and consultants. NewYork: John Wiley & Sons.
Krueger, Richard. 1988. Focus groups: a practical guide for ap-plied research. Newbury Park, California: Sage Publica-tions.
Kusler, J. A. 1985. “A call for action: protection of riparianhabitat in the arid and semi- arid west.” In Riparian eco-systems and their management: reconciling their uses,R. R. Johnson, C. D. Ziebell, D. R. Patton, P. F. Ffollion, andR. N. Hamre eds., pp. 6–8. Tucson, Arizona: U.S. ForestService.
Kusler, J. A., and Teresa Opheim. 1996. Our national wetlandheritage: a protection guide (2nd ed). Washington, D.C.:American Law Institute.
Lai, Richard Tseng- yu. 1988. Law in urban design and plan-ning. New York: Van Nostrand Reinhold.
Laird, Raymond T., Jeanne B. Perkins, David A. Bainbridge,James B. Baker, Robert T. Boyd, Daniel Huntsman, Paul E.Staub, and Melvin B. Zucker. 1979. Quantitative land- capability analysis (U.S. Geological Survey ProfessionalPaper 945).
Land Conservation and Development Commission (LCDC).1980. Statewide planning goals and guidelines. Salem, Ore-gon.
Laslett, Peter (ed.). 1988. John Locke: two treatises of govern-ment (student ed.). Cambridge, England: Cambridge Uni-versity Press.
Lassey, William R. 1977. Planning in rural environments. NewYork: McGraw- Hill.
Lawson, S. 1991. “Under stress.” Landscape Architecture81(10):76–78.
Le Compte, Margaret D., and Judith Preissle. 1993. Ethnogra-phy and quality design in educational research. San Diego,California: Academic Press.
Leach, John Craig. 1992. “Planners and the public: a commu-nication gap” (unpublished master of environmentalplanning thesis). Tempe, Arizona: Arizona State UniversitySchool of Planning and Landscape Architecture.
Leary, Robert M. 1968. “Zoning.” In Principles and practice ofurban planning, William I. Goodman and Eric C. Freundeds., pp. 403–442. Washington, D.C.: International CityManager’s Association.
Leopold, Aldo. 1933. “The conservation ethic.” The Journal ofForestry 31(6):634–643.
Leopold, Aldo. 1949. A Sand County almanac and sketcheshere and there. New York: Oxford.
447BIBLIOGRAPHY
Leslie, M., and E. H. Clark II. 1990. “Perspectives on wetlandloss and alterations.” In Issues in wetlands protection: back-ground papers prepared for national wetlands policy forum,G. Bingham, E. H. Clark II, L. V. Laygood, and M. Les-lie eds., pp. 1–21. Washington, D.C.: The ConservationFoundation.
Lewis, James A. 1980. Landownership in the United States,1978. Washington, D.C.: U.S. Department of Agriculture.
Lewis, Philip H. 1964. “Quality corridors in Wisconsin.”Landscape Architecture Quarterly 54(2):100–107.
Lewis, Philip H. 1969. “The inland water tree.” American In-stitute of Architects Journal 51(6):59–63.
Lewis, Philip H. 1996. Tomorrow by design. New York: JohnWiley & Sons.
van Lier, H. N. 1973. Determination of planning capacity andlayout criteria of outdoor recreation projects. Wageningen,The Netherlands: Centre for Agricultural Publishing andDocumentation.
van Lier, H. N. 1980. “Outdoor recreation in the Netherlands.II. A system to determine the planning capacity of outdoorrecreation projects having varying daily attendance.”Landscape Planning 7(4):329–343.
van Lier, H. N. 1991. Meervoudig grondgebruik. Deel A: prob-lemen, processen, effecten en oplossingen (Multiple land useplanning. Part A: problems, processes, effects and solutions).Wageningen, The Netherlands: Wageningen AgricultureUniversity.
van Lier, H. N., and Frederick Steiner. 1982. “A review of theZuiderzee reclamation works: an example of Dutch physi-cal planning.” Landscape Planning 9(1):35–59.
Lilieholm, Robert J., and Jeff Romm. 1992. “Pinelands national reserve: an intergovernmental approach to na-ture preservation.” Environmental Management 16(3):335–343.
Lime, D. W. 1979. “Carrying capacity.” Trends in Rivers andTrails 16:37–40.
Lime, D. W., and G. H. Stankey. 1971. “Carrying capac-ity: maintaining outdoor recreation quality.” In Forestrecreation symposium proceedings, pp. 174–184. UpperDarby, Pennsylvania: Northeast Forest Experiment Station.
Linstone, H. A., and M. Turoff (eds.). 1975. The Delphimethod: techniques and applications. Reading, Massachu-setts: Addison- Wesley Publishing Company.
Little, Charles E. 1990. Greenways for America. Baltimore,Maryland: Johns Hopkins University Press.
Little, Lynne A. 1975. “Geology and land use investigation inthe Pinnacle Peak Area” (unpublished master of sciencethesis). Tempe, Arizona: Arizona State University Depart-ment of Geology.
Litton, R. Burton, Jr. 1968. Forest landscape description andinventories—a basis for land planning and design. Berkeley,California: Pacific Southwest Forest and Range Experi-ment Station, U.S. Forest Service.
Littrell, David. 1976. The theory and practice of communitydevelopment. Columbia, Missouri: Extension Division,University of Missouri.
Local Government Commission. 1991. The Ahwahnee princi-ples. Sacramento, California.
Loe, Robert C. de. 1995. “Exploring complex policy questionsusing the policy Delphi: a multiround, interactive surveymethod.” Applied Geography 15(1):53–68.
Long, John. 1981. Population deconcentration in the UnitedStates. Washington, D.C.: U.S. Government Printing Office.
Lougeay, Ray, Anthony Brazel, and Mark Hubble. 1996.“Monitoring interurban temperature patterns and associ-ated land cover in Phoenix, Arizona using landset thermaldata.” Geocarto International 11(4):79–90.
Lovejoy, Derek (ed.). 1973. Land use and landscape planning.New York: Barnes & Noble.
Lovelock, J. E. 1979. Gaia. Oxford, U.K.: Oxford UniversityPress.
Lowe, Charles H., and David E. Brown. 1994. “Introduction.”In Biotic communities: southwestern United States andnorthwestern Mexico, David E. Brown ed., pp. 8–16. SaltLake City: University of Utah Press.
Lowe, C. H. (ed.). 1964. The vertebrates of Arizona. Tucson,Arizona: University of Arizona Press.
Lowrance, Richard, Paul F. Hendrix, and Eugene P. Odum.1986. “A hierarchical approach to sustainable agriculture.”American Journal of Alternative Agriculture 1(4):169–173.
Lucy, William H. 1994. “If planning includes too much,maybe it should include more.” Journal of the AmericanPlanning Association 60(3):305–318.
Lyle, John Tillman. 1994. Regenerative design for sustainabledevelopment. New York: John Wiley & Sons.
Lyle, John Tillman, and Frederick Stutz. 1983. “Computer-ized land use suitability mapping.” In Geographic informa-tion systems for resource management: a compendium, W. J.Ripple ed. Falls Church, Virginia: American Society forPhotogrammetry and Remote Sensing and AmericanCongress on Surveying and Mapping.
Lynch, Kevin. 1960. The image of the city. Cambridge, Massa-chusetts: MIT Press.
Lynch, Kevin. 1962. Site planning. Cambridge, Massachu-setts: MIT Press.
Lynch, Kevin. 1971. Site planning (2nd ed.). Cambridge,Massachusetts: MIT Press.
Lynch, Kevin, and Gary Hack. 1984. Site planning (3rd ed.).Cambridge, Massachusetts: MIT Press.
MacDougall, E. Bruce. 1975. “The accuracy of map overlays.”Landscape Planning 2:23–30.
MacKaye, Benton. 1940. “Regional planning and ecology.”Ecological Monographs 10(3):349–353.
MacNair, Ray H. 1981. “Citizen participation as a balancedexchange: an analysis and strategy.” Journal of the Commu-nity Development Society 12(1):1–19.
448BIBLIOGRAPHY
Manning, Warren. 1913. “The Billerica town plan.” Land-scape Architecture 3:108–118.
Marsh, William M. 1983. Landscape Planning. Reading: Mas-sachusetts: Addison- Wesley.
Marsh, William M. 1998. Landscape planning: environmentalapplications (3rd ed.). New York: John Wiley & Sons.
Mason, Robert J. 1986. “Environmental conflict and accom-modation: an evaluation of regional land use managementin the New Jersey Pinelands” (Ph.D. dissertation). NewBrunswick, New Jersey: Graduate Program in Geography,Rutgers, The State University of New Jersey.
McCarthy, James, Kim Shetter, and Frederick Steiner (eds.).1995. Findings of the North Sonoran land use charactercharrette. Tempe, Arizona: Herberger Center for DesignExcellence and School of Planning and Landscape Archi-tecture, Arizona State University.
McClendon, Bruce W. 1992. Customer service in local govern-ment. Chicago, Illinois: APA Planners Press.
McCormack, D. E. 1974. “Soil potentials: a positive approachto urban planning.” Journal of Soil and Water Conservation29:258–262.
McCormick, J. F. 1978. “A summary of the national ripariansymposium: a proposal for a national riparian program.”In Strategies for protection and management of floodplainwetlands and other riparian ecosystems: proceedings, R. R.Johnson and J. F. McCormick, technical coordinatorsUSDA, FS, GTR- WO- 12, pp. 362–363. Washington, D.C.:U.S. Department of Agriculture.
McCracken, Grant. 1988. The long interview. Newbury, Cali-fornia: Sage Publications.
McDowell, Bruce D. 1986. “Approaches to planning.” In Thepractice of state and regional planning, Frank S. So, IrvingHand, and Bruce D. McDowell eds., pp. 3–22. Chicago,Illinois: American Planning Association.
McHarg, Ian L. 1968. “A comprehensive highway route- section method.” Highway Research Record 246:1–15.
McHarg, Ian L. 1969. Design with nature. Garden City, NewYork: Doubleday/The Natural History Press. (1992. 2nded.) New York: John Wiley & Sons.
McHarg, Ian L. 1981. “Human ecological planning at Penn-sylvania.” Landscape Planning 8:109–120.
McHarg, Ian L. 1996. A quest for life. New York: John Wiley &Sons.
McHarg, Ian L. 1997a. “Ecology and design.” In Ecological de-sign and planning, George F. Thompson and FrederickSteiner eds., pp. 321–332. New York: John Wiley & Sons.
McHarg, Ian L. 1997b. “Natural factors in planning.” Journalof Soil and Water Conservation 52(1):13–17.
McHarg, Ian L., and Frederick R. Steiner (eds.). 1998. To healthe earth: selected writings of Ian L. McHarg. Washington,D.C.: Island Press.
McKenzie, Ricki. 1979. The Pinelands scenic study (summaryreport). Philadelphia, Pennsylvania: U.S. Department ofInterior.
McLean, Mary L., and Kenneth P. Voytek. 1992. Understand-ing your economy: using analysis to guide local strategicplanning. Chicago, Illinois: American Planning Associa-tion Planners Press.
McNally, Marcia. 1999. “A regional blueprint for sustainabil-ity.” Places 12(2):26–29.
McQuary, Julie. 1998. City of Olympia parks planner (per-sonal communication). Olympia, Washington.
McSheffrey, Gerald. 1999. Planning Derry, planning and poli-tics in Northern Ireland. Liverpool, England: LiverpoolUniversity Press.
Meeks, G., Jr., and I. C. Runyon. 1990. Wetlands protectionand the states. Denver, Colorado: National Conference ofState Legislatures.
Meester, R., and J. L. M. van der Voet. 1980. Carrying capacity,goal or result of a policy concerning water- based recreationareas. Wageningen, The Netherlands: Agricultural Univer-sity Department of Land and Water Use.
Meinig, D. W. 1979. “Introduction.” In The interpretation ofordinary landscapes, D. W. Meinig ed., pp. 1–7. New York:Oxford University.
Metro. 1991. Regional urban growth goals and objectives (Sep-tember). Portland, Oregon.
Metro. 1994a. Region 2040 public involvement report (Au-gust). Portland, Oregon.
Metro. 1994b. Region 2040 growth concept (December). Port-land, Oregon.
Meyer, B. 1994. “The North Arncliffe town planning char-rette.” New Planner 17:1,6,7.
Meyer, Neil L. 1980. Programming capital improvements(WREP 30). Corvallis, Oregon: Western Rural Develop-ment Center, Oregon State University.
Meyers, Charles R., Jr. 1971. Regional modeling abstracts(3 volumes). Oak Ridge, Tennessee: Oak Ridge National Laboratory.
Meyers, Charles R., Michael Kennedy, and R. Neil Samp-son. 1979. “Information systems for land- use planning.”In Planning the uses and management of land, Marvin T.Beatty, Gary W. Petersen, and Lester D. Swindale eds.,pp. 889–907. Madison, Wisconsin: American Society ofAgronomy, Crop Science of America, and Soil ScienceSociety of America.
Miller, Donald. 1980. “Project location analysis using thegoals achievement method of evaluation.” Journal of theAmerican Planning Association 46(2):195–208.
Miller, Fred P. 1978. “Soil survey under pressure: the Mary-land experience.” Journal of Soil and Water Conservation33(3):104–111.
Miller, Lynn. 1996. Personal communication. (ProfessorEmeritus from Pennsylvania State University at a 20March 1996 Arizona State University presentation.)
Miller, William, Michael G. Collins, Frederick R. Steiner, andEdward Cook. 1998. “An approach for greenway suitabilityanalysis.” Landscape and Urban Planning 42:91–105.
449BIBLIOGRAPHY
Ministry of Transport and Public Works. No date. Room atlast. Lelystad, The Netherlands: IJsselmeerpolders Devel-opment Authority.
Monroe, S. 1991. “Arizona riparian area initiative” (paper).Ankeny, Iowa: Soil and Water Conservation Society.
Moore, Terry. 1988. “Planning without preliminaries.” Jour-nal of the American Planning Association 54(4):525–528.
Morgan, Keith M. 1991. “Charles Eliot, 1859–1897, held intrust: Charles Eliot’s vision for the New England land-scape.” In National Association for Olmsted Parks workbookseries. (vol. 1, biography, pp. 1–12). Bethesda, Maryland:National Association for Olmsted Parks.
Morisawa, Marie. 1968. Streams. New York: McGraw- Hill.Morrell, Terri A. 1989. “Small social spaces in the Nether-
lands” (paper). Denver, Colorado: University of ColoradoSchool of Architecture and Planning.
Morris, Marya. 1997. “Subdivision design in flood hazardareas” (Planning Advisory Service Report Number 473).Chicago, Illinois: American Planning Association.
Moudon, Anne Vernez. 1997. “Urban morphology as anemerging interdisciplinary field.” Urban Morphology 1:3–10.
Mumford, Lewis. 1944. The condition of man. New York: Har-court, Brace and Company.
Mumford, Lewis. 1961. The city in history: its origins, itstransformations and its prospects. New York: Harcourt,Brace, and World.
Muratori, S. 1959. “Studi per una operante storia urbana diVenezia.” Palladio IX:97–209.
Muratori, S., R. Bollati, S. Bollati, and G. Marinucci. 1963.Studi per una operante storia urbana di Roma. Roma, Italia:Consiglio Nazionale della Riceche.
Murray, Timothy, Peter Rogers, David Sinton, Carl Steinitz,Richard Toth, and Douglas Way. 1971. Honey Hill: a sys-tems analysis for planning the multiple use of controlled wa-ter areas (2 vols). Report nos. AD 736 343 and AD 736 344.Springfield, Virginia: National Technical Information Service.
National Agricultural Lands Study. 1981. Final report. Wash-ington, D.C.: U.S. Department of Agriculture and Councilon Environmental Quality.
National Commission on the Environment. 1993. Choosing asustainable future. Washington, D.C.: Island Press.
Nations, Dale, and Edmund Stump. 1981. The geology of Ari-zona. Dubuque, Iowa: Kendall/Hunt.
Natural Resources Defense Council. 1977. Land use controlsin the United States, Elaine Moss ed. New York: The DialPress/James Wade.
Naveh, Zev, and Arthur S. Lieberman. 1994. Landscape ecol-ogy: theory and applications (2nd ed.). New York: Springer- Verlag.
Ndubisi, Forster. 1997. “Landscape ecological planning.” InEcological design and planning, George F. Thompson and
Frederick R. Steiner eds., pp. 9–44. New York: John Wiley& Sons.
Ndubisi, Forster, Terry De Meo, and Niels D. Ditto. 1995.“Environmentally sensitive areas: a template for develop-ing greenway corridors.” Landscape and Urban Planning33:159–177.
Neckar, Lance. 1989. “Developing landscape architecture forthe twentieth century: the career of Warren Manning.”Landscape Journal 8(2):78–91.
Needham, Roger D., and Robert C. de Loë. 1990. “The pol-icy Delphi: purpose, structure, and application.” TheCanadian Geographer/Le Géographe Canadien 34(2):133–142.
Nellis, Lee. 1980. “Planning with rural values.” Journal of Soiland Water Conservation 35(2):67–71.
Nellis, Lee. 1981. “The bottom line: implementation of re-gional landscape planning through effective citizen par-ticipation and an innovative legal and administrativetechnique.” In Regional landscape planning, Julius Gy. Fa-bos ed., pp. 72–80. Wash ington, D.C.: American Societyof Landscape Architects.
Nellis, Lee. 1994. “Linking LESA systems to local land useplanning.” In A decade with LESA: the evolution of landevaluation and site assessment, Frederick R. Steiner, JamesR. Pease, and Robert E. Coughlin eds., pp. 208–222.Ankeny, Iowa: Soil and Water Conservation Society.
Nelson, Arthur C. 1992. “Characterizing exurbia.” Journal ofPlanning Literature 6(4):350–368.
Nelson, Arthur C., and James B. Duncan. 1995. Growth man-agement principles and practices. Chicago, Illinois: Ameri-can Planning Association.
Neuman, Michael. 1998a. “Does planning need the plan?”Journal of the American Planning Association 64(2):208–220.
Neuman, Michael. 1998b. “Planning, governing, and the im-age of the city.” Journal of Planning Education and Research18(1):61–71.
New Jersey Pinelands Commission. 1998. A summary of theNew Jersey Pinelands comprehensive management plan.New Lisbon, New Jersey.
New Jersey State Planning Commission. 1988. The prelimi-nary state development and redevelopment plan for the Stateof New Jersey (vol. 2.). Trenton, New Jersey.
Newman, Harry George, III. 1982. “An environmentally sen-sitive area planning model for local government in theState of Washington” (unpublished master of regionalplanning thesis). Pullman, Washington: Program in Envi-ronmental Science and Regional Planning, WashingtonState University.
Nicholas, J. C., A. C. Nelson, and J. C. Juergensmeyer. 1991. Apractitioner’s guide to development impact fees. Chicago,Illinois: Planners’ Press.
Niebanck, Paul. 1993. “The shape of environmental planning
450BIBLIOGRAPHY
education.” Environment and Planning B: Planning andDesign 20:511–518.
Niemann, Bernard J. 1989. “Improved analytical functional-ity: modernizing land administration, planning, manage-ment, and policy analysis.” In Multipurpose land informa-tion systems: the guidebook (2 vols.), P. M. Brown and D. D.Moyer eds., pp. 11–13. Washington, D.C.: The Federal Ge-odetic Control Committee.
Noss, Reed, and Allen Cooperrider. 1993. “GAP analysis asapplied conservation biology.” GAP analysis bulletin3(Winter/Spring):3–5.
Novikoff, A. B. 1945. “The concept of integrative levels andbiology.” Science 101:209–215.
Odum, Eugene P. 1971. Fundamentals of ecology. Philadel-phia, Pennsylvania: W. B. Saunders.
Odum, Eugene P. 1978. “Ecological importance of the ripar-ian zone.” In Strategies for protection and management offloodplain wetlands and other riparian ecosystems: proceed-ings, R. R. Johnson and J. F. McCormick, technical coordi-nators, pp. 2–4. USDA, FS, GTR- WO- 12. Washington,D.C.: U.S. Department of Agriculture.
Odum, Eugene P. 1998. Ecological vignettes: ecological ap-proaches to dealing with human predicaments. Amsterdam,The Netherlands: Harwood Academic Publishers.
O’Harrow, Dennis. 1954. Performance standards for industrialzoning. Columbus, Ohio: National Industrial ZoningCommittee.
Ohmart, R. D., and B. W. Anderson. 1986. “Riparian habitat.”In Inventorying and monitoring of wildlife habitat, B. S.Cooperider ed., pp. 164–199. Denver, Colorado: U.S. Bu-reau of Land Management.
Olin, Laurie. 1988. “Form, meaning, and expression in landscape architecture.” Landscape Journal 7(2):149–168.
Olin, Laurie. 1997. “Landscape design and nature.” In Ecolog-ical design and planning, George R. Thompson and Freder-ick R. Steiner eds., pp. 109–139. New York: John Wiley &Sons.
Opie, John. 1998. Nature’s nation: an environmental history ofthe United States. Fort Worth, Texas: Harcourt Brace &Company.
Oregon Supreme Court. 1979. Neuburger v. City of Portland(288 Or. 155,603 P.2d 771). Salem, Oregon.
Orr, David W. 1994. Earth in mind: on education, environ-ment, and the human prospect. Washington, D.C.: IslandPress.
Ortolano, Leonard. 1984. Environmental planning and deci-sion making. New York: John Wiley & Sons.
Ortolano, Leonard. 1997. Environmental regulation and im-pact assessment. New York: John Wiley & Sons.
Palazzo, Danilo. 1997. Sulle spalle di giganti. Le matrici dellapianificazione ambientale negli Stati Uniti. Milano, Italy:FrancoAngeli/DST.
Palmer, Arthur E. 1981. Toward Eden. Winterville, NorthCarolina: Creative Resource Systems.
Paris Prize. 1993. “Syracuse student wins fellowship in the fi-nal charrette, Richard Lucas’ design for a New York middleschool, 1993.” Competitions 3, 2.
Patton, Carl V., and David S. Sawicki. 1993. Basic methods ofpolicy analysis and planning (2nd ed.). Englewood Cliffs,New Jersey: Prentice-Hall.
Pearthree, Philip A. 1991. “Geologic insights into flood haz-ards in Piedmont Areas of Arizona.” Arizona Geology21(4):1–5.
Pease, James R. 1984. “Oregon’s land conservation and devel-opment program.” In Planning for the conservation and de-velopment of land resources, Frederick R. Steiner and Hu-bert N. van Lier eds., pp. 253–271. Amsterdam, TheNetherlands: Elsevier Scientific Publishing.
Pease, James R., and Robert E. Coughlin. 1996. Land evalua-tion and site assessment: a guidebook for rating agriculturallands (2nd ed.). Ankeny, Iowa: Soil and Water Conserva-tion Society.
Peck, Sheila. 1998. Planning for biodiversity. Washington,D.C.: Island Press.
Petersen, Kip, Terri Morrell, and Larry Larsen. 1989. Growthmanagement plan, Teller County, Colorado. Cripple Creekand Woodland Park, Colorado: Teller County PlanningDepartment and City of Woodland Park Planning Department.
Pielke, R. A., and R. Avissar. 1990. “Influence of landscapestructure on local and regional climate.” Landscape Ecology4(2/3):133–155.
Pijawka, K. David, and Kim Shetter. 1995. The environmentcomes home. Tempe, Arizona: Herberger Center for De-sign Excellence, Arizona State University.
Pinelands Commission. 1980. New Jersey Pinelands compre-hensive management plan. New Lisbon, New Jersey: Stateof New Jersey.
Pinelands Commission. 1998. Long- term economic monitor-ing program, executive summary to 1998 annual report. NewLisbon, New Jersey: New Jersey Pinelands Commission.
Piscopo, Ornella. 1999. “L’Uso del concetto della carrying ca-pacity per il progetto della città sostenibile” (Ph.D. disser-tation). Rome, Italy: Dipartimento di Architettura e Ur-banistica per l’Ingegneria, Università degli Studi di Roma“La Sapienza.”
Planning. 1998. “Land trusts and partners add to protectedinventory.” Planning 64(11,November):23–24.
Platt, Rutherford H. 1991. Land use and society: geography,law and public policy. Washington, D.C.: Island Press.
Platt, Rutherford H. 1996. Land use and society: geography,law, and public policy (2nd ed.). Washington, D.C.: IslandPress.
Portland Bureau of Planning. 1977. The city planner hand-book (November). Portland, Oregon.
451BIBLIOGRAPHY
Portland Bureau of Planning. 1980a. Citizen involvement(September). (Comprehensive Plan Support DocumentNo. 9 of 11 documents.)
Portland Bureau of Planning. 1980b. Plan review and admin-istration. Portland, Oregon.
Powell, John Wesley. 1879. Report on the arid lands of the aridregion of the United States. Washington, D.C.: U.S. Govern-ment Printing Office.
Prentice, Helaine Kaplan. 1998. Suzhou, shaping an ancientcity for the New China: an EDAW/Pei workshop. Washing-ton, D.C.: Spacemaker Press.
President’s Council on Sustainable Development. 1996. Sus-tainable America: a new consensus for prosperity, opportu-nity, and a healthy environment for the future. Washington,D.C.: U.S. Government Printing Office.
Prigogine, Ilya, and Isabelle Stengers. 1984. Order out ofchaos. New York: Bantam Books.
Quinby, Peter A. 1988. “The contribution of ecol ogical sci-ence to the development of landscape ecology: a briefhistory.” Landscape Research 13(3):9–11.
Raintree, John. 1987. D. & D. users manual. Nairobi, Kenya:International Council for Research in Agroforestry.
Ransel, K., and E. Meyers. 1988. “State water quality certifica-tion and wetland protection: a call to awaken the sleepinggiant.” Virginia Journal of Natural Resources Law 7(2):339–379.
Rees, William E. 1990a. “Sustainable development and thebiosphere: concepts and principles.” Teilhard Studies No.23 (Spring/Summer). Chambersburg, Pennsylvania: An-ima Books.
Rees, William E. 1990b. “The ecology of sustainable develop-ment.” The Ecologist 20(1):18–23.
Rees, William E. 1992. “Ecological footprints and appropri-ated carrying capacity: what urban economics leaves out.”Environment and Urbanization 4(2):121–130.
Rees, William E. 1995. “Achieving sustainability: reform ortransformation?” Journal of Planning Literature 9(4):343–361.
Rees, William E. 1997. “Is ‘Sustainable City’ an oxymoron?”Local Environment 2(3):303–310.
Reganold, John P., and Michael J. Singer. 1978. Defining primeagricultural land in California. Environmental Quality Se-ries No. 29. Davis, California: University of California In-stitute of Government Affairs.
Reganold, John F., and Michael J. Singer. 1979. “Definingprime farmland by three land classification systems.” Jour-nal of Soil and Water Conservation 34(4):172–176.
Regional Planning Staff. 1929. The graphic regional plan, re-gional plan of New York and its environs (vol. 1). New York:Regional Planning Staff.
Reilly, W. K. 1991. “A new way with wetlands.” Journal of Soiland Water Conservation 46(3):192–194.
Renard, K. G., and G. R. Foster. 1983. “Soil conservation:principles of erosion by water.” In Dryland agriculture, H.
E. Dregne and W. O. Willis eds., pp. 155–176. Madison,Wisconsin: American Society of Agronomy, Crop ScienceSociety of America, and Soil Science Society of America.
Renard, K. G., G. R. Foster, G. A. Weeies, D. K. McCool, andD. C. Yoder. 1997. Predicting soil erosion by water: a guide toconservation planning with the revised universal soil lossequation (RUSLE) (Agricultural Handbook No. 703).Washington, D.C.: U.S. Department of Agriculture.
Reps, John W. 1964. “Pomeroy memorial lecture: requiem forzoning.” In Planning 1964, pp. 56–67. Chicago: The Amer-ican Society of Planning Officials.
Reps, John W., 1970. Town planning in frontier America. (Pa-perback ed.; original copyright 1969.) Princeton, New Jer-sey: Princeton University Press.
Reynolds, Stephen J. No date. Geologic map of Arizona.Tempe, Arizona: Arizona State University Department ofGeology.
Ribe, Robert G., and Ethan Seltzer. 1992. Ten essentials for aquality regional landscape: a guidebook for maintaining andenhancing greater Portland’s special sense of place (Decem-ber). Portland, Oregon: Metro.
Ricklefs, Robert E. 1973. Ecology. Newton, Massachusetts:Chiron Press.
Riddick, W. L. 1971. Charrette processes. York, Pennsylvania:George Shumway.
Riggle, James D. 1994. “LESA and the Illinois farmlandpreservation act.” In A decade with LESA: the evolution ofland evaluation and site assessment, Frederick R. Steiner,James R. Pease, and Robert E. Coughlin eds., pp. 180–193.Ankeny, Iowa: Soil and Water Conservation Society.
Roberts, John C. 1979. “Principles of land use planning.” InPlanning the uses and management of land, Marvin T.Beatty, Gary W. Petersen, and Lester D. Swindale eds., pp.47–63. Madison, Wisconsin: American Society of Agron-omy, Crop Science Society of America, and Soil ScienceSociety of America.
Rogers, Golden, and Halpern, Inc. 1986. Reforestation in thePacific Islands. Washington, D.C.: U.S. Peace Corps.
Rose, Dan, Frederick Steiner, and Joanne Jackson. 1978/1979.“An applied human ecological approach to regional plan-ning.” Landscape Planning 5(4):241–261.
Rowe, Peter G. 1995. “Broadacre city and contemporary met-ropolitan development.” In Frank Lloyd Wright: thePhoenix papers, K. Paul Zygas and Linda Nelson Johnsoneds., pp. 48–64. Tempe, Arizona: Herberger Center for De-sign Excellence, Arizona State University.
Safina, Carl. 1998. Song for the blue ocean: encounters alongthe world’s coasts and beneath the seas. New York: HenryHolt.
Salvesen, D. 1990. Wetlands, mitigating and regulating devel-opmental impacts. Washington, D.C.: ULI, The UrbanLand Institute.
Sarkissian, Wendy. 1994. “Community participation in the-ory and practice.” In Casebook: community participation in
452BIBLIOGRAPHY
practice, Wendy Sarkissian and Kelvin Walsh eds., pp. 1–32. Murdoch, Australia: The Institute for Science andTechnology Policy, Murdoch University.
Satterlund, Donald R., and Paul W. Adams. 1992. Wildlandwatershed management (2nd ed.). New York: John Wiley &Sons.
Satterlund, Donald R., and Joseph E. Means. 1979. Solar radi-ation in the Pacific Northwest (Bulletin 874). Pullman,Washington: Washington State University College of Agri-culture Research Center.
Scandurra, Enzo, and Alberto Budoni. 1997. “For a criticalrevision of the concept of sustainable development: tenyears after the Brundtland report.” Paper presented to the20th Annual Meeting, 30 May- 1 June, Northeast RegionalScience Association, Boston, Massachusetts.
Scandurra, Enzo, and Silvia Macchi (eds.). 1995. Ambiente epianificazione: lessico per le scienze urbane e territoriali.Rome, Italy: Etas Libri.
Schauman, Sally. 1986. “Countryside landscape visual as-sessment.” In Foundations for visual project analysis, R. C.Smardon, J. F. Palmer, and J. P. Felleman eds., pp. 103–114.New York: John Wiley & Sons.
Schauman, Sally. 1988a. “Scenic value of countryside land-scapes to local residents: a Whatcom County, Washingtoncase study.” Landscape Journal 7(1):40–46.
Schauman, Sally. 1988b. “Countryside scenic assessment:tools and an application.” Landscape and Urban Planning15:227–229.
Schmandt, Michael Joseph. 1995. “Postmodernism and the southwest urban landscape” (Ph.D. dissertation).Tempe, Arizona: Arizona State University Department ofGeography.
Schneider, Devon M., David R. Goldchalk, and NormanAxler. 1978. The carrying capacity concept as a planningtool. PAS Report No. 338. Chicago, Illinois: AmericanPlanning Association.
Sellers, William D., Richard H. Hill, and Margaret Sander-son- Rae. 1985. Arizona climate: the first hundred years.Tucson, Arizona: University of Arizona.
Seltzer, Ethan. 1998. (Correspondence, December 2). Port-land, Oregon: Portland State University.
Shirvani, Hamid. 1990. Beyond public architecture. New York:Van Nostrand Reinhold.
Shumway, G. 1973. Charrette at York, Pennsylvania. York,Pennsylvania: George Shumway.
Siegler, Theodore R., and Neil L. Meyer. 1980. Assessing fiscalimpact of rural growth (WREP 29). Corvallis, Oregon:Western Rural Development Center, Oregon State University.
Singer, Michael J., Kenneth K. Tanji, and J. Herbert Snyder.1979. “Planning uses of cultivated cropland and pasture-land.” In Planning the uses and management of land, Mar-vin T. Beatty, Gary W. Petersen, and Lester D. Swindaleeds., pp. 225–271. Madison, Wisconsin: American Society
of Agronomy, Crop Science Society of America, Soil Sci-ence of America.
Sistrom, Peter. 1979. “The comp plan goes political.”Willamette Week 26 November, 6(3):1, 5.
Skidmore, E. L. 1994. “Wind erosion.” In Soil erosion researchmethods (2nd ed.), R. Lal ed., pp. 265–293. Ankeny, Iowa:Soil and Water Conservation Society.
Slater, T. R. (ed.). 1990. The built form of western cities. Leices-ter, England: Leicester University Press.
Slocombe, D. Scott. 1998a. “Lessons from experience withecosystem- based management.” Landscape and UrbanPlanning 40:31–39.
Slocombe, D. Scott. 1998b. “Defining goals and criteria forecosystem- based management.” Environmental Manage-ment 22(4):483–493.
Smith, Daniel S., and Paul Cawood Helmund (eds.). 1993.Ecology of greenways: design and function of linear conser-vation areas. Minneapolis, Minnesota: University of Min-nesota Press.
Smith, Paul Jr. 1992. “The poetics of landscape: on the aes-thetic experience of the ephemeral qualities of the land-scape” (unpublished master of landscape architecturethesis). Berkeley, California: University of California De-partment of Landscape Architecture.
Smith, Tony, Brian Trushinski, Jim Willis, and Gord Lemon.1997. The Laurel Creek watershed study. Waterloo, On-tario: Grand River Conservation Authority, and City ofWaterloo.
So, Frank S. 1979. “Finance and budgeting.” In The practice oflocal government planning, Frank S. So, Israel Stollman,Frank Beal, and David S. Arnold eds., pp. 115–149. Wash-ington, D.C.: International City Management Association.
So, Frank S. 1988. “Financing and budgeting.” In The practiceof local government planning (2nd ed.), Frank S. So and Ju-dith Getzels eds., pp. 435–471. Washington, D.C.: Interna-tional City Management Association.
Soesilo, Andy J., and K. David Pijawka. 1998. “Hazardouswaste planning.” In Encyclopedia of environmental analy-sis and remediation, Robert A. Meyers ed., pp. 2072–2090.New York: John Wiley & Sons.
Soil Conservation Service. 1975. National soils handbook.Washington, D.C.: U.S. Department of Agriculture.
Soil Survey Staff. 1951, 1975a. Soil survey manual. USDAHandbook 18. Washington, D.C.: U.S. Department ofAgriculture.
Soil Survey Staff. 1975b. Soil taxonomy—a basic system ofsoil classification for making and interpreting soil surveys.USDA Agricultural Handbook 436. Washington, D.C.:U.S. Department of Agriculture.
Soleri, Paolo. 1987. Arcosanti: an urban laboratory? (2nd ed.).Santa Monica, California: VTI Press.
Spirn, Anne Whiston. 1984. The granite garden. New York:Basic Books.
Spirn, Anne Whiston. 1988. “The poetics of city and nature:
453BIBLIOGRAPHY
towards a new aesthetic for urban design.” Landscape Jour-nal 7(2):108–126.
Spirn, Anne Whiston. 1989. “ ‘Deep structure’: on process,pattern, form, and design in the urban landscape.” In Link-ing landscape structure to ecosystem process, conference ab-stracts. Fort Collins, Colorado: Colorado State University.
Spirn, Anne Whiston. 1998. The language of landscape. NewHaven, Connecticut: Yale University Press.
Stankey, George H., and David W. Lime. 1973. Recreationalcarrying capacity: an annotated bibliography. GeneralTechnical Report INT- 3. Ogden, Utah: IntermountainForest and Range Experiment Station, U.S. Forest Service.
State of Washington. 1984. State environmental policy actrules. Olympia, Washington: Department of Ecology.
Steiner, Frederick. 1981. “Farmland protection in the Nether-lands.” Journal of Soil and Water Conservation 36(2):71–76.
Steiner, Frederick. 1983. “Resource suitability: methods foranalyses.” Environmental Management 7(5):401–420.
Steiner, Frederick. 1987. “Agricultural land evaluation andsite assessment: an introduction.” Environmental Manage-ment 11(3):375–377.
Steiner, Frederick, Richard Dunford, and Nancy Dosdall.1987. “The use of the land evaluation and site assessmentsystem in the United States.” Landscape and Urban Plan-ning 14(3):183–199.
Steiner, Frederick, and Laurel McSherry. 2000. “Teachingplan- making.” In AICP’s collegiate handbook for planners,Bruce W. McClendon and Anthony Catanese eds. Chicago,Illinois: American Institute of Certified Planners. (Forth-coming.)
Steiner, Frederick, Laurel McSherry, Dean Brennan, MarkSoden, Joe Yarkin, Douglas Green, James McCarthy,Catherine Spellman, John Jennings, and Kirsten Barré.1999. “Concepts for alternative suburban planning in theNorthern Phoenix Area.” Journal of the American PlanningAssociation 65(2):207–222.
Steiner, Frederick, James R. Pease, and Robert E. Coughlin(eds.). 1994. A decade with LESA: the evolution of landevaluation and site assessment. Ankeny, Iowa: Soil and Wa-ter Conservation Society.
Steiner, Frederick, Scott Pieart, Edward Cook, JacquelineRich, and Virginia Coltman. 1994. “State wetlands and ri-parian area protection programs.” Environmental Manage-ment 18(2):183–201.
Steiner, Frederick, David Pijawka, and Bill Kasson. 1998. Sus-tainable neighborhood design for the desert southwest (Finalreport for the U.S. Environmental Protection Agency).Tempe, Arizona: Arizona State University School of Plan-ning and Landscape Architecture.
Steiner, Frederick, and John Theilacker. 1979. “Locating fea-sible areas for rural housing in Whitman County, Wash-ington.” Journal of Soil and Water Conservation 34(6):283–285.
Steiner, Frederick, and John Theilacker (eds.). 1984. Protect-ing farmland. Westport, Connecticut: AVI Publishing.
Steiner, Frederick, David C. Wood, and Robert Bowie. 1989.“The use of ecological planning information for growthmanagement planning: the Teller County/Woodland Park,Colorado case study” (paper). Denver, Colorado: Univer-sity of Colorado School of Architecture and Planning.
Steinitz, Carl. 1988. “When visual quality and ecological in-tegrity are mutually supportive or in conflict (and what todo about it): a case study based on (still- in- progress) re-search in Acadia National Park.” Paper presented at theThird Annual Landscape Ecology Symposium. Albu-querque, New Mexico.
Steinitz, Carl. 1990. “A framework for the theory applicableto the education of landscape architects (and other envi-ronmental design professionals).” Landscape Journal9(2):136–143.
Steinitz, Carl. 1993a. “A framework for theory and practice inlandscape planning.” GIS Europe (July):42–45.
Steinitz, Carl. 1993b. “GIS: a personal historical perspective.”GIS Europe 46:38–46.
Steinitz, Carl, Michael Binford, Paul Cote, Thomas Edwards,Jr., Steven Ervin, Richard T. T. Forman, Craig Johnson,Ross Kiester, David Mouat, Douglas Olson, Allan Shearer,Richard Toth, and Robin Wills. 1996. Biodiversity andlandscape planning: alternative futures for the region ofCamp Pendleton, California. Cambridge, Massachusetts:Harvard University Graduate School of Design.
Steinitz, Carl, Doug Olson, Allan Shearer, Irene Fairley, andSusan McNally (eds.). 1994. Alternative futures for MonroeCounty, Pennsylvania. Cambridge, Massachusetts: HarvardUniversity Graduate School of Design.
Steinitz, Carl, Paul Parker, and Lawrie Jordan. 1976. “Handdrawn overlays: their history and prospective uses.” Land-scape Architecture 9:444–455.
Stokes, Samuel N., A. Elizabeth Watson, Genevieve P. Keller,and J. Timothy Keller. 1989. Saving America’s countryside.Baltimore, Maryland: Johns Hopkins University Press.
Stokes, Samuel N., A. Elizabeth Watson, and Shelley Mastran.1997. Saving America’s countryside: a guide to rural conser-vation (2d ed.). Baltimore, Maryland: Johns Hopkins Uni-versity Press.
Strahler, A. N. 1957. “Quantitative analysis of watershed geo-morphology.” Transactions of the American GeophysicalUnion 38:913–920.
Sudman, Seymour, and Norman M. Bradburn. 1983. Askingquestions, a practical guide to questionnaire design. SanFrancisco, California: Jossey- Bass.
Suplee, Curt. 1998. “Earth’s plants imperiled.” InternationalHerald Tribune (9 April):1 and 4.
Survey Research Center. 1976. Interviewer’s manual (reviseded.). Ann Arbor, Michigan: Institute for Social Research,University of Michigan.
Sutro, Suzanne. 1984. Farmland protection strategies for the
454BIBLIOGRAPHY
Connecticut River Valley of Massachusetts. Philadelphia,Pennsylvania: Mid- Atlantic Regional Office, U.S. NationalPark Service.
Tahoe Regional Planning Agency. 1982. Environmental im-pact statement for the establishment of environmentalthreshold carrying capacities. South Lake Tahoe, California.
Tarjuelo, J. M., and J. A. de Juan. 1999. “Crop water manage-ment.” In CIGR- handbook, Vol. 1: Land and water engi-neering, H. N. van Lier, L. Santos Pereira, and FrederickSteiner eds. St. Joseph, Michigan: American Society ofAgricultural Engineers.
Tarlet, Jean. 1985. La planification écologique: méthodes ettechniques. Paris: Economica.
Tarlet, Jean. 1997. Intégration des données de l’environnementnaturel dans l’aménagement et la gestion de l’espace par laméthode de planification écologique. Aix Marseille, France:Université de Provence.
Taylor, S. 1992. Editorial. Australian Planning August:1–2.Teller County Planning Commission. 1990. Growth man-
agement plan, Teller County, Colorado. Cripple Creek, Colorado.
Teller County Planning Commission. 1995. 4- Mile regionalaction plan. Cripple Creek, Colorado.
Teller County Planning Commission. 1998a. Divide regionalplan. Divide, Colorado: Divide Planning Committee.
Teller County Planning Commission. 1998b. Florissant re-gional action plan (draft). Cripple Creek, Colorado: Floris-sant Planning Committee.
Tempe Daily News Tribune. 1995. Points and viewpoints. De-cember 3:A9.
Thayer, Robert L., Jr. 1994. Gray world, green heart: technol-ogy, nature, and the sustainable landscape. New York: JohnWiley & Sons.
Thompson, George F., and Frederick Steiner (eds.). 1997.Ecological design and planning. New York: John Wiley &Sons.
Thompson, J. W. 1993. “A sketching charrette is held in SanFrancisco.” Landscape Architecture 83(5):48–56.
Thornbury, William D. 1969. Principles of geomorphology(2nd ed.). New York: John Wiley & Sons.
Tiner, R. W. 1984. Wetlands of the United States: current statesand recent trends. Washington, D.C.: U.S. Fish and WildlifeService.
Tolba, M. K., O. A. El- Kholy, E. El- Hinnawi, M. W. Holdgate,D. F. McMichael, and R. E. Munn (eds.). 1992. The worldenvironment 1972–1992. London: Chapman & Hall.
Toner, William. 1978. Saving farms and farmlands: a commu-nity guide (PAS Report No. 333). Chicago, Illinois: Ameri-can Planning Association.
Toner, William. 1981. Zoning to protect farming: a citizens’guidebook (National agricultural lands study). Washing-ton, D.C.: U.S. Government Printing Office.
Trancik, Roger. 1986. Finding lost space. New York: Van Nos-trand Reinhold.
Treu, Maria Cristina, and Marcello Magoni. 1998. “The envi-ronmental sustainability index in the plan for the Cremonaarea.” In Creating Sustainable Places, Audrey BrichettoMorris ed., pp. 21–27. Tempe, Arizona: Herberger Centerfor Design Excellence, Arizona State University.
Tuan, Yi- Fu. 1974. Topophilia: a study of environmental per-ception attitudes, and values. Englewood Cliffs, New Jersey:Prentice- Hall.
Turner, Raymond M., and David E. Brown. 1994. “Sonorandesertscrub.” In Biotic communities: southwestern UnitedStates and northwestern Mexico, David E. Brown ed., pp.190–203. Salt Lake City, Utah: University of Utah Press.
Turoff, M. 1970. “The design of policy Delphi.” TechnologicalForecasting and Technical Change 2:149–171.
Turoff, M. 1975. “The policy Delphi.” In The Delphi method:techniques and applications, H. A. Linstone and M. Turoffeds., pp. 84–100. Reading, Massachusetts: Addison- WesleyPublishing Company.
Tyrwhitt, Jacqueline. 1950. “Surveys for planning.” In Townand country planning textbook. London: ArchitecturalPress.
U.S. Army Corps of Engineers. 1976. Final environmental im-pact statement: New River and Phoenix city streams, Mari-copa County, Arizona. Los Angeles, California.
U.S. Bureau of the Census. 1950, 1960, 1970, 1980, 1990. U.S.census of the population. Washington, D.C.: U.S. Depart-ment of Commerce, U.S. Government Printing Office.
U.S. Bureau of the Census. 1983. 1980 Census of population,volume 1, characteristics of the population, chapter C, gen-eral social and economic characteristics, part 7, Colorado.Washington, D.C.: U.S. Department of Commerce.
U.S. Bureau of Land Management. 1988. Public land statistics1987. Washington, D.C.: U.S. Department of Interior.
U.S. Bureau of Land Management. 1998. Public land statistics1997. Washington, D.C.: U.S. Department of Interior.
U.S. Congress. 1969. National environmental policy act of1968 (Public Law 91- 190).
U.S. Congress. 1979. “National forest system land and re-source management planning.” Federal Register 44(181):53983–53999.
U.S. Department of Agriculture. 1983. National land evalua-tion and site assessment handbook. Washington, D.C.: SoilConservation Service.
U.S. Department of Agriculture. 1984. “Farmland protectionpolicy, final rule.” Federal Register 49(130):27716–27727.
U.S. Department of the Interior. 1988. “A report to Congressby the Secretary of Interior. The impact of federal pro-grams on wetlands.” The lower Mississippi alluvial plainand prairie pothole region, Vol. I. Washington, D.C.: U.S.Government Printing Office.
U.S. Department of Transportation. 1976a. Effective citizenparticipation in transportation planning. Volume II, a cata-log of techniques. Washington, D.C.: Socio- EconomicStudies Division, Federal Highway Administration.
455BIBLIOGRAPHY
U.S. Department of Transportation. 1976b. Effective citi-zen participation in transportation planning, volume 1,community involvement processes. Washington, D.C.: Socio- Economic Studies Division, Federal Highway Administration.
U.S. General Accounting Office. 1988. Wetlands, the Corps ofEngineers’ administration of the Section 404 program.Washington, D.C.: U.S. Government Printing Office.
U.S. Environmental Protection Agency. 1988. America’s wet-lands: our vital link between land and water. Washington,D.C.: Office of Wetlands Protection, Office of Water.
U.S. Fish and Wildlife Service. 1981. Standards for the devel-opment of habitat suitability index models. Washington,D.C.: Division of Ecological Services.
U.S. Forest Service. 1973. National forest landscape manage-ment Vol. 1, Agricultural Handbook Number 434. Washing-ton, D.C.: U.S. Government Printing Office.
U.S. Forest Service. 1974. National forest landscape manage-ment Vol. 2, Agricultural Handbook Number 462. Washing-ton, D.C.: U.S. Government Printing Office.
U.S. National Park Service. 1985. Connecticut Valley actionprogram, landowner survey report. Philadelphia: Mid- Atlantic Regional Office.
U.S. National Park Service. 1986. Zoning review for the Con-necticut River Valley of Massachusetts. Philadelphia: Mid- Atlantic Regional Office.
U.S. Natural Resources Conservation Service. 1998. Na-tional planning procedures handbook (amendment 2).Washington, D.C.: U.S. Department of Agriculture.
U.S. Soil Conservation Service. 1978. National conservationplanning manual. Washington, D.C.: U.S. Department ofAgriculture.
University of Pennsylvania. 1985. Landscape architecture andregional planning 501 course primer. Philadelphia, Pennsyl-vania: Department of Landscape Architecture and Re-gional Planning.
Urban Ecology. 1996. Blueprint for a sustainable Bay Area.Oakland, California.
Van der Ryn, Sim, and Stuart Cowan. 1996. Ecological design.Washington, D.C.: Island Press.
van der Wal, Coenraad. 1997. In Praise of the ordinary. Rot-terdam, The Netherlands 010 Publishers.
Ventura, Steve. 1988. Dane county soil erosion control plan.Dane County, Wisconsin.
Verburg, Edwin A., and Richard A. Coon. 1987. “Planning inthe U.S. Fish and Wildlife Service.” Trends 24(2):20–26.
Verma, Niraj. 1998. Similarities, connections, and systems: thesearch for a new rationality for planning and management.Lanham, Maryland: Lexington Books.
Vink, A. P. A. 1975. Land use in advancing agriculture. NewYork: Springer- Verlag.
Vroom, M. J., J. B. Struik, and M. W. M. van der Toorn. 1980.Landscape planning in coastal areas (Annex- B). Wagenin-
gen, The Netherlands: Agricultural University Depart-ment of Landscape Architecture.
Waananen, A. O., J. T. Limerinos, W. J. Kockelman, W. E. Spangle, and M. L. Blair. 1977. Flood- prone areas andland- use planning–selected from the San Francisco bay re-gion (U.S. Geological Survey Professional Paper 942).
Wackernagel, Mathis, and William Rees. 1996. Our ecologicalfootprint: reducing human impact on the earth. Gabriola Is-land, British Columbia: New Society Publishers.
Wagner, J. Alan. 1974. “Recreational carrying capacity recon-sidered.” Journal of Forestry 72(5):274–278.
Wallace, McHarg, Roberts, and Todd. 1969. Ecological studyfor Twin Cities Metropolitan Region, Minnesota. Preparedfor Metropolitan Council of the Twin Cities Area. Phila-delphia, Pennsylvania: National Technical Information Se-ries, U.S. Department of Commerce.
Wallace, McHarg, Roberts, and Todd. 1972. An ecologicalplanning study for Wilmington and Dover, Vermont. Brat-tleboro, Vermont: Windham Regional Planning and De-velopment Commission and the Vermont State PlanningOffice.
Wallace, McHarg, Roberts, and Todd. 1976. Lake Austingrowth management plan. Austin, Texas: Department ofPlanning, City of Austin.
Walters, Kenneth, and P. A. Glancy. 1969. Reconnaissance ofgeology and ground- water occurrence in Whitman County,Washington. Water Supply Bulletin No. 26. Olym-pia, Washington: Washington Department of Water Resources.
Want, W. L. 1990. Law of wetlands regulation (also 1992 re-vised edition). New York: Clark Boardman Company.
Wardwell, John M., and C. Jack Gilchrist. 1980. “The distri-bution of population and energy in nonmetropolitanareas: confluence and divergence.” Social Science Quarterly61(3 and 4):567–580.
Washington Department of Ecology. 1984. State environmen-tal policy act (SEPA) handbook. Olympia, Washington.
Washington Department of Ecology. 1995. State environmen-tal policy act (SEPA) handbook. Olympia, Washington.
Weber, Bruce, and Richard Beck. 1979. Minimizing publiccosts of residential growth (WREP 17). Corvallis, Ore-gon: Western Rural Development Center, Oregon StateUniversity.
Westman, Walter E. 1985. Ecology, impact assessment, and en-vironmental planning. New York: John Wiley & Sons.
Whitehand, J. W. R. (ed.). 1981. The urban landscape: histori-cal development and management. London: AcademicPress.
Whitman County Regional Planning Council. 1978. Whit-man County comprehensive plan. Colfax, Washington.
Whitman County Regional Planning Council. 1979. Whitman County zoning regulations, revised. Colfax,Washington.
456BIBLIOGRAPHY
Whitmore, William A. 1993. “Verde River visual assessment:a study of methods” (unpublished master of environmen-tal planning thesis). Tempe, Arizona: Arizona State Uni-versity Department of Planning.
Whitmore, William A., Edward Cook, and Frederick Steiner.1995. “Public involvement in visual assessment: the VerdeRiver corridor study.” Landscape Journal 14(1):26–45.
Wickersham, Kirk, Jr. 1978. “Reform of discretionary land- usedecision- making: point systems and beyond.” Zoning andPlanning Law Report 1(9):65–71.
Wilkinson, Charles F., and H. Michael Anderson. 1985.“Land and resource planning in national forests.” OregonLaw Review 64(1 & 2):1–373.
Williams, M. 1990. “Understanding wetlands.” In Wetlands, athreatened landscape, M. Williams ed., pp. 1–41. Oxford,U.K.: Basil Blackwell.
Wilson, Alex, Jennifer L. Uncapher, Lisa McManigal, L.Hunter Lovins, Maureen Cureton, and William D.Browning. 1998. Green development: integrating ecologyand real estate. New York: John Wiley & Sons.
Wischmeier, W. H., and D. D. Smith. 1965. Predicting rain-fall—erosion losses from cropland east of the Rocky Moun-tains: guide for selection of practices for soil and water con-servation (Agricultural Handbook No. 282). Washington,D.C.: U.S. Department of Agriculture.
Wischmeier, W. H., and D. D. Smith. 1978. Predicting rain-fall—erosion losses: a guide to conservation planning (Agri-cultural Handbook No. 537). Washington, D.C.: U.S. De-partment of Agriculture.
Wisconsin Supreme Court. 1972. Just vs. Marinette County (4ERC 1842).
World Commission on Environment and Development(WCED). 1987. Our common future. Oxford, UK: OxfordUniversity Press.
World Wildlife Fund. 1992. Statewide wetlands strategies: aguide to protecting and managing the resource. Washington,D.C.: Island Press.
Wright, John B. 1993. Rocky Mountain Divide: selling and sav-ing the West. Austin, Texas: University of Texas Press.
Wright, Lloyd. 1981. “Agricultural land evaluation and as-sessment systems: pilot program” (unpublished briefingpaper). Washington, D.C.: Soil Conservation Service, U.S.Department of Agriculture.
Wright, Lloyd, Steve Aradas, Ron Darden, Sue Pfluger, andWarren Zitzmann. 1982. “Farmland: want to protect?”Planning 48(7):20–21.
Xiang, Wei- Ning. 1996. “GIS- based riparian buffer analysis:injecting geographic information into landscape planning.”Landscape and Urban Planning 34:1–10.
Yaro, Robert D., Randall G. Arendt, Harry L. Dodson, andElizabeth A. Brabec. 1988. Dealing with change in the Con-necticut River Valley: a design manual for conservation anddevelopment. Amherst, Massachusetts: Center for RuralMassachusetts, University of Massachusetts.
Yaro, Robert D., and Tony Hiss. 1996. A region at risk: thethird regional plan for the New York–New Jersey–Connecti-cut metropolitan area. Washington, D.C.: Island Press.
Young, Gerald L. 1974. “Human ecology as an interdiscipli-nary concept: a critical inquiry.” Advances in Ecological Re-search 8:1–105.
Young, Gerald L. 1976. “Environmental law: perspectivesfrom human ecology.” Environmental Law 6(2):289–307.
Young, Gerald L. 1978. Human ecology as an interdisciplinarydomain: an epistemological bibliography. Monticello, Illi-nois: Vance Bibliographies.
Young, Gerald L. 1989. “A conceptual framework for an in-terdisciplinary human ecology.” Acta Oecologiae Hominis1:1–136.
Young, Gerald L. (ed.). 1983. Origins of human ecology.Stroudsburg, Pennsylvania: Hutchinson Ross Publishing.
Young, Gerald L., Frederick Steiner, Kenneth Brooks, andKenneth Struckmeyer. 1983. “Determining the regionalcontext for landscape planning.” Landscape Planning10(4):269–296.
Zube, Ervin H. 1980. Environmental evaluation. Monterey,California: Brooks/Cole.
Zube, Ervin H., Gary Hartshorn, Peter Kareiva, Lloyd Loope,Thomas Loveland, James W. Merchant, Maurice Nyquist,James Quinn, Terry L. Root, Frederick Steiner, and JohnTerborg. 1994. Peer review panel report of the national GAPanalysis program from the national biological survey.Moscow, Idaho: National Biological Survey.
Zube, Ervin H., James L. Sell, and Jonathan G. Taylor. 1982.“Landscape perception: research, application and theory.”Landscape Planning 9:1–33.
457BIBLIOGRAPHY


INDEX
459
Italics indicate figures and tables.
1000 Friends of Oregon, 23, 369–70100-year floodplains, 81, 81, 346
Aberley, Doug, 413Absolute policies, 338–39Accessibility, 285Active Management Areas, 75–76Actual land suitability, 207, 210Adams, Ansel, 8Adams, Paul, 52Adams, Thomas, 202, 321–23Administration
budget and, 385–91current planning and, 382–85ecological planning and, 23impact analyses and, 391–404overview of, 381–82Portland, OR and, 404–7Tucson, AZ and, 407–9
Administrative planners, defined, 7Adversary planners, defined, 7Advisory committees, 276Advocacy planners, defined, 7Agency for International Development,
393Agricultural land, classification of, 18Agricultural Land Evaluation and Site As-
sessment (LESA) Systemhypothetical example of, 195, 198, 199modified version of, 194–98, 196overview of, 191–94performance standards and, 338use of at federal level, 198–200, 201
Agricultural land use, 192–93Agricultural lands, defined, 343Agricultural Production Areas, 265Agricultural protection zoning (APZ), 332
Agricultural viability factors, 193Agriculture
census information for, 148economic considerations of, 142Food Security Act and, 369innovative zoning for protection of, 373–
77New Jersey Pinelands and, 179, 265settlement patterns and, 114soil classification and, 188–200taxes and, 366–67wetland loss and, 84zoning and, 332
Agroforestry, 293Agronomic level, 14. See also Field system
levelAhwahnee Principles, 21, 22, 293Air pollution, 127, 343–44Alabama, 331Albedo, 97–98Alfisols, 94Alinsky approach, defined, 30Alinsky, Saul, 7, 8, 30Alluvial fans, 64, 68, 91, 96American Farmland Trust, 369, 377, 400–
402Andrew (hurricane), 236Annexation, 368Antiquities Act, 352Apaches, 108Appleyard, Donald, 171Application and evaluation, 295Applied human ecology, 9. See also Ecologi-
cal planningApse Effect, 316APZ. See Agricultural protection zoningAquifers, 75, 116–7, 119, 126Arendt, Randall, 9, 318, 321Aridisols, 94
Arizona. See also Phoenix metropolitan area
administration and, 407–9Broadacre City and, 314–16citizen involvement in, 273climate of, 57geological provinces of, 63implementation and, 377–79Phoenix Environmental Showcase Home
and, 313, 314, 313–14Tucson Solar Village and, 316–17, 317
Arizona State Lands Department, 106Arizona State University, 32–33Arroyo Vista Charrette, 301, 301–4, 304Arroyos. See WashesAsotin County, WA, 204, 206, 207, 208, 209Aspect, 71, 97Associations, 87Atlantic Coastal Plain formation, 124Australia, 237Avissar, R., 56
Babcock, Richard, 330Bajadas, 64, 91, 116Baker v. City of Milwaukie, 332Balling, Robert, 61Barcelona, Spain, 357Barnett, Jonathan, 323Barren land, 18Base maps, 53–55, 54Base submittal requirements for ESLO, 378Baseline natural resources, 16Basin and Range Province, 63–64, 67Bassett, Edward M., 331Beatley, Timothy, 9, 12, 293, 351, 413Beck, Richard, 368Bedrock geology maps, 65Bentham, Jeremy, 6Berger, Jon, 9, 139, 176, 185, 204, 204
Berry, Wendell, 9Bettman, Alfred, 331Bicycle paths, 304–11, 306, 307, 310Bill of Rights, 6Bioclimatic zones, 120Biodiversity, 130, 178Bivariate relationships, 116, 116–20, 174–75Black Hawk County, IA, 373–77, 376Blair, John, 297Blueprint for a Sustainable Bay Area, 285–88,
286Boards of adjustments, 383Bolan, Richard, 30Botkin, D. B., 217Boundaries
carrying capacity and, 218Cave Creek Wash preservation and, 231,
232in Desert View Tri-Villages Area, 53urban growth, 405, 405, 407watersheds, planning and, 52–53
Boundary review boards, 383Bowers, Deborah, 363–64, 365, 368Boyer, Ernest, 278Brabec, Elizabeth, 318Bradburn, Norman, 169Brady, Ward, 100, 415Brandywine Valley Association, 369Brazel, Anthony, 56, 57, 97–98Brazel, Sandra, 61Breckenridge Development Code, 338–39Broadacre City, 314–16Broderson, William, 86–87Brownfield sites, 367Brundtland Commission, 11Bucks County, PA, 336–37, 338Budgets, 259Budoni, Alberto, 12Building codes, 299–300, 355–57Building materials, 302–303Buildings as physiographic features, 71Bureau of Land Management (BLM),
365Burke, Jim, 230, 257Bursage flats, 100Bush, George H. W., 333Butler, Stuart M., 367Butterfield Stage Route, 108, 110Byrne, Brendan T., 45–46
CABO code. See Council of AmericanBuilding Officials code
Caldwell, Lynton, 417Caliche. See Hardpan soilsCalifornia, 331California cougars, 134, 138Calthorpe, Peter, 9Camelback East Primary Core Urban De-
sign Charrette, 236–37
Camp Pendleton region (CA)biophysical inventory and analysis and,
130–36decision making in, 247–50human community inventory and analy-
sis and, 178–85map of, 131population forecast for, 182visual types in, 183, 184
Canada, 237Canty, Dennis, 305CAP. See Central Arizona ProjectCapability, suitability vs., 187Capability analysis. See also Suitability
analysiscarrying capacity concept and, 217–19computer applications for, 213–17Dutch models for, 207–13McHarg suitability analysis method for,
200–207Medford Township, NJ and, 219–20Natural Resources Conservation Service
systems for, 188–200overview of, 187–88rural housing areas in Whitman County,
WA and, 220–22, 225–26Capability classes, 189Capability subclasses, 189Capability units, 189Capital costs, 399, 400Capital improvement programming (CIP),
364–65, 382, 390–91Carlson, Christine, 305Carrying capacity concept, 217–19Carter, Jimmy, 39, 45, 373Catchments, 14. See alsoWatershedsCategorical expulsions, 394Catena, 87Catton, William, 217Cave Creek Wash, 77, 230–32, 231, 232, 256,
258, 370, 415CC&Rs. See Codes, covenants, and restric-
tions (CC&Rs)Census Catalog and Guide, 148Census data, 110, 144, 148, 153, 162Center for Community Economic Develop-
ment, 279–81, 285Center for Rural Massachusetts, 318, 321,
325Central Arizona Project (CAP), 76Central Park (NYC), 8Change agents, 7Chaos theory, 412Characteristics. See Population characteris-
ticsCharles Eliot, Landscape Architect (Eliot),
200Charrettes
Arroyo Vista, 301, 301–4, 304
Camelback East Primary Core Urban De-sign, 236–37
community education and, 278conceptual design from, 296–304Desert View Tri-Villages Area (Phoenix,
AZ) and, 237–41goals and objectives of, 302La Lomita, 298–301, 300, 301overview of, 235–36process of, 236–37Sonoran North Land Use Character, 237–
41, 238, 239, 240, 241, 255–57, 256,296–97
South Avenue Streetscape, 237Surrey Design, 237
Cherioni soils, 91Chimney Effect, 316China, 237Chinese immigrants, 331Chipman, Carol, 311Choices. See Options and choicesChorographies, defined, 52Churches, 149Ciekot, Stephanie, 77, 91, 116, 120CIP. See Capital improvement program-
mingCircuit breaker tax relief laws, 366, 366–67Circulation, 302–3Citizen honoria, 275Citizen involvement. See Public participa-
tionCitizen referendums. See ReferendumsCitizen training, 275Citizens’ advisory committees, 29, 241–42,
274City Beautiful Movement, 8City Planner Handbook, 245Civano, 316–17, 317Clark, Janice, 376Classification systems, 15–16, 18Clays, 91Clean Water Act (CWA), 346Climate
as baseline natural resource, 16defined, 56Holridge life zones and, 121, 124–25landscape planning and, 57micro, 95–99, 116physiography and, 117regional, 56–62, 127soils and, 118topo, 95–96, 99vegetation and, 118
Coastal Plain formation, 124Coastal Zone Management Act (CZMA), 8Code of Hammurabi, 355Codes, covenants, and restrictions
(CC&Rs), 369Coffmann, Jim, 230
460INDEX
Cognitive paradigm, 172Cohanesy-Kirkwood aquifer system, 126,
126Cohort-survival model, 154–57, 158Colfax Avenue demonstration project, 312,
312–13, 313, 314Collection and analysis, 295Colleges and Universities, 149Collins, Mike, 415Colorado Plateau, 63COMLUP, 214Communities, 287. See also Human com-
munitiesCommunity context, 303Community education, 271–72, 275–88Community gardens, 300Community health and safety program, 389Community involvement. See Public partic-
ipationCommunity needs assessments, 175–76Community organizations, 144, 149Community organizers, 7Community planning, 22Community planning councils, 30Community Rating System, 345Community services, 402, 403Compatibility with comprehensive develop-
ment plans, 193Components of change, 153, 154Comprehensive management plans, 269Comprehensive planning, defined, 4Comprehensive plans, 20, 253Computer aided design (CAD), 323Computer applications, 213–17, 295Concentrated preserve concept, 232–33, 233Condemnation, 329–30, 358. See also Emi-
nent domainConferences, 275Conflict resolution, 4Conflicts, 177, 177Conn, William, 373Connecticut. See New York–New Jersey–
Connecticut metropolitan regionConnecticut River Valley (MA), 317–21,
319, 320, 321, 322, 323, 324, 325–27Connectivity, 173–75, 174. See also Bivariate
relationshipsConsent, planning and, 7Conservation, 206, 287, 293–95Conservation goals, 42, 44Conservation plans, 295Constraints, suitability analysis and, 204–6,
209, 210Construction sites, 63Context, 287Contiguous exurban subdivisions, 114Contingency plans, 254, 412Conzen, M. R. G., 71, 173Coon, Richard, 257
Cooperative Extension Service, 277–78Coordination, 367–69Coping with Growth series, 278Cougars, 134, 138Coughlin, Robert, 194–98Council of American Building Officials
(CABO) code, 355Council on Environmental Quality, 7, 391–
92Covenants, 357–58Cowan, Stuart, 21Cranberries, 46Cranham, Ronald, 368Credit program. See Development creditsCreighton, James, 27–28Creosote bush-bursage flats, 100Cripple Creek, CO, 269Critical areas, 339–44, 345Crop Suitability Rating (CSR), 376Cross-compliance, 369Cross-cutting relationships, 63CSR. See Crop Suitability RatingCullingworth, Barry, 334Cumulative impacts, 218CWA. See Clean Water Act
Dane County, WI, 215, 279–81Dane County Land Records Project, 215Daniels, Tom, 363–64, 365, 368, 377Data-overlay technique, 202Davis, CA, 355–57Dayton, OH, 387–91De Chiara, Joseph, 334Decision making, 272, 274, 275, 283. See also
Options and choicesDecision support, 295Deed restrictive covenants, 357. See also
CovenantsDeep context, 291–92Deep structure, 291Deferred taxation, 366DeFranceaux, Cynthia, 254DeGrove, John, 45DeKalb County, IL, 190DELMARVA, 213Delphi, overview of, 33–34Delphi Expert Opinion Panels, 34Demographics, 17. See also Census dataDensity, 153, 154, 302–3Department of Defense, 365Department of Ecology (DOE), 394–96Department of Land Conservation and De-
velopment, 41–45Dependency ratios, 153, 156Desert overlay district, 370–71Deserts, 75, 92Desert Scrub zone, 122Desert View Tri-Villages Area (Phoenix, AZ)
base map of, 54
bivariate relationships in elements of,116, 116–18
charrettes and, 237–41, 238, 239, 240, 241climate as inventory element in, 57, 58–60cyclical planning in, 413–17decision making and, 230–35development projections for, 160, 161drainage of, 67erosion potential of, 95implementation strategies of, 259–60implement matrix of, 372–73labor force data for, 164landsat image of, 72landscape map of, 261, 262landscape plan adoption in, 255–57, 256land use history of, 108–9, 110land use in, 111, 112, 113, 114layer cake diagrams for, 120, 121, 122, 123macroclimate influences on, 60major types of rock in, 64–65, 66overview of, 53regional context of, 56regions of, 157, 159slope analysis for, 68–71soils of, 87, 88, 90–91statement of policies for, 257–59suitability analyses for, 215, 216vegetation of, 100–103, 101, 102, 103water resources and, 75–76, 77, 79, 81wildlife of, 104–6, 105
Desert washes, 297, 298Design
checklist for evaluation of, 294conceptual of new facilities, 304–11Connecticut River Valley (MA) and, 317–
21, 319, 320, 321, 322, 323, 324, 325–27demonstration projects and, 311–14guidelines and controls for implementa-
tion of, 339individual land-users and, 293–95innovative projects in, 314–17New York–New Jersey–Connecticut met-
ropolitan region and, 321–27, 326, 327simulation and, 295–96, 296, 297site design, 292–93testing planning concepts through, 291–
92Design boards, 383Design of Residential Areas (Adams), 202Design with Nature (McHarg), 204, 363Design Workshop, 316Determinations of significance or non-
significance, 394, 396Development, suitability analysis and,
206–7Development areas, 363–64Development credits, 266Development goals, 42–43Development projections, 159–61
461INDEX
Development rights, 360–64Developmental credits, 364Developmental scenarios, 244Dewey, John, 412Dickert, Thomas, 218Digital elevation model data, 54, 73Digital line graph data, 54Dillman, Don, 35, 38, 168–69, 242Direction, 71, 97Discussion drafts, 246Dispersed preserve concept, 233, 234Distribution, 153Disturbance adaptive plants, 103Disturbed Landscape, 132Dodge Foundation. See Geraldine R. Dodge
FoundationDodson, Harry, 318, 323Dolan v. City of Tigard, 333Drainage basins, 14. See also WatershedsDrainage divides, 14Drainageways, 52, 132, 137Duane, Timothy, 113–14Duany, Andrés, 236, 316–17, 330Duerksen, Christopher, 104, 351–52, 358,
359Dunford, Richard, 366Dutch Forest Service, 20Dutch models. See Holland
Earth. See Geologic informationEasements, 359–60Eber, Ron, 23Ebon soils, 91École des Beaux-Arts, 235–36Ecological design, 21, 326–27Ecological footprint approach, 218–19Ecological integrity, 302Ecological planning
administration and, 21–23citizen involvement, community educa-
tion and, 13, 20–21design exploration and, 21detailed studies and, 16–18development of concepts for planning
area and, 18–20goal establishment and, 12–13implementation and, 21–23landscape analysis on local level and, 14–
16landscape analysis on regional level and,
13–14landscape plan development and, 20model for, 11overview of, 9–12problem and opportunity identification
and, 12Ecological processes, Camp Pendleton re-
gion (CA) and, 134–35, 138Ecologically critical areas, 341, 341, 344
Ecology, 4–5, 9, 51–52Economic analyses, 161–65, 162Economic base analysis, 163–65, 166Economic base surveys, 161–62Economic impact analyses, 396–99Economic multipliers, 398, 399Economically critical areas, 341, 341, 342Economy program, 389Eco-Northwest, 406Ecosystem management, 4Ecotones, 103Edges, 132Education, 20–21. See also Community edu-
cationElevation, 68, 80, 103, 117Elevation maps, 68, 69, 73Eliot, Charles, 200–202, 360Elite interviewing process, 169Emery, Franklin, 318Emery Farm, 318–21Eminent domain, 330, 358. See also Con-
demnationEmployment multipliers, 398Empowerment zones, 367Endangered species, 105Endangered Species Act (ESA), 351Energy, 302–3Energy resources, 63England, 5–6Enterprise zones, 366, 367Entisols, 94Environmental analysis for ESLO, 378–79Environmental assessments, 392Environmental boards, 383Environmental checklists, 396Environmental duties, 413Environmental impact analyses, 394–96Environmental impact statements (EIS),
391–96Environmental planning, 4Environmental Protection Agency, 347Environmental resource zone (ERZ),
407–9Environmental Showcase Home. See
Phoenix Environmental ShowcaseHome
Erosion, 87, 90, 95ERZ. See Environmental resource zoneEstuaries, 82Euclid, Ohio (Village of) v. Ambler Realty
Co., 331Environmentally sensitive areas, 339–44Environmentally Sensitive Lands Ordi-
nance, 377–79European Union, 5–6, 393Ewan, Joseph, 100, 117, 230–32, 257, 415Exactions, 329–30, 358–59Existing land use, 107–8Experiential paradigm, 172
Expert paradigm, 171Export activities, 398Export-base approach, 398Externalities, 331Exurban development patterns, 113–15Eyck, Christy Ten, 316
Faas, Ronald, 397–98Fabos, Julius, 214Face-to-face interviews, 169–70Factor ratings, 191Factor scale, 191Factors, 191Falini, Paola, 148Farm conservation plans, 293–95Farm system level, 14Farmland Protection Policy Act (FPPA),
198–99Fasano v. Board of County Commissioners of
Washington County, 332Federal Emergency Management Agency
(FEMA), 344–46Federal Insurance Administration, 344Federal Water Pollution Control Act, 347Fee-simple purchases, 358FEMA. See Federal Emergency Management
AgencyFertility, 155, 158Field system level, 14Fifth Amendment, 358Findings, 394Fire hazard areas, 343Fire insurance maps, 148FIRMs. See Flood Insurance Rate MapsFirst English Evangelical Lutheran Church v.
County of Los Angeles, 333First-order streams, 78Fiscal impact analysis, 399–402Fish Ewan, Rebecca, 100, 117, 230–32, 415Fisher, Howard, 213Flash flooding, 81Flood Insurance Rate Maps (FIRMs), 345–
46Flood prone areas, 343Flooding, 52, 78–81, 84, 146–47Floodplains, 78–81, 79, 344–46Florida, 368–69Fluvents, 119Focus groups, 31–33Fog, 97, 97Fogleman, Valerie, 393Food Security Act, 369Food webs, 106, 109Ford, John, 8Forecasting, 33Forest and Rangeland Renewable Resources
Planning Act, 188Forest Areas, 265Forestlands, 18
462INDEX
Forman, Richard, 52FPPA. See Farmland Protection Policy ActFrameworks, 5–9, 10Franklin Land Trust, 321Freemont County, ID, 338, 338Friedmann, John, 4, 20Frost, 97, 97Fry, Jana, 415
Gaia hypothesis, 99Gans, Herbert, 13, 330, 412, 415Gap Aalysis Program (GAP), 352Gardens, community, 300Gastil, Ray, 323Gated communities, 114Geddes, Patrick, 9, 413Geddes, Robert, 323Geiger ventilation formula, 97Gelfand, Donna, 379General management plans, 254General plans, 20, 241. See also Comprehen-
sive plansGeographic information systems (GIS)
base maps and, 53–55Camp Pendleton region (CA) and, 130,
132, 134overlay method and, 213, 214–15overview of, 18
Geologic conditions, 378Geologic information, 62–67Geologic symbols, 64Geological hazard areas, 343Geological maps, 62–63, 65Geology, 16, 62, 116–17Geomorphic Systems of North America
(Graf), 68Geraldine R. Dodge Foundation, 123Gibson, Lou, 161–62Gil, Efraim, 39–40Gila River, 76–77GIS. See Geographic information systemsGlikson, Artur, 9Goal oriented planning, 13, 41–48, 44, 45,
46, 47Goals, 12–13, 257–58, 302Goals-achievement matrices, 243, 243Goal setting, 40–41Gordon, Gaybrielle, 190Gordon, Steven, 190Gore, Al, 8Government agencies, 144–45Graduated scales, 68Graf, William, 68Graham, Otis, 387Grand Canyon, 63Green, Philip, 353Greenhouse Effect, 316Greenline planning, 317–18Greenspaces, 288
Grid cells, 214–15, 241Groundwater
defined, 75deserts and, 75–76Desert View Tri-Villages Area (Phoenix,
AZ) and, 77physiography and, 117streams and, 119
Groundwater hydrology, 16Groundwater Management Act, 75–76Group dynamics, 30–31Growing Smarter Act, 273Growth management, 367–69Growth Management Act (WA), 396Guthrie, Woody, 8
Habitat conservation areas (HCAs), 352Habitat conservation plans (HCP), 351Habitat Suitability Index (HSI), 132Habitats
New Jersey Pinelands and, 127, 128–29,130
overview of, 349–52wildlife and, 106, 108
Hack, Gary, 292–93Hallek, Ted, 41Hammurabi (King of Babylonia), 355Hardpan soils, 94HCAs. See Habitat conservation areasHearings examiners, 385Heat, 121, 124Heat island effects. See Urban heat island ef-
fectsHelmund, Paul, 9Hendricks, David, 93Herberger Center for Design Excellence, 278High Country News, 148Hill, Morris, 243Hills, G. Angus, 9, 202Hillside Ordinance, 377Hillsides, 378Hirschhorn, Larry, 243–44Hiss, Tony, 416Historic, archaeological, and cultural areas,
343Historic preservation, 352–53Historic Sites, Buildings, and Antiquities
Act, 352Histories, 144, 145, 148Histosols, 94Hohokam Indians, 108, 110, 314Holland, 20, 207–13, 237, 393Holridge, L. R., 120Holridge life-zone system, 120–22, 124, 125Homes, 108Honey Hill study, 213Hopkins, Lewis, 204Horizons, 87, 89Hough, Michael, 9
Household income (earnings) multipliers,398
Housing, 300Howard, Ebenezer, 9HSI. See Habitat Suitability IndexHuman communities
analysis and synthesis of social informa-tion and, 171–76
Camp Pendleton region (CA) and, 178–85
existing data sources and, 143–49new information generation for, 167–71New Jersey Pinelands Comprehensive
Management Plan and, 176–78, 185overview of inventory and analysis of,
141–43summary of information sources for,
144–45use of existing data for generation of new
information on, 149–67Human ecology, defined, 16Human population, 17Humans, 16Humbach, John, 6Hunt, Charles B., 67Hurricanes, 236Huxtable, Ada Louise, 330Hydrologic cycle, 73, 75, 75Hydrology, 16, 118, 132, 136, 137
Iacofano, Dan, 30IBC. See International Building CodeIdealists, 7Idealization process, 244Igneous rocks, 64IJselmeer. See Zuider ZeeImage processing, 214–15Impact analyses, 391–404Impact fees, 358–59, 359, 368Impact of proposed use, 193, 201Impact on biophysical resources, 218Implementation. See also Regulatory
powerAhwahnee Principles and, 22Desert View Tri-Villages Area (Phoenix,
AZ) and, 370–71ecological planning and, 21–22matrices and, 371–73, 372nongovernmental organizations and,
369–70Scottsdale, AZ and, 377–79taxation and, 366–67York County, PA, Black Hawk County, IA
and, 373–77Important farmland classification, 191, 192,
193. See also NRCS important farm-land mapping program
Inceptisols, 94Inclusions, 63
463INDEX
Independent surveys, 35, 38Indicator crops, 192Indicators, 287, 287Individuals, 293–95Industry groups, 163Infiltration, 75, 81Information, 275–76Information collection, 272, 274Information dissemination, 272, 274Infrastructure, 193–94Initiative planning, 272, 274Input-output analysis, 163–65, 166, 398Institute for Participatory Management and
Planning, 31, 244, 277Intelligence, 326–27Intensive interviewing process. See Elite in-
terviewing processInteractions, 173–75, 174Interagency coordination, 367–69International Building Code (IBC), 355International Conference of Building Offi-
cials, 355Interviews, 169–70, 240Inventories, 51Inventory elements
analysis and synthesis of, 115–22existing land use, land users and,
107–15geologic information as, 62–67microclimate as, 95–99overview of, 55–56regional climate as, 56–62soils as, 86–95terrain as, 67–71vegetation as, 99–104water as, 71–86wildlife as, 104–7
Involvement. See Public participationIterative process, 413
Jacobs, Allan, 110, 170James, William, 412Jefferson, Thomas, 6, 414Johannsen, Sonia, 376–77John Deere, 374Johnson, Arthur, 10Johnson, Craig, 132Joint Urban Design Program, 278Jones, Eddie, 313Juneja, Narendra, 219–220Juster, Robert, 331Just v. Marinette County, 341Justice, 285
Kaplan, Rachel, 171, 272Karetz, Jack, 165Kasson, Bill, 297Kast, Fremont, 412Keller, Edward, 217
Kellington, Wendie, 175Kelly, Eric, 331Kennett region (PA), 165, 167, 168Key informants, 169King County, WA, 362Koppelman, Lee, 334Kreske, Diori, 39Krueger, Richard, 32
Labor force participation, 153, 156, 157, 161,164
La Lomita Charrette, 298–301, 300, 301Land-capability classification, 191, 193Land Conservation and Development Com-
mission (LCDC), 41–44, 46Land Conservation and Development Com-
mission (OR), 242Land cover, 100, 102. See also VegetationLand dedications, 358–59Land Evaluation and Site Assessment Sys-
tem. See Agricultural Land Evaluationand Site Assessment (LESA) System
Land evaluations (LE)federal use of, 201hypothetical example of, 195, 199overview of, 191, 191–92, 193
Land slopes, 378Land Trust Alliance, 360Land use
as inventory element, 107–15Arroyo Vista Charrette and, 302–3classification system for, 18climate and, 119defined, 4overview of, 108Whitman County, WA and, 220, 222,
225–26zoning and, 331–32
Land-Use Land Cover Classification system,15–16, 18, 100, 106, 165
Land use maps, 143–45, 144Land use patterns, 135, 139Land use planning, 42–43Land use regulations, 193Landsat images, 61, 72, 73Landscape analysis, 13–16, 14Landscape patterns, 171–73Landscape plans
ecological planning and, 20elements and organization of, 261–64for New Jersey Pinelands, 264–66for Teller County/Woodland Park, 266–
69maps of, 260–61, 261, 262overview of, 253–55recognition and adoption of, 255–57statements of policies and, 257–59strategies for policy achievement and,
259–60
Landscapesbivariate relationships and, 116, 116–17Camp Pendleton region (CA) and, 132,
133conventional planning processes and, 142defined, 4, 5
Language of landscape, 172Larsen, Larry, 376–77Lassey, William, 271–72Laws of the Indies, 353Lawsuits, 332–33Layer cake model (McHarg), 15, 15Layer cake relationships, 120, 120, 121, 122,
123, 125LCDC. See Land Conservation and Devel-
opment CommissionLeach fields, 335Lead agencies, 395Leadership, 30Leadership and social advocacy program,
389League of Women Voters, 149Leary, Robert, 331, 332Lely, Cornelis, 210Lenni-Lenape, 176Leopold, Aldo, 9LESA System. See Agricultural Land Evalua-
tion and Site Assessment (LESA) Sys-tem
Lewin, Kurt, 30Lewis, Philip, 9, 203Licón, Carlos, 110–11Life zones, 121. See also Holdridge life-zone
systemLime, D. W., 218Limnology, 82Linkage, 53. See also Program linkageLithology, 71Litton, R. Burton, 171Loams, 91Local landscape analysis, 14–16Local LESA systems, 194–98, 196Location quotients, 166Locke, John, 6, 414Loudoun County, VA, 400–402Lovelock, J. E., 99Lower deserts, 378Lowrance et al. hierarchy, 14Lucas v. South Carolina Coastal Commission,
333Lucchesi, Enid, 39–40Lucy, William, 413Lyle, John, 9, 413Lynch, Kevin, 171, 172, 292–93
Macchi, Silvia, 9MacDougall, Bruce, 17–18, 213Machines, 17Mack, Nancy, 311
464INDEX
MacKaye, Benton, 9MacNair, Ray, 40Macpherson, Hector, 41Macroclimate, 56–62, 127Magazines. See Newspapers and periodicalsMail surveys, 167–69Main Street Program, 353Man and the Biosphere Program, 15, 17Management, 4Management objectives, 218Management plans, 253Manning, Kristy, 12, 293Manning, Warren, 200Map overlays. See Overlay methodMaps, 260–61, 261, 262, 287–88, 288Maricopa Association of Governments,
157Maricopa County. See Phoenix metropoli-
tan areaMarsh, William, 68Massachusetts Trustees of Public Reserva-
tions, 360Master plans, 253Matrices
decision making and, 243habitat conservation plans and, 351human community analysis and, 174–75implementation and, 371–73, 372Medford Township, NJ and, 220, 221, 222social impact analysis and, 402–4suitability analysis and, 204wildlife species and, 104, 105, 106, 107
McCall, Tom, 41, 48, 408McCarthy, James, 237McGeorge, Lizi, 237McHarg, Ian
community involvement and, 272definition of ecological planning of, 8, 9–
10ecological planning model of, 11, 16layer-cake model of, 15, 15Medford Township, NJ and, 219–20Plan for the Valley and, 363theoretical basis for overlaying informa-
tion and, 203–4McHarg suitability analysis method, 11, 17,
200–207, 316McKenzie, Ricki, 172, 177McLean, Mary, 163McNamara, Robert, 387Measure of magnitude, 161Medford Township, NJ, 219–20, 220, 221,
222, 223, 224Meinig, Donald W., 24Mesquite, 100Metamorphic rocks, 64–65METLAND. See Metropolitan Landscape
Planning ModelMetro government (OR), 404–7
Metropolitan Landscape Planning Model(METLAND), 214
Metzenbaum, James, 331Meyer, Neil L., 399Miami Conservancy District, 8Michigan, 348, 349Microclimate, 95–99, 116Microeconomic level, 14. See also Farm sys-
tem levelMigration, 155, 157, 158Military and Federal Installation Areas,
265Miller, Bill, 415Miller, Donald, 243Miller, Fred, 190Miller, Lynn, 200Mineral extraction areas, 343Mineral resources, 63Minimum-requirements analysis, 166Minimum size mapping units, 68Ministero dell’Ambiente, 393Mission statements, 28Mitigated determination of significance,
396Model Land Development Code (American
Law Institute), 339Moisture, 121, 124Mollisols, 94Monte Vista project, 316, 316Montgomery County, OH, 189–90Moratoriums, 368Morgan, Arthur, 8Morgan, Keith, 360Morris, Marya, 346Mortality, 155, 158Moscow region (WA), 304–11, 306, 307, 310Moudon, Anne, 114–15, 173Moule, Elizabeth, 316–17Multiple regression model, 154Multiple-use plans, 253Multipliers, 398Mumford, Lewis, 9, 412, 417Muratori, Saverio, 71, 148
National Agricultural Land Evaluation andSite Assessment Handbook, 191–92
National Agricultural Lands Study, 16, 373National Audubon Society, 369National Commission on the Environment,
11–12National Conservation Planning Manual,
295National Environmental Policy Act (NEPA)
environmental impact assessments and,391–92
historic preservation and, 352public participation and, 274requirements of, 4–5visual analysis and, 171
National Flood Insurance Program (NFIP),344–46
National Forest System, 273–74National Historic Preservation Act, 352–53National Park Service (NPS), 254, 276, 317–
18, 365National Parks and Recreation Act, 45National Pollution Discharge Elimination
System (NPDES), 347National Register of Historic Places, 352–53National Trust Act, 352National Trust for Historic Preservation,
352, 353, 369Native vegetation, 378Natural ecological areas, 342Natural environment, 17Natural hazard assessment, 63Natural hazard critical areas, 341, 341, 342Natural resource inventories, 122–23Natural resources, 16Natural Resources Conservation Service
(NRCS), 16, 86, 188–200, 295Natural Resources Defense Council, 393Natural wildlife habitat areas, 342Nature, 285Ndubisi, Forster, 203, 340Neighborhood planning councils, 29–30Neighborhood program, 389, 390Neighborhoods, 287, 287Nellis, Lee, 338Neotraditional town planning, 293. See also
New UrbanismNEPA. See National Environmental Policy
ActNet migration, 155, 157, 158Netherlands. See HollandNeuman, Michael, 261, 264New city alternative, 248, 249New England, 38–39New Jersey, 295–96, 348, 349. See also New
York–New Jersey–Connecticut metro-politan region; Pinelands (New Jersey)
New Jersey Pinelands Comprehensive Man-agement Plan, 266
Newman, George, 341–44New rationality, 412New Urbanism, 21, 293, 316New York, 362New York–New Jersey–Connecticut metro-
politan region, 321–27, 326, 327Newspapers and periodicals, 144, 148, 276NFIP. See National Flood Insurance Pro-
gramNGOs. See Nongovernmental organizationsNiebanck, Paul, 413Nixon, Richard, 5Nollan v. California Coastal Commission,
333Nominal-group workshops, 31
465INDEX
Nongovernmental information sources, 162Nongovernmental organizations (NGOs), 7,
369–70Normative planning, 411North Black Canyon Corridor, 256–57, 258,
259North Land Use Plan, 255–57North Sonoran Charrette. See Sonoran
North Land Use Character CharretteNorth Sonoran Collaborative, 230, 415–16Northern Spotted Owl Conservation Plan,
352NPDES. See National Pollution Discharge
Elimination SystemNPS. See National Park ServiceNRCS. See Natural Resources Conservation
ServiceNRCS important farmland mapping pro-
gram, 190–91
Objectives, 257, 302Oceanography, 82Odum, Eugene, 52, 82Official review, 385O’Harrow, Dennis, 335O’Keeffe, Georgia, 8Old Testament, 353Olin, Laurie, 326Olmsted, Frederick Law, 8Open space, 297, 297, 299, 302–3Operating and maintenance costs, 399,
400Optional plans, 230–35Options and choices
Blueprint for a Sustainable Bay Area and,285
charrettes and, 235–41citizen referendums, synchronized sur-
veys and, 242–43Dane County, WI, and, 283goals-achievement matrices and, 243in Camp Pendleton region, 247–50in Portland, OR, 245–47, 249–50optional plans and, 230–35public hearings and, 244scenario writing and, 243–44task forces, citizens’ advisory committees,
technical advisory committees and,241–42
Oregon. See also 1000 Friends of Oregon
citizen involvement in, 273community needs assessments and, 175–
76comprehensive planning and, 254–55ecological plan administration in, 23population trends, planning and, 142Portland, 404–7referenda in, 242
Oregon Comprehensive Planning Law, 41–45, 44
Oregonians in Action, 23Organization development, 30Original horizontality, 63Orr, David, 21, 317, 326–27Ostler, Jolene, 256Outcome measures, 259Output (business) multipliers, 398Overlay method
critical areas and, 340Desert View Tri-Villages Area (Phoenix,
AZ) and, 370environmental resource zone as, 408Hillside Ordinance and, 377historic preservation and, 352overview of, 17suitability analysis and, 200–6wetlands and, 349zoning and, 332
Oxisols, 94
Palazzo, Danilo, 9Palissy, Bernard, 73Palouse path, 304–11, 306, 307, 310Paradise Creek, 309Parent materials, 91Participant observation, 170–71Participation. See also Public participationParticipation process support, 272, 274, 275Patterns, 171–73Patton, Carl, 169PDR. See Purchase of development rightsPeach Bottom Township, 374, 375Pearthree, Philip, 64Pease, James, 194–98Peck, Sheila, 54, 213, 352Pedalogy, 87Pennsylvania, 6, 369Pennsylvania model. See McHarg suitability
analysis methodPerceptually and culturally critical areas,
341, 341–42Perennial snow ice, 18Performance standards, 22–23, 335–39,
336–37Performance zoning, 335, 336–37, 338Periodicals. See Newspapers and periodicalsPermit systems, 338Phases, 87Phillip II (King of Spain), 353Phoenix Environmental Showcase Home,
314, 313–314Phoenix metropolitan area. See also La
Lomita CharretteArroyo Vista Charrette and, 301charrettes and, 236–37development projections for, 160, 161landsat image of, 61
morphological cross section of, 74planning staff of, 383–85, 384population characteristics of, 151, 153,
155, 156, 157population projections for, 160population trends of, 150, 151urban heat island effects and, 57, 61
Phone books, 148–49Physiognomic profiles, 103, 103Physiography, 16, 67–68, 73, 117–18Physiography of the United States (Hunt), 67Pijawka, David, 297, 313–14Pinchot, Gifford, 23–24Pine Barrens. See Pinelands (New Jersey)Pine Barrens Treefrogs, 127, 276Pinelands (New Jersey)
agriculture in, 179biophysical inventory and analysis and,
122, 123–30, 135–36environmentally sensitive areas in, 341–
44, 344human community inventory and analy-
sis and, 176–78, 185landscape plan for, 264–66overview of, 45, 45–48, 46, 47population trends and, 182potential land-use conflicts in, 177, 177projected land use in, 178transfer of development rights and, 364visual types in, 180, 181
Pinelands Comprehensive ManagementPlan. See New Jersey Pinelands Com-prehensive Management Plan
Piscopo, Ornella, 219Place making, 413Planned unit developments (PUDs), 334Planning. See also Ecological planning
administration and, 381–82budget and, 385–91defined, 4, 9misuse of slope and, 68new approach for, 9normative, 411planning commissions, review boards
and, 382–83planning staffs and, 383–85procedural requirements for, 385traditional framework of in U.S., 5–9working plans and, 23–24
Planning, programming, and budget system(PPBS), 382, 385–87
Planning Areas C & D. See Desert View Tri-Villages Area (Phoenix, AZ)
Planning choices. See Options and choicesPlanning commissions, 382–83Planning Enabling Act, 382Planning options. See Options and choicesPlanning process, 3–4Planning staff, 383–85
466INDEX
Planning Standards in Industrial Zoning(O’Harrow), 335
Plans Build Out scenario, 247, 248Plants. See VegetationPlater-Zyberk, Elizabeth, 236, 316–17Play, 108Polders, 210, 211Police power, 6Policies, achievement of, 257–60Policy Delphi, 34–35Policy plans, 253Polygons, 214–15, 215Polyzoides, Stefanos, 316–17Pope, Alexander, 187Population characteristics, 150, 153,
157–59Population projections, 150, 153–57, 157–
59, 160Population trends
in Pinelands, 182overview of, 150, 151, 151, 152, 154, 157–
59planning and, 142revenue sources affected by, 401
Portland, OR, 245–47, 249–50, 404–7Potawatomi Land Trust, 402Potential land suitability, 207, 210Powell, John Wesley, 53PPBS. See Planning, programming, and
budget systemPragmatism, 412, 413Preapplication stage, 385Precipitation, 121, 124Preference surveys. See Public opinion pollsPreferential assessment system, 366, 366,
369Prescriptive zoning ordinances, 335Preservation Area Districts, 264, 265Preservation zones, 363–64President’s Council on Sustainable Develop-
ment, 8, 238Press releases, 276Prigogine, Ilya, 24Primary sectors, 163Priorities, 259Privacy, 168Private conservation alternative, 248–49Procedural requirements, 385Process goals, 42–43Process monitoring, 394Process scenarios, 244Processes, 52Program linkage, 369Program strategies, 387–91Project planning, defined, 4Projections. See Population projectionsProperty rights, 6, 23, 333Property rights movement, 333Prophecy scenarios, 244
Proposed comprehensive plans, 246Psychophysical paradigm, 172Public agencies, 144–45Public hearings, 38–40, 40, 244Public land management, 365–66Public opinion polls, 35–38, 38Public participation
benefits of, 27–28citizens’ advisory committees, technical
advisory committees and, 29components of, 28Delphi and, 33–34ecological planning and, 13, 20–21effectiveness of techniques for, 36–37focus groups and, 31–33group dynamics and, 30–31neighborhood planning councils and,
29–30nominal-group workshops and, 31overview of, 271–74Policy Delphi and, 34–35public opinion polls and, 35–38, 38task forces and, 28–29techniques for, 274–75techniques for and effectiveness of, 36–37town meetings, public hearings and, 38–
40, 40Publications. See Newspapers and periodi-
calsPuerto Rico, 360, 393Pullman, WA
new facility conceptual design and, 304–11, 306, 307, 310
species matrixes for, 104, 106water budget for, 75, 76
Purchase of development rights (PDR),360–63, 361
Puritans, 38–39Pygmy forests, 126–27
Qualitative data, 141Quantitative data, 141Quay, Ray, 256Questionnaires, 163, 280–81Quinby, Peter, 52–53
Radio, 278–79Radon gas, 63Raintree, John, 293Ranch conservation plans, 293–95RAND Corporation, 33. See also DelphiRangelands, 18Ranking, 194Rationalism, 411–12Reactive planning, 272, 274, 275Reagan, Ronald, 8, 333Realists, 7Receiving zones, 363–64Recommended comprehensive plans, 246
Recreational carrying capacity, 218Reed, David, 377Rees, William, 217–18Referendums, 242–43Region 2040 Planning Process, 405–7Regional center program, 389Regional climate, 56–62, 127Regional Growth Areas, 265Regional Growth Goals and Objectives
(RGGOs), 406Regional landscape analysis, 13–14Regional Municipality of Waterloo, 340–41Regional Plan Association of New York,
321–23, 326Regional planning, 22Regulations, 6, 329Regulatory power. See also Spending power;
Taxationbuilding codes and, 355–57condemnation, exaction and, 358covenants and, 357–58critical or environmentally sensitive areas
and, 339–44design guidelines, controls and, 339floodplain management and, 344–46habitat conservation plans and, 349–52historic preservation and, 352–53impact fees, land dedications and,
358–59overview of, 329–30performance standards and, 335–39planned unit developments (PUDs) and,
334subdivision regulations and, 353–54wetland and riparian area protection and,
346–49zoning and, 330–34
Reilly, William, 346, 347Relationships, 173–75, 174Relative policies, 338, 339Removal areas, 352Reps, John, 38, 330, 353Rest stops, 308Restrictive covenants, 357. See also
CovenantsResults-based governments, 382Reveille for Radicals (Alinsky), 7Review boards, 382–83Revised universal soil loss equation
(RUSLE), 90Reynolds, Stephen, 63RGGOS. See Regional Growth Goals and
ObjectivesRhodehamel, E. C., 124Ricklefs, Robert E., 99Riddick, W. L., 236Rielke, R. A., 56Riparian areas, 82, 84, 346–49Roosevelt, Franklin, 188
467INDEX
Roosevelt, Theodore, 8Rosenzweig, James, 412Rowe, Peter, 315RPA. See Regional Plan Association of New
YorkRuderal plants, 103. See also WeedsRule making, 413Rules of combination, 204Running-water habitats, 82Runoff, 90Rural desert overlay, 370–71Rural Development Areas, 265Rural population growthin Whitman County, WA, 220–22, 225–26,
226, 335, 335trends in, 150, 152Rural residential settlement, 111RUSLE. See Revised universal soil loss
equation
Safina, Carl, 82Salt River drainage basin, 76San Francisco Estuary Institute, 145, 148Sanborn Map Company, 148Sand, defined, 91Sarkissian, Wendy, 28Satellite imagery, 54Satterlund, Donald, 52Sawicki, David, 169SBC. See Standard Building CodeScablands, 225Scale, 13–14, 52, 54, 142Scale/Tool matrix, 351Scandurra, Enzo, 9, 12, 219Scenario writing, 243–44Scenic areas, 342–43Schedules, 259Schmandt, Michael, 173Scientific areas, 342Scio Township, MI, 402Scoping of issues, 394, 396Scores, 191Scottsdale, AZ, 377–79Second-order streams, 78Secondary sectors, 163Sedimentary rocks, 64Self-surveys, 35, 38, 38Semi-concentrated concept, 234, 235Sending zones, 363–64Sensitive lands, 377–79Septic systems, 335Service activities, 398Service districts, 368Settlement patterns, 111, 113–15, 113, 114,
143–45, 143, 144Shadowing, 331Shetter, Kim, 313–14Shift-and-share analysis, 166Shrader-Frechette, Kristin, 417
SIC code. See Standard Industrial Classifica-tion code
Siegler, Theodore R., 399Sieve-mapping overlay method, 202Silts, 91Simulation, 295–96, 296, 297Simulation model, 154Simulations, 244Single-family residential settlement, 111Sinton, John, 139, 176, 185Site assessments (SA), 191, 192–94, 195,
197, 199. See also Agricultural LandEvaluation and Site Assessment (LESA) System
Site design, 292–93Site planning, 292Skilled leadership, 30Skunk Creek Wash, 77Slide traces, 323Sliding-scale zoning, 373, 375Slope
calculation of erosion and, 90Camp Pendleton region (CA) and, 132,
134Desert View Tri-Villages Area (Phoenix,
AZ) and, 69infiltration rate and, 75overview of, 71physiography and, 68solar radiation and, 97
Small-group involvement, 30Smart growth movement, 365Smith, Daniel, 9Smith Jr., Paul, 116Smithsonian Institution, 342So, Frank, 364, 387, 390Social impact analysis, 402–4, 404Soil capability classification, 87Soil drainage, 90Soil erosion. See ErosionSoil Erosion Service, 188Soil potential, 191, 192, 193Soil productivity, 191–92, 193Soil profiles, 87, 89, 92, 93Soils
as baseline natural resource, 16as inventory element, 86–95Camp Pendleton region (CA) and, 132,
135capability classification and, 188–200classification of, 93, 93, 94climate and, 118defined, 86geology and, 116New Jersey Pinelands and, 126representative profiles of, 93
Soil series, 87Soil suitability, 207, 210Soil surveys, 86–87
Solar energy, 300–301Solar orientation, 354, 354Soleri, Paolo, 304, 315–16Sonoran Desert, 57, 65, 81, 94, 314Sonoran North Land Use Character Char-
rette, 237–41, 238, 239, 240, 241, 255–57, 256, 296–97
Sonoran Preserve Advisory Committee, 416
Sonoran Preserve Master Plandecision making and, 230, 232–35, 233,
237–41, 238, 239, 240, 241implementation strategies of, 256–57,
259South Avenue Streetscape Charrette, 237Southern Living, 277Space Imaging Eosat, 54, 55Special Agricultural Production Areas, 265Special features, 378Spending power, 359–66Spirn, Anne, 9, 172, 291–92, 323Spodosols, 94SPOT Image Corporation, 54–55Spread build-out alternative, 248, 249Staatsbosbeheer, 20Standard Building Code (SBC), 355Standard Industrial Classification (SIC)
code, 163Standard Zoning Enabling Act, 331Standing-water habitats, 82Stankey, George, 218State Land Trusts, 106States, 244, 348–49, 350, 366. See also Spe-
cific statesSteepness, 71, 97Steinitz, Carl, 178, 180, 213, 247Steinitz landscape planning process, 132,
133Stengers, Isabelle, 24Stokes, Samuel, 339Strahler, A. N., 78Strategic planning, 28, 254Strategies, defined, 259Streams, 78, 80, 119, 132, 394Structured processes, 31Subdivision regulations, 353–54Suburban desert overlay, 370–71Sudman, Seymour, 169Suffolk County, NY, 362, 362–63Suitability, 187, 188Suitability analysis, 17, 187–88, 204, 205,
215, 216Superposition, 63. See also Overlay methodSurface water, 75, 119, 126Surficial geology, 16, 65Surficial hydrology, 16Surrey Design Charrette, 237Survey Research Center (U. Michigan), 169Surveys, 167–69, 280, 280–81
468INDEX
Sustainability analysis, 19Sustainable design. See DesignSustainable development, 11SYMAP, 213Symposia, 275Synchronized surveys, 169, 242–43
Tahoe Regional Planning Agency, 218Takings clause, 6, 333Taliesin West, 314–16Tanks, 100Targets, 259Tarlet, Jean, 9Task forces, 28–29, 241–42, 242Tax increment financing (TIF) districts,
367Taxation, 193, 267, 366–67, 399–402, 403TDM. See Total design methodTDR. See Transfer of development rightsTechnical advisory committees, 29, 241–42,
242Technical staff review, 385Telephone surveys, 167–69Television, 278–79Teller County/ Woodland Park (CO), 266–
69, 267, 268Tennessee Valley Authority, 8Tenth Amendment, 6Terrain, 67–71Tertiary sectors, 163Textures, 90–91Thermal admittance, 98Third-order streams, 78Thoreau, Henry David, 8Three-E’s, 323, 325Threshold determinations, 395Threshold-level analysis, 281, 282, 285, 285Thresholds, 218, 281, 282, 285, 285TIGER line files, 148Timing, 31Tiner, R. W., 84Tolerable soil loss, defined, 90Toner, William, 373Tonto Apaches, 108, 110Topoclimate, 95–96, 99Torrifluvent soils, 93Total design method (TDM), 168–69Town and Village Areas, 265Townhouse residential settlement, 111Town meetings, 38–40, 40Trade areas, 281Transfer of development rights (TDR), 361,
363–64, 364Transition Zone, 63, 63Transitional areas, 352Transportation, 44, 304, 305Trends. See Population trendsTri-Villages Area. See Desert View Tri-
Villages Area (Phoenix, AZ)
Trust for Public Land (TPL), 369Trustees of Public Reservations, 360Tucson, AZ, 407–9, 408Tucson Solar Village, 316–17, 317Tugwell, Rexford, 8Tundra, 18Tuttle, Andrea, 218Twain, Mark, 8Two Treatises of Government (Locke), 6Tyrwhitt, Jacqueline, 202
UBC. See Uniform Building CodeUdell v. Haas, 332Ultisols, 94Underhill, Michael, 314, 315Underwood, Max, 316UNESCO Total Environment Checklist, 17Uniform Building Code (UBC), 355, 356United Nations, 393Universal soil loss equation (USLE), 90Universities. See Colleges and UniversitiesUniversity of Pennsylvania suitability analy-
sis method. See McHarg suitabilityanalysis method
University of Wisconsin extension program,279, 279–85, 280
Unstable slopes, 378Upper desert landforms, 378Urban Ecology, 285–88Urban growth boundaries, 405, 405, 407Urban heat island effects, 57, 61, 62Urban infrastructure, 193–94Urban lands, 18Urban management program, 389, 390Urban morphology, 71, 74, 173Urbanization, 130, 150, 152User activities, 165User groups, 165–67, 167, 168, 175U.S. Agency for International
Development, 393U.S. Geological Survey, 55USLE. See Universal soil loss equationUtilitarian landscape plans, 253Utilities, 360Utopian landscape plans, 253
Valladolid, Spain, 104, 107Van der Ryn, Sim, 9, 21Vegetation
as baseline natural resource, 16as inventory element, 99–104Camp Pendleton region (CA) and, 132,
137climate and, 118geology and, 117land use and, 119microclimate and, 97, 98New Jersey Pinelands and, 126–27physiography and, 117
soils and, 119wildlife and, 119–20
Ventilation, microclimate and, 96–97, 97Verburg, Edwin, 257Verde Valley greenway, 172–73Vertisols, 94Victor, CO, 269View-from-the-road approach, 172Village planning committees, 30. See also
Neighborhood planning councilsVink, A. P. A., 207–8Visitor attitudes, 218Visual resource assessment, 171–73Visual types, 180, 181, 183, 184Volcanism, 63Voluntary covenants, 357. See also
CovenantsVoluntary restrictive agreements, 366Voytek, Kenneth, 163
Walker-Macy, 406Wallace, David, 363Wallace-McHarg Plan for the Valley, 363WASH. See Watercourse amenities, safety
and habitat ordinanceWash vegetation, 100Washes, 77Washington, 6, 220–22, 225–26, 335, 335Washington Growth Management Act, 340,
359Washington State Environmental Policy Act
(SEPA), 339–40, 393, 394–96, 395, 397Waste, 303Water, 18, 71–86Water cycle. See Hydrologic cycleWater quality areas, 343, 343Water use and quality, 303Watercourse amenities, safety and habitat
(WASH) ordinance, 407–9Watercourses, 378Waterloo, Ontario, Canada, 340–41Watersheds, 14, 52–53Weber, Bruce, 368Websites, 276Weeds, 103Weighting, 194–95West Colfax Pedestrian Improvement
Demonstration Project, 312–13, 312,313, 314
Western Australia Department of Planningand Urban Development, 237
Western Rural Development Center, 278,396
Wetlandsas critical areas, 341classification of, 18, 83, 84overview of, 82–84protection of, 346–49
Whitman, Walt, 8
469INDEX
Whitman County, WAimportant farmland mapping in, 190rural housing areas in, 220–22, 225–26,
226zoning compliance in, 385, 386–87, 388–
89zoning ordinance for rural housing in,
335, 335Wickersham, Kirk, 338Wild and Scenic Rivers Act, 318Wilderness recreation areas, 342Wildlife
as baseline natural resource, 16as inventory element, 104–7Camp Pendleton region (CA) and, 134,
138carrying capacity and, 217climate and, 118–19defined, 104
geology and, 117New Jersey Pinelands and, 127, 128–29,
130physiography and, 118vegetation and, 119–20
Williams, F. B., 331Wilson, Kevin, 318, 323Windfalls, 363Windshield surveys, 172Wipeouts, 363Wisconsin, 215, 367Wise use movement, 333Woodland Park, CO. See Teller County/
Woodland Park (CO)Work, 108Working plans, 23–24World Bank, 393World Commission on Environment and
Development, 11
Wright, Frank Lloyd, 314–16Wright, Lloyd E., 191Wyoming Wetlands Act, 349
Yakima County, WA, 244Yaro, Robert, 318, 321, 326, 416, 417York County, PA, 373–77, 374Young, Gerald, 16Your Town Workshops, 353
Zelinka, Al, 256Zoning, 330–34, 333, 369. See also Planned
unit developments (PUD)Zoning adjustors, 385Zoning review boards, 383Zube, Ervin, 171–72Zuider Zee, 210, 211, 212
470INDEX
ABOUT THE AUTHOR
471
Frederick Steiner directs the School of Planning and Landscape Architecture at Ari-
zona State University. As a professional planner, he has participated in a number of
community and regional plans, in Arizona, Colorado, Washington, Rhode Island,
and elsewhere. In 1997, he received a grant from the U.S. Environmental Protection
Agency’s Sustainable Development Program with David Pijawka. He was the 1998
Rome Prize Fellow in Historic Preservation and Conservation at the American
Academy in Rome and was a 1980 Fulbright research scholar in the Netherlands.
The author of many professional papers and books in addition to the first edition of
this book, he holds B.S., M.C.P., M.R.P., M.A., and Ph.D. degrees in planning and de-
sign from the University of Cincinnati and the University of Pennsylvania.

William H. MeadowsPresident
The Wilderness Society
Washington, DC
Merloyd Ludington LawrenceMerloyd Lawrence Inc.
Boston, MA
Charles C. SavittPresident
Island Press
Washington, DC
Susan E. SechlerSenior Advisor
The German Marshall Fund
Washington, DC
Victor M. Sher, Esq. (Chair)
Sher & Leff
San Francisco, CA
Peter R. SteinGeneral Partner
LTC Conservation Advisory Services
The Lyme Timber Company
Hanover, NH
Diana Wall, Ph.D.Director and Professor
Natural Resource Ecology Laboratory
Colorado State University
Fort Collins, CO
Wren WirthWashington, DC
Island Press Board of Directors
Alexis G. Sant (Chair)
Trustee and Treasurer
Summit Foundation
Washington, DC
Dane A. Nichols (Vice-Chair)
Washington, DC
Carolyn Peachey (Secretary)
Campbell, Peachey & Associates
Washington, DC
Henry Reath (Treasurer)
Princeton, NJ


