Embed Size (px)
Citation preview

Provided by the author(s) and University College Dublin Library in accordance with publisher policies. Please
cite the published version when available.
Downloaded 2012-05-05T16:19:32Z
Some rights reserved. For more information, please see the item record link above.
Title The Irish Aviation Authority's cost of capital : report to theCommission for Aviation Regulation
Author(s) Hutson, Elaine; Kearney, Colm
PublicationDate 2007-03
Publisher Commission for Aviation Regulation
Link topublisher's
version
http://www.aviationreg.ie/_fileupload/Image/CP4%202007%20IAA%20Determination.pdf
This item'srecord/moreinformation
http://hdl.handle.net/10197/1967

The Irish Aviation Authority’s Cost of Capital
Report to the Commission for Aviation Regulation
March, 2007
Elaine Hutson,
Lecturer in Finance,
UCD School of Business
Blackrock, Co. Dublin.
e-mail: [email protected]
Colm Kearney,
Professor of International Business,
Trinity College Dublin,
Dublin 2.
e-mail: [email protected]

2
Contents
Executive summary 3
1. Introduction and overview 4
2. IAA’s core business and financial summary 5
3. The cost of equity 12
3.1 The risk-free rate of interest 13
3.2 The equity risk premium 18
3.3 Beta 21
4. The cost of debt 26
5. Gearing 27
6. The weighted average cost of capital 28
Bibliography 31
3
Executive Summary
1. The weighted average cost of capital (WACC) approach is used to estimate the
IAA’s cost of capital. To implement this approach, it is necessary to estimate the
IAA’s cost of equity, its cost of debt and its gearing ratio. Following a brief
financial summary, the cost of equity is discussed in Section 3, the cost of debt is
discussed in Section 4, the IAA’s gearing is discussed in Section 5, and Section 6
brings these together in the WACC calculations to derive the estimate of the IAA’s
cost of capital.
2. The estimated value for the real risk-free rate is 3 percent. The estimated equity
risk premium is 5 percent. The IAA’s asset beta is estimated at and its equity beta
is estimated at 0.65 and 1.1. The resulting estimate of the IAA’s real cost of
equity is 7.7 percent.
3. With a real risk-free rate of interest at 2.2 percent, and an estimated debt premium
of 80 basis points, the resulting estimate of the IAA’s real cost of debt is 3
percent.
4. The corporate tax rate that applies over the coming years is assumed to remain at
12.5%.
5. The resulting estimates of the IAA’s post-tax WACC and pre-tax WACC are 5.9
percent and 6.7 percent respectively.

4
[1] Introduction and overview
In our previous report to the Commission for Aviation Regulation (CAR) in which we
estimated the cost of capital for IAA (Hutson and Kearney, 2002) we used the CAPM-
WACC (capital asset pricing model-weighted average cost of capital) framework. In this
report we use the same approach, which involves estimating the cost of equity and cost of
debt components, and the weighting them according to their relative weights in the
regulated company‟s actual or optimal capital structure. To implement this approach, it
is therefore necessary to estimate the IAA‟s cost of equity, its cost of debt and its gearing
ratio. In doing so, we update our previous estimates in Hutson and Kearney (2002), with
reference to current data relating to components of the cost of capital such as IAA‟s
business risk and its debt premium. We include new estimates from academic studies
and recent regulatory precedent on the equity premium and the risk-free rate of interest.
This is designed to ensure that the derived estimate for the IAA‟s cost of capital is
consistent with best practice in aviation regulation in Ireland and elsewhere.
This approach has wide acceptance in regulation internationally, and this has been
reaffirmed in recent determinations, including the CAA‟s for the London airports. There
are three versions of the WACC framework: the „plain vanilla‟ WACC, the pre-tax
WACC and the post-tax WACC. Estimates of the cost of capital that do not include any
adjustments for corporate taxation yield the plain vanilla WACC, which has a post-tax
cost of equity and a pre-tax cost of debt. The rationale for using the plain vanilla WACC
is that it describes the cost of finance that the regulated utility has to recover, because it
must pay a post-tax cost of equity to its shareholders, while paying a pre-tax cost of debt
to its creditors.
This plain vanilla estimate of the WACC can be adjusted to provide either a pre-tax
WACC or a post-tax WACC. The former adds a tax adjustment to the cost of equity,
while the latter removes the tax adjustment from the pre-tax cost of debt. In adjusting the
plain vanilla WACC to either the pre-tax WACC or the post-tax WACC, an important
regulatory issue concerns whether the appropriate tax rate to use in conducting the
adjustment is the current statutory corporate tax rate or the expected likely effective tax
rate that will apply during the term of the determination. In applying the tax adjustment
to regulated utilities in Ireland, it is reasonable to assume that the difference between the
actual corporate tax rate and the effective rate that is expected to apply during the term of
the determination are insignificantly different from each other given Ireland‟s low
corporate tax rate of 12½ percent.
In our previous report for the CAR (Hutson and Kearney, 2002), we estimated IAA‟s cost
of capital at 6.5 percent. In a recent determination by the British CAA the cost of capital,
estimated by PricewaterhouseCoopers (2004) was 6.1 percent. It is readily
acknowledged that the circumstances within which the IAA operates are different to
those within which NATS operates insofar as IAA is a government-owned enterprise
whereas NATS has been partially privatised. It is also acknowledged that while the
British and Irish aviation scenes share many common features, there may be some
differences. It is appropriate, therefore, to consider an Irish comparator company as well.
5
The closest Irish organisation is the Dublin Airport Authority (DAA), for which we
estimated a cost of capital in 2005 (Hutson and Kearney, 2005).
This report begins with a brief financial summary of the IAA. The cost of equity is
discussed in Section 3 and the cost of debt is discussed in Section 4. The IAA‟s gearing
is discussed in Section 5. Section 6 brings these together in the WACC calculations to
derive our estimate of the IAA‟s cost of capital.
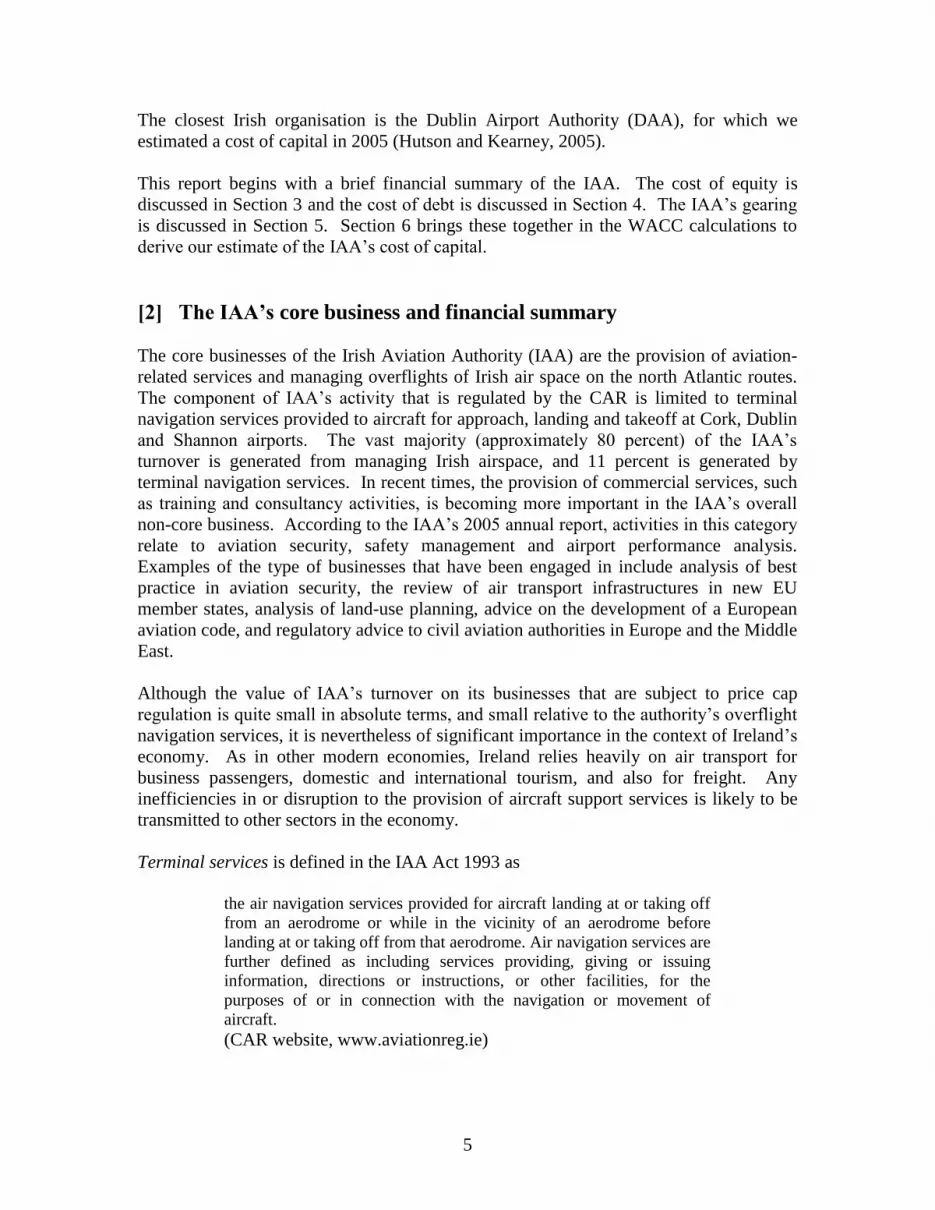
[2] The IAA’s core business and financial summary
The core businesses of the Irish Aviation Authority (IAA) are the provision of aviation-
related services and managing overflights of Irish air space on the north Atlantic routes.
The component of IAA‟s activity that is regulated by the CAR is limited to terminal
navigation services provided to aircraft for approach, landing and takeoff at Cork, Dublin
and Shannon airports. The vast majority (approximately 80 percent) of the IAA‟s
turnover is generated from managing Irish airspace, and 11 percent is generated by
terminal navigation services. In recent times, the provision of commercial services, such
as training and consultancy activities, is becoming more important in the IAA‟s overall
non-core business. According to the IAA‟s 2005 annual report, activities in this category
relate to aviation security, safety management and airport performance analysis.
Examples of the type of businesses that have been engaged in include analysis of best
practice in aviation security, the review of air transport infrastructures in new EU
member states, analysis of land-use planning, advice on the development of a European
aviation code, and regulatory advice to civil aviation authorities in Europe and the Middle
East.
Although the value of IAA‟s turnover on its businesses that are subject to price cap
regulation is quite small in absolute terms, and small relative to the authority‟s overflight
navigation services, it is nevertheless of significant importance in the context of Ireland‟s
economy. As in other modern economies, Ireland relies heavily on air transport for
business passengers, domestic and international tourism, and also for freight. Any
inefficiencies in or disruption to the provision of aircraft support services is likely to be
transmitted to other sectors in the economy.
Terminal services is defined in the IAA Act 1993 as
the air navigation services provided for aircraft landing at or taking off
from an aerodrome or while in the vicinity of an aerodrome before
landing at or taking off from that aerodrome. Air navigation services are
further defined as including services providing, giving or issuing
information, directions or instructions, or other facilities, for the
purposes of or in connection with the navigation or movement of
aircraft. (CAR website, www.aviationreg.ie)

6
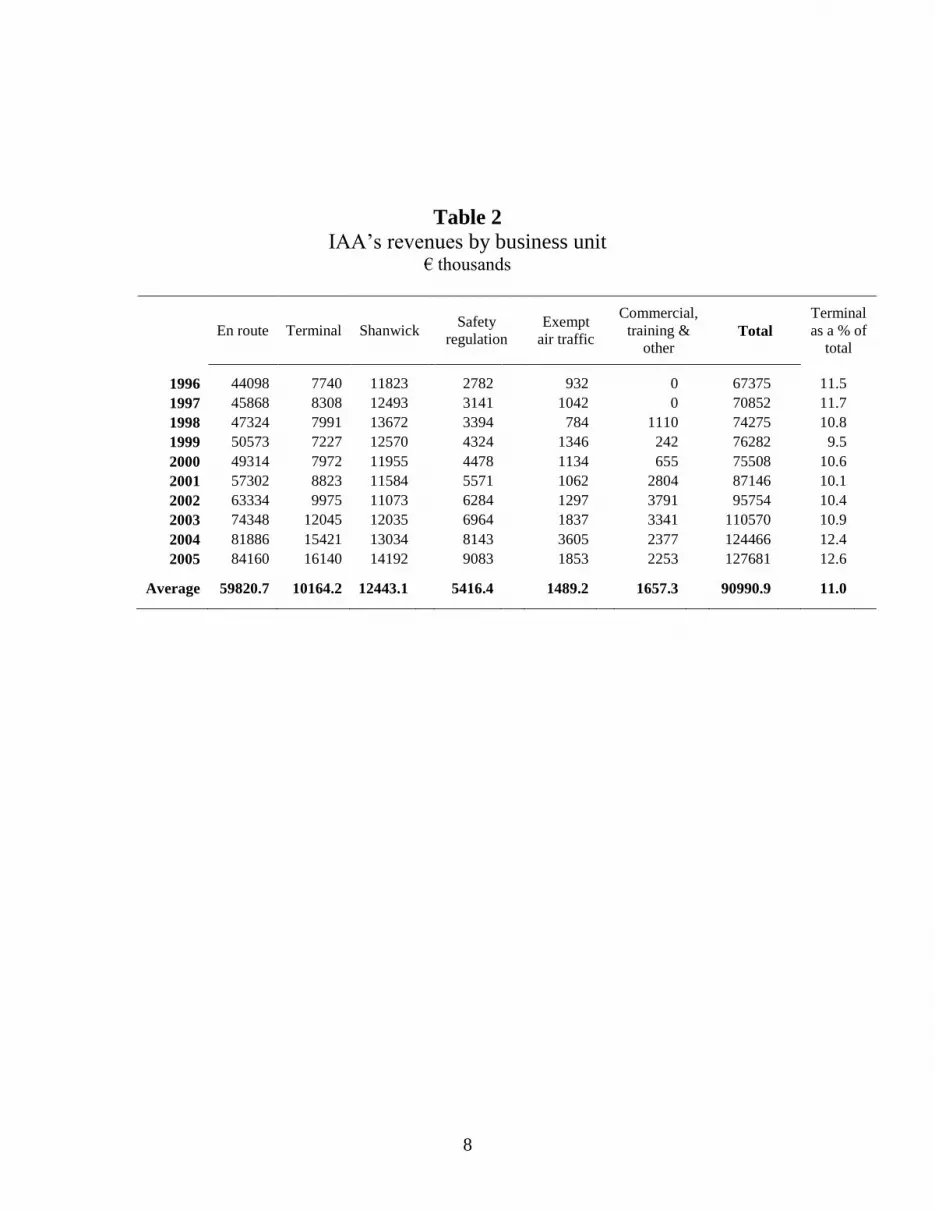
Table 1 provides the IAA‟s profit and loss account for the 10-year period from 1996-
2005, and Table 2 provides a breakdown of turnover by business line: en route income,
terminal income, Shanwick communications, safety regulation, exempt air traffic, and
commercial, training and other. In formatting Table 2, the data are net of the income
equalisation account, as explained in note 1 to the profit and loss accounts. This is
because the IAA performs the state‟s function in relation to the multilateral Eurocontrol
agreement whereby differences between income and costs in a given year are recovered
from or returned to providers in the subsequent year.
Table 1 shows that income overall has almost doubled in the period 1996, from €67.4
millions to €127.7 millions. Table 2 shows that terminal income has increased from €7.7
millions in 1996 to €16.1 millions in 2005. Figure 1, Panel A depicts the variation over
time in annual terminal turnover as a percentage of total turnover, and Panel B provides
the average terminal turnover as a percentage of total turnover along with the other major
components of the authority‟s turnover. These graphs provide important information
insofar as only the IAA‟s terminal activity is subject to price cap regulation by the CAR.
Panel A of the figure shows that terminal turnover as a percentage of the authority‟s total
turnover has varied from a minimum of 9.5 percent in 1999 to a maximum of 12.6
percent in 2005. The average terminal turnover as a percentage of the Authority‟s total
turnover over the 10-year period from 1996 to 2005 is 11 percent, and this is the same as
the proportion calculated in Hutson and Kearney (2002) for the period 1994-2000.
Overall, Table 2 and Figure 1 show that although terminal turnover as a percentage of
total turnover has varied from year to year, the average of 11 percent has tended to
remain stable since the beginning of the Authority‟s operations in 1994. The core
businesses of the authority‟s operations are en route and Shanwick, which account for
approximately 80 percent between them, and is sourced from customers flying the north
Atlantic route.
The Authority‟s balance sheet data for the 10-year period from 1996 to 2005 is
summarised in Table 3. In the 10 years since 1996, IAA‟s tangible asset value has
trebled from €31.4 million to €98.4 million in 2005. To support this considerable growth
in fixed assets, IAA‟s long-term debt has increased from almost negligible levels in the
early 2000s to €63.1 million in 2005. The change in IAA‟s gearing over the period is
shown in Figure 2, which contains a graph of IAA‟s total debt ratios (Panel A) and long-
term debt ratios (Panel B). The total liabilities-to-assets ratio (Panel A) has ranged
between a low of 33.6 percent in 1999 to 57 percent in 2003. The Authority‟s ratio of
total liabilities-to-assets in 2005 stands at 48 percent, which is very close to its 10-year
average. The ratio of long-term debt-to-assets, however, has been more volatile, showing
an increase from 1.6 percent in 2001 to 38 percent in 2002 (Panel B). This was due to
borrowings of €45 million to finance the major capital expenditure associated with the
new air traffic management re-equipping programme, which involved new buildings,
systems and equipment at Cork, Dublin and Shannon airports. IAA‟s long-term debt-to-
assets ratio currently stands at 40 percent, which is considerably higher than the average
of 20 percent.

7
Table 1
The IAA‟s profit and loss account, 1996-2005 € millions
1996 1997 1998 1999 2000 2001 2002 2003 2004 2005
Turnover 67.4 70.9 74.3 76.3 75.5 87.1 95.8 110.6 124.5 127.7
Operating expenses -54.0 -57.4 -59.7 -61.7 -60.8 -69.6 -77.0 -89.7 -113.5 -108.4
Operating profit - continuing
activities (EBIT) 5.5 5.4 6.1 6.2 6.5 5.2 5.4 7.4 10.9 19.3
Interest receivable 0.9 1.3 1.5 1.0 0.5 0.4 0.1 0.2 0.2 0.4
Interest payable -0.7 -1.6 1.6 1.6
Profit on ordinary activities
before tax 6.4 6.7 7.7 7.2 7.0 5.7 4.8 6.0 9.6 16.2
Tax credit/(charge) on profit on
ordinary activities -3.1 -2.3 -3.7 0.5 -1.5 -1.1 0.5 -0.9 -0.6 -2.8
Profit for the financial year 3.3 4.4 4.0 7.7 5.5 4.5 5.3 5.1 9.0 13.4
Dividend -1.3 -1.2 -1.1 -1.0 -1.3 -2.2
Transfer to contingency reserve -3.2 -4.4 -3.8 -6.5 -4.5 -3.5 -4.3 -3.8 -6.7
Profit and loss account at
beginning of year 0.7 0.8 0.8 1.0 0.9 0.8 0.7 0.7 0.7
Profit and loss account at year end 0.8 0.8 1.0 0.9 0.8 0.7 0.7 0.7 0.7
8
Table 2
IAA‟s revenues by business unit € thousands
En route Terminal Shanwick Safety
regulation
Exempt
air traffic
Commercial,
training &
other Total
Terminal
as a % of
total
1996 44098 7740 11823 2782 932 0 67375 11.5
1997 45868 8308 12493 3141 1042 0 70852 11.7
1998 47324 7991 13672 3394 784 1110 74275 10.8
1999 50573 7227 12570 4324 1346 242 76282 9.5
2000 49314 7972 11955 4478 1134 655 75508 10.6
2001 57302 8823 11584 5571 1062 2804 87146 10.1
2002 63334 9975 11073 6284 1297 3791 95754 10.4
2003 74348 12045 12035 6964 1837 3341 110570 10.9
2004 81886 15421 13034 8143 3605 2377 124466 12.4
2005 84160 16140 14192 9083 1853 2253 127681 12.6
Average 59820.7 10164.2 12443.1 5416.4 1489.2 1657.3 90990.9 11.0

9
Table 3 The IAA‟s Balance Sheet, 1996-2005 € millions
1996 1997 1998 1999 2000 2001 2002 2003 2004 2005
Fixed assets
Tangible assets 31.4 30.7 25.3 23.9 48.8 63.2 87 107.9 104.2 98.4
Current assets
Debtors 10.2 12.2 13.7 15.5 13.7 16.3 22.9 24.9 24.1 29.8
Cash at bank and in hand 19.4 24.7 32.2 27.9 13.5 3 9.4 8.4 13.7 30.2
Total current assets 29.7 37 45.9 43.4 27.2 19.4 32.3 33.3 37.8 60
Total assets 61.1 67.6 71.2 67.3 76 82.6 119.3 141.2 142 158.4
Creditors: amounts due within 1 year -20.8 -24.5 -22.7 -14.8 -18.2 -28.6 -16.6 -24.5 -37.9 -13.5
Net current assets (liabilities) 8.9 12.5 23.2 28.6 9 -9.2 15.7 8.8 -0.1 46.5
Creditors: amounts due after > 1 year -10.4 -8.9 -10.2 -7.8 -8.3 -1.3 -45 -55 -36 -63.1
Provisions for liabilities and charges -0.5 -0.2 -0.9 -1.1 -0.8 -0.9
Total Liabilities -31.2 -33.4 -32.9 -22.6 -26.9 -30.1 -62.5 -80.6 -74.7 -77.5
Capital and Reserves
Called up share capital 22.7 22.7 22.7 22.7 22.7 22.7 22.7 22.7 22.7 22.7
Profit and loss account 0.8 0.8 1 0.9 0.8 0.7 0.7 0.7 0.8 14.3
Other reserves 6.3 10.8 14.6 21.1 25.6 29.1 33.4 37.2 43.9 43.9
Shareholders' funds 29.8 34.3 38.2 44.7 49 52.5 56.8 60.6 67.3 80.9
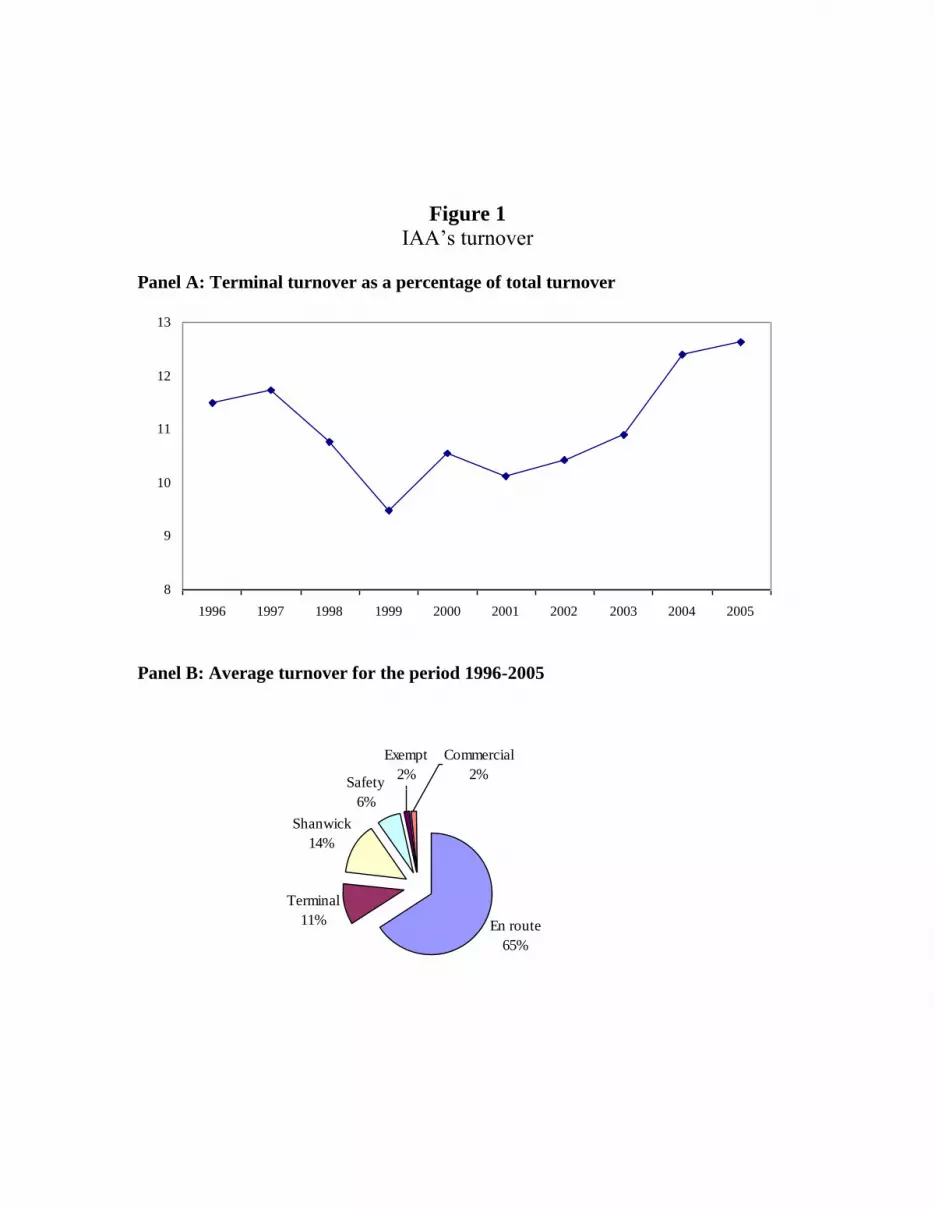
Figure 1 IAA‟s turnover
Panel A: Terminal turnover as a percentage of total turnover
8
9
10
11
12
13
1996 1997 1998 1999 2000 2001 2002 2003 2004 2005
Panel B: Average turnover for the period 1996-2005
En route
65%
Terminal
11%
Shanwick
14%
Safety
6%
Exempt
2%
Commercial
2%

11
Figure 2
IAA‟s gearing 1996-2005
Panel A: Total debt ratios (percent)
0
20
40
60
80
100
120
140
1996 1997 1998 1999 2000 2001 2002 2003 2004 2005
Total debt/assets
Total debt/equity
Panel B: Long-term debt ratios (percent)
0
20
40
60
80
100
1994 1995 1996 1997 1998 1999 2000 2001 2002 2003 2004 2005
Long-term debt/assets
Long-term debt/equity

12
[3] The cost of equity
As discussed in Hutson and Kearney (2002), there are three approaches to estimating the
cost of equity: the capital asset pricing model (CAPM), the dividend growth model, and
the arbitrage pricing theory model. Of these, the CAPM is the most widely used
approach. There is an extensive literature on both the theoretical and practical problems
related to its usage in many different applications (see, for example, Harrington (1987),
Cochran (1999), the CAA (2001), De Fraja and Stones (2004) and the recent report by
Smithers & Co. (2006)). In the context of aviation regulation, the CAPM approach
continues to be the most widely used methodology as evidenced by recent determinations
by the CAA.
The CAPM model is written in equation form as follows.
(1) In this equation,
E(Ri) is the expected return on stock i;
rf is the risk-free rate of interest;
E(Rm) is the expected return on the market portfolio; and
βi is the asset‟s „beta‟, representing the systematic risk of stock i.
The CAPM model in equation (1) describes the return on equity as the risk free rate, rf,
plus a premium for risk, βi[E(R
m) – r
f]. The risk premium is defined as the quantity of
risk multiplied by the price of risk. The quantity of risk is measured by the systematic
risk of the stock as measured by its beta βi (the covariance of the stock‟s return with the
return on the overall market), and the price of risk is measured by the equity risk
premium, [E(Rm) – r
f]. The essential insight in the CAPM model is that in order to invest
in equity rather than purchase a risk-free asset, investors expect to be rewarded by
earning the risk free rate of interest plus a premium for the risk associated with holding
equity.
The CAPM is a theoretical model that is built upon a number of assumptions: all
investors are risk-averse expected utility maximisers, asset quantities are fixed and all
assets are divisible and marketable, markets are competitive and frictionless, with
costless information simultaneously available to all investors, and there are no taxes,
regulations, or other restrictions on market behaviour. Although these assumptions do
not hold in the real world, they can be relaxed to a greater or lesser extent at the cost of
additional complexity in the model. The simple form of the CAPM as stated above,
however, remains useful and widely applied in utility regulation because it provides a
universally accepted methodology for quantifying and pricing equity risk. It is important
to note that significant problems arise in implementing the CAPM due to the necessity to
estimate its three parameters, and there exists an extensive literature on how best to

13
overcome these problems when applying the model.
3.1 The risk-free rate of interest
The risk-free rate is a theoretical construct defined as the rate of interest that has no
variance and no covariance with the market. It is usually proxied by the yield on default
risk-free government securities such as treasury bills or bonds. Such nominal rates of
interest include both a real and an expected inflation component, as described by the
Fisher equation:
)I1)(r1()r1(ectedexprealalminno
(2)
In this equation, r denotes the interest rate and I denotes the rate of inflation. Because
our task is to estimate IAA‟s real cost of capital, we need to estimate an appropriate real
risk-free rate of interest.
One way to estimate the real risk-free rate of interest is by using the yield on inflation
index-linked government bonds (ILGs). The British government has issued long-term
index-linked gilts for many years. However, there are two reasons why yields on these
bonds are an inappropriate proxy for the real rate of interest in estimating IAA‟s cost of
capital for regulatory purposes. First, as a member of the Eurozone Ireland is subject to
Eurozone rather than British monetary policy, so European base rates are more
appropriate. Second, yields on British ILGs have fallen in the past few years to unusually
low levels. PricewaterhouseCoopers (2004) show that the 10-year index-linked gilt yield
fell substantially during the 1990s from over 4 percent in 1992 to 2 percent at the end of
2004. In 2005 and 2006, ILG yields have fallen further. Shorter-dated bonds are now
yielding less than 2 percent, and long-dated ILGs have recently yielded as low as 0.4
percent.1 This is due to greater demand from pension funds and increasing concerns
amongst investors who are seeking a haven from inflation risk at a time when inflationary
expectations are on the rise.
An alternative approach is to estimate real rates of interest from nominal rates. There is
an extensive literature on how to do this (see, for example, Harrington (1987), Chapter 5)
and Weil (1989)). The choice of whether to use current rates or to calculate some
historical average is contentious (see CAA, 2001 and Hutson and Kearney, 2001), and
particularly pertinent at present because not only are interest rates at their lowest levels
for several decades, but the yield curve is inverted with longer-term rates being currently
lower than their short-term counterparts. Longer-term rates are generally preferred for
calculating the cost of capital for regulatory purposes because empirical studies show that
longer-term rates are less volatile and less influenced by changes to rates by monetary
authorities, and because longer-term rates better match real investment horizons.
Consistent with the generality of recent regulatory determinations, we believe that a long-
term average is the best approach to estimating the risk-free rate.
1 http://www.actuaries.org.uk/Display_Page.cgi?url=/finance_invest/indexlinkedgilts_briefing.html,
consulted 6/12/06.

14
We follow the procedure used in our previous reports for the CAR (Hutson and Kearney,
2001, 2002 and 2005), but instead of looking at German, UK and US data, we imply a
real rate for the Eurozone using the 10-year benchmark Eurozone bond rate and Eurozone
inflation rates.2 This is consistent with Article 6 of the European Commission Regulation
No. 1794/2006, which sets out a common charging scheme for air navigation services in
Europe. Article 6 paragraph 3 includes the following statement: “The return on equity
shall take into account the financial risk of the air navigation service provider taking the
national bond rate as the guide.” By „bond rate‟ we assume that the EC is referring to the
long-term government bond rate. Although we do not use Ireland‟s long-term bond rate,
the Eurozone benchmark is perfectly appropriate. Its membership of the Eurozone
implies that Ireland‟s long-term government bond rate would be very close to that of
other Eurozone countries, particularly those of the same sovereign debt rating. Most of
big Eurozone countries - France, Germany, the Netherlands and Spain – have AAA rating
(from Standard & Poors), and so does Ireland.
3.1.1 Nominal interest rates, inflation, and the real rate of interest for the Eurozone
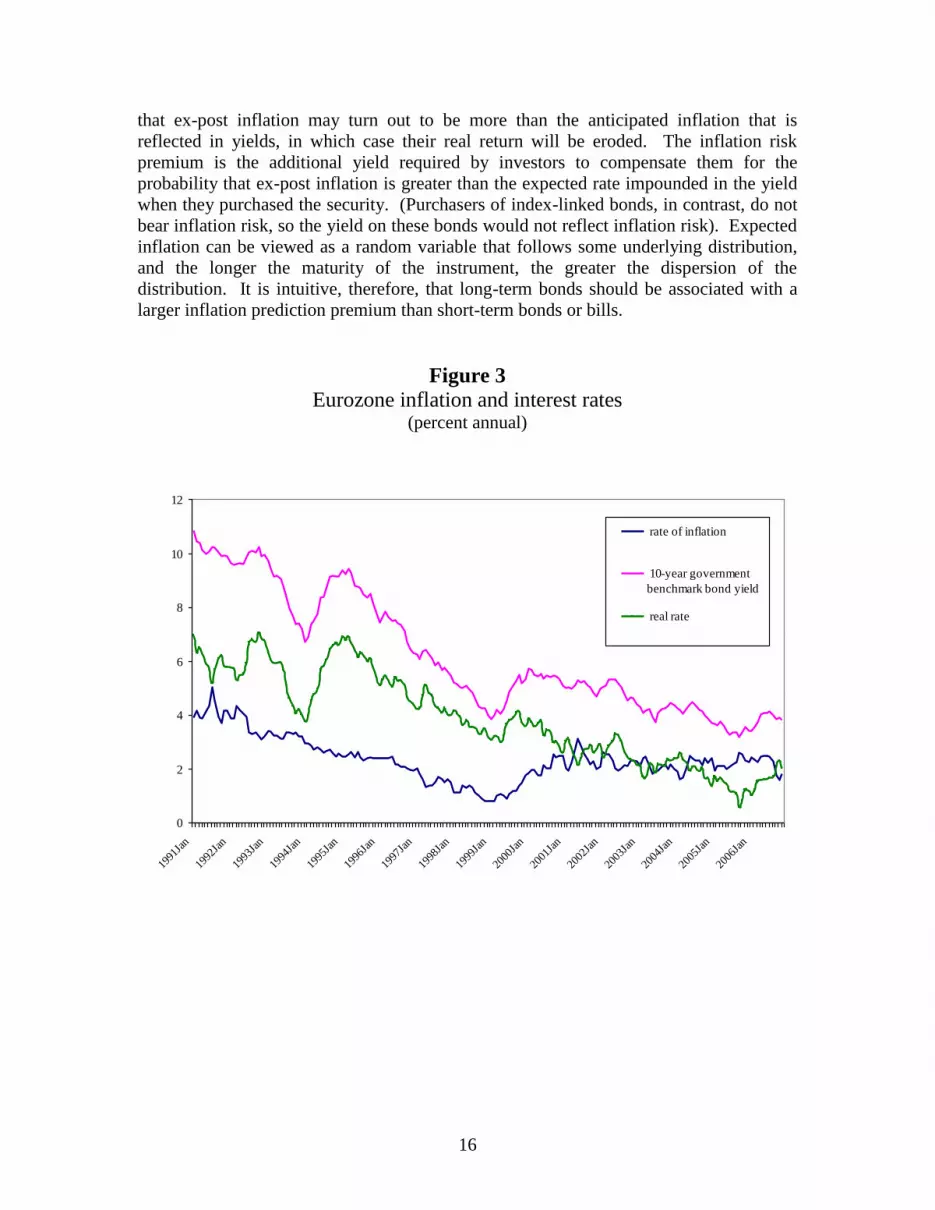
Figure 3 plots the 10-year Eurozone benchmark bond yield (our proxy for the nominal
risk-free rate of interest), the Eurozone annual rate of inflation, and the „real‟ rate, which
is the former minus the latter, for the period from January 1991 to November 2006. The
data were obtained from the ECB‟s website (www.ecb.int). It must be noted that when
we calculate our „real‟ rate of interest, we are assuming that the current rate of inflation is
a good proxy for expected inflation. The mean rate of inflation, the 10-year benchmark
bond yield, and the ex-post real rate of interest during the period are 2.3 percent, 6.2
percent, and 3.8 percent respectively. Figure 3 shows the clear downward trend in both
the rate of inflation and Eurozone government bond yields during the 1990s. As well as
declining inflation and inflationary expectations, the downward trend in the yield also
reflects the gradual convergence of Eurozone government bond yields throughout the
1990s as the market perceived a increasing likelihood that the currency zone project
would come to fruition.
The very high „real‟ rate of interest during the early 1990s that we have derived – of over
6 percent – is probably a significant overestimation of the true real rate of interest for the
period. Instead, it is likely to be the result of the market‟s consistent overestimation of
the future rate of inflation. By the same token, the unusually low current ex-post real rate
of interest of 2 percent may reflect the market‟s assessment that inflation will be even
lower in the future than it is at present. Alternatively, it has been widely discussed in the
markets and in the financial press that the current (unusually low) long-term bond yields
and the flattening of the yield curve reflect a very high level of demand for higher-
yielding securities because of minuscule nominal yields on short-term deposits and
treasury securities. Since the start of the current period of low nominal interest rates in
the early 2000s, demand has shifted to relatively risky securities as investors seek higher
returns, including shifting up the yield curve and also investing increasingly in risky
2 The Eurozone rate of inflation must be used rather than Ireland‟s rate of inflation, because interest rates faced by Irish
organisations and individuals are determined by the European Central Bank. Eurozone official interest rates thus
reflect Europe-wide rates of inflation.

15
securities and markets such as high-yield bonds and emerging markets. It also reflects
increasingly strong demand for assets with long maturities by pension fund managers as
they try to match their long-term liabilities with assets of similar maturities. The result of
all these factors is high prices, low yields and relatively small risk premiums for longer-
dated securities.
However, rather than interest rates being unusually low at present, it is possible that they
have fallen back to long-term historical averages. (We discuss this issue in the next
section). As can be clearly seen in Figure 3, inflation and interest rates in the past 5 years
have been considerably lower than during the 1990s. For the period 2000-2006, inflation
averages 2.2 percent, Eurozone benchmark bond yields average 4.4 percent, and the ex
post real rate of interest averages 2.45 percent. Given that the deceleration of inflation
during the 1990s was not widely anticipated by the market, and given that current bond
yields and other economic indicators reflect moderate inflationary expectations in the
medium-term, it is perhaps these latter averages that are a better guide to the appropriate
risk-free rate to be used as an input to IAA‟s estimated cost of capital over the next 5-
year period.
3.1.2 Previous estimates of the real risk-free rate
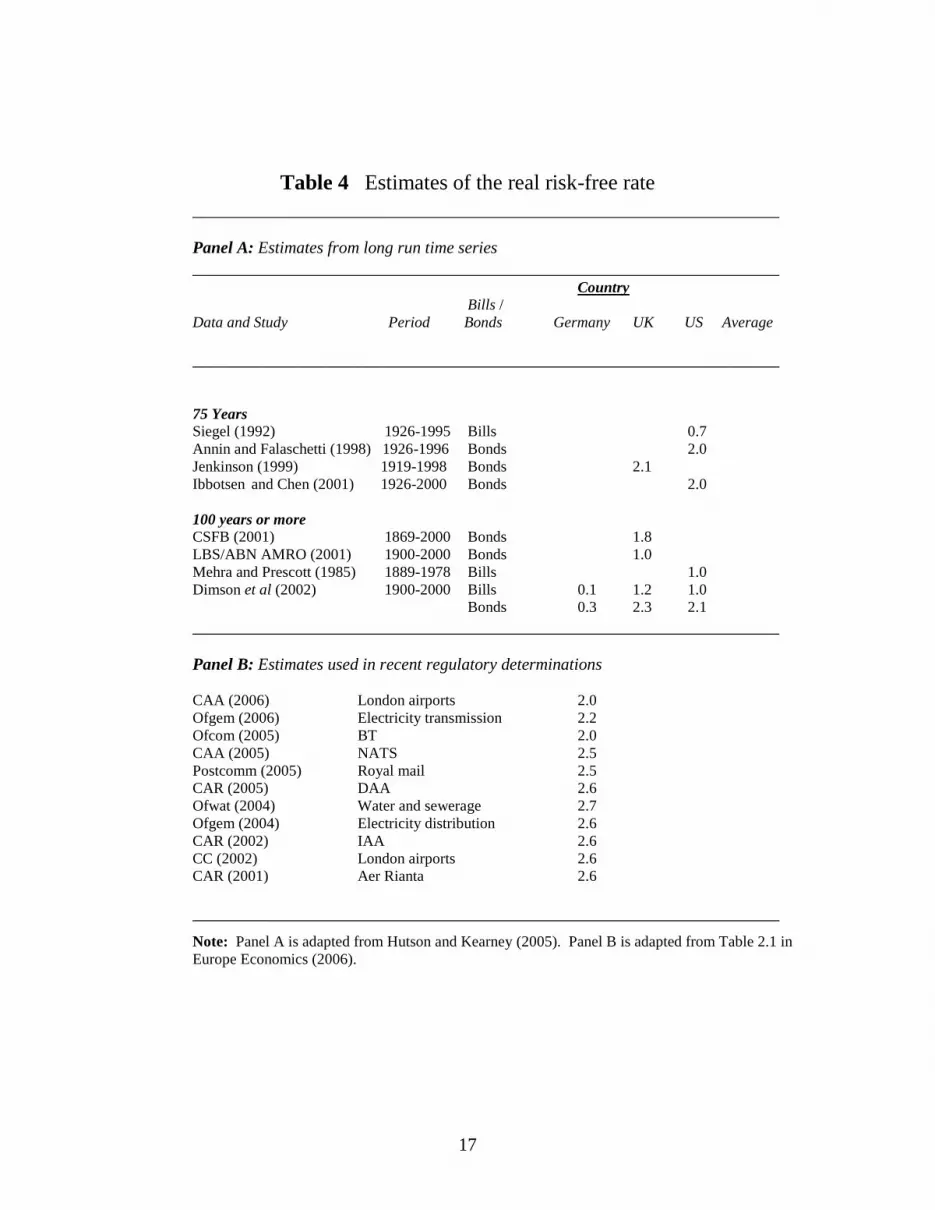
Table 4 (Panel A) summarises the findings of recent studies that have attempted to
estimate the real risk-free rate of interest. It is a copy of Table 1 in Hutson and Kearney
(2005), and it presents estimates of the risk-free rate of interest defined over various time
periods. The entries under „75 years‟ and under „100 years or more‟ include long-term
estimates using either bills or bonds. It is well known that using bills rather than bonds as
the benchmark tends to provide lower estimates of the real risk-free rate, because
historically an upward-sloping yield curve is the most common yield curve shape. The
estimates from long time-series based on bonds include those of Annin and Falaschetti
(1998) and Ibbotson and Chen (2001) for the US, and Jenkinson (1999), CSFB (2001)
and LBS/ABN Amro (2001) for the UK.
As discussed in section 3.1.1, it is plausible that rather than interest rates being unusually
low at present, that the current interest rate regime can be better described as a return to
long-run averages following a period of unusually high real rates. One of the most
rigorous studies of the long-term risk-free rate of interest is Dimson, Marsh and Staunton
(2002), whose estimates for Germany, the UK and the US appear in the bottom two rows
of Panel A in Table 4. Their estimates of the real risk-free rate using bills are 0.1, 1.0 and
1.2 percent; and using bonds the estimates are 0.3, 2.3 and 2.1 percent for Germany, the
US and the UK respectively. Against this backdrop, our calculated „real‟ long-term rate
in the last few years of less than 2 percent (see Figure 3) is a return to what might be
referred to as the long-run equilibrium real interest rate.
3.1.3 Adjusting for the inflation risk premium
While the rates of return on OECD government securities are generally assumed to be
default risk-free, they are not free of risk even if held to maturity. This is because actual
(ex-post) inflation will seldom equal expected inflation, and investors will be concerned
16
that ex-post inflation may turn out to be more than the anticipated inflation that is
reflected in yields, in which case their real return will be eroded. The inflation risk
premium is the additional yield required by investors to compensate them for the
probability that ex-post inflation is greater than the expected rate impounded in the yield
when they purchased the security. (Purchasers of index-linked bonds, in contrast, do not
bear inflation risk, so the yield on these bonds would not reflect inflation risk). Expected
inflation can be viewed as a random variable that follows some underlying distribution,
and the longer the maturity of the instrument, the greater the dispersion of the
distribution. It is intuitive, therefore, that long-term bonds should be associated with a
larger inflation prediction premium than short-term bonds or bills.
Figure 3
Eurozone inflation and interest rates (percent annual)
0
2
4
6
8
10
12
1991
Jan
1992
Jan
1993
Jan
1994
Jan
1995
Jan
1996
Jan
1997
Jan
1998
Jan
1999
Jan
2000
Jan
2001
Jan
2002
Jan
2003
Jan
2004
Jan
2005
Jan
2006
Jan
rate of inflation
10-year government
benchmark bond yield
real rate
17
Table 4 Estimates of the real risk-free rate
________________________________________________________________
Panel A: Estimates from long run time series
________________________________________________________________ Country
Bills /
Data and Study Period Bonds Germany UK US Average
________________________________________________________________
75 Years
Siegel (1992) 1926-1995 Bills 0.7
Annin and Falaschetti (1998) 1926-1996 Bonds 2.0
Jenkinson (1999) 1919-1998 Bonds 2.1
Ibbotsen and Chen (2001) 1926-2000 Bonds 2.0
100 years or more
CSFB (2001) 1869-2000 Bonds 1.8
LBS/ABN AMRO (2001) 1900-2000 Bonds 1.0
Mehra and Prescott (1985) 1889-1978 Bills 1.0
Dimson et al (2002) 1900-2000 Bills 0.1 1.2 1.0
Bonds 0.3 2.3 2.1
________________________________________________________________
Panel B: Estimates used in recent regulatory determinations
CAA (2006) London airports 2.0
Ofgem (2006) Electricity transmission 2.2
Ofcom (2005) BT 2.0
CAA (2005) NATS 2.5
Postcomm (2005) Royal mail 2.5
CAR (2005) DAA 2.6
Ofwat (2004) Water and sewerage 2.7
Ofgem (2004) Electricity distribution 2.6
CAR (2002) IAA 2.6
CC (2002) London airports 2.6
CAR (2001) Aer Rianta 2.6
________________________________________________________________
Note: Panel A is adapted from Hutson and Kearney (2005). Panel B is adapted from Table 2.1 in
Europe Economics (2006).
18
In Hutson and Kearney (2001) we deducted an inflation risk premium of 40 percent from
our calculated real risk-free rates. This estimate came from Breedon and Chadha (1997),
who estimated this figure for UK interest rates. Dimson, Marsh and Staunton (2002)
provide estimates of the inflation risk premiums at 0.2 percent, 0.9 percent and 1.0
percent for, respectively, Germany, the UK and the US, and their estimate for Ireland is
0.8 percent.
More recently, some economists have argued that the reduction in long-term real interest
rates observed over the past decade can be explained by a dramatic reduction in the
inflation risk premium, as a result of reduced volatility in inflationary expectations (or
more strongly „anchored‟ inflationary expectations), which is traced to the improved
credibility of monetary authorities. Reduced inflation around the world has also been
explained by the entry of China and more recently India into the world economy, whose
inexpensive goods enhance price competition and whose cheap labour moderates wage
pressures around the world. Certainly current low interest rates reflect moderate
inflationary expectations in the medium-term, and there is a strong argument to say that
this would be accompanied by a reduction in perceived inflation risk.
In section 3.1.1 we calculated an average „real‟ interest rate of 3.8 percent for the 16-year
period 1991 to 2006, and 2.45 percent for the period 2000-2006. As discussed in section
3.1.2, the real average rate of interest we have calculated for the 2000s is certainly closer
to the long-term averages that have been calculated by various experts presented in Table
4, so there is a strong argument to say that interest rates have moved back towards their
long-term historical mean. This may well reflect a dramatic reduction in the inflation risk
premium for longer-term bonds. We consequently estimate the real risk free rate of
interest to be within the range of 2.00 - 2.45 percent, and our best estimate is 2.2 percent.
As Panel B of Table 4 shows, this within the range of more recent regulatory
determinations, including the figure of 2.0 percent in the recent CAA proposed
determination for the London airports.
While this is less than the real rate of interest used in our previous estimate of the cost of
capital for IAA (Hutson and Kearney, 2002), it is consistent with the trend decline in the
return on bonds as projected by the Authority in the details of its pension scheme (various
IAA annual reports). In 2002 the expected return on equities was 8 percent and on bonds,
5 percent. This fell to 7.75 percent and 4.75 percent in 2003, and was reduced further to
7.3 percent for equities and 3.8 percent for bonds in 2004. The IAA‟s most recent
projection (2005) was equities 6.4 percent and bonds 3.1 percent.
3.2 The equity risk premium
The equity risk premium is the return that investors require to induce them to purchase
and hold equity rather than risk-free bonds. The equity risk premium is a forward-
looking variable that reflects investors‟ expectations, and it cannot be directly observed.
There is an extensive literature on the determinants and measurement of the equity risk
premium, and a significant element of judgment is required in establishing an estimate for
input into the cost of capital calculation. Kocherlakota (1996) and Siegel and Thaler

19
(1997) provide reviews of this literature. Given the complexities involved in estimating
the equity risk premium, we extrapolate from the most reliable and comprehensive
studies to estimate the equity risk premium for IAA‟s cost of equity.
3.2.1 The preferred estimation method
The equity risk premium can be estimated in three ways. The first method uses historical
time series data to calculate the difference between the long-run return on a stock market
index, and the long-run return on risk-free bills or bonds. The second method uses
models that incorporate fundamental information such as earnings, dividends or
economic productivity (see, for example, Diermeier, Ibbotson and Siegel (1984), Shiller
(2000) and Fama and French (2001)). The third method uses surveys of the views of
professional financial analysts (see, for example, Welch, 2000). The second method, as
discussed in Hutson and Kearney (2001), is complex and often difficult to implement in
practice. Estimates of the equity risk premium emanating from such studies, however,
tend to be lower than market-based studies. Claus and Thomas (2001), for example,
estimated the discount rate that equated US stock market valuations with the present
value of prevailing cash flow forecasts, and found that the equity risk premium may be as
low as 3 percent. The third approach – surveying analysts – was derided by Dimson,
Marsh and Staunton (2002) for being highly biased to fads and trends.
For these reasons, it is widely accepted that expected equity returns are best
approximated by actual (ex-post) equity returns, and in this report we draw on studies
that have used this approach. It is essential that such studies use data drawn from a very
long period. Equity markets are well known to move in a cyclical fashion and to lead the
business cycle. Long periods of bull market conditions are common, and are often
followed by bear markets, so care must be taken to include data from both types of
periods. Data drawn from a bear market, for example, may well result in a negative
estimate, which is nonsensical, while data drawn a bull market period will produce
overestimates of the equity risk premium.
3.2.2 Estimates from academic and practitioner studies
Table 5 summarises the estimates of the equity risk premium from a selection of previous
studies (Panel A) and recent determinations (Panel B). Panel A is an updated version of
Table 3 in Hutson and Kearney (2005). Dimson, Marsh and Staunton‟s (2002) study is
the most extensive and rigorous. They estimate the equity risk premium for 16 countries
for the period 1900-2001, and argue that by looking at a range of markets they address
the problem of survivorship bias. Many studies of the equity risk premium use data
mostly from „successful‟ economies like the UK and the US. Ignoring other markets that
have been less successful or have weathered more economic volatility than others, they
argue, leads to the overestimation of the equity risk premium. In a second innovation,
Dimson, Marsh and Staunton claim to control for „success bias‟ – that is, standard stock
market indices are intermittently re-jigged to include only companies with a particular
size by market capitalisation. They attempt to overcome success bias by ensuring that
their indices are compiled from a very large number of underlying stocks.

20
Table 5 Estimates of the equity risk premium
________________________________________________________________
Panel A: Estimates from long-run time series
________________________________________________________________ Country
Bills /
Data and Study Period Bonds Germany UK US Average
________________________________________________________________
75 Years
Annin and Falaschetti (1998) 1926-1996 Bonds 7.3
Cornell (1999) 1926-1997 Bonds 4.5
Ibbotsen and Chen (2001) 1926-2000 Bonds 6.0
100 years or more
Mehra and Prescott (1985) 1889-1978 Bills 6.0
Siegel (1992) 1802-1990 Bills 5.3
LBS/ABN AMRO (2001) 1901-2000 Bonds 9.9 5.6 6.9 6.7
Dimson et al (2002) 1900-2000 Bills 10.3 6.5 7.7 6.2
Bonds 9.9 5.6 7.0 5.6
Dimson et al (2006) 1900-2005 Bills 4.7
_____________________________________________________________________________
Panel B: Estimates used in recent regulatory determinations
CAA (2006) London airports 4.5
Ofgem (2006) Electricity transmission 5.3
Ofcom (2005) BT 4.5
CAA (2005) NATS 4.5
Postcomm (2005) Royal mail 4.2
CAR (2005) DAA 6.0
Ofwat (2004) Water and sewerage 4.5
Ofgem (2004) Electricity distribution 3.5
CAR (2002) IAA 6.0
CC (2002) London airports 3.5
CAR (2001) Aer Rianta 6.0
________________________________________________________________
Note: Panel A is adapted from Hutson and Kearney (2005). Panel B is adapted from Table 2.2 in
Europe Economics (2006).

21
The more recent „world‟ estimate of Dimson, Marsh and Staunton (2006) is an update of
the equity premium calculations from their 2002 book. They find that for the period 1900
to 2005, the equity premium on a world portfolio (estimated from 17 countries) is 4.7
percent, so they argue that the appropriate equity premium is in the range 4.5-5 percent.
Panel B of Table 5 presents the mid-point estimates of recent regulatory determinations.
The CAA‟s (2006) proposed central estimate of 4.5 percent for the London Airports cost
of capital calculation embodies a range of 3.5 – 5.0, and this is the same equity premium
used when applied to NATS (2005). The Ofgem (2006) estimate for use in cost of capital
calculations for electricity transmission of 5.3 embodies a range of 4.75 – 5.85, and
Ofwet‟s (2004) estimate of 4.5 for water and sewerage firms lies within a 4.0 – 5.0.
Overall, we are persuaded by the estimate in Dimson, Marsh and Staunton (2006) of 4.7
percent, which falls within the range of recent regulatory determinations. With this in
mind, our previous estimates of the equity risk premium in Hutson and Kearney (2001,
2002, 2005) of 6.0 percent appear somewhat higher than the more recent ranges of the
estimate. We therefore revise our estimate to 5.0 percent. As mentioned at the start of
this section, there is need for a considerable element of judgment, and our estimate lies
within the ranges proposed by CAA (2006) for NATS, by Ofgem (2006) for electricity
transmission, and by Ofwet (2004) for water and sewerage.
3.3 Beta
A stock‟s risk has two components: systematic and unsystematic (also known as
idiosyncratic or stock-specific risk). The equity beta (β) of a stock is its systematic (or
market) risk. It is well established in finance theory that only systematic risk is priced by
the market – that is, it is only the systematic risk of the stock that investors should expect
to be compensated for in terms of additional return, because investors can easily and
cheaply diversify their portfolios to eliminate idiosyncratic risk. Equity beta is usually
estimated using simple regression techniques that require a sufficient time-series of stock
price data. This technique cannot be used for the IAA, however, because the Authority is
not listed. The conventional approach in this case is to seek comparator companies that
are listed, and to adjust the estimated beta based on any clear differences between the
operations and gearing of the comparator companies and the firm for which beta is being
estimated.
Equity betas are adjusted for gearing by calculating an asset beta – which is the beta for
an unlevered firm and thus is a measure of systematic business risk – for the comparator
company. Adjustments are made for differences in business risk, and the asset beta is
then „re-geared‟ according to the capital structure of the firm for whom equity beta is
being estimated, using the following formula:
(3)
22
For this calculation, as well as an estimate of IAA‟s asset beta, we need estimates of its
debt-to-equity ratio (D/E) and the relevant corporate tax rate (Tc).
3.3.1 IAA’s business risk
In our previous cost of capital calculation for IAA (Hutson and Kearney, 2002), we
estimated the asset beta at 0.65 percent. Our comparator companies were Aer Rianta,
BAA and NATS, whose asset betas were estimated at 0.50, 0.50 and 0.65 respectively.
For this report, we continue to use NATS as the closest comparator, being an air traffic
control company. To provide an Irish perspective on risks in the aviation industry, we
use the Dublin Airport Authority (DAA) as a second comparator company. A critical
difference between airports and the traffic control organisations is that the former are
more capital intensive and a have larger proportion of commercial revenues. In addition,
the air traffic control companies arguably face more technological risk due to their high-
technology assets.
Events in recent years have led to a reassessment of the riskiness of the aviation business.
Amongst the major risks that have been identified by the IAA and by other aviation
operators and regulators in Ireland and abroad, the terrorist attacks of 11th
September
2001 feature as the most significant. They have led to a growing level of concern
amongst the flying public, and this has necessitated more security measures on the
ground and in the air. While there seems to be a consensus among experts that this single
event has increased risks substantially, it is difficult to quantify. The invasion of Iraq has
added to the level of perceived risk in the industry, and the world avian flu scare in 2003
also exacerbated concerns. More recently hikes in global oil prices and the expectation
of probable future green taxes on fuel has contributed to further uncertainty. In addition
to these factors, the impact of new technologies and possible further deregulation of the
international skyways has enhanced technological and regulatory risk. In Ireland,
operators face regulatory risk associated with expected changes to aviation regulation due
to the possible restructuring of the CAR to combine economic regulation with safety
regulation.
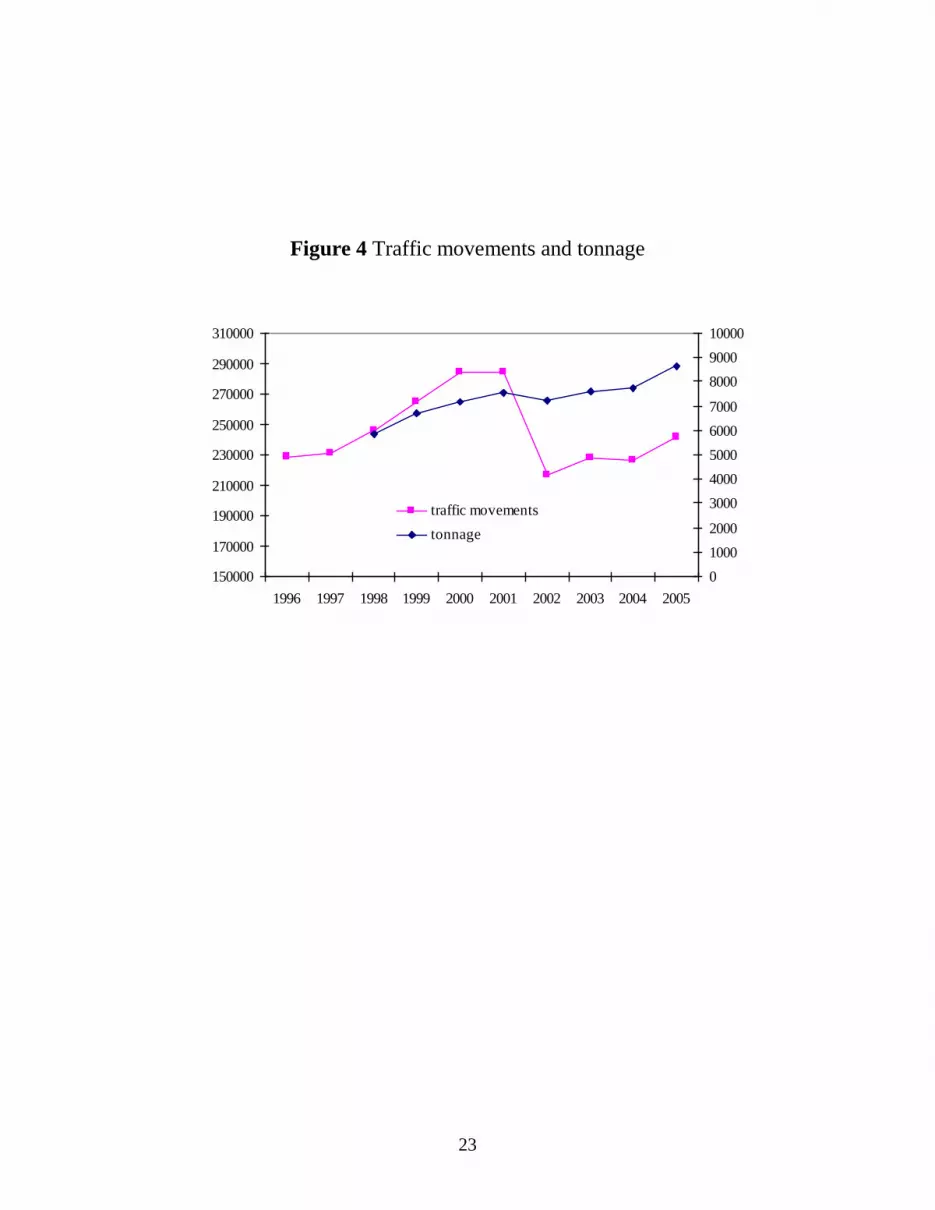
While all these risk factors are significant for the aviation sector, Table 2 shows that the
IAA‟s turnover from terminal activity, which is the regulated component of its
operations, has grown in every year since 1999 when it declined by 9.6 percent following
a prior decline of 3.8 percent in 1998. Figure 4 depicts traffic movements and tonnage
for the period 1996-2005. As can be seen in the figure, there was a reduction in traffic
movements in 2002 (following the events of 11th
September 2001) from 284,135 to
216,549. Traffic movements have not yet recovered fully from the highs of 2001
following a reduction of traffic movements of around 24 percent, but tonnage was barely
affected. This is consistent with our analysis in Hutson and Kearney (2005) of the
business risks facing the DAA, which concluded that in spite of the aforementioned risks,
the aviation industry has demonstrated an ability to recover quickly following periods of
crisis.
23
Figure 4 Traffic movements and tonnage
150000
170000
190000
210000
230000
250000
270000
290000
310000
1996 1997 1998 1999 2000 2001 2002 2003 2004 2005
0
1000
2000
3000
4000
5000
6000
7000
8000
9000
10000
traffic movements
tonnage
24
In their analysis of comparator companies to estimate the asset beta for NATS,
PricewaterhouseCoopers (2004) identified sectors and specific companies with similar
risk profiles to NATS as the basis for their analysis of comparators. They calculated the
equity and asset betas of utilities, airports and airlines. The group of utility comparators
included 7 from a number of sectors in France, Germany, Greece, Spain and the United
Kingdom. The average equity beta for the utilities was 0.58, with a minimum of 0.26 and
a maximum of 0.93. The average asset beta was 0.30, with a minimum of 0.21 and a
maximum of 0.39. The 6 airport comparators included airports in Austria, Denmark,
Germany, Italy and the United Kingdom. The average equity beta was 0.81, with a
minimum of 0.64 and a maximum of 1.01, and the mean asset beta was 0.62 with a
minimum of 0.42 and a maximum of 0.89. The group of 10 airlines included companies
from Finland, France, Germany, Italy, Spain, Turkey, Switzerland and the United
Kingdom. The average equity beta was 1.16, with a minimum of 0.50 and a maximum of
2.01. The average asset beta was 0.63, with a minimum of 0.28 and a maximum of 1.16.
(Being listed in London, Ryanair was counted as a UK company and its estimated equity
and asset betas were 0.86 and 0.72 respectively).
In their assessment of the implications of the comparator analysis for estimating the
riskiness of NATS, PricewaterhouseCoopers (2004) argued that NATS, being more
labour-intensive (particularly relative to the capital-intensive gas and electricity sectors),
coupled with NATS‟ greater ratio of operating costs to assets of 40 percent (relative to
that for utilities which is closer to 10 percent), suggests that its beta is likely to be higher.
With regard to the airport and airline comparators, although NATS operates in the same
industry, it is unlikely to be exposed to the same quantity of systematic risk faced by
airlines. Taking all this comparator analysis into consideration, PricewaterhouseCoopers
(2004) adopted an asset beta for NATS of 0.55 as the mid-point in the range 0.5 to 0.6.
In the more recently announced preliminary determination on the cost of capital for the
London airports, Europe Economics (2006) estimates the beta for BAA at 0.80, being at
the bottom of a range of 0.8 to 1.0, using two years of daily data on the listed stock price
of BAA and the FTSE all-share index, up to the end of January 2006 (which was when
speculation about the takeover began). The recommended beta of 0.80 lies at the bottom
of the 0.80 to 1.0 range that was applied in the previous determination. In order to check
the robustness of the estimated beta using the FTSE all-share index, Europe Economics
(2006) performed the estimates using both the MSCI Europe and the MSCI global share
price index. This investigation was motivated by the Smithers (2006) report, which
argued that a representative investor in a listed regulated utility might well be domiciled
outside the country of the utility. Using these global indices rather than the domestic
index, somewhat lower estimates of the beta were obtained, but when a 70/30 weighting
in favour of domestic as opposed to global estimate was applied the overall estimate was
similar to that obtained using only the domestic share price index.
On the basis of our previous analysis of the asset beta of IAA, and taking into
consideration the most recent set of profit and loss and balance sheet data for the
authority provided in Tables 1 and 2, together with the other data provided in Table 2 and
Panel A of Figure 1 on movements in terminal activity over time, and given the detailed

25
analysis of NATS and its comparator companies performed by PricewaterhouseCoopers
(2004), we argue that IAA‟s asset beta should be higher than BAA‟s; our estimate is 0.65.
In addition to the reasons discussed above as to why NATS‟ business risk is lower than
IAA‟s, NATS operates under the traffic risk-sharing scheme, in which the air navigation
service supplier shares the traffic risks with the airlines. This traffic risk sharing scheme
does not operate in Ireland. We understand that the CAR is considering adopting the
NATS‟ risk-sharing approach for the IAA. If a risk-sharing system is put into place, it
will strengthen risk comparisons between NATS and the IAA.
Our estimate of the asset beta for the IAA is therefore the same as that suggested in our
previous report: 0.65.
3.3.2 IAA’s gearing
There is some debate about whether actual or „optimal‟ gearing should be used in the cost
of capital calculation. In our last cost of capital calculation for IAA (Hutson and
Kearney, 2002), the difference between actual and optimal gearing was substantial
because at that time IAA had no long-term debt, and we assumed an optimal gearing ratio
for IAA of 50 percent on the basis of NATS‟ gearing. As discussed in section 2, IAA
embarked on a major capital expenditure programme in late 2002, and this was financed
by banks loans. As Panel B of Figure 2 shows, the IAA‟s long-term debt-to-assets ratio
is now 40 percent (as against a 10-year average of 20 percent) and its total debt-to-assets
ratio is 48 percent. We use an average for the 4 years for 2002 to 2005 to calculate the
debt-to-assets and debt-to-equity ratios. These are respectively 35.5 and 75.4. (As its
2005 current liabilities of €13.5 million are more than offset by total current assets of €60
million, the long-term debt ratio is more appropriate to use than the total debt ratio).
3.3.3 The equity beta calculation
In our last report regarding IAA‟s cost of capital (Hutson and Kearney, 2002), we
assumed that the rate of tax stepped down from 16 percent in 2002 to 12.5 percent
thereafter, giving an average tax rate for the period 2002 to 2006 as 13.2%. We assume
that the corporate tax rate will remain at 12.5 percent for the foreseeable future.
(3)
βequity
= 0.65(1+(1-.125)0.754)
βequity
= 1.08
Our recommended equity beta for the IAA with an assumed debt-to-equity ratio of 0.754
is 1.1. This is a reduction of 0.1 from our prior estimate in Hutson and Kearney (2002), which was 1.2. There are two reasons for the difference. While the asset beta estimate
remains at 0.65, the debt-to-equity ratio has fallen, and this reduces the equity beta given
the asset beta. This is partially offset by a reduction in the corporate tax rate (which leads
to an increase in equity beta) from an average of 13.5 in the previous estimate to 12.5.

26
[4] The cost of debt
Investors require a premium over and above the return on the risk-free asset to
compensate them for the additional risk associated with corporate debt. The debt
premium reflects the likelihood that the company will default on its debt obligations. It is
determined by both the business and financial risks faced by the company, and it is
usually determined by fundamental analysis of the company and its industry. If a
regulated utility has publicly traded debt outstanding, the common method for estimating
the nominal cost of debt is to take the current market yield on that debt. If the real cost of
debt is required, the yield spread over benchmark is taken as the best estimate of the debt
premium, and this is added to the estimated real risk-free rate of interest to determine the
cost of debt. If the regulated utility has no outstanding public debt, the widely accepted
approach is to seek comparator companies that have public debt.
In estimating the debt premium for BAA, the CAA (2002) used BAA‟s actual cost of
debt together with the cost of debt for several comparator companies. They derived an
estimated debt premium of 1.1 percent (110 basis points), with a range from 90 to 120
basis points. This was very similar to the PricewaterhouseCoopers (2004) central
estimate of the cost of debt for NATS 120 basis points. In its proposed determination on
the cost of debt for BAA, the CAA (2006) adopts the same methodology as it did
previously to derive an estimated debt premium of 105 basis points with a range of 80 to
110 basis points. In our past estimates of the debt premiums facing Aer Rianta, the IAA
and the DAA (Hutson and Kearney, 2001, 2002 and 2005, we followed standard
regulatory practice in using combinations of comparator companies and/or the actual cost
of debt where available.
At the time of the last determination the IAA had no long-term debt, but we needed an
estimated cost of debt because we assumed an optimal debt ratio of 50 percent. We
inferred a debt premium of 120 basis points from a group of comparator companies. As
the Authority‟s balance sheet data shows (Table 3 and Figure 2), however, its ratio of
long-term debt-to-assets rose from 1.6 percent in 2001 to 38 percent in 2002 (Figure 2,
Panel B). This was due to bank borrowings of €45 million to finance the major capital
expenditure associated with the new air traffic management re-equipping programme,
which involved new buildings, systems and equipment at Cork, Dublin and Shannon
airports. Using information on its borrowing costs provided by the Authority, we
estimate that the IAA pays an average margin of 0.38 over Euribor for its bank loan
facilities. On 7th
December, 2006 the Euribor benchmark rate ranged from 3.503 for a 1-
week maturity to 3.841 for the 12-month maturity, taking IAA‟s nominal cost of debt to
approximately 4 percent.
Article 6 of the European Commission Regulation No. 1794/2006, which sets out a
common charging scheme for air navigation services in Europe, includes the following
statement: “The interest rates on debts shall be equal to the average interest rate on debts
of the air navigation service provider.” The margins above Euribor discussed in the
paragraph above, however, are rather low, and it is not appropriate that they be used
without adjustment in IAA‟s cost of capital calculation. First, while commonly used as a
benchmark in debt markets, Euribor is not, strictly speaking, a risk-free rate of interest. It

27
is an interbank lending rate, and reflects a small risk premium over the risk-free rate.
These spreads over benchmark would therefore be slightly higher if the benchmark was a
government rate. Second, and more importantly, IAA‟s borrowings are to support a long-
term capital expansion programme, and so the appropriate assumed borrowing rate is a
long-term rate. Longer-term rates of interest attract a maturity premium vis-à-vis short-
term rates.
We estimate IAA‟s cost of debt with reference to the assumed debt premium used for the
CAA‟s (2006) proposed determination with respect to BAA. Europe Economics (2006)
provides (in Table 2.5) detailed information on average premiums for debt securities
issued by companies in the transport and utility sectors, for each Moody‟s and Standard
& Poor‟s rating categories. The range of ratings spans the Aaa/AAA lowest-risk
companies down to the B3/B- high risk companies.
Given that the IAA is a public enterprise fully owned by the government, it is appropriate
to seek comparator companies from amongst the Aaa/AAA band. This is supported by
the low margins associated with the Authority‟s existing bank loan arrangements. Given
the balance sheet categorisation of these loans as maturing in more than one year, we
calculate an average of the medium-term and long-term spreads for transport and utilities
firms in the Aaa/AAA rating category. This is 98 basis points for the transport sector,
and 64 basis points for utilities. Although it could be argued that the risks facing the IAA
are more in line with the transport than with the utilities sector, this is not necessarily the
case because the former will include not just aviation transport but also other forms of
transport that could well be more risky. We therefore take a simple arithmetic average of
the two, which provides an estimate for the debt premium of 81 basis points. Our best
estimate of the debt premium facing the IAA, therefore, is 0.8 percent (80 basis points).
In summary, therefore, we estimate the IAA‟s real cost of debt as our real risk-free rate
estimate of 2.2 percent plus 80 basis points for the debt premium. The resulting real cost
of debt estimate for the IAA is 3 percent.
[5] Gearing
The weightings applied to the estimates of the cost of debt and equity in the WACC
should in theory be based on the firm‟s „optimal‟ capital structure. The term „optimal‟
capital structure is based on the fact that, as the interest payments on debt are tax
deductible, raising the quantity of debt in the capital structure adds to company value.
The „optimal‟ capital structure gives a level of debt at which the tax benefits of debt
begin to be outweighed by the costs of financial distress caused by difficulties associated
with servicing high debt obligations. The problem with the concept, however, is that the
„optimal‟ capital structure is difficult to determine, and there is no guiding theory as to
how to estimate it. In our prior report on the Cost of Capital for the IAA (Hutson and
Kearney, 2001), we used an assumed „optimal‟ debt ratio of 50 percent because IAA had
no debt at the time, and that they planned to raise debt financing in the near future. Our
assumed debt ratio of 50 percent was estimated with reference to NATS‟ actual gearing at
the time.

28
Furthermore, in countries like Ireland where there is a low corporate tax rate, or where a
dividend imputation system reduces the tax benefit of debt, the concept of an „optimal‟
capital structure is less important to company value. For this reason, we use IAA‟s actual
gearing ratio of 35.5 percent, which as discussed in sections 2 and 3.3.2, is IAA‟s mean
long-term debt-to-assets ratio for the last 4 years. The use of actual gearing is consistent
with Article 6 paragraph 3 of the European Commission regulation 1794/2006.
Specifically, it states that “….the weight factors to be ascribed to debt or equity shall be
based on the proportion of the financing of the IAA through either debt or equity.”
[6] The weighted average cost of capital
In its recent report on the cost of capital of NATS for the CAA, PricewaterhouseCoopers
(2004) provide evidence that the vast majority of cost of capital determinations for
regulated utilities since the early 1990s have used the real pre-tax approach to calculating
the WACC. This is the approach that we have adopted in our prior reports (although we
have also included the real post-tax WACC for comparison purposed), and it is also the
approach that the CAA have used in the past and in its recent report on the cost of capital
for the London airports. Again we provide estimates fir both the pre-tax and post-tax real
WACC.
Post-tax WACC:
ERPrED
Et1r
ED
DWACC fcftaxpost
(3)
Pre-tax WACC:
)t1(
ERPrED
E
rED
DWACC
c
f
ftaxpre
(4)
where D = total debt
E = total equity
rf = the real risk-free rate of interest
ρ = the debt premium
tc = the corporate tax rate
ERP = the equity risk premium
β = equity beta
The expression (rf + ρ) is the company‟s real return on debt, and (r
f+[ERP] β) is the
company‟s real return on equity using the CAPM.

29
Inserting our estimates of the inputs to the WACC calculations provides our estimates of
the IAA‟s cost of capital follows:
Post-tax WACC:
ERPrED
Et1r
ED
DWACC fcftaxpost
(3)
= 0.355(2.2+.8)(1-.125) + 0.645(2.2+5(1.1))
= 5.9
Pre-tax WACC:
)t1(
ERPrED
E
rED
DWACC
c
f
ftaxpre
(4)
= 0.355(2.2 + 0.8) + 0.645(2.2 + 5(1.1))/(1-.125)
= 6.7
Our estimate of the post-tax real WACC at 5.9 percent is 0.6 percentage points below the
estimate of 6.5 percent for the IAA in 2002, and the pre-tax real WACC of 6.7 percent is
0.8 percentage our 2002 estimate of 7.5 percent. The real post-tax (real pre-tax) WACC
calculated by PricewaterhouseCoopers (2004) for NATS was estimated as lying within
the range of 4.1 percent to 6.2 percent (4.9 percent to 7.4 percent), with a central estimate
of 5.0 percent (6.1 percent).
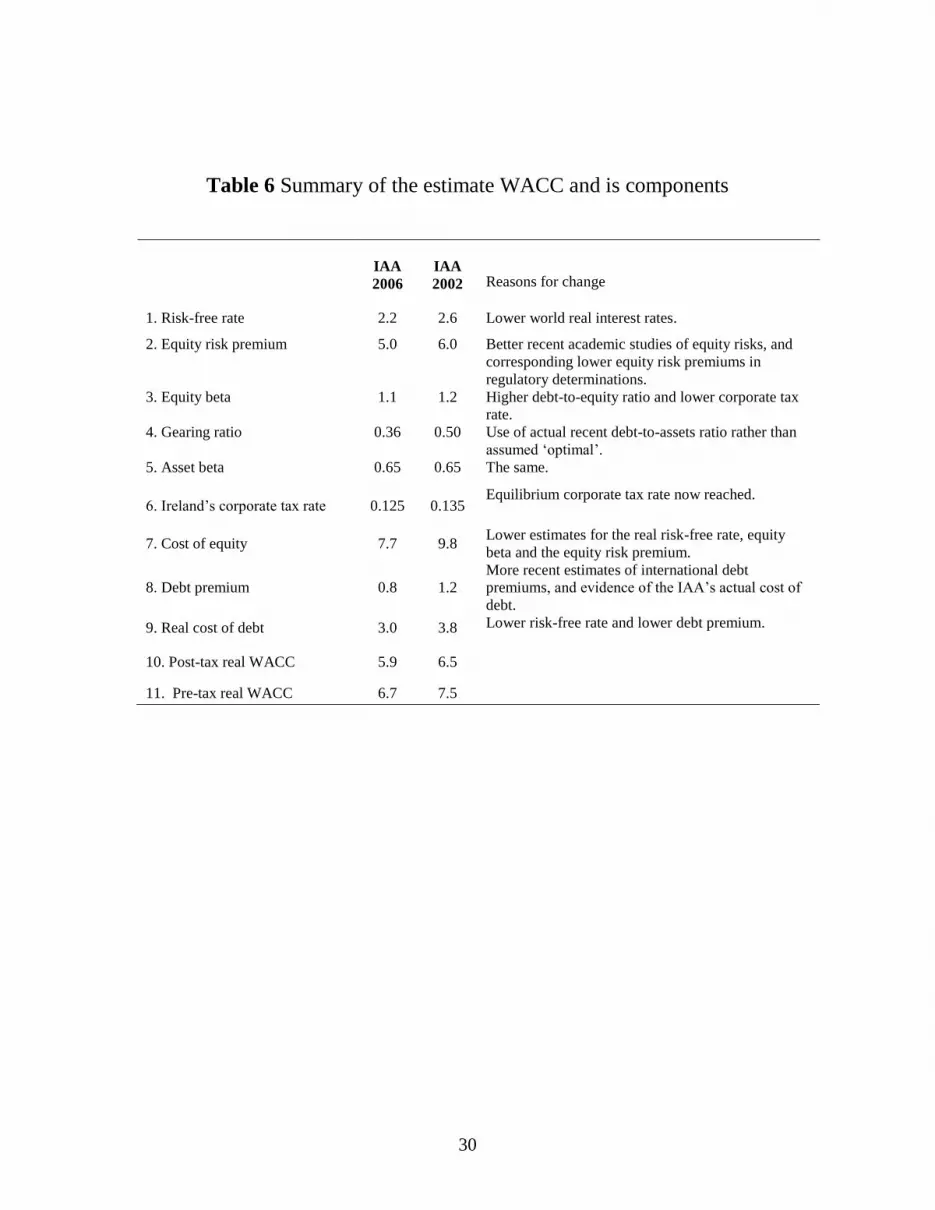
A summary of our findings for the WACC and its components can be found in Table 6.
30
Table 6 Summary of the estimate WACC and is components
IAA
2006
IAA
2002 Reasons for change
1. Risk-free rate 2.2 2.6 Lower world real interest rates.
2. Equity risk premium 5.0 6.0 Better recent academic studies of equity risks, and
corresponding lower equity risk premiums in
regulatory determinations.
3. Equity beta 1.1 1.2 Higher debt-to-equity ratio and lower corporate tax
rate.
4. Gearing ratio 0.36 0.50 Use of actual recent debt-to-assets ratio rather than
assumed „optimal‟.
5. Asset beta 0.65 0.65 The same.
6. Ireland‟s corporate tax rate 0.125 0.135 Equilibrium corporate tax rate now reached.
7. Cost of equity 7.7 9.8 Lower estimates for the real risk-free rate, equity
beta and the equity risk premium.
8. Debt premium 0.8 1.2
More recent estimates of international debt
premiums, and evidence of the IAA‟s actual cost of
debt.
9. Real cost of debt 3.0 3.8 Lower risk-free rate and lower debt premium.
10. Post-tax real WACC 5.9 6.5
11. Pre-tax real WACC 6.7 7.5

31
References
Annin, M. and D. Falaschetti (1998) “The Equity Risk Premium” Valuation Strategies.
Breedon, F.J. and J.S. Chadha (1997) “The information content of the inflation term
structure” Bank of England.
Civil Aviation Authority (2001) Cost of Capital Position Paper, Mimeograph, London.
Civil Aviation Authority (2006) Airports price control review, initial proposals for
Heathrow, Gatwick and Stansted, London.
Claus, J. and J. Thomas (2001) “Equity premia as low as three percent? Evidence from
analysts‟ forecasts for domestic and international stock markets” Journal of Finance
56(5), 1629-1666.
Cochran, J.H. (1999) “New Facts in Finance” Research Paper, University of Chicago,
June.
Cornell, B. (1999) The Equity Risk Premium: The Long-Run Future of the Stock Market
John Wiley & Sons.
CS First Boston (2001) Equity Gilt Study, April.
De Fraja, G. and C. Stones (2004) “Risk and Capital Structure in the Regulated Firm”,
Journal of Regulatory Economics, 26, 69-84.
Diermeier, J.J., R.C Ibbotson and L.B. Siegel (1984), “The Supply for Capital Market
Returns”, Financial Analysts Journal, March/April.
Dimson, E., P. Marsh and M. Staunton (2002) Triumph of the Optimists: 101 years of
global investment returns, Princeton University Press, Princeton and Oxford.
Dimson, E., P. Marsh and M. Staunton (2006) “The worldwide equity premium: a smaller
puzzle” London Business School working paper.
Economic Regulation Group (2000) “National Air Traffic Services public-private
partnership: setting the charge control for en-route services in UK airspace for the first 5
years”, consultation paper, CAA, April.
Europe Economics (2006) “Estimation of Cost of Capital for BAA London Airports”,
Report for the CAA, Supporting Paper XIII, December.
Fama, E. and K.R. French (2001) “The Equity Premium” Journal of Finance.
Harrington, D.R. (1987) Modern Portfolio Theory, the Capital Asset Pricing Model, and
Arbitrage Pricing Theory: A User’s Guide 2nd
Edition, Prentice Hall, New Jersey.
Hutson, E. and C. Kearney (2001) “The Cost of Capital for Aer Rianta”, Report for the
Commission for Aviation Regulation, August.
Hutson, E. and C. Kearney (2002) “The Irish Aviation Authority‟s Cost of Capital”,
Report for the Commission for Aviation Regulation, February.
Hutson, E. and C. Kearney (2005) “Dublin Airport Authority‟s Cost of Capital”, Report
for the Commission for Aviation Regulation, May.

32
Ibbotson, R.G. and C. Chen (2001) “The Supply of Stock Market Returns” Research
Paper, Ibbotson Associates Inc., Mimeograph.
Irish Aviation Authority Annual Reports, 2000-2005.
Jenkinson, T.J (1999) “Real interest rates and the cost of capital” Oxford Review of
Economic Policy 15, 114-127.
Kocherlakota, N.R. (1996) “The Equity Premium: It‟s Still a Puzzle” Journal of
Economic Literature 34, 42-71.
LBS/ABN Amro (2001) Millenium Book II: 101 years of investment returns.
Mehra, R. and E.C. Prescott (1985) “The Equity Premium: a Puzzle” Journal of
Monetary Economics 15, 145-162.
NATS website: www.nats.co.uk.
PricewaterhouseCoopers (2004) “NATS – cost of capital for CP2”
Shiller, R.J. (2000), Irrational Exuberance, Princeton University Press, Princeton, NJ.
Sharpe, W. (1964), “Capital Asset Prices: A Theory of Market Equilibrium”, Journal of
Finance, September.
Siegel, J.J. (1992) “The real rate of interest, from 1800-1990: a study of the US and UK”
Journal of Monetary Economics 29, 227-252.
Siegel, J.J. and R.H. Thaler (1997) “Anomalies: The Equity Premium Puzzle” Journal of
Economic Perspectives 11(1), 191-200.
Smithers & Co (2006) “Report on the cost of capital”, provided to OFGEM, by S.
Wright, R. Mason, S. Satchell, K. Hori and M. Baskaya.
Welch, I. (2000), “Views of Financial Economists on the Equity Premium and other
Issues”, The Journal of Business, October, 501-537.
Wiel, P. (1989) “The Equity Premium Puzzle and the Risk-Free Rate Puzzle” Journal of
Monetary Economics 24, 401-421.