Embed Size (px)
Citation preview
The Involvement of Thaumatin-Like Proteins in PlantFood Cross-Reactivity: A Multicenter Study Using aSpecific Protein MicroarrayArantxa Palacın1, Luis A. Rivas2, Cristina Gomez-Casado1, Jacobo Aguirre2, Leticia Tordesillas1,
Joan Bartra3, Carlos Blanco4, Teresa Carrillo5, Javier Cuesta-Herranz6, Jose A. Cumplido Bonny5,
Enrique Flores7, Mar G. Garcıa-Alvarez-Eire8, Ignacio Garcıa-Nunez9, Francisco J. Fernandez7,
Pedro Gamboa10, Rosa Munoz3, Rosa Sanchez-Monge1, Maria Torres11, Susana Varela Losada8,
Mayte Villalba11, Francisco Vega4, Victor Parro2, Miguel Blanca9, Gabriel Salcedo12, Araceli Dıaz-
Perales1*
1 Centro de Biotecnologıa y Genomica de Plantas, Campus de Montegancedo, Pozuelo de Alarcon, Madrid, Spain, 2 Departamento de Evolucion Molecular, Centro de
Astrobiologıa (INTA-CSIC), Torrejon de Ardoz, Madrid, Spain, 3 Unitat d’Allergia, Servei Pneumologia i Allergia Respiratoria, Hospital Clınic, Universitat de Barcelona, Institut
d’Investigacions Biomediques August Pi i Sunyer (IDIBAPS), Centro de Investigaciones Biomedicas en Red de Enfermedades Respiratorias (CIBERES), Barcelona, Spain,
4 Servicio de Alergia, Hospital Universitario de la Princesa, Instituto de Investigacion Sanitaria Princesa (IP), Madrid, Spain, 5 Servicio de Alergologıa, Hospital Universitario
de Gran Canaria Dr. Negrın, Las Palmas de Gran Canaria, Spain, 6 Servicio de Alergia, Fundacion Jimenez Dıaz, Madrid, Spain, 7 Unidad de Alergia, Hospital General
Universitario, Alicante, Spain, 8 Unidad de Alergologıa, Complexo Hospitalario, Ourense, Spain, 9 Laboratorio de Investigacion, Fundacion IMABIS-Carlos Haya Hospital,
Hospital Civil, Malaga, Spain, 10 Servicio de Alergia, Hospital de Basurto, Bilbao, Spain, 11 Departamento de Bioquımica y Biologıa Molecular I, Facultad de Quımicas,
Universidad Complutense, Madrid, Spain, 12 Departamento de Biotecnologıa, ETSI Agronomos, Universidad Politecnica, Madrid, Spain
Abstract
Cross-reactivity of plant foods is an important phenomenon in allergy, with geographical variations with respect to thenumber and prevalence of the allergens involved in this process, whose complexity requires detailed studies. We haveaddressed the role of thaumatin-like proteins (TLPs) in cross-reactivity between fruit and pollen allergies. A representativepanel of 16 purified TLPs was printed onto an allergen microarray. The proteins selected belonged to the sources mostfrequently associated with peach allergy in representative regions of Spain. Sera from two groups of well characterizedpatients, one with allergy to Rosaceae fruit (FAG) and another against pollens but tolerant to food-plant allergens (PAG),were obtained from seven geographical areas with different environmental pollen profiles. Cross-reactivity betweenmembers of this family was demonstrated by inhibition assays. Only 6 out of 16 purified TLPs showed noticeable allergenicactivity in the studied populations. Pru p 2.0201, the peach TLP (41%), chestnut TLP (24%) and plane pollen TLP (22%)proved to be allergens of probable relevance to fruit allergy, being mainly associated with pollen sensitization, and stronglylinked to specific geographical areas such as Barcelona, Bilbao, the Canary Islands and Madrid. The patients exhibited .50%positive response to Pru p 2.0201 and to chestnut TLP in these specific areas. Therefore, their recognition patterns wereassociated with the geographical area, suggesting a role for pollen in the sensitization of these allergens. Finally, the co-sensitizations of patients considering pairs of TLP allergens were analyzed by using the co-sensitization graph associatedwith an allergen microarray immunoassay. Our data indicate that TLPs are significant allergens in plant food allergy andshould be considered when diagnosing and treating pollen-food allergy.
Citation: Palacın A, Rivas LA, Gomez-Casado C, Aguirre J, Tordesillas L, et al. (2012) The Involvement of Thaumatin-Like Proteins in Plant Food Cross-Reactivity: AMulticenter Study Using a Specific Protein Microarray. PLoS ONE 7(9): e44088. doi:10.1371/journal.pone.0044088
Editor: Bin Xue, University of South Florida, United States of America
Received June 6, 2012; Accepted August 1, 2012; Published September 7, 2012
Copyright: � 2012 Palacın et al. This is an open-access article distributed under the terms of the Creative Commons Attribution License, which permitsunrestricted use, distribution, and reproduction in any medium, provided the original author and source are credited.
Funding: Ministerio de Ciencia e Innovacion (project BIO2009-07050) and FIS-Thematic Networks and Co-operative Research Centers: RIRAAF (RD07/0064).C. Gomez Casado and L. Tordesillas were supported by training grants from the Spanish Government (FPI and FPU programmes, MEC, respectively). J. Aguirre wassupported by the Ministerio de Ciencia e Innovacion (project FIS2011-27569) and Comunidad de Madrid, R&D Programme of Activities, grant MODELICO-CMS2009ESP-1691. The funders had no role in the study design, data collection or analysis, the decision to publish, or the preparation of the manuscript.
Competing Interests: The authors have declared that no competing interests exist.
* E-mail: [email protected]
Introduction
Cross-reactivity is an important problem for the diagnosis and
treatment of allergy, and in the daily routine of patients, due to our
lack of knowledge about the original sensitization source. Cross-
reactivity in plant food allergy is mediated by panallergens
belonging to widely distributed protein families. Identifying the
patterns of association between different allergen sources from
pollen and foods is a priority because of its importance for
understanding how allergy is triggered.
Rosaceae fruit allergy, represented by peach, is the most prevalent
plant ingested allergy in Spain and the south of Europe. It has
become notably common in the last years [1]. Pru p 3, the lipid
transfer protein (LTP) of peach, is considered to be the main
allergen in this fruit, and is recognized by 60–70% of allergic
patients [2,3]. This allergen exhibits cross-reactivity with a wide
PLOS ONE | www.plosone.org 1 September 2012 | Volume 7 | Issue 9 | e44088
range of plant foods and some pollen sources, such as mugwort
and plane, in a high proportion of patients [3,4,5]. However,
despite the identification of the major allergen responsible for most
peach-associated allergies, we still do not understand the
coexistence of cross-reactivity between peach and some fruits or
pollens such as grasses.
Recently, members of the thaumatin-like protein (TLP) family
have been identified as important allergens in peach fruit [6].
TLPs have also been described as allergens in various fruits, such
as apple, cherry, kiwi, olive and banana, and in pollens such as
cypress and possibly others. This family is thought to be a
panallergen family responsible for cross-reactivity between pollen
and fruit, although this is not currently backed up by sufficient
experimental evidence [7].
The proteins of the thaumatin-like family have molecular
masses of 20–30 kDa, with a very stable three-dimensional
structure that is maintained by six disulphide bridges. They have
been described as plant defense proteins (PR-5) against pathogen-
attacks, especially fungal. Some thaumatins are glycoproteins, and
this could account for their allergenic capacity [8].
The involvement of this protein family in cross-reactivity has
been determined by in vitro techniques, such as ELISA assays, that
require large quantities of allergens and serum volume. The onset
of microarray techniques with large panels of purified allergens,
some of them from the same family, has been a major advance in
the diagnosis of allergic diseases [9,10]. Thus, it is possible to
measure simultaneously IgEs, specific to many molecules, using
tiny amounts of allergen and sera, thereby enabling a large
number of samples to be screened at the reasonable cost. The
wealth of information generated by microarrays also demands
more powerful analytical strategies to identify associations within
the data [11,12]. For this reason, we have made use of the graph
theory to study and visualize the co-sensitization of different sera
for TLP allergens. A graph, or network, is composed of nodes and
connecting links [13,14]. These links might be directed or
undirected, and weighted or unweighted, depending on the nature
of the system under study. In the graphs used in this work, nodes
represent allergens, and links (which are undirected and weighted)
represent the co-sensitization of sera for pairs of allergens.
Recently, these graphs have been used to describe the cross-
reactions in an antibody microarray immunoassay in a sandwich
format [15], and, in fact, there is an extensive literature about their
usefulness for analyzing biological systems [16,17,18,19,20]. In our
particular case, we have focused on developing the potential of
graph theory for analyzing TLP microarrays and for applying
them in the field.
The principal objective of this study was to establish the role of
TLPs in fruit allergy and their putative involvement in cross-
reactivities with other foods and/or pollens. For this purpose, 16
members of this family were purified and printed on a protein
microarray. The panel of proteins was chosen with respect to the
specific features of the sensitization of the population under
evaluation [2]. The TLP microarray was tested with the sera from
329 allergic patients from seven regions of Spain, and considering
with respect to their different pollen profiles.
Results
Purification of TLP Members from Different Foods andPollens
Peach allergy is usually associated to sensitization to other fruits
such as apple, kiwi and banana, and to nuts such as hazelnut,
chestnut and walnut [2]. Moreover, over 70% of peach-allergic
patients in Spain also suffering from pollinosis, mainly from
grasses, mugwort, olive and cypress [2]. Considering these
associations, 16 TLPs were purified, from both foods and pollens,
according to previously described methods (Table 1). Some of
these food-related TLPs had been previously identified as allergens
(www.allergen.org, IUIS; www.allergome.com): Act d 2 [8], Cup a
3 [21], Mal d 2 [22], Mus a 4 [23], Pru av 2 [24], Pru p 2.0101 [6],
Pru p 2.0201 [6], a wheat TLP [25] and olive TLP [26]. The
purified wheat TLP in this study proved to be different from the
one associated with baker’s asthma. In this paper, the allergenic
activities of the other purified TLPs (such as the proteins from
mugwort, birch and plane pollens, and from hazelnut, chestnut,
cabbage, lettuce and olive) have been studied for the first time
(Table 1). Unfortunately, no TLP from grass pollen could be
purified, even though it is one of the most frequently associated
with peach allergy.
Other allergens were included in the microarray: Pru p 3 (LTP,
peach allergen), Art v 3 (LTP, mugwort allergen), Act d 1 (cysteine
protease, kiwi allergen), Ana c 2 (pineapple allergen and marker of
carbohydrate cross-reactive determinants (CCD)), Bet v 1 (PR10
from birch pollen), Cuc m 2 (melon fruit profilin), Pers a 1
(avocado latex-fruit allergen) and Pho d 2 (palm-pollen profilin).
Frequency of Recognition of TLPs by Allergic PatientsSeven regions of Spain were chosen on the basis of their
characteristic major pollens (Table 2, pollen count average for the
previous 10 years), and two groups of patients were included in the
study, prospectively among adult population (Table 2): fruit-
allergic (FAG) patients and non-food pollen-allergic (PAG)
patients. The first group was subdivided into two subgroups
depending on whether patients were allergic to pollen (n = 169) or
not (n = 43). An additional group of food-tolerant volunteers
without pollinosis (n = 35; five per region) was recruited as a
negative control.
A microarray approach was chosen as the best in vitro high-
throughput immunological assay to test a large number of proteins
and sera, based on the small quantities of protein and sera
required. The microarray was constructed by printing TLP
proteins onto activated glass slides, following previously published
methods [27]. Each protein was recognized by at least one serum,
but none of them gave a positive response with sera from the
healthy control group (data not shown).
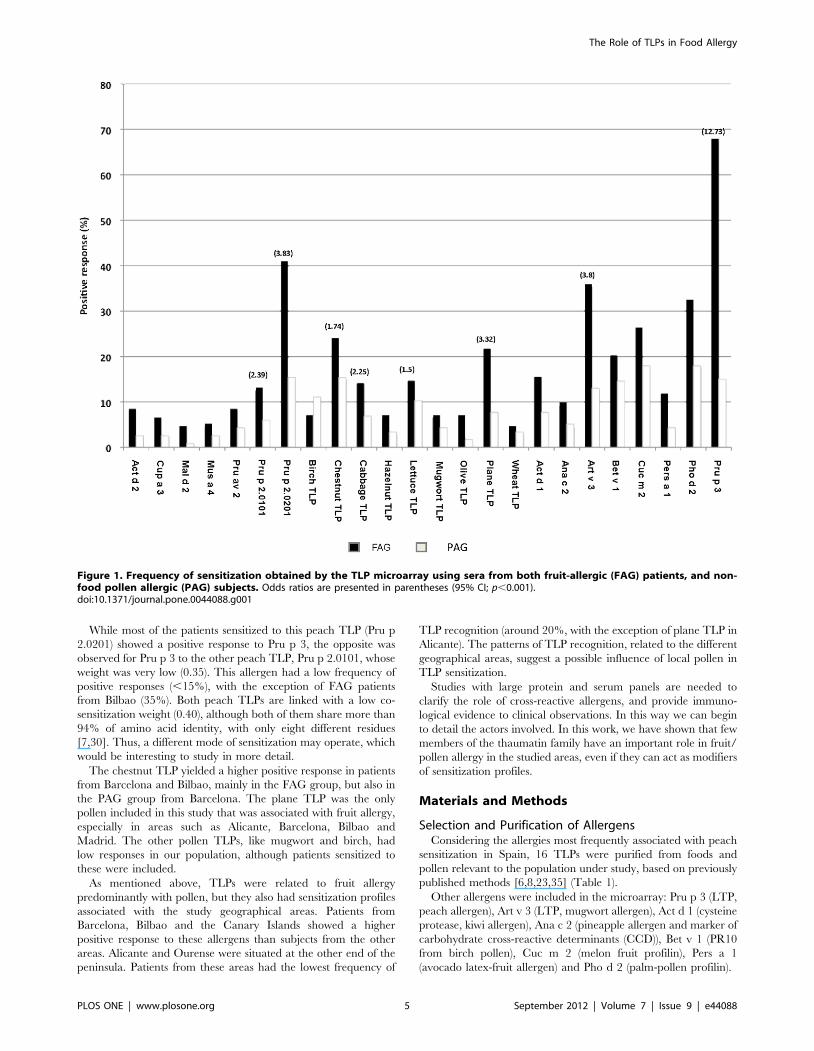
Generally, TLPs were not highly prevalent in the allergic
populations examined in this study (Figure 1). Most of the TLPs
(10/16) were recognized by fewer than 10% of the patients.
Despite this, they were mainly associated with fruit allergy. The
fruit-allergic patients recognized more TLPs than pollinic food-
tolerant subjects (2 versus 0.5 on average, respectively). Curiously,
patients from Barcelona were significantly different, showing
higher polysensitization to these allergens (4 TLPs on average)
than did subjects from the other regions (Mann-Whitney U test:
p = 0.001).
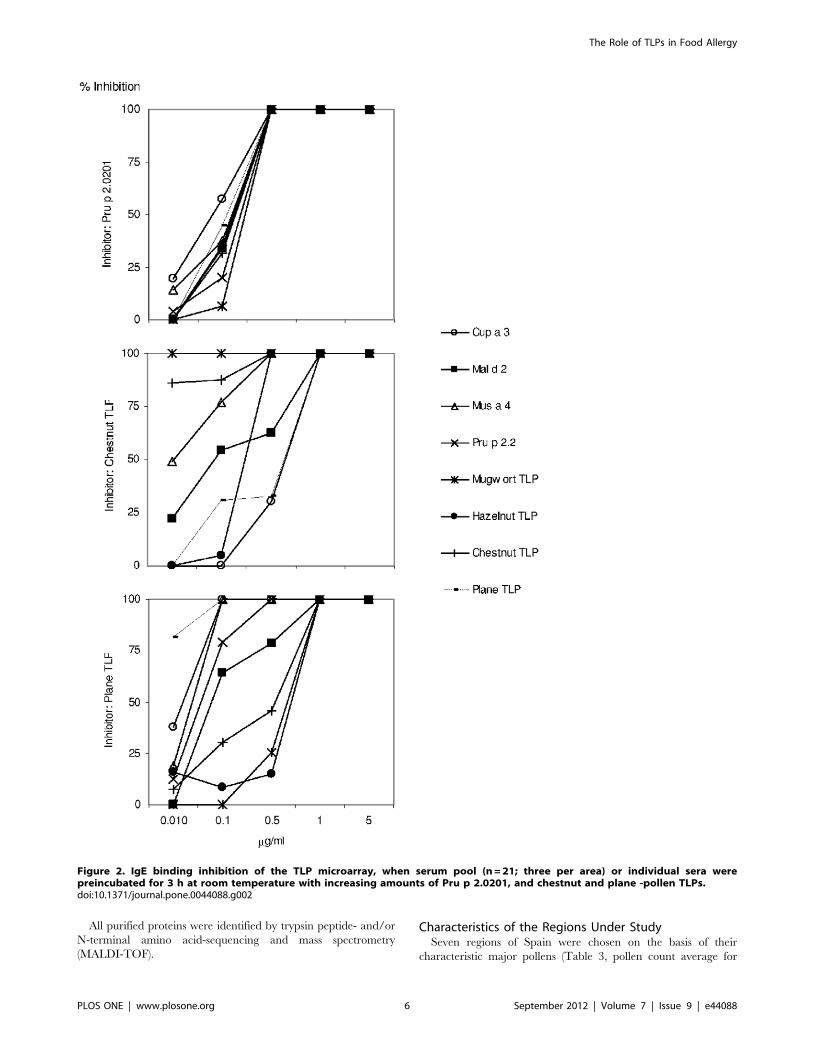
Inhibition assays using the peach TLP, Pru p 2.0201, and
chestnut and plane pollen TLPs as inhibitors confirmed the cross-
reactivity between the members of this family (Figure 2). Pru p
2.0201 seemed to be the starting point for TLP sensitization since
it was able to inhibit IgE binding to the other allergens tested
(Figure 2).
Fruit allergic group was more likely to have a positive response
to Pru p 2.0201(41% vs. 15%), chestnut (24% vs. 15%) and plane
TLP (22% vs. 8%) than did patients from the pollen allergic group,
who were pollinic subjects but plant-food tolerant attending to
microarray results (x2 = 0.002, 0.017 and 0.003, respectively).
Individuals affected by fruit and pollen allergy more frequently
recognized TLPs than did those without respiratory allergy. In the
The Role of TLPs in Food Allergy
PLOS ONE | www.plosone.org 2 September 2012 | Volume 7 | Issue 9 | e44088
case of Pru p 2.0201, 41% of patients allergic to pollen and fruit -
had a positive response in contrast to 33% of individuals in the
same group without pollen allergy. Pru p 2.0201 was the most
prevalent allergen, being recognized by 32% of all the patients
(FAG+PAG) studied. A close association between sensitization to
Pru p 2.0201 and to Pru p 3 was observed (x2 = 0.005).
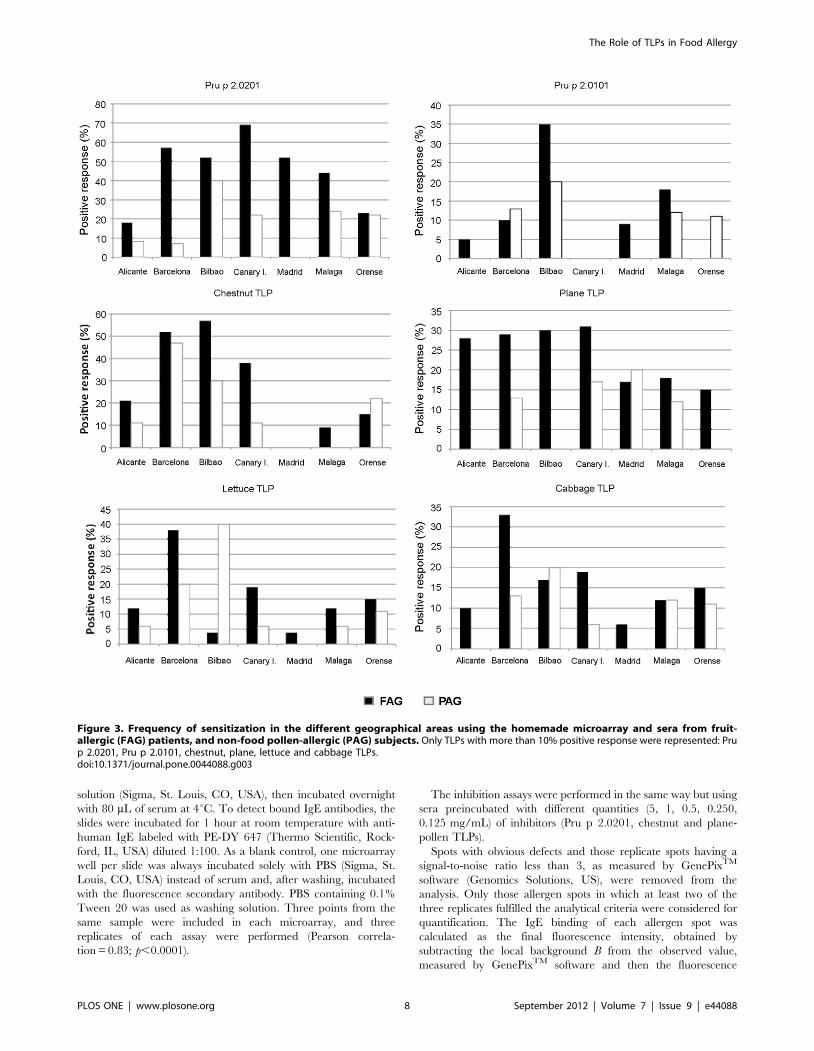
Response Pattern by Geographical AreaTo study the differences in the TLPs recognition in patients with
fruit allergy, we selected patients from 7 geographical areas with
different pollen profiles (Table 3). The analysis of prevalence by
geographical area revealed some specific features about recogni-
tion frequencies in fruit allergy group of patients (Figure 3).
Significant differences were observed in response to Pru p
2.0201 (x2,0.0001), ranging from 18–23% in patients from
Alicante/Ourense respectively, to 70% in those from the Canary
Islands. These results contrasted with the prevalences of Pru p
2.0101, the other peach TLP, which was less than 10% in every
region, except for the FAG patients from Bilbao (35%; x2 = 0.012)
and from Malaga (18%; x2 = 0.120). In fact the frequencies of both
peach TLPs (Pru p 2.0201 and Pru p 2.0101) were especially high
in patients with pollen sensitization but with plant food tolerance
(PAG) from Bilbao. The same pattern was observed for the lettuce
TLP. This allergen was recognized by 40% of PAG subjects from
Bilbao, although almost no recognition was detected in FAG
patients (,5%). This raises the possibility that respiratory allergies
affect the recognition of TLP allergens. However, this suggestion
needs more evidences.
Chestnut TLP and plane TLP were found to be important in
fruit sensitizations. The former proved to be a significant allergen
in fruit-allergic patients from Barcelona and Bilbao, with
recognition frequencies of more than 50%, and from the Canary
Islands, with almost 40% recognition. In Barcelona, 48% of
pollen-allergic patients with plant-food tolerance had a positive
response. In all other study areas, limited recognition was
observed. The case of the plane TLP was quite different. The
most striking recognition level (around 30%) was exhibited by
fruit-allergic patients from Alicante, Barcelona, Bilbao and the
Canary Islands. This allergen was the only pollen TLP that
appeared to be important in fruit allergy.
Graph-based Analysis of the TLP MicroarrayImmunoassay
We made use of the graph theory for two main reasons. Firstly,
it is a simple and useful way of representing TLP-microarray
immunoassay data, and secondly, because we wanted to gain
insight into the co-sensitization patterns of the TLP allergens in the
selected population. The steps for building the co-sensitization
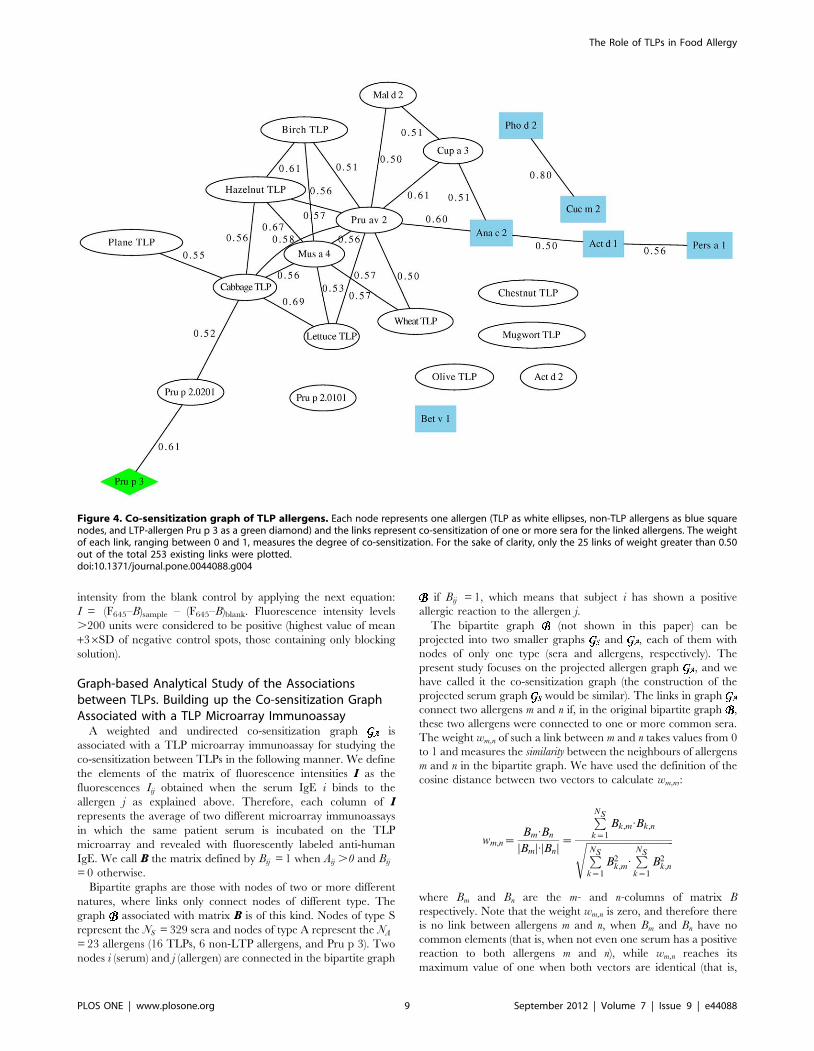
graph associated with our TLP microarray immunoassay (Figure 4)
are explained in detail in the Materials and Methods. In short, two
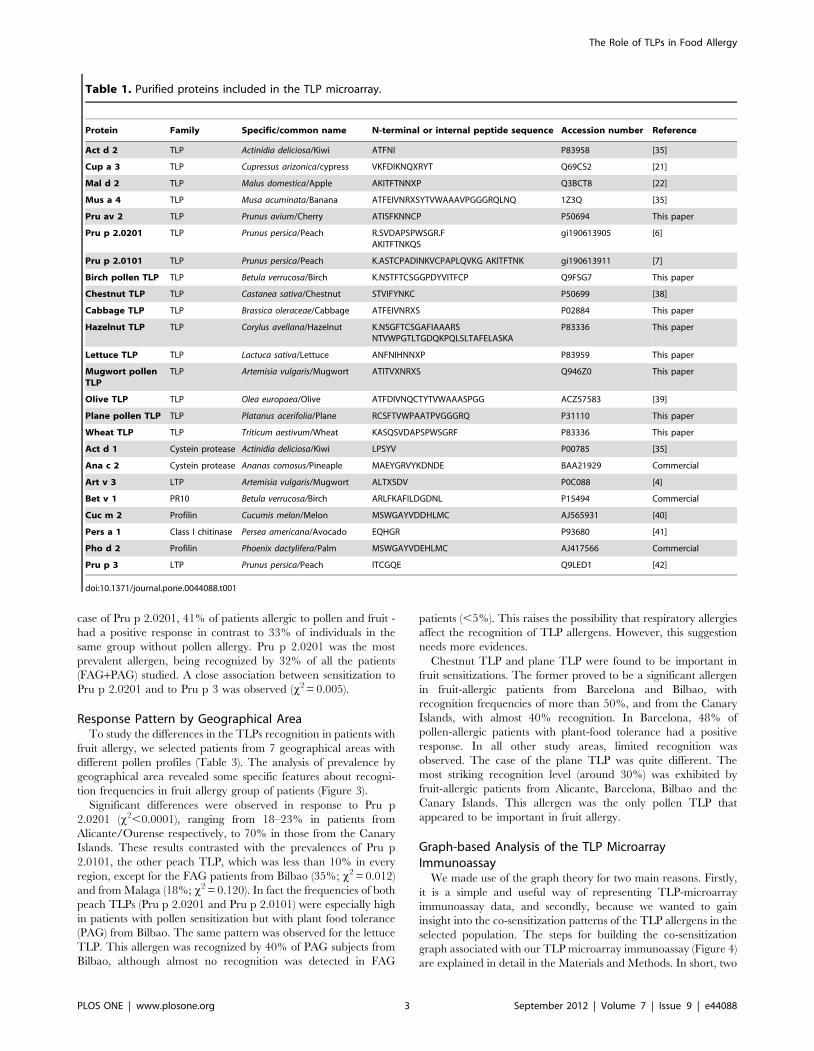
Table 1. Purified proteins included in the TLP microarray.
Protein Family Specific/common name N-terminal or internal peptide sequence Accession number Reference
Act d 2 TLP Actinidia deliciosa/Kiwi ATFNI P83958 [35]
Cup a 3 TLP Cupressus arizonica/cypress VKFDIKNQXRYT Q69CS2 [21]
Mal d 2 TLP Malus domestica/Apple AKITFTNNXP Q3BCT8 [22]
Mus a 4 TLP Musa acuminata/Banana ATFEIVNRXSYTVWAAAVPGGGRQLNQ 1Z3Q [35]
Pru av 2 TLP Prunus avium/Cherry ATISFKNNCP P50694 This paper
Pru p 2.0201 TLP Prunus persica/Peach R.SVDAPSPWSGR.FAKITFTNKQS
gi190613905 [6]
Pru p 2.0101 TLP Prunus persica/Peach K.ASTCPADINKVCPAPLQVKG AKITFTNK gi190613911 [7]
Birch pollen TLP TLP Betula verrucosa/Birch K.NSTFTCSGGPDYVITFCP Q9FSG7 This paper
Chestnut TLP TLP Castanea sativa/Chestnut STVIFYNKC P50699 [38]
Cabbage TLP TLP Brassica oleraceae/Cabbage ATFEIVNRXS P02884 This paper
Hazelnut TLP TLP Corylus avellana/Hazelnut K.NSGFTCSGAFIAAARSNTVWPGTLTGDQKPQLSLTAFELASKA
P83336 This paper
Lettuce TLP TLP Lactuca sativa/Lettuce ANFNIHNNXP P83959 This paper
Mugwort pollenTLP
TLP Artemisia vulgaris/Mugwort ATITVXNRXS Q946Z0 This paper
Olive TLP TLP Olea europaea/Olive ATFDIVNQCTYTVWAAASPGG ACZ57583 [39]
Plane pollen TLP TLP Platanus acerifolia/Plane RCSFTVWPAATPVGGGRQ P31110 This paper
Wheat TLP TLP Triticum aestivum/Wheat KASQSVDAPSPWSGRF P83336 This paper
Act d 1 Cystein protease Actinidia deliciosa/Kiwi LPSYV P00785 [35]
Ana c 2 Cystein protease Ananas comosus/Pineaple MAEYGRVYKDNDE BAA21929 Commercial
Art v 3 LTP Artemisia vulgaris/Mugwort ALTXSDV P0C088 [4]
Bet v 1 PR10 Betula verrucosa/Birch ARLFKAFILDGDNL P15494 Commercial
Cuc m 2 Profilin Cucumis melon/Melon MSWGAYVDDHLMC AJ565931 [40]
Pers a 1 Class I chitinase Persea americana/Avocado EQHGR P93680 [41]
Pho d 2 Profilin Phoenix dactylifera/Palm MSWGAYVDEHLMC AJ417566 Commercial
Pru p 3 LTP Prunus persica/Peach ITCGQE Q9LED1 [42]
doi:10.1371/journal.pone.0044088.t001
The Role of TLPs in Food Allergy
PLOS ONE | www.plosone.org 3 September 2012 | Volume 7 | Issue 9 | e44088
allergens are connected by a link in the graph if at least one serum
gave a positive reaction to both allergens, and the weight of such a
link is a measure of the degree of similarity or correlation between
the sera that reacted positively to each of the allergens -that is,
such weight depends on whether these two sets have common
elements or not-. Therefore, the maximum weight 1 was assigned
when both allergens were recognized by exactly the same group of
reacting sera (irrespective of the size of the group).
The co-sensitization graph showed to be totally connected (i.e.,
all allergens were connected with all other allergens), meaning at
least one serum reacted positively to any pair of allergens, or in
other words, that there were no incompatible pairs of co-
sensitizations. Therefore, there are (23622)/2 = 253 links in the
graph. However in order to clarify the interpretation of the results
only the 25 links with weights greater than 0.50 were plotted in
Figure 4.
The TLP allergens connected with the highest weights were
cabbage-TLP/Lettuce TLP (0.69) and hazelnut-TLP/Mus a 4
(0.67). By contrast, the strongest link connected the non-TLP
allergens Cuc m 2 and Pho d 2 (0.80), both belonging to the family
of, profilins. The lowest co-sensitizations were found between Mal
d 2/Pru p 2.0201 (0.12), wheat-TLP/Pru p 2.0101 (0.14), and
wheat-TLP/Mal d 2 (0.16).
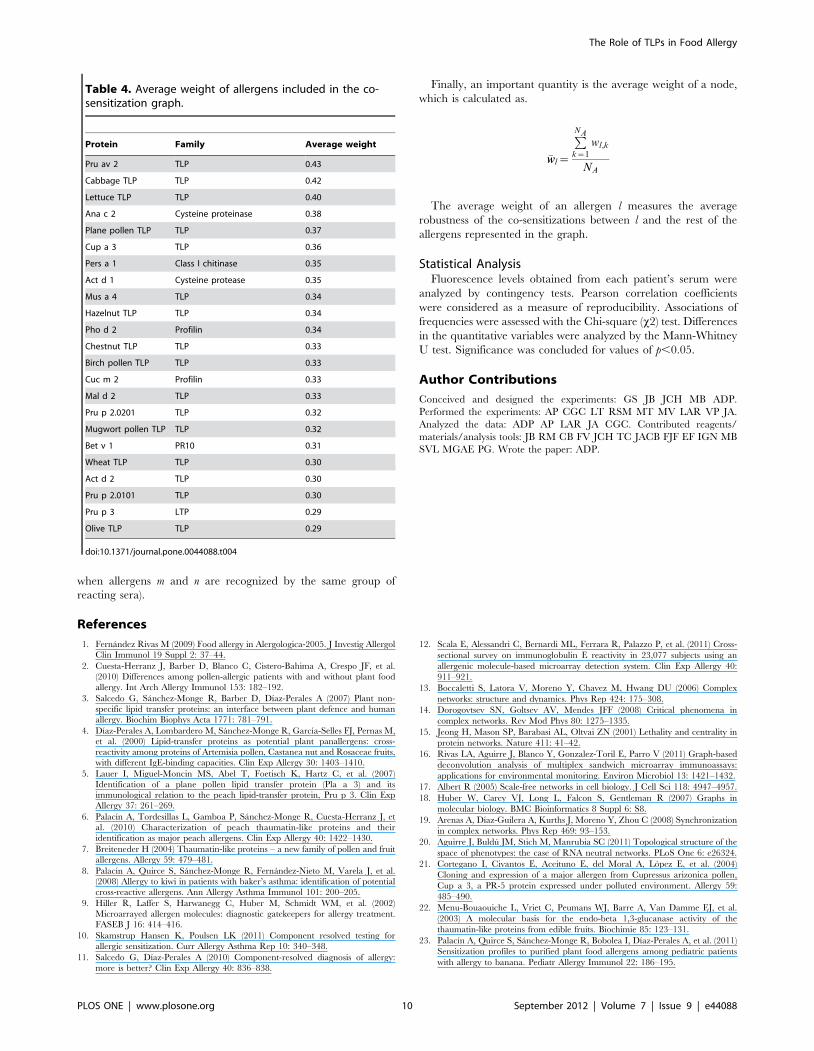
The average weights (Table 4) were a measure of the degree of
co-sensitization that an allergen showed with the rest of the
allergens in the graph. Pru av 2, cabbage TLP and Lettuce TLP
had the highest average weights (all above 0.4), meaning that their
co-sensitizations with the rest of the network are especially
relevant. The case of the non-TLP allergens is remarkable, as
they have relatively large average weights (especially Ana c 2
(CCD marker) with a value of 0.38), even when they were used as
control proteins in the experiments. Finally, we should mention
the case of olive TLP and Pru p 3, the allergens linked with the
lowest average weight (both 0.29).
Discussion
The study of cross-reactivity in allergy using protein-microarray
strategies is a powerful method with advantages over other
immunological approaches [9,11]. A large number of allergens
and sera from many patients can be tested in the same assay, with
the additional advantages of lower costs and the more rapid
processing of samples [12,28,29,33].
In Spain, fruit allergy is clearly associated with LTP sensitiza-
tion, especially to Pru p 3 [2,3], the peach allergen. However,
LTPs are not the only proteins involved in fruit/food sensitization.
Other families of allergens, such as profilins [30,31,32], have been
described as being important in the development of food allergy in
this area.
Members of the TLP family can have a role as allergens in a
wide panel of plant food and several pollens, although there is little
experimental evidence in plant foods and/or pollen cross-
reactivities [6,7]. In this paper, we have tried to establish the role
of this protein family in plant food allergy and in cross-reactivity
between foods and pollens. A large number of patients were
selected from different Spanish regions and a representative panel
of TLPs based on the most frequent sensitizations associated with
peach allergy [2] was printed in a protein microarray.
In order to study the association between the different allergens
in a visual and intuitive manner, we have presented our results in a
co-sensitization graph. In this, the nodes represent the different
allergens, and the weight of the link that connects two allergens
measures whether the sera that reacted positively to one allergen
also gave a positive reaction to the other. Therefore, the weight of
each link gives us a quantitative impression of the co-sensitization
of sera for that pair of allergens.
The analysis of the recognition profile revealed that fruit-allergic
(FAG, independent of their respiratory sensitization) subjects
showed a strong positive response to several TLPs, although this
response tended to be more frequent in patients with pollinosis.
However, people with isolated pollen allergy (PAG) showed no
predominant recognition pattern. They had a low level of positive
responses to TLPs.
Only six of the 16 TLPs studied (the two peach, chestnut,
lettuce, cabbage and plane TLPs) yielded recognition frequencies
greater than 10%. Of particular interest is the significantly small
number of responders we obtained with Mal d 2 and Pru av 2
(5%), which are both important allergens in central and northern
Europe [7,34]. This low response may be related to the allergic
profile of the patients included in this work, who were mainly
sensitized to peach.
The peach TLP, Pru p 2.0201, gave more than 40% positive
responses in fruit-allergic patients, with values of up to 50% in
areas such as Barcelona, Bilbao, the Canary Islands and Madrid.
This protein seems to act as the gateway for sensitizing members of
this family. An unexpected pattern of association between the two
LTP allergens (Pru p 3 and Art v 3) and the TLP Pru p 2.0201 was
observed. The recognition of Pru p 3 and Pru p 2.0201 was closely
associated (x2 = 0.005), and the weight of its co-sensitization link
was 0.61.
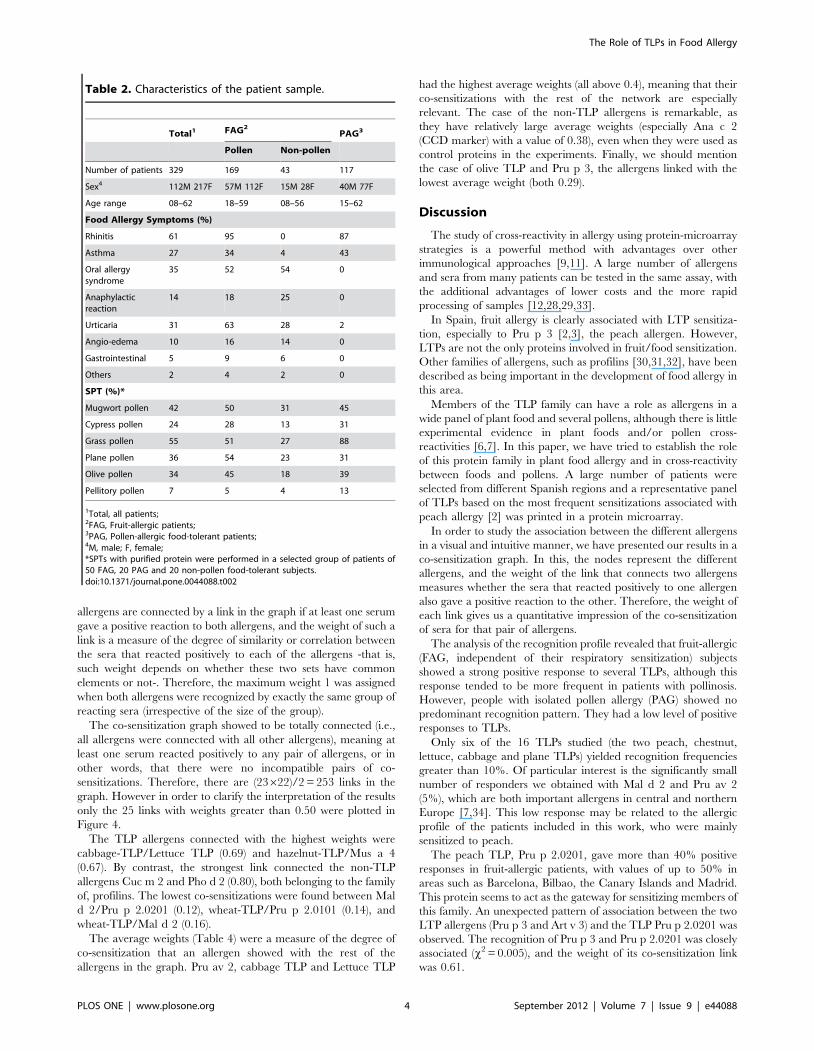
Table 2. Characteristics of the patient sample.
Total1 FAG2PAG3
Pollen Non-pollen
Number of patients 329 169 43 117
Sex4 112M 217F 57M 112F 15M 28F 40M 77F
Age range 08–62 18–59 08–56 15–62
Food Allergy Symptoms (%)
Rhinitis 61 95 0 87
Asthma 27 34 4 43
Oral allergysyndrome
35 52 54 0
Anaphylacticreaction
14 18 25 0
Urticaria 31 63 28 2
Angio-edema 10 16 14 0
Gastrointestinal 5 9 6 0
Others 2 4 2 0
SPT (%)*
Mugwort pollen 42 50 31 45
Cypress pollen 24 28 13 31
Grass pollen 55 51 27 88
Plane pollen 36 54 23 31
Olive pollen 34 45 18 39
Pellitory pollen 7 5 4 13
1Total, all patients;2FAG, Fruit-allergic patients;3PAG, Pollen-allergic food-tolerant patients;4M, male; F, female;*SPTs with purified protein were performed in a selected group of patients of50 FAG, 20 PAG and 20 non-pollen food-tolerant subjects.doi:10.1371/journal.pone.0044088.t002
The Role of TLPs in Food Allergy
PLOS ONE | www.plosone.org 4 September 2012 | Volume 7 | Issue 9 | e44088
While most of the patients sensitized to this peach TLP (Pru p
2.0201) showed a positive response to Pru p 3, the opposite was
observed for Pru p 3 to the other peach TLP, Pru p 2.0101, whose
weight was very low (0.35). This allergen had a low frequency of
positive responses (,15%), with the exception of FAG patients
from Bilbao (35%). Both peach TLPs are linked with a low co-
sensitization weight (0.40), although both of them share more than
94% of amino acid identity, with only eight different residues
[7,30]. Thus, a different mode of sensitization may operate, which
would be interesting to study in more detail.
The chestnut TLP yielded a higher positive response in patients
from Barcelona and Bilbao, mainly in the FAG group, but also in
the PAG group from Barcelona. The plane TLP was the only
pollen included in this study that was associated with fruit allergy,
especially in areas such as Alicante, Barcelona, Bilbao and
Madrid. The other pollen TLPs, like mugwort and birch, had
low responses in our population, although patients sensitized to
these were included.
As mentioned above, TLPs were related to fruit allergy
predominantly with pollen, but they also had sensitization profiles
associated with the study geographical areas. Patients from
Barcelona, Bilbao and the Canary Islands showed a higher
positive response to these allergens than subjects from the other
areas. Alicante and Ourense were situated at the other end of the
peninsula. Patients from these areas had the lowest frequency of
TLP recognition (around 20%, with the exception of plane TLP in
Alicante). The patterns of TLP recognition, related to the different
geographical areas, suggest a possible influence of local pollen in
TLP sensitization.
Studies with large protein and serum panels are needed to
clarify the role of cross-reactive allergens, and provide immuno-
logical evidence to clinical observations. In this way we can begin
to detail the actors involved. In this work, we have shown that few
members of the thaumatin family have an important role in fruit/
pollen allergy in the studied areas, even if they can act as modifiers
of sensitization profiles.
Materials and Methods
Selection and Purification of AllergensConsidering the allergies most frequently associated with peach
sensitization in Spain, 16 TLPs were purified from foods and
pollen relevant to the population under study, based on previously
published methods [6,8,23,35] (Table 1).
Other allergens were included in the microarray: Pru p 3 (LTP,
peach allergen), Art v 3 (LTP, mugwort allergen), Act d 1 (cysteine
protease, kiwi allergen), Ana c 2 (pineapple allergen and marker of
carbohydrate cross-reactive determinants (CCD)), Bet v 1 (PR10
from birch pollen), Cuc m 2 (melon fruit profilin), Pers a 1
(avocado latex-fruit allergen) and Pho d 2 (palm-pollen profilin).
Figure 1. Frequency of sensitization obtained by the TLP microarray using sera from both fruit-allergic (FAG) patients, and non-food pollen allergic (PAG) subjects. Odds ratios are presented in parentheses (95% CI; p,0.001).doi:10.1371/journal.pone.0044088.g001
The Role of TLPs in Food Allergy
PLOS ONE | www.plosone.org 5 September 2012 | Volume 7 | Issue 9 | e44088
All purified proteins were identified by trypsin peptide- and/or
N-terminal amino acid-sequencing and mass spectrometry
(MALDI-TOF).
Characteristics of the Regions Under StudySeven regions of Spain were chosen on the basis of their
characteristic major pollens (Table 3, pollen count average for
Figure 2. IgE binding inhibition of the TLP microarray, when serum pool (n = 21; three per area) or individual sera werepreincubated for 3 h at room temperature with increasing amounts of Pru p 2.0201, and chestnut and plane -pollen TLPs.doi:10.1371/journal.pone.0044088.g002
The Role of TLPs in Food Allergy
PLOS ONE | www.plosone.org 6 September 2012 | Volume 7 | Issue 9 | e44088
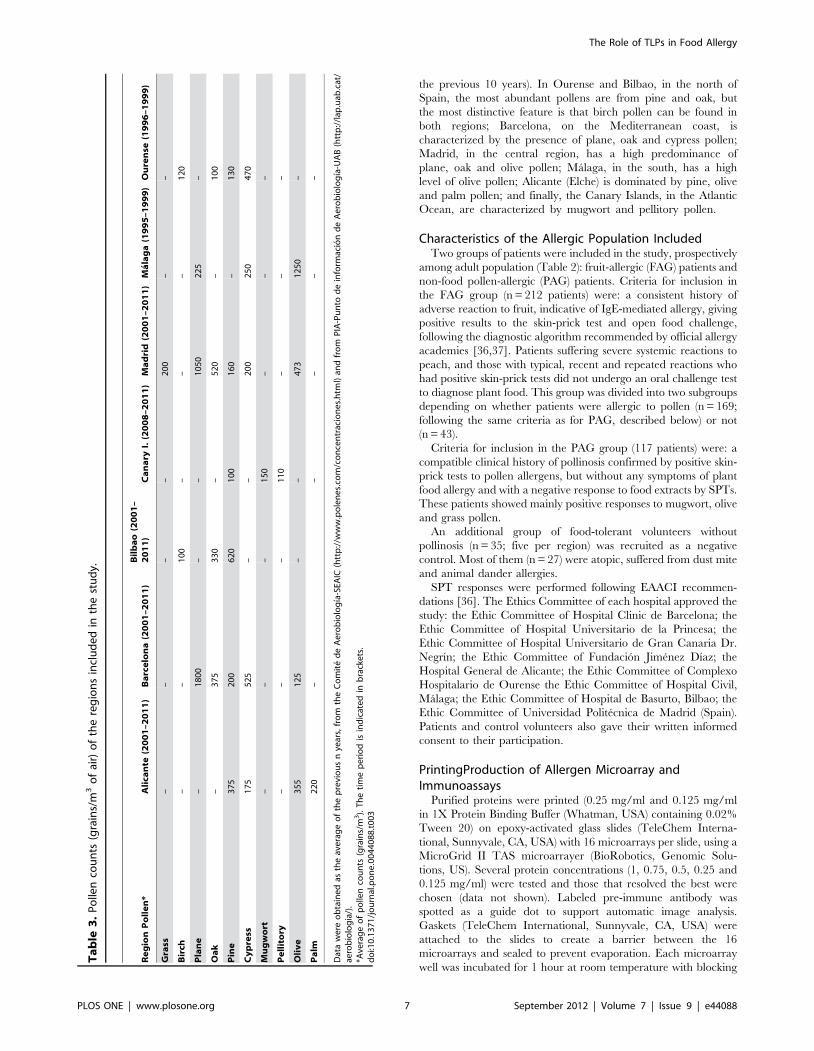
the previous 10 years). In Ourense and Bilbao, in the north of
Spain, the most abundant pollens are from pine and oak, but
the most distinctive feature is that birch pollen can be found in
both regions; Barcelona, on the Mediterranean coast, is
characterized by the presence of plane, oak and cypress pollen;
Madrid, in the central region, has a high predominance of
plane, oak and olive pollen; Malaga, in the south, has a high
level of olive pollen; Alicante (Elche) is dominated by pine, olive
and palm pollen; and finally, the Canary Islands, in the Atlantic
Ocean, are characterized by mugwort and pellitory pollen.
Characteristics of the Allergic Population IncludedTwo groups of patients were included in the study, prospectively
among adult population (Table 2): fruit-allergic (FAG) patients and
non-food pollen-allergic (PAG) patients. Criteria for inclusion in
the FAG group (n = 212 patients) were: a consistent history of
adverse reaction to fruit, indicative of IgE-mediated allergy, giving
positive results to the skin-prick test and open food challenge,
following the diagnostic algorithm recommended by official allergy
academies [36,37]. Patients suffering severe systemic reactions to
peach, and those with typical, recent and repeated reactions who
had positive skin-prick tests did not undergo an oral challenge test
to diagnose plant food. This group was divided into two subgroups
depending on whether patients were allergic to pollen (n = 169;
following the same criteria as for PAG, described below) or not
(n = 43).
Criteria for inclusion in the PAG group (117 patients) were: a
compatible clinical history of pollinosis confirmed by positive skin-
prick tests to pollen allergens, but without any symptoms of plant
food allergy and with a negative response to food extracts by SPTs.
These patients showed mainly positive responses to mugwort, olive
and grass pollen.
An additional group of food-tolerant volunteers without
pollinosis (n = 35; five per region) was recruited as a negative
control. Most of them (n = 27) were atopic, suffered from dust mite
and animal dander allergies.
SPT responses were performed following EAACI recommen-
dations [36]. The Ethics Committee of each hospital approved the
study: the Ethic Committee of Hospital Clinic de Barcelona; the
Ethic Committee of Hospital Universitario de la Princesa; the
Ethic Committee of Hospital Universitario de Gran Canaria Dr.
Negrın; the Ethic Committee of Fundacion Jimenez Dıaz; the
Hospital General de Alicante; the Ethic Committee of Complexo
Hospitalario de Ourense the Ethic Committee of Hospital Civil,
Malaga; the Ethic Committee of Hospital de Basurto, Bilbao; the
Ethic Committee of Universidad Politecnica de Madrid (Spain).
Patients and control volunteers also gave their written informed
consent to their participation.
PrintingProduction of Allergen Microarray andImmunoassays
Purified proteins were printed (0.25 mg/ml and 0.125 mg/ml
in 1X Protein Binding Buffer (Whatman, USA) containing 0.02%
Tween 20) on epoxy-activated glass slides (TeleChem Interna-
tional, Sunnyvale, CA, USA) with 16 microarrays per slide, using a
MicroGrid II TAS microarrayer (BioRobotics, Genomic Solu-
tions, US). Several protein concentrations (1, 0.75, 0.5, 0.25 and
0.125 mg/ml) were tested and those that resolved the best were
chosen (data not shown). Labeled pre-immune antibody was
spotted as a guide dot to support automatic image analysis.
Gaskets (TeleChem International, Sunnyvale, CA, USA) were
attached to the slides to create a barrier between the 16
microarrays and sealed to prevent evaporation. Each microarray
well was incubated for 1 hour at room temperature with blocking
Ta
ble
3.
Po
llen
cou
nts
(gra
ins/
m3
of
air)
of
the
reg
ion
sin
clu
de
din
the
stu
dy.
Re
gio
nP
oll
en
*A
lica
nte
(20
01
–2
01
1)
Ba
rce
lon
a(2
00
1–
20
11
)B
ilb
ao
(20
01
–2
01
1)
Ca
na
ryI.
(20
08
–2
01
1)
Ma
dri
d(2
00
1–
20
11
)M
ala
ga
(19
95
–1
99
9)
Ou
ren
se(1
99
6–
19
99
)
Gra
ss–
––
–2
00
––
Bir
ch–
–1
00
––
–1
20
Pla
ne
–1
80
0–
–1
05
02
25
–
Oa
k–
37
53
30
–5
20
–1
00
Pin
e3
75
20
06
20
10
01
60
–1
30
Cy
pre
ss1
75
52
5–
–2
00
25
04
70
Mu
gw
ort
––
–1
50
––
–
Pe
llit
ory
––
–1
10
––
–
Oli
ve
35
51
25
––
47
31
25
0–
Pa
lm2
20
––
––
–
Dat
aw
ere
ob
tain
ed
asth
eav
era
ge
of
the
pre
vio
us
nye
ars,
fro
mth
eC
om
ite
de
Ae
rob
iolo
gıa
-SEA
IC(h
ttp
://w
ww
.po
len
es.
com
/co
nce
ntr
acio
ne
s.h
tml)
and
fro
mP
IA-P
un
tod
ein
form
acio
nd
eA
ero
bio
log
ıa-U
AB
(htt
p:/
/lap
.uab
.cat
/ae
rob
iolo
gia
/).
*Ave
rag
eo
fp
olle
nco
un
ts(g
rain
s/m
3).
Th
eti
me
pe
rio
dis
ind
icat
ed
inb
rack
ets
.d
oi:1
0.1
37
1/j
ou
rnal
.po
ne
.00
44
08
8.t
00
3
The Role of TLPs in Food Allergy
PLOS ONE | www.plosone.org 7 September 2012 | Volume 7 | Issue 9 | e44088
solution (Sigma, St. Louis, CO, USA), then incubated overnight
with 80 mL of serum at 4uC. To detect bound IgE antibodies, the
slides were incubated for 1 hour at room temperature with anti-
human IgE labeled with PE-DY 647 (Thermo Scientific, Rock-
ford, IL, USA) diluted 1:100. As a blank control, one microarray
well per slide was always incubated solely with PBS (Sigma, St.
Louis, CO, USA) instead of serum and, after washing, incubated
with the fluorescence secondary antibody. PBS containing 0.1%
Tween 20 was used as washing solution. Three points from the
same sample were included in each microarray, and three
replicates of each assay were performed (Pearson correla-
tion = 0.83; p,0.0001).
The inhibition assays were performed in the same way but using
sera preincubated with different quantities (5, 1, 0.5, 0.250,
0.125 mg/mL) of inhibitors (Pru p 2.0201, chestnut and plane-
pollen TLPs).
Spots with obvious defects and those replicate spots having a
signal-to-noise ratio less than 3, as measured by GenePixTM
software (Genomics Solutions, US), were removed from the
analysis. Only those allergen spots in which at least two of the
three replicates fulfilled the analytical criteria were considered for
quantification. The IgE binding of each allergen spot was
calculated as the final fluorescence intensity, obtained by
subtracting the local background B from the observed value,
measured by GenePixTM software and then the fluorescence
Figure 3. Frequency of sensitization in the different geographical areas using the homemade microarray and sera from fruit-allergic (FAG) patients, and non-food pollen-allergic (PAG) subjects. Only TLPs with more than 10% positive response were represented: Prup 2.0201, Pru p 2.0101, chestnut, plane, lettuce and cabbage TLPs.doi:10.1371/journal.pone.0044088.g003
The Role of TLPs in Food Allergy
PLOS ONE | www.plosone.org 8 September 2012 | Volume 7 | Issue 9 | e44088
intensity from the blank control by applying the next equation:
I = (F645–B)sample – (F645–B)blank. Fluorescence intensity levels
.200 units were considered to be positive (highest value of mean
+36SD of negative control spots, those containing only blocking
solution).
Graph-based Analytical Study of the Associationsbetween TLPs. Building up the Co-sensitization GraphAssociated with a TLP Microarray Immunoassay
A weighted and undirected co-sensitization graph is
associated with a TLP microarray immunoassay for studying the
co-sensitization between TLPs in the following manner. We define
the elements of the matrix of fluorescence intensities I as the
fluorescences Iij obtained when the serum IgE i binds to the
allergen j as explained above. Therefore, each column of Irepresents the average of two different microarray immunoassays
in which the same patient serum is incubated on the TLP
microarray and revealed with fluorescently labeled anti-human
IgE. We call B the matrix defined by Bij = 1 when Aij .0 and Bij
= 0 otherwise.
Bipartite graphs are those with nodes of two or more different
natures, where links only connect nodes of different type. The
graph associated with matrix B is of this kind. Nodes of type S
represent the NS = 329 sera and nodes of type A represent the NA
= 23 allergens (16 TLPs, 6 non-LTP allergens, and Pru p 3). Two
nodes i (serum) and j (allergen) are connected in the bipartite graph
if Bij = 1, which means that subject i has shown a positive
allergic reaction to the allergen j.
The bipartite graph (not shown in this paper) can be
projected into two smaller graphs and , each of them with
nodes of only one type (sera and allergens, respectively). The
present study focuses on the projected allergen graph , and we
have called it the co-sensitization graph (the construction of the
projected serum graph would be similar). The links in graph
connect two allergens m and n if, in the original bipartite graph ,
these two allergens were connected to one or more common sera.
The weight wm,n of such a link between m and n takes values from 0
to 1 and measures the similarity between the neighbours of allergens
m and n in the bipartite graph. We have used the definition of the
cosine distance between two vectors to calculate wm,n,:
wm,n~Bm:Bn
DBmD:DBnD~
PNS
k~1
Bk,m:Bk,nffiffiffiffiffiffiffiffiffiffiffiffiffiffiffiffiffiffiffiffiffiffiffiffiffiffiffiffiffiffiffiffiffiffiffiPNS
k~1
B2k,m: PNS
k~1
B2k,n
s
where Bm and Bn are the m- and n-columns of matrix B
respectively. Note that the weight wm,n is zero, and therefore there
is no link between allergens m and n, when Bm and Bn have no
common elements (that is, when not even one serum has a positive
reaction to both allergens m and n), while wm,n reaches its
maximum value of one when both vectors are identical (that is,
Figure 4. Co-sensitization graph of TLP allergens. Each node represents one allergen (TLP as white ellipses, non-TLP allergens as blue squarenodes, and LTP-allergen Pru p 3 as a green diamond) and the links represent co-sensitization of one or more sera for the linked allergens. The weightof each link, ranging between 0 and 1, measures the degree of co-sensitization. For the sake of clarity, only the 25 links of weight greater than 0.50out of the total 253 existing links were plotted.doi:10.1371/journal.pone.0044088.g004
The Role of TLPs in Food Allergy
PLOS ONE | www.plosone.org 9 September 2012 | Volume 7 | Issue 9 | e44088
when allergens m and n are recognized by the same group of
reacting sera).
Finally, an important quantity is the average weight of a node,
which is calculated as.
�wwl~
PNA
k~1
wl,k
NA
The average weight of an allergen l measures the average
robustness of the co-sensitizations between l and the rest of the
allergens represented in the graph.
Statistical AnalysisFluorescence levels obtained from each patient’s serum were
analyzed by contingency tests. Pearson correlation coefficients
were considered as a measure of reproducibility. Associations of
frequencies were assessed with the Chi-square (x2) test. Differences
in the quantitative variables were analyzed by the Mann-Whitney
U test. Significance was concluded for values of p,0.05.
Author Contributions
Conceived and designed the experiments: GS JB JCH MB ADP.
Performed the experiments: AP CGC LT RSM MT MV LAR VP JA.
Analyzed the data: ADP AP LAR JA CGC. Contributed reagents/
materials/analysis tools: JB RM CB FV JCH TC JACB FJF EF IGN MB
SVL MGAE PG. Wrote the paper: ADP.
References
1. Fernandez Rivas M (2009) Food allergy in Alergologica-2005. J Investig Allergol
Clin Immunol 19 Suppl 2: 37–44.
2. Cuesta-Herranz J, Barber D, Blanco C, Cistero-Bahima A, Crespo JF, et al.
(2010) Differences among pollen-allergic patients with and without plant food
allergy. Int Arch Allergy Immunol 153: 182–192.
3. Salcedo G, Sanchez-Monge R, Barber D, Dıaz-Perales A (2007) Plant non-
specific lipid transfer proteins: an interface between plant defence and human
allergy. Biochim Biophys Acta 1771: 781–791.
4. Dıaz-Perales A, Lombardero M, Sanchez-Monge R, Garcıa-Selles FJ, Pernas M,et al. (2000) Lipid-transfer proteins as potential plant panallergens: cross-
reactivity among proteins of Artemisia pollen, Castanea nut and Rosaceae fruits,
with different IgE-binding capacities. Clin Exp Allergy 30: 1403–1410.
5. Lauer I, Miguel-Moncin MS, Abel T, Foetisch K, Hartz C, et al. (2007)
Identification of a plane pollen lipid transfer protein (Pla a 3) and itsimmunological relation to the peach lipid-transfer protein, Pru p 3. Clin Exp
Allergy 37: 261–269.
6. Palacın A, Tordesillas L, Gamboa P, Sanchez-Monge R, Cuesta-Herranz J, et
al. (2010) Characterization of peach thaumatin-like proteins and their
identification as major peach allergens. Clin Exp Allergy 40: 1422–1430.
7. Breiteneder H (2004) Thaumatin-like proteins – a new family of pollen and fruit
allergens. Allergy 59: 479–481.
8. Palacın A, Quirce S, Sanchez-Monge R, Fernandez-Nieto M, Varela J, et al.(2008) Allergy to kiwi in patients with baker’s asthma: identification of potential
cross-reactive allergens. Ann Allergy Asthma Immunol 101: 200–205.
9. Hiller R, Laffer S, Harwanegg C, Huber M, Schmidt WM, et al. (2002)
Microarrayed allergen molecules: diagnostic gatekeepers for allergy treatment.
FASEB J 16: 414–416.
10. Skamstrup Hansen K, Poulsen LK (2011) Component resolved testing for
allergic sensitization. Curr Allergy Asthma Rep 10: 340–348.
11. Salcedo G, Dıaz-Perales A (2010) Component-resolved diagnosis of allergy:
more is better? Clin Exp Allergy 40: 836–838.
12. Scala E, Alessandri C, Bernardi ML, Ferrara R, Palazzo P, et al. (2011) Cross-
sectional survey on immunoglobulin E reactivity in 23,077 subjects using an
allergenic molecule-based microarray detection system. Clin Exp Allergy 40:
911–921.
13. Boccaletti S, Latora V, Moreno Y, Chavez M, Hwang DU (2006) Complex
networks: structure and dynamics. Phys Rep 424: 175–308.
14. Dorogovtsev SN, Goltsev AV, Mendes JFF (2008) Critical phenomena in
complex networks. Rev Mod Phys 80: 1275–1335.
15. Jeong H, Mason SP, Barabasi AL, Oltvai ZN (2001) Lethality and centrality in
protein networks. Nature 411: 41–42.
16. Rivas LA, Aguirre J, Blanco Y, Gonzalez-Toril E, Parro V (2011) Graph-based
deconvolution analysis of multiplex sandwich microarray immunoassays:
applications for environmental monitoring. Environ Microbiol 13: 1421–1432.
17. Albert R (2005) Scale-free networks in cell biology. J Cell Sci 118: 4947–4957.
18. Huber W, Carey VJ, Long L, Falcon S, Gentleman R (2007) Graphs in
molecular biology. BMC Bioinformatics 8 Suppl 6: S8.
19. Arenas A, Dıaz-Guilera A, Kurths J, Moreno Y, Zhou C (2008) Synchronization
in complex networks. Phys Rep 469: 93–153.
20. Aguirre J, Buldu JM, Stich M, Manrubia SC (2011) Topological structure of the
space of phenotypes: the case of RNA neutral networks. PLoS One 6: e26324.
21. Cortegano I, Civantos E, Aceituno E, del Moral A, Lopez E, et al. (2004)
Cloning and expression of a major allergen from Cupressus arizonica pollen,
Cup a 3, a PR-5 protein expressed under polluted environment. Allergy 59:
485–490.
22. Menu-Bouaouiche L, Vriet C, Peumans WJ, Barre A, Van Damme EJ, et al.
(2003) A molecular basis for the endo-beta 1,3-glucanase activity of the
thaumatin-like proteins from edible fruits. Biochimie 85: 123–131.
23. Palacın A, Quirce S, Sanchez-Monge R, Bobolea I, Dıaz-Perales A, et al. (2011)
Sensitization profiles to purified plant food allergens among pediatric patients
with allergy to banana. Pediatr Allergy Immunol 22: 186–195.
Table 4. Average weight of allergens included in the co-sensitization graph.
Protein Family Average weight
Pru av 2 TLP 0.43
Cabbage TLP TLP 0.42
Lettuce TLP TLP 0.40
Ana c 2 Cysteine proteinase 0.38
Plane pollen TLP TLP 0.37
Cup a 3 TLP 0.36
Pers a 1 Class I chitinase 0.35
Act d 1 Cysteine protease 0.35
Mus a 4 TLP 0.34
Hazelnut TLP TLP 0.34
Pho d 2 Profilin 0.34
Chestnut TLP TLP 0.33
Birch pollen TLP TLP 0.33
Cuc m 2 Profilin 0.33
Mal d 2 TLP 0.33
Pru p 2.0201 TLP 0.32
Mugwort pollen TLP TLP 0.32
Bet v 1 PR10 0.31
Wheat TLP TLP 0.30
Act d 2 TLP 0.30
Pru p 2.0101 TLP 0.30
Pru p 3 LTP 0.29
Olive TLP TLP 0.29
doi:10.1371/journal.pone.0044088.t004
The Role of TLPs in Food Allergy
PLOS ONE | www.plosone.org 10 September 2012 | Volume 7 | Issue 9 | e44088
24. Fuchs HC, Bohle B, Dall’Antonia Y, Radauer C, Hoffmann-Sommergruber K,
et al. (2006) Natural and recombinant molecules of the cherry allergen Pru av 2show diverse structural and B cell characteristics but similar T cell reactivity.
Clin Exp Allergy 36: 359–368.
25. Lehto M, Airaksinen L, Puustinen A, Tillander S, Hannula S, et al. (2010)Thaumatin-like protein and baker’s respiratory allergy. Ann Allergy Asthma
Immunol 104: 139–146.26. Palomares O, Alcantara M, Quiralte J, Villalba M, Garzon F, et al. (2008)
Airway disease and thaumatin-like protein in an olive-oil mill worker.
N Engl J Med 358: 1306–1308.27. Rivas LA, Garcıa-Villadangos M, Moreno-Paz M, Cruz-Gil P, Gomez-Elvira J,
et al. (2008) A 200-antibody microarray biochip for environmental monitoring:searching for universal microbial biomarkers through immunoprofiling. Anal
Chem 80: 7970–7979.28. Sanz ML, Blazquez AB, Garcıa BE (2011) Microarray of allergenic component-
based diagnosis in food allergy. Curr Opin Allergy Clin Immunol 11: 204–209.
29. Shreffler WG (2011) Microarrayed recombinant allergens for diagnostic testing.J Allergy Clin Immunol 127: 843–849; quiz 850–841.
30. Gadermaier G, Hauser M, Egger M, Ferrara R, Briza P, et al. (2011)Sensitization prevalence, antibody cross-reactivity and immunogenic peptide
profile of api g 2, the non-specific lipid transfer protein 1 of celery. PLoS One 6:
e24150.31. Hauser M, Roulias A, Ferreira F, Egger M (2010) Panallergens and their impact
on the allergic patient. Allergy Asthma Clin Immunol 6: 1.32. Asero R, Monsalve R, Barber D (2008) Profilin sensitization detected in the
office by skin prick test: a study of prevalence and clinical relevance of profilin asa plant food allergen. Clin Exp Allergy 38: 1033–1037.
33. Beyer K, Teuber SS (2005) Food allergy diagnostics: scientific and unproven
procedures. Curr Opin Allergy Clin Immunol 5: 261–266.
34. Fernandez-Rivas M, Bolhaar S, Gonzalez-Mancebo E, Asero R, van Leeuwen
A, et al. (2006) Apple allergy across Europe: how allergen sensitization profilesdetermine the clinical expression of allergies to plant foods. J Allergy Clin
Immunol 118: 481–488.
35. Palacin A, Rodriguez J, Blanco C, Lopez-Torrejon G, Sanchez-Monge R, etal.(2008) Immunoglobulin E recognition patterns to purified Kiwifruit
(Actinidinia deliciosa) allergens in patients sensitized to Kiwi with differentclinical symptoms. Clin Exp Allergy. 2008 Jul;38(7): 1220–8.
36. EAACI Sub-, Immunology CoSTotEAoAaC (1989) Skin tests used in type I
allergy testing Position paper. Allergy 44: 1–59.37. Committee AFR (1999) Food Adverse Reaction Committee of Sociedad
Espanola de Alergia e Inmunologıa SEAIC 14: 50–62.38. Garcıa-Casado G, Collada C, Allona I, Soto A, Casado R, et al. (2000)
Characterization of an apoplastic basic thaumatin-like protein from recalcitrantchestnut seeds. Physiologia Plantarum 110: 172–180.
39. Tordesillas L, Sirvent S, Dıaz-Perales A, Villalba M, Cuesta-Herranz J, et al.
(2011) Plant lipid transfer protein allergens: no cross-reactivity between thosefrom foods and olive and parietaria pollen. Int Arch Allergy Immunol 156: 291–
296.40. Lopez-Torrejon G, Crespo JF, Sanchez-Monge R, Sanchez-Jimenez M, Alvarez
J, et al. (2005) Allergenic reactivity of the melon profilin Cuc m 2 and its
identification as major allergen. Clin Exp Allergy 35: 1065–1072.41. Dıaz-Perales A, Blanco C, Sanchez-Monge R, Varela J, Carrillo T, et al. (2003)
Analysis of avocado allergen (Prs a 1) IgE-binding peptides generated bysimulated gastric fluid digestion. J Allergy Clin Immunol 112: 1002–1007.
42. Dıaz-Perales A, Sanz ML, Garcıa-Casado G, Sanchez-Monge R, Garcıa-SellesFJ, et al. (2003) Recombinant Pru p 3 and natural Pru p 3, a major peach
allergen, show equivalent immunologic reactivity: a new tool for the diagnosis of
fruit allergy. J Allergy Clin Immunol 111: 628–633.
The Role of TLPs in Food Allergy
PLOS ONE | www.plosone.org 11 September 2012 | Volume 7 | Issue 9 | e44088


