Embed Size (px)
Citation preview
The International Journal of Economic Policy Studies
Volume 5 2010 Article 4
Dividend Policy in Crisis. Case of Japan 1991-2008.
Paweł Młodkowski
Collegium Mazovia – Innovative University
161 Sokołowska Street, 08-110 Siedlce, Poland
E-mail: [email protected]
ABSTRACT
Japan is a unique case for analyzing economic processes and business behavior under crisis.
After the bubble economy that ended in 1989/1990, Japan experienced unprecedented long-
lasting economic slowdown associated with highly ineffective monetary and fiscal policies that
were aimed at stimulating economic activity. Short recovery periods after 1991 did not change
the general downward trend and the global financial crisis that affected Japan in 2008 led to
further deterioration. Questions posed in this paper are related to a general dividend policy
conducted by companies listed at the Tokyo Stock Exchange (TSE) and its macroeconomic
influence under specific socio-demographic circumstances. Formal testing in regression models
covers responses to standard variables that are perceived in theory as crucial for shaping
earnings distribution. The results for crisis (1991-2008) were benchmarked against estimates for
the preceding period 1980-1990. Time series provided by the TSE and by the Cabinet Office are
used to check the actual responses of dividend policy to growth rate of real GDP and several
variables which describe the financial and economic circumstances of Japanese companies. The
findings were cast against information about the structure of investor holding stocks in Japan
and argue that the clienteles hypothesis may hold. In this particular case of the economy in crisis
and with an aging society, demographic considerations may be playing a significant role in
increasing the demand for liquid resources at pension funds.
Key words: dividend policy, crisis, Japan, domestic savings and investment.
JEL Classification: E3, G3, J1
Vol.5 2010
50
Dividend Policy in Crisis. Case of Japan 1991-2008.
1. Introduction
Japan is a very special case in terms of its society and national economy. Dynamic
growth and development over the post-war period ceased in 1990. Since then, a
prolonged stagnation has prevailed. The nature of the contemporaneous economic
situation in Japan became a hot topic and the subject of many theoretical and empirical
studies. The reason for this popularity in the literature result from the fact that the nature
of the stagnation and recession in Japan after 1990 does not match the known patterns
of business cycle phases recognized thus far. It is still not clear what the root cause is
for the observed long-lasting stagnation of an economy that doubled its GDP over just
one decade (from 1980 to 1990) and became one of the wealthiest countries in the world.
The design of this study of dividend policy in Japan is based on a hypothesis that strategies
of earnings distribution may have their part in aggravating the already severe economic situation
of Japanese companies. This paper is an attempt to combine several factors that were until now
considered separately in explaining the reasons for the prolonged stagnation. The first step is to
recognize the nature of the dividend policy in Japan and its potential adjustments after 1990.
Expectations associated with the dividend policy should theoretically be different in distinctive
business cycle phases as it is difficult to expect that the corporate income dynamics of prior
years would be maintained. As a consequence, dividend policy should be redesigned to reflect
lower profits, lower sales and changes of other variables that are distorted in crisis. The second
step is to recognize potential reasons for the observed dividend policy response during crisis and
stagnation. After which, an answer to the question regarding the relationship between private
investment in Japan and dividend policy developments is offered. In the first phase of the study,
estimates of regression models for dividend policy are used. Then, an analogous methodology is
used for private investment analysis. The findings allow a new light to be shed on the causes for
the long lasting stagnation in Japan. The results suggest that the rigid dividend policy is a result
of the socio-economic phenomena of change-aversion and the age structure of the underlying
society. As a consequence, credit crunch and financial sector problems that resulted in loan
scarcity were not offset by appropriate adjustments in earnings distribution strategies. Internally
generated resources were consumed by dividends instead of being utilized in further
endowments for capital resources which had served to improve the competitiveness of the
Japanese economy in the global markets. Departure from the pattern of private investment in
Japan that sustained Japan’s competitive position for decades was detrimental to the national
International Journal of Economic Policy Studies
51
economy and in fact initiated a negative feedback loop. Products lost competitive position due
to continued appreciation of the yen, and companies were not able to offset this trend because
they did not have sufficient resources to finance new investment in capital. This resulted in
lower profitability and further deterioration of financial position. Throughout all this, dividends
remained unchanged. As a consequence, internally generated resources shrank compounded by
a credit crunch that led to the unavailability of loans, despite extremely low nominal interest
rates. Monetary policy demonstrated its impotence in stimulating the national economy either
with a zero nominal interest rates policy (ZIRP) or with quantitative easing policy (QEP). Not
only did private investment (I) decrease, but so did private consumption (C) due to systematic
growth in the number of unemployed persons. Increased public spending (G) did not improve
the situation because it caused an appreciation of the domestic currency and further
deterioration of the financial standing of Japanese companies (Mlodkowski 2010).
The remainder of the paper is organized as follows. First (Part II), a brief description of the
main causes and the nature of the prolonged economic stagnation in Japan are presented. The
recognized reasons are of institutional, legal and demographic nature and also result from the
global imbalances in international trade. Then, specific features of the Japanese capital market
are revealed (Part III) and cover the structure of investors holding stocks and their preferences
regarding dividends. The empirical (Part IV) presents and discusses the results of estimations
for groups of models organized by different proxies for dividend policy and for simple models
of private investment in Japan. The paper is closed with conclusions (Part V).
2. Origins and Nature of the Prolonged Economic Stagnation in Japan
Japan is a very special case as regards its society and economy. After World War II, the pacifist
approach plus the focus on technology improvement and development allowed for Japan to
become the second most important economy in the world. The Japanese currency in the late
1980s was expected to dethrone the USD in its predominance in the global financial system.
The subsequent economic developments in Japan, after 1990, resulted in a substantial decline,
both domestically and internationally. The prolonged stagnation became a subject of concern for
policymakers and of interest for economists. The literature offers many views to explain the
reasons and nature of the prolonged stagnation in Japan. Bayoumi (1999) argues that it is
possible to distinguish at least four explanations that received a wider recognition. His
classification omits at least two other crucial aspects. One of these omitted aspects is what Ando
(1998, 2002, 2004) explained extensively as demographic factors. There is no doubt that this
dimension is of crucial significance for every society and for an aging society in particular.
Vol.5 2010
52
Many authors have supported this claim in the case of Japan (Faruqee and Muhleisen 2001,
Kozu, Sato, Inada 2003, Horioka, Suzuki, Hatta 2007). The focus in this part of the literature is
on demographic features’ influence on domestic savings and investment and domestic demand
(Madsen 2004, Horioka 2006) and approaching consequences for the national pension system.
The approach to explaining the causes and consequences of the ‘lost decade’ (and beyond) in
this paper perceives demographic considerations as the driving force for observed developments.
The postulated propagation mechanism is, however, through the corporate financial strategies
shaped according to the needs of stockholders. The shareholders in Japan represent a growing
demand for a stable cash income from dividends due to necessity to: (1) maintain consumption
of individual investors, (2) pay pensions to pensioners covered by corporate and public pension
schemes. Results obtained by Ramaswany and Rendu (1999) indirectly support these claims.
Ramaswany and Rendu (1999) using Vector Autoregressive (VAR) models discovered that
despite price declines of assets in the 1990s, the associated private consumption response was
relatively small. This observation suggests that private spending was maintained due to a stable
income from another source. This other source of income was (and still is) cash dividends paid
by Japanese corporations.
Sekine (1999) claims that liquidity problems and the credit crunch experienced by Japanese
enterprises in the 1990s resulted in significant decreases of private investment. It seems
reasonable to add to these findings another part of the equation. It was already observed by
Ando (1998) that Japan suffered in the 1990s from a low rate of return on invested capital due
to over-investment in the 1980s. Bearing this argument in mind, one may draw additional
support from claims by Kanaya and Woo (2000) about external financing problems faced by
Japanese companies.1 Other authors suggested the presence of significant external financing
constraints in Japan since 1990 (Kimura 2009) resulting from problems in the domestic banking
sector (Bayoumi 1999). Banks play a relatively more important role in Japan in business
financing than, for example, in Anglo-Saxon countries where external financing is provided via
stock exchanges. Therefore, with the value of the available collateral declining since the 1990s,
bank loans were not available to many businesses. The alternative sources of capital to finance
private investment in Japan were also restricted. Share prices trended down along with corporate
earnings, which together made equity financing an expensive option. Added to this severe
financing situation after 1990, another factor detrimental for investment decisions was the
1 Kanaya and Woo (2000) put emphasis on the regulatory framework and corporate governance as the
reasons for deterioration of the banking sector and the associated prolonged inability of the private sector
to overcome stagnation. We believe that the institutional and legal frameworks in this regard did not fail
in Japan.
International Journal of Economic Policy Studies
53
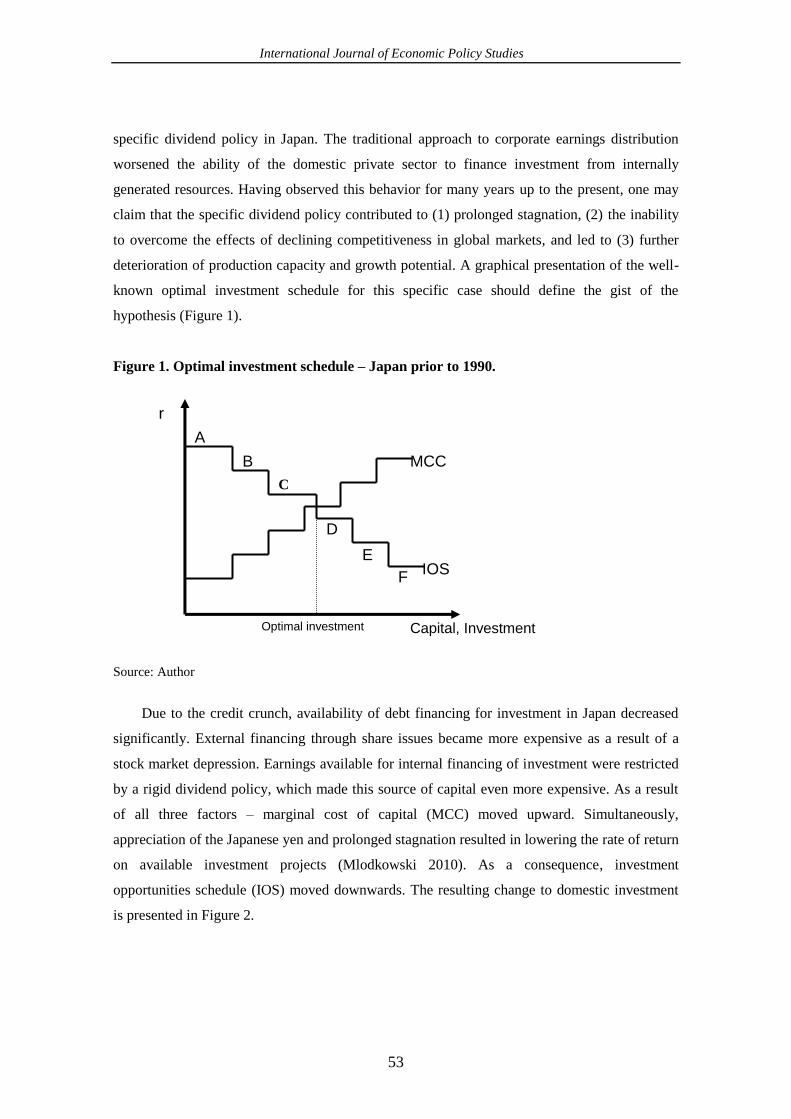
specific dividend policy in Japan. The traditional approach to corporate earnings distribution
worsened the ability of the domestic private sector to finance investment from internally
generated resources. Having observed this behavior for many years up to the present, one may
claim that the specific dividend policy contributed to (1) prolonged stagnation, (2) the inability
to overcome the effects of declining competitiveness in global markets, and led to (3) further
deterioration of production capacity and growth potential. A graphical presentation of the well-
known optimal investment schedule for this specific case should define the gist of the
hypothesis (Figure 1).
Figure 1. Optimal investment schedule – Japan prior to 1990.
Source: Author
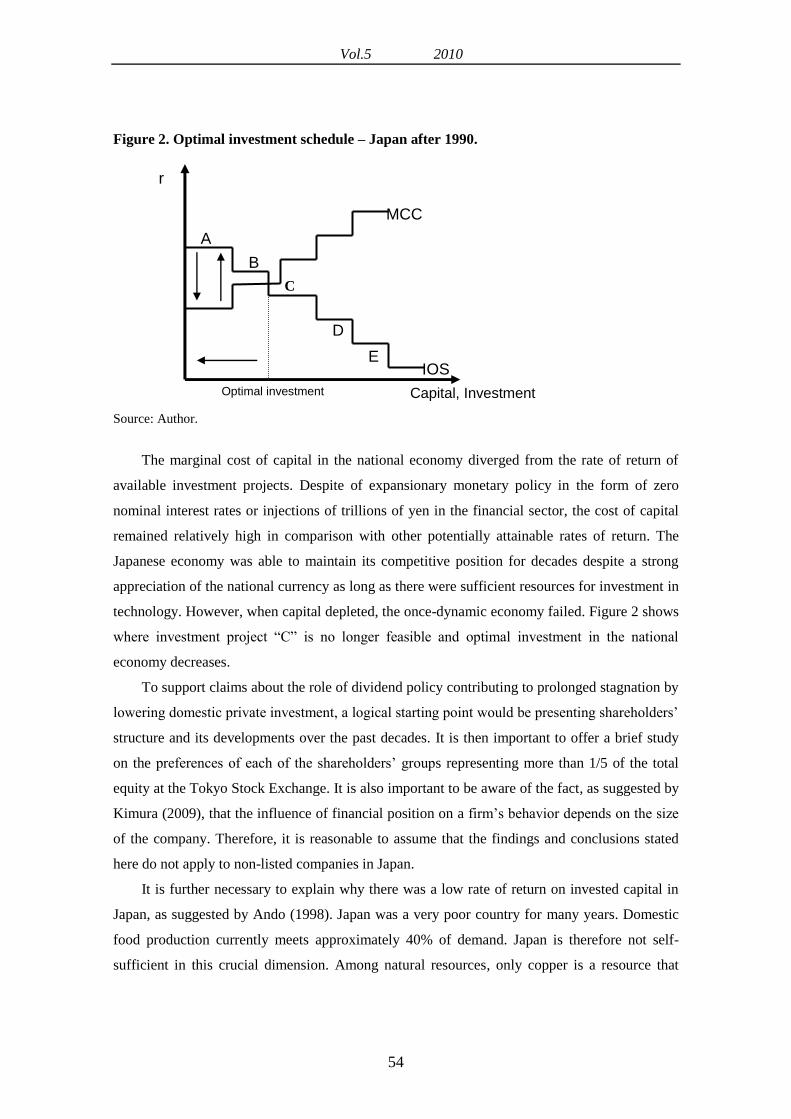
Due to the credit crunch, availability of debt financing for investment in Japan decreased
significantly. External financing through share issues became more expensive as a result of a
stock market depression. Earnings available for internal financing of investment were restricted
by a rigid dividend policy, which made this source of capital even more expensive. As a result
of all three factors – marginal cost of capital (MCC) moved upward. Simultaneously,
appreciation of the Japanese yen and prolonged stagnation resulted in lowering the rate of return
on available investment projects (Mlodkowski 2010). As a consequence, investment
opportunities schedule (IOS) moved downwards. The resulting change to domestic investment
is presented in Figure 2.
Optimal investment
F
E
D
C
B
A
Capital, Investment
r
IOS
MCC
Vol.5 2010
54
Figure 2. Optimal investment schedule – Japan after 1990.
Source: Author.
The marginal cost of capital in the national economy diverged from the rate of return of
available investment projects. Despite of expansionary monetary policy in the form of zero
nominal interest rates or injections of trillions of yen in the financial sector, the cost of capital
remained relatively high in comparison with other potentially attainable rates of return. The
Japanese economy was able to maintain its competitive position for decades despite a strong
appreciation of the national currency as long as there were sufficient resources for investment in
technology. However, when capital depleted, the once-dynamic economy failed. Figure 2 shows
where investment project “C” is no longer feasible and optimal investment in the national
economy decreases.
To support claims about the role of dividend policy contributing to prolonged stagnation by
lowering domestic private investment, a logical starting point would be presenting shareholders’
structure and its developments over the past decades. It is then important to offer a brief study
on the preferences of each of the shareholders’ groups representing more than 1/5 of the total
equity at the Tokyo Stock Exchange. It is also important to be aware of the fact, as suggested by
Kimura (2009), that the influence of financial position on a firm’s behavior depends on the size
of the company. Therefore, it is reasonable to assume that the findings and conclusions stated
here do not apply to non-listed companies in Japan.
It is further necessary to explain why there was a low rate of return on invested capital in
Japan, as suggested by Ando (1998). Japan was a very poor country for many years. Domestic
food production currently meets approximately 40% of demand. Japan is therefore not self-
sufficient in this crucial dimension. Among natural resources, only copper is a resource that
E
D
C
B
A
IOS
Optimal investment Capital, Investment
r
MCC
International Journal of Economic Policy Studies
55
does not need to be imported to meet the requirements of domestic production. All other
deposits of natural resources are negligible or have been depleted long ago.
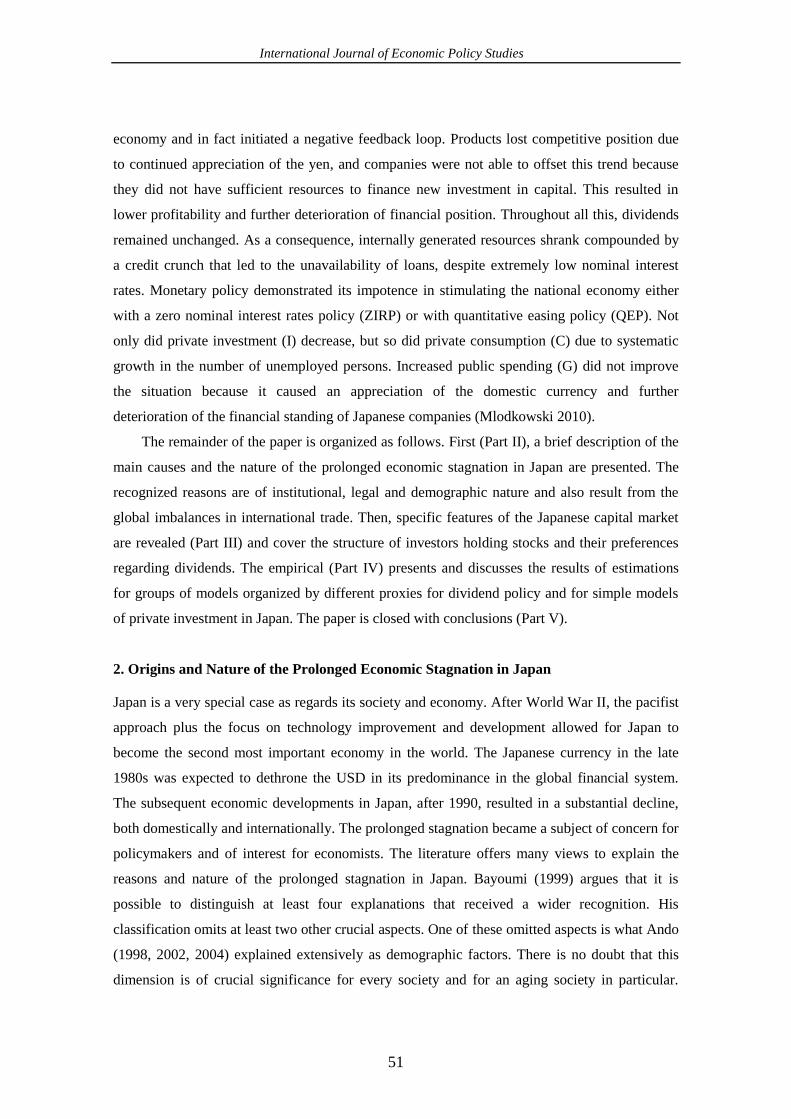
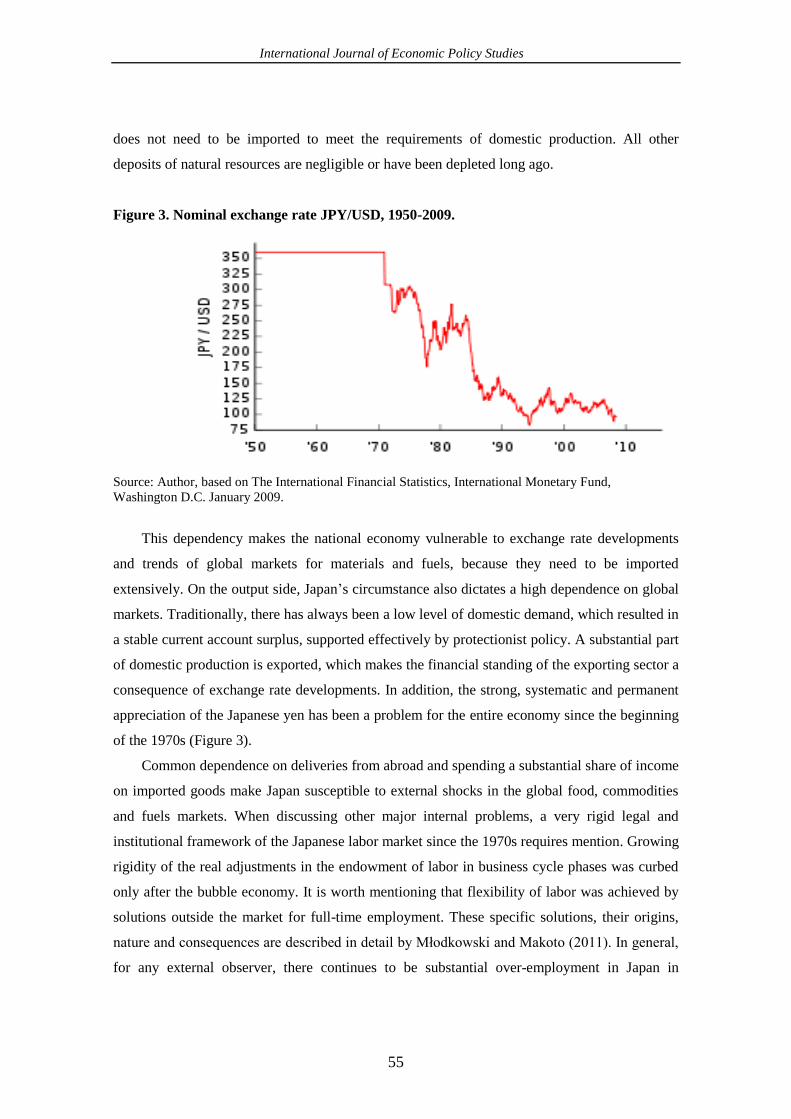
Figure 3. Nominal exchange rate JPY/USD, 1950-2009.
Source: Author, based on The International Financial Statistics, International Monetary Fund,
Washington D.C. January 2009.
This dependency makes the national economy vulnerable to exchange rate developments
and trends of global markets for materials and fuels, because they need to be imported
extensively. On the output side, Japan’s circumstance also dictates a high dependence on global
markets. Traditionally, there has always been a low level of domestic demand, which resulted in
a stable current account surplus, supported effectively by protectionist policy. A substantial part
of domestic production is exported, which makes the financial standing of the exporting sector a
consequence of exchange rate developments. In addition, the strong, systematic and permanent
appreciation of the Japanese yen has been a problem for the entire economy since the beginning
of the 1970s (Figure 3).
Common dependence on deliveries from abroad and spending a substantial share of income
on imported goods make Japan susceptible to external shocks in the global food, commodities
and fuels markets. When discussing other major internal problems, a very rigid legal and
institutional framework of the Japanese labor market since the 1970s requires mention. Growing
rigidity of the real adjustments in the endowment of labor in business cycle phases was curbed
only after the bubble economy. It is worth mentioning that flexibility of labor was achieved by
solutions outside the market for full-time employment. These specific solutions, their origins,
nature and consequences are described in detail by Młodkowski and Makoto (2011). In general,
for any external observer, there continues to be substantial over-employment in Japan in
Vol.5 2010
56
comparison with other industrialized countries. As a consequence, labor costs represent a major
share in total production costs.2
These unfavorable economic conditions converged at the beginning of the 1990s with
specific demographic developments resulting from Japan being the fastest aging society in the
world. According to demographic statistics provided by Kozu, Sato and Inada (2003), there are
104 million people covered by the public pension system, of which 70 million are paying
contributions and 34 million are receiving pensions. Employees’ Pension Insurance represents
about 50% of total payouts. The remainder is covered by the Mutual Aid Association Pension
System and the National Pension. The public pension system in Japan was initially a funded one,
but transformed into a fully pay-as-you-go system in 1974 until reforms in 2004. Therefore, in
the literature it is often recognized as a PAYG system. The system, however, owns pension
assets with a value of 147 trillion yen, of which 137 trillion yen is owned by Employees’
Pension Insurance and the remaining 10 trillion yen by National Pension (Ministry of Health,
Labour and Welfare 2002). These financial assets are supposed to generate cash income to
finance the growing amount of pension payouts. Therefore, institutions that represent these
assets in the stock market have very clear preferences concerning the form of benefits generated
by the associated stockholdings. One should pronounce these preferences as: (1) growing or at
least stable amount of dividends in each period, (2) growing or at least stable amount of
dividends irrespective of business cycle phases or financial standing, (3) growing or at least
stable amount of dividends no matter the available investment opportunities for the underlying
companies. Shareholders constrained by the obligation to pay out pensions are not interested in
gains from stock price appreciation. Due to the nature and duration structure of their obligations,
their priority is to maintain the value of initial capital. However, this was also a problem in
Japan after 1990. With the asset price bubble burst, a decline of share prices hit all holders of
pension assets. Despite these unfavorable developments, preferences of shareholders remained
relatively unchanged and managers defining earnings distribution policy had to comply with the
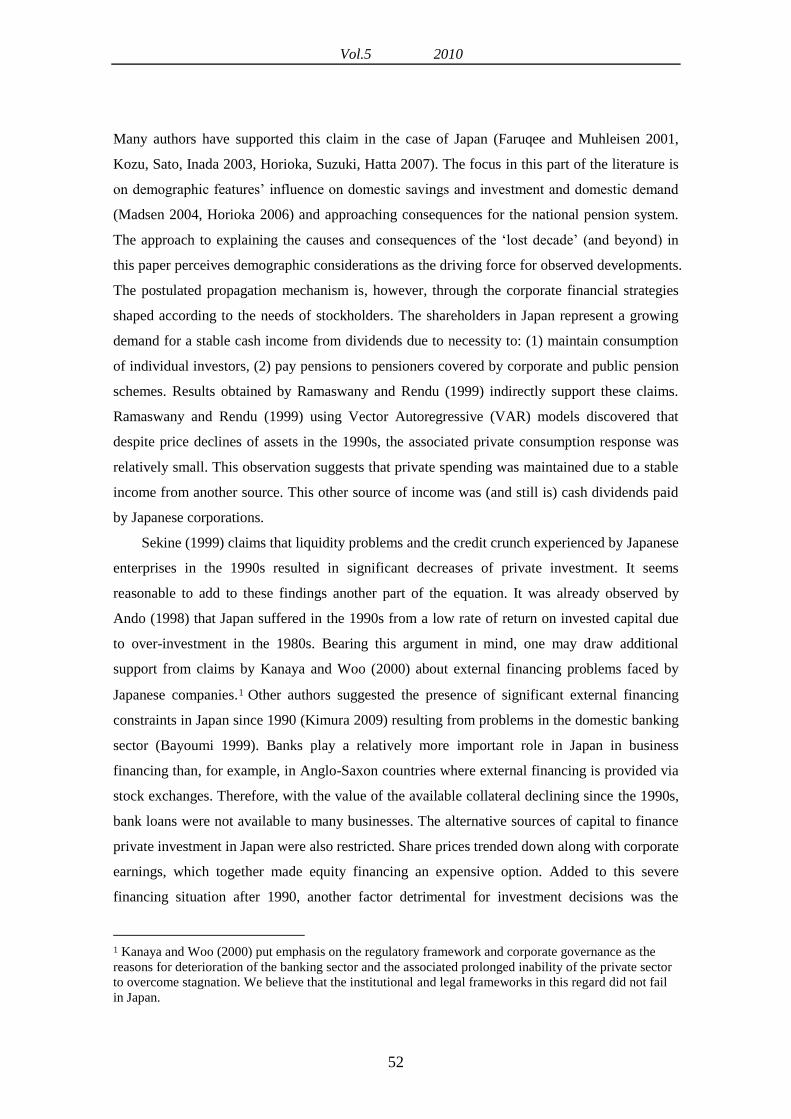
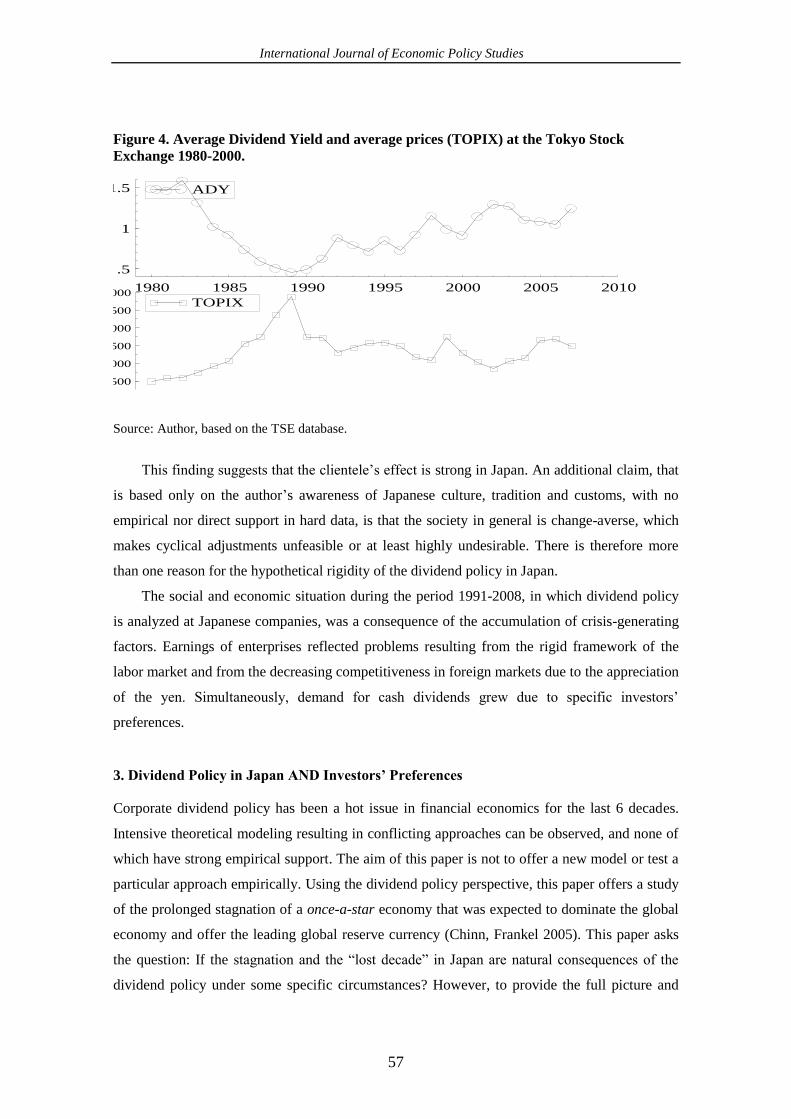
wishes of these specific investors’ needs. The observed anti-cyclical behavior of the average
dividend yield (Figure 4) indicates that the amount of dividends paid responded to economic
crisis and stagnation less than proportionally.
2 There is lack of social and political acceptance for nation-wide restructuring of employment due to
expected unprecedented surge in unemployment, as a consequence of such a move. However, this is still
possible that such a shock would be an impulse for creative entrepreneurs to absorb the labor force
surplus in new business projects for the prosperity of the whole country.
International Journal of Economic Policy Studies
57
Figure 4. Average Dividend Yield and average prices (TOPIX) at the Tokyo Stock
Exchange 1980-2000.
Source: Author, based on the TSE database.
This finding suggests that the clientele’s effect is strong in Japan. An additional claim, that
is based only on the author’s awareness of Japanese culture, tradition and customs, with no
empirical nor direct support in hard data, is that the society in general is change-averse, which
makes cyclical adjustments unfeasible or at least highly undesirable. There is therefore more
than one reason for the hypothetical rigidity of the dividend policy in Japan.
The social and economic situation during the period 1991-2008, in which dividend policy
is analyzed at Japanese companies, was a consequence of the accumulation of crisis-generating
factors. Earnings of enterprises reflected problems resulting from the rigid framework of the
labor market and from the decreasing competitiveness in foreign markets due to the appreciation
of the yen. Simultaneously, demand for cash dividends grew due to specific investors’
preferences.
3. Dividend Policy in Japan AND Investors’ Preferences
Corporate dividend policy has been a hot issue in financial economics for the last 6 decades.
Intensive theoretical modeling resulting in conflicting approaches can be observed, and none of
which have strong empirical support. The aim of this paper is not to offer a new model or test a
particular approach empirically. Using the dividend policy perspective, this paper offers a study
of the prolonged stagnation of a once-a-star economy that was expected to dominate the global
economy and offer the leading global reserve currency (Chinn, Frankel 2005). This paper asks
the question: If the stagnation and the “lost decade” in Japan are natural consequences of the
dividend policy under some specific circumstances? However, to provide the full picture and
1980 1985 1990 1995 2000 2005 2010
.5
1
1.5 ADY
500
1000
1500
2000
2500
3000TOPIX
Vol.5 2010
58
reasoning for the observations, one has to refer to some dividend policy theories to understand
motivation for the postulated behavior.
There are three general schools of thought regarding corporate dividend policy. The first
perceives dividends as positively influencing the share price, another approach perceives
dividend-share price relationship as negative one, and the third approach claims that dividends
are irrelevant. However, the most recent research on dividend policy should be divided
according to different criteria. What matters for modern theoretical models is the nature of the
stock market structure and the underlying motivation driving investors’ decisions. As a
consequence, one can recognize models assuming full or asymmetric information and ruled by
specific behavior of groups of investors. For this study, the Tokyo Stock Exchange preferences
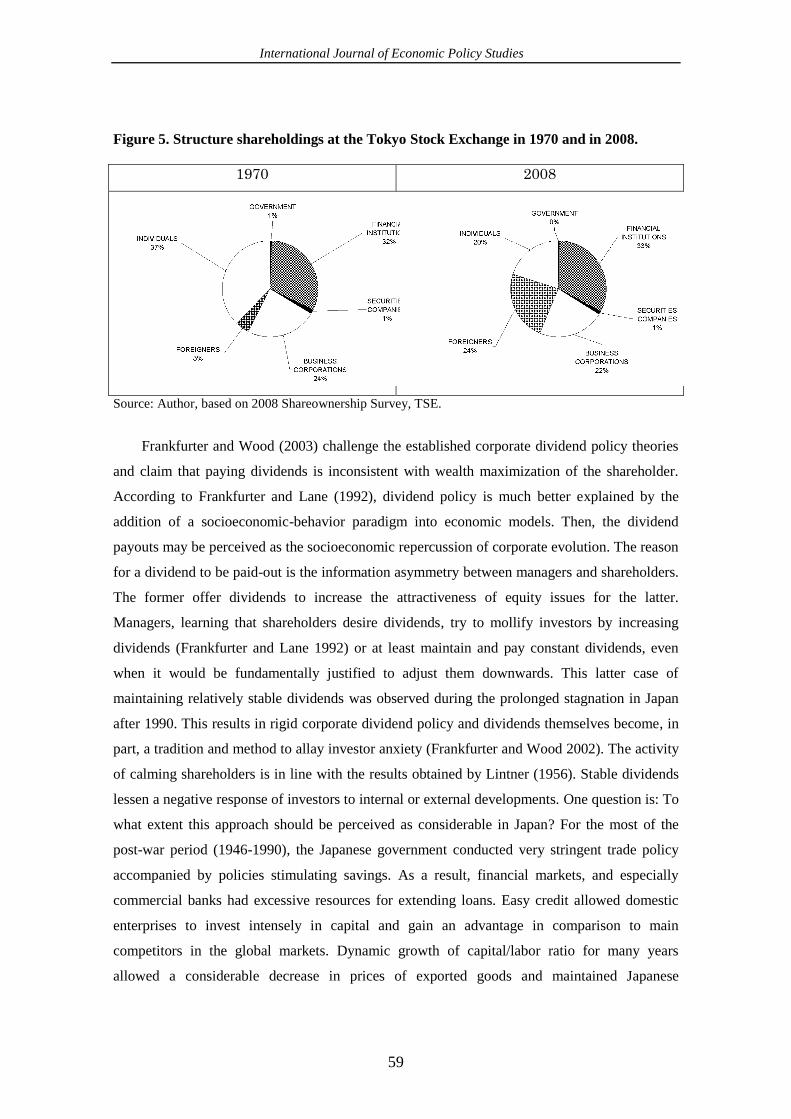
of the main investor groups matter will be applied. Due to the fact that the shareholdings are
divided more or less equally among financial institutions, business corporations, foreigners and
individual investors (Figure 5), studying and recognizing preferences of these groups is of the
highest importance. Focusing on tax considerations (Miller and Modigliani 1961) or signaling
models under information asymmetry (Akerlof 1970) or agency costs (Jensen and Meckling
1976) or free cash flow hypothesis (Jensen 1986) do not allow us to explain completely the
observed corporate dividend policy. In the case of the Japanese stock market, it seems that the
most appropriate approach is based on behavioral models. As was already observed by Shiller
(1984) “…investors’ behavior is substantially influenced by societal norms and attitudes…”
One should add to Shiller (1984) another dimension that indirectly drives stockholders’
decisions: demographic issues. To be even more precise, one may perceive the age structure of
the underlying society as the most important driving force for the corporate dividend policy
observed for Japanese companies listed at the Tokyo Stock Exchange. Referring once again to
Shiller (1989) “…including these influences in modeling efforts can enrich the development of a
theory to explain the endurance of corporate dividend policy.” As will be revealed shortly,
Japanese companies exhibit a rare endurance of corporate dividend policy.
International Journal of Economic Policy Studies
59
Figure 5. Structure shareholdings at the Tokyo Stock Exchange in 1970 and in 2008.
1970 2008
Source: Author, based on 2008 Shareownership Survey, TSE.
Frankfurter and Wood (2003) challenge the established corporate dividend policy theories
and claim that paying dividends is inconsistent with wealth maximization of the shareholder.
According to Frankfurter and Lane (1992), dividend policy is much better explained by the
addition of a socioeconomic-behavior paradigm into economic models. Then, the dividend
payouts may be perceived as the socioeconomic repercussion of corporate evolution. The reason
for a dividend to be paid-out is the information asymmetry between managers and shareholders.
The former offer dividends to increase the attractiveness of equity issues for the latter.
Managers, learning that shareholders desire dividends, try to mollify investors by increasing
dividends (Frankfurter and Lane 1992) or at least maintain and pay constant dividends, even
when it would be fundamentally justified to adjust them downwards. This latter case of
maintaining relatively stable dividends was observed during the prolonged stagnation in Japan
after 1990. This results in rigid corporate dividend policy and dividends themselves become, in
part, a tradition and method to allay investor anxiety (Frankfurter and Wood 2002). The activity
of calming shareholders is in line with the results obtained by Lintner (1956). Stable dividends
lessen a negative response of investors to internal or external developments. One question is: To
what extent this approach should be perceived as considerable in Japan? For the most of the
post-war period (1946-1990), the Japanese government conducted very stringent trade policy
accompanied by policies stimulating savings. As a result, financial markets, and especially
commercial banks had excessive resources for extending loans. Easy credit allowed domestic
enterprises to invest intensely in capital and gain an advantage in comparison to main
competitors in the global markets. Dynamic growth of capital/labor ratio for many years
allowed a considerable decrease in prices of exported goods and maintained Japanese
Vol.5 2010
60
companies’ competitive position despite the strong appreciation of the yen. The Japanese
economy benefited from a high level of domestic savings that were invested in the national
economy to maintain and even increase competitive advantage for decades. As long as this
mechanism was in operation, Japan easily overcame any external shocks, despite its deep-rooted
vulnerabilities. The end of domestically invested savings started a chain reaction that resulted in
the ‘lost decade’ (ushinawareta jūnen). In addition, there emerged an inability to further resist
appreciation of the yen or any other external shocks. Contemporary shocks, such as the global
financial crisis of 2008-2009, started to hit Japanese investment (savings) abroad and led to
mass dismissals at domestic enterprises that were no longer able to resist foreign competition.
The claim is that this inability to maintain a competitive position is a direct result of a rigid
dividend policy that became rather a tradition than a flexible element of corporate strategy. It is
also possible to offer an explanation for the rigidity of dividend policy and point out the indirect
influence of demographic features of Japanese society. The growing amount of pension
transfers with the descending number of workers that currently support pension funds is not
sustainable. Pension funds drain corporate resources in the form of dividends. This resource
drain makes it difficult for domestic enterprises to invest since much of the domestic savings are
invested abroad and thus no longer available for Japanese companies.
The blame for the outflow of domestic savings abroad rests with economic policies in the
second half of the 1980s and the entire period from 1990 to 2009. Therefore, this paper focuses
on some crucial decisions and their consequences to set the table for economic policy discussion.
The reasons for an aging society and available policy responses are much more complex and
beyond the scope of this paper. It should be taken for granted that Japanese society has been
systematically and rapidly aging for the last three decades as well as having a declining birth
rate. According to the World Bank database, The Global Development Indicators, Japanese life
expectancy is among the world’s longest and the fertility rate is among the lowest (WB 2009).
As a consequence, Japanese society may be perceived as a very old society, with an increasing
demand for cash transferred to retired citizens. What’s more, the social security system is
extensive and together with the pension system depends on contributions by currently employed
workers and resources generated by previously accumulated pension assets. The latter element
generates income in the form of cash dividends paid by Japanese companies to their
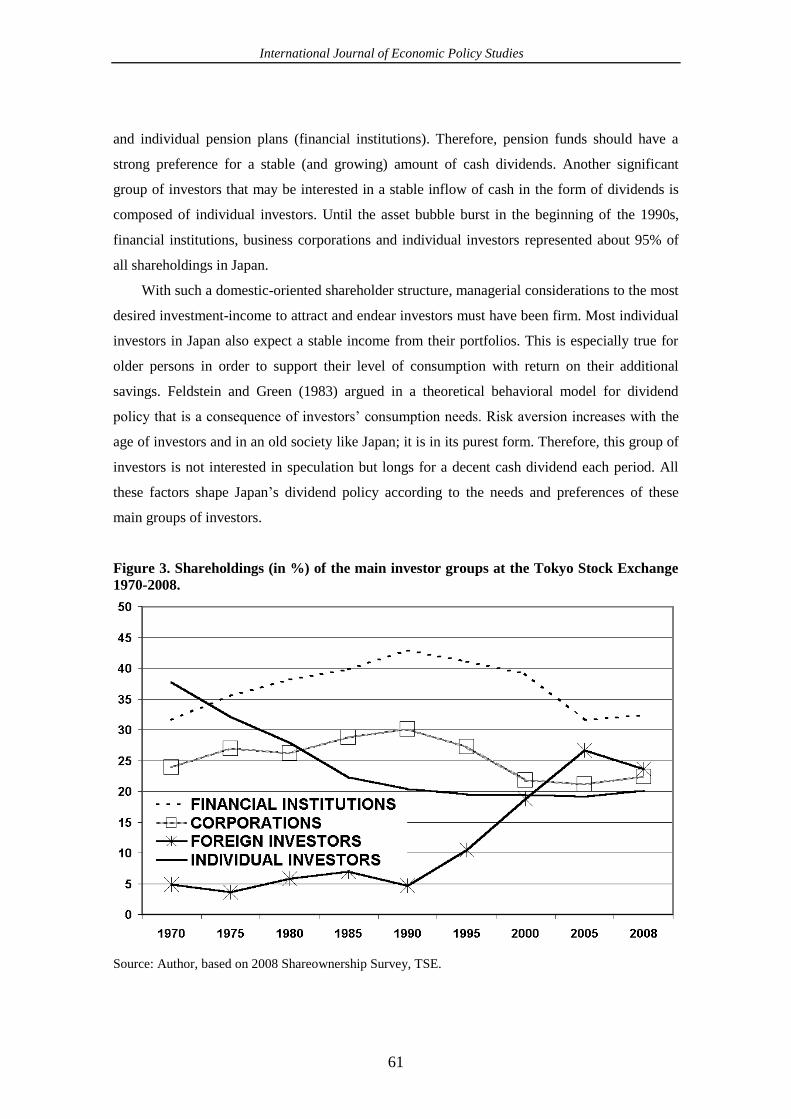
shareholders. As can be seen in Figure 3, for the last 30 years the biggest shareholder groups are
financial institutions. Together with business corporations holding an average of 25% of all
shares, they represent more than half of all stockholders in Japan. These two groups are
responsible for paying pensions according to corporate pension plans (business corporations)
International Journal of Economic Policy Studies
61
and individual pension plans (financial institutions). Therefore, pension funds should have a
strong preference for a stable (and growing) amount of cash dividends. Another significant
group of investors that may be interested in a stable inflow of cash in the form of dividends is
composed of individual investors. Until the asset bubble burst in the beginning of the 1990s,
financial institutions, business corporations and individual investors represented about 95% of
all shareholdings in Japan.
With such a domestic-oriented shareholder structure, managerial considerations to the most
desired investment-income to attract and endear investors must have been firm. Most individual
investors in Japan also expect a stable income from their portfolios. This is especially true for
older persons in order to support their level of consumption with return on their additional
savings. Feldstein and Green (1983) argued in a theoretical behavioral model for dividend
policy that is a consequence of investors’ consumption needs. Risk aversion increases with the
age of investors and in an old society like Japan; it is in its purest form. Therefore, this group of
investors is not interested in speculation but longs for a decent cash dividend each period. All
these factors shape Japan’s dividend policy according to the needs and preferences of these
main groups of investors.
Figure 3. Shareholdings (in %) of the main investor groups at the Tokyo Stock Exchange
1970-2008.
Source: Author, based on 2008 Shareownership Survey, TSE.
Vol.5 2010
62
Only for the last 16 years has the importance of foreign investors begun to grow. Foreign
investors in foreign stock markets are most often financial institutions, for which shareholdings
are recognized in the official statistics as “portfolio investments” due to their short-term nature
and the lack of influence on the management of underlying enterprises. The fact that foreign
investors hold about 20% of Japanese stocks today has no meaning for the dividend policy. First,
there are other groups of investors (domestic) who represent the other 80% of stockholders and
their preferences have an actual influence on dividend policy. Second, foreign investors offer
capital to Japanese companies via stock markets and thus do not to control managerial decisions.
Their aim is to benefit from the traditional and customary corporate dividend policies that suit
their investment needs and diversification preferences. As a consequence, one should not
observe any response of dividend policy variables to changes in the shareholdings of the foreign
investors in Japan. Third, the Japanese stock market is relatively stable and resistant to shocks.
Japan has been perceived for many years as a safe marina for speculative capital. Rapid and
strong appreciation of yen in the last quarter of 2008 confirms this claim and shows that despite
many domestic problems that surfaced in that period, they are of no concern for speculators.
Short-term involvement induces the omission of dividend considerations. This allows an
assumption that some foreign investors are dividend policy neutral because they aim at
preserving their wealth in turbulent times. There were few sudden drops or surges in the history
of the Tokyo Stock Exchange listed in the annual Factbook published by the TSE (TSE 2009, p.
78). Consequently, foreign investors do not expect to realize gains on speculation on Japanese
stocks and look for a more probable and certain income in the form of a cash dividend. As can
be concluded, all stockholders owning Japanese company stock expect and desire cash
dividends. This preference is due to two factors. The first is the demand for cash necessary for
paying out pensions’ under corporate (and individual) pension plans. The other factor is the
attitude of foreign portfolio investors. Japanese companies succumbed and adjusted to these
preferences.
4. Dividend Policy in Crisis 1991-2008
The methodology of the dividend policy study in this paper is composed of two phases. The first
econometric exercise is a test of the nature of the relationships between dividend policy
(DIVPOL) and a set of independent variables. The initial findings are separately based on a
simple comparison of estimated parameters for two sampling periods: the economic boom-
1980-1990 (the bubble economy) and the economic recession 1991-2009 (the lost decade or the
International Journal of Economic Policy Studies
63
lost 18 years). After recognizing the dividend policy in crisis and any changes that emerged due
to crisis conditions, the hypothetical causality is reversed.
In the second econometric exercise, the regression equations of dividend policy against
private domestic investment in Japan in the two periods (1980-1990 and 1991-2008) are
estimated. The hypothesis posed is that due to a set of socio-demographic features of the
Japanese economy in crisis, there was a significant change in the manner in which domestic
resources were utilized. For the whole post-war period, domestic consumption was relatively
low with a high rate of savings that were invested domestically. This allowed for significant and
unprecedented growth rates of the Japanese economy, doubling the GDP over the 1980s, despite
the strong appreciation of the yen. From the 1990s, the “carry trade” developed and domestic
savings started to be invested overseas. With no easy access to financial resources (Kimura
2009), compared with the former situation, and with a rigid dividend policy, Japanese
corporations started to give ground in the global markets. It may be suggested that this inability
to maintain investment in technological advancement may be responsible for the prolonged
stagnation of the Japanese economy and for difficulties in recovering from the economic crisis,
which started in 1991.
The time series that serve in estimations are provided by the Tokyo Stock Exchange and
are available on-line in MsExcel spreadheets: (1) “Summary of Earnings Digest”, (part:
“historical”), (2) “Average Yield”, (3) “Monthly PER and PBR” and in PDF files: (1)
Shareownership Survey”, (2) the TSE “Factbooks” from 2001 to 2009. The other variables (real
GDP growth rate and private domestic investment) are provided by the Cabinet Office and the
International Monetary Fund in the International Financial Statistics database, respectively.
PCGIVE software, version 1.0 serves in data processing and in all estimations.
The regressions in the first step of the empirical analysis utilize two kinds of models.
Estimations for two different periods of a simple linear regression use the following formula:
DIVPOLt =a +dDIVPOLt-1 +bXt +et (1)
where:
DIVPOLt is the dividend policy variable with three proxies: (1) average dividend yield, (2)
dividends paid, (3) dividend payout ratio; for (2) and (3) time series available for non-financial
sector, manufacturing sector and non-manufacturing sector allowed for sectoral estimations and
analysis.
Vol.5 2010
64
- is the constant, that is for most models set to ZERO due to lack of economic interpretations
in the estimated regressions; omitting the constant was justified also by its statistical
insignificance and no role in improving fitness of the regression models.
DIVPOLt-1 – is the lagged endogenous variable to reflect the fact of an autoregressive nature of
dividend policy that is true at least to some extent.
- is the parameter reflecting nature and strength of the studied relationship between the Xt
variable and the dividend policy.
Xt – is the exogenous variable that is supposed to have an influence on dividend policy; the set
of Xt variables is composed on the basis of literature review and covers: (1) net sales, (2)
operating income, (3) EBIT, (4) net income (5) total assets, (6) return on equity, (7) return on
investment, (8) share of non-resident shareholders, (9) real GDP growth rate.
t – is the standard error term N(0,).
The other group of models estimated for the whole period during the initial econometric
exercise utilizes multiple regression design of the following form:
DIVPOLt =a +dDIVPOLt-1 +bXt +lKRt +et (2)
where:
DIVPOLt – represented previously.
- is the constant set to ZERO.
DIVPOLt-1 – is the lagged endogenous variable to reflect the fact of an autoregressive nature of
dividend policy that is true at least to some extent.
- represented previously.
Xt – is the exogenous variable represented previously.
– is the parameter describing the nature of relationship between crisis and dividend policy.
KR – is the dummy variable, with “0” for 1980-1990 and “1” for the “lost decade” period.
t – is the standard error term N(0,).
The estimations were conducted for all available sets of variables, which also included
separate observations for each aggregated variable for the following categories of companies:
(1) non-financial sector, (2) manufacturing sector, and (3) non-manufacturing sector. Since the
first category, in nominal terms, was a simple sum of (2) and (3) it was reasonable to restrict the
presentation of obtained results to only the non-financial sector. Results obtained for the non-
manufacturing sector that should be perceived as the service sector do not diverge from the
International Journal of Economic Policy Studies
65
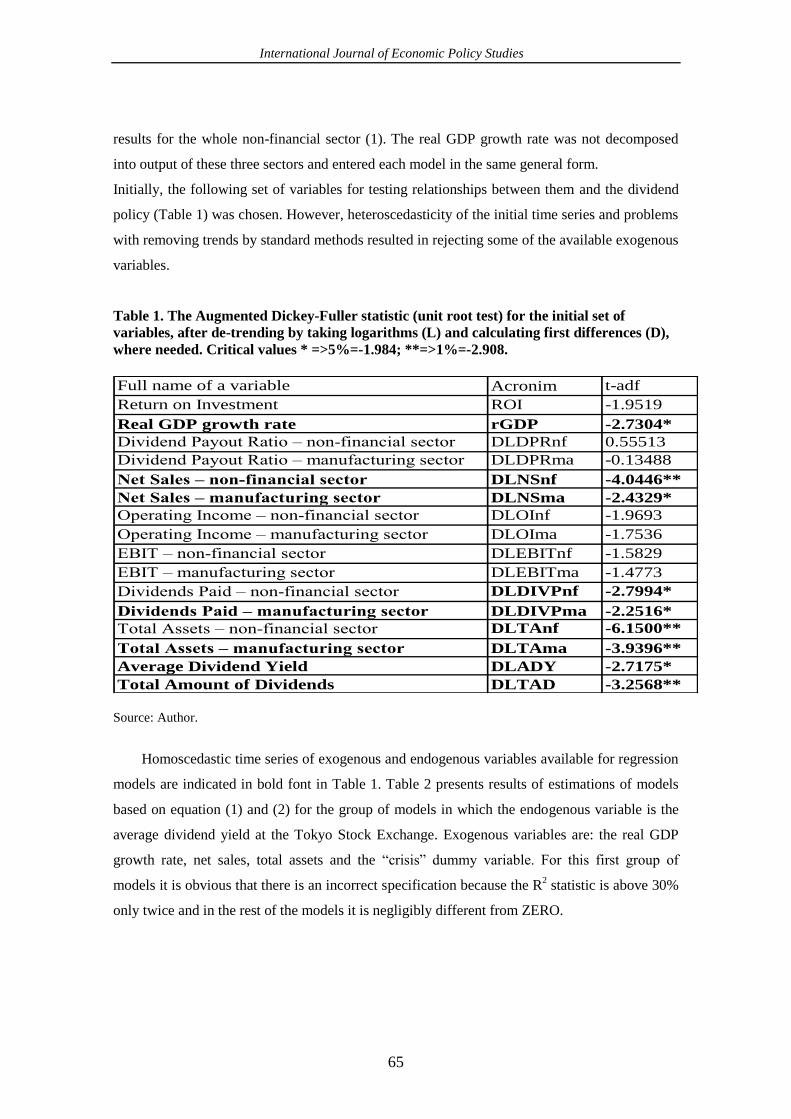
results for the whole non-financial sector (1). The real GDP growth rate was not decomposed
into output of these three sectors and entered each model in the same general form.
Initially, the following set of variables for testing relationships between them and the dividend
policy (Table 1) was chosen. However, heteroscedasticity of the initial time series and problems
with removing trends by standard methods resulted in rejecting some of the available exogenous
variables.
Table 1. The Augmented Dickey-Fuller statistic (unit root test) for the initial set of
variables, after de-trending by taking logarithms (L) and calculating first differences (D),
where needed. Critical values * =>5%=-1.984; **=>1%=-2.908.
Full name of a variable Acronim t-adf
Return on Investment ROI -1.9519
Real GDP growth rate rGDP -2.7304*
Dividend Payout Ratio – non-financial sector DLDPRnf 0.55513
Dividend Payout Ratio – manufacturing sector DLDPRma -0.13488
Net Sales – non-financial sector DLNSnf -4.0446**
Net Sales – manufacturing sector DLNSma -2.4329*
Operating Income – non-financial sector DLOInf -1.9693
Operating Income – manufacturing sector DLOIma -1.7536
EBIT – non-financial sector DLEBITnf -1.5829
EBIT – manufacturing sector DLEBITma -1.4773
Dividends Paid – non-financial sector DLDIVPnf -2.7994*
Dividends Paid – manufacturing sector DLDIVPma -2.2516*
Total Assets – non-financial sector DLTAnf -6.1500**
Total Assets – manufacturing sector DLTAma -3.9396**
Average Dividend Yield DLADY -2.7175*
Total Amount of Dividends DLTAD -3.2568**
Source: Author.
Homoscedastic time series of exogenous and endogenous variables available for regression
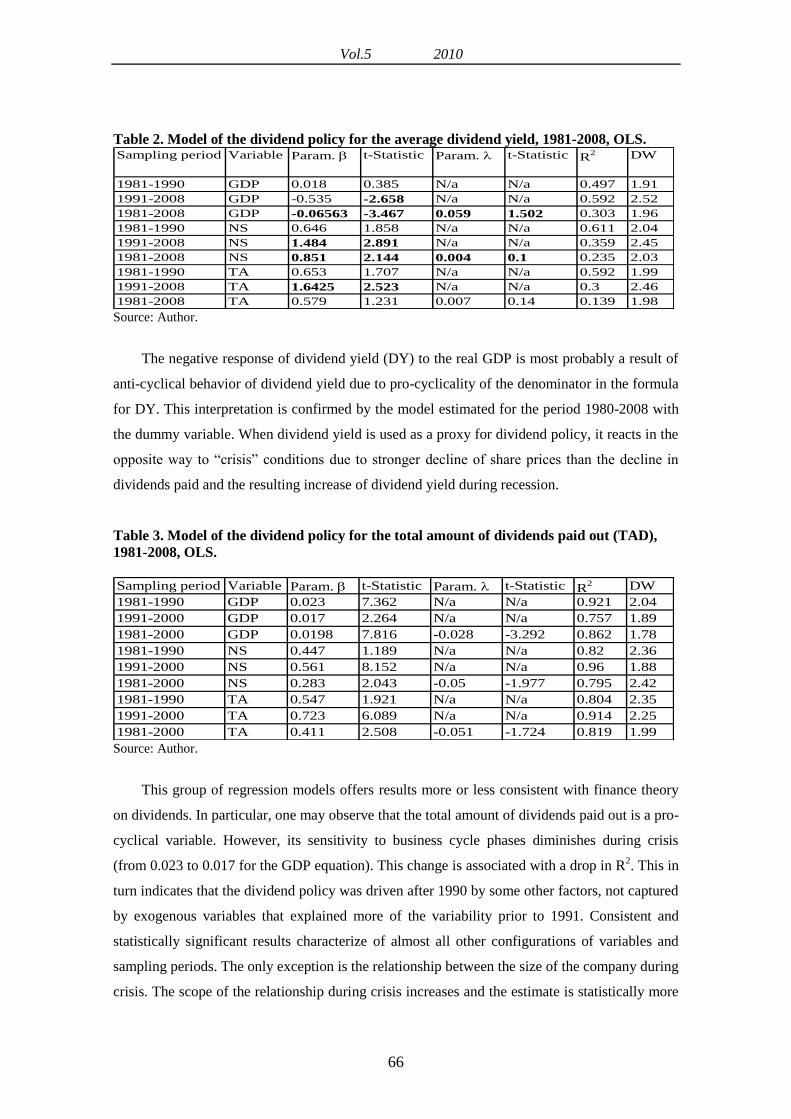
models are indicated in bold font in Table 1. Table 2 presents results of estimations of models
based on equation (1) and (2) for the group of models in which the endogenous variable is the
average dividend yield at the Tokyo Stock Exchange. Exogenous variables are: the real GDP
growth rate, net sales, total assets and the “crisis” dummy variable. For this first group of
models it is obvious that there is an incorrect specification because the R2 statistic is above 30%
only twice and in the rest of the models it is negligibly different from ZERO.
Vol.5 2010
66
Table 2. Model of the dividend policy for the average dividend yield, 1981-2008, OLS. Sampling period Variable Param. t-Statistic Param. t-Statistic R
2 DW
1981-1990 GDP 0.018 0.385 N/a N/a 0.497 1.91
1991-2008 GDP -0.535 -2.658 N/a N/a 0.592 2.52
1981-2008 GDP -0.06563 -3.467 0.059 1.502 0.303 1.96
1981-1990 NS 0.646 1.858 N/a N/a 0.611 2.04
1991-2008 NS 1.484 2.891 N/a N/a 0.359 2.45
1981-2008 NS 0.851 2.144 0.004 0.1 0.235 2.03
1981-1990 TA 0.653 1.707 N/a N/a 0.592 1.99
1991-2008 TA 1.6425 2.523 N/a N/a 0.3 2.46
1981-2008 TA 0.579 1.231 0.007 0.14 0.139 1.98 Source: Author.
The negative response of dividend yield (DY) to the real GDP is most probably a result of
anti-cyclical behavior of dividend yield due to pro-cyclicality of the denominator in the formula
for DY. This interpretation is confirmed by the model estimated for the period 1980-2008 with
the dummy variable. When dividend yield is used as a proxy for dividend policy, it reacts in the
opposite way to “crisis” conditions due to stronger decline of share prices than the decline in
dividends paid and the resulting increase of dividend yield during recession.
Table 3. Model of the dividend policy for the total amount of dividends paid out (TAD),
1981-2008, OLS.
Sampling period Variable Param. t-Statistic Param. t-Statistic R
2 DW
1981-1990 GDP 0.023 7.362 N/a N/a 0.921 2.04
1991-2000 GDP 0.017 2.264 N/a N/a 0.757 1.89
1981-2000 GDP 0.0198 7.816 -0.028 -3.292 0.862 1.78
1981-1990 NS 0.447 1.189 N/a N/a 0.82 2.36
1991-2000 NS 0.561 8.152 N/a N/a 0.96 1.88
1981-2000 NS 0.283 2.043 -0.05 -1.977 0.795 2.42
1981-1990 TA 0.547 1.921 N/a N/a 0.804 2.35
1991-2000 TA 0.723 6.089 N/a N/a 0.914 2.25
1981-2000 TA 0.411 2.508 -0.051 -1.724 0.819 1.99 Source: Author.
This group of regression models offers results more or less consistent with finance theory
on dividends. In particular, one may observe that the total amount of dividends paid out is a pro-
cyclical variable. However, its sensitivity to business cycle phases diminishes during crisis
(from 0.023 to 0.017 for the GDP equation). This change is associated with a drop in R2. This in
turn indicates that the dividend policy was driven after 1990 by some other factors, not captured
by exogenous variables that explained more of the variability prior to 1991. Consistent and
statistically significant results characterize of almost all other configurations of variables and
sampling periods. The only exception is the relationship between the size of the company during
crisis. The scope of the relationship during crisis increases and the estimate is statistically more
International Journal of Economic Policy Studies
67
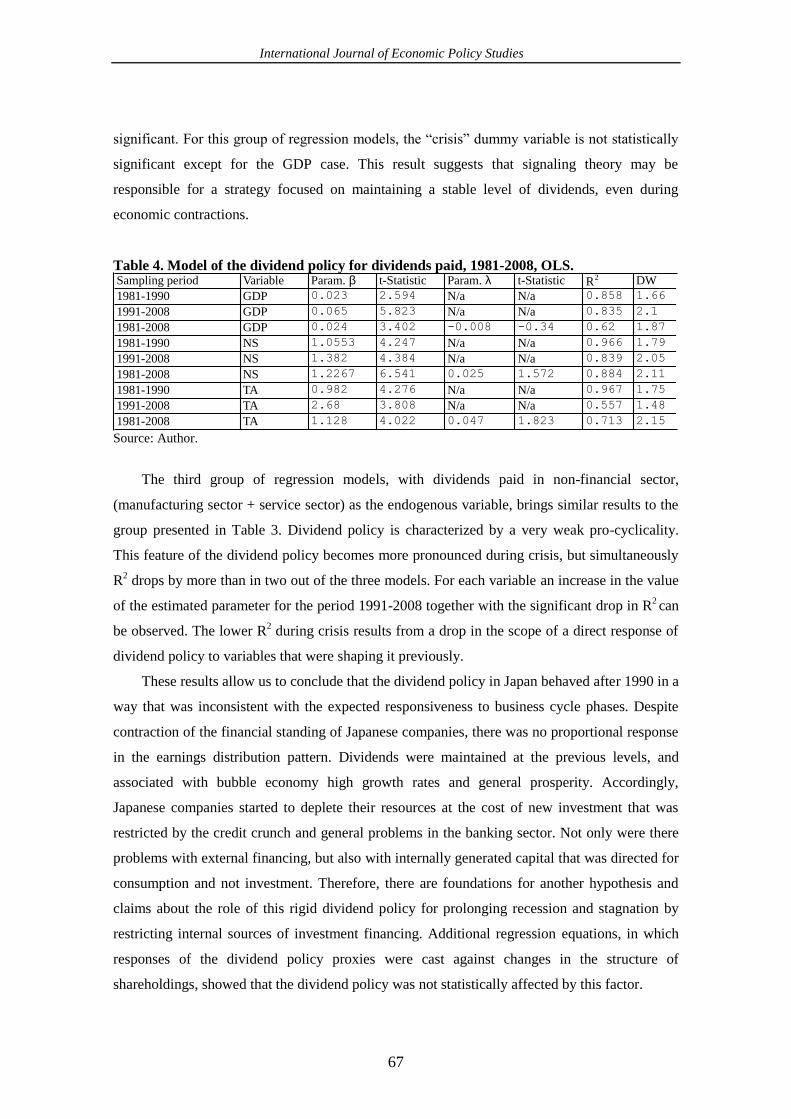
significant. For this group of regression models, the “crisis” dummy variable is not statistically
significant except for the GDP case. This result suggests that signaling theory may be
responsible for a strategy focused on maintaining a stable level of dividends, even during
economic contractions.
Table 4. Model of the dividend policy for dividends paid, 1981-2008, OLS. Sampling period Variable Param. b t-Statistic Param. l t-Statistic R2 DW
1981-1990 GDP 0.023 2.594 N/a N/a 0.858 1.66
1991-2008 GDP 0.065 5.823 N/a N/a 0.835 2.1
1981-2008 GDP 0.024 3.402 -0.008 -0.34 0.62 1.87
1981-1990 NS 1.0553 4.247 N/a N/a 0.966 1.79
1991-2008 NS 1.382 4.384 N/a N/a 0.839 2.05
1981-2008 NS 1.2267 6.541 0.025 1.572 0.884 2.11
1981-1990 TA 0.982 4.276 N/a N/a 0.967 1.75
1991-2008 TA 2.68 3.808 N/a N/a 0.557 1.48
1981-2008 TA 1.128 4.022 0.047 1.823 0.713 2.15 Source: Author.
The third group of regression models, with dividends paid in non-financial sector,
(manufacturing sector + service sector) as the endogenous variable, brings similar results to the
group presented in Table 3. Dividend policy is characterized by a very weak pro-cyclicality.
This feature of the dividend policy becomes more pronounced during crisis, but simultaneously
R2 drops by more than in two out of the three models. For each variable an increase in the value
of the estimated parameter for the period 1991-2008 together with the significant drop in R2 can
be observed. The lower R2 during crisis results from a drop in the scope of a direct response of
dividend policy to variables that were shaping it previously.
These results allow us to conclude that the dividend policy in Japan behaved after 1990 in a
way that was inconsistent with the expected responsiveness to business cycle phases. Despite
contraction of the financial standing of Japanese companies, there was no proportional response
in the earnings distribution pattern. Dividends were maintained at the previous levels, and
associated with bubble economy high growth rates and general prosperity. Accordingly,
Japanese companies started to deplete their resources at the cost of new investment that was
restricted by the credit crunch and general problems in the banking sector. Not only were there
problems with external financing, but also with internally generated capital that was directed for
consumption and not investment. Therefore, there are foundations for another hypothesis and
claims about the role of this rigid dividend policy for prolonging recession and stagnation by
restricting internal sources of investment financing. Additional regression equations, in which
responses of the dividend policy proxies were cast against changes in the structure of
shareholdings, showed that the dividend policy was not statistically affected by this factor.
Vol.5 2010
68
In the second econometric exercise multiple regression was used to test for any potential
evolution of the relationship between dividend policy and private investment in Japan. Due to
data availability, estimations are restricted to variables of the broadest coverage. This means
that sectoral proxies for dividend policy do not enter these regressions due to the lack of data on
sectoral investment. The formal design of the regressions is based on an assumption that private
investment is to some extent an autoregressive process and therefore requires a latent exogenous
observation for investment to capture this fact. One-period lag seems an optimal choice both in
terms of theoretical foundation and the fitness of the model. The following formula for this
phase of the study was used:
(3)
where:
INVt – is the private investment variable in period t,
INVt-1 – is the private investment variable in period t-1,
DIVPOLt – is the dividend policy variable in period t,
and are parameters to be estimated
t – is the standard error term N(0,).
Private investment variable time series for the Japanese economy comes from the International
Monetary Fund database – International Financial Statistics. Dividend policy is described by the
Average Dividend Yield, since this is the only proxy that covers the whole stock market in
Japan. Therefore, the matching of these two variables is the best approach because other proxies
for the dividend policy are available for narrower sectors only. Due to heterogeneity of the
original time series, they were subject to standard de-trending procedure by taking logarithms
and calculating first differences series. ADF test results are provided in Table 5.
tttt DIVPOLINVINV 1
International Journal of Economic Policy Studies
69
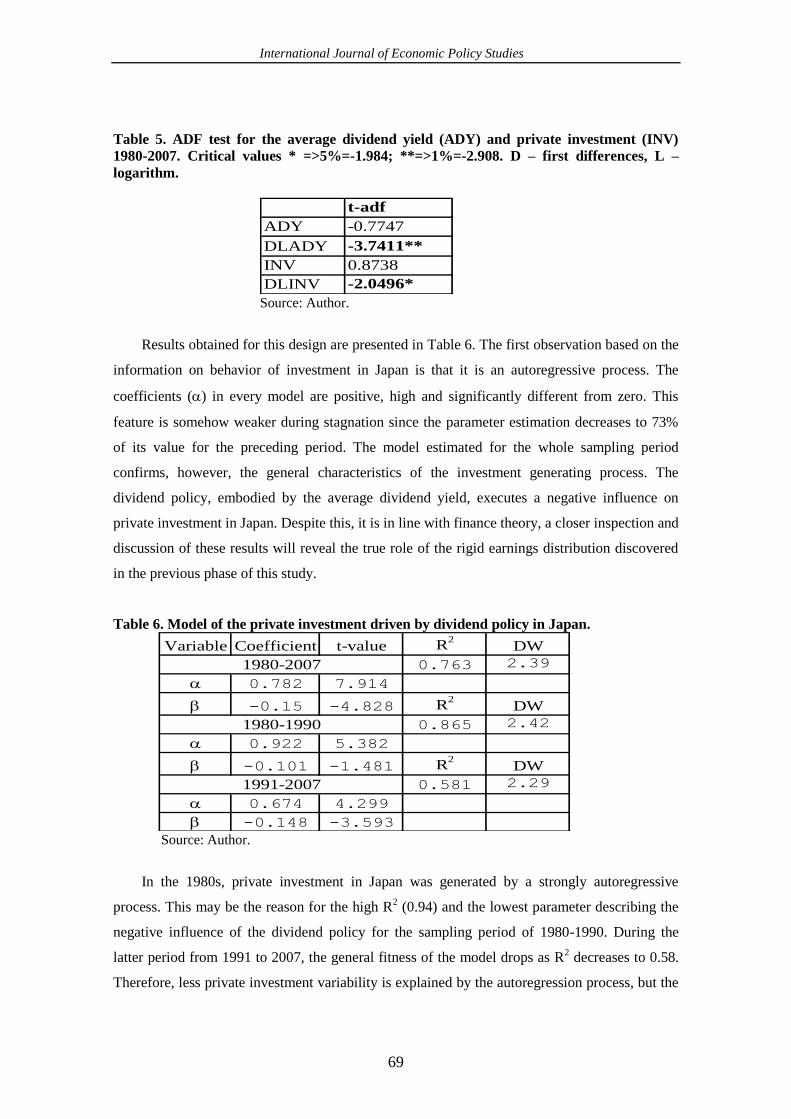
Table 5. ADF test for the average dividend yield (ADY) and private investment (INV)
1980-2007. Critical values * =>5%=-1.984; **=>1%=-2.908. D – first differences, L –
logarithm.
t-adf
ADY -0.7747
DLADY -3.7411**
INV 0.8738
DLINV -2.0496* Source: Author.
Results obtained for this design are presented in Table 6. The first observation based on the
information on behavior of investment in Japan is that it is an autoregressive process. The
coefficients () in every model are positive, high and significantly different from zero. This
feature is somehow weaker during stagnation since the parameter estimation decreases to 73%
of its value for the preceding period. The model estimated for the whole sampling period
confirms, however, the general characteristics of the investment generating process. The
dividend policy, embodied by the average dividend yield, executes a negative influence on
private investment in Japan. Despite this, it is in line with finance theory, a closer inspection and
discussion of these results will reveal the true role of the rigid earnings distribution discovered
in the previous phase of this study.
Table 6. Model of the private investment driven by dividend policy in Japan.
Variable Coefficient t-value R2
DW
0.763 2.39
0.782 7.914
-0.15 -4.828 R2
DW
0.865 2.42
0.922 5.382
-0.101 -1.481 R2
DW
0.581 2.29
0.674 4.299
-0.148 -3.593
1980-2007
1980-1990
1991-2007
Source: Author.
In the 1980s, private investment in Japan was generated by a strongly autoregressive
process. This may be the reason for the high R2 (0.94) and the lowest parameter describing the
negative influence of the dividend policy for the sampling period of 1980-1990. During the
latter period from 1991 to 2007, the general fitness of the model drops as R2 decreases to 0.58.
Therefore, less private investment variability is explained by the autoregression process, but the
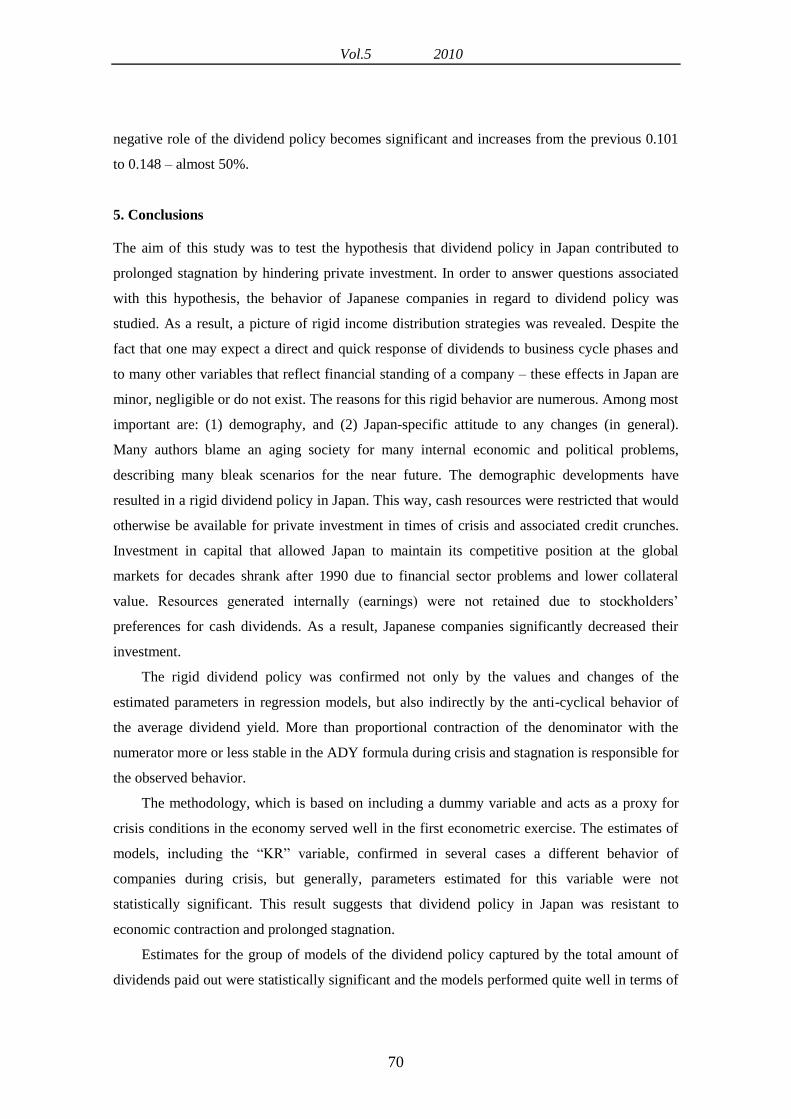
Vol.5 2010
70
negative role of the dividend policy becomes significant and increases from the previous 0.101
to 0.148 – almost 50%.
5. Conclusions
The aim of this study was to test the hypothesis that dividend policy in Japan contributed to
prolonged stagnation by hindering private investment. In order to answer questions associated
with this hypothesis, the behavior of Japanese companies in regard to dividend policy was
studied. As a result, a picture of rigid income distribution strategies was revealed. Despite the
fact that one may expect a direct and quick response of dividends to business cycle phases and
to many other variables that reflect financial standing of a company – these effects in Japan are
minor, negligible or do not exist. The reasons for this rigid behavior are numerous. Among most
important are: (1) demography, and (2) Japan-specific attitude to any changes (in general).
Many authors blame an aging society for many internal economic and political problems,
describing many bleak scenarios for the near future. The demographic developments have
resulted in a rigid dividend policy in Japan. This way, cash resources were restricted that would
otherwise be available for private investment in times of crisis and associated credit crunches.
Investment in capital that allowed Japan to maintain its competitive position at the global
markets for decades shrank after 1990 due to financial sector problems and lower collateral
value. Resources generated internally (earnings) were not retained due to stockholders’
preferences for cash dividends. As a result, Japanese companies significantly decreased their
investment.
The rigid dividend policy was confirmed not only by the values and changes of the
estimated parameters in regression models, but also indirectly by the anti-cyclical behavior of
the average dividend yield. More than proportional contraction of the denominator with the
numerator more or less stable in the ADY formula during crisis and stagnation is responsible for
the observed behavior.
The methodology, which is based on including a dummy variable and acts as a proxy for
crisis conditions in the economy served well in the first econometric exercise. The estimates of
models, including the “KR” variable, confirmed in several cases a different behavior of
companies during crisis, but generally, parameters estimated for this variable were not
statistically significant. This result suggests that dividend policy in Japan was resistant to
economic contraction and prolonged stagnation.
Estimates for the group of models of the dividend policy captured by the total amount of
dividends paid out were statistically significant and the models performed quite well in terms of
International Journal of Economic Policy Studies
71
the level of explained variability (R2) of the dependent variable. The amount of dividends paid
during the period 1991-2008 was 50% weaker pro-cyclical than in the preceding sampling
period. This is interpreted as an increase in rigidity of the dividend policy in crisis. There was a
similar, weaker response to net sales during crises than during the bubble economy; however, it
remained positive and statistically significant. The estimated coefficient for net sales also
confirms increased rigidity of the dividend policy in Japan. After 1990, the size of the company
did not play a statistically significant role for the dividends paid out.
Estimations of models for the non-financial sector with dividends paid, as the endogenous
variable, brought results in line with expectations formulated on the basis of finance theory
regarding the cyclical behavior of dividend policy, dependence on net sales and the influence of
the size of an enterprise. In addition, the positive estimates for the “crisis” dummy variable offer
an interesting interpretation: it is possible to explain this behavior from the point of view of the
prolonged economic stagnation.
The clientele effect seems very strong in Japan. A driving factor for stable cash dividend
policy, no matter the business cycle phase, is its elderly society. It requires support from the
pension system. Pension funds as substantial stockholders, in turn, prefer a stable income from
the capital invested in shares listed at the Tokyo Stock Exchange, and realizing capital gains is
not an option in their case. In addition, pension funds are experiencing a predictable time
structure of their pension-payment liabilities and need to match their income structure
accordingly. The observed anti-cyclical behavior of the average dividend yield confirms that
Japanese companies do not decrease dividends during recession or that any changes in this
dimension are less than proportional to the drop in share prices. As a result, one can observe an
increase in the average dividend yield in Japan during economic recession and decrease in
dividend yield during booms. This behavior was erroneously interpreted by Ho (2003). The gist
of the Ho (2003) study was to show the importance of the external environment for dividend
policy. However, even more important are issues covering the scope of influence of those
external factors on dividend policy and any potential interactions among these factors. For
example, the tax effect that predominates dividend policy in Australia allows for the conclusion
that transaction costs are the main driving force for decisions of investors there. This difference
may be explained by the fact that Australian companies are generally smaller in comparison
with Japanese ones.
Companies in Japan have operated under unfavorable conditions since 1991. They are
forced to maintain a stable level of cash dividend, even when circumstances suggest retaining
earnings for reinvestment and improving efficiency of internal processes to regain a competitive
Vol.5 2010
72
position and move from a recession. It is reasonable to claim that the structure of shareholders
in Japan and their preferences regarding cash dividends are the reasons for the long-lasting
stagnation and the “lost decade”, or one should say, “almost two lost decades”. The inability of
Japanese companies to regain their grip and take the lead in the global markets is due to investor
constrained pension-related payments. Pensioners would probably have no other means to
finance their consumption without cash inflow from pension funds. Therefore, any solution for
the presented problem shall require consideration of this fact. Since this prolonged stagnation
has lasted since 1990 and is emphasized by the recent global financial crisis, the accumulated
losses due to rigidity in dividend policy adjustments may be substantial in terms of productivity,
competitive position in export markets and in terms of lost growth and development
opportunities.
International Journal of Economic Policy Studies
73
REFERENCES
Akerlof, G. 1970. “The Market for 'Lemons', Quality Uncertainty and the Market
Mechanism”, The Quarterly Journal of Economics 84: 488-500.
Ando, A. 2002. “Missing Household Saving and Valuation of Corporations, Inquiry into
Japanese National Accounts I”, Journal of the Japanese and International Economies
16: 147-176.
Ando, A., Christelis, D. and T. Miyagawa. 2003. “Inefficiency of Corporate Investment
and Distortion of Savings Behavior in Japan”, (in Magnus Blomstrom, Jennifer Corbett,
Fumio Hayashi, and Anil Kashyap, eds., Structural Impediments to Growth in Japan),
Chicago and London: The University of Chicago Press: pp. 155-190.
Bank of Japan. 2009, “Outlook for Economic Activity and Prices April 2009”, Bank of Japan
Quarterly Bulletin, Tokyo.
Bayoumi, T. 1999. “The Morning After: Explaining the Slowdown in Japanese Growth in the
1990s”, IMF Working Paper, WP/99/13. International Monetary Fund, Washington D.C.
Chinn, M. and J. Frankel. 2005. “Will the Euro Eventually Surpass the Dollar as Leading
Reserve Currency?”, NBER Working Paper 11510.
Faruqee, H. and M. Mühleisen. 2001. “Population Aging in Japan: Demographic Shock
and Fiscal Sustainability”, IMF Working Paper, WP/01/14, International Monetary Fund,
Washington. D.C.
Feldstein, M. S. and J. Green. 1983. “Why Do Companies Pay Dividends?”, The
American Economic Review 73: 17-30.
Frankfurter, G. M., Wood B. G. and J. W. Wansley. 2003. Dividend Policy: Theory and
Practice, Academic Press.
Frankfurter, G.M. and W.R. Lane. 1992. “The rationality of dividends”, International Review
of Financial Analysis 1: 115-29.
Frankfurter, G.M. and B. Jr. Wood. 2002. “Dividend policy theories and their empirical
tests”, International Review of Financial Analysi 11: 111-38.
Frankfurter, G.M. and B. Jr. Wood. 2003. Dividend Policy: Theory and Practice,
Elsevier/Academic Press, Amsterdam.
Ho, H. 2003. “Dividend Policies in Australia and Japan”, International Advances in Economic
Research, May 1st.
.
Horioka, Ch. 2006. “The Causes of Japan’s ‘Lost Decade’: The Role of Household
Consumption“, Working Paper No. N-002. Center for U.S.-Japan Business and
Economic Studies, The Leonard N. Stern School of Business, New York University,
November.
Horioka, Ch., Suzuki W. and T. Hatta. (2007). “Aging, Saving and Pensions in Japan”, Asian
Economic Policy Review 2: 303-319.
International Monetary Fund. 2009. International Financial Statistics database, January 2009,
Washington D.C.
Jensen, M. C. and W. H. Meckling. 1976. “Theory of the Firm: Managerial Behavior, Agency
Costs and Ownership Structure”, Journal of Financial Economics, No. 4, Oct., 305 – 360.
Jensen, M. 1986. “Agency Costs of Free Cash Flow, Corporate Finance, and Takeovers”,
American Economic Review 76: 323 – 329.
Kanaya, A. and D. Woo. 2000. “The Japanese Banking Crisis of the 1990s: Sources and
Lessons”, IMF Working Paper WP/00/7. International Monetary Fund, Washington D.C.
Kimura, T. 2009. “Financial Problems and Firms’ Pricing Decisions”, Bank of Japan
Working Paper Series, No. 09-E-4.
Kozu, T. , Sato Y. and M. Inada. 2003. “Demographic Changes in Japan and their
Macroeconomic Effects”, Bank of Japan Working Paper Series, No. 04-E-6.
Vol.5 2010
74
Lintner, J. 1956. “Optimal Dividends and Corporate Growth Under Uncertainty”, The
Quarterly Journal of Economics 78: 49-95.
Madsen, R. 2004. “ What Went Wrong: Aggregate Demand, Structural Reform, and the
Politics of 1990s Japan”, UC Berkeley: Berkeley Roundtable on the International
Economy, http://escholarship.org/uc/item/4xk937q7 [Accessed: 15.11.2009]
Makoto, M. and P. Młodkowski. 2009. “Labor Market Response to Monetary Policy in Japan
1957-2008”. Asian Economic Review, forthcoming.
Miller, M. H. and F. Modigliani. 1961. “Dividend Policy, Growth and the Valuation of
Shares”, The Journal of Business 34: 411-433.
Ministry of Health, Labour and Welfare. 2002, Heisei 14-nenban Kouseiroudou Hakusho
White Paper on Health, Labour and Welfare.
Mlodkowski, P. 2010. “A new theory of the crowding–out effect in the open economy”, The
Shogaku Ronso 3 (SERNO.37): 21-40
Posen, A. S. 1998. Restoring Japan’s Economic Growth. Institute for International Economics,
Washington D.C.
Ramaswamy, R. and Ch. Rendu. 1999. “Japan’s Stagnant Nineties: A Vector Autoregression
Retrospective”, IMD Working Paper WP/99/45. International Monetary Fund,
Washington D.C.
Sekine, S. 1999. “Firm Investment and Balance Sheet Problems in Japan”, IMF Working Paper
WP/99/111. International Monetary Fund, Washington D.C.
Shiller, R. J. 1984. “Stock Prices and Social Dynamics”, Brookings Papers on Economic
Activity, 457-510.
Shiller, R. J. 1989. “Fashions, Fads, and Bubbles in Financial Markets”, (in Market Volatility),
Cambridge, Massachusetts: MIT Press.
Suwabe, T. 2006. “Dividend Policy that Boosts Shareholder Value”, Security Analysts Journal,
44: 1-18
The World Bank. 2009. World Development Indicators 2009, Washington D.C.
Tokyo Stock Exchange. 2009. Factbok 2009, Tokyo Stock Exchange Group, Tokyo.
Ugai, H. 2007. “Effects of the Quantitative Easing Policy: A Survey of Empirical Analyses”,
Monetary and Economic Studies, Bank of Japan, March 2007.


