Embed Size (px)
Citation preview
ADDIS ABABA UNIVERSITY SCHOOL OF COMMERCIE
Department of Marketing Management
THE INFLUENCE OF PROMOTIONAL MIX ON BRAND
PREFERENCE: THE CASE OF ORIGIN MINERAL WATER
COMPANY
By: EMAN BASHA
June 2019
Addis Ababa, Ethiopia
THE INFLUENCE OF PROMOTIONAL MIX ON BRAND PREFERENCE:
THE CASE OF ORIGIN MINERAL WATER COMPANY
By: EMAN BASHA
ADVISOR: TEWODROS MESFIN (PhD)
Research proposal submitted to the school of graduate studies of Addis Ababa
University school of commerce in partial fulfillment of the requirement for the
award of master of arts in marketing management
June,2019
Addis Ababa, Ethiopia
ADDIS ABEBA UNIVERSITY
SCHOOL OF COMMERCE GRADUATE STUDIES
MA PROGRAM
THE INFLUENCE OF PROMOTIONAL MIX ON BRAND PREFERENCE:
THE CASE OF ORIGIN MINERAL WATER COMPANY
BY: - EMAN BASHA
Approved by Board of Examiners
______________________ ___________________
Chairman, Department Signature
______________________ ___________________
Advisor Signature
______________________ ___________________
Examiner Signature
Statement Of Certification
This is to certify that Eman Basha has carried out his research work on the
topic entitled The Influence Of Promotional Mix On Brand Preference: The
Case Of Origin Mineral Water Company. The work is original in nature and
is suitable for submission for the award of Master’s Degree in Marketing
Management.
___________________
Adviser: Tewodros Mesfin (PhD)
Date: ____________________
Statement of Declaration
I, Eman Basha here by declared that this thesis titled the influence of promotional mix
on brand preference in the case of origin mineral water Company is my original work.
I have carried out the present study independently with the guidance and support of
the research advisor, Tewodros Mesfin (phd). Any other sources used there in this
study have been duly acknowledged. Moreover, this study has not been submitted for
the award of any degree or other program in this or other university.
Eman Basha signature ----------------- Date--------------------
Confirmed by Advisor signature ----------------- Date--------------------
Tewodros Mesfin (PhD)
Table Contents
Acknowledgement ................................................................................................................................. i
List of Tables ........................................................................................................................................ ii
List of Illustrations ............................................................................................................................... iii
Abstract ................................................................................................................................................ iv
Abbreviations and Acronyms ................................................................................................................ v
CHAPTER ONE ................................................................................................................................. 1
INTRODUCTION ............................................................................................................................... 1
1.1 Background Of The Study .............................................................................................................. 1
1.2 Background Of The Organization ............................................................................................. 4
1.3 Statement Of The Problem ............................................................................................................. 4
1.4 Research Objectives ........................................................................................................................ 5
1.4.1 General Objective ........................................................................................................................ 5
1.4.2 Specific Objectives ...................................................................................................................... 5
1.5 Research Questions ................................................................................................................... 6
1.5.1 General Questions ....................................................................................................................... 6
1.6 Significance Of The Study ........................................................................................................ 6
1.7 Scope Of The Study .................................................................................................................. 6
1.8. Limitation Of The Study ........................................................................................................... 7
1.9 Organization Of The Study ............................................................................................................. 7
1.10. Definition Of Terms ..................................................................................................................... 7
CHAPTER TWO ................................................................................................................................ 9
REVIEW OF RELATED LITERATURE ........................................................................................ 9
2.1 Theoretical Literature Review ....................................................................................................... 9
2.1.1 History And Implementation Of Marketing Mix ......................................................................... 9
2.1.2 Marketing Communications Concept ....................................................................................... 10
2.1.3 Promotional Mix ........................................................................................................................ 11
2.1.4 Integrated Marketing Communication Planning Process .......................................................... 15
2.1.5 Brand and the Branding concept ................................................................................................ 16
2.1.6 Brand Preference ........................................................................................................................ 17
2.1.7 The bottle water industry .................................................................................................... 20
2.2 Empirical Literature Review ................................................................................................... 22
2.3 Conceptual Framework and Hypothesis ....................................................................................... 26
2.3.1 Conceptual Framework .............................................................................................................. 26
2.3.2 Research Hypotheses ................................................................................................................. 27
CHAPTER THREE .......................................................................................................................... 28
RESEARCH METHODOLOGY .................................................................................................... 28
3.1 Research approaches ............................................................................................................... 28
3.2 Research Design...................................................................................................................... 28
3.3 Target Population .......................................................................................................................... 29
3.4 Sampling Frame ............................................................................................................................ 29
3.5 Sampling Techniques .................................................................................................................... 29
3.6 Sample Size ................................................................................................................................... 29
3.7 Sources of Data and Data Collection Techniques................................................................... 30
3.8 Data collection Methodology .................................................................................................. 31
3.9 Questionnaire Design .................................................................................................................... 31
3.10 Data Analysis Techniques ........................................................................................................... 31
3.10.1 Validity and Reliability ....................................................................................................... 31
3.10.2 Validity ..................................................................................................................................... 31
3.10.3 Reliability ................................................................................................................................. 32
3.11 Ethical Considerations ............................................................................................................ 32
CHAPTER FOUR ............................................................................................................................. 33
DATA ANALYSIS AND DISCUSSSION ....................................................................................... 33
4.1. Demographics of the Respondents ............................................................................................... 33
4.2 ONMW Awareness Information Collected From Respondent ..................................................... 35
4.3 Validity and Reliability Test ......................................................................................................... 36
4.4 Descriptive Statistics Results of variables .................................................................................... 37
4.5 Normality test................................................................................................................................ 40
4.6 Pearson correlation Analysis ......................................................................................................... 41
4.7 Regression Analysis ...................................................................................................................... 42
4.7.1. Multi-collinearity Analysis ....................................................................................................... 42
4.7.2 Homoscedasticity Assumptions ................................................................................................. 43
4.7.3 Multiple regression analysis ....................................................................................................... 44
4.9 Hypothesis Testing ........................................................................................................................ 47
CHAPTER FIVE ............................................................................................................................... 49
Summary, Conclusion and Recommendation ................................................................................ 49
5.1 Summary of major finding ............................................................................................................ 49
5.2 Conclusion .................................................................................................................................... 51
5.3 Recommendation .......................................................................................................................... 52
5.3 Further Area Of Study .................................................................................................................. 53
Reference ............................................................................................................................................ 54

Appendix A.......................................................................................................................................... 63
Appendix B : SPSS Result .................................................................................................................... 66
i
Acknowledgement
I would first like to thank The Almighty God for helping me do this research, giving me good
health throughout and providing all the resources and support I required to do this work. I am
gratefully indebted to my thesis supervisor DR. Tewodros M. for his valuable supervision
through timely, useful, and insightful feedback, his availability, support, and commitment to
helping me successfully complete this thesis. Without his passionate participation and input,
this research could not have been successfully conducted. I also acknowledge my parents for
their prayers and support towards this project.
ii
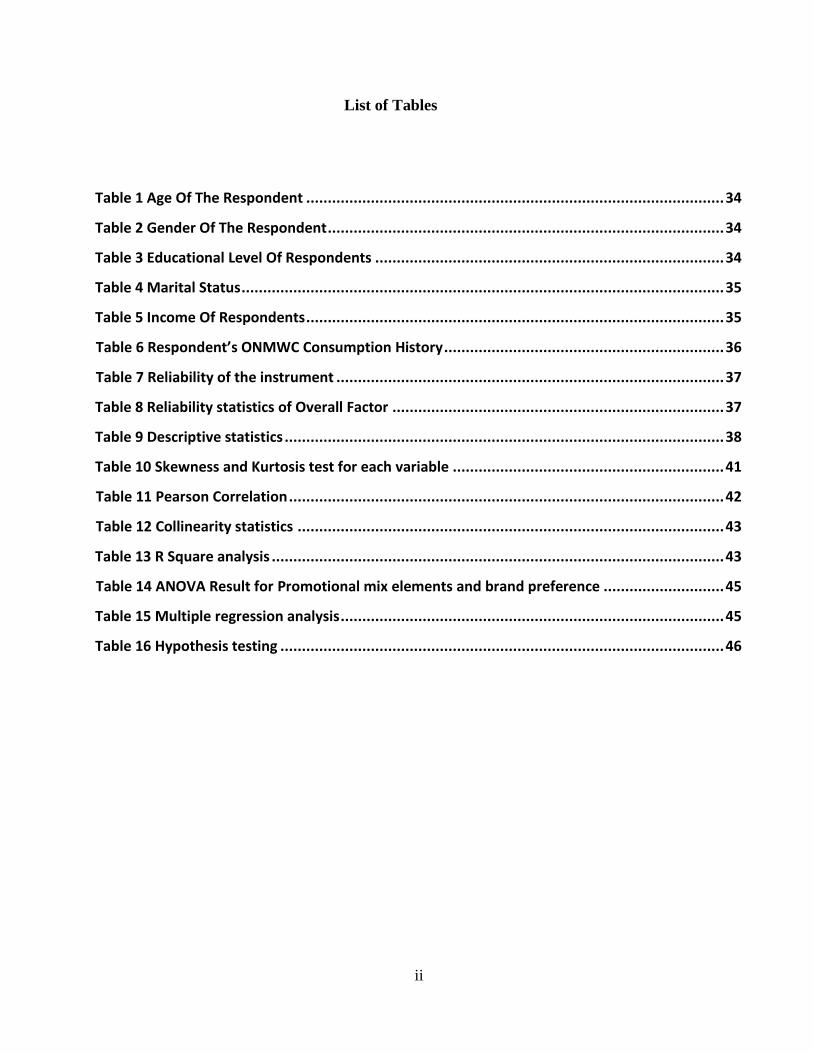
List of Tables
Table 1 Age Of The Respondent ................................................................................................. 34
Table 2 Gender Of The Respondent ............................................................................................ 34
Table 3 Educational Level Of Respondents ................................................................................. 34
Table 4 Marital Status ................................................................................................................ 35
Table 5 Income Of Respondents ................................................................................................. 35
Table 6 Respondent’s ONMWC Consumption History ................................................................. 36
Table 7 Reliability of the instrument .......................................................................................... 37
Table 8 Reliability statistics of Overall Factor ............................................................................. 37
Table 9 Descriptive statistics ...................................................................................................... 38
Table 10 Skewness and Kurtosis test for each variable ............................................................... 41
Table 11 Pearson Correlation ..................................................................................................... 42
Table 12 Collinearity statistics ................................................................................................... 43
Table 13 R Square analysis ......................................................................................................... 43
Table 14 ANOVA Result for Promotional mix elements and brand preference ............................ 45
Table 15 Multiple regression analysis ......................................................................................... 45
Table 16 Hypothesis testing ....................................................................................................... 46
iii
List of Illustrations
Iluustration 1: Integrated Marketing Communication Planning Process………………….. ..………15
Iluustration 2: Conceptual Frame work……………………………………………………………...26
iv
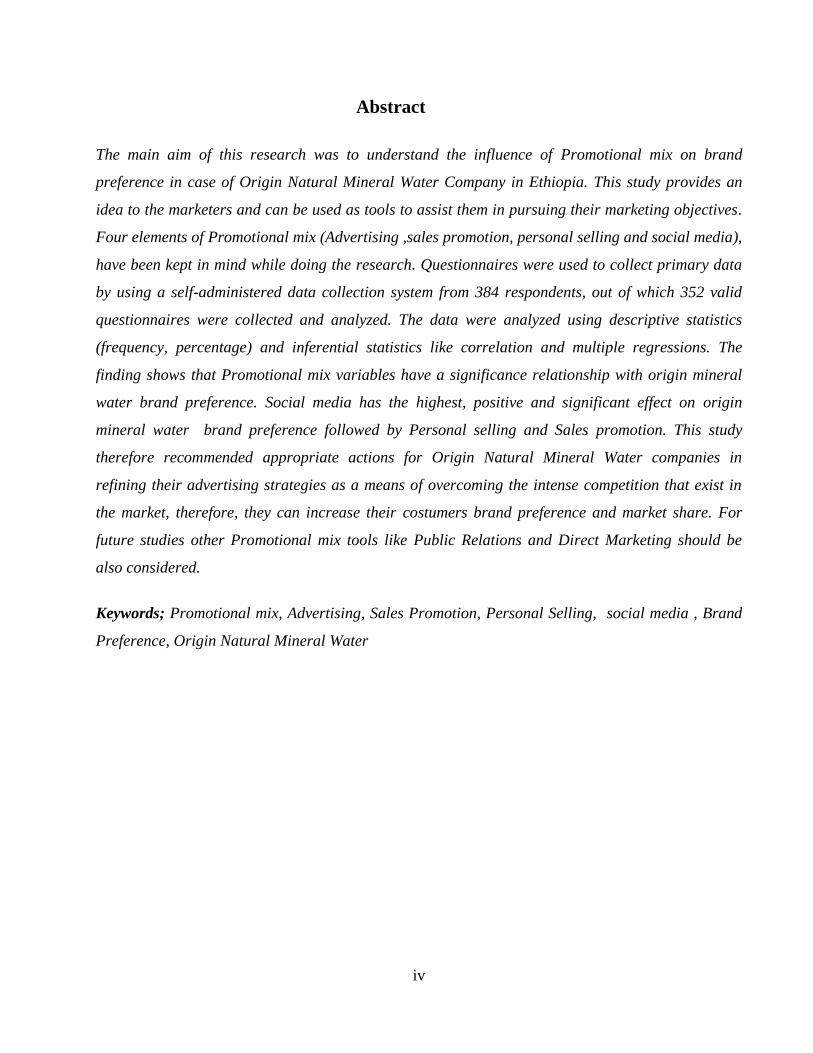
Abstract
The main aim of this research was to understand the influence of Promotional mix on brand
preference in case of Origin Natural Mineral Water Company in Ethiopia. This study provides an
idea to the marketers and can be used as tools to assist them in pursuing their marketing objectives.
Four elements of Promotional mix (Advertising ,sales promotion, personal selling and social media),
have been kept in mind while doing the research. Questionnaires were used to collect primary data
by using a self-administered data collection system from 384 respondents, out of which 352 valid
questionnaires were collected and analyzed. The data were analyzed using descriptive statistics
(frequency, percentage) and inferential statistics like correlation and multiple regressions. The
finding shows that Promotional mix variables have a significance relationship with origin mineral
water brand preference. Social media has the highest, positive and significant effect on origin
mineral water brand preference followed by Personal selling and Sales promotion. This study
therefore recommended appropriate actions for Origin Natural Mineral Water companies in
refining their advertising strategies as a means of overcoming the intense competition that exist in
the market, therefore, they can increase their costumers brand preference and market share. For
future studies other Promotional mix tools like Public Relations and Direct Marketing should be
also considered.
Keywords; Promotional mix, Advertising, Sales Promotion, Personal Selling, social media , Brand
Preference, Origin Natural Mineral Water
v
Abbreviations and Acronyms
AMC American Marketing Association
PM Promotional Mix
MCPF Marketing Communications Planning Framework
BP Brand Preference
ONMWC Origin Natural Mineral Water Company
SPSS Statistical Package For Social Sciences
IMC
Integrated Marketing Communications
1
CHAPTER ONE
INTRODUCTION
1.1 Background Of The Study
A dynamic nature of 21th century markets leads to the existence of competition in different products
and services market. On the other hands , the companies promotional tools which are used to
communicate with customers will also plays a major role for customers brand preferences in
different types of industries. This is because that the right Integrated marketing communication tools
delivery contributes for the profitability, success as well as for the good will of any company.
Integrated marketing communication is defined by Naeem et.al.(2013), as "concept of marketing
communication planning that combine and evaluate strategic role of different communication
discipline to get the clarity, consistency and greater impact" (pp125). The IMC process starts with
the customer and works in a way that defines and finds methods and forms that are developed to
influence various communication programs. The integration aspect of marketing communication
comes with the aim of delivering consistent and complementary messages across various elements
of the promotion mixes. According to belch & belch (2003), the tools for IMC which are considered
as promotion mixes are advertising, direct marketing, interactive/internet marketing, sales
promotion, publicity/public relations and personal selling.
Integrated marketing communication has been defined as a process for planning, executing
and monitoring the brand messages that create customer relationships (duncan, 2005).
Marketing communication has also been defined as the coordination and integration of all
marketing communication tools, avenues and sources within a company into a seamless
program that maximizes the impact on consumers and other end users at a minimal cost (clow
& baack, 2007).
Integrated marketing communication therefore represents the voice of a brand and the means
by which companies can establish a dialogue with consumers concerning their product
offerings. It allows marketers to inform, persuade, incite, and remind consumers. It can provide
detailed product information or ignore the product all together to address other issues (keller,
2
2001). The brand is rarely managed and coordinated coherently, with a long-term strategic vision as
farquar (1989) indicates that it can be used to increase the value of the product.
Brand preference features in most of the major texts on brands and brand strategy. It has also been
considered by different authors; however, unlike the lack of consensus on the definition of brand,
different scholars revolve around the same concept when defining brand preference.
In addition, hellier, geursen, carr, & rickard (2003) define it as the extent to which a consumer
makes purchasing decisions based on a name rather than the quality of a product or the price. These
authors agree that brand preference is created from consumers’ differentiation and comparisons
between various alternatives of brands considered by them. It is regarded as a very important
concept in business practice as well as in academic research because marketers can gain competitive
advantage through successful brands. The competitive advantage of firms that have brands with high
equity includes the opportunity for successful extensions, resilience against competitors’
promotional pressures, and creation of barriers to competitive entry (farquhar, 1989).
A brand shows the meaning and direction of any product and identify product with due to time and
space. Brand may have several components including brand name, brand image, logo, design,
packaging and promotion. Brand choice or brand behavior are the word which are used
interchangeably for brand preference which means that to identify the consumer choice among
different brands. Consumer brand preference is linked with brand loyalty, which means repurchase
again and again by long period of time (ghose & lowengart, 2013). Brand involvement is the level of
interest by consumer to purchase a specific brand and loyal with this brand.
Duncan (2005:15) acknowledges that integrated marketing communication can add value for
customers, because customers need to be informed on aspects, such as the features and potential
benefits of a product, where it can be bought, and whether it is a well-known brand with a good
reputation, or whether it has already formed a positive association in the minds of the consumers. In
other words, marketing communication can influence the target audiences’ perceptions of crucial
features and symbolic associations that are superior to those of the competitors.
3
Marketing communication has become an integral part of the social and economic system
everywhere in the world. A producer believes, Consumers rely on the information from marketing
communication to make wise purchase decisions by preferring a specific brand. Businesses, ranging
from multinational corporations to small retailers, depend on marketing communication to sell their
goods and services. Marketing communication has become an important player in the life of a
business. It helps to move products, services, and ideas from manufacturers to end users, builds and
maintains relationships with customers, prospects, and other important stakeholders in the company.
Olakunori (1986:101) said that advertising as an indispensable component or aspect of integrated
marketing communication has continued to pay a vital role in brands of products. According to him,
a product without promotion is like music without tune. Sales promotions include techniques that
organizations can use as part of their marketing effort (Jobber and Lancaster, 2006). The importance
of sales promotions has increased since 1960, as has the sophistication of methods used. It is
sometimes implied that sales promotion is a peripheral marketing activity, but companies
increasingly realize the importance of a well-planned and coordinated programmer of sales
promotion.
According to New York state department of health, Bottled water can be defined as any product,
including natural spring or well water, taken from municipal or private utility systems or other water,
distilled water or any the foregoing to which chemicals may be added, which are put in to sealed
bottles, packages or other containers, to be sold for domestic consumption or culinary use.
As the level of competition keep on increasing in the bottled water market, it is essential for every
bottled water producer companies to understand customer insight in order to further increase their
share of wallet. Thus they need to understand what factors might influence their customers‟ decision
on purchasing a bottled water.
Currently in Ethiopia, the demand for bottled water is increasing. Changing in lifestyle, the
perceived impurity of tap water and the perceived purity of bottled water can be considered as the
cause for the demand increase. The expansion of bottled water companied is also the other cause
driving force for the growing demand. This rapidly growing market will make the competition
4
environment; the way by which companies win the competition is by analyzing the factors that
consumers perceived to be important in their purchasing decision. (Gedamnesh, 2013)
1.2 Background Of The Organization
ORIGIN Natural Mineral Water Company (ONMWC) was established in 2000 .Origin Natural
Mineral Water Factory is located in Oromia region, Alemgena town along the Addis Butajira road
exactly 21kms from the capital city of Ethiopia, Addis Ababa. With a plot size of 20,000 square
meters, ONMWC started the development of the site by ensuring that the ecosystem was
environmentally friendly and also developed an impressive green area, to bring back the badly
affected fauna and flora that once use to live there.
ONMWC is one of the most popular and fast-growing food and beverage factories in Ethiopia. It is
among the leading companies in providing the best-Natural mineral water to the consumer. The
brand has gained recognition in a very short space of time in manufacturing origin natural mineral
water. The revolution in drinking bottled natural mineral water has witnessed the consumption of
natural mineral water leap forward, coinciding with the origin's newest packaging, pack sizes and
product range. The superior quality and product safety is the main reason behind the increasing
market share. It has helped them in touch new heights and register high sales volumes. The superior
quality, safety and reliability of their products create consumer and company confidence.
1.3 Statement Of The Problem
In today's competitive environment, organizations must constantly communicate with current and
potential stakeholders, to offer high quality products and / or services, to establish attractive prices
and to facilitate their access to customers. Therefore, integrated marketing communication is the
focus of all these activities, given that consumer perceptions and attitudes towards certain products
and / or services may be influenced by communicational messages sent by the company (Yeboah
and Atakora, 2013).
As the market is saturated by products and / or services, most companies try to differentiate
themselves by providing information on their functional attributes through communicational
5
messages. However, these features have become very easy to be copied by competitors. Therefore,
the challenge to differentiate lies with the marketers and communication specialists, who shall
transmit these emotional and/or rational values that can influence the purchasing behavior of
consumers. In this regard, identifying those external stimuli that could become key factors in
designing a communicational message and that can therefore, influence consumer’s decision and
choice to purchase a product represents a strategic aspect.
A bottled water industry has been one of the dominant contributor in many economies in Ethiopia
in last decade where by employing thousands of people and generating huge revenue to the national
economy . Due to a higher revenue generation as well as the needs of businessman and investors to
indulge in bottled water manufacturing businesses, it’s been observed that the country has many
bottled water manufacturers with different brands as well. Hence the larger brand name
availabilities is also another factor that contributes a lees brand preferences the products by
consumers. Therefore , the right promotional mix communication tools which are implemented by
companies are vital for the success of their business. The consumer perception of origin mineral
water brand is that the sodium content is very high and salty. But the company has changed the
content of the water. origin mineral water brand can Change the consumer perception by creating
awareness through this promotional mix if it is used appropriately by the company. Does this
promotional mix commutation technique influence the consumer brand preference ? The above
problem statement is in context of ONMW, the issue is to evaluate the current campaign of
ONMW;to examine if the promotional mix used by the company is really helping the product to
make a positive change in the consumer brand preference.
1.4 Research Objectives
1.4.1 General Objective
Generally, the main objective of this research is to investigate the influence of promotional mix on
the customer brand preference of ONMWC.
1.4.2 Specific Objectives
Specifically, the study has the following objectives;
1. To examine the effectiveness of advertising activities on the brand performance of the
ONMWC.
6
2. To assess the effectiveness of Sales Promotion activities on the brand performance of
ONMWC.
3. To assess the effectiveness of personal selling on the brand performance of the ONMWC.
4. To assess the effectiveness of social media on consumer brand preference on ONMWC.
1.5 Research Questions
1.5.1 General Questions
The study was aimed at find the influence of promotional mix on the brand preference of
ONMWC.
1.5.2 Specific Research Questions
Therefore, the study has the following specific research questions;
1. What is the influence of advertisement activities of ONMWC brand performance?
2. What effect do Sales Promotion activities affect the brand performance of the ONMWC?
3. How does direct personal selling affect brand performance of the ONMWC?
4. What are the effects of social media on consumer brand preference on ONMWC?
1.6 Significance Of The Study
The study will have significant contribution to the Ethiopian water manufacturers and specifically to
the origin water company in the current marketing communication tools in promoting its brand
performance. It is also expected to provide recommendations for the improvement areas to be
implemented to minimize the identified and stated problems and challenges. The findings and
results is expected to contribute effective recommendations with regard to the choices and
application of tools among the existing marketing communications tools as well as the water
manufacturers by which the research questions will present valuable information that led decision
taken on switching of brand preferences by previous customers.
1.7 Scope Of The Study
Geographically the population of the study is limited to Addis Ababa, capital city of Ethiopia. In
order to achieve a more focused study and in light of limited financial resource. Conceptually the
general definition of promotional mix spans cover a wide spectrum of tools (advertising, public
7
relations, direct marketing, sales promotions, personal selling and Internet Marketing and Service
Outlets ). But this research strictly concerned itself in investigating the effectiveness of marketing
tools such as Advertisement, personal selling, sales promotion and social Media, on consumers
brand preference since origin mineral water brand.Methodologically, explanatory research and
quantitative approach is used to assess the relationship between promotional mix and brand
preference.
1.8. Limitation Of The Study
The study was mainly focused only on origin mineral water company.Lack of adequate reference
material conducted in similar study in the country as well as insufficient time allocated to complete
the study exerted significant challenges for the researcher to make a thorough investigation.
1.9 Organization Of The Study
The presentation of the study was organized in five parts. The first chapter provides a brief
introduction of including background of the study, statement of the problem, basic research
questions, objectives of the study and significance and scope of the study. The second chapter deals
with different literatures written on the subject matter as well as empirical results.
Chapter three presents the research methodology that was used to actualize the study objectives by
establishing the research design , the population and sampling design, data collection method,
research procedures and data analysis methods.
Chapter four narrated the results and findings while chapter five presented thorough discussion on
the findings of the research as guided by the specific research objectives, and chapter five included
conclusion and recommendation of the study is given.
1.10. Definition Of Terms
Integrated Marketing Communication (IMC) – “The concept under which a company carefully
integrates and coordinates its many promotional communications channels to deliver a clear and
consistent message” (Kotler and Armstrong 1997, p. 427).
8
Advertising: Any paid form of non-personal presentation and promotion of ideas, goods, or services
by an identified sponsor via print media, broadcast media, network media, electronic media, and
display media (Kotler & Keller, 2012). In this research the effect of advertising is expressed in terms
of the subjective perceptions of consumers about how high a brand is spending on advertising (Yoo
et al., 2000).
Sales Promotions:- sales promotion is a form of indirect advertisement, designed to stimulate sales
mainly by the use of incentives. Examples of such incentives include free sample, twin-pack bargain,
temporary price reduction, special discount bonus, etc. (Adebisi and Babatunde, 2011).
Personal Selling: -Personal selling, according to Jobber (2001), is the marketing task involving face-
to-face contact with a customer.
Social media: Form of electronic communication (as Web sites for social networking and micro
blogging) through which users create online communities to share information, ideas, personal
messages, and other content (as videos). (Merriam Webster- an encyclopedia Britannica Company.)
Brand preference: is the degree of brand loyalty in which a customer definitely prefers one brand
over competitive offerings and will purchase this brand if it is available. Dibb et al (2006).
9
CHAPTER TWO
REVIEW OF RELATED LITERATURE
2.1 Theoretical Literature Review
2.1.1 History And Implementation Of Marketing Mix
Borden (1965) claims to be the first to have used the term “marketing mix” and that it was suggested
to him by Culliton’s (1948) description of a business executive as “mixer of ingredients”. An
executive is “a mixer of ingredients, who sometimes follows a recipe as he goes along, sometimes
adapts a recipe to the ingredients immediately available, and sometimes experiments with or invents
ingredients no one else has tried” (Culliton, 1948). Rasmussen (1955) then developed what became
known as parameter theory. He proposes that the four determinants of competition and sales are
price, quality, service and advertising. Mickwitz(1959) applies this theory to the Product Life Cycle
Concept.
Borden’s original marketing mix had a set of 12 elements namely: product planning; pricing;
branding; channels of distribution; personal selling; advertising; promotions; packaging; display;
servicing; physical handling; and fact finding and analysis. Frey (1961) suggests that marketing
variables should be divided into two parts: the offering (product, packaging, brand, price and
service) and the methods and tools (distribution channels, personal selling, advertising, sales
promotion and publicity). On the other hand, Lazer and Kelly (1962) and Lazer, Culley and
Staudt(1973) suggested three elements of marketing mix: the goods and services mix, the
distribution mix and the communication mix. McCarthy (1964) refined Borden’s (1965) idea further
and defined the marketing mix as a combination of all of the factors at a marketing manger’s
command to satisfy the target market. He regrouped Borden’s 12 elements to four elements or 4Ps,
namely product, price, promotion and place at a marketing manger’s command to satisfy the target
market.
Especially in 1980s onward, number of researchers proposes new ‘P’ into the marketing mix. Judd
(1987) proposes a fifth P (people). Booms and Bitner (1980) add 3 Ps (participants, physical
evidence and process) to the original 4 Ps to apply the marketing mix concept to service. Kotler
(1986) adds political power and public opinion formation to the Ps concept. Baumgartner (1991)
suggests the concept of 15 Ps. MaGrath (1986) suggests the addition of 3 Ps (personnel, physical
10
facilities and process management). Vignalis and Davis (1994) suggests the addition of S (service)
to the marketing mix. Goldsmith (1999) suggests that there should be 8 Ps (product, price, place,
promotion, participants, physical evidence, process and personalization).
Möller (2006) presents an up-to-date picture of the current standing in the debate around the Mix as
marketing paradigm and predominant marketing management tool by reviewing academic views
from five marketing management sub-disciplines (consumer marketing, relationship marketing,
services marketing, retail marketing and industrial marketing) and an emerging marketing (E-
Commerce) . Most of researchers and writers reviewed in these domains express serious doubts as to
the role of the Mix as marketing management tool in its original form, proposing alternative
approaches, which is adding new parameters to the original Mix or replacing it with alternative
frameworks altogether.
2.1.2 Marketing Communications Concept
A concept of marketing communications planning that recognizes the added value of
comprehensive plan that evaluates the strategic roles of a variety of communication disciplines – for
example, general advertising, direct response, sales promotion, and public relations – and combines
these disciplines to provide clarity, consistency, and maximum communications impact (Schultz et
al. 1993, 17).
According to Schultz, an Marketing Communications plan is created not only to transmit a
consistent message about the company and its customers but also to choose the most effective
methods for communicating and building relationship with the current and potential customers.
Moreover, Belch and his co-writer also identified some reasons that led to the success of Marketing
Communications in the modern marketing theory.
Mass media which used to be the main method of advertising chosen by many marketers has been
replaced by other forms of promotion which is more of the consumer-orientation. This change helps
to reduce the advertising cost since the traditional media advertising were expensive.
11
Since the mass media just aimed at the increase in sales figures, new promotion tools such as event
marketing, sponsorships, direct mail, etc. offer companies chances of solving most of the
communication problems.
The information technology development has been supporting the processing database marketing.
All of the elements of customer profiles are saved and used to address target customers for the new
marketing methods.
The increasing demands for greater accountability from advertising agencies and how much they are
compensated is also one reason. Nowadays, the compensation advertising agencies receive depends
on the market sales, share and profitability. As a result, these agencies, by all means, provide their
clients with the most cost-effective IMC plan.
The rapid growth of the Internet as well as social networks such as twitter, Facebook, etc. offer
companies chances of getting closer to their customers in a interactive manner (Belch et al. 2011,
13-14)
The mentioned reasons for the growth of IMC applying indicates the significant role of IMC plan in
marketing strategies of many companies. Therefore, it is important to learn more about the available
promotional tools and its advantages and disadvantages in general.
2.1.3 Promotional Mix
Promotional mix refers to marketing communications mix. In service marketing, in addition to
traditional marketing channels such as advertising, public relations, direct marketing, sales
promotions, personal selling and Internet, many messages from service providers are transmitted
through their own service delivery channels, e.g. front line staff, service outlets and self-service
delivering points. All of the tools are discussed in details below.
Advertising
Advertising is defined as a paid form of non-personal communication about companies and their
products/services (Belch et al. 2001, 15). This best-know form of promotion includes a wide range
of advertising media such as broadcast with TV and radio, print with magazines and newspapers and
12
many other types of outdoor media such as posters, billboards, electronic message boards, transits,
etc. (Lovelock et al. 2011, 196).
Advertising is mostly used to grab the attention of a large group of individuals. The most relevant
advantage of this mass media type is to create quickly and intentionally the brand image and the
symbolic appeal of certain products/services (Belch et at. 2001, 15). However, the fact that
thousands of advertisements are being produced everyday has put advertisers and their team under
pressure of making an ad that is out-standing and does not make audiences consider themselves to be
bombarded.
Public Relations
Public relations includes news releases, press conferences, articles, photographs, etc. which are
about the company, its products/services, and its employees, mainly concerning the credibility. In
some cases, companies can gain the publicity by getting the media to cover a favorable story on its
offerings to affect the awareness, knowledge, opinions and behaviors (Belch et al. 2001, 22).
Furthermore, sponsorship and other special events such as fundraising, community activities, etc. are
also listed in the public relations techniques.
Direct Marketing
Direct marketing is a promotional tool in which companies communicate directly with their target
customers in the attempt to receive a response or generate a transaction (Belch et al. 2001, 17). This
form of promotion consists of mailings, e-mails, mail-order catalogs, telemarketing and direct-
response ads. Using this tool, companies are required to have a sufficient database of information
about customers (Lovelock et al. 2011, 195). In return, customer relationship is built up quickly and
effectively thanks to the reach of direct marketing since the lifestyle of people has been changing.
They do not have time for in-store shopping but always need updating.
Sales Promotion
Sales promotion is a marketing activity which provides extra values or incentives to sales force,
distributors or consumers. The increase in sales volume or the profit gain after sales promotion
13
campaign can be stimulated quickly (Belch et al. 2001, 21). Sales promotion normally comes in
form on samples, coupons, discounts, gifts and competitions with prizes (Lovelock et al. 2011, 198).
The purpose of these forms is to generate immediate purchase with customers or increase the
volume in each purchase and in frequency of using.
Personal Selling
Personal selling is set up in the attempt to educate customers and promote preference for a particular
brand or products (Lovelock et al. 2011, 199). This marketing activity helps to enhance customer
satisfaction which is the main focus of relationship building between companies and their customers.
Moreover, personal selling offers advantages over other forms of marketing communication in such
situations where customers need more explanations to certain complex information. However, this
marketing activity can reach a small number of customers and would be expensive from the labor-
extension aspect (Cant et al. 2004, 24).
Interactive/ Internet Marketing
Internet marketing generally has the flow of information transferred back and forth between
companies and their customers. As a result, the audiences can customize their received information
and choose what they are interested in; therefore, they can make their own purchasing decisions or
giving feedbacks (Belch et al. 2001, 19). The company’s website is one of the internet tools in a
marketing plan. Through its website, a company operates a wide range of communication tasks such
as promoting customer awareness, providing information about its product/service, receiving
responses from customers and measuring the effectiveness of an advertising campaign. Online
advertising is another form of internet marketing in which companies pay to place their advertising
banner on famous websites like Yahoo or CNN or to see what customers need through search engine
advertising (Lovelock et al. 2011, 200).
14
Service Outlets
Besides marketing channels which traditionally serve as tools to transmit the messages from
companies to their customers, delivery channels also offer such function. Based on the nature of
services, promotion and consumption take place simultaneously. Both service providers and
consumers participate in service production at a specified location, which also allows the message to
be transmitted (Rao 2011, 292). Service outlet is one of the options for marketers who plan to use
delivery channels as a marketing tool. The physical design of the service outlet can help to send the
message to customers by catching customer off-guard with some visual elements of both interiors
and exteriors (Lovelock et al. 2011, 203).
Frontline Employees and Customer Training
Employees in frontline positions are in charge of communicating with customers face-to-face. With
direct contacts, the frontline employees can offer many supplementary services including providing
information, taking reservations, receiving payments and solving problems. Some companies’
frontline employees Also carry out the customer training function. This function helps to familiarize
customers with the offered products/services. The more professional frontline employees are, the
higher the success in attracting new customers who tend to rely on frontline staff for help in learning
how to use a servie is (Lovelock et al. 2011, 203).
Self-service Delivery Points
Self-service delivery points normally are operated through vending machines and websites where
customers produce their own service based on the instructions provided by service providers. The
main factor that determines if the message is transmitted effectively to current and potential
customers is how clear and detailed the instructions are designed to show customers how to operate
the service (Lovelock et al. 2011, 203).
15
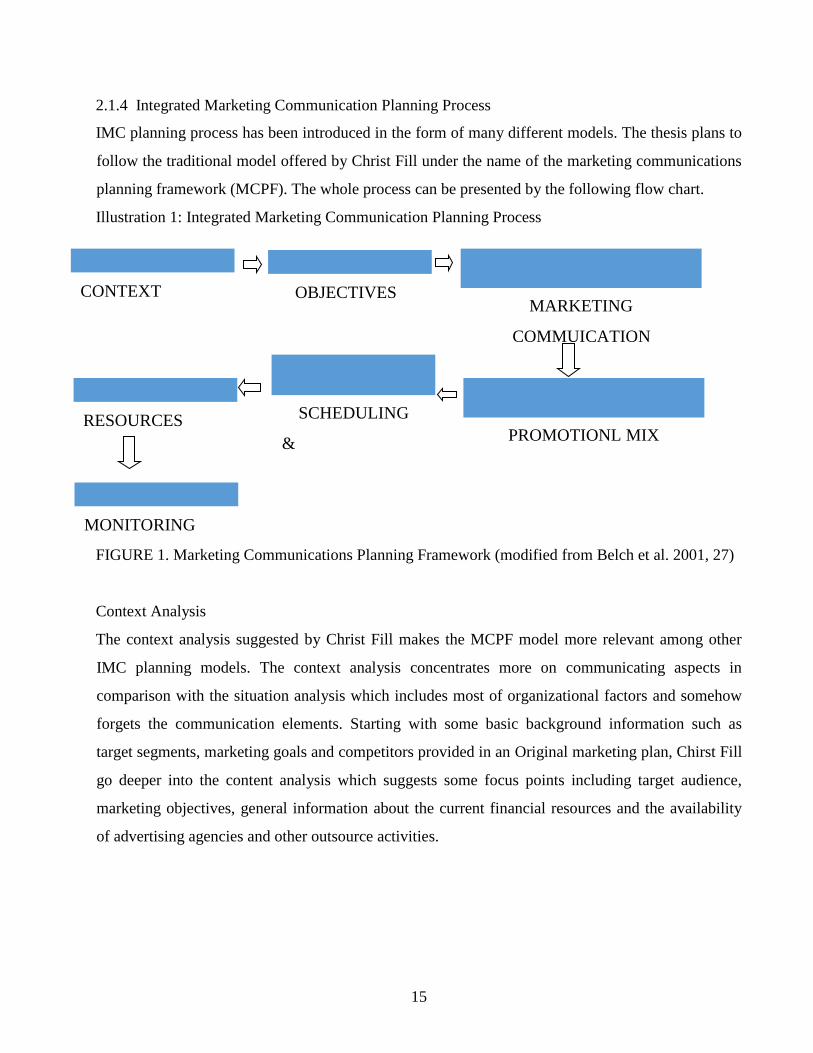
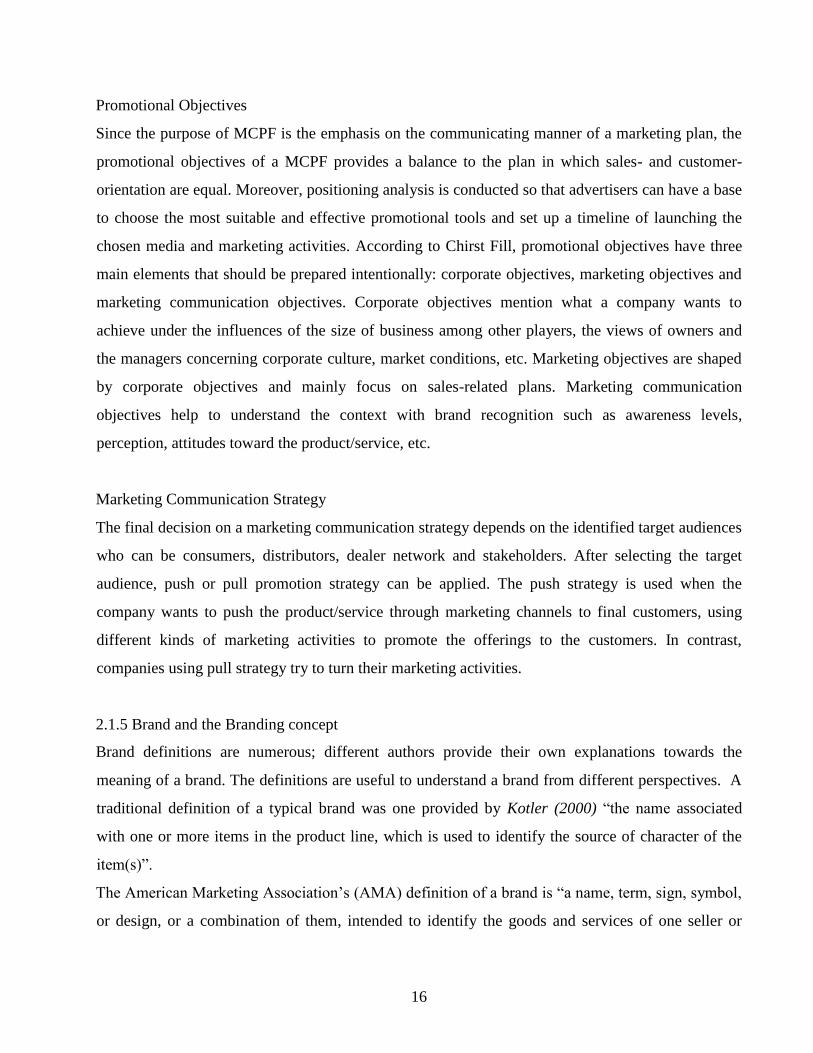
2.1.4 Integrated Marketing Communication Planning Process
IMC planning process has been introduced in the form of many different models. The thesis plans to
follow the traditional model offered by Christ Fill under the name of the marketing communications
planning framework (MCPF). The whole process can be presented by the following flow chart.
Illustration 1: Integrated Marketing Communication Planning Process
FIGURE 1. Marketing Communications Planning Framework (modified from Belch et al. 2001, 27)
Context Analysis
The context analysis suggested by Christ Fill makes the MCPF model more relevant among other
IMC planning models. The context analysis concentrates more on communicating aspects in
comparison with the situation analysis which includes most of organizational factors and somehow
forgets the communication elements. Starting with some basic background information such as
target segments, marketing goals and competitors provided in an Original marketing plan, Chirst Fill
go deeper into the content analysis which suggests some focus points including target audience,
marketing objectives, general information about the current financial resources and the availability
of advertising agencies and other outsource activities.
RESOURCES
CONTEXT
ANALYSIS
OBJECTIVES
MARKETING
COMMUICATION
SCHEDULING
&
PROMOTIONL MIX
MONITORING
16
Promotional Objectives
Since the purpose of MCPF is the emphasis on the communicating manner of a marketing plan, the
promotional objectives of a MCPF provides a balance to the plan in which sales- and customer-
orientation are equal. Moreover, positioning analysis is conducted so that advertisers can have a base
to choose the most suitable and effective promotional tools and set up a timeline of launching the
chosen media and marketing activities. According to Chirst Fill, promotional objectives have three
main elements that should be prepared intentionally: corporate objectives, marketing objectives and
marketing communication objectives. Corporate objectives mention what a company wants to
achieve under the influences of the size of business among other players, the views of owners and
the managers concerning corporate culture, market conditions, etc. Marketing objectives are shaped
by corporate objectives and mainly focus on sales-related plans. Marketing communication
objectives help to understand the context with brand recognition such as awareness levels,
perception, attitudes toward the product/service, etc.
Marketing Communication Strategy
The final decision on a marketing communication strategy depends on the identified target audiences
who can be consumers, distributors, dealer network and stakeholders. After selecting the target
audience, push or pull promotion strategy can be applied. The push strategy is used when the
company wants to push the product/service through marketing channels to final customers, using
different kinds of marketing activities to promote the offerings to the customers. In contrast,
companies using pull strategy try to turn their marketing activities.
2.1.5 Brand and the Branding concept
Brand definitions are numerous; different authors provide their own explanations towards the
meaning of a brand. The definitions are useful to understand a brand from different perspectives. A
traditional definition of a typical brand was one provided by Kotler (2000) “the name associated
with one or more items in the product line, which is used to identify the source of character of the
item(s)”.
The American Marketing Association’s (AMA) definition of a brand is “a name, term, sign, symbol,
or design, or a combination of them, intended to identify the goods and services of one seller or
17
group of sellers and to differentiate them from those of competitors” (Maurya and Mishra, 2012).
Within this view Keller (2003) stated, whenever a marketer creates a new name, logo, or symbol for
a new product, he or she has created a brand.
Kapferer (2008), supported the above definition by explaining a brand as a set of mental
associations, held by the customer, which add to the perceived value of a product or service. These
associations should be unique (exclusive), strong (salient), and positive (desirable).
Branding is a universe of activities used to build awareness and extend customer loyalty. It requires
a mandate from the top and readiness to invest in the future. Branding is about seizing every
opportunity to express why people should choose one brand over another. A desire to lead, outpace
the competition, and give employees the best tools to reach customers is the reasons why companies
leverage branding (Wheeler, 2012).
2.1.6 Brand Preference
Brand preference is a concept that has long grasped the attention of practitioners and researchers.
The term refers to the degree of brand loyalty in which a customer definitely prefers one brand over
competitive offerings and will purchase this brand if it is available. However, if the brand is not
available, the customer will accept a substitute brand rather than expending additional effort finding
and purchasing the preferred brand (Dibb and Michaelidou, 2006).
Brand preference features in most of the major texts on brands and brand strategy. It has also been
considered by different authors; however, unlike the lack of consensus on the definition of brand,
different scholars revolve around the same concept when defining brand preference: Hellier,
Geursen, Carr, & Rickard (2003) define it as the extent to which a consumer makes purchasing
decisions based on a name rather than the quality of a product or the price. These authors agree that
brand preference is created from consumers’ differentiation and comparisons between various
alternatives of brands considered by them.
18
From a business stand point, brand preference is important for business as a component of brand
loyalty. It can be used as a mechanism to enhance sales (Rundle-Thiele & Mackay, 2001). The
challenge for businesses is that customers could change their favorite brands by trying products of
other brands (Mathur, Moschis, & Lee, 2003) because they are exposed to a variety of attractive
brands. For businesses to reduce that risk, they must identify what affects brand preference and how
to build brand preference.
Brand preference is important to companies because it provides an indicator of their customers'
loyalty, the success of their marketing tactics, and the strength of their respective brands. In order to
gain brand loyalty and high market share or obtain the outcomes of brand equity, creating consumers
brand preference or effort to be the preferred brand should be at the heart of marketing activities.
Brand preference is a stronger predictor of consumer intentions and future purchase decision than
brand attitude ( Bass and Talarzyk, 1972).
A brand loyalty shows that a consumer chooses a brand among competing brands and not accept any
other as substitute (Kotler & Keller, 2003). Customers prefer the water brands according to their
income level. Product image is the component which plays a dynamic role in the brand preference
and that image based on consumer’s awareness and related information about the water content of
Total Dissolvable Solute (TDS). The people belonging to middle class like to prefer price as leading
element to select the kind of mineral water on the other hand the quality, performance or package of
a product brand are mainly considered by elite class people.
The five elements of making the decision about choosing the kind of mineral water such as value or
price, quality of the product, brand participation, brand advocacy and brand involvement.
Brand Participation
The participation of the consumer in branded products has achieved the company destination. The
brand preference increased when consumer participated in product promotion. The brand preference
increased due to participation by consumer in brand or company activities (Bagozzi &Dholakia,
2006). Some consumers don’t attached with any product brand and don’t participate in brand
promotion activities (Blanchard & Markus, 2004).
19
Brand Advocacy
Brand advocacy is identification, supports and promotion of the brand to other people, user or
consumers who are the user of same or other brands” (Bhattacharya & Sen, 2003). Promotion of the
brand product to the other users shows the brand advocacy and brand loyalty. Brand advocacy shows
the consumer perception, thinking, interest and uses of the product only which delivered to other
people to advocate this brand which is used his own and differentiate from other brands (Dutton &
Dukerich, 1991; Scott & Lane, 2000).
Brand Involvement
Brand involvement shows the how much customer has information, interest and concern about
branded cars to choose in specific income level. Brand involvement was the only main and primary
criteria to explain the consumer behavior about your product and its feelings (Chakravarti &
Janiszewski, 2003). Brand involvement shows the relationship with consumer satisfaction that how
much he was satisfied by the performance of brand (McColl-Kennedy & Fetter Jr, 2001).The use of
the brand shows the experience and past knowledge of the consumer(Zaichkowsky, 1987).In earlier
researches many researchers concisely described three elements of the brand involvement as
personal, physically and situational. Printed media, radio and television are different sources to
deliver the message or advertising the brand which have changed the preference of the consumer and
its involvement towards the brand (Wright, 1973).
Price of Brand
The consumer expected at the time of take purchase decision from the selection of car model to meet
their quality, brand images, performance, charge appropriate cost, sales & after sales quality criteria
at least (Aghdaie & Yousefi, 2011). Mostly consumer prefer only product price. The price of the
product has impact on consumer purchasing decision process & also the sales margin (Osman, Talib,
Sanusi, Shiang-Yen, & Alwi, 2012). The price of the product is that which is expected to pay by
purchasing of product. There are two types of price of product that prevail in the market. The brand
image is the key element of the product when some products have high price in the market. Some
products have low brand price which is useful technique by brand & consumer rely on the previous
price value for the brand (Swani & Yoo, 2010). Different prices level of different products have
20
impact on consumer behavior connection because the brand price make the brand image in the eyes
of consumer.
Quality of Brand
The product quality only checked by compare it with other competitive brand product. At the time of
pre-purchasing the consumer checked the product & compare it with another same product & make
decision on the base of the results which product is better or not. The product quality has great
impact on consumer behavior & their taste for selection the product with highly connection of
product quality. The consumer behavior can change only on the basis of the analyzing the quality of
the product & services that provide by the brand company (Taylor,Hunter, & Lindberg, 2007).We
get the product quality information by external & internal resources. The external resources are
directly transfer the message from company to consumer.
The product quality play an important role between innovativeness & new product which is recently
introduced (Chevalier & Mayzlin, 2006). Before using the product we can’t judge the quality of
product. The thinking about the product transferred to other are not correct information because at
the time of launching the product in the market nobody can’t accessed the quality of brand product
and said anything.
2.1.7 The bottle water industry
While bottled water itself has been around for centuries, the last 100 years or so saw the creation of
what we see today as a vital source of healthy convenient hydration. The industry is the fastest-
growing beverage category in the world: it “has expanded from a tap water substitute into the
beverage arena” (Lenzner, 1997). The consumption has been steadily growing in the world for the
past 30 years. Even though bottled water is excessively high priced when compared to tap water, the
supply has increased by an average of 7% each year.
Bottled water is a newly growing business in Ethiopia. Before the introduction of Highland natural
spring water, in 2002, people barely knew a bottled mineral water other than Ambo. After that,
investors easily noticed the success of Highland natural spring water and now different other brands
are available in the market (Gedamnesh, 2014). According to the information obtained from
21
Reporter newspaper, the agency, which is in charge of assessing quality and reporting to regulatory
bodies like the Food, Medicine, and Health Care Administration (FMHCA) along with the Ministry
of Trade (MoT) is currently aggressively urging bottled water manufacturing companies to obtain
accreditation from the Ethiopian Standards Agency.
In Ethiopia, from time to time the number of bottled water companies has increased. Bottled water is
a booming and very competitive market involving numerous companies. According to the
information obtained from Ethiopian Trade Minister, Reporter newspaper (2016) disseminated that
there are 37 bottled water manufacturers in the country. The supply of these bottled water producing
companies has grown tremendously.
The growing number of bottled water companies provides customers with a set of alternative brands
from which to choose. Currently in Ethiopia, there is an increase in both the demand and supply for
bottled water is increasing. The expansion of bottled water companies and rapidly growing market
will make the competition among companies stiffer than before. In this competitive environment, the
way by which companies win the competition is through differentiation, building strong brand. To
build a strong brand understanding what consumers expect from certain bottled water is important.
In 2004, the world consumption of Bottled Water reached 154 billion liters (41 billion gallons),
and Americans alone consumed 26 billion liters (Arnold, 2006). Since then, the demand for
bottled water has been increasing, even in places where tap water is safe to drink (Emily & Janet,
2006). Consumers choose to drink bottled water for several reasons. In many cases, it is because
the consumers think bottled water tastes better than tap water, which they think is a sign for
better quality. Furthermore, consumers are very health conscious, so they perceive bottled water
as safer and of better quality (Ferrier, 2001). The increasing usage of bottled water represents a
change in ways of life, for example, the increasing urbanization deteriorates the quality of tap
water, but at the same time, the increasing standard of living enables people to drive far and bring
home heavy and expensive bottled water (Ferrier, 2001).
Although bottled water is a huge market success, it is not a sustainable solution for the global
community due to the massive amount of fossil fuel burning required for transportation and
22
packaging (Emily & Janet, 2006). Furthermore, the bottles degrade slowly, and incinerating used
bottles can produce toxic byproducts. Therefore, it is necessary to investigate consumer’s
behavior – why some people think bottled water is better than tap water and some think otherwise,
and especially the factors that shape such behavior. In a 1993 poll of people who drink bottled
water, it was found that 35 percent of people chose bottled water because of concern of tap water
quality, and 12 percent chose bottled water because of both health concerns and desire for a
substitute for other beverages. Another 35 percent drank bottled water as a substitute for soft
drinks and other beverages. The last 7 percent chose bottled water for other reasons such as taste
and convenience (Olson, 1999).
2.2 Empirical Literature Review
According to Philip Kotler (2002) modern marketing calls for more than developing a good product,
pricing it attractively, and making it accessible. Companies must also communicate with present and
potential stakeholders as well as the general public. For most companies, the question is not whether
to communicate but rather what to say, to whom, and how often. The marketing communications
mix consists of advertising, sales promotion, public relations and publicity, personal selling, and
direct marketing. The product’s styling and price, the package’s shape and color, the salesperson’s
manner and dress, the place’s decor—all communicate something to buyers. In fact, every brand
contact delivers an impression that can affect a customer’s view of the company. Therefore, the
entire marketing mix must be integrated to deliver a consistent message and strategic positioning.
Dr. Bandar Khalaf Alharthey(2015)understanding Decision Making of Consumers through
Advertising Strategy and Integrated Marketing, the study has found that consumers do not prefer
purchasing products about which they are not aware of, which signifies the importance of
advertising and integrated marketing. It has been found in this study that advertising strategy is most
important tool of integrated marketing program which produce profound and lasting impact on
consumers. This explains that advertising is the most important tool in creating brand awareness as
well as influencing consumer purchase decision. The study found out that advertising strategy and
integrated marketing share a positive correlation with consumer purchase decision; only if they are
used effectively through application of appropriate research technic.
23
Dr. Tahir Ali (2013)on the study made on impact of Integrated marketing communication on
consumers purchase decision confirms the importance of IMC activities and concludes that IMC is
the best to target the consumers, because the consumers are strongly influenced by IMC
implementations
Annette W. Mutuku (2001) aims at investigating the influence of marketing mix on consumers’
brand preference of smart phones among public university student in Nairobi. The findings indicate
that respondents learned about smartphones through various promotional mix like advertisements
which enhanced their brand preference. Promotion acts as shopping guide for most consumers and
the more wincing the promotion is, the more likely it will influence purchase.
Chakravarti and Janiszewski, (2005) examined the impact of generic advertising on brand
preference. They proved that for advertising, there is no support for a direct significant impact on
brand preferences. Generally the impact of advertising on brand preferences is complicated and often
indirect. Generic advertising affects consumers brand preferences by affecting their beliefs about
brand attributes and price responsiveness. Similarly Doyle (1989) suggests that it is a misperception
to consider advertising as a tool that can enhance consumer preference for certain brands over their
competitors. He argues that there is little correlation between the advertising and strength of the
brand; many superior brands exist in the market and with little or no advertising at all.
A study of perceived advertising spending on one of Malaysia’s noodle brands found out that
Perceived advertising spending had no significant impact on brand preference and its Dimensions
(Tamara, 2014). The author attributed this to the fact that instant noodles are Cheap and readily
available which makes consumers to relay more on the actual consumption Experience for judgment.
M Sayeed Alam and Md. Farhan Faruqui (2009) had presented a case study to investigate the effect
of sales promotion on consumer Brand preference of laundry detergent in Dhaka city consumers.
The study find that sales promotion will not related to brand loyalty or brand preference. In this case,
it is mentioned that the study was conducted on Dhaka city consumers (sample). The Sales
promotion increase the sales for short time and the message satisfies the consumers but it has no
impact to convince the customer to become loyal towards the promoted brand or in other words it
will not increase the deterministic component if the customer utility equation.
24
According to (Blattberg & Neslin, 1990) sales promotion is a key ingredient in marketing campaigns
which consist of collection of incentive tools to stimulate quicker or greater purchase of particular
products by the consumers. Similarly Brassington & Pettitt, 2000) states that sales promotion are
range of marketing technique that are designed to add value to a product or services over and above
the normal offering in order to achieve specific sales or marketing objective
The study of Chakrabortty, Hossain, Azad, and Islam (2013) found that sales promotion and
advertising positions a product or service strongly in the mind of the consumer in order to encourage
repeat purchase of the product. It was also discovered that advertising makes consumer less price
sensitive which is a problem often associated to motivate consumer’s mind by sales promotion. The
results of the study of Soni and Verghese (2013) found that sales promotion and personal selling
play significant role in consumer purchase decision. Offer, premium, and contest are the most
significant tools in influencing consumer’s purchase decisions while price and rebate have
insignificant influence on consumer’s purchase decision. Rizwan, Javed, Khan, Aslam, Anwar,
Noor, and Kanwal (2012) discovered that while free samples and coupons have no significant
relationship with consumer buying behavior hand price discount, buy-one-get-one-free and physical
surrounding have significant relationship with consumer buying behavior.
The study of Muthukrishnaveni and Muruganandam (2013) revealed that sales promotion schemes
play a very important role in influencing the consumer’s purchase decision. More than 50% of the
respondents see sales promotion as an important factor to be considered when purchasing personal
care products. Matthew, Ogedebe, and Ogedebe (2013) found that web advertising influences
consumers’ purchase decision in Maiduguri Metropolis, Nigeria. The study revealed that majority of
the respondents have positive disposition towards web advertising.
Melkamu (2014) analyzed the effect of media advertising on consumers’ buying behavior as well as
the factors that motivate consumers to respond to media advertising. This was conducted on a
specific brand within the banking sector. The results of the study revealed that media ads were the
most important sources of information; and the types of media ads (broadcast & print media ads) and
the objectives of media ad messages have significant effect on consumers’ buying behavior. The
findings showed that TV has the most powerful influence on consumers’ buying behavior due to the
combinations of audio-visual presentations. The informative ads, perception about the bank, the
25
color of the logo and the brand name were the imperative factors that motivated consumers to
respond to the bank’s media ads (Melkamu, 2014).
According to Julian & Ramaseshan (2004) the relationship between the salesperson and the
customer is perceived as being of great importance for the marketing of a company. Hence, the sales
force within the industry needs not only to be trained in the art of selling, but also to be aware of all
the products available and be able to clearly explain what each offers. Since customers‟ needs and
motivation are likely to be complex, and their ability to assess alternative courses of action without
professional assistance is likely to be limited, it is of great significance for the sales force to know
their customers, as well as their products.
Verhallenet al. (2007) indicate that companies should see the personal selling as a problem-solving
process in which the sales force engages and co-operates towards the customer, trying to find a
solution to the customers‟ problem, rather than only persuading him to purchase the products or
services. In addition, Meidan (2006) claims that it is up to the sales force to enhance the company‟s
reputation by looking after its customers
According to Christine Adhiambo Odhiambo Social media can help a small business reach a target
market in a very short time because through the network effect, the message gets to the target market
segment almost instantly at a cheaper cost compared to other traditional advertising channels like
print and radio. He also suggested that the management of customers’ comments online is a big
challenge facing small businesses because some are very positive and some are “business damaging”
meaning negative comments could potentially impact sales and brand image. Negative comments
posted online could be from a competitor trying to pull down the brand name or turn away
customers. The fact that online advertisers do not have control of these comments is a cause of
concern to small business because they have less resource in terms of human resource and finances
to invest in doing online damage control.
Shutri Arora & Anukrati Sharam (2013) in their study “Social Media: A Successful Tool of Brand
awareness” in 2013 concluded that There is no escaping the social media these days, either for
individuals or for businesses. Today, it is impossible to separate social media from the online world.
Social media is a strong and potent communication tool. It presents brands with enormous reach and
26
endless communication possibilities. It allows brands to emerge into a world of peer-to-peer
dialogue and therefore the possibility of harnessing the brand building potential of the richest
communication form available. However, it is important to do it right.
The study of Rashmi Belwal shows that how social media has become an important tool for
marketing and creating brand awareness. In fact it is foreseen that in the near future there will be a
paradigm shift from traditional advertising to social media platforms. However, Social media alone
cannot be effective without augmenting it with other traditional media channels like radio,
newspaper, or TV even though it is widely reported that the effectiveness of traditional media and
their use is sharply falling.
A thesis paper by Gedamnesh (2013) investigates underlying factors of bottled water brand choice in
Addis Ababa, Ethiopia. The findings of the study showed that most of respondents were aware of
bottled water brands available in Ethiopia. The study revealed that advertisement, product quality,
packaging, brand availability and price make a significant contribution to bottled water brand choice
of consumers in Addis Ababa (Gedamnesh, 2013).
2.3 Conceptual Framework and Hypothesis
2.3.1 Conceptual Framework
A conceptual model shows how on theorize the relationships among several elements identified as
important to the research questions based on the theoretical and empirical literature available. With
this under consideration, a conceptual model has been developed for this particular case at hand
based on the reviews of previous knowledge to discuss the interrelationships among the tools of
integrated marketing communication and the performance of Origin Water Company in terms of
various variables.
The framework has been developed considering similar empirical studies and the theoretical
illustrations on the above sections of the literature. They are made based on the promotional mix
tools in this study, i.e., advertising, sales promotion, social media and personal selling affect the
brand preference and the performance of Origin Water Company positively and significantly.
27
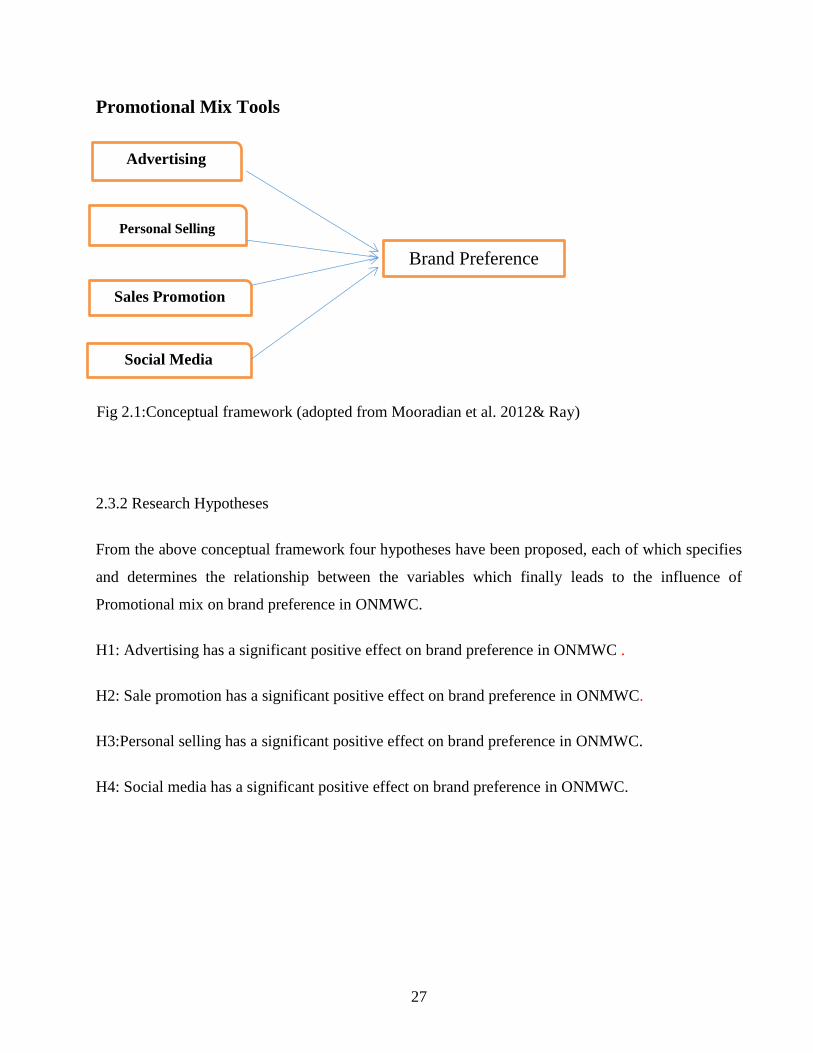
Promotional Mix Tools
Fig 2.1:Conceptual framework (adopted from Mooradian et al. 2012& Ray)
2.3.2 Research Hypotheses
From the above conceptual framework four hypotheses have been proposed, each of which specifies
and determines the relationship between the variables which finally leads to the influence of
Promotional mix on brand preference in ONMWC.
H1: Advertising has a significant positive effect on brand preference in ONMWC .
H2: Sale promotion has a significant positive effect on brand preference in ONMWC.
H3:Personal selling has a significant positive effect on brand preference in ONMWC.
H4: Social media has a significant positive effect on brand preference in ONMWC.
Sales Promotion
Personal Selling
Social Media
Advertising
Brand Preference
28
CHAPTER THREE
RESEARCH METHODOLOGY
Introduction
This chapter presents the approaches and methods that are employed in the study such as the design,
collected and sources of data & information as well as sampling size versus human population of the
study area. Attempts were also made in narrating the reliability and validity the analysis to the
objectives of the study.
3.1 Research approaches
Two basic research approaches have been identified: inductive and/or deductive approach. Inductive
approach is a research approach that builds on specific phenomenon to generalize. A deductive
approach to research is the one that people typically associate with scientific investigations.
(Soiferman, 2010). This research is using the deductive reasoning approach. The reason for selecting
deductive reasoning is because the researcher intends to study what others have done, reads existing
theories of IMC and brand preference, and then emerges from those theories.
The research instrument for this study was designed through conducting the quantitative method in
the study because quantitative methods are more appropriate for large scale issues. The attempt was
to express the possible relationships between one or more independent variables by conducting a
great number of data. This approach was applied by collecting data using questionnaires from
convenient places for the researcher
3.2 Research Design
The research design for this study was explanatory research. For this study, explanatory research was
used to obtain a picture of feedbacks of various ORIGIN mineral water consumers with a view to
understand how they feel and respond Promotional mix communication strategy implemented by
ORIGIN mineral water in Ethiopia. Explanatory study is also used to understand and explain the
relationship between different Variables (Advertisement, personal selling sales promotion etc.) of
29
Promotional mix communication and brand preference in case of ORIGIN mineral water in
Ethiopian.
3.3 Target Population
The target population of the study compromise office, retailer ,supermarkets ,mini markets, hotels
and individual consumers who are occasional and/or regular users of ORIGIN mineral water. Addis
Ababa was the target location to be obtained from the respondents.
3.4 Sampling Frame
The sampling frame refers to the list of all units of population from which the sample is selected
(William, 1991). The sampling frames for this research was infinite or undefined because there was
no statistical data that list or even estimate the number of origin mineral water brand consumers in
Addis Ababa and it is impossible to identify and list from this research perspective. therefore the
sampling frame of this research was the office, retailer ,supermarkets ,mini markets, hotels and
individual consumers of origin mineral water brand product in Addis Ababa city.
3.5 Sampling Techniques
A non-probability sampling technique, which is Judgment Sampling, was used to undertake the
study and to complete the structured questionnaire on voluntary basis. It is typically not practical to
include every member of the population of interest in a research study. Time, money, and resources
are three limiting factors that make this unlikely. Therefore, most researchers are forced to study a
representative subset, a sample of the population of interest (Marczyk, DeMatteo, and Festinger,
2005). The specific places in which the researcher collected the data was supermarket ,GYM, cafe
and restaurants, and universities.
3.6 Sample Size
In this research, the target population of the study can be considered as infinite population since the
customers cannot be determined. As result, the following sampling formula for infinite population
was used to come up with the sample size using the formula of (Israel, 2012).
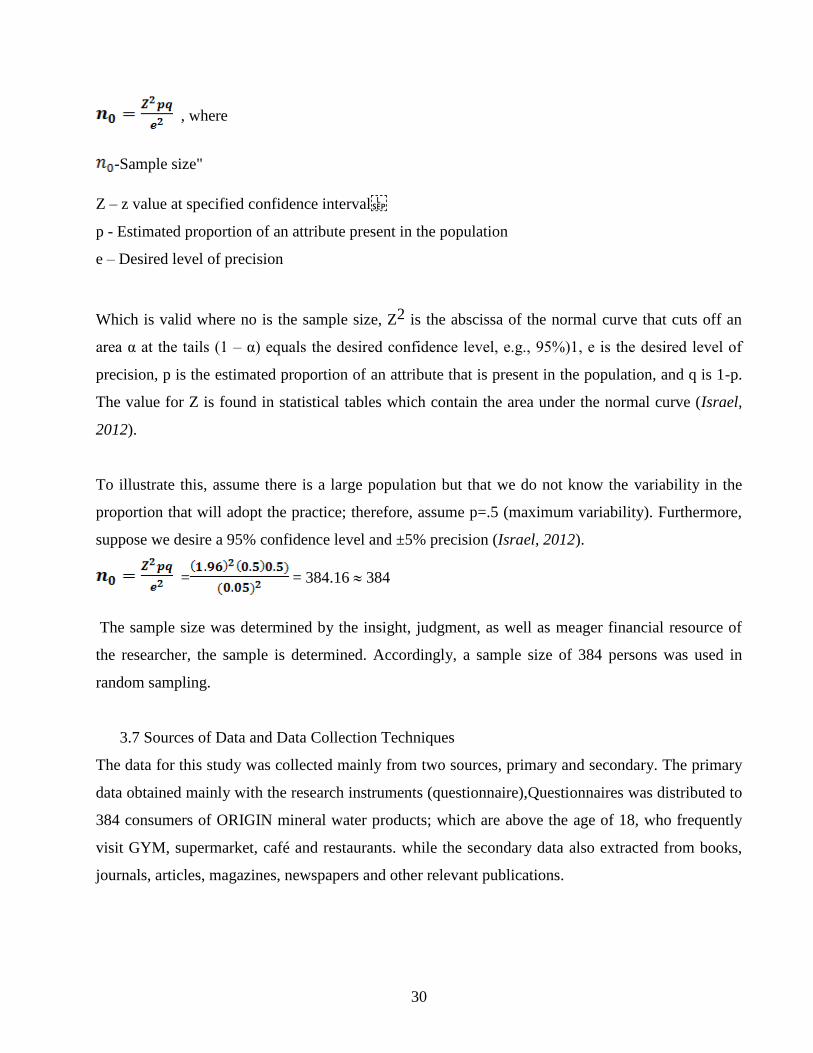
30
, where
-Sample size"
Z – z value at specified confidence interval
p - Estimated proportion of an attribute present in the population
e – Desired level of precision
Which is valid where no is the sample size, Z2 is the abscissa of the normal curve that cuts off an
area α at the tails (1 – α) equals the desired confidence level, e.g., 95%)1, e is the desired level of
precision, p is the estimated proportion of an attribute that is present in the population, and q is 1-p.
The value for Z is found in statistical tables which contain the area under the normal curve (Israel,
2012).
To illustrate this, assume there is a large population but that we do not know the variability in the
proportion that will adopt the practice; therefore, assume p=.5 (maximum variability). Furthermore,
suppose we desire a 95% confidence level and ±5% precision (Israel, 2012).
= = 384.16 384
The sample size was determined by the insight, judgment, as well as meager financial resource of
the researcher, the sample is determined. Accordingly, a sample size of 384 persons was used in
random sampling.
3.7 Sources of Data and Data Collection Techniques
The data for this study was collected mainly from two sources, primary and secondary. The primary
data obtained mainly with the research instruments (questionnaire),Questionnaires was distributed to
384 consumers of ORIGIN mineral water products; which are above the age of 18, who frequently
visit GYM, supermarket, café and restaurants. while the secondary data also extracted from books,
journals, articles, magazines, newspapers and other relevant publications.
31
3.8 Data collection Methodology
The research used self-administered questionnaire survey as instrument to collect primary data. A
self-structured questionnaire developed using a five point Liker scale on the four independent
variables and one dependent variable.
3.9 Questionnaire Design
There is two main sections in the questionnaire. The first section was regarding the socio
demographic data of respondents which included characteristics:- gender, age, educational
background, Marital status, Monthly income and for how long the customer is using the ORIGIN
mineral water product. The second section of the questionnaire was designed to collect data relating
to the four determinants of Brand preference. This section consisted of the dependent variable
(Brand preference) and the four independent variables(advertisement, personal selling, sales
promotion, and social Media).The questionnaire encompassed 18 items which are prepared on five
point liker scale ranging from strongly disagree to strongly agree.
3.10 Data Analysis Techniques
The questionnaires was distributed, collected, coded and analyzed using the statistical package for
social science (SPSS 20).The data analyzed using both descriptive and inferential statistics.
Descriptive analysis include frequency of distribution (to interpret demographic variables of
respondents) and mean (to find the mean sores of Determinants of Brand preference) and inferential
analysis will be sued for hypothesis testing that include correlations and regression. To examine the
relationship between Brand preference and independent variables, Pearson correlation was used.
Multiple Regression analysis was used to test hypotheses and identify the significant factors
influencing Brand preference. Multiple regression analysis was used to examine the relationship
between the four independent variables and one dependent variable.
3.10.1 Validity and Reliability
3.10.2 Validity
Validity is the extent to which differences found with a measuring instrument reflect true differences
among those being tested, (Kothari,2004). In other words, Validity is the most critical criterion and
32
indicates the degree to which an instrument measures what it is supposed to measure. In order to
ensure the quality, the research design the researcher will check content and construct validity of the
research.
3.10.3 Reliability
Is the extent to which a measurement reproduces consistent results if the process of measurement
were to be repeated (Malhotra & Birks, 2007). In order to check the internal consistency of the
instrument, a pilot study 20 questionnaire was conducted on respondents and reliability test will be
conducted using Cronbach-Alpha. Cronbach alpha is widely used in educational research when
instrument for gathering data have items that are scored on a range of values, i.e. different items
have different scoring points or attitude scales in which the item responses are in continuum
(Oluwatayo, 2012). This coefficient varies from 0 to 1, and a value of 0.6 or less generally indicates
unsatisfactory level of internal consistency (Malhotra & Birks, 2007).
3.11 Ethical Considerations
According to Saunders, Lewis and Thornhill (2001, p. 130) “Ethics refers to the appropriateness of
your behavior in relation to the rights of those who become the subject of your work, or are affected
by it”. The data will be collected from the samples through by using a questionnaire; the respondents
will not be required to write their name. The result of the study is will be used for academic purpose
only and the response of the participants is fully confidential. The information that the respondents
will be analyzed without any change by the researcher. Furthermore, the works that is used in this
research as a base for this study is cited appropriately as the researcher respects the work of
previous studies
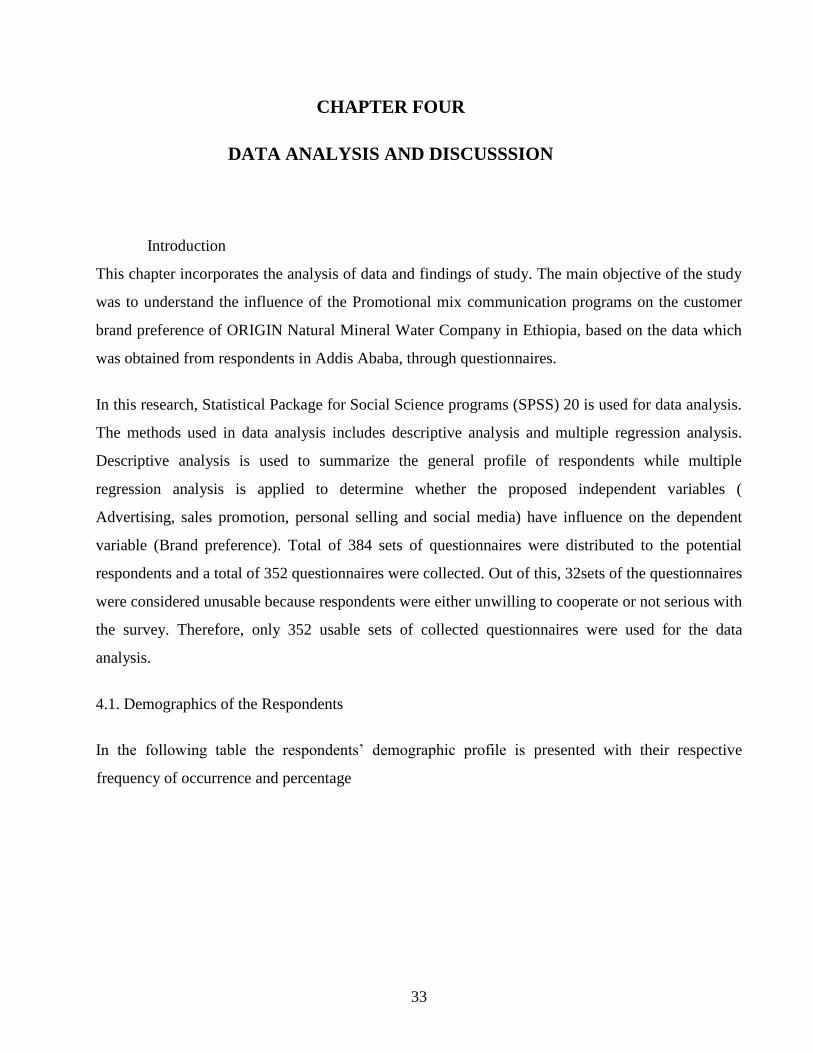
33
CHAPTER FOUR
DATA ANALYSIS AND DISCUSSSION
Introduction
This chapter incorporates the analysis of data and findings of study. The main objective of the study
was to understand the influence of the Promotional mix communication programs on the customer
brand preference of ORIGIN Natural Mineral Water Company in Ethiopia, based on the data which
was obtained from respondents in Addis Ababa, through questionnaires.
In this research, Statistical Package for Social Science programs (SPSS) 20 is used for data analysis.
The methods used in data analysis includes descriptive analysis and multiple regression analysis.
Descriptive analysis is used to summarize the general profile of respondents while multiple
regression analysis is applied to determine whether the proposed independent variables (
Advertising, sales promotion, personal selling and social media) have influence on the dependent
variable (Brand preference). Total of 384 sets of questionnaires were distributed to the potential
respondents and a total of 352 questionnaires were collected. Out of this, 32sets of the questionnaires
were considered unusable because respondents were either unwilling to cooperate or not serious with
the survey. Therefore, only 352 usable sets of collected questionnaires were used for the data
analysis.
4.1. Demographics of the Respondents
In the following table the respondents’ demographic profile is presented with their respective
frequency of occurrence and percentage
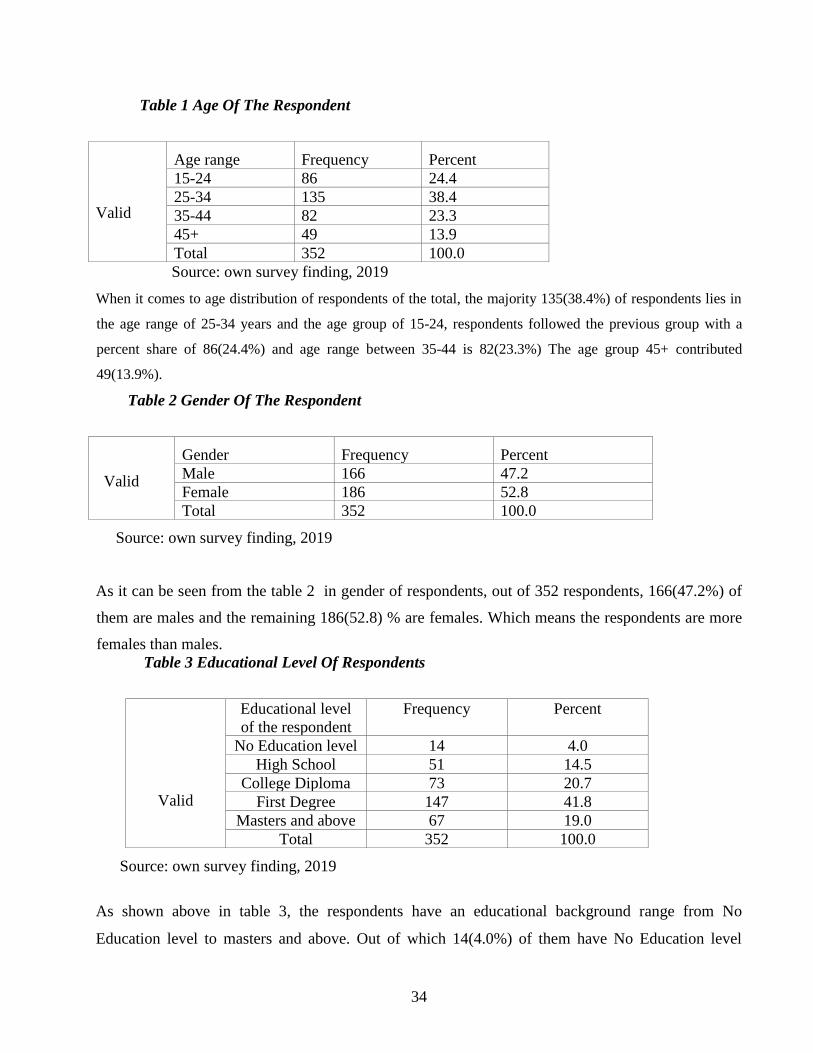
34
Table 1 Age Of The Respondent
Valid
Age range Frequency Percent
15-24 86 24.4
25-34 135 38.4
35-44 82 23.3
45+ 49 13.9
Total 352 100.0
Source: own survey finding, 2019
When it comes to age distribution of respondents of the total, the majority 135(38.4%) of respondents lies in
the age range of 25-34 years and the age group of 15-24, respondents followed the previous group with a
percent share of 86(24.4%) and age range between 35-44 is 82(23.3%) The age group 45+ contributed
49(13.9%).
Table 2 Gender Of The Respondent
Valid
Gender Frequency Percent
Male 166 47.2
Female 186 52.8
Total 352 100.0
Source: own survey finding, 2019
As it can be seen from the table 2 in gender of respondents, out of 352 respondents, 166(47.2%) of
them are males and the remaining 186(52.8) % are females. Which means the respondents are more
females than males.
Table 3 Educational Level Of Respondents
Valid
Educational level
of the respondent
Frequency Percent
No Education level 14 4.0
High School 51 14.5
College Diploma 73 20.7
First Degree 147 41.8
Masters and above 67 19.0
Total 352 100.0
Source: own survey finding, 2019
As shown above in table 3, the respondents have an educational background range from No
Education level to masters and above. Out of which 14(4.0%) of them have No Education level
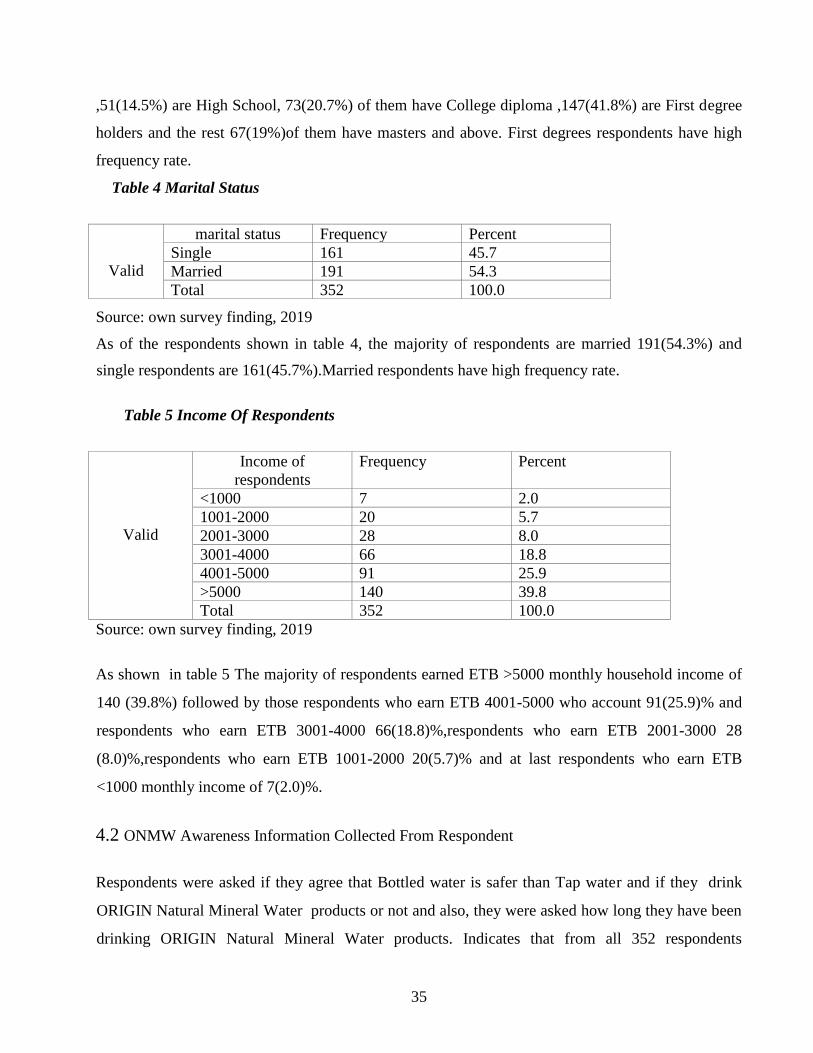
35
,51(14.5%) are High School, 73(20.7%) of them have College diploma ,147(41.8%) are First degree
holders and the rest 67(19%)of them have masters and above. First degrees respondents have high
frequency rate.
Table 4 Marital Status
Valid
marital status Frequency Percent
Single 161 45.7
Married 191 54.3
Total 352 100.0
Source: own survey finding, 2019
As of the respondents shown in table 4, the majority of respondents are married 191(54.3%) and
single respondents are 161(45.7%).Married respondents have high frequency rate.
Table 5 Income Of Respondents
Valid
Income of
respondents
Frequency Percent
<1000 7 2.0
1001-2000 20 5.7
2001-3000 28 8.0
3001-4000 66 18.8
4001-5000 91 25.9
>5000 140 39.8
Total 352 100.0
Source: own survey finding, 2019
As shown in table 5 The majority of respondents earned ETB >5000 monthly household income of
140 (39.8%) followed by those respondents who earn ETB 4001-5000 who account 91(25.9)% and
respondents who earn ETB 3001-4000 66(18.8)%,respondents who earn ETB 2001-3000 28
(8.0)%,respondents who earn ETB 1001-2000 20(5.7)% and at last respondents who earn ETB
<1000 monthly income of 7(2.0)%.
4.2 ONMW Awareness Information Collected From Respondent
Respondents were asked if they agree that Bottled water is safer than Tap water and if they drink
ORIGIN Natural Mineral Water products or not and also, they were asked how long they have been
drinking ORIGIN Natural Mineral Water products. Indicates that from all 352 respondents
36
,312(88.16)% respondents agree that Bottled water is safer than Tap water and 40(11.4)% doesn’t
agree that Bottled water is safer than Tap water. The respondents who drink ORIGIN mineral water
brand products are 302(85.8)% and who don’t drink 50(14.2)%.
Table 6 Respondent’s ONMWC Consumption History
Questions Option Frequency Percent
Do you agree that
Bottled water is safer
than Tap water?
Yes 312 88.16
No 40 11.4
Total 352 100.0
Do you drink ORIGIN
mineral water brand
products?
Yes 302 85.8
No 50 14.2
Total 352 100.0
Source: own survey finding, 2019
4.3 Validity and Reliability Test
Validity and reliability are the two important characteristics of every measure of materials such as
questionnaire. Reliability is fundamentally concerned with issues of consistency of measures
whereas validity is the degree to which an instrument measures what it is supposed to measure.
(Bryman and Bell, 2003). So before analyzing the collected data the reliability of the main items of
the questionnaire was tested using Cronbach’s alpha and validity of the instrument for the present
study was ensured as the independent variables and items are identified from the literature. Pilot
tests were then conducted with twenty consumers who were like to the population for the study. The
purpose of the pre-testing was to refine the questionnaire and to assess the validity of measures in
Ethiopian context. First reliability of the independent variables (Advertising, personal selling, sales
promotion and social media) and the dependent variable (brand preference) was checked then overall
reliability for all items which were important for the research was performed by using SPSS.
According to Hair, et al., (2010), if α is greater than 0.7, it means that it has high reliability and ifα is
smaller than 0.3, then it implies that there is low reliability. In this study, all the independent
variables and dependent variable, met the above requirement. The alpha value is identified and
summarized in the below table.
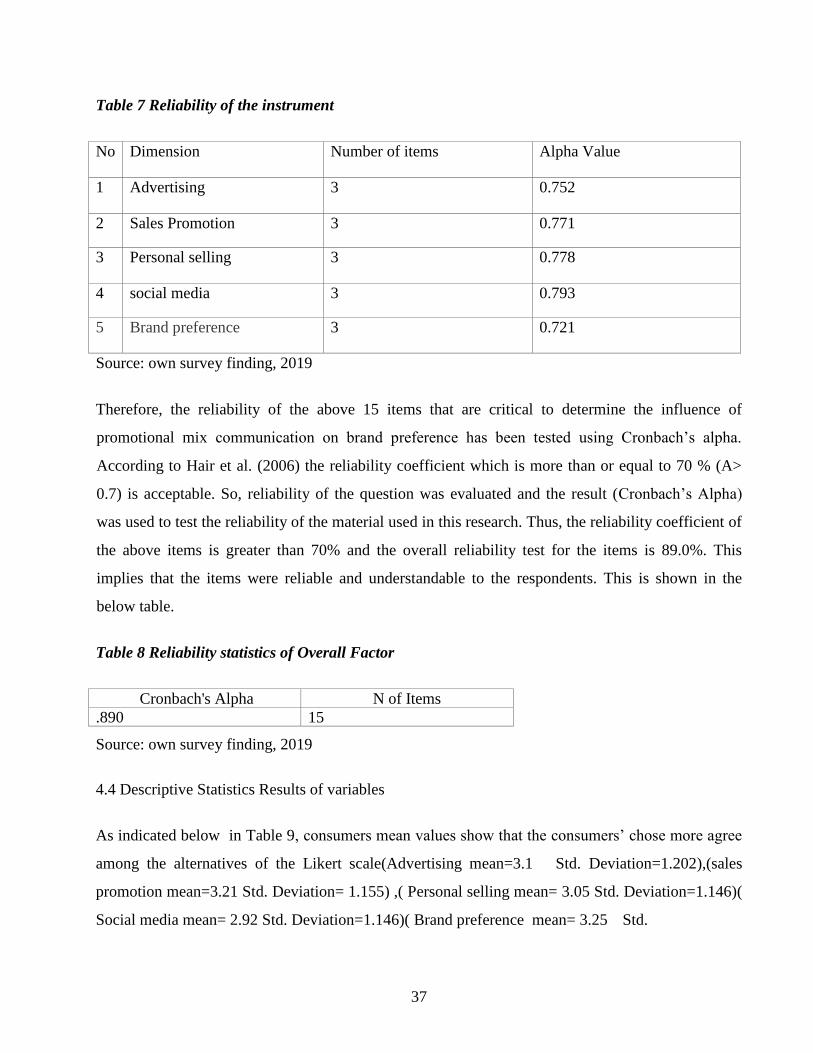
37
Table 7 Reliability of the instrument
No Dimension Number of items Alpha Value
1 Advertising 3 0.752
2 Sales Promotion 3 0.771
3 Personal selling 3 0.778
4 social media 3 0.793
5 Brand preference 3 0.721
Source: own survey finding, 2019
Therefore, the reliability of the above 15 items that are critical to determine the influence of
promotional mix communication on brand preference has been tested using Cronbach’s alpha.
According to Hair et al. (2006) the reliability coefficient which is more than or equal to 70 % (A>
0.7) is acceptable. So, reliability of the question was evaluated and the result (Cronbach’s Alpha)
was used to test the reliability of the material used in this research. Thus, the reliability coefficient of
the above items is greater than 70% and the overall reliability test for the items is 89.0%. This
implies that the items were reliable and understandable to the respondents. This is shown in the
below table.
Table 8 Reliability statistics of Overall Factor
Cronbach's Alpha N of Items
.890 15
Source: own survey finding, 2019
4.4 Descriptive Statistics Results of variables
As indicated below in Table 9, consumers mean values show that the consumers’ chose more agree
among the alternatives of the Likert scale(Advertising mean=3.1 Std. Deviation=1.202),(sales
promotion mean=3.21 Std. Deviation= 1.155) ,( Personal selling mean= 3.05 Std. Deviation=1.146)(
Social media mean= 2.92 Std. Deviation=1.146)( Brand preference mean= 3.25 Std.
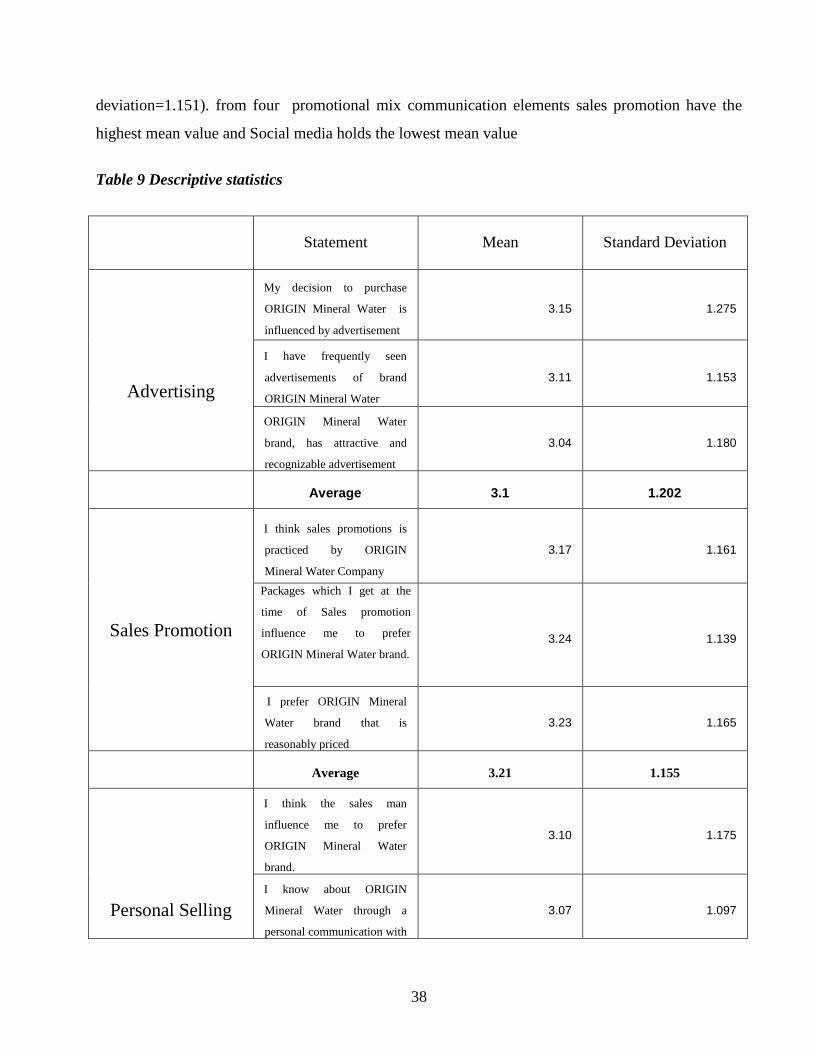
38
deviation=1.151). from four promotional mix communication elements sales promotion have the
highest mean value and Social media holds the lowest mean value
Table 9 Descriptive statistics
Statement Mean Standard Deviation
Advertising
My decision to purchase
ORIGIN Mineral Water is
influenced by advertisement
3.15 1.275
I have frequently seen
advertisements of brand
ORIGIN Mineral Water
3.11 1.153
ORIGIN Mineral Water
brand, has attractive and
recognizable advertisement
3.04 1.180
Average 3.1 1.202
Sales Promotion
I think sales promotions is
practiced by ORIGIN
Mineral Water Company
3.17 1.161
Packages which I get at the
time of Sales promotion
influence me to prefer
ORIGIN Mineral Water brand.
3.24 1.139
I prefer ORIGIN Mineral
Water brand that is
reasonably priced
3.23 1.165
Average 3.21 1.155
Personal Selling
I think the sales man
influence me to prefer
ORIGIN Mineral Water
brand.
3.10 1.175
I know about ORIGIN
Mineral Water through a
personal communication with
3.07 1.097
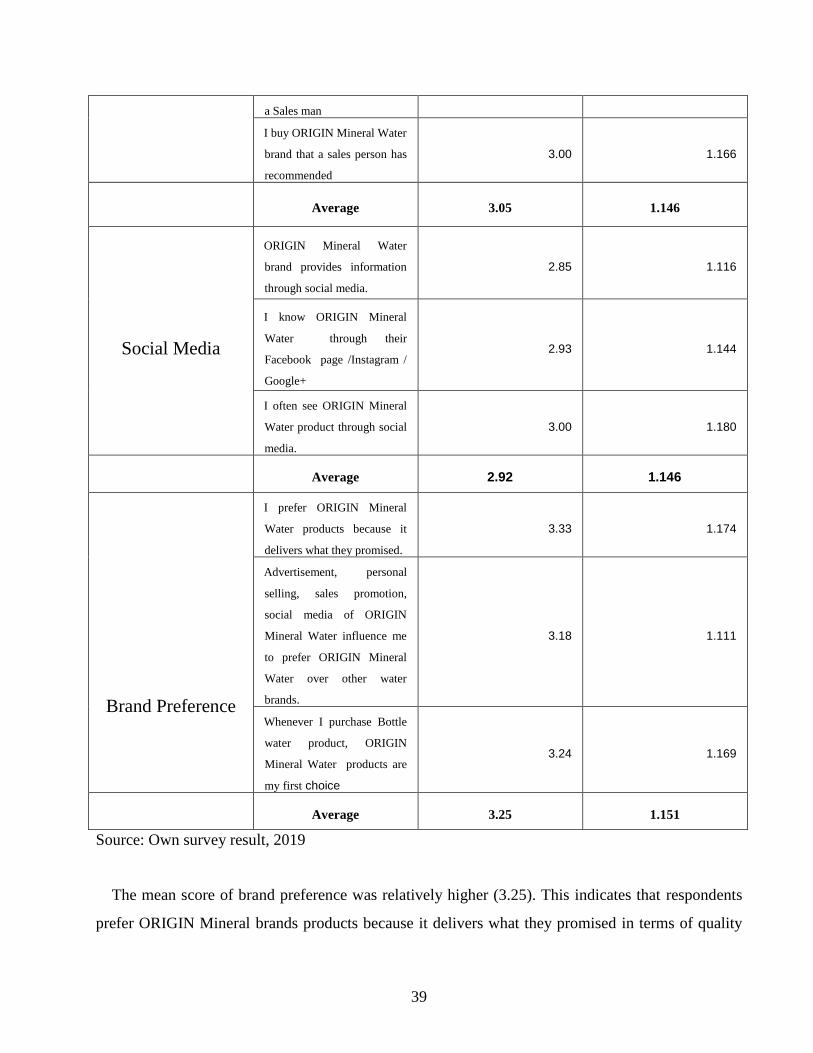
39
a Sales man
I buy ORIGIN Mineral Water
brand that a sales person has
recommended
3.00 1.166
Average 3.05 1.146
Social Media
ORIGIN Mineral Water
brand provides information
through social media.
2.85 1.116
I know ORIGIN Mineral
Water through their
Facebook page /Instagram /
Google+
2.93 1.144
I often see ORIGIN Mineral
Water product through social
media.
3.00 1.180
Average 2.92 1.146
Brand Preference
I prefer ORIGIN Mineral
Water products because it
delivers what they promised.
3.33 1.174
Advertisement, personal
selling, sales promotion,
social media of ORIGIN
Mineral Water influence me
to prefer ORIGIN Mineral
Water over other water
brands.
3.18 1.111
Whenever I purchase Bottle
water product, ORIGIN
Mineral Water products are
my first choice
3.24 1.169
Average 3.25 1.151
Source: Own survey result, 2019
The mean score of brand preference was relatively higher (3.25). This indicates that respondents
prefer ORIGIN Mineral brands products because it delivers what they promised in terms of quality
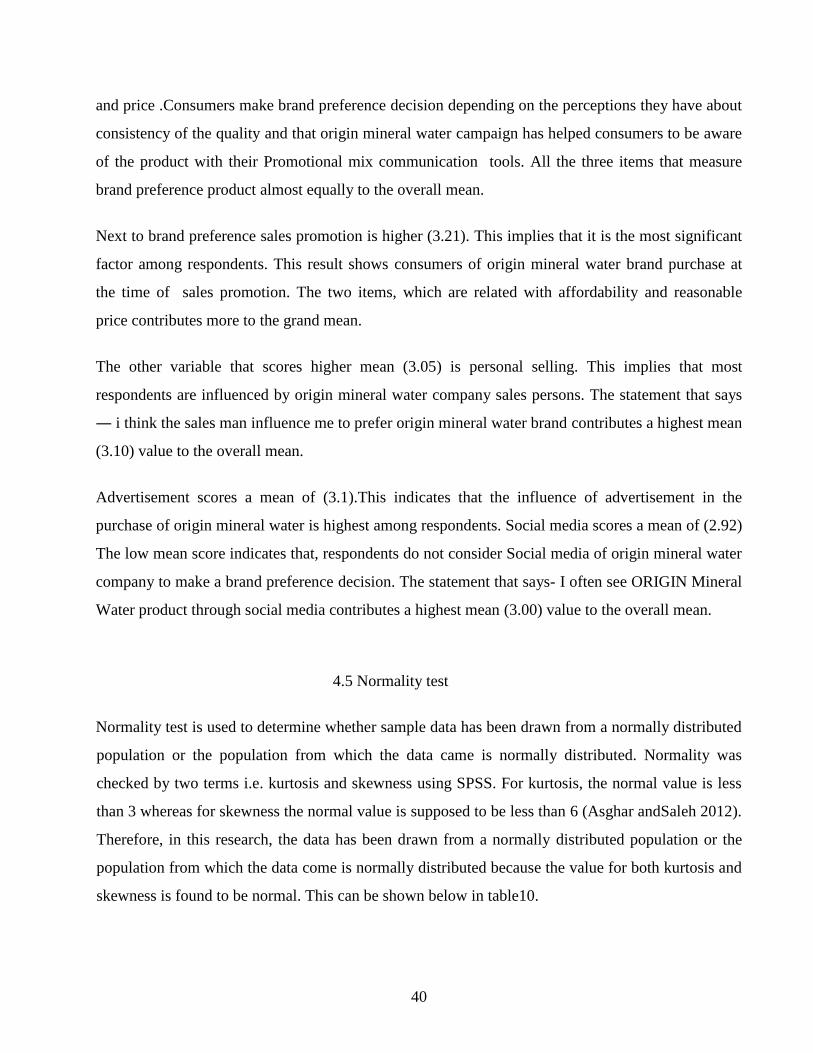
40
and price .Consumers make brand preference decision depending on the perceptions they have about
consistency of the quality and that origin mineral water campaign has helped consumers to be aware
of the product with their Promotional mix communication tools. All the three items that measure
brand preference product almost equally to the overall mean.
Next to brand preference sales promotion is higher (3.21). This implies that it is the most significant
factor among respondents. This result shows consumers of origin mineral water brand purchase at
the time of sales promotion. The two items, which are related with affordability and reasonable
price contributes more to the grand mean.
The other variable that scores higher mean (3.05) is personal selling. This implies that most
respondents are influenced by origin mineral water company sales persons. The statement that says
― i think the sales man influence me to prefer origin mineral water brand contributes a highest mean
(3.10) value to the overall mean.
Advertisement scores a mean of (3.1).This indicates that the influence of advertisement in the
purchase of origin mineral water is highest among respondents. Social media scores a mean of (2.92)
The low mean score indicates that, respondents do not consider Social media of origin mineral water
company to make a brand preference decision. The statement that says- I often see ORIGIN Mineral
Water product through social media contributes a highest mean (3.00) value to the overall mean.
4.5 Normality test
Normality test is used to determine whether sample data has been drawn from a normally distributed
population or the population from which the data came is normally distributed. Normality was
checked by two terms i.e. kurtosis and skewness using SPSS. For kurtosis, the normal value is less
than 3 whereas for skewness the normal value is supposed to be less than 6 (Asghar andSaleh 2012).
Therefore, in this research, the data has been drawn from a normally distributed population or the
population from which the data come is normally distributed because the value for both kurtosis and
skewness is found to be normal. This can be shown below in table10.
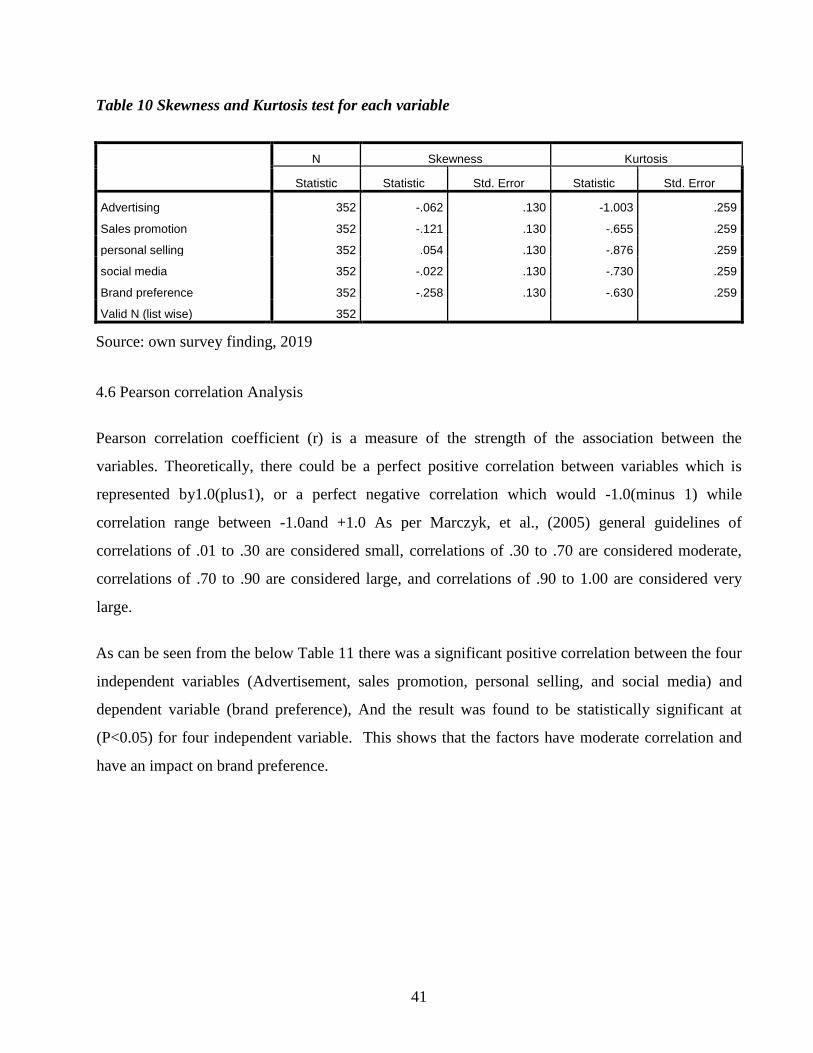
41
Table 10 Skewness and Kurtosis test for each variable
N Skewness Kurtosis
Statistic Statistic Std. Error Statistic Std. Error
Advertising 352 -.062 .130 -1.003 .259
Sales promotion 352 -.121 .130 -.655 .259
personal selling 352 .054 .130 -.876 .259
social media 352 -.022 .130 -.730 .259
Brand preference 352 -.258 .130 -.630 .259
Valid N (list wise) 352
Source: own survey finding, 2019
4.6 Pearson correlation Analysis
Pearson correlation coefficient (r) is a measure of the strength of the association between the
variables. Theoretically, there could be a perfect positive correlation between variables which is
represented by1.0(plus1), or a perfect negative correlation which would -1.0(minus 1) while
correlation range between -1.0and +1.0 As per Marczyk, et al., (2005) general guidelines of
correlations of .01 to .30 are considered small, correlations of .30 to .70 are considered moderate,
correlations of .70 to .90 are considered large, and correlations of .90 to 1.00 are considered very
large.
As can be seen from the below Table 11 there was a significant positive correlation between the four
independent variables (Advertisement, sales promotion, personal selling, and social media) and
dependent variable (brand preference), And the result was found to be statistically significant at
(P<0.05) for four independent variable. This shows that the factors have moderate correlation and
have an impact on brand preference.
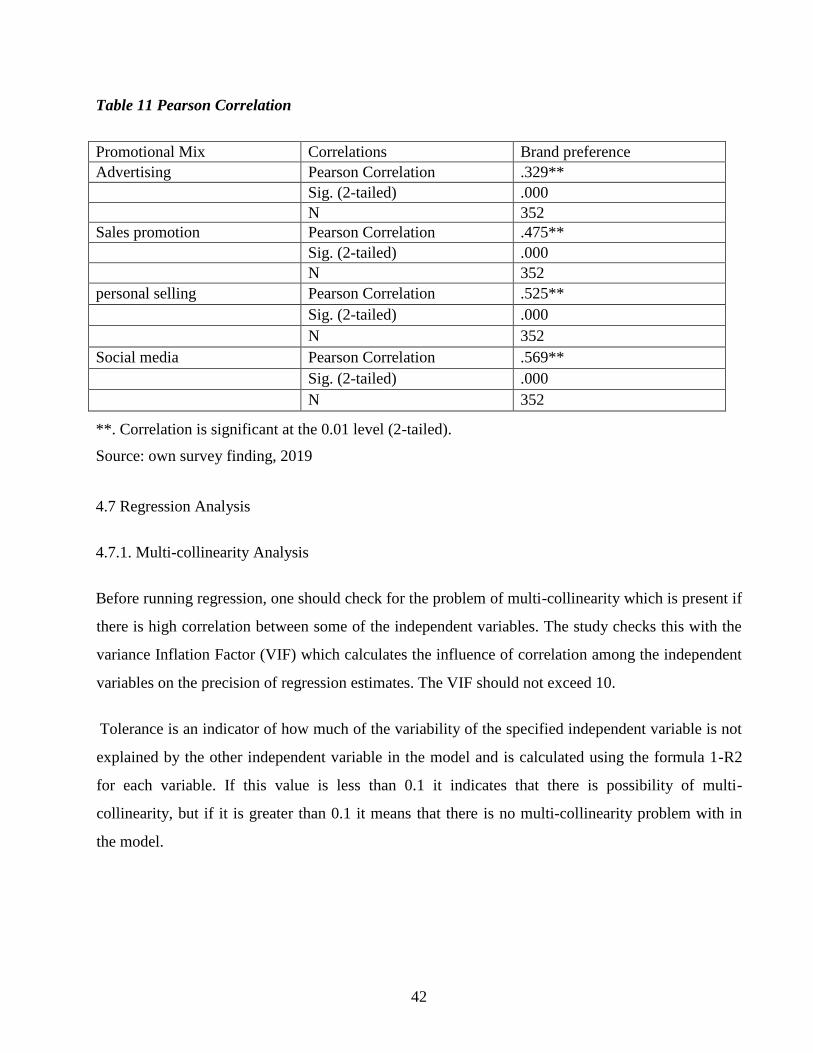
42
Table 11 Pearson Correlation
Promotional Mix Correlations Brand preference
Advertising Pearson Correlation .329**
Sig. (2-tailed) .000
N 352
Sales promotion Pearson Correlation .475**
Sig. (2-tailed) .000
N 352
personal selling Pearson Correlation .525**
Sig. (2-tailed) .000
N 352
Social media Pearson Correlation .569**
Sig. (2-tailed) .000
N 352
**. Correlation is significant at the 0.01 level (2-tailed).
Source: own survey finding, 2019
4.7 Regression Analysis
4.7.1. Multi-collinearity Analysis
Before running regression, one should check for the problem of multi-collinearity which is present if
there is high correlation between some of the independent variables. The study checks this with the
variance Inflation Factor (VIF) which calculates the influence of correlation among the independent
variables on the precision of regression estimates. The VIF should not exceed 10.
Tolerance is an indicator of how much of the variability of the specified independent variable is not
explained by the other independent variable in the model and is calculated using the formula 1-R2
for each variable. If this value is less than 0.1 it indicates that there is possibility of multi-
collinearity, but if it is greater than 0.1 it means that there is no multi-collinearity problem with in
the model.
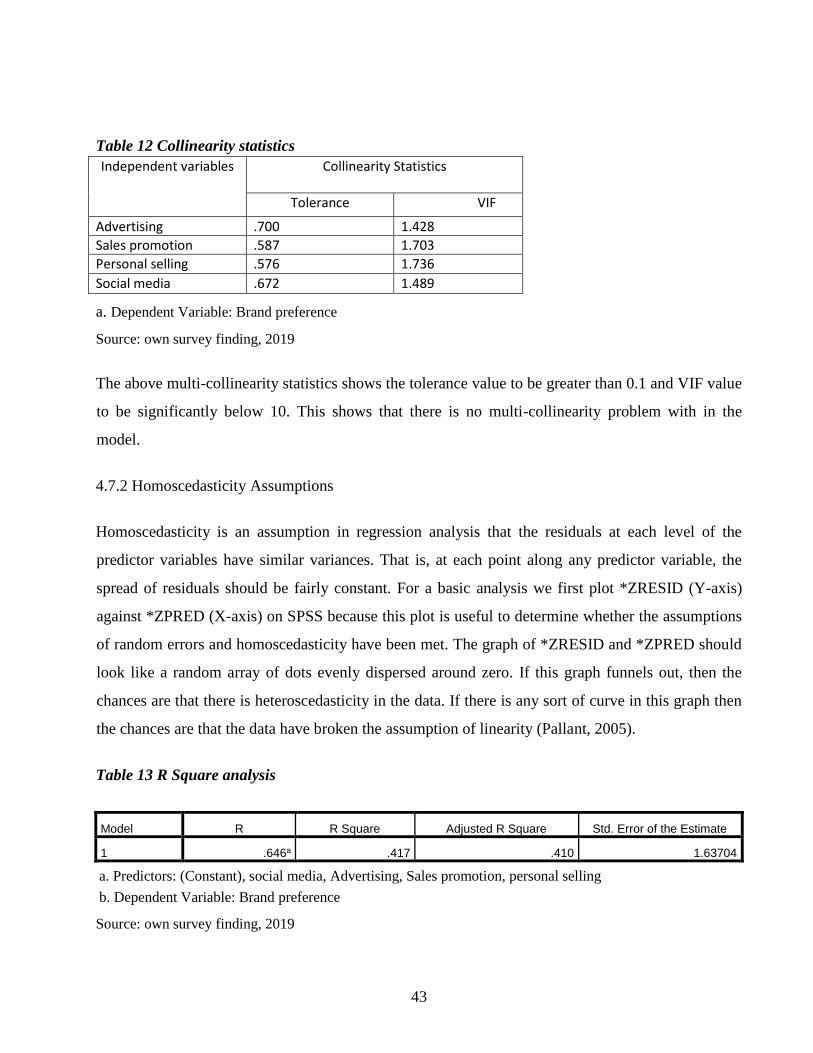
43
Table 12 Collinearity statistics
Independent variables Collinearity Statistics
Tolerance VIF
Advertising .700 1.428
Sales promotion .587 1.703
Personal selling .576 1.736
Social media .672 1.489
a. Dependent Variable: Brand preference
Source: own survey finding, 2019
The above multi-collinearity statistics shows the tolerance value to be greater than 0.1 and VIF value
to be significantly below 10. This shows that there is no multi-collinearity problem with in the
model.
4.7.2 Homoscedasticity Assumptions
Homoscedasticity is an assumption in regression analysis that the residuals at each level of the
predictor variables have similar variances. That is, at each point along any predictor variable, the
spread of residuals should be fairly constant. For a basic analysis we first plot *ZRESID (Y-axis)
against *ZPRED (X-axis) on SPSS because this plot is useful to determine whether the assumptions
of random errors and homoscedasticity have been met. The graph of *ZRESID and *ZPRED should
look like a random array of dots evenly dispersed around zero. If this graph funnels out, then the
chances are that there is heteroscedasticity in the data. If there is any sort of curve in this graph then
the chances are that the data have broken the assumption of linearity (Pallant, 2005).
Table 13 R Square analysis
Model R R Square Adjusted R Square Std. Error of the Estimate
1 .646a .417 .410 1.63704
a. Predictors: (Constant), social media, Advertising, Sales promotion, personal selling
b. Dependent Variable: Brand preference
Source: own survey finding, 2019
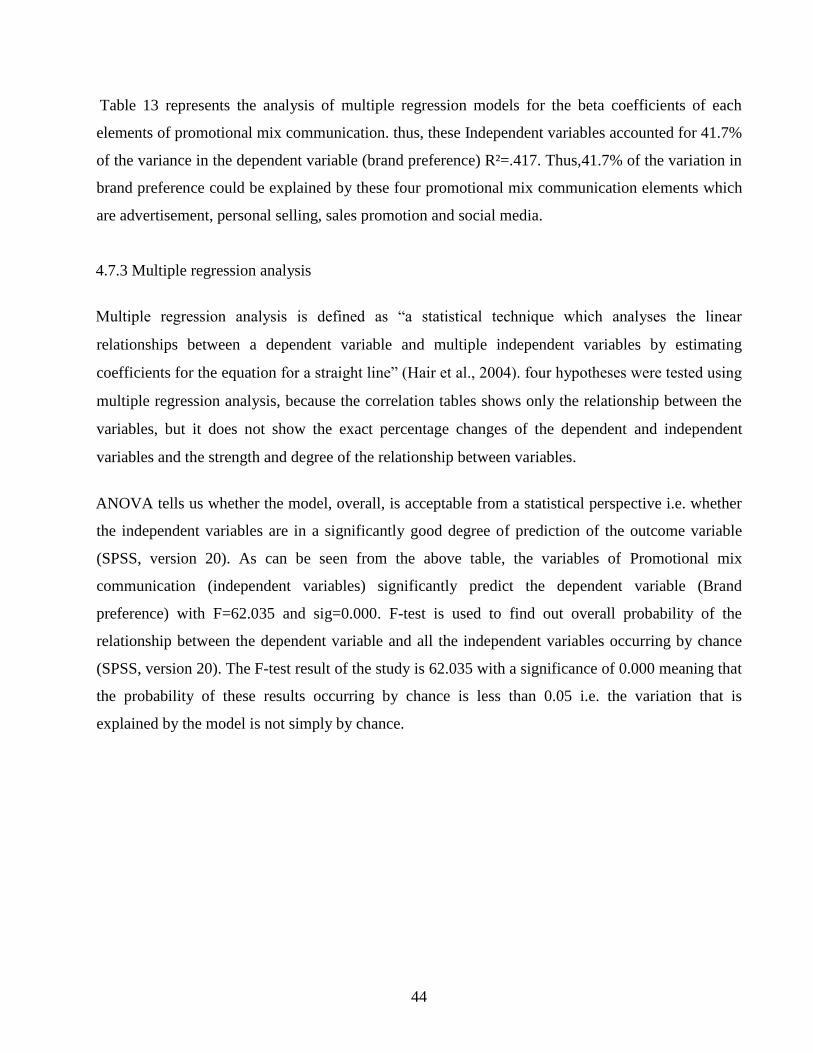
44
Table 13 represents the analysis of multiple regression models for the beta coefficients of each
elements of promotional mix communication. thus, these Independent variables accounted for 41.7%
of the variance in the dependent variable (brand preference) R²=.417. Thus,41.7% of the variation in
brand preference could be explained by these four promotional mix communication elements which
are advertisement, personal selling, sales promotion and social media.
4.7.3 Multiple regression analysis
Multiple regression analysis is defined as “a statistical technique which analyses the linear
relationships between a dependent variable and multiple independent variables by estimating
coefficients for the equation for a straight line” (Hair et al., 2004). four hypotheses were tested using
multiple regression analysis, because the correlation tables shows only the relationship between the
variables, but it does not show the exact percentage changes of the dependent and independent
variables and the strength and degree of the relationship between variables.
ANOVA tells us whether the model, overall, is acceptable from a statistical perspective i.e. whether
the independent variables are in a significantly good degree of prediction of the outcome variable
(SPSS, version 20). As can be seen from the above table, the variables of Promotional mix
communication (independent variables) significantly predict the dependent variable (Brand
preference) with F=62.035 and sig=0.000. F-test is used to find out overall probability of the
relationship between the dependent variable and all the independent variables occurring by chance
(SPSS, version 20). The F-test result of the study is 62.035 with a significance of 0.000 meaning that
the probability of these results occurring by chance is less than 0.05 i.e. the variation that is
explained by the model is not simply by chance.
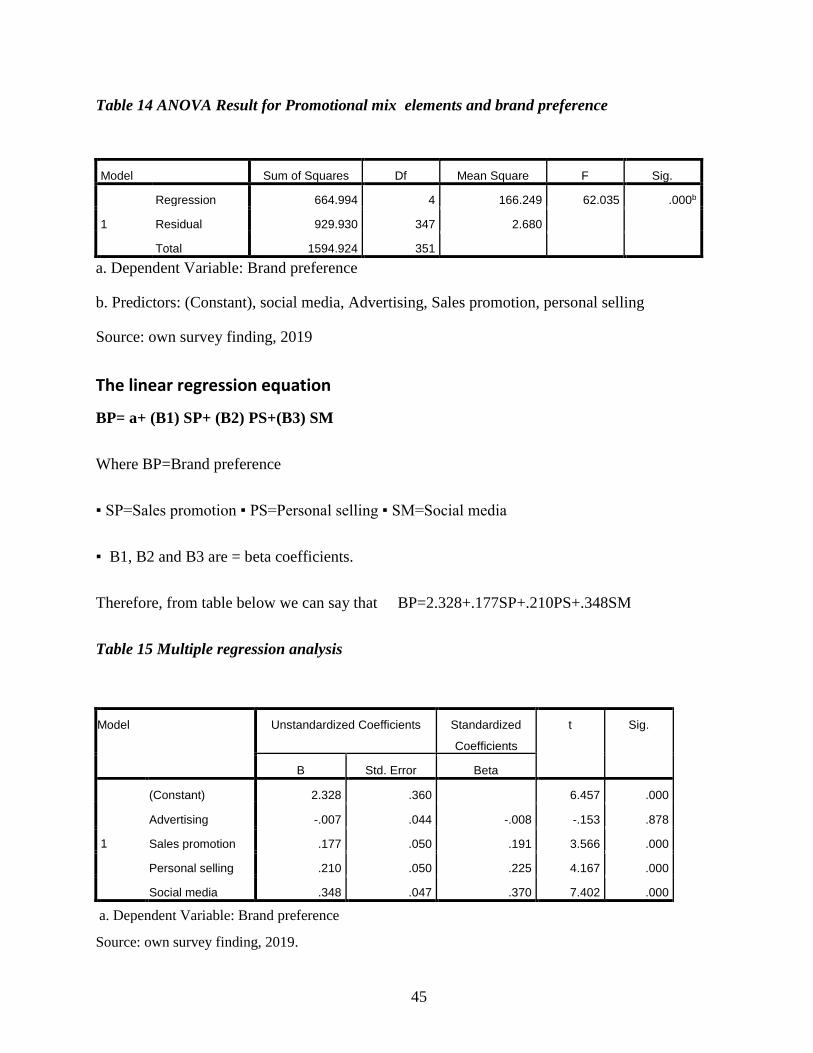
45
Table 14 ANOVA Result for Promotional mix elements and brand preference
Model Sum of Squares Df Mean Square F Sig.
1
Regression 664.994 4 166.249 62.035 .000b
Residual 929.930 347 2.680
Total 1594.924 351
a. Dependent Variable: Brand preference
b. Predictors: (Constant), social media, Advertising, Sales promotion, personal selling
Source: own survey finding, 2019
The linear regression equation
BP= a+ (B1) SP+ (B2) PS+(B3) SM
Where BP=Brand preference
▪ SP=Sales promotion ▪ PS=Personal selling ▪ SM=Social media
▪ B1, B2 and B3 are = beta coefficients.
Therefore, from table below we can say that BP=2.328+.177SP+.210PS+.348SM
Table 15 Multiple regression analysis
Model Unstandardized Coefficients Standardized
Coefficients
t Sig.
B Std. Error Beta
1
(Constant) 2.328 .360 6.457 .000
Advertising -.007 .044 -.008 -.153 .878
Sales promotion .177 .050 .191 3.566 .000
Personal selling .210 .050 .225 4.167 .000
Social media .348 .047 .370 7.402 .000
a. Dependent Variable: Brand preference
Source: own survey finding, 2019.
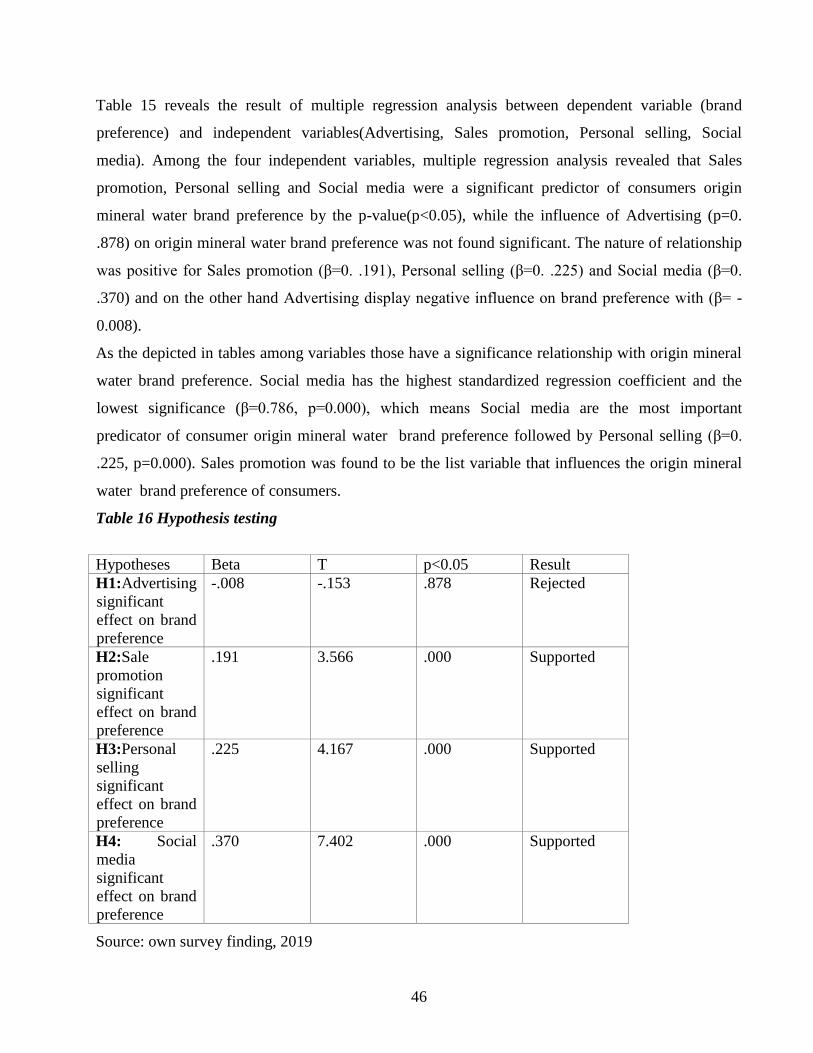
46
Table 15 reveals the result of multiple regression analysis between dependent variable (brand
preference) and independent variables(Advertising, Sales promotion, Personal selling, Social
media). Among the four independent variables, multiple regression analysis revealed that Sales
promotion, Personal selling and Social media were a significant predictor of consumers origin
mineral water brand preference by the p-value(p<0.05), while the influence of Advertising (p=0.
.878) on origin mineral water brand preference was not found significant. The nature of relationship
was positive for Sales promotion (β=0. .191), Personal selling (β=0. .225) and Social media (β=0.
.370) and on the other hand Advertising display negative influence on brand preference with (β= -
0.008).
As the depicted in tables among variables those have a significance relationship with origin mineral
water brand preference. Social media has the highest standardized regression coefficient and the
lowest significance (β=0.786, p=0.000), which means Social media are the most important
predicator of consumer origin mineral water brand preference followed by Personal selling (β=0.
.225, p=0.000). Sales promotion was found to be the list variable that influences the origin mineral
water brand preference of consumers.
Table 16 Hypothesis testing
Hypotheses Beta T p<0.05 Result
H1:Advertising
significant
effect on brand
preference
-.008 -.153 .878
Rejected
H2:Sale
promotion
significant
effect on brand
preference
.191 3.566
.000 Supported
H3:Personal
selling
significant
effect on brand
preference
.225 4.167 .000 Supported
H4: Social
media
significant
effect on brand
preference
.370 7.402 .000 Supported
Source: own survey finding, 2019
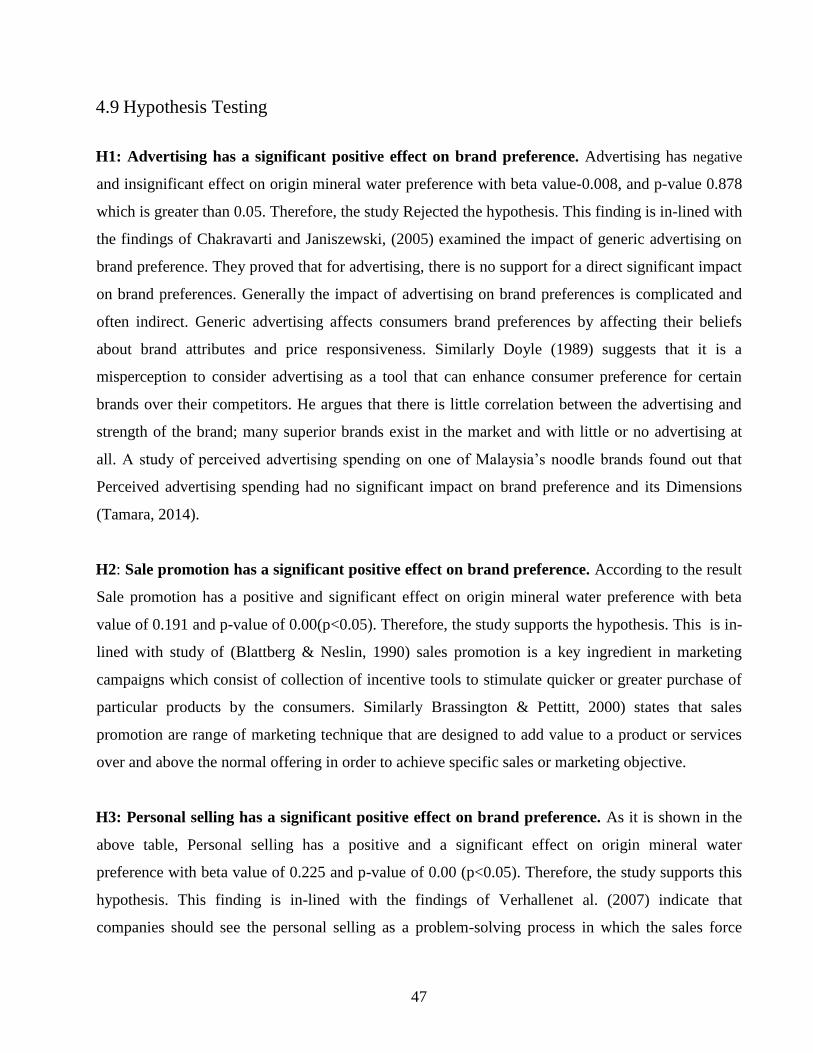
47
4.9 Hypothesis Testing
H1: Advertising has a significant positive effect on brand preference. Advertising has negative
and insignificant effect on origin mineral water preference with beta value-0.008, and p-value 0.878
which is greater than 0.05. Therefore, the study Rejected the hypothesis. This finding is in-lined with
the findings of Chakravarti and Janiszewski, (2005) examined the impact of generic advertising on
brand preference. They proved that for advertising, there is no support for a direct significant impact
on brand preferences. Generally the impact of advertising on brand preferences is complicated and
often indirect. Generic advertising affects consumers brand preferences by affecting their beliefs
about brand attributes and price responsiveness. Similarly Doyle (1989) suggests that it is a
misperception to consider advertising as a tool that can enhance consumer preference for certain
brands over their competitors. He argues that there is little correlation between the advertising and
strength of the brand; many superior brands exist in the market and with little or no advertising at
all. A study of perceived advertising spending on one of Malaysia’s noodle brands found out that
Perceived advertising spending had no significant impact on brand preference and its Dimensions
(Tamara, 2014).
H2: Sale promotion has a significant positive effect on brand preference. According to the result
Sale promotion has a positive and significant effect on origin mineral water preference with beta
value of 0.191 and p-value of 0.00(p<0.05). Therefore, the study supports the hypothesis. This is in-
lined with study of (Blattberg & Neslin, 1990) sales promotion is a key ingredient in marketing
campaigns which consist of collection of incentive tools to stimulate quicker or greater purchase of
particular products by the consumers. Similarly Brassington & Pettitt, 2000) states that sales
promotion are range of marketing technique that are designed to add value to a product or services
over and above the normal offering in order to achieve specific sales or marketing objective.
H3: Personal selling has a significant positive effect on brand preference. As it is shown in the
above table, Personal selling has a positive and a significant effect on origin mineral water
preference with beta value of 0.225 and p-value of 0.00 (p<0.05). Therefore, the study supports this
hypothesis. This finding is in-lined with the findings of Verhallenet al. (2007) indicate that
companies should see the personal selling as a problem-solving process in which the sales force
48
engages and co-operates towards the customer, trying to find a solution to the customers‟ problem,
rather than only persuading him to purchase the products or services. In addition, Meidan (2006)
claims that it is up to the sales force to enhance the company‟s reputation by looking after its
customers.
H4: Social media has a significant positive effect on brand preference. According to the result
Social media has a positive and significant effect on origin mineral water preference with beta value
of 0.370 and p-value of 0.00(p<0.05). Therefore, the study supports the hypothesis. Therefore, the
study supports the hypothesis. This finding is in-lined with the findings of Shutri Arora & Anukrati
Sharam (2013) in their study “Social Media: A Successful Tool of Brand awareness” in 2013
concluded that There is no escaping the social media these days, either for individuals or for
businesses. Today, it is impossible to separate social media from the online world. Social media is a
strong and potent communication tool. It presents brands with enormous reach and endless
communication possibilities. It allows brands to emerge into a world of peer-to-peer dialogue and
therefore the possibility of harnessing the brand building potential of the richest communication
form available. However, it is important to do it right. The study of Rashmi Belwal shows that how
social media has become an important tool for marketing and creating brand awareness. In fact it is
foreseen that in the near future there will be a paradigm shift from traditional advertising to social
media platforms.
49
CHAPTER FIVE
Summary, Conclusion and Recommendation
This chapter presents the Summary, conclusions and recommendation derived from the data
analysis carried out in the previous section.
5.1 Summary of major finding
The main objective of the study was the influence of Promotional mix communication on the
customer brand preference of origin natural mineral water brand in Ethiopia. The study about
Promotional mix (advertisement, sales promotion, personal selling ) and brand preference
accordingly, the following are major findings of the study.
• Demographics characteristics of respondents shows the age distribution of respondents of the
total, the majority 135(38.4%) of respondents lies in the age range of 25-34 years and the age
group of 15-24, respondents followed the previous group with a percent share of 86(24.4%)
and age range between 35-44 is 82(23.3%) The age group 45+ contributed 49(13.9%).
• Gender of respondents shows out of 352 respondents, 166(47.2%) of them are males and the
remaining 186(52.8) % are females.
• Regarding, educational background range from No Education level to masters and above.
Out of which 14(4.0%) of them have No Education level ,51(14.5%) are High School,
73(20.7%) of them have College diploma ,147(41.8%) are First degree holders and the rest
67(19%)of them have masters and above.
• The majority of respondents earned ETB >5000 monthly household income of 140 (39.8%)
followed by those respondents who earn ETB 4001-5000 who account 91(25.9)% and
respondents who earn ETB 3001-4000 66(18.8)%,respondents who earn ETB 2001-3000 28
(8.0)%,respondents who earn ETB 1001-2000 20(5.7)% and at last respondents who earn
ETB <1000 monthly income of 7(2.0)%.
• Indicates that from all 352 respondents ,312(88.16)% respondents agree that Bottled water is
safer than Tap water and 40(11.4)% doesn’t agree that Bottled water is safer than Tap water.
50
The respondents who drink ORIGIN mineral water brand products are 302(85.8)% and who
don’t drink 50(14.2)%.
• The findings revealed that four components of Promotional mix: advertisement, sales
promotion, personal selling and social media are well correlated with consumers’ preference
of origin mineral water brand. Pearson correlation coefficient shows that there is strong
relationship with one of the independent variables which is social media and dependent
variable (brand preference) i.e. 0.569.The correlation between the rest of independent
variables (: advertisement ,sales promotion ,personal selling) variable and dependent variable
(brand preference is moderate) .i.e. 0.329,0. 475 and 0. 525respectively.
• The result of multiple regression analysis between dependent variable (brand preference) and
independent variables(Advertising, Sales promotion, Personal selling, Social media). Among
the four independent variables, multiple regression analysis revealed that Sales promotion,
Personal selling and Social media were a significant predictor of consumers origin mineral
water brand preference by the p-value(p<0.05), while the influence of Advertising (p=0.
.878) on origin mineral water brand preference was not found significant. The nature of
relationship was positive for Sales promotion (β=0. .191), Personal selling (β=0. .225) and
Social media (β=0. .370) and on the other hand Advertising display negative influence on
brand preference with (β= - 0.008).
• Among variables those have a significance relationship with origin mineral water brand
preference. Social media has the highest standardized regression coefficient and the lowest
significance (β=0.786, p=0.000), which means Social media are the most important
predicator of consumer origin mineral water brand preference followed by Personal selling
(β=0. .225, p=0.000). Sales promotion was found to be the list variable that influences the
origin mineral water brand preference of consumers.
51
5.2 Conclusion
The main purpose of this research focuses on understanding the influence of Promotional mix
implemented by origin mineral water brand on consumers’ brand preference in Ethiopia. The main
issue in implementing Promotional mix is to cope up those marketing communication practices with
the fusion of available resources and various communication channels and building an understanding
of consumers’ preferences. The result form this study will helps to recognize the adaptation in their
marketing practices according to the changing environment and changing consumers’ buying trends
and highlight the important tools which are mostly influencing consumers to prefer origin mineral
water brand.
Among elements of Promotional mix communication social media is the most important factor for
consumers to prefer origin mineral water brand products, which means that they are more in touch
with these tools as compare to other. This may be because Nowadays, technology is important aspect
for origin mineral water’s Promotional mix communication implementation as consumers in
Ethiopia are getting more involved in to social media, internet and online activities. There is a
groundswell support for social media in the published literature and businesses using these
technologies seem to be more than just because is the latest trend.
Social media has become an imperative conduit for global marketing communications and is
commanding a larger share of advertising budgets, especially to reach the younger generation.
Therefore, the value of advertising on social media such as Facebook, YouTube, LinkedIn,
Twitter and others is of great interest to organizations, managers and academics (Saxena &
Khanna, 2013). In theory, social media is indeed an effective business tool. There are many articles
in the web, books, research-based evidence to prove it.
On the other hand, Sales promotion is significant for preferring origin mineral water brand products
due to a diverse collection of mostly short term incentives designed to motivate consumers
Personal selling activities, is significant for preferring origin mineral water brand products due to the
fact that origin mineral water companies practice such activities.Its revealed that respondents were
very satisfied with information on how sales persons promotes the organization brand and
information on the benefits of the promotion.
52
Advertisement is that advertisement activities are not aggressively implemented and also not
efficiently implemented to influence them to prefer origin mineral water brand as compared to other
promotional mix communication tools. Based on feedback and analysis this study it can be
concludes that origin mineral water Promotional mix communication implementation strategy meets
its target in creating brand preference.
This research concludes that Promotional mix communication is the best way to influence the
consumers on their brand preference., because the consumers are strongly influenced by
Promotional mix communication implementations. The research also confirms the past research
literatures are valid and reliable after data analysis of consumers’ feed backs. Concluding the
consumers feedback, is obvious that they want firm to incorporate Promotional mix communication
activities as they are well informed and able to purchase from the variety of water brands available,
so which water brand reach them more effectively will influence them more.
5.3 Recommendation
Based on the major findings of the study and conclusion drown above, the following
recommendations are made,
• According to Schultz, an IMC plan is created not only to transmit a consistent message about
the company and its customers but also to choose the most effective methods for
communicating and building relationship with the current and potential customers. origin
mineral water need to analyse by building relationship with consumers and implementing
Promotional mix communication practices.
• Origin mineral water company should use more of Facebook ,Instagram and WhatsApp for
achieving wide reach since they are most frequent and widely used And for providing
adequate product information. Social media marketing should be leveraged on because it is
perceived to be more creative and attractive compared to other marketing platforms.
• The key recommendations for personal selling is Origin mineral water company should
maintain current performance on personal selling as most customers are happy across the
53
various factors which include the types of products it is done for; household and personal
care. Consumers also appreciate the extra convincing efforts implemented for water items.
And it increases the trustworthiness and image of a brand
• Recommendations for Sales promotions ,in Origin mineral water company Price discounts
should be widely used however there is potential to get more effective results through ‘extra
amounts’ e.g. buy 2 get 1 free. Leverage on training sales representatives and effective TV
communication since they are the main sources of knowledge on sales promotions. Sales
promotions should be used to boost immediate sales since they promote temporary switch of
brands.
• Origin mineral water company should start advertise more since it’s a big marketing weapon
to attract customers and stay in customers’ mind, and it will have significant impact on
consumers to prefer Origin mineral water brand. Consumers will recall and rely on
advertisements of Origin mineral water. This recall helps them in preferring Origin mineral
water brand and made impulse purchase any time they are exposed to the advertisement.
5.3 Further Area Of Study
This study has explored the influence of promotional mix communication on brand preference in the
case of origin mineral water brand. Further research is needed to validate the results reported in
this study by extending this research to include a broader region with a larger sample size
in order to ascertain if the present findings are applicable to the broader population of other
bottled water brands . Additionally, this study examined the influence of promotional mix on brand
preference by focusing only on the origin mineral water industry should see other bottles water
company too. This research strictly concerned itself in investigating the effectiveness of marketing
tools such as Advertisement, personal selling, sales promotion and social Media, on consumers
brand preference since origin mineral water company focus on this tools of promotional mix. Other
promotional mix tools like Public Relations and Direct Marketing should be also considered in the
future studies.
54
Reference
Aaker, J.L., (1997) Dimensions of brand personality, Journal of marketing research, pp.347-356.
Adebisi, S.A. and Babatunde, B.O. (2011). Strategic influence of promotional mix on organizational
sale turnover in the face of strong competitors. Business Intelligence Journal, 4 (2): 343-350.
Aghdaie, S.F.A., & Yousefi, E. (2011) ‘The Comparative Analysis Of Affecting Factors On
Purchasing Domestic And Imported Cars In Iran Market-Using AHP Technique.’
International Journal Of Marketing Studies, 3(2), Pg.142.
Alharthey, Bandar khalaf .(2015) ‘understanding Decision Making of Consumers through
Advertising Strategy and Integrated Marketing, journal of marketing
management,5(26),pp.10446-10451.
Arnold, E. (2006, February 2). BOTTLED WATER: Pouring Resources Down the Drain. Retrieved
April22,2011,fromearthpolicy.org:http://www.earthpolicy.org/Updates/2006/Update51_print
able.htm (6 de 7)25/02/2006 18:52:45
Bagozzi,R.P., & Dholakia,U.M. (2006) ‘Antecedents And Purchase Consequences Of Customer
Participate on In Small Group Brand Communities.’ International Journal Of Research In
Marketing, 23(1), pg. 45-61.
Baungartner J. (1991). Nonmarketing Professionals Need More Than 4Ps, Marketing News.
Belch, G. E., & Belch, M. A., (6th ed.). (2003) Advertising and promotion: An Integrated Marketing
Communications perspective. New York: Tata McGraw-Hill.
Belch, George E., & Belch, Michael A., (5thed.). (2001) Advertising and Promotion: An Integrated
Marketing Communications Perspective. New York : Irwin/McGraw-Hill.
Bhattacharya, C.B., & Sen,S. (2003) ‘Consumer-Company Identification: A Framework For
Understanding Consumers Relationships With Companies.’ Journal Of Marketing, 67(2), pg.
76-88.
55
Blanchard, A.L., & Markus, M.L. (2004) ‘The Experienced Sense Of A Virtual Community:
Characteristics And Processes.’ ACM Sigmis Database, 35(1), pg.64-79.
Blattberg., & Neslin, S.A.(1990) sales promotion: Concepts Methods and strategies, Englewood
Cliffs,N.J:Prenrice Hall.
Booms B. H. & Bitner B. J. (1980). Marketing strategies and organization structures for service
firms. In Donnelly, J. & George W. R. (Eds.), Marketing of services. American Marketing
Association, 47-51.
Borden, N. H. (1965). The concept of the marketing mix. In Schwartz, G. (Ed), Science in
marketing. New York: John Wiley & Sons, 386-397.
Cant, MC & Van, Heerden C.H. (2004). Personal Selling. Lansdowne : Juta and Co Ltd., 2004.
Casaló, L.V, Flavián, C, & Guinalíu, M. (2010) ‘ Determinants Of The Intention To Participate In
Firm-Hosted Online Travel Communities And Effects On Consumer Behavioral Intentions’,
Tourism Management, 31(6), pp. 898-911.
Chakrabortty, R.K., Hossain, M., Azad, F.H., and Islam, J. (2013). Analyzing the effects of sales
promotion and advertising on consumer’s purchase behavior. World Journal of Social
Sciences, 3 (4): 183-194.
Chakravarti, A., & Janiszewski, C. (2003) ‘The Influence Of Macro‐Level Motives On
Consideration Set Composition In Novel Purchase Situations.’ Journal Of Consumer
Research, 30(2), pg.244-258.
Chevalier, J.A., & Mayzlin, D. (2006) ‘The Effect Of Word Of Mouth On Sales: Online Book
Reviews.’ Journal Of Marketing Research, 43(3), pg.345-354.
Clow, K. E & Baack, D. (2007). Integrated advertising, promotion & marketing communications.
Upper Saddle River, N.J: Pearson Prentice Hall.
Culliton, J.W. (1948). The Management of Marketing Costs. Division of Research, Graduate School
of Business Administration, Boston, MA: Harvard University.
56
Dibb S., Simikin L., Pride W.M., and Ferrell O.C. (2006) Marketing: Concept and Strategies 5.
Houghton: Mifflin Company Hartford.
Doyle.(1989)’the role of advertising in brand image development’, journal of products& Brand
management,Vol.4issuse:4,pp23-34.
Duncan, T. & Duncan, T. (2005) Principles of advertising & IMC. Chicago IL: McGraw Hill/Irwin.
Dutton, J.E., & Dukerich, J.M. (1991) ‘Keeping An Eye On The Mirror: Image And Identity In
Organizational Adaptation.’ Academy Of Management Journal, 34(3), pg. 517-554.
Emily, A., & Janet, L. (2006) Plan B Updates From Earth Policy Institute: Available at
http://www.earth-policy.org/index.php?/plan_b_updates/2006/update51. [Retrieved March
13, 2011].
Evans, D. & McKee, J. (2010) Social Media Marketing The Next Generation of Business
Engagement, Wiley Publishing, Inc., Indianapolis, Indiana.
Farquhar, P.H. (1989).Managing Brand Equity. Marketing Research ,1(September),24-33.
Ferrier, C. (2001) ‘ Bottled Water: Understanding a Social Phenomenon of Ambo’ 30(2), pp. 118-
119.
Frey, A. W. (1961). Advertising (3rd ed.). New York: The Ronald Press.
Gedamnesh Tesfay, (2014). ‘Choice of consumers: the case of bottled water brands in Addis Ababa.’
School of Commerce. Addis Ababa University. Unpublished Thesis paper.
Gedamnesh Tesfaye, (2013). Factors Underlying Brand Choice of Consumers: The Case of Bottled
Water Brands in Addis Ababa. Unpublished Master‟s Thesis, Addis Ababa University.
Ghose, S., & Lowengart, O. (2013) ‘Consumer Choice And Preference For Brand Categories’,
Journal Of Marketing Analytics, 1(1), pp. 3-17.
Goldsmith R. E. (1999). The Personalized Marketplace: Beyond the 4Ps. Marketing Intelligence and
Planning, 17(4),178-185.
57
Hair, J. B. (2010). Multivariate Data Analysis. PEARSON.
Hair, j. f., Black, w. c., Babin, b. J. & Anderson, r. e., 2010. Multivirate Data Analysis. 6th
ed.s.l.:Pearson prentice Hall.
Heilman, Kyryl Lakishyk, Sonja Radas, (2011) "An empirical investigation of in‐ store sampling
promotions", British Food Journal, Vol. 113 Issue: 10, pp.1252-1266.
Hellier, P.K., Geursen , G.M., Carr, R.A., & Rickard, J.A. (2003) ‘ Customer repurchase intention: A
general structural equation model.’ European journal of marketing, 37(11/12), pp.1762-1800.
Hodder Education (n.d). Introduction to the Marketing Mix - Pricing. [Online] Available
http://www.hoddersamplepages.co.uk/pdfs/cceabus6.pdf.
Holbrook, Morris B., & Hirschman, Elizabeth C. (1982) ‘ The experiential aspects of consumption:
Consumer fantasies, feeling, and fun.’ Journal of Consumer Research, 9 (September),
pp.132-140.
Israel, G. D. (2012). Determining Sample Size 1. Florida: University of Florida.
Jobber, D. (2001). Principles and practice of marketing (3rd Edition). London: McGraw-Hill
International (UK) Limited.
Jobber, D. and Lancaster, G. (2006). Selling and sales management (7th Edition). Harlow: Prentice
Hall
Julian & Ramaseshan (2004).effect of salesperson on consumer brand preference
;,AUR,vol.3no.2,july-december 2009,pp-57-64.
Kapferer, Jean-Noel. (2008). The New Strategic Brand Management: Creating and Sustaining Brand
Equity. London: kogan page.
Keller, K.L. (2003) ‘Brand synthesis: The multidimensionality of brand knowledge.’ Journal of
consumer research, 29(4), pp.595-600.
58
Keller, L. K. (2001) ‘Mastering the Marketing Communications Mix: Micro and Macro perspectives
on Integrated Marketing Communication Programs’, Journal of Marketing Management, Vol
(17), pp. 819 – 847.
Kothari, C. (2004). Research Methodology. New Delhi: New Age International (P) Limited.
Kotler, P. (1986). Principles of Marketing (3rd ed.). New Jersey: Prentice Hall.
Kotler, P. (2000) Principles of marketing: prentice- Hall, Inc., N.J.
Kotler, P. (2002). ‘Integrated Advertising, Promotion and Marketing Communications’, pp. 338.
Prentice Hall PTR.
Kotler, P. and Armstrong, G. (1997) Marketing: An Introduction. 4th Ed. New Jersey. Prentice Hall
International.
Kotler, Philip & Armstrong, Gary.(2010). Principles of Marketing. NewJersey :Pearson Education,
Inc.
Kotler,P.& Keller,K.L.(14thed.).(2012) Marketing Management. NewJersey: Pearson Education,Inc.
Lamb, C. W., Hair, J. F., & McDaniel, C. (1996). Marketing, 3rd edition. Cincinnati, OH: South‐
Western College Publishing.
Lazer, W. & Kelly, E. K. (1962). Managerial Marketing: Perspectives and Viewpoints. IL: Richard
D. Irwin.
Lazer, W., Culley, J.D. & Staudt, T. (1973). The Concept of the Marketing Mix, In Britt, S. H. (Ed.),
Marketing.
Lenzner, R., (1997) ‘Monster beverage Water, water, everywhere.” Forbes,160, pp.64-64.
Loureiro, S.M., Sardinha, I.M.D., & Reijnders, L. (2012). The Effect Of Corporate Social
Responsibility On Consumer Satisfaction And Perceived Value:
Lovelock, Christopher & Wirtz, Jochen. (2011) Service Marketing: People, Technology, Strategy.
Edinburgh : Pearson Education.
59
M Sayeed Alam and Md. Farhan Faruqui (2009), effect of sales promotion on consumer brand
preference ;,AUR,vol.3no.2,july-december 2009,pp-57-64.
MaGrath A. J. (1986). When Marketing Services, 4Ps Are Not Enough. Business Horizons, 29(3),
45-50.
Malhotra, N. K., & Birks, D. F. (2007). Marketing Research: An Applied Approach (Third European
Edition ed.). England: Prentice Hall, Inc., a Pearson Education company.
Marczyk, G., DeMatteo D. and Festinger, D. (2005), Essentials of Research Design and
Methodology, Published by John Wiley & Sons, Inc., Hoboken, New Jersey
Mathur, A., Moschis, G.P. & Lee, E. (2003) ‘Life events and brand preference changes.’ Journal of
Consumer Behaviour, 3(2), pp.129-141.
Matthew, J., Ogedebe, P.M., and Ogedegbe, S. (2013). Influence of web advertising on consumer
behavior in Maiduguri Metropolis, Nigeria. Asian Journal of Social Sciences and
Humanities, 2 (2): 548-557.
Maurya, & Mishra,P. (2012) ‘What is a brand? A Perspective on Brand Meaning.’ European Journal
of Business and Management, 4(3), pp.122-133.
McCarthy, E. J. (1964). Basic Marketing, IL: Richard D. Irwin.
Mccoll-Kennedy, J. R., & Fetter Jr, R. E. (2001) ‘An Empirical Examination Of The Involvement To
External Search Relationship In Services Marketing.’ Journal Of Services Marketing, 15(2),
pg.82-98.
Melkamu Daba, (2014). “The effect of media advertising on consumers’ buying behavior in the
banking service (The case of Oromia International Bank S.C)”. School of Commerce. Addis
Ababa University. Unpublished Thesis paper
Mickwitz, G..(1959). Marketing and Competition. Finland: Societas Scientarium Fennica,
Helsingfors.
Mitchell, A (1984).Marketing sales promotion force: Hampshire and London: Macmillan Press Ltd.
60
Möller, K. (2006). The Marketing Mix Revisited: Towards the 21st Century Marketing by E.
Constantinides. Journal of Marketing Management, 22(3), 439-450
Muthukrishnaveni, D. and Muruganandam, D. (2013). Effect of sales promotions on consumer
purchase behaviour with reference to personal care products. International Journal of
Scientific Research, 2 (10): 1-2.
Naeem, et.al. (2013), ‘Integrated Marketing Communication: A Review Paper’, Interdisciplinary
Journal Of Contemporary Research In Business, 5(5), pp.124-133.
Olakunori O.K(1997),successful Research Theory and practice :amazing grace printing and
publishing company.
Olson, E. D. (1999). Bottled Water: pure drink or pure hype? California: NRDC Publications
Department.
Oluwatayo, J. A. (2012). Validity and Reliability Issues in Educational Research. Journal of
Educational and Social Research , Vol. 2 (No. 2).
Osman, M. A., Talib, A.Z., Sanusi, Z.A., Shiang-Yen, T. & Alwi, A.S. (2012) ‘A Study Of The
Trend Of Smartphone And Its Usage Behavior In Malaysia.’ International Journal Of New
Computer Architectures And Their Applications (IJNCAA), 2(1), pg. 274-285.
Pallant, J. F. (2005). SPSS Survival Manual: a step by step guide to data analysis using SPSS (1st
ed.). Crows Nest, Australia: Allen & Unwin.
Rao, K. Rama, Mohana. (2011) Services Marketing. Singapore : Pearson Education.
Rashmi F, Belwal.(2013)’ Social media Marketing Management, 12 (3), pg. 26- 32.
Rasmussen, A. (1955). Pristeori Eller Parameterteori - Studier Omkring Virksomhedens Afsaetning
(Price Theory or Parameter Theory - Studies of the Sales of the Firm. Denmark:
Erhvervsokonomisk Forlag.
Ray,M.L,Sawyer,A.G,Rothschlid,M.L,.Heeler,R.M.,Strong,E.C.&Reed,J.B(2012)Mareketing
communication and the hierarchy of effects.
61
Rijnsoever, V, Farla, F.J, & Dijst, M. J. (2009) ‘ Consumer Car Preferences And Information Search
Channels’, Transportation Research Part D: Transport And Environment, 14(5), pp. 334-342.
Rizwan, M., Javed, M.A., Khan, M.T., Aslam, M.T., Anwar, K., Noor, S., and Kanwal, W.(2012).
The impact of promotional tools on consumer buying behavior: A study from Pakistan. Asian
Journal of Empirical Research, 3 (2): 118-134.
Rundle-Thiele, S., & Mackay, M.M. (2001) ‘Assessing the performance of brand loyalty measures.’
Journal of Services Marketing, 15(7), pp. 529–546.
Saunders, M., Lewis, P. & Thornhill, A. (5th ed.).(2009) Research methods for business students.
Harlow, England: Pearson Education Limited.
Saxena, A., & Khanna,U.(2013). Advertising on social network sites: a structural equation
modelling approach. Vision, Vol. 17 No. 1, pp. 17 25
Schultz., Don E.; Tannenbaum, Stanley & Lauterborn, Robert,F. (1993). Integrated Marketing
Communcations. Chicago : NTC Publishing Business Books.
Shutri Arora & Anukrati Sharam.(2013) “Social Media: Marketing The Next Generation of Business
Engagement, Wiley Publishing, Inc., Indianapolis, Indiana
Soiferman, L.K., (2010). Compare and Contrast Inductive and Deductive Research Approaches.
Online Submission.
Swani, K., & Yoo, B. (2010) ‘Interactions Between Price And Price Deal.’ Journal Of Product &
Brand Management, 19(2), pg.143-152.
Tahir Ali is Professor ,Department of commerce, University of Karachi ,[email protected]
Tamara, H.B., (2014), Perceived advertising., European Journal of Business and Management,
Vol.(5), Nr.2, p.41.
Taylor, S.A., Hunter, G. L., & Lindberg, D. L. (2007) ‘Understanding (Customer-Based) Brand
Equity In Financial Services.’ Journal Of Services Marketing, 21(4), pg. 241-252.
62
Verhallenet al. (2007). effect of salesperson on consumer brand preference ;,AUR,vol.3no.2,july-
december 2009,pp-57-64.
Vignali, C. & Davies, B. J. (1994). The Marketing Mix Redefined and Mapped - Introducing the
MIXMAP Model.
Webster, M. Definition of Social Media.www.merriam-ebster.com/dictionary/social media.
(Accesses 18/11/2013).
Wheeler, A. (2012). Designing brand identity: an essential guide for the whole branding team. John
Wiley & Sons.
William, C. A. (1991). Business Research Methods. Boston: Richard D. IRWIN INC.
Wright, P, L. (1973) ‘The Cognitive Processes Mediating Acceptance Of Advertising.’ Journal Of
Marketing Research, pg. 53-62.
Yeboah, A., & Atakora, A. (2013) ‘Integrated Marketing Communication: How Can It Influence
Customer Satisfaction? ’, European Journal of Business and Management, Vol.(5), Nr.2,
p.41.
Yoo, B., Donthu, N. & Lee, S., 2000. An Examinaton of Selected Marketing Mix Elements and
Brand Equity. Journal of the Academy of Marketing Science , 28(2), pp.195-211.
Zaichkowsky, J. L. (1987) ‘The Emotional Effect Of Product Involvement.’ Advances In Consumer
Research, 14, pg. 32-35.
Zoltanpolla. (2017). Effect of Personal Selling and Marketing on Sales Growth. Retrieved from
URL: http://www.zoltanpolla.com/marketing/effect-of-personalselling-and-marketing-on-
sales-growth/index.html
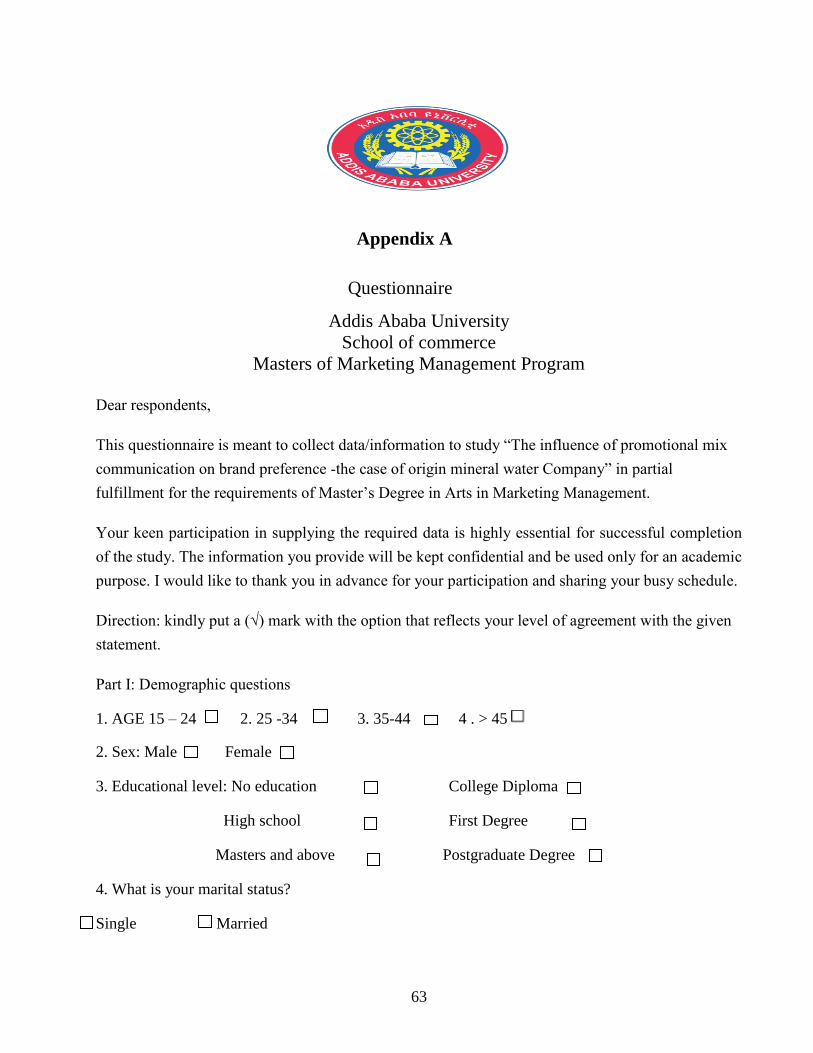
63
Appendix A
Questionnaire
Addis Ababa University
School of commerce
Masters of Marketing Management Program
Dear respondents,
This questionnaire is meant to collect data/information to study “The influence of promotional mix
communication on brand preference -the case of origin mineral water Company” in partial
fulfillment for the requirements of Master’s Degree in Arts in Marketing Management.
Your keen participation in supplying the required data is highly essential for successful completion
of the study. The information you provide will be kept confidential and be used only for an academic
purpose. I would like to thank you in advance for your participation and sharing your busy schedule.
Direction: kindly put a (√) mark with the option that reflects your level of agreement with the given
statement.
Part I: Demographic questions
1. AGE 15 – 24 2. 25 -34 3. 35-44 4 . > 45
2. Sex: Male Female
3. Educational level: No education College Diploma
High school First Degree
Masters and above Postgraduate Degree
4. What is your marital status?
Single Married
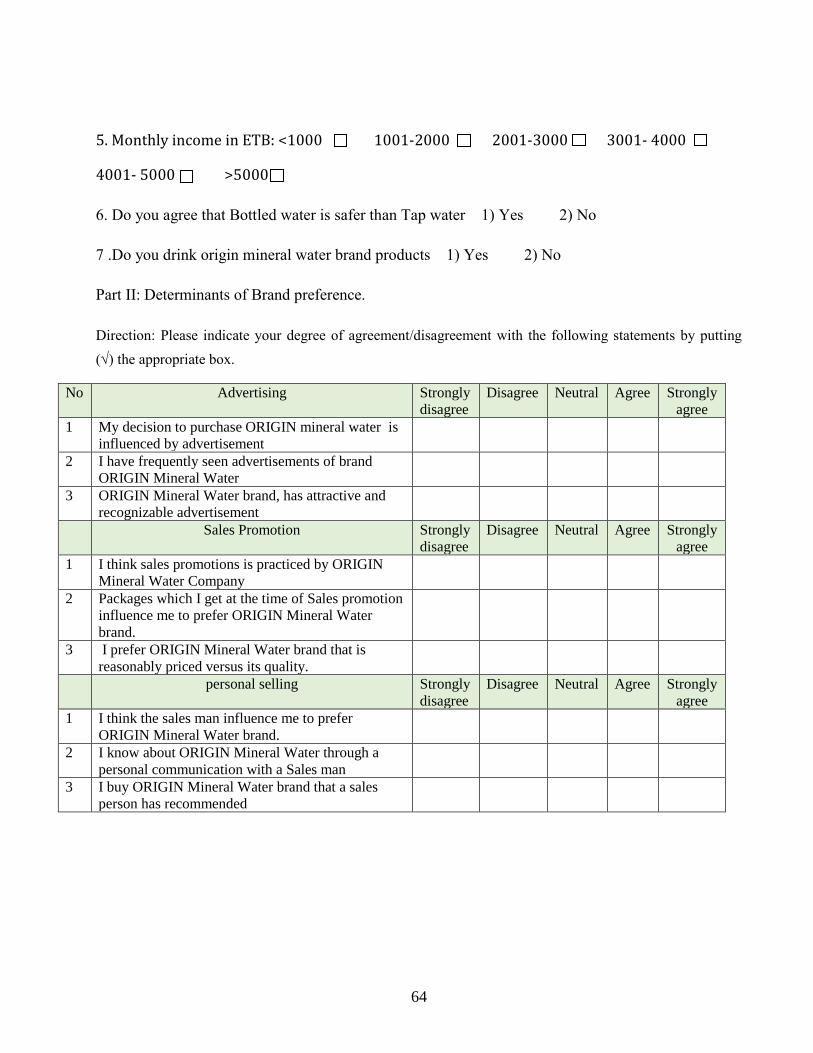
64
5. Monthly income in ETB: <1000 1001-2000 2001-3000 3001- 4000
4001- 5000 >5000
6. Do you agree that Bottled water is safer than Tap water 1) Yes 2) No
7 .Do you drink origin mineral water brand products 1) Yes 2) No
Part II: Determinants of Brand preference.
Direction: Please indicate your degree of agreement/disagreement with the following statements by putting
() the appropriate box.
No Advertising Strongly
disagree
Disagree Neutral Agree Strongly
agree
1 My decision to purchase ORIGIN mineral water is
influenced by advertisement
2 I have frequently seen advertisements of brand
ORIGIN Mineral Water
3 ORIGIN Mineral Water brand, has attractive and
recognizable advertisement
Sales Promotion Strongly
disagree
Disagree Neutral Agree Strongly
agree
1 I think sales promotions is practiced by ORIGIN
Mineral Water Company
2 Packages which I get at the time of Sales promotion
influence me to prefer ORIGIN Mineral Water
brand.
3 I prefer ORIGIN Mineral Water brand that is
reasonably priced versus its quality.
personal selling Strongly
disagree
Disagree Neutral Agree Strongly
agree
1 I think the sales man influence me to prefer
ORIGIN Mineral Water brand.
2 I know about ORIGIN Mineral Water through a
personal communication with a Sales man
3 I buy ORIGIN Mineral Water brand that a sales
person has recommended
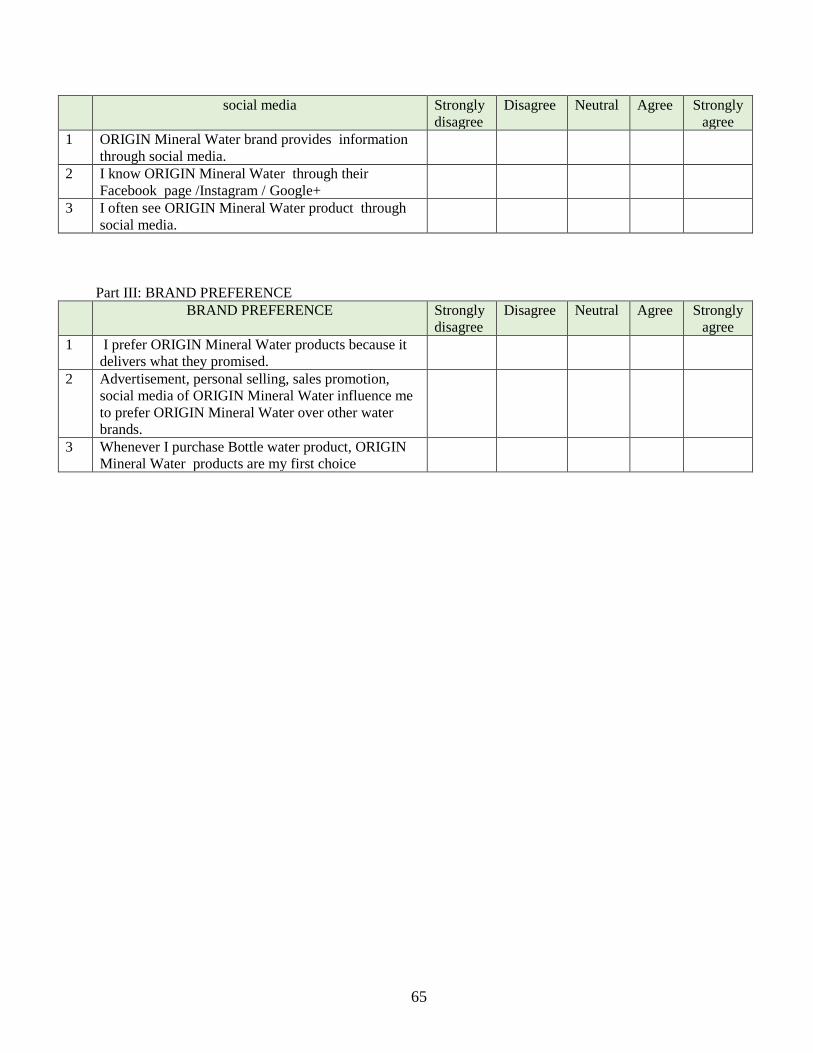
65
social media Strongly
disagree
Disagree Neutral Agree Strongly
agree
1 ORIGIN Mineral Water brand provides information
through social media.
2 I know ORIGIN Mineral Water through their
Facebook page /Instagram / Google+
3 I often see ORIGIN Mineral Water product through
social media.
Part III: BRAND PREFERENCE
BRAND PREFERENCE Strongly
disagree
Disagree Neutral Agree Strongly
agree
1 I prefer ORIGIN Mineral Water products because it
delivers what they promised.
2 Advertisement, personal selling, sales promotion,
social media of ORIGIN Mineral Water influence me
to prefer ORIGIN Mineral Water over other water
brands.
3 Whenever I purchase Bottle water product, ORIGIN
Mineral Water products are my first choice
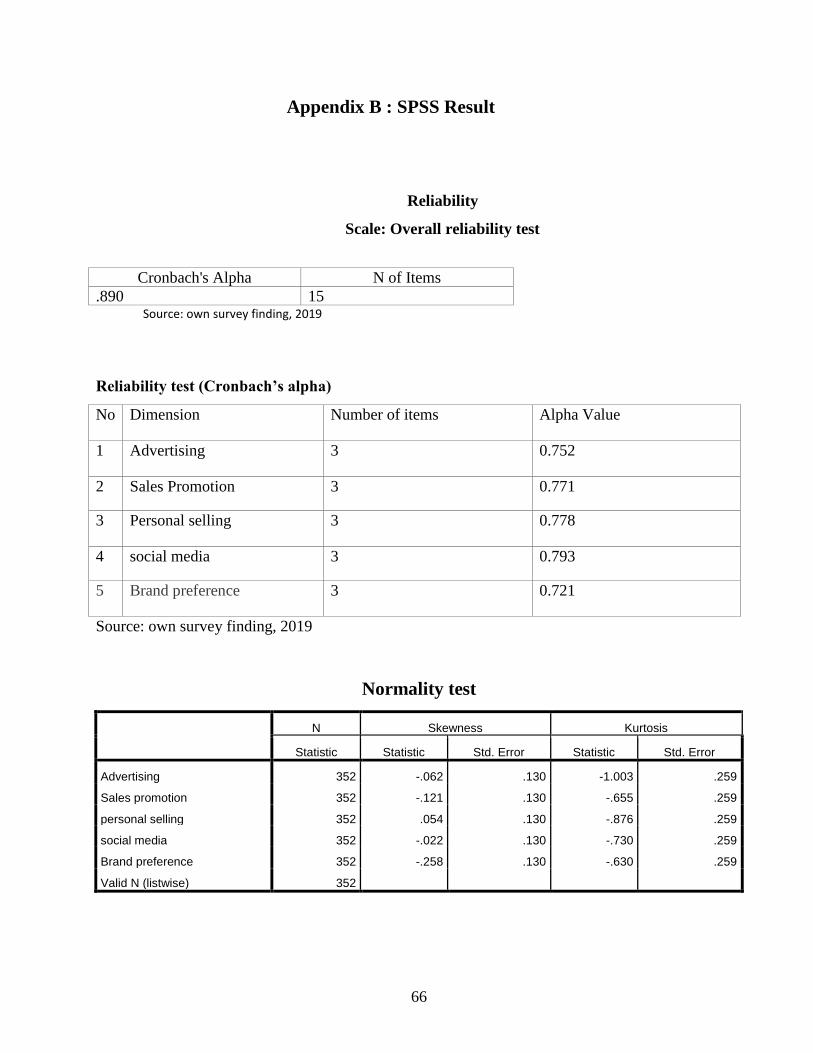
66
Appendix B : SPSS Result
Reliability
Scale: Overall reliability test
Cronbach's Alpha N of Items
.890 15 Source: own survey finding, 2019
Reliability test (Cronbach’s alpha)
No Dimension Number of items Alpha Value
1 Advertising 3 0.752
2 Sales Promotion 3 0.771
3 Personal selling 3 0.778
4 social media 3 0.793
5 Brand preference 3 0.721
Source: own survey finding, 2019
Normality test
N Skewness Kurtosis
Statistic Statistic Std. Error Statistic Std. Error
Advertising 352 -.062 .130 -1.003 .259
Sales promotion 352 -.121 .130 -.655 .259
personal selling 352 .054 .130 -.876 .259
social media 352 -.022 .130 -.730 .259
Brand preference 352 -.258 .130 -.630 .259
Valid N (listwise) 352
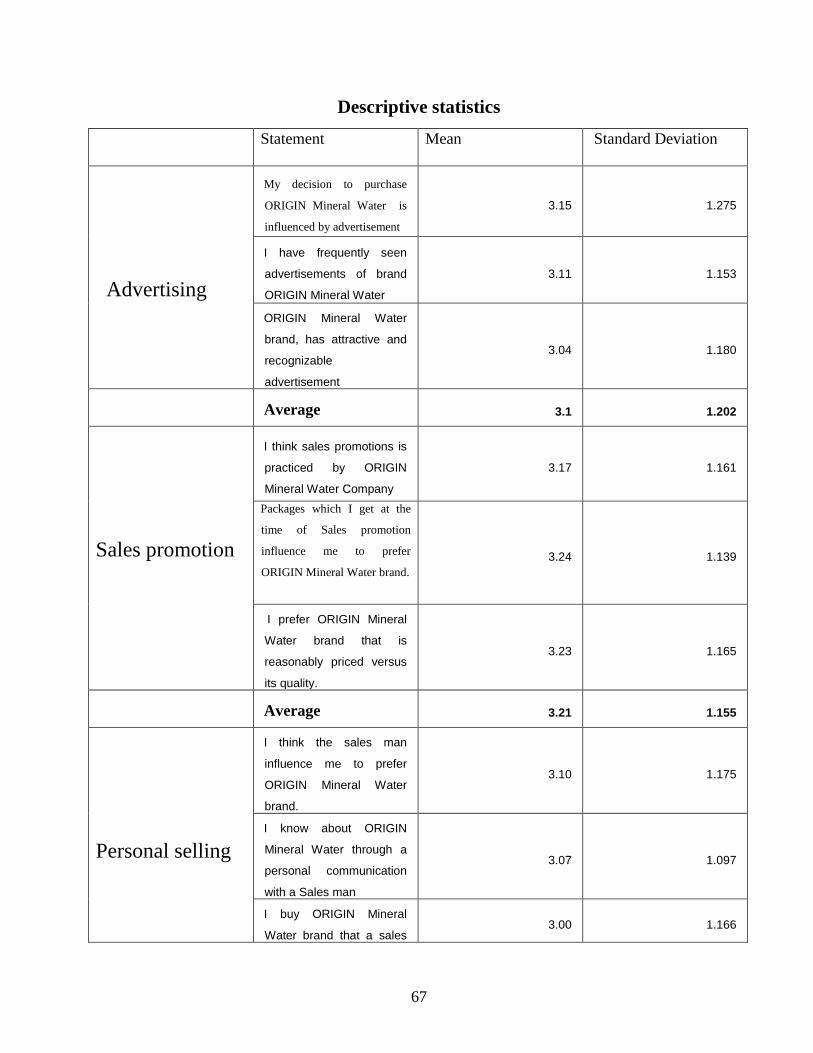
67
Descriptive statistics
Statement Mean Standard Deviation
Advertising
My decision to purchase
ORIGIN Mineral Water is
influenced by advertisement
3.15 1.275
I have frequently seen
advertisements of brand
ORIGIN Mineral Water
3.11 1.153
ORIGIN Mineral Water
brand, has attractive and
recognizable
advertisement
3.04 1.180
Average 3.1 1.202
Sales promotion
I think sales promotions is
practiced by ORIGIN
Mineral Water Company
3.17 1.161
Packages which I get at the
time of Sales promotion
influence me to prefer
ORIGIN Mineral Water brand. 3.24 1.139
I prefer ORIGIN Mineral
Water brand that is
reasonably priced versus
its quality.
3.23 1.165
Average 3.21 1.155
Personal selling
I think the sales man
influence me to prefer
ORIGIN Mineral Water
brand.
3.10 1.175
I know about ORIGIN
Mineral Water through a
personal communication
with a Sales man
3.07 1.097
I buy ORIGIN Mineral
Water brand that a sales 3.00 1.166
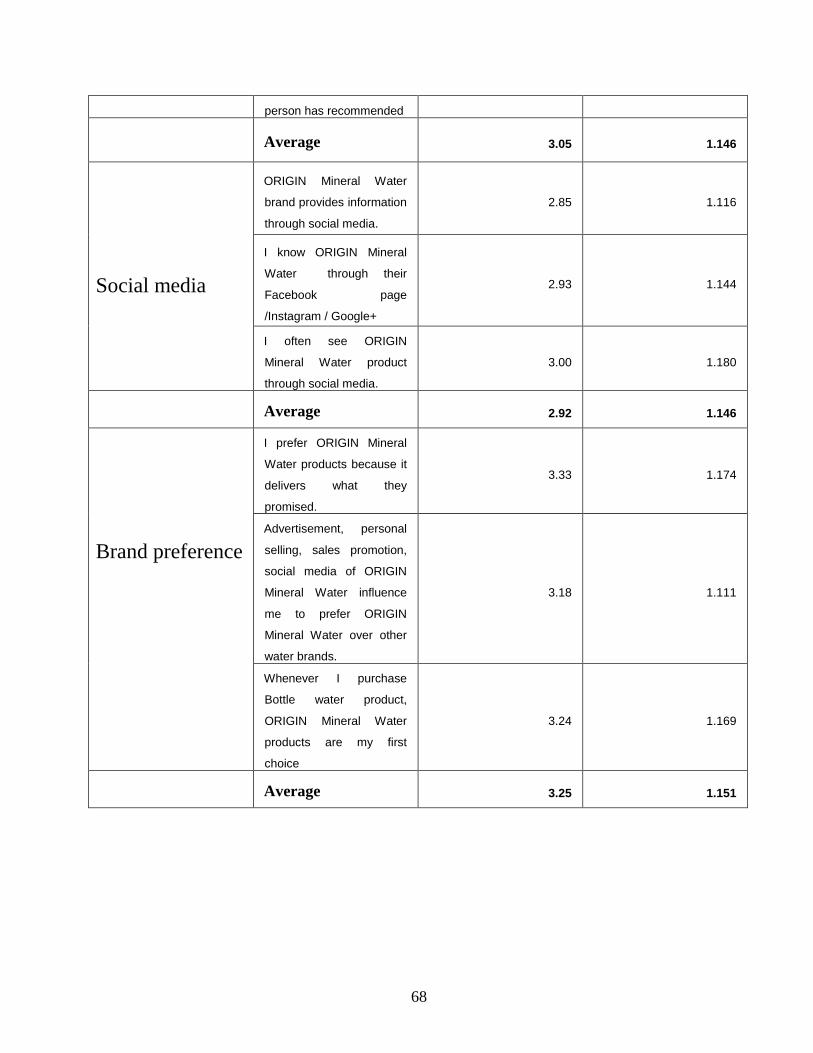
68
person has recommended
Average 3.05 1.146
Social media
ORIGIN Mineral Water
brand provides information
through social media.
2.85 1.116
I know ORIGIN Mineral
Water through their
Facebook page
/Instagram / Google+
2.93 1.144
I often see ORIGIN
Mineral Water product
through social media.
3.00 1.180
Average 2.92 1.146
Brand preference
I prefer ORIGIN Mineral
Water products because it
delivers what they
promised.
3.33 1.174
Advertisement, personal
selling, sales promotion,
social media of ORIGIN
Mineral Water influence
me to prefer ORIGIN
Mineral Water over other
water brands.
3.18 1.111
Whenever I purchase
Bottle water product,
ORIGIN Mineral Water
products are my first
choice
3.24 1.169
Average 3.25 1.151
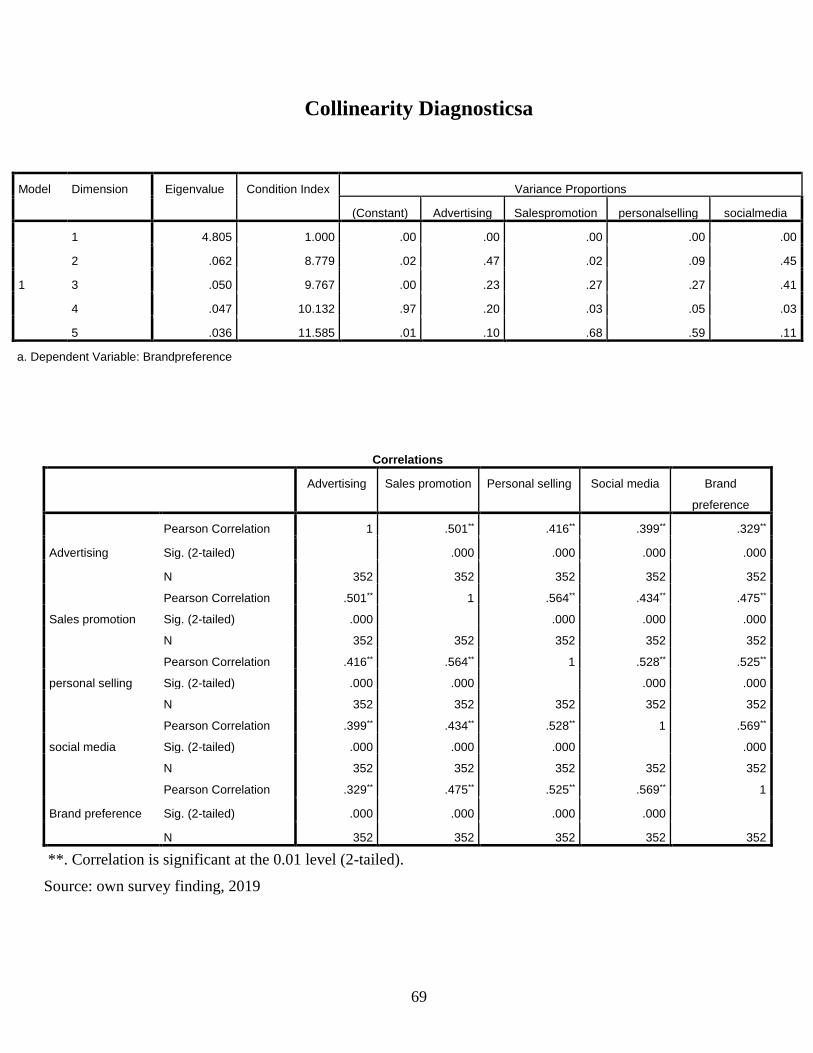
69
Collinearity Diagnosticsa
Model Dimension Eigenvalue Condition Index Variance Proportions
(Constant) Advertising Salespromotion personalselling socialmedia
1
1 4.805 1.000 .00 .00 .00 .00 .00
2 .062 8.779 .02 .47 .02 .09 .45
3 .050 9.767 .00 .23 .27 .27 .41
4 .047 10.132 .97 .20 .03 .05 .03
5 .036 11.585 .01 .10 .68 .59 .11
a. Dependent Variable: Brandpreference
Correlations
Advertising Sales promotion Personal selling Social media Brand
preference
Advertising
Pearson Correlation 1 .501** .416** .399** .329**
Sig. (2-tailed) .000 .000 .000 .000
N 352 352 352 352 352
Sales promotion
Pearson Correlation .501** 1 .564** .434** .475**
Sig. (2-tailed) .000 .000 .000 .000
N 352 352 352 352 352
personal selling
Pearson Correlation .416** .564** 1 .528** .525**
Sig. (2-tailed) .000 .000 .000 .000
N 352 352 352 352 352
social media
Pearson Correlation .399** .434** .528** 1 .569**
Sig. (2-tailed) .000 .000 .000 .000
N 352 352 352 352 352
Brand preference
Pearson Correlation .329** .475** .525** .569** 1
Sig. (2-tailed) .000 .000 .000 .000
N 352 352 352 352 352
**. Correlation is significant at the 0.01 level (2-tailed).
Source: own survey finding, 2019
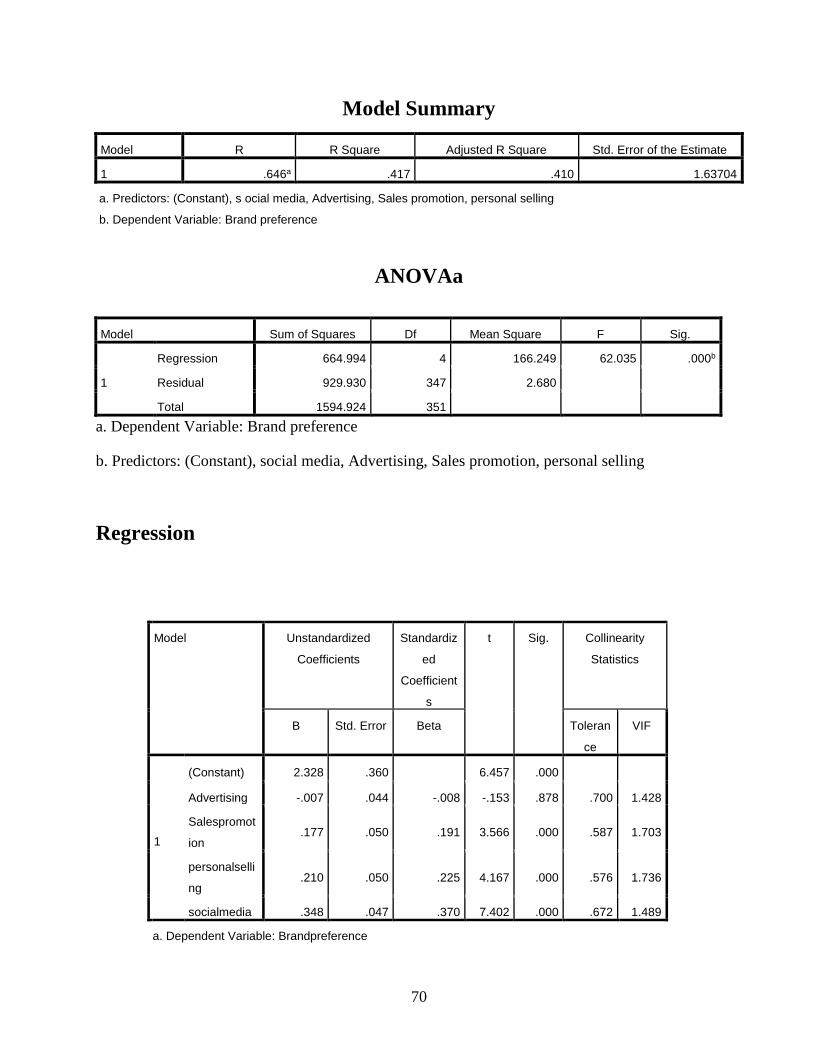
70
Model Summary
Model R R Square Adjusted R Square Std. Error of the Estimate
1 .646a .417 .410 1.63704
a. Predictors: (Constant), s ocial media, Advertising, Sales promotion, personal selling
b. Dependent Variable: Brand preference
ANOVAa
Model Sum of Squares Df Mean Square F Sig.
1
Regression 664.994 4 166.249 62.035 .000b
Residual 929.930 347 2.680
Total 1594.924 351
a. Dependent Variable: Brand preference
b. Predictors: (Constant), social media, Advertising, Sales promotion, personal selling
Regression
Model Unstandardized
Coefficients
Standardiz
ed
Coefficient
s
t Sig. Collinearity
Statistics
B Std. Error Beta Toleran
ce
VIF
1
(Constant) 2.328 .360 6.457 .000
Advertising -.007 .044 -.008 -.153 .878 .700 1.428
Salespromot
ion .177 .050 .191 3.566 .000 .587 1.703
personalselli
ng .210 .050 .225 4.167 .000 .576 1.736
socialmedia .348 .047 .370 7.402 .000 .672 1.489
a. Dependent Variable: Brandpreference
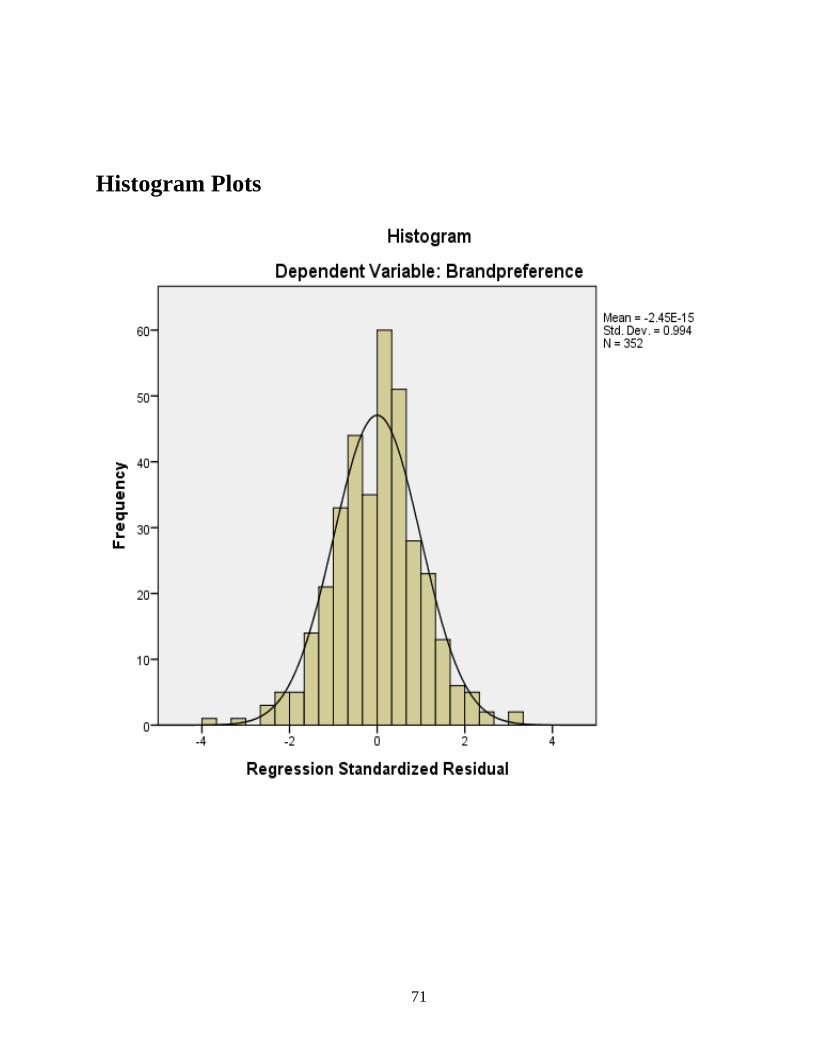
71
Histogram Plots
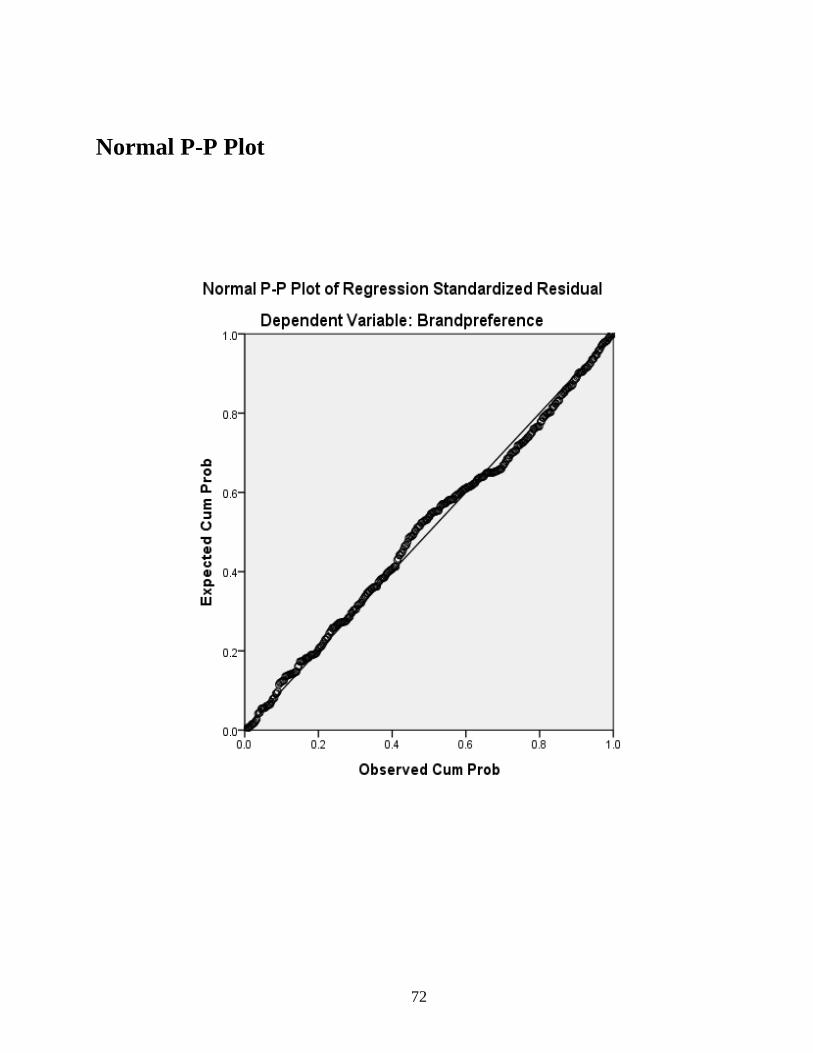
72
Normal P-P Plot
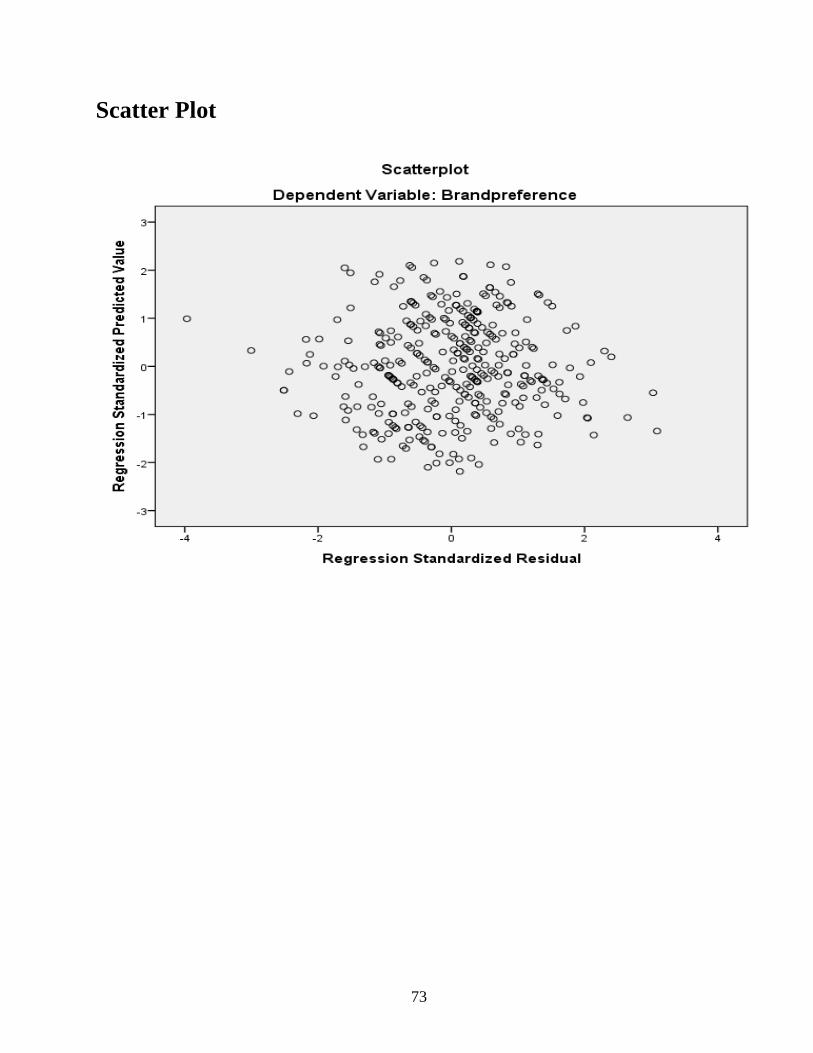
73
Scatter Plot