Embed Size (px)
Citation preview

METALLURGICAL AND MATERIALS TRANSACTIONS A VOLUME 34A SEPTEMBER 2003mdash1941
The Importance of Viscoplastic Strain Rate in the Formationof Center Cracks during the Start-Up Phase of Direct-ChillCast Aluminum Extrusion Ingots
M MrsquoHAMDI S BENUM D MORTENSEN HG FJAEligR and J-M DREZET
A comparison of experimental observations and computer simulations shows that trends in the occur-rence and severity of center cracks in direct-chill (DC) cast ingots due to different initial casting speedhistories may best be explained by the changes in viscoplastic strain rate close to the center of the baseof the ingot The thermomechanical histories of five ingots were simulated and correlations betweenstresses strains strain rates and liquid pressure drops due to feeding restrictions were considered
I INTRODUCTION
THE start-up period of the direct-chill (DC) castingprocess of extrusion ingots is the most critical phase forthe formation of hot tears The hot tearing tendency duringthis period depends on a number of process parametersIncreasing the casting speed for example increases the hottearing tendency leading to larger amounts of scrap to beremelted In some cases the cracks continue to extendthrough the entire process and the ingot must be rejected
A lot of work has been done in order to understand theformation of hot tears and a number of theories and criteriahave been proposed in the literature These studies agree thathot tearing occurs at the last stages of solidification whenthe fraction of solid is close to one[1] They also emphasizethe role of strain accumulation[2] and tensile stresses to whichthe material is subjected when it is still in the mushy state[34]
These strains and stresses build up due to thermally-induceddeformation which arises owing to non-uniform coolingconditions throughout the casting Liquid feeding due tosolidification shrinkage and tensile deformation which canbe related to the hydrostatic pressure in the liquid is also animportant factor since no hot tear can form if liquid feedingis available[56] Furthermore experimental studies of hottearing formation during the start-up period of the DC castingprocess have established the effect of various processparameters In addition to the casting speed[7] parameterssuch as grain refinement starting block material and shapeand water cooling are also known to have an effect on thehot tearing tendency[89] Recent two-phase models[1011]
attempt to quantify the interactions between liquid feedingand thermally-induced deformation in the mushy zone
The purpose of the present work is to identify by com-parison between experimental observations and computersimulation a physical quantity whose variation could best
explain the observed trends in center cracks during the start-upphase of DC cast round extrusion ingots For this purposea series of real-scale casting trials with varying startingconditions were carried out The crack lengths have beenmeasured for all trials The casting conditions and theexperimental results including temperature measurements inthe starting block and in the ingot are presented in Section IIThe trials were accompanied by numerical simulations usingcoupled heat transfer fluid flow and thermomechanicalmodels The simulation work and boundary conditions aredescribed in Section III The goal of the modeling work isto interpret the casting trials based on the simulation resultsIn Section IV quantities usually associated with hot tearingsuch as strains and stresses in the solid the pressure in theliquid and their correlation to the experimental results arediscussed
II CASTING TRIALS
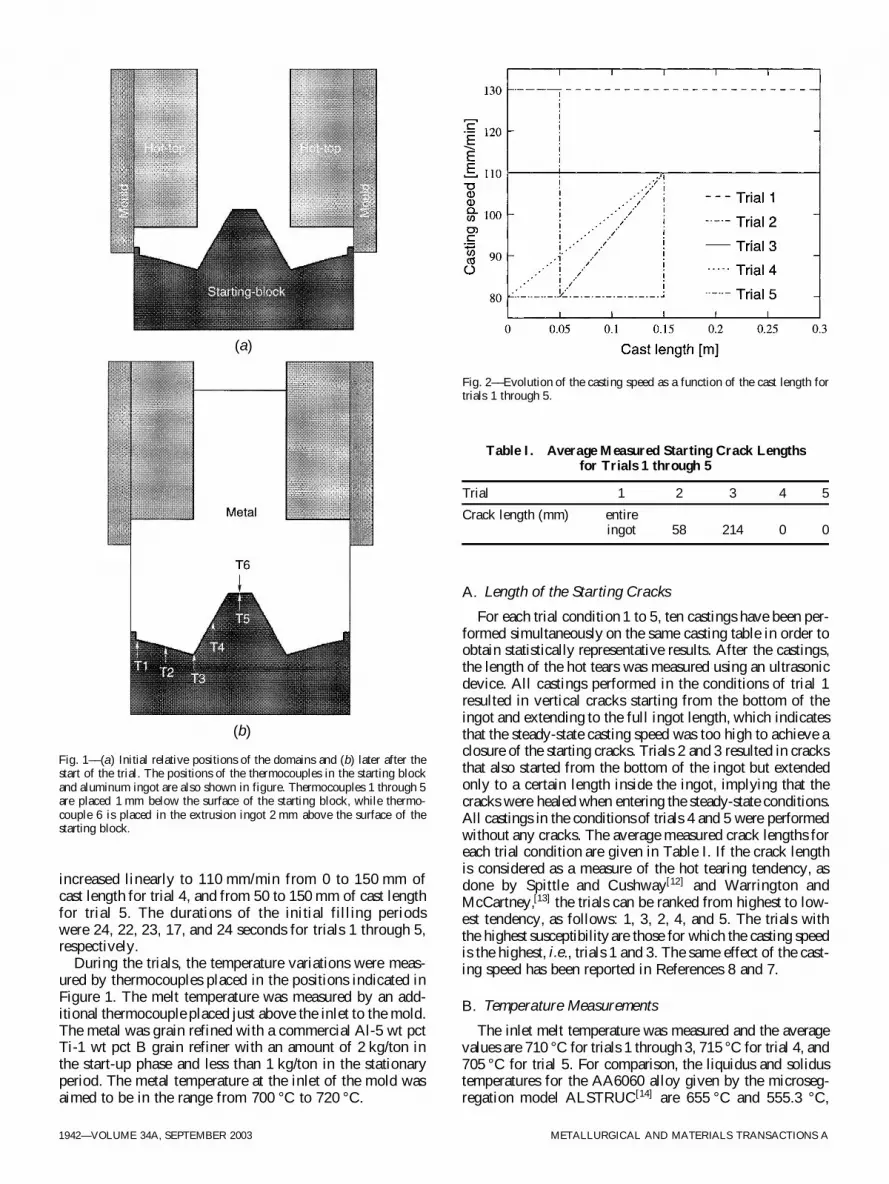
Five casting trials with 228-mm-diameter round extrusioningots were performed The geometry of the ingot is plot-ted in Figure 1 The cast material is an AA6060 type alloyInitially the starting block is inside the mold The liquidmetal is poured into the open mold from the top Solidi-fication starts over the surface of the starting block and alongthe walls of the mold When the formed solid is sufficientlystrong to hold the liquid metal inside the steel starting blockis lowered at the casting speed As soon as the ingot emergesbelow the mold water impinges directly on the surface ofthe casting As can be seen in Figure 1 the starting blockhas a cone shape Such a cone shape was suggested by Jensenand Schneider[89] in order to reduce the susceptibility forhot tearing in the start-up phase
The casting equipment used was a standard Hycast GasCushion system with modified bottom blocks The castingspeed is the only process parameter varied during the start-up period of these trials (Figure 2) For trial 1 a constantspeed of 130 mmmin was used Trial 2 was started with acasting speed of 130 mmmin and then the speed was low-ered to 80 mmmin after 50 mm of cast length The speedwas later increased to 110 mmmin after 150 mm of castlength For trial 3 a constant casting speed of 110 mmminwas used for the entire start-up phase Trials 4 and 5 werestarted at the same casting speed of 80 mmmin which was
M MrsquoHAMDI Research Scientist is with SINTEF Materials Technol-ogy N-0314 Oslo Norway Contact e-mailmohammedmhamdisintefnoS BENUM Senior Research Scientist is with Hydro Aluminium RampDSunndalsoslashra N-6600 Sunndalsoslashra Norway D MORTENSEN andHG FJAEligR Principal Research Scientists are with the Department ofProcess and Fluid Flow Technology N-2027 Kjeller Norway J-MDREZET Senior Scientist is with Eacutecole Polytechnique Feacutedeacuterale de LausanneCH-1015 Lausanne Switzerland and Calcom SA CH-1015 LausanneSwitzerland
Manuscript submitted January 3 2002
1942mdashVOLUME 34A SEPTEMBER 2003 METALLURGICAL AND MATERIALS TRANSACTIONS A
A Length of the Starting Cracks
For each trial condition 1 to 5 ten castings have been per-formed simultaneously on the same casting table in order toobtain statistically representative results After the castingsthe length of the hot tears was measured using an ultrasonicdevice All castings performed in the conditions of trial 1resulted in vertical cracks starting from the bottom of theingot and extending to the full ingot length which indicatesthat the steady-state casting speed was too high to achieve aclosure of the starting cracks Trials 2 and 3 resulted in cracksthat also started from the bottom of the ingot but extendedonly to a certain length inside the ingot implying that thecracks were healed when entering the steady-state conditionsAll castings in the conditions of trials 4 and 5 were performedwithout any cracks The average measured crack lengths foreach trial condition are given in Table I If the crack lengthis considered as a measure of the hot tearing tendency asdone by Spittle and Cushway[12] and Warrington andMcCartney[13] the trials can be ranked from highest to low-est tendency as follows 1 3 2 4 and 5 The trials withthe highest susceptibility are those for which the casting speedis the highest ie trials 1 and 3 The same effect of the cast-ing speed has been reported in References 8 and 7
B Temperature Measurements
The inlet melt temperature was measured and the averagevalues are 710 degC for trials 1 through 3 715 degC for trial 4 and705 degC for trial 5 For comparison the liquidus and solidustemperatures for the AA6060 alloy given by the microseg-regation model ALSTRUC[14] are 655 degC and 5553 degC
Fig 1ndashndash(a) Initial relative positions of the domains and (b) later after thestart of the trial The positions of the thermocouples in the starting blockand aluminum ingot are also shown in figure Thermocouples 1 through 5are placed 1 mm below the surface of the starting block while thermo-couple 6 is placed in the extrusion ingot 2 mm above the surface of thestarting block
Fig 2ndashndashEvolution of the casting speed as a function of the cast length fortrials 1 through 5
Table I Average Measured Starting Crack Lengthsfor Trials 1 through 5
Trial 1 2 3 4 5
Crack length (mm) entireingot 58 214 0 0
(a)
(b)
increased linearly to 110 mmmin from 0 to 150 mm ofcast length for trial 4 and from 50 to 150 mm of cast lengthfor trial 5 The durations of the initial filling periodswere 24 22 23 17 and 24 seconds for trials 1 through 5respectively
During the trials the temperature variations were meas-ured by thermocouples placed in the positions indicated inFigure 1 The melt temperature was measured by an add-itional thermocouple placed just above the inlet to the moldThe metal was grain refined with a commercial Al-5 wt pctTi-1 wt pct B grain refiner with an amount of 2 kgton inthe start-up phase and less than 1 kgton in the stationaryperiod The metal temperature at the inlet of the mold wasaimed to be in the range from 700 degC to 720 degC
METALLURGICAL AND MATERIALS TRANSACTIONS A VOLUME 34A SEPTEMBER 2003mdash1943
Fig 3ndashndashTemperatures measured in the starting block (T1ndash5) and in the center of the ingot (T6) for trials 1 through 4 No measurements are available at posi-tion T6 for trial 1
respectively The measured temperatures in the starting block(thermocouples 1 through 5) and in the center of the ingot(thermocouple 6) are given for trials 1 through 4 in Figure 3It can be seen that the temperature measurements for the dif-ferent trials are quite close Those for trial 5 deviate onlyslightly from those measured for trial 4 and therefore are notshown here The temperature measurements were commencedas soon as the filling of the molds started During the fillingphase (about 17 to 24 seconds) the temperatures in positions1 through 5 in the starting block increase rapidly with aboutthe same rate As the starting block is lowered and the waterimpingement starts the measured temperatures start to decreasein positions T1 and T2 Maximum temperatures in position T5 inthe center of the cone are 652 degC 646 degC 639 degC 635 degC and636 degC for trials 1 through 5 respectively In this position themeasured temperature becomes higher than the solidus tem-perature of the alloy after about 30 to 40 seconds and staysabove it until about 100 seconds Note that in the case of trial1 the maximum temperature in the steel starting block is almostequal to the liquidus temperature of the alloy For positionT6 in the ingot the temperature increases quickly up to about660 degC as the liquid metal heats the thermocouple The tem-perature then remains stable until it starts to decrease due tothe effect of the water cooling after approximately 80 secondsAt this stage the temperature in position T6 becomes evenlower than the measured temperature in position T5 in the start-
ing block This indicates that during all the rest of the processthe heat transfer in the center of the ingot occurs mainly in theradial direction The measurements also suggest that for all thetrials no fully solid shells form on top of the cone during thefirst 100 seconds of the start-up period This position canthen behave as a hot spot where thermally induced deform-ation can concentrate and lead to the formation of hot tears ifliquid feeding is insufficient
III NUMERICAL SIMULATION
Trials 1 through 5 have been simulated using a finite ele-ment model ALSIM[15] for the development of time-dependentheat transfer and fluid flow during DC casting and thethermomechanical model ALSPEN[16] In ALSIM forcedconvection is taken into account and turbulence is modeledby a low-Reynolds-number k-laquo model Thermal convectionis included by the Boussinesq approximation and a Darcyforce is used in the mixture momentum equation whichaccounts for the interfacial friction between the solid and liq-uid[17] Shrinkage-driven flow and solute transport (macroseg-regation) however are not included in the model
During the casting trials the top of the cone on the start-ing block is initially placed above the bottom of the hot top(Figure 1) As the starting block is lowered the uppermost
1944mdashVOLUME 34A SEPTEMBER 2003 METALLURGICAL AND MATERIALS TRANSACTIONS A
Table II Heat-Transfer Coefficients between Ingotand Starting Block
T Tcoh h 5 3000 Wm2K
T Tcoh
where d is the air gap size dmin 5 02 mm anddm 5 01 mm
where a1 5 200 Wm2 K11a2 Paa3 a2 5 205and a3 5 05
where hinit 5 3000 Wm2 K
hg2 51
1|(hcond 1 hrad ) 1 1
|hinit
hg1 5 a1 (Tcoh2Ts)a2 pa3
n
112
hg2 b
1 1 tanh bd2dmin
dm
c c
h 512
hg1 b
1 1 tanh bdmin2d
dm
c c
part of the cone moves downward through the hot top areaIncluding this in the modeling would require a dynamicdeformable mesh between the fixed hot top and the top ofthe moving bottom block Such a dynamic remeshing isnot implemented in the model Due to this limitation it hasbeen necessary to use a slightly modified initial geometryfor the ALSIM simulations In the calculations the heightof the hot top is 18 mm shorter than in the real geometryso that at the start of the simulation the bottom of the hottop is located at the same level as the top of the startingblock cone To compensate for this limitation an 18-mm-thick ring of insulation is introduced below the hot top inorder to remain as close as possible to the real heat-transferconditions In the model as explained in Reference 15 ahorizontal expanding row of elements is located belowthe hot top which divides the domain into an Euleriansubdomain on the top and a mixed EulerianndashLagrangian sub-domain below Moreover because of the axisymmetric formof the ingot the problem is reduced to two dimensions andonly half of the domain plotted in Figure 1 including thehot top the mold the ingot and the starting block is usedin the simulation
Thermally-induced deformations in the ingot are calculatedusing the finite element model ALSPEN[16] The solutiondomain for the thermomechanical calculation is only the partof the ingot that is considered to behave as a solid ie wherethe temperature is predicted to be below a given coherencytemperature Tcoh For the AIMgSi alloy AA6060 studied inthe present work Tcoh has been set to 641 degC which corre-sponds to a fraction of solid equal to 08 This isotherm definesthe position of the uppermost boundary of the solution domainfor ALSPEN Above this boundary the metal is assumed tobehave as a liquid which acts with a hydrostatic pressure Inthe solution domain the material is described as an elastic-viscoplastic material The temperature-dependent materialparameters used in the constitutive equations for thermal andelastic strains are extracted from Mondolfo[18] while the para-meters for the constitutive equation for the viscoplastic strainrate are based on the experimental work of Nedreberg[7] andare given in Reference 16 Investigations of the mechanicalproperties of various aluminum alloys in the mushy state[192021]
have revealed that the flow stress decreases significantly withan increasing fraction of liquid To account for this effectthough in a rather ad-hoc manner the constitutive equationfor the viscoplastic flow in the solid is modified The flowstress in the mushy zone smush is computed simply bymultiplying the flow stress for the solid ssol with a functiondecreasing exponentially with the liquid fraction gl iesmush 5 exp(2kgl) ssol In this work the mushy zone factork has been given a value of 20
An important uncertainty in the thermomechanical modelingis due to the lack of reliable data for the coherency temperatureand constitutive equations for the viscoplastic behavior of the mushyzone In order to study the sensitivity of the results to a change ofthe employed values a case study has been carried out in whichthe coherency temperature Tcoh and the mushy zone factor k havebeen varied Although changing these values resulted in quantita-tively different computed stresses and strains qualitatively thesame trends are obtained and the conclusions of Section IV areunchanged
A Thermal Boundary Conditions
The description and the numerical values of the appliedheat-transfer coefficients for the heat transfer between theingot the mold and the water cooling are provided in Ref-erence 15 Here we will focus mainly on the heat-transferboundary condition between the ingot and the starting blockThis boundary requires a special treatment because of thecontact resistance between the cast metal and the bottomblock material as well as the formation of an air gap dueto the butt-curl effect
The influence of calculated displacements and pressureson the thermal boundary conditions between the ingot andthe bottom block are taken into account by coupling theALSIM and ALSPEN models as explained in Reference22 As long as the temperature of a given node in the ingotbottom surface is higher than Tcoh a good contact isassumed between the ingot and the starting block and aconstant heat-transfer coefficient h is applied When thetemperature is lower than Tcoh the heat-transfer coeffi-cient becomes dependent on both the local gap sizecalculated from the displacement field and the estimatedcontact pressure[22] If the air gap size is less than 02 mmthe heat-transfer coefficient hg1 is assumed to depend onthe local surface temperature of the ingot Ts and thenormal pressure pn If the calculated gap size is largerthan 02 mm the heat-transfer coefficient hg2 is calcu-lated from the contributions from conduction through theair hcond radiation hrad and an initial heat-transfer coef-ficient representing the insulating effect of lubricationhinit In order to avoid a sharp transition between hg1 andhg2 when an air gap has formed the applied heat-transfercoefficient h is a smooth function of both coefficientsas shown in Table II Vertical forces counterbalancing thetotal weight of the ingot are distributed underneath theingot The local contact pressure pn is estimated from thecalculated gap size and the weight of the ingot emulatingan elastic response from the starting block This simplifiedtreatment of the boundary condition enables us to incor-porate a temperature and pressure dependency in thecontact heat transfer
METALLURGICAL AND MATERIALS TRANSACTIONS A VOLUME 34A SEPTEMBER 2003mdash1945
Fig 4ndashndash(a) Measured casting temperatures (dotted) as a function of time for trials 1 through 5 and (b) comparison between calculated and measured tem-peratures at positions 1 through 5 for trial 1
Table III Thermophysical Properties of the AA6060 Alloy Used in the Simulations
Element Fe Si Mg Cu Mn
Composition (wt pct) 019 043 048 002 0009Temperature (degC) 6550 6542 6531 6516 6444 6000 5553Mass fraction of solid 0 015 030 045 075 095 1Conductivity (Wm K) 1019 1151 1283 1415 1680 1856 1900Specific heat (Jkg K) 1175 1165
Latent heat (Jkg) 399 105
Density (kgm3) 27 103
Kinematic viscosity (m2s) 06 1026
Thermal expansion coefficient (K21) 12 1024
Solidification shrinkage factor b 60 1022
The initial temperatures of the hot top and the starting blockare set to 20 degC The measured melt temperatures as a func-tion of time which are shown in Figure 4(a) were used asinput to the heat-transfer calculations The heat-transfer coef-ficients given in Table II have been chosen so that the bestfit between measured and calculated temperatures is obtainedat the positions of the thermocouples Material parameters arelisted in Table III The solidification path for the AA6060alloy used in the heat-transfer calculations is given by themicrosegregation model ALSTRUC[14] Typical CPU timerequired for the simulations shown in Section IV is 25 hourson a Pentium III 800 MHz workstation based on a grid of
filling which is not included in the calculation and thecomplexity of the heat-transfer conditions when an air gapforms between the ingot and the starting block It shouldbe noted that the measurements show erratic variations duringthe initial filling period It is therefore not expected to find anexact match between measured and calculated temperaturesThe aim was to find approximately the same thermal profilesin the bottom block in order to have good confidence inthe applied heat-transfer conditions between the ingot andthe bottom block
A Mushy Zone Evolution
The evolution of the temperature field as a function oftime is plotted in Figure 5 for trial 1 Solidification of themetal on the top of the cone does not start until about 50 sec-onds after the start of the casting It takes about 50 secondsmore for the solidus isotherm to reach the top of the coneDuring the first 50 seconds the temperature on the top ofthe cone increases to reach 600 degC after which the cone doesnot significantly affect the temperature field in the liquidmetal above the cone The temperature difference betweenthe two materials is too small for the starting block to act asa significant cooling medium The heat transfer occurs mainlyin the radial direction and the temperature in the metal ontop of the cone stays at a stable value until the solidusisotherm starts to approach the center From the simulationsit is found that the isotherms become nearly vertical on top
(a) (b)
Pentiumreg III Processor is a product of Intel Corporation Santa Clara CA
8670 nodes (at the end of the calculation) and a time-step of006 seconds
IV RESULTS AND DISCUSSION
The calculated and measured temperatures from trial 1at positions 1 through 5 are shown in Figure 4(b) Althougha fairly good agreement is found for thermocouples 1 2and 5 after the initial phase of about 50 seconds thecalculated values are lower than the measurements for posi-tions 3 and 4 The differences between the measurementsand the calculations are due to the lack of the hot streamimpingement on the top of the cone during the initial mold
1946mdashVOLUME 34A SEPTEMBER 2003 METALLURGICAL AND MATERIALS TRANSACTIONS A
Fig 6ndashndashCalculated (a) mushy zone length and (b) sump depth along the centerline as a function of time for trials 1 through 5
Fig 5ndashndashTemperature field in the ingot and the starting block during the start-up period at (a) t 5 50 s when the liquidus isotherm reaches the top of thestarting block cone at (b) t 5 100 s just before the sump leaves the top of the cone and at (c) t 5 150 s when the mushy zone enters the steady-stateconditions The extent of the mushy zone is given by the positions of the liquidus and solidus isotherms at 655 degC and 5553 degC respectively
of the cone as seen in Figure 5(b) for the solidus isothermAt 150 seconds the temperature field starts approaching thesteady-state conditions It is also seen that the length of themushy zone along the centerline reaches a maximum justbefore the solidus isotherm leaves the cone ie when thesolidification fronts meet on the top of the starting block
Figure 6(a) shows the mushy zone length at the centerof the ingot for trials 1 through 5 For all the trials onecan see that the depth of the sump increases quickly toreach a maximum before rapidly decreasing and enteringthe steady-state conditions All maximums are reachedwhen the fraction of solid first equals one at the contactbetween the ingot and the top of the cone When the fractionof solid of the metal on top of the cone is lower than thecoherency value the material exhibits a negligible strength
and the permeability of the material is still relatively highLiquid feeding can therefore easily prevent the formationof hot tears It is during the critical phase of the processwhen the fraction of solid in this location is rapidly increas-ing to reach one ie when the permeability tends towardzero that starting cracks can nucleate in the center andpropagate inside the ingot This critical phase coincideswith the time interval during which the mushy zone is aboutto reach its maximum length as shown in Figure 6(a) Itshould also be noted that the ranking of the trials based ontheir cracking tendency corresponds well with their rank-ing based on the maximum mushy zone lengths in ascend-ing order The evolutions of the sump depth in Figure 6(b)reveal another interesting observation It can be seen thatthe sump depth goes through a maximum for the trials that
(a) (b)
METALLURGICAL AND MATERIALS TRANSACTIONS A VOLUME 34A SEPTEMBER 2003mdash1947
Fig 7ndashndashCalculated (a) hoop stress and (b) hoop viscoplastic strain rate for trial 1 at t 5 100 s
resulted in hot tears This is in agreement with the workof Schneider and Jensen[8] who suggested aiming for amonotonic sump depth during the nonstationary castingphase to avoid center cracks
B Stress and Strain Buildups
In the simulations the stress state and the strain rate arefocused on since these quantities can be associated withthe deformation of the solid skeleton in the mushy zoneAs suggested elsewhere[161023] these quantities are studiedat a position for which the solid fraction has a given criti-cal value here taken to be 095[23] which corresponds to atemperature of 600 degC Note that this critical position doesnot correspond to a material point
1 StressThe calculated hoop stress suu and hoop viscoplastic
strain rate uu are plotted in Figure 7 for trial 1 at time equalto 100 seconds ie just before the sump leaves the coneas shown in Figure 5(b) Note that symmetry causes theradial and hoop stress and strain rate components to be equalat the centerline of the ingot Thermally-induced deforma-tions in the already solidified shell create a tensile stressstate in the center of the ingot As shown in Figure 5(b)the insufficient heat transfer between the ingot and the start-ing block yields a hot spot just above the cone At this loca-tion the mushy zone has the lowest strength becauseof the elevated temperatures and the presence of grainboundary films which leads to a significant strain concen-tration as can be seen in Figure 7 Indeed while the com-puted local thermal strain rate in the hot spot is about 231024 s21 the calculated hoop viscoplastic strain rate isabout 31023 s21 at time t 5 100 s for trial 1 Away fromthe hot spot the computed radial strain rate decreases rapidlyto almost zero In the center the combination of a tensilestress state strain concentration and the difficult liquid
laquou
All quantities discussed here are plotted as a function of the solidifiedlength and not as a function of time The solidified length is defined as thedistance between the critical position which corresponds to the position ofthe fraction of solid 095 and the position of the top of the starting block inthe center of the ingot Peak values for all trials are reached at almost thesame solidified length They are however reached at different time pointsas is the case for the depth of the mushy zone in Figure 6(a)
feeding at high fractions of solid creates a favorable situa-tion for the formation of a hot tear
It is commonly believed that in order for a hot tear toform the stress must exceed a critical limit Since startingcracks in the center of the ingot propagate in the verticaldirection it is of interest to analyze the stress componentsin the direction perpendicular to the crack direction Boththe radial (equal to the hoop) and the mean stress in thecenter of the ingot at the critical position (corresponding toa fraction of solid of 095) are plotted in Figure 8 as a func-tion of the solidified length for all trials If the peak radial
(or hoop) stresses are used as indicators for the hot tearingtendency the five trials may be ranked in the sequence trials1 3 2 4 and 5 Note that this ordering of the trials is inagreement with the length of the cracks for trials 1 2 and3 Although no cracks occurred for trials 4 and 5 trial 5should have the lowest cracking tendency since a lower orequal casting speed was used compared to trial 4 (Figure 2)This again is in agreement with the calculated maximumstresses for trial 4 which are higher than those computedfor trial 5 It should however be noted that all calculatedpeak values for the radial (or hoop) stresses for examplerange between 24 and 31 MPa indicating relatively closestress states This is in contrast to the measured crack lengthswhich imply a larger difference in hot tearing tendencybetween trials 1 and 3 and between trials 3 and 2
It is interesting to notice that peak values of the meanstress also correlate well with the ranking based on thecrack lengths Although the Von Mises flow rule and the
(a) (b)
1948mdashVOLUME 34A SEPTEMBER 2003 METALLURGICAL AND MATERIALS TRANSACTIONS A
Fig 9ndashndashCalculated (a) radial (or hoop) viscoplastic strain rate in the cen-ter of the ingot at the critical position and (b) accumulated strain alongthe centerline for trials 1 through 5
Fig 8ndashndashCalculated (a) mean stress and (b) radial (or hoop) stress in thecenter of the ingot at the critical position
viscoplastic strain rate constitutive equation used to describethe rheological behavior of the material are independent ofthe mean stress work done by Martin et al[24ndash27] suggeststhat this quantity can also have an effect on the behaviourof the material Martin et al consider the mushy zone as aporous metallic material saturated with liquid and proposeconstitutive equations for the material behaviour where boththe first and second invariant of the stress tensor are intro-duced Their approach has recently been incorporated in atwo-phase model for thermally induced deformation in themushy zone[11] and could serve as a basis for a better descrip-tion of the mushy zone rheology
2 Strain RateCritical accumulated strains or strain rates are also often
used as criteria for the formation of hot tears[6728] The strainrate tensor is the sum of the thermal elastic and viscoplasticcontributions Since elastic strains are much smaller than theviscoplastic strains in the mushy zone due to the elevatedtemperatures only the viscoplastic contribution is of interestFor symmetry reasons the radial and hoop components ofthe viscoplastic strain rate tensor are equal in the center ofthe ingot and are both acting in a direction perpendicularto that of the crack propagation
The values of this quantity at the critical position in the cen-ter of the ingot are plotted in Figure 9 as a function of thesolidified length for trials 1 through 5 If peak values are usedas an indicator for the hot tearing tendency the trials can beranked in the following sequence 1 3 2 4 and 5 which isin agreement with the ranking based on the crack lengths fortrials 1 through 3 The calculated peak strain rate values arealso always higher for trial 4 than for trial 5 which is in agree-ment with the higher or equal casting speed of trial 4 com-pared to trial 5 Furthermore in contrast to the computedstresses of Figure 8 the calculated peak values of Figure 9(a)show a significant distinction between trials 1 3 and 2 whichis in agreement with the substantial differences in the mea-sured crack lengths between trials 1 and 3 and trials 3 and 2
Figure 9(a) also shows that after the peak values arereached the strain rate for trial 2 drops quickly to reach thesame levels as for trials 4 and 5 This is not the case for tri-als 1 and 3 for which the strain rates remain at a higherlevel with trial 1 having always larger values than trial 3Although the model is not valid anymore when a crack hasformed as for trials 1 through 3 the differences in strainrate levels after the peak values when the process isapproaching the steady-state conditions can be used as an
(a)
(b)
(a)
(b)
METALLURGICAL AND MATERIALS TRANSACTIONS A VOLUME 34A SEPTEMBER 2003mdash1949
indication for the magnitude of the driving force for crackpropagation The rapid decrease in strain rate level for trial2 to the levels of trials 4 and 5 (about 55 1024 s21)for which no cracks occurred at 0045 m of solidifiedlength correlates well with the small crack length for trial2 (0058 m) The strain rate for trial 3 reaches the samelevels only after 025 m of solidified length which againcorrelates well with the larger crack length for trial 3(021 m) Although the strain rate level for trial 1 alsodecreases it continues at a higher level than the other trialseven when entering the steady-state conditions
In order to study the effect of the height of the startingblock cone two additional calculations have been carriedout in the conditions of trial 1 with cone heights reducedby 10 and 21 mm respectively Results from these simula-tions not shown here predict substantially lower valuesfor the strain rate than those plotted for trial 1 in Figure 9(a)implying a lower hot tearing tendency for the cases with alower cone height Another important parameter for the hottearing tendency is the starting block material A copper oran aluminium starting block because of its higher thermalconductivity compared to steel would reduce the hot tear-ing tendency by enhancing the heat transfer between theingot and the cone as suggested in Reference 9
3 Accumulated StrainIt has also been suggested that the nucleation and prop-
agation of hot tears can be related to some critical strainingof the material when it is still in the mushy state[27] In orderto check the validity of this criterion the strain accumulatedin the material in the vulnerable stage between the frac-tions of solid 09 and 099 Dlaquo 5 laquo(gs 5 099) 2 laquo(gs 5 09)has been recorded during the calculations The values of Dlaquoalong the centerline of the casting are plotted in Figure9(b) as a function of the distance from the top of the start-ing block The accumulated strains are largest for thepositions in the ingot close to the starting block This isbecause solidification in these locations occurs while theviscoplastic strain rates are at their highest values due tostrain concentration (Figure 7(b)) Away from the top of thestarting block where solidification occurs later in the processthis phenomenon is less pronounced as seen in Figure 9(a)and the accumulated strains are significantly lower
If the maximum accumulated strains are used as an indi-cator of the hot tearing tendency trial 3 is ranked beforetrial 1 and trial 2 is ranked after trial 4 The comparisonwith the cracking tendency based on the measured cracklengths is not as good as with the radial viscoplastic strainrates It should be noted that the accumulated strains do notdepend only on the viscoplastic strain rates but also on theamount of time spent by the material in the vulnerable region(between fractions of solid 09 and 099) This time is greaterfor trial 4 than for trial 2 due to the slower casting speedFor this reason trial 4 is ranked before trial 2 although theopposite ranking is obtained based on the radial strain ratesof Figure 9(a)
C Liquid Feeding
Although a main part of the mechanism of hot tearingformation is tensile straining of the mushy zone[4] no hottear can form if liquid feeding is sufficient As shown by
Poirier et al[29] a key driving force for liquid feeding issolidification shrinkage due to density difference betweenthe liquid and the solid phase The latter can be charac-terised with a shrinkage factor b 5 (rl 2 rs)rl whererl and rs are the liquid and solid densities respectivelyassumed here to be constant but not equal An additionaldriving force for liquid feeding is tensile straining ofthe mushy zone As explained by Niyama[30] and byRappaz et al[6] tensile stresses in the solidifying dendriticnetwork will result in widening the volume betweenthe grains which in turn increases the need for liquidfeeding
Using Darcyrsquos law to describe liquid flow Rappaz etal calculated the pressure drop in the mushy zone due toboth solidification shrinkage Dpsh and straining of themushy zone Dpmec At the fractions of solid where hottears occur the permeability of the mushy zone is lowand the resulting total pressure drop (Dp 5 Dpsh 1 Dpmec)is usually considered as a measure of the liquid feedingdifficulties[610] For Niyama in the case of steels and Rap-paz et al in the case of aluminum columnar dendrites ahot tear will occur when the pressure drop in the liquidis larger than a cavitation depression In other words thelarger the pressure drop the higher is the tendency for hottearing One main difference between the criteria ofNiyama and Rappaz et al is that the latter takes intoaccount both the shrinkage and mechanical contributionswhile Niyama considers only the mechanical contribu-tion in the pressure drop
In order to calculate Dp in the center of the ingot thoughin an approximate manner the model proposed by Rap-paz et al and initially developed for steady-state situationshas been extended to transient conditions as outlined inthe Appendix The model is applied only along the cen-terline where it is assumed that liquid feeding must com-pensate for both solidification shrinkage and the radialstraining of the mushy zone Since the evolution of thefraction of solid and the strain rates are known from thethermal and mechanical calculations it is possible to eval-uate both Dpsh and Dpmec (Appendix) Figure 10 shows boththe shrinkage and mechanical pressure drops for trials 1through 5 in the center of the ingot The pressure dropsare calculated between the positions of the iso-solid frac-tions 08 and 095 in the mushy zone For all the trials
Using a smaller fraction of solid for the upper boundary of the mushyzone does not change the results because most of the pressure drop occursin the last stages of solidification for the fractions of solids larger than08 However using a fraction of solid of 099 for the lower boundary ofthe mushy zone leads to larger pressure drops but gives qualitatively thesame results Moreover the hydrostatic contribution which tends to decreasethe total pressure drop is negligible compared to the mechanical and shrink-age contributions
the pressure drops after reaching their maximum valueslevel out quickly as the process enters the steady-state con-ditions The largest values are obtained during the criticalphase of the casting when the sump is about to leave thetop of the starting block As expected trial 1 undergoesthe highest pressure drops clearly demonstrating a severesituation for liquid feeding and the possibility of porenucleation Conversely the calculated values are lowestfor trial 5 for which no cracks occurred
1950mdashVOLUME 34A SEPTEMBER 2003 METALLURGICAL AND MATERIALS TRANSACTIONS A
Fig 10ndashndashCalculated (a) shrinkage and (b) mechanical pressure drops inthe center of the mushy zone for trials 1 through 5
The calculated shrinkage contributions of Figure 10(a)however are quite close for all trials and therefore unlikelyto explain the observed large variation in cracking tendencyDuring the critical phase of the process the mechanicalpressure drop is 3 to 6 times larger than the shrinkagecontribution revealing that most of the total pressure dropis due to the mechanical deformation of the mushy zone Thisis primarily due to the severe strain concentration occurringon the top of the starting block when the solidus isothermreaches this location (Figure 9(a)) and the need for liquidfeeding to compensate for the straining of the mushy zoneIf peak values of the mechanical pressure drop are used asa measure for the hot tearing tendency the following sequenceis obtained 1 3 2 4 and 5 in agreement with the rankingbased on the measured crack lengths The computed pressuredrops for trials 2 and 4 however are comparable while ahot tear occurred for trial 2 but not for trial 4 Because ofthe relatively small shrinkage contribution the same rankingis obtained when the maximum total pressure drop (Dpsh1 Dpmec) is used instead of the mechanical contribution alone
It should be noted that due to the simplified approach adoptedhere the calculated mechanical pressure drops are probablyoverestimated since in addition to liquid feeding some plasticdeformation in the vertical direction also compensates for the
radial straining of the mushy zone It is also well known thatgrain refining reduces the tendency for hot tearing This effecthas not been studied here and the models should be furtherdeveloped to include the grain-size lengthscale
V CONCLUSIONS
From the temperature measurements and the simulationsit is shown that insufficient heat transfer between the ingotand the starting block yields a hot spot just above the conein the center The temperature in the cone becomes too highfor it to act as a cooling medium during the critical phaseof the process ie when the sump is about to leave the topof the cone From the simulation work the following con-clusions can be made
1 Qualitatively trends in the calculated stresses andviscoplastic strain rates acting in the perpendicular directionto the crack propagation are in good correspondence withthe measured crack lengths The calculated viscoplasticstrain rate provides the best correlation with the severityof center cracks The agreement between center crackingand the calculated accumulated strains is less good
2 Pressure drops in the mushy zone calculated using a sim-ple model show that the mechanical contribution is largerthan the shrinkage contribution during the critical latestage of solidification Computed pressure drops showthat liquid feeding is more difficult for the trials thatresulted in the formation of hot tears
It is believed that the casting trials presented here could serveas a basis for the testing of new hot tearing criteria One ofthe shortcomings of the simulations shown here is the sim-plified treatment of the rheology of the semisolid materialMore realistic constitutive equations for the rheological behav-ior of the mushy zone such as those proposed in Reference27 are clearly needed for the thermomechanical modeling
ACKNOWLEDGMENTS
The authors thank Professor Asbjoslashrn Mo SINTEF(Norway) for his useful comments and suggestions dur-ing this work The authors are also grateful to one of thereviewers for his remarks and suggestions This researchis carried out as part of the Fifth European research frame-work programme called Competitive and SustainableGrowth as Project No GRD1-1999ndash10921 VIRCAST (TheVirtual Casthouse) (Contract No G5RD-CT-2000ndash00153)It includes the following partners and major subcontrac-tors Alusuisse Technology amp Management Ltd(Switzerland) Calcom SA (Switzerland) Elkem AluminumANS (Norway) Eacutecole Polytechnique Feacutedeacuterale de Lau-sanne (Switzerland) Hoogovens Corporate Services (TheNetherlands) Hydro Aluminum AS (Norway) Institutefor Energy Technology (Norway) Institut National Poly-technique de Grenoble (France) Institut NationalPolytechnique de Lorraine (France) Norwegian Univer-sity of Science and Technology (Norway) Peacutechiney SA(France) SINTEF Materials Technology (Norway) and
(a)
(b)
METALLURGICAL AND MATERIALS TRANSACTIONS A VOLUME 34A SEPTEMBER 2003mdash1951
Fig 11ndashndashSchematic illustration of the mushy zone
VAW Aluminum AG (Germany) Funding by the EuropeanCommunity and by the Office Feacutedeacuteral de lrsquoEducation etde la Science (Bern) for the Swiss partners is gratefullyacknowledged
APPENDIX
Calculation of the Liquid Pressure Drop
The calculation of the shrinkage and mechanical contribu-tions to the total pressure drop in the mushy zone in the caseof steady-state situations has been described in detail byRappaz et al[6] The purpose of this section is to extend theirapproach to transient situations As in Reference 6 it isassumed that in the one-dimensional situation of Figure 11the flow of liquid moves along the x-axis only and that thesolid deforms in the transverse direction y In a frame ofreference attached to the starting block the equation of massconservation can be written as
[1]
Where rk fk ykx and yky refer to the density the volume frac-
tion and the velocity components of phase k esl Introduc-
ing the shrinkage factor and the strain rate in the
transverse direction leads to the following equation
[2]bshyfs
shyt 1
shy( fl vlx )
shyx 1 (1 1 b) fslaquo
up 5 0
laquo
up 5
shyvsy
shyy
b 5 brs
rl21
c
shy
shyt (rl fl 1 rs fs) 1
shy
shyx (rl fl vlx) 1
shy
shyy (rs fs vsy) 5 0
Integrated over a distance x in the mushy zone Eq [2] gives
[3]
[4]
with the functions F and E defined by
[5]
[6]
The constant C can be calculated from the boundary con-dition fs 5 1 at which ylx 5 0 This leads to C 5 0 Liquidflow in the mush can be described using Darcyrsquos law
[7]
where K denotes the permeability of the mushy zone m thedynamic viscosity of the liquid phase and p the liquid pres-sure The pressure drop between the top of the mushy zoneL and any position x in the mush can be calculated bycombining Eq [2] and [7] and integrating between x and L
[8]
where Dp can then be written as the sum of two contribu-tions Dp 5 Dpsh 1 Dpmec with
[9]
[10]
where Dpsh is the contribution associated with the solidifi-cation shrinkage while Dpmec is the contribution associatedwith the mechanical deformation The permeability K isgiven by the KozenyndashCarman relation
[11]
where l2 is the secondary dendrite arm spacing In theaxisymmetric situation of Section IVndashC the viscoplastic strainrate in the center of the ingot p has to be replaced by
rr 1 uu 5 2 uu In the calculations l2 was set to 40 mm
REFERENCES1 TW Clyne and GJ Davies Br Foundry 1981 vol 74 pp 65-732 WS Pellini Foundry 1952 pp 125-33 and 192-993 YF Guven and JD Hunt Cast Met 1988 vol 1 pp 104-11
laquo
ulaquo
ulaquo
u laquo
u
K 5l2
2
180
f 3l
(12fl)2
Dpmec 5 (1 1 b)mL
x
E
K dx
Dpsh 5 bmL
x
F
K dx
Dp 5 bmL
x
F
K dx 1 (1 1 b)m
L
x
E
K dx
flvlx 5 2Km
shyp
shyx
E 5 x
0
fslaquo
up dx
F 5 x
0
shyfs
shyt dx
bF 1 fl vlx 1 (1 1 b) E 5 C
bx
0
shyfs
shyt dx 1 gl vl x 1 (1 1 b)
x
0
fslaquo
up dx 5 C
1952mdashVOLUME 34A SEPTEMBER 2003 METALLURGICAL AND MATERIALS TRANSACTIONS A
4 J Campbell Castings Butterworth Heinemann England 19915 U Feurer Giesserei Forschung 1976 vol 28 p 756 M Rappaz J-M Drezet and M Gremaud Metall Mater Trans A
1999 vol 30A pp 449-5507 ML Nedreberg PhD Thesis University of Oslo Oslos 19918 W Schneider and EK Jensen in Light Metals CM Bickert ed
TMS-AIME Warrendale PA 1990 pp 931-369 EK Jensen and W Schneider in Light Metals CM Bickert ed
TMS-AIME Warrendale PA 1990 pp 937-4310 I Farup and A Mo Metall Mater Trans A 2000 vol 31A pp 1461-7211 MMrsquohamdi AMo and CL Martin Metall Mater Trans A 2002
vol 33A pp 2081-9312 JA Spittle and AA Cushway Met Technol 1983 vol 10 pp 6-1313 B Warrington and DG McCartney Cast Met 1989 vol 2(3)
pp 135-4314 AL Dons EK Jensen Y Langsrud E Troslashmborg and S Brusethaug
Metall Mater Trans A 1999 vol 30A pp 2135-4615 D Mortensen Metall Mater Trans B 1999 vol 30B pp 119-3316 HG Fjae r and A Mo Metall Trans B 1990 vol 21B pp 1049-6117 BR Henriksen EK Jensen and D Mortensen in Modeling of Casting
Welding and Advanced Solidification Processes VIII BG Thomas andC Beckermann eds TMS USA 1998 pp 623-30
18 LF Mondolfo ALUMINIUM ALLOYS Structure and PropertiesButterworth and Co London 1976
19 L Ohm and S Engler Giessereiforschung 1990 vol 42 (4) pp 149-62
20 JM Drezet and G Eggeler Scripta Metall Mater 1994 vol 31 (6)pp 757-62
21 P Wisniewski and HD Brody in Modeling and Control of Castingand Welding Processes V M Rappaz M R Oumlzguuml and KW Mahieds TMS Warrendale PA 1991 pp 273-78
22 H Fjae r D Mortensen A Haringkonsen and EA Soslashrheim Light MetalsTMS Warrendale PA 1999 pp 743-48
23 S Benum D Mortensen and H Fjaer in Continuous Casting K Ehrkeand W Schneider eds Wiley-VCH Verlag Germany 2000 pp 54-60
24 CL Martin D Favier and M Sueacutery Int J Plasticity 1997 vol 13 (3)pp 215-35
25 CL Martin D Favier and M Sueacutery Int J Plasticity 1997 vol 13 (3)pp 237-59
26 CL Martin D Favier and M Sueacutery Int J Plasticity 1999 vol 15pp 981-1008
27 CL Martin M Braccini and M Sueacutery Mater Sci Eng A 2000vol A325 pp 293-302
28 HG Fjaeligr EK Jensen and A Mo Proc 5th Int AluminiumExtrusion Technology Seminar RI Werner and VR Bird edsThe Aluminum Association Aluminum Extruders Council USA1992 pp 113-20
29 DR Poirier K S Yeum and AL Maples Metall Trans A 1987vol 18A pp 1979-87
30 E Niyama Japan-USA Joint Seminar on Solidification of Metals andAlloys National Science Foundation 1977 pp 271-82
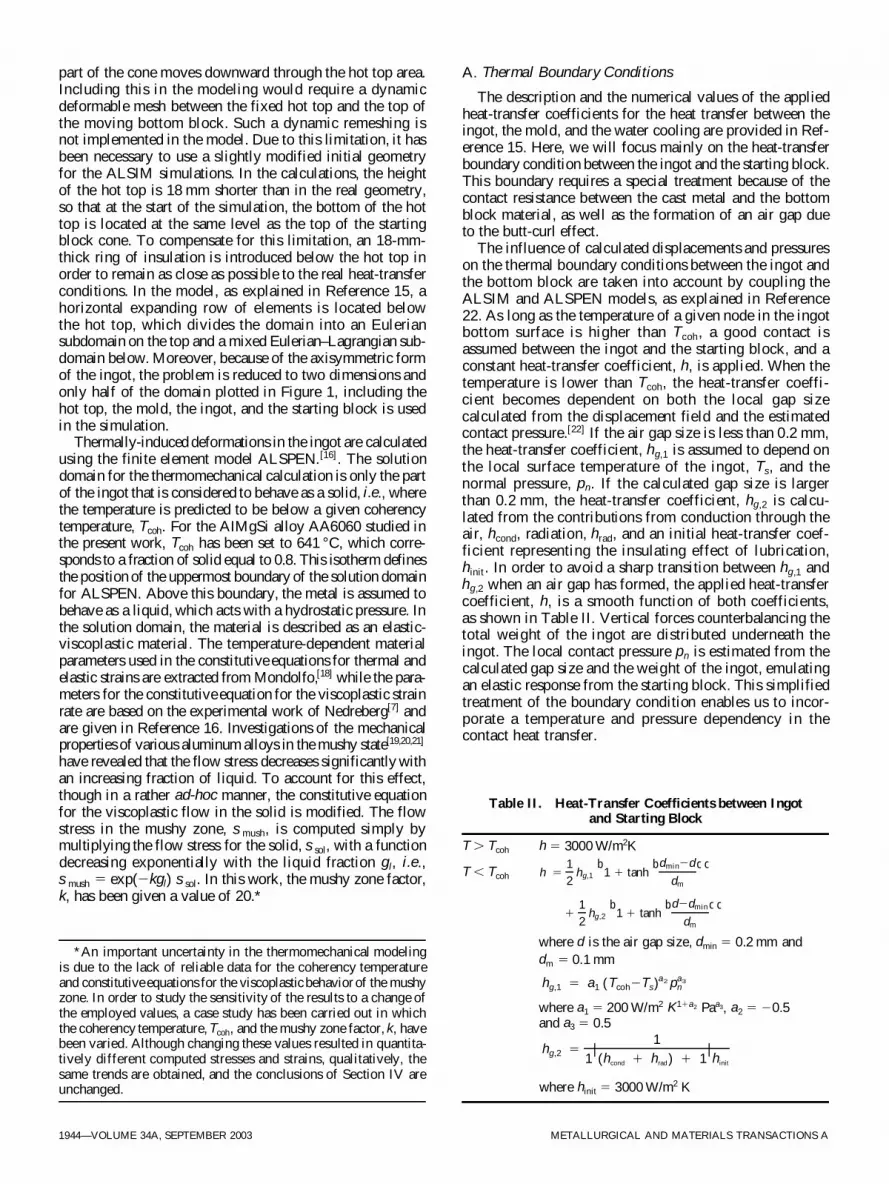
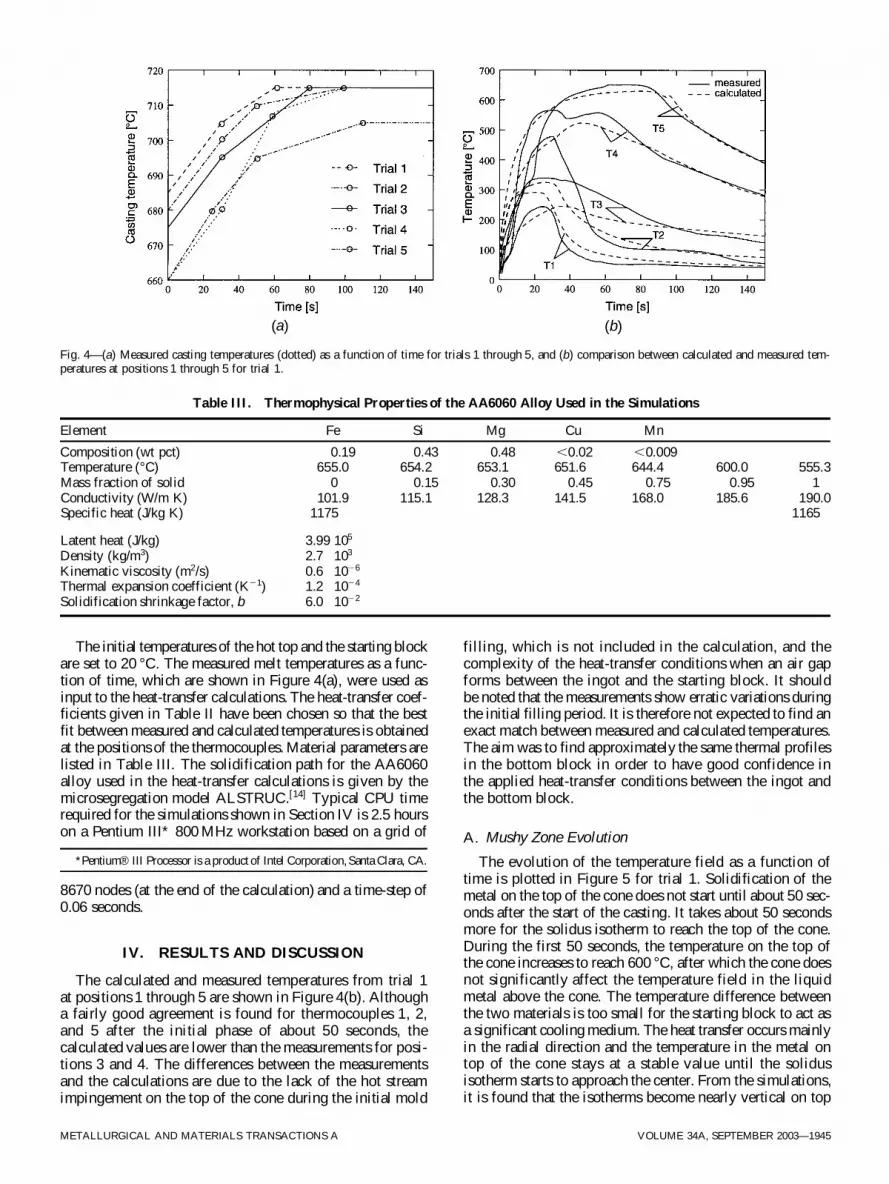
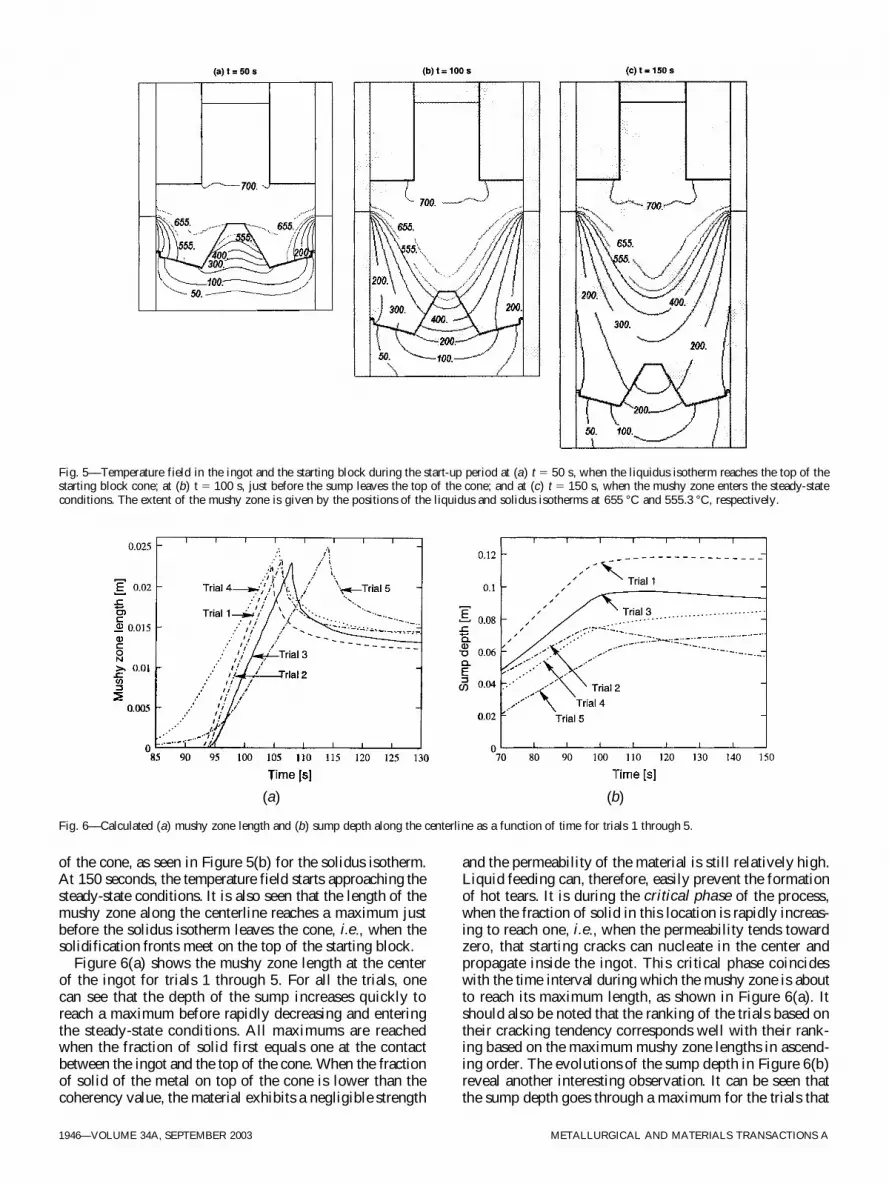
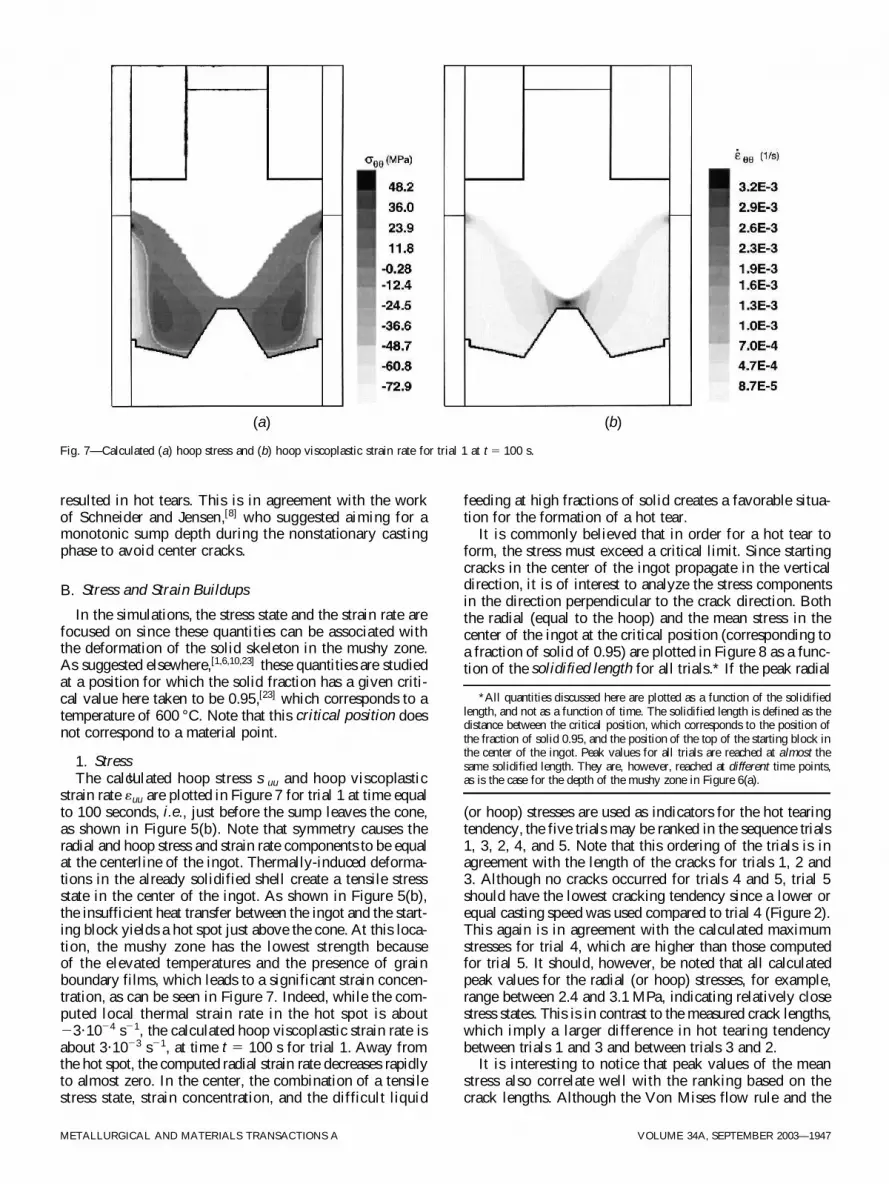
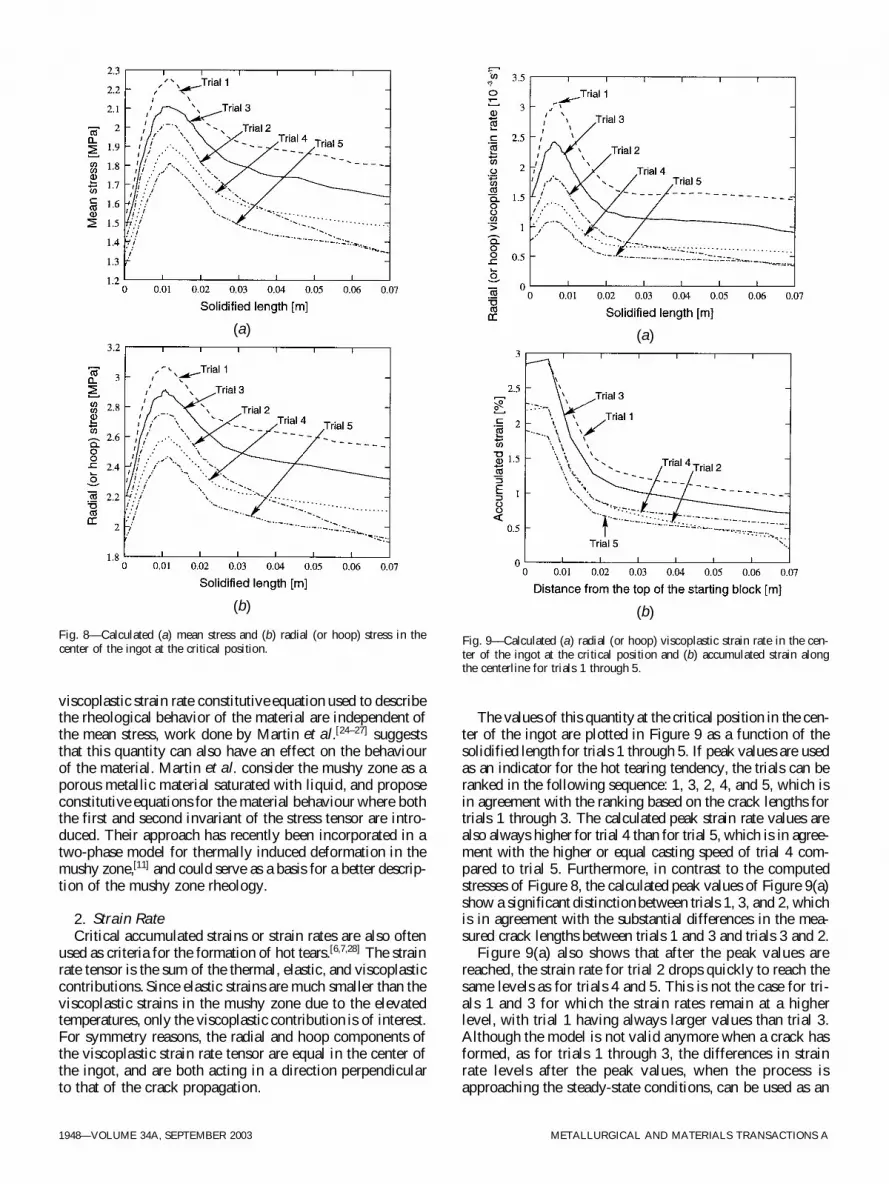
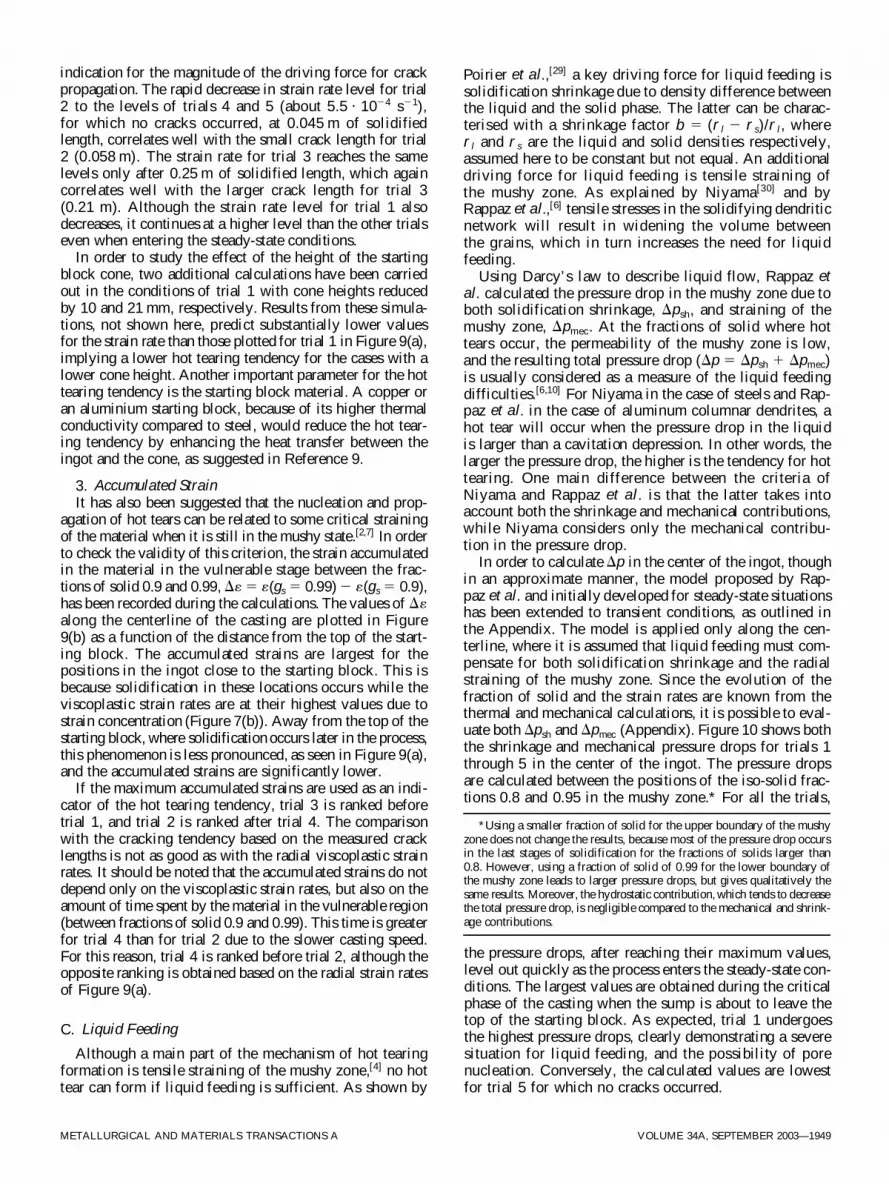
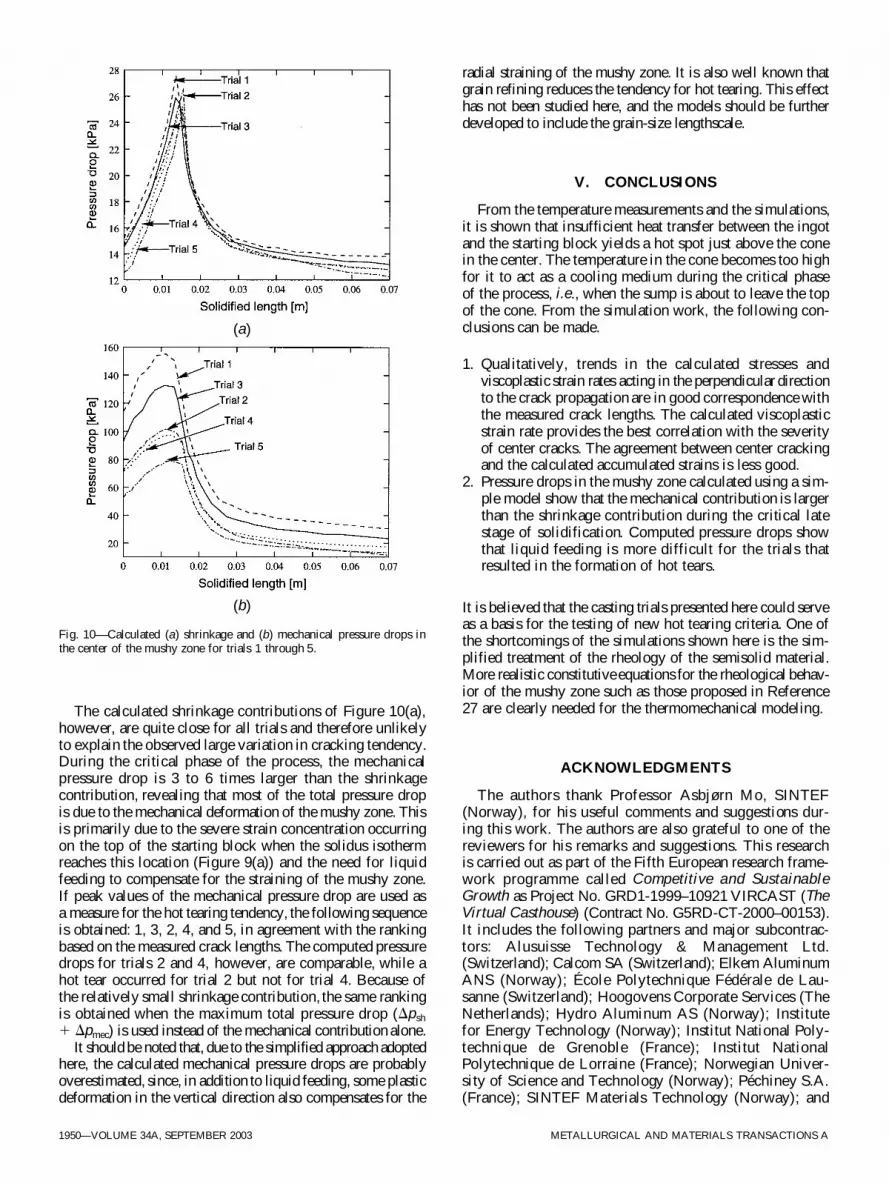
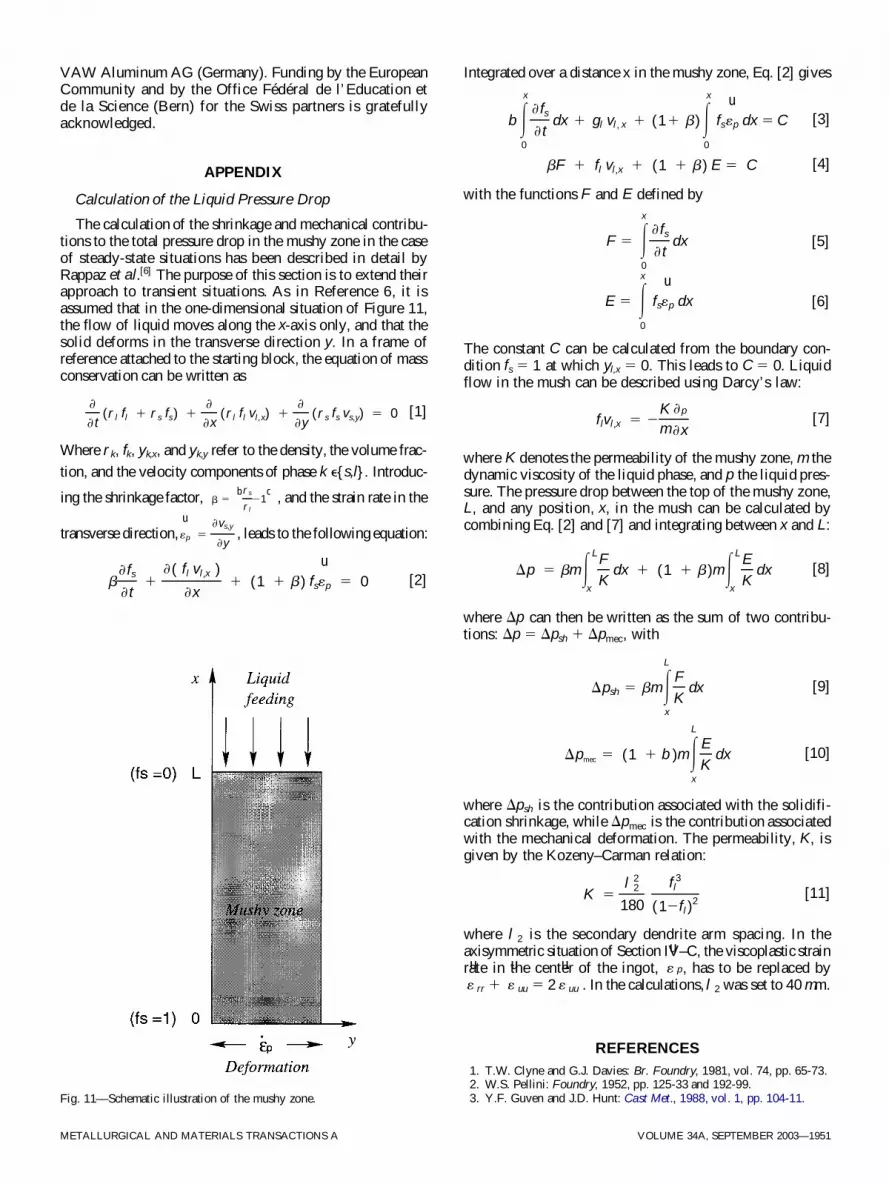


