Embed Size (px)
Citation preview
DOI: http://doi.org/10.4038/kjm.v6i0.7540
Kelaniya Journal of Management | 2017 | Special Issue | Page 55
The Impact of Promotional Strategies of Pharmaceutical Companies on
Doctor’s Recommendation of Branded Drugs: An Empirical Study on
Pharmaceutical Industry in Sri Lanka
Punchibandara, M. M. T.1
Faculty of Graduate Studies, University of Kelaniya, Sri Lanka
Abstract
The study was focused on selected promotional strategies such as medical detailing,
providing scientific materials, Sponsorships, continuous medical education programs (CME),
and sponsoring clinical meetings conducted by the pharmaceutical companies in order to get
recommendations of their products. As a sample, 150 doctors from Colombo, Kandy and
Galle, were interviewed with a structured questionnaire. Both descriptive and inferential
statistics methods were used to analyze the data. Correlation analysis and multiple
regressions were used to test the relationship among the independent and dependent
variables. The statistical analysis revealed that there is a significant influence of promotional
strategies used by pharmaceutical companies on the recommendation of branded drugs by
doctors. Further, it was found that each promotional strategy has different degree of impact
on recommendation of branded drugs. Detailing and sampling have significant impact but it
is relatively low compared to other factors like continuous meetings, scientific materials and
CME.
Keywords: Pharmaceutical Industry, Branded Drugs, Promotional Strategies
Introduction
Background of the Study
Pharmaceutical companies are developing processes to influence the people who influence
the physicians. There are several channels by which a physician may be influenced, including
self-influence through research, peer influence, direct interaction with pharmaceutical
companies, patients, and public or private insurance companies. These activities are being
practiced by the pharmaceutical companies in two ways like creating the pull strategy and
1 https://orcid.org/0000-0003-1564-8021
DOI: http://doi.org/10.4038/kjm.v6i0.7540
Kelaniya Journal of Management | 2017 | Special Issue | Page 56
push strategy. Pull strategy mainly concentrating on the mass media promotions which has a
limited influence on doctors. Push is the main promotional method followed by many
countries where promotions are more prominent among doctors. A Country like Sri Lanka is
more inclined towards this strategy where the government has not given the provision to do
pull strategy (Wendy D. 2007).
Hence, it is very much important to identify the doctor’s psychology in order to get the mind
share to prescribe a brand. This study touched the key variable, which will help
pharmaceutical companies to streamline their marketing strategies and enable them to invest
their budget in a proper way to get consistent business throughout the financial year. Also this
paper providing basic information of the industry which creates a platform to understand the
doctor’s perception on branded drugs is common in the Pharmaceutical industry of Sri Lanka.
Literature Review
In May 2003 the British Medical Journal devoted a special edition on the relationship
between doctors and pharmaceutical companies entitled “time to untangle doctors from drug
companies” (Moynihan 2003). The theme was relationship between the medical profession
and the pharmaceutical industry (Big Pharma). The medical profession in Europe, in
conjunction with many social movements, has begun to consider seriously the appropriate-
ness of current relationships between Big Pharma and the health sector. This was occurring in
the context of legal actions around corrupt sales practices in Europe such as those against
GlaxoSmithKline (GSK) in Germany (Gopal 2002) and Italy (Turone 2003), and the major
action against TAP Pharmaceutical Products, Inc in the United States which resulted in a
$875-million-dollar settlement in 2001 (Riccardi 2002).
In this context it is a question that how drug companies promote their products to the medical
professionals. According to Jon Buckley (2006), published in a paper article on Electronic
Journal of Business Ethics and Organization Studies titling “Pharmaceutical Marketing –
Time to change” had mentioned two ways, which are creating pull and creating push. As
mentioned in this article, pull strategy is much more common in countries like USA and New
Zealand where those pharmaceutical companies are given provision to advertise their
products on mass media. This is commonly known as Direct to consumer advertisements
(DTCA). This was somewhat controversial among the medical professional and health related
DOI: http://doi.org/10.4038/kjm.v6i0.7540
Kelaniya Journal of Management | 2017 | Special Issue | Page 57
agencies. Flynn (1999) argues that DTCA makes consumers better informed and more
sophisticated. In his view consumers are enable, through DTCA, to understand the market
better for drugs and the therapeutic options available to them. This view is also shared by
Calfee (2002), who argues that consumers can engage in more equitable relationships with
health care providers and become partners in their own health care as a result of DTCA.
Mintzes et al (2002) found that the consumers had selected drugs through the system having
learnt from the advertisements and influenced the physicians to prescribe the same when they
go for medication which was responded positively by physicians. The research also found the
choice of physicians was influenced and prescribed the same, or otherwise different brands
would have been. In contrast to pull strategy, push is the opposite strategy, which is followed
by many countries. This was found that more viable and reliable promotional method to a
pharma company where many governments do not allow direct advertising to convince
consumers (Joan Buckley, 2006).
Separate studies by McInney, Scheidermeyer, Lurie et al (1990), Banks and Mainour (1992)
and Chren, Landefeld and Murray (1989) all found that there was a strong correlation
between doctors’ tendencies to recommend drugs and their receipt of gifts/sponsorship/ non-
related payment etc. Studies by Wazana (2000), Chren et al (1989) and Thomson, Craig and
Barnham (1994) all show that gifts impact on doctors’ prescribing practices. Wazana (2000)
examined 29 empirical studies of the impact of interactions between the medical profession
and Big Pharma. According to this 29 empirical studies that doctors are more keen
prescribing the drug with relate to detailing skills, sampling of the products, scientific
materials, relationship with the doctor, continuous meeting and CME meeting conducted as a
promotional tool by the pharmaceutical companies.
While reviewing the above literature it was found that there is phenomenal relationship
among the recommendation of the drug versus promotional strategies implemented by the
pharmaceutical companies. Hence researcher looking to identify “To what extent the
promotional strategies of pharmaceutical companies will be influential on doctors to
prescribe the branded drugs in Sri Lanka.
Hypothesis of the Study
H1: - The promotional strategies of pharmaceutical companies have a significant influence on
doctor’s recommendations of branded drugs.
DOI: http://doi.org/10.4038/kjm.v6i0.7540
Kelaniya Journal of Management | 2017 | Special Issue | Page 58
H2: - Detailing is the most important promotional strategy which is highly influenced on
doctor’s recommendation of branded drugs
H3: - Scientific materials are more influenced on doctors’ prescription than providing
samples.
H4: - Continuous Medical Education (CME) is least significant promotional strategy which
has influenced on doctors’ prescription.
H5: - Continuous meetings are more significant than sampling as a promotional strategy.
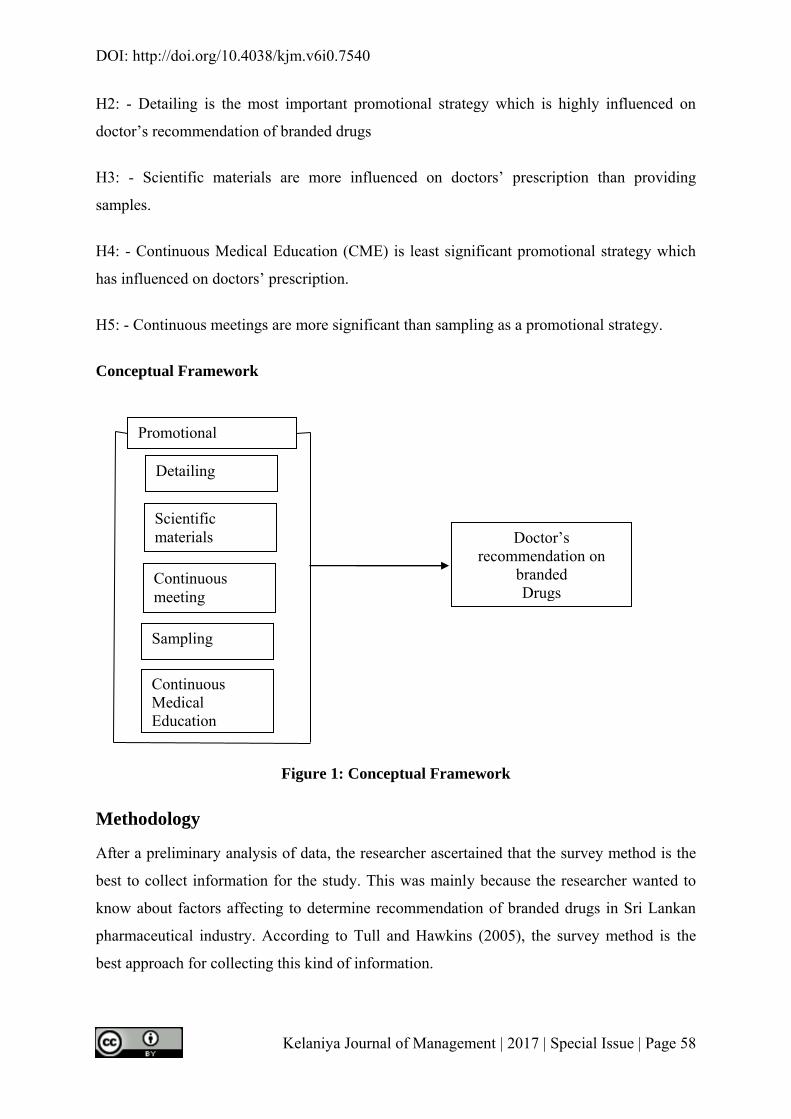
Conceptual Framework
Figure 1: Conceptual Framework
Methodology
After a preliminary analysis of data, the researcher ascertained that the survey method is the
best to collect information for the study. This was mainly because the researcher wanted to
know about factors affecting to determine recommendation of branded drugs in Sri Lankan
pharmaceutical industry. According to Tull and Hawkins (2005), the survey method is the
best approach for collecting this kind of information.
Detailing
Scientific materials
Continuous meeting
Sampling
Continuous Medical Education programs
Promotional Strategy
Doctor’s
recommendation on branded Drugs
ugs
DOI: http://doi.org/10.4038/kjm.v6i0.7540
Kelaniya Journal of Management | 2017 | Special Issue | Page 59
Krejcie and Morgan (1970) greatly simplified the sample decision table from the population.
According to the table, one million populations can be represented as a sample size of 384.
According to the Department of Census and Statistics (2008), active population of doctors in
Sri Lanka is 11,023. Even though doctor’s population 11,00 plus, only 1000 to 1500 doctors
are covered by the pharmaceutical companies in Sri Lanka (IMS annual Report 2017). Since
this population homogenous in nature and under the Cochran (1963) table of determining the
sample size for ±10% precision level, with 95% confidence interval suggested sample size
was 99 for the population of 10,000. In the research, samples of 150 respondents were
selected from Colombo, Kandy and Galle for the survey under simple random sampling
method justified the basis on above criteria. According to the report of IMS survey 2017 Q1,
60% of the pharmaceutical sales were generated from Colombo, Galle and Kandy. This base
gave the researcher to select above areas for the sample collection. Descriptive statistical
techniques were utilized to analyze the data. The major descriptive statistical techniques,
which were used in this study, are the percentage analysis measurements. Percentage values
were highlighted the salient features of collected data, facilitate comparison between
variables and enabled the study relationship more readily. Percentage values were used to
identify the contribution of various categories for each variable, to identify the nature of
influence of each independent variable on store choice behavior and for comparison. In
addition, the mean, mode, median, Standard deviation, Correlation analysis and Multiple
regression analysis were used for further extensive analysis of data.
Data Processing and Scales
After the data were collected through questionnaires, they were processed with a view to
reduce them to a manageable proportion. In this process researcher used SPSS software
package for editing, classification and tabulation. Each question was inserted to SPSS
package with defining variables.
Findings and data analysis
Reliability of Data Collection Instrument
Cronbach's alpha is the most common form of internal consistency reliability coefficient use
by the researches (George and Mallery, 2003). To measure the internal consistency of the
items in the questionnaire researcher run reliability test with taking 30 respondents and
DOI: http://doi.org/10.4038/kjm.v6i0.7540
Kelaniya Journal of Management | 2017 | Special Issue | Page 60
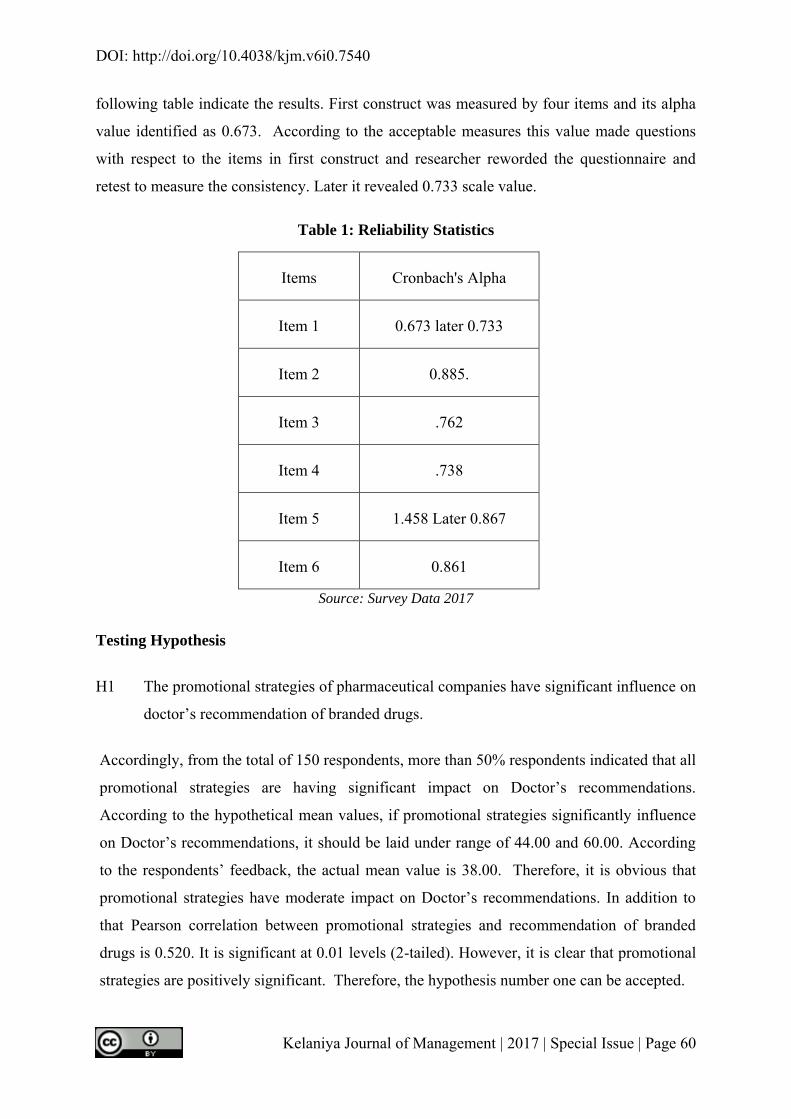
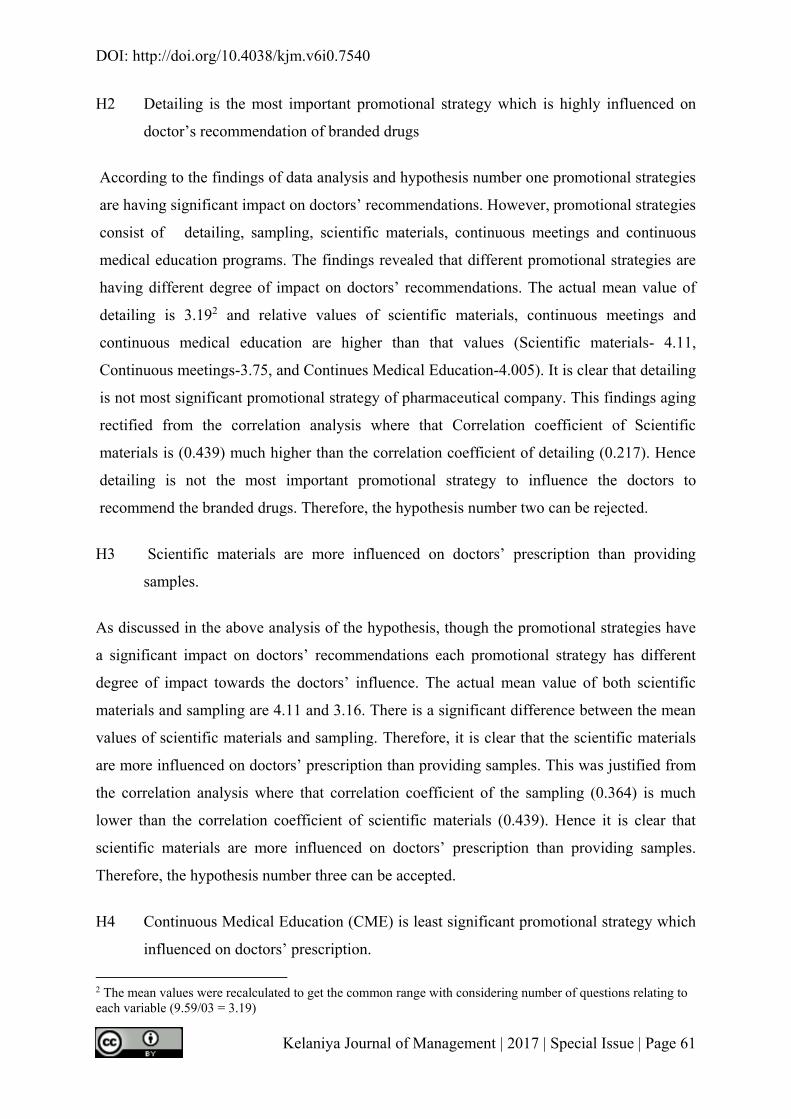
following table indicate the results. First construct was measured by four items and its alpha
value identified as 0.673. According to the acceptable measures this value made questions
with respect to the items in first construct and researcher reworded the questionnaire and
retest to measure the consistency. Later it revealed 0.733 scale value.
Table 1: Reliability Statistics
Items Cronbach's Alpha
Item 1 0.673 later 0.733
Item 2 0.885.
Item 3 .762
Item 4 .738
Item 5 1.458 Later 0.867
Item 6 0.861
Source: Survey Data 2017
Testing Hypothesis
H1 The promotional strategies of pharmaceutical companies have significant influence on
doctor’s recommendation of branded drugs.
Accordingly, from the total of 150 respondents, more than 50% respondents indicated that all
promotional strategies are having significant impact on Doctor’s recommendations.
According to the hypothetical mean values, if promotional strategies significantly influence
on Doctor’s recommendations, it should be laid under range of 44.00 and 60.00. According
to the respondents’ feedback, the actual mean value is 38.00. Therefore, it is obvious that
promotional strategies have moderate impact on Doctor’s recommendations. In addition to
that Pearson correlation between promotional strategies and recommendation of branded
drugs is 0.520. It is significant at 0.01 levels (2-tailed). However, it is clear that promotional
strategies are positively significant. Therefore, the hypothesis number one can be accepted.
DOI: http://doi.org/10.4038/kjm.v6i0.7540
Kelaniya Journal of Management | 2017 | Special Issue | Page 61
H2 Detailing is the most important promotional strategy which is highly influenced on
doctor’s recommendation of branded drugs
According to the findings of data analysis and hypothesis number one promotional strategies
are having significant impact on doctors’ recommendations. However, promotional strategies
consist of detailing, sampling, scientific materials, continuous meetings and continuous
medical education programs. The findings revealed that different promotional strategies are
having different degree of impact on doctors’ recommendations. The actual mean value of
detailing is 3.192 and relative values of scientific materials, continuous meetings and
continuous medical education are higher than that values (Scientific materials- 4.11,
Continuous meetings-3.75, and Continues Medical Education-4.005). It is clear that detailing
is not most significant promotional strategy of pharmaceutical company. This findings aging
rectified from the correlation analysis where that Correlation coefficient of Scientific
materials is (0.439) much higher than the correlation coefficient of detailing (0.217). Hence
detailing is not the most important promotional strategy to influence the doctors to
recommend the branded drugs. Therefore, the hypothesis number two can be rejected.
H3 Scientific materials are more influenced on doctors’ prescription than providing
samples.
As discussed in the above analysis of the hypothesis, though the promotional strategies have
a significant impact on doctors’ recommendations each promotional strategy has different
degree of impact towards the doctors’ influence. The actual mean value of both scientific
materials and sampling are 4.11 and 3.16. There is a significant difference between the mean
values of scientific materials and sampling. Therefore, it is clear that the scientific materials
are more influenced on doctors’ prescription than providing samples. This was justified from
the correlation analysis where that correlation coefficient of the sampling (0.364) is much
lower than the correlation coefficient of scientific materials (0.439). Hence it is clear that
scientific materials are more influenced on doctors’ prescription than providing samples.
Therefore, the hypothesis number three can be accepted.
H4 Continuous Medical Education (CME) is least significant promotional strategy which
influenced on doctors’ prescription.
2 The mean values were recalculated to get the common range with considering number of questions relating to each variable (9.59/03 = 3.19)
DOI: http://doi.org/10.4038/kjm.v6i0.7540
Kelaniya Journal of Management | 2017 | Special Issue | Page 62
The findings revealed each promotional strategy has different impact towards the
recommendation of the branded drugs by doctors. Especially when researcher compares the
actual means of each variable there was a clear difference found among them. This rectified
that level of influence made by each variable towards the recommendation of the branded
drugs is differ. The actual mean value of the continues medical education is 4.005 and the
mean value of the other variables are; detailing-3.19, sampling – 3.16, scientific materials –
4.11, continues meeting – 3.75. The actual mean value of continues medical education is
second highest mean compare to other actual mean values. It is not the lowest mean value
among the other variables. These findings also justified through correlation coefficients
where that correlation coefficient of CME (0.368) is much higher than the detailing (0.217)
and sampling (0.364). This data suggested that CME is much more positively correlates than
sampling and detailing. Hence, it is clear that continues medical education is not the least
significant promotional strategy which influenced on doctors’ prescription. Therefore,
hypothesis number four is rejected.
H5 Continuous meeting is more significant promotional strategy than sampling
According to the actual mean comparison between sampling and continues meetings, it was
found that the mean values much differ from each other and impact towards the doctor’s
recommendation differs too. The actual mean value of continuous meeting is 3.75 where it is
much higher than the sampling mean value, 3.16. This also further explained by the
correlation analysis where that correlation coefficient of continues meeting (0.373) is higher
than the correlation coefficient of sampling (0.364). This suggested that continues meeting is
much positively correlates than sampling. Hence, continuous meeting is more significant
promotional strategy than sampling. Therefore, hypothesis number five is accepted.
Multiple Regressions Analysis
In addition to the descriptive statistics, the researcher further analyzed the impact of
promotional strategies on doctor’s recommendation of branded drugs with the help of
multiple regression model. The model summary, ANOVA table and, Coefficient table are
given in table 2, 3 and 4 respectively.
DOI: http://doi.org/10.4038/kjm.v6i0.7540
Kelaniya Journal of Management | 2017 | Special Issue | Page 63
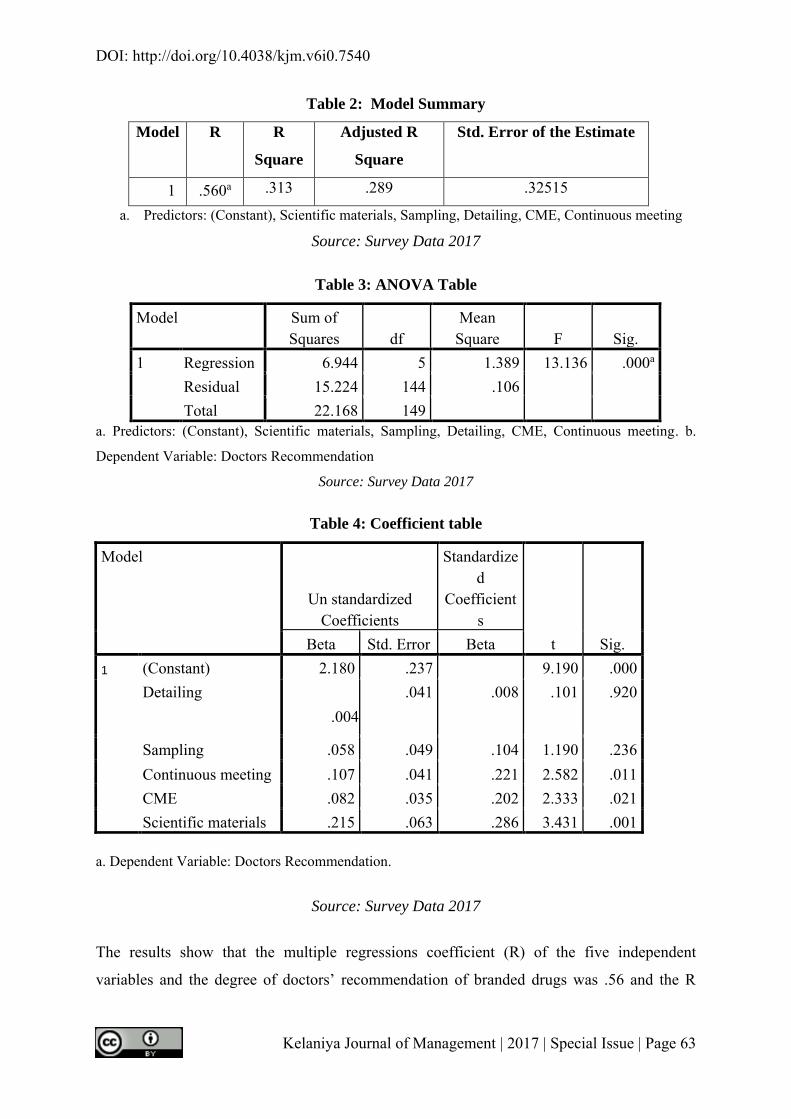
Table 2: Model Summary
Model R R
Square
Adjusted R
Square
Std. Error of the Estimate
1 .560a .313 .289 .32515
a. Predictors: (Constant), Scientific materials, Sampling, Detailing, CME, Continuous meeting
Source: Survey Data 2017
Table 3: ANOVA Table
Model Sum of Squares df
Mean Square F Sig.
1 Regression 6.944 5 1.389 13.136 .000a Residual 15.224 144 .106 Total 22.168 149
a. Predictors: (Constant), Scientific materials, Sampling, Detailing, CME, Continuous meeting. b.
Dependent Variable: Doctors Recommendation
Source: Survey Data 2017
Table 4: Coefficient table
Model
Un standardized Coefficients
Standardized
Coefficients
t Sig. Beta Std. Error Beta 1 (Constant) 2.180 .237 9.190 .000
Detailing
.004 .041 .008 .101 .920
Sampling .058 .049 .104 1.190 .236 Continuous meeting .107 .041 .221 2.582 .011 CME .082 .035 .202 2.333 .021 Scientific materials .215 .063 .286 3.431 .001
a. Dependent Variable: Doctors Recommendation.
Source: Survey Data 2017
The results show that the multiple regressions coefficient (R) of the five independent
variables and the degree of doctors’ recommendation of branded drugs was .56 and the R
DOI: http://doi.org/10.4038/kjm.v6i0.7540
Kelaniya Journal of Management | 2017 | Special Issue | Page 64
squire was .313. Therefore, the results suggested that 31 percent of the variance (R Square) in
doctors’ recommendation of branded drugs has been significantly explained by the group of
five independent variables. As shown by the F value of 13 (P<0.05), it is clear that those
values are substantiating the main hypothesis. Therefore, the hypothesis one, the promotional
strategies of pharmaceutical companies have significant influence on doctor’s
recommendation of branded drugs can be accepted.
Additionally, the strength of influence of each independent variable would have been on the
prescription of branded drugs being addressed and the results are shown in the coefficient
table. (See table 4). In analyzing the magnitude of the coefficients, the variables with the
largest beta value in absolute (ignoring signs) has greatest influence on the dependent
variable. While holding the other independent variables constant, Scientific material on
prescription of drugs represent the strongest explanatory variable with a largest standardized
beta of .286 and highest t value (3.431). The next strongest explanatory variable with the beta
of .221 and t value of 2.582 was continues meeting. This was followed by CME of standard
beta value of .202 and t value of 2.333. Therefore, all independent variables help to explain
the variance of prescription of drugs by the doctors.
Discussion and recommendation
Basic job of a medical representative is to meet doctors. He was given other inputs to make
that call more professional and productive. In this research it was found that doctors are
highly considered on regular meetings of the representatives. With high correlation
coefficient and high mean value suggested that continues meeting is highly impact on
recommending branded drugs. This revealed that pharmaceutical companies should focus on
regular visit of the representative. It is always better to create a field manager/field
coordinator level above the representative category to coordinate the regular meetings of
doctors. At the same time, it also suggested that to make a small areas or territories to
medical reps where that they can increase the frequency of visits to doctors. Especially brand
manager should make proper documentation system to get the information from the field. The
researcher can suggest some documents such as doctor call reports, doctors profile reports,
daily call reports, missing doctor analysis reports, work plans etc.
As a whole the analysis revealed that promotional strategies of pharmaceutical companies
had a considerable impact on doctors’ recommendation. Therefore, product managers, brand
DOI: http://doi.org/10.4038/kjm.v6i0.7540
Kelaniya Journal of Management | 2017 | Special Issue | Page 65
managers, marketing managers should have a balance approach in promoting the drugs to
doctors and should concentrates more strategy planning, execution and controlling to reach
for substantial and sustainable results.
References
Banks, J.W., Mainour, A.G. (1992). Attitudes of medical school faculty towards gifts from
the pharmaceutical industry. Academic Medicine. Journal of National Center for
Biotechnology Information, 67(2), 610-612
Buckley J. (2006). Pharmaceutical marketing-time for change. Electronic Journal of Business
Ethics and Organization Studies, 9(2), 1-8
Calfee J. (2002). Public Policy Issues in Direct-to-Consumer Advertising of Prescription
Drugs. Journal of Public Policy and Marketing, 21(2), 174-193
Chren M.M., Landefeld, C.S., Murray, T.H. (1989). Doctors, drug companies and gifts.
Journal of the Australian Medical Association, 26(2), 3448-3451
Flynn, L.T. (1999). Does direct to consumer advertising of prescription drugs benefit the
public’s health? – Yes. American Council on Science and Health, 11(4)
Gopal, K. (2002). GSK face bribe charges, changing of the guard. Retrieve from
http://www.pharmexec.com/gsk-faces-bribe-charges-changing-guard
McInney W.P., Scheidermeyer D.L., Lurie N. (1990). Attitudes of internal medicine faculty
and residents towards professional interaction with pharmaceutical sales
representatives. Journal of the Australian Medical Association, 264(13), 1693-1697
Moynihan R. (2003). Drug company sponsorship of education could be replaced at a fraction
of its cost. British Medical Journal, 326, 1163, doi:10.1136/bmj.326.7400.1163
Riccardi F. (2002). Healthcare Providers and Pharmaceutical Companies: Is there a
prescription for Ethical Relationships? Journal of Health Care Compliance. Jul-Aug,
4-8
DOI: http://doi.org/10.4038/kjm.v6i0.7540
Kelaniya Journal of Management | 2017 | Special Issue | Page 66
Thomson, A.N., Craig, B.J., Barnham, P.M. (1994). Attitudes of general practitioners in New
Zealand to pharmaceutical representatives. British Journal of General Practice, 44,
220-223
Tull, D. S., & Hawkins, D. I. (2005). Marketing Research: Measurement and Method (3rd
ed.). USA: Macmillan
Turone F. (2003). Italian police investigate GSK Italy for bribery. British Medical Journal,
326,413
Wazana A. (2000). Physicians and the pharmaceutical industry. Is a gift ever just a gift?.
Journal of the Australian Medical Association, 283, 373-380
Wendy, D., Herman S. (2007). Healthcare: Pharmaceuticals. Standard & Poor’s Industry
Surveys, 175(19), 1-58