Embed Size (px)
Citation preview

The GAME Algorithm Applied to ComplexFractionated Atrial Electrograms Data Set
Pavel Kordık1, Vaclav Kremen2, and Lenka Lhotska2
1Department of Computer Science and Engineering, FEE,2Department of Cybernetics, FEE,
Czech Technical University, Prague, Czech [email protected], [email protected]
Abstract. Complex fractionated atrial electrograms (CFAEs) representthe electrophysiologic substrate for atrial fibrillation (AF). Individualsignal complexes in CFAEs reflect electrical activity of electrophysiologicsubstrate at given time. To identify CFAEs sites, we developed algorithmbased on wavelet transform allowing automated feature extraction fromsource signals. Signals were ranked by three experts into four classes.We compiled a representative data set of 113 instances with extractedfeatures as inputs and average of expert ranking as the output. In thispaper, we present results of our GAME data mining algorithm, that wasused to (a) predict average ranking of experts, (b) classify into threeclasses. The performance of the GAME algorithm was compared to wellknown data mining techniques using robust ten times tenfold cross val-idation. Results indicate that wavelet signal decomposition could carryhigh level of predictive information about the state of electrophysiologicsubstrate and that the GAME algorithm outperforms other data min-ing techniques (such as decision trees, linear regression, neural networks,Support Vector Machines, etc.) in both prediction and classification ac-curacy.
1 Introduction
Atrial fibrillation (AF) is a cardiac arrhythmia characterized by very rapid anduncoordinated atrial activation with a completely irregular ventricular response[8]. Radiofrequency ablation of atrial areas that triggers or sustains AF is anonfarmacological treatment available recently [4].
During AF, multiple wavefronts propagate continuously through the rightand left atria, separated by anatomical and functional barriers [10]. This canbe electrophysiologically manifested as hierarchical distribution of dominant fre-quency [19] or complex fractionated electrograms (CFAEs) [17] during endocar-dial mapping. Local dominant frequency analysis of AF is burdened by manymethodological problems of spectral analysis [18]. Therefore the software sup-port for electroanatomical mapping system is focused on objective descriptionand space representation of CFAEs distribution most recently. Till now there isno single automated classifier of A-EGMs, that would enable independently on
2
operator classify A-EGMs and suggest its level of fractionation of CFAEs duringmapping procedure.
Our approach is based on the idea, that there are signal complexes (Fig. 2)in every AEGM signal, which are related to electrical activation of electropatho-logical substrate during AF. These signal complexes (SCs) can be found auto-matically and then used for several features extraction (degrees of freedom of thesignal), which could be used for automatic evaluation of electrogram complexity(or level of fractionation).
In this paper we used these and other features to construct an automated clas-sifier using the FAKE GAME approach [13]. The GAME algorithm constructshybrid feedforward neural networks that enable to give an operator indepen-dent look on A-EGM signal and classify its degree of fractionation. The FAKEmethods allow to extract useful knowledge from data.
In this contribution we studied optimal settings if the GAME algorithm andcompared its performance to several well established methods available in theWEKA data mining environment [1]. For the comparison, we needed to repeatten-fold cross validation 10 times to get reliable results. Results are presented inform of box plot charts.
2 Methodology
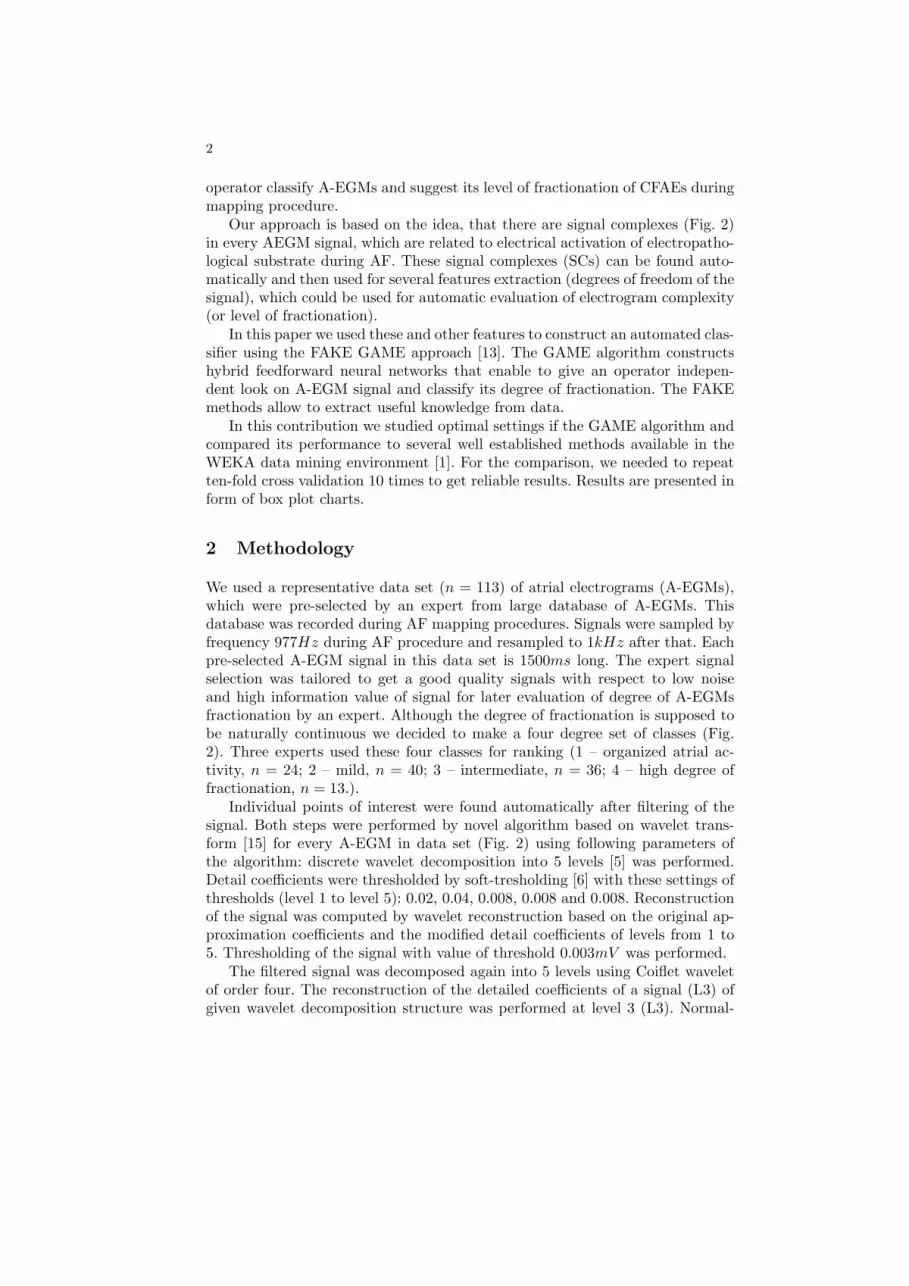
We used a representative data set (n = 113) of atrial electrograms (A-EGMs),which were pre-selected by an expert from large database of A-EGMs. Thisdatabase was recorded during AF mapping procedures. Signals were sampled byfrequency 977Hz during AF procedure and resampled to 1kHz after that. Eachpre-selected A-EGM signal in this data set is 1500ms long. The expert signalselection was tailored to get a good quality signals with respect to low noiseand high information value of signal for later evaluation of degree of A-EGMsfractionation by an expert. Although the degree of fractionation is supposed tobe naturally continuous we decided to make a four degree set of classes (Fig.2). Three experts used these four classes for ranking (1 – organized atrial ac-tivity, n = 24; 2 – mild, n = 40; 3 – intermediate, n = 36; 4 – high degree offractionation, n = 13.).
Individual points of interest were found automatically after filtering of thesignal. Both steps were performed by novel algorithm based on wavelet trans-form [15] for every A-EGM in data set (Fig. 2) using following parameters ofthe algorithm: discrete wavelet decomposition into 5 levels [5] was performed.Detail coefficients were thresholded by soft-tresholding [6] with these settings ofthresholds (level 1 to level 5): 0.02, 0.04, 0.008, 0.008 and 0.008. Reconstructionof the signal was computed by wavelet reconstruction based on the original ap-proximation coefficients and the modified detail coefficients of levels from 1 to5. Thresholding of the signal with value of threshold 0.003mV was performed.
The filtered signal was decomposed again into 5 levels using Coiflet waveletof order four. The reconstruction of the detailed coefficients of a signal (L3) ofgiven wavelet decomposition structure was performed at level 3 (L3). Normal-

3
Fig. 1. Four complex fractionated electrograms are shown. These are representativesof each ranking class of degree of fractionation ranked by three independent experts.From the top to bottom: 1 – organized atrial activity; 2 – mild, 3 – intermediate; 4 –high degree of fractionation.
ization of L3 was performed with respect to maximal absolute value of given L3values to obtain uniform signals across the data set for next stages of SCs detec-tion. Thresholding of normalized L3 signal values was performed with value ofthreshold 0.014. Then all parts of the signal, where absolute value of amplitudewas higher than 0, and whose inter-distance was closer than threshold 5ms werejoined together and they were marked as one individual SC.
Several feature extraction was performed to prepare input of classifier.
1. Number of inflection points in particular A-EGM signal (IP).2. Mean value of number of inflexion points in the found SCs in particular
A-EGM signal (MIPSC).3. Variance of number of inflexion points in the found SCs in particular A-EGM
signal (VIPSC).4. Mean value of width of found SCs in particular A-EGM signal (MWSC).5. Number of inflection points in found SCs in particular A-EGM signal (IPSC).6. IPSC normalized per number of found SCs in particular A-EGM signal
(NIPSC).7. IP + MIPSC (IPMIPSC).8.√
IPSC2 + TDM2 (IPSCTDM).9. Number of zero-level crossing points in found SCs in particular A-EGM
signal (ZCP).
4
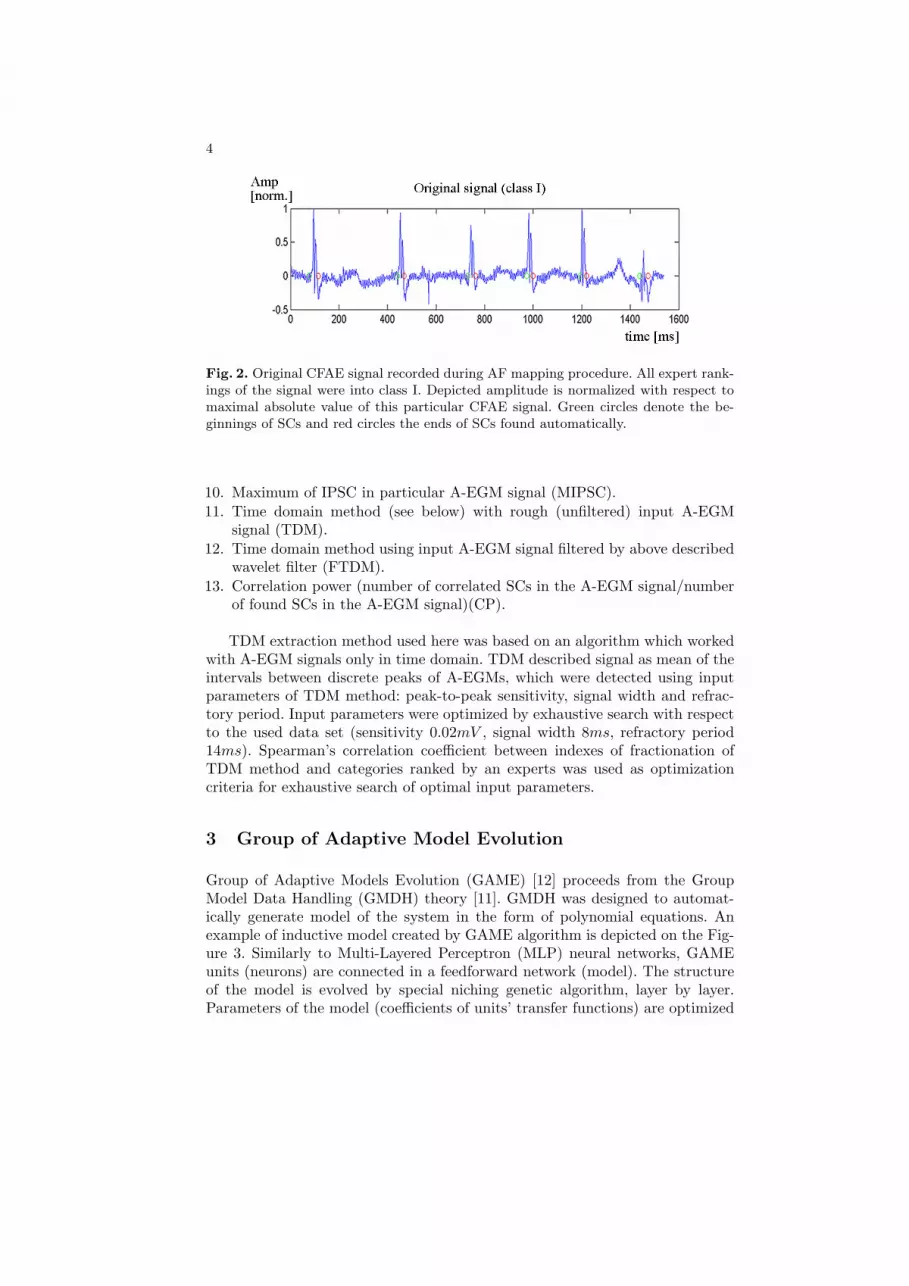
Fig. 2. Original CFAE signal recorded during AF mapping procedure. All expert rank-ings of the signal were into class I. Depicted amplitude is normalized with respect tomaximal absolute value of this particular CFAE signal. Green circles denote the be-ginnings of SCs and red circles the ends of SCs found automatically.
10. Maximum of IPSC in particular A-EGM signal (MIPSC).11. Time domain method (see below) with rough (unfiltered) input A-EGM
signal (TDM).12. Time domain method using input A-EGM signal filtered by above described
wavelet filter (FTDM).13. Correlation power (number of correlated SCs in the A-EGM signal/number
of found SCs in the A-EGM signal)(CP).
TDM extraction method used here was based on an algorithm which workedwith A-EGM signals only in time domain. TDM described signal as mean of theintervals between discrete peaks of A-EGMs, which were detected using inputparameters of TDM method: peak-to-peak sensitivity, signal width and refrac-tory period. Input parameters were optimized by exhaustive search with respectto the used data set (sensitivity 0.02mV , signal width 8ms, refractory period14ms). Spearman’s correlation coefficient between indexes of fractionation ofTDM method and categories ranked by an experts was used as optimizationcriteria for exhaustive search of optimal input parameters.
3 Group of Adaptive Model Evolution
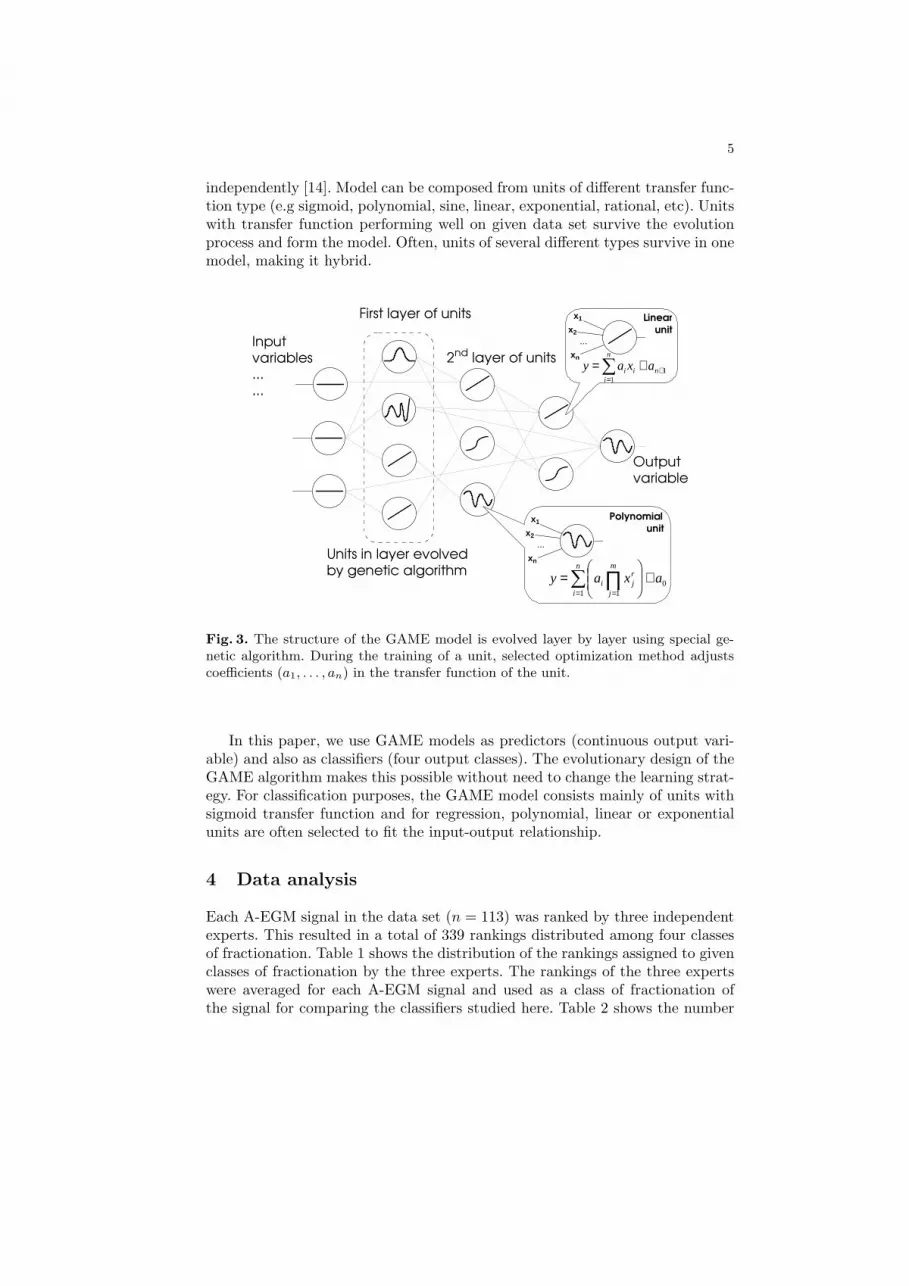
Group of Adaptive Models Evolution (GAME) [12] proceeds from the GroupModel Data Handling (GMDH) theory [11]. GMDH was designed to automat-ically generate model of the system in the form of polynomial equations. Anexample of inductive model created by GAME algorithm is depicted on the Fig-ure 3. Similarly to Multi-Layered Perceptron (MLP) neural networks, GAMEunits (neurons) are connected in a feedforward network (model). The structureof the model is evolved by special niching genetic algorithm, layer by layer.Parameters of the model (coefficients of units’ transfer functions) are optimized
5
independently [14]. Model can be composed from units of different transfer func-tion type (e.g sigmoid, polynomial, sine, linear, exponential, rational, etc). Unitswith transfer function performing well on given data set survive the evolutionprocess and form the model. Often, units of several different types survive in onemodel, making it hybrid.
Inputvariables......
First layer of units
2nd layer of units
Outputvariable
x1
xn
x2
...
01 1
axayn
i
m
j
rji +
=∑ ∏= =
Polynomial
unit
x1
xn
x2
...
11
+=
+=∑ n
n
iii axay
Linear
unit
Units in layer evolvedby genetic algorithm
Fig. 3. The structure of the GAME model is evolved layer by layer using special ge-netic algorithm. During the training of a unit, selected optimization method adjustscoefficients (a1, . . . , an) in the transfer function of the unit.
In this paper, we use GAME models as predictors (continuous output vari-able) and also as classifiers (four output classes). The evolutionary design of theGAME algorithm makes this possible without need to change the learning strat-egy. For classification purposes, the GAME model consists mainly of units withsigmoid transfer function and for regression, polynomial, linear or exponentialunits are often selected to fit the input-output relationship.
4 Data analysis
Each A-EGM signal in the data set (n = 113) was ranked by three independentexperts. This resulted in a total of 339 rankings distributed among four classesof fractionation. Table 1 shows the distribution of the rankings assigned to givenclasses of fractionation by the three experts. The rankings of the three expertswere averaged for each A-EGM signal and used as a class of fractionation ofthe signal for comparing the classifiers studied here. Table 2 shows the number

6
of signals in the averaged classes of fractionation. The observation of particular
Table 1. Number of A-EGM signals in the data set assigned bythree independent experts to the four classes of fractionation.
CF1 1 2 3 4
NS2 76 116 102 451Four classes of fractionation used in the study.2Number of A-EGM signals assigned by three independent ex-perts to each CF.
importance is that expert rankings differ mostly for two inner classes (2 and 3).Several times happened that one two experts ranked the signal as class 2 andthe third expert included the signal to class 3. This case was observed 19 times(class 2.3 in Table 2).
Table 2. Number of A-EGM signals in the data set assignedto averaged classes of fractionation and used for comparison ofclassifiers.
ACF1 1 1.3 1.7 2 2.3 2.7 3 3.3 3.7 4
NS2 19 5 9 17 19 4 21 4 4 111 Classes of fractionation, determined as the average of the rank-ings assigned by three independent experts.2Number of A-EGM signals in the data set assigned to the ACF.
The character of the data set, particulary the uncertain boundary of middleclasses excludes the possibility to classify into 10 classes of fractionation withreasonable error. Even for classification into four classes, we got perfect (95%)accuracy for class 1 and 4 only, the accuracy for other two classes was bad(around 65%).
Reflecting these preliminary experiments we projected the data into two di-mensions (using [7]) and found boundaries better separating the data vectors. Weprepared two versions of the data set. The first was A-EGM-regression data set,where the output was continuous number - the average experts ranking (AER).The second was A-EGM-classification data set with three output classes: (1 – or-ganized atrial activity; 2 – intermediate; 3 – high degree of fractionation), wherefor class one the AER was below 1.9, for class two the AER in 〈1.9, 3〉 intervaland for the class three the AER was above 3.
5 Results
At first, we studied the regression performance of GAME models produced bydifferent configurations of the algorithm. The target variable was the average

7
A-EGM signal ranking by three experts (the A-EGM-regression data set). Wefound out, and it is also apparent in the boxplot charts, that comparison of the10-fold cross validation error is not stable enough to decide, which configurationis better. Therefore we repeated the 10-fold cross validation ten times, each timewith different fold splitting. For each box plot it was necessary to generate andvalidate hundred models.
0.290.30.310.320.330.340.350.360.370.38
all all-ens3 lin lin-ens3 quickquick-ens3 std std-ens3 0.280.30.320.340.360.380.40.42
game-all3 game-lin3 w-linregw-lin-ens3w-leastMedSqw-SMOreg w-RBFNFig. 4. The comparison of RMS cross validation errors for several configuration con-figuration of the GAME engine(left). Selected GAME models compared with modelsgenerated in Weka environment(right).
For all experiments we used three default configurations of the GAME algo-rithm available in FAKE GAME environment [2]. The std configuration uses justsubset of units (those with implemented analytic gradient for faster optimiza-tion). It evolves 15 units for 30 epochs in each layer. The quick configuration isthe same as std except that it do not use the niching genetic algorithm (just 15units in the initial population). The linear restricts type of units that can beused to linear transfer function units. The all configuration is the same as std,in addition it uses all units available in the FAKE GAME environment. Thisconfiguration is more computationally expensive, because it also optimizes com-plex units such as BPNetwork containing standard MLP neural network withthe back-propagation of error [16].
The GAME algorithm also allows to generate ensemble of models [9, 3]. En-semble configurations contain digit (number of models) in their name.
The Figure 4 shows that the regression of the AER output is not too diffi-cult task. All basic GAME configurations performed similarly (left chart) andensembling of three models further improved their accuracy. The ensemble ofthree linear models performed best in average, but the difference from all−ens3configuration is not significant.
8
In Weka data mining environment, LinearRegression with embedded fea-ture selection algorithm was the best performing algorithm. Ensembling (bag-ging) did not improved results of generated model, quite the contrary. The RadialBasis Function Network (RBFN) failed to deliver satisfactory results in spite ofexperiments with its optimal setting (number of clusters).
55606570758085
quickquick-ens3quick-ens5 linlin-ens3 lin-ens5 stdstd-ens3std-ens5 all all-ens3all-ens5 6870727476788082
j48 mlp rbfn game
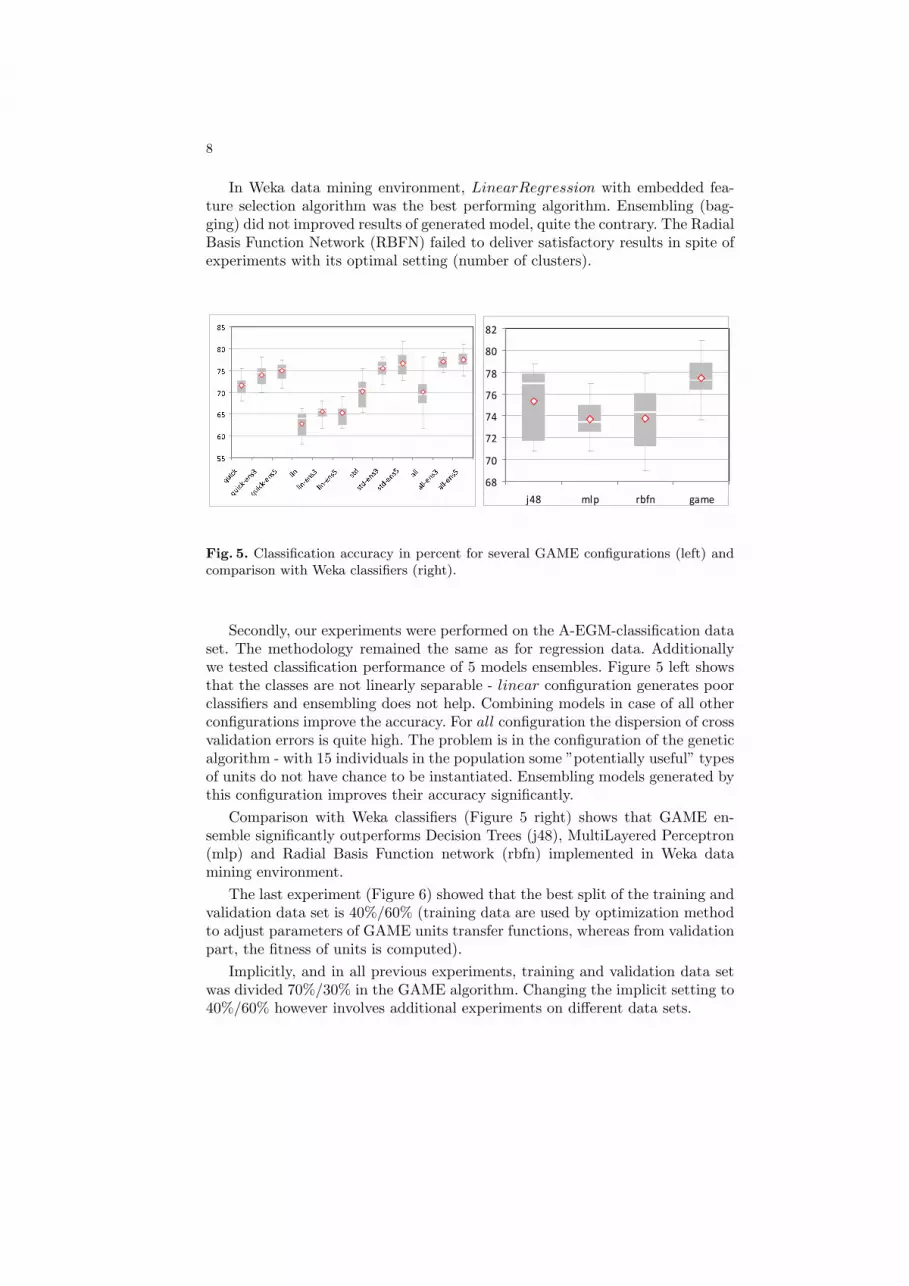
Fig. 5. Classification accuracy in percent for several GAME configurations (left) andcomparison with Weka classifiers (right).
Secondly, our experiments were performed on the A-EGM-classification dataset. The methodology remained the same as for regression data. Additionallywe tested classification performance of 5 models ensembles. Figure 5 left showsthat the classes are not linearly separable - linear configuration generates poorclassifiers and ensembling does not help. Combining models in case of all otherconfigurations improve the accuracy. For all configuration the dispersion of crossvalidation errors is quite high. The problem is in the configuration of the geneticalgorithm - with 15 individuals in the population some ”potentially useful” typesof units do not have chance to be instantiated. Ensembling models generated bythis configuration improves their accuracy significantly.
Comparison with Weka classifiers (Figure 5 right) shows that GAME en-semble significantly outperforms Decision Trees (j48), MultiLayered Perceptron(mlp) and Radial Basis Function network (rbfn) implemented in Weka datamining environment.
The last experiment (Figure 6) showed that the best split of the training andvalidation data set is 40%/60% (training data are used by optimization methodto adjust parameters of GAME units transfer functions, whereas from validationpart, the fitness of units is computed).
Implicitly, and in all previous experiments, training and validation data setwas divided 70%/30% in the GAME algorithm. Changing the implicit setting to40%/60% however involves additional experiments on different data sets.

9
50
55
60
65
70
75
80
85
s1/9 s3/7 s5/5 s7/3 s9/1
50
55
60
65
70
75
80
85
3s1/9 3s3/7 3s5/5 3s7/3 3s9/1
Fig. 6. Classification performance for different ratios of training/validation data split.Left - results for single game models generated by std configuration. Right - results forGAME ensemble (std− ens3).
6 Conclusion
Our results show, that extracted features for Complex Fractionated Atrial Elec-trograms bear significant information allowing us to classify signals into threeclasses with 80% accuracy. That is good result with respect to 60% of consis-tent assignments into four classes performed by experts. For this data set, theGAME algorithm outperforms well established methods in both classificationand regression accuracy. What is even more important, both winning configura-tions were identical all− ens. Natural selection evolved optimal models for verydifferent tasks - that is in accordance with our previous experiments and withour aim to develop automated data mining engine.
7 Acknowledgement
This research is partially supported by the grant Automated Knowledge Ex-traction (KJB201210701) of the Grant Agency of the Academy of Science ofthe Czech Republic and the research program ”Transdisciplinary Research inthe Area of Biomedical Engineering II” (MSM6840770012) sponsored by theMinistry of Education, Youth and Sports of the Czech Republic.
References
1. Weka open source data mining software. available online athttp://www.cs.waikato.ac.nz/ml/weka/, September 2006.
2. The fake game environment for the automatic knowledge extraction. availableonline at: http://www.sourceforge.net/projects/fakegame, March 2008.
3. G. Brown. Diversity in Neural Network Ensembles. PhD thesis, The Universityof Birmingham, School of Computer Science, Birmingham B15 2TT, United King-dom, January 2004.

10
4. H. Calkins, J. Brugada, D. Packer, and et al. Hrs/ehra/ecas expert consensusstatement on catheter and surgical ablation of atrial fibrillation: recommendationsfor personnel, policy, procedures and follow-up. Heart Rhythm, 4:816–61, 2007.
5. I. Daubechies. Ten lectures on Wavelts. Philadelphia, Pennsylvania, USA, 1992.6. D. Donoho. De-noising by soft-thresholding. IEEE Trans. on Inf. Theory,
41(3):613–62, 1995.7. J. Drchal, P. Kordık, and M. Snorek. Dataset Visualization Based on a Simulation
of Intermolecular Forces. In IWIM 2007 - International Workshop on InductiveModelling, volume 1, pages 246–253, Praha, 2007. Czech Technical University inPrague.
8. V. Fuster, L. Rydn, C. D.S., and et al. Acc/aha/esc 2006 guidelines for the man-agement of patients with atrial fibrillation: a report of the american college ofcardiology/american heart association task force on practice guidelines and the eu-ropean society of cardiology committee for practice guidelines (writing committeeto revise the 2001 guidelines for the management of patients with atrial fibrilla-tion): developed in collaboration with the european heart rhythm association andthe heart rhythm society. Circulation, 114(7):257–354, 2006.
9. L. Hansen and P. Salamon. Neural network ensembles. IEEE Trans. Pattern Anal.Machine Intelligence, 12(10):993–1001, 1990.
10. A. M. Houben, R.P.M. Processing of intracardiac electrograms in atrial fibrillation.diagnosis of electropathological substrate of af. IEEE Eng Med Biol Mag, 25:40–51,2006.
11. A. G. Ivakhnenko. Polynomial theory of complex systems. IEEE Transactions onSystems, Man, and Cybernetics, SMC-1(1):364–378, 1971.
12. P. Kordık. Game - group of adaptive models evolution. Technical Report DCSE-DTP-2005-07, Czech Technical University in Prague, FEE, CTU Prague, CzechRepublic, 2005.
13. P. Kordık. Fully Automated Knowledge Extraction using Group of Adaptive ModelsEvolution. PhD thesis, Czech Technical University in Prague, FEE, Dep. of Comp.Sci. and Computers, FEE, CTU Prague, Czech Republic, September 2006.
14. P. Kordık, O. Kovarık, and M. Snorek. OPTIMIZATION OF MODELS: LOOK-ING FOR THE BEST STRATEGY. In Proceedings of the 6th EUROSIM Congresson Modelling and Simulation, volume 2, pages 314–320, Vienna, 2007. ARGESIM.
15. V. Kremen and L. Lhotska. Evaluation of novel algorithm for search of signalcomplexes to describe complex fractionated atrial electrogram. In In Proceedingsof Biosignal. Biosignals, 2008.
16. M. Mandischer. A comparison of evolution strategies and backpropagation forneural network training. Neurocomputing, (42):87–117, 2002.
17. K. Nademanee, J. McKenzie, E. Kosar, and et al. A new approach for catheterablation of atrial fibrillation: mapping of the electrophysiologic substrate. J AmColl Cardiol., 43:2044–53, 2004.
18. J. Ng, A. Kadish, and J. Goldberger. Effect of electrogram characteristics on therelationship of dominant frequency to atrial activation rate in atrial fibrillation.Heart Rhythm, 3:1295–305, 2006.
19. P. Sanders, O. Berenfeld, M. Hocini, and et al. Spectral analysis identifies sitesof high-frequency activity maintaining atrial fibrillation in humans. Circulation,112:789–97, 2005.


