Embed Size (px)
Citation preview
Applied Geochemistry xxx (2013) xxx–xxx
Contents lists available at SciVerse ScienceDirect
Applied Geochemistry
journal homepage: www.elsevier .com/ locate/apgeochem
The effect of sulfide concentrate mineralogy and texture on ReactiveOxygen Species (ROS) generation
0883-2927/$ - see front matter � 2012 Elsevier Ltd. All rights reserved.http://dx.doi.org/10.1016/j.apgeochem.2012.11.015
⇑ Corresponding author.E-mail address: [email protected] (S.T.L. Harrison).
Please cite this article in press as: Jones, G.C., et al. The effect of sulfide concentrate mineralogy and texture on Reactive Oxygen Species (ROS) geneAppl. Geochem. (2013), http://dx.doi.org/10.1016/j.apgeochem.2012.11.015
Gavin C. Jones a, Megan Becker b, Robert P. van Hille a, Susan T.L. Harrison a,⇑a Centre for Bioprocess Engineering Research, Department of Chemical Engineering, University of Cape Town, Private Bag, Rondebosch 7701, South Africab Centre for Minerals Research, Department of Chemical Engineering, University of Cape Town, Private Bag, Rondebosch 7701, South Africa
a r t i c l e i n f o a b s t r a c t
Article history:Received 14 August 2012Accepted 29 November 2012Available online xxxx
The generation of Reactive Oxygen Species (ROS), H2O2 and �OH, has been observed from sulfide mineralcontaining particles in acidic solutions. The implications of this phenomenon, as a potential microbialstress-causing effect, have been studied previously with respect to thermophilic bioleaching performancein the presence of finely milled pyrite and chalcopyrite concentrates. In this study, the effect of sulfidemineralogy on ROS generation in the absence of microbes under physicochemical conditions typicalfor the bioleach environment was investigated. The mineralogical and elemental composition of elevendifferent samples containing sulfide mineral was obtained. These Au, Cu and other base metal-containingsulfide mineral concentrates as well as a milled whole ore of low Cu grade were tested for ROS genera-tion. The whole ore sample and two refractory Au concentrates containing approximately 50% pyrite,generated significantly less ROS compared to the base metal-containing concentrates when comparedon a constant surface area loading basis. Sulfide mineral-related variables were correlated with ROS gen-eration. A significant difference was observed between FeS2 and CuFeS2 grades separately, whereas acombined measure of both minerals present in samples showed a consistently strong correlation toROS generation. The Cu grade, total Cu-containing sulfides and the chalcopyrite content of Cu-containingsamples correlated well with ROS generation. However, a common deterministic variable with a strongassociation to increased ROS generation was not found. A sub-set of samples were subjected to QEM-SCAN� for textural analysis. Results suggested that a decrease in sulfide mineral liberation, caused bygangue silicate mineral occlusion to solution, resulted in decreased reactivity as shown in one of theAu-containing samples. Well-liberated chalcopyrite and pyrite phases corresponded to increased reactiv-ity of samples. Pyrite, which was present in all of the reactive samples, was shown to be associated withother sulfide minerals, implicating its importance in galvanic interactions. Micro-analysis of chalcopyriteand pyrite phases from highly reactive samples showed an abundance of particles with extensive crack-ing and the possible presence of secondary transformation phases (szomolnokite). These results suggestthat sulfide mineralogy, liberation and extent of physical processing affect sulfide mineral concentratereactivity in acidic solutions.
� 2012 Elsevier Ltd. All rights reserved.
1. Introduction
Sulfide mineral particles are generally appreciated to be reac-tive. This ‘‘sulfide reactivity’’ includes a number of complex physi-cochemical processes that occur either at the surface or inside thebulk of sulfide mineral-containing particles or both, reducing sta-bility under certain conditions and leading to transformation andoxidation. The detrimental effects of this reactivity have been stud-ied mostly in the context of uncontrolled exposure to biologicalsystems, both human (Schoonen et al., 2006) and environmental(Salmon and Malmström, 2006; Moncur et al., 2009), upon miningactivities. More recent developments have looked at harnessing
sulfide mineral reactivity for application in advance oxidation pro-cesses, to treat recalcitrant organic pollutants (Che and Lee, 2011;Che et al., 2011; Hara, 2011; Wang et al., 2012). Enhanced sulfidemineral reactivity is often promoted in hydrometallurgical pro-cesses where the extraction of the contained metal value is desired.In sulfide mineral biohydrometallurgy for the extraction of baseand precious metals from sulfide mineral concentrates using Fe-and S-oxidising microorganisms (i.e. bioleaching/biooxidation),there is a need to understand sulfide mineral reactivity and its po-tential effects on the microbial catalysts used in the process.
The bulk mineralogies of sulfide mineral concentrates used intwo different tank bioprocessing technologies are shown in Table 1(Rawlings et al., 2003). The sulfide mineral pyrite, is common toboth processes. For the commercial BIOX� process it is intention-ally recovered from the run of mine ore into the concentrate due
ration.
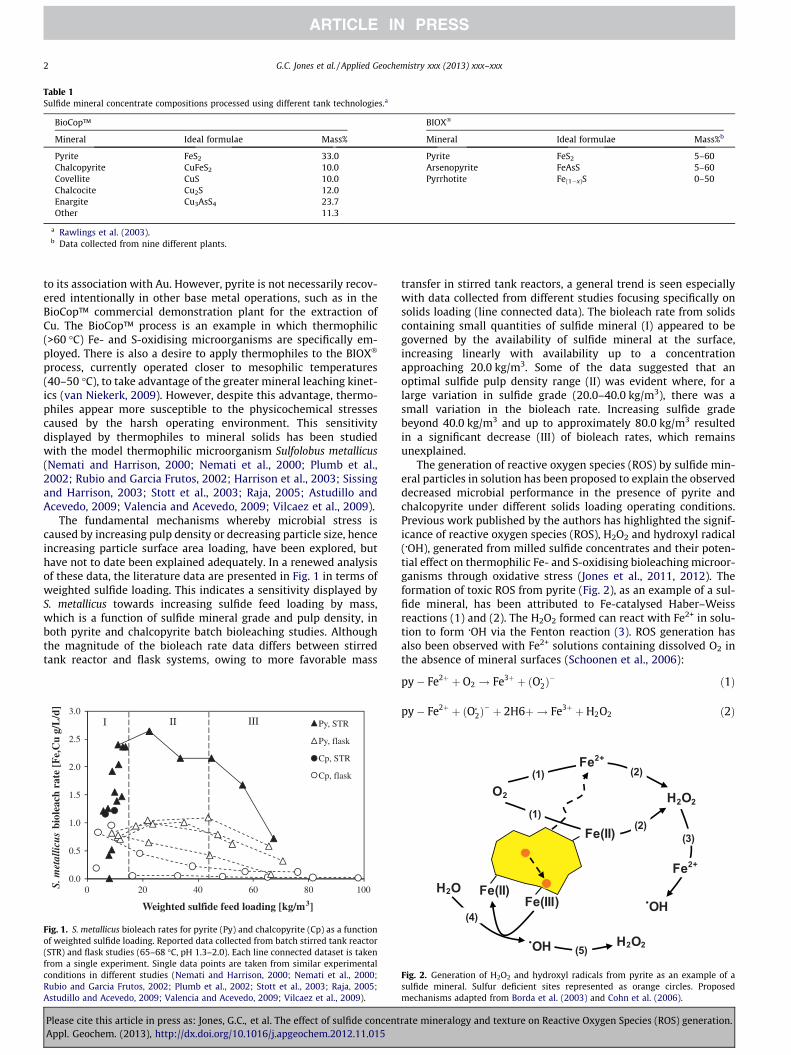
Table 1Sulfide mineral concentrate compositions processed using different tank technologies.a
BioCop™ BIOX�
Mineral Ideal formulae Mass% Mineral Ideal formulae Mass%b
Pyrite FeS2 33.0 Pyrite FeS2 5–60Chalcopyrite CuFeS2 10.0 Arsenopyrite FeAsS 5–60Covellite CuS 10.0 Pyrrhotite Fe(1�x)S 0–50Chalcocite Cu2S 12.0Enargite Cu3AsS4 23.7Other 11.3
a Rawlings et al. (2003).b Data collected from nine different plants.
2 G.C. Jones et al. / Applied Geochemistry xxx (2013) xxx–xxx
to its association with Au. However, pyrite is not necessarily recov-ered intentionally in other base metal operations, such as in theBioCop™ commercial demonstration plant for the extraction ofCu. The BioCop™ process is an example in which thermophilic(>60 �C) Fe- and S-oxidising microorganisms are specifically em-ployed. There is also a desire to apply thermophiles to the BIOX�
process, currently operated closer to mesophilic temperatures(40–50 �C), to take advantage of the greater mineral leaching kinet-ics (van Niekerk, 2009). However, despite this advantage, thermo-philes appear more susceptible to the physicochemical stressescaused by the harsh operating environment. This sensitivitydisplayed by thermophiles to mineral solids has been studiedwith the model thermophilic microorganism Sulfolobus metallicus(Nemati and Harrison, 2000; Nemati et al., 2000; Plumb et al.,2002; Rubio and Garcia Frutos, 2002; Harrison et al., 2003; Sissingand Harrison, 2003; Stott et al., 2003; Raja, 2005; Astudillo andAcevedo, 2009; Valencia and Acevedo, 2009; Vilcaez et al., 2009).
The fundamental mechanisms whereby microbial stress iscaused by increasing pulp density or decreasing particle size, henceincreasing particle surface area loading, have been explored, buthave not to date been explained adequately. In a renewed analysisof these data, the literature data are presented in Fig. 1 in terms ofweighted sulfide loading. This indicates a sensitivity displayed byS. metallicus towards increasing sulfide feed loading by mass,which is a function of sulfide mineral grade and pulp density, inboth pyrite and chalcopyrite batch bioleaching studies. Althoughthe magnitude of the bioleach rate data differs between stirredtank reactor and flask systems, owing to more favorable mass
0.0
0.5
1.0
1.5
2.0
2.5
3.0
0 20 40 60 80 100S. m
etal
licus
biol
each
rat
e [F
e,C
u g/
L/d
]
Weighted sulfide feed loading [kg/m3]
Py, STR
Py, flask
Cp, STR
Cp, flask
II IIII
Fig. 1. S. metallicus bioleach rates for pyrite (Py) and chalcopyrite (Cp) as a functionof weighted sulfide loading. Reported data collected from batch stirred tank reactor(STR) and flask studies (65–68 �C, pH 1.3–2.0). Each line connected dataset is takenfrom a single experiment. Single data points are taken from similar experimentalconditions in different studies (Nemati and Harrison, 2000; Nemati et al., 2000;Rubio and Garcia Frutos, 2002; Plumb et al., 2002; Stott et al., 2003; Raja, 2005;Astudillo and Acevedo, 2009; Valencia and Acevedo, 2009; Vilcaez et al., 2009).
Please cite this article in press as: Jones, G.C., et al. The effect of sulfide concentAppl. Geochem. (2013), http://dx.doi.org/10.1016/j.apgeochem.2012.11.015
transfer in stirred tank reactors, a general trend is seen especiallywith data collected from different studies focusing specifically onsolids loading (line connected data). The bioleach rate from solidscontaining small quantities of sulfide mineral (I) appeared to begoverned by the availability of sulfide mineral at the surface,increasing linearly with availability up to a concentrationapproaching 20.0 kg/m3. Some of the data suggested that anoptimal sulfide pulp density range (II) was evident where, for alarge variation in sulfide grade (20.0–40.0 kg/m3), there was asmall variation in the bioleach rate. Increasing sulfide gradebeyond 40.0 kg/m3 and up to approximately 80.0 kg/m3 resultedin a significant decrease (III) of bioleach rates, which remainsunexplained.
The generation of reactive oxygen species (ROS) by sulfide min-eral particles in solution has been proposed to explain the observeddecreased microbial performance in the presence of pyrite andchalcopyrite under different solids loading operating conditions.Previous work published by the authors has highlighted the signif-icance of reactive oxygen species (ROS), H2O2 and hydroxyl radical(�OH), generated from milled sulfide concentrates and their poten-tial effect on thermophilic Fe- and S-oxidising bioleaching microor-ganisms through oxidative stress (Jones et al., 2011, 2012). Theformation of toxic ROS from pyrite (Fig. 2), as an example of a sul-fide mineral, has been attributed to Fe-catalysed Haber–Weissreactions (1) and (2). The H2O2 formed can react with Fe2+ in solu-tion to form �OH via the Fenton reaction (3). ROS generation hasalso been observed with Fe2+ solutions containing dissolved O2 inthe absence of mineral surfaces (Schoonen et al., 2006):
py� Fe2þ þ O2 ! Fe3þ þ ðO�2Þ� ð1Þ
py� Fe2þ þ ðO�2Þ� þ 2H6þ ! Fe3þ þH2O2 ð2Þ
O2
Fe(III)
•OH
H2O2
H2O
H2O2(5)
Fe2+
•OH
(1)
(1)
(2)
(2)(3)
(4)
Fe(II)
Fe(II)
Fe2+
Fig. 2. Generation of H2O2 and hydroxyl radicals from pyrite as an example of asulfide mineral. Sulfur deficient sites represented as orange circles. Proposedmechanisms adapted from Borda et al. (2003) and Cohn et al. (2006).
rate mineralogy and texture on Reactive Oxygen Species (ROS) generation.
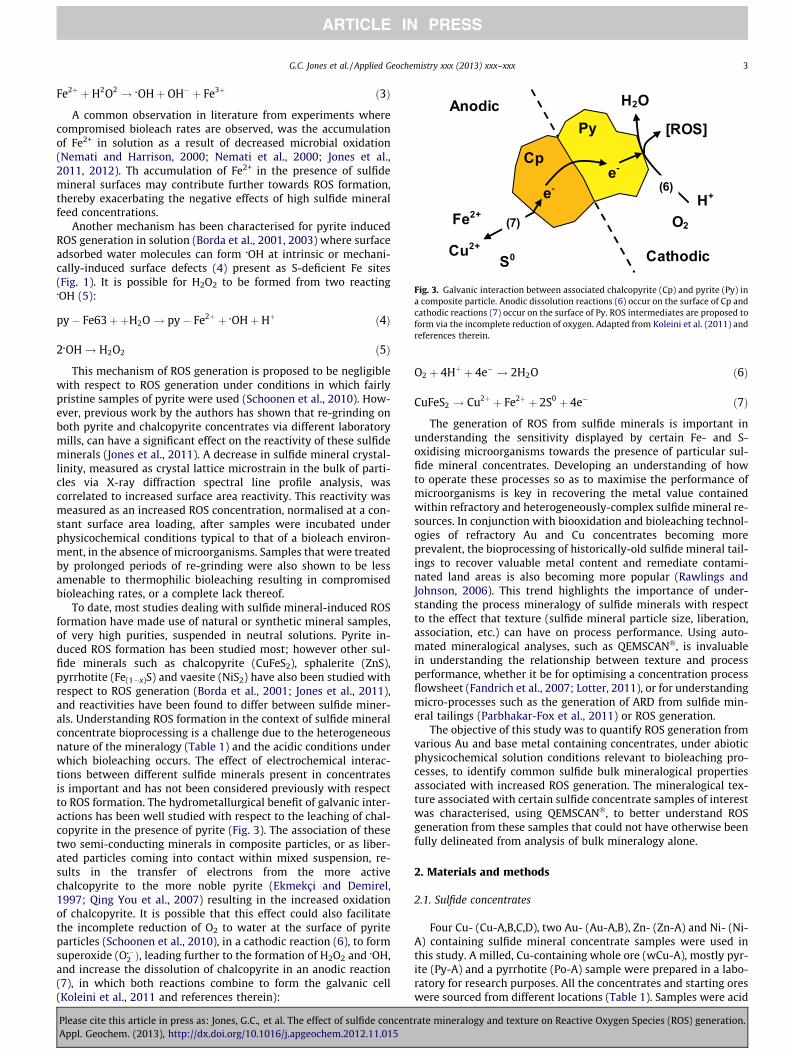
Fig. 3. Galvanic interaction between associated chalcopyrite (Cp) and pyrite (Py) ina composite particle. Anodic dissolution reactions (6) occur on the surface of Cp andcathodic reactions (7) occur on the surface of Py. ROS intermediates are proposed toform via the incomplete reduction of oxygen. Adapted from Koleini et al. (2011) andreferences therein.
G.C. Jones et al. / Applied Geochemistry xxx (2013) xxx–xxx 3
Fe2þ þH2O2 ! �OHþ OH� þ Fe3þ ð3Þ
A common observation in literature from experiments wherecompromised bioleach rates are observed, was the accumulationof Fe2+ in solution as a result of decreased microbial oxidation(Nemati and Harrison, 2000; Nemati et al., 2000; Jones et al.,2011, 2012). Th accumulation of Fe2+ in the presence of sulfidemineral surfaces may contribute further towards ROS formation,thereby exacerbating the negative effects of high sulfide mineralfeed concentrations.
Another mechanism has been characterised for pyrite inducedROS generation in solution (Borda et al., 2001, 2003) where surfaceadsorbed water molecules can form �OH at intrinsic or mechani-cally-induced surface defects (4) present as S-deficient Fe sites(Fig. 1). It is possible for H2O2 to be formed from two reacting�OH (5):
py� Fe63þþH2O! py� Fe2þ þ �OHþHþ ð4Þ
2�OH! H2O2 ð5Þ
This mechanism of ROS generation is proposed to be negligiblewith respect to ROS generation under conditions in which fairlypristine samples of pyrite were used (Schoonen et al., 2010). How-ever, previous work by the authors has shown that re-grinding onboth pyrite and chalcopyrite concentrates via different laboratorymills, can have a significant effect on the reactivity of these sulfideminerals (Jones et al., 2011). A decrease in sulfide mineral crystal-linity, measured as crystal lattice microstrain in the bulk of parti-cles via X-ray diffraction spectral line profile analysis, wascorrelated to increased surface area reactivity. This reactivity wasmeasured as an increased ROS concentration, normalised at a con-stant surface area loading, after samples were incubated underphysicochemical conditions typical to that of a bioleach environ-ment, in the absence of microorganisms. Samples that were treatedby prolonged periods of re-grinding were also shown to be lessamenable to thermophilic bioleaching resulting in compromisedbioleaching rates, or a complete lack thereof.
To date, most studies dealing with sulfide mineral-induced ROSformation have made use of natural or synthetic mineral samples,of very high purities, suspended in neutral solutions. Pyrite in-duced ROS formation has been studied most; however other sul-fide minerals such as chalcopyrite (CuFeS2), sphalerite (ZnS),pyrrhotite (Fe(1�x)S) and vaesite (NiS2) have also been studied withrespect to ROS generation (Borda et al., 2001; Jones et al., 2011),and reactivities have been found to differ between sulfide miner-als. Understanding ROS formation in the context of sulfide mineralconcentrate bioprocessing is a challenge due to the heterogeneousnature of the mineralogy (Table 1) and the acidic conditions underwhich bioleaching occurs. The effect of electrochemical interac-tions between different sulfide minerals present in concentratesis important and has not been considered previously with respectto ROS formation. The hydrometallurgical benefit of galvanic inter-actions has been well studied with respect to the leaching of chal-copyrite in the presence of pyrite (Fig. 3). The association of thesetwo semi-conducting minerals in composite particles, or as liber-ated particles coming into contact within mixed suspension, re-sults in the transfer of electrons from the more activechalcopyrite to the more noble pyrite (Ekmekçi and Demirel,1997; Qing You et al., 2007) resulting in the increased oxidationof chalcopyrite. It is possible that this effect could also facilitatethe incomplete reduction of O2 to water at the surface of pyriteparticles (Schoonen et al., 2010), in a cathodic reaction (6), to formsuperoxide (O��2 Þ, leading further to the formation of H2O2 and �OH,and increase the dissolution of chalcopyrite in an anodic reaction(7), in which both reactions combine to form the galvanic cell(Koleini et al., 2011 and references therein):
Please cite this article in press as: Jones, G.C., et al. The effect of sulfide concentAppl. Geochem. (2013), http://dx.doi.org/10.1016/j.apgeochem.2012.11.015
O2 þ 4Hþ þ 4e� ! 2H2O ð6Þ
CuFeS2 ! Cu2þ þ Fe2þ þ 2S0 þ 4e� ð7Þ
The generation of ROS from sulfide minerals is important inunderstanding the sensitivity displayed by certain Fe- and S-oxidising microorganisms towards the presence of particular sul-fide mineral concentrates. Developing an understanding of howto operate these processes so as to maximise the performance ofmicroorganisms is key in recovering the metal value containedwithin refractory and heterogeneously-complex sulfide mineral re-sources. In conjunction with biooxidation and bioleaching technol-ogies of refractory Au and Cu concentrates becoming moreprevalent, the bioprocessing of historically-old sulfide mineral tail-ings to recover valuable metal content and remediate contami-nated land areas is also becoming more popular (Rawlings andJohnson, 2006). This trend highlights the importance of under-standing the process mineralogy of sulfide minerals with respectto the effect that texture (sulfide mineral particle size, liberation,association, etc.) can have on process performance. Using auto-mated mineralogical analyses, such as QEMSCAN�, is invaluablein understanding the relationship between texture and processperformance, whether it be for optimising a concentration processflowsheet (Fandrich et al., 2007; Lotter, 2011), or for understandingmicro-processes such as the generation of ARD from sulfide min-eral tailings (Parbhakar-Fox et al., 2011) or ROS generation.
The objective of this study was to quantify ROS generation fromvarious Au and base metal containing concentrates, under abioticphysicochemical solution conditions relevant to bioleaching pro-cesses, to identify common sulfide bulk mineralogical propertiesassociated with increased ROS generation. The mineralogical tex-ture associated with certain sulfide concentrate samples of interestwas characterised, using QEMSCAN�, to better understand ROSgeneration from these samples that could not have otherwise beenfully delineated from analysis of bulk mineralogy alone.
2. Materials and methods
2.1. Sulfide concentrates
Four Cu- (Cu-A,B,C,D), two Au- (Au-A,B), Zn- (Zn-A) and Ni- (Ni-A) containing sulfide mineral concentrate samples were used inthis study. A milled, Cu-containing whole ore (wCu-A), mostly pyr-ite (Py-A) and a pyrrhotite (Po-A) sample were prepared in a labo-ratory for research purposes. All the concentrates and starting oreswere sourced from different locations (Table 1). Samples were acid
rate mineralogy and texture on Reactive Oxygen Species (ROS) generation.
4 G.C. Jones et al. / Applied Geochemistry xxx (2013) xxx–xxx
washed and stored in a vacuum desiccator for several months priorto being used.
2.2. Mineralogical and chemical analyses
Mineralogical quantification was performed by powder X-raydiffraction (QXRD) analysis using a PANalytical X’Pert Pro powderdiffractometer with X’Celerator detector, variable divergence andfixed receiving slits with Fe filtered Co Ka radiation. The phaseswere identified using X’Pert Highscore plus software. Elementalconcentration of Fe and Cu were measured using atomic absorp-tion spectroscopy (Varian SpectrAA 30). Total S grade was mea-sured by Leco (S632) analysis. Minor elements were measuredusing inductively coupled plasma – optical emission spectroscopy(Varian 730-ES). Sample surface area was measured using the N2
adsorption Brunauer, Emmett and Teller (BET) method (Micromer-itics TriStar).
QEMSCAN� analysis (Gottlieb et al., 2000) was used to quantifysulfide mineral texture of the following sub-set of samples: Cu-A,Cu-B, Au-B and Py-A. Each sample was dry screened into 3 or 4 dif-ferent size fractions and each fraction split into three representa-tive aliquots for analysis. Graphite was added to avoid touchingparticles and aliquots were mounted into an epoxy resin. The QEM-SCAN� used in this study was based on a LEO 4010 SEM platform,equipped with two Bruker SDD detectors. Pixel size varied between1 and 5 lm depending on the particle size of the sample. Theaccompanying software package iDiscover™ (version 5.0) wasused for processing and reporting of the data. Bulk mineralogicalanalysis data was validated using analytical chemistry data andfound to be in agreement. Scanning electron micrographs (SEM)were taken (FEI Nova NanoSEM Quanta 360) of selected particlesin QEMSCAN� resin blocks and energy dispersive X-ray spectros-copy (EDS), Oxford X-Max detector, was used to indicate relativeelemental abundances (Oxford, Inca). Major-Fe substitution wasmeasured for sample ZnA, sphalerite phases (±5%), using a JXA-8100 (JEOL) Electron Probe Microanalyser with a beam diameterof 3 lm.
2.3. ROS generation experiments
The generation of reactive oxygen species (ROS) and its mea-surement was performed using an adapted 30-(p-Aminophenyl)fluorescein (Invitrogen) fluorescence method (Jones et al., 2011).In brief, this technique relies on the conversion of a non-fluorescentmolecular probe molecule to a fluorescent molecule upon reactionwith �OH radical or the combination of horse radish peroxidase(HRP) and H2O2. Originally developed for use in biomedical re-search at pH 7.4, it has been used to study mineral slurries at pH7.4 and adapted by the authors to make time specific measure-ments under acidic conditions. ROS was quantified from sampleswithdrawn from mineral suspensions at specific time intervalsand filtered (0.22 lm Millipore). ROS containing filtrates werereacted with probe, potassium phosphate buffer (0.55 M, pH 5.4)and/or HRP for 5 min before fluorescence measurement.
All ROS experiments were performed in the following solutioncontaining basal salts: (NH4)2SO4 (1.30 g/L), KH2PO4 (0.28 g/L),MgSO4�7H2O (0.25 g/L) and CaCl2�2H2O (0.07 g/L) made up inultra-pure water (MilliQ, Millipore), adjusted to pH 1.6 with con-centrated H2SO4. Initial experiments were conducted in both shakeflask and stirred tank reactor systems (STR). A baffled STR of 1.0 Lcapacity and working volume of 0.7 L was used with a four-pitchblade stainless steel impeller (diameter 0.058 m set at a clearanceof 0.01 m from the reactor base), to provide agitation at 560 rpm.Compressed air was supplied at a rate of 2 L/min. Triplicate sam-ples were carefully weighed and suspended in solution in sealed50 mL Erlenmeyer flasks, using an orbital shaker (180 rpm) at
Please cite this article in press as: Jones, G.C., et al. The effect of sulfide concentAppl. Geochem. (2013), http://dx.doi.org/10.1016/j.apgeochem.2012.11.015
room temperature for 24 h. The pH of the suspensions was notmeasured and was assumed to stay constant at 1.6. Ferrous iron,dissolved in solution from suspension of mineral particles, aftersample incubation and filtration (0.22 lm Millipore) was mea-sured colorimetrically using the 1–10 phenanthroline method(APHA, 1998).
2.4. Data analysis
ROS generation data were normalised to 10 m2/L surface arealoading (SAL) for comparison. The contribution of sulfide mineral-ogical (QXRD) and elemental compositions to ROS generation weredetermined on a mass percentage basis (w/w%). This made it pos-sible to assess the contribution of each common sulfide mineraland associated variable within all the samples tested towardsROS generation under typical bioleaching conditions in the absenceof bioleaching microorganisms. Correlations between different sul-fide mineral associated variables and normalised ROS values werecalculated (Excel, Microsoft). Both Pearson’s correlation coefficient(rp) and Spearman’s rank correlation coefficient (rs) were used tostatistically assess the tendency of a given variable to vary withROS generation, across all samples. The significance of all correla-tion values was calculated using a two-tailed Student’s t-test(Davis, 2002).
3. Results
3.1. Analysis of mineralogical and elemental composition data ofsulfide concentrate samples
Table 2 shows the results of the quantitative X-ray diffraction(QXRD) analysis of the eleven sulfide mineral-containing samplesused in this study. As can be seen from the results, sulfide mineralconcentrates are heterogeneous with respect to mineralogy. Thisheterogeneity is a function of the run of mine ore and the concen-tration process used, most often froth flotation, to recover valuableminerals. Pyrite was identified in most of the samples with theexception of Zn-A and Po-A. Pyrite is known to be commonly asso-ciated with both Au- and base metal-containing sulfide mineralconcentrates used in biooxidation and bioleaching processes,respectively. Gangue minerals associated with sulfide mineral con-centrates are defined as unwanted minerals not bearing any metalvalue of interest. Therefore, pyrite is considered to be a gangue sul-fide mineral with respect to base metal concentrates containingmetals such as Cu, Zn and Ni. However refractory Au is oftenassociated with pyrite and arsenopyrite as finely disseminated par-ticles or as a solid solution (invisible Au) within the pyritic andarsenopyritic sulfide mineral host matrix (Márquez et al., 2006;Benzaazoua et al., 2007). The mineralogies of the two Au-containingsamples used in this study are typical of that used in biooxidationprocesses (e.g. BIOX™) where concentrates are prepared to maxi-mise Au recovery (i.e. pyrite and/or arsenopyrite associated)resulting in concentrates with a lower sulfide mineral grade anda higher non-sulfide mineral grade. Chalcopyrite was identifiedin most of the Cu concentrates, with exception of sample Cu-Dwhich contained the As-containing Cusulfide enargite. Chalcopy-rite is the most common Cu bearing sulfide mineral and is consid-ered to be refractory with respect to its poor leachingcharacteristics. A key objective in developing thermophilic tech-nologies is in the treatment of chalcopyrite-containing ores andconcentrates.
A reasonable conformity was measured between elementalanalysis and those calculated from QXRD and QEMSCAN� derivedmineralogy, for Cu, Fe (atomic absorption spectroscopy) and totalS (Leco) analyses (Table 3). Iron values deviated by approximately
rate mineralogy and texture on Reactive Oxygen Species (ROS) generation.
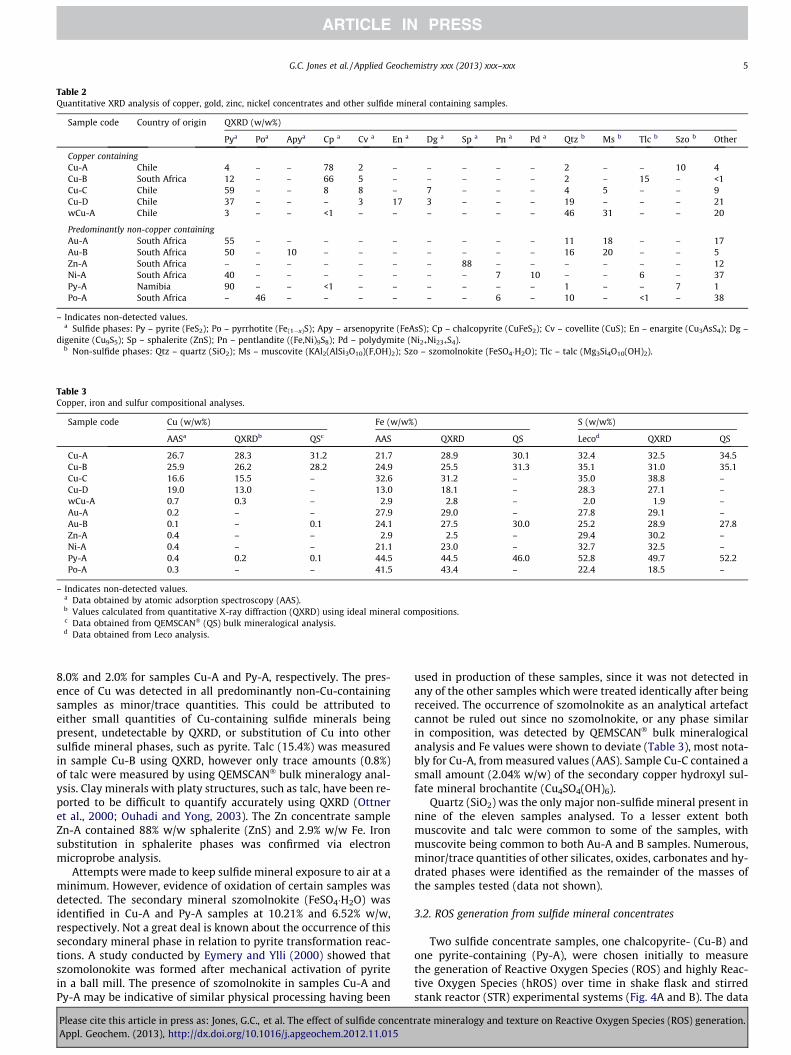
Table 2Quantitative XRD analysis of copper, gold, zinc, nickel concentrates and other sulfide mineral containing samples.
Sample code Country of origin QXRD (w/w%)
Pya Poa Apya Cp a Cv a En a Dg a Sp a Pn a Pd a Qtz b Ms b Tlc b Szo b Other
Copper containingCu-A Chile 4 – – 78 2 – – – – – 2 – – 10 4Cu-B South Africa 12 – – 66 5 – – – – – 2 – 15 – <1Cu-C Chile 59 – – 8 8 – 7 – – – 4 5 – – 9Cu-D Chile 37 – – – 3 17 3 – – – 19 – – – 21wCu-A Chile 3 – – <1 – – – – – – 46 31 – – 20
Predominantly non-copper containingAu-A South Africa 55 – – – – – – – – – 11 18 – – 17Au-B South Africa 50 – 10 – – – – – – – 16 20 – – 5Zn-A South Africa – – – – – – – 88 – – – – – – 12Ni-A South Africa 40 – – – – – – – 7 10 – – 6 – 37Py-A Namibia 90 – – <1 – – – – – – 1 – – 7 1Po-A South Africa – 46 – – – – – – 6 – 10 – <1 – 38
– Indicates non-detected values.a Sulfide phases: Py – pyrite (FeS2); Po – pyrrhotite (Fe(1�x)S); Apy – arsenopyrite (FeAsS); Cp – chalcopyrite (CuFeS2); Cv – covellite (CuS); En – enargite (Cu3AsS4); Dg –
digenite (Cu9S5); Sp – sphalerite (ZnS); Pn – pentlandite ((Fe,Ni)9S8); Pd – polydymite (Ni2+Ni23+S4).b Non-sulfide phases: Qtz – quartz (SiO2); Ms – muscovite (KAl2(AlSi3O10)(F,OH)2); Szo – szomolnokite (FeSO4�H2O); Tlc – talc (Mg3Si4O10(OH)2).
Table 3Copper, iron and sulfur compositional analyses.
Sample code Cu (w/w%) Fe (w/w%) S (w/w%)
AASa QXRDb QSc AAS QXRD QS Lecod QXRD QS
Cu-A 26.7 28.3 31.2 21.7 28.9 30.1 32.4 32.5 34.5Cu-B 25.9 26.2 28.2 24.9 25.5 31.3 35.1 31.0 35.1Cu-C 16.6 15.5 – 32.6 31.2 – 35.0 38.8 –Cu-D 19.0 13.0 – 13.0 18.1 – 28.3 27.1 –wCu-A 0.7 0.3 – 2.9 2.8 – 2.0 1.9 –Au-A 0.2 – – 27.9 29.0 – 27.8 29.1 –Au-B 0.1 – 0.1 24.1 27.5 30.0 25.2 28.9 27.8Zn-A 0.4 – – 2.9 2.5 – 29.4 30.2 –Ni-A 0.4 – – 21.1 23.0 – 32.7 32.5 –Py-A 0.4 0.2 0.1 44.5 44.5 46.0 52.8 49.7 52.2Po-A 0.3 – – 41.5 43.4 – 22.4 18.5 –
– Indicates non-detected values.a Data obtained by atomic adsorption spectroscopy (AAS).b Values calculated from quantitative X-ray diffraction (QXRD) using ideal mineral compositions.c Data obtained from QEMSCAN� (QS) bulk mineralogical analysis.d Data obtained from Leco analysis.
G.C. Jones et al. / Applied Geochemistry xxx (2013) xxx–xxx 5
8.0% and 2.0% for samples Cu-A and Py-A, respectively. The pres-ence of Cu was detected in all predominantly non-Cu-containingsamples as minor/trace quantities. This could be attributed toeither small quantities of Cu-containing sulfide minerals beingpresent, undetectable by QXRD, or substitution of Cu into othersulfide mineral phases, such as pyrite. Talc (15.4%) was measuredin sample Cu-B using QXRD, however only trace amounts (0.8%)of talc were measured by using QEMSCAN� bulk mineralogy anal-ysis. Clay minerals with platy structures, such as talc, have been re-ported to be difficult to quantify accurately using QXRD (Ottneret al., 2000; Ouhadi and Yong, 2003). The Zn concentrate sampleZn-A contained 88% w/w sphalerite (ZnS) and 2.9% w/w Fe. Ironsubstitution in sphalerite phases was confirmed via electronmicroprobe analysis.
Attempts were made to keep sulfide mineral exposure to air at aminimum. However, evidence of oxidation of certain samples wasdetected. The secondary mineral szomolnokite (FeSO4�H2O) wasidentified in Cu-A and Py-A samples at 10.21% and 6.52% w/w,respectively. Not a great deal is known about the occurrence of thissecondary mineral phase in relation to pyrite transformation reac-tions. A study conducted by Eymery and Ylli (2000) showed thatszomolonokite was formed after mechanical activation of pyritein a ball mill. The presence of szomolnokite in samples Cu-A andPy-A may be indicative of similar physical processing having been
Please cite this article in press as: Jones, G.C., et al. The effect of sulfide concentAppl. Geochem. (2013), http://dx.doi.org/10.1016/j.apgeochem.2012.11.015
used in production of these samples, since it was not detected inany of the other samples which were treated identically after beingreceived. The occurrence of szomolnokite as an analytical artefactcannot be ruled out since no szomolnokite, or any phase similarin composition, was detected by QEMSCAN� bulk mineralogicalanalysis and Fe values were shown to deviate (Table 3), most nota-bly for Cu-A, from measured values (AAS). Sample Cu-C contained asmall amount (2.04% w/w) of the secondary copper hydroxyl sul-fate mineral brochantite (Cu4SO4(OH)6).
Quartz (SiO2) was the only major non-sulfide mineral present innine of the eleven samples analysed. To a lesser extent bothmuscovite and talc were common to some of the samples, withmuscovite being common to both Au-A and B samples. Numerous,minor/trace quantities of other silicates, oxides, carbonates and hy-drated phases were identified as the remainder of the masses ofthe samples tested (data not shown).
3.2. ROS generation from sulfide mineral concentrates
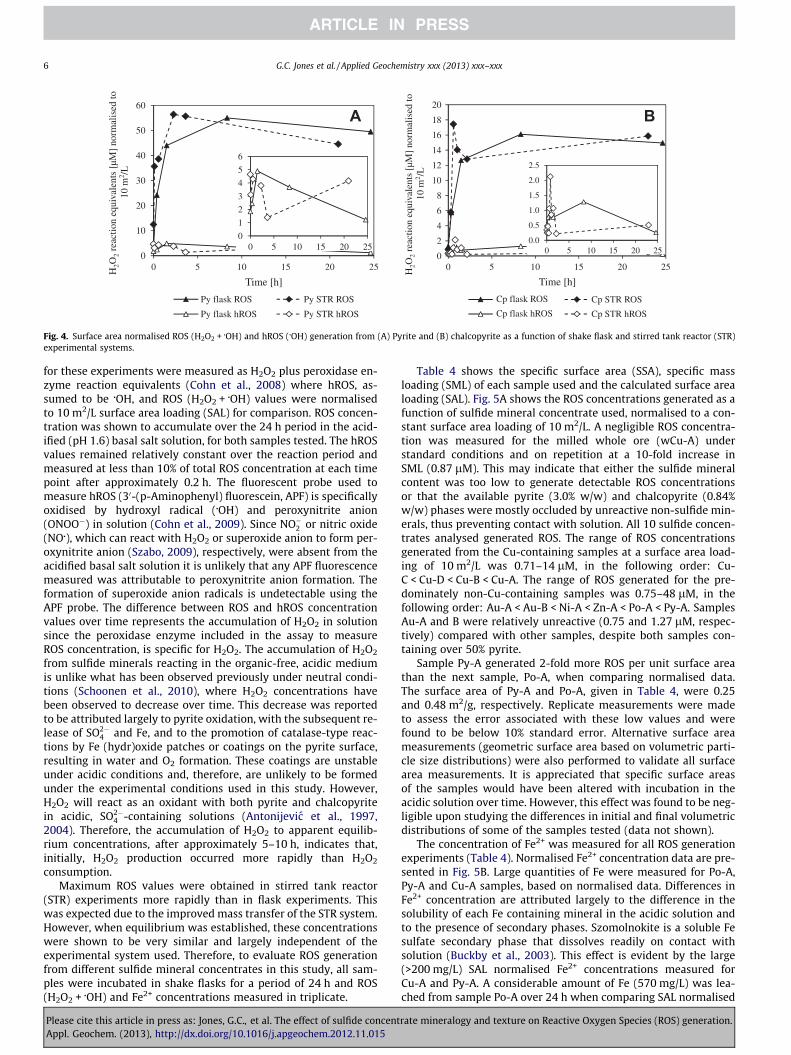
Two sulfide concentrate samples, one chalcopyrite- (Cu-B) andone pyrite-containing (Py-A), were chosen initially to measurethe generation of Reactive Oxygen Species (ROS) and highly Reac-tive Oxygen Species (hROS) over time in shake flask and stirredstank reactor (STR) experimental systems (Fig. 4A and B). The data
rate mineralogy and texture on Reactive Oxygen Species (ROS) generation.
0
10
20
30
40
50
60H
2O2
reac
tion
equi
vale
nts
[µM
] no
rmal
ised
to
10 m
2 /L
Time [h]
Py flask ROS Py STR ROS
Py flask hROS Py STR hROS
A
0
1
2
3
4
5
6
0 5 10 15 20 250
2
4
6
8
10
12
14
16
18
20
0 5 10 15 20 25 0 5 10 15 20 25H2O
2re
actio
n eq
uiva
lent
s [µ
M]
norm
alis
ed to
10
m2 /
L
Time [h]
Cp flask ROS Cp STR ROS
Cp flask hROS Cp STR hROS
B
0.0
0.5
1.0
1.5
2.0
2.5
0 5 10 15 20 25
Fig. 4. Surface area normalised ROS (H2O2 + �OH) and hROS (�OH) generation from (A) Pyrite and (B) chalcopyrite as a function of shake flask and stirred tank reactor (STR)experimental systems.
6 G.C. Jones et al. / Applied Geochemistry xxx (2013) xxx–xxx
for these experiments were measured as H2O2 plus peroxidase en-zyme reaction equivalents (Cohn et al., 2008) where hROS, as-sumed to be �OH, and ROS (H2O2 + �OH) values were normalisedto 10 m2/L surface area loading (SAL) for comparison. ROS concen-tration was shown to accumulate over the 24 h period in the acid-ified (pH 1.6) basal salt solution, for both samples tested. The hROSvalues remained relatively constant over the reaction period andmeasured at less than 10% of total ROS concentration at each timepoint after approximately 0.2 h. The fluorescent probe used tomeasure hROS (30-(p-Aminophenyl) fluorescein, APF) is specificallyoxidised by hydroxyl radical (�OH) and peroxynitrite anion(ONOO�) in solution (Cohn et al., 2009). Since NO�2 or nitric oxide(NO�), which can react with H2O2 or superoxide anion to form per-oxynitrite anion (Szabo, 2009), respectively, were absent from theacidified basal salt solution it is unlikely that any APF fluorescencemeasured was attributable to peroxynitrite anion formation. Theformation of superoxide anion radicals is undetectable using theAPF probe. The difference between ROS and hROS concentrationvalues over time represents the accumulation of H2O2 in solutionsince the peroxidase enzyme included in the assay to measureROS concentration, is specific for H2O2. The accumulation of H2O2
from sulfide minerals reacting in the organic-free, acidic mediumis unlike what has been observed previously under neutral condi-tions (Schoonen et al., 2010), where H2O2 concentrations havebeen observed to decrease over time. This decrease was reportedto be attributed largely to pyrite oxidation, with the subsequent re-lease of SO2�
4 and Fe, and to the promotion of catalase-type reac-tions by Fe (hydr)oxide patches or coatings on the pyrite surface,resulting in water and O2 formation. These coatings are unstableunder acidic conditions and, therefore, are unlikely to be formedunder the experimental conditions used in this study. However,H2O2 will react as an oxidant with both pyrite and chalcopyritein acidic, SO2�
4 -containing solutions (Antonijevic et al., 1997,2004). Therefore, the accumulation of H2O2 to apparent equilib-rium concentrations, after approximately 5–10 h, indicates that,initially, H2O2 production occurred more rapidly than H2O2
consumption.Maximum ROS values were obtained in stirred tank reactor
(STR) experiments more rapidly than in flask experiments. Thiswas expected due to the improved mass transfer of the STR system.However, when equilibrium was established, these concentrationswere shown to be very similar and largely independent of theexperimental system used. Therefore, to evaluate ROS generationfrom different sulfide mineral concentrates in this study, all sam-ples were incubated in shake flasks for a period of 24 h and ROS(H2O2 + �OH) and Fe2+ concentrations measured in triplicate.
Please cite this article in press as: Jones, G.C., et al. The effect of sulfide concentAppl. Geochem. (2013), http://dx.doi.org/10.1016/j.apgeochem.2012.11.015
Table 4 shows the specific surface area (SSA), specific massloading (SML) of each sample used and the calculated surface arealoading (SAL). Fig. 5A shows the ROS concentrations generated as afunction of sulfide mineral concentrate used, normalised to a con-stant surface area loading of 10 m2/L. A negligible ROS concentra-tion was measured for the milled whole ore (wCu-A) understandard conditions and on repetition at a 10-fold increase inSML (0.87 lM). This may indicate that either the sulfide mineralcontent was too low to generate detectable ROS concentrationsor that the available pyrite (3.0% w/w) and chalcopyrite (0.84%w/w) phases were mostly occluded by unreactive non-sulfide min-erals, thus preventing contact with solution. All 10 sulfide concen-trates analysed generated ROS. The range of ROS concentrationsgenerated from the Cu-containing samples at a surface area load-ing of 10 m2/L was 0.71–14 lM, in the following order: Cu-C < Cu-D < Cu-B < Cu-A. The range of ROS generated for the pre-dominately non-Cu-containing samples was 0.75–48 lM, in thefollowing order: Au-A < Au-B < Ni-A < Zn-A < Po-A < Py-A. SamplesAu-A and B were relatively unreactive (0.75 and 1.27 lM, respec-tively) compared with other samples, despite both samples con-taining over 50% pyrite.
Sample Py-A generated 2-fold more ROS per unit surface areathan the next sample, Po-A, when comparing normalised data.The surface area of Py-A and Po-A, given in Table 4, were 0.25and 0.48 m2/g, respectively. Replicate measurements were madeto assess the error associated with these low values and werefound to be below 10% standard error. Alternative surface areameasurements (geometric surface area based on volumetric parti-cle size distributions) were also performed to validate all surfacearea measurements. It is appreciated that specific surface areasof the samples would have been altered with incubation in theacidic solution over time. However, this effect was found to be neg-ligible upon studying the differences in initial and final volumetricdistributions of some of the samples tested (data not shown).
The concentration of Fe2+ was measured for all ROS generationexperiments (Table 4). Normalised Fe2+ concentration data are pre-sented in Fig. 5B. Large quantities of Fe were measured for Po-A,Py-A and Cu-A samples, based on normalised data. Differences inFe2+ concentration are attributed largely to the difference in thesolubility of each Fe containing mineral in the acidic solution andto the presence of secondary phases. Szomolnokite is a soluble Fesulfate secondary phase that dissolves readily on contact withsolution (Buckby et al., 2003). This effect is evident by the large(>200 mg/L) SAL normalised Fe2+ concentrations measured forCu-A and Py-A. A considerable amount of Fe (570 mg/L) was lea-ched from sample Po-A over 24 h when comparing SAL normalised
rate mineralogy and texture on Reactive Oxygen Species (ROS) generation.
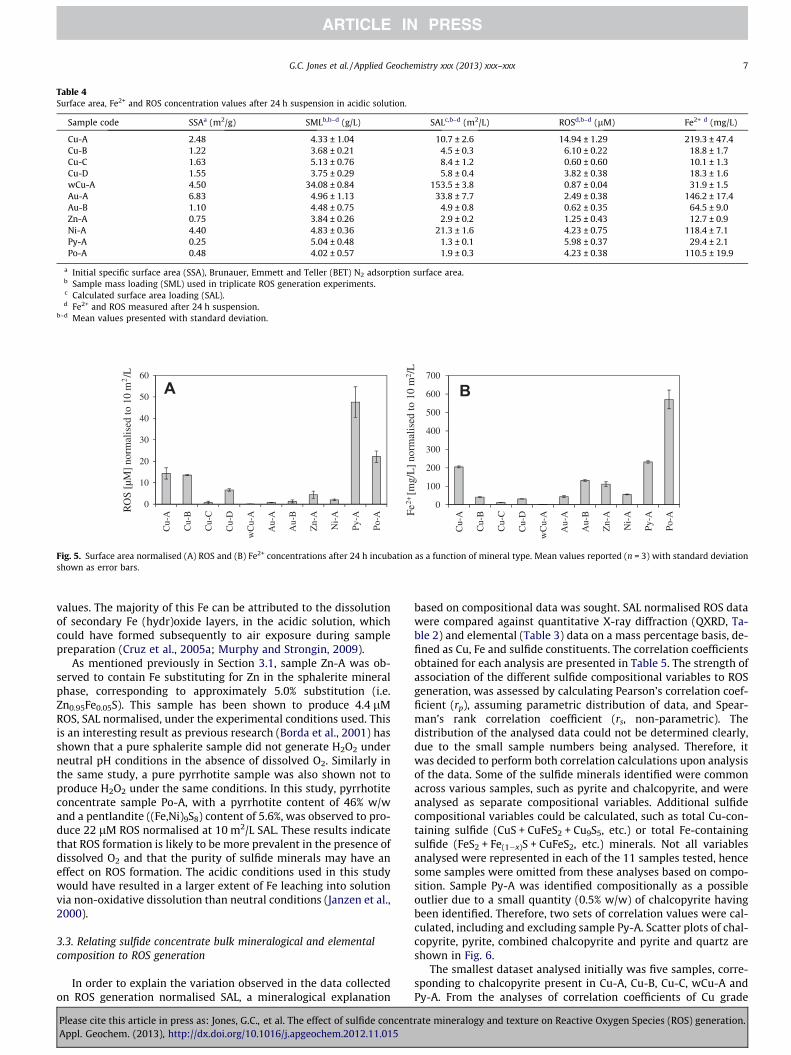
Table 4Surface area, Fe2+ and ROS concentration values after 24 h suspension in acidic solution.
Sample code SSAa (m2/g) SMLb,b–d (g/L) SALc,b–d (m2/L) ROSd,b–d (lM) Fe2+ d (mg/L)
Cu-A 2.48 4.33 ± 1.04 10.7 ± 2.6 14.94 ± 1.29 219.3 ± 47.4Cu-B 1.22 3.68 ± 0.21 4.5 ± 0.3 6.10 ± 0.22 18.8 ± 1.7Cu-C 1.63 5.13 ± 0.76 8.4 ± 1.2 0.60 ± 0.60 10.1 ± 1.3Cu-D 1.55 3.75 ± 0.29 5.8 ± 0.4 3.82 ± 0.38 18.3 ± 1.6wCu-A 4.50 34.08 ± 0.84 153.5 ± 3.8 0.87 ± 0.04 31.9 ± 1.5Au-A 6.83 4.96 ± 1.13 33.8 ± 7.7 2.49 ± 0.38 146.2 ± 17.4Au-B 1.10 4.48 ± 0.75 4.9 ± 0.8 0.62 ± 0.35 64.5 ± 9.0Zn-A 0.75 3.84 ± 0.26 2.9 ± 0.2 1.25 ± 0.43 12.7 ± 0.9Ni-A 4.40 4.83 ± 0.36 21.3 ± 1.6 4.23 ± 0.75 118.4 ± 7.1Py-A 0.25 5.04 ± 0.48 1.3 ± 0.1 5.98 ± 0.37 29.4 ± 2.1Po-A 0.48 4.02 ± 0.57 1.9 ± 0.3 4.23 ± 0.38 110.5 ± 19.9
a Initial specific surface area (SSA), Brunauer, Emmett and Teller (BET) N2 adsorption surface area.b Sample mass loading (SML) used in triplicate ROS generation experiments.c Calculated surface area loading (SAL).d Fe2+ and ROS measured after 24 h suspension.
b–d Mean values presented with standard deviation.
0
10
20
30
40
50
60
Cu-
A
Cu-
B
Cu-
C
Cu-
D
wC
u-A
Au-
A
Au-
B
Zn-
A
Ni-
A
Py-A
Po-A
RO
S [µ
M]
norm
alis
ed to
10
m2/L
A
0
100
200
300
400
500
600
700
Cu-
A
Cu-
B
Cu-
C
Cu-
D
wC
u-A
Au-
A
Au-
B
Zn-
A
Ni-
A
Py-A
Po-AFe
2+ [m
g/L
] no
rmal
ised
to 1
0 m
2 /L
B
Fig. 5. Surface area normalised (A) ROS and (B) Fe2+ concentrations after 24 h incubation as a function of mineral type. Mean values reported (n = 3) with standard deviationshown as error bars.
G.C. Jones et al. / Applied Geochemistry xxx (2013) xxx–xxx 7
values. The majority of this Fe can be attributed to the dissolutionof secondary Fe (hydr)oxide layers, in the acidic solution, whichcould have formed subsequently to air exposure during samplepreparation (Cruz et al., 2005a; Murphy and Strongin, 2009).
As mentioned previously in Section 3.1, sample Zn-A was ob-served to contain Fe substituting for Zn in the sphalerite mineralphase, corresponding to approximately 5.0% substitution (i.e.Zn0.95Fe0.05S). This sample has been shown to produce 4.4 lMROS, SAL normalised, under the experimental conditions used. Thisis an interesting result as previous research (Borda et al., 2001) hasshown that a pure sphalerite sample did not generate H2O2 underneutral pH conditions in the absence of dissolved O2. Similarly inthe same study, a pure pyrrhotite sample was also shown not toproduce H2O2 under the same conditions. In this study, pyrrhotiteconcentrate sample Po-A, with a pyrrhotite content of 46% w/wand a pentlandite ((Fe,Ni)9S8) content of 5.6%, was observed to pro-duce 22 lM ROS normalised at 10 m2/L SAL. These results indicatethat ROS formation is likely to be more prevalent in the presence ofdissolved O2 and that the purity of sulfide minerals may have aneffect on ROS formation. The acidic conditions used in this studywould have resulted in a larger extent of Fe leaching into solutionvia non-oxidative dissolution than neutral conditions (Janzen et al.,2000).
3.3. Relating sulfide concentrate bulk mineralogical and elementalcomposition to ROS generation
In order to explain the variation observed in the data collectedon ROS generation normalised SAL, a mineralogical explanation
Please cite this article in press as: Jones, G.C., et al. The effect of sulfide concentAppl. Geochem. (2013), http://dx.doi.org/10.1016/j.apgeochem.2012.11.015
based on compositional data was sought. SAL normalised ROS datawere compared against quantitative X-ray diffraction (QXRD, Ta-ble 2) and elemental (Table 3) data on a mass percentage basis, de-fined as Cu, Fe and sulfide constituents. The correlation coefficientsobtained for each analysis are presented in Table 5. The strength ofassociation of the different sulfide compositional variables to ROSgeneration, was assessed by calculating Pearson’s correlation coef-ficient (rp), assuming parametric distribution of data, and Spear-man’s rank correlation coefficient (rs, non-parametric). Thedistribution of the analysed data could not be determined clearly,due to the small sample numbers being analysed. Therefore, itwas decided to perform both correlation calculations upon analysisof the data. Some of the sulfide minerals identified were commonacross various samples, such as pyrite and chalcopyrite, and wereanalysed as separate compositional variables. Additional sulfidecompositional variables could be calculated, such as total Cu-con-taining sulfide (CuS + CuFeS2 + Cu9S5, etc.) or total Fe-containingsulfide (FeS2 + Fe(1�x)S + CuFeS2, etc.) minerals. Not all variablesanalysed were represented in each of the 11 samples tested, hencesome samples were omitted from these analyses based on compo-sition. Sample Py-A was identified compositionally as a possibleoutlier due to a small quantity (0.5% w/w) of chalcopyrite havingbeen identified. Therefore, two sets of correlation values were cal-culated, including and excluding sample Py-A. Scatter plots of chal-copyrite, pyrite, combined chalcopyrite and pyrite and quartz areshown in Fig. 6.
The smallest dataset analysed initially was five samples, corre-sponding to chalcopyrite present in Cu-A, Cu-B, Cu-C, wCu-A andPy-A. From the analyses of correlation coefficients of Cu grade
rate mineralogy and texture on Reactive Oxygen Species (ROS) generation.
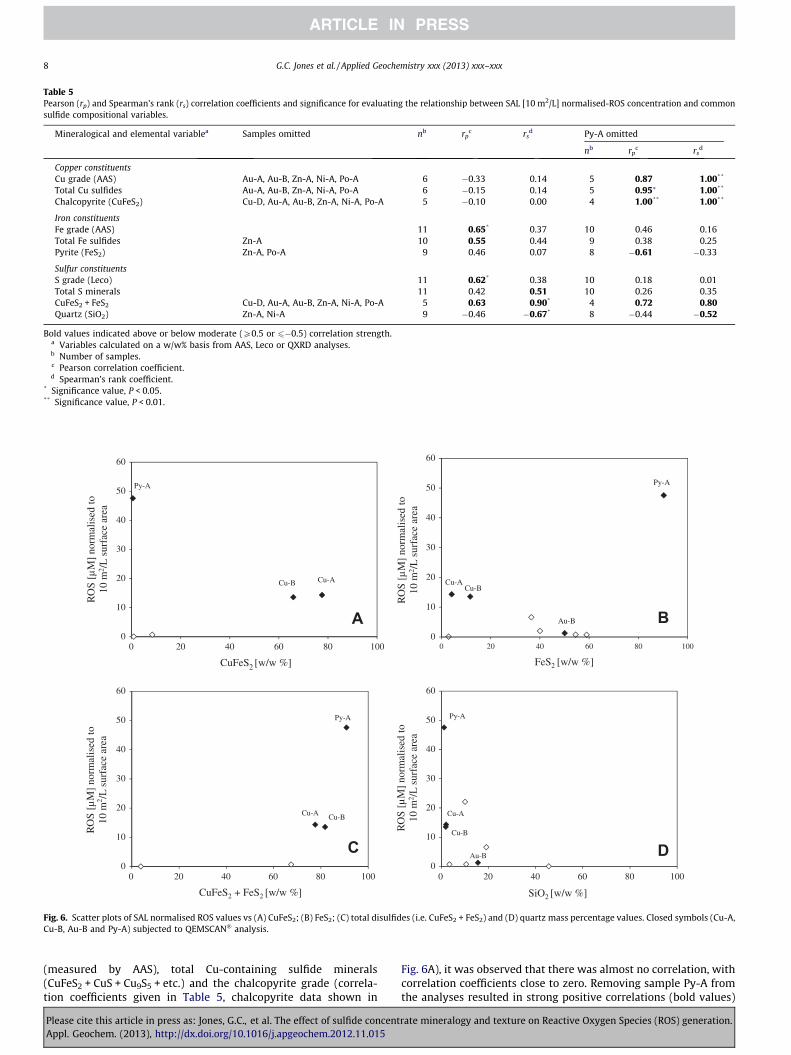
Table 5Pearson (rp) and Spearman’s rank (rs) correlation coefficients and significance for evaluating the relationship between SAL [10 m2/L] normalised-ROS concentration and commonsulfide compositional variables.
Mineralogical and elemental variablea Samples omitted nb rpc rs
d Py-A omitted
nb rpc rs
d
Copper constituentsCu grade (AAS) Au-A, Au-B, Zn-A, Ni-A, Po-A 6 �0.33 0.14 5 0.87 1.00**
Total Cu sulfides Au-A, Au-B, Zn-A, Ni-A, Po-A 6 �0.15 0.14 5 0.95⁄ 1.00**
Chalcopyrite (CuFeS2) Cu-D, Au-A, Au-B, Zn-A, Ni-A, Po-A 5 �0.10 0.00 4 1.00** 1.00**
Iron constituentsFe grade (AAS) 11 0.65* 0.37 10 0.46 0.16Total Fe sulfides Zn-A 10 0.55 0.44 9 0.38 0.25Pyrite (FeS2) Zn-A, Po-A 9 0.46 0.07 8 �0.61 �0.33
Sulfur constituentsS grade (Leco) 11 0.62* 0.38 10 0.18 0.01Total S minerals 11 0.42 0.51 10 0.26 0.35CuFeS2 + FeS2 Cu-D, Au-A, Au-B, Zn-A, Ni-A, Po-A 5 0.63 0.90* 4 0.72 0.80Quartz (SiO2) Zn-A, Ni-A 9 �0.46 �0.67* 8 �0.44 �0.52
Bold values indicated above or below moderate (P0.5 or 6�0.5) correlation strength.a Variables calculated on a w/w% basis from AAS, Leco or QXRD analyses.b Number of samples.c Pearson correlation coefficient.d Spearman’s rank coefficient.
* Significance value, P < 0.05.** Significance value, P < 0.01.
0
10
20
30
40
50
60
0 20 40 60 80 100
RO
S [µ
M]
norm
alis
ed to
10
m2 /
L s
urfa
ce a
rea
CuFeS2 [w/w %]
Py-A
Cu-B Cu-A
A0
10
20
30
40
50
60
RO
S [µ
M]
norm
alis
ed to
10
m2 /
L s
urfa
ce a
rea
FeS2 [w/w %]
Cu-B
Py-A
Au-B
Cu-A
B
0
10
20
30
40
50
60
RO
S [µ
M]
norm
alis
ed to
10
m2 /L
sur
face
are
a
CuFeS2 + FeS2 [w/w %]
Py-A
Cu-A Cu-B
C0
10
20
30
40
50
60
0 20 40 60 80 100
0 20 40 60 80 100 0 20 40 60 80 100
RO
S [µ
M]
norm
alis
ed to
10
m2 /
L s
urfa
ce a
rea
SiO2 [w/w %]
Py-A
Cu-A
Cu-B
Au-B D
Fig. 6. Scatter plots of SAL normalised ROS values vs (A) CuFeS2; (B) FeS2; (C) total disulfides (i.e. CuFeS2 + FeS2) and (D) quartz mass percentage values. Closed symbols (Cu-A,Cu-B, Au-B and Py-A) subjected to QEMSCAN� analysis.
8 G.C. Jones et al. / Applied Geochemistry xxx (2013) xxx–xxx
(measured by AAS), total Cu-containing sulfide minerals(CuFeS2 + CuS + Cu9S5 + etc.) and the chalcopyrite grade (correla-tion coefficients given in Table 5, chalcopyrite data shown in
Please cite this article in press as: Jones, G.C., et al. The effect of sulfide concentAppl. Geochem. (2013), http://dx.doi.org/10.1016/j.apgeochem.2012.11.015
Fig. 6A), it was observed that there was almost no correlation, withcorrelation coefficients close to zero. Removing sample Py-A fromthe analyses resulted in strong positive correlations (bold values)
rate mineralogy and texture on Reactive Oxygen Species (ROS) generation.
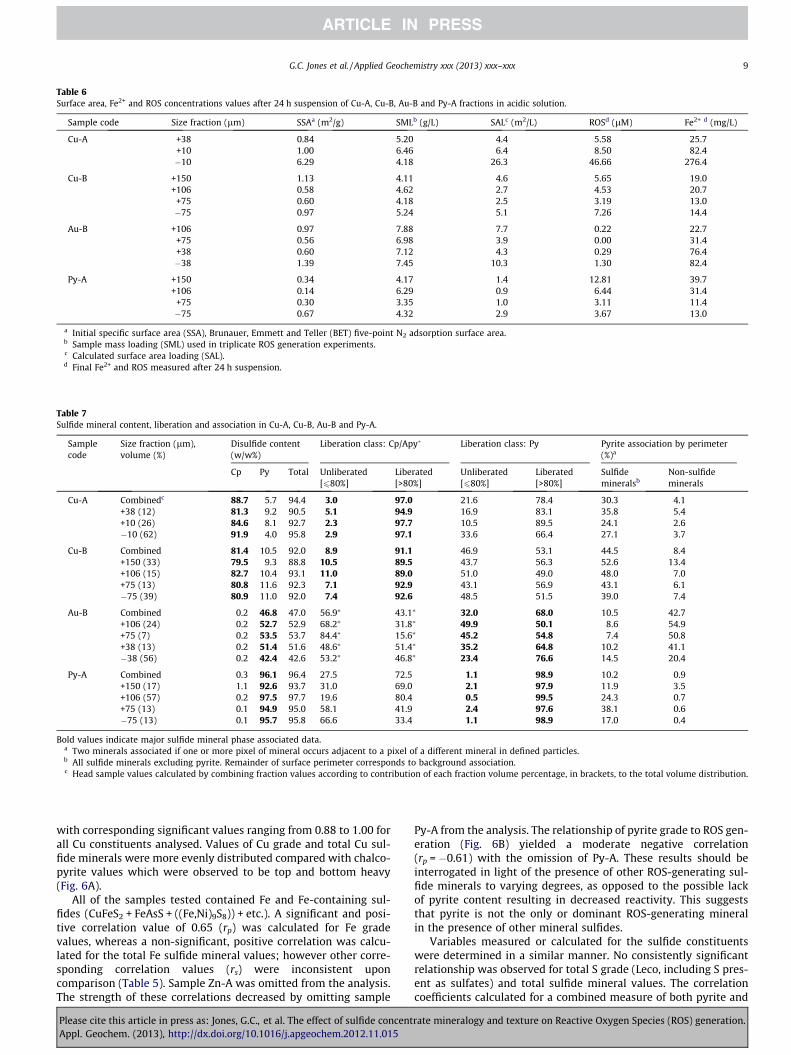
Table 6Surface area, Fe2+ and ROS concentrations values after 24 h suspension of Cu-A, Cu-B, Au-B and Py-A fractions in acidic solution.
Sample code Size fraction (lm) SSAa (m2/g) SMLb (g/L) SALc (m2/L) ROSd (lM) Fe2+ d (mg/L)
Cu-A +38 0.84 5.20 4.4 5.58 25.7+10 1.00 6.46 6.4 8.50 82.4�10 6.29 4.18 26.3 46.66 276.4
Cu-B +150 1.13 4.11 4.6 5.65 19.0+106 0.58 4.62 2.7 4.53 20.7
+75 0.60 4.18 2.5 3.19 13.0�75 0.97 5.24 5.1 7.26 14.4
Au-B +106 0.97 7.88 7.7 0.22 22.7+75 0.56 6.98 3.9 0.00 31.4+38 0.60 7.12 4.3 0.29 76.4�38 1.39 7.45 10.3 1.30 82.4
Py-A +150 0.34 4.17 1.4 12.81 39.7+106 0.14 6.29 0.9 6.44 31.4
+75 0.30 3.35 1.0 3.11 11.4�75 0.67 4.32 2.9 3.67 13.0
a Initial specific surface area (SSA), Brunauer, Emmett and Teller (BET) five-point N2 adsorption surface area.b Sample mass loading (SML) used in triplicate ROS generation experiments.c Calculated surface area loading (SAL).d Final Fe2+ and ROS measured after 24 h suspension.
Table 7Sulfide mineral content, liberation and association in Cu-A, Cu-B, Au-B and Py-A.
Samplecode
Size fraction (lm),volume (%)
Disulfide content(w/w%)
Liberation class: Cp/Apy� Liberation class: Py Pyrite association by perimeter(%)a
Cp Py Total Unliberated[680%]
Liberated[>80%]
Unliberated[680%]
Liberated[>80%]
Sulfidemineralsb
Non-sulfideminerals
Cu-A Combinedc 88.7 5.7 94.4 3.0 97.0 21.6 78.4 30.3 4.1+38 (12) 81.3 9.2 90.5 5.1 94.9 16.9 83.1 35.8 5.4+10 (26) 84.6 8.1 92.7 2.3 97.7 10.5 89.5 24.1 2.6�10 (62) 91.9 4.0 95.8 2.9 97.1 33.6 66.4 27.1 3.7
Cu-B Combined 81.4 10.5 92.0 8.9 91.1 46.9 53.1 44.5 8.4+150 (33) 79.5 9.3 88.8 10.5 89.5 43.7 56.3 52.6 13.4+106 (15) 82.7 10.4 93.1 11.0 89.0 51.0 49.0 48.0 7.0+75 (13) 80.8 11.6 92.3 7.1 92.9 43.1 56.9 43.1 6.1�75 (39) 80.9 11.0 92.0 7.4 92.6 48.5 51.5 39.0 7.4
Au-B Combined 0.2 46.8 47.0 56.9⁄ 43.1⁄ 32.0 68.0 10.5 42.7+106 (24) 0.2 52.7 52.9 68.2⁄ 31.8⁄ 49.9 50.1 8.6 54.9+75 (7) 0.2 53.5 53.7 84.4⁄ 15.6⁄ 45.2 54.8 7.4 50.8+38 (13) 0.2 51.4 51.6 48.6⁄ 51.4⁄ 35.2 64.8 10.2 41.1�38 (56) 0.2 42.4 42.6 53.2⁄ 46.8⁄ 23.4 76.6 14.5 20.4
Py-A Combined 0.3 96.1 96.4 27.5 72.5 1.1 98.9 10.2 0.9+150 (17) 1.1 92.6 93.7 31.0 69.0 2.1 97.9 11.9 3.5+106 (57) 0.2 97.5 97.7 19.6 80.4 0.5 99.5 24.3 0.7+75 (13) 0.1 94.9 95.0 58.1 41.9 2.4 97.6 38.1 0.6�75 (13) 0.1 95.7 95.8 66.6 33.4 1.1 98.9 17.0 0.4
Bold values indicate major sulfide mineral phase associated data.a Two minerals associated if one or more pixel of mineral occurs adjacent to a pixel of a different mineral in defined particles.b All sulfide minerals excluding pyrite. Remainder of surface perimeter corresponds to background association.c Head sample values calculated by combining fraction values according to contribution of each fraction volume percentage, in brackets, to the total volume distribution.
G.C. Jones et al. / Applied Geochemistry xxx (2013) xxx–xxx 9
with corresponding significant values ranging from 0.88 to 1.00 forall Cu constituents analysed. Values of Cu grade and total Cu sul-fide minerals were more evenly distributed compared with chalco-pyrite values which were observed to be top and bottom heavy(Fig. 6A).
All of the samples tested contained Fe and Fe-containing sul-fides (CuFeS2 + FeAsS + ((Fe,Ni)9S8)) + etc.). A significant and posi-tive correlation value of 0.65 (rp) was calculated for Fe gradevalues, whereas a non-significant, positive correlation was calcu-lated for the total Fe sulfide mineral values; however other corre-sponding correlation values (rs) were inconsistent uponcomparison (Table 5). Sample Zn-A was omitted from the analysis.The strength of these correlations decreased by omitting sample
Please cite this article in press as: Jones, G.C., et al. The effect of sulfide concentAppl. Geochem. (2013), http://dx.doi.org/10.1016/j.apgeochem.2012.11.015
Py-A from the analysis. The relationship of pyrite grade to ROS gen-eration (Fig. 6B) yielded a moderate negative correlation(rp = �0.61) with the omission of Py-A. These results should beinterrogated in light of the presence of other ROS-generating sul-fide minerals to varying degrees, as opposed to the possible lackof pyrite content resulting in decreased reactivity. This suggeststhat pyrite is not the only or dominant ROS-generating mineralin the presence of other mineral sulfides.
Variables measured or calculated for the sulfide constituentswere determined in a similar manner. No consistently significantrelationship was observed for total S grade (Leco, including S pres-ent as sulfates) and total sulfide mineral values. The correlationcoefficients calculated for a combined measure of both pyrite and
rate mineralogy and texture on Reactive Oxygen Species (ROS) generation.
A
B
Fig. 7. (A) SEM–EDS micrographs and (B) particle mineral maps generated from QEMSCAN� analyses of Cu–A chalcopyrite particles and associated phases. Chalcopyrite bulkparticle (closed squares), non-chalcopyrite phases associated with surface (closed circles) and apparent micro-crack (open squares) phases highlighted. Chalcopyrite (Cp), Cp-rim and covellite (Cv) phases shown.
10 G.C. Jones et al. / Applied Geochemistry xxx (2013) xxx–xxx
chalcopyrite content (Fig. 6C), were consistently observed to havepositive correlations (0.63–0.90), with a significant correlation(rs = 0.90) having been calculated. The correlation was limited tosamples containing both chalcopyrite and pyrite. This is an inter-esting result that implicates the presence of both chalcopyriteand pyrite towards increased ROS generation. This effect could bemediated by galvanic interactions.
Quartz was included in the correlation analyses (Fig. 6D) as acommon, non-sulfide variable. Analysis of the Spearman’s rankcoefficients indicated that quartz content was negatively corre-lated towards increased ROS generation, under the experimentalconditions used. This result suggests that the quantities of quartzcontained within these samples did not contribute towards in-creased reactivity of these samples. Furthermore, the negativecorrelation may be influenced by the increasing metal sulfideconcentrations in the presence of decreasing quartz concentra-tions. Silicate and oxide minerals, considered to be gangue miner-als in concentrates, have been shown to be poor ROS producers incomparison to pyrite under neutral conditions (Elsner et al., 2004;Nefso et al., 2005; Cohn et al., 2006; Matta et al., 2007). Evidencesuggests that when the silicates and oxides do display reactivity,it is often a function of surface bound Fe(II), either occurring assubstitution or through adsorption processes, and not necessarilydue to the primary properties of the minerals themselves
Please cite this article in press as: Jones, G.C., et al. The effect of sulfide concentAppl. Geochem. (2013), http://dx.doi.org/10.1016/j.apgeochem.2012.11.015
(Klausen et al., 1995; Fubini and Mollo, 1995; Fubini et al.,1995). However, ROS generation from Fe-free quartz sampleshas also been observed after mechanical activation via grinding,which caused fracturing and cracking of the sub-surface resultingin the homolytic cleavage of the silica–oxygen bond and the pro-duction of free radicals at the surface (Fubini and Hubbard, 2003).Although sulfide mineral induced ROS formation from concen-trates is the focus of this study, ROS formation from non-sulfideminerals, especially where significant physical processing has oc-curred, cannot be completely ignored in the interpretation ofthese results.
Additional experimental factors, relating to the leaching or dis-solution of sulfide minerals and related oxidation products overthe 24 h incubation period, would have had an effect on ROS gen-eration and its measurement. Upon correlating unadjusted ROSconcentration values to unadjusted dissolved Fe2+ concentrations,it was found that a significant correlation of rp = 0.65, for all sam-ples included in the analysis. This result lends support to the pro-posed ROS generation mechanism whereby Fe2+ in solution, asopposed to Fe(II) associated with sulfide mineral surfaces, may re-act with dissolved O2 to form superoxide (ðO��2 Þ, see reaction (1)),and subsequently result in the formation of detectable ROS(H2O2 + �OH). However, it may be more accurate to consider nor-malised ROS and Fe2+ values together as a combined measure of
rate mineralogy and texture on Reactive Oxygen Species (ROS) generation.
A
B
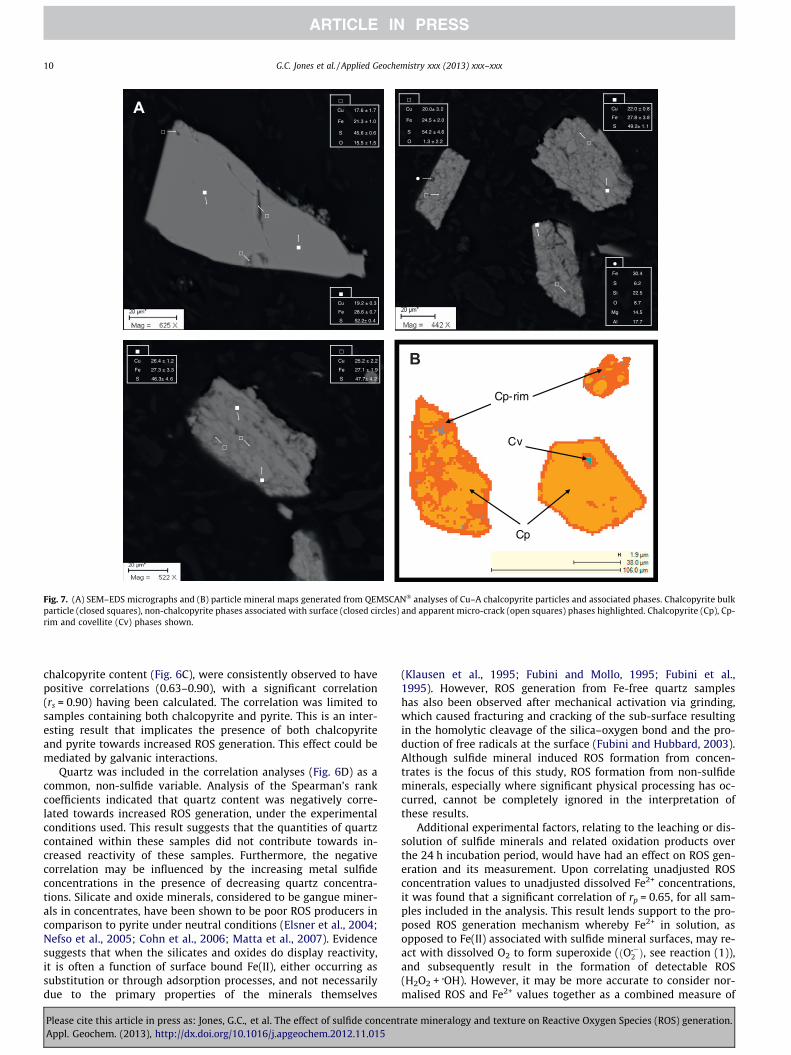
Fig. 8. (A) SEM–EDS micrographs and (B) particle mineral maps generated from QEMSCAN� analyses of Cu-B chalcopyrite particles and associated phases. Chalcopyrite bulkparticle (closed squares), non-chalcopyrite phases associated with surface (closed circles) and apparent micro-crack (open squares) phases highlighted. Chalcopyrite (Cp), Cp-rim, pyrite (Py) and talc (Tlc) phases shown.
G.C. Jones et al. / Applied Geochemistry xxx (2013) xxx–xxx 11
reactivity over the 24 h period since H2O2 in acidic solutions is astrong oxidant, resulting in additional Fe dissolution.
These results suggest further that additional information isneeded to describe ROS generation from sulfide mineral concen-trates accurately. Therefore, it was decided to analyse a sub-setof samples based on differences observed in reactivity and compo-sition (Fig. 6, closed symbols) for additional textural information.
3.4. Relating sulfide mineral texture to ROS generation
Two Cu, Cu-A and Cu-B and two predominantly non-Cu, Au-Band Py-A, sulfide mineral concentrate samples were selected fortextural analysis using QEMSCAN�. Each sample was fractionatedinto 3 or 4 different size fractions, determined by the total volu-metric particle size distribution of the head sample. These fractionswere tested for generation of ROS according to the previous meth-od. The data are presented in Table 6. A large degree of variationwas observed for SAL ROS and dissolved Fe2+ concentrations. Noclear trends could be discerned based on fraction size. A decreasein Cu-A fraction size did correspond with increased reactivity,however the opposite was observed for Py-A fractions, with thecoarser fractions being measured as more reactive than the finerfractions. The Au-B fractions were found to be the least reactiveunder the experimental conditions tested.
Please cite this article in press as: Jones, G.C., et al. The effect of sulfide concentAppl. Geochem. (2013), http://dx.doi.org/10.1016/j.apgeochem.2012.11.015
The results for measured disulfide content, liberation class andpyrite association for each size fraction are shown in Table 7. Pyriteand chalcopyrite, disulfide content, data for head samples Cu-A,Cu-B and Py-A were observed to diverge from corresponding quan-titative X-ray diffraction data (Table 2), for reasons explained pre-viously in Section 3.1. Sulfide mineral liberation refers to thepercentage of a particular mineral occurring as free particles inrelation to the total content of the specified mineral within a sam-ple. A distinction was made between well-liberated (>80%, basedon area of particle measured) and un-liberated, a combined mea-sure of locked (<20%) and middling (20–80%), particles. Liberationvalues for pyrite, chalcopyrite and arsenopyrite (sample Au-B only)are shown in Table 7. Over approximately 90% of the chalcopyritein Cu-A and Cu-B fractions was present as well-liberated particles.Similarly, for sample Py-A, for which pyrite made up the majorityof the sample by mass, pyrite was predominantly present as freeparticles. Corresponding auxiliary sulfide minerals in those sam-ples were less liberated; for example, approximately half of theCu-B pyrite content (±10%) was present as un-liberated particles.The pyrite content of Au-B fractions (±50%) was also less liberated,containing 23.4–49.9% un-liberated particles. This result partly ex-plains the lack of reactivity measured from the pyrite phases con-tained within these fractions. A lower degree of pyrite liberationmay correspond to a reduced amount of pyrite surface area
rate mineralogy and texture on Reactive Oxygen Species (ROS) generation.
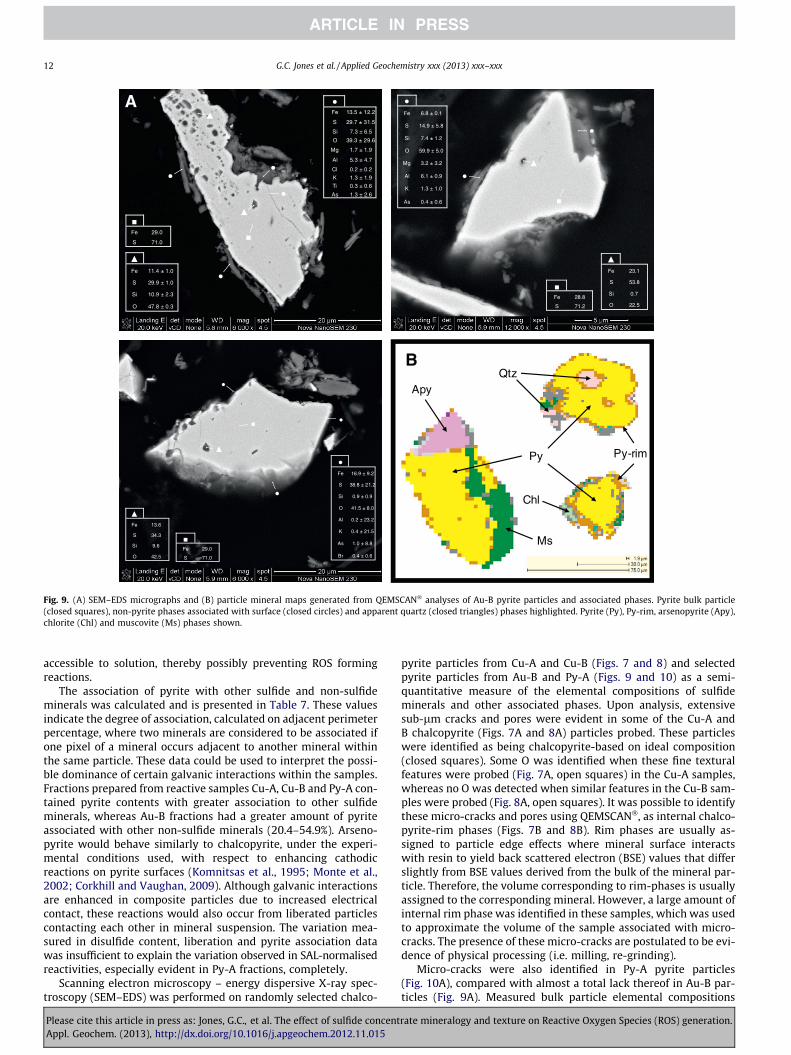
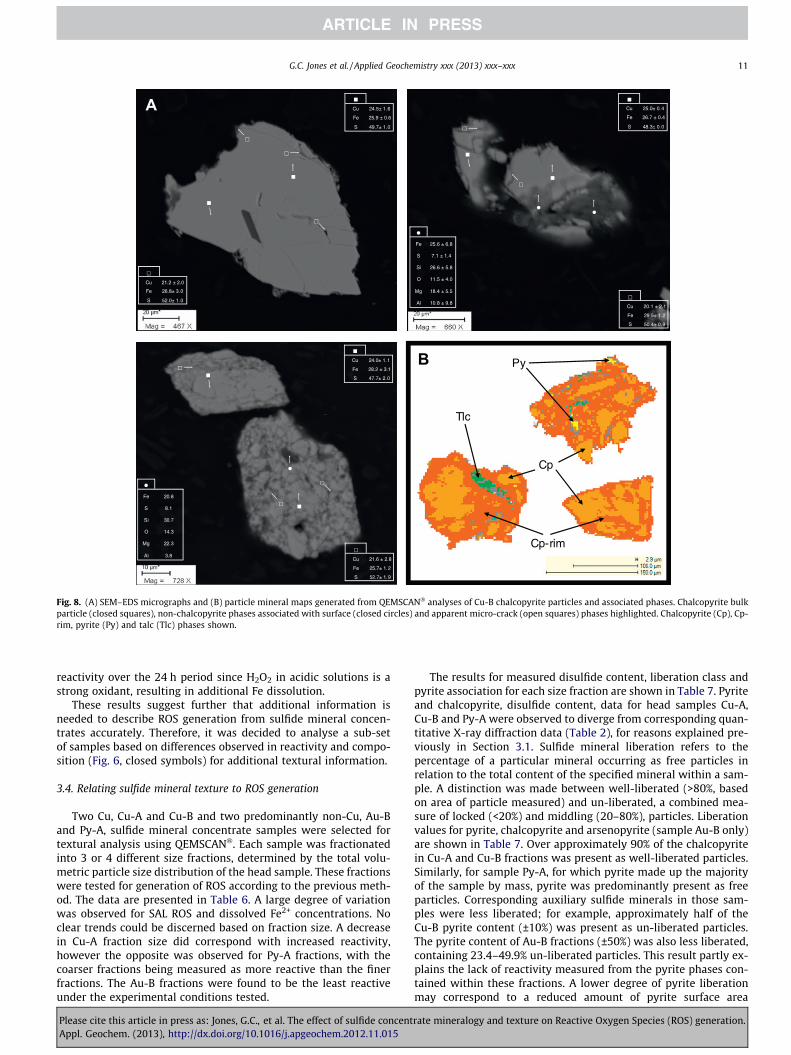
Fig. 9. (A) SEM–EDS micrographs and (B) particle mineral maps generated from QEMSCAN� analyses of Au-B pyrite particles and associated phases. Pyrite bulk particle(closed squares), non-pyrite phases associated with surface (closed circles) and apparent quartz (closed triangles) phases highlighted. Pyrite (Py), Py-rim, arsenopyrite (Apy),chlorite (Chl) and muscovite (Ms) phases shown.
12 G.C. Jones et al. / Applied Geochemistry xxx (2013) xxx–xxx
accessible to solution, thereby possibly preventing ROS formingreactions.
The association of pyrite with other sulfide and non-sulfideminerals was calculated and is presented in Table 7. These valuesindicate the degree of association, calculated on adjacent perimeterpercentage, where two minerals are considered to be associated ifone pixel of a mineral occurs adjacent to another mineral withinthe same particle. These data could be used to interpret the possi-ble dominance of certain galvanic interactions within the samples.Fractions prepared from reactive samples Cu-A, Cu-B and Py-A con-tained pyrite contents with greater association to other sulfideminerals, whereas Au-B fractions had a greater amount of pyriteassociated with other non-sulfide minerals (20.4–54.9%). Arseno-pyrite would behave similarly to chalcopyrite, under the experi-mental conditions used, with respect to enhancing cathodicreactions on pyrite surfaces (Komnitsas et al., 1995; Monte et al.,2002; Corkhill and Vaughan, 2009). Although galvanic interactionsare enhanced in composite particles due to increased electricalcontact, these reactions would also occur from liberated particlescontacting each other in mineral suspension. The variation mea-sured in disulfide content, liberation and pyrite association datawas insufficient to explain the variation observed in SAL-normalisedreactivities, especially evident in Py-A fractions, completely.
Scanning electron microscopy – energy dispersive X-ray spec-troscopy (SEM–EDS) was performed on randomly selected chalco-
Please cite this article in press as: Jones, G.C., et al. The effect of sulfide concentAppl. Geochem. (2013), http://dx.doi.org/10.1016/j.apgeochem.2012.11.015
pyrite particles from Cu-A and Cu-B (Figs. 7 and 8) and selectedpyrite particles from Au-B and Py-A (Figs. 9 and 10) as a semi-quantitative measure of the elemental compositions of sulfideminerals and other associated phases. Upon analysis, extensivesub-lm cracks and pores were evident in some of the Cu-A andB chalcopyrite (Figs. 7A and 8A) particles probed. These particleswere identified as being chalcopyrite-based on ideal composition(closed squares). Some O was identified when these fine texturalfeatures were probed (Fig. 7A, open squares) in the Cu-A samples,whereas no O was detected when similar features in the Cu-B sam-ples were probed (Fig. 8A, open squares). It was possible to identifythese micro-cracks and pores using QEMSCAN�, as internal chalco-pyrite-rim phases (Figs. 7B and 8B). Rim phases are usually as-signed to particle edge effects where mineral surface interactswith resin to yield back scattered electron (BSE) values that differslightly from BSE values derived from the bulk of the mineral par-ticle. Therefore, the volume corresponding to rim-phases is usuallyassigned to the corresponding mineral. However, a large amount ofinternal rim phase was identified in these samples, which was usedto approximate the volume of the sample associated with micro-cracks. The presence of these micro-cracks are postulated to be evi-dence of physical processing (i.e. milling, re-grinding).
Micro-cracks were also identified in Py-A pyrite particles(Fig. 10A), compared with almost a total lack thereof in Au-B par-ticles (Fig. 9A). Measured bulk particle elemental compositions
rate mineralogy and texture on Reactive Oxygen Species (ROS) generation.
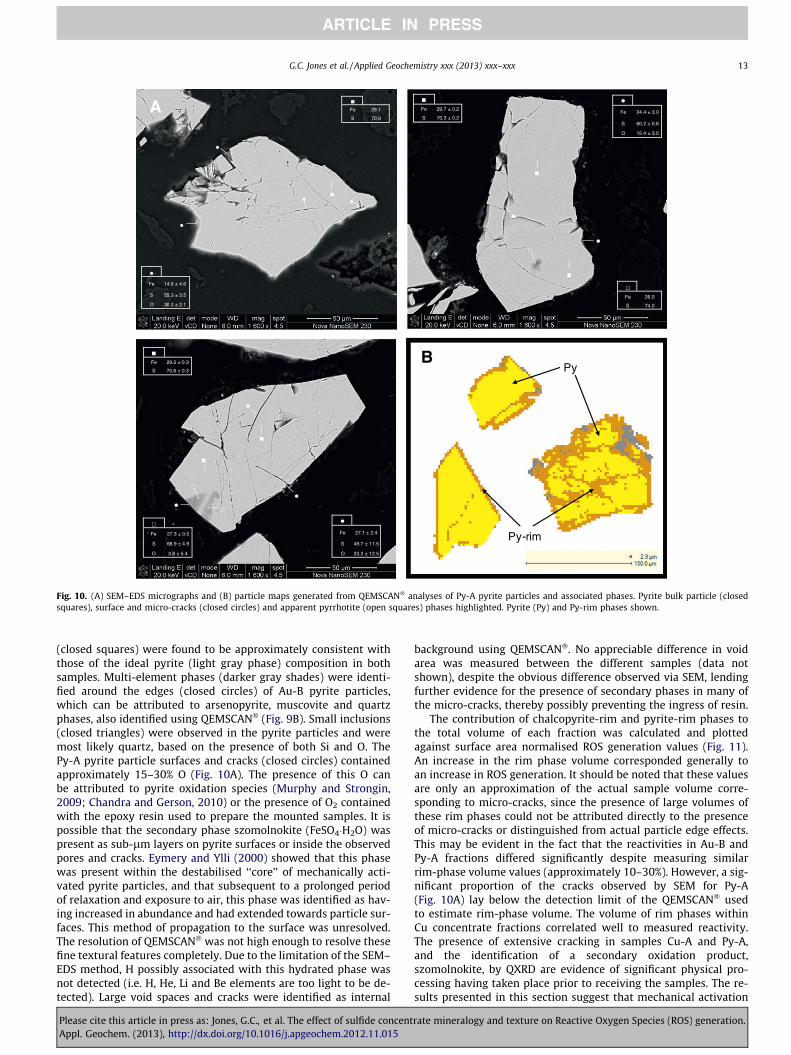
Fig. 10. (A) SEM–EDS micrographs and (B) particle maps generated from QEMSCAN� analyses of Py-A pyrite particles and associated phases. Pyrite bulk particle (closedsquares), surface and micro-cracks (closed circles) and apparent pyrrhotite (open squares) phases highlighted. Pyrite (Py) and Py-rim phases shown.
G.C. Jones et al. / Applied Geochemistry xxx (2013) xxx–xxx 13
(closed squares) were found to be approximately consistent withthose of the ideal pyrite (light gray phase) composition in bothsamples. Multi-element phases (darker gray shades) were identi-fied around the edges (closed circles) of Au-B pyrite particles,which can be attributed to arsenopyrite, muscovite and quartzphases, also identified using QEMSCAN� (Fig. 9B). Small inclusions(closed triangles) were observed in the pyrite particles and weremost likely quartz, based on the presence of both Si and O. ThePy-A pyrite particle surfaces and cracks (closed circles) containedapproximately 15–30% O (Fig. 10A). The presence of this O canbe attributed to pyrite oxidation species (Murphy and Strongin,2009; Chandra and Gerson, 2010) or the presence of O2 containedwith the epoxy resin used to prepare the mounted samples. It ispossible that the secondary phase szomolnokite (FeSO4�H2O) waspresent as sub-lm layers on pyrite surfaces or inside the observedpores and cracks. Eymery and Ylli (2000) showed that this phasewas present within the destabilised ‘‘core’’ of mechanically acti-vated pyrite particles, and that subsequent to a prolonged periodof relaxation and exposure to air, this phase was identified as hav-ing increased in abundance and had extended towards particle sur-faces. This method of propagation to the surface was unresolved.The resolution of QEMSCAN� was not high enough to resolve thesefine textural features completely. Due to the limitation of the SEM–EDS method, H possibly associated with this hydrated phase wasnot detected (i.e. H, He, Li and Be elements are too light to be de-tected). Large void spaces and cracks were identified as internal
Please cite this article in press as: Jones, G.C., et al. The effect of sulfide concentAppl. Geochem. (2013), http://dx.doi.org/10.1016/j.apgeochem.2012.11.015
background using QEMSCAN�. No appreciable difference in voidarea was measured between the different samples (data notshown), despite the obvious difference observed via SEM, lendingfurther evidence for the presence of secondary phases in many ofthe micro-cracks, thereby possibly preventing the ingress of resin.
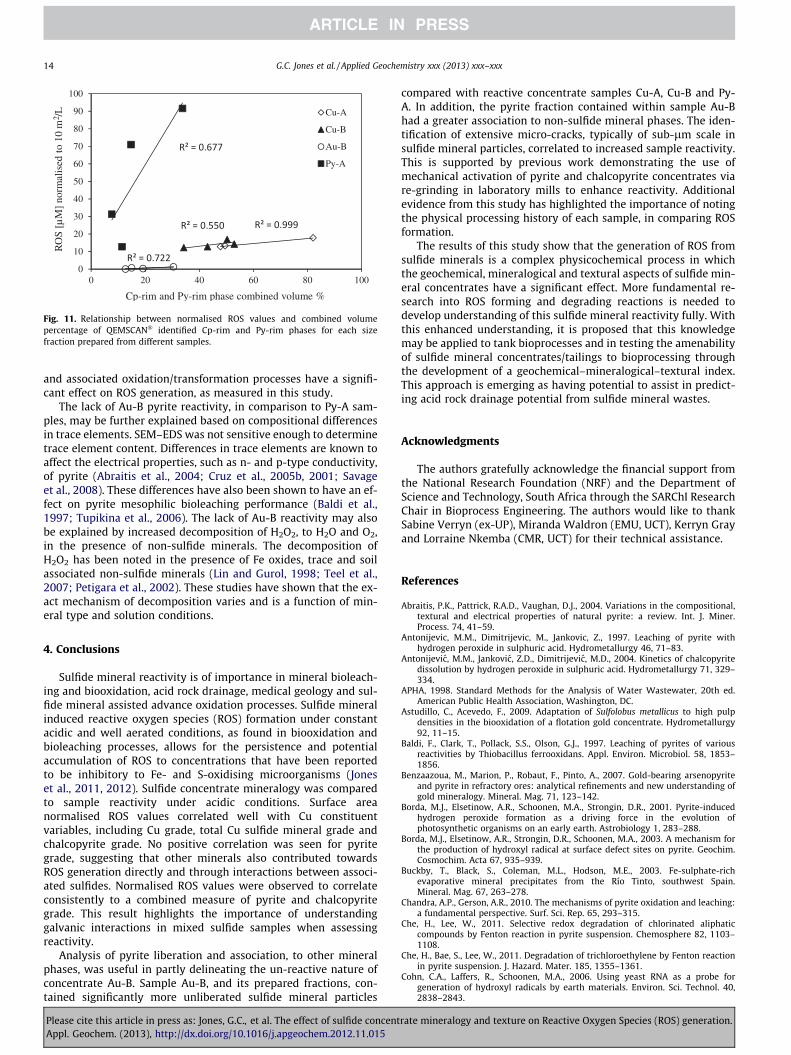
The contribution of chalcopyrite-rim and pyrite-rim phases tothe total volume of each fraction was calculated and plottedagainst surface area normalised ROS generation values (Fig. 11).An increase in the rim phase volume corresponded generally toan increase in ROS generation. It should be noted that these valuesare only an approximation of the actual sample volume corre-sponding to micro-cracks, since the presence of large volumes ofthese rim phases could not be attributed directly to the presenceof micro-cracks or distinguished from actual particle edge effects.This may be evident in the fact that the reactivities in Au-B andPy-A fractions differed significantly despite measuring similarrim-phase volume values (approximately 10–30%). However, a sig-nificant proportion of the cracks observed by SEM for Py-A(Fig. 10A) lay below the detection limit of the QEMSCAN� usedto estimate rim-phase volume. The volume of rim phases withinCu concentrate fractions correlated well to measured reactivity.The presence of extensive cracking in samples Cu-A and Py-A,and the identification of a secondary oxidation product,szomolnokite, by QXRD are evidence of significant physical pro-cessing having taken place prior to receiving the samples. The re-sults presented in this section suggest that mechanical activation
rate mineralogy and texture on Reactive Oxygen Species (ROS) generation.
0
10
20
30
40
50
60
70
80
90
100
0 20 40 60 80 100
RO
S [
µM
] no
rmal
ised
to
10 m
2 /L
Cp-rim and Py-rim phase combined volume %
Cu-A
Cu-B
Au-B
Py-A
Fig. 11. Relationship between normalised ROS values and combined volumepercentage of QEMSCAN� identified Cp-rim and Py-rim phases for each sizefraction prepared from different samples.
14 G.C. Jones et al. / Applied Geochemistry xxx (2013) xxx–xxx
and associated oxidation/transformation processes have a signifi-cant effect on ROS generation, as measured in this study.
The lack of Au-B pyrite reactivity, in comparison to Py-A sam-ples, may be further explained based on compositional differencesin trace elements. SEM–EDS was not sensitive enough to determinetrace element content. Differences in trace elements are known toaffect the electrical properties, such as n- and p-type conductivity,of pyrite (Abraitis et al., 2004; Cruz et al., 2005b, 2001; Savageet al., 2008). These differences have also been shown to have an ef-fect on pyrite mesophilic bioleaching performance (Baldi et al.,1997; Tupikina et al., 2006). The lack of Au-B reactivity may alsobe explained by increased decomposition of H2O2, to H2O and O2,in the presence of non-sulfide minerals. The decomposition ofH2O2 has been noted in the presence of Fe oxides, trace and soilassociated non-sulfide minerals (Lin and Gurol, 1998; Teel et al.,2007; Petigara et al., 2002). These studies have shown that the ex-act mechanism of decomposition varies and is a function of min-eral type and solution conditions.
4. Conclusions
Sulfide mineral reactivity is of importance in mineral bioleach-ing and biooxidation, acid rock drainage, medical geology and sul-fide mineral assisted advance oxidation processes. Sulfide mineralinduced reactive oxygen species (ROS) formation under constantacidic and well aerated conditions, as found in biooxidation andbioleaching processes, allows for the persistence and potentialaccumulation of ROS to concentrations that have been reportedto be inhibitory to Fe- and S-oxidising microorganisms (Joneset al., 2011, 2012). Sulfide concentrate mineralogy was comparedto sample reactivity under acidic conditions. Surface areanormalised ROS values correlated well with Cu constituentvariables, including Cu grade, total Cu sulfide mineral grade andchalcopyrite grade. No positive correlation was seen for pyritegrade, suggesting that other minerals also contributed towardsROS generation directly and through interactions between associ-ated sulfides. Normalised ROS values were observed to correlateconsistently to a combined measure of pyrite and chalcopyritegrade. This result highlights the importance of understandinggalvanic interactions in mixed sulfide samples when assessingreactivity.
Analysis of pyrite liberation and association, to other mineralphases, was useful in partly delineating the un-reactive nature ofconcentrate Au-B. Sample Au-B, and its prepared fractions, con-tained significantly more unliberated sulfide mineral particles
Please cite this article in press as: Jones, G.C., et al. The effect of sulfide concentAppl. Geochem. (2013), http://dx.doi.org/10.1016/j.apgeochem.2012.11.015
compared with reactive concentrate samples Cu-A, Cu-B and Py-A. In addition, the pyrite fraction contained within sample Au-Bhad a greater association to non-sulfide mineral phases. The iden-tification of extensive micro-cracks, typically of sub-lm scale insulfide mineral particles, correlated to increased sample reactivity.This is supported by previous work demonstrating the use ofmechanical activation of pyrite and chalcopyrite concentrates viare-grinding in laboratory mills to enhance reactivity. Additionalevidence from this study has highlighted the importance of notingthe physical processing history of each sample, in comparing ROSformation.
The results of this study show that the generation of ROS fromsulfide minerals is a complex physicochemical process in whichthe geochemical, mineralogical and textural aspects of sulfide min-eral concentrates have a significant effect. More fundamental re-search into ROS forming and degrading reactions is needed todevelop understanding of this sulfide mineral reactivity fully. Withthis enhanced understanding, it is proposed that this knowledgemay be applied to tank bioprocesses and in testing the amenabilityof sulfide mineral concentrates/tailings to bioprocessing throughthe development of a geochemical–mineralogical–textural index.This approach is emerging as having potential to assist in predict-ing acid rock drainage potential from sulfide mineral wastes.
Acknowledgments
The authors gratefully acknowledge the financial support fromthe National Research Foundation (NRF) and the Department ofScience and Technology, South Africa through the SARChI ResearchChair in Bioprocess Engineering. The authors would like to thankSabine Verryn (ex-UP), Miranda Waldron (EMU, UCT), Kerryn Grayand Lorraine Nkemba (CMR, UCT) for their technical assistance.
References
Abraitis, P.K., Pattrick, R.A.D., Vaughan, D.J., 2004. Variations in the compositional,textural and electrical properties of natural pyrite: a review. Int. J. Miner.Process. 74, 41–59.
Antonijevic, M.M., Dimitrijevic, M., Jankovic, Z., 1997. Leaching of pyrite withhydrogen peroxide in sulphuric acid. Hydrometallurgy 46, 71–83.
Antonijevic, M.M., Jankovic, Z.D., Dimitrijevic, M.D., 2004. Kinetics of chalcopyritedissolution by hydrogen peroxide in sulphuric acid. Hydrometallurgy 71, 329–334.
APHA, 1998. Standard Methods for the Analysis of Water Wastewater, 20th ed.American Public Health Association, Washington, DC.
Astudillo, C., Acevedo, F., 2009. Adaptation of Sulfolobus metallicus to high pulpdensities in the biooxidation of a flotation gold concentrate. Hydrometallurgy92, 11–15.
Baldi, F., Clark, T., Pollack, S.S., Olson, G.J., 1997. Leaching of pyrites of variousreactivities by Thiobacillus ferrooxidans. Appl. Environ. Microbiol. 58, 1853–1856.
Benzaazoua, M., Marion, P., Robaut, F., Pinto, A., 2007. Gold-bearing arsenopyriteand pyrite in refractory ores: analytical refinements and new understanding ofgold mineralogy. Mineral. Mag. 71, 123–142.
Borda, M.J., Elsetinow, A.R., Schoonen, M.A., Strongin, D.R., 2001. Pyrite-inducedhydrogen peroxide formation as a driving force in the evolution ofphotosynthetic organisms on an early earth. Astrobiology 1, 283–288.
Borda, M.J., Elsetinow, A.R., Strongin, D.R., Schoonen, M.A., 2003. A mechanism forthe production of hydroxyl radical at surface defect sites on pyrite. Geochim.Cosmochim. Acta 67, 935–939.
Buckby, T., Black, S., Coleman, M.L., Hodson, M.E., 2003. Fe-sulphate-richevaporative mineral precipitates from the Río Tinto, southwest Spain.Mineral. Mag. 67, 263–278.
Chandra, A.P., Gerson, A.R., 2010. The mechanisms of pyrite oxidation and leaching:a fundamental perspective. Surf. Sci. Rep. 65, 293–315.
Che, H., Lee, W., 2011. Selective redox degradation of chlorinated aliphaticcompounds by Fenton reaction in pyrite suspension. Chemosphere 82, 1103–1108.
Che, H., Bae, S., Lee, W., 2011. Degradation of trichloroethylene by Fenton reactionin pyrite suspension. J. Hazard. Mater. 185, 1355–1361.
Cohn, C.A., Laffers, R., Schoonen, M.A., 2006. Using yeast RNA as a probe forgeneration of hydroxyl radicals by earth materials. Environ. Sci. Technol. 40,2838–2843.
rate mineralogy and texture on Reactive Oxygen Species (ROS) generation.
G.C. Jones et al. / Applied Geochemistry xxx (2013) xxx–xxx 15
Cohn, C.A., Simon, S.R., Schoonen, M., 2008. Comparison of fluorescence-basedtechniques for the measurement of hydroxyl radicals in particle suspensions.Particle Fibre Toxicol. 5, 2.
Cohn, C., Pedigo, C., Hylton, S., Simon, S., Schoonen, M., 2009. Evaluating the use of30-(p-Aminophenyl) fluorescein for determining the formation of highlyreactive oxygen species in particle suspensions. Geochem. Trans. 10, 8.
Corkhill, C.L., Vaughan, D.J., 2009. Arsenopyrite oxidation – a review. Appl.Geochem. 24, 2342–2361.
Cruz, R., Bertrand, V., Monroy, M., González, I., 2001. Effect of sulfide impurities onthe reactivity of pyrite and pyritic concentrates: a multi-tool approach. Appl.Geochem. 16, 803–819.
Cruz, R., González, I., Monroy, M., 2005a. Electrochemical characterization ofpyrrhotite reactivity under simulated weathering conditions. Appl. Geochem.20, 109–121.
Cruz, R., Luna-Sánchez, R.M., Lapidus, G.T., González, I., Monroy, M., 2005b. Anexperimental strategy to determine galvanic interactions affecting thereactivity of sulfide mineral concentrates. Hydrometallurgy 78, 198–208.
Davis, J.F., 2002. Statistics and Data Analysis in Geology. Wiley, New York.Ekmekçi, Z., Demirel, H., 1997. Effects of galvanic interaction on collectorless
flotation behaviour of chalcopyrite and pyrite. Int. J. Miner. Process. 52, 31–48.Elsner, M., Schwarzenbach, R.P., Haderlein, S.B., 2004. Reactivity of Fe(II)-bearing
minerals toward reductive transformation of organic contaminants. Environ.Sci. Technol. 38, 799–807.
Eymery, J.P., Ylli, F., 2000. Study of a mechanochemical transformation in ironpyrite. J. Alloys Compd. 298, 306–309.
Fandrich, R., Gu, Y., Burrows, D., Moeller, K., 2007. Modern SEM-based mineralliberation analysis. Int. J. Miner. Process. 84, 310–320.
Fubini, B., Hubbard, A., 2003. Reactive oxygen species (ROS) and reactive nitrogenspecies (RNS) generation by silica in inflammation and fibrosis. Free Radic. Biol.Med. 34, 1507–1516.
Fubini, B., Mollo, L., 1995. Role of iron in the reactivity of mineral fibers. Toxicol.Lett. 82 (83), 951–960.
Fubini, B., Mollo, L., Giamello, E., 1995. Free radical generation at the solid/liquidinterface in iron containing minerals. Free Radical Res. 23, 593–614.
Gottlieb, P., Wilkie, G., Sutherland, D., Ho-Tun, E., Suthers, S., Perera, K., Jenkins, B.,Spencer, S., Butcher, A., Rayner, J., 2000. Using quantitative electron microscopyfor process mineral applications. J. Miner. Metal. Mater. Soc. 52, 24–25.
Hara, J., 2011. The effect of oxygen on chemical dechlorination of dieldrin using ironsulphides. Chemosphere 82, 1308–1313.
Harrison, S.T.L., Sissing, A., Raja, S., Pearce, S.J.A., Lamaignere, V., Nemati, M., 2003.Solids loading in the bioleach slurry reactor: mechanisms through whichparticulate parameters influence slurry bioreactor performance.Biohydrometallurgy: a sustainable technology in evolution. In: Proc. 15thInternat. Biohydrometallurgy Symp. pp. 359–375.
Janzen, M.P., Nicholson, R.V., Scharer, J.M., 2000. Pyrrhotite reaction kinetics:reaction rates for oxidation by oxygen, ferric iron, and for nonoxidativedissolution. Geochim. Cosmochim. Acta 64, 1511–1522.
Jones, G.C., Corin, K.C., van Hille, R.P., Harrison, S.T.L., 2011. The generation of toxicreactive oxygen species (ROS) from mechanically activated sulphideconcentrates and its effect on thermophilic bioleaching. Miner. Eng. 24, 1198–1208.
Jones, G., van Hille, R.P., Harrison, S.T.L., 2012. Reactive Oxygen Species generated inthe presence of fine pyrite particles and its implication in thermophilic mineralsbioleaching. Appl. Micrbiol. Biotechnol. doi: http://dx.doi.org/10.1007/s00253-012-4116-y.
Klausen, J., Tröber, S.P., Haderlein, S.B., Schwarzenbach, R.P., 1995. Reduction ofsubstituted nitrobenzenes by Fe(ll) in aqueous mineral suspensions. Environ.Sci. Technol. 29, 2396–2404.
Koleini, S.M.J., Aghazadeh, V., Sandström, Å., 2011. Acidic sulphate leaching ofchalcopyrite concentrates in presence of pyrite. Miner. Eng. 24, 381–386.
Komnitsas, K., Xenidis, A., Adam, K., 1995. Oxidation of pyrite and arsenopyrite insulphidic spoils in Lavrion. Miner. Eng. 8, 1443–1454.
Lin, S., Gurol, M.D., 1998. Catalytic decomposition of hydrogen peroxide on ironoxide: kinetics, mechanism, and implications. Environ. Sci. Technol. 32, 1417–1423.
Lotter, N.O., 2011. Modern process mineralogy: an integrated multi-disciplinedapproach to flowsheeting. Miner. Eng. 24, 1229–1237.
Márquez, M., Gaspar, J., Bessler, K.E., Magela, G., 2006. Process mineralogy ofbacterial oxidized gold ore in São Bento Mine (Brasil). Hydrometallurgy 83,114–123.
Matta, R., Hanna, K., Chiron, S., 2007. Fenton-like oxidation of 2,4,6-trinitrotolueneusing different iron minerals. Sci. Total Environ. 385, 242–251.
Moncur, M.C., Jambor, J.L., Ptacek, C.J., Blowes, D.W., 2009. Mine drainage from theweathering of sulfide minerals and magnetite. Appl. Geochem. 24, 2362–2373.
Please cite this article in press as: Jones, G.C., et al. The effect of sulfide concentAppl. Geochem. (2013), http://dx.doi.org/10.1016/j.apgeochem.2012.11.015
Monte, M.B.M., Dutra, A.J.B., Albuquerque Jr., C.R.F., Tondo, L.A., Lins, F.F., 2002. Theinfluence of the oxidation state of pyrite and arsenopyrite on the flotation of anauriferous sulphide ore. Miner. Eng. 15, 1113–1120.
Murphy, R., Strongin, D.R., 2009. Surface reactivity of pyrite and related sulfides.Surf. Sci. Rep. 64, 1–45.
Nefso, E.K., Burns, S.E., McGrath, C.J., 2005. Degradation kinetics of TNT in thepresence of six mineral surfaces and ferrous iron. J. Hazard. Mater. 123, 79–88.
Nemati, M., Harrison, S.T.L., 2000. Effect of solid loading on thermophilicbioleaching of sulfide minerals. J. Chem. Technol. Biotechnol. 75, 526.
Nemati, M., Lowenadler, J., Harrison, S.T.L., 2000. Particle size effects in bioleachingof pyrite by acidophilic thermophile Sulfolobus metallicus (BC). Appl. Microbiol.Biotechnol. 53, 173–179.
Ottner, F., Gier, S., Kuderna, M., Schwaighofer, B., 2000. Results of an inter-laboratory comparison of methods for quantitative clay analysis. Appl. Clay Sci.17, 223–243.
Ouhadi, V.R., Yong, R.N., 2003. Impact of clay microstructure and mass absorptioncoefficient on the quantitative mineral identification by XRD analysis. Appl.Clay Sci. 23, 141–148.
Parbhakar-Fox, A.K., Edraki, M., Walters, S., Bradshaw, D., 2011. Development of atextural index for the prediction of acid rock drainage. Miner. Eng. 24, 1277–1287.
Petigara, B.R., Blough, N.V., Mignerey, A.C., 2002. Mechanism of hydrogen peroxidedecomposition in soils. Environ. Sci. Technol. 36, 639–645.
Plumb, J.J., Gibbs, B., Stott, M.B., Robertson, W.J., Gibson, J.A.E., Nichols, P.D., Watling,H.R., Franzmann, P.D., 2002. Enrichment and characterisation of thermophilicacidophiles for the bioleaching of mineral sulphides. Miner. Eng. 15, 787–794.
Qing You, L., Heping, L., Li, Z., 2007. Study of galvanic interactions between pyriteand chalcopyrite in a flowing system: implications for the environment.Environ. Geol. 52, 11–18.
Raja, S.B., 2005. The Effect of Particulate-induced Hydrodynamic Stress on theBioleaching of Chalcopyrite by a Sulfolobus sp. PhD Thesis, Univ. Cape Town.
Rawlings, D.E., Johnson, D.B., 2006. Biomining. Springer-Verlag, Berlin.Rawlings, D.E., Dew, D., du Plessis, C., 2003. Biomineralization of metal-containing
ores and concentrates. Trends Biotechnol. 21, 38–44.Rubio, A., Garcia Frutos, F.J., 2002. Bioleaching capacity of an extremely
thermophilic culture for chalcopyritic materials. Miner. Eng. 15, 689–694.Salmon, S.U., Malmström, M.E., 2006. Quantification of mineral dissolution rates
and applicability of rate laws: laboratory studies of mill tailings. Appl.Geochem. 21, 269–288.
Savage, K.S., Stefan, D., Lehner, S.W., 2008. Impurities and heterogeneity in pyrite:influences on electrical properties and oxidation products. Appl. Geochem. 23,103–120.
Schoonen, M.A., Cohn, C.A., Roemer, E., Laffers, R., Simon, S.R., O’Riordan, T., 2006.Mineral-induced formation of reactive oxygen species. Rev. Mineral. Geochem.64, 179–221.
Schoonen, M.A.A., Harrington, A.D., Laffers, R., Strongin, D.R., 2010. Role of hydrogenperoxide and hydroxyl radical in pyrite oxidation by molecular oxygen.Geochim. Cosmochim. Acta 74, 4971–4987.
Sissing, A., Harrison, S.T.L., 2003. Thermophilic mineral bioleaching performance: acompromise between maximising mineral loading and maximising microbialgrowth and activity. SAIMM J., March 2003, pp. 1–4.
Stott, M.B., Sutton, D.C., Watling, H.R., Franzmann, P.D., 2003. Comparative leachingof chalcopyrite by selected acidophilic Bacteria and Archaea. Geomicrobiol. J. 20,215–230.
Szabo, C., 2009. Peroxynitrite: biochemistry, toxicology and development oftherapeutics. Toxicol. Lett. 189 (Suppl. S22).
Teel, A.L., Finn, D.D., Schmidt, J.T., Cutler, L.M., Watts, R.J., 2007. Rates of tracemineral-catalyzed decomposition of hydrogen peroxide. J. Environ. Eng. 133,853–858.
Tupikina, O.V., Kondrat’eva, T.F., Samorukova, V.D., Rassulov, V.A., Karavaiko, G.I.,2006. Pheno- and genotypic characteristics of Acidithiobacillus ferrooxidansstrains as affected by physicochemical properties of pyrites. Hydrometallurgy83, 255–262.
Valencia, P., Acevedo, F., 2009. Are bioleaching rates determined by the availableparticle surface area concentration? World J. Microbiol. Biotechnol. 25, 101–106.
van Niekerk, J., 2009. Recent advances in BIOX� technology. In: HydrometallurgyConf. 2009, The Southern African Institute of Mining and Metallurgy, 2009,Johannesburg, pp. 167–176.
Vilcaez, J., Yamada, R., Inoue, C., 2009. Effect of pH reduction and ferric ion additionon the leaching of chalcopyrite at thermophilic temperatures. Hydrometallurgy96, 62–71.
Wang, W., Qu, Y., Yang, B., Liu, X., Su, W., 2012. Lactate oxidation in pyritesuspension: a Fenton-like process in situ generating H2O2. Chemosphere 82,1103–1108.
rate mineralogy and texture on Reactive Oxygen Species (ROS) generation.


