Embed Size (px)
Citation preview
61
Soil & Water Res., 13, 2018 (2): 61–73 Original Paper
https://doi.org/10.17221/231/2016-SWR
Mineralogy and Chemical Composition of Cryosols and Andosols in Antarctica
Vítězslav VLČEK1*, Ľubica POSPÍŠILOVÁ1 and Peter UHLÍK 2
1Department of Agrochemistry, Soil Science, Microbiology and Plant Nutrition, Mendel University in Brno, Brno, Czech Republic; 2Department of Economic Geology, Faculty of Natural Sciences, Comenius University in Bratislava, Bratislava, Slovak Republic
*Corresponding author: [email protected]
Abstract
Vlček V., Pospíšilová L., Uhlík P. (2018): Mineralogy and chemical composition of Cryosols and Andosols in Antarc-tica. Soil & Water Res., 13: 61−73.
Variations in mineralogical and elemental composition of Turbic Cryosol (King George Island and James Ross Island), Skeletic Cryosol (J. Ross Island, the Trinity Peninsula), Leptic Andosols (Deception Island), and Skeletic Andosols (Deception Island) were studied. Significant differences in mineralogical composition in size fraction, vertical and horizontal position were determined by X-ray diffraction quantitative analysis. The differences were attributed to a variable degree of chemical weathering process. As a product of weathering were defined mont-morillonite, chlorite, microcrystalline polymorphous silica, Fe oxides, and oxyhydroxides. Their content was increased towards the surface and in a finer fraction. Crystal thickness and size distribution of montmorillonite was measured by the Bertaut-Warren-Averbach technique and the results confirmed higher intensity of chemical weathering in Turbic Cryosols (J. Ross Island and King George Island). Feldspars and volcanic glass were the main phases found in soil samples from Deception Island. They were determined as phases of parent rock and indicated low intensity of chemical weathering. Clinoptilolite was identified in soil samples from J. Ross Island and Deception Islad and its hydrothermal origin was supposed. Soil (sample AP) from Base General Bernardo O’Higgins Riquelme had significantly higher content of phosphate minerals, which was a result of ornithogenic activities. Macro elements content was consistent with mineralogical analyses. Turbic Cryosols were rich in iron, aluminium, magnesium, and manganese (> 2%). Skeletic Cryosols contained also iron, aluminium, magnesium, manganese, calcium, and sulphur (> 1%). Leptic Andosols were rich in iron and aluminium (> 2%). Soil proper-ties and humic substances quality were evaluted. Results of chemical and physical analyses indicated that poorly developed soils of Antarctica varied in acidity, conductivity, humus content, and texture. Humic substances content and quality were low. Mainly mechanical (physical) and chemical weathering processes played major role in the soil development accompanied by low intensity of biological activity.
Keywords: King George Island; Deception Island; James Ross Island; weathering; mineralogical composition; clay mineral
Climatic conditions have changed in the past half century and therefore a considerable attention is payed to the human impact on the Antarctic en-vironment. The retreat and disintegration of ice shelves together with habitant changes are evidence of environmental changes, therefore important new investigations in ice-free areas of Antarctica are needed (Ugolini & Bockheim 2008). The soils of
Antarctica have formed since the last deglaciation on different lithological materials (e.g. andesitic and basaltic lavas, breccias, fluvio-glacial and moraine deposits, Cretaceous deposits etc.) being affected by a number of pedogenic processes as quoted Ugo-lini (1964), Navas et al. (2008), and Bockheim et al. (2015). Keys Soils Taxonomy (Soil Survey Staff 2006) divided permafrost affected soils (Gelisols)
62
Original Paper Soil & Water Res., 13, 2018 (2): 61–73
https://doi.org/10.17221/231/2016-SWR
into three subordes: Histels, Tuberls, and Orthels. Turbel suborder includes soils with ice-cemented permafrost within 70 cm of the surface. The main soil forming processes are cryoturbation, physi-cal (mechanical) weathering, chemical weathering (oxidation and salinization), podsolization, rubifi-cation, cambic process, ornithogenic activities, and humus accumulation (Beyer et al. 1997, 2000; Lee et al. 2007; Ugolini & Beckheim 2008; Simas et al. 2008; Haus et al. 2016). Also volcanic activity (e.g. nearby Deception Island) is a factor directly affect-ing soil formation processes. Many authors came to the conclusion that the intensity of pedogenic pro-cesses was decreasing with the increasing latitude. The relationship between soil formation process, landscape, and the glacial and volcanic activities is not well understood and has involved many recent investigators. The attention is also focused on a number of soil forming factors and different mineral substrata, which directly affect pedogenesis under extreme climatic conditions. The studies of Antarctic ecosystem showed that in an ice-free environment there are a large number of species of non-flowering plants (lichen, mosses, algae, fungi) and animals. Only two species of flowering plants are known: the Antarctic hair grass (Deschampsia antarctica) and the Antarctic pearlwort (Colobanthus quitensis). These are the main source of soil organic carbon. Humification process and formation of humic acids in spite of the absence of lignin containing plants was confirmed by Wilson et al. (1986), Beyer et al. (1997, 2000), and Gajdošová et al. (2003). Ac-cording to Kaiser and Guggenberger (2000) and Kleber et al. (2005, 2007) the soil organic carbon concentration is closely related not only to texture but also to the content of extractable Fe and Al and nitrogen compounds. Significant correlation was found between chemical composition, texture, mineral specific surface area, and organic carbon concentra-tion (Wang & Xing 2005; Grandy & Neff 2008; Pietramellara et al. 2009). Chemical composi-tion of mineral-associated organic carbon seems to influence the mineralization rate of soil organic carbon. Higher mineralization rate is observed for labile and more aliphatic carbon fraction and lower rate is characteristic for aromatic and more resist-ant organic carbon fractions (Mikutta et al. 2006; Schneider et al. 2010).
The aim of the present study was to determine the degree of weathering of poorly developed Turbic or Skeletic Cryosols and Leptic or Skeletic Andosols formed
in the ice-free area of Antarctica by analyzing the el-emental and mineralogical composition. Furthermore, basic soil physical and chemical properties, humic substances quality and content, crystal thickness, and size distribution of montmorillonite were evaluated.
MATERIAL AND METHODS
Regional settings. Strelin and Sone (1998) re-corded the mean annual air temperature (in de-glaciated area and at sea level) of –6.5°C and the mean annual precipitation around 200 mm water equivalent at James Ross Island. Deception Island is an active volcano with polar maritime climate, the mean annual air temperature measured was –3°C (ranging from +11°C to –28°C) and the mean annual precipitation was 500 mm water equivalent. Extreme hot microclimates exist around steaming fumaroles and geothermally heated water (INACH 2005). King George Island had the mean annual sur-face temperature (at Bellingshausen station) –2.8°C (Kejna 1999) and the mean annual precipitation was 700 mm water equivalent (Kejna et al. 2013).
One of the soil forming factors is the parent mate-rial – the rock (e.g. Jenny 1944). King George Island is formed from Jurassic to Pleistocene stratiform volcano-sedimentary complexes cut by numerous intrusions (Table 1) (Birkenmajer 1980; Birken-majer et al. 1990). Deception Island is a large, ac-tive, mainly basalt-andesite Antarctic volcano at the western end of the Bransfield Strait, a very young (< 4 Ma) marginal basin situated at the northern end of the Antarctic Peninsula (Baker et al. 1975; Smellie 2001). James Ross Island is a large basaltic volcano. The James Ross Island outcrops are dominated by spectacular voluminous (tens of km3) far-travelled lava-fed deltas that mainly erupted in a glacial (i.e. ice sheet or ice cap) setting, although at least one delta and several tuff cones were marine-emplaced (Smellie et al. 2009). The lava, breccias, and glacial sediments overly poorly exposed Cretaceous fine clastic sediments (Crame et al. 2004; Johnson & Smellie 2007). Because no eruptions have been observed, James Ross Island is generally regarded as inactive. However, the volcanic field is probably still active, as suggested by the very long periods of dormancy (hundreds of ka) and the presence of two essentially pristine scoria cones in the east of James Ross Island (Smelie et al. 2009).
King George Island. One soil sample (KGI) derived from poorly developed soil profile to 10 cm.
63
Soil & Water Res., 13, 2018 (2): 61–73 Original Paper
https://doi.org/10.17221/231/2016-SWR
James Ross Island. Three soil profiles (JRI 1, 2, 5a, 5b, 5c and 6a, 6b, 6c) with different soil hori-zons; the first soil profile with samples JRI 1a: depth 0–10 cm; JRI 1b: depth 10–20 cm; the second soil profile JRI 5a: depth 5–15 cm (massive stone pave-ment on surface); JRI 5b: depth 25–30 cm, and JRI 5c: depth 38–45 cm; the third soil profile JRI 6 (Table 2) with subsamples JRI 6a: depth 0–3 cm; JRI 6b: depth 12–20 cm; JRI 6c: depth 51–57 cm and three other soil samples (JRI 2–4) from shallow, undifferentiated soils to the depth of 10 cm. Soil profiles were limited by ice (permafrost) or by soil skeleton.
Deception Island. Three soil samples (samples DI 1, 2, and 4) from shallow soils limited by soil skeleton or rock (Table 2).
The Trinity Peninsula. One soil sample (sample AP from Chilean Base General Bernardo O’Higgins Riquelme) from shallow soil (near a colony of pen-guins) limited by rock.
Soils were classified according to the IUSS Working Group WRB (IUSS 2014). Horizon designation was done by Jahn et al. (2006). Sampling was performed during the Antarctica expedition 2011–2012. Soil samples were collected into plastic bags, air-dried at the Johann Gregor Mendel Base (James Ross Island), and stored at room temperature ≤ 10°C (Vlček 2016). Characteriza-
tion of sampling localities, GPS coordinates, and basic soil properties are given in Tables 1 and 2 and Figure 1, examples of soil pit JRI6 and DI4 in Figure 2.
Soil analysis. Basic soil properties were determined by the commonly used standard methods. Soil reac-tion was determined by the potentiometric method in distilled water and in 1M KCl solution (1 : 2.5). Particle size analysis was determined by the pipette method. Total organic carbon content (TOC) was determined by wet digestion according to Nelson and Sommers (1982). Humic substances content was determined by the short fractionation method given by Kononova and Beltchikova (1963).
The X-ray diffraction (XRD) analysis: a corundum-spike sample was milled in methanol using a McCrone Micronising Mill (Retsch, Germany), then dried and side loaded to a XRD holder (Eberl et al. 1996; Eberl 2003; Środoň et al. 2001). The XRD analysis was carried out in the 4–65° 2Θ range using a Philips X-ray diffractometer model 1710 (Almelo, the Nether-lands) equipped with Cu tube and Ni filter at 20 mA and 40 kV. The exposure was 2 s per step (0.02° 2Θ). Quantitative analysis of 11 samples of soil fraction (< 2 mm) and five samples of soil skeleton (> 2 mm) was performed using the RockJock 11 program (Eberl 2003). To determine clay minerals, six soil samples
Table 1. Basic characteristics of the studied localities (see number of sample in Figure 1)
No. Sample Altitude (m) Land cover Parent material Latitude Longitude
1–2 James Ross Island (JRI 1a + 1b) 35 – Cretaceous deposits undiff. 63°48.014'S 57°53.662'W
3 James Ross Island (JRI 2) 375 – hyaloclastite tuffs 63°48.500'S 57°56.923'W
4 James Ross Island (JRI 3) 320 – hyaloclastite breccias 63°49.270'S 57°56.000'W
5 James Ross Island (JRI 4) 55 – Cretaceous deposits undiff. 63°48.335'S 57°55.082'W
6–8 James Ross Island (JRI 5a+5b+5c) 53 – Cretaceous deposits undiff. 63°48.339'S 57°55.082'W
9–11 James Ross Island (JRI 6a+6b+6c) 38 – glacial/fluvioglacial deposits 63°53.135'S 57°57.692'W
12 James Ross Island (JRI 7) 44 – glacial/fluvioglacial deposits 63°53.405'S 57°57.661'W
13 Deception Island (DI 1) 20 – post-caldera series, tuffs 62°58.748'S 60°33.280'W
14 Deception Island (DI 2) 12 – post-caldera series, tuffs 62°58.715'S 60°33.438'W
15 Deception Island (DI 4) 4 – post-caldera series, tuffs 62°58.742'S 60°33.413'W
16 King George Island (KGI) 50 – Tertiary andesitic and basaltic lavas 62°12.187'S 58°57.593'W
17 Antarctic /Trinity Peninsula (AP) 10 – metasediments 63°19.282'S 57°53.893'W
64
Original Paper Soil & Water Res., 13, 2018 (2): 61–73
https://doi.org/10.17221/231/2016-SWR
(< 2 mm) were selected, ground, and sieved to obtain fraction < 0.16 mm. Subsequently, the Jackson treat-ment modified by Šucha et al. (1991) was applied to remove carbonates, organic matter, and Fe oxides and hydroxides. Clay fraction (< 2 μm) was separated by sedimentation in a water suspension following Stokes’ law. Excess soluble salts were removed by dialysis. Orientated powder samples were prepared by the glass slide method (Moore & Reynolds 1997) with drying of the suspensions at room temperature. Samples were analyzed in an air-dried state and saturated with ethylene glycol overnight at 70°C (EG) using the Philips PW 1710 diffractometer (Philips, Netherland) (CuKα radiation, 35 kV, 20 mA, step size 0.2°, 1s per step; measured interval was 2–50° 2Θ). The Bertaut-Warren-Averbach (BWA) technique and MudMaster program for calculating mean crystallite thickness (TMEAN) and thickness distribution from the shapes of X-ray diffraction peaks according to Eberl et al. (1996), Drits et al. (1998) and Eberl (2003) were applied. The interference functions were extracted from patterns by dividing the intensity by the Lorentz-polarization and layer structure factors
(Drits et al. 1998). For the bulk chemical analysis an aliquot of each sample was dried overnight at 105°C, ground in a motorized agate mortar to a grain size of < 50 µm, weighed, and digested in a microwave
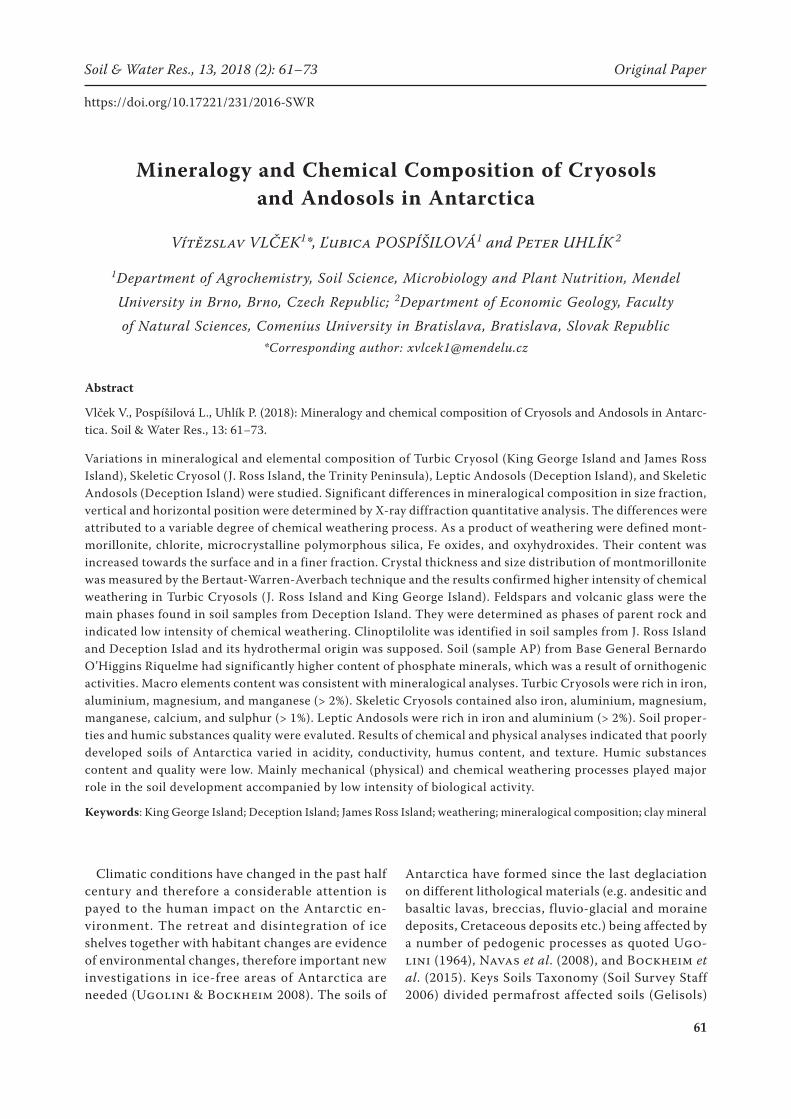
Figure 1. Geographical location of soil sampling; top row, from left to right: detail of Graham Land with islands (source: Zdeněk Stachoň, Masaryk University), detail of James Ross Island (source Czech Geological Survey 2009); bottom row, from left to right: Deception Island and King George Island (source: Google maps) (for more information see Table 1)
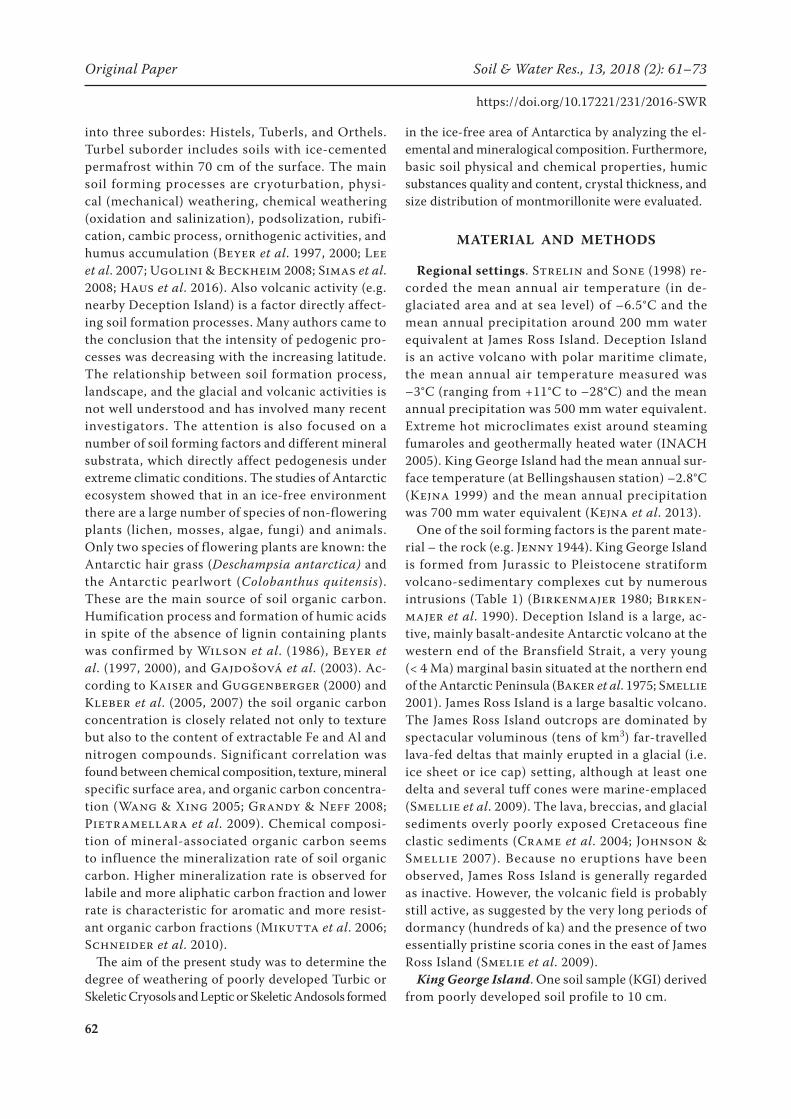
Figure 2. Soil profile JRI 6 (samples JRI 6a, b, c) on James Ross Island and on Deception Island (sample DI 4) (from left to right)
65
Soil & Water Res., 13, 2018 (2): 61–73 Original Paper
https://doi.org/10.17221/231/2016-SWR
in an aqua regia solution. The solution was filtrated and analyzed by flame AAS (AAS Vario 6, Analytic Jena, Germany) for Fe. Macro elements content was determined by the Inductively Coupled Plasma Mass Spectrometry (ICP-MS) analysis at Bureau Veritas Commodities Canada Ltd.
RESULTS AND DISCUSSION
Pedological and geochemical characterization. The studied soil profiles in Antarctica ice-free areas were poorly developed (57 cm maximum depth). Soils were mainly sandy loam (9 samples: JRI 1a, JRI 2, JRI 3, JRI 4, JRI 5c, JRI 6a, JRI 7, DI 1, KGI); loamy sand (3 samples: JRI 6c, DI 2, DI 4); loam (2 samples: JRI 1b and JRI 5a); and silt loam (2 samples: JRI 5b and JRI 6b) textured (Table 2). In the soil profiles JRI 5 and 6 the clay fraction has a maximum at a depth close to 10 cm; silt particles have a maximum at a depth 15–30 cm, and sand particles have two maxima: at the first subsurface horizon (because of stone pavement and selective wind and water ero-sion of fine fractions – Oh & Richter 2005; Bauer & Velde 2014) and deeper than 35 cm (because of weathering decreasing).
The studied soil samples varied in active soil reaction (3.6–7.9) and exchangeable soil reaction
(3.1–6.7). More acid were Turbic Cryosols JRI 5 and JRI 6 from James Ross Island mainly at deeper layers (Table 2, samples JRI 5c, JRI 6b, and JRI 6c). The electric conductivity (EC) of part of the studied samples showed similar values (100–200 µS/cm; Ta-ble 2) as published by Navas et al. (2008) and Haus et al. (2016). Some samples from James Ross Island, however, presented 10-times higher values (Table 2). High EC (in samples with very low pH) can result by different ionic species in the soil solution. Ion H+ is the ion with the highest equivalent ionic conduct-ance having (to low pH) the highest contribution to EC. We expected that low pH and high EC were caused precisely due to the high concentration of H+ ions but the absence of water soluble salts. EC was very low in Andosols (samples DI) as well as in the Turbic Cryosol formed from Tertiary andesitic and basaltic lavas (sample KGI, Table 2).
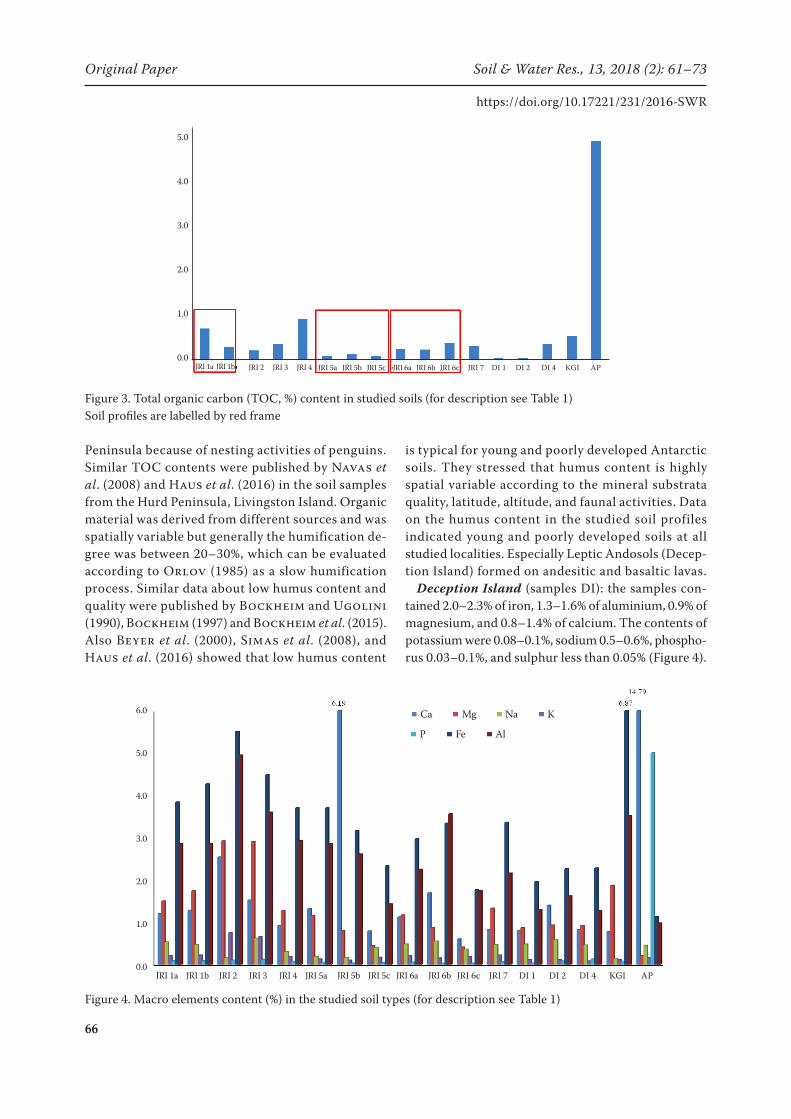
Total organic carbon (TOC) content in all samples was very low except the sample from the Trinity Peninsula (sample AP; Figure 3). The lowest values of TOC were in the samples from Deception Island (0.04%), TOC ranged from 0.09 to 0.92% at James Ross Island, decreased with depth ( JRI 1), or was relatively stable in two other profiles (JRI 5, JRI 6; Table 2) (Pospíšilová et al. 2017). The highest value of TOC (4.94%) was in the sample from the Trinity
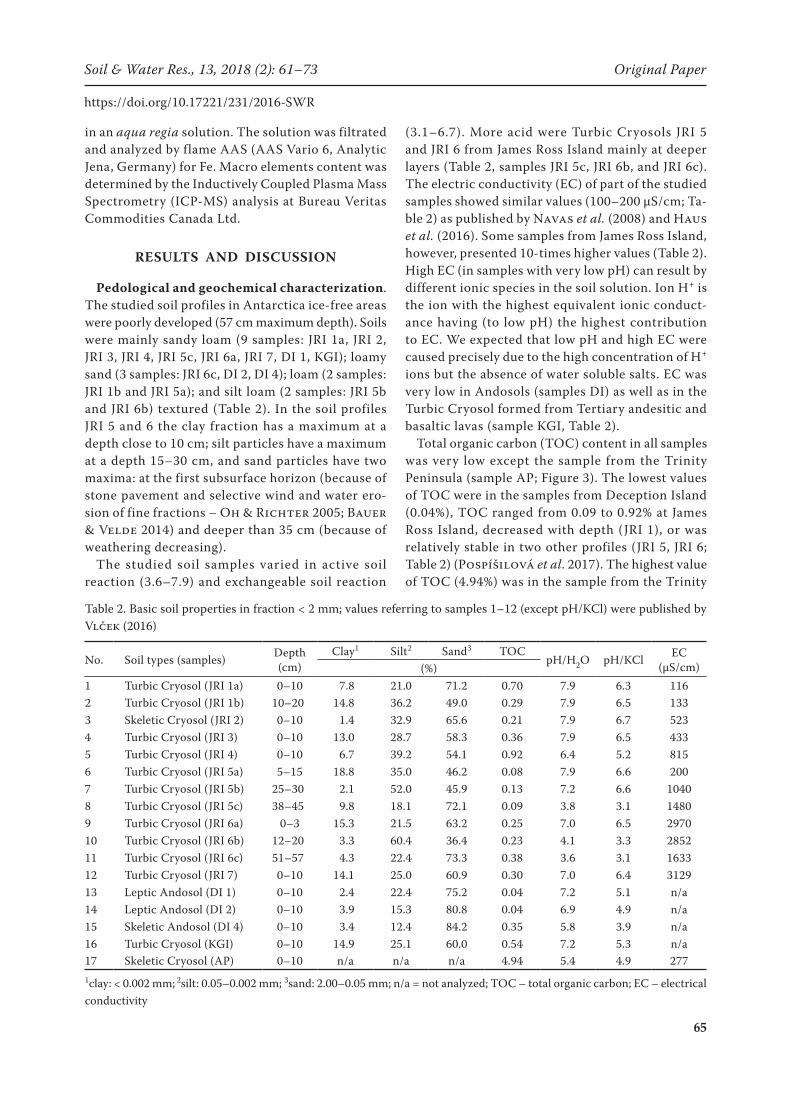
Table 2. Basic soil properties in fraction < 2 mm; values referring to samples 1–12 (except pH/KCl) were published by Vlček (2016)
No. Soil types (samples) Depth(cm)
Clay1 Silt2 Sand3 TOCpH/H2O pH/KCl EC
(µS/cm)(%)1 Turbic Cryosol (JRI 1a) 0–10 7.8 21.0 71.2 0.70 7.9 6.3 1162 Turbic Cryosol (JRI 1b) 10–20 14.8 36.2 49.0 0.29 7.9 6.5 1333 Skeletic Cryosol (JRI 2) 0–10 1.4 32.9 65.6 0.21 7.9 6.7 5234 Turbic Cryosol (JRI 3) 0–10 13.0 28.7 58.3 0.36 7.9 6.5 4335 Turbic Cryosol (JRI 4) 0–10 6.7 39.2 54.1 0.92 6.4 5.2 8156 Turbic Cryosol (JRI 5a) 5–15 18.8 35.0 46.2 0.08 7.9 6.6 2007 Turbic Cryosol (JRI 5b) 25–30 2.1 52.0 45.9 0.13 7.2 6.6 10408 Turbic Cryosol (JRI 5c) 38–45 9.8 18.1 72.1 0.09 3.8 3.1 14809 Turbic Cryosol (JRI 6a) 0–3 15.3 21.5 63.2 0.25 7.0 6.5 297010 Turbic Cryosol (JRI 6b) 12–20 3.3 60.4 36.4 0.23 4.1 3.3 285211 Turbic Cryosol (JRI 6c) 51–57 4.3 22.4 73.3 0.38 3.6 3.1 163312 Turbic Cryosol (JRI 7) 0–10 14.1 25.0 60.9 0.30 7.0 6.4 312913 Leptic Andosol (DI 1) 0–10 2.4 22.4 75.2 0.04 7.2 5.1 n/a14 Leptic Andosol (DI 2) 0–10 3.9 15.3 80.8 0.04 6.9 4.9 n/a15 Skeletic Andosol (DI 4) 0–10 3.4 12.4 84.2 0.35 5.8 3.9 n/a16 Turbic Cryosol (KGI) 0–10 14.9 25.1 60.0 0.54 7.2 5.3 n/a17 Skeletic Cryosol (AP) 0–10 n/a n/a n/a 4.94 5.4 4.9 2771clay: < 0.002 mm; 2silt: 0.05–0.002 mm; 3sand: 2.00–0.05 mm; n/a = not analyzed; TOC – total organic carbon; EC – electrical conductivity
66
Original Paper Soil & Water Res., 13, 2018 (2): 61–73
https://doi.org/10.17221/231/2016-SWR
Peninsula because of nesting activities of penguins. Similar TOC contents were published by Navas et al. (2008) and Haus et al. (2016) in the soil samples from the Hurd Peninsula, Livingston Island. Organic material was derived from different sources and was spatially variable but generally the humification de-gree was between 20–30%, which can be evaluated according to Orlov (1985) as a slow humification process. Similar data about low humus content and quality were published by Bockheim and Ugolini (1990), Bockheim (1997) and Bockheim et al. (2015). Also Beyer et al. (2000), Simas et al. (2008), and Haus et al. (2016) showed that low humus content
is typical for young and poorly developed Antarctic soils. They stressed that humus content is highly spatial variable according to the mineral substrata quality, latitude, altitude, and faunal activities. Data on the humus content in the studied soil profiles indicated young and poorly developed soils at all studied localities. Especially Leptic Andosols (Decep-tion Island) formed on andesitic and basaltic lavas.
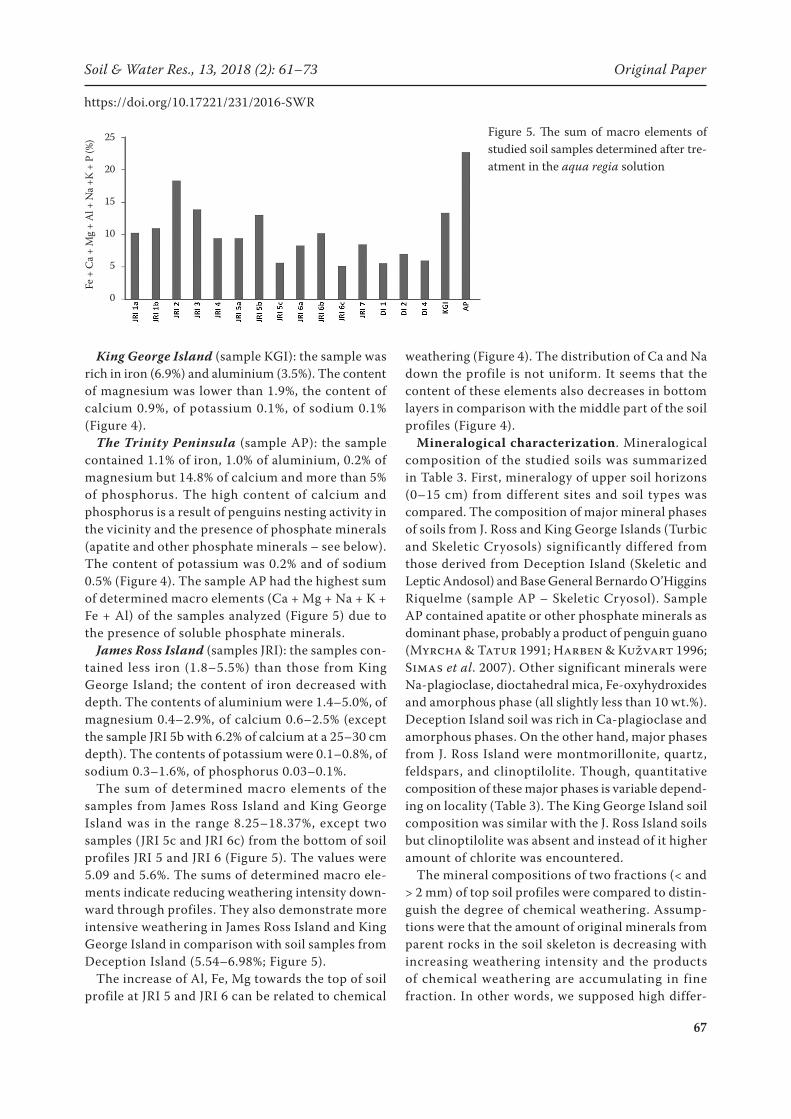
Deception Island (samples DI): the samples con-tained 2.0–2.3% of iron, 1.3–1.6% of aluminium, 0.9% of magnesium, and 0.8–1.4% of calcium. The contents of potassium were 0.08–0.1%, sodium 0.5–0.6%, phospho-rus 0.03–0.1%, and sulphur less than 0.05% (Figure 4).
Figure 3. Total organic carbon (TOC, %) content in studied soils (for description see Table 1)Soil profiles are labelled by red frame
Figure 4. Macro elements content (%) in the studied soil types (for description see Table 1)
JRI 1a JRI 1b JRI 2 JRI 3 JRI 4 JRI 7 DI 1 DI 2 DI 4 KGI APJRI 6a JRI 6b JRI 6cJRI 5a JRI 5b JRI 5c
5.0
4.0
3.0
2.0
1.0
0.0
JRI 1a JRI 1b JRI 2 JRI 3 JRI 4 JRI 5a JRI 5b JRI 5c JRI 6a JRI 6b JRI 6c JRI 7 DI 1 DI 2 DI 4 KGI AP
6.0
5.0
4.0
3.0
2.0
1.0
0.0
Ca Mg Na K
P Fe Al
67
Soil & Water Res., 13, 2018 (2): 61–73 Original Paper
https://doi.org/10.17221/231/2016-SWR
King George Island (sample KGI): the sample was rich in iron (6.9%) and aluminium (3.5%). The content of magnesium was lower than 1.9%, the content of calcium 0.9%, of potassium 0.1%, of sodium 0.1% (Figure 4).
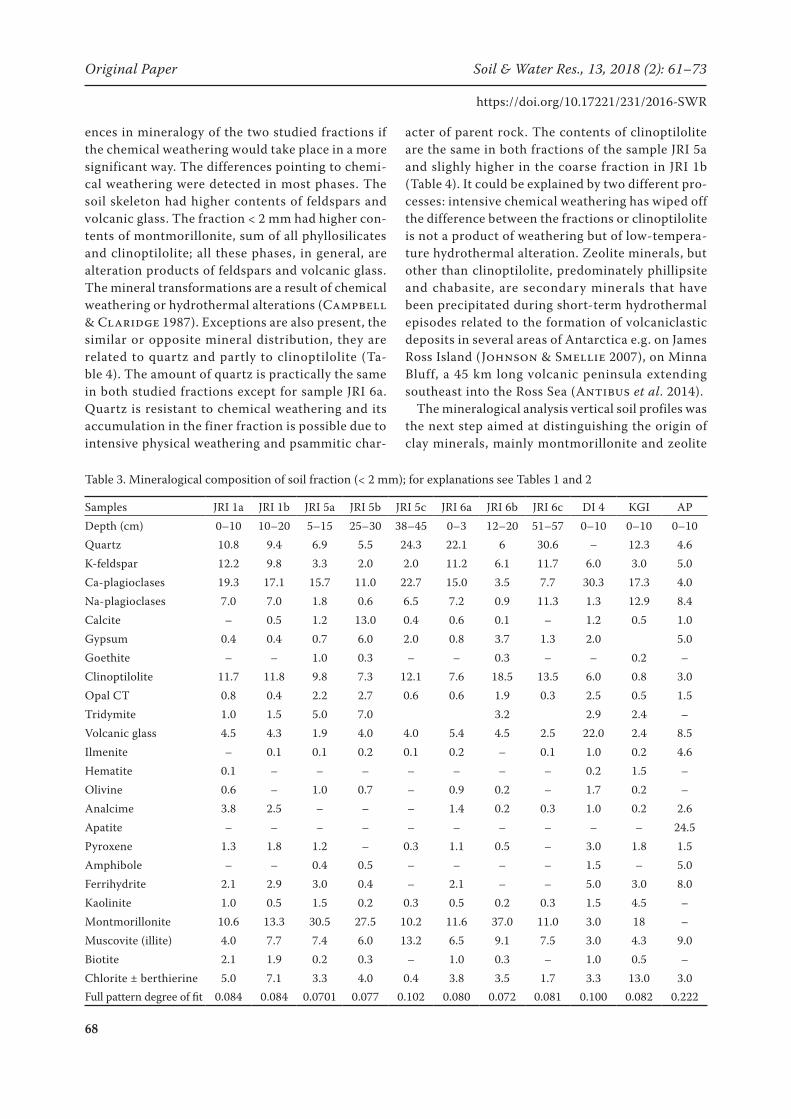
The Trinity Peninsula (sample AP): the sample contained 1.1% of iron, 1.0% of aluminium, 0.2% of magnesium but 14.8% of calcium and more than 5% of phosphorus. The high content of calcium and phosphorus is a result of penguins nesting activity in the vicinity and the presence of phosphate minerals (apatite and other phosphate minerals – see below). The content of potassium was 0.2% and of sodium 0.5% (Figure 4). The sample AP had the highest sum of determined macro elements (Ca + Mg + Na + K + Fe + Al) of the samples analyzed (Figure 5) due to the presence of soluble phosphate minerals.
James Ross Island (samples JRI): the samples con-tained less iron (1.8–5.5%) than those from King George Island; the content of iron decreased with depth. The contents of aluminium were 1.4–5.0%, of magnesium 0.4–2.9%, of calcium 0.6–2.5% (except the sample JRI 5b with 6.2% of calcium at a 25–30 cm depth). The contents of potassium were 0.1–0.8%, of sodium 0.3–1.6%, of phosphorus 0.03–0.1%.
The sum of determined macro elements of the samples from James Ross Island and King George Island was in the range 8.25–18.37%, except two samples (JRI 5c and JRI 6c) from the bottom of soil profiles JRI 5 and JRI 6 (Figure 5). The values were 5.09 and 5.6%. The sums of determined macro ele-ments indicate reducing weathering intensity down-ward through profiles. They also demonstrate more intensive weathering in James Ross Island and King George Island in comparison with soil samples from Deception Island (5.54–6.98%; Figure 5).
The increase of Al, Fe, Mg towards the top of soil profile at JRI 5 and JRI 6 can be related to chemical
weathering (Figure 4). The distribution of Ca and Na down the profile is not uniform. It seems that the content of these elements also decreases in bottom layers in comparison with the middle part of the soil profiles (Figure 4).
Mineralogical characterization. Mineralogical composition of the studied soils was summarized in Table 3. First, mineralogy of upper soil horizons (0–15 cm) from different sites and soil types was compared. The composition of major mineral phases of soils from J. Ross and King George Islands (Turbic and Skeletic Cryosols) significantly differed from those derived from Deception Island (Skeletic and Leptic Andosol) and Base General Bernardo O’Higgins Riquelme (sample AP – Skeletic Cryosol). Sample AP contained apatite or other phosphate minerals as dominant phase, probably a product of penguin guano (Myrcha & Tatur 1991; Harben & Kužvart 1996; Simas et al. 2007). Other significant minerals were Na-plagioclase, dioctahedral mica, Fe-oxyhydroxides and amorphous phase (all slightly less than 10 wt.%). Deception Island soil was rich in Ca-plagioclase and amorphous phases. On the other hand, major phases from J. Ross Island were montmorillonite, quartz, feldspars, and clinoptilolite. Though, quantitative composition of these major phases is variable depend-ing on locality (Table 3). The King George Island soil composition was similar with the J. Ross Island soils but clinoptilolite was absent and instead of it higher amount of chlorite was encountered.
The mineral compositions of two fractions (< and > 2 mm) of top soil profiles were compared to distin-guish the degree of chemical weathering. Assump-tions were that the amount of original minerals from parent rocks in the soil skeleton is decreasing with increasing weathering intensity and the products of chemical weathering are accumulating in fine fraction. In other words, we supposed high differ-
Figure 5. The sum of macro elements of studied soil samples determined after tre-atment in the aqua regia solution
Fe +
Ca +
Mg
+ A
l + N
a +K
+ P
(%) 25
20
15
10
5
0
68
Original Paper Soil & Water Res., 13, 2018 (2): 61–73
https://doi.org/10.17221/231/2016-SWR
ences in mineralogy of the two studied fractions if the chemical weathering would take place in a more significant way. The differences pointing to chemi-cal weathering were detected in most phases. The soil skeleton had higher contents of feldspars and volcanic glass. The fraction < 2 mm had higher con-tents of montmorillonite, sum of all phyllosilicates and clinoptilolite; all these phases, in general, are alteration products of feldspars and volcanic glass. The mineral transformations are a result of chemical weathering or hydrothermal alterations (Campbell & Claridge 1987). Exceptions are also present, the similar or opposite mineral distribution, they are related to quartz and partly to clinoptilolite (Ta-ble 4). The amount of quartz is practically the same in both studied fractions except for sample JRI 6a. Quartz is resistant to chemical weathering and its accumulation in the finer fraction is possible due to intensive physical weathering and psammitic char-
acter of parent rock. The contents of clinoptilolite are the same in both fractions of the sample JRI 5a and slighly higher in the coarse fraction in JRI 1b (Table 4). It could be explained by two different pro-cesses: intensive chemical weathering has wiped off the difference between the fractions or clinoptilolite is not a product of weathering but of low-tempera-ture hydrothermal alteration. Zeolite minerals, but other than clinoptilolite, predominately phillipsite and chabasite, are secondary minerals that have been precipitated during short-term hydrothermal episodes related to the formation of volcaniclastic deposits in several areas of Antarctica e.g. on James Ross Island (Johnson & Smellie 2007), on Minna Bluff, a 45 km long volcanic peninsula extending southeast into the Ross Sea (Antibus et al. 2014).
The mineralogical analysis vertical soil profiles was the next step aimed at distinguishing the origin of clay minerals, mainly montmorillonite and zeolite
Table 3. Mineralogical composition of soil fraction (< 2 mm); for explanations see Tables 1 and 2
Samples JRI 1a JRI 1b JRI 5a JRI 5b JRI 5c JRI 6a JRI 6b JRI 6c DI 4 KGI APDepth (cm) 0–10 10–20 5–15 25–30 38–45 0–3 12–20 51–57 0–10 0–10 0–10Quartz 10.8 9.4 6.9 5.5 24.3 22.1 6 30.6 – 12.3 4.6K-feldspar 12.2 9.8 3.3 2.0 2.0 11.2 6.1 11.7 6.0 3.0 5.0Ca-plagioclases 19.3 17.1 15.7 11.0 22.7 15.0 3.5 7.7 30.3 17.3 4.0Na-plagioclases 7.0 7.0 1.8 0.6 6.5 7.2 0.9 11.3 1.3 12.9 8.4Calcite – 0.5 1.2 13.0 0.4 0.6 0.1 – 1.2 0.5 1.0Gypsum 0.4 0.4 0.7 6.0 2.0 0.8 3.7 1.3 2.0 5.0Goethite – – 1.0 0.3 – – 0.3 – – 0.2 –Clinoptilolite 11.7 11.8 9.8 7.3 12.1 7.6 18.5 13.5 6.0 0.8 3.0Opal CT 0.8 0.4 2.2 2.7 0.6 0.6 1.9 0.3 2.5 0.5 1.5Tridymite 1.0 1.5 5.0 7.0 3.2 2.9 2.4 –Volcanic glass 4.5 4.3 1.9 4.0 4.0 5.4 4.5 2.5 22.0 2.4 8.5Ilmenite – 0.1 0.1 0.2 0.1 0.2 – 0.1 1.0 0.2 4.6Hematite 0.1 – – – – – – – 0.2 1.5 –Olivine 0.6 – 1.0 0.7 – 0.9 0.2 – 1.7 0.2 –Analcime 3.8 2.5 – – – 1.4 0.2 0.3 1.0 0.2 2.6Apatite – – – – – – – – – – 24.5Pyroxene 1.3 1.8 1.2 – 0.3 1.1 0.5 – 3.0 1.8 1.5Amphibole – – 0.4 0.5 – – – – 1.5 – 5.0Ferrihydrite 2.1 2.9 3.0 0.4 – 2.1 – – 5.0 3.0 8.0Kaolinite 1.0 0.5 1.5 0.2 0.3 0.5 0.2 0.3 1.5 4.5 –Montmorillonite 10.6 13.3 30.5 27.5 10.2 11.6 37.0 11.0 3.0 18 –Muscovite (illite) 4.0 7.7 7.4 6.0 13.2 6.5 9.1 7.5 3.0 4.3 9.0Biotite 2.1 1.9 0.2 0.3 – 1.0 0.3 – 1.0 0.5 –Chlorite ± berthierine 5.0 7.1 3.3 4.0 0.4 3.8 3.5 1.7 3.3 13.0 3.0Full pattern degree of fit 0.084 0.084 0.0701 0.077 0.102 0.080 0.072 0.081 0.100 0.082 0.222
69
Soil & Water Res., 13, 2018 (2): 61–73 Original Paper
https://doi.org/10.17221/231/2016-SWR
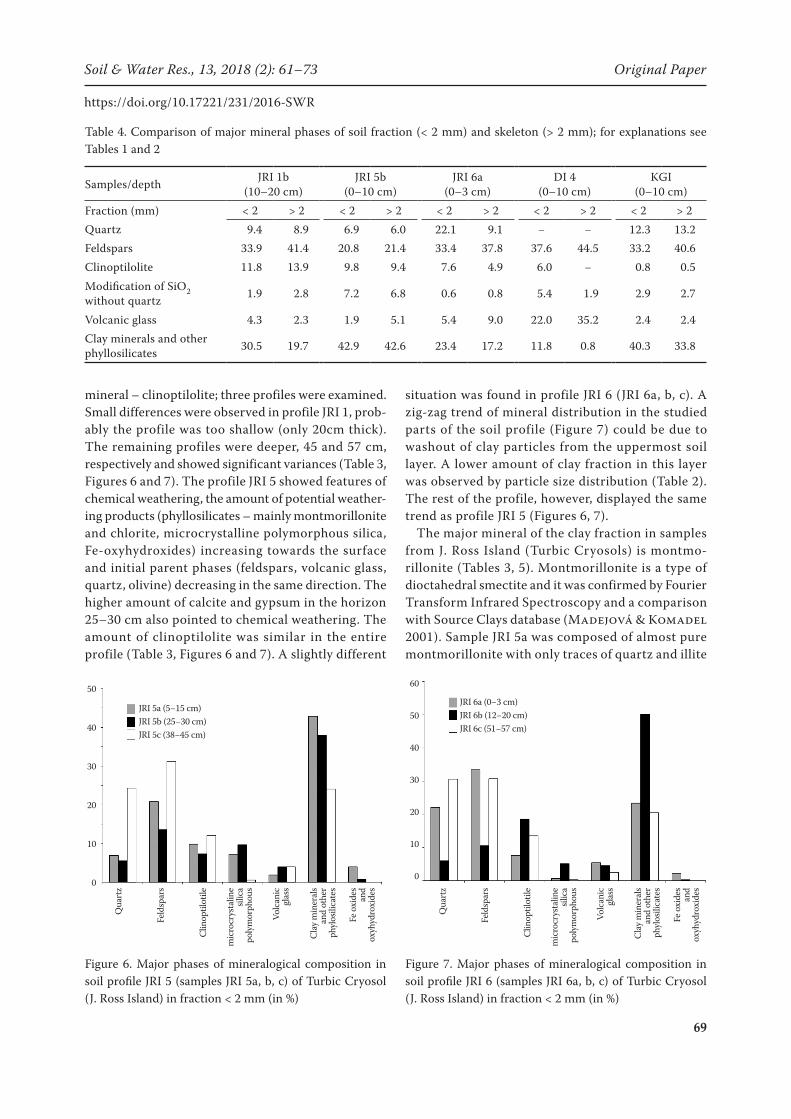
mineral – clinoptilolite; three profiles were examined. Small differences were observed in profile JRI 1, prob-ably the profile was too shallow (only 20cm thick). The remaining profiles were deeper, 45 and 57 cm, respectively and showed significant variances (Table 3, Figures 6 and 7). The profile JRI 5 showed features of chemical weathering, the amount of potential weather-ing products (phyllosilicates – mainly montmorillonite and chlorite, microcrystalline polymorphous silica, Fe-oxyhydroxides) increasing towards the surface and initial parent phases (feldspars, volcanic glass, quartz, olivine) decreasing in the same direction. The higher amount of calcite and gypsum in the horizon 25–30 cm also pointed to chemical weathering. The amount of clinoptilolite was similar in the entire profile (Table 3, Figures 6 and 7). A slightly different
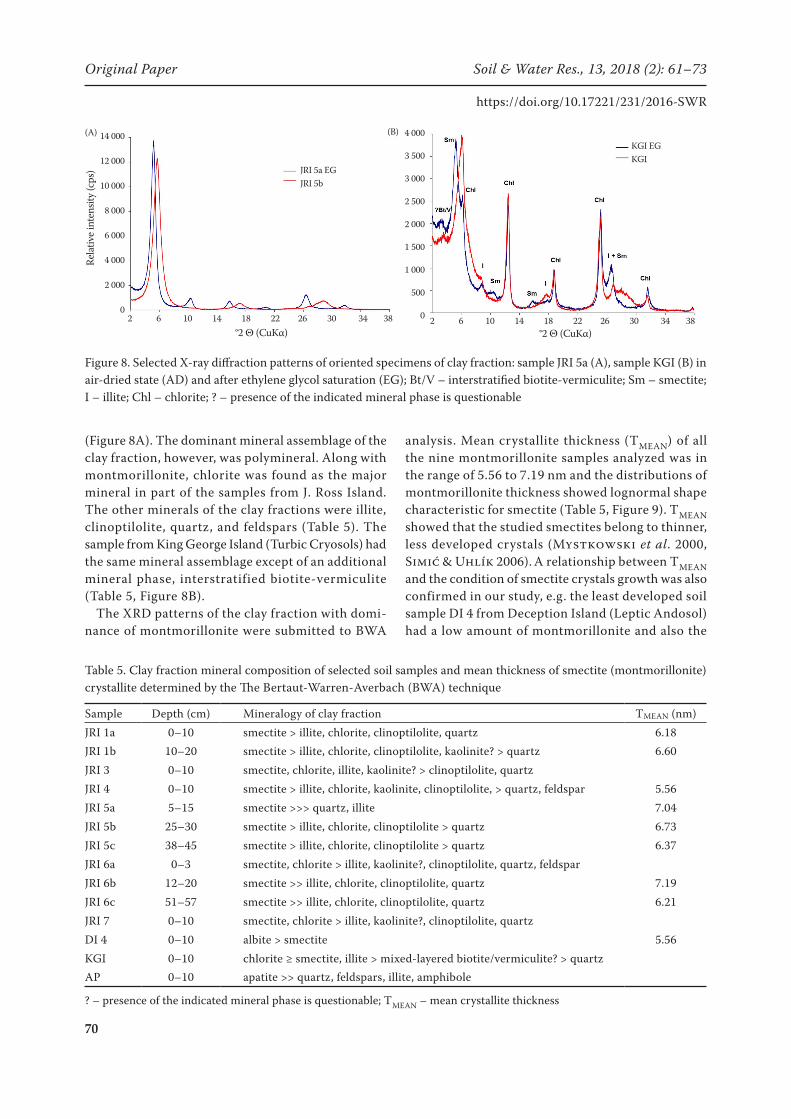
situation was found in profile JRI 6 (JRI 6a, b, c). A zig-zag trend of mineral distribution in the studied parts of the soil profile (Figure 7) could be due to washout of clay particles from the uppermost soil layer. A lower amount of clay fraction in this layer was observed by particle size distribution (Table 2). The rest of the profile, however, displayed the same trend as profile JRI 5 (Figures 6, 7).
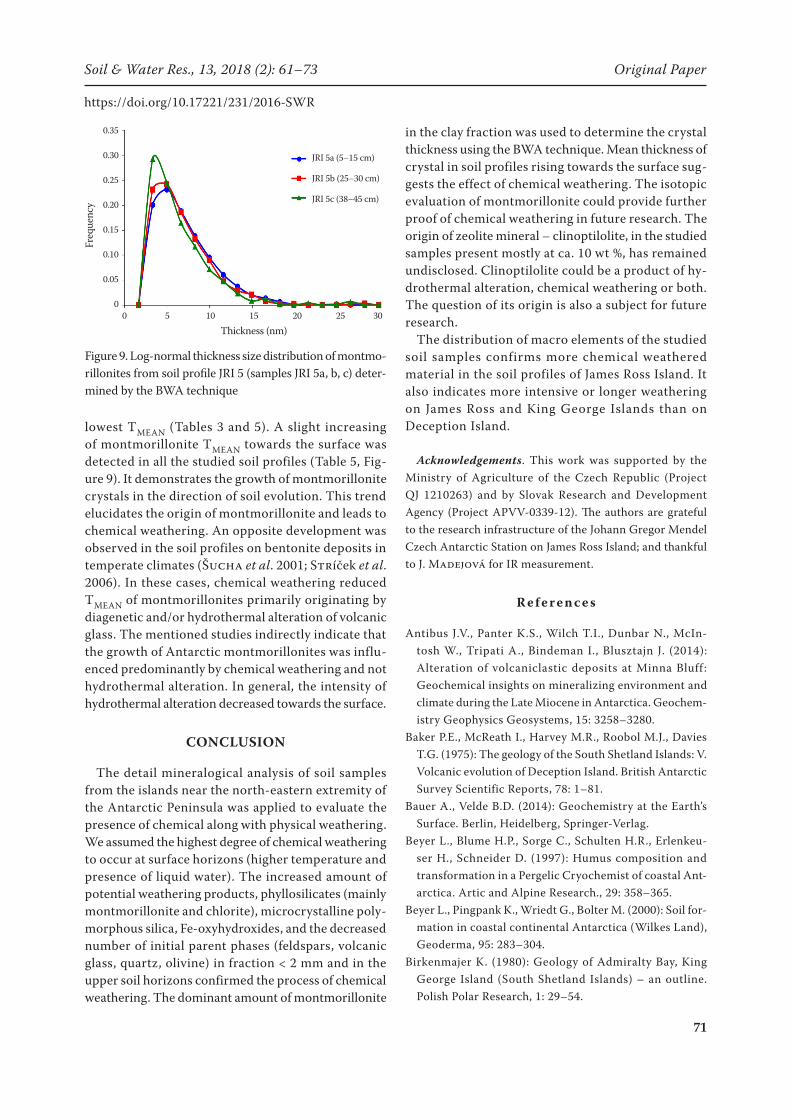
The major mineral of the clay fraction in samples from J. Ross Island (Turbic Cryosols) is montmo-rillonite (Tables 3, 5). Montmorillonite is a type of dioctahedral smectite and it was confirmed by Fourier Transform Infrared Spectroscopy and a comparison with Source Clays database (Madejová & Komadel 2001). Sample JRI 5a was composed of almost pure montmorillonite with only traces of quartz and illite
Table 4. Comparison of major mineral phases of soil fraction (< 2 mm) and skeleton (> 2 mm); for explanations see Tables 1 and 2
Samples/depth JRI 1b (10–20 cm)
JRI 5b (0–10 cm)
JRI 6a (0–3 cm)
DI 4 (0–10 cm)
KGI(0–10 cm)
Fraction (mm) < 2 > 2 < 2 > 2 < 2 > 2 < 2 > 2 < 2 > 2 Quartz 9.4 8.9 6.9 6.0 22.1 9.1 − − 12.3 13.2Feldspars 33.9 41.4 20.8 21.4 33.4 37.8 37.6 44.5 33.2 40.6Clinoptilolite 11.8 13.9 9.8 9.4 7.6 4.9 6.0 − 0.8 0.5Modification of SiO2 without quartz 1.9 2.8 7.2 6.8 0.6 0.8 5.4 1.9 2.9 2.7
Volcanic glass 4.3 2.3 1.9 5.1 5.4 9.0 22.0 35.2 2.4 2.4Clay minerals and other phyllosilicates 30.5 19.7 42.9 42.6 23.4 17.2 11.8 0.8 40.3 33.8
Figure 6. Major phases of mineralogical composition in soil profile JRI 5 (samples JRI 5a, b, c) of Turbic Cryosol (J. Ross Island) in fraction < 2 mm (in %)
Figure 7. Major phases of mineralogical composition in soil profile JRI 6 (samples JRI 6a, b, c) of Turbic Cryosol (J. Ross Island) in fraction < 2 mm (in %)
JRI 5a (5−15 cm)JRI 5b (25−30 cm)JRI 5c (38−45 cm)
50
40
30
20
10
0
Qua
rtz
Feld
spar
s
Clin
optil
otile
mic
rocr
ysta
line
silic
apo
lym
orph
ous
Volc
anic
glas
s
Cla
y min
eral
s an
d ot
her
phyl
osili
cate
s
Fe o
xide
san
dox
yhyd
roxi
des
Qua
rtz
Feld
spar
s
Clin
optil
otile
mic
rocr
ysta
line
silic
apo
lym
orph
ous
Volc
anic
glas
s
Cla
y min
eral
s an
d ot
her
phyl
osili
cate
s
Fe o
xide
san
dox
yhyd
roxi
des
60
50
40
30
20
10
0
JRI 6a (0−3 cm)JRI 6b (12−20 cm)JRI 6c (51−57 cm)
70
Original Paper Soil & Water Res., 13, 2018 (2): 61–73
https://doi.org/10.17221/231/2016-SWR
(Figure 8A). The dominant mineral assemblage of the clay fraction, however, was polymineral. Along with montmorillonite, chlorite was found as the major mineral in part of the samples from J. Ross Island. The other minerals of the clay fractions were illite, clinoptilolite, quartz, and feldspars (Table 5). The sample from King George Island (Turbic Cryosols) had the same mineral assemblage except of an additional mineral phase, interstratified biotite-vermiculite (Table 5, Figure 8B).
The XRD patterns of the clay fraction with domi-nance of montmorillonite were submitted to BWA
analysis. Mean crystallite thickness (TMEAN) of all the nine montmorillonite samples analyzed was in the range of 5.56 to 7.19 nm and the distributions of montmorillonite thickness showed lognormal shape characteristic for smectite (Table 5, Figure 9). TMEAN showed that the studied smectites belong to thinner, less developed crystals (Mystkowski et al. 2000, Simić & Uhlík 2006). A relationship between TMEAN and the condition of smectite crystals growth was also confirmed in our study, e.g. the least developed soil sample DI 4 from Deception Island (Leptic Andosol) had a low amount of montmorillonite and also the
Figure 8. Selected X-ray diffraction patterns of oriented specimens of clay fraction: sample JRI 5a (A), sample KGI (B) in air-dried state (AD) and after ethylene glycol saturation (EG); Bt/V – interstratified biotite-vermiculite; Sm – smectite; I – illite; Chl – chlorite; ? – presence of the indicated mineral phase is questionable
Table 5. Clay fraction mineral composition of selected soil samples and mean thickness of smectite (montmorillonite) crystallite determined by the The Bertaut-Warren-Averbach (BWA) technique
Sample Depth (cm) Mineralogy of clay fraction TMEAN (nm)JRI 1a 0–10 smectite > illite, chlorite, clinoptilolite, quartz 6.18JRI 1b 10–20 smectite > illite, chlorite, clinoptilolite, kaolinite? > quartz 6.60JRI 3 0–10 smectite, chlorite, illite, kaolinite? > clinoptilolite, quartzJRI 4 0–10 smectite > illite, chlorite, kaolinite, clinoptilolite, > quartz, feldspar 5.56JRI 5a 5–15 smectite >>> quartz, illite 7.04JRI 5b 25–30 smectite > illite, chlorite, clinoptilolite > quartz 6.73JRI 5c 38–45 smectite > illite, chlorite, clinoptilolite > quartz 6.37JRI 6a 0–3 smectite, chlorite > illite, kaolinite?, clinoptilolite, quartz, feldsparJRI 6b 12–20 smectite >> illite, chlorite, clinoptilolite, quartz 7.19JRI 6c 51–57 smectite >> illite, chlorite, clinoptilolite, quartz 6.21JRI 7 0–10 smectite, chlorite > illite, kaolinite?, clinoptilolite, quartzDI 4 0–10 albite > smectite 5.56KGI 0–10 chlorite ≥ smectite, illite > mixed-layered biotite/vermiculite? > quartzAP 0–10 apatite >> quartz, feldspars, illite, amphibole
? – presence of the indicated mineral phase is questionable; TMEAN – mean crystallite thickness
14 000
12 000
10 000
8 000
6 000
4 000
2 000
0
(A)
Rela
tive i
nten
sity (
cps)
2 6 10 14 18 22 26 30 34 38°2 Θ (CuKα)
4 000
3 500
3 000
2 500
2 000
1 500
1 000
500
0
°2 Θ (CuKα)2 6 10 14 18 22 26 30 34 38
(B)
JRI 5a EGJRI 5b
KGI EGKGI
71
Soil & Water Res., 13, 2018 (2): 61–73 Original Paper
https://doi.org/10.17221/231/2016-SWR
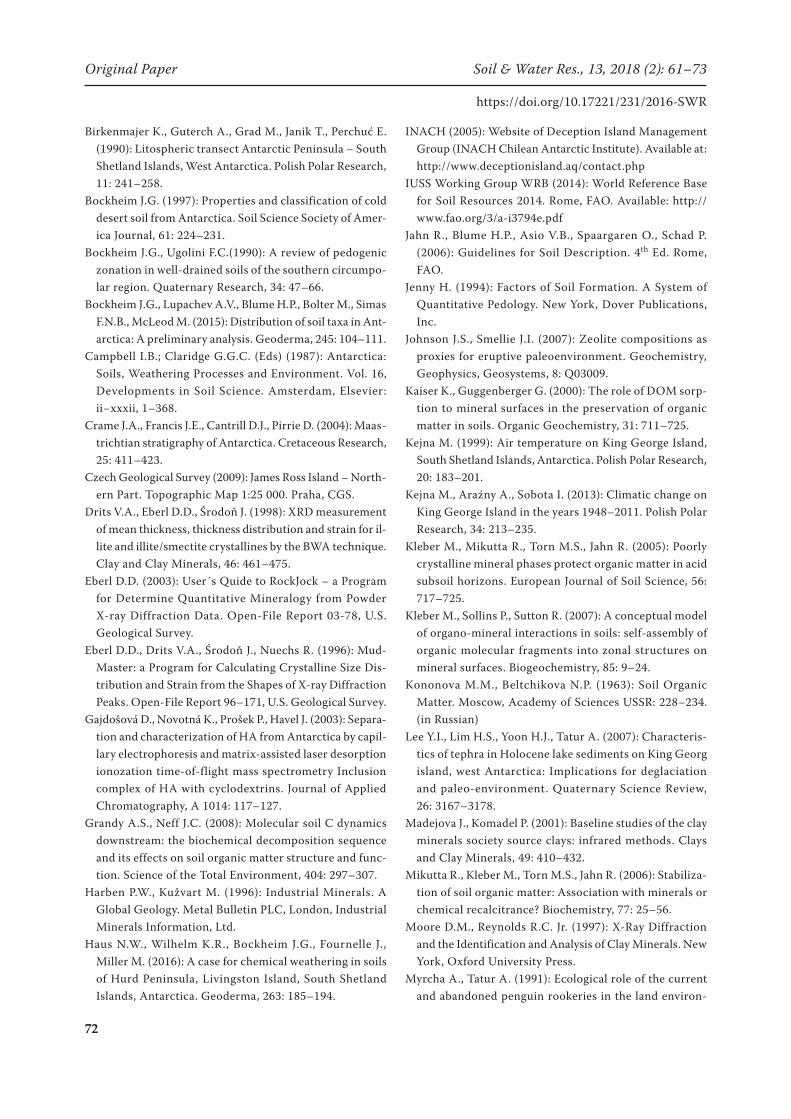
lowest TMEAN (Tables 3 and 5). A slight increasing of montmorillonite TMEAN towards the surface was detected in all the studied soil profiles (Table 5, Fig-ure 9). It demonstrates the growth of montmorillonite crystals in the direction of soil evolution. This trend elucidates the origin of montmorillonite and leads to chemical weathering. An opposite development was observed in the soil profiles on bentonite deposits in temperate climates (Šucha et al. 2001; Stríček et al. 2006). In these cases, chemical weathering reduced TMEAN of montmorillonites primarily originating by diagenetic and/or hydrothermal alteration of volcanic glass. The mentioned studies indirectly indicate that the growth of Antarctic montmorillonites was influ-enced predominantly by chemical weathering and not hydrothermal alteration. In general, the intensity of hydrothermal alteration decreased towards the surface.
CONCLUSION
The detail mineralogical analysis of soil samples from the islands near the north-eastern extremity of the Antarctic Peninsula was applied to evaluate the presence of chemical along with physical weathering. We assumed the highest degree of chemical weathering to occur at surface horizons (higher temperature and presence of liquid water). The increased amount of potential weathering products, phyllosilicates (mainly montmorillonite and chlorite), microcrystalline poly-morphous silica, Fe-oxyhydroxides, and the decreased number of initial parent phases (feldspars, volcanic glass, quartz, olivine) in fraction < 2 mm and in the upper soil horizons confirmed the process of chemical weathering. The dominant amount of montmorillonite
in the clay fraction was used to determine the crystal thickness using the BWA technique. Mean thickness of crystal in soil profiles rising towards the surface sug-gests the effect of chemical weathering. The isotopic evaluation of montmorillonite could provide further proof of chemical weathering in future research. The origin of zeolite mineral – clinoptilolite, in the studied samples present mostly at ca. 10 wt %, has remained undisclosed. Clinoptilolite could be a product of hy-drothermal alteration, chemical weathering or both. The question of its origin is also a subject for future research.
The distribution of macro elements of the studied soil samples confirms more chemical weathered material in the soil profiles of James Ross Island. It also indicates more intensive or longer weathering on James Ross and King George Islands than on Deception Island.
Acknowledgements. This work was supported by the Ministry of Agriculture of the Czech Republic (Project QJ 1210263) and by Slovak Research and Development Agency (Project APVV-0339-12). The authors are grateful to the research infrastructure of the Johann Gregor Mendel Czech Antarctic Station on James Ross Island; and thankful to J. Madejová for IR measurement.
R e f e r e n c e s
Antibus J.V., Panter K.S., Wilch T.I., Dunbar N., McIn-tosh W., Tripati A., Bindeman I., Blusztajn J. (2014): Alteration of volcaniclastic deposits at Minna Bluff : Geochemical insights on mineralizing environment and climate during the Late Miocene in Antarctica. Geochem-istry Geophysics Geosystems, 15: 3258–3280.
Baker P.E., McReath I., Harvey M.R., Roobol M.J., Davies T.G. (1975): The geology of the South Shetland Islands: V. Volcanic evolution of Deception Island. British Antarctic Survey Scientific Reports, 78: 1–81.
Bauer A., Velde B.D. (2014): Geochemistry at the Earth’s Surface. Berlin, Heidelberg, Springer-Verlag.
Beyer L., Blume H.P., Sorge C., Schulten H.R., Erlenkeu-ser H., Schneider D. (1997): Humus composition and transformation in a Pergelic Cryochemist of coastal Ant-arctica. Artic and Alpine Research., 29: 358–365.
Beyer L., Pingpank K., Wriedt G., Bolter M. (2000): Soil for-mation in coastal continental Antarctica (Wilkes Land), Geoderma, 95: 283–304.
Birkenmajer K. (1980): Geology of Admiralty Bay, King George Island (South Shetland Islands) – an outline. Polish Polar Research, 1: 29–54.
Figure 9. Log-normal thickness size distribution of montmo-rillonites from soil profile JRI 5 (samples JRI 5a, b, c) deter-mined by the BWA technique
0.35
0.30
0.25
0.20
0.15
0.10
0.05
0
Freq
uenc
y
0 5 10 15 20 25 30
Thickness (nm)
JRI 5a (5−15 cm)
JRI 5b (25−30 cm)
JRI 5c (38−45 cm)
72
Original Paper Soil & Water Res., 13, 2018 (2): 61–73
https://doi.org/10.17221/231/2016-SWR
Birkenmajer K., Guterch A., Grad M., Janik T., Perchuć E. (1990): Litospheric transect Antarctic Peninsula – South Shetland Islands, West Antarctica. Polish Polar Research, 11: 241–258.
Bockheim J.G. (1997): Properties and classification of cold desert soil from Antarctica. Soil Science Society of Amer-ica Journal, 61: 224–231.
Bockheim J.G., Ugolini F.C.(1990): A review of pedogenic zonation in well-drained soils of the southern circumpo-lar region. Quaternary Research, 34: 47–66.
Bockheim J.G., Lupachev A.V., Blume H.P., Bolter M., Simas F.N.B., McLeod M. (2015): Distribution of soil taxa in Ant-arctica: A preliminary analysis. Geoderma, 245: 104–111.
Campbell I.B.; Claridge G.G.C. (Eds) (1987): Antarctica: Soils, Weathering Processes and Environment. Vol. 16, Developments in Soil Science. Amsterdam, Elsevier: ii−xxxii, 1–368.
Crame J.A., Francis J.E., Cantrill D.J., Pirrie D. (2004): Maas-trichtian stratigraphy of Antarctica. Cretaceous Research, 25: 411–423.
Czech Geological Survey (2009): James Ross Island – North-ern Part. Topographic Map 1:25 000. Praha, CGS.
Drits V.A., Eberl D.D., Środoň J. (1998): XRD measurement of mean thickness, thickness distribution and strain for il-lite and illite/smectite crystallines by the BWA technique. Clay and Clay Minerals, 46: 461–475.
Eberl D.D. (2003): User´s Quide to RockJock – a Program for Determine Quantitative Mineralogy from Powder X-ray Diffraction Data. Open-File Report 03-78, U.S. Geological Survey.
Eberl D.D., Drits V.A., Środoň J., Nuechs R. (1996): Mud-Master: a Program for Calculating Crystalline Size Dis-tribution and Strain from the Shapes of X-ray Diffraction Peaks. Open-File Report 96–171, U.S. Geological Survey.
Gajdošová D., Novotná K., Prošek P., Havel J. (2003): Separa-tion and characterization of HA from Antarctica by capil-lary electrophoresis and matrix-assisted laser desorption ionozation time-of-flight mass spectrometry Inclusion complex of HA with cyclodextrins. Journal of Applied Chromatography, A 1014: 117–127.
Grandy A.S., Neff J.C. (2008): Molecular soil C dynamics downstream: the biochemical decomposition sequence and its effects on soil organic matter structure and func-tion. Science of the Total Environment, 404: 297–307.
Harben P.W., Kužvart M. (1996): Industrial Minerals. A Global Geology. Metal Bulletin PLC, London, Industrial Minerals Information, Ltd.
Haus N.W., Wilhelm K.R., Bockheim J.G., Fournelle J., Miller M. (2016): A case for chemical weathering in soils of Hurd Peninsula, Livingston Island, South Shetland Islands, Antarctica. Geoderma, 263: 185–194.
INACH (2005): Website of Deception Island Management Group (INACH Chilean Antarctic Institute). Available at: http://www.deceptionisland.aq/contact.php
IUSS Working Group WRB (2014): World Reference Base for Soil Resources 2014. Rome, FAO. Available: http://www.fao.org/3/a-i3794e.pdf
Jahn R., Blume H.P., Asio V.B., Spaargaren O., Schad P. (2006): Guidelines for Soil Description. 4th Ed. Rome, FAO.
Jenny H. (1994): Factors of Soil Formation. A System of Quantitative Pedology. New York, Dover Publications, Inc.
Johnson J.S., Smellie J.I. (2007): Zeolite compositions as proxies for eruptive paleoenvironment. Geochemistry, Geophysics, Geosystems, 8: Q03009.
Kaiser K., Guggenberger G. (2000): The role of DOM sorp-tion to mineral surfaces in the preservation of organic matter in soils. Organic Geochemistry, 31: 711–725.
Kejna M. (1999): Air temperature on King George Island, South Shetland Islands, Antarctica. Polish Polar Research, 20: 183–201.
Kejna M., Araźny A., Sobota I. (2013): Climatic change on King George Island in the years 1948–2011. Polish Polar Research, 34: 213–235.
Kleber M., Mikutta R., Torn M.S., Jahn R. (2005): Poorly crystalline mineral phases protect organic matter in acid subsoil horizons. European Journal of Soil Science, 56: 717–725.
Kleber M., Sollins P., Sutton R. (2007): A conceptual model of organo-mineral interactions in soils: self-assembly of organic molecular fragments into zonal structures on mineral surfaces. Biogeochemistry, 85: 9–24.
Kononova M.M., Beltchikova N.P. (1963): Soil Organic Matter. Moscow, Academy of Sciences USSR: 228–234. (in Russian)
Lee Y.I., Lim H.S., Yoon H.J., Tatur A. (2007): Characteris-tics of tephra in Holocene lake sediments on King Georg island, west Antarctica: Implications for deglaciation and paleo-environment. Quaternary Science Review, 26: 3167–3178.
Madejova J., Komadel P. (2001): Baseline studies of the clay minerals society source clays: infrared methods. Clays and Clay Minerals, 49: 410–432.
Mikutta R., Kleber M., Torn M.S., Jahn R. (2006): Stabiliza-tion of soil organic matter: Association with minerals or chemical recalcitrance? Biochemistry, 77: 25–56.
Moore D.M., Reynolds R.C. Jr. (1997): X-Ray Diffraction and the Identification and Analysis of Clay Minerals. New York, Oxford University Press.
Myrcha A., Tatur A. (1991): Ecological role of the current and abandoned penguin rookeries in the land environ-
73
Soil & Water Res., 13, 2018 (2): 61–73 Original Paper
https://doi.org/10.17221/231/2016-SWR
ment of the maritime Antarctic. Polish Polar Research, 12: 3–24.
Mystkowski K., Srodon, J., Elsass F. (2000): Mean thickness and thickness distribution of smectite crystallites. Clay Minerals, 35: 545–557.
Navas A., Martinez J.L., Casas J., Machin J., Durán J.J., Ser-rano E., Cuchi J.A., Mink S. (2008): Soil characteristics on varying lithological substrates in the South Shetland Islands, maritime Antarctica. Geoderma, 144: 123–139.
Nelson D.W., Sommers L.E. (1982): Total carbon, organic carbon, and organic matter, In: Page A.L., Miller R.H., Keeney D.R. (eds): Methods of Soil Analysis. Part 2. 2nd Ed. Agronomy Monographs No. 9, Madison, ASA and SSSA: 539–579.
Oh N., Richter R. (2005): Elemental translocation and loss from three highly weathered soil bed-rock profiles in the south-eastern United States. Geoderma, 126: 5–25.
Orlov D.S. (1985): Soil Chemistry. Moskva, MGU. (in Rus-sian)
Pietramellara G., Ascher J., Borgogni F., Ceccherini M.T., Guerri G., Nannipieri P. (2009): Extracellular DNA in soil and sediments: fate and ecological relevance. Biology and Fertility of Soils, 45: 219–235.
Pospíšilová L., Vlček V., Hybler V., Uhlik P. (2017): Carbon content and macroelements content in Cryosols. Humic Substances Research. (in print)
Schneider I., Kniker H., Kogel-Knabner I. (2010): Intimate association between O/N-alkyl carbon and iron oxidex in clay fractions of forest soils. Organic Geochemistry, 36: 1378–1390.
Simas F.N.B., Schaefer C.G.R., Melo V.F., Albuquerque-Filho M.R., Michel R.F.M., Pereira V.V., Gomes M.R.M., da Costa L.M. (2007): Ornithogenic cryosols from maritime Antarctica: phosphatization as a soil forming process. Geoderma, 138: 191–203.
Simas F.N.B, Schaeffer C.E.G.R., Filho M.R.A., Francelino M.R., Filho E.I.F., da Costa L.M. (2008): Genesis, proper-ties and classification of Cryosols from Admiralty Bay, maritime Antarctica. Geoderma, 144: 116–122.
Simic V., Uhlík P. (2006): Crystallite size distribution of clay minerals from selected Serbian clay deposits. Geološki anali Balkanskoga poluostrova, 67: 109–116.
Smellie J.L. (2001): Lithostratigraphy and volcanic evolution of Deception Island, South Shetland Islands. Antarctic Science, 13: 188–209.
Smellie J.L., Haywood A.M., Hillenbrand C.D., Lunt D.J., Valdes P.J. (2009): Nature of the Antarctic Peninsula ice sheet during the Pliocene: geological evidence and model-ling results compared. Earth-Science Reviews, 94: 79–94.
Soil Survey Staff (2006): Keys to Soil Taxonomy. 10th Ed. Washington, USDA.
Strelin J.A., Sone T. (1998): Rock glaciers on James Ross Island, Antarctica. In: Proc. 7th Int. Permafrost Conf. PERMAFROST, Yellowknife, Jan 1998. Collection Nor-dicana No. 55.
Stríček I., Šucha V., Uhlík P., Madejová J. (2006): Weather-ing of smectite on bentonite deposits. Mineralia Slovaca, 38: 337–342.
Środoň J., Drits V.A., McCarty D.K., Hsieh J.C.C., Eberl D.D. (2001): Quantitative X-ray diffraction analysis of clay-bearing rocks from random preparations. Clay and Clay Minerals, 49: 514–528.
ŠuchaV., Środoń J., ZatkalíkováV., Franců J. (1991): Mixed layered illite/smectite: separation, identification, use. Mineralia Slovaca, 23: 267–274. (in Slovak, with English Abstracts)
Šucha V., Srodon J., Clauer N., Elsass F., Eberl D.D., Kraus I., Madejova J. (2001): Weathering of smectite and illite-smectite under temperate climatic conditions. Clay min-erals, 36: 403–419.
Ugolini F.C. (1964): Soils of Mount Erebus, Antarctica. New Zealand Journal of Geology and Geophysics, 10: 431–442.
Ugolini F.C, Bockheim J.G. (2008): Antarctic soils and soil formation in a changing environment: A review. Geo-derma, 144: 1–8.
Vlček V. (2016): Evaluation of selected basic soil properties at the James Ross Island (Antarctica). Acta Universitatis Agriculturae et Silviculturae Mendelianae Brunensis, 64: 919–926.
Wang X., Xing B. (2005): Structural and sorption character-istics of adsorbed humic acids on clay minerals. Journal of Environmental Quality, 34: 342–349.
Wilson M.A.K.M., Colin P.J., Greenfield I.G. (1986): Origins of humus variantions. Organic Geochemistry, 9: 225–231.
Received for publication November 23, 2016Accepted after corrections September 6, 2017
Published online September 27, 2017


