Embed Size (px)
Citation preview
Proceedings of the International Conference on 'Cities, People and Places'- ICCPP-2014
October 31th – November 02nd, 2014, Colombo, Sri Lanka
1
The Effect of Street Canyon Geometry on Outdoor Thermal Comfort in Colombo
N G R Perera & W M S B Weerasekara Department of Architecture, University of Moratuwa, Sri Lanka. [email protected]
Abstract
Although life in the equatorial tropics is largely an outdoor phenomenon, modern urban development has by and large failed to facilitate such living in a climatically pleasant manner. The approach then, should be an attempt to make the equatorial urban outdoors thermally comfortable. (Emmanuel, 1993) The primary approach to the research is to quantify and compare the thermal comfort implications of critical canyon geometry in warm humid Colombo. It explores street canyons that are currently existing as well as projected under the Sri Lanka, Urban Development Authority Development (UDA) Plan for 2020. Thus, the task is twofold; to report on the thermal comfort effects of the most widespread urban canyons in the city, and secondly to project the change that will occur with the growth of Colombo's built fabric, therefore canyon geometry. The urban fabric simplified using the Local Climate Zone (LCZ) system and surveyed shows the most predominant street canyons are;
LCZ3 - LCZ3 (Compact Low-rise- Compact Low-rise (North-South)
LCZ3 - LCZ8 (Compact Low-rise- Large Low-rise (East-West)
LCZ2 - LCZ2(Compact Mid-rise- Compact Mid-rise (East-West)
LCZ2 - LCZ3 Compact Mid-rise- Compact Low-rise (East-West) Simulation of existing and projected growth using ENVI-met establish that, the H:W ratio has a positive relationship in improving thermal comfort, while an increase SVF has the opposite effect. The study utilises the thermal comfort indices Predicted Mean Vote (PMV) and Mean Radiant Temperature (MRT) to communicate the results. The research indicates that thermal comfort cannot be achieved within the existing and projected urban canyons, for the peak time of the day. Therefore, future urban design strategies that transcend canyon geometry needs to be explored. Keywords: Outdoor Thermal Comfort / Urban Heat Island (UHI)/ Urban Morphology/ / Sky View Factor (SVF) / Height to Width Ratio
Proceedings of the International Conference on 'Cities, People and Places'- ICCPP-2014
October 31th – November 02nd, 2014, Colombo, Sri Lanka
2
Introduction
Outdoor open spaces and streets in particular are an integral part of healthy city life. A comfortable thermal environment is vital in creating the proper stage for social activities that people partake in, especially on a routine basis. The deeper understanding of the microclimate of these outdoor spaces and with it the characteristics of outdoor thermal comfort is essential in establishing the proper background for climate sensitive urban design. The urban canyon, which is a simplified rectangular vertical profile of infinite length, has been widely adopted in urban climatology as the basic structural unit for describing a typical urban open space. (Ali-Toudert & Mayer, 2006) The research is a focus on the climate sensitive design of these canyons, with an emphasis on the design applicability of the results, in the context of warm humid Colombo, Sri Lanka.
Background ‘Urbanization’ is used to refer both to the movement of people into cities and to the transformation of ‘natural’ into urban land-cover. An urban land-cover consists of closely spaced buildings, impervious surfaces and managed outdoor spaces. Currently, just 2–3% of the earth’s ice-free land area corresponds to this definition – yet half of humanity resides in these areas, and it is here that human activity is concentrated. Currently, cities are the foci for the planetary flows of energy and materials, which are used to construct the physical city and sustain its functions (Decker et al., 2000). As a consequence, cities are directly and indirectly responsible for global changes in the atmosphere, hydrosphere, geosphere and biosphere. (Mills, 2007) The major anthropogenically induced urban temperature anomalies are manifested in the Urban Heat Island (UHI) effect, a microclimatic anomaly characterized by warmer nighttime temperatures in the core of a city compared to the surrounding rural environment. (R Emmanuel & Fernando, 2007) Urban Heat Island The UHI is directly linked to two of the most serious environmental issues of the twentieth century: population growth and climate change. (I. D. Stewart & Oke, 2012) Heat islands occur in almost all urban areas, large or small, in warm climates or cold. The traditionally described heat island is that which is measured at standard screen height (1–2 m above ground), below the city’s mean roof height in a thin section of the boundary layer atmosphere called the urban canopy layer. Air in this layer is typically warmer than that at screen height in the countryside. (I. D. Stewart & Oke, 2012) It is in this scale that the people using the urban outdoors, experience such microclimatic effects. Therefore, this becomes the focus of this study. The reasons behind the urban climate anomaly have been thoroughly examined in the last decades. The main reasons have been found to be urban geometry, i.e. the ratio between building height (H) and distance between buildings (W), as well as surface material properties. The nocturnal heat island increases with increased H/W ratio because nighttime cooling is hindered. (Johansson, Emmanuel, & Rosenlund, 2004)
Proceedings of the International Conference on 'Cities, People and Places'- ICCPP-2014
October 31th – November 02nd, 2014, Colombo, Sri Lanka
3
Thermal comfort in warm, humid outdoors Urban climate studies from the warm, humid region lag far behind those from the temperate zone (Roth, 2007). The practice of applying universal thermal comfort indices to analyse the thermal conditions in the tropics continues to be the norm. Studies specifically estimating the outdoor comfort conditions in the tropics are very rare. The few that exists confirm that warm, humid dwellers typically prefer higher temperatures and have greater tolerance to warming. One of the earliest such studies was conducted in Dhakka, Bangladesh (Ahmed, 2003). An outdoor temperature range of 27.5 – 32.5oC under calm conditions was considered ‘acceptable’ in Dhaka when the relative humidity ranged between 70-80%. The acceptable relative humidity range can be increased by adding ventilation into the mix. (Rohinton Emmanuel, 2011) Thermal comfort studies in Colombo, Sri Lanka Emmanuel, (1994) analysed historic trends in thermal comfort in the Sri Lankan primate city of Colombo and correlated them with land cover changes. He found that, 'an increasing trend in thermal discomfort – particularly at night – is seen especially at the suburban station and it correlates well with hard land cover changes. The relative importance of land cover in city centre vs. rural areas is clearly visible. Hard cover has more effect on thermal discomfort in city centre than in rural areas' (Rohinton Emmanuel, 2004) The study by Emmanuel et al., (2007) in Colombo, found that the lowest daytime mean radiant temperatures result from high H/W ratios of streets. 'This has a positive effect on thermal comfort; the increase of H/W ratio from about 1 to 3 leads to a decrease in PET by about 10 °C. Differences in air and surface temperatures, as well as PET, are small during the night. The results show that strategies that lead to better air temperature mitigation may not necessarily lead to better thermal comfort. However, shade enhancement through increased H/W ratios is clearly capable of significant reductions in PET, and thus, improved outdoor thermal comfort'. (R Emmanuel, Rosenlund, & Johansson, 2007)
Method The primary approach to the research is to quantify and compare the thermal comfort implications of critical canyon geometry in warm humid Colombo. It explores street canyons that are currently existing as well as projected under the Sri Lanka, Urban Development Authority Development (UDA) Plan for 2020. The most predominant canyons are further categorised according to the canyon orientation as a limitation to the scope of the study. Thus, the task is twofold; to report the thermal comfort effects of the most widespread urban canyons and to project the change in the degree of influence when Colombo develops. The adopted research process is approached under the following steps;
Survey- Establish predominant Urban Street Canyons in Colombo
Critical canyon selection and case study simulation matrix
ENVI-met simulation Survey- Establish predominant Urban Street Canyons in Colombo The initial task of the research was to establish a representative form of street canyons prevalent in Colombo.
Proceedings of the International Conference on 'Cities, People and Places'- ICCPP-2014
October 31th – November 02nd, 2014, Colombo, Sri Lanka
4
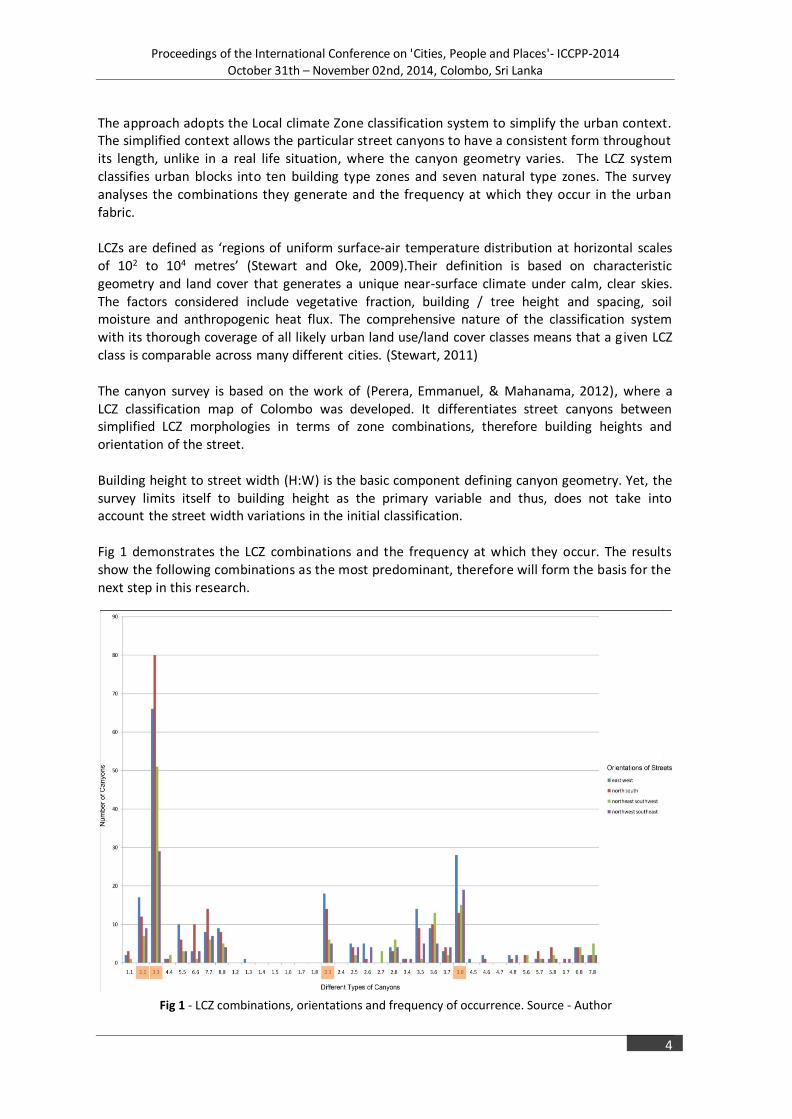
Fig 1 - LCZ combinations, orientations and frequency of occurrence. Source - Author
The approach adopts the Local climate Zone classification system to simplify the urban context. The simplified context allows the particular street canyons to have a consistent form throughout its length, unlike in a real life situation, where the canyon geometry varies. The LCZ system classifies urban blocks into ten building type zones and seven natural type zones. The survey analyses the combinations they generate and the frequency at which they occur in the urban fabric. LCZs are defined as ‘regions of uniform surface-air temperature distribution at horizontal scales of 102 to 104 metres’ (Stewart and Oke, 2009).Their definition is based on characteristic geometry and land cover that generates a unique near-surface climate under calm, clear skies. The factors considered include vegetative fraction, building / tree height and spacing, soil moisture and anthropogenic heat flux. The comprehensive nature of the classification system with its thorough coverage of all likely urban land use/land cover classes means that a given LCZ class is comparable across many different cities. (Stewart, 2011) The canyon survey is based on the work of (Perera, Emmanuel, & Mahanama, 2012), where a LCZ classification map of Colombo was developed. It differentiates street canyons between simplified LCZ morphologies in terms of zone combinations, therefore building heights and orientation of the street. Building height to street width (H:W) is the basic component defining canyon geometry. Yet, the survey limits itself to building height as the primary variable and thus, does not take into account the street width variations in the initial classification. Fig 1 demonstrates the LCZ combinations and the frequency at which they occur. The results show the following combinations as the most predominant, therefore will form the basis for the next step in this research.
Proceedings of the International Conference on 'Cities, People and Places'- ICCPP-2014
October 31th – November 02nd, 2014, Colombo, Sri Lanka
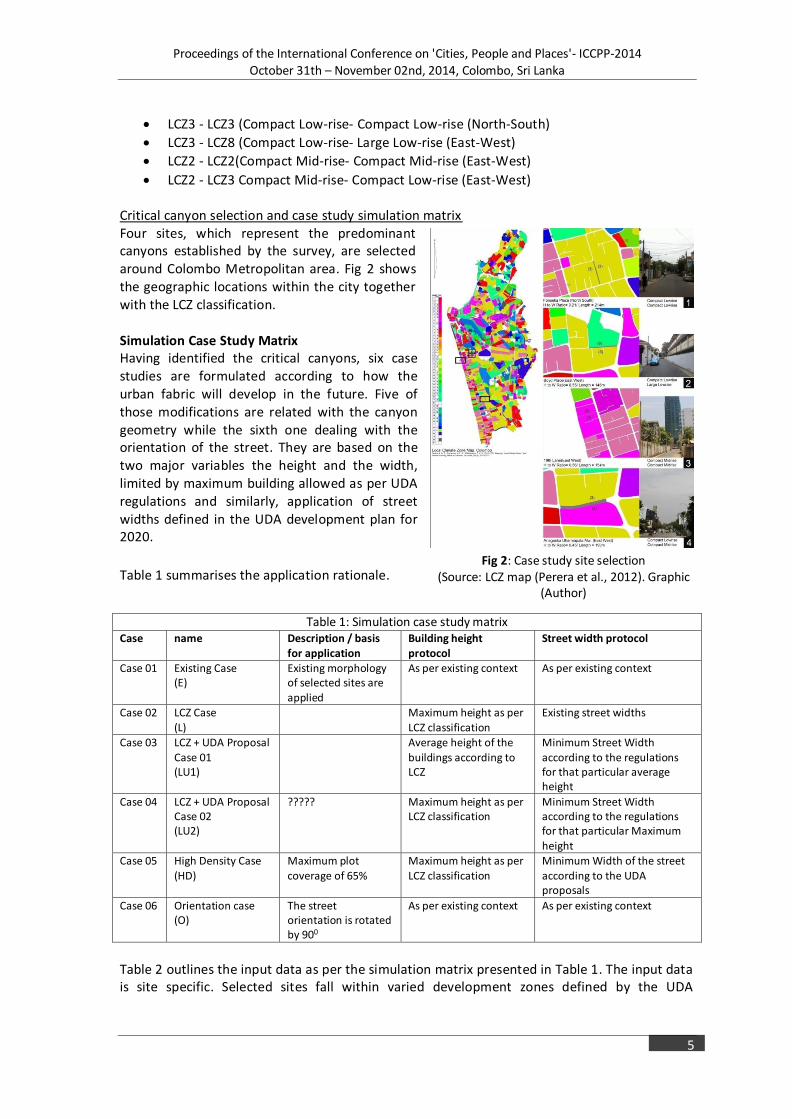
5
Fig 2: Case study site selection (Source: LCZ map (Perera et al., 2012). Graphic
(Author)
LCZ3 - LCZ3 (Compact Low-rise- Compact Low-rise (North-South)
LCZ3 - LCZ8 (Compact Low-rise- Large Low-rise (East-West)
LCZ2 - LCZ2(Compact Mid-rise- Compact Mid-rise (East-West)
LCZ2 - LCZ3 Compact Mid-rise- Compact Low-rise (East-West) Critical canyon selection and case study simulation matrix Four sites, which represent the predominant canyons established by the survey, are selected around Colombo Metropolitan area. Fig 2 shows the geographic locations within the city together with the LCZ classification. Simulation Case Study Matrix Having identified the critical canyons, six case studies are formulated according to how the urban fabric will develop in the future. Five of those modifications are related with the canyon geometry while the sixth one dealing with the orientation of the street. They are based on the two major variables the height and the width, limited by maximum building allowed as per UDA regulations and similarly, application of street widths defined in the UDA development plan for 2020.
Table 1 summarises the application rationale.
Table 1: Simulation case study matrix Case name Description / basis
for application Building height protocol
Street width protocol
Case 01 Existing Case (E)
Existing morphology of selected sites are applied
As per existing context As per existing context
Case 02 LCZ Case (L)
Maximum height as per LCZ classification
Existing street widths
Case 03 LCZ + UDA Proposal
Case 01 (LU1)
Average height of the
buildings according to LCZ
Minimum Street Width
according to the regulations for that particular average height
Case 04 LCZ + UDA Proposal Case 02 (LU2)
????? Maximum height as per LCZ classification
Minimum Street Width according to the regulations for that particular Maximum height
Case 05 High Density Case (HD)
Maximum plot coverage of 65%
Maximum height as per LCZ classification
Minimum Width of the street according to the UDA proposals
Case 06 Orientation case (O)
The street orientation is rotated by 900
As per existing context As per existing context
Table 2 outlines the input data as per the simulation matrix presented in Table 1. The input data is site specific. Selected sites fall within varied development zones defined by the UDA
Proceedings of the International Conference on 'Cities, People and Places'- ICCPP-2014
October 31th – November 02nd, 2014, Colombo, Sri Lanka
6
development plan for 2020. Therefore, the regulations that apply differ. The street and building lines are defined for each individual street and thus not dependent on the development zoning.
Table 2: Site specific Input data for simulation cases Site Name LCZ Block Maximum No: of
Floors Plot Coverage (Existing Value to 65%)
Development Zone
Min: Street Line Width
Min: Building Line Width LCZ UDA Apply
Fonseka Road Block (A)=LCZ3
3 9 3 46% to 65% Special Primary Residential Zone
12.19m
15m
Block (B)=LCZ3
3 9 3 35% to 65%
Boyd Place Block (A)=LCZ3
3 5 3 47% to 65% Concentrated Development Zone
No 12m
Block (B)=LCZ8
3 5 3 46% to 65%
19th Lane Block (A)=LCZ2
9 6 9 50% to 65% Mixed Development Zone, Sea Front Zone
No 12.2m
Block (B)=LCZ2
9 6 9 46% to 65%
Dharmapala Mawatha
Block (A)=LCZ2
9 12 9 48% to 65% Concentrated Development Zone
No 24m
Block (B)=LCZ3
3 12 3 47% to 65%
ENVI-met simulation
As Ali-Toudert and Mayer (2006) states; it is a three- dimensional non-hydrostatic model for the simulation of surface-plant-air interactions, especially within the urban canopy layer. It is designed for micro-scale with a typical horizontal resolution from 0.5 to 10 m, and a typical time frame of 24–48 h with a time step of 10 s at maximum. This resolution allows the investigation of small-scale interactions between individual buildings, surfaces and plants. ENVI-met was validated for Sri Lanka by Emmanuel, R., & Johansson, E. (2006). ENVI-met inputs; o Meteorological:
Wind speed and direction at 10 m above ground
Roughness length (Zo)
Initial temperature of the atmosphere
Specific humidity at 2500 m
Relative humidity at 2 m level o Morphology:
Site plan (incl. buildings, trees, man-made surfaces
Height of buildings and trees o Surface property:
Ground, building and all surfaces plus water ENVI-met outputs; o Ambient temperature (T) - The T values and variation of T values o SVF - The SVF due to Buildings o MRT- MRT values, variation of MRT values in the form of contour plots o PMV – PMV values through contour plots using Leonardo Maps presentation tool
Proceedings of the International Conference on 'Cities, People and Places'- ICCPP-2014
October 31th – November 02nd, 2014, Colombo, Sri Lanka
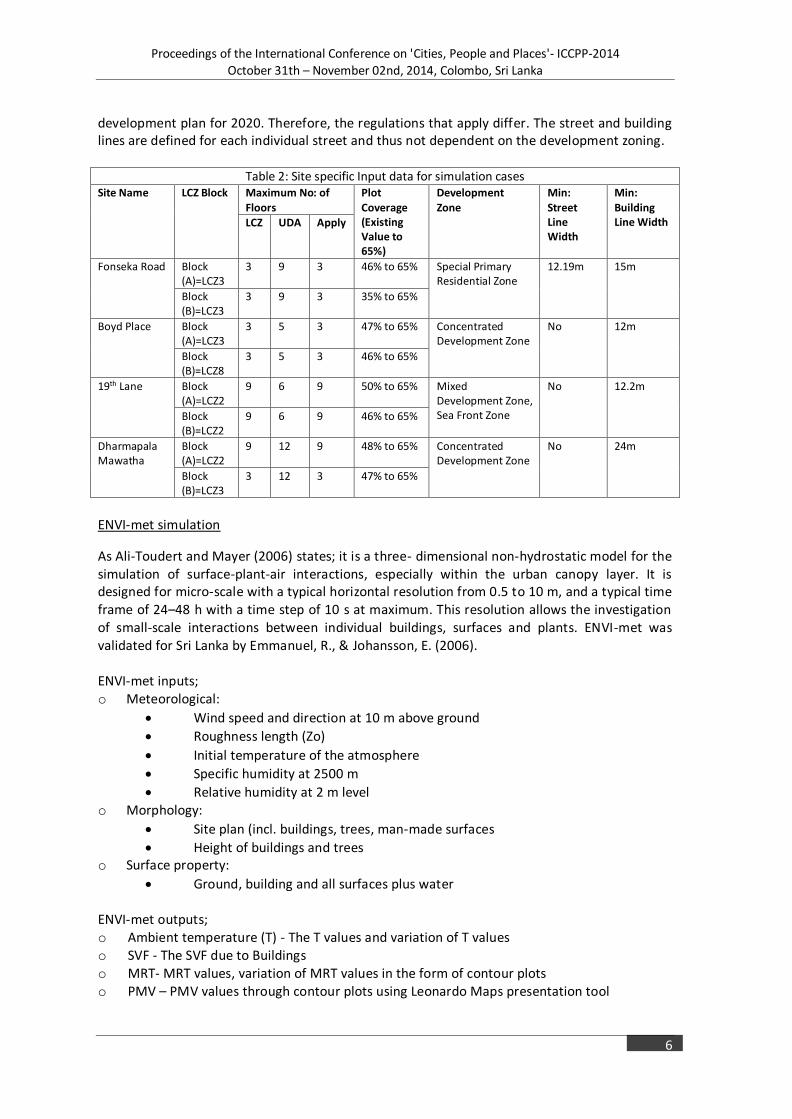
7
Fig 3: Site 01 - MRT variation (Source: Author)
The mean radiant temperature (MRT) is defined for the real environment in practice (actual non-uniform enclosure) as “the uniform temperature of an imaginary enclosure in which radiant heat transfer from the human body equals the radiant heat transfer in the actual non-uniform enclosure” (ASHRAE, 1997). In the outdoor environment, it is complicated to determine MRT because the body exchanges radiation with various sources. The magnitude of the radiation from the different sources varies greatly in space and time. The MRT is calculated by ENVI-met for a standing person considering all radiation aspects. (Ali-Toudert & Mayer, 2006) The most commonly used thermal comfort indices are based on the heat balance of the human body, e.g. the predicted mean vote (PMV), the new effective temperature (ET*), the standard effective temperature (SET*), and the physiologically equivalent temperature (PET). These indices have in common that they take into account all environmental variables influencing thermal comfort (Ali Toudert, 2005). For this study, we utilise PMV for comparative studies. The limitation in generating PMV in ENVI-met is that it is only depicted as contours in graphic form, unlike the MRT data that is tabulated form. The PMV data is presented as maximum and minimum because of this limitation. PMV is evaluated on a seven point thermal sensation scale, with '0' being the neutral threshold.
The main limitations of the ENVI-met software are as follows; o Buildings are modelled as blocks where width and length are multiples of grid cells o Buildings have no thermal mass and constant indoor temperature o Albedo and thermal transmission (U-value) for walls and roofs are the same for all buildings
The protocol for analysis uses a Microsoft Excel platform to generate the required relationships. Results and Discussion The data generated by the ENVI-met simulations are analysed in the following stages;
o Within canyon variation to MRT and PMV in relation to changing morphology o Overall relationship between H:W to MRT and PMV o Overall relationship between SVF to MRT and PMV
Within canyon variation to MRT and PMV in relation to changing morphology Site 01 - Fonseka Road, (off Dickman’s Road) – North/South (LCZ3-LCZ3) Fig 3 shows the MRT variation throughout particular day. Comparison shows a distinct change in case 05 - HD, where the canyon warms later in the morning and cools earlier in the afternoon. This is due to the high aspect ratio and North/South orientation of the canyon. The orientation allows maximum shading of the street by the buildings that define it. The difference is evident in case 06 where the street orientation is changes to East/West. The maximum MRT and PMV intensity is shown in case 03, which has the lowest aspect ratio of 0.1 and highest SVF of 0.957. As the variables indicate, the street receives the maximum solar radiation among cases.
Proceedings of the International Conference on 'Cities, People and Places'- ICCPP-2014
October 31th – November 02nd, 2014, Colombo, Sri Lanka
8
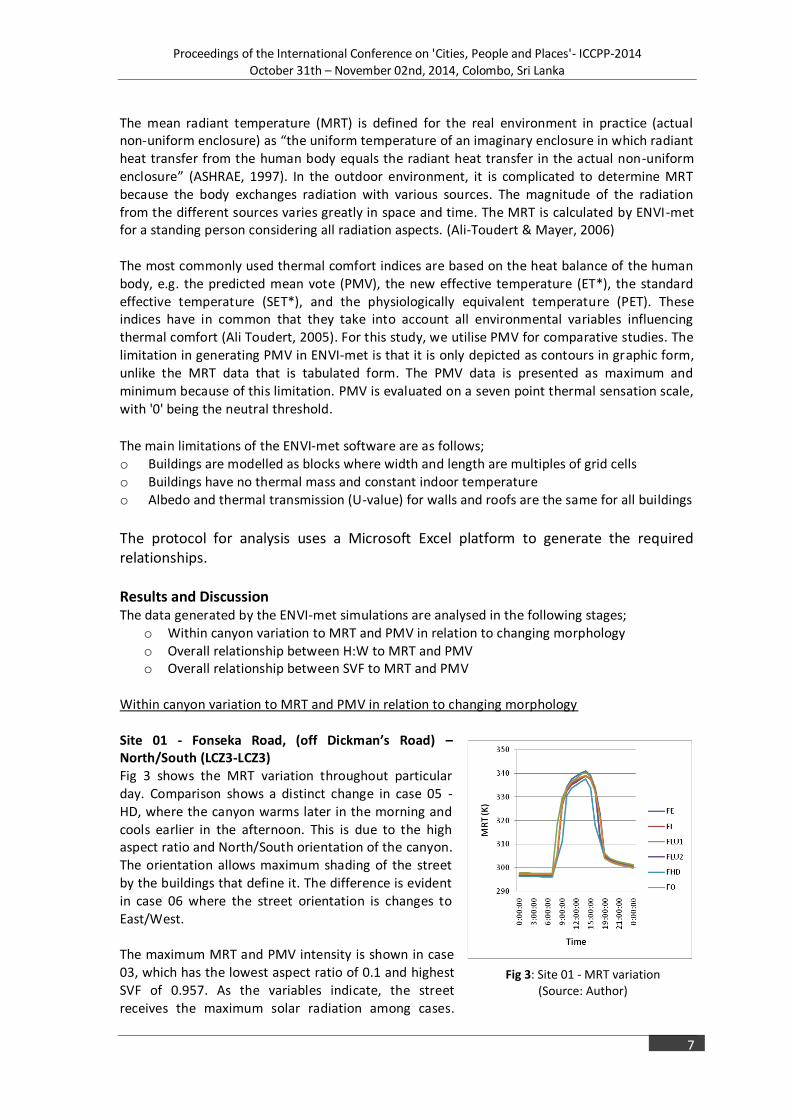
Fig 4: Site 02 - MRT variation
(Source: Author)
Nighttime hours of the day show little or no variation in terms of MRT variation between cases.
Site 02 - Boyd Place - East/West (LCZ3-LCZ8) As in Site 01, case 03 shows the highest MRT and PMV intensity. However, the difference is significant in comparison to the other cases. Similarly, case 06 shows a distinct difference for the afternoon hours. With the street canyon orientation of East/West and therefore limited possibility of shade by the adjacent buildings, the differences are understandable. An orientation change in case 06, allows for shade, therefore is reflected in the reduced MRT and PMV values. The aspect ratio is uniform for the canyon, therefore, case 06 MRT intensity reduction in the afternoon hours is attributed to the larger building footprint of the LCZ8
classified urban block to the west.
The High density, case 05 morphology has little or no effect on the MRT intensity in an East/West oriented street canyon. Similarly, as seen in Table 8, the orientation of the street has a bigger impact on the PMV values than a change in the aspect ratio. Site 03 - 19th Lane, Colombo 03 – East/West (LCZ2-LCZ2) The analysis compares morphology cases that classify as LCZ2, therefore increased building height of maximum 27m (9 floors as per LCZ classification). The previous sites were LCZ3 and LCZ8. As with the previous sites and cases, it is clear that high aspect ratio cases show a lower intensity of MRT and PMV. However, unlike the previous East/West oriented
Table 3: Site 01 - Data Summary Case 01 02 03 04 05 06
H:W 0.21 0.32 0.1 0.32 0.6 0.21
SVF 0.855 0.741 0.957 0.756 0.676 0.855
MRT (max) 340.91 338.82 340.33 339.19 337.57 339.18
PMV (min) 4.95 4.93 5.01 4.92 4.67 4.72
PMV(max) 5.23 5.21 5.29 5.2 4.94 5.00
Table 4: Site 02 - Data Summary
Case 01 02 03 04 05 06
H:W 0.55 0.64 0.21 0.64 0.75 0.55
SVF 0.531 0.528 0.833 0.537 0.525 0.531
MRT 331.93 331.38 338.81 331.04 330.67 320.78
PMV (min) 4.03 3.97 4.65 3.97 3.97 3.45
PMV (max) 4.35 4.3 4.98 4.3 4.3 3.78
Proceedings of the International Conference on 'Cities, People and Places'- ICCPP-2014
October 31th – November 02nd, 2014, Colombo, Sri Lanka
9
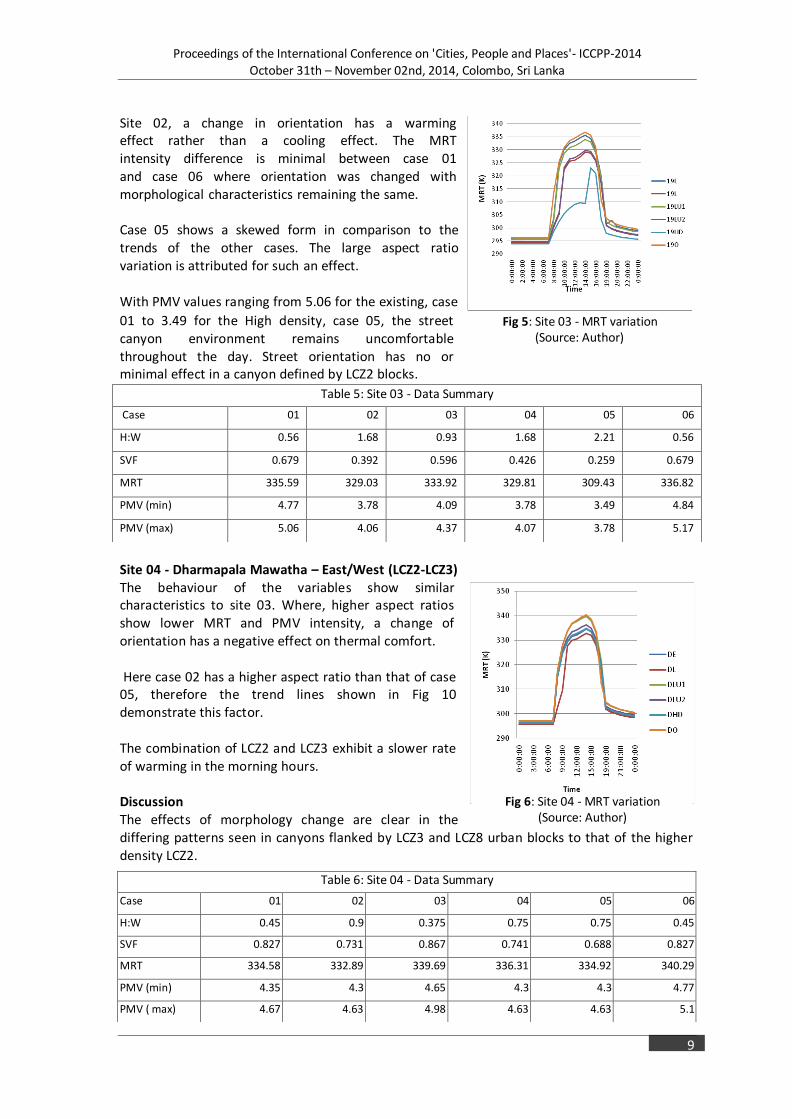
Fig 5: Site 03 - MRT variation (Source: Author)
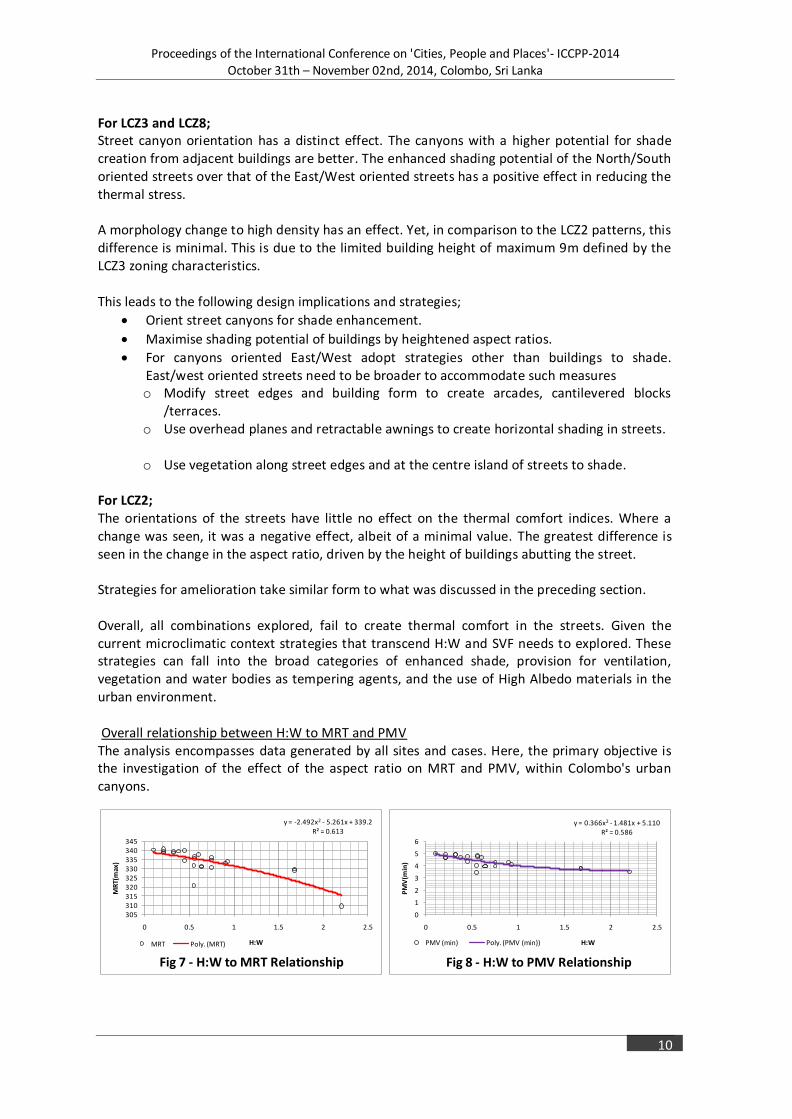
Fig 6: Site 04 - MRT variation (Source: Author)
Site 02, a change in orientation has a warming effect rather than a cooling effect. The MRT intensity difference is minimal between case 01 and case 06 where orientation was changed with morphological characteristics remaining the same. Case 05 shows a skewed form in comparison to the trends of the other cases. The large aspect ratio variation is attributed for such an effect. With PMV values ranging from 5.06 for the existing, case
01 to 3.49 for the High density, case 05, the street canyon environment remains uncomfortable throughout the day. Street orientation has no or minimal effect in a canyon defined by LCZ2 blocks.
Site 04 - Dharmapala Mawatha – East/West (LCZ2-LCZ3) The behaviour of the variables show similar characteristics to site 03. Where, higher aspect ratios show lower MRT and PMV intensity, a change of orientation has a negative effect on thermal comfort. Here case 02 has a higher aspect ratio than that of case 05, therefore the trend lines shown in Fig 10 demonstrate this factor. The combination of LCZ2 and LCZ3 exhibit a slower rate of warming in the morning hours. Discussion The effects of morphology change are clear in the differing patterns seen in canyons flanked by LCZ3 and LCZ8 urban blocks to that of the higher density LCZ2.
Table 5: Site 03 - Data Summary
Case 01 02 03 04 05 06
H:W 0.56 1.68 0.93 1.68 2.21 0.56
SVF 0.679 0.392 0.596 0.426 0.259 0.679
MRT 335.59 329.03 333.92 329.81 309.43 336.82
PMV (min) 4.77 3.78 4.09 3.78 3.49 4.84
PMV (max) 5.06 4.06 4.37 4.07 3.78 5.17
Table 6: Site 04 - Data Summary
Case 01 02 03 04 05 06
H:W 0.45 0.9 0.375 0.75 0.75 0.45
SVF 0.827 0.731 0.867 0.741 0.688 0.827
MRT 334.58 332.89 339.69 336.31 334.92 340.29
PMV (min) 4.35 4.3 4.65 4.3 4.3 4.77
PMV ( max) 4.67 4.63 4.98 4.63 4.63 5.1
Proceedings of the International Conference on 'Cities, People and Places'- ICCPP-2014
October 31th – November 02nd, 2014, Colombo, Sri Lanka
10
y = 0.366x2 - 1.481x + 5.110R² = 0.586
0
1
2
3
4
5
6
0 0.5 1 1.5 2 2.5
PM
V(m
in)
H:W
Fig 8 - H:W to PMV Relationship
PMV (min) Poly. (PMV (min))
y = -2.492x2 - 5.261x + 339.2R² = 0.613
305310315320325330335340345
0 0.5 1 1.5 2 2.5
MR
T(m
ax)
H:W
Fig 7 - H:W to MRT Relationship
MRT Poly. (MRT)
For LCZ3 and LCZ8; Street canyon orientation has a distinct effect. The canyons with a higher potential for shade creation from adjacent buildings are better. The enhanced shading potential of the North/South oriented streets over that of the East/West oriented streets has a positive effect in reducing the thermal stress. A morphology change to high density has an effect. Yet, in comparison to the LCZ2 patterns, this difference is minimal. This is due to the limited building height of maximum 9m defined by the LCZ3 zoning characteristics. This leads to the following design implications and strategies;
Orient street canyons for shade enhancement.
Maximise shading potential of buildings by heightened aspect ratios.
For canyons oriented East/West adopt strategies other than buildings to shade. East/west oriented streets need to be broader to accommodate such measures o Modify street edges and building form to create arcades, cantilevered blocks
/terraces. o Use overhead planes and retractable awnings to create horizontal shading in streets. o Use vegetation along street edges and at the centre island of streets to shade.
For LCZ2; The orientations of the streets have little no effect on the thermal comfort indices. Where a change was seen, it was a negative effect, albeit of a minimal value. The greatest difference is seen in the change in the aspect ratio, driven by the height of buildings abutting the street. Strategies for amelioration take similar form to what was discussed in the preceding section. Overall, all combinations explored, fail to create thermal comfort in the streets. Given the current microclimatic context strategies that transcend H:W and SVF needs to explored. These strategies can fall into the broad categories of enhanced shade, provision for ventilation, vegetation and water bodies as tempering agents, and the use of High Albedo materials in the urban environment. Overall relationship between H:W to MRT and PMV The analysis encompasses data generated by all sites and cases. Here, the primary objective is the investigation of the effect of the aspect ratio on MRT and PMV, within Colombo's urban canyons.
Proceedings of the International Conference on 'Cities, People and Places'- ICCPP-2014
October 31th – November 02nd, 2014, Colombo, Sri Lanka
11
y = -58.43x2 + 107.5x + 289.8R² = 0.798
305310315320325330335340345
0 0.2 0.4 0.6 0.8 1
MR
T(m
ax)
SVF
Fig 9 - SVF to MRT Relationship
MRT Poly. (MRT)
y = -0.418x2 + 2.874x + 2.639R² = 0.729
0
1
2
3
4
5
6
0 0.2 0.4 0.6 0.8 1
PM
V(m
in)
SVF
Fig 10 - SVF to PMV Relationship
PMV (min) Poly. (PMV (min))
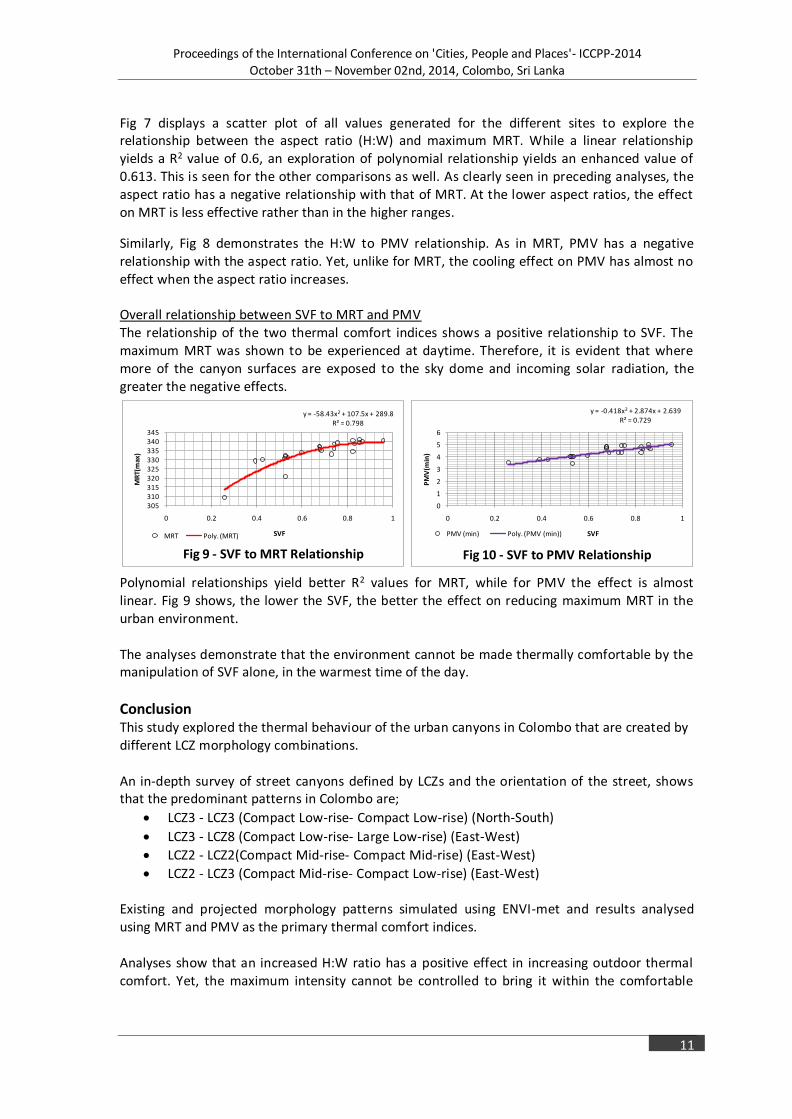
Fig 7 displays a scatter plot of all values generated for the different sites to explore the relationship between the aspect ratio (H:W) and maximum MRT. While a linear relationship yields a R2 value of 0.6, an exploration of polynomial relationship yields an enhanced value of 0.613. This is seen for the other comparisons as well. As clearly seen in preceding analyses, the aspect ratio has a negative relationship with that of MRT. At the lower aspect ratios, the effect on MRT is less effective rather than in the higher ranges.
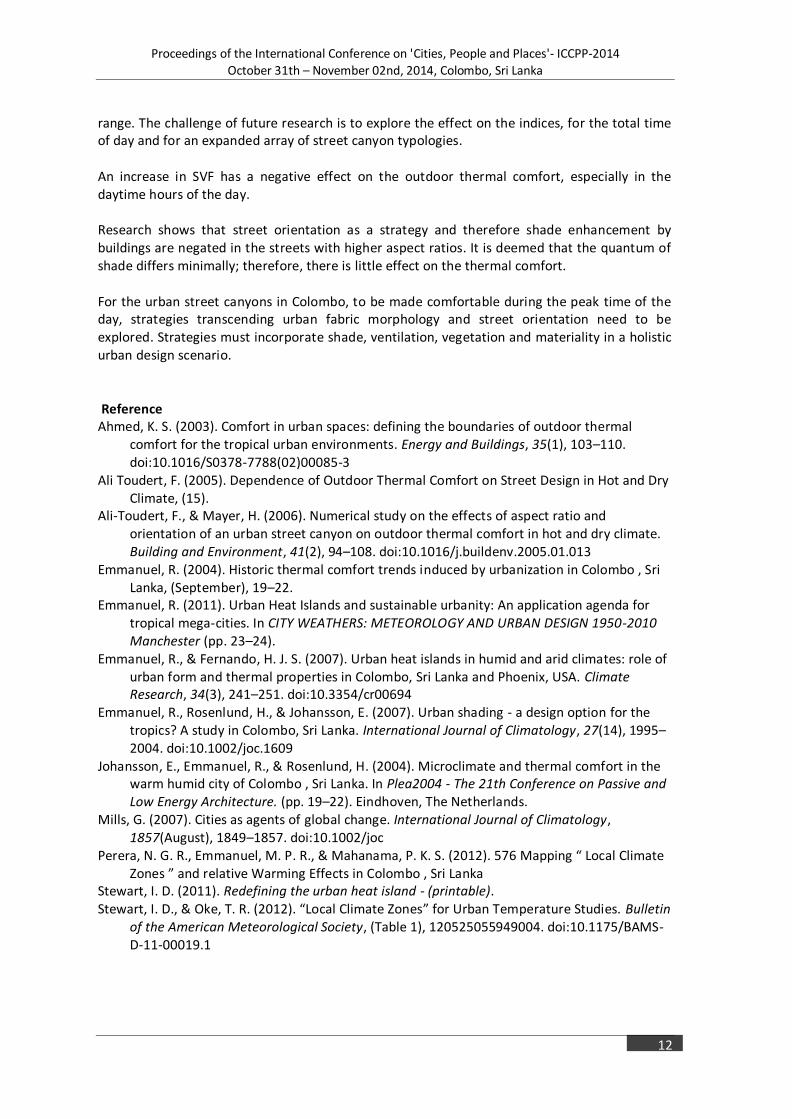
Similarly, Fig 8 demonstrates the H:W to PMV relationship. As in MRT, PMV has a negative relationship with the aspect ratio. Yet, unlike for MRT, the cooling effect on PMV has almost no effect when the aspect ratio increases. Overall relationship between SVF to MRT and PMV The relationship of the two thermal comfort indices shows a positive relationship to SVF. The maximum MRT was shown to be experienced at daytime. Therefore, it is evident that where more of the canyon surfaces are exposed to the sky dome and incoming solar radiation, the greater the negative effects.
Polynomial relationships yield better R2 values for MRT, while for PMV the effect is almost linear. Fig 9 shows, the lower the SVF, the better the effect on reducing maximum MRT in the urban environment. The analyses demonstrate that the environment cannot be made thermally comfortable by the manipulation of SVF alone, in the warmest time of the day.
Conclusion This study explored the thermal behaviour of the urban canyons in Colombo that are created by different LCZ morphology combinations. An in-depth survey of street canyons defined by LCZs and the orientation of the street, shows that the predominant patterns in Colombo are;
LCZ3 - LCZ3 (Compact Low-rise- Compact Low-rise) (North-South)
LCZ3 - LCZ8 (Compact Low-rise- Large Low-rise) (East-West)
LCZ2 - LCZ2(Compact Mid-rise- Compact Mid-rise) (East-West)
LCZ2 - LCZ3 (Compact Mid-rise- Compact Low-rise) (East-West) Existing and projected morphology patterns simulated using ENVI-met and results analysed using MRT and PMV as the primary thermal comfort indices. Analyses show that an increased H:W ratio has a positive effect in increasing outdoor thermal comfort. Yet, the maximum intensity cannot be controlled to bring it within the comfortable
Proceedings of the International Conference on 'Cities, People and Places'- ICCPP-2014
October 31th – November 02nd, 2014, Colombo, Sri Lanka
12
range. The challenge of future research is to explore the effect on the indices, for the total time of day and for an expanded array of street canyon typologies. An increase in SVF has a negative effect on the outdoor thermal comfort, especially in the daytime hours of the day. Research shows that street orientation as a strategy and therefore shade enhancement by buildings are negated in the streets with higher aspect ratios. It is deemed that the quantum of shade differs minimally; therefore, there is little effect on the thermal comfort. For the urban street canyons in Colombo, to be made comfortable during the peak time of the day, strategies transcending urban fabric morphology and street orientation need to be explored. Strategies must incorporate shade, ventilation, vegetation and materiality in a holistic urban design scenario. Reference Ahmed, K. S. (2003). Comfort in urban spaces: defining the boundaries of outdoor thermal
comfort for the tropical urban environments. Energy and Buildings, 35(1), 103–110. doi:10.1016/S0378-7788(02)00085-3
Ali Toudert, F. (2005). Dependence of Outdoor Thermal Comfort on Street Design in Hot and Dry Climate, (15).
Ali-Toudert, F., & Mayer, H. (2006). Numerical study on the effects of aspect ratio and orientation of an urban street canyon on outdoor thermal comfort in hot and dry climate. Building and Environment, 41(2), 94–108. doi:10.1016/j.buildenv.2005.01.013
Emmanuel, R. (2004). Historic thermal comfort trends induced by urbanization in Colombo , Sri Lanka, (September), 19–22.
Emmanuel, R. (2011). Urban Heat Islands and sustainable urbanity: An application agenda for tropical mega-cities. In CITY WEATHERS: METEOROLOGY AND URBAN DESIGN 1950-2010 Manchester (pp. 23–24).
Emmanuel, R., & Fernando, H. J. S. (2007). Urban heat islands in humid and arid climates: role of urban form and thermal properties in Colombo, Sri Lanka and Phoenix, USA. Climate Research, 34(3), 241–251. doi:10.3354/cr00694
Emmanuel, R., Rosenlund, H., & Johansson, E. (2007). Urban shading - a design option for the tropics? A study in Colombo, Sri Lanka. International Journal of Climatology, 27(14), 1995–2004. doi:10.1002/joc.1609
Johansson, E., Emmanuel, R., & Rosenlund, H. (2004). Microclimate and thermal comfort in the warm humid city of Colombo , Sri Lanka. In Plea2004 - The 21th Conference on Passive and Low Energy Architecture. (pp. 19–22). Eindhoven, The Netherlands.
Mills, G. (2007). Cities as agents of global change. International Journal of Climatology, 1857(August), 1849–1857. doi:10.1002/joc
Perera, N. G. R., Emmanuel, M. P. R., & Mahanama, P. K. S. (2012). 576 Mapping “ Local Climate Zones ” and relative Warming Effects in Colombo , Sri Lanka
Stewart, I. D. (2011). Redefining the urban heat island - (printable). Stewart, I. D., & Oke, T. R. (2012). “Local Climate Zones” for Urban Temperature Studies. Bulletin
of the American Meteorological Society, (Table 1), 120525055949004. doi:10.1175/BAMS-D-11-00019.1


