Embed Size (px)
Citation preview
SU+ @ Strathmore
University Library
Electronic Theses and Dissertations
This work is availed for free and open access by Strathmore University Library.
It has been accepted for digital distribution by an authorized administrator of SU+ @Strathmore University.
For more information, please contact [email protected]
2021
The Effect of corporate governance
structures on firm performance among
family-owned businesses in Nairobi County
Kenya.
Munyoki, Diana Itumbi Strathmore Business School Strathmore University
Recommended Citation
Munyoki, D. I. (2021). The Effect of corporate governance structures on firm performance among family-
owned businesses in Nairobi County Kenya [Thesis, Strathmore University].
http://hdl.handle.net/11071/12695
Follow this and additional works at: http://hdl.handle.net/11071/12695

THE EFFECT OF CORPORATE GOVERNANCE STRUCTURES ON FIRM
PERFORMANCE AMONG FAMILY-OWNED BUSINESSES IN NAIROBI
COUNTY KENYA
BY
DIANA ITUMBI MUNYOKI (053082)
DISSERTATION SUBMITTED IN PARTIAL FULFILLMENT OF THE
REQUIREMENTS FOR THE AWARD OF A DEGREE OF MASTER OF
COMMERCE AT STRATHMORE UNIVRSITY
NOVEMBER 2021

i
DECLARATION
Student’s declaration
I declare that this work has not been previously submitted and approved for the award of a degree by
this university or any other university. To the best of my knowledge and belief, the dissertation contains
no material previously published or written by another person except where due reference is made in the
dissertation itself.
© No part of this thesis may be reproduced without the permission of the author and Strathmore
University
Diana Itumbi Munyoki 053082
Signature
Date…………04/11/2021……………..
Supervisor’s Approval
The dissertation of Diana Itumbi Munyoki was reviewed and approved by the following:
Signature …… ………….. Date…04/11/2021………………………..
Name of Supervisor: Dr. Stella Nyongesa
Lecturer, Strathmore University Business School
Dr. George Njenga
Executive Dean
Strathmore University Business School.
Dr. Bernard Shibwabo
Director, Office of Graduate Studies

ii
ACKNOWLEDGEMENT
I am thankful to God the Almighty for the gift of health and sound mind that has enabled me to work on
this thesis dedicatedly. I am also extremely grateful to my supervisor, Dr. Stella Nyongesa, for her un-
ending patience with me and unwavering support as I worked on this thesis. Without her guidance and
support, this research thesis would not have been a success.

iii
ABSTRACT
Family-owned businesses form a significant pillar of most economies across the globe because
these organizations are a major contributor to wealth creation and employment creation. Most
successful worldwide businesses started their activities as family businesses and have
effectively become global brands. Like any other business though, corporate governance is a
concern here too. Family business continuity plans are expected to establish a governance
structure for the family and for the family business. These structures are aimed at improving
procedural and control mechanisms of the family-owned company and for coordinating the
correspondence and connection between family proprietors and business executives. With more
and more family businesses opening to the world, such firms can no longer keep away from
execution of the corporate governance standards for reasonable and transparent functioning.
However, there is scanty empirical evidence on the extent to which corporate governance
structures affect firm performance among family-owned businesses. Therefore, the fundamental
aim of this study was to research the effects of corporate governance structures on firm
performance by relying on resource-based theory and institutional theory. The specific
objectives of the study were:-to determine the effect of ownership structure on firm
performance of family-owned businesses in Kenya, to establish the effect of board structure on
firm performance of family-owned businesses, and to establish the effect of management
structure on firm performance. The study used a descriptive research design to collect data from
a sample of 220 family-owned businesses; a structured questionnaire was employed to obtain
data while analysis was done with the use of the statistical package for social sciences (SPSS).
The quantitative data generated was subjected to descriptive statistical analysis, correlation and
regression analysis. The study found that there was a significant and positive relationship
between ownership structure and firm performance in family-owned businesses. Further, the
study established that there was a positive significant relationship with CEO-duality, however
women on board, board composition and board Committee were not significant in influencing
firm performance in family-owned business. The study further found that separate chairman and
CEO roles had a positive effect on a corporate’s reputation hence influence on the firm
performance in family-owned businesses. The findings for management structures were
observed to be positively related to firm performance. Of all the three structures ownership
structure had a greater influence on firm performance. The recommendations of the study are: -
hiring of a professional CEO, strategic differentiation to create more growth opportunities,
introduction of a governance code by policy makers that accommodates the complexities of
family businesses that are publicly traded. The study was however limited by the Covid – 19
crisis, where holding a one on one interview was a challenge following the government
directive of social distancing, hence most of the interviews were done over the telephone.
Information withholding was also another challenge encountered given the nature of family
businesses.
.

iv
TABLE OF CONTENTS
DECLARATION ......................................................................................................................................... i
ACKNOWLEDGEMENT ......................................................................................................................... ii
ABSTRACT ............................................................................................................................................... iii
TABLE OF CONTENTS .......................................................................................................................... iv
LIST OF TABLES ..................................................................................................................................... ix
LIST OF FIGURES ................................................................................................................................... xi
CHAPTER ONE ......................................................................................................................................... 1
INTRODUCTION ...................................................................................................................................... 1
1.1 Background of the Study ....................................................................................................... 1
1.1.1 Corporate governance and corporate governance structures ....................................................... 4
1.1.2 Firm Performance ........................................................................................................................ 6
1.1.3 Family-Owned Businesses in Kenya ......................................................................................... 10
1.2 Statement of the Problem .................................................................................................... 11
1.3 Purpose of the Study ........................................................................................................... 14
1.3.1 General Objectives of the Study ................................................................................................ 14
1.3.2 Specific Objectives of the Study ............................................................................................... 14
1.3.3 Research Questions ................................................................................................................... 15
1.4 Scope of the Study............................................................................................................... 15
1.5 Significance of the Study .................................................................................................... 15
1.6 Chapter Summary ................................................................................................................ 16
CHAPTER TWO ...................................................................................................................................... 17
LITERATURE REVIEW ........................................................................................................................ 17
2.1 Introduction ......................................................................................................................... 17

v
2.2 Theoretical Foundation/framework ..................................................................................... 17
2.2.1 Resource Based Theory ............................................................................................................. 17
2.2.2 Institutional Theory ................................................................................................................... 20
2.3. Empirical Literature Review .............................................................................................. 23
2.3.1 Ownership Structure and Firm Performance ............................................................................. 23
2.3.2 Board Structure and Firm Performance ..................................................................................... 24
2.3.3 Management Structure and Firm Performance ......................................................................... 26
2.5 Research Gaps ..................................................................................................................... 27
2.6 Conceptual Framework ....................................................................................................... 32
2.7 Operationalization of variables ........................................................................................... 33
2.8 Chapter Summary ................................................................................................................ 34
CHAPTER THREE.................................................................................................................................. 35
RESEARCH METHODOLOGY .............................................................................................. 35
3.1 Introduction ......................................................................................................................... 35
3.2 Research Philosophy ........................................................................................................... 35
3.3 Research Design .................................................................................................................. 35
3.4 Target Population ................................................................................................................ 36
3.5 Sampling Design ................................................................................................................. 36
3.5.1 Sample Size ............................................................................................................................... 37
3.6 Data Collection Instrument ................................................................................................. 37
3.6.1 Data Collection Procedure ........................................................................................................ 38
3.7 Data Analysis and Presentation ........................................................................................... 38
3.8 Analytical Model ................................................................................................................. 38
3.9 Diagnostic Tests .................................................................................................................. 39

vi
3.9.1 Collinearity/multicollinearity Test ............................................................................................ 39
3.9.2 Normality Test........................................................................................................................... 39
3.10 Research Quality ............................................................................................................... 40
3.10.1 Internal Validity of the Instruments ....................................................................................... 40
3.10.2 Construct Validity .................................................................................................................. 40
3.10.3 External Validity .................................................................................................................... 41
3.10.4 Reliability of the Instruments ................................................................................................. 41
3.11 Ethical Considerations ..................................................................................................................... 42
CHAPTER FOUR .................................................................................................................................... 44
DATA ANALYSIS, PRESENTATION, AND INTERPRETATION .................................................. 44
4.1 Introduction ......................................................................................................................... 44
4.2. Response Rate .................................................................................................................... 44
4.2.1 Respondents by title .................................................................................................... 45
4.2.2 Respondents by gender................................................................................................ 45
4.2.3 Respondents marital status .......................................................................................... 46
4.2.4 Respondents age bracket ............................................................................................. 46
4.2.5 Length of service with the organization ...................................................................... 46
4.2.6 Respondents level of education ................................................................................... 47
4.2.7 Length of existence of the organization ...................................................................... 47
4.3 Descriptive results on study variables ................................................................................. 48
4.3.1 Ownership Percentage ................................................................................................. 48
4.3.2. Ownership Structure and firm performance ............................................................... 49
4.3.3. Board Structure and firm performance....................................................................... 50
4.3.4. Management Structure and firm performance ........................................................... 52

vii
4.3.5. Firm Performance ....................................................................................................... 53
4.3. Reliability Results .............................................................................................................. 54
4.4. Pearson’s Correlation Analysis .......................................................................................... 54
4.4.1 Univariate Analysis ..................................................................................................... 56
4.4.2. Influence of Ownership Structure on Firm Performance ........................................... 56
4.4.3. Influence of Board Structure on Firm Performance ................................................... 58
4.4.4. Influence of Management Structure on Firm Performance ........................................ 60
4.4.5 Multivariate Regression Results.................................................................................. 62
4.5 Chapter Summary ................................................................................................................ 66
CHAPTER FIVE ...................................................................................................................................... 67
SUMMARY OF FINDINGS, CONCLUSIONS AND RECOMMENDATIONS ............................... 67
5.1 Introduction ......................................................................................................................... 67
5.2 Summary of the Findings .................................................................................................... 67
5.3 Discussion of findings ......................................................................................................... 67
5.3.1 Effects of ownership structure on firm performance of family-owned businesses ................... 67
5.3.2 Effect of board structure on firm performance of family-owned businesses ........................... 68
5.3.3 Effect of management structure firm performance of family-owned businesses ...................... 69
5.4 Conclusions ......................................................................................................................... 70
5.5 Recommendations ............................................................................................................... 71
5.5.1 Hiring a professional CEO of an organization reputation ......................................................... 71
5.5.2 Strategic differentiation in a family firm ................................................................................... 72
5.5.3 Policy recommendation………………………………………………………………72
5.5.4 Theoretical recommendations………………………………………………………..73
5.6 Suggestions for further research .......................................................................................... 73

viii
5.7 Limitations .......................................................................................................................... 74
REFERENCES ......................................................................................................................................... 75
APPENDICES .......................................................................................................................................... 82
APPENDIX I: INTRODUCTION LETTER............................................................................. 82
APPENDIX II: LIST OF FAMILY BUSINESSES .................................................................. 83
APPENDIX III: QUESTIONNAIRE ........................................................................................ 90
SECTION A: DEMOGRAPHIC INFORMATION ........................................................................... 90
SECTION B: CORPORATE GOVERNANCE STRUCTURES ...................................................... 91
SECTION C: CORPORATE GOVERNANCE STRUCTURES AND FIRM PERFORMANCE .... 96
APPENDIX IV: NACOSTI RESEARCH LICENCE ............................................................... 98
APPENDIX V: STRATHMORE ETHICS APPROVAL LETTER. ........................................ 99

ix
LIST OF TABLES
Table 2.5 Research Gaps ........................................................................................................... 28
Table 2.7 Operationalization of study variables........................................................................ 33
Table 3.1 Reliability of Cronbach’s alpha Reliability Coefficient…………………………..
Table 4.1 Response rate ............................................................................................................ 43
Table 4.2 Respondents by title. ................................................................................................. 44
Table 4.3 Respondents gender ...................................................................................................45
Table 4.4 Respondents marital status.......................................................................................45
Table 4.5 Respondents age bracket ........................................................................................... 45
Table 4.6 Length of service with the organization .................................................................... 45
Table 4.7 Respondents by level of education ............................................................................ 46
Table 4.8 Length of existence of the organization .................................................................... 46
Table 4.9 Ownership percentage ............................................................................................... 47
Table 4.10. Proportion of share ownership ............................................................................... 47
Table 4.11 generation of the family that owns/runs the company. ........................................... 48
Table 4.12: Principal Component Analysis and Reliability of Ownership Structure ............... 49
Table 4.13: Principal Component Analysis and Reliability of Board Structure ....................... 52
Table 4.14: Principal Component Analysis and Reliability of Management Structure ............ 53
Table 4.15: Principal Component Analysis and Reliability of Board Structure…............…….53
Table 4.16: Summary of Reliability of Cronbach’s alpha Reliability Coefficient ................... 53
Table 4.17: Pearson’s Correlation ............................................................................................. 52

x
Table 4.18: Model Summary for Ownership Structure ............................................................. 56
Table 4.19: ANOVA Analysis for Ownership Structure .......................................................... 57
Table 4.20: Coefficients for Firm Performance ........................................................................ 57
Table 4.21: Model Summary for Board Structure..................................................................... 58
Table 4.22: ANOVA Analysis for Board Structure .................................................................. 59
Table 4.23: Coefficients for Firm Performance ........................................................................ 60
Table 4.24: Model Summary for Management Structure ......................................................... 61
Table 4.25: ANOVA Analysis for Management Structure ....................................................... 61
Table 4.26: Coefficients for Firm Performance ........................................................................ 62
Table 4.27: Model Summary for firm performance of family owned businesses..................... 63
Table 4.28: ANOVA Analysis for family firm performance .................................................... 63
Table 4.29: Coefficients of firm performance of family owned businesses ............................. 65

xi
LIST OF FIGURES
Figure 2.1: Conceptual Framework ........................................................................................................................ 32

1
CHAPTER ONE
INTRODUCTION
1.1 Background of the Study
Organizations around the globe look to attract financing from financial backers to expand
and develop further. However, before financial backers choose to put resources into a
specific business, regular affirmation is looked for on whether the business is financially
solid, (Mallin, 2010). In order to have this assurance investors, examine published reports
and accounts of the business and any other information released by the company with the
expectation that the books of account represent a true picture of the company's present
position.
Various prominent corporate breakdowns have occurred notwithstanding the manner in
which organizations' yearly reports and records appear good. Mallin, (2010) highlights
some of these corporate collapses to include: - Barings bank which collapsed in 1995 due to
lack of effective internal controls. Enron collapsed due to lack of integrity and honesty by
directors in 2001, it also highlights the need for external auditors to ask searching questions.
Royal ahold which collapsed in 2003 draws attention to what may happen if investor
involvement is suppressed and there is dominance of a chief executive. Royal bank of
Scotland which collapsed in 2008 emphasizes that a board might find it difficult to question
and limit the activities of a powerful chief executive. Parmalat which collapsed in 2003
indicates the deficiencies that may be exhibited in a family-owned firm where members of
the family take a controlling role across the board which can be viewed an absence of board
autonomy.
From the above corporate collapses, it can be concluded that although the annual reports of
such organizations seemed fine, the businesses still failed. The issues that stand out from
the collapses are:- lack of effective internal controls, lack of integrity and honesty by
directors, negligence on the part of external auditors for failing to ask searching questions,
lack of investor involvement ,presence of a dominant and powerful chief executive and a
2
lack of board independence due dominance of family members across the board. These
issues point out to the issue of corporate governance structures. Corporate governance has
been regarded as a preserve of the listed and large firms. However, it is important to MSEs
as it provides a framework for scrutinizing the actions and performance of the agent.
Corporate governance protects both the future of the business and the interests of the
owners and investors (Mirkovic, 2015).
IFC (2018) defined corporate governance as the processes and structures that direct and
control the organizations relatedness among the administration, governing body, controlling
investors, minority investors, and different partners to improve responsibility, obligation,
straightforwardness, and reasonableness. Mallin (2010) suggests that good corporate
governance can help avert such corporate collapses from recurring and encourages
transparency and accountability which investors look for. With proper corporate
governance structures there is an assurance that a business is well managed in the interest of
both the shareholders and stake holders. It also forestalls any single individual from having
powerful influence; further it assists in ensuring that adequate and appropriate systems of
controls are in place to safeguard assets; it is thus concerned with the relationship between
the management, directors, shareholders and stakeholders (Mallin, 2010).
World over, family-owned businesses are viewed as pivotal drivers of numerous
economies, contributing an estimated 70 - 90% of worldwide Gross Domestic Product
(GDP) annually (Fatoki, 2014; IFC,2018; Kotlar, Cuomo, & Zatton, 2019). European
Commission (2008) decipher a family owned business as a firm where initially, most of the
dynamic rights are in the ownership of the individual who set up the firm, or in the
ownership of the individual who has gained the offer capital of the firm, or in the ownership
of their life partners, guardians or children; Secondly most of dynamic rights are indirect or
direct; Thirdly, in any event one member of the family or kinfolk is officially associated
with the governance of the firm; and ultimately, an organization meets the meaning of
family undertaking if the individual who set up or obtained the firm (share capital) or their
families or relatives have 25% of the dynamic rights commanded by their offer capital.

3
Attributable to this order, family-owned businesses are needed to ascend to an undeniable
level as performance is concerned (Brenes, Madriga & Requena, 2011; Moche, 2014).
As indicated by McCormick, K’Obonyo, and Machuki (2013) family-owned business
performance is concerned with the results of an organization whereby they quantify and
measure the efficiency and effectiveness of their actions, decisions and processes against its
projected goals and objectives as per the strategic plans. Besides, studies position
performance as the most significant and enduring strategy in ensuring survival of family-
owned businesses and a fundamental route to excellence of any enterprise (Brenes et al.,
2011; IFC,2018).
However, despite the fundamental role of performance as articulated above, the
performance attributable to the family-owned businesses in Kenya continues to deteriorate
(Kiilu & Ntale, 2018; Wamaitha 2016). Absence of effective leadership, conflicts among
family members, lack of management skills and questionable regulatory frameworks within
the sector deteriorate the performance of family-owned businesses (Wamaitha, 2016;
Karanja, 2012). Despite numerous interventions and reforms such as enhanced family law,
this situation has persisted (John, Kidwell, & Camp 2016). Various interventions have been
used to improve this situation such as accommodating regulatory environment, improved
institutions for capacity building, proper legislations and enforcement, facilitation of
international trade and investments, better frameworks that support enterprise creation and
growth among other interventions (World Bank, 2015).
As per 2016 statistics, only 35 percent of family ventures tend to survive past the first
generation of proprietorship. Subsequently, out of 35 percent only 20 percent survive to the
third generation (John et al.,2016). Moreover, a study conducted by Wamaitha (2016) on
impact of succession planning management strategies on performance of medium sized
family-owned businesses in Kenya indicated that of the more than 70 percent of enterprises
owned by families, only 10 to 15% of them live to the third generation. Could this be
attributed to absence of appropriate governance structures set up to guarantee a smooth
progress and maintainability of the privately-run company? .Corporate governance has been

4
appraised as a unique attribute to improved performance of family-owned business (Brenes
et al., 2011; Che & Langli,2015 ; Kamau, Aosa, Machuki, & Pokhariyal, 2018 ; Kenga,
2018).
The corporate governance theories on which this research relied upon were institutional
theory and Resource-based theory of the firm. Of these, the overriding theory was the
resource-based theory of the firm. Resource based theory (RBT) centers on analyzing the
nature, attributes and capability of a firm’s resource base. The family business uniqueness
is to a great extent attributed to the peculiar assets and capacities that are produced when
the family framework and the business framework collaborate and exist together in unison
(Basco & Rodríguez, 2009; Nordqvist & Melin, 2010; Piper & Klein, 2007).
According to Scott (2004) institutional theory explains the resilient aspects of social
structure. It takes into consideration the technique by which structures, rules, norms, and
routines, become set up as authoritative guidelines for social behavior. It probes into how
these components are made, diffused, and embraced throughout existence; and how they
fall into decay and neglect. Institutional theory is therefore about “homogeneity in structure,
culture and yield between organizations.” (DiMaggio & Powell, 1983).
1.1.1 Corporate governance and corporate governance structures
The concept of corporate governance has been defined in a variety of ways by different
scholars. Keasey, Thompson and Wright (1997) define corporate governance as the
interaction and design used to synchronize and deal with the business issues of the
organization towards upgrading the business with a definitive goal of acknowledging
long‐term investor needs, while considering the premium of different partners. Larcker,
Richardson and Tuna (2005) further define corporate governance as the arrangement of
components both institutional and market-based which impact regulators of an organization
to settle on choices that advance the performance of the organization. Monks and Minow
(2011) rather portray corporate governance as the connection between investors, the
executives, individuals from top managerial staff, representatives, clients, suppliers and
other vested parties deciding the way and performance of the corporation.

5
IFC (2018) denote corporate governance as the structures and processes that direct and
control organizations concerning the interrelatedness among the managers, board of
directors, controlling investors, minority investors, and different partners with the principle
point of improving responsibility, duty, transparency and fairness. The organization for
economic co-operation and development [OECD] (2004) depicts corporate governance as a
set of relationship between an organization's board, its investors and other partners .it
likewise gives the instrument through which the objectives of the organization are set and
the methods of achieving them and observing performance are resolved. The corporate
governance structures describe the appropriation of rights and obligations among various
members in the organization and sets out the guidelines and systems for settling on choices
for corporate undertakings. By doing this, it gives the format through which the
organization objectives are set, and the methods for achieving those goals and observing
execution.
World Bank (1999) hypothesized that, the main attributes of effective corporate governance
are transparency (exposure of significant monetary and operational data) and internal
processes of board oversight and control. Protection and enforceability of the rights and
prerogatives of all shareholders; and directors capable of independently approving the
corporation’s strategy and major business plans & decisions, and of independently hiring
management, monitoring management’s performance and integrity, and replacing
management when necessary.
From the diverse definitions above, corporate governance can be termed as a set of
structures and processes that are aimed at directing, controlling and managing a business.
Corporate governance structures as seen from the different definitions of corporate
governance include: -ownership structure, board structure and management structure. The
ownership structure indicators include:- family type, percentage of family ownership,
control ownership wedge, managerial ownership, family founder ownership. The board
structure indicators include: - board independence, board composition, board size, board
committees, and board functioning and board tenure. The management Structure indicators
are:-percentage of family in top management, family CEO/ chairman, founder

6
CEO/chairman, family/founder management, heir/descendant CEO (Edem, Honyenuga,
Berent, & Kil, 2018).
Based on the above structures this research examined corporate governance structures
(ownership structures, board structure and management structure) and their effect on firm
performance. According to Scholten (2014) ownership can be total ownership concentration
and insider ownership or inside and outside ownership. The concept insider ownership
refers to all managers, directors and board members and total ownership concentration is
about the presence of large shareholders. The board of directors play out a significant part
in the governance structure of organizations. They are liable for setting coordinated
arrangement of internal and external controls and incentive arrangements that are utilized to
synchronize the interests of the directors (proprietors or investors) with the interests of the
supervisors (Ferrero, Fernández, & Muñoz, 2015). Fauzi and Locke (2012) define board
composition as consisting of board demographics, board structure, board recruitment, board
member motivation and criteria, board education and evaluation, and board leadership.
Board composition is one of the important factors affecting firm financial performance.
Langton and Robbins (2007) contended that board structure serves to appropriately
facilitate taking all things together board individuals to accomplish the objectives. Langston
(2007) viewed that board structure, and its competencies are the most important
organizational resources.
1.1.2 Firm Performance
Taouab and Issor (2019) described firm perfomnce as an achievement or the outcome
obtained by management, economics and marketing in providing competitiveness,
efficiency and effectiveness to the company.Richard , Devinney, Yip, & Johnson, (2009)
defined firm perfomance as encompassing three areas of firm outcomes : (a) financial
perfomance-profits, return on assets, return on investment , (b) product market performance
- sales, market share, (c) Shareholder return -total shareholder return, economic value
added. Ismyrlis (2019) described firm perfomance as comprising of the actual output or
results of an organization (or else the company’s performance) as measured against its
intended outputs (or goals and objectives). Baum and Rowley (2002) further elucidated that
firm performance comprises the actual output or results of an organization as measured

7
against its intended outputs (or goals and objectives). It is a broad construct which captures
what organizations do, produce, and accomplish for the various constituencies with which
they interact. From the above definitions firm performance can be termed to be the outcome
obtained by a firm as a result of utilization of its resources. Firm perfomance can be
measured using various ways and approaches.
According to Kaplan and Norton, (1992) firm performance measurement was defined as
a technique used to identify the performance of a business with the aim of giving a
balanced picture of the business. The assessment criteria is expected to reflect global
outcomes of the business in terms of financial and non‐financial.
According to Michaela and Marketa (2012), performance measurement tools that are
often used include but not limited to: - the balanced score card, the four-level
performance pyramid and the performance prism. The Balanced Scorecard (BSC) as
advanced by Kaplan and Norton (1992) provides a technique to evaluate performance
from four viewpoints: customers/stakeholders, internal (quality and efficiency),
innovation/learning (human capital, infrastructure, technology, culture and other capacities
that are key to performance), financial (financial performance and the use of financial
resources). It intimates that the organization is viewed from four viewpoints and helps to
develop objectives, measure key performance indicators (KPIs), targets, and initiatives
(actions) relative to each of these viewpoints.
The four lever performance pyramid as proposed by Lynch and Cross (1991) ties up
corporate strategy with operations through the pecking order by deciphering targets from
the top and measures from the base .The top tier represents a corporates vision and
strategy, the second tier represents business unit objectives and measures defined in the
market and financial terms, and the third tier represents objectives and measures for
core processes of the business units defined in terms of customer satisfaction, flexibility
and productivity. At the bottom of the pyramid, objectives are translated into specific
operational criteria: quality, delivery, cycle time, and waste for each department or
component of the business.

8
The Performance Prism by Neely, Adams, and Kennerley (2002) comprises of five
dimensions, each representing: - stakeholder satisfaction, strategies, processes
capabilities, stakeholder contribution. These five dimensions provide a comprehensive
and integrated framework for managing organizational performance.
Finally Azila-Gbettor, Honyenuga, Berent-Braun and kil, (2018) articulate that performance
evaluation can be defined as a system that is concise and characterized by a bunch of
measures (financial or non-financial) that aids the decision-making process of an
organization by collecting, processing, and analyzing quantified data of performance
information. The financial or accounting measures include return on assets investment,
return on equity, return on capital employed, sales growth, financing decisions, and
acquisition decision among many other. Non-financial measures include market share
(Tobins Q) corporate reputation, entrepreneurial evidence, CEO compensation, strategic
conformity, acquisition behavior, strategic change, social performance among many other
non-financial measures.
It can be concluded that from the three tools of measuring performance, inclusivity of all
various stakeholders in the business in conducting the performance measurement helps
achieve a better-rounded and close to accurate indication of the firm’s performance.
Different appraisal criterions are also considered which include financial and non-financial
measures. According to Tidd and Pavitt (2011), firm performance measures may be either
on the financial or non-financial aspects. Non-financial measures can include market share,
new market development, employee satisfaction and customer loyalty; while financial
measures include share price, profits, return on investment and sales revenue. He further
argues that accounting and finance performance indicators concentrate only on the short-
term measures of performance thus undervaluing innovation. Ittner & Larcker (2003)
contended that utilization of non-monetary measures empowers managers to get a glimpse
of a business progress before monetary judgment. Moreover, non-monetary measures
empower financial backers to have a superior comprehension of the whole business
performance.

9
Therefore, based on above firm performance measures the current study adopted non-
financial measures as articulated by Azilla et al,.(2018). This is because use of non-
financial performance measures enables managers to get an understanding of the business
progress well before a financial judgment is made. Additionally, non-financial measures
enable investors to have a better sense of the overall performance since non-financial
indicators usually reflect more of intangible value such as research and development
productivity that accounting rules rarely recognize as assets. The indicators of non-financial
performance used in this research were: - entrepreneurship as strategic change and renewal,
corporate reputation and strategic conformity and differentiation.
Wartick, (1992) described corporate reputation as the stakeholder’s perception of how well
organizational responses are meeting the demands and expectations of organizational
stakeholders. Following similar arguments, Fombrun (2012) elucidated that corporate
reputation can be termed as the collective representation of a company’s past actions and
future prospects that describes how key resource providers interpret a company’s initiatives
and assess its ability to deliver valued outcomes.” Finally, Waddock (2000) defined
reputation as the organization’s perceived capacity to meet its stakeholders’ expectations.
The above definitions indicate that corporate reputation is dependent on assumptions
regarding the capacity of a firm to satisfy its partners and it is worked by the
conglomeration of all partners' assumption.
Waeraas and Sataøen (2016) portrayed conformity and differentiation as techniques that
organizations follow in order to improve key organizational outcomes. Conformity signifies
acting as per a set of norms, standards, or policies, while differentiation infers to standing
apart as not quite the same as others as for specific certain attributes. Both strategies emerge
from different theoretical positions, are selected on the basis of different strategic
considerations, and are generally assumed to have different effects on a firm’s performance.
Audretsch, Keilbach and Lehmann (2006) defined entrepreneurship as the ability of a firm
to translate inventions or technologies into products and services. In this sense,
entrepreneurship describes activities on the part of both established firms and new

10
businesses (Brunninge and Nordqvist, 2004) alluded to the fact that entrepreneurship leads
to strategic change and renewal. Corporate entrepreneurship can improve competitive
positioning and transform companies, their markets and industries as the result of
exploitation of new business opportunities (Brunninge and Nordqvist ,2004). From the
above statement strategic renewal of a company can be termed as a pervasive activity that is
related to the rejuvenation and transformation of key strategic ideas on which the company
is built, this can all be achieved through corporate entrepreneurship hence the term
entrepreneurship as strategic change and renewal.
1.1.3 Family-Owned Businesses in Kenya
European Commission (2008) interpret a family business as an entity where first and
foremost, most of dynamic rights is in the ownership of the normal person(s) who set up the
firm, or in the ownership of the common person(s) who has/have obtained the offer capital
of the firm, or in the ownership of their life partners, guardians, kid or immediate
beneficiaries; Secondly most of dynamic rights are aberrant or direct; Thirdly, in any event
one agent of the family or kinfolk is officially engaged with the administration of the firm;
and finally, a recorded organizations meets the meaning of family undertaking if the
individual who set up or procured the firm (share capital) or their families or relatives have
25% of the dynamic rights commanded by their share capital.
Family businesses assume a significant part in many economies universally and in Kenya
they are the predominant type of business ownership. They form a significant piece of the
worldwide economy offering in excess of 75% of the Gross Domestic Product (GDP) in
many economies and offer work to in excess of 85% of the working populace around the
globe (Poza, 2007). They are postulated as the originating form of businesses dominating
the economic landscape of most major economies in the world (Castillo & Wakefield,
2006). As reported by Jean & Li (2008) family businesses in the United States contribute
half of the job opportunities, in Germany, they contribute 66% of GDP and accounts for
75% of total national employment. In Great Britain, the number of employees in family
enterprises is 50% of the country’s workforce. In Southeast Asian nations, family
enterprises contribute significantly to the GDP with Korea for example reaching 48.2%,

11
Taiwan 61% and Malaysia 67.2 %. Internationally, majority of family businesses are small
or medium sized (Bjuggern & Sund 2001).
In Kenya, small and medium sized enterprises (SMEs) are family owned and they provide
employment constituting of 83.4% of the total employment, according to KNBS ( 2017). As
drivers of economic development and the foundation of many businesses in Kenya, family-
owned SMEs provide employment. As such family businesses are an important source of
economic growth and development in many countries (Astrachan & Shanker, 2010). They
are considered to be the engines of employment, alleviating poverty and improving equality
(Ayyagari, Demirguc, & Maksimovic, 2011). The SMEs are therefore critical to the
economies of numerous nations yet little consideration has been offered explicitly to the
family claimed organizations in Kenya.
Although the family business dominant role is evident in most economies, such businesses
fail particularly during the transition from one generation to another raising concern on
their performance and sustainability. Poza (2007) explained that approximately 85% of new
businesses collapse within their first year of operation and among those that survive; only
30% are successfully passed on to the second generation of the founding owners. The
circumstance deteriorates in the progress between the second and third generation and the
third and fourth generation where just 12% and 4 percent of such organizations
individually, stay in the founding family. A survey by the Kenya National Bureau of
Statistics released early 2017 indicated that approximately 400,000 micro, small and
medium enterprises do not celebrate their second birthday. Few reach their fifth birthday-
leading to concerns of sustainability of this sector.
1.2 Statement of the Problem
The importance of businesses adopting corporate governance best practices cannot be
overemphasized since global best practices demonstrate a strong connection between good
corporate governance and firm profitability. Corporate governance is a key concept that has
been linked to a corporate value performance analysis by numerous studies in the past
(Onguka, Iraya & Nyamute, 2020). Onguka et al. (2020) further stated that poor corporate
governance had proven in part to be a major impediment to improving the corporate value

12
of firms besides not being able to attract capital in an environment with ever-increasing
capital mobility. In Kenya, cases of underperformance and corporate failures continue to
increase in magnitude and frequency despite attempts by regulatory authorities to
strengthen financial discipline and corporate governance through the implementation of
improved governance principles and financial discipline through regular reporting and
oversight.
Notably, in Nairobi County, despite efforts to improve the performance of family-owned
business, there are instances of evident failure (Moche, 2014; kiilu & ntale, 2018).
Statistically, performance of these enterprises remains at a worrying condition. This is
indicated by high level of exit of family-owned businesses from the market, weak financial
systems, untimely payment of staff, poor sales volume, costly litigation cases, lack of
respect to organization’s values, clear vision and mission, non-professionalism,
questionable legal strategic framework, among others (Wamaitha, 2016; Moche, 2014;
Kiilu & Ntale, 2018).
Various studies have been done covering the area of corporate governance in Kenya and
around the world. Malik and Makhdoom (2016) sought to find out if corporate governance
affects firm performance in Fortune Global 500 companies, the study established a positive
connection between corporate governance and firm performance. Nehme, Richard, and
Georges (2015) analyzed the connection between corporate governance structure and
family firms’ performance in Lebanon and found that there was a significant relationship
between board size and family firm performance. There was no relationship between board
composition and family firm performance. The study concluded that there was no
connection between CEO tenure and family firm performance. Anum and Ghazali (2010)
looked at ownership structure and firm performance in Malaysia, they analyzed the impact
of corporate governance on corporate performance, the results showed weak proof to
demonstrate that companies which adopted good governance practices performed better
than others. None of the corporate governance variables (CEO duality, Independent
directors, Board size) were statistically significant in explaining corporate performance.
Dalwai (2015), on the other hand, investigated the relationship between corporate

13
governance and firm performance among GCC banking sector and the findings showed that
board size had a positive relationship with firm performance.
Ehikioya (2009) researched on corporate governance structure and firm performance in
developing economies, the empirical investigations demonstrated that ownership
concentration had a positive impact on performance. Albeit the outcomes uncovered no
proof to support the impact of board composition on performance. Another variable,
identified as more than one family member on the board, was found to adversely affect
firm performance. Kyereboah (2008) conducted a study on corporate governance and
firm performance in Africa, the findings indicated that large and independent boards
improved firm value and that combining the positions of CEO and board chair had a
negative impact on corporate performance.
Opanga (2013) analyzed the connection between corporate governance and firm
performance in insurance firms in Kenya, the study established that the number of board
committees, board meeting frequency, number of resolutions passed in an AGM and
number of board of directors were all positively correlated with firm performance. In
conclusion, each of the independent variable studied played a key role in the firm
performance of insurance firms in Kenya. Moche (2014) analyzed the effect of corporate
governance on firm performance of listed family firms; the study concluded that corporate
governance was not related to firm performance for family-owned business. In particular,
the corporate governance structures were measured using shareholding, board composition,
board functioning, control mechanisms and disclosures. Wanjiku (2014) embraced an
examination pointed toward deciding the connection between corporate governance
practices and firm performance small and medium enterprises in Kenya. The findings
revealed that the number of board of directors, percentage of inside ownership, number of
board meetings were emphatically associated with improved firm performance while the
number of board committees, percentage of outside directors and CEO duality was
adversely related to organizational performance. From the above studies there was a bias on
listed firms and financial performance. The researchers also relied on the board structure to
arrive at their conclusion.

14
From the above empirical literature, it is evident that more studies need to be done on
corporate governance and firm performance of family-owned businesses in Kenya focusing
on non-financial performance. Evaluation of firm performance based on the financial aspect
of performance can be inconclusive and skewed. Non-financial performance measures or
aspects of firm performance give an all-inclusive perspective of the firm. Majority of the
studies conducted so far have examined firm performance on financial measures. It can also
be noted that the studies carried out relied on a single structure of the corporate governance
structures. A substantive number of the studies have focused on board structure to arrive at
their conclusion without considering the other structures namely ownership structure and
management structure to give a conclusive finding. A single structure approach might not
bring out all characteristics of the firm, a combination of multiple structures can help bring
out a better opinion of governance structures in a firm. This study sought to examine the
three structures of corporate governance: namely, ownership structure, board structure and
management structure on firm performance. Whereas majority of the studies relied on
secondary data, which is historical in nature, this study relied on primary data by
administering a closed ended questionnaire and conducting interviews. The purpose of this
research was to bridge these knowledge gaps by establishing the effects of corporate
governance on firm performance of corporate governance in Nairobi Kenya.
1.3 Purpose of the Study
The purpose of this study was to establish the effects of corporate governance structures on
performance of family-owned businesses in Kenya.
1.3.1 General Objectives of the Study
The general objective of this study was to establish the effects of corporate governance
structures on firm performance of family-owned businesses in Kenya.
1.3.2 Specific Objectives of the Study
i. To determine the effect of ownership structure on firm performance of family-owned
businesses in Kenya.
ii. To establish the effect of board structure on firm performance of family-owned
businesses in Kenya.

15
iii. To establish the effect of management structure firm performance of family-owned
businesses in Kenya.
1.3.3 Research Questions
i. What is the effect of ownership structure on firm performance of family-owned businesses
in Kenya?
ii. What is the effect of board structure on firm performance of family-owned businesses in
Kenya?
iii. What is the effect of management structure on firm performance among family-owned
businesses in Kenya?
1.4 Scope of the Study
The research study focused on examining the effects of corporate governance Structures, on
performance of medium and large family-owned businesses with an annual turnover of
5million dollars to 10 million dollars in Nairobi county Kenya. To empirically obtain
satisfactory and informative data, the study covered Nairobi County in Kenya. This was
because it is considered as the main center for the establishment of family-owned
businesses. In this context, top managers, chief executive officers and firm owners, formed
the unit of inquiry since they were at the mainstream of family-owned business
management. This study involved filling of questionnaires for collection of data. The study
focused on the period between June 2020 to September 2020. The study was anchored on
two theories which are institutional theory and resource-based theory.
1.5 Significance of the Study
This research will help practitioners and policy makers to overcome the deficiencies
regarding the ownership structure, board structure and family in top management, and to
exercise the best combination of ownership structure, board structure and family in top
management to get the desired goals. Policy makers need a reference point for policies
regarding a particular subject. This study would provide such basis for articulating policies
that would help family businesses transition into reputable firms and create wealth and
employment in the economy

16
This research study will empower the board of directors to re-think their corporate structure
and make a balance of ownership structure, board structure and family in top management,
which will enhance the firm value and non-financial performance. It will help to guide
businesses on how to integrate corporate governance structures in their firms to help
strengthen firm performance. The research study findings will contribute to improving the
performance of family firms which in return adds into the economy positively. The research
study findings will be of importance to family-owned businesses management, by providing
strategies to improve corporate governance structures and performance of their businesses.
An academic study is desired to be able to build into academia by adding new insights into
a variable of study. This study therefore, not only adds to the body of knowledge of
corporate governance in family run businesses but will also form basis for further research
to academia in the area of corporate governance and firm performance in family businesses.
This research further adds into the existing body of knowledge related to the relationship
between of ownership structure, board structure and family in top management.
1.6 Chapter Summary
This Chapter presents the background of corporate governance and its effect on firm
performance of family-owned businesses in Kenya. It also presents the problem statement,
purpose of the study, research questions to be answered by the study, scope of the study and
importance of the study. Next is Chapter two which reviews the literature underpinning the
study based on the research questions and theories that help support the study variables.

17
CHAPTER TWO
LITERATURE REVIEW
2.1 Introduction
This chapter reviews theoretical and empirical literature. Empirical studies on effects of
corporate governance on firm performance and theories thereon are discussed as they relate
to the objectives of the study. The chapter also presents a summary of knowledge gaps
arising from this review which inform the conceptual framework and operationalization of
study variables presented towards the end of the chapter.
2.2 Theoretical Foundations
A theoretical foundation serves as the guide on which to build and support a research study,
It can be defined a structure that guides research by relying on a formal theory constructed
by using an established, coherent explanation of certain phenomena and relationships”
(Grant & Osanloo, 2014). It is based on an existing theory in a field of inquiry that is
related and mirrors the speculation of a study. It is additionally considered as an outline that
is regularly 'acquired' by the researcher to build his/her own research inquiry. The following
section discusses the different theories on which this study is anchored on, namely the
resource based theory and institutional theory.
2.2.1 Resource Based Theory
This theory was first postulated by Penrose (1959) who argued that a firm was more than an
administrative unit; it was seen as a collection of productive resources the disposal of which
between different users and over time is determined by administrative decision.She
emphasized on the internal resources of a firm. A firm's growth is reliant on a firm's
resources and is limited by managerial resources. This theory was further developed by
Andrews (1971) who emphasized on management of internal resources. Resource based
theory emphasis is on analyzing the nature, characteristics, and potential of a firm’s
resource base. It has been suggested that the family business uniqueness is largely because
of the idiosyncratic resources and capabilities that are generated when the family system
and the business system interact and co-exist in Unison (Basco & Pérez Rodríguez, 2009;
Nordqvist & Melin, 2010).

18
Resources are defined as factor which could be thought of strength or weakness of a firm
and at any given time can be the assets that are either tangible or intangible and which are
tied semi-permanently to the firm (Wernerfelt, 1984). Miller and Shamsie (1996) extended
the definition further by differentiating intangible and tangible resources. They termed
intangible resources as the knowledge-based ones while the tangible ones were property
based. Intangible resources more than likely to lead to sustained competitive advantage
because they are often unknown hence difficult to identity and are firm specific.
Resource based theory is anchored on several assumptions. These assumptions are linked to
persistent superior firm performance theories. In particular, they focus on how to assess
superior performance in order to evaluate a firm’s competitiveness. Resource based logic,
for instance, adopts the assumption that firms are profit- maximizing entities and that
managers in firms are bounded rational (Simon, 1945). Over and above these basic
assumptions, resource-based logic makes two additional issues that distinguish it from other
strategic management theories: the concept of resource heterogeneity and that of resource
immobility (Barney, 1991). These assumptions are: Resource heterogeneity: competing
firms may possess different bundles of resources and Resource immobility: these resource
differences may persist.
According to Barney (1991) the main prepositions of resource based theory are:- Factor
market competition and temporary rents. Firms that acquire or develop valuable resources
in imperfectly competitive strategic factor markets can gain at least temporary economic
rents by using them to develop and implement strategies.
Factor market competition and sustained economic rents: - Firms that utilize valuable
resources to develop and implement strategies in ways others cannot anticipate can gain
sustained economic rents. Resource heterogeneity and temporary competitive advantages: -
Firms that control valuable and scarce resources can gain temporary competitive
advantages by using them to develop and implement strategies. Resource heterogeneity and
immobility and sustainable competitive advantages: - Firms that control valuable, scarce,
and non- substitutable resources that are inelastic in supply can gain persistent competitive
advantages by using them to develop and implement strategies.

19
Barney (1991) explains that a firm is said to possess a competitive advantage when it is
implementing a value creating strategy that is not being executed by its current or potential
competitors and when the competitors are unable to duplicate the benefits of this strategy.
According to Habbershon and Williams (1999), a far-reaching perspective of the resource-
based theory suggests that unique bundles of resources and capabilities serve as a source of
competitive advantage for the firm. The objective then of resource-based theory is in
understanding how firms can acquire and keep their upper hand advantage through resource
heterogeneity (Barney, 1991). The resource-based theory also helps us to understand the
heterogeneous character of the family business. The theory opines that firms with valuable,
rare and inimitable resources have the potential of achieving superior performance (Barney,
1996; Barney et al., 2001). This view has been tended to by several researchers who
contend that resourced based theory is useful in examining strategic alliances between
firms.
Resource based theory (RBT) of the firm is the original theoretical basis for the familiness
construct (Barney, 1991; Makadok, 2001). It centers on the internal capabilities of the firm
and how these can best be used for the firm’s advantage. The theory expands our
understanding in regard to how firm resources are applied and consolidated, what makes
competitive advantage sustainable, the nature of rents, and the origins of heterogeneity
(Peteraf, 1993). Resource based theory particularly highlights the intangible resources that
influence a firm’s competitive advantage; like the uniqueness and intricacies of the
intangible resources which is usually referred to as “familiness” in family businesses.
Resource based theory has also dominated the literature in the study of entrepreneurship
and family businesses due to their simplicity of measurement. Capabilities and competence
have been found to be far weightier in explaining competitive advantage and performance
(Newbert, 2007). This makes the application of resource-based theory in the family
business context generally significant. The theory proposes that unique bundles of resources
and capabilities serve as a source of competitive advantage of the firm (Habbershon &
Williams 1999). Familiness is the set of resources resulting from the interaction between
the family, individual members and the business. As a theoretical framework, resource-

20
based theory has been key in developing a theory for family business (Chrisma et al., 2005).
The theory is likewise used to identify the resources and capabilities that make family firms
unique and to examine the family’s influence on the formation of a firm’s strategy (Chrisma
et al., 2003).
The Resource based theory was consequently most suitable for this study because it
highlights the complexities and uniqueness of the internal mechanisms in the family
business that operates in when the family and the business interact. Moreover, the resource-
based theory perspective highlights the need for a fit between the external environment
context in which the company operates and its internal capabilities. It proposes that a firm’s
unique resources and capabilities provide the premise for strategic choice hence
performance. Family business characteristics comprise of a firm’s resource base which are
either a strength or weakness and can influence the firm’s performance which in this
study’s perspective include corporate reputation, strategic conformity and differentiation
and strategic change and renewal. While numerous family firms may have similar
characteristics, founder and cultural influences and how the individual families utilize their
resources may determine their firm performance differences. This theory provides a basis
for both our independent (corporate governance structures) and our dependent variable
which is firm performance. Proper structures need to be put in place to enable strategic
utilization of the firm resources which in turn assist the firm to achieve a competitive
advantage over its competitors leading to superior long term performance.
2.2.2 Institutional theory
Institutional theory was proposed by (Meyer & Rowan, 1977) as an approach to
understanding organizations and management practices as the product of social rather than
economic pressures.
According to Scott (2004) institutional theory tends to center on the more profound and
stronger parts of social design. It respects the cycles by which structures, including
blueprints, rules, standards, and schedules, become grounded as legitimate rules for social
conduct. It tests into how these components are made, diffused, embraced, and adjusted
throughout existence; and how they fall into decrease and neglect. Institutional theory is
21
about the “homogeneity in structure, culture and output” between organizations (DiMaggio
& Powell, 1983). As claimed by Scott (2008), institutional theory is "a widely accepted
theoretical posture that emphasizes rational myths, isomorphism, and
legitimacy." Researchers building on this perspective accentuate that a key perception of
institutional theory is imitation(conforming): as opposed to optimizing their decisions,
practices, and structures, organizations look to their peers for cues to appropriate behavior.
In defining institutions, Scott (1995) intimates that there is no single and universally agreed
definition of an 'institution' in the institutional school of thought. Scott (1995) further states
that, institutions are social structures that have attained a high degree of resilience. They are
composed of cultural-cognitive, normative, and regulative elements that, together with
associated activities and resources, provide stability and meaning to social life. Institutions
are transmitted by various types of carriers, including symbolic systems, relational systems,
routines, and artifacts. Institutions operate at different levels of jurisdiction, from the world
system to localized interpersonal relationships.
Institutional theorists contend that the institutional environment can strongly have effect on
the advancement of formal structures in an organization, more profoundly than market
pressures. Innovative structures that improve technical efficiency in early-adopting
organizations are permitted in the environment. Ultimately these innovations reach a level
of legitimization where failure to adopt them is seen as "irrational and negligent". At this
point new and existing organizations will adopt the structural form even if the form doesn't
improve efficiency. Meyer and Rowan (1977) argue that often these "institutional myths"
are merely accepted formally in order for the organization to gain or maintain validity in the
institutional environment. Organizations adopt the "vocabularies of structure" common in
their environment such as specific job titles, procedures, and organizational roles. The
adoption and display of these institutionally acceptable "trappings of legitimacy" help
preserve an aspect of organizational action based on "good faith". Legitimacy in the
institutional environment helps ensure organizational survival.
However, these formal structures of legitimacy can bring down effectiveness and hamper
the organization's competitive position in their technical environment. To limit this negative

22
effect, organizations often will decouple their technical core from these legitimizing
structures. Organizations will minimize or formalize evaluation and neglect program
implementation to maintain external (and internal) confidence in formal structures while
reducing their efficiency impact.
DiMaggio and Powell (1983) infer that the final product of institutional pressure is to
increase the homogeneity of organizational structures in an institutional environment. Firms
will embrace similar structures as a result of three types of pressures. Coercive pressures,
which come from legal mandates or influence from organizations they are dependent upon;
Mimetic pressures to copy successful forms arise during high uncertainty and finally,
normative pressures to homogeneity come from the similar attitudes and approaches of
professional groups and associations brought into the firm through hiring practices.
This theory causes us to comprehend both "old" and "new" institutionalism which add
valuable viewpoint for the analysis of family businesses. "Old" institutionalism encourages
the study of structural change because of environmental pressures. "New" institutionalism
focuses on the symbolic nature of organizations. Hence the theory is relevant to this study
in as far as it offers an explanation for family businesses choosing conformance over
differentiation. It also forms a strong basis for both our independent (corporate governance
structures) and our dependent variable which is firm performance in that
Institutional theorists assert that the institutional environment can strongly influence the
development of formal structures in an organization, often more profoundly than market
pressures. Legitimacy in the institutional environment helps ensure organizational survival
which can be viewed at from a firm’s performance perspective.
Combining these two theories reveals that they are distinctive yet complementary regarding
the consequences of an organizational behavior such as the choice of instituting corporate
governance structures to aid a firm’s performance. While the institutional theory draws
attention on how prevailing institutional norms may impact market structure in general and
organizational behavior in particular, the resource based theory highlights the outcomes
rather than antecedents of a firm’s behavior. These two theories will anchor the choice of

23
the research variables, both the independent (corporate governance structures) and the
dependent variable (firm performance).
2.3. Empirical Literature Review
Different researchers have investigated the relationship between corporate governance
and the performance of firms in various dimensions. The next section discusses some
of these studies while bringing out the knowledge gaps arising.
2.3.1 Ownership Structure and Firm Performance
Scholten (2014) sought to determine the effect of total ownership and insider ownership on
firm performance in the Netherlands. The researcher used a data set of two annual
observations of 2011 and 2012 of 80 Dutch listed companies; a quadratic effect of total
ownership on firm performance measured by the return on asset-ratio was found. It was
also found that firm performance measured by the return on asset-ratio increased when
insider ownership increased. After a certain point though, firm performance decreased, and
later on increased.
García, Quevedo, and Fuente (2010) researched on the effect of ownership structure on
corporate reputation. They found that ownership concentration in the hands of the largest
shareholder erodes corporate reputation, whereas contestability of the main shareholder’s
power enhances it. Insider ownership showed a non-linear relationship with corporate
reputation, with lower corporate reputation at low and very high levels of insider
ownership. Finally, if the largest shareholder was either a pressure-resistant or a pressure-
sensitive institutional investor, as opposed to other types of largest shareholder, corporate
reputation was lower.
Che and Langli ( 2015) examined the effect of governance structure and firm performance
in private family firms in Norway using a sample that covered private limited liability firms
in Norway, spreading over 11 years. The results showed a U-shaped relationship between
family ownership and firm performance. High ownership of the second largest owner, high
percentage of family members on the board, strong family power, and small boards were

24
associated with high firm performance. In addition, the positive association between the
ownership of the second largest owner and firm performance also occurred when the
second largest owner was a member of the controlling family, but the association was
stronger when the second largest owner is a non-family member. The authors’ further tested
the relative importance of these test variables and found that ownership structure was more
associated with firm performance than board structure.
Moche (2014) sought to study the relationship between corporate governance and firm
performance of listed family-owned firms in Kenya. The author relied on corporate
governance structures namely shareholding, board composition, board functioning, control
mechanisms and disclosures and compared the structures to firm performance. Firm
performance was measured using return on equity, sales growth, net margins, as well as
Tobin q. The results of the study concluded that corporate governance is not related to firm
performance for listed family-owned business.
A review of prior studies therefore shows that most of the studies carried out on this
relationship were conducted in developed economies with minimal attention given to
developing economies. It can also be noted that most of the studies relied on financial
measures to measure performance. Minimal attention was given to non-financial measures.
This study was carried out on a developing economy (Kenya) and relied on non-financial
performance measures to measure performance.
2.3.2 Board Structure and Firm Performance
Nehme et al., (2015) investigated the relationship between corporate governance structure
and family firms’ performance in Lebanon. A survey of 40 family businesses was carried
out with semi opened questionnaires. The researchers explored the relationship between
board composition and firm performance. The study concluded that there was no
relationship between board composition and family firm performance.
Shahrier, Jessica, and Gaur (2015) instead sought to establish the relationship between
board composition and firm performance. The findings revealed that the presence of
professional directors led to superior firm performance. However, the positive effect of

25
board independence on firm performance reduced in firms that had a high-ownership
concentration. Additionally, a high-ownership concentration reduced the positive effects of
board size and board competence. The sample for this study was on the listed firms on the
New Zealand Stock Exchange between 2004 and 2007.
Likewise, Ehikioya (2009) investigated the connection between corporate governance
structures and firm performance in developing economies. The study relied on the
regression model to analyze publicly available data for a sample of 107 firms quoted on the
Nigerian stock exchange for the fiscal years 1998 to 2002. The results indicated that
ownership concentration had a positive impact on performance. Although the results
revealed no evidence to support the effect of board composition on performance, there was
significant evidence to support the fact that CEO duality adversely affected firm
performance. The results also suggested that firm size and leverage affected firm
performance. More than one family member on the board, was found to have an adverse
effect on firm performance. In their research Joshua and Nicholas (2007) investigated
corporate governance, ownership structure and firm performance of SMEs in Ghana. The
study sampled 120 firm’s. The data used in the empirical analysis was derived from the
financial statements of SMEs in both the industrial and services sectors during a six-year
period, 1998-2003. Information on governance and ownership issues was also obtained
through interviews from the management of the firms. The results showed that board size,
board composition, management skill level, CEO duality, inside ownership, family
business, and foreign ownership had a significant positive impact on profitability.
Moche (2014) sought to study the relationship between corporate governance and firm
performance of listed family-owned businesses in Kenya. The author relied on corporate
governance structures which included: shareholding, board composition, board functioning,
control mechanisms and board disclosures and compared the structures with firm
performance which was measured using return on equity, sales growth, net margins and
Tobin q. The results of the study concluded that corporate governance was not related to
firm performance for listed family-owned business.

26
From the above studies most, researchers relied on financial measures to measure
performance and their study subjects were in developed and evolved markets. This study
was conducted in Kenya which is a developing country and firm performance was
measured using non-financial measures.
2.3.3 Management Structure and Firm Performance
Hoffmann, Wulf and Stubner (2014) sought to establish the performance repercussions of
family members in the top management team on family firms in Germany. The study
investigated the relationship between long-term orientations, family involvement in the top
management team (TMT), and family firm performance. The researchers recommended that
the inclusion of family members in the top management team only enhances firm
performance if it brings about a long-term orientation among management. The study was
based on an empirical analysis involving 201 privately owned family firms from Germany.
The findings reinforced their theory that a long-term orientation helps align family and
organizational goals. As such, it represents an important mediator that links family
involvement in the top management team to performance.
Alessandro, Corbetta and Ian (2010) investigated the impact of top management team in
family-controlled companies on financial performance. The results revealed that while the
presence of a family CEO was beneficial for firm performance, the coexistence of ‘groups’
in family and non-family managers within the top management team had the potential to
create division among the subgroups and consequently affect negatively the firm
performance. There was U-shaped relationship between the ratio of family members in the
top management team and firm performance.
Patriciah, Zachary, Kennedy and Ogutu (2016) scrutinized group cohesion and strategic
context on the relationship between top management team composition and performance of
family firms. They sought to establish the effect of top management team composition on
firm performance in family firms. The study established that the impact of top management
team composition on firm performance in family firms was mediated by group cohesion.
The reason being that the family firm is fraught with many dynamics among the family

27
members some of which are not related to the business. This led to the conclusion that
whether the top management team composition in the family firm impacted performance
positively or not, was dependent upon the family’s ability to pull in the same direction that
is how cohesive the family was. In addition, it was established that family firms pursuing
complex strategies in terms of their products or markets were likely to benefit the most
from top management team composition. The reason being the strategic context triggered
deliberations and information sharing which harnessed the diverse skills availed by the top
management team composition. Thus, the strategy context moderated the relationship
between top management team composition and firm performance.
Most studies carried out on this relationship are based on developed economies with
minimal attention given to developing economies. It can also be noted that most of the
studies relied on financial measures to measure performance. This study thus sought to
address these knowledge gaps by focusing on a developing economy (Kenya) and relied on
non-financial performance measures to measure performance.
2.5 Research Gaps
From the above empirical review, several gaps have been identified. Most of the past
studies have been carried out in developed countries with proper and established
governance mechanisms; on the contrary minimal attention has been given to developing
countries where the corporate structures and mechanisms are still being established. From
the review it was also established that many studies relied on financial measures to evaluate
firm performance and minimal attention had been given to non-financial performance
measures. This study therefore sought to address this knowledge gaps. Table 2.5 presents a
summary of these knowledge gaps.

28
Table 2.5 Research Gaps
Author Title Findings Research Gap How the current
study aims to fill
the gaps
Nehme et
al..,
(2015)
The relationship
between
corporate
governance
structure and
family firms’
performance
among Lebanon
firms
A strong relationship
between duality and
Family Firm
Performance was
observed.
There was no degree
of association
between board
composition and
family firm
performance.
The study was
carried out in a
developed country
whose strategic
approach and
corporate
governance systems
are not similar to
those of Kenya.
It used accounting
measures to
measure
performance
This study was
carried out in
Kenya which is a
developing
country.
Shahrier
et al.,
(2015)
Ownership
concentration,
board
characteristics
and firm
performance
Presence of
professional
director’s increased
firm performance.
Lack of ownership
concentration led to
agency problems
resulting in inferior
performance. High-
ownership
concentration
reduced the positive
effects of board size
and board
competence.
This study used
accounting
measures to
measure
performance.
The study was also
carried out in a
developed country
with advance
corporate
governance
structures as
compared to Kenya,
which is a
developing country.
This study used
non-financial
measures to
measure firm
performance
Ehikioya
(2009)
Corporate
governance
structure and
firm
performance in
developing
economies:
Ownership
concentration had a
positive effect on
performance. No
evidence was found
to support the effect
of board
This study used
accounting
measures to
measure
performance.
It also considered
This study used
non-financial
measures to
measure firm
performance.
The study was

29
evidence from
Nigeria
composition on
performance, there
was significant
evidence to support
that CEO duality
negatively affects
firm performance.
only listed firms. carried out on
family businesses
that were not
listed on the
Nairobi stock
exchange
Scholten
(2014)
Ownership
structure and
firm
performance:
Evidence from
the Netherlands.
Firm performance
increased when
insider ownership
concentration
increased. At a
certain point firm
performance
decreased, and later
on increased.
The study only
considered a single
structure of
corporate
governance which
is ownership
structure
This study
focused on the
four structures of
mechanisms of
corporate
governance,
which included:
Board structure,
management
structure and
ownership
structure
García et
al..,(2010)
The impact of
ownership
structure on
corporate
reputation:
evidence from
Spain
Ownership in the
hands of the largest
shareholder erodes
corporate reputation.
Contestability of the
main shareholder’s
power enhances it.
There was low
corporate reputation
at low and very high
levels of insider
ownership. Finally,
if the largest
shareholder is an
institutional
investor, as opposed
to other types of
largest shareholder,
corporate reputation
is lower.
The study only
considered a single
structure of
corporate
governance which
is ownership
structure

30
Che and
Langli
(2015)
Governance
structure and
firm
performance in
private family
firms.
Ownership of the
second largest
owner, high
percentage of family
members on the
board, strong family
power, and small
boards were
associated with high
firm performance.
The positive relation
between ownership
and firm
performance also
arose when the
second largest owner
was a member of the
controlling family,
The relationship was
stronger when the
second largest owner
was a non-family
member. Ownership
structure is more
associated with firm
performance than
board structure.
This study used
accounting
measures to
measure
performance.
It also considered
only listed firms.
This study used
non-financial
measures to
measure firm
performance.
The study was
also carried out
on non-listed
family firms.
Moche
(2014)
Corporate
governance and
firm
performance of
listed family-
owned firms in
Kenya(using the
corporate
governance
structures
shareholding,
board
composition,
board
functioning,
control
mechanisms
Corporate
governance was not
related to firm
performance.
This study was
based on
accounting
measures to
measure
performance. It also
considered only
listed firms.
This study used
non-financial
measures to
measure firm
performance.
The study was
also carried out
on non-listed
family firms

31
and disclosures)
Hoffmann
et al..,
(2014)
Understanding
the performance
consequences of
family
involvement in
the top
management
team: The role
of long-term
orientation.
Inclusion of family
members in top
management only
enhances firm
performance if it
induces a long-term
orientation among
management.
The study only
considered a single
structure of
corporate
governance which
is management
structure
This study
focused on the
four structures of
mechanisms of
corporate
governance,
which included:
Board structure,
management
structure and
ownership
structure
Alessandr
o et
al..,(2010)
Top
management
teams in
family‐controlle
d companies:
‘familiness’,
‘faultiness’, and
their impact on
financial
performance.
A family CEO is
beneficial for firm
performance. There
was U-shaped
relationship between
the ratio of family
members in the top
management and
firm performance.
The considered a
single structure of
corporate
governance which
is management
structure.
This study
focused on the
four structures of
mechanisms of
corporate
governance,
which included:
Board structure,
management
structure and
ownership
structure
Patriciah
et al..,
(2016)
Group cohesion
and strategic
context on the
relationship
between top
management
team
composition
and
performance of
family firms
Firm performance
was dependent upon
the family’s ability
to pull in the same
direction, regardless
of the top
management team
composition.
The study
considered a single
structure of
corporate
governance which
is management
structure.
This study
focused on the
four structures of
mechanisms of
corporate
governance,
which included:
Board structure,
management
structure and
ownership
structure.
Source: Author 2021
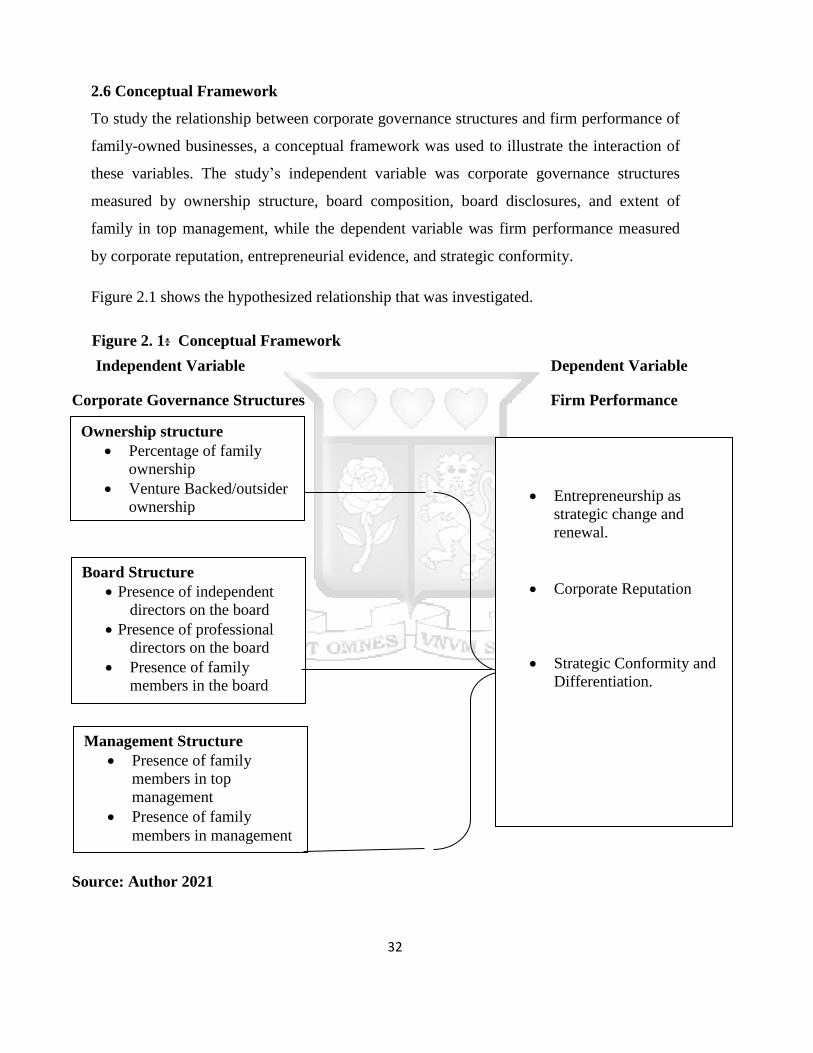
32
2.6 Conceptual Framework
To study the relationship between corporate governance structures and firm performance of
family-owned businesses, a conceptual framework was used to illustrate the interaction of
these variables. The study’s independent variable was corporate governance structures
measured by ownership structure, board composition, board disclosures, and extent of
family in top management, while the dependent variable was firm performance measured
by corporate reputation, entrepreneurial evidence, and strategic conformity.
Figure 2.1 shows the hypothesized relationship that was investigated.
Figure 2. 1: Conceptual Framework
Independent Variable Dependent Variable
Corporate Governance Structures Firm Performance
Source: Author 2021
Ownership structure
Percentage of family
ownership
Venture Backed/outsider
ownership
Board Structure
Presence of independent
directors on the board
Presence of professional
directors on the board
Presence of family
members in the board
Management Structure
Presence of family
members in top
management
Presence of family
members in management
Entrepreneurship as
strategic change and
renewal.
Corporate Reputation
Strategic Conformity and
Differentiation.

33
2.7 Operationalization of variables
This section presents a table demonstrating how the study variables were operationalized.
Table 2.7: Operationalization of study variables
Variable Indicators Data collection
measure
Supporting
literature
Ownership structure Family type
family shareholding in
business
Ownership concentration
control ownership wedge
family founder ownership
5-point Likert scale
5=strongly agree,
4=agree,
3=neutral
2=disagree
1=Strongly Disagree
Ehikioya (2009)
Moche (2014)
Mburu (2019)
Njagi (2014)
(Abor, 2017)
(Brunninge, 2004)
Board Structure
Presence of independent
directors on the board
Presence of professional
directors on the board
Presence of family members
in the board
5-point Likert scale
5=strongly agree,
4=agree,
3=neutral
2=disagree
1=Strongly Disagree
(Ehikioya 2009)
(Moche 2014)
(Mburu 2019)
Nehme et al.., (2015)
(Njagi 2014)
(Abor, 2017)
(Brunninge, 2004)

34
Management
Structure
Presence of family members
in top management.
Presence of family members
in management of the
business
5-point Likert scale
5=strongly agree,
4=agree,
3=neutral
2=disagree
1=Strongly Disagree
(Ehikioya 2009)
(Mburu 2019)
(Njagi (2014)
(Abor, 2017)
(Brunninge, 2004)
Firm performance
Entrepreneurship as strategic
change and renewal.
Corporate Reputation.
Strategic Conformity and
Differentiation
5-point Likert scale
5=strongly agree,
4=agree,
3=neutral
2=disagree
1=Strongly Disagree
(Brunninge, 2004)
Fombrun (2012)
Wartick (1992)
Waddock (2000)
Waeraas (2016)
Source: Author 2021
2.8 Chapter Summary
This chapter highlighted the theoretical and empirical review of the subject matter, that is,
corporate governance and firm performance. It provided an analysis of the topics key
concepts and discussed the nature of the relationship between the two variables. Research
gaps were identified which formed the basis for hypothesizing of relationships depicted in
the conceptual framework. The chapter winds up with the conceptualization of study
variables guided by existing literature.

35
CHAPTER THREE
RESEARCH METHODOLOGY
3.1 Introduction
This chapter presents the methodology that was used for this study. It comprises of the
research design employed, data collection instrument, method and data collection process,
data analysis techniques and data presentation methods that were employed. The chapter
ends with the ethical standards the researcher was expected to uphold.
3.2 Research Philosophy
Saunders, Lewis and Thorn hill (2009) define research philosophy as a system of
assumptions that explain the development of knowledge. Burrell and Morgan (1979) noted
that there are assumptions that a researcher is bound to make during the research, including
assumptions about human knowledge (epistemological assumptions), about the realities
encountered in research (ontological assumptions) and the extent of how own values
influence the research process (axiological assumptions). Zukauskas, Vveinhardt and
Andriukaitiene (2017) classify research philosophy into three clusters namely positivist
research philosophy, which asserts that the social world can be understood in an impartial
way where the scientist is viewed as an impartial analyst who dissociates himself from
personal views and works independently. Interpretivist research philosophy, which asserts
that the social world can be interpreted in a subjective manner. Attention is given to
understanding ways in which people experience the social world. This research philosophy
concludes that the resaerch is based on the researchers interest. Pragmatist research
philosophy is based on facts and practical results are considered important. It holds claim
that the choice of a research philosophy is determined by the research problem. Based on
the above research philosophy definantions and descriptions, this research therefore relied
on the positivist research philosophy. This study focused on facts and tested theories in an
attempt to understand the phenomenon .
3.3 Research Design
Kothari (2004) defines research design as the prearrangement of events for data collection
and analysis in a way that strives to combine significance to the purpose of the research.

36
In this study, the researcher utilized descriptive research design. Descriptive research
attempts to explore and explain while providing additional information about a topic.
Descriptive research design tries to describe what is happening in more detail, filling in the
missing parts and expanding our understanding (Kowalczyk, 2016). According to Cooper &
Schindler (2003), a descriptive study is one that finds out what, where and how of a
phenomenon. Descriptive research is used to determine the relationships between variables.
This study sought to determine the relation between corporate governance structures and
firm performance specifically for family-owned business. This research design was most
appropriate for the study due to the nature of inquest this research was carried out for and
finding the relation between the research variables.
3.4 Target Population
Population alludes to people or items (unit of analysis) with the features that a researcher
desires to study. The unit of analysis can be a person, a group, an organization, a country,
an object or any an entity that a researcher desires to draw scientific inferences about
(Bhattacherjee, 2012). As stated by Mugenda and Mugenda (2003) target population is a set
of individuals who have common observable characteristics. Zikmund (2003) also defined a
population as any complete group of people or a collection of items under consideration for
research purpose. The population for this study was family-owned businesses operating in
Nairobi County in Kenya. As per the institute of family-owned businesses in Kenya there
were 490 family businesses registered with the institute as at of January 2019, with an
annual income of 5million dollars to 10 million dollars (asoko, 2019).
3.5 Sampling Design
Kothari (2004) defines a sample design as a method for selecting a sample from a
population under study. It is the strategy the researcher uses to select items for the sample.
There are different types of sample designs depending on the representation basis and the
element selection criteria. A sample may be acquired using probability sampling through
random selection or using non-probability sampling. Element selection refers to the sample
being unrestricted or restricted. When each sample element is selected individually from the
population at large, then the sample so drawn is known as ‘unrestricted sample’, whereas all
other forms of sampling are covered under the term ‘restricted sampling’. For this study,

37
non-probability sampling, in particular, judgmental sampling procedure was used to select
the family-owned businesses. According to Frey (2018) judgment sampling occurs when
units are selected for inclusion in a study based on the professional judgment of the
researcher. The goal of judgment sampling is to deliberately select units (e.g. individual
people, events, objects) that are best suited to enable researchers to address their research
questions. This is often done when the population of interest is very small, or desired
characteristics of units are very rare, making probabilistic sampling infeasible (Frey, 2018).
To select the respondents, a judgmental sampling technique was applied in which either the
CEO, or founders or top manager of these businesses were targeted to participate in the
study.
3.5.1 Sample Size
A sample refers to a part of the target population from which data is to be obtained to
estimate the traits of the population as a whole. According to Creswell (2006), a sample
size should be large enough to ensure that the responses obtained are a true representative
of the target population. According to Bhattacherjee (2012) whenever a sample is obtained
from the population, it is important to use a sample size determination formula to put into
consideration the margins of error and confidence levels. Slovin's Formula was used to
determine the sample size for this study as shown below.
n=N/1+ (N*0.0025)
Where by:
n = no. of samples
N = total population (490)
E = error margin (0.0025)
N=490/1+ (490*.0025) = 220 were the targeted respondents
3.6 Data Collection Instrument
The study collected data using questionnaires with closed ended questions whose aim was
to enhance uniformity and obtain quantitative data. The questionnaire was divided into

38
three sections; Section A was for general or demographic information, which sought to find
out the gender, age, education level, marital status, and work experience of the respondents.
Section B contained the corporate governance structures which included ownership
structure, board structure and management structure. Section C contained the firm
performance indicators. The respondents comprised of company CEOs, top management,
and owners of the businesses as they were in charge of proper functioning of the corporate
governance structures.
3.6.1 Data Collection Procedure
A letter of introduction and assurance of confidentiality was prepared and presented to the
respondents to enable the researcher get cooperation from the respondents. Data was
collected with the aid of a structured questionnaire, which was administered face to face
after booking an appointment with the respondents. This was to ensure high response rate
and cooperation. However, owing to the Covid pandemic where physical interactions were
restricted, data was also collected using telephone interviews.
3.7 Data Analysis and Presentation
Data analysis is the process of applying statistical and/or logical techniques to describe and
illustrate, condense, and recap, and evaluate data. The data for this study was analyzed
quantitatively. The data collected was keyed in, coded, cleaned and analyzed with the aid of
the statistical package for social sciences (SPSS), with the quantitative data generated
subjected to descriptive, correlation, and regression statistical analysis.
3.8 Analytical Model
Multiple regression analysis makes it possible to use other variables to predict one variable
(Oludhe, 2011). The model shows the correlation between corporate governance structures
and firm performance as measured by entrepreneurship as strategic change and renewal,
corporate reputation, and Strategic conformity. Corporate governance structures was
measured by: - board structure, ownership structure and management structure. Regression
analysis was used to establish the relationship between corporate governance structures and
the firm performance, and the nature of this relationship was depicted using the regression
model below. The researcher chose to use correlation analysis and regression analysis due
to their ability to quantify the degree to which the variables understudy are related and the

39
capability of the models to show how much the dependent variable changes when the
independent variable changes.
Regression model
Y= β0 + β1X1 + β2X2 + β3X3 + ε
Whereby:
Y= Firm Performance
β0 = Constant term
β1 – β3 = Coefficients of determination
X1= Ownership structure
X2= Board structure
X3= Management structure
ε= Error term
3.9 Diagnostic Tests
A regression model is based on several assumptions including linear relationships between
variables, collinearity/multicollinearity, multivariate normality and homoscedasticity. The
below diagnostic tests were performed on the data collected.
3.9.1 Collinearity/multicollinearity Test
Collinearity is a situation in which the independent variables in a linear regression model
are linearly related and hence they cannot independently predict the value of the dependent
variable and this in turn reduces the statistical significance of the model (Woolridge, 2002).
3.9.2 Normality Test
Normality test is used to test if a variable is normally distributed or not. Sujianto (2009)
states that normality distribution test is a test to measure whether data has a normal
distribution. The main reason for conducting normality testing is that it is necessary for the
researcher to know whether the data involved in the research normally distributed.

40
3.10 Research Quality
This section addresses the validity and reliability of instruments. Quality research describes
the scientific process including all aspects of study design.it relates to the judgment
regarding the match between the methods and questions, selection of subjects, measurement
of outcomes, and protection against systematic bias or non-systematic bias, and inferential
error (Boaz & Ashby, 2003; Lohr, 2004; Shavelson & Towne, 2002).
To achieve a quality research, the researcher ensured that: - the research questions were true
and informing the respondent of its aim. The sample provided reliable conclusions, the
research design was suitable to answer the research question, the criteria measures
demonstrated reliability and validity for both the independent and dependent variable,
statistical tests were applied on the data obtained and ethical standards were met.
3.10.1 Internal Validity of the Instruments
Mugenda and Mugenda, (2003) defined validity as the extent to which a data collection
instrument measures what it’s intended to measure. It is the accuracy and meaningfulness of
inferences, which are based on the research results. Internal validity refers to whether the
outcomes observed in a study are due to the independent variables or experimental
manipulations investigated in the study and not to some other factor or set of factors. To
determine whether a research study has internal validity, a research should ask whether
changes in the outcome could be attributed to alternative explanations that are not explored
in the study. Studies that specifically explain how alternative explanations were ruled out
are more likely to have internal validity.
3.10.2 Construct Validity
Construct validity alludes to how much a variable, test, questionnaire or instrument measure
the theoretical concept that the researcher hopes to measure. To assess whether a study has
construct validity, a research should ask whether the study has adequately measured the key
concepts in the study. Studies that use measures that have been independently validated in
prior studies are more likely to have construct validity.

41
3.10.3 External Validity
External reliability refers to the degree to which research findings can be used to generate
conclusions relevant to similar contexts (Saunders et al., 2012). External Validity also
refers to the extent to which the results of a study can be generalized to other settings
(ecological validity), other people (population validity) and over time (historical validity).
To assess whether a study has external validity, a research consumer should ask whether the
findings apply to individuals whose place and circumstances differ from those of study
participants.
3.10.4 Reliability of the Instruments
Reliability refers to the consistency of data arising from the use of a particular research
method. Mugenda and Mugenda (2003), states that reliability is the measure of the degree
to which a research instrument yields the same result after repeated trials over a period.
This study relied on Cronbach’s alpha as a measure of reliability. Consistency and stability
in measurement of a research instrument is understood as reliability. Alpha scores ranging
from zero (no internal consistency) to one (complete internal consistency have been
furnished under the rule of thumb as furnished by Cronbach’s Alpha values of 0.9 and
above being ‘excellent’, 0.8 to be ‘good’, 0.7 to be ‘acceptable’, 0.6 to be considered as
‘questionable’,0. 5 to be deemed ‘poor’ and less than 0.5 to be ‘unacceptable’. From the test
conducted on the study variables, the variables had a Cronbach’s alpha of greater than 0.5
which was acceptable. Ownership Structure had a Cronbach’s alpha of 0.745, Board
Structure a Cronbach’s alpha of 0.822, Management Structure Cronbach’s alpha of 0.932
while Firm Performance the dependent variable had a Cronbach’s alpha of 0.768.
Table 3.1 Summary of Reliability of Cronbach’s alpha Reliability Coefficient
Variables
Number
of Items
Cronbach’s
alpha
Ownership Structure (X1) 3 0.745
Board Structure (X2) 6 0.822

42
Management Structure (X3) 3 0.932
Firm Performance (DV) 7 0.768
Source: Primary Data, 2021
3.11 Ethical Considerations
The researcher gave the respondents the assurance that the data collected was confidential
and was to be utilized for academic purposes only with no disclosure of their names. In
addition, the study participation was voluntary, and no respondent was compelled to
participate in the interview. Ethical clearance was also obtained from Strathmore
University’s Internal Review Board before commencement of data collection.
The researcher further observed the following: - Respect for persons - the research subjects
were not coerced into participating in the study and requires the protection of research
subjects who have diminished autonomy. Beneficence - the researcher ensured that the
research did not harm research subjects and minimized the risks for subjects while
maximizing the benefits for them. Justice – the researcher ensured that all forms of
differential treatment among research subjects were justified.
Informed Consent The researcher first obtained informed consent from the participants
before participating in the study. For participants to give informed consent the researcher
informed the participants of the study's purpose, content, duration, and potential risks and
benefits. The researcher informed the participants that they could stop participating in the
study at any point.
Confidentiality Unless consent is given otherwise, it is imperative that researchers keep
participants' identities confidential. Confidentiality means that participants cannot be
identified in any way. In survey research, this includes but is not limited to making sure that
participants' identifiers are not linked to their survey responses. Common identifiers include
names, social security numbers, addresses, and telephone numbers. Such Personal
Identifying Information or PII must be safeguarded.

43
Anonymity The researcher assured the respondents that they will remain anonymous.
Anonymity is an even stronger safeguard of participant privacy. If a researcher assures
anonymity, it means that the researcher is unable to link participants' names to the
information they provide.
An application was made to National Commission for Science, Technology and Innovation
(NACOSTI) for a research permit and the research permit was granted. The aim of the
permit was to assure respondents that the research was purely for academic purposes and
also assure them of the credibility of the researcher.

44
CHAPTER FOUR
DATA ANALYSIS, PRESENTATION, AND INTERPRETATION
4.1 Introduction
This chapter presents the analysis of the data that was collected in relation to corporate
governance structures and firm performance of family businesses in Kenya. The data was
analyzed and presented in the form of tables, proportions as well as charts. The section also
provides the descriptive statistics showing the frequencies of the responses while the
inferential statistics indicate the correlation and regression results of the study.
4.2. Response Rate
Primary data was collected using structured questionnaires which were mainly administered
over the telephone owing to the Covid 19 pandemic where physical interaction was limited.
Questionnaires were filled based on the responses acquired. According to Mugenda and
Mugenda (1999), a 50% response rate is adequate, 60% good and above 70% is rated very
well. Based on this assertion, the response rate for this study was at 59% which in this case
was very good. The results obtained are presented on table 4.1.
Table 4.1 Response rate
Category Questionnaires Percentage %
Response
130
59
None Response
90
41
Total
220
100
Source: Primary Data, 2021
According to Table 4.1 above, 59% of the respondents participated in the interviews while
41% did not participate. Based on the analysis the response was high and this indicated that
the study was a success.

45
4.2.1 Respondents by title
The study sought to establish how respondents were distributed in terms of gender and
further enabled the classification of employees in terms job title.
Table 4.2 Respondents by title
Frequency Percent
CEO 21 16.2
Chairman 17 13.1
CFO 30 23.1
Manager 45 34.6
Owner 17 13.1
Total 130 100.0
Source: Primary Data, 2021
According to Table 4.2, 16.2% of the total respondents were CEO’s, 13.1% chairman’s,
23.1% CFO’s, 34.6% managers and 13.1% owners of the family businesses. Majority of the
responses were availed by managers who were easily contacted and available.
4.2.2 Respondents by gender
The study sought to establish the respondent’s distribution by gender and further enabled
the classification of employees in terms of male and female.
Table 4.3 Respondents gender
Frequency Percent
Female 34 26.2
Male 96 73.8
Total 130 100.0
Source: Primary Data, 2021
From table above the total number of male respondents was 96 represented by 73.8% while
the number of female respondents was 34 represented by 26.2%. This indicated that a big
percentage of the top managers in family businesses were male showing an inclination by
family businesses to hire male managers.

46
4.2.3 Respondents marital status
Table 4.4 Respondents marital status
Frequency Percent
Married 114 87.7
Single 6 4.6
Others 10 7.7
Total 130 100.0
Source: Primary Data, 2021
Table 4.2 indicated that 114 of the respondents with a percentage of 87.7% were married, 6
of the respondents were single representing 4.6% and ten of the respondents were in the
category of others with a percentage of 7.7%.This analysis indicated that a big percentage
in top management in family businesses were married.
4.2.4 Respondents age bracket
Table 4.5 Respondents age bracket
Frequency Percent
25years to 35 years 10 7.7
36 years to 45 years 50 38.5
46years and above 70 53.8
Total 130 100.0
Source: Primary Data, 2021
Table 4.4 presented the data analysis on the age of the respondents. As per the analysis
7.7% were at the age of 25 - 35 years, 38.5% at the age of 36-45 years, and 53.8% at the
age of 46 years and above. From the study analysis the biggest percentage of the
respondents were in the age bracket 46 years and above.
4.2.5 Length of service with the organization
Table 4.6 Length of service with the organization
Frequency Percent
Less than five years 28 21.5
more than five years 102 78.5
Total 130 100.0
Source: Primary Data, 2021

47
Table 4.5 presents the analysis of respondents based on number of years worked in the
family business. Majority of the respondents with a percentage of 78.5% had worked in the
businesses for more than five years, only a small percentage of 21.5% had been in the
business for less than five years. This is an indication to family businesses retaining
employees for long with low employee turnover rates. This gives creates organizational
memory which comes in handy for future plans and strategy setting, benchmarking with
prior years.
4.2.6 Respondents level of education
Table 4.7 Respondents by level of education
Frequency Percent
College 3 2.3
University 38 29.2
Postgraduate 89 68.5
Total 130 100.0
Source: Primary Data, 2021
Table 4.7 gives analysis of respondent’s according to level of academic qualifications.
Majority of the respondents had post graduate level of education representing a 68.5%,
followed by undergraduate level with 29.2% and only three representing a 2.3% had only
college level of education. This shows that family businesses tend to have a preference for
post graduate qualifications in their managerial hiring process. Post graduate education
most oftenly exposes one to critical and analytical thinking, this provides knowledge to the
organization for strategic thinking. Employees most oftenly than not tend to think outside
the box.
4.2.7 Length of existence of the organization
Table 4.8 Length of existence of the organization
Frequency Percent
Less than five years 6 4.6
more than five years 124 95.4
Total 130 100.0
Source: Primary Data, 2021

48
Table 4.8 shows analysis of the length of existence of the family businesses that the
respondents work in.95.4% of the businesses under study had been in operation for more
than five years, only 4.6% had been in operation for less than five years. This showed an
increased sustainability of family businesses.
4.3 Descriptive results on study variables
4.3.1 Ownership Percentage
This sought to understand the percentage of ownership of family businesses in comparing
insider ownership to outsider ownership.
Table 4.9 Ownership percentage
Frequency Percent
Any other (combined
ownership )
8 6.2
Successor 3 2.3
Venture backed 49 37.7
Founder / owner 70 53.8
Total 130 100.0
Source: Primary Data, 2021
Table 4.9 shows the ownership structure and status of the family business in the study
samples.53.8% of the businesses are under founder owner which forms the majority of the
businesses, followed by venture backed family businesses with 37.7%,businesses with
combined ownership which can be termed as 50-50 ownership form 6.2% and lastly
families under successors form the least percentage 2.3%.This shows that most family
businesses running even to the third generation retain business ownership within the family.
Table 4.10. Proportion of share ownership
Frequency Percent
Non-Family members more
than 50%
11 8.5
Family Members more than
50%
114 87.7

49
Combined ownership (50%
- 50%)
5 3.8
Total 130 100.0
Source: Primary Data, 2021
Table 4.10 analysis the percentage of ownership or shares held by majorly family members
or non-family members (venture).From the analysis we can deduce that 87.7% of the
business in the study are majorly owned by family with more than 50% shares, 8.5% by
non-family with more than 50% shares and the least is the combined ownership with 3.8%
of the total population size.
Table 4.11 Generation of the family that owns/runs the company
Frequency Percent
Third Generation 14 10.8
Second generation 42 32.3
First generation 74 56.9
Total 130 100.0
Source: Primary Data, 2021
Table 4.11 presents the analysis of the generation that presently runs the family
businesses.56.9% of the businesses were run by the first generation of the family, 32.3%
were in the hands of the second generation and 10.8% were run by the third generation of the
family. This indicated that a big percentage of family businesses in Kenya were still in the
hands of the first generation.
4.3.2. Ownership Structure and firm performance
Table 4.12 presents the Principal Component Analysis (PCA) output for all the indicators
before and after extraction with a factor loadings value of more than 0.4 is presented.
Indicators with factor loading more than 0.4 were extracted and their components retained for
further univariate analysis. The result of the output loadings gave one dimension labelled as
Ownership Structure dimension with a factor loading of 0.4 and above were retained, all the
indicators under the variable Ownership Structure were retained.
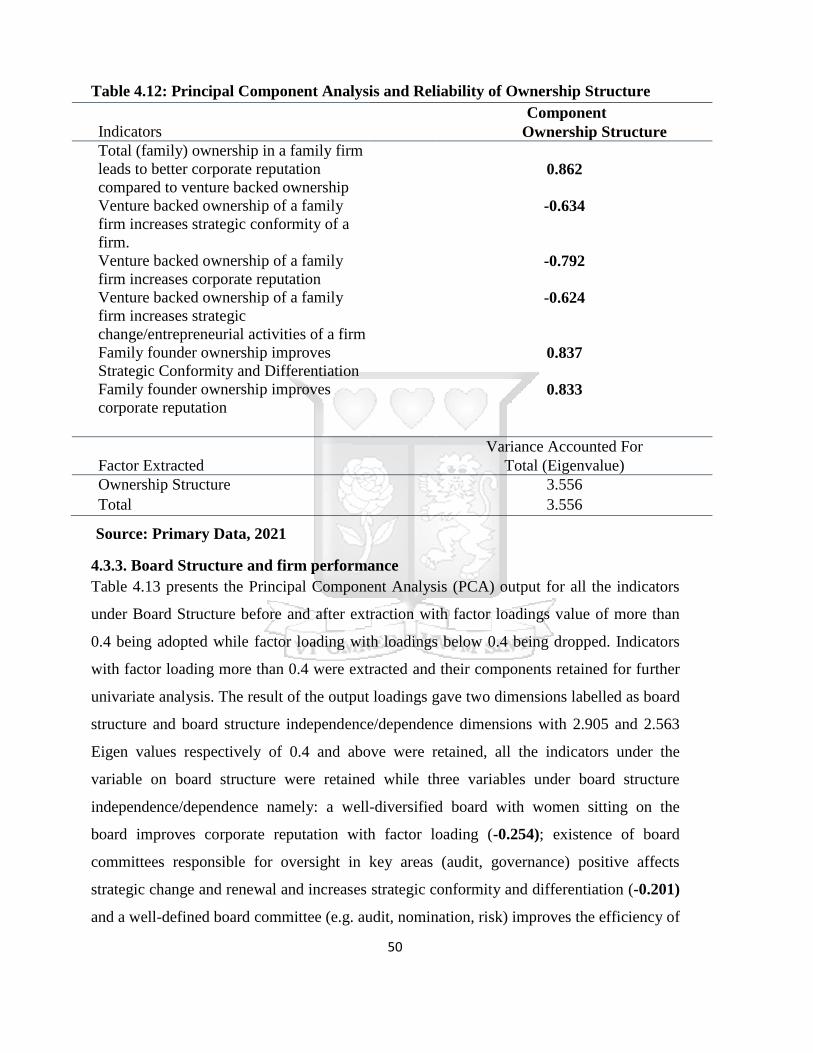
50
Table 4.12: Principal Component Analysis and Reliability of Ownership Structure
Indicators
Component
Ownership Structure
Total (family) ownership in a family firm
leads to better corporate reputation
compared to venture backed ownership
0.862
Venture backed ownership of a family
firm increases strategic conformity of a
firm.
-0.634
Venture backed ownership of a family
firm increases corporate reputation
-0.792
Venture backed ownership of a family
firm increases strategic
change/entrepreneurial activities of a firm
-0.624
Family founder ownership improves
Strategic Conformity and Differentiation 0.837
Family founder ownership improves
corporate reputation 0.833
Factor Extracted
Variance Accounted For
Total (Eigenvalue)
Ownership Structure 3.556
Total 3.556
Source: Primary Data, 2021
4.3.3. Board Structure and firm performance
Table 4.13 presents the Principal Component Analysis (PCA) output for all the indicators
under Board Structure before and after extraction with factor loadings value of more than
0.4 being adopted while factor loading with loadings below 0.4 being dropped. Indicators
with factor loading more than 0.4 were extracted and their components retained for further
univariate analysis. The result of the output loadings gave two dimensions labelled as board
structure and board structure independence/dependence dimensions with 2.905 and 2.563
Eigen values respectively of 0.4 and above were retained, all the indicators under the
variable on board structure were retained while three variables under board structure
independence/dependence namely: a well-diversified board with women sitting on the
board improves corporate reputation with factor loading (-0.254); existence of board
committees responsible for oversight in key areas (audit, governance) positive affects
strategic change and renewal and increases strategic conformity and differentiation (-0.201)
and a well-defined board committee (e.g. audit, nomination, risk) improves the efficiency of

51
board meetings and are a vital component of governance and improves an organization’s
strategic conformity and differentiation (-0.213) were dropped.
Table 4.13: Principal Component Analysis and Reliability of Board Structure
Indicators
Components
Board Board
Structure Independence/
Dependence
The Right mix of professional skills (e.g.,
marketing, strategy, international financial markets,
and audit committee expertise) on the board
enhances strategic change and renewal and
increases strategic conformity and differentiation.
0.658
0.650
A board comprising of professional independent
directors has a positive effect on strategic change
and renewal
0.709 0.588
A well-diversified board with women sitting on the
board improves corporate reputation.
0.743 -0.254
Separate chairman and CEO roles has a positive
effect on a corporate’s reputation
0.691 -0.425
Existence of board committees responsible for
oversight in key areas (Audit, Governance) positive
affects Strategic change and renewal and increases
strategic Conformity and Differentiation
0.868 -0.201
A Well-defined board committee (e.g. audit,
nomination, risk) improves the efficiency of board
meetings and are a vital component of governance
and improves an organization’s Strategic
Conformity and Differentiation.
0.881 -0.213
Factor Extracted
Variance Accounted For
Total (Eigenvalue)
Board Structure 3.496
Board Dependence or Independence 1.101
Total 4.596
Source: Primary Data, 2021
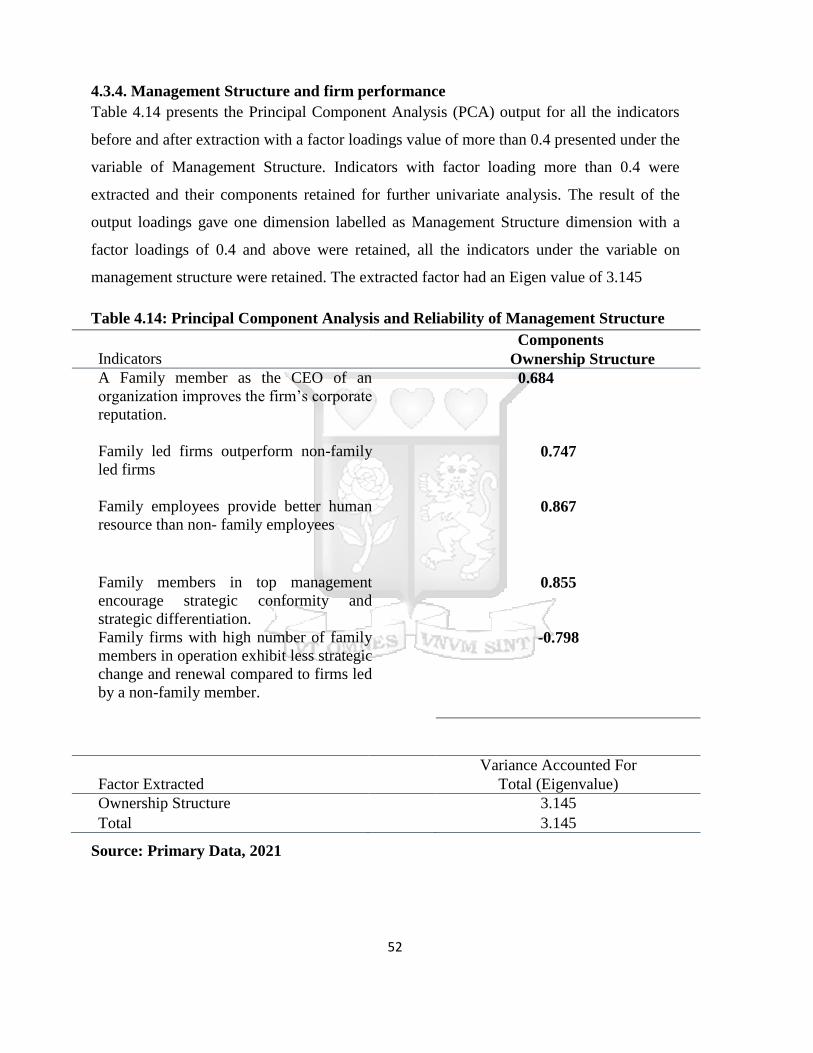
52
4.3.4. Management Structure and firm performance
Table 4.14 presents the Principal Component Analysis (PCA) output for all the indicators
before and after extraction with a factor loadings value of more than 0.4 presented under the
variable of Management Structure. Indicators with factor loading more than 0.4 were
extracted and their components retained for further univariate analysis. The result of the
output loadings gave one dimension labelled as Management Structure dimension with a
factor loadings of 0.4 and above were retained, all the indicators under the variable on
management structure were retained. The extracted factor had an Eigen value of 3.145
Table 4.14: Principal Component Analysis and Reliability of Management Structure
Indicators
Components
Ownership Structure
A Family member as the CEO of an
organization improves the firm’s corporate
reputation.
0.684
Family led firms outperform non-family
led firms
0.747
Family employees provide better human
resource than non- family employees
0.867
Family members in top management
encourage strategic conformity and
strategic differentiation.
0.855
Family firms with high number of family
members in operation exhibit less strategic
change and renewal compared to firms led
by a non-family member.
-0.798
Factor Extracted
Variance Accounted For
Total (Eigenvalue)
Ownership Structure 3.145
Total 3.145
Source: Primary Data, 2021

53
4.3.5. Firm Performance
Table 4.15 presents the Principal Component Analysis (PCA) output for all the indicators
before and after extraction with a factor loadings value of more than 0.4 presented under the
dependent variable of Firm Performance. Indicators with factor loading more than 0.4 were
extracted and their components retained for further univariate analysis. The result of the
output loadings gave two dimensions labelled as differentiation by entrepreneurial change
and corporate reputation by conformance with the Eigen values of 3.496 and 1.101
respectively.
Table 4.15: Principal Component Analysis and Reliability of Board Structure
Differentiation
by
entrepreneurial
change
Corporate
reputation by
conformance
Corporate reputation is an important indicator
of firm’s performance.
0.300
0.765
Entrepreneurial activities/strategic change
and renewal is a clear indicator of improved
firm performance
0.801 -0.225
Strategic conformity in a family firm is an
indicator of better firm performance
0.632 -0.030
An increase in entrepreneurial activity in a
firm is an indicator of a firms improved
performance.
0.821 -0.363
Strategic differentiation plays a key role in
improving a firm’s performance.
0.834 -0.076
Strategic conformity protects an
organizations reputation
0.556 0.544
Strategic differentiation increases
entrepreneurial activities in a firm which in
turn enhance an organizations performance
0.621 -0.015
Factor Extracted
Variance Accounted For
Total (Eigenvalue)
Differentiation by entrepreneurial change 3.496
Corporate reputation by conformance 1.101
Total 4.596
Source: Primary Data, 2021

54
4.4 Reliability Results
Consistency and stability in measurement of a research instrument is understood as
reliability. Alpha scores ranging from zero (no internal consistency) to one (complete
internal consistency have been furnished under the rule of thumb as furnished by
Cronbach’s Alpha values of 9 and above being ‘excellent’, 8 to be ‘good’, 7 to be
‘acceptable’, 6 to be considered as ‘questionable’, 5 to be deemed ‘poor’ and less than 5 to
be ‘unacceptable’.
Table 4.16: Summary of Reliability of Cronbach’s alpha Reliability Coefficient
Variables
Number
of Items
Cronbach’s
alpha
Ownership Structure (X1) 3 0.745
Board Structure (X2) 6 0.822
Management Structure (X3) 3 0.932
Firm Performance (DV) 7 0.768
Source: Primary Data, 2021
4.5 Pearson’s Correlation Analysis
The Pearson’s correlation analysis sought to find out whether there was any significant
relationship between the independent variables and the dependent variables. The results of
the correlation analysis for independent variables presented in table 4:17 below. The results
show that ownership structure was negatively related to board structure (-0.263 < 0.01) and
positively related to management structure (0.748 < 0.01). Board structure was negatively
related to management structure (-0.178 < 0.05). The findings for ownership structure was
observed to be positively related to firm performance with a Pearson’s Correlation
Coefficient of r = 0.233. The findings for board structure was observed to be positively
related to firm performance with a Pearson’s correlation coefficient of r = 0.243 and at
level of significance of 0.01, was statistically significant as the p-value is less than 0.01;

55
this relationship was classified as low positive effect (Hinkle et al., 2003).The findings for
management structure was observed to be positively related to firm performance with a
Pearson’s correlation coefficient of r = 0.318 and at level of significance of 0.001, was
statistically significant as the p-value is less than 0.01;
This relationship was classified as low positive effect.
Table 4.17: Pearson’s Correlation
Ownership
Structure
Board
Structure
Management
Structure
Firm
Performance
Ownership
Structure
Pearson
Correlation
1
Sig.(2-tailed)
N 130
Board
Structure
Pearson
Correlation -.263** 1
Sig.(2-tailed) .003
N 130 130
Management
Structure
Pearson
Correlation .748** -.178* 1
Sig.(2-tailed) .000 .048
N 130 130 130
Firm
Performance
Pearson
Correlation .233* .243** .312** 1
Sig.(2-tailed) .008 .005 .000
N 130 130 130 130
**. Correlation is significant at the 0.01 level (2-tailed)
*. Correlation is significant at the 0.05 level (2-tailed).
Source: Primary Data, 2021

56
4.4.1 Univariate Analysis
In this section the study sought to determine whether the corporate governance structures as
related to ownership, board and management influenced the firm performance of family-
owned businesses in Nairobi County through univariate analysis.
4.4.2. Influence of Ownership Structure on Firm Performance
The findings on ownership structure are presented in the subsequent sections.
a. Regression analysis of ownership structure and firm performance
Regression analysis was used to determine the significance of the relationship between
ownership structure and firm performance of family-owned businesses. Table 4.18 shows
the coefficient of determination was 0.360 implying that about 36 percent of the variation in
firm performance is explained by ownership structure.
Table 4.18: Model Summary for Ownership Structure
Model R
R
Square
Adjusted
R
Square
Std. Error
of the
Estimate
1 .600a 0.360 0.350 0.80603214
a. Predictors: (Constant), Percentage of Family Ownership, Venture Backed Ownership
Source: Primary Data, 2021
Table 4.19 presents the results of the Analysis of Variance (ANOVA) on ownership
structure versus firm performance of family-owned business. The ANOVA results for
regression coefficients indicate that the significance of the F is 0.0001 which is less than
0.001. This indicates that the regression model statistically significantly predicts the
outcome variable (meaning it is a good fit for the data). Ownership Structure therefore
significantly affects firm’s performance in family-owned businesses, F (2, 129) = 35.778, p
< .001, R2 = .360.

57
Table 4.19: ANOVA Analysis for Ownership Structure
Modela
Sum of
Squares df
Mean
Square F Sig.
1 Regression 46.490 2 23.245 35.778 .000b
Residual 82.510 127 0.650
Total 129.00 129
a. Dependent Variable: Firm Performance
b. Predictors: (Constant), Percentage of Family Ownership, Venture Backed Ownership
Source: Primary Data, 2021
From table 4.20, the linear regression model for this relationship is represented as:
: Y = - 0.001 + 0.715X1a + 0.509X1b.
From regression results, a unit increase in ownership structure specifically with an increase
in venture backed ownership and percentage of family ownership with 0.715 and 0.509
units respectively resulted in an increase of 71.5% and 50.9% change in Firm performance
of family owned businesses in Nairobi County. The general regression model will be
specified as
Table 4.20: Coefficients for Firm Performance
Model a
Unstandardized Coefficients
Standardized
Coefficients
t Sig. B Std. Error Beta
1 (Constant) -0.001 0.071 0.000 1.000
Venture Backed
Ownership
0.715 0.086 0.715 8.326 0.000
Percentage of
Family Ownership
0.509 0.086 0.509 5.927 0.000
a. Dependent Variable: Firm Performance
Source: Primary Data, 2021
The research sought to determine the beta coefficients of ownership structure verses firm
performance of family-owned businesses. Table 4.20; shows that there was a positive
relationship since the coefficient of venture backed Ownership and Percentage of family
Ownership was 0.715 and 0.509 which is significantly greater than zero. The t statistics
(8.326 and 5.927) was also greater than zero. This demonstrated that the determinant of

58
ownership structure had positive influence on the firm performance of family-owned
business. With the significant coefficient value of 0.001 which is less than the p-value of
0.05, the null hypothesis that there is no significant relationship between ownership
structure and firm performance in family-owned businesses in Nairobi County is rejected.
The research therefore accepts the alternative hypothesis that there exists a significant and
positive relationship between ownership structure and firm performance in family-owned
businesses in Nairobi County.
4.4.3. Influence of Board Structure on Firm Performance
The findings on board structure are presented in the subsequent sections as elaborated from
the indicators of Board composition, Women on the board, Board Committees and CEO
duality.
a. Regression analysis of Board structure and firm performance
Regression analysis to determine the significance relationship of board structure against
firm performance of family-owned businesses was conducted. Table 4.21 shows that the
coefficient of determination is 0.135; therefore, about 13.5 percent of the variation in firm
performance is explained by board structure.
Table 4.21: Model Summary for Board Structure
Model R
R
Square
Adjusted
R
Square
Std. Error
of the
Estimate
1 .368a 0.135 0.108 0.94462424
a. Predictors: (Constant), Board of Committee, Composition of Board, Separate chairman
and CEO roles has a positive effect on a corporate’s reputation, A well-diversified board
with women sitting on the board improves corporate reputation.
Source: Primary Data, 2021
Table 4.22 presents the results of the Analysis of Variance (ANOVA) on board structure
versus firm performance of family-owned businesses. The ANOVA results for regression
coefficients indicate that the significance of the F is 0.001 which is equal to 0.001. This
indicates that the regression model statistically significantly predicts the outcome variable

59
(meaning it is a good fit for the data). Board Structure therefore carries a significant effect
on firm performance in family-owned businesses, F (4, 129) = 4.892, p < .001, R2 = .135.
Table 4.22: ANOVA Analysis for Board Structure
Modela
Sum of
Squares df
Mean
Square F Sig.
1 Regression 17.461 4 4.365 4.892 .001b
Residual 111.539 127 0.892
Total 129.000 129
a. Dependent Variable: Firm Performance
b. Predictors: (Constant), Board of Committee, Composition of Board,
Separate chairman and CEO roles has a positive effect on a corporate’s
reputation, A well-diversified board with women sitting on the board
improves corporate reputation.
Source: Primary Data, 2021
From table 4.23, the linear regression model for nature of transactions determinant,
Y = β0 + β2 X 2a + β2 X 2b + β2 X 2c+ β2 X 2d Ɛ
Where;
Y = Firm Performance of Family Owned Businesses in Nairobi County
β0 = Constant (Y- Intercept)
Ɛ= Standard Error term
Β2, = Coefficient of Firm Performance equation
X2a = Board of Committee.
X2b = Composition of Board.
X2c = CEO-Duality.
X2d = Women on Board.
From regression results, a unit increase in board structure specifically with an increase in
separate chairman and CEO roles with 0.401 units resulted in an increase of 36.1% in Firm
Performance of family-owned businesses in Nairobi County. The rest of the descriptors did
not have a significant effect on firm performance of family-owned businesses. The general

60
regression model was specified as: Y = - 1.948 + 0.061X2a + 0.401X2b. - 0.012X2c. -
0.045X2d.
Table 4.23: Coefficients for Firm Performance
Model a
Unstandardized Coefficients
Standardized
Coefficients
t Sig. B Std. Error Beta
1 (Constant) -1.948 0.559 -3.482 0.001
Women on Board 0.061 0.121 0.056 0.506 0.614
CEO-Duality 0.401 0.119 0.361 3.354 0.001
Board Composition -0.012 0.096 -0.012 -0.123 0.903
Board Committee -0.045 0.113 -0.045 -0.393 0.695
a. Dependent Variable: Firm Performance
Source: Primary Data, 2021
The research sought to determine the beta coefficients of board structure firm performance
of family-owned businesses. Table 4.23 shows that there was a positive relationship with
the coefficient of CEO-duality (0.401) being significant with a t statistics score of 3.354
which was greater than zero, however Women on Board, Board Composition and Board
Committee were not significant in influencing firm performance in family-owned business
in Nairobi County. This univariate analysis demonstrated that the indicator named as
separate chairman and CEO roles has a positive effect on a corporate’s reputation and
consequently had positive influence on the firm performance in family-owned businesses in
Nairobi County.
4.4.4. Influence of Management Structure on Firm Performance
The findings on Management structure are presented in the subsequent sections as
elaborated from the indicators of Percentage of family in top management and Family
members as employees.
a. Regression analysis of Management Structure and firm performance
Regression analysis to determine the significance relationship of management structure
against firm performance of family-owned businesses was conducted. Table 4.24 shows
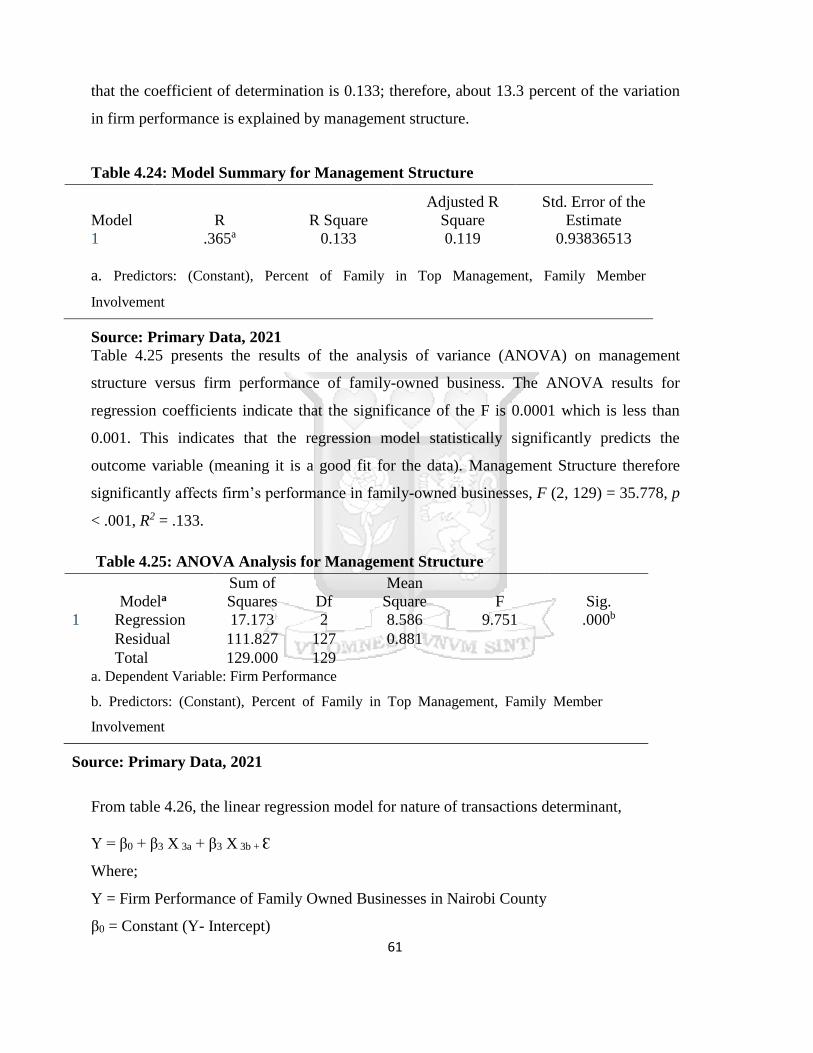
61
that the coefficient of determination is 0.133; therefore, about 13.3 percent of the variation
in firm performance is explained by management structure.
Table 4.24: Model Summary for Management Structure
Model R R Square
Adjusted R
Square
Std. Error of the
Estimate
1 .365a 0.133 0.119 0.93836513
a. Predictors: (Constant), Percent of Family in Top Management, Family Member
Involvement
Source: Primary Data, 2021
Table 4.25 presents the results of the analysis of variance (ANOVA) on management
structure versus firm performance of family-owned business. The ANOVA results for
regression coefficients indicate that the significance of the F is 0.0001 which is less than
0.001. This indicates that the regression model statistically significantly predicts the
outcome variable (meaning it is a good fit for the data). Management Structure therefore
significantly affects firm’s performance in family-owned businesses, F (2, 129) = 35.778, p
< .001, R2 = .133.
Table 4.25: ANOVA Analysis for Management Structure
Modela
Sum of
Squares Df
Mean
Square F Sig.
1 Regression 17.173 2 8.586 9.751 .000b
Residual 111.827 127 0.881
Total 129.000 129 a. Dependent Variable: Firm Performance
b. Predictors: (Constant), Percent of Family in Top Management, Family Member
Involvement
Source: Primary Data, 2021
From table 4.26, the linear regression model for nature of transactions determinant,
Y = β0 + β3 X 3a + β3 X 3b + Ɛ
Where;
Y = Firm Performance of Family Owned Businesses in Nairobi County
β0 = Constant (Y- Intercept)

62
Ɛ= Standard Error term
Β3, = Coefficient of Firm Performance equation
X3a = Percent of Family in Top Management.
X3b = Family Member Involvement.
From regression results, a unit increase in management structure specifically with an
increase in Family Member Involvement with 0.634 units resulted in an increase of 63.4%
change in Firm Performance of family-owned businesses in Nairobi County. The general
regression model was specified as: Y = - 0.001 + 0.634X3a + 0.306X3b.
Table 4.26: Coefficients for Firm Performance
Model a
Unstandardized Coefficients
Standardized
Coefficients
t Sig. B
Std.
Error Beta
1 (Constant) -
0.001
0.082 0.000 1.000
Family Member
Involvement 0.634 0.232 0.634 2.736 0.000
Percent of Family in
Top Management
0.306 0.232 0.306 1.319 0.189
a. Dependent Variable: Firm Performance
Source: Primary Data, 2021
The research sought to determine the beta coefficients of management structure verses firm
performance of family-owned businesses. Table 4.26 shows that there was a positive
relationship with the coefficient of Family Member Involvement was 0.634 was found to be
significantly greater than zero, the t statistics (2.736) was also greater than zero. However,
the coefficient on Percent of Family in Top Management was found not to be significant.
4.4.5 Multivariate Regression Results
In this section, the combined effect of the independent variables to the dependent variable
was determined by multiple regression analysis. The independent variables of ownership
structure, board structure and management structure with the dependent variable being firm
performance. The results showed that the coefficient of determination was 0.240 which
meant that 24.0 percent of variation in firm performance was explained by ownership
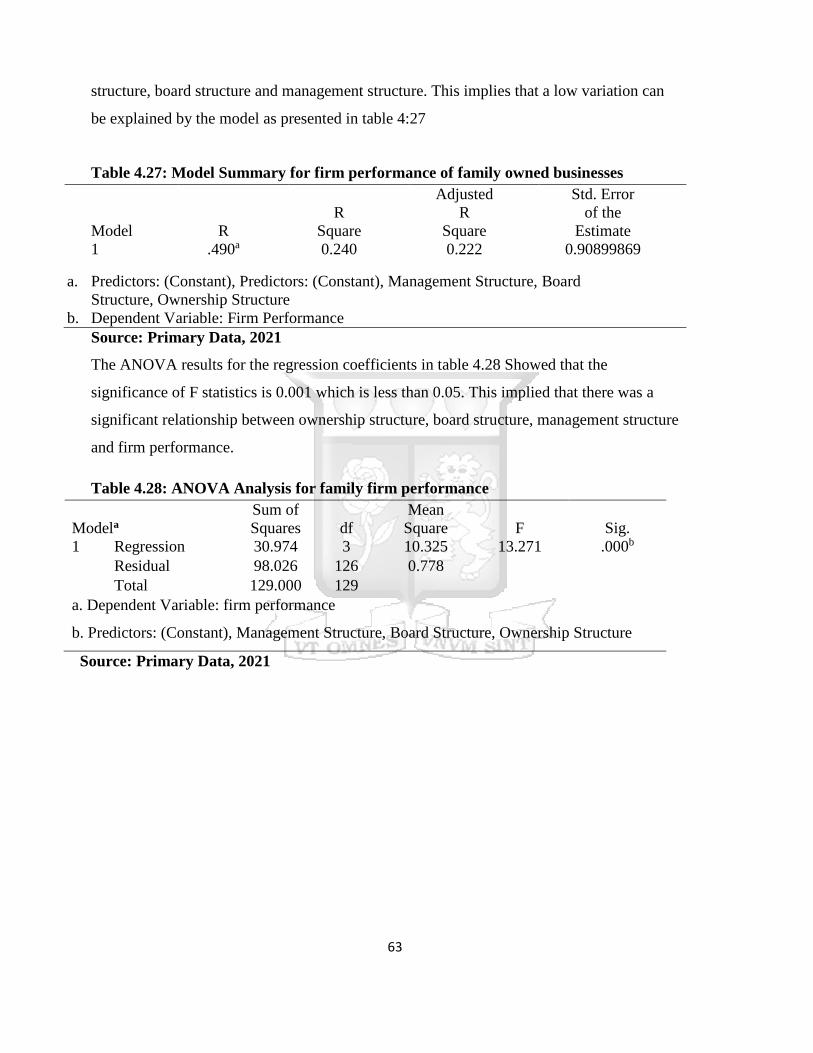
63
structure, board structure and management structure. This implies that a low variation can
be explained by the model as presented in table 4:27
Table 4.27: Model Summary for firm performance of family owned businesses
Model R
R
Square
Adjusted
R
Square
Std. Error
of the
Estimate
1 .490a 0.240 0.222 0.90899869
a. Predictors: (Constant), Predictors: (Constant), Management Structure, Board
Structure, Ownership Structure
b. Dependent Variable: Firm Performance
Source: Primary Data, 2021
The ANOVA results for the regression coefficients in table 4.28 Showed that the
significance of F statistics is 0.001 which is less than 0.05. This implied that there was a
significant relationship between ownership structure, board structure, management structure
and firm performance.
Table 4.28: ANOVA Analysis for family firm performance
Modela
Sum of
Squares df
Mean
Square F Sig.
1 Regression 30.974 3 10.325 13.271 .000b
Residual 98.026 126 0.778
Total 129.000 129
a. Dependent Variable: firm performance
b. Predictors: (Constant), Management Structure, Board Structure, Ownership Structure
Source: Primary Data, 2021


65
Table 4.29: Coefficients of firm performance of family-owned businesses
Model
Unstandardized
Coefficients
Standardized
Coefficients
t
Sig.
B Std. Error Beta (Constant) -.00001 .077
.000 1.000
Management Structure .205 .083 .205 2.467 .015
Ownership Structure
.295
.100
.295
3.052
.003
Board Structure .500 .100 .500 5.475 .000
a. Dependent Variable: Firm Performance
b. Predictors: (Constant), management structure, board structure, ownership structure
Source: Primary Data, 2021
From table 4.29, the linear regression model for firm performance in family-owned
businesses,
Y = β0 + β1 X 1 + β2 X 2 + β3 X 3 +Ɛ
Where;
Y = Firm performance in family-owned businesses
β0 = Constant (Y- Intercept)
Ɛ= Standard Error term
β1, β2, β3, β4, β5 = Coefficients of corporate governance structures on firm performance
of family-owned businesses in Nairobi County.
X1 = Management Structure
X2 = Board Structure
X3 = Ownership Structure
Firm performance of family-owned businesses in Nairobi County in terms of nature of
transactions, Y = - 0.001 + 0.205 management structure + 0.295 board structure + 0.500
ownership structure. The general regression model arrived at was Y = - 0.001 +0.205X1
+ 0.295X2 + 0.500X3. The Regression results show that a unit change in management
structure resulted to 20.5% increase in firm performance of family owned businesses;

66
unit change in board structure resulted to 29.5% increase in firm performance of family
owned businesses and a unit change in the ownership structure resulted to a 50.0%
increase in firm performance of family owned businesses.
The Beta (β) coefficients values help us to compare the relative strength in each of the
independent variable’s relationship with the dependent variable. From table 4:29
Ownership structure X1 (β=0.205, p < 0.05), Board Structure X2 (β=0.295, p < 0.05) and
Management Structure X3 (β=0.500, p < 0.05) had a significant positive effect to firm
performance of family-owned businesses in Nairobi, County.
4.5 Chapter Summary
The chapter explains how data collected was analyzed, from an overall response rate of
59 %, summary results of respondents’ titles, gender, marital status, and years of
service, education level and the length of time in operation of the businesses are
presented. The variables measured were: - ownership structure, board structure,
management structure and firm Performance. Information on the variables was
collected using questionnaires and content analysis. The questionnaires used contained
closed questions which were refined using Liker scale. The respondents made a choice
of “Agree” “strongly agree” “Neutral” “Disagree” “Strongly Disagree” answers.
Descriptive statistics such as frequencies and percentages were used in data analysis.
The analyzed data was presented in tables and pie charts. In general, the key
observation was that most of the corporate governance variables tested greatly affected
the performance of family businesses, derived from the samples obtained. The findings
revealed that corporate governance is positively and significantly related to firm
performance.
67
CHAPTER FIVE
SUMMARY OF FINDINGS, CONCLUSIONS AND RECOMMENDATIONS
5.1 Introduction
This chapter discusses the summary of findings, conclusions, recommendations and
proposes future areas of research other researchers may focus on.
5.2 Summary of the Findings
The main aim of this research was to establish the effect of corporate governance structures
on firm performance among family-owned businesses in Nairobi County Kenya. The
specific objectives of the study were: to determine the effect of ownership structure on firm
performance of family-owned businesses in Kenya, to establish the effect of board structure
on firm performance of family-owned businesses in Kenya, to examine the effect of
management structure firm performance of family-owned businesses in Kenya. The study
used descriptive design. The population of the study comprised of 220 family-owned
businesses. The sample was selected through judgmental sampling technique. Research data
was collected through questionnaires. This study used descriptive and inferential statistics
to analyze the data collected. The independent variable for the study was corporate
governance structures (ownership structure, board structure and management structure)
while the dependent variable was firm performance measured by (entrepreneurship as
strategic change and renewal, corporate reputation, strategic conformity and differentiation.
5.3 Discussion of findings
5.3.1 Effect of ownership structure on firm performance of family-owned businesses
The Regression analysis to determine the significant relationship of ownership structure
against firm performance of family-owned businesses showed that ownership structure
significantly affects firm’s performance in family-owned businesses. About 36 percent of
the variation in firm performance was explained by ownership structure. From the
regression results, a unit increase in ownership structure specifically with an increase in
venture backed ownership and percentage of family ownership resulted in a change in firm

68
performance of family-owned businesses. The study findings also relate to Che and Langli
(2015) the researchers established that high ownership of the second largest owner was
associated with high firm performance, in addition, the positive association between the
ownership of the second largest owner and firm performance also occurs when the second
largest owner is a member of the controlling family, but the association is stronger when the
second largest owner is a non-family member. García, Quevedo, and Fuente (2010)
concluded that ownership concentration in the hands of the largest shareholder erodes
corporate reputation, whereas contestability of the main shareholder’s power enhances it.
Insider ownership showed a non-linear relationship with corporate reputation, with lower
corporate reputation at low and very high levels of insider ownership. (Ehikioya, 2009)
asserts that ownership structure affects firm performance. On the contrary Moche (2014)
found that corporate governance - ownership structure, was not related to firm perfomance.
5.3.2 Effect of board structure on firm performance of family-owned businesses
The Regression analysis to establish the significant relationship of board structure against
firm performance of family-owned businesses indicated that a variation in firm
performance could be explained by board structure. Board Structure therefore carried a
significant effect on a firm’s performance in family-owned businesses. About 13.5 percent
of the variation in firm performance was explained by board structure.
The regression analysis further showed that there was a positive relationship with the
coefficient of CEO with firm performance, however women on board, board composition
and board committee were not significant in influencing firm performance in family-owned
businesses. This univariate analysis demonstrated that the indicator named as separate
chairman and CEO roles had a positive effect on a corporate’s reputation and consequently
had positive influence on the firm performance in family-owned businesses in Nairobi
County. From the regression results, an increase in board structure specifically with an
increase in separate chairman and CEO roles resulted in an increase of in firm performance
of family-owned businesses. The rest of the descriptors did not have a significant effect on
firm performance of family-owned businesses.

69
The study findings are similar to Shahrier, Jessica, and Gaur (2015) who established that
the presence of professional directors led to superior firm performance. However, the
positive effect of board independence on firm performance reduced in firms that had a high-
ownership concentration. Additionally, a high-ownership concentration reduced the positive
effects of board size and board competence. Ehikioya (2009) found significant evidence to
support the fact that CEO duality adversely affected firm performance. The results also
suggested that firm size and leverage affected firm performance. More than one family
member on the board, was found to have an adverse effect on firm performance. Joshua and
Nicholas (2007) observed that board size, board composition and CEO duality had a
significant positive impact on a firm’s performance. Contrary to these findings Nehme et
al., (2015) concluded that that there was no relationship between board composition and
family firm performance. Moche (2014) reiterated that his study findings found that board
structure had no relation to firm perfomance.
5.3.3 Effect of management structure firm performance of family-owned businesses
The Regression analysis to determine the significant relationship of management structure
against firm performance of family-owned businesses was conducted and it showed that the
about 13.3 percent of the variation in firm performance is explained by management
structure. Management Structure is therefore a significant affects firm’s performance in
family-owned businesses. From the regression results, a unit increase in management
structure specifically with an increase in family member involvement resulted in a change
in firm performance of family-owned businesses.
The regression analysis showed that there was a positive relationship with the coefficient of
family member involvement and firm performance, however, the coefficient on percent of
family in top management was found not to be significant. The study findings also relate to
Hoffmann, Wulf and Stubner (2014) the researchers recommended that the inclusion of
family members in the top management team only enhances firm performance if it brings
about a long-term orientation among management ,Alessandro, Corbetta and Ian (2010)
research results revealed that while the presence of a family CEO is beneficial for firm
performance, the coexistence of ‘groups’ in family and non-family managers within the top
management team has the potential to create division among the subgroups and

70
consequently affect negatively the firm performance.Patriciah, Zachary, Kennedy and
Ogutu (2016) established that the impact of top management team composition on firm
performance in family firms is mediated by group cohesion. The reason being that the
family firm is fraught with many dynamics among the family members some of which are
not related to the business, in addition, they established that family firms pursuing complex
strategies in terms of their products or markets were likely to benefit the most from top
management team composition.
5.4 Conclusions
The study findings indicated that corporate governance structures are pivotal in improving
or affecting a firm’s performance. The structures namely: - ownership structure, board
structure, management structure when blended improve a firm’s performance.
On the effect of ownership structure on firm performance of family-owned businesses, the
study concluded that ownership structure significantly affects firm performance. A change
in ownership structure with an increase in venture backed ownership and percentage of
family ownership resulted in a change in firm performance of family-owned businesses.
On the effect of board structure on firm performance of family-owned businesses, the study
concluded that board structure carried a significant effect on a firm’s performance in
family-owned businesses. The regression analysis indicated that there was a positive
relationship between CEO duality with firm performance. Separate chairman and CEO
roles had a positive effect on a corporate’s reputation and consequently had positive
influence on the firm performance. Separate chairman and CEO roles resulted in an
increase of in firm performance
On the effect of management structure on firm performance of family-owned businesses.
Management Structure had a significant effect on firm’s performance. An increase in
family member involvement resulted in a change in firm performance. The analysis
indicated that there was a positive relationship between family member involvement and
firm performance, however, the percentage of family members in top management was
found to be less significant in affecting firm performance. The study overall concluded that

71
corporate governance structures are very pivotal in a firm’s performance. Putting in place
proper governance structures enhances a firm’s performance.
5.5 Recommendations
From the above findings the research was able to come up with the below recommendations
to policy makers, management and theoretical recommendations/implications.
5.5.1 Hiring a professional CEO.
Most of the family firms have a family member as a CEO, this works well when the firms
have low requirements in managerial skills and a high potential for expropriation but when
the firm requires high managerial skills, using a professional CEO can help firm
performance, especially if the family has low cash‐flow rights and weak control. The study
findings indicate that separate CEO and chairman roles affect a firm’s performance.CEO
duality can affect a board’s independence. Similar research also point out that while the
presence of a family CEO is beneficial for firm performance, the coexistence of ‘groups’ in
family and non-family managers within the top management team has the potential to
create division among the subgroups and consequently affect negatively the firm
performance. It is from this findings that the researcher recommends hiring of a
professional CEO compared to a family member as a CEO.
Although family firms exhibit family involvement in ownership and management, one
important decision many family firms have to make is related to professionalization There
currently exist two, seemingly contrary, perspectives on the antecedents and consequences
of professionalization in family firms. On the one hand, scholars in developed economies
tend to believe that due to the preservation of socio-emotional wealth and the avoidance of
potential principal-agent family governance exhibits relatively less professionalization, and
professionalization often brings in undesirable results such as the rise of agency and the loss
of family socio-emotional wealth .On the other hand, scholars in developing economies
tend to endorse family firm professionalization because the majority of market players in
developing economies are non-professionalized family firms. Thereby, professionalization
may yield first-mover advantage and above-average-returns that no other approaches can
match and substitute.

72
5.5.2 Strategic differentiation.
Most family firms conform to the industry norms and standards for fear or the two
competing pressures: to look like peers to ensure social acceptance and legitimacy, and to
differentiate to gain social recognition. Family firms should look more to differentiate and
create more growth opportunities. From the theoretical basis of this research which are the
resource based theory and the institutional theory, the former asserts that a family firm is
endowed with an intangible asset which is familiness. Familiness is the set of resources
resulting from the interaction between the family, individual members and the business.
Firms that acquire or develop valuable resources in imperfectly competitive strategic factor
markets can gain at least temporary economic rents by using them to develop and
implement strategies. It can be further noted that a firm can be said to possess a competitive
advantage when it is implementing a value creating strategy that is not being executed by
its current or potential competitors and when the competitors are unable to duplicate the
benefits of this strategy, this strategy is differentiation. The later theory argues that firms
should conform to in order to gain legitimacy, there is need to differentiate in order to deal
with uncertainty and become competitive while achieving sustainability in the market place.
5.5.3 Policy recommendations
The code of corporate governance in place in Kenya favors the listed and publicly traded
companies in Kenya. Little attention has been given to family businesses which are still
emerging and commanding a share in the marketplace. Given the complexities of family
businesses, policy makers should come up with a code of corporate governance which
borrows a leaf from the code applicable to listed companies and still is accommodative to
different challenges and technicities in emerging family businesses. Guidance on the three
structures of corporate governance as outlined in this research study is very key in ensuring
continuity and sustainability of family businesses through incorporation of investors into
the business. The code should address issues of CEO duality which has an impact on a
firm’s performance. It should also outline the most acceptable ownership or shareholding
structure that gives an investor assurance of their investment.

73
5.5.4 Theoretical Implications/recommendations
This study relied on two theories, namely the resource based theory and the institutional
theory. The resource based theory asserts that a family firm is endowed with an intangible
asset which is familiness. Familiness is the set of resources resulting from the interaction
between the family, individual members and the business. Firms that acquire or develop
valuable resources in imperfectly competitive strategic factor markets can gain at least
temporary economic rents by using them to develop and implement strategies. From the
research findings when the three structures of corporate governance are combined they
provide a competitive advantage for the family firm leading to improved firm performance
and sustainability. Family businesses should strive to utilize its uniqueness in its resources
and strive to make them rare and none duplicable.
Relying on the second theory that is the institutional theory that advocates for
organizational conformity to the institutional norms in order to gain legitimacy. The theory
examines interactions between organizations and the institutional environment. Institutional
theorists contend that the institutional environment can strongly have effect on the
advancement of formal structures in an organization, more profoundly than market
pressures. Innovative structures that improve technical efficiency in early-adopting
organizations are permitted in the environment. Ultimately these innovations reach a level
of legitimization where failure to adopt them is seen as "irrational and negligent". At this
point new and existing organizations will adopt the structural form even if the form doesn't
improve efficiency. Based on this research findings, there is need for family businesses to
find a balance between conformity and differentiation to be able to create a niche in the
market and enhance their firm performance and business sustainability.
5.6 Suggestions for further research
The study indicates a positive relationship between corporate governance structures and
firm performance in family businesses and the relationship is made stronger by combining
the governance structures. Ownership structure in this study had a larger percentage
influence on firm performance as compared to management structure and board structure.
Further research should be undertaken on family business in a specific industry or sector

74
e.g. education sector or hospitality industry. Secondly, inclusion of moderating variables
could also be included in further research. Thirdly combining both quantitative and
qualitative measures as indicators of performance could be used in further research.
5.7 Limitations
When conducting the data collection exercise, the researcher experienced certain
limitations: -
Being a time when the country was facing the Covid – 19 crisis, holding a one on one
interview was a challenge following the government directive of social distancing, hence
most of the interviews were done over the telephone.
The nature of the businesses under study being family businesses information sharing was a
huge challenge despite the assurance by the researcher that the study was purely for
academic purposes.

75
REFERENCES
Alchian, A. A., & Demsetz, H. (1972). Production, information costs, and economic
organization. American Economic Review, 62, 777-795.
Alessandro, M., Corbetta, G., & Ian, C. ,. (2010). Minichilli, A. C. (2010). Top Management
Teams in Family‐ Controlled Companies: ‘Familiness’, ‘Faultlines’, and Their Impact on
Financial Performance. Journal of Management Studies, 47: doi:10.1111/j.1467-
6486.2009., , 205-222.
Anum, N., & Ghazali, M. (2010). "Ownership structure, corporate governance and corporate
performance in Malaysia. International Journal of Commerce and Management, Vol
20,issue 2,, 109-119.
Astrachan, J., & Shanker, M. (2003). Family Businesses’ Contribution to the US Economy: A
Closer Look. , . Family Business Review, 16, 211-219.
Audretsch, D., Bozeman, B., Combs, K., Feldman, M., Link, A., Siegel, D., . . . Wessner, C.
(2002). The Economics of Science and Technology. The Journal of Technology Transfer,
155-203.
Audretsch, D., Keilbach, M., & Lehmann, E. (2006). Entrepreneurship and Economic Growth. .
Entrepreneurship and Economic Growth. .
Ayyagari, M., Demirguc, K. A., & Maksimovic, V. (2011). Small vs. young firms across the
world : contribution to employment, job creation, and growth. olicy Research working
paper ; no. WPS 5631. Washington, DC: World Bank.
Azila-Gbettor, E. M., Honyenuga, B. Q., Berent-Braun, M. M., & kil, A. (2018). Structural
aspects of corporate governance and family firm performance: a systematic review. .
Journal of Family Business Management, 8(3), , 306-330.
Basco, R., & Rodríguez, M. J. (2009). Studying the Family Enterprise Holistically: Evidence for
Integrated Family and Business Systems. Family Business Review, 22(1),, 82-95.
(Nordqvist, 2010)
Bhagwat, R., & Sharma, M. (2007). Performance Measurement of Supply Chain Management: A
Balanced Scorecard Approach. . Computers & Industrial Engineering, 53, 43-62.
Bjuggern, P., & Sund, L. (2001). Strategic Decision Making in Intergenerational Succession of
Small and Medium Size Family-owned Businesse. Family Business Review, Vol. 14, Nº
1,, pp.11–23.

76
Brenes, E., Madriga, K., & Requena, B. (2011). Corporate Governance and Family Business
Performance. Journal of Business Research, 280-285.
Brunninge, O., & Nordqvist, M. (2004). Ownership structure, board composition and
entrepreneurship: Evidence from family firms and venture-capital-backed firms.
International Journal of Entrepreneurial Behaviour & Research 10, 85-105.
Castillo, J., & Wakefield, M. W. (2006). An Exploration of Firm Performance Factors in Family
Businesses: Do Families Value Only the "Bottom Line"?
Che, L., & Langli, J. C. ( 2015). Governance structure and firm performance in private family
firms. center for corporate governance research ,Working Paper no 2/2015.
Daily, C. M., Dalton, D. R., & Rajagopalan, N. (2003). Governance through Ownership:
Centuries of Practice, Decades of Research. The Academy of Management Journal, Vol.
46, No. 2 , pp. 151-158.
Dalwai, T. A. (2015). A critical review of relationshipbetween corporate governance and firm
performance: GCC banking sector perspective. Corporate Governance, Vol. 15 Issue: 1,
18-30.
DiMaggio, P. J., & Powell, W. W. (1983). The Iron Cage Revisited: Institutional Isomorphism
and Collective Rationality in Organizational Fields. . American Sociological Review,
48(2), 147–160. (Scott, 2005)
Donald, T., & Preston, L. (1995). The Stakeholder Theory of the Corporation: Concepts,
Evidence and Implications. Academy of Management Review, 20, 66-67.
Ehikioya, B. I. (2009). Corporate governance structure and firm performance in developing
economies: evidence from Nigeria", Corporate Governance. The international journal of
business in society vol. 9 Issue: 3,, 231-243.
European, C. ,. (2009). Overview Of Family–Business–Relevant Issues Research, Networks,
Policy Measures And Existing Studies
European, C. (2008). Internal Market, Industry, Entrepreneurship and SMEs. Retrieved from
European Commission website: https://ec.europa.eu/growth/smes/supporting-
entrepreneurship/family-business_en
Fatoki, O. (2014). The Causes of the Failure of New Small and Medium Enterprises in South
Africa. Mediterranean Journal of Social Sciences., 5(20), 922.

77
Fauzi, F., & Locke, S. (2012). Board structure, ownership structure and firm performance: A
study of New Zealand listed-firms. . Asian Academy of Management Journal of
Accounting and Finance. 8. , 43-67.
Ferrero, F. I., Fernández, I. M., & Muñoz, T. M. (2015). Integrating Sustainability into Corporate
Governance: An Empirical Study on Board Diversity. orporate Social Responsibility and
Environmental Management.
Fombrun, C. (2012). The building blocks of corporate reputation: Definitions, antecedents,
consequences. . The Oxford Handbook of Corporate Reputation., 94-113. (Wæraas &
Sataøen, 2016)
Frey, B. B. (2018). Measurement, and evaluation. The SAGE encyclopedia of educational
research.
García, J. B., Quevedo, ‐P. E., & Fuente, ‐S. J. (2010). The Impact of Ownership Structure on
Corporate Reputation: Evidence From Spain. Corporate Governance . An International
Review, 18: , 540-556. An International Review, 18: , 540-556, 540-556.
Grant, C., & Osanloo, A. (2014). Understanding, Selecting, And Integrating A Theoretical
Framework In Dissertation Research: Creating The Blueprint For Your “House”.
Administrative Issues Journal .
Hoffmann, C., Wulf, T., & Stubner, S. (2014). Understanding the performance consequences of
family involvement in the top management team: The role of long-term orientation.
International Small Business Journal. 34. 10.1177/0266242614550.
IFC, I. F. (2018). Corporate governance. Beograd.
Ismyrlis, V. (2019). Knowledge Management Practices in a Greek Public Sector Organization:
The Case of OAED. In Y. Albastaki, A. Al-Alawi, & S. Abdulrahman Al-Bassam (Eds.),.
Greece: IGI global.
Ittner, C., & Larcker, D. (2003). Coming Up Short on Nonfmancial Performance Measurement.
Harvard business review. 81, 88-95,139.
James, H. D., David, S., & Donaldson, L. (1997). Toward a Stewardship Theory of Management.
. The Academy of Management Review, Vol. 22, No. 1 , 20-47.
Jean, L., & Li, h. (2008). 'Wealth Doesn't Last 3 Generations: How Family Businesses Can
Maintain Prosperity.
John James Cater, I., Kidwell, R. E., & Camp, K. M. (2016). Successor Team Dynamics in
Family Firms. Family Business Review, 29 (3),, 301 - 326 .

78
Joshua, A., & Nicholas, B. (2007). Corporate governance, ownership structure and performance
of SMEs in Ghana: implications for financing opportunities. . The international journal
of business in society vol. 7 Issue: 3, , 288-300.
Kamau, G., Aosa, E., Machuki, V., & Pokhariyal, G. (2018). Corporate Governance and
Performance: An Empirical Investigation of Sugar Producing Companies in Kenya.
European Scientific Journal, 14(31):240-264., 240-264.
Kaplan, R. S., & Norton, D. P. (1992). The Balanced Scorecard –Measures that Drive
Performance. Harvard Business Review 70, no. 1, 71-79. (Lynch & Cross, 1991)
Karanja, J. (. (2012). Role of succession planning on survival of small and medium family
enterprises after retirement/death of the first generation entrepreneurs in Kenya. Prime
Journal of Business administration and Management (BAM), 2(12) , 788-802.
Kenga, S. T. (2018). The Role of Corporate Governance Practices on Firm Performance of
Medium Sized Enterprises in Kilifi County, Kenya. . The Strategic Journal of Business
and Change Management, 5(2), 639-661.
Kiilu, J. M., & Ntale, D. J. (2018). Succession Strategies and Performance of African Family
Business: An Empirical Investigation of Nairobi Central Business District of Kenya. .
European Journal of Business and Management, 10(20), 91-97.
Kotlar, J., Cuomo, F., & Zatton, S. G. (2019). Corporate Governance in Large UK Family
Firms. United Kingdom: IFB Research Foundation Report.
Kyereboah, C. A. (2008). Corporate Governance and firm perfomance in Africa:A dynamic
panel data analysis. Journal for Studies in Economics and Econometrics. 32, 1-24.
Keasey, K., Thompson, S., & Wright, M. (1997). Corporate Governance: Economic and
Financial Issues. Norfolk: Oxford University Press.
Langton, N., & Robbins, S. P. (2007). Fundamentals of Organizational Behavior. Canada:
Pearson Education.
Larcker, D. F., Richardson, S. A., & Tuna, A. I. (2005). How Important is Corporate
Governance? SSRN Electronic journal 10.2139.
Lynch, R. L., & Cross, K. F. (1991). Measure Up! Yardstick for Continuous Improvement.
Cambridge, MA: Blackwell.
Maalu, J., McCormick, D., K’Obonyo, P., & Machuki, V. (2013). Succession Strategy And
Performance Of Small And Medium Family Businesses In Nairobi, Kenya. International
Journal of Education and Research , Vol. 1 No. 6 June 2013, 1-22.

79
Malik, M. S., & Makhdoom, D. D. (2016). Does corporate governance beget firm performance in
Fortune Global 500 companies? Corporate Governance, Vol. 16 Issue: 4,, 747-764.
Mallin, C. (2010). The Modern Firm: corporate Governance & Investments. New York: Oxford
University Press.
Marlene, S. (2007). A guide to understanding theoretical and conceptual frameworks. Evidence
Based Midwifery. 5.
Meckling, J. (1976). Theory of the Firm: Managerial behaviour, agency, cost, and ownership
structure. ,. Journal of Financial Economics, 3(3), 305-360.
moche, S. w. (2014). Corporate Governance And Firm Performance Of Listed Family-Owned
Firms In Kenya. unpublished.
Monks, R., & Minow., N. (2011). Corporate Governance. West Sussex: Chichester, West
Sussex, U.K. : John Wiley & Sons.
Neely, A., Adams, C., & Kennerley, M. (2002). The Performance Prism: The Scorecard for
Measuring and Managing Business Success.
Nehme, A., Richard, J., & Georges, A. (2015). The relationship between corporate governance
structure and family firms’ performance. . EuroMed J. Management, Vol. 1, No 1.
Nordqvist, M., & Melin, L. (2010). Entrepreneurial Families and Family Firms.
Entrepreneurship and Regional Development - ENTREP REG DEV. 22., 211-239.
OECD, T. (2004). Principles of Corporate Governance. Paris: Organisation For Economic Co-
Operation And Development.
Onguka, D., Iraya, C. M., & Nyamute, W. L. (2020). Impact of Corporate Governance on
Corporate Value for Companies Listed at the Nairobi Securities Exchange 2020.
International Journal of Economics and Finance, 70.
opanga, O. b. (2013). The Relationship Between Corporate Governance And Financial
Performance: A Study Of Insurance Firms In Kenya. not published.
Padilla, A. (2000). Agency Theory, Evolution, and Austrian Economics.
Patriciah, G. ,., Zachary, B. A., Kennedy, O. ,., & Ogutu, M. (2016). Group Cohesion and
Strategic Context On The Relationship Between Top Management Team Composition
And Performance Of Family Firms: A Critical Review Of Literature. DBA Africa
Management Review January Vol 6 No.1, 2016 , 5.
Poza, E. J. (2007). Family Business, 2nd Edition. Family Business Review.

80
Richard, P. J., Devinney, T. M., Yip, G. S., & Johnson, G. (2009). Measuring Organizational
Performance: Towards Methodological Best Practice. Journal of Management, 35(3),
718–804.
Robert, S. K., & David, P. N. (1992). The Balanced Scorecard—Measures That Drive
Performance. Harvard Business Review, 79. . Harvard Business Review, 79.
Ross, S. (. (1973). Ross, Stephen. (1973). The Economic Theory of Agency: The Principal's
Problem. American Economic Review. 63. 134-39.
Scholten, M. (2014). Ownership structure and firm performance:Evidence from the Netherlands.
IBA Bachelor Thesis Conference,. Netherlands: University of Twente, Faculty of
Management and Governance. .
Shahrier, N. A., Jessica, S.-Y., & Gaur, S. (2015). Ownership concentration, board
characteristics and firm performance: A contingency framework",. Management
Decision, Vol. 53.
Taouab, O., & Issor, Z. (2019). Firm Performance: Definition and Measurement Models. .
European Scientific Journal ESJ.
Tidd, J., & Pavitt, K. (2011). Managing Innovation: Integrating Technological, Market And
Organizational Change. Chichester: John Wiley,.
Wæraas, A., & Sataøen, H. (2016). Building a Sector Reputation: The Strategic Communication
of National Higher Education. International Journal of Strategic Communication. 10, 1-
12.
Wæraas, A., & Sataøen, H. (2013). Trapped in conformity? Translating reputation management
into practice. . Scandinavian Journal of Management.10.
Waddock, S. (2000). The Multiple Bottom Lines of Corporate Citizenship: Social Investing,
Reputation, and Responsibility Audits. . Business and Society Review, 105, 323-345.
Wamaitha, L. (2016). Influence of Succession Planning Management Strategies on Performance
of Medium Sized Family Owned Businesses in Kenya. . unpublished.
Wanjiku, P. N. (2014). Njagi, P. W. (2014). The Relationship Between Corporate Governance
Practices And The Financial Performance Of Top 100 Small And Medium Enterprises In
Kenya. . not published.
Wartick, S. L. (1992). The relationship between intense media exposure and change in corporate
reputation’. Business and Society, 31,, 33–42.

81
Wright, M., Keasey, K., & Thompson, S. (1997). Corporate Governance: Economic and
Financial Issues. Norfolk: Oxford University Press.

82
APPENDICES
APPENDIX I: INTRODUCTION LETTER
THE EFFECT OF CORPORATE GOVERNANCE STRUCTURES ON FIRM
PERFORMANCE AMONG FAMILY-OWNED BUSINESSES IN NAIROBI
COUNTY- KENYA.
Dear Sir / Madam,
My name is Diana Itumbi Munyoki, a Master of Commerce student at Strathmore University. In
partial fulfillment of the master’s degree programme, I am required to carry out a research
project and write a dissertation on a contemporary subject within my field of specialization.
Among other activities, the project involves data collection and analysis.
I hereby request to gather information to be used in this research in your firm. The information
obtained will be used for this academic purpose only and will be kept confidential. The results of
the survey will not disclose any individual, company name or information in any way.
If you have any further questions about this study, you may also contact my supervisor directly,
Dr. Stella Nyongesa at [email protected]
Thank you very much for your time and cooperation.
Sincerely,
Diana Itumbi Munyoki

83
APPENDIX II: LIST OF FAMILY BUSINESSES
LIST OF FAMILY OWNED BUSINESSES IN KENYA-NAIROBI COUNTY
1 Zucchini Greengrocers Limited
2 Wood Manufacturers Ltd
3 Window Plus (E.A) Ltd
4 Warren Concrete Company
5 Victoria Courts- Mombasa Road
6 Veg-Pro Group
7 Veefarm limited
8 Up Stores
9 UNEECOPS Technologies Limited
10 Twiga Stationers & Printers Ltd
11 Twiga Foods Limited
12 Twiga Chemical Industries Limited
13 Tusker Mattresses Limited
14 Tumaini Self Service Limited
15 Tucha Wholesalers
16 Trinity Petroleum Limited
17 TransAfrica Water Systems Limited
18 Trade House East Africa ltd
19 The Copy Cat Ltd
20 The Riara Group Of Schools Ltd
21 The Karen Hospital
22 Thames Electricals Ltd.
23 Tetra Pak Limited
24 Telemas Company Limited
25 Techpak Industries Ltd
26 Super Fit Tyres
27 Sunshine Secondary School
28 Sun culture Kenya Limited
29 Success Signature Co, Ltd
30 Stat pack Industries Ltd
31 St.annahs school

84
32 St. Mary's School-Nairobi
33 Spice World Limited
34 Spectra Chemicals Kenya Limited
35 Space & Style Limited
36 SOWITEC Kenya Limited
37 Smooth Tel Data and solution ltd
38 Shamas Motor Parts Ltd
39 Shade Nett Ltd
40 Seven Seas Technologies Limited
41 Serare School Limited
42 School Equipment Production Unit
43 Sayani Investments Limited
44 Savanis Book Centre
45 Sarova Hotels Limited
46 SAP East Africa
47 Sambika Steel / Wood
48 Sai Office Supplies Limited
49 Sai Office Supplies Limited
50 Rusinga School Nairobi
51 Rupas Gift Centre Ltd
52 Rosewood Furniture Manufacturers Limited
53 Rodent kill Cleaning Co. Ltd
54 Right Choice Tours & Safaris
55 Riara University
56 Rexe Roofing Products Ltd
57 Resolution Insurance Company Limited
58 Rentco East Africa Limited
59 Real Auto Parts Limited
60 Razco Ltd
61 Ramco Printing Works Limited
62 Rai Group Limited
63 Quick Mart Limited
64 Puretech Enterprises Limited

85
65 Propack Kenya Ltd
66 Prime General Fabricators
67 PrideInn Paradise Beach Resort
68 Prideinn Hotels & Investments Limited
69 Power Point Systems E.A Limited
70 Power Governor Limited
71 Potterhouse School and Kindergarten
72 Pop Metal
73 Polyplay Limited
74 Plast Packaging Industries Limited
75 Pipe Manufacturers Ltd
76 Peponi House Preparatory School
77 Paytree Group Limited
78 Patco Industries Limited
79 Palm House Dairies Ltd
80 Packhard Limited
81 Osho Chemicals Industries Limited
82 Osaka Auto Spares
83 Orchard Juice Limited
84 Orbit Engineering Ltd
85 One Time Supply
86 Norda Industries Limited
87 Njoroge Regeru & Company Advocates
88 Njimia Pharmacy Ltd
89 Ngariama Papers & Stationers
90 New Westlands Stores Ltd.
91 New Light Junior Academy
92 Natural World Kenya Safaris
93 Naivas Supermarket Limited
94 Nairobi Water company
95 Nairobi Sports House
96 Nairobi County Secondary School Activity Fund
97 Multiple Hardware & Traders (k) Ltd

86
98 Mukiri Global Associates
99 Mukashi Africa
100 Mugoya Vegetable Shop ltd
101 Motor Rank Enterprises Ltd
102 Morison Engineering Ltd
103 Mombasa Maize Millers Ltd
104 Modern Fire Engineers
105 M-KOPA Limited
106 Mini Bakeries
107 Microskills I. T. (K) Ltd
108 Melvin Tea (K)
109 Melvin Marsh International Limited
110 Melchizedek Hospital
111 Mecol Ltd
112 Mbame Construction Company Limited
113 Mayfair Holdings Limited
114 Mawingu Dairy Farm
115 MauWest Company Limited
116 Mascal Investment company
117 Mars Wrigley Confectionery Kenya Limited
118 Mangu Auto & Hardware Ltd.
119 Makini Schools
120 Mabati Rolling Mills Limited
121 Lukenya High School Limited
122 Lloyd Masika Ltd
123 Liwan Auto Spares & Hardware Limited
124 Lavera Luiza Levi & Kenneth Michael Levi
125 Koko Networks Limited
126 kobo safaris
127 Kids Fun Supermarket
128 Khetia Drapers Limited
129 Kevian Kenya Ltd - Head Office
130 Keroche Breweries Limited

87
131 Kenya Sweets Limited
132 Kenya Expresso Tours & Safaris
133 Kenpoly Manufacturers Ltd
134 Kenchic Limited
135 Kenbro Industries Limited
136 Kenblest Limited
137 Kenafric Industries Limited
138 Kartasi Industries ltd
139 Kapa Oil Refineries Limited
140 Kamco Stainless Steel Works Ltd
141 Jomu Glassmart and Hardware
142 Jamii Telecommunications Limited
143 J & J Veterinary Ltd
144 Iway Africa Kenya Limited
145 Impala Auto Spares Limited
146 Ikram Sheet Metal Works
147 Human Capital Synergies Africa Limited
148 HACO Industries Kenya Limited
149 Grindstone Limited
150 Good Testimony Junior School Limited
151 Gilani Butchery Limited
152 Geokang Enterprises
153 Garden Veterinary Services Ltd
154 Garden Centre Ltd
155 Garbage.Com Ltd
156 Fushia Kenya Limited
157 Furniture Palace International (K) Ltd
158 Fun City
159 Fremodex Consult Ltd
160 Finsbury Trading Limited
161 Feedwaters Treatment Ltd
162 Farmers Choice
163 Fairdeal Furniture - Msa Road
88
164 Fair Link Auto Spares
165 Excel Chemicals Limited
166 Events & Promotions Ltd
167 English Press Limited
168 Empire Feeds Limited
169 Elite Renovators & General Supplies
170 Elgon Kenya Limited
171 Educate Yourself Ltd
172 East Africa Steel Structures Ltd
173 East Africa Glassware Mart Ltd
174 Drill bit ltd
175 Drick Electrotech Systems
176 Doshi & Company (Hardware) Limited
177 Doshi & Company (Hardware) Limited
178 Dodhia Packaging ltd
179 Devki Group of Companies
180 Desley Holdings (k) ltd
181 Densey Tours and Travel Ltd
182 Davis and Shirtliff Limited
183 Crown Paints Kenya PLC
184 Credible Sounds
185 Computer Pride Limited
186 Cleeveland Autotech Limited
187 Chiuri Kirui & Rugo Advocates
188 Chemicals & School Supplies Limited
189 Charlie Photographic & Video Productions
190 Chandaria Industries Limited
191 Chandarana Supermarket Limited
192 Challenge Enterprises
193 Carton Manufacturers Ltd
194 Capsule Partners Ltd (Fridah Rutere)
195 Caffe Del Duca Ltd
196 Brush Manufacturers Limited

89
197 Brooms Limited
198 Brookside Dairy Limited
199 Brands & Beyond Limited
200 Bountiful Safaris
201 Borehole masters
202 Bonfire Ventures
203 Bollore Transport & Logistics (K) Limited
204 Bobmil Industries Ltd
205 Blue Nile Rolling Mills Limited
206 Blowplast Limited
207 Biogas Power Holdings (EA) Limited
208 Bidco Oil Refineries
209 Bidco Africa Limited
210 Basco Paints
211 Autoxpress Limited
212 Autoline Parts & Hardware
213 Auto Moon Spares Ltd
214 ASHUT
215 Apex Boreholes & Engineering Ltd
216 Ansie's Laundry & Dry Cleaners
217 Animet Limited
218 Alpha Fine Foods Ltd
219 All Tymes Tents
220
Primarosa Flowers Limited

90
APPENDIX III: QUESTIONNAIRE
Please answer the questions below as precisely and truthful as possible. Any information
provided will be held with strict confidentiality and anonymity. In addition, your answers will
only be used for academic purposes only. Kindly tick your responses against each question in the
spaces provided. The information provided here will be used solely for academic purposes and will be
treated with maximum confidentiality.
SECTION A: DEMOGRAPHIC INFORMATION
Name of the Organization………………………………………………….
1. Which of the following is your current title? CEO[ ] Chairman [ ] CFO [ ] Manager [ ]
Owner [ ]
2. Gender Female [ ] Male [ ]
3. Marital status Married [ ] Single [ ] Others [ ]
4. Age Bracket: Below 25 Years [ ] 25 to 35 Years [ ] 36 to 45 Years [ ] 46 years and above [ ]
5. How long have you worked for your current organization? Less than five years [ ] more than
five years [ ]
6. State your highest level of education
Secondary School [ ] College [ ] University [ ] Postgraduate [ ]
7. For how long has your organization been in existence? Less than five years [ ] more than five
years [ ]

91
SECTION B: CORPORATE GOVERNANCE STRUCTURES
This Section is concerned with assessing the role of corporate governance structures.
B1. Ownership Structure
8. Please indicate the status of ownership of this company.
Founder / owner 4 Venture backed 3
Successor 2 Any other 1
9. Please indicate the proportion of share ownership held by family and non-family
Family Members 2 Non family members (venture backed) 1
10. What generation of the family owns/runs the company?
First generation 3 Second generation 2
Any other 1
This likert scale seeks your opinion regarding ownership structure of the organization. To what extent
do you agree with the following statements in relation to ownership structure? Using a scale of 1
to 5 please tick the number corresponding to your opinion for each question.
# Statement
Str
on
gly
dis
agre
e
Dis
ag
ree
Neu
tral
Agre
e
Str
on
gly
ag
ree
1 2 3 4 5
11 Total (family) ownership in a family firm
leads to better corporate reputation

92
compared to venture backed ownership
12 Venture backed ownership of a family firm
increases strategic conformity of a firm.
13 Venture backed ownership of a family firm
increases corporate reputation.
14 Venture backed ownership of a family firm
increases strategic change/entrepreneurial
activities of a firm.
15 Family founder ownership improves
Strategic Conformity and Differentiation
16 Family founder ownership improves
corporate reputation
B2.Board Structure
17. Does your organization have a formal board?
Yes 2 No 1
18. If yes, please indicate the composition of the board
Family members 2 Non Family Members 1
19. How often does the board of directors meet?

93
Regularly 3 Not Regularly 2 Not at all 1
20. What is the average level of education of board members in your organization?
College 1 Undergraduate 2 Post
graduate 3
To what extent do you agree with the following statements in relation to the board composition?
Using a scale of 1 to 5 please tick the number corresponding to your opinion for each question.
STATEMENT
1 2 3 4 5
Str
on
gly
dis
agre
e
dis
agre
e
Neu
tral
Agre
e
Str
on
gly
agre
e
21 The Right mix of professional skills (e.g., marketing,
strategy, international financial markets, and audit
committee expertise) on the board enhances Strategic
change and renewal and increases Strategic
Conformity and Differentiation
22
A board comprising of professional independent
directors has a positive effect on strategic change and
renewal
23 A well-diversified board with women sitting on the
board improves corporate reputation.
24 Separate chairman and CEO roles has a positive effect
on a corporate’s reputation

94
25
Existence of board committees responsible for
oversight in key areas (Audit, Governance) positive
affects Strategic change and renewal and increases
Strategic Conformity and Differentiation
26
A Well-defined board committee (e.g. audit,
nomination, risk) improves the efficiency of board
meetings and are a vital component of governance and
improves an organization’s Strategic Conformity and
Differentiation.
B3.Family in Top Management Structure
27. Please indicate the composition of the top management team in this company.
Family members more
than 5 4
Family members less
than 5
3
Non family members
more than 5
2 Non family members
less than 5
1
To what extent do you agree with the following statements in relation to the Family in top
management and Firm performance? Using a scale of 1 to 5 please tick the number
corresponding to your opinion for each question.

95
STATEMENT
Str
on
gly
dis
agre
e
dis
agre
e
neu
tral
agre
e
Str
on
gly
agre
e
1 2 3 4 5
28 A Family member as the CEO of an organization
improves the firm’s corporate reputation
29 Family led firms outperform non family led firms
30 Family employees provide better human resource than
non family employees
31 Family members in top management encourage
strategic conformity and strategic differentiation.
32 Family firms with high number of family members in
operation exhibit less strategic change and renewal
compared to firms led by a non family member.

96
SECTION C: FIRM PERFORMANCE
To what extent do you agree with the following statements in relation Firm performance in a
family firm? Using a scale of 1 to 5 please tick the number corresponding to your opinion for
each question.
STATEMENT
Str
on
gly
dis
agre
e
dis
agre
e
neu
tral
agre
e
Str
on
gly
agre
e
1 2 3 4 5
33 Corporate reputation is an important indicator of firm’s
performance.
34 Entrepreneurial activities/strategic change and renewal
is a clear indicator of improved firm performance
35 Strategic conformity in a family firm is an indicator of
better firm performance
36 An increase in entrepreneurial activity in a firm is an
indicator of a firms improved performance.
37 Strategic differentiation plays a key role in improving a
firm’s performance.
38 Strategic conformity protects an organizations

97
reputation
39 Strategic differentiation opens up an organization to
increased entrepreneurial activities which in turn
enhance an organizations performance.
THANK YOU VERY MUCH FOR YOUR COOPERATION.

98
APPENDIX IV: NACOSTI RESEARCH LICENCE

99
APPENDIX V: STRATHMORE ETHICS APPROVAL LETTER.