Embed Size (px)
Citation preview
Dedication and Note of Thanks II
The compatibility of lean and innovation -
The coevolution of lean management and
innovations in the automotive industry
Dissertation to obtain the doctoral degree of Economic Sciences
(Dr. oec.)
Faculty of Business, Economics and Social Sciences
University of Hohenheim
Institute of Economics
submitted by
Carolin Pischl (geb. Lorber)
from Grainau
2021
Date of Disputation: December 6, 2021
Examiner: Univ.-Prof. Dr. Bernd Ebersberger, University of Hohenheim
Supervisor: Univ.-Prof. Dr. Andreas Pyka, University of Hohenheim
Second Reviewer: Prof. Dr. Alexander Gerybadze, University of Hohenheim

Dedication and Note of Thanks II
Dedication
For my father.
Note of Thanks
I would like to take this opportunity to thank Prof. Dr. Andreas Pyka, Head of the Institute for
Innovation Economics at the University of Hohenheim, who gave me the opportunity to do this
work under his leadership.
I would particularly like to thank my husband, Stephan Pischl, and siblings, Dr. Verena
Wörndle and Günter Lorber, for the unrestricted, loving and versatile support during my
dissertation.
Foreword III
Foreword
In the automotive industry, original equipment manufacturers (OEMs) face the challenge of
being innovative and lean at the same time. This ambidexterity influences their research and
development strategy as well as their production system strategy. Considering that until today
no consistent definition exists of innovation within the literature, a multidimensional approach
is used in this work, which focuses on three main objectives to analyse the compatibility of lean
and innovation. Within the theoretical background, innovations are characterised based on their
origin (generated or adapted innovation), type (process, product or organisational innovation),
and intensity (incremental or radical innovation). Embedding this characterisation into the
lifecycle theories of industries, technologies, and products displays the resulting complexity
and leads to the drawing of connections between state decisions (laws and regulations) and
society (megatrends), thereby creating a holistic theoretical framework in which OEMs have to
align their production system strategy.
The first objective of this work is to create a deeper understanding of the ambidexterity
of the patent structure within the automotive industry focusing on OEMs and their production
systems. The coevolution of lean und innovation is analysed in a long-term view using a
statistical patent analysis. Until today, the question of whether companies should set their
priorities in explorative or exploitative inventions to generate innovations has not been clarified
explicitly. Therefore, a model combining ambidexterity (exploitation and exploration) with
leagility (lean and agile) is defined and tested to obtain an enhanced understanding that the
combination of being agile and being lean plays a key role within a lean production system and
has a main influence on innovation.
The second objective is to propose how a production system can successfully cope with
external/adapted (incremental and radical innovation) innovation using lean principles. A
model focusing on the target orientation of new concepts, methods, and technologies is defined
and tested to obtain an enhanced understanding that lean must be integrated into the selection
and evaluation process of innovations projects within the production system to ensure target
orientation and make it possible to cope with innovation successfully.
The third objective is to demonstrate how lean principles can be successfully integrated
into innovation projects using augmented reality (AR) in assembly training. Modern
workplaces equipped with large screens provide new employees with 2D and 3D information
about the current task. Workers receive additional visual or haptic information through pick-to-
light systems to prevent picking mistakes or smart tools, such as a screwdriver with torque and

Foreword IV
rotation angle monitoring. Over the last years, a various range of AR systems have been
proposed. This shows that assembly training with head-mounted displays using AR and taking
lean principles into consideration are as good as being trained by a trainer, which provides an
enhanced understanding that lean principles must be integrated in process and product
innovation projects to achieve the optimal output and ensure smooth implementation in the
production system.
Table Overview V
Table overview
Foreword……………………………………………………………………………………...III
Table overview………………………………………………………………………………...V
Table of contents……………………………………………………………………………...VI
List of figures…………………………………………………………………………………IX
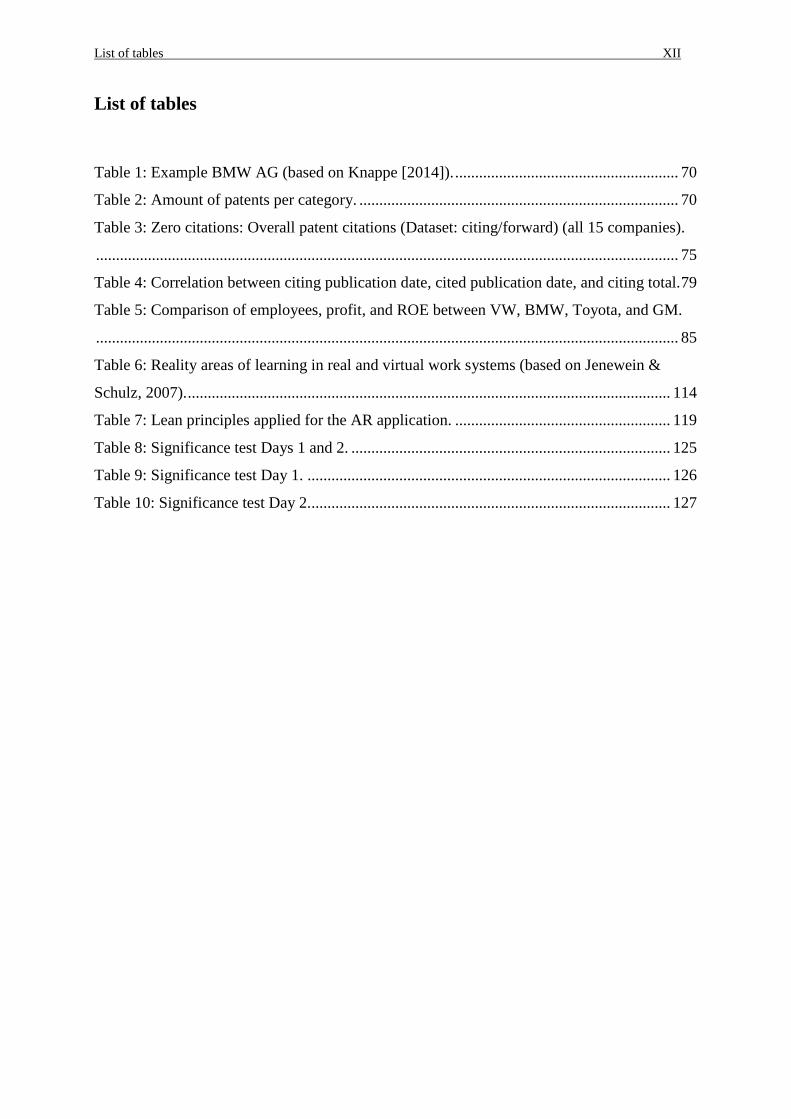
List of tables…………………………………………………………………………………XII
List of abbreviations………………………………………………………………………...XIII
1. Introduction……………………………………………………………………………1
2. Theoretical Background………………………………………………………………11
3. Compatibility of lean and Innovation in an industry on a macro level perspective -
Ambidexterity and Innovation Patterns in the Automotive Industry…………………………63
4. Compatibility of Lean and Innovations in a Company on a meso level perspective - An
Integrated Framework Approach……………………………………………………………..92
5. Compatibility of Lean and Innovations in a Production System on a micro level
perspective - Empirical Use Cases…………………………………………………………..112
6. Conclusion…………………………………………………………………………...145
Bibliography…………………………………………………………………………………148
Appendix…………………………………………………………………………………….164
Table of contents VIII
Table of contents
Foreword .................................................................................................................................. III
Table overview .......................................................................................................................... V
Table of contents ...................................................................................................................... VI
List of figures ........................................................................................................................... IX
List of tables ............................................................................................................................ XII
List of abbreviations .............................................................................................................. XIII
1. Introduction ........................................................................................................................... 1
1.1. Introduction to the topic and definition of the problem .................................................. 3
1.2. Objectives of the study .................................................................................................... 6
1.3. Structure of the study ...................................................................................................... 8
2. Theoretical Background ...................................................................................................... 11
2.1. Innovation, its link to change and resistance influenced by type, origin, and intensity 11
2.1.1. Innovation Type—Product, Process, and Organisation and the Influence on
and of the Human Factor................................................................................................ 16
2.1.2. The Origin of Innovation—Generation and Adaption and the Influence on and
of the Human Factor ...................................................................................................... 19
2.1.3. Intensity of Innovation and its Impact—Radical, Incremental, and Disruptive
Innovations and Their Influence on and of the Human Factor ...................................... 23
2.1.4. Influence of Type, Origin, and Intensity of Innovation on Society, Politics,
and Laws on the Example of the Automobile ................................................................ 26
2.2. Life cycle theories and the implications on innovation ................................................. 28
2.2.1. The Industry and the Market Life Cycle ........................................................ 29
2.2.2. The Product Life Cycle ................................................................................... 31
2.2.3. The Technology Life Cycle ............................................................................ 32
2.2.4. Redesign of the Life Cycles ............................................................................ 33
2.3. Knowledge and innovation networks and ambidexterity—Influence on the Production
System ................................................................................................................................. 35
2.3.1. Productions System—Knowledge and Innovation Networks ........................ 37
2.3.2. Production Systems—Ambidexterity and Innovation .................................... 39
2.4. Complexity in the context of innovation—Complex products in complex systems ..... 42
2.4.1. Complexity in the Product .............................................................................. 42
2.4.2. Complexity in the Product Production Process .............................................. 44
2.4.3. Complexity in the Social System .................................................................... 45
2.4.4. Complexity in the Network ............................................................................ 47
2.4.5. Complexity Through Political Instabilities ..................................................... 49
Table of contents VIII
2.4.6. Complexity at the Macro, Meso, and Micro Levels ....................................... 51
2.5. Link between innovation and lean management/production and the link to evolutionary
economics ............................................................................................................................ 53
2.5.1. Lean: The Upcoming of Lean and its Link to Innovation in the Automotive
Industry 54
2.5.2. Agile: The Upcoming of Agility and the Link to Innovation in the
Automotive Industry ...................................................................................................... 57
2.5.3. Lean vs. Agile: Similarities and Differences .................................................. 60
3. Compatibility of Lean and Innovation in an Industry at a Macro-Level Perspective—
Ambidexterity and Innovation Patterns in the Automotive Industry ....................................... 63
3.1. Leagility and ambidexterity—Two standalone concepts? ............................................ 63
3.2. Combining leagility and ambidexterity in one framework ........................................... 64
3.3. Comparison of explorative and exploitative patent structure of OEMs and the influence
on and of a lean production system ..................................................................................... 65
3.3.1. Explorative and Exploitative Patent Structure of OEMs ................................ 66
3.3.1.1. Method: Patent Analysis ................................................................................. 67
3.3.1.2. Dataset Patent Analysis .................................................................................. 69
3.3.1.3. Results: Patent Analysis ................................................................................. 74
3.3.2. Influence on and of a Lean Production System of OEMs .............................. 80
3.3.2.1. Regression Analysis ..................................................................................... 811
3.3.2.2. Dataset Regression Analysis ........................................................................ 811
3.3.2.3. Results Regression Analysis ......................................................................... 822
3.4. Compatibility on a macro level—Industry development and remaining concepts ....... 89
4. Compatibility of Lean and Innovations in a Company at a Meso-Level Perspective—An
Integrated Framework Approach ............................................................................................. 92
4.1. Selection and evaluation of innovation projects based on lean principles .................... 92
4.1.1. Industry 4.0 and Lean Management ............................................................... 94
4.1.2. Methodology and Aim of the Research .......................................................... 96
4.1.3. Results—A Multi-Dimensional Capability Maturity Model .......................... 97
4.1.3.1. Maturity Model Development ........................................................................ 97
4.1.3.2. Procedure Model Development .................................................................... 106
4.1.4. Limitation ..................................................................................................... 108
4.1.5. Prospects ....................................................................................................... 109
4.2. Compatibility on a meso level—Vision and goal formation of companies ................ 110
5. Compatibility of Lean and Innovations in a Production System from a Micro Level
Perspective—Empirical Use Cases ........................................................................................ 112
5.1. Performance/execution of an innovation project using lean principles in production
training 4.0 ......................................................................................................................... 112
Table of contents VIII
5.2. Face to face training vs. head mounted display training—Can AR be used in training
sessions and how can lean principles help/support innovations? ...................................... 115
5.2.1. AR-based training ......................................................................................... 116
5.2.2. Lean Approach in AR-Based Assembly Training Sessions ......................... 118
5.2.3. Technology ................................................................................................... 120
5.2.3.1. Hardware ...................................................................................................... 120
5.2.3.2. Software ........................................................................................................ 121
5.2.4. User Study .................................................................................................... 122
5.2.4.1. Design ........................................................................................................... 122
5.2.4.2. Apparatus and Setup ..................................................................................... 123
5.2.4.3. Procedure ...................................................................................................... 124
5.2.4.4. Participants ................................................................................................... 124
5.2.4.5. Results .......................................................................................................... 124
5.3. Value stream analysis—Can AR training also be used in complex tasks such as value
stream analysis and how should AR training sessions be designed for more complex
industrial training tasks? .................................................................................................... 128
5.3.1. AR-Based Value Stream Analysis ................................................................ 128
5.3.2. Lean Approach in AR-Based Value Stream Analysis Training ................... 130
5.3.3. Technology—Hardware and Software ......................................................... 130
5.3.4. User Study .................................................................................................... 132
5.3.4.1. Design ........................................................................................................... 132
5.3.4.2. Apparatus and Setup ..................................................................................... 132
5.3.4.3. Procedure ...................................................................................................... 135
5.3.4.4. Participants ................................................................................................... 135
5.3.4.5. Results .......................................................................................................... 135
5.4. Compatibility at a Micro level—Conclusion of the Use Cases .................................. 142
6. Conclusion ......................................................................................................................... 145
Bibliography ........................................................................................................................... 148
Appendix ................................................................................................................................ 164
List of figures IX
List of figures
Figure 1: Reference scheme of coupled progress functions (own representation based on
Grupp, 2013). ............................................................................................................................. 3
Figure 2: Picture of the content. ................................................................................................. 8
Figure 3: Interaction between innovation types (own representation, based on Utterback and
Abernathy [1975] and Choi, Narasimhan, and Kim [2016]) .................................................... 18
Figure 4: Life cycles seen in the old way (own representation based on Klepper and Gort
[1982], Pyka [2000], and Taylor and Taylor [2012]). .............................................................. 32
Figure 5: Life cycles seen in the new way, Generelles Beispiel (own representation based on
startup, volatility. and technology shifts). ................................................................................ 34
Figure 6 Supply chain as a part of the production system (own representation). .................... 37
Figure 7: The production system as a part of the innovation network (own representation,
based on Hauschildt [1997], p. 73). ......................................................................................... 39
Figure 8: Increase in variation combinations over time (see Becker [2007], pp. 27 ff.).......... 43
Figure 9: The four industrial revolutions (own representation based on Stearns[2018]) ......... 45
Figure 10: Leagility and ambidexterity framework (self-created representation). .................. 65
Figure 11: Improvements, extensions, generational change, and market novelties (own
representation based on Booz-Allen and Hamilton [1982] and Ringen, Holtskog, and
Martinsen [2012]). .................................................................................................................... 66
Figure 12: Patents drive strain (Electric H01/H02 + Combustion F01/F02). .......................... 71
Figure 13: Patents drive strain (Electric H01/H02 + Combustion F01/F02) for five OEMs. .. 73
Figure 14: Overall patent citations (Dataset: citing/forward) (all 15 companies). ................... 75
Figure 15: Patent citations (five companies). ........................................................................... 76
Figure 16: Patents combustion (all 15 companies)…………………………………………...76
Figure 17: Patents electric (all 15companies)………………………………………………...76
Figure 18: Patents combustion and electric (five chosen companies)...................................... 77
Figure 19: Drive strain citing publication date. ........................................................................ 78
Figure 20: Combustion citing publication date. ....................................................................... 78
Figure 21: Electro citing publication date. ............................................................................... 78
Figure 22: Drive train cited publication date. .......................................................................... 78
Figure 23: Combustion cited publication date. ........................................................................ 78
Figure 24: Electro cited publication date. ................................................................................ 78
Figure 25: Model regression analysis. ...................................................................................... 81
List of figures X
Figure 26: Explorative patents per employee. .......................................................................... 82
Figure 27: Exploitative patents per employee. ......................................................................... 83
Figure 28: Explorative Patents per model / product. ................................................................ 83
Figure 29: Exploitative patents per model / product. ............................................................... 84
Figure 30: Regression analysis for VW—Impact of employees, profit, and ROE on
exploration and exploitation. .................................................................................................... 86
Figure 31: Regression analysis for BMW—Impact of employees, profit, and ROE on
exploration and exploitation. .................................................................................................... 87
Figure 32: Regression analysis for Toyota—Impact of employees, profit, and ROE on
exploration and exploitation. .................................................................................................... 88
Figure 33: Regression analysis forFord—Impact of employees, profit, and ROE on
exploration and exploitation. .................................................................................................... 89
Figure 34: Exemplary itemization for hierarchical domains within the capability maturity
model, extending the model of Spath et al. (2017). ................................................................. 98
Figure 35: Schematic of the capability maturity levels across aggregation niveaus. ............... 99
Figure 36: Exemplary artefact interdependencies across concepts, methods, and technologies.
................................................................................................................................................ 101
Figure 37: Trajectory of the target vector in dependency to the aspired configuration ( based
on Schuh et al.[2017] and Morlock et al.[2016]). .................................................................. 102
Figure 38:Continous improvement steps (based on Kostka and Kostka, 2013) .................... 103
Figure 39: Schematic of the functionality of the paradigm integrated capability maturity
model. ..................................................................................................................................... 106
Figure 40: Unidirectional and bottom-up approach as a result of operational visibility of
methods and technologies. ..................................................................................................... 107
Figure 41: Procedure model for the lean–Industry 4.0 transformation. ................................. 108
Figure 42: Fabric layout learning factory. .............................................................................. 113
Figure 43: The 4-step methodology for work instructions. .................................................... 115
Figure 44: Lean principles. ..................................................................................................... 118
Figure 45: Microsoft HoloLens front view sensor overview. ................................................ 120
Figure 46: Software level structure. ....................................................................................... 121
Figure 47: Working space. ..................................................................................................... 123
Figure 48: Instructions by trainer (group A)…………………………………………...……124
Figure 49: Instructions by HoloLens (group B). .................................................................... 124
Figure 50: Software level structure value stream analysis. .................................................... 131

List of figures XI
Figure 51: Fabric layout of the VPS Center. .......................................................................... 133
Figure 52: Value stream heat shield. ...................................................................................... 134
List of tables XII
List of tables
Table 1: Example BMW AG (based on Knappe [2014]). ........................................................ 70
Table 2: Amount of patents per category. ................................................................................ 70
Table 3: Zero citations: Overall patent citations (Dataset: citing/forward) (all 15 companies).
.................................................................................................................................................. 75
Table 4: Correlation between citing publication date, cited publication date, and citing total. 79
Table 5: Comparison of employees, profit, and ROE between VW, BMW, Toyota, and GM.
.................................................................................................................................................. 85
Table 6: Reality areas of learning in real and virtual work systems (based on Jenewein &
Schulz, 2007). ......................................................................................................................... 114
Table 7: Lean principles applied for the AR application. ...................................................... 119
Table 8: Significance test Days 1 and 2. ................................................................................ 125
Table 9: Significance test Day 1. ........................................................................................... 126
Table 10: Significance test Day 2........................................................................................... 127
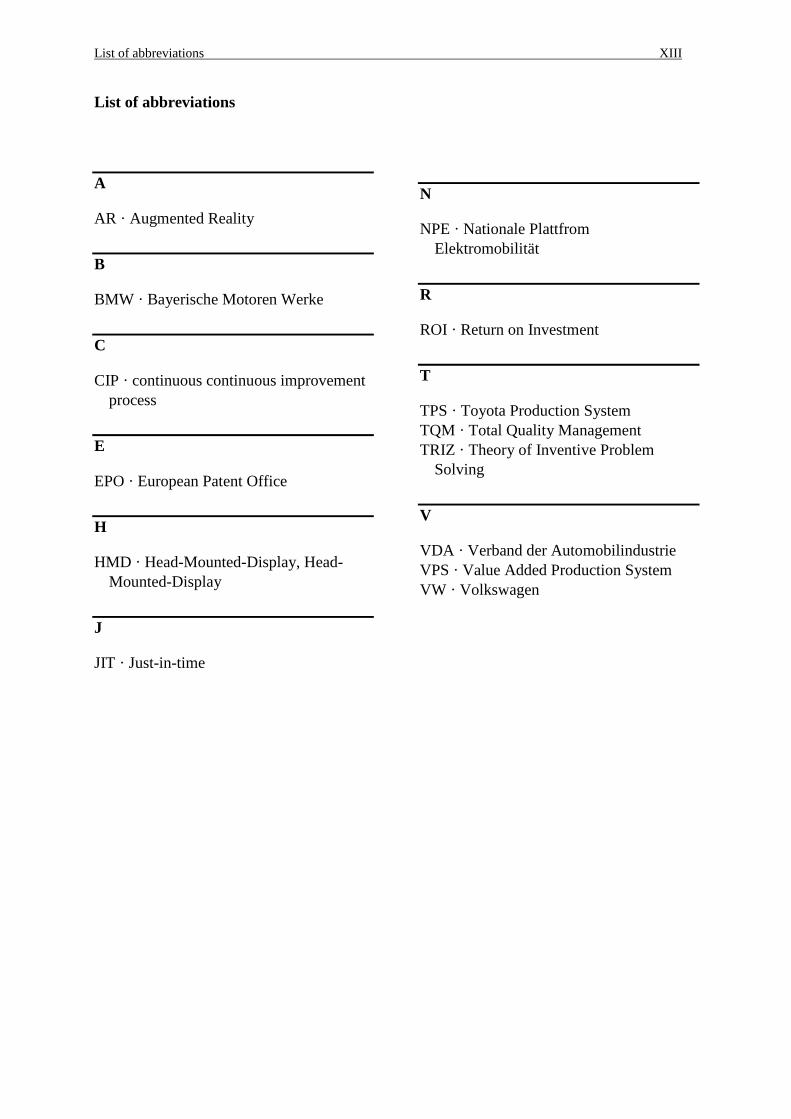
List of abbreviations XIII
List of abbreviations
A
AR · Augmented Reality
B
BMW · Bayerische Motoren Werke
C
CIP · continuous continuous improvement
process
E
EPO · European Patent Office
H
HMD · Head-Mounted-Display, Head-
Mounted-Display
J
JIT · Just-in-time
N
NPE · Nationale Plattfrom
Elektromobilität
R
ROI · Return on Investment
T
TPS · Toyota Production System
TQM · Total Quality Management
TRIZ · Theory of Inventive Problem
Solving
V
VDA · Verband der Automobilindustrie
VPS · Value Added Production System
VW · Volkswagen
Introduction 1
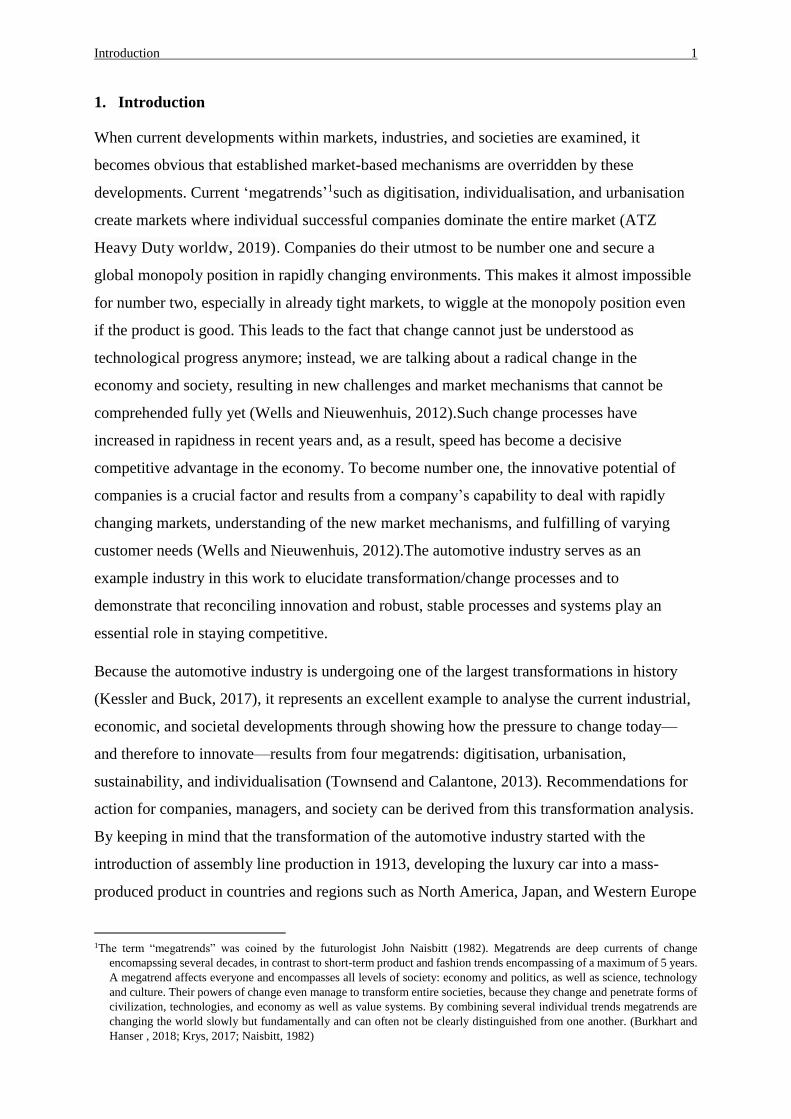
1. Introduction
When current developments within markets, industries, and societies are examined, it
becomes obvious that established market-based mechanisms are overridden by these
developments. Current ‘megatrends’1such as digitisation, individualisation, and urbanisation
create markets where individual successful companies dominate the entire market (ATZ
Heavy Duty worldw, 2019). Companies do their utmost to be number one and secure a
global monopoly position in rapidly changing environments. This makes it almost impossible
for number two, especially in already tight markets, to wiggle at the monopoly position even
if the product is good. This leads to the fact that change cannot just be understood as
technological progress anymore; instead, we are talking about a radical change in the
economy and society, resulting in new challenges and market mechanisms that cannot be
comprehended fully yet (Wells and Nieuwenhuis, 2012).Such change processes have
increased in rapidness in recent years and, as a result, speed has become a decisive
competitive advantage in the economy. To become number one, the innovative potential of
companies is a crucial factor and results from a company’s capability to deal with rapidly
changing markets, understanding of the new market mechanisms, and fulfilling of varying
customer needs (Wells and Nieuwenhuis, 2012).The automotive industry serves as an
example industry in this work to elucidate transformation/change processes and to
demonstrate that reconciling innovation and robust, stable processes and systems play an
essential role in staying competitive.
Because the automotive industry is undergoing one of the largest transformations in history
(Kessler and Buck, 2017), it represents an excellent example to analyse the current industrial,
economic, and societal developments through showing how the pressure to change today—
and therefore to innovate—results from four megatrends: digitisation, urbanisation,
sustainability, and individualisation (Townsend and Calantone, 2013). Recommendations for
action for companies, managers, and society can be derived from this transformation analysis.
By keeping in mind that the transformation of the automotive industry started with the
introduction of assembly line production in 1913, developing the luxury car into a mass-
produced product in countries and regions such as North America, Japan, and Western Europe
1The term “megatrends” was coined by the futurologist John Naisbitt (1982). Megatrends are deep currents of change
encomapssing several decades, in contrast to short-term product and fashion trends encompassing of a maximum of 5 years.
A megatrend affects everyone and encompasses all levels of society: economy and politics, as well as science, technology
and culture. Their powers of change even manage to transform entire societies, because they change and penetrate forms of
civilization, technologies, and economy as well as value systems. By combining several individual trends megatrends are
changing the world slowly but fundamentally and can often not be clearly distinguished from one another. (Burkhart and
Hanser , 2018; Krys, 2017; Naisbitt, 1982)
Introduction 2
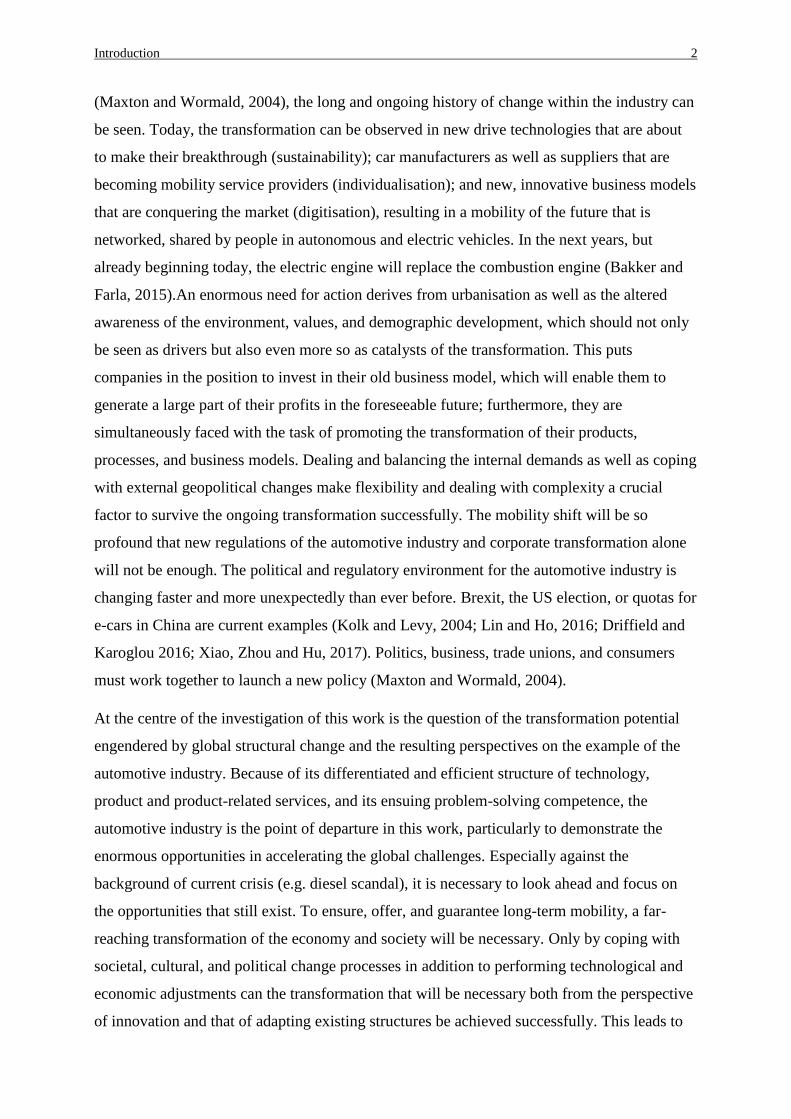
(Maxton and Wormald, 2004), the long and ongoing history of change within the industry can
be seen. Today, the transformation can be observed in new drive technologies that are about
to make their breakthrough (sustainability); car manufacturers as well as suppliers that are
becoming mobility service providers (individualisation); and new, innovative business models
that are conquering the market (digitisation), resulting in a mobility of the future that is
networked, shared by people in autonomous and electric vehicles. In the next years, but
already beginning today, the electric engine will replace the combustion engine (Bakker and
Farla, 2015).An enormous need for action derives from urbanisation as well as the altered
awareness of the environment, values, and demographic development, which should not only
be seen as drivers but also even more so as catalysts of the transformation. This puts
companies in the position to invest in their old business model, which will enable them to
generate a large part of their profits in the foreseeable future; furthermore, they are
simultaneously faced with the task of promoting the transformation of their products,
processes, and business models. Dealing and balancing the internal demands as well as coping
with external geopolitical changes make flexibility and dealing with complexity a crucial
factor to survive the ongoing transformation successfully. The mobility shift will be so
profound that new regulations of the automotive industry and corporate transformation alone
will not be enough. The political and regulatory environment for the automotive industry is
changing faster and more unexpectedly than ever before. Brexit, the US election, or quotas for
e-cars in China are current examples (Kolk and Levy, 2004; Lin and Ho, 2016; Driffield and
Karoglou 2016; Xiao, Zhou and Hu, 2017). Politics, business, trade unions, and consumers
must work together to launch a new policy (Maxton and Wormald, 2004).
At the centre of the investigation of this work is the question of the transformation potential
engendered by global structural change and the resulting perspectives on the example of the
automotive industry. Because of its differentiated and efficient structure of technology,
product and product-related services, and its ensuing problem-solving competence, the
automotive industry is the point of departure in this work, particularly to demonstrate the
enormous opportunities in accelerating the global challenges. Especially against the
background of current crisis (e.g. diesel scandal), it is necessary to look ahead and focus on
the opportunities that still exist. To ensure, offer, and guarantee long-term mobility, a far-
reaching transformation of the economy and society will be necessary. Only by coping with
societal, cultural, and political change processes in addition to performing technological and
economic adjustments can the transformation that will be necessary both from the perspective
of innovation and that of adapting existing structures be achieved successfully. This leads to
Introduction 3
the main question of this dissertation: How can a compatibility between being innovative and
being efficient (lean) be achieved?
1.1.Introduction to the topic and definition of the problem
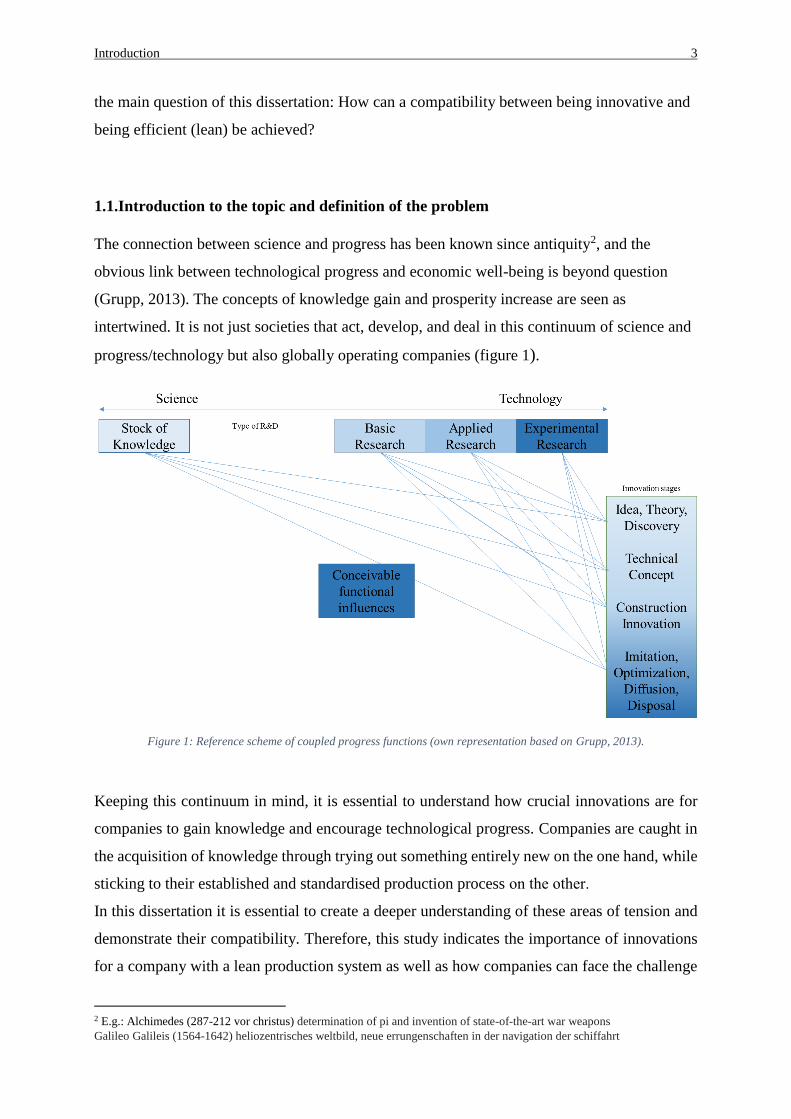
The connection between science and progress has been known since antiquity2, and the
obvious link between technological progress and economic well-being is beyond question
(Grupp, 2013). The concepts of knowledge gain and prosperity increase are seen as
intertwined. It is not just societies that act, develop, and deal in this continuum of science and
progress/technology but also globally operating companies (figure 1).
Figure 1: Reference scheme of coupled progress functions (own representation based on Grupp, 2013).
Keeping this continuum in mind, it is essential to understand how crucial innovations are for
companies to gain knowledge and encourage technological progress. Companies are caught in
the acquisition of knowledge through trying out something entirely new on the one hand, while
sticking to their established and standardised production process on the other.
In this dissertation it is essential to create a deeper understanding of these areas of tension and
demonstrate their compatibility. Therefore, this study indicates the importance of innovations
for a company with a lean production system as well as how companies can face the challenge
2 E.g.: Alchimedes (287-212 vor christus) determination of pi and invention of state-of-the-art war weapons
Galileo Galileis (1564-1642) heliozentrisches weltbild, neue errungenschaften in der navigation der schiffahrt
Introduction 4
of being lean and innovative simultaneously using theoretical and empirical evidence.
Furthermore, the interrelations of lean and innovation in the context of the automotive industry
are presented.
A peculiarity of this work lies in the shared perspective for observing the production of the new
at several levels (micro, meso, and macro), keeping in mind that ‘there is no cheap way to
successful innovation’ (Anderson and Hein 1987, S. 73). The three levels/perspectives of
macro, meso, and micro are derived from the field of evolutionary economics (Dopfer, Foster,
Potts 2004), and they are used in this study to create a multiple and holistic perspective.
Researchers assume that both individual companies and entire industries regularly have
problems when the old rules of the game are overturned by new business models or technical
innovations (Enders, König, Hungenberg, Engelbertz , 2009).
At all three levels, the descriptions of an economic system containing rules, their structure, and
their process by Dopfer, Foster, and Potts (2004) help to understand and explain the resulting
interplay of change and complexity. The microstructure is the smallest unit and displays how
the rules are conducted at the lowest individual level. While the meso structure investigates the
collusion of the micro units on a higher level, the macro further consists of the population
structure of the systems of the meso. Thus, micro cannot be summed into macro but micro can
be summed into meso and meso into macro. However, an untraditional way to explain
innovative change, starting from the micro level with new rules, results in change at the meso
level, and this work uses structural shifts leading to changes in aggregate sizes on the macro
(Albrecht Enders xx). Moreover, by explaining the macro level first and then breaking it down
into the meso and micro levels, this study develops an understanding of the environment as
well as the reasons that old top dogs often fail to adapt to changes in the new environment,
sooner or later being overtaken by newcomers. Based on this logic, the compatibility of lean
and innovation are analysed using the architecture described above. This study will show that
that the complexity that can be found at the respective level makes it necessary to put a meso
level in between.
At the first level (industry), in a long-term view, this work illuminates the roles that lean and
innovation play in research and development (R&D) in the automotive industry—the macro-
level view. At the second level (company), it shows how companies are caught between the
standardisation of processes, achieving a strategic vision, and staying competitive in the market
by fostering prosperity increase through innovation—the meso-level view. At the third level
(project), this work answers the main questions of how companies can use lean principles to

Introduction 5
create a successful innovation project and how innovation can be used to conduct a successful
lean project—the micro-level view. The objectives and structure of this work are defined
analogously to this fundament in sections 1.2 and 1.3, respectively.
Introduction 6
1.2.Objectives of the study
The first objective of the study is to create a deeper understanding of the ambidexterity of the
patent structure within the automotive industry, focusing on OEMs and their production
systems, which are assigned to different states in lean evolution. The goal is to shape the macro
perspective of the whole industry to be able to deduce essential factors, outcomes, and
arguments for the meso level.
Deduction: Companies in the automotive industries are caught in a field of tension between
being innovative and being lean.
The second objective is to identify how a production system can successfully cope with
incremental and radical innovation using lean principles on a company level. Especially when
selecting an evaluation for innovation projects, it is essential to answer the question of whether
the innovation is going in the right direction and supports the vision and targets of the company.
The goal is to form the meso perspective on the example of one company to obtain a deeper
understanding of how units collude on a higher level and what the rules are for the interplay
within the company.
Deduction: Lean must be integrated into the selection and evaluation process of innovation
projects within the production system to ensure competitiveness.
The third objective is to analyse how lean principles can be successfully integrated into
innovation projects. Use cases serve as empirical validation to demonstrate the compatibility of
lean and innovation in conducting innovation projects that take lean principles into
consideration. The goal is to create an understanding of the micro perspective, and specifically
how the interplay of rules works on an individual project level and the balance that can be found
between lean and innovation.
Deduction: Lean must be integrated into innovation projects to achieve the optimal output and
conduct a smooth implementation.
Central topics of investigation in the present analysis are thus the balance of lean and innovation
in the automotive industry as well as their structural and knowledge-related impacts on the
macro, meso, and micro levels. Accompanying structural change processes, such as the change
and influences on the productions system as well as the state influence, are included in the flow
of reasoning only to the extent necessary.

Introduction 7
Furthermore, limitations that accompany the analysis are only discussed to the necessary extent
for this work, but do not reflect the main focus as well.
Introduction 8
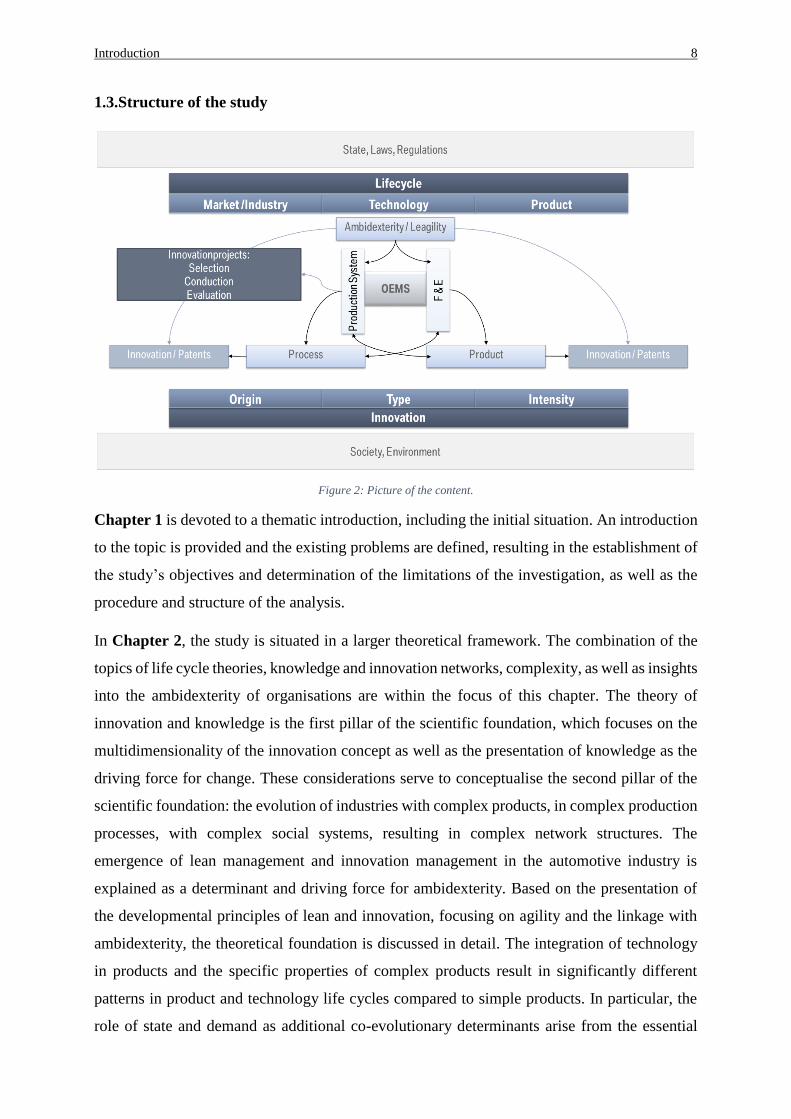
1.3.Structure of the study
Figure 2: Picture of the content.
Chapter 1 is devoted to a thematic introduction, including the initial situation. An introduction
to the topic is provided and the existing problems are defined, resulting in the establishment of
the study’s objectives and determination of the limitations of the investigation, as well as the
procedure and structure of the analysis.
In Chapter 2, the study is situated in a larger theoretical framework. The combination of the
topics of life cycle theories, knowledge and innovation networks, complexity, as well as insights
into the ambidexterity of organisations are within the focus of this chapter. The theory of
innovation and knowledge is the first pillar of the scientific foundation, which focuses on the
multidimensionality of the innovation concept as well as the presentation of knowledge as the
driving force for change. These considerations serve to conceptualise the second pillar of the
scientific foundation: the evolution of industries with complex products, in complex production
processes, with complex social systems, resulting in complex network structures. The
emergence of lean management and innovation management in the automotive industry is
explained as a determinant and driving force for ambidexterity. Based on the presentation of
the developmental principles of lean and innovation, focusing on agility and the linkage with
ambidexterity, the theoretical foundation is discussed in detail. The integration of technology
in products and the specific properties of complex products result in significantly different
patterns in product and technology life cycles compared to simple products. In particular, the
role of state and demand as additional co-evolutionary determinants arise from the essential
Introduction 9
development drivers due to the technical and product-related dynamics in the life cycles. A
foundation is created for understanding the importance of lean principles and methods for
innovation and vice versa. From this insight emerges the need for a multi-level study of the
automotive industry. Industry development is viewed as a network dynamic in which
organisations leverage external connections to meet the complexity and change demands.
Based on the scientific-theoretical foundation, Chapters 3, 4, and 5 are devoted to the practical
field of this investigation. The necessity of transformation gives the industry the task of
balancing exploration and exploitation across the product and technology lifecycle. This study
analyses these requests for ambidexterity to the industry at three levels, namely macro, meso,
and micro.
In Chapter 3, the macro level under consideration, displayed by the ambidexterity and
innovation patterns in the automotive industry resulting in an empirical (patent) analysis, is
discussed. In addition, the transformational impulses that characterise the industrial structure
are presented as well as the necessity of examining ambidexterity in the automotive industry is
explained. It is shown how the theoretical impulses are empirically validated through a
comparison of explorative and exploitative patent structures of companies, resulting in a
description of the impact of the framework on a lean production system and vice versa.
In Chapter 4, the meso level under consideration is discussed, which is related to the selection
and evaluation process of innovation projects within the production system and the link to
ambidextrous and structural requirements. The selection and evaluation of an innovation project
is seen as a crucial factor for success. With the establishment of a maturity model,
considerations of the overall system- and target configuration at local/temporal operational
decisions are allowed, ensuing the vision and goal definition of the project as well as its
direction.
Chapter 5 focuses on the micro level under consideration, where the structural design of
innovation projects and link between ambiguous requirements are discussed. The final
synthesis summarises the findings and links them. Two use cases are employed to investigate
the multitude of questions that arise in connection with the compatibility of lean and innovation
on a micro level. Thus, strengths and weaknesses of the two different forms—namely lean
principles used in supporting an innovation and innovation used to support lean
principles/methods, in particular with regard to their suitability for learning processes—can
clearly be demonstrated.

Introduction 10
The dissertation concludes with Chapter 6, which summarises key findings and derives
implications for practice, policy, and research. Based on a critical reflection on the approach,
further approaches for research are presented.
Theoretical Background 11
2. Theoretical Background
The focus of this chapter is to classify the relevant concepts and locate them in one scientific
framework. The main goal is to explain the theories of innovation concentrating on the origin,
type, and intensity of innovations: Section 2.1 is examining innovation and change; Section 2.2.
discusses industry-, technology,- and product-lifecycle theories and their influence on
innovation; Section 2.3. reflects upon ambidexterity and the impact on innovation; Section 2.4.
reflects upon complexity in the context of innovation; Section 2.5 unites these insights in a
theoretical fundament to generate the link to innovation and lean management.
2.1.Innovation, its link to change and resistance influenced by type, origin, and intensity
First, a common understanding of innovation must be created, followed by a discussion of the
drivers of change. Based on the fact that research on innovation is multidisciplinary (Corsten
et al. 2006), there is no consistent definition of innovation. However, examining the different
research fields, all definitions of innovation have the generation (process) and introduction
(launch) of something new in common (Vgl. Schumpeter 1934; Schumpeter 1939;
Schmookler 1966; Kline und Rosenberg 1986; Herkema 2003; Chen et al. 2004; OECD
2005).
Fred Gault (2016) created a general definition of innovation that is applicable in all economic
sectors: “An innovation is the implementation of a new or significantly changed product or
process. A product is a good or a service. Process includes production or delivery, organisation,
or marketing processes. A new or significantly changed product is implemented when it is made
available to potential users. New or significantly changed processes are implemented when they
are brought into actual use in the operation of the institutional unit, including the making of
product available to potential users.” (Gault 2016, p. 24)
Gault’s definition considers basic facts for the theoretical fundament of the present study. First,
it differentiates between the types of innovation (see subsection 2.1.1.); second, it sees
innovation as the realisation and launch of an invention on the market (Schumpeter 1939; see
Section 2.1); and third, it deals with the implementation of the product and therefore with the different
resulting lifecycles (i.e., industry, market, product, and technology; see Section 2.2.).
Following Schumpeter’s (1939) definition of innovation, it is essential to distinguish between
invention and innovation. While an invention reflects ideas, concepts, and prototypes before its
launch onthe market, innovation is the realisation and launch on the market, and thus the
capitalisation of the invention. Thus, invention is the process of creating something new (e.g.,
Theoretical Background 12
the Stage-Gate process by Cooper [2008]), whereas innovation is the output or launch of
something new (e.g., organisational innovation, product innovation, supply chain innovation,
process innovation, marketing innovation and business model innovation by Kahn [2018]). In
successfully performing the innovation process and creating an output, the mindset of the
organisation plays a critical role (Kahn, 2018). Associating, questioning, observing,
experimenting, and networking were found by Dyer, Gregerson, and Christensen (2011) to be
fundamental skills that spur innovation. Moreover, research on the Toyota Production System
(TPS) showed that networking (transferring knowledge from one unit to another) is a valuable
unit of analysis for explaining competitive advantage (Dyer & Nobeoka 2000). The example of
the TPS shows that openly shared knowledge, the prevention of free riding, and the efficient
transfer of tacit and explicit knowledge are the key factors for creating a highly interconnected
network with strong ties. These ties create the competitive advantage because, most
importantly, knowledge is seen as the property of the network and not of the firm (Dyer &
Nobeoka 2000).
For a more holistic view, the focus in the following paragraphs lies on innovation being
described as a process, in which the acquisition, sharing, and assimilation of knowledge aim
to create new knowledge (Herkema 2003; subsection2.1.2). The modern economy is a highly
complex system of distributed knowledge. Every individual action leads to changes in socially
distributed knowledge, without these changes being completely manageable for all
individuals—not even for the one that caused the change (Herrmann-Pillath, 2002). In the
theoretical background, change processes, such as innovations, structural change,
technological change, institutional change, economic growth or, in general, the economic
development of an industry, crucial roles in elucidating the subject of the convergence of lean
and innovation.
Innovation has shaped modern society since its inception, but it is changing its character today.
Innovation was long seen as left to chance, the brilliant ideas of individuals, and the creative
practices of separate areas (Hutter, Knoblauch, Rammert & Windeler 2016). This can best be
described with one of the most famous innovation incidents in history—the discovery of
penicillin. In the Nobel lecture that Alexander Fleming (1945) gave in Stockholm, it would
have been easy for him to say that he had come to the conclusion, based on serious literature
studies and deep thought, that moulds produce valuable antibacterial substances. However, he
preferred to tell the truth, namely that the history of penicillin began with an ‘accidental
observation’ (Fleming, 1947).The change of character in innovation can be seen as two sides
Theoretical Background 13
of a medal. Innovation is still seen as a coincidence, as researchers and engineers like to show,
but it can also be the result of a process clearly managed by management (Gassmann and Sutter,
2013). Moreover, economics innovation today is increasingly driven on purpose, in relation to
many others, and in the context of general demands for strategic manufacturing (Hutter,
Knoblauch, Rammert & Windeler 2016). However, there is still a discussion that real
innovation cannot be planned and controlled deterministically (Gassmann and Sutter,
2013).Coincidence and chance are constant companions of innovations, but today, innovations
are coordinated as processes, distributed across different instances and reflected with reference
to the actions and knowledge of the actors in other areas(Townsend and Calantone 2013). This
leads to the question of whether innovation must be seen as controlled coincidence with
innovators often being repeat offenders (Gassmann and Sutter, 2013).
The concept of reflexive innovation attempts to clarify, explain, and answer this question.
Reflexive innovation, as described by Hutter, Knoblauch, Rammert, and Windeler (2016),
refers to the interplay of these practices, orientations, and processes, observing, shaping, and
controlling the course of an innovation in terms of its various institutional implications,
discursive justifications, and the shapes and patterns of other innovations. It is not only a
targeted but also a continuously renewed knowledge of innovation, which is supported by action
practices. Hutter et al. (2016) differentiated between semantics of the new (the goal and purpose
of social action), the pragmatics of creative action (as part of the routine of action), and the
grammar of the innovative regime (as systematically created social structures for the production
of the new; Hutter et al. 2016).
However, when discussing innovation it is necessary to keep in mind that it often does not take
place without resistance. Furthermore ‘Innovation has to reckon with resistance’ (Hauschildt
et al 2016, p. 31). Schumpeter already noted the following in the first edition of his theory of
economic development: ‘The most modern enterprise has a persistence resistance against
changes’ (Ders. 2006 [1912]: 108f.).
Changes, novelties, innovations in organisational matters (internal resistance) have to deal
with several problems (Hauschild, 1998).They …
… provoke resistance (Wilkesmann 1999, p.11) by others putting forward ‘rational’
arguments, especially of a technical, economic, legal, and ecological nature;
… meet barriers to innovation (Mirow 2010) asa result of ‘not knowing’ and ‘not
wanting’;
Theoretical Background 14
… have an acceptance problem (Meffert 1976, p. 77) created by a fear culture that does
not allow mistakes, and therefore does not provide a basis for systematically developing
and promoting future ideas.
… harbour conflict potential (Thom 1980, p. 391) by letting interpersonal conflicts
inhibit creativity;
… call opponents (Witte 1973) antagonists and bring forward objectors as actors of the
resistance (Markham, Green & Basu 1991), due to divergent power claims.
However, the following question arises: Is it still possible to expect internal innovation
resistance in companies with highly standardised innovation processes and established
innovation cultures? Resistance seems unlikely today because of modernisation and
institutionalisation of innovation. With the integration of innovation into the business
enterprise, the new is desirable and thus no longer encounters resistance (Blättel-Mink 2006,
p.59 f., referring to Schumpeter 2005 [1947], p.213 ff.).The devaluation of established know-
how with the need for players to renegotiate the distribution of scarce resources might be a
possible reason for resistance in organisations. In particular, in the case of a highly novel and
uncertain character of an innovation idea, a high potential for resistance is assumed (Jaworski
and Zurlino 2007).
Resistive responses occur mainly during the innovation process, prior to the decision to launch
or implement, because organisational members will hardly be able to oppose a successful new
product or process. Thus, resistance depends on time and the different process steps (Pongratz
& Trinczek 2005).
Internal or organisational resistance is not the only problem companies face today; there is also
a form of external resistance that arises from society and the right point of time for the
implementation/launch of the innovation. Therefore, one must understand the technical system
itself with all its driving forces. The technical environment should have reached a certain level
of maturity before an innovation is successfully adapted. Companies have to make sure that no
products and services are offered that do not meet the needs of customers. In addition, the social
system in which one wishes to launch the new idea, product, or process must be understood.
Deciding which products and services are purchased and consumed also depends on what is
considered appropriate and desirable within society and the social association. Economic
change can occur as a result of the emergence of taboos that cover certain goods and products.
Economic activity in modern capitalist economies is governed and structured by social and
Theoretical Background 15
cultural values as well as binding legal norms (Böhme 1997).The path from sacrilege to an
exercise or process usually begins with horror, outrage, and violent protests. A good example
is the introduction/adaption of denim jeans after the Second World War in Germany or Europe.
First, the product only led to rejection in the European market. After the rejection phase,
emotional barriers decreased and curiosity as well as willingness—still mixed with caution—
increased. Gradually, an increasing number of people were convinced about denim jeans.
Finally, a broader acceptance, getting used to, and normalisation occurred. A small denim jeans
business quickly developed into a worldwide textile company that is known today under the
brand name Mustang (Siegfried 2016).
However, the great influence of moral ideas is even more evident when morally problematic
products and services are traded in markets. In this regard, the impact of moral change can also
be seen as fundamental to economisation (Kley 2018).
Nonetheless, ‘at present, we are seeing a further shift in the relationship between innovation
and society: innovation is crossing its barriers and growing into the dominant driving force of
future society’ (Rammert, Windeler, Knoblauch, & Hutter, 2016, p. 3). Today, not only must
manufacturers comply with labour standards and environmental regulations but also observe
social conventions and decency. For goods that are classified as worthy of protection or even
as disreputable or dangerous, economic requirements and moral ideas regularly come into
conflict when companies or countries are dealing with them. Speculating on food, offering
erotic services, or producing weapons show that entrepreneurs must use specific strategies to
legitimise their actions and pursue their economic goals. The trade in such products is often
subject to special moral restrictions (Kley 2018).
To create a deeper understanding of the technological forces as well as the social influence, this
study uses the derivation of general principles for economic change (Schmap, 2012) with a
view on the macro, meso, and micro levels of industry as the cornerstones of the following
analyses, based on a theory of economic evolution that explains change (novelty) and stability
(preservation).Evolutionary economics not only deal with the macro-meso-micro perspective
but are also concerned with economic change and the resulting essential basic problem of
fundamental knowledge (Herrmann-Pillath, 2002), as well as the coordination and growth of
knowledge (Dopfer, 2007); therefore, evolutionary economics serves in all chapters as a
reference framework for the results of the analyses. Technical innovations alone are not able to
solve complex problems fully. Only a change of mentalities and altered practices, resulting
Theoretical Background 16
from education, social inclusion, good work, and new ways of thinking together with the right
technology can create change. This means that the potential of new technologies can only be
developed if they are embedded in changes in social practices (Rogers 2003). This follows the
suggestion of Kurt Lewin (1947) that a system cannot be understood until the attempt to change
it.
Therefore, the micro and macro perspectives serve to show the structural aspects of change on
the meso level, on which the economic system is based (Dopfer, Foster, Potts, 2004). Thus,
the prevailing complexity at all levels must not be neglected. Both micro perspectives for
economic development, based on complex structures of rules that form systems such as
companies, and macro perspectives for economic development, based on complex structures
of rule populations such as industries or the entire economy, display complexity at the meso
level (Dopfer, Foster, Potts, 2004).
In sum, the tripartist micro-meso-macro level, with the existing complexity at all levels, is not
neglected, and neither is the fact that innovation—defined as knowledge creation,
dissemination, and a fundamental instrument for change processes—is the basic concept that
operates and influences each level/perspective.
2.1.1. Innovation Type—Product, Process, and Organisation and the Influence on and of
the Human Factor
The type dimension of innovation concentrates on the output that is created by the launch of an
innovation. Thus, innovation is differentiated into technical (product and process innovation;
Chenavaz [2012]) and administrative (organisational) innovation (Afuah 1998).3 Product
innovation is defined as the creation of a totally new product, or at least a significantly altered
one, that is available for potential users (Gault 2016). Process innovation is defined as the
implementation of a totally new or at least significantly altered production or delivery process,
including equipment, software, or technique (OECD/Eurostat 2005). For both types of
innovation, the improvement of quality to enhance competitiveness plays a critical role.
Improving the overall product quality or functionality to enhance product diversification is the
aim of product innovation (Pan and Li, 2016), whereas reducing the costs of production by
improving the overall quality of the production process and maximising the efficiency of
resources are the aims of process innovation (Li and Ni, 2016). Product innovation has been
3Gault (2016) differentiates between product and process innovation (process innovation = production innovation,
organizational innovation and marketing innovation)
Theoretical Background 17
proven to be a fundamental source of firm growth (Besanko, Donnenfeld and White, 1987;
Lambertini, 2006), Lambertini and Orsini 2015), but a rich line of research has shown that for
sustainable growth, the relationship between process and product innovation is crucial.4
Within dynamic models of process and product innovation, both forms of innovation are
performed sequentially (Utterback and Abernathy, 1975). Producing a new product at a very
low rate of process innovation in the beginning follows an increase in process innovation with
a decrease in product innovation to the point of a dominant design, followed by the stimulation
of technology and costs. However, the increase in customer needs caused by individualisation
has led to an increase in the complexity of product architecture and structure. Moreover, with
product lifecycles becoming shorter, product portfolios becoming more complex, technology
gaps between firms decreasing, and digital convergence among product features increasing
(Coad and Rao, 2008; Jacobs and Swink, 2011; Kamath and Roy, 2007), sequentially performed
product and process innovation can no longer fulfil the responses to customer requirements.
Thus, instead of performing product and process innovation sequentially, companies should
perform them simultaneously to enhance their performance (figure 3).With the development of
a new product, the enhancement of the production process must start simultaneously in iterative
circles.
However, with the simultaneous performance of product and process innovation, the company
structure as well as administrative processes must also be innovated, making organisational
innovation necessary. ‘An organisational innovation is the implementation of a new or
significantly changed organisational method in the business practice, workplace organisation
or external relations of the institutional unit’ (Gault 2016, p. 8).Process and organisational
innovation cannot be distinguished incisively, but for this work, newly or enhanced business
models, marketing strategies, and the reorganisation of company structures are seen as
organisational innovation, whereas newly or enhanced production or delivery processes are
seen as process innovations. Organisational innovation is an underlying process in which
product innovation and/or process innovation are matched with existing business models,
4Cf.:
- Mantovani (2006): Dynamic model to study complementarity between market enhancing product
innovation and cost-reducing process innovation in a monopoly setting;
- Chenavaz (2012): Product and process innovation model to determine the optimal product price, the
product and process innovation investment strategy, given a time-varying demand conditions;
- Choi, Narasimhan and Kim (2016): new paradigm, wherein product and process innovations are
pursued concurrently instead of sequentially.
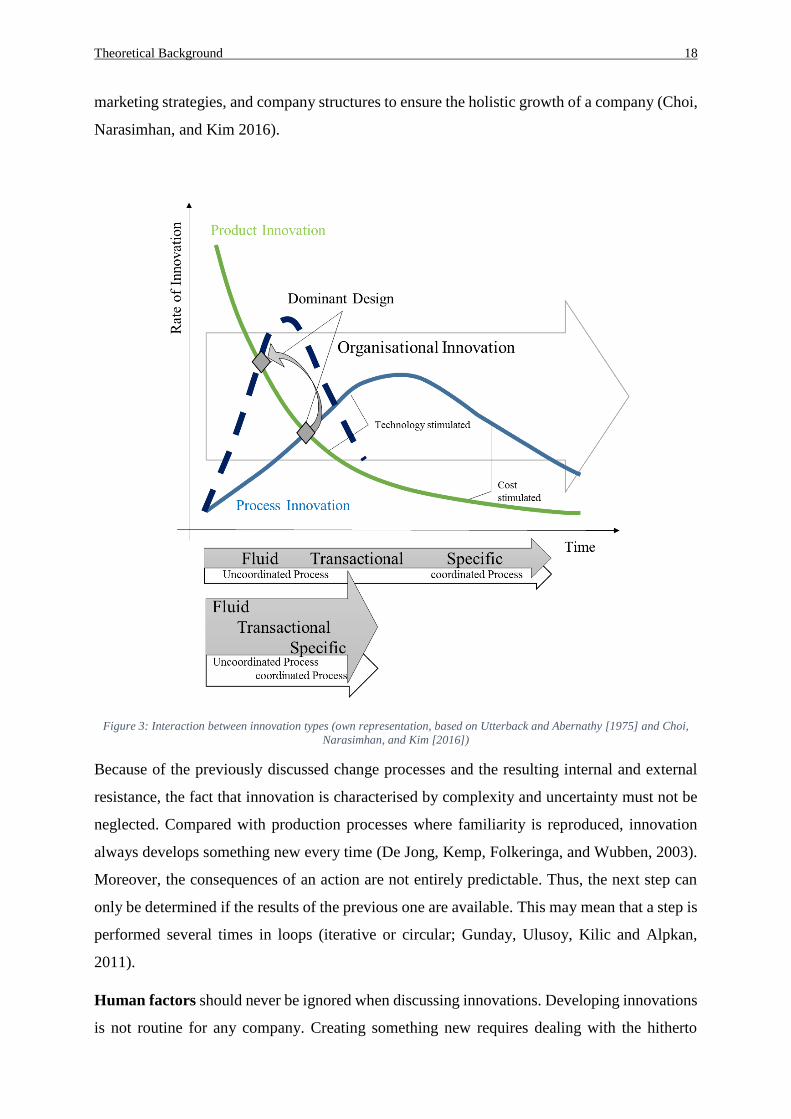
Theoretical Background 18
marketing strategies, and company structures to ensure the holistic growth of a company (Choi,
Narasimhan, and Kim 2016).
Figure 3: Interaction between innovation types (own representation, based on Utterback and Abernathy [1975] and Choi,
Narasimhan, and Kim [2016])
Because of the previously discussed change processes and the resulting internal and external
resistance, the fact that innovation is characterised by complexity and uncertainty must not be
neglected. Compared with production processes where familiarity is reproduced, innovation
always develops something new every time (De Jong, Kemp, Folkeringa, and Wubben, 2003).
Moreover, the consequences of an action are not entirely predictable. Thus, the next step can
only be determined if the results of the previous one are available. This may mean that a step is
performed several times in loops (iterative or circular; Gunday, Ulusoy, Kilic and Alpkan,
2011).
Human factors should never be ignored when discussing innovations. Developing innovations
is not routine for any company. Creating something new requires dealing with the hitherto
Theoretical Background 19
unknown. In addition, creativity cannot be forced. Therefore the establishment of innovation
processes is a crucial management tool to support ideas and their implementation
(Damanpour, Walker and Avellaneda, 2009).
To take up the question posed above, namely innovation as a controlled coincidence (Section
2.1), the first answer can be given. On the one hand, a coordinated and well-structured
innovation process space is created by defined processes in the form of standards, the provision
of services, the support and guidance of the same ,and everything not having to be reinvented,
which means that participants can direct their creativity toward the creation of new things and
necessary improvement. On the other hand, an innovation process promotes the targeted use of
creativity and prevents innovations in everyday business life from perishing. By giving a certain
amount of structure an innovation process offers orientation but at the same time must be
flexible enough to react to the unforeseen. This creates opportunities in the employee suggestion
system and in the continuous improvement process that avoid waste through the untapped
potential of employees.
However, with the simultaneous performance of product and process innovation, the
standardised innovation process must meet the requirements for product as well as for process
innovation. Defined processes in the form of standards, the provision of services, and the
support and guidance of the same for product innovations might not be useful in process
innovation, and vice versa. For example, to achieve the economic success of an innovation, a
smooth transfer of the innovation into the business areas such as marketing or production is
required. These business areas differ between process and product innovation.
Moreover, ‘Lean Innovation’ is currently attempting to translate the successful principles of
lean thinking into the innovation process (Schuh, 2007). The goal is the sustainable
rationalisation of the entire innovation process and the mastery of complex product and project
programmes (for more details, see subsection 2.4.3).
2.1.2. The Origin of Innovation—Generation and Adaption and the Influence on and of
the Human Factor
As already discussed, it is essential for companies to focus on competitiveness through
innovation, especially because of the positive effects on manufacturing performance. The origin
of creating something new can be distinguished in adoption and generation. Innovation
generation is defined as new to the world, whereas innovation adoption is defined as new to
Theoretical Background 20
the user/company or, as in other streams of research, called innovators versus imitators
(Damanpour and Wischnevsky, 2006). Whereas former research on adoption (imitator) and
generation (innovator) is seen as a binary choice within companies (Pérez-Luño et al., 2007a,b;
Zhou, 2006; Lieberman and Montgomery, 1988; Damanpour and Wischnevsky, 2006), this
work goeswith the suggestion of Perez-Lunos, Wiklunds, and Cabreras (2011) that companies
do not engage in generation or adoption solely, but instead adopt and generate
simultaneously, emphasising one or the other to different degrees.
Therefore, adoption or generation is not a binary choice but a matter of the degree of
engagement, which also resembles the logic of the ambidexterity of exploitation and
exploration (Section2.3). As innovation is seen as a knowledge creation process, adoption and
generation go along with different ways to enhance the knowledge base in a company
(Grossman and Helpman, 1991). Whereas knowledge in innovation adaption is in possession
of various or at least one player in the market already, in innovation generation a genuinely new
product or process is created, which means genuinely new knowledge is established that has
not been created by one or various players on the market before (Mahmood and Rufin, 2005).
What does this development mean for the organisation and structure of companies to
successfully generate and adopt innovation? Every innovation in the innovation process is
individual compared with a production process, where every output is the same and thus
plannable. Moreover, strict control over planning, budgeting, and scheduling are known to
prevent or inhibit innovation. Thus, companies are advised to refrain from these practices.
Deviations from plan specifications should be allowed and welcomed, because the fulfilment
of only the prescribed task will not lead to innovative ideas. In addition, the chance of
discovering new solutions and innovation is diminished by strict process planning and the
necessary flexibility is limited (Kanter 2006).
The adaptation of innovation is based on the basic principle that it does not always have to be
a fundamentally new idea—exploiting existing potentials can be enough. This means exceeding
the existing by perfecting the product, business model, and sales behind it. Almost the same
aspects can be applied to the principle of imitations, with a difference being that imitation is
not just copying, but rather a creative process of learning from other products and adapting
them (Leitner 2016).
Today, most common diffusion theories are based on the works of the American sociologist
and communication scientist Everett Rogers, and focus on the merits of having an innovation
for the potential adapter as well as which properties hinder an adaptation of the innovation.
Theoretical Background 21
Rogers (1962) considered the nature of the innovation to play a central role in the diffusion
process. Acceptance or adaptation by an increasing number of users or companies and the
associated spread in society is called the diffusion of innovation (Rogers 1962). The possibility
of being able to forecast and explain the spread of innovations is of great interest to companies,
because of growing competition in saturated markets in combination with ever faster changes
in needs (Bodensteiner, 2011).
Factors that are responsible for the success and failure of innovations are relevant to
comprehend the diffusion of an innovation. Success factors of diffusion are whether the
innovation offers advantages in terms of technical performance, efficiency, and value for
money, but also in terms of social prestige, which encourages a commitment to innovation and
foster the diffusion (Hagerstrand, 1968; Mahajan, Muller, & Bass, 1990). A high compatibility
of the innovation with existing needs, technologies, or social practices also has a positive effect
on the adaptation behaviour (Peres, R., Muller, E., Mahajan, V. 2010, Rogers 2003). The
diffusion of innovation can best be seen in the example of smartphones, which combine the
advantages of telephones, computers, and calendars, thereby offering the user more advantages.
If a new mobile phone is compatible with other devices, it fosters compatibility with existing
needs as well. Moreover, the ability to test innovation can help reduce uncertainty and convey
information about its benefits (Peres, R., Muller, E., Mahajan, V. 2010). This is one reason why
flagship stores of smartphone manufacturers are often designed in a way that customers can try
out and test the products easily and quickly. The stores have a concept of walk in and try out
with experts in the background of the sales area. When preferences become observable, because
the innovation finds its way into the personal environment of the potential user, this can also
have an effect. For example, if a friend uses a new cell phone and the benefits become highly
obvious (Peres, R., Muller, E., Mahajan, V. 2010).
A complexity of innovation that goes beyond the user’s understanding, however, hinders the
innovation process and resembles failure factors of diffusion. The perceived risk of a product
purchase can be seen as such a failure factor. The perceived risk of a product purchase increases
the need for information, especially when the first purchase of a product has consequences that
cannot be clearly estimated beforehand, including negative consequences. The consumer is
faced with a feeling of risk during the purchasing decision (Bauer, 1960).
In the case of smartphones, this applies, among other things, to older people who grew up with
other technologies and can therefore not fully estimate the technology itself as well as the
resulting consequences of the purchasing decision.
Theoretical Background 22
Some companies also refrain from innovation because their product is perfect and popular (for
example, Coca Cola) or they rely on tradition and quality. These companies and industries apply
the principle of ‘No Innovation’. They take advantage of the fact that they have not changed
their product for years and use it as a marketing strategy (Leitner 2016).
Similar to this is the principle of pseudo-innovation. Many companies adapt their products
easily, such as in design, and sell them as an innovation. This follows the logic of fully
exploiting existing potential. When new ideas that could fail or revolutionise the industry are
missing, companies often use old ideas in new packaging or gimmicks that sound good mainly
in commercials to foster sales and growth. They use this strategy because they are afraid of
degrowth and zero growth caused by the lack of innovation capabilities (Leitner 2016). This
raises the following almost philosophical questions: Do companies have to grow at all? Would
it not be easier and better to maintain stability, perfect the products, and just do the job well?5
(Pelz and Mahlmann 2015).
Apart from the growth discussion, the adaption of innovation has a positive effect on the degree
of vertical integration, supplier relations, and enterprise resource planning (Bates, Flynn &
Flynn 2009). The generation of innovation has a positive impact on growth on the market (Cefis
and Marsili, 2003), revenue growth, and higher output levels (Koellinger, 2008). For both
origins of innovations, market processes, involving the consumers and the competitors,
determine the payoffs. An innovator only gains sustainable profits as long as the innovation
(product and/or process) is not adopted by a competitor completely. Game theory research
shows that these companies outpace their direct competitors, stay profitable on the market, and
take over market shares from their rivals (Teece, 1986, 2006).
As the question of ‘innovation or no innovation’ refers to a company’s strategy and is therefore
answered on a managerial level, whether the company does have the right mind set and people
to foster growth, change, and innovation still has not been fully answered yet. The role of
psychological factors of the individuals involved in the innovation process and the generic
culture within the company are crucial in the generation and adaptation of innovations. Nearly
all business units need to be involved in the development and implementation of a new
technology. This leads to changes on their side, due the required cooperation and resourcres.
The transmission of new things is always associated with risk and uncertainty (so-called risk
5 Pelz and Malham (2015) answer these question: Due to rising material and personnel costs that cannot be compensated, to
the necessary extent, by price increases and productivity increases, companies are returning to a growth strategyto survive.
Factors like eliminating borders, the growing world economy and the ‘growth’ mantra of global financial markets contradict
the principle of zero growth. The motto is: A company that doesn't grow dies.
Theoretical Background 23
behaviour; Rammert 2008, 295) and creates a field of tension between hope for success and
fear of failure (so-called performance motivation; Mohr, 1977), as employees move around in
innovation projects. New combinations of different knowledge stocks that are necessary to
promote innovative approaches, can only be reached through exchange between employees of
different departments and with business partners (exchange culture and information sharing)
(Kanter 2006). As previously mentioned, resistance and unwillingness to change must be
overcome, which makes an optimisation culture as well as the right mind-set of employees
some of the most vital factors for change (Judge et al.,1999).Wanberg et al. (2000) and Oreg
(2003) identified various dispositional factors (e.g., self-esteem, optimism and perceived
controllability, and need for routine, short-term orientation, and cognitive rigidity) associated
with successfully managing situations of change or a generally increased willingness to change.
Only the willingness to change will make it possible to adapt or generate innovations
successfully; otherwise, the launch of every new idea or product will be hindered.
2.1.3. Intensity of Innovation and its Impact—Radical, Incremental, and Disruptive
Innovations and Their Influence on and of the Human Factor
Not only the origin but also the intensity dimension of innovation have an impact on the
performance of a company. Innovations can be distinguished by the intensity level in
incremental, radical6, and disruptive innovations.
Incremental innovation is seen as the improvement, refinement, and reinforcement of current
processes, products, and organisational structures (Chandy & Tellis, 1998; OECD, 2005).
Hence, incremental innovations build on the knowledge, functionalities, components, and
structure that is already there (Van de Ven et al., 1999, p. 171), and make it harder for
competitors to enter the market by enhancing the dominance and stability of already existing
companies (Kemp and Rotmans, 2005, p.43).
Radical innovations are seen as substantial breakthroughs, and have a discontinuous character
(Pyka, 1999) involving different perspectives, such as technical and social (Linton 2009),
technology and market (Chandy and Tellis 1998), as well as the influence on components and
on the connection between them (Henderson and Clark 1990). Focusing on the technical, social,
and market perspectives, radical innovation is the change/creation of a process or product that
6Cf. Synonyms in former research (Kristiansen and Gersten, 2014):
- incremental = sustaining, variation und continuous
- radical = breakthrough, pioneering, non-routine und non-programmed
Theoretical Background 24
entails a fundamental increase in customer benefits or newly social systems, such as patent
systems. However, the impact on components has an effect on the architecture of the innovation
because the impact on the component itself changes the dominant design, which also leads to a
change in linked components and functionalities, resulting in a new architecture of the product
(Henderson and Clark 1990). Creating new products and processes helps companies to gain or
maintain their competitive advantage. The creation is only possible if the company is able to
combine their current knowledge base with external knowledge to build a specific and tacit
knowledge base that cannot be observed or imitated by others easily (Lichtenthaler, 2009).
Thus, investment in a company’s capability to absorb and transform external knowledge is
essential to develop radical innovations and remain on the market long term (Fores and
Camison, 2016). The benefit of gaining external knowledge by involving suppliers or institution
must be differentiated into the predesign and commercialisation phases. In the predesign phase,
the involvement of suppliers or external institutions is least beneficial, because of high
uncertainty, cost intensive investment in new technologies, and human capital that might be
easily imitated and launched on the market by competitors earlier. The involvement of suppliers
during the commercialisation phase instead is moderately beneficial, because of lower
uncertainty as well as the necessity to invest in new technologies or human capital (Song and
Thieme 2009). Radical innovation is associated with a huge improvement in performance and
technology change. Sometimes it can resemble the shift from already existing product
executions or through solving complex problems (of great importance) in a way that existing
products have failed to do. This often requires a more sophisticated technology, which is the
result of advanced expertise. However, radical innovation is not enough to trigger the necessary
transformation within companies and markets. This is where disruptive innovation comes into
play.
Disruptive innovation has been one of the defining themes of recent years as it goes
significantly further in terms of scope and impact of change than any previous innovation and
ties in with concept of ‘creative destruction’ of Joseph Schumpeter (1942). By changing
customer behaviour, inventing new markets, and fundamentally disrupting existing rules of the
game, disruptive innovations attack the status quo (Christensen, Raynor and McDonald, 2015).
It initially comes with a lower performance than other products (measured by the valuation
metrics) used in an industry; thus, in contrast to incremental and radical innovation, disruption
is seldom intended and most of the time of no particular interest to existing users or customers
(Christensen, Baumann, Ruggles, and Sadtler, 2006). Furthermore, disruptive innovations are
Theoretical Background 25
being adopted by a market that is currently not saturated or not served at all. In other words,
they serve a market segment that did not exist before and does not necessarily have to be based
on radical technological innovations (Markides, 2006; Dan and Chieh, 2008; Christensen,
Raynor and McDonald, 2015).
Start-ups, for example, often disrupt or even displace existing companies, because existing
companies, public authorities, and other organisations can usually not disrupt themselves, but
are disturbed. New players with new business models are able to open up new markets
established companies were not even aware of. They have an influence on the market and
technology lifecycle, because existing business model or an entire market is replaced by a
rapidly growing innovation (for more details see subsection 2.2.1.). Simply put, disruptive
innovations, often based on new technologies, make existing products or services obsolete
(Markides, 2006).
Being able to generate knowledge internally leads to the maximisation of the potential of the
existing knowledge base (Bierly & Chakrabarti, 1996) and enhances the company’s established
position on the market short term (Lavie, 2006), as was already discussed in subsection
2.1.2.However, especially for the establishment of the right form/intensity of innovation
(incremental, radical, or disruptive), the respective area and topic as well as your own
organisational culture are crucial (Schneider, Günther and Brandenburg, 2010).
Several personal factors of employees have been found to influence the generation of
knowledge, the intensity of innovation, as well as an organisational culture that is able to
perform change positively. The locus of control, creativity, as well as problem-solving skills
have been proven to have an influence on innovation (Hippel, 1994; Isaksen, Dorval, and
Treffinger, 2010; Weissberg, (2006).
The degree of conviction that one can influence and design certain events and situations through
one’s own actions is the characteristic feature of internal control beliefs (locus of control,
feasibility, and convictions). To actively intervene in situations, see oneself as the initiator of
events, and make every effort to influence tasks, people, and events in the sense of one’s own
goals, are characteristics attributed to people with pronounced internal control beliefs. At the
experiential level, internal control beliefs are often associated with feelings of self-efficacy,
which can in turn support proactive work behaviour and intrinsically motivated work
engagement (Lefcourt, 1976; Deci and Ryan, 1987; Bandura, 1982). As already mentioned,
employees who just fulfil their daily tasks will not play an active role in the creation of
incremental, radical, or disruptive ideas.
Theoretical Background 26
Creativity means the ability to not only consider known and already considered possibilities in
problem solving, but also to develop new situation-related solutions from the network of
individual and potentially relevant experiences (Kuhl, 2001). In particular, when dealing or
fostering disruptive innovation ideas, creativity is a critical personal factor. It is generally
assumed that entrepreneurs are more creative and innovative compared with comparable
individuals (McClelland, 1987, Chell, Haworth and Brearley1991, Goebel, 1991, Miner, Smith
and Bracker, 1994, Müller & Gappisch, 2002; Williams and McGuire, 2008).
Closely related to creativity is problem-solving orientation, which requires experience,
ingenuity, and the ability to innovate. Having a differentiated perception and comprehension as
well as regarding new or complex work requirements as fundamentally manageable are
characteristics people with a problem-solving-orientation are said to have. It is essential for
problem-oriented individuals to deal with a variety of job responsibilities, be able to expand
their knowledge and experience, and improve their existing skills, because of the large amounts
of individual information that can be quickly surveyed and processed or used in difficult
decisions or negotiations (King, 1985). Ingenuity and creativity help to invent something new
and recombine the familiar in ways that have never been there before (Goebel, 1991; Hooper,
Jukes and Stubbs, 2000; Hagen and Larssaether, 2000; Skarp and Gadde, 2008).
In addition to the specific characteristics of a person (e.g., locus of control, creativity, and
problem-solving orientation), the process characteristics, particularly how these properties are
implemented and conducted, are of particular importance to create successful innovations (see
Personality System Interactions [PSI] Theory by Kuhl7).
2.1.4. Influence of Type, Origin, and Intensity of Innovation on Society, Politics, and
Laws on the Example of the Automobile
Nevertheless, innovations have far-reaching implications for all sectors of the economy and
society. It is a permissible conclusion that innovations are overestimated in the short term and
underestimated in the long term. To ensure efficiency and productivity an innovation process
is absolutely essential, in which errors and unnecessary loops, caused by missing or incorrect
information, are eliminated. Moreover, the impact on society, politics, and laws in the
7Personality System Interactions (PSI) The theory is Kuhl's Theory of Willful Action Control. At the heart of PSI is the action
management model. It explains individual behavior through the interaction of various psychophysiological brain processes
- and makes the cause of behavioral control measurable for the first time through a differentiated psychological test
procedure.
Theoretical Background 27
successful generation and adaption of (radical or incremental) innovation (process, product, and
organisation) must not be underestimated. Driven by different influences, structural change is
taking place. This continuous process started more than 100 years ago and is sure to accelerate
further. One of the most important questions is which economic and social effects will be
connected with the innovation and is there a need for laws and regulations to be introduced?
The development of the first automobile shows impressively what effects and impacts an
innovation has on the economy, society, politics, laws, and the environment and is therefore
discussed as an example as follows.
The imperial patent number 37.435, registered on January 29, 1886 by Carl Benz, represents
the starting point of the incessant triumph of the motor car, despite the fact that people were
mainly travelling by horse-drawn carriage or train by then. First seen by contemporaries as a
tricycle with a stinking and rattling single-cylinder engine, with no roof and three wheels, cars
back then were uncomfortable, very loud, and priceless for most people. Yet, today, they are an
indispensable part of our lives and impact all relevant fields of life, and it is estimated that up
to 2 billion cars have been built worldwide (Möser, 2002).
Impact on the economy: With car cities, such as Los Angeles, that were planned for the
automobile, as well as all countries with a highly developed economy having a high car density,
the economic importance of the auto industry is enormous. It is seen in many countries as one
of the key industries; for example, more than 700,000 people in Germany work for major car
manufacturers such as Volkswagen (VW), Daimler, Bayerische Motorenwerke (BMW), as well
as suppliers such as Bosch and Conti. This is one of the most impressive examples, showing
the connection between knowledge gain and prosperity increase resulting out of technological
progress (Holweg 2008, Wells 2012).
Impact on society: The epitome of personal freedom and prosperity are attributes that are
attributed to the automobile, because cars make people flexible and create independence. The
mass distribution of the car ultimately paralyses its own mobility, which can be seen especially
in metropolises today. The automobile makes individual mobility available to a large extent,
without which there would be no economic growth and social development. It made day trips
or weekend journeys—resembling freedom—possible, developed new housing areas and huge
shopping centres with equally huge parking decks on the green field, and fostered the separation
of living and working in cities. This resulted, especially in cities, in a huge parking problem
that is not solved as of today, despite the planning of our cities being geared to the needs of
drivers and neglecting pedestrians. However, not only have the changes in social structures of
daily life been massive; the automobile has also managed to create an attitude towards life, with
Theoretical Background 28
special cars such as the Volkswagen Beetle or the Trabant expressing a special life feeling and
thus standing for social development (Reichhart and Holweg, 2008, Wells, 2012).
Impact on regulations, laws, and politics (traffic): No new technology, no matter how
revolutionary and helpful it is, would be introduced today at such a blood toll. Despite the
number of fatalities dropping drastically, with innovations such as traffic lights over the years,
in Germany alone around 4,000 people are killed every year in traffic accidents, plus tens of
thousands are injured (Güttner, Sommer-Dittrich,2008). Over the last decades, accidents
have been the reason for several innovations, such as small fences on the edge of the
sidewalk, bridges to overpass, and traffic lights to structurally separate streams that used to
share the urban space (Güttner and Sommer-Dittrich, 2008, Wells, 2012). With the approach
of autonomous driving, moral beliefs are also becoming even more crucial. By
supplementing people’s self-determined actions with autonomous artificial systems and the
question of who should survive an accident, lawyer or homeless person, mother or child,
man or woman, the automobile will continue to have a major influence on politics, laws,
and regulations in the future (Scholz and Kempf, 2016).
Impact on the environment: The electric era is approaching with the age of fossil fuels coming
to an end. Greener propulsion technologies will change cars and the industry—and possibly the
relationship of the customer with the car. With new players on the market, the new powerhouse
of global sales is no longer in Western Europe or the USA but in Asia (Güttner and Sommer-
Dittrich, 2008; Nakicenovic and Schulz, 2011).
2.2.Life cycle theories and the implications on innovation
The key drivers of economic development and economic growth are closely linked to the impact
of technological advances. It is necessary to understand in which cycles industries, products,
and technologies evolve and exit from the market and what the connection to innovation is. In
this section, innovation activity and its influence on industrial evolution are examined, first in
the competitive context of companies and second in terms of their technological and—above
all—nonmarket relationships. Within the literature, the terms technology, industry, and product
lifecycle have been used synonymously or interchangeably (Taylor & Taylor,
2012).Considering knowledge creation and diffusion within the industry, it is necessary to
understand how industries, technologies, or products change over time and how customers,
competitors, and the market react. In particular, growth should not only be understood as purely
Theoretical Background 29
economic but also as social and intellectual growth, in the sense of scientific progress and
innovative ability.
2.2.1. The Industry and the Market Life Cycle
Taking product innovation into account to obtain a deeper understanding of the industry
lifecycle, it is important to compare/plot the number of producers against time to measure how
product innovations diffuse (Klepper and Gort, 1982; Kleppers, 1982). The industry life cycle
follows an evolutionary logic, starting with the exploration phase surrounded by high levels of
uncertainty and many firms entering the market; followed by the growth phase with stabilised
product design, specialised production equipment, and already reducing numbers of entrants as
well as the shake out of producers; and ending with the mature phase with slowing growth and
further decline of entrants (Taylor & Taylor, 2012).The development path of an industry is not
always as ordered, regular, and determinate as the concept of the industrial life cycle suggests;
despite certain regularities, the process is always open to a certain extent (Haid and Münter,
1999).
The evolution of an industry is shaped by, on the one hand, a variety of product life cycles and
product generations of different companies, whereas on the other hand it is shaped by the
market life cycle. This is defined as the ideal typical course of a market, in which a significant
segment of the buying public is interested in purchasing a given product or service. The market
life cycle is divided into the same phases as the industry life cycle (development phase, growth
phase, maturity phase, and age). Each phase offers opportunities to enter the market, resulting
in adjustments in the marketing situation, and thus effecting the marketing strategy and mix of
companies (Koplyay, Liand Rochfort, 2010).
Since startups are designed by definition to grow rapidly in a short time, their product
development has a significant influence on the industry lifecycle as well as on the market
lifecycle. Such rapid growth makes flexibility enormously important and is reflected in all the
different ways of working between agile and fast-acting startup teams, as opposed to strict
hierarchical orders that paralyse and slow processes that are found in established companies.
Through producing products and services that are urgently required, startups increasingly turn
out to be the R&D department of our economy. With few financial resources at their disposal,
startups are in need of finding pragmatic, new solutions quickly to establish themselves in a
market, according to whose rules they should not actually exist (Hack, 2005; Arvanitis and
Theoretical Background 30
Stucki 2014).Young companies in the startup scene show how it is possible to act faster by
building a company around a product or family of products with a single business model.
Startups are more customer-friendly than ever before, which is the result of operating profitably
on the market (Carbonell, Rodriguez-Escudero and Pujari, 2012).That is why many established
companies are looking for access to the founder community to innovate. Established companies
must decide between competition, cooperation, or integration strategies. Using cooperation and
integration when the immediate interface and cooperation is intense, the biggest problem is the
will to bring the pioneering spirit of startups into the company without being able to discard the
old organisation and business models. Therefore, the following question continually arises: how
high is the actual connectivity and transfer performance within startup cooperation? (Baum and
Silverman, 2004; Benson and Ziedonis, 2009; Buenstorf, 2015).
However, with the markets becoming increasingly volatile, the complexity of the life cycles
(fig.x) increases. Volatility as a known factor in risk models of the financial sector is used as
an estimate of future fluctuation margins. Volatility is noticeable in two directions—risk of loss
and chance of profit. For example, a stock with high volatility—high price swings both up and
down—runs the risk of entering a period of sharply falling prices after that stock is bought.
Simultaneously, however, the volatility of the investment also increases the chance of a
correspondingly larger profit (Koplyay and Mitchell, 2014a). The challenge is to deal with the
continuing volatility and the resulting increase in uncertainty. In particular, in the transition and
initial phases of the industry lifecycle, the cycles cannot actually be predicted and the patterns
of the past at best provide a first starting point. The interactions between the different levels of
consideration and the complexity in economic systems must not be neglected and demonstrates
the complexity in industry life cycles. For example, economic actors always make their
decisions in an overarching context that has a certain influence on them. Dynamics within an
industry or even in an economy as a whole can therefore not be explained only by the sole
consideration of entrepreneurial development paths on the micro level (Dopfer and Potts 2008,
Dopfer 2005; Brette and Mehier 2008; Schröder 2010).
In sum, because of startups, dynamics within the industry that increase uncertainty and
complexity, as well as the context in which economic actors make their decision, the influence
on the industry lifecycle and the increasing volatility in the markets make it necessary to reshape
the common understanding of industry lifecycles.
Theoretical Background 31
2.2.2. The Product Life Cycle
The product life cycle plots revenues or sales volume against time, but follows the same logic.
It consists of four stages, beginning with the introduction of a new product. When it is launched
first onto the market, sales volumes are at a low level; this is followed by growth, as when an
acceptance is built up by consumers, sales volumes increase, followed by maturity when sales
volumes stabilise, and ending with decline when sales volumes decrease (e.g., Urban and
Hauser, 1993).With a few exceptions, all products go through this lifecycle from development
through market launch to disinvestment, the exit from the market. In the different phases of this
cycle, the products generate different contribution margins for the company. It is thus an
analysis concept that serves to describe the development of individual generations of a product.
(Taylor & Taylor, 2012).However, the exact course of product lifecycles depends on the
company, demand, and technological determinants, and the interplay between product
development speed, the company’s product policy, competitive behaviour, and consumer
behaviour (Lambkin and Day 1989). It is a reflection of different industry- and company-
specific factors, which themselves are subject to temporal change. Although product lifecycle
analysis does not provide a holistic view of future earnings growth, it is very helpful in
classifying and estimating future earnings growth. Because auto products are defined by
software, the integration of hardware and software life cycles requires integrated lifecycle
management. Product lifecycle management and application lifecycle management must be
merged into a single system approach (Stark, 2005; Stark, 2015).
Over the past decades, the complexity in the product life cycle has increased. At the beginnings
of the automotive industry, to use the words of Henry Ford (1923), ‘Any customer can have a
car painted any colour he wants so long as it’s black’ (Grafstein, 2012, p. 203). At the turn of
the millennium, the products of the automotive industry largely consisted of mechanics,
electronics, and some mechatronics. Software was there, but it lived in the mechatronic
components and was inseparable from them (for more details see subsection2.4.1).Everything
that is now common under the slogan ‘digital’ was out of sight for many years. Today, digital
services, software as a product, or automated driving with all the new related tasks such as
functional safety and the assumption of responsibility for driving activities, are becoming
increasingly relevant. Therefore, product lifecycles must be adapted and seen differentially.
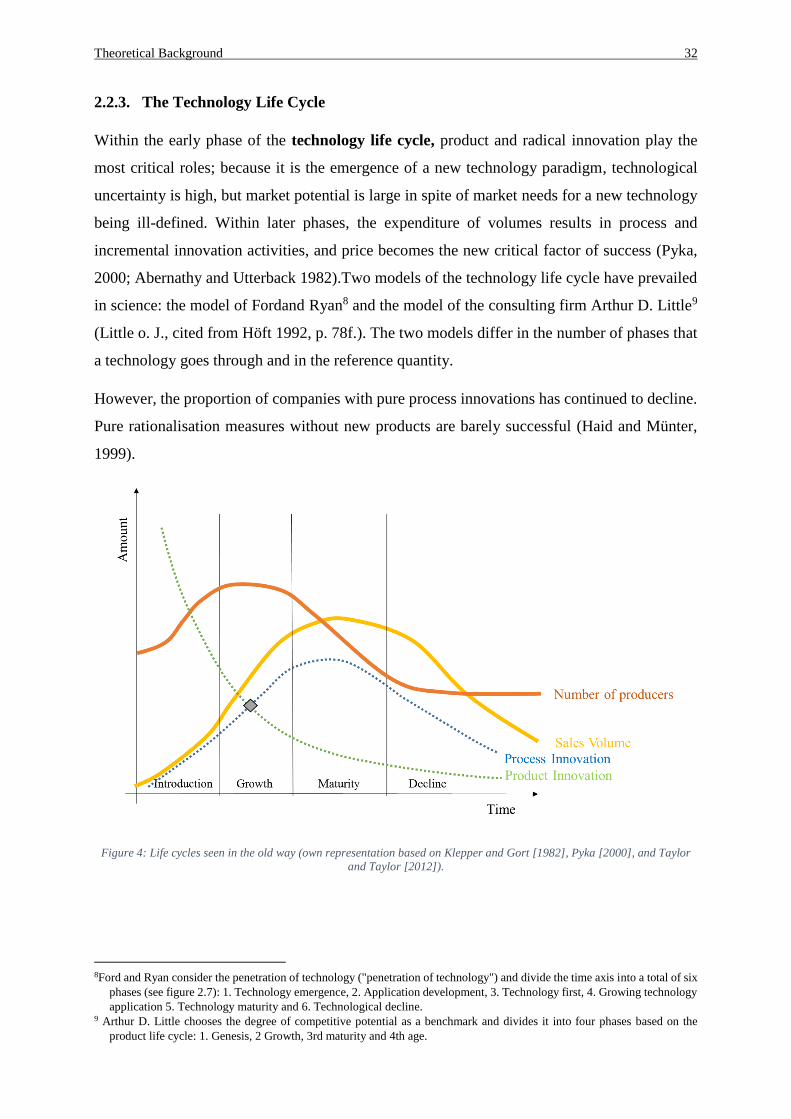
Theoretical Background 32
2.2.3. The Technology Life Cycle
Within the early phase of the technology life cycle, product and radical innovation play the
most critical roles; because it is the emergence of a new technology paradigm, technological
uncertainty is high, but market potential is large in spite of market needs for a new technology
being ill-defined. Within later phases, the expenditure of volumes results in process and
incremental innovation activities, and price becomes the new critical factor of success (Pyka,
2000; Abernathy and Utterback 1982).Two models of the technology life cycle have prevailed
in science: the model of Fordand Ryan8 and the model of the consulting firm Arthur D. Little9
(Little o. J., cited from Höft 1992, p. 78f.). The two models differ in the number of phases that
a technology goes through and in the reference quantity.
However, the proportion of companies with pure process innovations has continued to decline.
Pure rationalisation measures without new products are barely successful (Haid and Münter,
1999).
Figure 4: Life cycles seen in the old way (own representation based on Klepper and Gort [1982], Pyka [2000], and Taylor
and Taylor [2012]).
8Ford and Ryan consider the penetration of technology ("penetration of technology") and divide the time axis into a total of six
phases (see figure 2.7): 1. Technology emergence, 2. Application development, 3. Technology first, 4. Growing technology
application 5. Technology maturity and 6. Technological decline. 9 Arthur D. Little chooses the degree of competitive potential as a benchmark and divides it into four phases based on the
product life cycle: 1. Genesis, 2 Growth, 3rd maturity and 4th age.
Theoretical Background 33
Four phases of the evolution of technologies can be identified, namely introduction, growth,
maturity, and decline. In the terminology of Malerba and Orsenigo (1993, 1997), the
introduction phase (phase I) can also be called the innovation phase of the Schumpeter I type.
In this phase, a radical innovation induces a series of product innovations; the competition is
intense, market barriers are low, and the market is turbulent. In the further course, with a
standardisation of the technology taking place, phase 2 (growth) starts. Through shaping and
limiting further technological development to some extent and pursuing process innovations
more strongly, company size increases and competition intensity falls as market entry barriers
increase(phase 3: maturity). In the final phase (decline), the innovation momentum declines,
only a few incremental process innovations are observed, market concentration is high, and the
number of possible business combinations is increasing. These last two phases are more likely
to be associated with innovative behaviour that corresponds to the Schumpeter II type. As early
as 1980, Dasgupta and Stiglitz (1980) made a reference to the interdependence of market
structure and innovation activity (Cantner und Hanusch, 1998).
The increasing economic and technological dominance of a leading technological company is
achieved through the selection of competition as well as the scale or size-dependent innovation
success, with the consequence being monopolisation (Schumpeter II, of success-breeds success
hypothesis) (Flaig, and Stadler, 1994).
2.2.4. Redesign of the Life Cycles
With customer demands becoming more individualised, resulting in changing demand needs
on the market, product life cycles are becoming shorter. Thus, as previously mentioned, product
and process optimisation must occur simultaneously, which makes companies rethink their
production system. Furthermore, the rising volatility as well as the influence of startups on
industry lifecycles sharpen the course described in figure 4 in a different way (figure 5). To
improve their chances of success startups need to create new and disruptive products (simpler,
cheaper, and more convenient) as fast as possible, in addition to locating strategic alliances
(Buenstorf, 2015). That is why a fast growth curve can be observed for startups. Startups then
evolve in three different possible ways. First, they can be taken over by an established company;
second, they cannot cope with the breakthrough and disappear from the market; or third, they
can establish themselves as a stable company and follow the line of numbers of producers. The
influence of startup and volatility then result in shifting product and process innovation cycles
as well as the sooner or later defining dominant design.
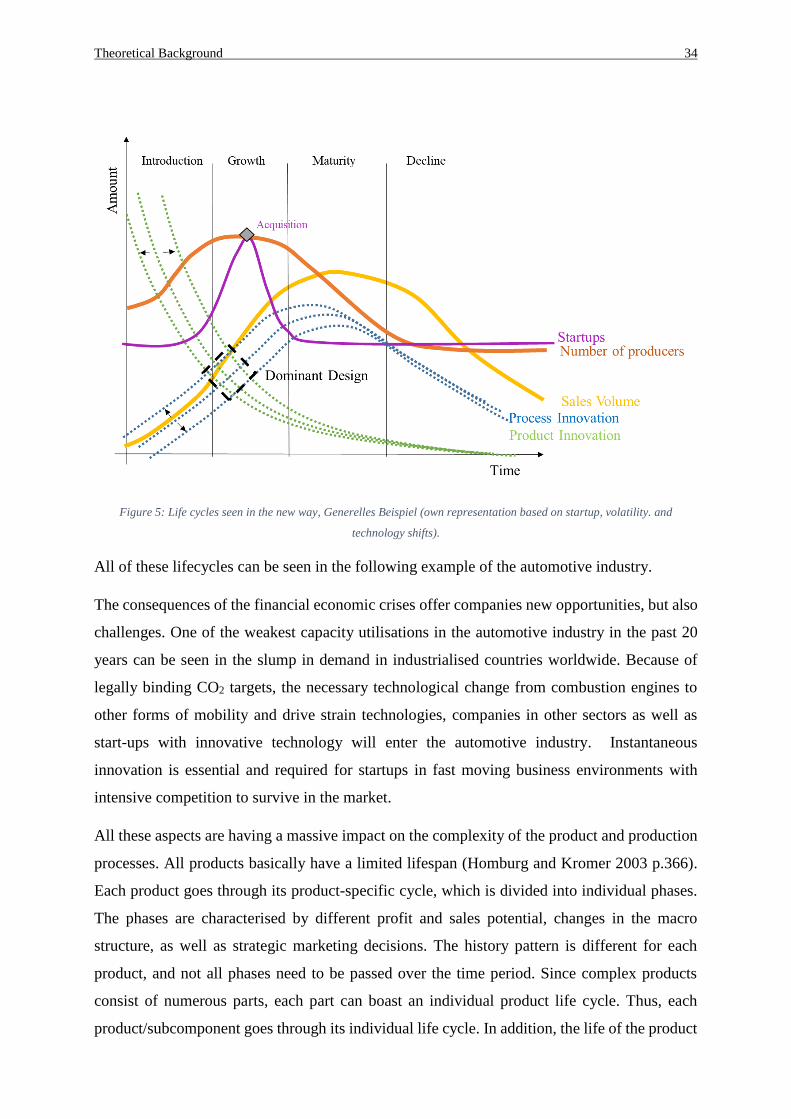
Theoretical Background 34
Figure 5: Life cycles seen in the new way, Generelles Beispiel (own representation based on startup, volatility. and
technology shifts).
All of these lifecycles can be seen in the following example of the automotive industry.
The consequences of the financial economic crises offer companies new opportunities, but also
challenges. One of the weakest capacity utilisations in the automotive industry in the past 20
years can be seen in the slump in demand in industrialised countries worldwide. Because of
legally binding CO2 targets, the necessary technological change from combustion engines to
other forms of mobility and drive strain technologies, companies in other sectors as well as
start-ups with innovative technology will enter the automotive industry. Instantaneous
innovation is essential and required for startups in fast moving business environments with
intensive competition to survive in the market.
All these aspects are having a massive impact on the complexity of the product and production
processes. All products basically have a limited lifespan (Homburg and Kromer 2003 p.366).
Each product goes through its product-specific cycle, which is divided into individual phases.
The phases are characterised by different profit and sales potential, changes in the macro
structure, as well as strategic marketing decisions. The history pattern is different for each
product, and not all phases need to be passed over the time period. Since complex products
consist of numerous parts, each part can boast an individual product life cycle. Thus, each
product/subcomponent goes through its individual life cycle. In addition, the life of the product
Theoretical Background 35
component is shorter than that of the system architecture. Each component can thus be located
in a different phase section, which in turn makes it difficult to assess the product life cycle of
complex products. Moreover, product lifecycles may be overlaid by multiple technology life
cycles, resulting in the development of new products or subcomponents10. Without endangering
functionality and compatibility, it is not possible to integrate new components into a complex
product without hesitation at any time (Schmidt, 2009). The different types of complexity as
well as their appearance in the automotive industry are discussed in detail in Section 2.4.
However, to understand the behaviour of companies within the different life cycles and how
they deal with the tension resulting from their complex goods/products, it is crucial to
understand the production structures (i.e., the production system) before complexity types are
integrated into the discussion.
2.3. Knowledge and innovation networks and ambidexterity—Influence on the
Production System
To develop products rapidly, fulfil individualised customer demands, and respond to volatile
markets, the production system of manufacturing companies must be flexible and reactive.
Furthermore, due to the increase of international supply chains, the environment has become
increasingly complex, entailing the establishment of intelligent products and production
systems (Vyatkin et al., 2007). To rise to these challenges, products require internalised
consumer information and manufacturing specifications to lead their way through the supply
chain independently (Spath et al., 2013). With the rise of big data and the development of cloud-
based data collection and storage, the role of human decision making will change
fundamentally, because production systems will become knowledgeable and self-optimising
(Yan et al., 2007).
To keep the competitive advantage gained through innovation and spawn new innovations,
innovation networks, in which knowledge is shared, codeveloped, and recombined, play an
critical role (Pyka 2002) and enable learning in a way that can hardly be provided by other
means (Summerton 1999).
In knowledge-intensive markets and fields of production, such as the automotive industry,
network structures already exist that are a result of global manufacturing chains, supply chains,
and production systems. Moreover communities that are pursuing a specific purpose and come
together based on tasks can be seen in this industry as well. A community is defined as a group
10 Technologic Substitution vs. Economic Substitution (Geels 2005; Dietz 1990)
Theoretical Background 36
of like-minded actors, often from several companies and different institutions, who come
together on a task-related basis and promote a specific innovation project (Gerybadze, 2003).
Following Gerybadze (2003) it is essential to differentiate between several forms of
communities:
- Communities of practice (e.g. Verband der Automobilindustrie (VDA)) are formed in
very specific areas of work and for the pursuit of professional interests.
- Innovation communities (e.g. Nationale Plattform Elektromobilität (NPE)) are aiming
to help an innovation in the technical, economic or social field to make a breakthrough.
- R&D communities (e.g. Innovationscampus „Mobilität der Zukunft“ of the University
of Stuttgart) are scientific communities that pursue certain research topics.
Communities and the resulting network structures influence the knowledge creation and sharing
impressively. With the rise of the Industrial Internet of Things (IIoT), a new kind of information
(big data) and way of information sharing (cloud) that can be felt at every level of the
manufacturing and scientific ecosystem has been created (Tien, 2013). The potential of big data
is not only a purely technical extension of reporting but also the change of processes and
development of the organisation towards a data- and analysis-driven company. With data sets
of a size that does not allow access, analysis, or applications to be undertaken in a reasonable
amount of time and that are beyond the ability of available tools, the created knowledge has an
impact on the network structure, analytics, methods, information sharing, as well as information
availability within companies and the above described communities. (Tien, 2013)
Using big data techniques, data can be processed in greater quantities, speed, and variety than
is possible with conventional methods. Big data must be analysed or processed to yield critical
information first; before this, big data is worthless from a decision-making point of view. Big
data techniques allow for completely new data sources and a greater input as well as increased
forecasting quality. Forecasts that are created within the framework of company controlling
usually serve as decision support. Therefore, it can be expected that with big data analytics we
are able to make informed decisions in science, business, defence, engineering, education,
healthcare, and society at large. (Tien, 2013).In addition, the system in which the knowledge
is generated and analysed to make decisions plays a vital role. In terms of the automotive
industry, every company is acting within the supply chain and has a production system.
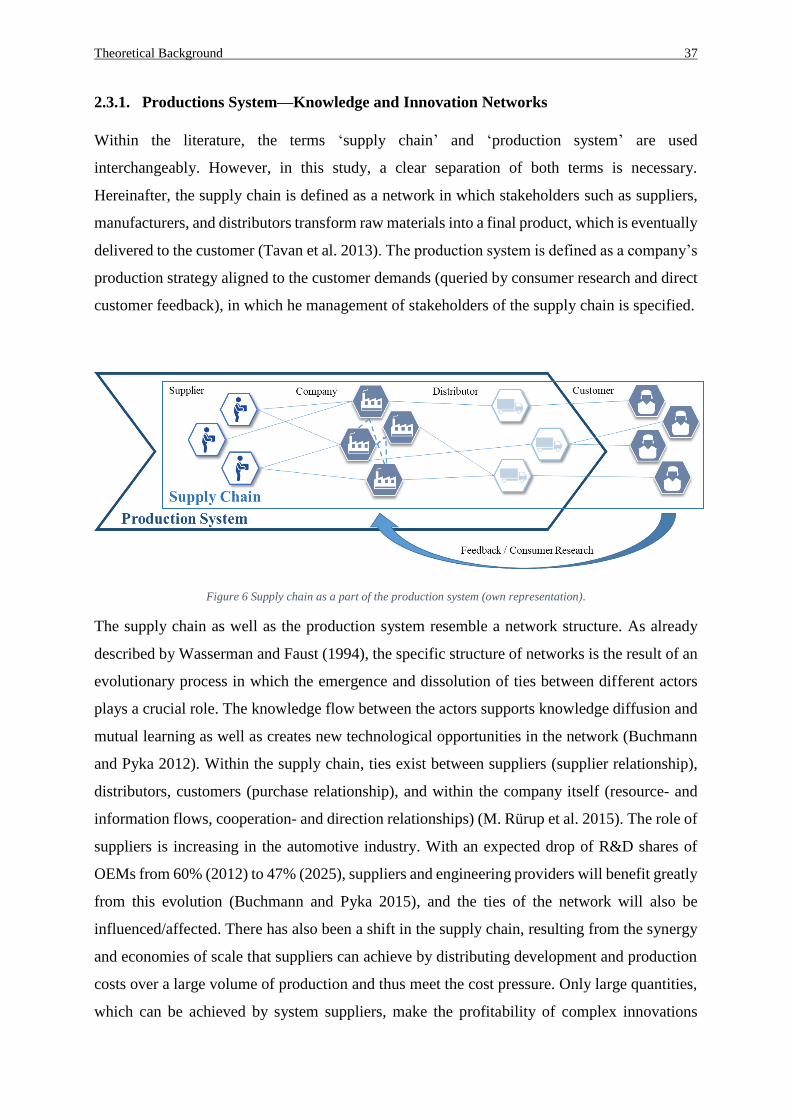
Theoretical Background 37
2.3.1. Productions System—Knowledge and Innovation Networks
Within the literature, the terms ‘supply chain’ and ‘production system’ are used
interchangeably. However, in this study, a clear separation of both terms is necessary.
Hereinafter, the supply chain is defined as a network in which stakeholders such as suppliers,
manufacturers, and distributors transform raw materials into a final product, which is eventually
delivered to the customer (Tavan et al. 2013). The production system is defined as a company’s
production strategy aligned to the customer demands (queried by consumer research and direct
customer feedback), in which he management of stakeholders of the supply chain is specified.
Figure 6 Supply chain as a part of the production system (own representation).
The supply chain as well as the production system resemble a network structure. As already
described by Wasserman and Faust (1994), the specific structure of networks is the result of an
evolutionary process in which the emergence and dissolution of ties between different actors
plays a crucial role. The knowledge flow between the actors supports knowledge diffusion and
mutual learning as well as creates new technological opportunities in the network (Buchmann
and Pyka 2012). Within the supply chain, ties exist between suppliers (supplier relationship),
distributors, customers (purchase relationship), and within the company itself (resource- and
information flows, cooperation- and direction relationships) (M. Rürup et al. 2015). The role of
suppliers is increasing in the automotive industry. With an expected drop of R&D shares of
OEMs from 60% (2012) to 47% (2025), suppliers and engineering providers will benefit greatly
from this evolution (Buchmann and Pyka 2015), and the ties of the network will also be
influenced/affected. There has also been a shift in the supply chain, resulting from the synergy
and economies of scale that suppliers can achieve by distributing development and production
costs over a large volume of production and thus meet the cost pressure. Only large quantities,
which can be achieved by system suppliers, make the profitability of complex innovations
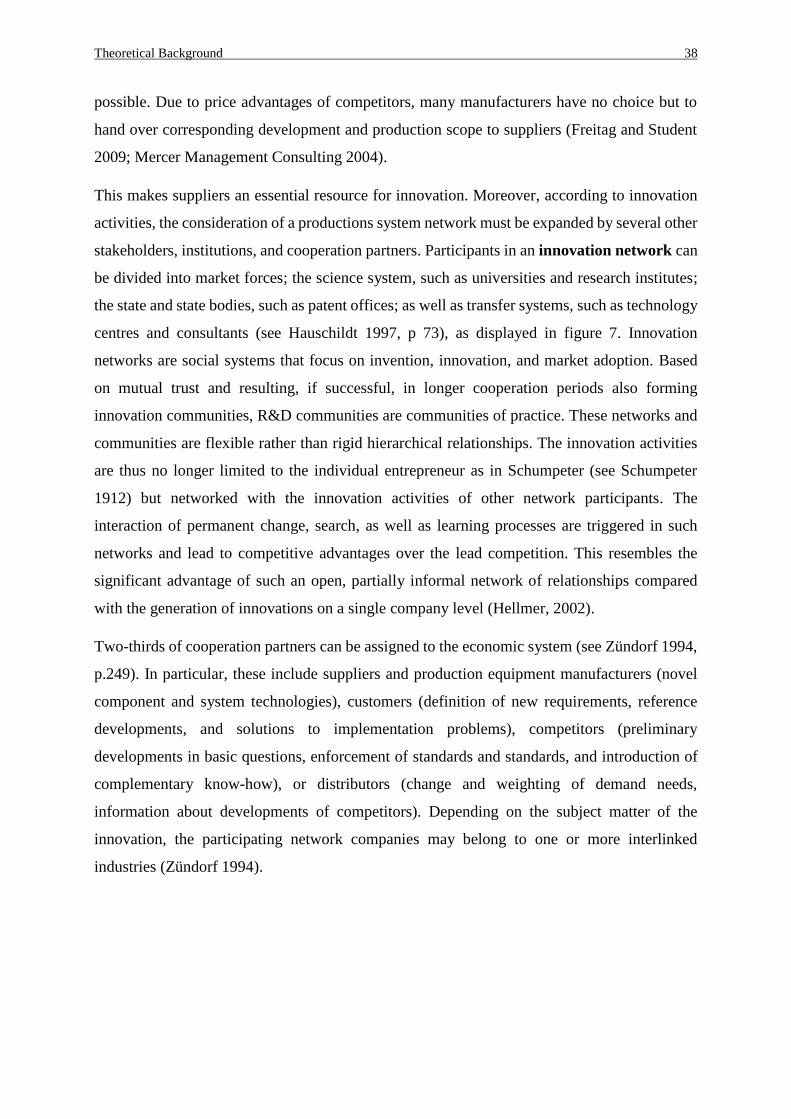
Theoretical Background 38
possible. Due to price advantages of competitors, many manufacturers have no choice but to
hand over corresponding development and production scope to suppliers (Freitag and Student
2009; Mercer Management Consulting 2004).
This makes suppliers an essential resource for innovation. Moreover, according to innovation
activities, the consideration of a productions system network must be expanded by several other
stakeholders, institutions, and cooperation partners. Participants in an innovation network can
be divided into market forces; the science system, such as universities and research institutes;
the state and state bodies, such as patent offices; as well as transfer systems, such as technology
centres and consultants (see Hauschildt 1997, p 73), as displayed in figure 7. Innovation
networks are social systems that focus on invention, innovation, and market adoption. Based
on mutual trust and resulting, if successful, in longer cooperation periods also forming
innovation communities, R&D communities are communities of practice. These networks and
communities are flexible rather than rigid hierarchical relationships. The innovation activities
are thus no longer limited to the individual entrepreneur as in Schumpeter (see Schumpeter
1912) but networked with the innovation activities of other network participants. The
interaction of permanent change, search, as well as learning processes are triggered in such
networks and lead to competitive advantages over the lead competition. This resembles the
significant advantage of such an open, partially informal network of relationships compared
with the generation of innovations on a single company level (Hellmer, 2002).
Two-thirds of cooperation partners can be assigned to the economic system (see Zündorf 1994,
p.249). In particular, these include suppliers and production equipment manufacturers (novel
component and system technologies), customers (definition of new requirements, reference
developments, and solutions to implementation problems), competitors (preliminary
developments in basic questions, enforcement of standards and standards, and introduction of
complementary know-how), or distributors (change and weighting of demand needs,
information about developments of competitors). Depending on the subject matter of the
innovation, the participating network companies may belong to one or more interlinked
industries (Zündorf 1994).
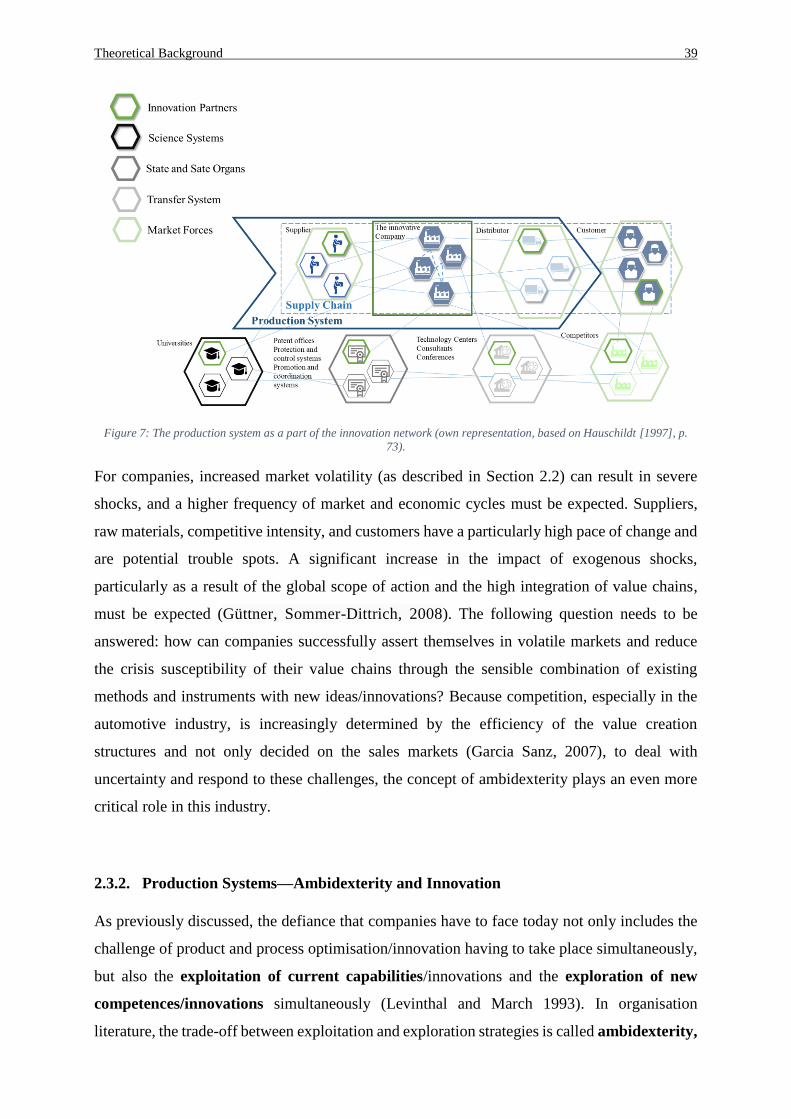
Theoretical Background 39
Figure 7: The production system as a part of the innovation network (own representation, based on Hauschildt [1997], p.
73).
For companies, increased market volatility (as described in Section 2.2) can result in severe
shocks, and a higher frequency of market and economic cycles must be expected. Suppliers,
raw materials, competitive intensity, and customers have a particularly high pace of change and
are potential trouble spots. A significant increase in the impact of exogenous shocks,
particularly as a result of the global scope of action and the high integration of value chains,
must be expected (Güttner, Sommer-Dittrich, 2008). The following question needs to be
answered: how can companies successfully assert themselves in volatile markets and reduce
the crisis susceptibility of their value chains through the sensible combination of existing
methods and instruments with new ideas/innovations? Because competition, especially in the
automotive industry, is increasingly determined by the efficiency of the value creation
structures and not only decided on the sales markets (Garcia Sanz, 2007), to deal with
uncertainty and respond to these challenges, the concept of ambidexterity plays an even more
critical role in this industry.
2.3.2. Production Systems—Ambidexterity and Innovation
As previously discussed, the defiance that companies have to face today not only includes the
challenge of product and process optimisation/innovation having to take place simultaneously,
but also the exploitation of current capabilities/innovations and the exploration of new
competences/innovations simultaneously (Levinthal and March 1993). In organisation
literature, the trade-off between exploitation and exploration strategies is called ambidexterity,
Theoretical Background 40
and creating a healthy balance between these two strategies is a key factor in achieving long-
term success (March 1991).Being able to develop a successful balance within the company
between both strategies and using the generated knowledge effectively can be considered a
critical resources that companies need to establish to stay competitive, and therefore follows
the resource-oriented approach. A company’s behaviour and success, primarily explained
through the existence and use of its unique resources, are the basis of the approach. Due to the
assumption of a resource heterogeneity in the markets, a company can gain a vulnerable market
position based on specific resources, which translates into a lasting competitive advantage
(Zentes, Swoboda and Morschett 2003). Dynamic characteristics (for example, balancing
exploitation and exploration) within the resource-oriented approach deals with the internal
development, protection, and further development of such resources (Duschek 2002). The
innovations are interpreted as being path-dependent, which means that the tangible and
intangible resources of the company enable or limit the possible innovation processes.
While exploration strategies imply searching, experimenting, risk taking, and discovering
behaviour that is associated with improvised, autonomous, and chaotic system structures,
exploitation strategies focus on refinement, selection, efficiency, and implementation
behaviour that is associated with routine, controlled, and bureaucratic system structures
(Ancona et al.2001, Cheng and Van de Ven 1996,).Furthermore, these two strategies have an
impact on the returns of the company. While returns caused by exploration are more distant in
time and have a more variable character, those caused by exploration result out of a more stable
performance with lower variability and are less distant in time. Organisational ambidexterity
is thus defined as the ability of organisations to be efficient and flexible at the same time (He
Wong, 2004). Each company faces the innovator’s dilemma, referring to the fact that companies
that are successful on the market could disappear into insignificance from one day to another
because they have missed out on a new technology (Christensen, 1997). Specifically, when a
business is successful, they neglect the R&D of new technologies and instead put all resources
into their supposed success story, because this seems to be more efficient and less expensive.
However, even if they try to overcome this challenge by creating Innolabs or startups in the
organisation, they tend to fail because they misunderstand the basic meaning of ambidexterity.
At the heart of the model is the thought that everything stays in one organisational body. One
cannot just hand over innovation to the other hand without keeping a connection to the rest of
the organisation. Thus, organisational ambidexterity means the parallelism of exploitation of
the existing and exploration of the new. In addition to the tasks that differ in the two spheres, a
parallelism also exists in organisational methods. While the core business is optimisation
Theoretical Background 41
(exploitation), which is best achieved through fixed structures, processes, time horizons, and
regulatory compliance, innovation spaces are about creativity, the breaking of routines and
patterns, leaving of comfort zones, and therefore the discovery of new solutions (exploration).
The solution and moderation of these conflicts succeed only through contextual or harmonic
ambidexterity, in contrast to structural or cyclic ambidexterity (Carmeli and Halevi, 2009).
- Cyclical ambidexterity: Long cycles of exploitation are interrupted by short periods
of exploration (Gupta et al. 2006).
- Position-based ambidexterity: Exploration and exploitation are located on different
hierarchical levels of the organisation (Volberda et al. 2001).
- Structural ambidexterity: Different teams and locations are used to separate the
learning types, which include inter organisational realisation (Wollersheim 2010).
- Contextual/harmonic ambidexterity: The individual level (i.e., one person) is
decisive (Gibson and Birkinshaw 2004).
Thus, the resulting question is whether exploration and exploitation, which are orthogonal
competencies (Gupta et al. 2006), can be effectively exercised simultaneously or sequentially
(Guffarth 2016).The seamless integration of efficiency today as well as innovation in the
future describes the necessity of exhausting the existing, and simultaneously exploring the
new. This resembles the true nature of ambidexterity.
In addition, the focus on either exploitation or exploration strategies can result in a self-
reinforcing trap, namely the so-called efficiency trap (exploitative strategies) or innovation
trap (explorative strategies). Whereas the innovation trap inhibits the unsuccessful
commitment to an innovation project, through spending increasing amounts of money and time
disregarding the disappointing experiences that have already appeared, in the efficiency trap
companies tend to neglect investment in exploratory innovation activities because the short-
term success of the incremental optimisations offers quick returns and a low risk of failing,
similar to the innovator’s dilemma(Benner & Tushman, 2003; Gupta et al., 2006; March, 1991).
Focusing on product innovation/new product development (NPD), companies concentrate on
the same strategies without consideration of differentiating between exploitation and
exploration. With regard to a company’s performance, a cross-functional structure for
explorative (radical) innovations significantly enhances the breakthrough innovation
performance, whereas a functional structure for exploitative innovation (incremental)
Theoretical Background 42
significantly enhances the derivative innovation performance (Visser, Weerd-Nederhof, Faems,
Song, van Looy and Visscher, 2010).
Furthermore, the system in which the innovation/knowledge is generated or needs to be adapted
plays a crucial role. In the automotive industry, the production system as well as the product
can be described as complex.
2.4.Complexity in the context of innovation—Complex products in complex systems
In this section, complexity is seen as the behaviour of a system or model whose many
components can interact in different ways (Willke, 1987). The focus is on the role of complexity
in the product (2.4.1), the production system (2.4.2.), the social system (2.4.3.), the network
(2.4.4.), and political instabilities (2.4.5.). The transformation of the automotive industry and
its products over the last centuries serve as an example to show the results of the
interconnectedness of the world, due to the rapidly increasing complexity displayed at the
macro, meso, and micro levels.
2.4.1. Complexity in the Product
Products themselves are becoming increasingly complex; moreover, innovation today often
occurs in software. The reason for the increasing variety of offerings and variants is the race of
manufacturers to meet consumers’ wishes through innovative vehicle concepts as well as new
technologies (Stock 2007). The number of vehicle variants or vehicle models has increased
significantly in recent decades (Becker 2007) (Figure 8).
However, the increasing customer requirements not only create complexity in the form of
additional models but also increased complexity in the systems of a vehicle. To offer maximum
functionality, an increased network of individual systems is necessary (Hessing 2008).With
enhanced complexity, the strain of the achievement of goals increases and conflicting goals
emerge. The rising security requirements demanded by customers and by law, with control
units, additional sensors, actuators, and crash-optimised body structures, satisfy the desire for
more safety in vehicles; by contrast, the additional weight in the vehicle has a counterproductive
effect on other customer requirements. This example demonstrates the conflicting goals
impressively (Lindemann et al., 2009).
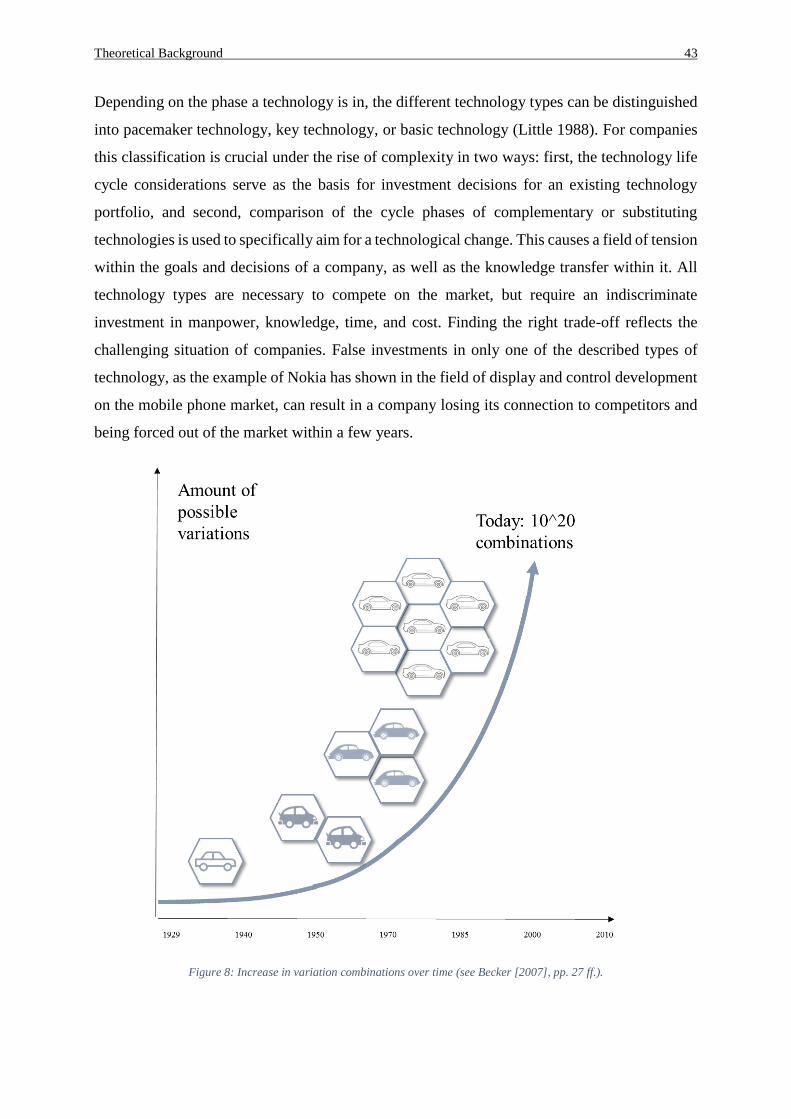
Theoretical Background 43
Depending on the phase a technology is in, the different technology types can be distinguished
into pacemaker technology, key technology, or basic technology (Little 1988). For companies
this classification is crucial under the rise of complexity in two ways: first, the technology life
cycle considerations serve as the basis for investment decisions for an existing technology
portfolio, and second, comparison of the cycle phases of complementary or substituting
technologies is used to specifically aim for a technological change. This causes a field of tension
within the goals and decisions of a company, as well as the knowledge transfer within it. All
technology types are necessary to compete on the market, but require an indiscriminate
investment in manpower, knowledge, time, and cost. Finding the right trade-off reflects the
challenging situation of companies. False investments in only one of the described types of
technology, as the example of Nokia has shown in the field of display and control development
on the mobile phone market, can result in a company losing its connection to competitors and
being forced out of the market within a few years.
Figure 8: Increase in variation combinations over time (see Becker [2007], pp. 27 ff.).
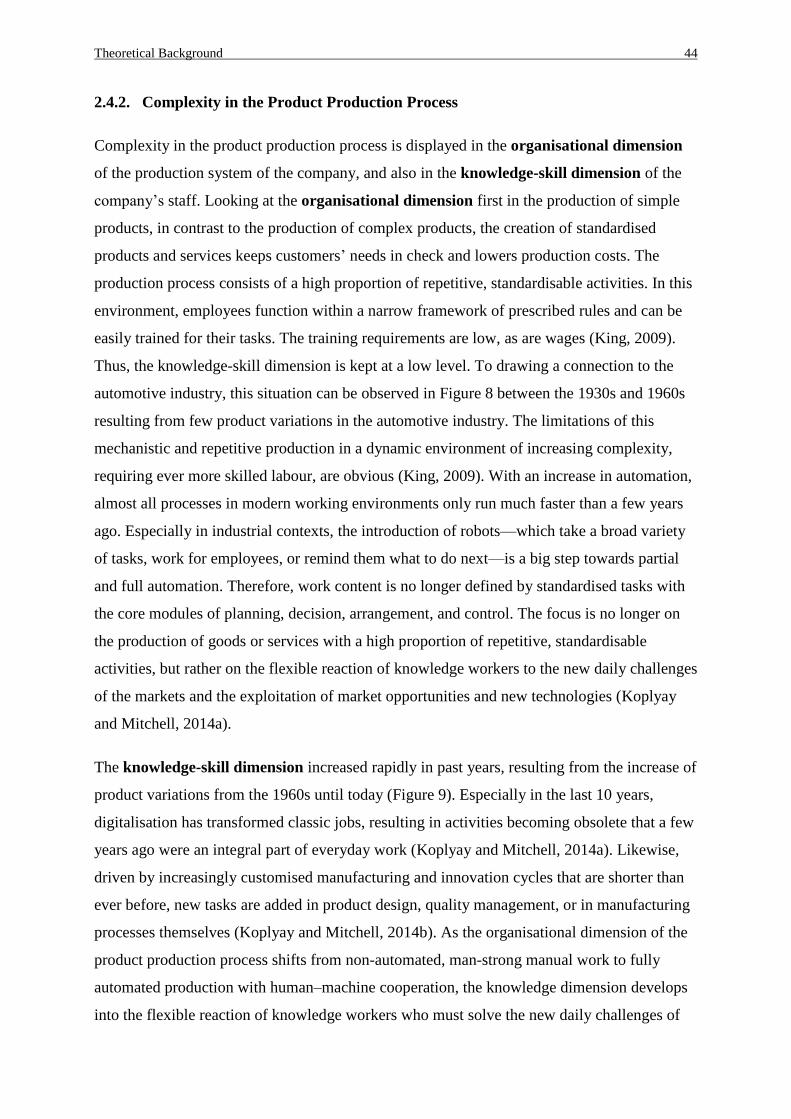
Theoretical Background 44
2.4.2. Complexity in the Product Production Process
Complexity in the product production process is displayed in the organisational dimension
of the production system of the company, and also in the knowledge-skill dimension of the
company’s staff. Looking at the organisational dimension first in the production of simple
products, in contrast to the production of complex products, the creation of standardised
products and services keeps customers’ needs in check and lowers production costs. The
production process consists of a high proportion of repetitive, standardisable activities. In this
environment, employees function within a narrow framework of prescribed rules and can be
easily trained for their tasks. The training requirements are low, as are wages (King, 2009).
Thus, the knowledge-skill dimension is kept at a low level. To drawing a connection to the
automotive industry, this situation can be observed in Figure 8 between the 1930s and 1960s
resulting from few product variations in the automotive industry. The limitations of this
mechanistic and repetitive production in a dynamic environment of increasing complexity,
requiring ever more skilled labour, are obvious (King, 2009). With an increase in automation,
almost all processes in modern working environments only run much faster than a few years
ago. Especially in industrial contexts, the introduction of robots—which take a broad variety
of tasks, work for employees, or remind them what to do next—is a big step towards partial
and full automation. Therefore, work content is no longer defined by standardised tasks with
the core modules of planning, decision, arrangement, and control. The focus is no longer on
the production of goods or services with a high proportion of repetitive, standardisable
activities, but rather on the flexible reaction of knowledge workers to the new daily challenges
of the markets and the exploitation of market opportunities and new technologies (Koplyay
and Mitchell, 2014a).
The knowledge-skill dimension increased rapidly in past years, resulting from the increase of
product variations from the 1960s until today (Figure 9). Especially in the last 10 years,
digitalisation has transformed classic jobs, resulting in activities becoming obsolete that a few
years ago were an integral part of everyday work (Koplyay and Mitchell, 2014a). Likewise,
driven by increasingly customised manufacturing and innovation cycles that are shorter than
ever before, new tasks are added in product design, quality management, or in manufacturing
processes themselves (Koplyay and Mitchell, 2014b). As the organisational dimension of the
product production process shifts from non-automated, man-strong manual work to fully
automated production with human–machine cooperation, the knowledge dimension develops
into the flexible reaction of knowledge workers who must solve the new daily challenges of
Theoretical Background 45
the markets and use the opportunities brought by new technologies and digitisation. This
results in rising complexity in the social system.
Figure 9: The four industrial revolutions (own representation based on Stearns [2018])
2.4.3. Complexity in the Social System
Parallel to the digitisation of products and processes, the ways in which people are learning,
working, and living are changing as described above. The increase in the knowledge-skill
dimension leads to significant implications for learning and skill development and is more
crucial than ever. Today, the VUCA11 principle is increasingly cited to describe modern
working contexts and the complexity in the social system (Mack and Khare, 2016). This
principle deals with the fact that there are no fixed rules, no certainties, and clearly recognisable
relationships, meaning that everything is possible, even its opposite (Seifert et. Al. 2017). Each
letter (V, U, C, A) resembles the first letter of a word describing influencing factors of a social
system:
- Volatility: Characterising conditions that are unstable and thus unpredictable.
- Uncertainty: Referring to a state of a lack of knowledge, ambiguity, and unknown risk.
11 VUCA is an acronym of the words Volatility, Uncertainty, Complexity and Ambiguity and was first stated by Bennis und
Burt Nanus in 1987. VUCA - in its German variant VUKA - is increasingly used in economic contexts and when it comes
to leadership issues in profit-oriented companies. (Seifert et. al. 2017)
Theoretical Background 46
- Complexity: Referring to the behaviour of a system or model whose (many) components
can interact with each other in a variety of ways, following only local rules and where
higher-level instructions are unknown.
- Ambiguity: Referring to contradictions and alternative facts making decisions difficult,
because simple explanations are not working anymore and there are no clear solutions
to an existing problem (Bennett and Lemoine, 2014a; Horney, Pasmore and O’Shea, T.
2010).
Because each share of the principle cannot be seen individually or isolated, but they are seen as
networked, dissolving becomes even less possible. It is exactly through this network that an
unpredictable conflict arises (Bennett and Lemoine, 2014a).In contrast to young startups,
established companies usually have an inheritance that does not allow them to reject all previous
organisational mechanisms in the VUCA world and establish a radically new form of
organisation. In many areas, the efficiency- and quality-oriented established structures and
processes continue to offer indispensable value (Johansen and Euchner, 2013; Bennett and
Lemoine, 2014b).
The need for digital transformation and the VUCA world requires overcoming of the inertia of
traditional organisational forms and management principles (Rodriguez and Rodriguez, 2015;
Sarkar, 2016). The concept of ambidexterity, therefore, provides for the establishment of a
second parallel operating system. Whereas an efficiency-oriented organisation is concerned
with continuously optimising what already exists, a parallel organisation is concerned with the
future viability of radical innovation and new business models of the company. As mentioned
earlier, the challenge of this ambidexterity is to master both simultaneously: to optimise the
existing and create the new. A good balance of the different principles is important for success
on both sides (Balthes and Freyth, 2017).
Paradoxes and contradictions inevitably arise in the organisation because of this parallelism of
economically resilient investment in strategic innovations on the one hand, and the profitable,
efficiency-oriented optimisation of the core business on the other (Balthes and Freyth 2017).
The adaptability as well as the exploration potential of companies in a situation characterised
by volatility, uncertainty, complexity, and ambiguity, while simultaneously not losing sight of
the exploitation in environments characterised by stability, security, simplicity, and uniqueness,
are elements of several decision models for complex social systems.
The Stacey Matrix, named after Ralph Stacey, correlates the degree of unity on the way and
the degree of certainty (certainty). In simple situations, when all parties in the company agree
Theoretical Background 47
on which path to take it is clear which way to go, and tried and tested standards with strict
monitoring and continuous improvement can be used. By contrast, in situations with a
disagreement about the solution path, because of high diversity among the stakeholders,
insufficient information available, or the need to develop new technologies, the path to
achieving the goals becomes increasingly insecure and the complexity increases. In this
complex situation, standards only help a little; negotiating ways through open forms of
cooperation and promoting creativity and innovation are more effective (Stacey, 2001).
Similarly, Dave Snowden (2007) differentiated four different areas of life of organisations in
his Cynefin framework, namely simple, complicated, complex, and chaotic areas.
- Simple and complicated areas are clear enough to derive what to do from best or
good practices. In simple and complicated areas, one perceives what happens, and then
categorises or analyses the perceived reality and shape one’s reaction based on the
results.
- Complex and chaotic areas lack clarity and therefore only emergent or novel practices
help. In complex and chaotic areas, one starts testing or acting to be able to perceive
what has happened, and then make my next step of the reaction (Snowden and Boone,
2007).
Today, both the Stacey matrix and the Cynefin framework are used to identify the current
situation of a project landscape. In simple and complicated areas, it makes sense to exploit
efficiency by exploiting standardisation, since the necessary stability, security, simplicity, and
uniqueness are given. Efficiency programmes, such as from the Lean environment, make
sense here. By contrast, in complex areas characterised by volatility, uncertainty, complexity,
and ambiguity, exploring agile ways of working is most suitable. How to be lean and agile
simultaneously, and what this means for the automotive industry and companies’ production
systems, are discussed in Section3.1. With these paradoxes and contradictions inevitably
arising in the organisation, the complexity in the network also increases.
2.4.4. Complexity in the Network
Networking itself is an initially value-free event of economic activity, which can be described
in the course of the evaluation of and decision between alternatives under scarcity of resources
in a first-course determination with complexity, unmanageability, and non-transparency
(Willke, 1987). A classic example is the car and the automotive industry. In a car itself, up to
Theoretical Background 48
100ECUs are installed and form an electronic network. Each of these controllers can again
contain millions of lines of code. Moreover, all parts that need to be assembled within the
manufacturing process form a complex network of hardware and software. In addition, the
manufacturing structures as well as suppliers and distributors form a complex network of
services and goods. Therefore, as a contribution to this research, various sources of complexity
in companies are addressed and applied to the automotive industry (Koplyay and Mitchell,
2014a).
In displaying production system networks (subsection2.3.1), the whole automotive industry
can itself be described as a complex network. Following the definition of Scholz (2009), a real
complex network is a complex system consisting of individual elements (people, computers, or
molecules) and connections or relationships between them (friendships, networks, or
interactions). Real complex networks are naturally grown or emerging networks (not centrally
planned; Scholz, 2009).Through the formation of networks, the company hopes for improved
mobilisation and pooling of resources, innovative concepts, structures, and processes as well as
the reduction of transaction costs. In a rapidly changing environment, networks are always an
attempt to condense mutual dependencies and turn them into social capital that can be used in
turbulent conditions (Henning, Oertelt and Isenhardt, 2003).
Network researchers have analysed the most diverse relationship aspects of a system (see
Salancik, 1995; Cook, 1992; Freeman 1979; Nohria and Eccles 1992):
- Cooperation relations: Who is researching together with whom? Who publishes with whom?
Who cites whom?
- Formal relationships: Who is reporting to whom? Who is the shareholder of which research
company? Who owns which patent rights?
- Communication relations: Who gets advice and tips from whom? Who talks to whom? Who
is connected to whom via a virtual communication infrastructure?
- Economic relations: Who is sponsoring which scientific conference? Who is a customer of
which research company? Who is the supplier of which research company?
- Affiliation, memberships: Who is a member of an advisory board, a jury? Who is the
reviewer or publisher of which journal? Who lives, works, and researches where?
Due to this complex constellation of network partners (subsection 2.3.1), innovation processes
are not completely controllable. This does not mean that they occur accidentally or are
determined exogenously, but rather that they run between internal and external coordination
Theoretical Background 49
(Duschek 2002). A higher degree of novelty and complexity, the associated uncertainty, and a
higher content of conflict make it difficult to control innovation processes; this is in contrast to
routine operational processes, which are relatively easy to control through standards and
constant repetition (Thom 1980).
Especially globally-dispersed innovation processes with distributed R&D activities are the
reason for highly complex, uncontrollable and unmanageable organizational structures and
architectures. To manage the innovation activities in a lean and effective way a spatial
distribution between learning and coordination is necessary. Creating and enabling multiple
centres of learning accommodated by one dominant centre of coordination and control is an
effective strategy companies have already adapted to manage complexity in these networks.
(Gerybadze and Reger, 1999)
At the same time, foreseeable developments such as climate change, demographic change, or
the scarcity of resources pose challenges that create pressure to act as well as shape the future,
and must therefore be addressed by politicians as well (Fischer and Wiegand; 2012).
2.4.5. Complexity Through Political Instabilities
Long-term and reliable political conditions are essential for the industry as well as its
employees, and can be international drivers and encourage investment. A political environment
that allows cooperation and demonstrates stable structures offers numerous advantages for
international companies (Dyer and Chu, 2003). Therefore, managing interdependencies is not
only a challenge for companies but also for politicians and countries. These interdependencies
occur between private and public (usually collective) actors, between a complex political
regulatory system and other functional systems of society (Benz 2004a).
Cost-oriented benefits of cooperation result from economies of scale, economies of scope,
optimisation of the degree of integration, and risk sharing. The economies of scale or scope
(Backhaus and Plinke, 1990) can be attributed to the sharing of production factors, which
according to Porter (1985) leads to enhanced capacity utilisation and faster learning curve
progression. Cost-related synergy effects through the optimisation of the degree of integration
occur when the coordination mechanisms within cooperation for the coordination of
interdependent business processes are more cost-effective than when coordination between
external organisational units (i.e., via the market) must be conducted (Transaction Cost
Theoretical Background 50
Theory12) (Lyons B. R. 1995, Dyer, 1997; Coles and Hesterly, 1998). Risks arise particularly in
the case of investments that are subject to high uncertainty (e.g. R&D investments). Through
cooperation, the effort and thus the risk of the individual company can be reduced (Gahl 1990;
Dyer, 1997).Market-oriented advantages arise when the market position of a company can be
improved through cooperation. This can be done in relation to the suppliers, with regard to the
customers or also with respect to the competitors (Backhaus and Plinke 1990). Reasons for
cooperation are to gain access to international sales markets through a foreign cooperation
partner or to aim for a diversification strategy, which leads to an expansion of the range of
services (Eisele 1995). Cooperation is necessary when it is not possible to enter the foreign
market unilaterally due to legal or cultural restrictions. Likewise, cooperation can aim for a
diversification strategy (Eisele 1995). Aiming for diversification is essential when a company
can gain more ground through cooperation and is less dependent on a single product, single
service, or single customer segment. Market-oriented advantages can also arise if standards are
established through cooperation and system leadership results from this (Plinke 1990).
The emergence of knowledge related to innovation within a production system, which can be
described as a complex process with the output car (a complex product) and the difficulty people
and the organisation face to deal with it, is a primary component of this work. The different
approaches that have emerged in recent years in the automotive industry to meet the growing
complexity, increasing demands, and volatility of markets as well as politics are the theoretical
basis for the empirical validation of the legibility of lean and innovation in the following
sections.
The natural response of people and organisations to complex challenges varies widely. A
common and frequent reaction is to try to solve the complexity at the structural level, such as
through lean management principles and methods. Furthermore, a change of channels or
messages is another frequently used approach, such as agile principles and methods (see
Chapter 3).The consequence, however, can also be that the complexity is not reduced, but even
increased. Moreover, for employees and customers, this can lead to additional irritation if
concepts and methods are not integrated into the company culture in the right way.
12 Transaction Cost Theory: Transactions cause costs (information, communication and coordination costs), so-called
transaction costs (search costs, initiation costs, agreement costs, processing, adaptation and control costs) (Coase, 1960;
Picot, 1982; Windsperger, 1983). A transaction is the transfer of a preliminary or intermediate product or a service from an
upstream to a downstream production stage. (Ghoshal and Moran 1996)
Theoretical Background 51
2.4.6. Complexity at the Macro, Meso, and Micro Levels
The complexity of innovations at different levels results in immense uncertainty with regard to
assumptions about possible developments. Developments in technology, the economy, and
society cannot be predicted with certainty. Therefore, complexity leads to uncertainty at all
levels (micro, meso, and macro) and is described in the following paragraphs (Fischer and
Wiegand; 2012):
Complexity at the macro level: The complexity of the social system as well as through
political instabilities shows the uncertainty at the macro level. In particular, the effects on the
economy caused by the financial crisis of 2008 and 2009 in the automotive industry show the
influence of VUCA principles as well as the political instabilities at the macro level. The
uncertainty is reflected in the decline in registrations and production figures in the automotive
industry in 2008 and 2009.In the fourth quarter of 2008, sales markets such as the USA lost in
some cases over 40% compared with the previous year (Freitag and Student 2009). With
manufacturers under extreme pressure to save costs as well as companies not pursuing
competitive technologies in times of crisis, the inherent risk that competitors will gain
technological advantages as markets recover was rising enormously. Some companies had to
reduce their spending on R&D or exclude certain fields of action such as electrification from
austerity measures in those years to not lose touch with competitors. Furthermore, the
indecisiveness of German politics, since there was no solution, for example, to reorganise the
motor vehicle tax, did the rest (Freitag & Student 2009). Facing uncertainty on the customer
side as well as in the development of products and production processes leads to an increase of
complexity at the macro level, but also influences the micro level of the automotive industry
enormously.
Complexity at the micro level: Uncertainty in product development as well as the selection of
the right sustainable technology for the future in general, but especially in times of crisis,
displays the complexity at the micro level. In the automotive industry, the market change caused
by customers increasingly wanting individualised products means that the number of variants
increases significantly and implies a more complex production or service by producing different
versions with the same production volume. This, in turn, brings out economies of scale and
challenges in the traditional structures of a company (Wildemann, 1998).
The structural changes in the global economy become clear when one sees the economy as part
of a dynamic network. The objects of this network (such as market players, assets, factors of
Theoretical Background 52
production, available information, and skills and knowledge of employees) are in different
relationships with each other (see Section 2.3).The decision made on an individual level affect
the company (e.g., skills and knowledge of workers, project management, innovation processes,
and innovation culture) and result in rising complexity at the micro level. In particular, the type
and aspects of relationships, characterised by the type and number of elements as well as the
type, strength, number, and density of interrelations, increase the complexity. This can
positively result in shorter development and decision cycles, the use of new technology, and
the gain and sharing of task relevant knowledge; however, it can also have negative results
when failing to anticipate or neglecting the cost effects of complexity (Hundertmark, 2013).
Therefore, innovative change can be seen through new rules (innovation) at the micro level,
which, if successful, lead to a structural change at the meso level. This shows that the
complexity to be found at the respective level makes it necessary to put a meso level in between
.Only the meso level makes it possible to unite the minimum unit (micro) and a maximum unit
(macro) and be able to find the causes of the change described at the macro level and explained
at the micro level (Carlsson and Eliasson 2003; Savotti and Pyka, 2004)
Complexity at the meso level: The causes of change can often be found in the interplay of
decisions of individual units on an organisational and institutional level under the given
framework and influencing factors. Decisions are not made at an individual (micro) level
anymore, but rather on an organisational level (between different micro units). Organisational
decisions are characterised by the fact that they are not only anchored in the brain structures of
those involved but also in the surrounding social systems, such as organisations or cultures.
Therefore, a rule system and structures are required because the underlying evolutionary
process is much faster than the biological one and can result in increasing complexity at the
meso level (Arthur, 2013).
The digital transformation for innovation systems opens up ground breaking new perspectives
in understanding why market players trade with each other, certain production factors are
required to produce a good, and a market or players have certain information and therefore help
in developing the right rules and structures in the company to reduce uncertainty and
complexity. Intelligent digital networking, new digital technologies that complement an array
of technologies, digital platforms, and the arising intelligent networking of people and objects
are advantages (Bauer et al. 2015; acatech and BDI 2017); however, when understood
incorrectly, they can also be disadvantages and a reason for the increase of complexity in
innovation systems at the meso level. This is especially true if nationally or regionally varying
Theoretical Background 53
shaped values as well as thinking and cultural patterns need to be incorporated into overarching
innovation processes and further refined in a globally competitive way (Tushman and O’Reilly,
2002).
It is of course an essential element that all levels (macro, meso, and micro) feed back to the
levels below, which is a major cause of the complexity observed.
2.5.Link between innovation and lean management/production and the link to
evolutionary economics
There is no doubt that without technological innovations our lives would look very different
today, because they have created new opportunities for communicating, interacting with each
other, seeing, thinking, and living. Simplification, organisation, and coordination of tasks are
what management has been based on since the beginning of the 20th century. Developing
corporate policies, creating hierarchies to ensure worker compliance, and reducing the
surrounding complexity levels were the main goals. This is why lean management and methods
play a critical role in companies handling complexity. Core principles in the lean philosophy
are based on problem solving and continuous improvement. Connecting these principles to
innovation theories, in practice, the challenge is often to find a problem for which an idea
provides the solution. Good ideas often start with the question of the right problem: what exactly
is the problem we are looking for solutions to? (Chen and Taylor, 2009).In 1975, Kodak
launched the first digital camera that could only save a few pictures, but obviously had great
potential. However, it was a good idea at the wrong time, with nobody buying it. Once people
realise which of their problems is solved by an idea, the idea has a great chance of survival
(Lucas and Goh, 2009).
This leads to the dilemma Porter (1980) stated—it is impossible for companies to pursue a low
cost strategy as well as a differentiation strategy and not get stuck in the middle. This section
clearly shows that Lean and innovation can co-exist and are not mutually exclusive, and in fact
are vital components to the bottom line equation of cost, quality, and value. Coupling the two
concepts might seem challenging first, but a commitment made by those in management to merge
the changes they engender into the operational strategy and assure that the implementers
understand and accept the main determination and goal, the difficulties will be dissolved and a
cutback in complexity at all levels will be ensured.
Theoretical Background 54
2.5.1. Lean: The Upcoming of Lean and its Link to Innovation in the Automotive
Industry
Lean management combines a multitude of methods. The supporting pillars are just-in-time
(JIT) production and Jidoka (Monden, 1983; Sakakibara et al., 1993; McKone and Weiss,
1999), described as the autonomous shutdown of a plant in the event of production problems.
To do this, production and processes must be levelled, standardised, and visualised. The core
principles aim to optimise the production factors and product quality as well as to make the
production apparatus more flexible (Li et al., 2005; Shah and Ward, 2003; Sugimori et al.,
1977).
The most valuable features of lean are the continuous improvement (kaizen) of the processes
and the concentration on customers, suppliers, and employees (Kranz, 2007). This is
illustrated in the TPS house. In Japan, after the Second World War, a different strategy was
chosen to that chosen by automakers in the USA and Europe. Instead of pure mass
production, the focus was on rapid product innovation. This rapid change required a different
production strategy. Taiichi Ohno and Shigeo Shingo are considered the founders of this new
philosophy of production, and in the 1950s they shifted process planning from the top of the
hierarchy to the place of actual work. Newly created principles enabled companies to react
faster to change and thus be more agile in the market. Positive effects within production are
reductions in unused production areas, employees, development times, inventories, lead times,
and sources of error. This increases product diversity, product quality, and overall customer
satisfaction, and therefore has a positive impact on competitiveness (Womack and Jones,
1996; Spear and Bowen, 1999). Furthermore, employees were included in the planning to not
only create rapid product changes but also adapt the production strategy to these changes.
Thus, the idea of the continuous improvement process (CIP) was born (De Treville and
Antonakis, 2006; Hopp and Spearman, 2004; Narasimhan et al., 2006; Womack and Jones,
1996).
Lean production should ideally be combined with a lean administration, which then results in
a doubling of production and halving of costs in all areas of the company. It boils down to
allowing people to collaborate better in lean production: cross-disciplinary, silo-disruptive,
thereby shortening the communication channels between the individual members of a project,
department, or organisation (Hall, 1987; McLachlin, 1997).
At the beginning, many companies failed because they only used lean methods and
management to solve individual problems or improve single processes. The mindset behind
Theoretical Background 55
the methods was ignored. Crucially, the management work must create a tight mindset on the
basis of the company’s vision and goals. Important components of this mindset are
manufacturing, leadership, and organisational principles that together form a system in which
the mindset, methods, and approach concept belong together. This system represents the
guiding principles for executives and employees in their day-to-day work. Employees are
trained in lean tools and methods to optimise processes in the prescribed guidelines to enforce
the principles. This forms the basis for the change process (Womack and Jones, 1996).
The link between lean and innovation provides insights through the components of emerging
knowledge. On the one hand, early routinisation and reduction of uncertainty through being
rigid, standardised, and constrained to productivity leaves less room for radical creative
thinking and disruptive innovation (Ven de Ven, 1986). However, as lean’s focus is on
optimisation strategies and process improvements, it has a decisive impact on the emergence
of incremental knowledge in innovation processes. Tried-and-tested models that promote the
idea of optimisation within innovations and reflect incrementally generated knowledge
include the theory of inventive problem solving (TIPS) and lean innovation.
TIPS and lean innovation both have the intention of eradicating items that do not add value in
the innovation process by encompassing the optimisation of the operations of the system (Chen
and Taylor, 2009; Yamashina, Ito and Kawada, 2002; Schuh et al. 2015). Thus, implementing
a lean culture in which slack, risk, and variability are reduced has a positive impact on the
innovation process of companies (Chen and Taylor, 2009).
TIPS is a Russian concept of inventive problem-solving and is based on two basic ideas:
solving a contradiction leads to high-quality inventions and inventing is a repeatable and
reproducible process. Recurring patterns, meaning that thousands of inventors have repeatedly
overcome similar contradictions with comparable solutions, were described as generic solutions
by Altschuller and Shapiro (1998). These solutions are the ‘40 inventive principles’ known
today (Gundlach and Nähler 2006, p. 14). Each and every invention and innovation can be
traced back to one or more of these inventive principles. In the Altschuller matrix,
contradictions and the inventive principles applied to the solution are clearly depicted and
ordered by the frequency with which they were used to solve the problem situation (Altschuller
1998).
Compared with the other problem-solving methods, TIPS can solve a wide variety of tasks of
different complexity. Most of the other problem-solving methods such as trial and error are
unsystematic because they attempt to achieve the desired solution by experimenting several
Theoretical Background 56
times or reaching its limits with increasing complexity, such as the morphological box (Livotov
and Petrov 2010).
By demanding the exact description of the problem and not concentrating on generating as
many solution variants as possible, TIPS clearly delimits the search field for new ideas or
solutions, and therefore combines all techniques into a complex problem-solving methodology
(Herb et al 2000). This allows a targeted search for solutions and the finding of high-quality
results that approach the ideal end result (Koltze and Souchkov 2011).
Lean innovation, defined as the waste-free and value-oriented implementation of product
innovation, shares many similarities with lean management. The larger the organisation, the
more the market-centred thinking seems to move away and being innovative becomes more
difficult. Through moving back to the base of the company, lean management resembles a
countermovement with core principles coming into play. Building on these core principles, the
lean innovation system of the WZL at RWTH Aachen University is based on four
phases/categories, containing 12 principles in total (Schuh, 2007):
Clear prioritisation: Strategic success positioning – Clear hierarchies – Road mapping
Unequivocal prioritisation is the incarnation of value orientation in innovation management. If
you do not strategically prioritise your innovation resources, you will at best come to market
success at random—regardless of how efficient your processes are (Schuh, 2007).
Early structuring: Product architecture design –Assortment optimisation –Solution space
control
Early structuring translates into effective frontloading through defining the guard rails for
value-based product design. It is crucial to exclude the cause of waste in the project, above all
in downstream stages of the value chain, even at an early stage (Schuh, 2007).
Simply synchronisation: Value stream optimisation – Data consistency – Timing
The interplay of the disciplines involved in an innovation project is like a symphony orchestra:
numerous experts and artists work together simultaneously, but only the perfect synchronisation
creates a work of art –it counts the ability to easily synchronise all involved in the project
(Schuh, 2007).
Safe adaptation: Innovation controlling – Release engineering – Continuous improvement
Lean innovation requires the versatility of innovation management: secure adaptation
describes the goal-oriented further development of products and processes with regard to
identified potential for improvement (Schuh, 2007).
Moreover, lean innovation can only be methodically implemented if the right framework
conditions for employee motivation and development are in place. The focus is on product
Theoretical Background 57
identification, defined as the measure of emotional attachment and enthusiasm for the product
in whose immediate environment one works (Schuh, Lenders and Schöning 2007).This goes
hand in hand with the principle of lean management, that all activities are geared to the
customer’s benefit and therefore the resulting knowledge is tailored to the customer’s
satisfaction and benefit (Bergman and Klefsjö, 2010).
Only if the customer of a product or service promises a benefit will he or she be willing to
pay for it. In simple terms, the higher the benefit, the higher the price that can be charged.
Criteria such as product quality, process service (e.g., smooth ordering and short delivery
times), and customer service (e.g., customer friendliness, good advice, warranty services, and
payment methods) are still key elements for which the customer is willing to pay. However,
customisation of the product is becoming increasingly important. Thus, taking this aspect into
consideration, customer benefit is the advantage that the customer gains through the
performance of the product. However, it is not the objective benefit that is relevant but rather
the benefit subjectively felt by the customer, and therefore it may vary from consumer to
consumer. The better the customer needs are met, the higher the customer benefit (Bergman
and Klefsjö, 2010).
Customer satisfaction or dissatisfaction arises when the customer compares his or her
expectations regarding the company with the perceived performance. If the expectations are
met or even exceeded, he or she is satisfied, but if the performance does not live up to its
claim, the customer is dissatisfied (Zairi, 2000). Lean is known to have several negative
effects as well. First, lean value analysis has a negative effect on a company’s competence to
profitably deal with radical innovations and disruptive innovations. Second, lean supply chain
management has an unfavourable effect on a company’s receptivity to radical innovations and
revolutionary innovations. Third, lean human resource management has a negative effect on
employee creativity (Bhasin, 2008). Thus, only being lean cannot be the solution and being
flexible and agile comes into play.
2.5.2. Agile: The Upcoming of Agility and the Link to Innovation in the Automotive
Industry
The concept of agility has existed in the system theory of organisations since the 1950s
(Jensen, 1980, Atkinson Reay and Moffat, 2005). The American sociologist Talcott Parsons
Theoretical Background 58
identified the following four functions that each system must meet to maintain its existence
(Sciulli and Gerstein, 1985):
- Adaptation: Core elements are the ability of a system to respond to external changes
- Goal attainment: To define and pursue goals
- Inclusion and integration: To establish and assure cohesion and inclusion
- Latency: To maintain basic structures and processes of value patterns (Jensen, 1980)
The initial letters of these four functions result in the well-known AGIL scheme (Jensen,
1980).
The upcoming of agility can be seen in three different areas:
Agile Software Development: Reinforced by methods such as ‘Scrum’ and ‘Kanban’, since
the beginning of the 21st century, agility has become apparent under the heading of agile
software development. With the formulation of the so-called ‘agile manifesto in software
development’ (Agile Manifesto, 2001), a kind of action orientation exists, according to which
principles the development of software should be designed so that it can be described as agile
and the benefits postulated actually come to fruition (Dybå and Dingsøyr, 2008).
Agile Manufacturing: Agile manufacturing, created in response to lean production, is a
production philosophy that focuses on meeting customer demand through flexible production
practices, by focusing on fast product development (simultaneous engineering), multi-
functional teams, and continuous optimisation of production processes (Sharifi et al., 2001;
Zhang, 2011).
Agile manufacturing alters from lean production in its focus on complying customer needs
without losing quality or creating additional costs. The suggestion is based on the approach of
the virtual enterprise and seeks to establish flexible, often short-term relationships with
suppliers when market opportunities arise (Gabler Wirtschaftslexikon, 2016).
To give the fulfilment of customer requirements and thus customer satisfaction more
importance than the pure production volume, a self-sufficient and intelligent workforce is
needed in agile manufacturing. This structure can then also be described as an agile
organisation (Kaufmann, 2015).
The Agile Organisation: The decades-old concept of agility is experiencing a renaissance
and practical benefit due to the challenges that current megatrends in the workplace bring
with them. By not focusing on agility in one part of the organisation, production, or (software)
Theoretical Background 59
development, but rather on issues such as the transformation of business units or even entire
companies, the organisation itself achieves the necessary flexibility to meet and react to
customer benefit and demands (Atkinson and James 2005).
Ultimately, it is about agile teams solving customer-related issues because market dynamics
require rapid reaction. A maximum of dynamic and target orientation makes it possible to
respond promptly to continually changing customer requirements, with the goal of creating a
potentially usable product for the customer. This product may not be fully developed yet, but
offers added value to the recipient (Power, Sohal and Rahman, 2001).Agility is primarily a
matter of mindset (value and principles), which unfolds the effectiveness of the mindset
change taking place. Concrete practices such as Scrum13 and Kanban14can only help you learn
this mindset and anchor (Ahmed et al. 2010; Sharma, Sarkar and Gupta 2012; Dickmann,
2015).
The cycles of vehicle manufacturing are growing ever shorter. Althought here are still model
development cycles of more than 36 months in Germany, manufacturers such as Toyota,
Peugeot, and Tesla drive the market ahead of them (Womack, Jones and Roos 1991, p. 125
ff., Clark and Fujimoto 1992, p. 95; Schulze, MacDuffie and Täube; 2015, p. 604).
A critical factor affecting the production system is the constantly changing economy, due to
digitisation and other megatrends and a resulting pressure on abilities such as flexibility and
adaptation. A flexible integration of new technologies is the only way to not offer outdated
innovations to customers, as the example of navigation systems shows. To avoid old
components or outdated navigation systems being put on the market in a new car after a three-
year development phase with a subsequent 18-month production integration phase, software
updates are made available for customers continually (Atkinson and Moffat, 2005).To make
this possible, the production itself must be opened back and forth by reducing the boundaries
between supplier and manufacturer as well as between manufacturer and customer(Güttner,
Sommer-Dittrich, 2008).Replacing software components and making the customer part of an
iterative circle by creating new functionalities on demand (even after a purchase) is the only
13Scrum is a method of agile development based on the incremental software development process aiming to increase
productivity In the method the entire development cycle is divided into a series of iteration where each iteration (=sprint)
has a maximum of 30 days. (Sharma, Sarkar and Gupta 2012) 14Kanban is a work management method that originated from the Toyota Production System (TPS). but also in the software
development to Appearance comes. In the late 1940s, Toyota introduced just-in-time production. The approach is based on
a pull system. Production is geared to customer demand and is not fixed to specific quantities as is the case with push
systems, which then come onto the market. In software development, the method serves to limit the number of parallel tasks,
thus achieving shorter throughput times and making problems - especially bottlenecks - quickly visible.( Dickmann, 2015)
Theoretical Background 60
way to stay successful in the market and meet the current challenges. Agility gives companies
the flexibility and dynamism they need to cope with the increased complexity.
Agile optimisation, for example, accompanies the entire process such that bottlenecks can be
identified early on and operations prioritised and rescheduled. When changes occur, the
algorithms used in agile optimisation help to quickly take them into account and, above all, to
understand their impact on the whole (Savelsberg, Dorndorf and Weiler, 2018).
The different aspects of agility show that both the digitisation of the value chain as well as
fostering of agile thinking by internalising and acting on the agile value system are core
competencies a company needs to build to stay competitive and produce more effectively,
sustainably, and faster. Therefore, what does it mean when these two concepts, lean and agile,
collide in an industry and the companies reacting, pricing, and selling products in the market?
Are there similarities and differences that can support the compatibility?
2.5.3. Lean vs. Agile: Similarities and Differences
In comparison and similar to the upcoming of lean, similarities and differences can be
observed upon a detailed examination of the definition of both concepts and their core
principles.
Definition of Agility: Definition of Lean:
‘Corporate agility, the capacity to react
quickly to rapidly changing
circumstances, requires a focus on clear
system output goals and the capability to
match human resources to the demands
on changing circumstances’ (Brown and
Agnew, 1982, S. 29).
‘… an effective integration of response
ability and knowledge management in
order to rapidly, efficiently and
accurately adapt to any unexpected (or
unpredictable) change in both proactive
‘Lean production (...) is lean because it
uses less of everything than mass
production - half of the factory staff, half
of the production floor, half of the
investment in tools, half of the time to
develop a new product. It also requires
far less than half of the necessary
inventory, leads to much fewer errors,
and produces a larger and ever-growing
variety of products’ (Womack et al.,
1992, p. 19).
Theoretical Background 61
and reactive business/ customer needs
and opportunities without compromising
with the cost or the quality of the
product/ process’ (Ganguly et al., 2009,
S. 411).
Elements found in both approaches (similarities) are the importance of tight (and lean)
vendor and customer relationships as well as the abolition of hierarchies in organisations,
which involve shifting decision-making to the lower levels of the hierarchy. Highly
motivated, well trained, and informed employees are also an integral part of both concepts
(Förster and Wendler, 2011). The core principles of lean are also significant features of
agility (Schmitz, 1995):
- Just-in-time production
- Error control system / Total Quality management (TQM)
- Reasonable technical equipment, robust uncomplicated automation technology
instead of complex technical equipment, control and monitoring of the
mechanical manufacturing process, short set-up times
- Work organisation in flat hierarchies (semi-autonomous group work, flexible
workforce division, and job rotation)
- Qualification / motivation of employees (multifunctional employees)
- Continuous improvement process (Kaizen)
- Value creation and process orientation
The selection is more prevalent in agility; for example, not all elements of lean production are
reflected in the concept of agility (differences). The idea of well-being and employee
satisfaction is, for example, not as important in lean production as it is in agility. Furthermore,
the agile concept, like the lean organisation, is focused on reducing resources, time, and costs,
albeit not with the same focus on the cost aspect that has become a barrier to technological
development within lean production (Conboy, 2009, S. 338).
It can be seen that agility is based to a large extent on the concepts of flexibility and leanness,
although, especially with regard to leanness, the selection of aspects to be adopted has been
made. In addition, the concept of agility contains a multitude of other approaches that are
more or less widespread in business practice (Förster and Wendler, 2011).
It is not only the different types of complexity that play a role in the emergence of
innovations; the interaction of the different networks within the company are also important.
Theoretical Background 62
Within a production system, different networks can be found, such as the production network,
value-added partnerships, supply chains, strategic corporate networks, and innovation
networks (see Section2.3).
As described earlier, innovation networks are defined as the complex network of a large
number of cooperation partners who agree on and practice conscious, sustainable,
collaborative, and interactive cooperation in innovation (Hausschildt, 1997).Innovations in the
highest quality and most complex technologies are increasingly being provided by self-
organising networks. With this networks being interconnected organisations—companies,
universities, government agencies—that establish, promote, and unite specific knowledge and
skills to invent complex technologies, the concepts of being lean and being agile play an even
more important role. In other words, innovation networks are organised around permanent
learning and the knowledge creation process is a main part of both concepts. In business and
society in general, networks are becoming an increasingly relevant factor for success or
competition, and therefore, the right balance of ambidextrous strategies needs to be found to
not disturb or hinder learning in the network. This can be the answer to master structural
change towards an information society, which is accompanied by the global economy and that
places particular demands on companies in competition. Due to the complex constellation of
network partners, innovation processes will never be completely controllable, but this does
not mean that they occur accidentally or are determined exogenously (Duschek, 2002).
Moreover, innovations are considered the growth engine of economic development and
promote constant renewal, regardless of whether they are generated by lean or agile methods.
How innovations are used as a necessary tool to increase and maintain competitiveness in the
automotive industry is discussed in the following chapters.
Compatibility of Lean and Innovation in an Industry at a Macro-Level Perspective 63
3. Compatibility of Lean and Innovation in an Industry at a Macro-Level Perspective—
Ambidexterity and Innovation Patterns in the Automotive Industry
With the macro level describing the change, the meso level finding the cause for the change,
and the micro level explaining the change, the analysis of the compatibility of lean and
innovation in the automotive industry starts with the macro level perspective. It is of course
an essential element that all levels (macro, meso, and micro) feed back to the levels below and
are a major cause of the complexity observed (see subsection 2.4.6).
In this chapter, the macro perspective provides descriptions to the following questions:
- How does industry evolve to cope with the volatility, complexity, and resulting
uncertainty? (Demonstrated using the example of the automotive industry)
- Which existing concepts and models must be used and how must innovative ideas be
implemented / generated to survive on the market?
The main goal is to discuss the connections between lean and agile (leagility) as well as
ambidexterity to widen the theoretical fundament. It is necessary to know how it can be
combined in one framework (3.1) and is empirically validated through a comparison of
explorative and exploitative patent structure of OEMs(3.1.1),resulting in the description of the
impact of this framework on a lean production system and vice versa (3.3.2). Based on these
insights in the theoretical fundament and its empirical validation, the compatibility of lean and
innovation from a macro level perspective are reviewed as well as concrete recommendations
for action for industry and economy derived (3.2).
3.1.Leagility and ambidexterity—Two standalone concepts?
Leagility: Naylor, Naim, and Berry (1999) defined the concept of leagility for the first time.
Whereas agility in manufacturing processes is the ability to respond to uncertain market
situations, complexity, and change by exploring profitable opportunities, lean in manufacturing
processes is the ability to handle competitive pressure with less resources by developing a value
stream (Dubey and Gunsekaran 2014). Because it is not possible to employ both concepts
successfully at the same point within the supply chain, current research suggests a decoupling
point which divides leanness for upstream processes and agility for downstream processes (Cox
and Chicksan 2005, Purvis, Gosling and Naim 2014).
Compatibility of Lean and Innovation in an Industry at a Macro-Level Perspective 64
In the last 17 years much research has been conducted in different industries with various foci
on the leagility topic. Crocitto and Youssef (2004) concentrated on the human aspects of
leagility including reward systems and organisational culture. Bruce et al. (2004) tried to
classify companies in fibre production, the fashion goods industry, and premium
manufacturers/retailers as agile, lean, or leagile. Within the automotive industry, the main
interest in former research lies on the supply chain and how to design it with a higher degree of
robustness (Tuner 2005). Naim and Gossling (2011) stated in a final summary that it is not
possible to be leagile in every industry, but market as well as product characteristics can help
to determine applicability. If significant organisational changes are undertaken by the company,
then it is possible to achieve enhanced performance improvements resulting in increased market
share and financial performance (Naim and Gossling 2011).
Ambidexterity: In comparison, but also somehow in connection to the concept of leagility with
a decoupling point and a separation of being lean and agile, stands the concept of ambidexterity,
which was explained in subsection 2.3.2.
3.2.Combining leagility and ambidexterity in one framework
In contrast to former research focusing on the concept of leagility mainly in the supply chain,
this study attempts to combine leagility with the concept of ambidexterity to obtain a holistic
view of different companies in the automotive industry.
The aim is to combine the above mentioned concepts—leagility and ambidexterity—in one
framework (Figure 10). Agility is based on exploration strategies, including flexible reactions
on market demands in yielding radical innovations. Lean is based on exploitative strategies,
including efficient value streams in yielding incremental innovations. Lean thinking includes
behaviour strategies such as continuous improvement, standardisation, routinisation, and
formalisation (Jansen, Van der Bosch, & Volberda, 2006) and is therefore linked to exploitative
innovation, which entails firm behaviour characterised by refinement, implementation,
efficiency, production, and selection (March 1991). Companies must be careful not to fall into
the efficiency trap. Agility encompassed behaviour strategies such as the capability to adapt or
respond in an accelerated manner to a changing marketplace environment and undertake risk
and change management, and is therefore related to explorative innovations, which imply firm
behaviour characterised by search, discovery, experimentation, risk taking, and innovation
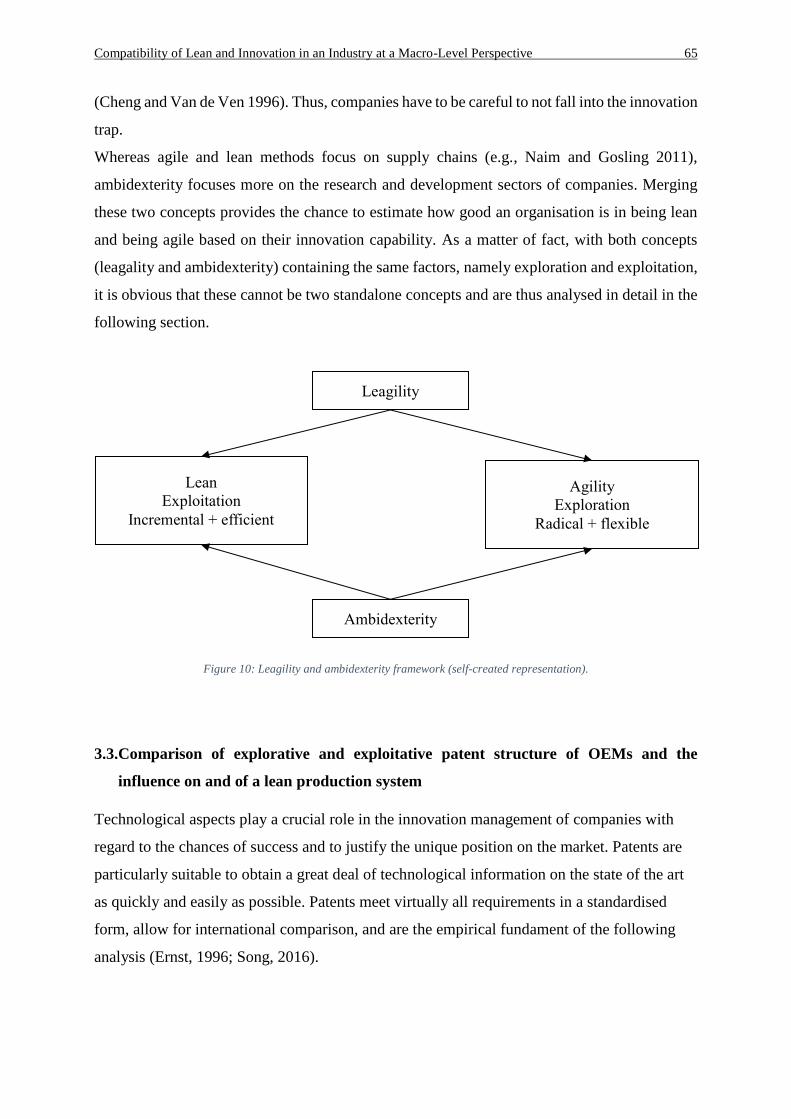
Compatibility of Lean and Innovation in an Industry at a Macro-Level Perspective 65
(Cheng and Van de Ven 1996). Thus, companies have to be careful to not fall into the innovation
trap.
Whereas agile and lean methods focus on supply chains (e.g., Naim and Gosling 2011),
ambidexterity focuses more on the research and development sectors of companies. Merging
these two concepts provides the chance to estimate how good an organisation is in being lean
and being agile based on their innovation capability. As a matter of fact, with both concepts
(leagality and ambidexterity) containing the same factors, namely exploration and exploitation,
it is obvious that these cannot be two standalone concepts and are thus analysed in detail in the
following section.
Figure 10: Leagility and ambidexterity framework (self-created representation).
3.3.Comparison of explorative and exploitative patent structure of OEMs and the
influence on and of a lean production system
Technological aspects play a crucial role in the innovation management of companies with
regard to the chances of success and to justify the unique position on the market. Patents are
particularly suitable to obtain a great deal of technological information on the state of the art
as quickly and easily as possible. Patents meet virtually all requirements in a standardised
form, allow for international comparison, and are the empirical fundament of the following
analysis (Ernst, 1996; Song, 2016).
Leagility
Ambidexterity
Agility
Exploration
Radical + flexible
Lean
Exploitation
Incremental + efficient
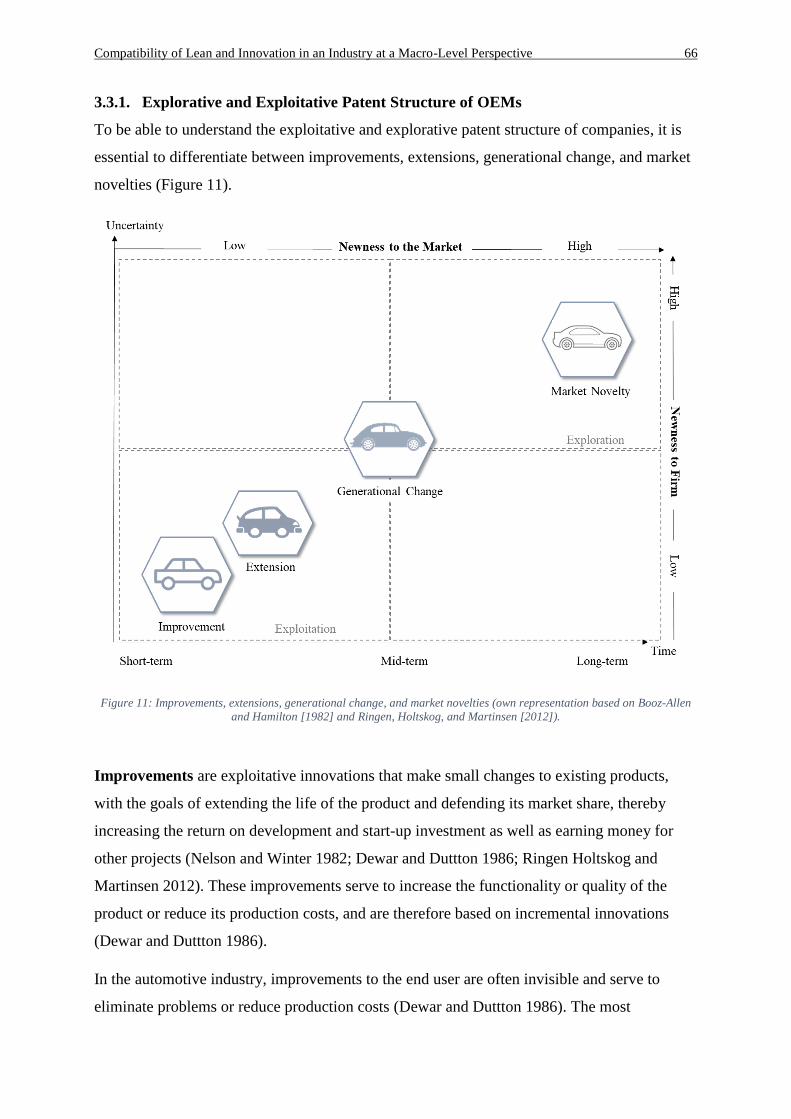
Compatibility of Lean and Innovation in an Industry at a Macro-Level Perspective 66
3.3.1. Explorative and Exploitative Patent Structure of OEMs
To be able to understand the exploitative and explorative patent structure of companies, it is
essential to differentiate between improvements, extensions, generational change, and market
novelties (Figure 11).
Figure 11: Improvements, extensions, generational change, and market novelties (own representation based on Booz-Allen
and Hamilton [1982] and Ringen, Holtskog, and Martinsen [2012]).
Improvements are exploitative innovations that make small changes to existing products,
with the goals of extending the life of the product and defending its market share, thereby
increasing the return on development and start-up investment as well as earning money for
other projects (Nelson and Winter 1982; Dewar and Duttton 1986; Ringen Holtskog and
Martinsen 2012). These improvements serve to increase the functionality or quality of the
product or reduce its production costs, and are therefore based on incremental innovations
(Dewar and Duttton 1986).
In the automotive industry, improvements to the end user are often invisible and serve to
eliminate problems or reduce production costs (Dewar and Duttton 1986). The most
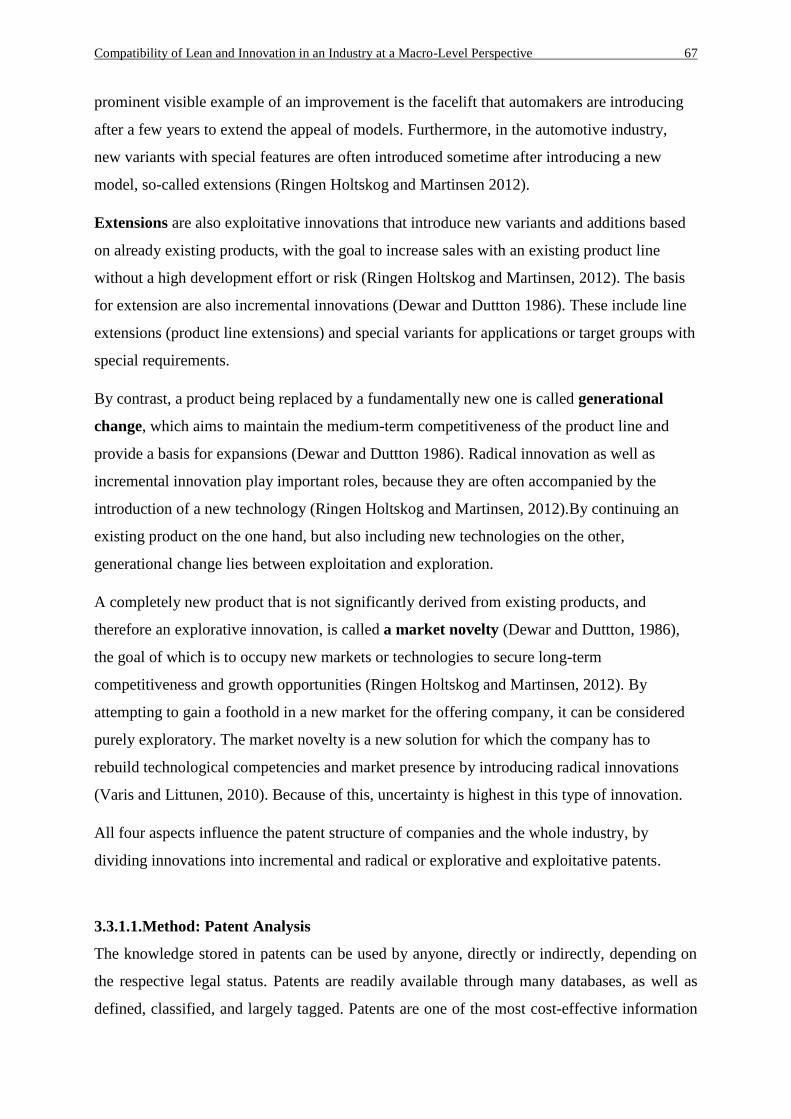
Compatibility of Lean and Innovation in an Industry at a Macro-Level Perspective 67
prominent visible example of an improvement is the facelift that automakers are introducing
after a few years to extend the appeal of models. Furthermore, in the automotive industry,
new variants with special features are often introduced sometime after introducing a new
model, so-called extensions (Ringen Holtskog and Martinsen 2012).
Extensions are also exploitative innovations that introduce new variants and additions based
on already existing products, with the goal to increase sales with an existing product line
without a high development effort or risk (Ringen Holtskog and Martinsen, 2012). The basis
for extension are also incremental innovations (Dewar and Duttton 1986). These include line
extensions (product line extensions) and special variants for applications or target groups with
special requirements.
By contrast, a product being replaced by a fundamentally new one is called generational
change, which aims to maintain the medium-term competitiveness of the product line and
provide a basis for expansions (Dewar and Duttton 1986). Radical innovation as well as
incremental innovation play important roles, because they are often accompanied by the
introduction of a new technology (Ringen Holtskog and Martinsen, 2012).By continuing an
existing product on the one hand, but also including new technologies on the other,
generational change lies between exploitation and exploration.
A completely new product that is not significantly derived from existing products, and
therefore an explorative innovation, is called a market novelty (Dewar and Duttton, 1986),
the goal of which is to occupy new markets or technologies to secure long-term
competitiveness and growth opportunities (Ringen Holtskog and Martinsen, 2012). By
attempting to gain a foothold in a new market for the offering company, it can be considered
purely exploratory. The market novelty is a new solution for which the company has to
rebuild technological competencies and market presence by introducing radical innovations
(Varis and Littunen, 2010). Because of this, uncertainty is highest in this type of innovation.
All four aspects influence the patent structure of companies and the whole industry, by
dividing innovations into incremental and radical or explorative and exploitative patents.
3.3.1.1.Method: Patent Analysis
The knowledge stored in patents can be used by anyone, directly or indirectly, depending on
the respective legal status. Patents are readily available through many databases, as well as
defined, classified, and largely tagged. Patents are one of the most cost-effective information
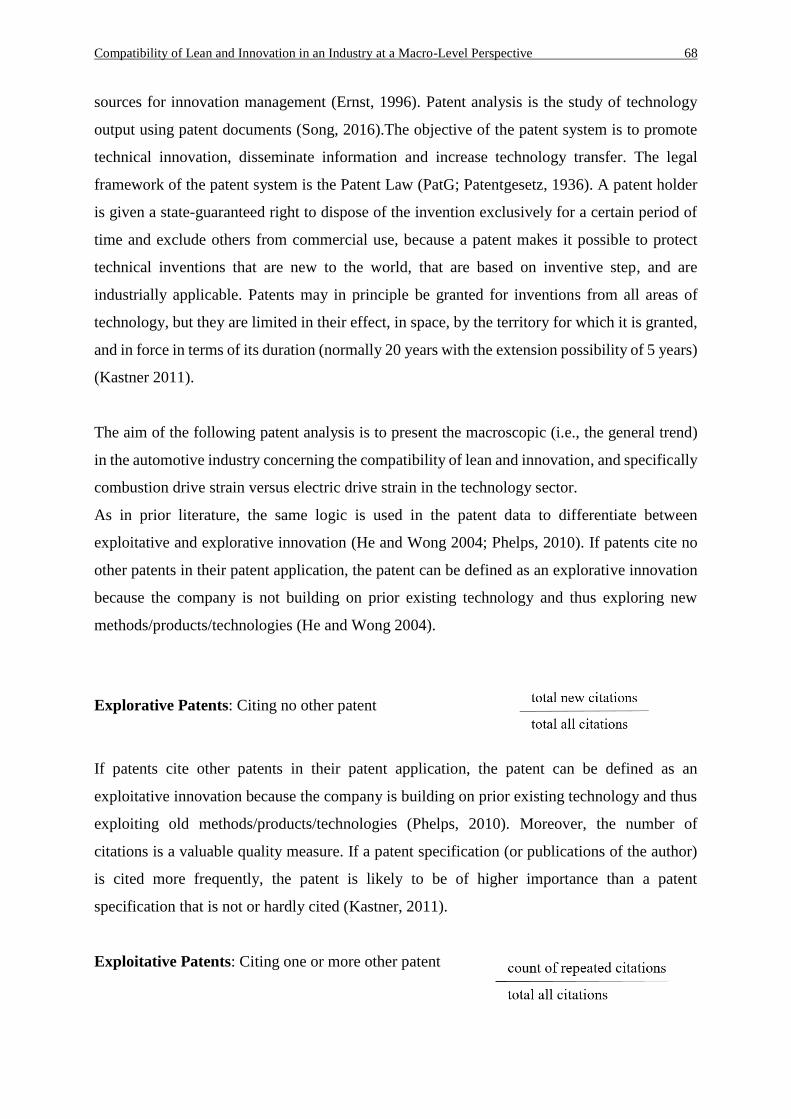
Compatibility of Lean and Innovation in an Industry at a Macro-Level Perspective 68
sources for innovation management (Ernst, 1996). Patent analysis is the study of technology
output using patent documents (Song, 2016).The objective of the patent system is to promote
technical innovation, disseminate information and increase technology transfer. The legal
framework of the patent system is the Patent Law (PatG; Patentgesetz, 1936). A patent holder
is given a state-guaranteed right to dispose of the invention exclusively for a certain period of
time and exclude others from commercial use, because a patent makes it possible to protect
technical inventions that are new to the world, that are based on inventive step, and are
industrially applicable. Patents may in principle be granted for inventions from all areas of
technology, but they are limited in their effect, in space, by the territory for which it is granted,
and in force in terms of its duration (normally 20 years with the extension possibility of 5 years)
(Kastner 2011).
The aim of the following patent analysis is to present the macroscopic (i.e., the general trend)
in the automotive industry concerning the compatibility of lean and innovation, and specifically
combustion drive strain versus electric drive strain in the technology sector.
As in prior literature, the same logic is used in the patent data to differentiate between
exploitative and explorative innovation (He and Wong 2004; Phelps, 2010). If patents cite no
other patents in their patent application, the patent can be defined as an explorative innovation
because the company is not building on prior existing technology and thus exploring new
methods/products/technologies (He and Wong 2004).
Explorative Patents: Citing no other patent
If patents cite other patents in their patent application, the patent can be defined as an
exploitative innovation because the company is building on prior existing technology and thus
exploiting old methods/products/technologies (Phelps, 2010). Moreover, the number of
citations is a valuable quality measure. If a patent specification (or publications of the author)
is cited more frequently, the patent is likely to be of higher importance than a patent
specification that is not or hardly cited (Kastner, 2011).
Exploitative Patents: Citing one or more other patent
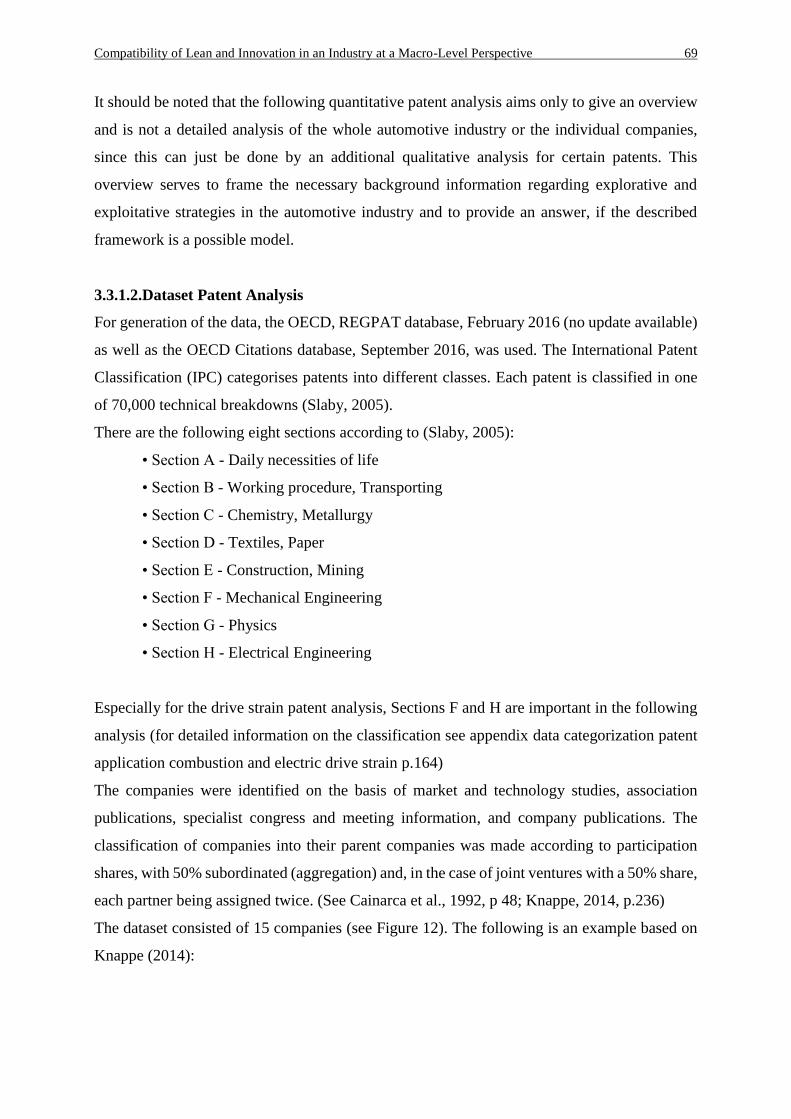
Compatibility of Lean and Innovation in an Industry at a Macro-Level Perspective 69
It should be noted that the following quantitative patent analysis aims only to give an overview
and is not a detailed analysis of the whole automotive industry or the individual companies,
since this can just be done by an additional qualitative analysis for certain patents. This
overview serves to frame the necessary background information regarding explorative and
exploitative strategies in the automotive industry and to provide an answer, if the described
framework is a possible model.
3.3.1.2.Dataset Patent Analysis
For generation of the data, the OECD, REGPAT database, February 2016 (no update available)
as well as the OECD Citations database, September 2016, was used. The International Patent
Classification (IPC) categorises patents into different classes. Each patent is classified in one
of 70,000 technical breakdowns (Slaby, 2005).
There are the following eight sections according to (Slaby, 2005):
• Section A - Daily necessities of life
• Section B - Working procedure, Transporting
• Section C - Chemistry, Metallurgy
• Section D - Textiles, Paper
• Section E - Construction, Mining
• Section F - Mechanical Engineering
• Section G - Physics
• Section H - Electrical Engineering
Especially for the drive strain patent analysis, Sections F and H are important in the following
analysis (for detailed information on the classification see appendix data categorization patent
application combustion and electric drive strain p.164)
The companies were identified on the basis of market and technology studies, association
publications, specialist congress and meeting information, and company publications. The
classification of companies into their parent companies was made according to participation
shares, with 50% subordinated (aggregation) and, in the case of joint ventures with a 50% share,
each partner being assigned twice. (See Cainarca et al., 1992, p 48; Knappe, 2014, p.236)
The dataset consisted of 15 companies (see Figure 12). The following is an example based on
Knappe (2014):
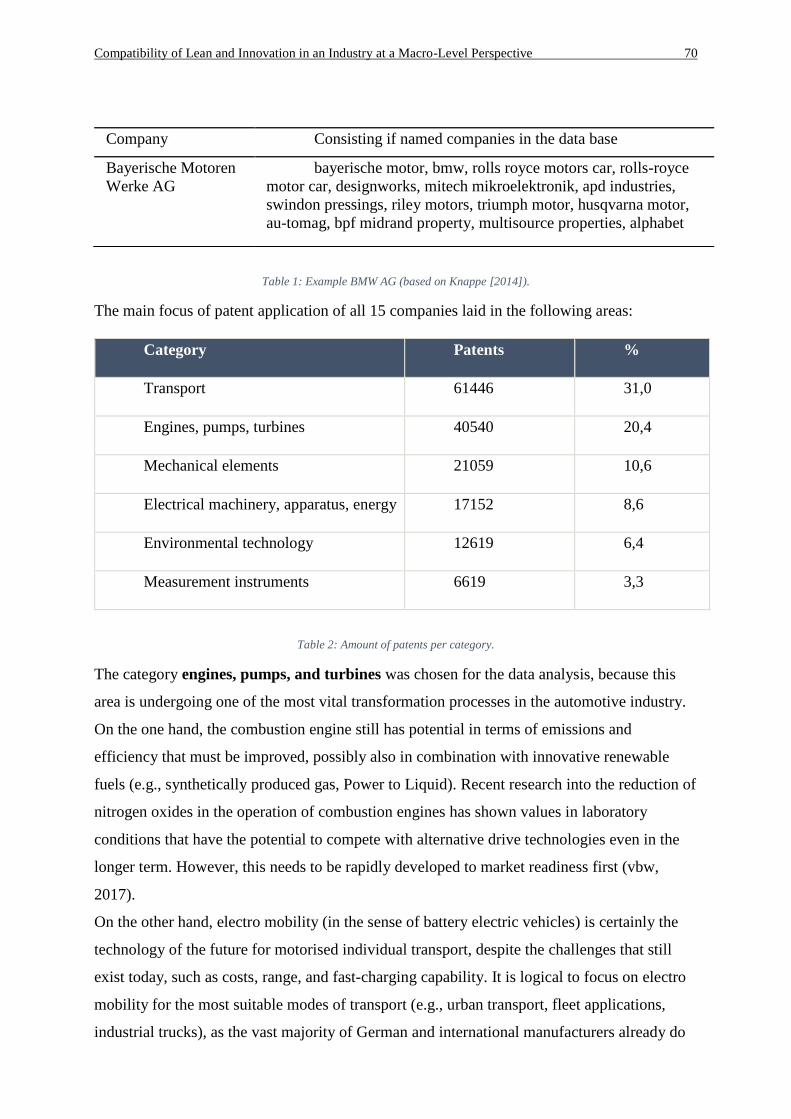
Compatibility of Lean and Innovation in an Industry at a Macro-Level Perspective 70
Table 1: Example BMW AG (based on Knappe [2014]).
The main focus of patent application of all 15 companies laid in the following areas:
Category Patents %
Transport 61446 31,0
Engines, pumps, turbines 40540 20,4
Mechanical elements 21059 10,6
Electrical machinery, apparatus, energy 17152 8,6
Environmental technology 12619 6,4
Measurement instruments 6619 3,3
Table 2: Amount of patents per category.
The category engines, pumps, and turbines was chosen for the data analysis, because this
area is undergoing one of the most vital transformation processes in the automotive industry.
On the one hand, the combustion engine still has potential in terms of emissions and
efficiency that must be improved, possibly also in combination with innovative renewable
fuels (e.g., synthetically produced gas, Power to Liquid). Recent research into the reduction of
nitrogen oxides in the operation of combustion engines has shown values in laboratory
conditions that have the potential to compete with alternative drive technologies even in the
longer term. However, this needs to be rapidly developed to market readiness first (vbw,
2017).
On the other hand, electro mobility (in the sense of battery electric vehicles) is certainly the
technology of the future for motorised individual transport, despite the challenges that still
exist today, such as costs, range, and fast-charging capability. It is logical to focus on electro
mobility for the most suitable modes of transport (e.g., urban transport, fleet applications,
industrial trucks), as the vast majority of German and international manufacturers already do
Company Consisting if named companies in the data base
Bayerische Motoren
Werke AG
bayerische motor, bmw, rolls royce motors car, rolls-royce
motor car, designworks, mitech mikroelektronik, apd industries,
swindon pressings, riley motors, triumph motor, husqvarna motor,
au-tomag, bpf midrand property, multisource properties, alphabet
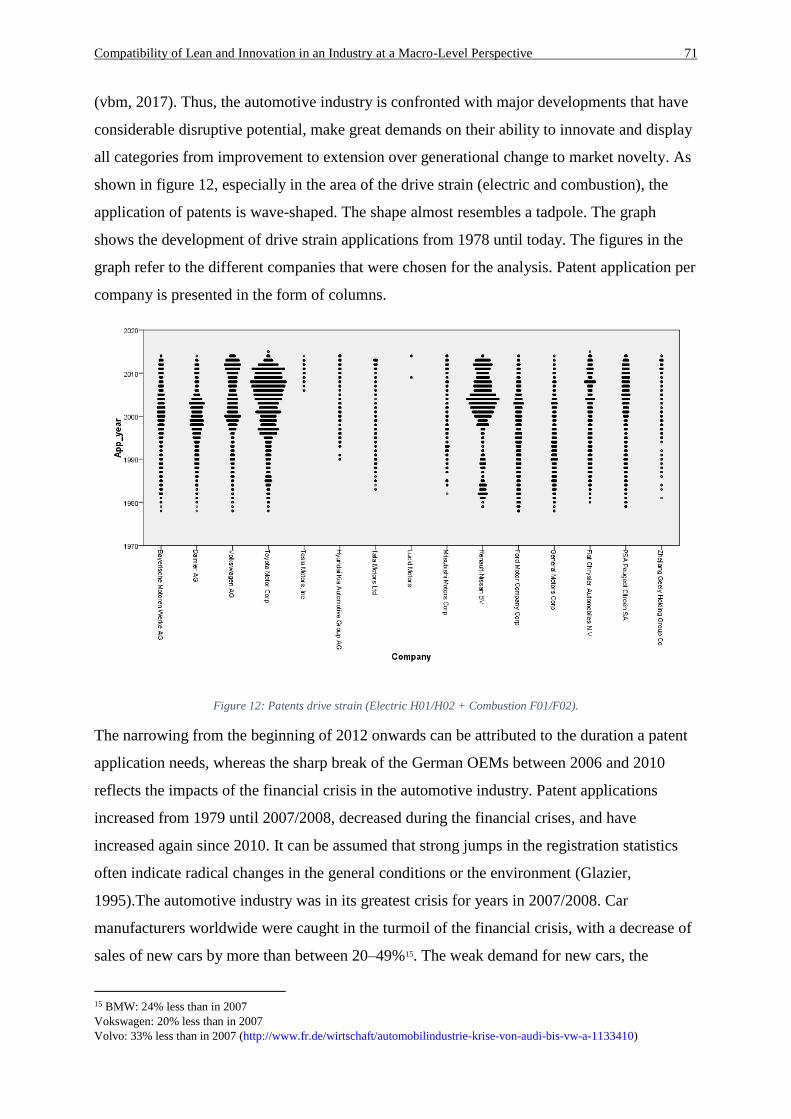
Compatibility of Lean and Innovation in an Industry at a Macro-Level Perspective 71
(vbm, 2017). Thus, the automotive industry is confronted with major developments that have
considerable disruptive potential, make great demands on their ability to innovate and display
all categories from improvement to extension over generational change to market novelty. As
shown in figure 12, especially in the area of the drive strain (electric and combustion), the
application of patents is wave-shaped. The shape almost resembles a tadpole. The graph
shows the development of drive strain applications from 1978 until today. The figures in the
graph refer to the different companies that were chosen for the analysis. Patent application per
company is presented in the form of columns.
Figure 12: Patents drive strain (Electric H01/H02 + Combustion F01/F02).
The narrowing from the beginning of 2012 onwards can be attributed to the duration a patent
application needs, whereas the sharp break of the German OEMs between 2006 and 2010
reflects the impacts of the financial crisis in the automotive industry. Patent applications
increased from 1979 until 2007/2008, decreased during the financial crises, and have
increased again since 2010. It can be assumed that strong jumps in the registration statistics
often indicate radical changes in the general conditions or the environment (Glazier,
1995).The automotive industry was in its greatest crisis for years in 2007/2008. Car
manufacturers worldwide were caught in the turmoil of the financial crisis, with a decrease of
sales of new cars by more than between 20–49%15. The weak demand for new cars, the
15 BMW: 24% less than in 2007
Vokswagen: 20% less than in 2007
Volvo: 33% less than in 2007 (http://www.fr.de/wirtschaft/automobilindustrie-krise-von-audi-bis-vw-a-1133410)
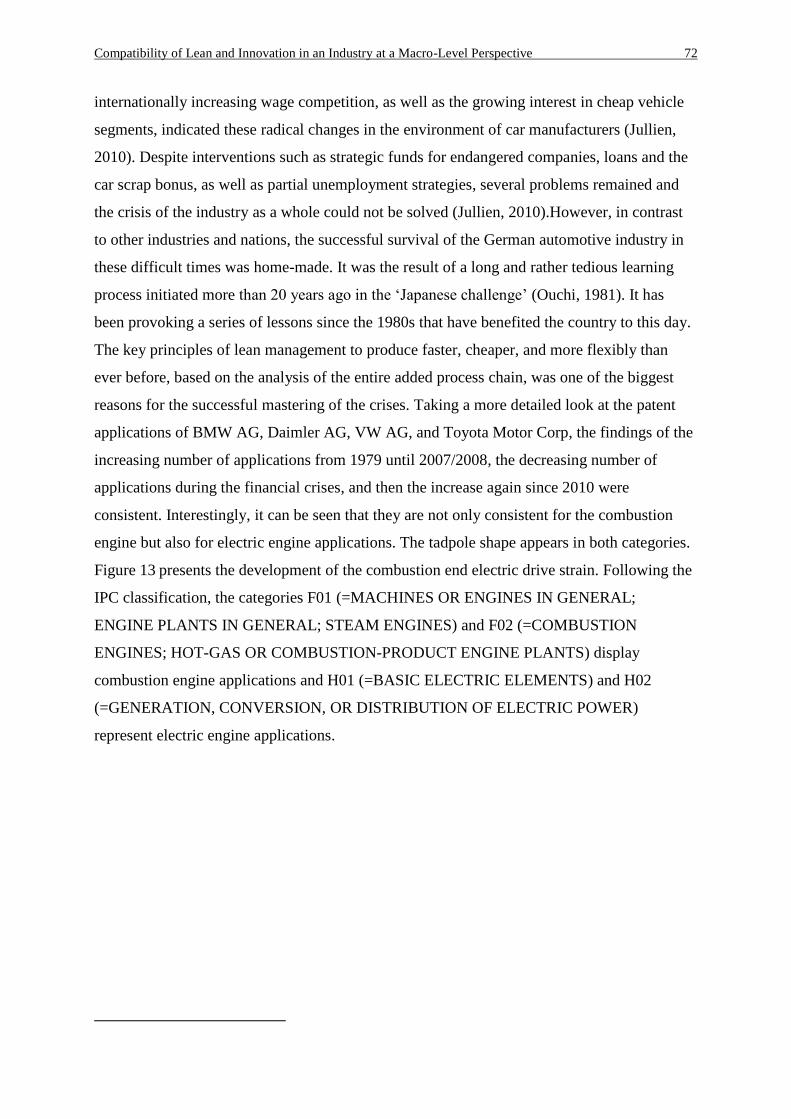
Compatibility of Lean and Innovation in an Industry at a Macro-Level Perspective 72
internationally increasing wage competition, as well as the growing interest in cheap vehicle
segments, indicated these radical changes in the environment of car manufacturers (Jullien,
2010). Despite interventions such as strategic funds for endangered companies, loans and the
car scrap bonus, as well as partial unemployment strategies, several problems remained and
the crisis of the industry as a whole could not be solved (Jullien, 2010).However, in contrast
to other industries and nations, the successful survival of the German automotive industry in
these difficult times was home-made. It was the result of a long and rather tedious learning
process initiated more than 20 years ago in the ‘Japanese challenge’ (Ouchi, 1981). It has
been provoking a series of lessons since the 1980s that have benefited the country to this day.
The key principles of lean management to produce faster, cheaper, and more flexibly than
ever before, based on the analysis of the entire added process chain, was one of the biggest
reasons for the successful mastering of the crises. Taking a more detailed look at the patent
applications of BMW AG, Daimler AG, VW AG, and Toyota Motor Corp, the findings of the
increasing number of applications from 1979 until 2007/2008, the decreasing number of
applications during the financial crises, and then the increase again since 2010 were
consistent. Interestingly, it can be seen that they are not only consistent for the combustion
engine but also for electric engine applications. The tadpole shape appears in both categories.
Figure 13 presents the development of the combustion end electric drive strain. Following the
IPC classification, the categories F01 (=MACHINES OR ENGINES IN GENERAL;
ENGINE PLANTS IN GENERAL; STEAM ENGINES) and F02 (=COMBUSTION
ENGINES; HOT-GAS OR COMBUSTION-PRODUCT ENGINE PLANTS) display
combustion engine applications and H01 (=BASIC ELECTRIC ELEMENTS) and H02
(=GENERATION, CONVERSION, OR DISTRIBUTION OF ELECTRIC POWER)
represent electric engine applications.
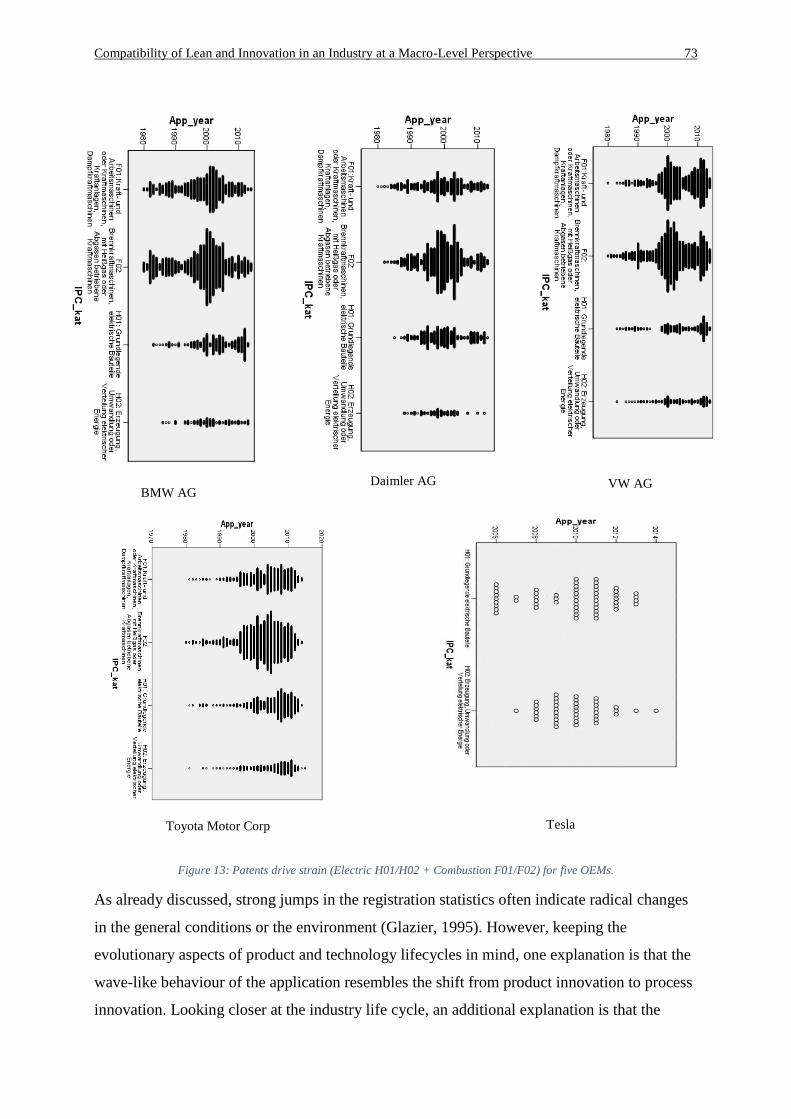
Compatibility of Lean and Innovation in an Industry at a Macro-Level Perspective 73
BMW AG
Daimler AG
VW AG
Toyota Motor Corp
Tesla
Figure 13: Patents drive strain (Electric H01/H02 + Combustion F01/F02) for five OEMs.
As already discussed, strong jumps in the registration statistics often indicate radical changes
in the general conditions or the environment (Glazier, 1995). However, keeping the
evolutionary aspects of product and technology lifecycles in mind, one explanation is that the
wave-like behaviour of the application resembles the shift from product innovation to process
innovation. Looking closer at the industry life cycle, an additional explanation is that the
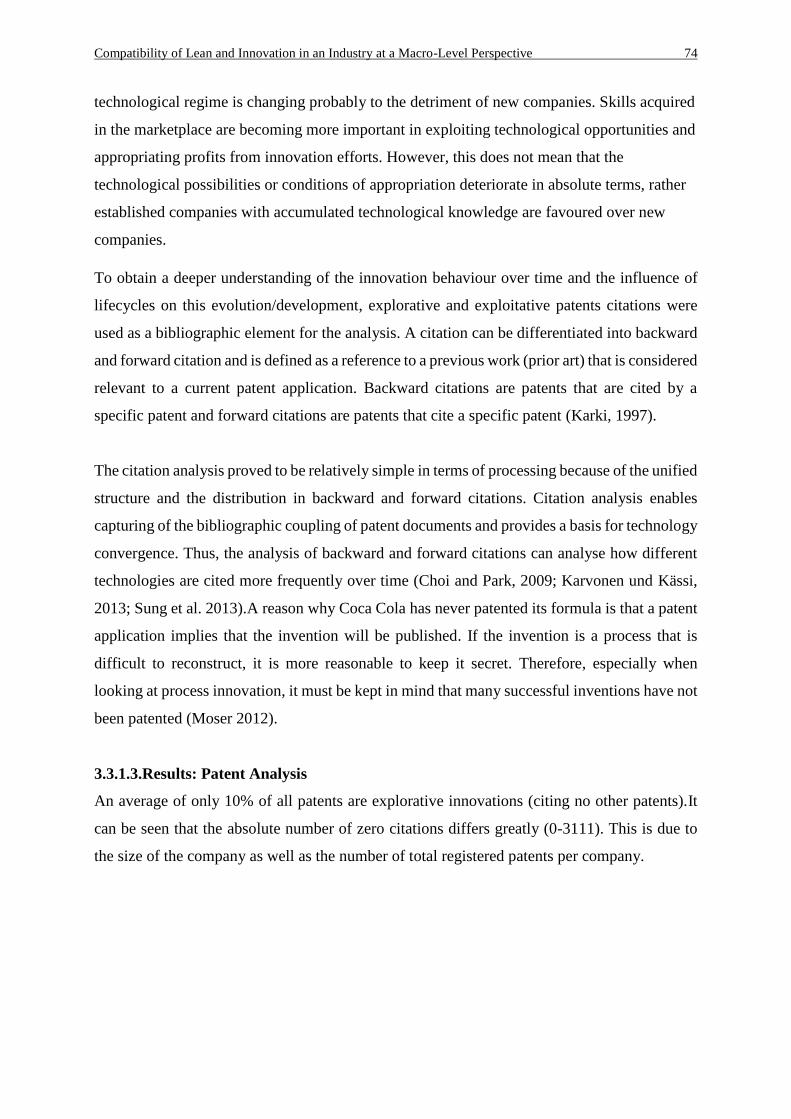
Compatibility of Lean and Innovation in an Industry at a Macro-Level Perspective 74
technological regime is changing probably to the detriment of new companies. Skills acquired
in the marketplace are becoming more important in exploiting technological opportunities and
appropriating profits from innovation efforts. However, this does not mean that the
technological possibilities or conditions of appropriation deteriorate in absolute terms, rather
established companies with accumulated technological knowledge are favoured over new
companies.
To obtain a deeper understanding of the innovation behaviour over time and the influence of
lifecycles on this evolution/development, explorative and exploitative patents citations were
used as a bibliographic element for the analysis. A citation can be differentiated into backward
and forward citation and is defined as a reference to a previous work (prior art) that is considered
relevant to a current patent application. Backward citations are patents that are cited by a
specific patent and forward citations are patents that cite a specific patent (Karki, 1997).
The citation analysis proved to be relatively simple in terms of processing because of the unified
structure and the distribution in backward and forward citations. Citation analysis enables
capturing of the bibliographic coupling of patent documents and provides a basis for technology
convergence. Thus, the analysis of backward and forward citations can analyse how different
technologies are cited more frequently over time (Choi and Park, 2009; Karvonen und Kässi,
2013; Sung et al. 2013).A reason why Coca Cola has never patented its formula is that a patent
application implies that the invention will be published. If the invention is a process that is
difficult to reconstruct, it is more reasonable to keep it secret. Therefore, especially when
looking at process innovation, it must be kept in mind that many successful inventions have not
been patented (Moser 2012).
3.3.1.3.Results: Patent Analysis
An average of only 10% of all patents are explorative innovations (citing no other patents).It
can be seen that the absolute number of zero citations differs greatly (0-3111). This is due to
the size of the company as well as the number of total registered patents per company.
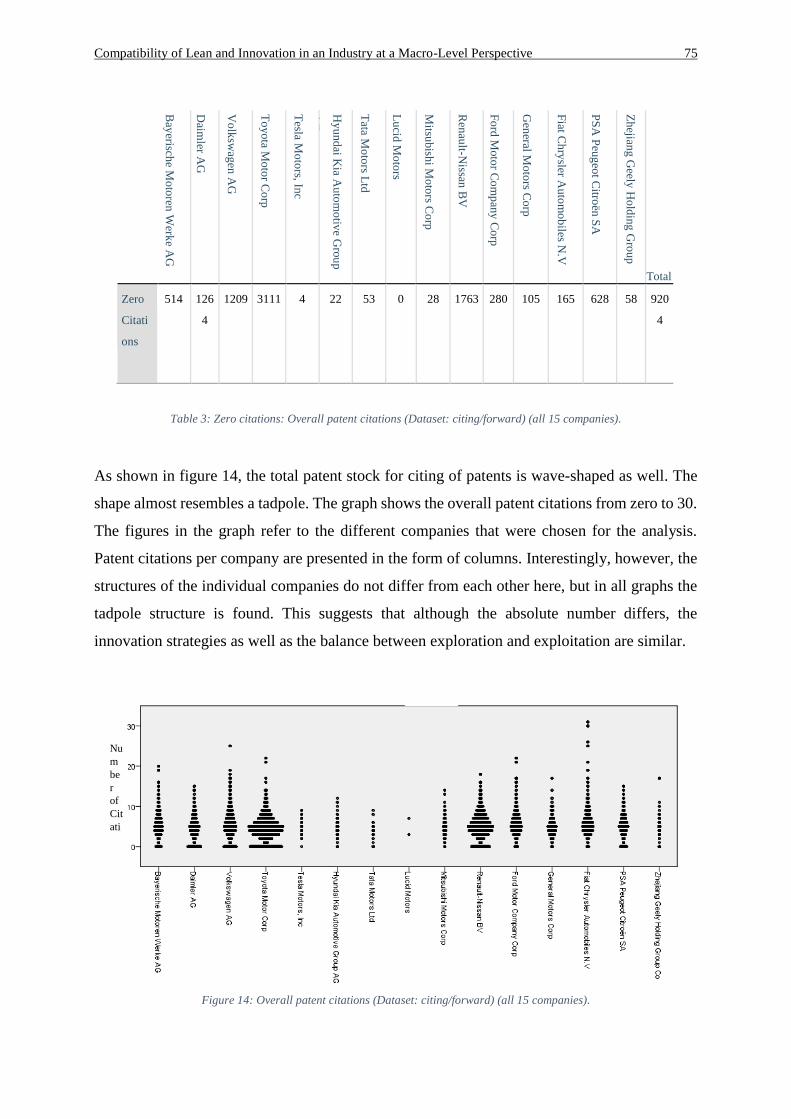
Compatibility of Lean and Innovation in an Industry at a Macro-Level Perspective 75
Table 3: Zero citations: Overall patent citations (Dataset: citing/forward) (all 15 companies).
As shown in figure 14, the total patent stock for citing of patents is wave-shaped as well. The
shape almost resembles a tadpole. The graph shows the overall patent citations from zero to 30.
The figures in the graph refer to the different companies that were chosen for the analysis.
Patent citations per company are presented in the form of columns. Interestingly, however, the
structures of the individual companies do not differ from each other here, but in all graphs the
tadpole structure is found. This suggests that although the absolute number differs, the
innovation strategies as well as the balance between exploration and exploitation are similar.
Figure 14: Overall patent citations (Dataset: citing/forward) (all 15 companies).
Bay
erische M
oto
ren W
erke A
G
Daim
ler AG
Vo
lksw
agen
AG
To
yo
ta Mo
tor C
orp
Tesla M
oto
rs, Inc
Hy
und
ai Kia A
uto
mo
tive G
rou
p
AG
Tata M
oto
rs Ltd
Lu
cid M
oto
rs
Mitsu
bish
i Mo
tors C
orp
Ren
ault-N
issan B
V
Fo
rd M
oto
r Co
mp
any
Co
rp
Gen
eral Mo
tors C
orp
Fiat C
hry
sler Au
tom
ob
iles N.V
PS
A P
eug
eot C
itroën
SA
Zh
ejiang G
eely H
old
ing
Gro
up
Co
Total
Zero
Citati
ons
514 126
4
1209 3111 4 22 53 0 28 1763 280 105 165 628 58 920
4
Nu
m
be
r
of
Cit
ati
on
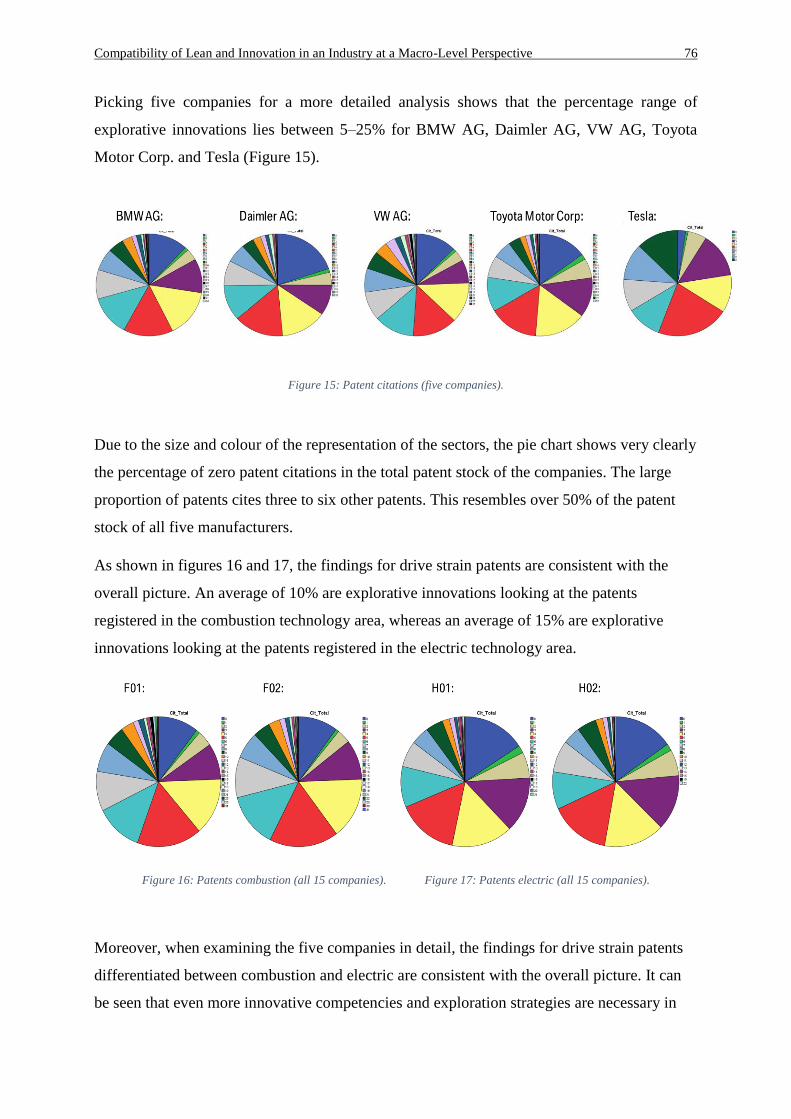
Compatibility of Lean and Innovation in an Industry at a Macro-Level Perspective 76
Picking five companies for a more detailed analysis shows that the percentage range of
explorative innovations lies between 5–25% for BMW AG, Daimler AG, VW AG, Toyota
Motor Corp. and Tesla (Figure 15).
Figure 15: Patent citations (five companies).
Due to the size and colour of the representation of the sectors, the pie chart shows very clearly
the percentage of zero patent citations in the total patent stock of the companies. The large
proportion of patents cites three to six other patents. This resembles over 50% of the patent
stock of all five manufacturers.
As shown in figures 16 and 17, the findings for drive strain patents are consistent with the
overall picture. An average of 10% are explorative innovations looking at the patents
registered in the combustion technology area, whereas an average of 15% are explorative
innovations looking at the patents registered in the electric technology area.
Figure 16: Patents combustion (all 15 companies). Figure 17: Patents electric (all 15 companies).
Moreover, when examining the five companies in detail, the findings for drive strain patents
differentiated between combustion and electric are consistent with the overall picture. It can
be seen that even more innovative competencies and exploration strategies are necessary in
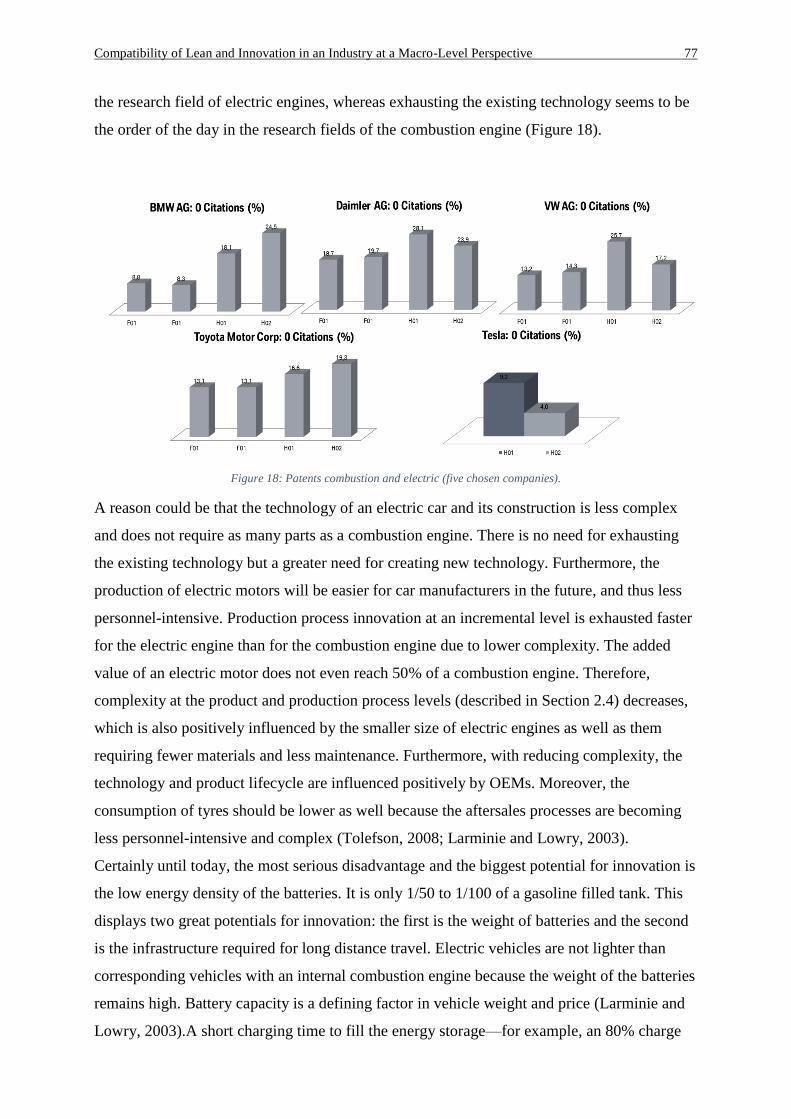
Compatibility of Lean and Innovation in an Industry at a Macro-Level Perspective 77
the research field of electric engines, whereas exhausting the existing technology seems to be
the order of the day in the research fields of the combustion engine (Figure 18).
Figure 18: Patents combustion and electric (five chosen companies).
A reason could be that the technology of an electric car and its construction is less complex
and does not require as many parts as a combustion engine. There is no need for exhausting
the existing technology but a greater need for creating new technology. Furthermore, the
production of electric motors will be easier for car manufacturers in the future, and thus less
personnel-intensive. Production process innovation at an incremental level is exhausted faster
for the electric engine than for the combustion engine due to lower complexity. The added
value of an electric motor does not even reach 50% of a combustion engine. Therefore,
complexity at the product and production process levels (described in Section 2.4) decreases,
which is also positively influenced by the smaller size of electric engines as well as them
requiring fewer materials and less maintenance. Furthermore, with reducing complexity, the
technology and product lifecycle are influenced positively by OEMs. Moreover, the
consumption of tyres should be lower as well because the aftersales processes are becoming
less personnel-intensive and complex (Tolefson, 2008; Larminie and Lowry, 2003).
Certainly until today, the most serious disadvantage and the biggest potential for innovation is
the low energy density of the batteries. It is only 1/50 to 1/100 of a gasoline filled tank. This
displays two great potentials for innovation: the first is the weight of batteries and the second
is the infrastructure required for long distance travel. Electric vehicles are not lighter than
corresponding vehicles with an internal combustion engine because the weight of the batteries
remains high. Battery capacity is a defining factor in vehicle weight and price (Larminie and
Lowry, 2003).A short charging time to fill the energy storage—for example, an 80% charge
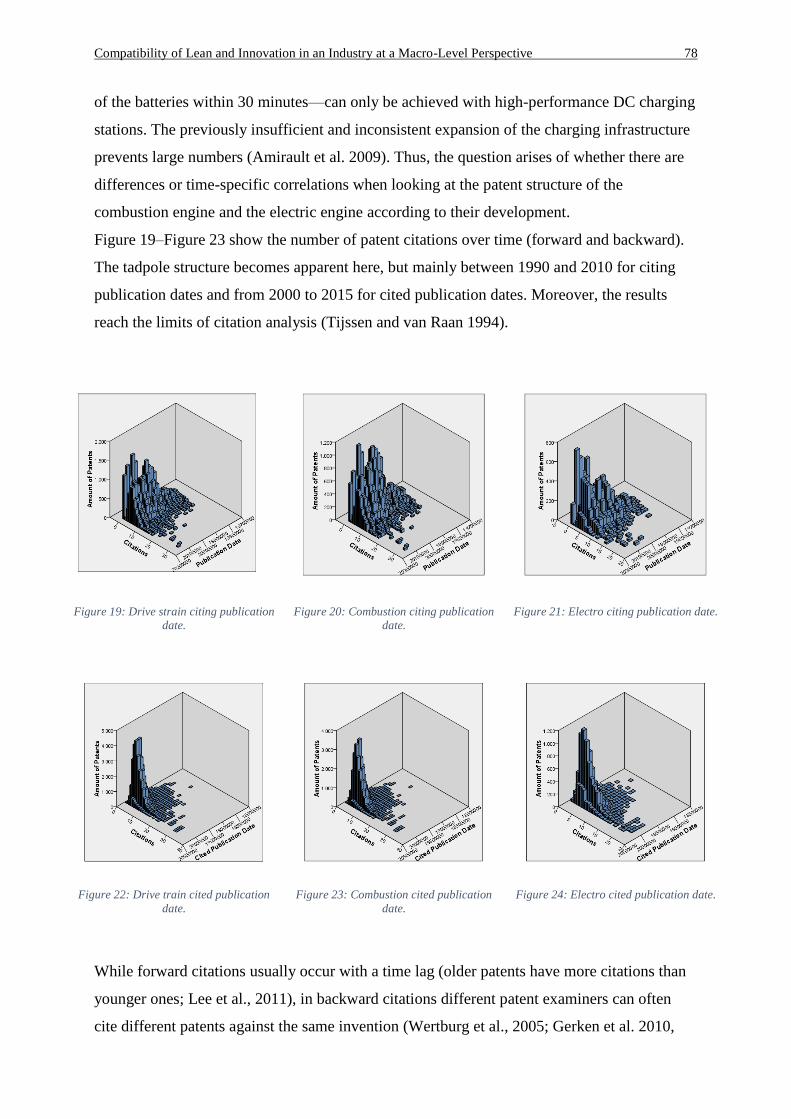
Compatibility of Lean and Innovation in an Industry at a Macro-Level Perspective 78
of the batteries within 30 minutes—can only be achieved with high-performance DC charging
stations. The previously insufficient and inconsistent expansion of the charging infrastructure
prevents large numbers (Amirault et al. 2009). Thus, the question arises of whether there are
differences or time-specific correlations when looking at the patent structure of the
combustion engine and the electric engine according to their development.
Figure 19–Figure 23 show the number of patent citations over time (forward and backward).
The tadpole structure becomes apparent here, but mainly between 1990 and 2010 for citing
publication dates and from 2000 to 2015 for cited publication dates. Moreover, the results
reach the limits of citation analysis (Tijssen and van Raan 1994).
Figure 19: Drive strain citing publication
date. Figure 20: Combustion citing publication
date. Figure 21: Electro citing publication date.
Figure 22: Drive train cited publication
date. Figure 23: Combustion cited publication
date. Figure 24: Electro cited publication date.
While forward citations usually occur with a time lag (older patents have more citations than
younger ones; Lee et al., 2011), in backward citations different patent examiners can often
cite different patents against the same invention (Wertburg et al., 2005; Gerken et al. 2010,
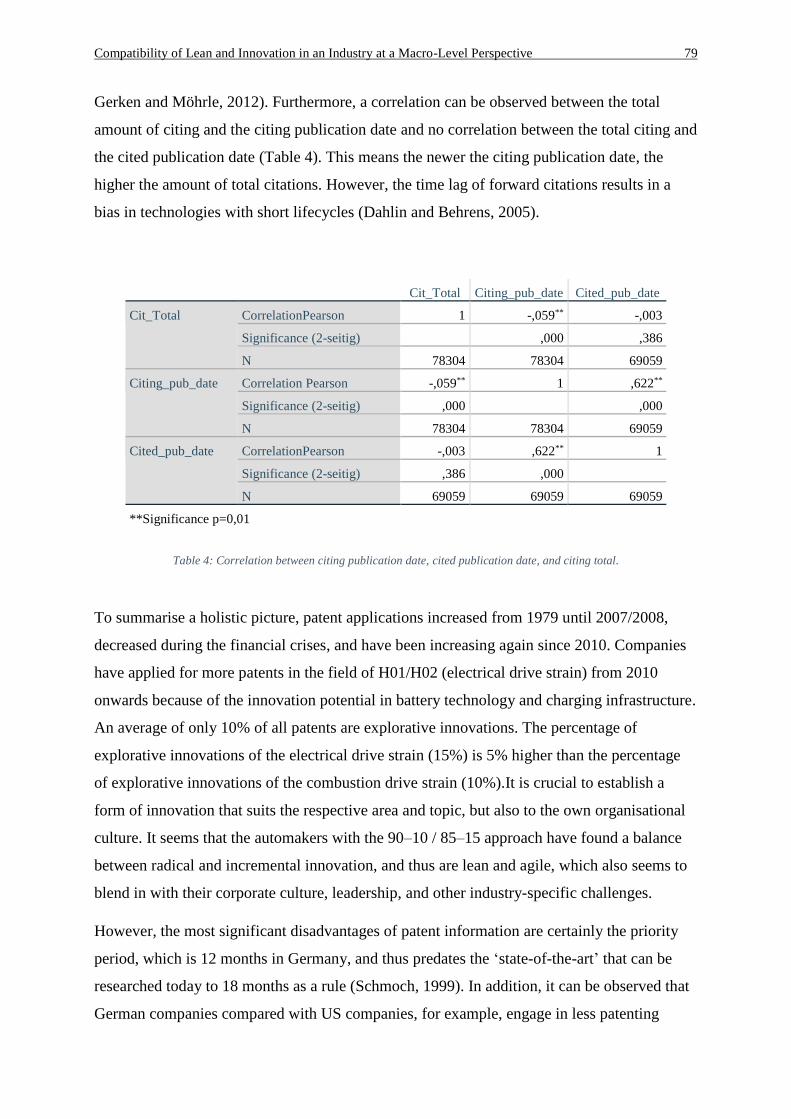
Compatibility of Lean and Innovation in an Industry at a Macro-Level Perspective 79
Gerken and Möhrle, 2012). Furthermore, a correlation can be observed between the total
amount of citing and the citing publication date and no correlation between the total citing and
the cited publication date (Table 4). This means the newer the citing publication date, the
higher the amount of total citations. However, the time lag of forward citations results in a
bias in technologies with short lifecycles (Dahlin and Behrens, 2005).
Cit_Total Citing_pub_date Cited_pub_date
Cit_Total CorrelationPearson 1 -,059** -,003
Significance (2-seitig) ,000 ,386
N 78304 78304 69059
Citing_pub_date Correlation Pearson -,059** 1 ,622**
Significance (2-seitig) ,000 ,000
N 78304 78304 69059
Cited_pub_date CorrelationPearson -,003 ,622** 1
Significance (2-seitig) ,386 ,000
N 69059 69059 69059
**Significance p=0,01
Table 4: Correlation between citing publication date, cited publication date, and citing total.
To summarise a holistic picture, patent applications increased from 1979 until 2007/2008,
decreased during the financial crises, and have been increasing again since 2010. Companies
have applied for more patents in the field of H01/H02 (electrical drive strain) from 2010
onwards because of the innovation potential in battery technology and charging infrastructure.
An average of only 10% of all patents are explorative innovations. The percentage of
explorative innovations of the electrical drive strain (15%) is 5% higher than the percentage
of explorative innovations of the combustion drive strain (10%).It is crucial to establish a
form of innovation that suits the respective area and topic, but also to the own organisational
culture. It seems that the automakers with the 90–10 / 85–15 approach have found a balance
between radical and incremental innovation, and thus are lean and agile, which also seems to
blend in with their corporate culture, leadership, and other industry-specific challenges.
However, the most significant disadvantages of patent information are certainly the priority
period, which is 12 months in Germany, and thus predates the ‘state-of-the-art’ that can be
researched today to 18 months as a rule (Schmoch, 1999). In addition, it can be observed that
German companies compared with US companies, for example, engage in less patenting
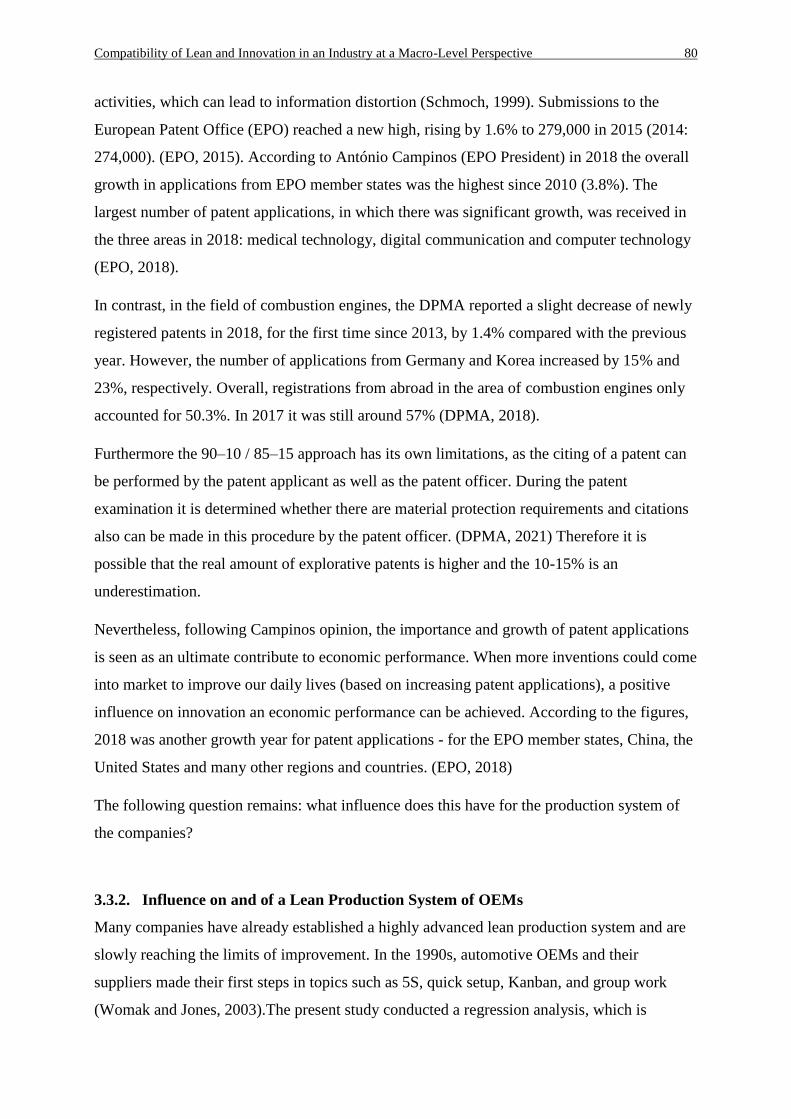
Compatibility of Lean and Innovation in an Industry at a Macro-Level Perspective 80
activities, which can lead to information distortion (Schmoch, 1999). Submissions to the
European Patent Office (EPO) reached a new high, rising by 1.6% to 279,000 in 2015 (2014:
274,000). (EPO, 2015). According to António Campinos (EPO President) in 2018 the overall
growth in applications from EPO member states was the highest since 2010 (3.8%). The
largest number of patent applications, in which there was significant growth, was received in
the three areas in 2018: medical technology, digital communication and computer technology
(EPO, 2018).
In contrast, in the field of combustion engines, the DPMA reported a slight decrease of newly
registered patents in 2018, for the first time since 2013, by 1.4% compared with the previous
year. However, the number of applications from Germany and Korea increased by 15% and
23%, respectively. Overall, registrations from abroad in the area of combustion engines only
accounted for 50.3%. In 2017 it was still around 57% (DPMA, 2018).
Furthermore the 90–10 / 85–15 approach has its own limitations, as the citing of a patent can
be performed by the patent applicant as well as the patent officer. During the patent
examination it is determined whether there are material protection requirements and citations
also can be made in this procedure by the patent officer. (DPMA, 2021) Therefore it is
possible that the real amount of explorative patents is higher and the 10-15% is an
underestimation.
Nevertheless, following Campinos opinion, the importance and growth of patent applications
is seen as an ultimate contribute to economic performance. When more inventions could come
into market to improve our daily lives (based on increasing patent applications), a positive
influence on innovation an economic performance can be achieved. According to the figures,
2018 was another growth year for patent applications - for the EPO member states, China, the
United States and many other regions and countries. (EPO, 2018)
The following question remains: what influence does this have for the production system of
the companies?
3.3.2. Influence on and of a Lean Production System of OEMs
Many companies have already established a highly advanced lean production system and are
slowly reaching the limits of improvement. In the 1990s, automotive OEMs and their
suppliers made their first steps in topics such as 5S, quick setup, Kanban, and group work
(Womak and Jones, 2003).The present study conducted a regression analysis, which is
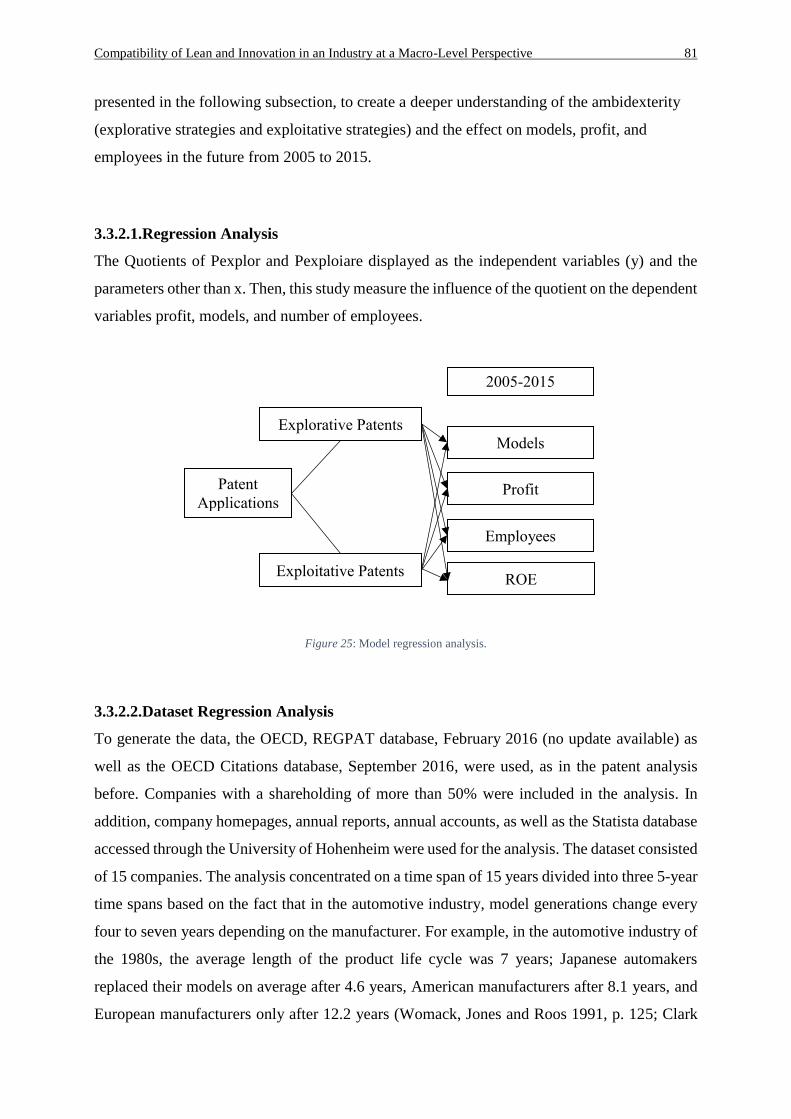
Compatibility of Lean and Innovation in an Industry at a Macro-Level Perspective 81
presented in the following subsection, to create a deeper understanding of the ambidexterity
(explorative strategies and exploitative strategies) and the effect on models, profit, and
employees in the future from 2005 to 2015.
3.3.2.1.Regression Analysis
The Quotients of Pexplor and Pexploiare displayed as the independent variables (y) and the
parameters other than x. Then, this study measure the influence of the quotient on the dependent
variables profit, models, and number of employees.
Figure 25: Model regression analysis.
3.3.2.2.Dataset Regression Analysis
To generate the data, the OECD, REGPAT database, February 2016 (no update available) as
well as the OECD Citations database, September 2016, were used, as in the patent analysis
before. Companies with a shareholding of more than 50% were included in the analysis. In
addition, company homepages, annual reports, annual accounts, as well as the Statista database
accessed through the University of Hohenheim were used for the analysis. The dataset consisted
of 15 companies. The analysis concentrated on a time span of 15 years divided into three 5-year
time spans based on the fact that in the automotive industry, model generations change every
four to seven years depending on the manufacturer. For example, in the automotive industry of
the 1980s, the average length of the product life cycle was 7 years; Japanese automakers
replaced their models on average after 4.6 years, American manufacturers after 8.1 years, and
European manufacturers only after 12.2 years (Womack, Jones and Roos 1991, p. 125; Clark
Patent
Applications
Explorative Patents
Exploitative Patents
Models
Profit
Employees
2005-2015
ROE
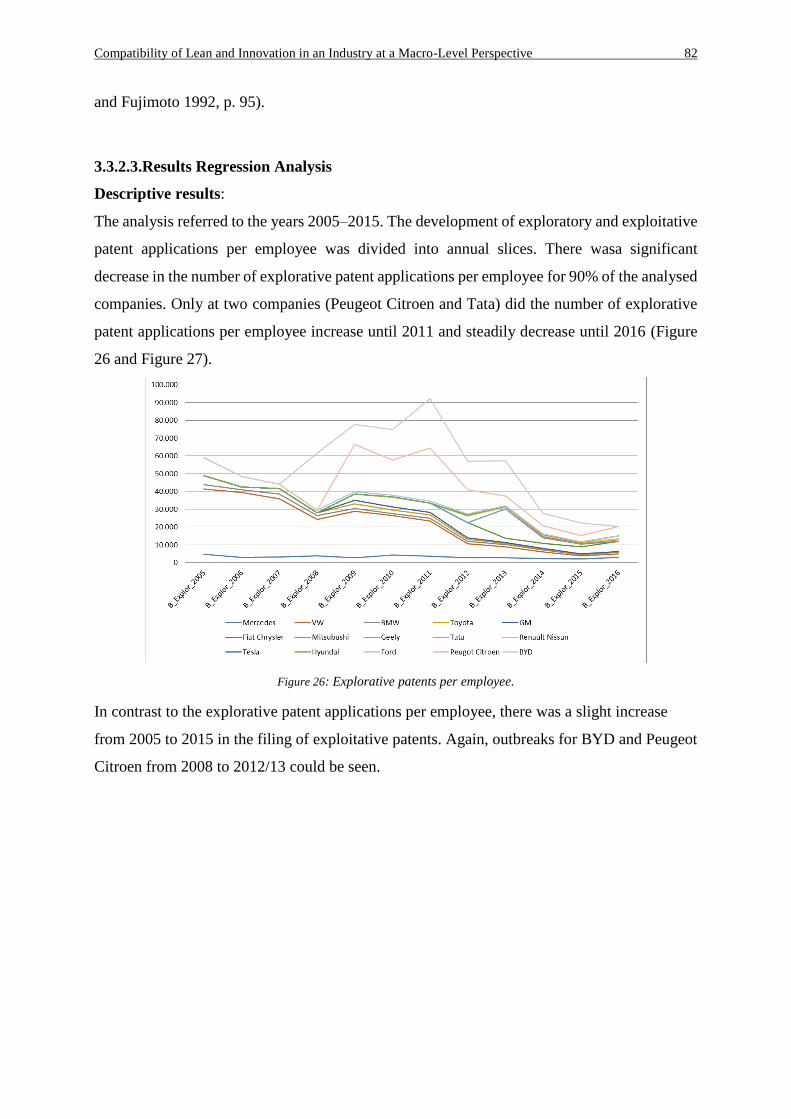
Compatibility of Lean and Innovation in an Industry at a Macro-Level Perspective 82
and Fujimoto 1992, p. 95).
3.3.2.3.Results Regression Analysis
Descriptive results:
The analysis referred to the years 2005–2015. The development of exploratory and exploitative
patent applications per employee was divided into annual slices. There wasa significant
decrease in the number of explorative patent applications per employee for 90% of the analysed
companies. Only at two companies (Peugeot Citroen and Tata) did the number of explorative
patent applications per employee increase until 2011 and steadily decrease until 2016 (Figure
26 and Figure 27).
Figure 26: Explorative patents per employee.
In contrast to the explorative patent applications per employee, there was a slight increase
from 2005 to 2015 in the filing of exploitative patents. Again, outbreaks for BYD and Peugeot
Citroen from 2008 to 2012/13 could be seen.
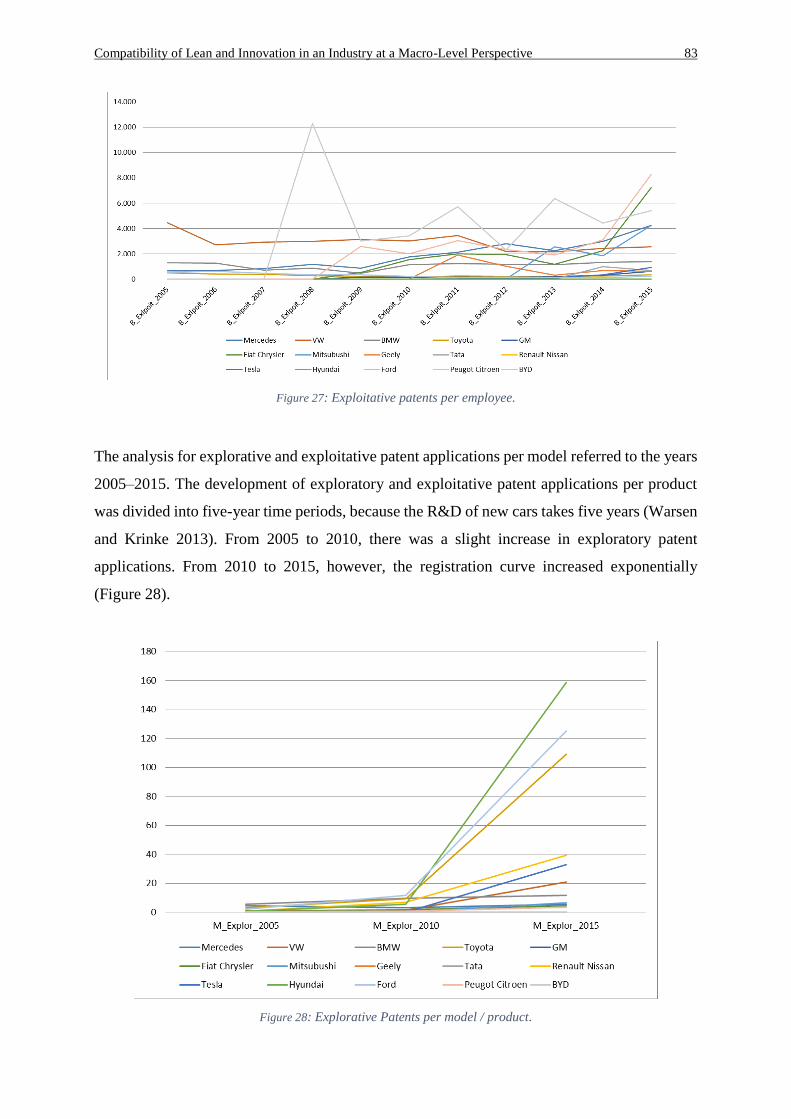
Compatibility of Lean and Innovation in an Industry at a Macro-Level Perspective 83
Figure 27: Exploitative patents per employee.
The analysis for explorative and exploitative patent applications per model referred to the years
2005–2015. The development of exploratory and exploitative patent applications per product
was divided into five-year time periods, because the R&D of new cars takes five years (Warsen
and Krinke 2013). From 2005 to 2010, there was a slight increase in exploratory patent
applications. From 2010 to 2015, however, the registration curve increased exponentially
(Figure 28).
Figure 28: Explorative Patents per model / product.
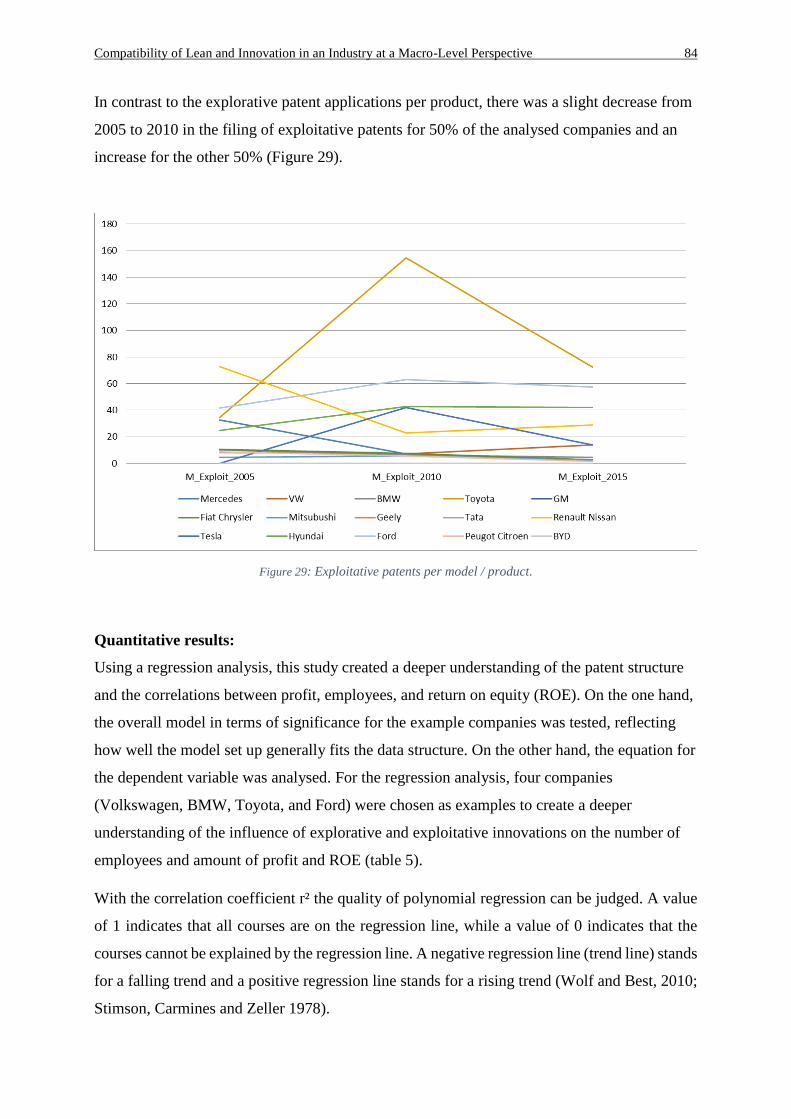
Compatibility of Lean and Innovation in an Industry at a Macro-Level Perspective 84
In contrast to the explorative patent applications per product, there was a slight decrease from
2005 to 2010 in the filing of exploitative patents for 50% of the analysed companies and an
increase for the other 50% (Figure 29).
Figure 29: Exploitative patents per model / product.
Quantitative results:
Using a regression analysis, this study created a deeper understanding of the patent structure
and the correlations between profit, employees, and return on equity (ROE). On the one hand,
the overall model in terms of significance for the example companies was tested, reflecting
how well the model set up generally fits the data structure. On the other hand, the equation for
the dependent variable was analysed. For the regression analysis, four companies
(Volkswagen, BMW, Toyota, and Ford) were chosen as examples to create a deeper
understanding of the influence of explorative and exploitative innovations on the number of
employees and amount of profit and ROE (table 5).
With the correlation coefficient r² the quality of polynomial regression can be judged. A value
of 1 indicates that all courses are on the regression line, while a value of 0 indicates that the
courses cannot be explained by the regression line. A negative regression line (trend line) stands
for a falling trend and a positive regression line stands for a rising trend (Wolf and Best, 2010;
Stimson, Carmines and Zeller 1978).
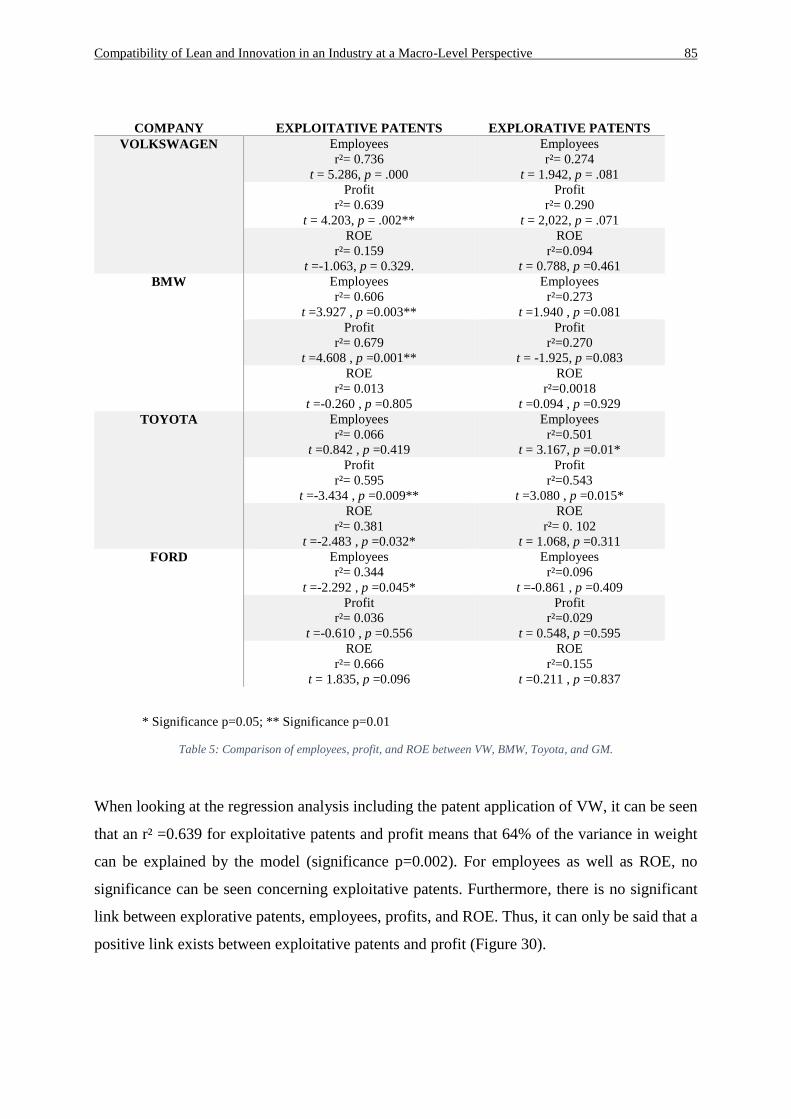
Compatibility of Lean and Innovation in an Industry at a Macro-Level Perspective 85
COMPANY EXPLOITATIVE PATENTS EXPLORATIVE PATENTS
VOLKSWAGEN Employees
r²= 0.736
t = 5.286, p = .000
Employees
r²= 0.274
t = 1.942, p = .081
Profit
r²= 0.639
t = 4.203, p = .002**
Profit
r²= 0.290
t = 2,022, p = .071
ROE
r²= 0.159
t =-1.063, p = 0.329.
ROE
r²=0.094
t = 0.788, p =0.461
BMW Employees
r²= 0.606
t =3.927 , p =0.003**
Employees
r²=0.273
t =1.940 , p =0.081
Profit
r²= 0.679
t =4.608 , p =0.001**
Profit
r²=0.270
t = -1.925, p =0.083
ROE
r²= 0.013
t =-0.260 , p =0.805
ROE
r²=0.0018
t =0.094 , p =0.929
TOYOTA Employees
r²= 0.066
t =0.842 , p =0.419
Employees
r²=0.501
t = 3.167, p =0.01*
Profit
r²= 0.595
t =-3.434 , p =0.009**
Profit
r²=0.543
t =3.080 , p =0.015*
ROE
r²= 0.381
t =-2.483 , p =0.032*
ROE
r²= 0. 102
t = 1.068, p =0.311
FORD Employees
r²= 0.344
t =-2.292 , p =0.045*
Employees
r²=0.096
t =-0.861 , p =0.409
Profit
r²= 0.036
t =-0.610 , p =0.556
Profit
r²=0.029
t = 0.548, p =0.595
ROE
r²= 0.666
t = 1.835, p =0.096
ROE
r²=0.155
t =0.211 , p =0.837
* Significance p=0.05; ** Significance p=0.01
Table 5: Comparison of employees, profit, and ROE between VW, BMW, Toyota, and GM.
When looking at the regression analysis including the patent application of VW, it can be seen
that an r² =0.639 for exploitative patents and profit means that 64% of the variance in weight
can be explained by the model (significance p=0.002). For employees as well as ROE, no
significance can be seen concerning exploitative patents. Furthermore, there is no significant
link between explorative patents, employees, profits, and ROE. Thus, it can only be said that a
positive link exists between exploitative patents and profit (Figure 30).
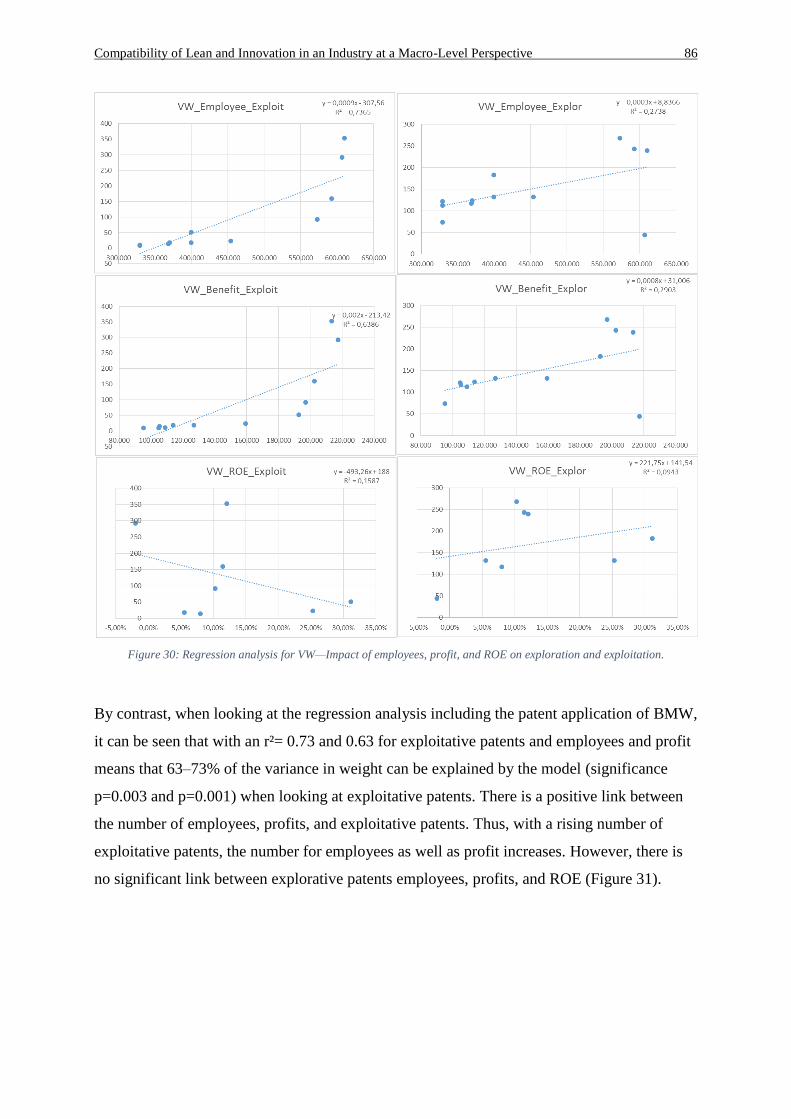
Compatibility of Lean and Innovation in an Industry at a Macro-Level Perspective 86
Figure 30: Regression analysis for VW—Impact of employees, profit, and ROE on exploration and exploitation.
By contrast, when looking at the regression analysis including the patent application of BMW,
it can be seen that with an r²= 0.73 and 0.63 for exploitative patents and employees and profit
means that 63–73% of the variance in weight can be explained by the model (significance
p=0.003 and p=0.001) when looking at exploitative patents. There is a positive link between
the number of employees, profits, and exploitative patents. Thus, with a rising number of
exploitative patents, the number for employees as well as profit increases. However, there is
no significant link between explorative patents employees, profits, and ROE (Figure 31).
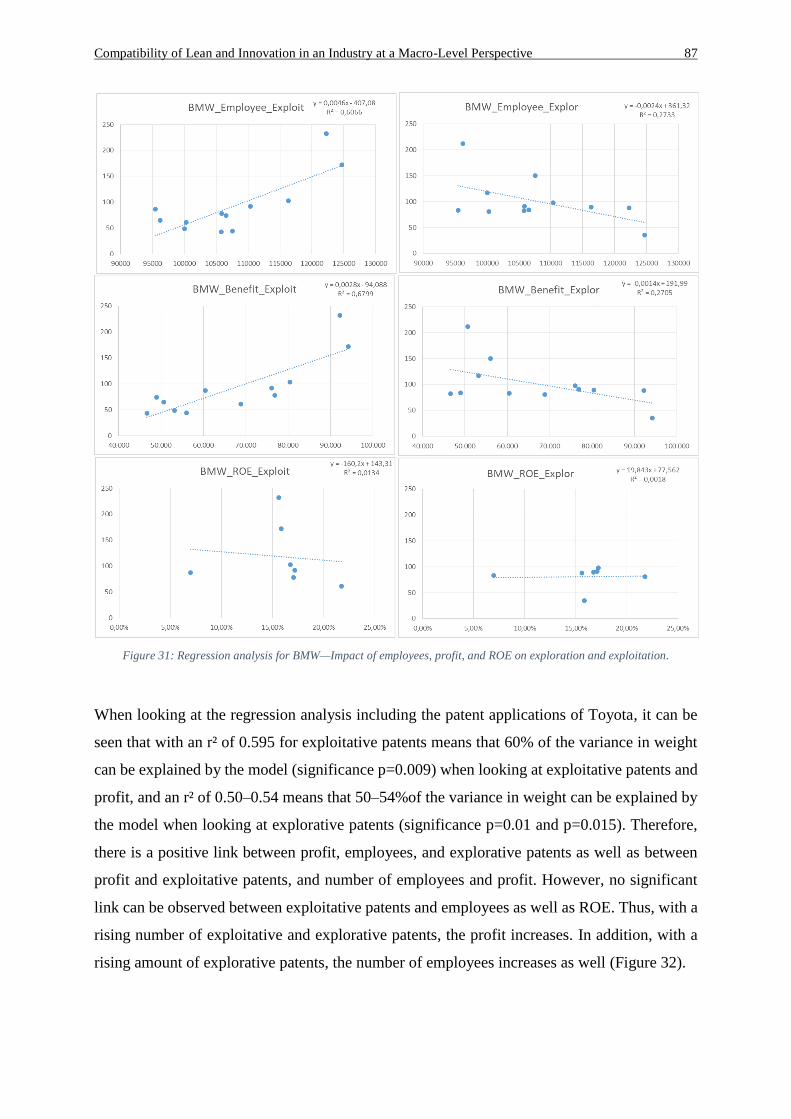
Compatibility of Lean and Innovation in an Industry at a Macro-Level Perspective 87
Figure 31: Regression analysis for BMW—Impact of employees, profit, and ROE on exploration and exploitation.
When looking at the regression analysis including the patent applications of Toyota, it can be
seen that with an r² of 0.595 for exploitative patents means that 60% of the variance in weight
can be explained by the model (significance p=0.009) when looking at exploitative patents and
profit, and an r² of 0.50–0.54 means that 50–54%of the variance in weight can be explained by
the model when looking at explorative patents (significance p=0.01 and p=0.015). Therefore,
there is a positive link between profit, employees, and explorative patents as well as between
profit and exploitative patents, and number of employees and profit. However, no significant
link can be observed between exploitative patents and employees as well as ROE. Thus, with a
rising number of exploitative and explorative patents, the profit increases. In addition, with a
rising amount of explorative patents, the number of employees increases as well (Figure 32).
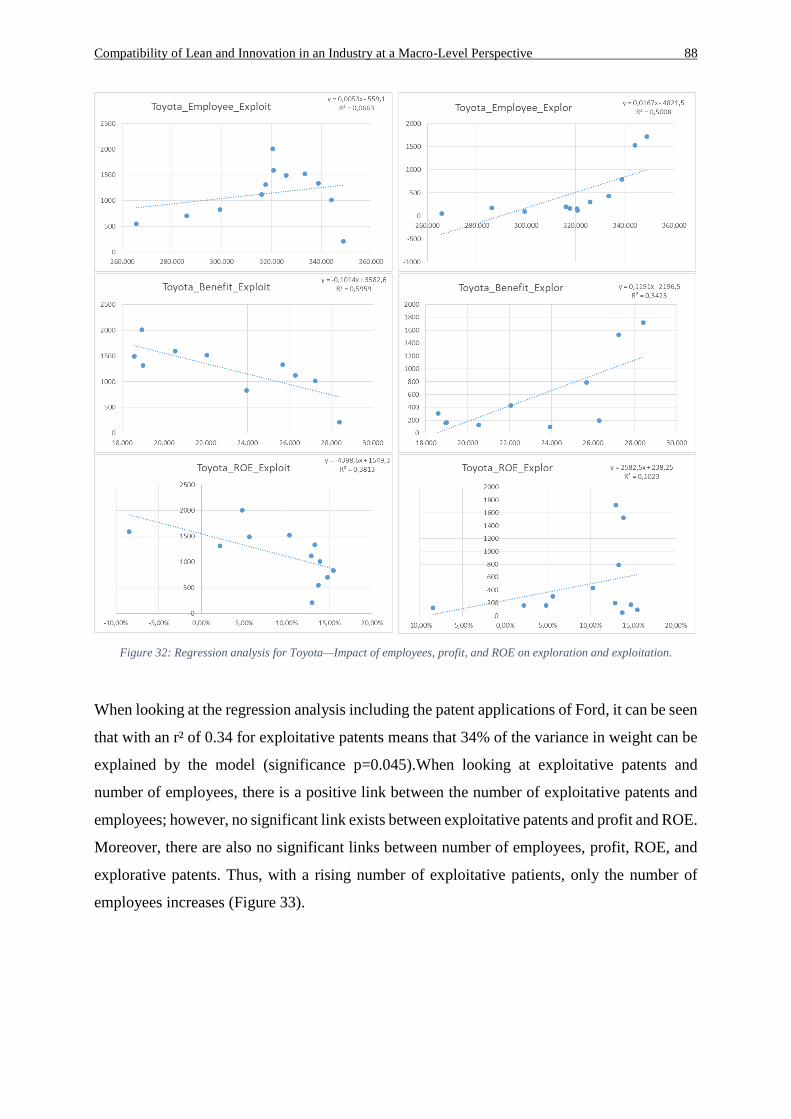
Compatibility of Lean and Innovation in an Industry at a Macro-Level Perspective 88
Figure 32: Regression analysis for Toyota—Impact of employees, profit, and ROE on exploration and exploitation.
When looking at the regression analysis including the patent applications of Ford, it can be seen
that with an r² of 0.34 for exploitative patents means that 34% of the variance in weight can be
explained by the model (significance p=0.045).When looking at exploitative patents and
number of employees, there is a positive link between the number of exploitative patents and
employees; however, no significant link exists between exploitative patents and profit and ROE.
Moreover, there are also no significant links between number of employees, profit, ROE, and
explorative patents. Thus, with a rising number of exploitative patients, only the number of
employees increases (Figure 33).
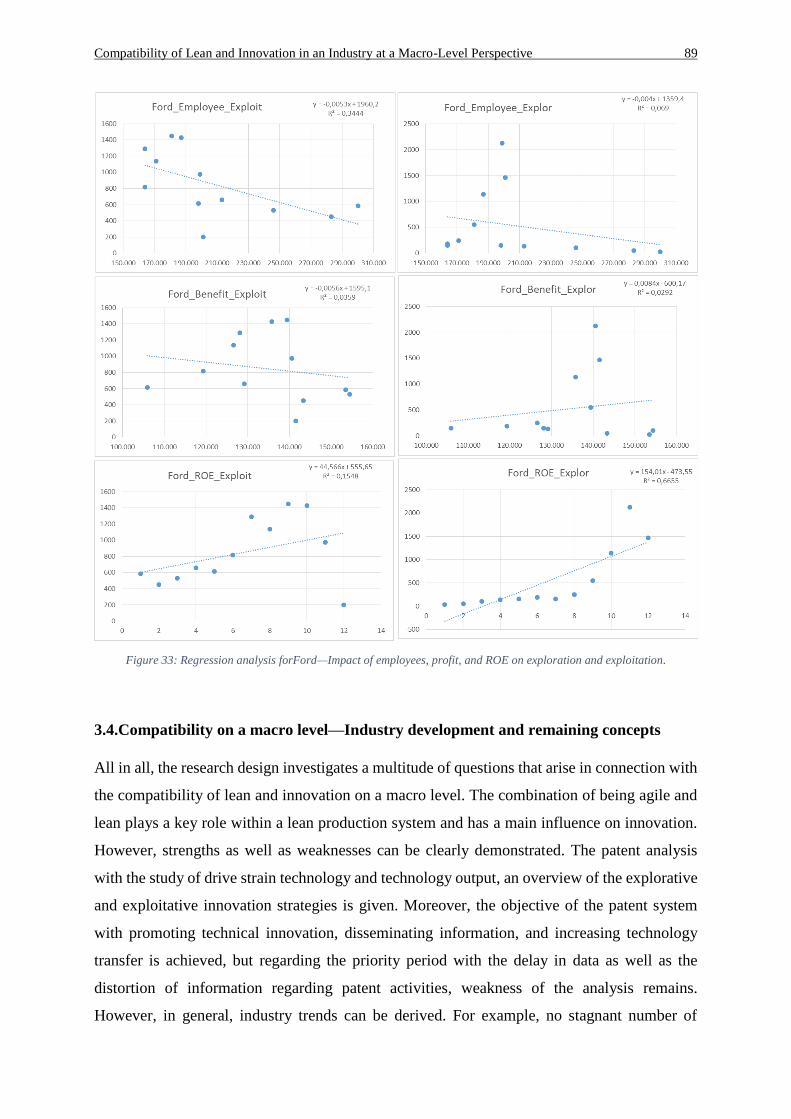
Compatibility of Lean and Innovation in an Industry at a Macro-Level Perspective 89
Figure 33: Regression analysis forFord—Impact of employees, profit, and ROE on exploration and exploitation.
3.4.Compatibility on a macro level—Industry development and remaining concepts
All in all, the research design investigates a multitude of questions that arise in connection with
the compatibility of lean and innovation on a macro level. The combination of being agile and
lean plays a key role within a lean production system and has a main influence on innovation.
However, strengths as well as weaknesses can be clearly demonstrated. The patent analysis
with the study of drive strain technology and technology output, an overview of the explorative
and exploitative innovation strategies is given. Moreover, the objective of the patent system
with promoting technical innovation, disseminating information, and increasing technology
transfer is achieved, but regarding the priority period with the delay in data as well as the
distortion of information regarding patent activities, weakness of the analysis remains.
However, in general, industry trends can be derived. For example, no stagnant number of
Compatibility of Lean and Innovation in an Industry at a Macro-Level Perspective 90
registrations/decline over a longer period of observation can be seen; by contrast, an increase
in patent applications in the drive strain sector shows the importance and transformation
challenges within this technology.
A high development potential of these technologies can be seen, which can be divided into
exploration and exploitation strategies. However, with traditional thinking centred solely on
immediate benefit and fear of change and failure, tomorrow’s big ideas are hard to find in
today’s mainstream markets, especially in the field of drive strain technology.
In the 90–10/85–15 approach, the focus and the approach must be adapted to the current
challenges, and even in the case of great uncertainty, the implementation of the ideas must not
be stopped. Companies must realise that radical innovation will pay the most when the biggest
uncertainty is accepted. It is a paradox that transcends classic benefit, enabling companies to
change the world we live in. For the creation of this balance and the acceptance of uncertainty,
the internal company structures as well as the project management strategy need to blend in.
Concentrating on exploitative innovations such as improvements or extensions of existing
products will ensure production costs are kept at a low level while increasing the returns on
development, but without a focus on generational change and real market novelties OEMs will
not be able to keep their position on the market. Therefore, it is all about keeping the balance
between the ambidextrous strategies of exploration and exploitation.
As seen in the results concerning the drive strain technology, combustion and electric patents
have been applied since 1978, but to force a real generational change new drive strain types
such as the fuel cell and hydrogen engines must be developed. Furthermore, the infrastructure
and the supplier network display great potential for innovation, attributed to the lack in
flexibility of electric vehicles for long distances and the nationwide charging infrastructure.
Current political decisions and social pressure increase the need for a generational change and
market novelties even more. A binding and holistic traffic concept, which takes into account
ecological, economic and health criteria, is increasingly becoming the focus of social and
political demands. In addition to drive strain technology, this also includes a quota for electric
cars and a concrete exit date for combustion engines. Moreover, considerations must also be
pushed forward, such as the technologies for storing renewable electricity (‘Power-to-X’), in
particular for road freight, shipping, and air travel.
Sustainability as well as change potentials and opportunities will have a strong impact on the
future of automakers and are a decisive factor in the fight for survival in the automotive markets.
Compatibility of Lean and Innovation in an Industry at a Macro-Level Perspective 91
The adaptability and exploration potential of companies in a situation characterised by the
already named VUCA principles becomes more relevant than ever before. Strategy,
organisation, cooperation, and leadership are the main areas in a company in which the right
behaviour and VUCA handling are essential/critical for success. At the same time, the
exploitation must not be lost sight of, by continuing to operate in good, stable, safe, simple, and
unique environments. Therefore, it is essential to be able to act lean and agile at the same time,
making it possible to keep the balance between exploitation and exploration. However,
companies still struggle in today’s application of lean approaches because of the massive barrier
to the realisation of ambidexterity. An organisational cultural double bind arises, because on
the one hand employees are required to organise themselves, to communicate without hierarchy,
and to think creatively to realise exploration and agility, but on the other hand they are forced
into the organisation with hard-hand efficiency programmes and exploitation only in the truly
negative sense of the word. As a result, employees are disrupted and the organisation is
paralysed. This in return leads to an increased complexity with making and optimisation
approach impossible.
Thus, the meso level of the compatibility of lean and innovation plays an important role, and is
thus the focus of the next chapter.
Compatibility of Lean and Innovations in a Production System from a Micro Level Perspective 92
4. Compatibility of Lean and Innovations in a Company at a Meso-Level Perspective—
An Integrated Framework Approach
The selection, implementation, and evaluation of innovations/innovation projects are critical
factors in every company’s strategy. The key aspects, knowledge gain and prosperity increase,
described already at the beginning, play a major role in the long-term success of companies.
The strategic selection and evaluation of innovation and their adaptation in the production
system as well as the evaluation of this adaptation process are the focus of this chapter.
However, before the selection, conduction, and evaluation of innovations/innovation projects
are discussed, to be able to choose the right approach (exploitation and exploration) for the
project, it is necessary to understand the current situation fully. The Stacey matrix and the
Cynefin framework, as described in subsection 2.4.3, are helpful decision models in
companies to identify the current situation of a project landscape. Based on this addition of
the theoretical framework, and therefore with knowing the importance of the situation, the
focus is now how we can select and evaluate innovation/innovation projects that fit the vision
and goal of the company and follow the correct path. The maturity model described in the
following section allows consideration of the overall system- and target configuration in
local/temporal operational decisions, and can therefore help to define the vision and goal for
the project as well as the direction. Ata meso-level perspective, this fits directly into streams
of aforementioned research that state getting to know the situation first is one of the most vital
factors for the success of the project.
4.1.Selection and evaluation of innovation projects based on lean principles16
The value creation system of companies, especially within the production system of
automotive companies, needs to be highly flexible and versatile due to increasing competitive
pressure, growing customer demands, and rising desire for individuality in the field of product
design. As a result of increasing requirements in flexibility, speed, profitability, and efficacy,
the overall targets regarding costs, time, quality, and sustainability represent a key motivation
not only for lean management approaches but also for Industry 4.0 approaches (Dombrowski
et al., 2017). Companies face the challenge of aligning their Lean and Industry 4.0 strategies
and transferring respective strategy derivations into an operative level in terms of concrete
concepts, methods, and technology projects. However, appropriate guidelines and models
16 Section 4.1. was created in coauthership by Burggräf, P., Lorber, C., Pyka, A., Wagner, J. & Weisser, T. (2020) Kaizen 4.0
towards an Integrated Framework for the Lean-Industry 4.0 Transformation. Proceedings of the Future Technologies
Conference (FTC), pp. 692-709.
Compatibility of Lean and Innovations in a Production System from a Micro Level Perspective 93
uniting Lean and Industry 4.0 on an operative decision level are still missing. This section
aims to close this gap by providing a range of contributions for the establishment of such
standards. The first subsection conduces to a critical appreciation of related research as well
as the definition of corresponding objectives. Maturity model creation, including evaluation
criteria, is described in the second section and concludes in section four. The third section
provides a procedural perspective to the field of observation. To conclude, a brief discussion
and summary are given in the fifth subsection at the end of this section.
Womack and Jones (2003) defined five core principles of lean: First, the identification of the
customer defined value; second, the continuous improvement of the value stream; third, the
elimination of waste in order to convert the value flow smoothly; fourth, the synchronisation
of information flow and customer demand to activate a demand driven pull system; and fifth,
the perfection of all processes, products and services. Concentrating on these core lean
principles enables manufacturing processes as well as whole organisations to achieve
increasingly high levels of efficiency and to compete at a low cost level while maintaining
high speed of delivery and gaining optimal quality (Rosário Cabrita et al., 2016). In order to
accomplish a lean production system, lean processes need to be established. Those can be
defined as ‘an integrated socio-technical system whose main objective is to eliminate waste
by concurrently reducing or minimising supplier, customer, and internal variability’(Shah and
Ward, 2007). With the invention of lean production having taken place more than 50 years
ago, however, it seems that the concept/management technique has reached its limit. In the
future, production decoupled from market requirements will become increasingly relevant, as
deviations in market requirements are already in conflict with levelled capacity utilisation
(Erlach, 2013; Dickmann, 2007).
Furthermore, due to the increase of international supply chains, the environment has become
increasingly complex, entailing the establishment of intelligent products and production
systems (Vyatkin et al., 2007). The necessity of lean as an evolving concept was already
described by Hines, Holweg, and Rich (2004). The goal of companies in the 21st century is to
verify, examine, and perfect proven technologies continuously and to intelligently combine
them with new methods (e.g., Industry 4.0). Industry 4.0 is a term for the increased integration
of information and communication technologies with the aim to enhance and optimise value
chains by implementing an autonomously controlled, dynamic production (Kolberg and
Zühlke, 2015; Bitkom e.V. et al., 2016). It is commonly considered to represent the fourth
industrial revolution, a new level of organisation and control of the entire value chain beyond
the product life cycle (Hirsch-Kreinsen, 2014). Kolberg and Zühlke (2015) suggested that the
Compatibility of Lean and Innovations in a Production System from a Micro Level Perspective 94
successful merging of Lean and Industry 4.0 can be achieved on four different operational
levels:
Smart Operator: Reduction of time from failure occurrence to failure notification by real-time
error detection and direct employee localisation through Cyber Physical Systems (CPS).
Smart Product: Collection of process data for the analysis during and after the production
tailored to each product through the utilisation of sensors and CPS.
Smart Machine: Collection of process data by every machine with connectable sensors and
CPS to achieve fast and flexible predictive maintenance.
Smart Planer: Decentralisation of planning processes to find the optimum between highest
possible capacity utilisation per working station and continuous flow of goods, using working
stations integrated in CPS to negotiate cycle times.
4.1.1. Industry 4.0 and Lean Management
Shortly after the technology-driven Industry 4.0 paradigm emerged, researchers tended to
examine potential ties to the traditional best practice-driven paradigm of lean production.
Whereas a consensus concerning the complementarity of both paradigms has been developed
so far, concrete cooperative specifications are still subject to current research. The
subsequently used classification of scientific approaches serves to allocate the field of
research chronologically.
Compatibility of the Lean and Industry 4.0 Paradigms. Examinations originate at the
executive principles of the respective paradigm. Through reciprocal comparison of those
principles (geared to operational functions), different goals become apparent to some extent,
as Roy et al.(2015) and Quasdorff and Bracht (2016) demonstrated. Thus, an exhaustive
conformity of both paradigms cannot be assumed. For example, Ganschar et al.(2013)
discussed the issue with the discrepancy between FIFO/Flow (Lean) and a decentral, case-
based control (I4.0) as part of a difference between the goals of standardisation and complete
information of technological pervasion. Despite the determination of certain characteristic
differences and partial incoherency, most researchers see a benefit in the complimentary
application of the two paradigms (especially Wagner et al., 2017; Roy et al., 2015; Kolberg
and Zühlke, 2015. Cf. a detailed record on this in Dombrowski et al., 2017). Leveraging
Industry 4.0, higher lean maturity levels are expected, as well as a reasonable integration of
Industry 4.0 being possible with the aid of lean. Accordance prevails with the assumption that
process orientation and especially lean production represent a key prerequisite for Industry
4.0.
Compatibility of Lean and Innovations in a Production System from a Micro Level Perspective 95
Paradigm transformation. Besides the consensus of general complementarity, a plethora of
research focuses on the transformation process to Industry 4.0. In this regard, there are different
approaches to enhance contemporary lean methods unidirectionally using technologies of
Industry 4.0 (cf. Kolberg and Zühlke, 2015 and Sanders et al., 2016). Sanders and his colleagues
responded in a very detailed manner to 10measurable lean manufacturing dimensions
developed by Shah and Ward(2007) and described the respective capabilities of Industry 4.0.
Beyond that, Metternich et al.(2017) provided a first proposal for capability maturity levels
with the attempt of arranging the principles and methods of the paradigms in a hierarchical
stage model from lean across digitisation to Industry 4.0. Concerning specified transformation
options, approaches have thus far merely concentrated on a production technological view,
which is only preliminary to the value-added/production systematic view (cf. Baena et al., 2017,
Erol et al., 2016, Morlock et al., 2016, with low consideration of lean, respectively). Also
concerning maturity based assessment, dedicated lean maturity models are unintegratedly
confronted with dedicated Industry 4.0 maturity models; for example, Nightingale and H.
Mize(2002) and Maasouman and Demirli (2015), finishing lean optimised, and Leyh et
al.(2016), with the SIMMI 4.0 maturity model, starting at the digitization level.
Semi-integrated approaches. Consecutive to the paradigm transformation, semi-integrated
approaches exist that are oriented on specific methods. Meudt et al.(2017) expanded the value
stream mapping to a 4.0 level by the integration of a data view. Rauch et al.(2016) focused on
operational functions, in detail on the transformation from lean product development to smart
product development. Likewise, semi-integrated approaches represent a sub-step in the
direction of a holistic paradigm integration and a detailed elaboration of an artifact thereof.
Schuh et al.(2017) developed an Industry 4.0 maturity index, also classified as being semi
integrated, because their approach included both an applicable procedure and accurately
detailed maturity model, both giving direction to the research at hand. Though dignifying lean
in terms of organisational and cultural contributions, complementarities to established
principles and methods of lean manufacturing were not examined by Schuh et al., however.
Fully integrated approaches. Burggräf et al. (2017) proposed a fully integrated procedure
model emanating from a company’s value stream analysis. Through the identification of
mission critical lean principles, a digitised value stream is designed by serving the three
perspectives of Human–Technology, Human–Organisation, and Technology–Organisation (to
the H-M-T approach cf. also Morlock et al. 2016) with applications and related technologies
from Industry 4.0. Burggräf et al. concluded their work by questioning evaluation and
Compatibility of Lean and Innovations in a Production System from a Micro Level Perspective 96
comparison methods for digital solutions. Regarding this, Bauer, Pokorni, and Findeisen (2018)
provided, with ‘Production assessment 4.0’, a first integrated approach for a maturity level-
based representation and consequently the measurability of the transformation from lean to
Industry 4.0. Their model allows an assessment of the production systems’ maturity within 33
criteria with up to eight sub criteria each. Additional to the traditional development fields of
lean production (e.g., standardisation and continuous improvement), scopes of Industry 4.0 are
reasonably integrated (e.g., M2M, digital image of the production system). A further allocation
is achieved by aligning strategy, processes and value stream, organisation, methods and tools,
as well as labour. However, the model of Spath et al. does not exceed the allocation of general
development fields and a proposal for potential maturity levels.
The integration and further development of Burggräf et al.’s procedure model in terms of
bidirectionality, as well as Spath et al.’s assessment model in terms of operationalisation
are thus subject to the subsequently presented work under consideration of the following:
- Operationalisation and value oriented model usability
- Decision base for transformation interfaces
- Transfer and individual application of artefacts
- Bidirectional paradigm view within a reference procedure model
Subsumable as framework consisting of procedure and evaluation model for the lean Industry
4.0 transformation is missing.
4.1.2. Methodology and Aim of the Research
The explanations above yield three main questions that the presented works attempt to answer:
1. Which interrelations occur between lean production and Industry 4.0 considering an
evolutionary transformation?
2. How can companies evaluate concepts, methods, and technologies on an operative level
to develop the production system in the context of lean and Industry 4.0?
3. How can companies proceed to develop their lean production systems in the context of
Industry 4.0?
Compatibility of Lean and Innovations in a Production System from a Micro Level Perspective 97
Interrelations result in our field of observation from the diversity of concepts, methods, and
technologies, serving similar requirements in different areas of a company while being
individually adapted and embedded into the local system environment. With regard to this
circumstance, a multi-dimensional model intends to contribute in particular to a complexity
reduction in the given context. Contemplating possible interdependencies, the continuity of
transformation processes has to be likewise considered, requiring a temporal perspective of the
evaluation of concepts, methods, and tools. To answer questions (1) and (2), we suggest the
development of a multi-dimensional capability maturity model, which depicts the spatial factor
of interdependencies as well as the temporal factor of transformation processes. The model
development process performed in our research follows the procedure of Becker et al.(2009),
proposing a reference procedure for maturity model development focusing on information
technology. Commencing with a problem definition, a review of hitherto relevant approaches
to the subject matter is now complemented by a development strategy. Thus, the further
procedure consists of an iterative maturity model development. In addition to a plausibility
evaluation, a quantitative evaluation regarding specific assessment criteria for deployment is
performed in a different paper (cf. explanations on related research). The iteration of model
development is carried out across each of the following levels: design level selection, approach
selection, design of model section, and testing. As maturity models according to Becker et al.
only allow a systems’ posterior appraisal, our maturity model is complemented by a procedure
model. Through this, the consideration of adequate concepts, methods, and technologies
(C/M/T) referring to the system configuration shall be enabled a priori. The procedure model
development is based on the idea of hierarchic views as an Enterprise Architecture principle
(cf. Josey, 2018, Zachman, 1987; Sowa and Zachman, 1992). Passing through the procedure
model, the maturity model in turn allows an evaluation on each view/level, which is why both
models have to be seen interconnected.
4.1.3. Results—A Multi-Dimensional Capability Maturity Model
4.1.3.1.Maturity Model Development
Field of observation. As shown above, the synthesis of lean production and Industry 4.0 is not
comprehensively discussed. It can, however, be asserted that the transformation to Industry 4.0
is based on a lean production and develops in an evolutionary process of single elements in a
systems’ configuration. Referring to a further development of the production assessment model
of Spath et al.(2017), modelling is particularly performed under consideration of an operative
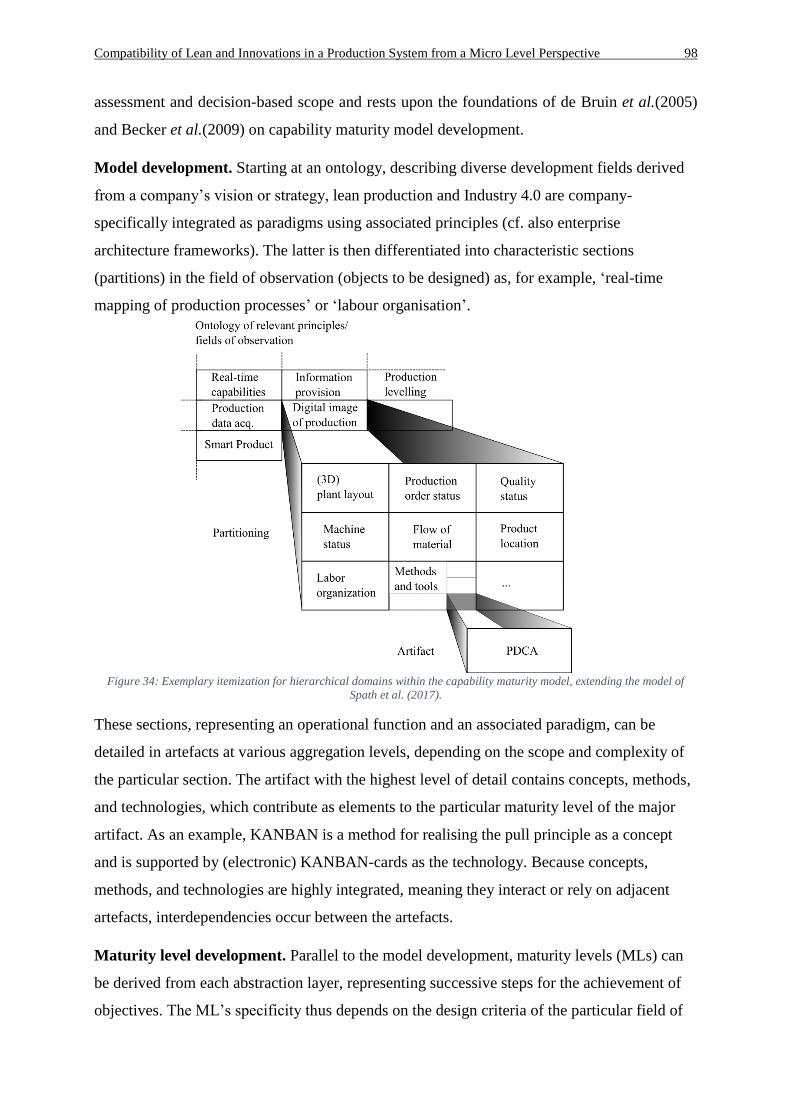
Compatibility of Lean and Innovations in a Production System from a Micro Level Perspective 98
assessment and decision-based scope and rests upon the foundations of de Bruin et al.(2005)
and Becker et al.(2009) on capability maturity model development.
Model development. Starting at an ontology, describing diverse development fields derived
from a company’s vision or strategy, lean production and Industry 4.0 are company-
specifically integrated as paradigms using associated principles (cf. also enterprise
architecture frameworks). The latter is then differentiated into characteristic sections
(partitions) in the field of observation (objects to be designed) as, for example, ‘real-time
mapping of production processes’ or ‘labour organisation’.
Figure 34: Exemplary itemization for hierarchical domains within the capability maturity model, extending the model of
Spath et al. (2017).
These sections, representing an operational function and an associated paradigm, can be
detailed in artefacts at various aggregation levels, depending on the scope and complexity of
the particular section. The artifact with the highest level of detail contains concepts, methods,
and technologies, which contribute as elements to the particular maturity level of the major
artifact. As an example, KANBAN is a method for realising the pull principle as a concept
and is supported by (electronic) KANBAN-cards as the technology. Because concepts,
methods, and technologies are highly integrated, meaning they interact or rely on adjacent
artefacts, interdependencies occur between the artefacts.
Maturity level development. Parallel to the model development, maturity levels (MLs) can
be derived from each abstraction layer, representing successive steps for the achievement of
objectives. The ML’s specificity thus depends on the design criteria of the particular field of
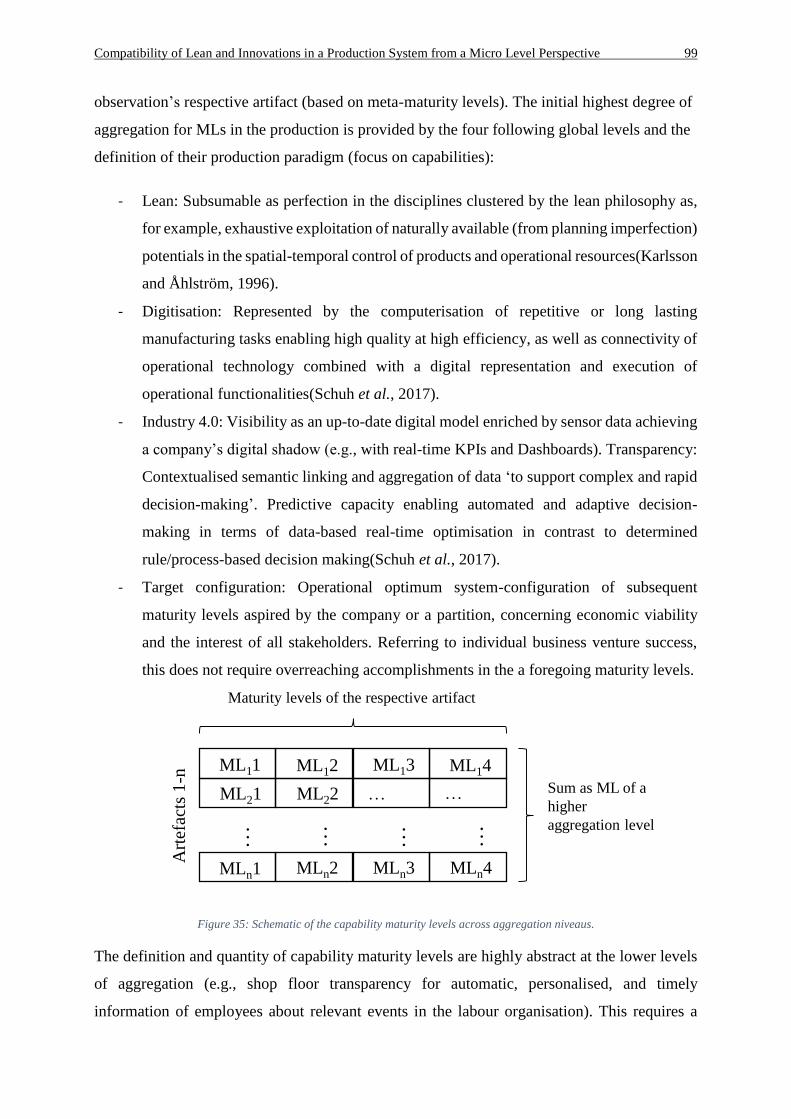
Compatibility of Lean and Innovations in a Production System from a Micro Level Perspective 99
observation’s respective artifact (based on meta-maturity levels). The initial highest degree of
aggregation for MLs in the production is provided by the four following global levels and the
definition of their production paradigm (focus on capabilities):
- Lean: Subsumable as perfection in the disciplines clustered by the lean philosophy as,
for example, exhaustive exploitation of naturally available (from planning imperfection)
potentials in the spatial-temporal control of products and operational resources(Karlsson
and Åhlström, 1996).
- Digitisation: Represented by the computerisation of repetitive or long lasting
manufacturing tasks enabling high quality at high efficiency, as well as connectivity of
operational technology combined with a digital representation and execution of
operational functionalities(Schuh et al., 2017).
- Industry 4.0: Visibility as an up-to-date digital model enriched by sensor data achieving
a company’s digital shadow (e.g., with real-time KPIs and Dashboards). Transparency:
Contextualised semantic linking and aggregation of data ‘to support complex and rapid
decision-making’. Predictive capacity enabling automated and adaptive decision-
making in terms of data-based real-time optimisation in contrast to determined
rule/process-based decision making(Schuh et al., 2017).
- Target configuration: Operational optimum system-configuration of subsequent
maturity levels aspired by the company or a partition, concerning economic viability
and the interest of all stakeholders. Referring to individual business venture success,
this does not require overreaching accomplishments in the a foregoing maturity levels.
Figure 35: Schematic of the capability maturity levels across aggregation niveaus.
The definition and quantity of capability maturity levels are highly abstract at the lower levels
of aggregation (e.g., shop floor transparency for automatic, personalised, and timely
information of employees about relevant events in the labour organisation). This requires a
…… … …
Art
efac
ts1
-n
Maturity levels of the respective artifact
ML11 ML12 ML13 ML14
ML21 ML22 … …
MLn1 MLn2 MLn3 MLn4
Sum as ML of a
higher
aggregation level
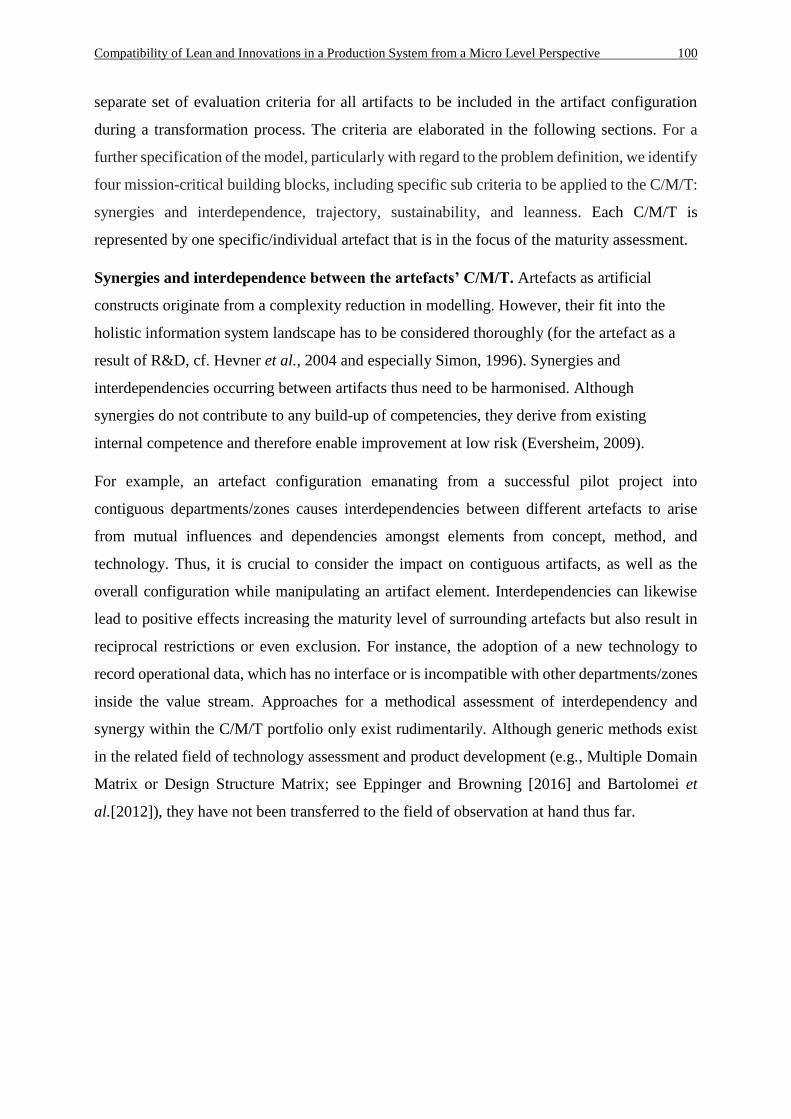
Compatibility of Lean and Innovations in a Production System from a Micro Level Perspective 100
separate set of evaluation criteria for all artifacts to be included in the artifact configuration
during a transformation process. The criteria are elaborated in the following sections. For a
further specification of the model, particularly with regard to the problem definition, we identify
four mission-critical building blocks, including specific sub criteria to be applied to the C/M/T:
synergies and interdependence, trajectory, sustainability, and leanness. Each C/M/T is
represented by one specific/individual artefact that is in the focus of the maturity assessment.
Synergies and interdependence between the artefacts’ C/M/T. Artefacts as artificial
constructs originate from a complexity reduction in modelling. However, their fit into the
holistic information system landscape has to be considered thoroughly (for the artefact as a
result of R&D, cf. Hevner et al., 2004 and especially Simon, 1996). Synergies and
interdependencies occurring between artifacts thus need to be harmonised. Although
synergies do not contribute to any build-up of competencies, they derive from existing
internal competence and therefore enable improvement at low risk (Eversheim, 2009).
For example, an artefact configuration emanating from a successful pilot project into
contiguous departments/zones causes interdependencies between different artefacts to arise
from mutual influences and dependencies amongst elements from concept, method, and
technology. Thus, it is crucial to consider the impact on contiguous artifacts, as well as the
overall configuration while manipulating an artifact element. Interdependencies can likewise
lead to positive effects increasing the maturity level of surrounding artefacts but also result in
reciprocal restrictions or even exclusion. For instance, the adoption of a new technology to
record operational data, which has no interface or is incompatible with other departments/zones
inside the value stream. Approaches for a methodical assessment of interdependency and
synergy within the C/M/T portfolio only exist rudimentarily. Although generic methods exist
in the related field of technology assessment and product development (e.g., Multiple Domain
Matrix or Design Structure Matrix; see Eppinger and Browning [2016] and Bartolomei et
al.[2012]), they have not been transferred to the field of observation at hand thus far.
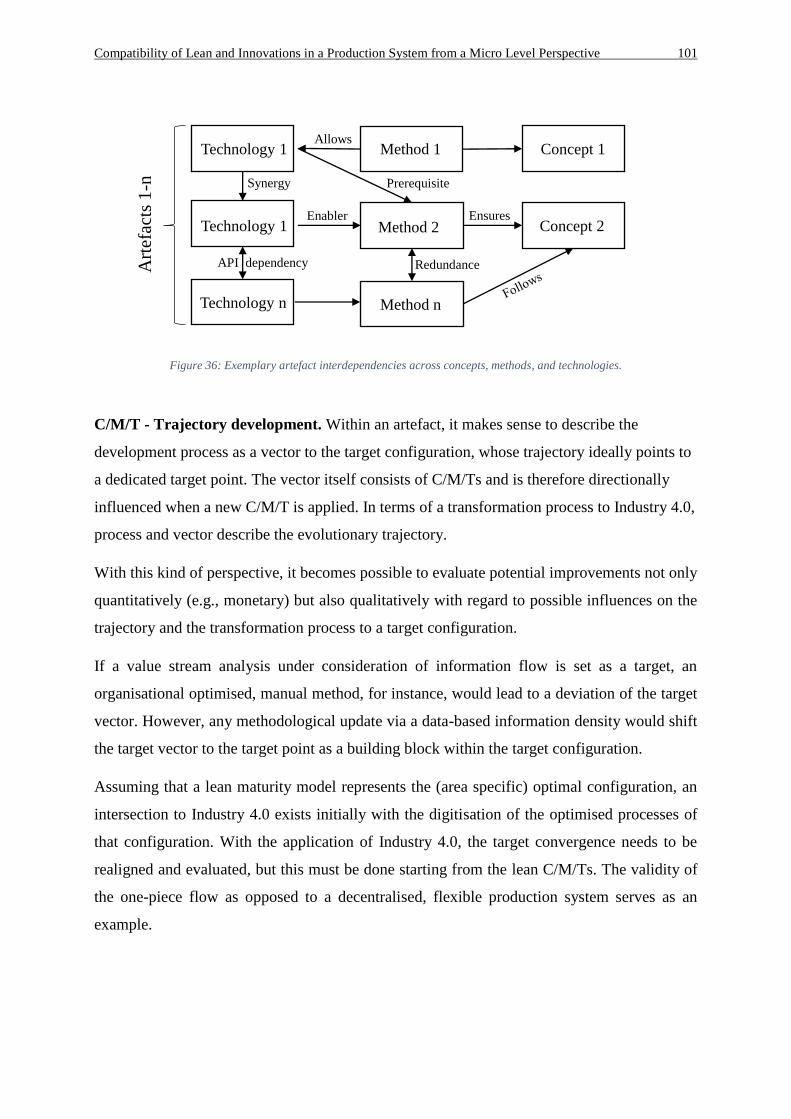
Compatibility of Lean and Innovations in a Production System from a Micro Level Perspective 101
Figure 36: Exemplary artefact interdependencies across concepts, methods, and technologies.
C/M/T - Trajectory development. Within an artefact, it makes sense to describe the
development process as a vector to the target configuration, whose trajectory ideally points to
a dedicated target point. The vector itself consists of C/M/Ts and is therefore directionally
influenced when a new C/M/T is applied. In terms of a transformation process to Industry 4.0,
process and vector describe the evolutionary trajectory.
With this kind of perspective, it becomes possible to evaluate potential improvements not only
quantitatively (e.g., monetary) but also qualitatively with regard to possible influences on the
trajectory and the transformation process to a target configuration.
If a value stream analysis under consideration of information flow is set as a target, an
organisational optimised, manual method, for instance, would lead to a deviation of the target
vector. However, any methodological update via a data-based information density would shift
the target vector to the target point as a building block within the target configuration.
Assuming that a lean maturity model represents the (area specific) optimal configuration, an
intersection to Industry 4.0 exists initially with the digitisation of the optimised processes of
that configuration. With the application of Industry 4.0, the target convergence needs to be
realigned and evaluated, but this must be done starting from the lean C/M/Ts. The validity of
the one-piece flow as opposed to a decentralised, flexible production system serves as an
example.
Art
efac
ts1
-nTechnology 1
Technology 1
Synergy
API dependency
Technology n
Method 2
Method n
Prerequisite
Enabler EnsuresConcept 2
Method 1 Concept 1
Redundance
Allows
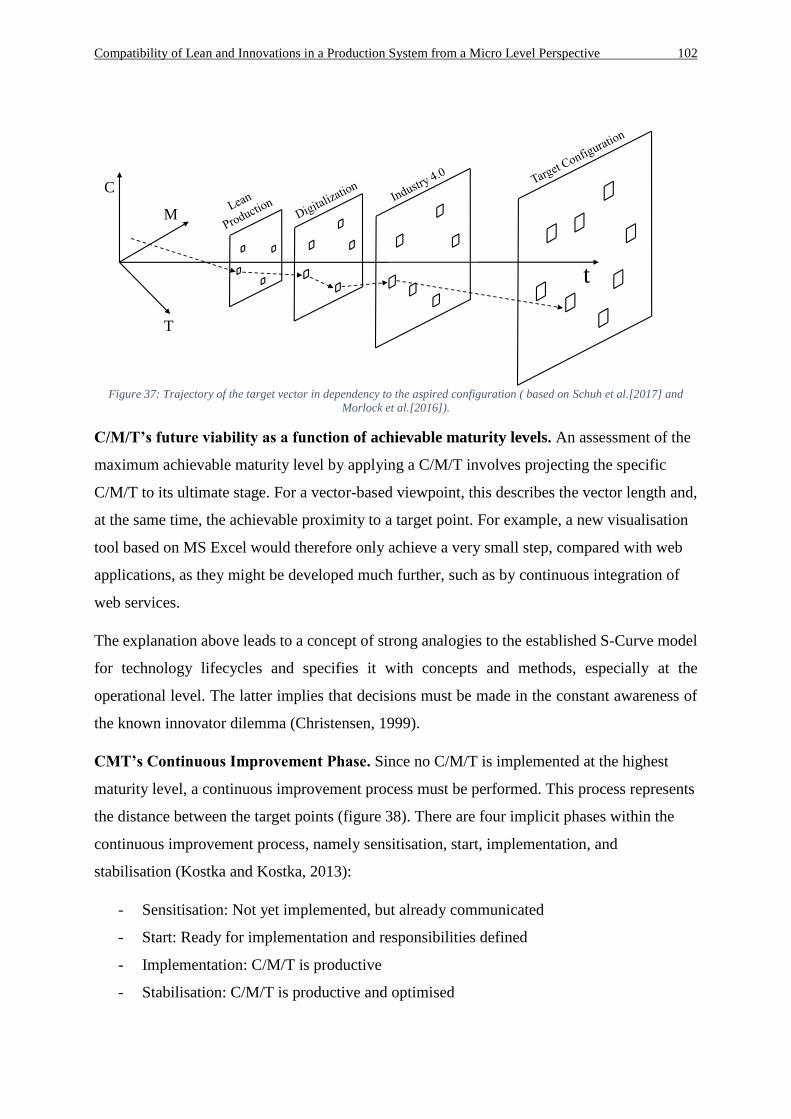
Compatibility of Lean and Innovations in a Production System from a Micro Level Perspective 102
Figure 37: Trajectory of the target vector in dependency to the aspired configuration ( based on Schuh et al.[2017] and
Morlock et al.[2016]).
C/M/T’s future viability as a function of achievable maturity levels. An assessment of the
maximum achievable maturity level by applying a C/M/T involves projecting the specific
C/M/T to its ultimate stage. For a vector-based viewpoint, this describes the vector length and,
at the same time, the achievable proximity to a target point. For example, a new visualisation
tool based on MS Excel would therefore only achieve a very small step, compared with web
applications, as they might be developed much further, such as by continuous integration of
web services.
The explanation above leads to a concept of strong analogies to the established S-Curve model
for technology lifecycles and specifies it with concepts and methods, especially at the
operational level. The latter implies that decisions must be made in the constant awareness of
the known innovator dilemma (Christensen, 1999).
CMT’s Continuous Improvement Phase. Since no C/M/T is implemented at the highest
maturity level, a continuous improvement process must be performed. This process represents
the distance between the target points (figure 38). There are four implicit phases within the
continuous improvement process, namely sensitisation, start, implementation, and
stabilisation (Kostka and Kostka, 2013):
- Sensitisation: Not yet implemented, but already communicated
- Start: Ready for implementation and responsibilities defined
- Implementation: C/M/T is productive
- Stabilisation: C/M/T is productive and optimised
C
M
T
t
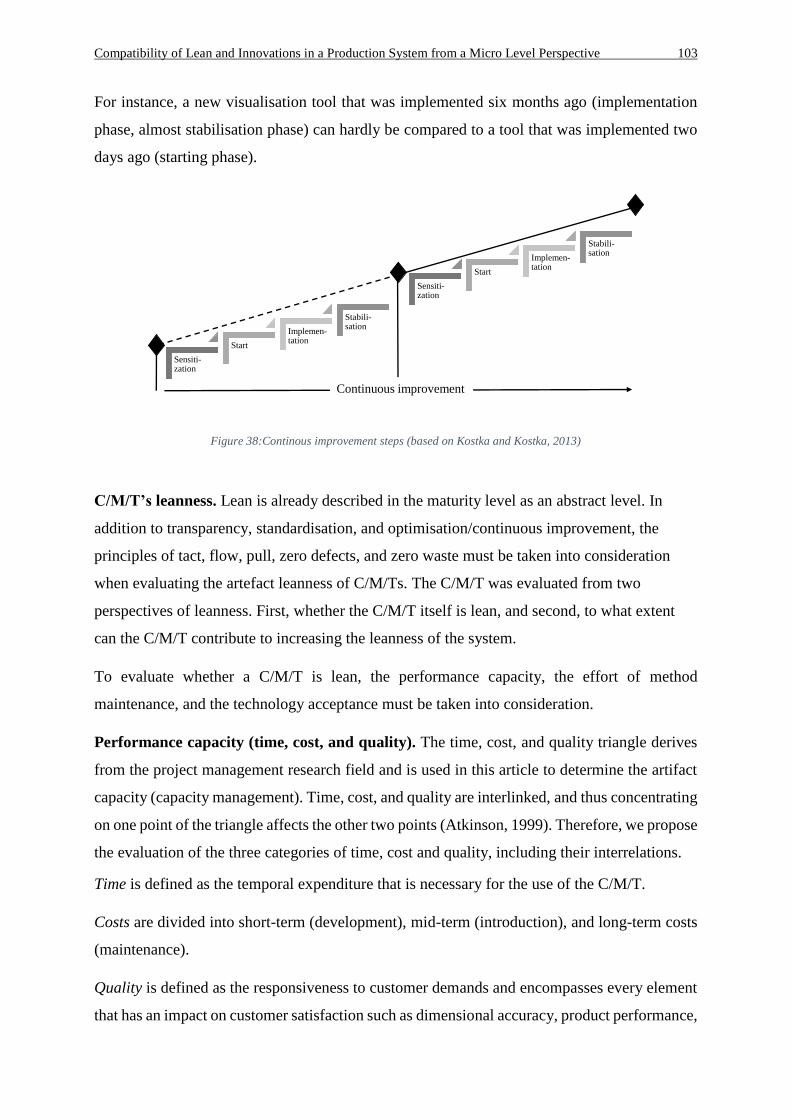
Compatibility of Lean and Innovations in a Production System from a Micro Level Perspective 103
For instance, a new visualisation tool that was implemented six months ago (implementation
phase, almost stabilisation phase) can hardly be compared to a tool that was implemented two
days ago (starting phase).
Figure 38:Continous improvement steps (based on Kostka and Kostka, 2013)
C/M/T’s leanness. Lean is already described in the maturity level as an abstract level. In
addition to transparency, standardisation, and optimisation/continuous improvement, the
principles of tact, flow, pull, zero defects, and zero waste must be taken into consideration
when evaluating the artefact leanness of C/M/Ts. The C/M/T was evaluated from two
perspectives of leanness. First, whether the C/M/T itself is lean, and second, to what extent
can the C/M/T contribute to increasing the leanness of the system.
To evaluate whether a C/M/T is lean, the performance capacity, the effort of method
maintenance, and the technology acceptance must be taken into consideration.
Performance capacity (time, cost, and quality). The time, cost, and quality triangle derives
from the project management research field and is used in this article to determine the artifact
capacity (capacity management). Time, cost, and quality are interlinked, and thus concentrating
on one point of the triangle affects the other two points (Atkinson, 1999). Therefore, we propose
the evaluation of the three categories of time, cost and quality, including their interrelations.
Time is defined as the temporal expenditure that is necessary for the use of the C/M/T.
Costs are divided into short-term (development), mid-term (introduction), and long-term costs
(maintenance).
Quality is defined as the responsiveness to customer demands and encompasses every element
that has an impact on customer satisfaction such as dimensional accuracy, product performance,
Continuous improvement
Sensiti-zation
Start
Implemen-tation
Stabili-sation
Sensiti-zation
Start
Implemen-tation
Stabili-sation
Compatibility of Lean and Innovations in a Production System from a Micro Level Perspective 104
specifications, or basic functionalities (Frits and Fujimoto, 2007). When the production quality
of the product rises, production time as well as the production costs increase initially. In the
short term time, cost, and quality as critical success factors of a production system may
outweigh the subsequently explained criteria, however long-term they scale moderately.
Effort of usage and maintenance. Regarding the cost–benefit ratio of a method or technology,
two key factors must be taken into consideration. At first the people, in particular their effort to
maintain the method or technology, and second the software itself, particularly “waste” within
software development and handling. Especially when decisions about potential digital
replacements are pending, the effort of usage and maintenance has to be scrutinised.
People are the centre of resources, information, process design, decision making, and
organisational energy. Organisation structures have to be centred around the flow of value, not
on functional expertise. For the assessment and the degree of depletion it is essential that the
digital information is presented and handled dedicated to the people who are adding value to
the system (Poppendieck & Poppendieck 2003). It is therefore crucial that new methods or
technologies do not cause more effort for the people than established ones.
Waste in software development consists of seven different categories: extra features and
requirements, extra iterations, information gathering, unexposed defects during tests, waiting,
and handoffs (Poppendieck & Poppendieck 2003). The usage of multiple software systems
additionally leads to interface- and architecture complexity. Thus, it has to be ensured that these
seven categories of waste are fundamentally eliminated.
Technology acceptance. With regard to the target configuration, the technology acceptance
model of Davis (1986) is used to evaluate whether the usage of the C/M/T is evaluated
positively or negatively. The use of the C/M/T is dependent on the intention of the user (Davis,
1986). The intention or attitude towards the usage results from the perceived usefulness as well
as the perceived ease of use. These two categories can be influenced by different factors such
as job relevance, output quality, subjective norms, or personal experience (Venkatesh und
Davis, 2000).
For example, a visualisation tool based on MS Excel may seem quickly introducible at a low
cost level, but it lacks many of the already introduced criteria (e.g., efficiency or future viability)
compared with a web application. The Excel tool has further restrictions concerning usability
and compatibility, which decreases the method maintenance by creating work-arounds (waste),
which are not necessary in the web application. The technology acceptance for the prevalent
Compatibility of Lean and Innovations in a Production System from a Micro Level Perspective 105
MS Excel may be high in the beginning, but regarding its limited usability the acceptance will
decrease with rising application complexity. To evaluate to which degree the C/M/T can help
to increase the leanness of the system, it has to be taken into consideration how new levels of
tact, flow, pull, zero defects, or zero waste are achieved. For instance, production activities of
one specific area are mapped on a physical board with printed sheets containing basic
information about the machines that are used in the system (e.g., overall equipment
effectiveness), people who are working in the area (e.g., shift schedule and accidents at work),
and the key performance indicators (e.g., output per hour), contain high transparency but also a
high effort of usage and maintenance. Therefore the introduction of a manually handled Excel
tool that unites the information about the machines, the people, and the key performance
indicators in one Excel sheet that is digitally accessible is a first step in increasing the leanness
of the whole system. A web application that unites all information automatically without
needing a person to summarise the information that is digitally accessible will be a next step.
Model consolidation. In figure 39, the successive conceptualisations of the components of
the maturity models are now recapitulated and presented as an overall model. The nature of
concepts, methods, and technologies influences the direction of a target vector, which in an
ideal case, is aligned to a point of the systems’ target configuration17. As the latter is not
achievable by implication, a CIP is necessary, which is represented by the distance to the
target point and can be evaluated by the maturity levels. Kaizen 4.0 then describes an
aggregated view to improve artifacts that integrates both lean and Industry 4.0 to obtain the
target configuration (figure 34, for example, aggregation levels). As a C/M/T (depending on
the aggregation level) enters an artifact, it passes through the phases depicted in figure 38.
There are several potential reasons for a C/M/T shift, and the question of whether and when is
also the core topic of this work as well as what makes ∆t the focal point of the model. As
already discussed, a shift may either arise from saturated process optimisations pulling new
approaches, or from C/M/T pushed towards apparent inefficiencies. For the assessment of
single C/M/Telements concerning their integration in the overall system configuration, and to
determine their potential for an achievement of objectives, leanness plays an important role.
Deviations within the trajectory may occur, caused by temporary target configurations, either
requiring interim solutions or economic optima. Synergies and interdependence across
multiple artefacts are shown between the maturity levels, as their influence directly relates to
adapting, facilitating, or interlocking of adjoining capabilities.
17The vectors‘ ascend therby serves a better visualization, however the orientation has to be understood as solely dependent of
the spatial and temporal location of the target point.
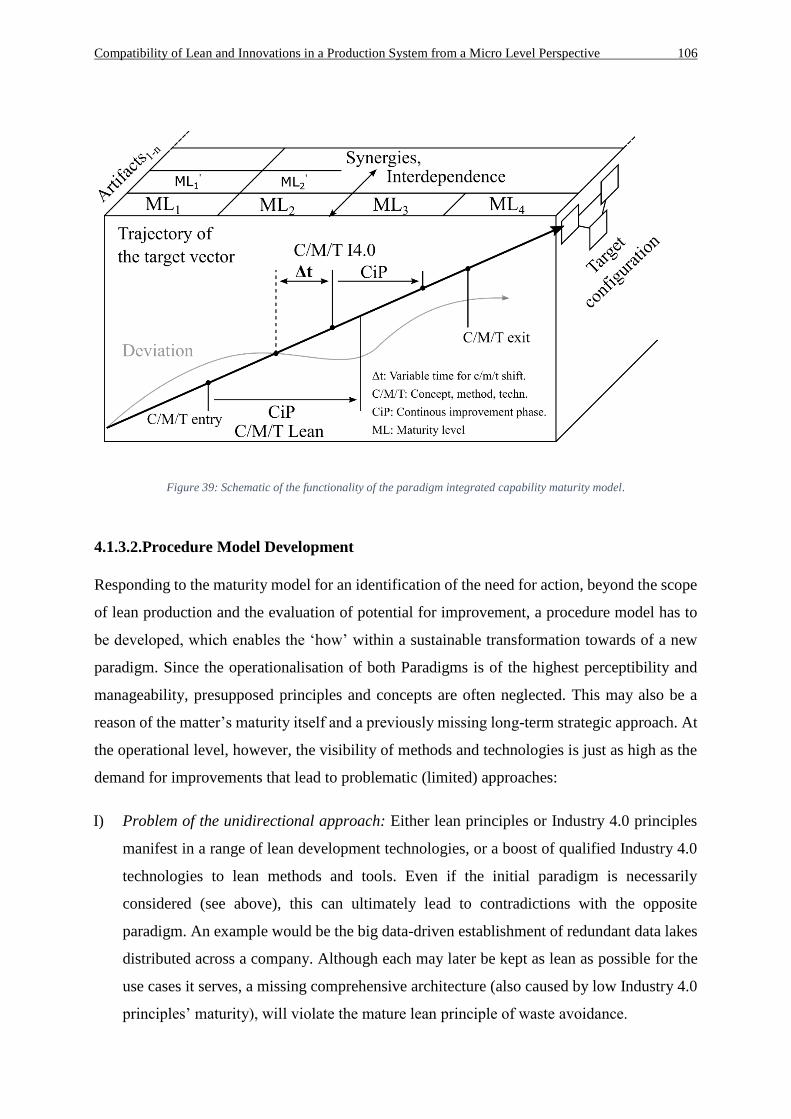
Compatibility of Lean and Innovations in a Production System from a Micro Level Perspective 106
Figure 39: Schematic of the functionality of the paradigm integrated capability maturity model.
4.1.3.2.Procedure Model Development
Responding to the maturity model for an identification of the need for action, beyond the scope
of lean production and the evaluation of potential for improvement, a procedure model has to
be developed, which enables the ‘how’ within a sustainable transformation towards of a new
paradigm. Since the operationalisation of both Paradigms is of the highest perceptibility and
manageability, presupposed principles and concepts are often neglected. This may also be a
reason of the matter’s maturity itself and a previously missing long-term strategic approach. At
the operational level, however, the visibility of methods and technologies is just as high as the
demand for improvements that lead to problematic (limited) approaches:
I) Problem of the unidirectional approach: Either lean principles or Industry 4.0 principles
manifest in a range of lean development technologies, or a boost of qualified Industry 4.0
technologies to lean methods and tools. Even if the initial paradigm is necessarily
considered (see above), this can ultimately lead to contradictions with the opposite
paradigm. An example would be the big data-driven establishment of redundant data lakes
distributed across a company. Although each may later be kept as lean as possible for the
use cases it serves, a missing comprehensive architecture (also caused by low Industry 4.0
principles’ maturity), will violate the mature lean principle of waste avoidance.
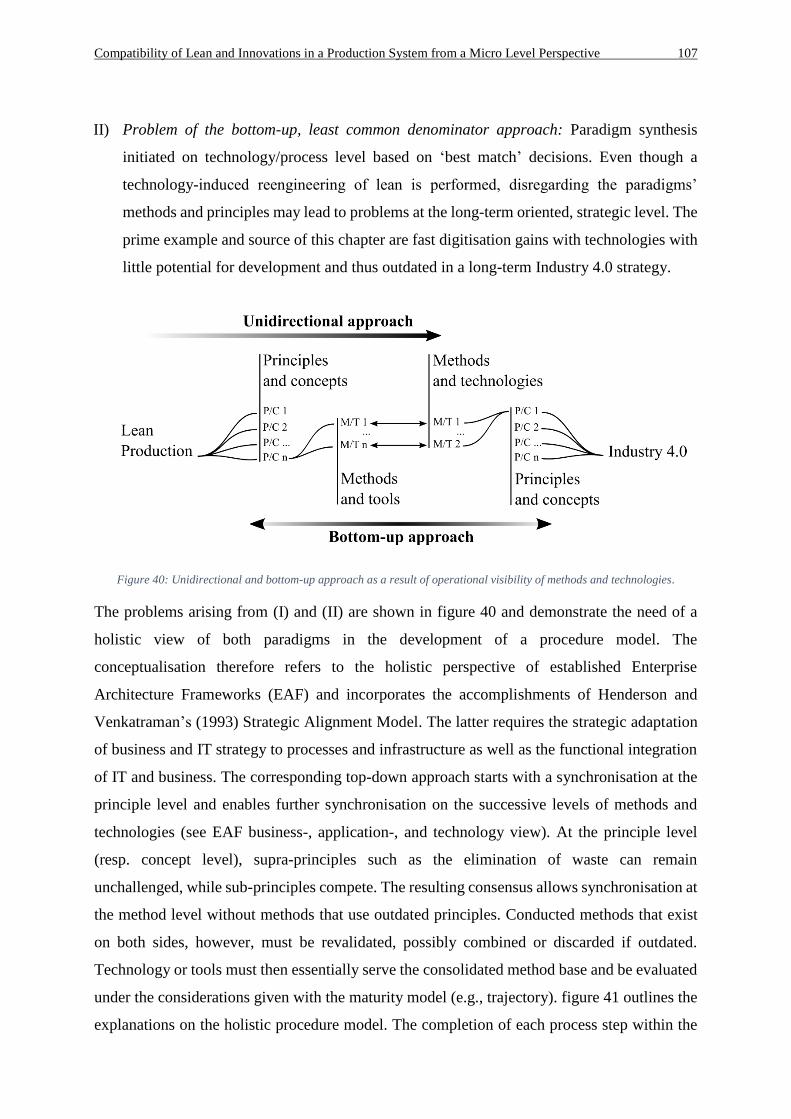
Compatibility of Lean and Innovations in a Production System from a Micro Level Perspective 107
II) Problem of the bottom-up, least common denominator approach: Paradigm synthesis
initiated on technology/process level based on ‘best match’ decisions. Even though a
technology-induced reengineering of lean is performed, disregarding the paradigms’
methods and principles may lead to problems at the long-term oriented, strategic level. The
prime example and source of this chapter are fast digitisation gains with technologies with
little potential for development and thus outdated in a long-term Industry 4.0 strategy.
Figure 40: Unidirectional and bottom-up approach as a result of operational visibility of methods and technologies.
The problems arising from (I) and (II) are shown in figure 40 and demonstrate the need of a
holistic view of both paradigms in the development of a procedure model. The
conceptualisation therefore refers to the holistic perspective of established Enterprise
Architecture Frameworks (EAF) and incorporates the accomplishments of Henderson and
Venkatraman’s (1993) Strategic Alignment Model. The latter requires the strategic adaptation
of business and IT strategy to processes and infrastructure as well as the functional integration
of IT and business. The corresponding top-down approach starts with a synchronisation at the
principle level and enables further synchronisation on the successive levels of methods and
technologies (see EAF business-, application-, and technology view). At the principle level
(resp. concept level), supra-principles such as the elimination of waste can remain
unchallenged, while sub-principles compete. The resulting consensus allows synchronisation at
the method level without methods that use outdated principles. Conducted methods that exist
on both sides, however, must be revalidated, possibly combined or discarded if outdated.
Technology or tools must then essentially serve the consolidated method base and be evaluated
under the considerations given with the maturity model (e.g., trajectory). figure 41 outlines the
explanations on the holistic procedure model. The completion of each process step within the
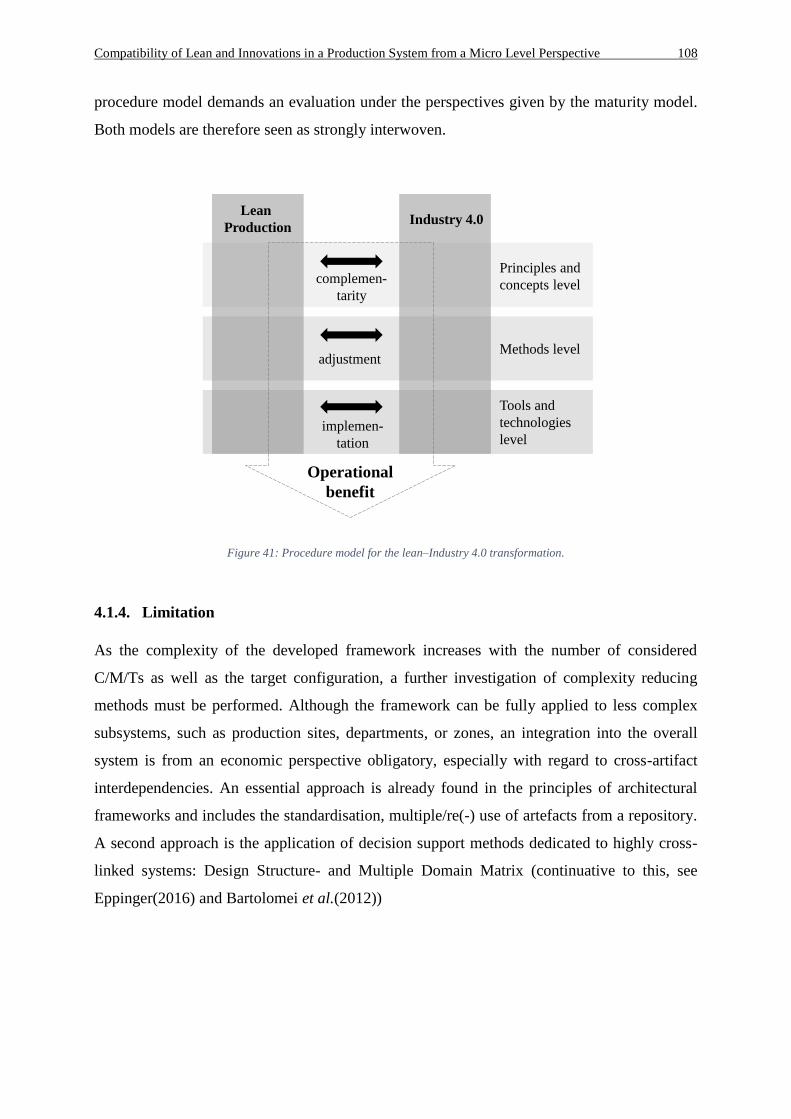
Compatibility of Lean and Innovations in a Production System from a Micro Level Perspective 108
procedure model demands an evaluation under the perspectives given by the maturity model.
Both models are therefore seen as strongly interwoven.
Figure 41: Procedure model for the lean–Industry 4.0 transformation.
4.1.4. Limitation
As the complexity of the developed framework increases with the number of considered
C/M/Ts as well as the target configuration, a further investigation of complexity reducing
methods must be performed. Although the framework can be fully applied to less complex
subsystems, such as production sites, departments, or zones, an integration into the overall
system is from an economic perspective obligatory, especially with regard to cross-artifact
interdependencies. An essential approach is already found in the principles of architectural
frameworks and includes the standardisation, multiple/re(-) use of artefacts from a repository.
A second approach is the application of decision support methods dedicated to highly cross-
linked systems: Design Structure- and Multiple Domain Matrix (continuative to this, see
Eppinger(2016) and Bartolomei et al.(2012))
implemen-
tation
adjustment
complemen-
tarity
Principles and
concepts level
Methods level
Tools and
technologies
level
Operational
benefit
Lean
ProductionIndustry 4.0
Compatibility of Lean and Innovations in a Production System from a Micro Level Perspective 109
4.1.5. Prospects
Building on the work of Spath et al.(2017) and Schuh et al.(2017), a model-based approach is
presented, which contributes to a complexity reduction for challenging decision-making at
transformation interfaces from lean to digitisation and Industry 4.0.
Perspectives given by the construction of the maturity model allow considerations of the
overall system- and target configuration at local/temporal operational decisions. Based on the
developed evaluation criteria, the decision-making process can be deployed as user-friendly.
The model recognises lean, in particular the standardisation of processes, as the basis for
Industry 4.0. With regard to open questions concerning the compatibility of lean and Industry
4.0 concerning, for example, decision processes and people centricity versus decentralised
responsibility through the use of artificial intelligence, further empirical validations of the
model must be conducted. A methodologically integrated application and the validation of the
model, in particular the operational evaluation criteria, will be subject to further examination
and published in following papers. Although the development of the framework was
dedicated to the integration of lean and Industry 4.0 paradigms, its generic structure also
allows for its application on transformation processes without a concrete paradigm reference.
Project, technology, and change management are mentioned here as exemplary at different
levels. A parameterisation or a further mathematical description of the model would allow use
for simulations. For this, the vector character of the model has to be elaborated. Further
investigations should also focus on the organisational and management perspective of the
subject matter in terms of employee centricity, as a success factor of the lean philosophy and a
major bias against digitisation and Industry 4.0. In addition, the ambidexterity of lean and
Industry 4.0 must be explored. With Industry 4.0 requiring standardised processes as a basis
for sensible crosslinking and automation on the one hand, as well as Industry 4.0 supporting
leanness by gathering process data to enhance the transparency within the production system
on the other hand, the chicken-and-egg problem becomes obvious. Thus, a further aspect that
needs to be explored within this transformational process is whether lean remains a basis of a
value-added production system and potentially only the tools are changing from, for example,
Ishikawa diagrams to advanced analytics or from Kanban to intelligent carriers.
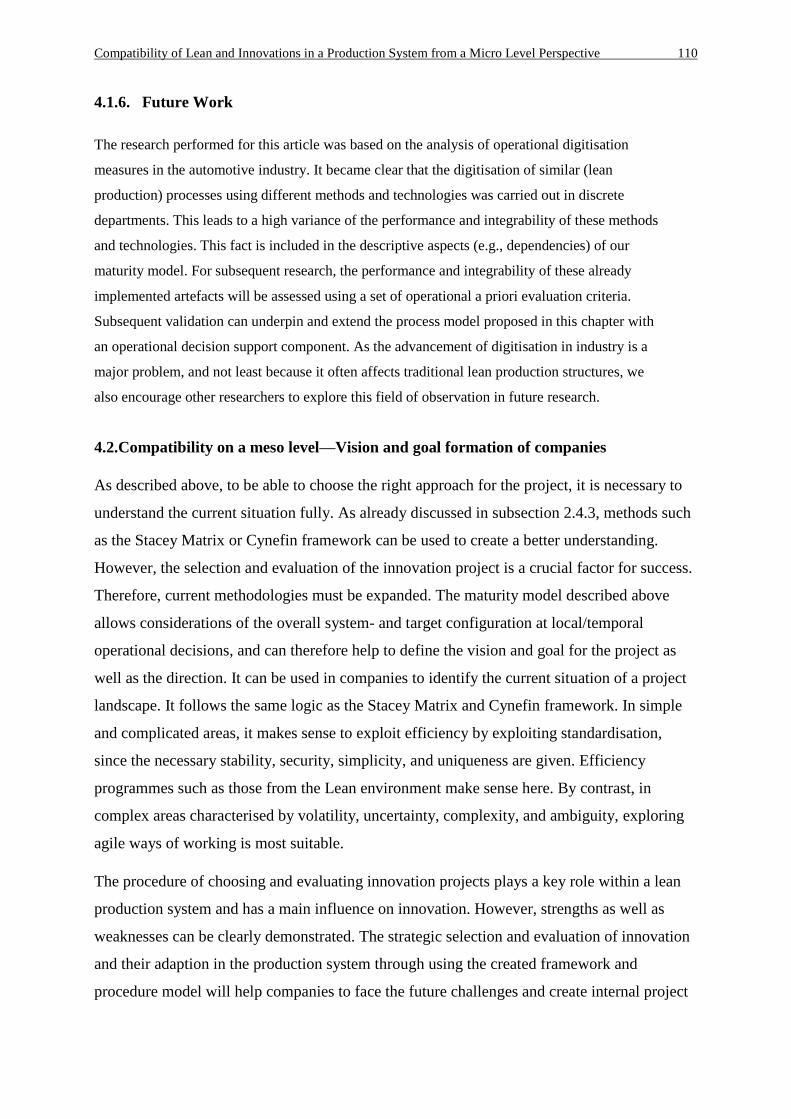
Compatibility of Lean and Innovations in a Production System from a Micro Level Perspective 110
4.1.6. Future Work
The research performed for this article was based on the analysis of operational digitisation
measures in the automotive industry. It became clear that the digitisation of similar (lean
production) processes using different methods and technologies was carried out in discrete
departments. This leads to a high variance of the performance and integrability of these methods
and technologies. This fact is included in the descriptive aspects (e.g., dependencies) of our
maturity model. For subsequent research, the performance and integrability of these already
implemented artefacts will be assessed using a set of operational a priori evaluation criteria.
Subsequent validation can underpin and extend the process model proposed in this chapter with
an operational decision support component. As the advancement of digitisation in industry is a
major problem, and not least because it often affects traditional lean production structures, we
also encourage other researchers to explore this field of observation in future research.
4.2.Compatibility on a meso level—Vision and goal formation of companies
As described above, to be able to choose the right approach for the project, it is necessary to
understand the current situation fully. As already discussed in subsection 2.4.3, methods such
as the Stacey Matrix or Cynefin framework can be used to create a better understanding.
However, the selection and evaluation of the innovation project is a crucial factor for success.
Therefore, current methodologies must be expanded. The maturity model described above
allows considerations of the overall system- and target configuration at local/temporal
operational decisions, and can therefore help to define the vision and goal for the project as
well as the direction. It can be used in companies to identify the current situation of a project
landscape. It follows the same logic as the Stacey Matrix and Cynefin framework. In simple
and complicated areas, it makes sense to exploit efficiency by exploiting standardisation,
since the necessary stability, security, simplicity, and uniqueness are given. Efficiency
programmes such as those from the Lean environment make sense here. By contrast, in
complex areas characterised by volatility, uncertainty, complexity, and ambiguity, exploring
agile ways of working is most suitable.
The procedure of choosing and evaluating innovation projects plays a key role within a lean
production system and has a main influence on innovation. However, strengths as well as
weaknesses can be clearly demonstrated. The strategic selection and evaluation of innovation
and their adaption in the production system through using the created framework and
procedure model will help companies to face the future challenges and create internal project

Compatibility of Lean and Innovations in a Production System from a Micro Level Perspective 111
structures to stay competitive. Not only project structures but also the people who are working
within them have to be understood and supported.
Thus, the meso level links the compatibility of lean and agile/innovation at the macro level, as
discussed in Chapter 3, but is influenced by the subordinate micro-level perspective, in which
the compatibility of lean and innovation on an individual level plays an important role. Thus,
it is the focus of the next chapter.
Compatibility of Lean and Innovations in a Production System from a Micro Level Perspective 112
5. Compatibility of Lean and Innovations in a Production System from a Micro Level
Perspective—Empirical Use Cases
In this chapter, the use of augmented reality (AR) with head-mounted displays (HMD) serves
as empirical validation to demonstrate the compatibility of lean and innovation under the aspect
of conducting innovation projects, taking lean principles into consideration. This use cases
serve as an example comparing traditional training in the automotive industry with new learning
approaches using AR-based technologies (using the example of the BMW Group’s VPS
Center/Lean Training).This will provide answers to how, at a micro level perspective, the
compatibility of lean and innovation at an individual level can be achieved.
5.1.Performance/execution of an innovation project using lean principles in production
training 4.018
The Value-added Production System (VPS) is BMW’s application of lean management
principles, methods, and mindset. It is furthermore the foundation of the BMW Production
System. To qualify employees within the theme of lean and offer a place where participants can
get in contact with the matter, the BMW Group founded a central VPS Center with the VPS
Learning factory for the production network in 2011. Contemporary existing solutions were
examined and a prototype was created that, after circuits of improving concept and content,
ended in a final set up and opening in 2012 at the BMW Group Academy in Munich. The main
focus of the installation is the qualification of management and lean experts within the
company. Since 2015, trainings are also offered to suppliers. To fulfil the kaizen mindset, the
VPS Learning factory pursues not only qualification targets but also research targets concerning
the continuous improvement of lean tools and methods.
On the 600 sqm of the VPS learning factory (Figure 42), the value stream of a heat protection
plate from the receipt of raw materials over pressing, welding, to assembling on the engine is
mapped. Because the engines are not sold, the parts are disassembled and returned to the
lifecycle of the VPS learning factory. This realistic learning setting serves as the environment
for the empirical validation of the consideration of lean principles in the successful
implementation of innovation/innovation projects.
18 Section 5.1. was created in coauthership by Lorber C. & Stäudel T. (2019) VPS Center. In: Abele, E., Metternich, J., Tisch,
M. (eds) Learning Factories. Concepts, Guidelines, Best-Practice Examples (Berlin: Springer), pp. 458-459.
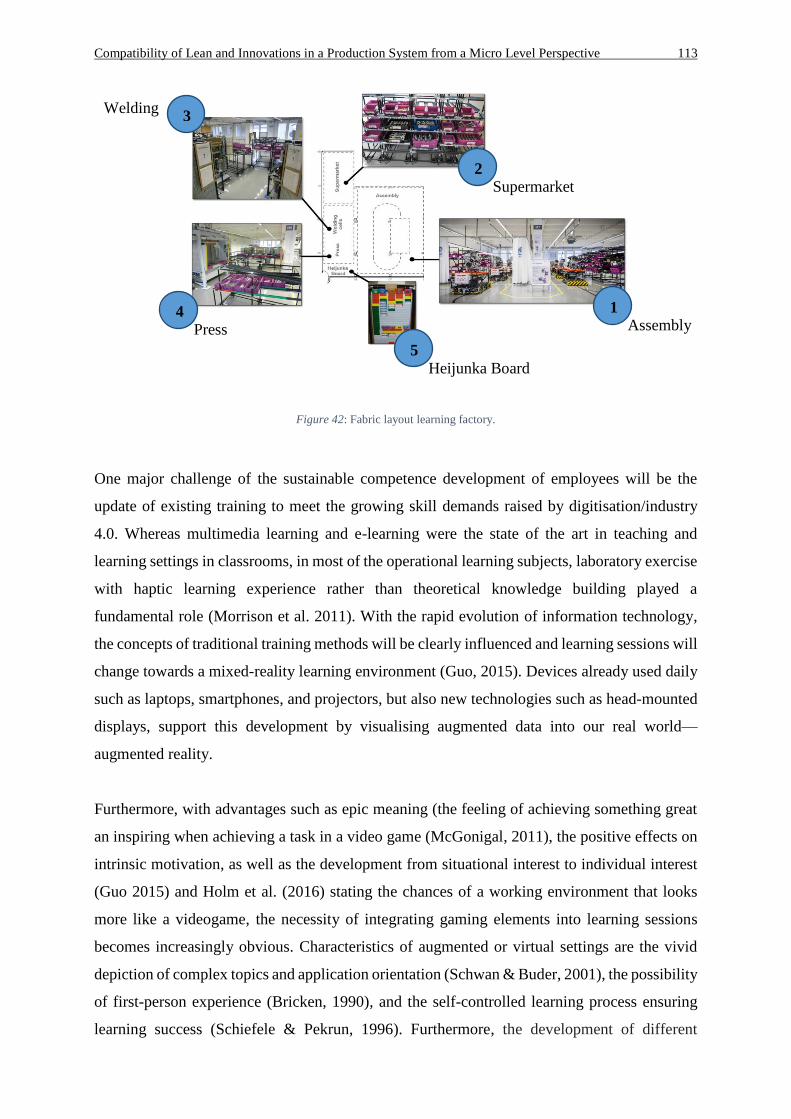
Compatibility of Lean and Innovations in a Production System from a Micro Level Perspective 113
Figure 42: Fabric layout learning factory.
One major challenge of the sustainable competence development of employees will be the
update of existing training to meet the growing skill demands raised by digitisation/industry
4.0. Whereas multimedia learning and e-learning were the state of the art in teaching and
learning settings in classrooms, in most of the operational learning subjects, laboratory exercise
with haptic learning experience rather than theoretical knowledge building played a
fundamental role (Morrison et al. 2011). With the rapid evolution of information technology,
the concepts of traditional training methods will be clearly influenced and learning sessions will
change towards a mixed-reality learning environment (Guo, 2015). Devices already used daily
such as laptops, smartphones, and projectors, but also new technologies such as head-mounted
displays, support this development by visualising augmented data into our real world—
augmented reality.
Furthermore, with advantages such as epic meaning (the feeling of achieving something great
an inspiring when achieving a task in a video game (McGonigal, 2011), the positive effects on
intrinsic motivation, as well as the development from situational interest to individual interest
(Guo 2015) and Holm et al. (2016) stating the chances of a working environment that looks
more like a videogame, the necessity of integrating gaming elements into learning sessions
becomes increasingly obvious. Characteristics of augmented or virtual settings are the vivid
depiction of complex topics and application orientation (Schwan & Buder, 2001), the possibility
of first-person experience (Bricken, 1990), and the self-controlled learning process ensuring
learning success (Schiefele & Pekrun, 1996). Furthermore, the development of different
Assembly 1
Supermarket 2
Press 4
Welding 3
Heijunka Board 5
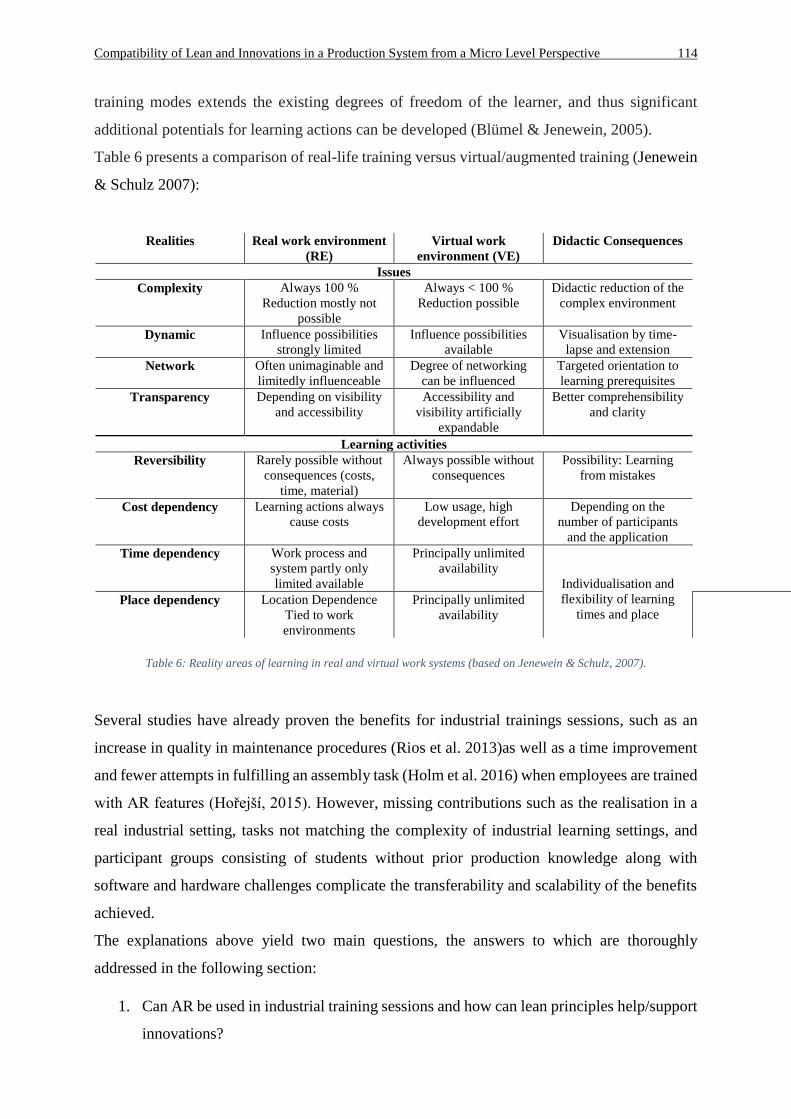
Compatibility of Lean and Innovations in a Production System from a Micro Level Perspective 114
training modes extends the existing degrees of freedom of the learner, and thus significant
additional potentials for learning actions can be developed (Blümel & Jenewein, 2005).
Table 6 presents a comparison of real-life training versus virtual/augmented training (Jenewein
& Schulz 2007):
Realities Real work environment
(RE)
Virtual work
environment (VE)
Didactic Consequences
Issues
Complexity Always 100 %
Reduction mostly not
possible
Always < 100 %
Reduction possible
Didactic reduction of the
complex environment
Dynamic Influence possibilities
strongly limited
Influence possibilities
available
Visualisation by time-
lapse and extension
Network Often unimaginable and
limitedly influenceable
Degree of networking
can be influenced
Targeted orientation to
learning prerequisites
Transparency Depending on visibility
and accessibility
Accessibility and
visibility artificially
expandable
Better comprehensibility
and clarity
Learning activities
Reversibility Rarely possible without
consequences (costs,
time, material)
Always possible without
consequences
Possibility: Learning
from mistakes
Cost dependency Learning actions always
cause costs
Low usage, high
development effort
Depending on the
number of participants
and the application
Time dependency Work process and
system partly only
limited available
Principally unlimited
availability
Individualisation and
flexibility of learning
times and place Place dependency Location Dependence
Tied to work
environments
Principally unlimited
availability
Table 6: Reality areas of learning in real and virtual work systems (based on Jenewein & Schulz, 2007).
Several studies have already proven the benefits for industrial trainings sessions, such as an
increase in quality in maintenance procedures (Rios et al. 2013)as well as a time improvement
and fewer attempts in fulfilling an assembly task (Holm et al. 2016) when employees are trained
with AR features (Hořejší, 2015). However, missing contributions such as the realisation in a
real industrial setting, tasks not matching the complexity of industrial learning settings, and
participant groups consisting of students without prior production knowledge along with
software and hardware challenges complicate the transferability and scalability of the benefits
achieved.
The explanations above yield two main questions, the answers to which are thoroughly
addressed in the following section:
1. Can AR be used in industrial training sessions and how can lean principles help/support
innovations?
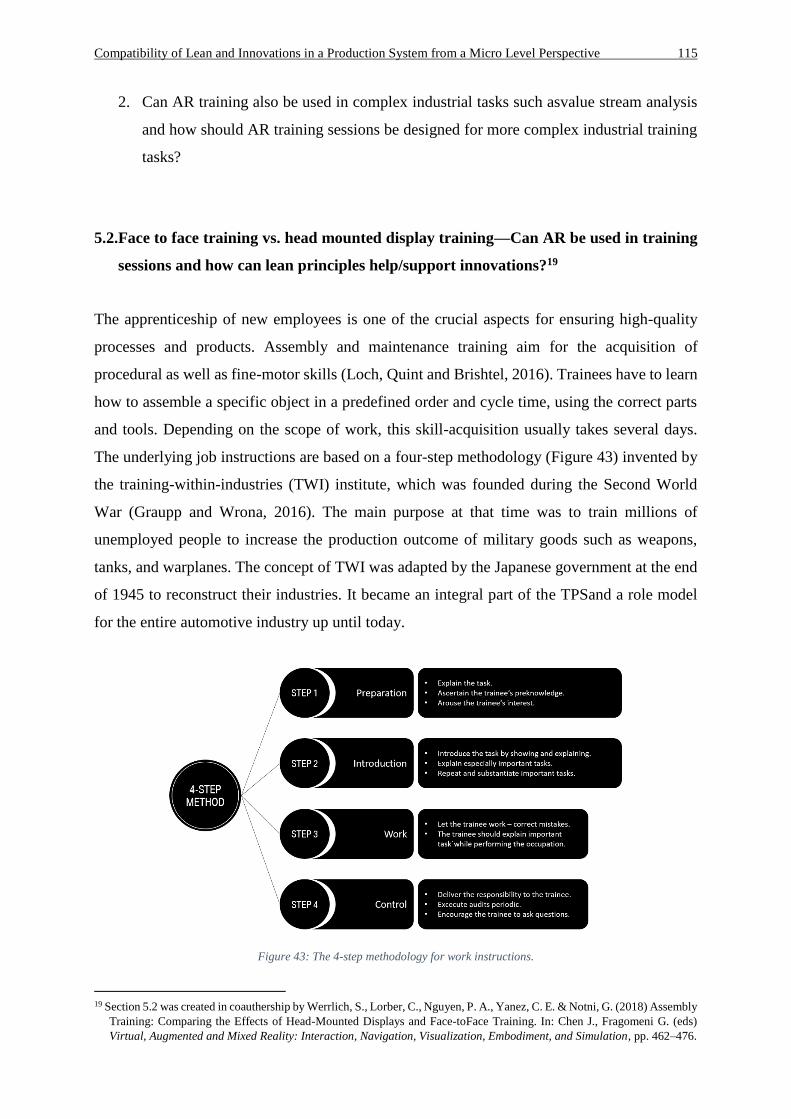
Compatibility of Lean and Innovations in a Production System from a Micro Level Perspective 115
2. Can AR training also be used in complex industrial tasks such asvalue stream analysis
and how should AR training sessions be designed for more complex industrial training
tasks?
5.2.Face to face training vs. head mounted display training—Can AR be used in training
sessions and how can lean principles help/support innovations?19
The apprenticeship of new employees is one of the crucial aspects for ensuring high-quality
processes and products. Assembly and maintenance training aim for the acquisition of
procedural as well as fine-motor skills (Loch, Quint and Brishtel, 2016). Trainees have to learn
how to assemble a specific object in a predefined order and cycle time, using the correct parts
and tools. Depending on the scope of work, this skill-acquisition usually takes several days.
The underlying job instructions are based on a four-step methodology (Figure 43) invented by
the training-within-industries (TWI) institute, which was founded during the Second World
War (Graupp and Wrona, 2016). The main purpose at that time was to train millions of
unemployed people to increase the production outcome of military goods such as weapons,
tanks, and warplanes. The concept of TWI was adapted by the Japanese government at the end
of 1945 to reconstruct their industries. It became an integral part of the TPSand a role model
for the entire automotive industry up until today.
Figure 43: The 4-step methodology for work instructions.
19 Section 5.2 was created in coauthership by Werrlich, S., Lorber, C., Nguyen, P. A., Yanez, C. E. & Notni, G. (2018) Assembly
Training: Comparing the Effects of Head-Mounted Displays and Face-toFace Training. In: Chen J., Fragomeni G. (eds)
Virtual, Augmented and Mixed Reality: Interaction, Navigation, Visualization, Embodiment, and Simulation, pp. 462–476.
Compatibility of Lean and Innovations in a Production System from a Micro Level Perspective 116
The first step aims to explain the task in detail while creating a pleasant work environment to
make the trainee feel comfortable. The trainer further arouses the trainee’s interest and
ascertains any prior knowledge. The second step represents the introduction to the task itself.
Demonstrating the task while showing and explaining important details, the trainer provides a
first overview and understanding of the occupation to the trainee. In the third phase, the trainee
starts working on and explaining the tasks while the trainer pays attention and makes corrections
in case of any mistakes. After repeating the work process several times, the trainee is able to
work independently. The trainer delivers full responsibility to the trainee and executes audits at
regular intervals.
This methodology is a standard procedure in the automotive industry and other industrial
domains, but not a contemporary one. Due to increasing globalisation and several causes for
migration, the world population is mixing. Naturally, this social phenomenon also affects the
entire workforce of a company. Employees of different origins and various language
backgrounds are required to work together in the same work environment. Depending on the
extent of a possible language barrier and the trainer’s pedagogical abilities, the learning time
and success vary between employees. In addition, a trainer is assigned to one and the same
trainee until the training is completed, which does not add value and should be reduced to a
minimum to save human resources. Furthermore, assembly training is realised during the actual
production at the assembly line, which provokes stress because of short cycle times. Most
trainees are not able to assemble a specific object in the given cycle time at the beginning of a
training session. The learning process takes mostly three to four days, depending on the task
complexity (Werrlich, Nitsche and Notni, 2017). Because of these reasons, assembly training
needs to be optimised. Therefore, AR is being introduced to the industrial domain and promises
to increase the efficiency and quality of procedural tasks. We present respective approaches in
the following sections.
5.2.1. AR-based training
Holm mentioned that it “(…) would be really good if we could create a working environment
looking more like a video game” (Holm, Adamson, Moore and Wang, 2016). Especially for
young people, who will be the future shop-floor operators, such fascinating work environments
become increasingly interesting. Established technologies such as laptops, smartphones, and
projectors as well as new technologies such as HMDs can support this idea by visualising
augmented data into our real world. These approaches not only affect our daily life but also
Compatibility of Lean and Innovations in a Production System from a Micro Level Perspective 117
promise to increase the efficiency and quality of procedural tasks, such as assembly training
tasks. Previous studies reinforcing this potential are presented in the following paragraphs.
A mobile solution using a tablet was developed by Rios et al. (2013) to enhance the
maintenance procedures of the Engine Air Bleed System on the Boeing 737. A study was
executed with 34 students comparing the impact of written instructions to those of AR features.
The assembly time and assembly quality were measured using a 46-point scale. Participants
performed 17.22% slower when using the AR learning approach but reached a quality
increment of 24% compared with the traditional method.
Another study (Hořejší, 2015) compared the effects of paper-based instructions to a screen-
based solution, where augmented instructions were presented on a screen at the workplace in
front of the participants. Twenty volunteers participated in each experimental group while the
assembly time was measured. Results indicated a two-minute time improvement for the first
attempt of assembling a gully trap compared with the paper-based method. Participants in the
AR group further were able to fully assemble the gully trap after 10 attempts; the other group
required 12 attempts, which indicated quicker learning success when using AR.
An experiment with 20participants compared HMD-based training with face-to-face training
(Gonzalez-Franco et al. 2017). A modified Oculus Rift HMD equipped with two additional
cameras was used as a video-see-through HMD. An aircraft maintenance task was chosen for
this study; 24 were randomly assigned to one of the two conditions using a between subject
design. Trainees had to perform a multiple choice questionnaire in order to assess how much
knowledge was retained during the training session. An additional second evaluation aimed to
gather the captured knowledge. All of the participants were asked to perform the task step by
step until completing the entire operation. Results indicated no significant differences between
both tests.
More evaluations using AR for assembly and maintenance training tasks were presented in
comprehensive contemporary surveys (Wang, Ong and Nee, 2016). Although AR’s potential
has been proven promising and the advantages seem obvious, it is not in practical use in the
automotive industry due to several scientific limitations (Werrlich, Eichstetter, Nitsche and
Notni, 2017):
Most of the assessments examining AR are realised under laboratory conditions.
Participants are mostly students without prior knowledge of assembly tasks.
Procedural tasks do not match the complexity of industrial assembly tasks.
Reliable comparisons between HMD-based and face-to-face training are still missing.
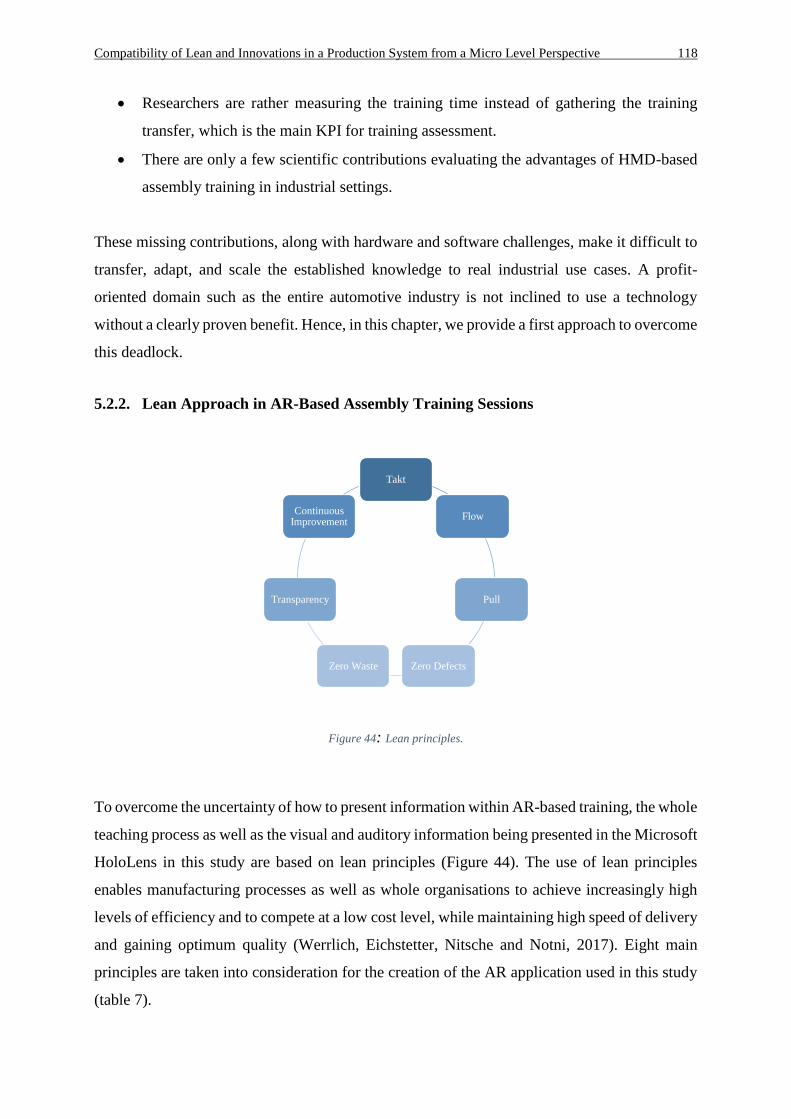
Compatibility of Lean and Innovations in a Production System from a Micro Level Perspective 118
Researchers are rather measuring the training time instead of gathering the training
transfer, which is the main KPI for training assessment.
There are only a few scientific contributions evaluating the advantages of HMD-based
assembly training in industrial settings.
These missing contributions, along with hardware and software challenges, make it difficult to
transfer, adapt, and scale the established knowledge to real industrial use cases. A profit-
oriented domain such as the entire automotive industry is not inclined to use a technology
without a clearly proven benefit. Hence, in this chapter, we provide a first approach to overcome
this deadlock.
5.2.2. Lean Approach in AR-Based Assembly Training Sessions
Figure 44: Lean principles.
To overcome the uncertainty of how to present information within AR-based training, the whole
teaching process as well as the visual and auditory information being presented in the Microsoft
HoloLens in this study are based on lean principles (Figure 44). The use of lean principles
enables manufacturing processes as well as whole organisations to achieve increasingly high
levels of efficiency and to compete at a low cost level, while maintaining high speed of delivery
and gaining optimum quality (Werrlich, Eichstetter, Nitsche and Notni, 2017). Eight main
principles are taken into consideration for the creation of the AR application used in this study
(table 7).
Takt
Flow
Pull
Zero DefectsZero Waste
Transparency
Continuous Improvement
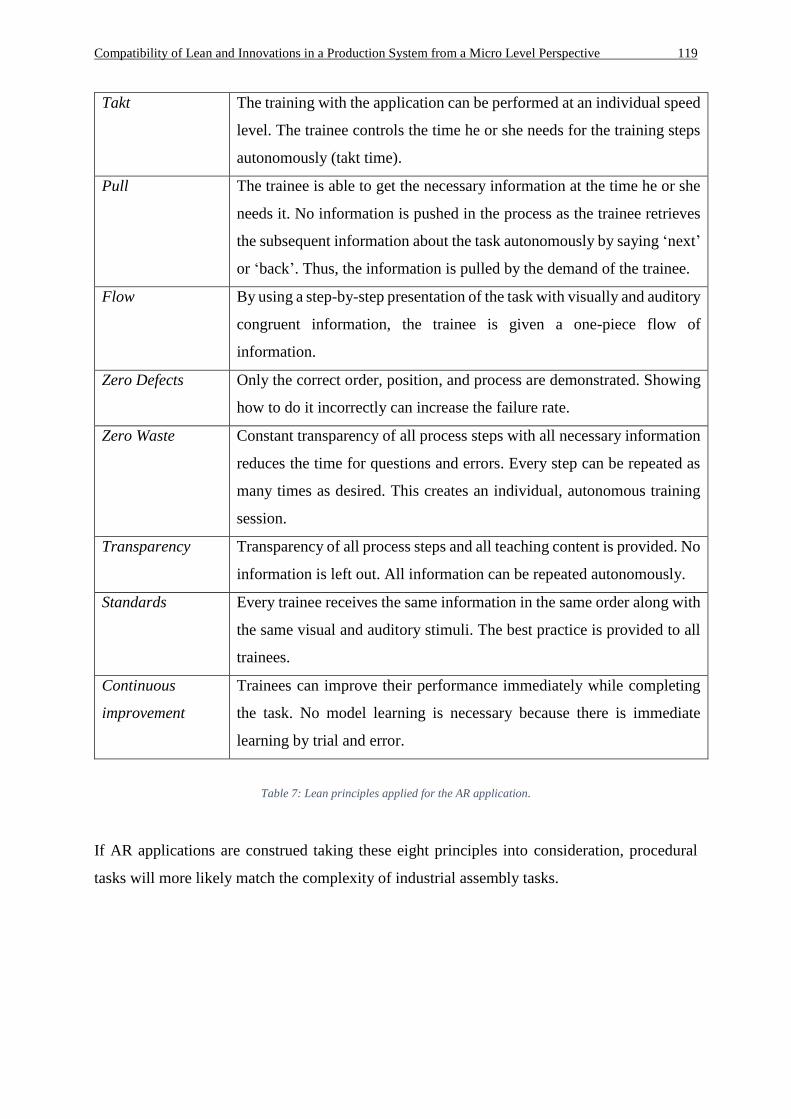
Compatibility of Lean and Innovations in a Production System from a Micro Level Perspective 119
Takt
The training with the application can be performed at an individual speed
level. The trainee controls the time he or she needs for the training steps
autonomously (takt time).
Pull
The trainee is able to get the necessary information at the time he or she
needs it. No information is pushed in the process as the trainee retrieves
the subsequent information about the task autonomously by saying ‘next’
or ‘back’. Thus, the information is pulled by the demand of the trainee.
Flow
By using a step-by-step presentation of the task with visually and auditory
congruent information, the trainee is given a one-piece flow of
information.
Zero Defects
Only the correct order, position, and process are demonstrated. Showing
how to do it incorrectly can increase the failure rate.
Zero Waste
Constant transparency of all process steps with all necessary information
reduces the time for questions and errors. Every step can be repeated as
many times as desired. This creates an individual, autonomous training
session.
Transparency
Transparency of all process steps and all teaching content is provided. No
information is left out. All information can be repeated autonomously.
Standards
Every trainee receives the same information in the same order along with
the same visual and auditory stimuli. The best practice is provided to all
trainees.
Continuous
improvement
Trainees can improve their performance immediately while completing
the task. No model learning is necessary because there is immediate
learning by trial and error.
Table 7: Lean principles applied for the AR application.
If AR applications are construed taking these eight principles into consideration, procedural
tasks will more likely match the complexity of industrial assembly tasks.
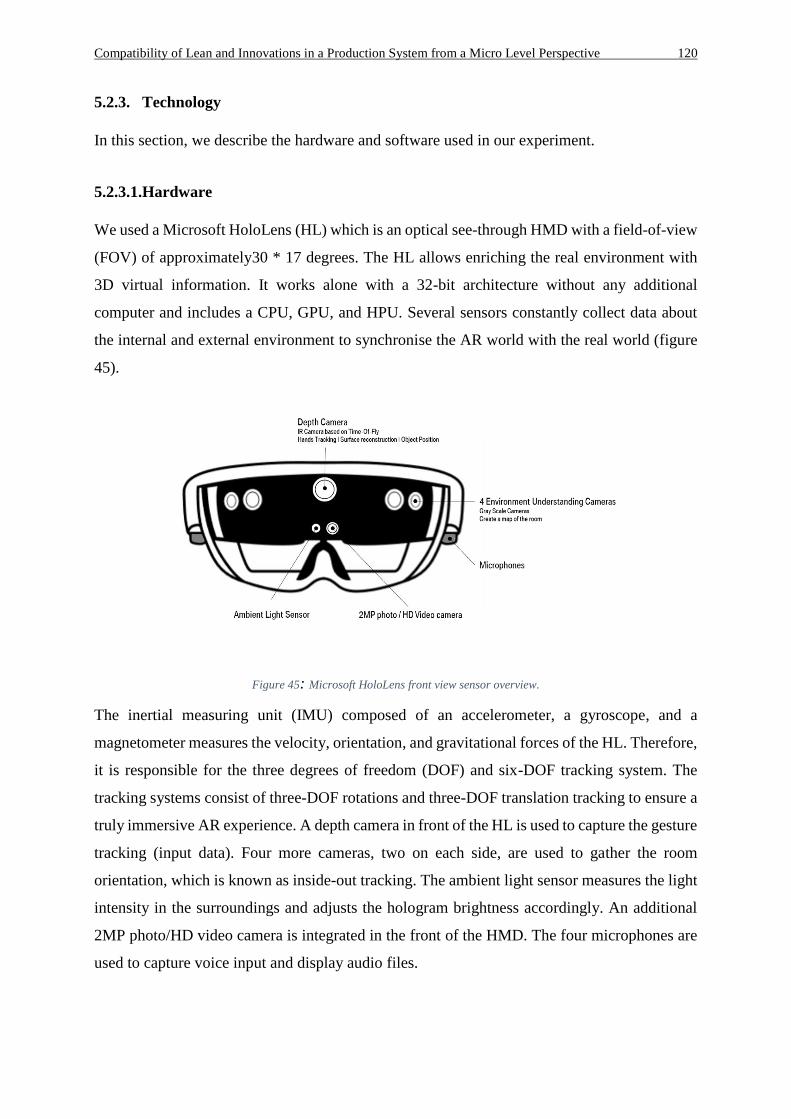
Compatibility of Lean and Innovations in a Production System from a Micro Level Perspective 120
5.2.3. Technology
In this section, we describe the hardware and software used in our experiment.
5.2.3.1.Hardware
We used a Microsoft HoloLens (HL) which is an optical see-through HMD with a field-of-view
(FOV) of approximately30 * 17 degrees. The HL allows enriching the real environment with
3D virtual information. It works alone with a 32-bit architecture without any additional
computer and includes a CPU, GPU, and HPU. Several sensors constantly collect data about
the internal and external environment to synchronise the AR world with the real world (figure
45).
Figure 45: Microsoft HoloLens front view sensor overview.
The inertial measuring unit (IMU) composed of an accelerometer, a gyroscope, and a
magnetometer measures the velocity, orientation, and gravitational forces of the HL. Therefore,
it is responsible for the three degrees of freedom (DOF) and six-DOF tracking system. The
tracking systems consist of three-DOF rotations and three-DOF translation tracking to ensure a
truly immersive AR experience. A depth camera in front of the HL is used to capture the gesture
tracking (input data). Four more cameras, two on each side, are used to gather the room
orientation, which is known as inside-out tracking. The ambient light sensor measures the light
intensity in the surroundings and adjusts the hologram brightness accordingly. An additional
2MP photo/HD video camera is integrated in the front of the HMD. The four microphones are
used to capture voice input and display audio files.
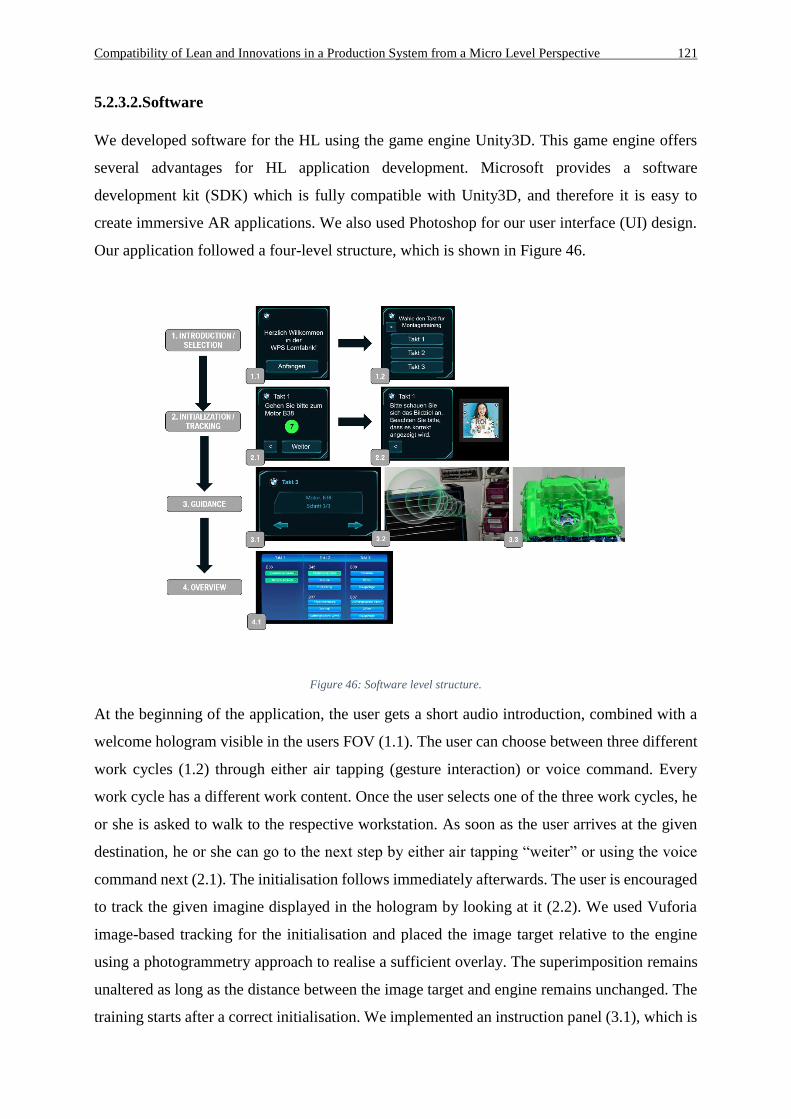
Compatibility of Lean and Innovations in a Production System from a Micro Level Perspective 121
5.2.3.2.Software
We developed software for the HL using the game engine Unity3D. This game engine offers
several advantages for HL application development. Microsoft provides a software
development kit (SDK) which is fully compatible with Unity3D, and therefore it is easy to
create immersive AR applications. We also used Photoshop for our user interface (UI) design.
Our application followed a four-level structure, which is shown in Figure 46.
Figure 46: Software level structure.
At the beginning of the application, the user gets a short audio introduction, combined with a
welcome hologram visible in the users FOV (1.1). The user can choose between three different
work cycles (1.2) through either air tapping (gesture interaction) or voice command. Every
work cycle has a different work content. Once the user selects one of the three work cycles, he
or she is asked to walk to the respective workstation. As soon as the user arrives at the given
destination, he or she can go to the next step by either air tapping “weiter” or using the voice
command next (2.1). The initialisation follows immediately afterwards. The user is encouraged
to track the given imagine displayed in the hologram by looking at it (2.2). We used Vuforia
image-based tracking for the initialisation and placed the image target relative to the engine
using a photogrammetry approach to realise a sufficient overlay. The superimposition remains
unaltered as long as the distance between the image target and engine remains unchanged. The
training starts after a correct initialisation. We implemented an instruction panel (3.1), which is
Compatibility of Lean and Innovations in a Production System from a Micro Level Perspective 122
always visible above the engine, where the user receives text-based instructions about the
current task. The user can go further or back by either air tapping the arrows or by using the
voice commands ‘next’ and ‘back’. We further implemented a Bezier curve (3.2), which was
recommended in [12] as a best-practice approach for guidance at picking tasks. The user
receives text information in the instruction panel, additional audio guidance and the Bezier
curve to pick the correct part from the shelf. This multimodal learning approach was
recommended in a previous study[13]. By saying ‘next’, the user gets to the next visual feature
which is a 3D virtual overlay (3.3) and helps to understand the part orientation and location.
After successfully assembling the part at the predefined location, the user can continue with the
next step.
Building a mental representation of a given procedural task was found to be critical for the
learning success (Loch, Quint, and Brishtel 2016). Therefore, we implemented an overview
panel (4.1) where the user receives information about finished, current, and upcoming tasks.
This holistic overview can help strengthen the mental model building.
The entire software was developed based on previous comprehensive demand analysis
(Werrlich, Nitsche and Notni, 2017), general software design guidelines according to the DIN
EN ISO 9241-110 [14], and domain specific recommendations (Ergonomics of human-system
interaction, 2006; Regenbrecht, Baratoff and Wilke, 2005). We evaluated this software product
in order to find weaknesses and compare this learning approach to the established face-to-face
training. The next chapter section describes our methodology in detail.
5.2.4. User Study
We conducted a user study with 36 participants to compare the effects of HMD-based assembly
training with traditional face-to-face training. This section describes the study design, explains
the procedure, introduces the hardware setup, gives detailed information about the participants,
and reports the results of our measurements.
5.2.4.1.Design
We used a repeated measure experiment as a study design with one independent variable,
namely instructions given by a person (group A) compared with instructions given by an
augmented reality application (group B), to test the following hypotheses:
H0: No significant difference exists between face-to-face training and AR-to-face training.
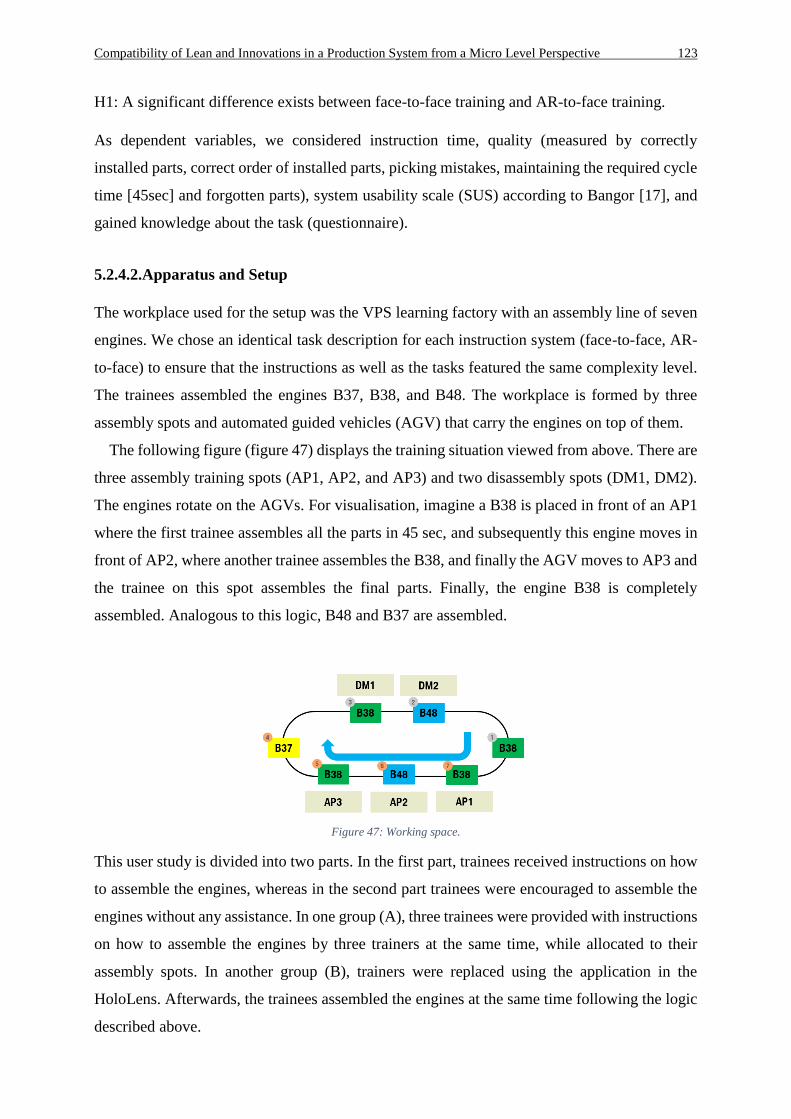
Compatibility of Lean and Innovations in a Production System from a Micro Level Perspective 123
H1: A significant difference exists between face-to-face training and AR-to-face training.
As dependent variables, we considered instruction time, quality (measured by correctly
installed parts, correct order of installed parts, picking mistakes, maintaining the required cycle
time [45sec] and forgotten parts), system usability scale (SUS) according to Bangor [17], and
gained knowledge about the task (questionnaire).
5.2.4.2.Apparatus and Setup
The workplace used for the setup was the VPS learning factory with an assembly line of seven
engines. We chose an identical task description for each instruction system (face-to-face, AR-
to-face) to ensure that the instructions as well as the tasks featured the same complexity level.
The trainees assembled the engines B37, B38, and B48. The workplace is formed by three
assembly spots and automated guided vehicles (AGV) that carry the engines on top of them.
The following figure (figure 47) displays the training situation viewed from above. There are
three assembly training spots (AP1, AP2, and AP3) and two disassembly spots (DM1, DM2).
The engines rotate on the AGVs. For visualisation, imagine a B38 is placed in front of an AP1
where the first trainee assembles all the parts in 45 sec, and subsequently this engine moves in
front of AP2, where another trainee assembles the B38, and finally the AGV moves to AP3 and
the trainee on this spot assembles the final parts. Finally, the engine B38 is completely
assembled. Analogous to this logic, B48 and B37 are assembled.
Figure 47: Working space.
This user study is divided into two parts. In the first part, trainees received instructions on how
to assemble the engines, whereas in the second part trainees were encouraged to assemble the
engines without any assistance. In one group (A), three trainees were provided with instructions
on how to assemble the engines by three trainers at the same time, while allocated to their
assembly spots. In another group (B), trainers were replaced using the application in the
HoloLens. Afterwards, the trainees assembled the engines at the same time following the logic
described above.
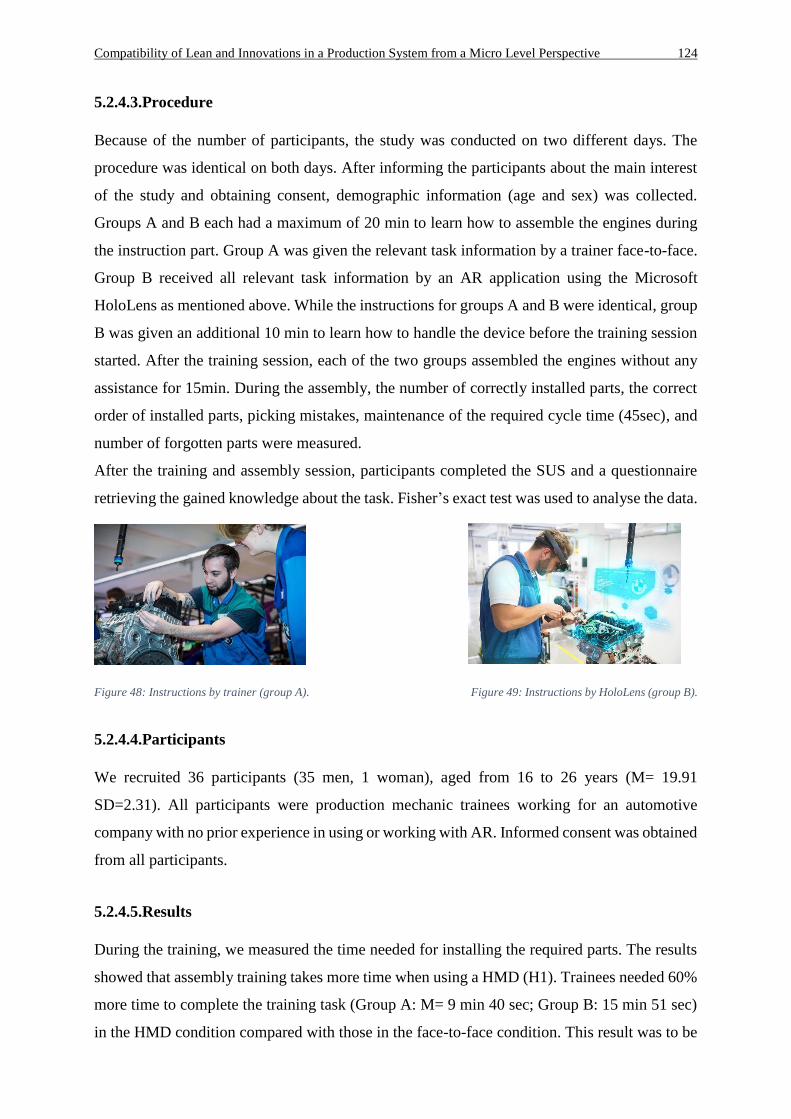
Compatibility of Lean and Innovations in a Production System from a Micro Level Perspective 124
5.2.4.3.Procedure
Because of the number of participants, the study was conducted on two different days. The
procedure was identical on both days. After informing the participants about the main interest
of the study and obtaining consent, demographic information (age and sex) was collected.
Groups A and B each had a maximum of 20 min to learn how to assemble the engines during
the instruction part. Group A was given the relevant task information by a trainer face-to-face.
Group B received all relevant task information by an AR application using the Microsoft
HoloLens as mentioned above. While the instructions for groups A and B were identical, group
B was given an additional 10 min to learn how to handle the device before the training session
started. After the training session, each of the two groups assembled the engines without any
assistance for 15min. During the assembly, the number of correctly installed parts, the correct
order of installed parts, picking mistakes, maintenance of the required cycle time (45sec), and
number of forgotten parts were measured.
After the training and assembly session, participants completed the SUS and a questionnaire
retrieving the gained knowledge about the task. Fisher’s exact test was used to analyse the data.
Figure 48: Instructions by trainer (group A). Figure 49: Instructions by HoloLens (group B).
5.2.4.4.Participants
We recruited 36 participants (35 men, 1 woman), aged from 16 to 26 years (M= 19.91
SD=2.31). All participants were production mechanic trainees working for an automotive
company with no prior experience in using or working with AR. Informed consent was obtained
from all participants.
5.2.4.5.Results
During the training, we measured the time needed for installing the required parts. The results
showed that assembly training takes more time when using a HMD (H1). Trainees needed 60%
more time to complete the training task (Group A: M= 9 min 40 sec; Group B: 15 min 51 sec)
in the HMD condition compared with those in the face-to-face condition. This result was to be
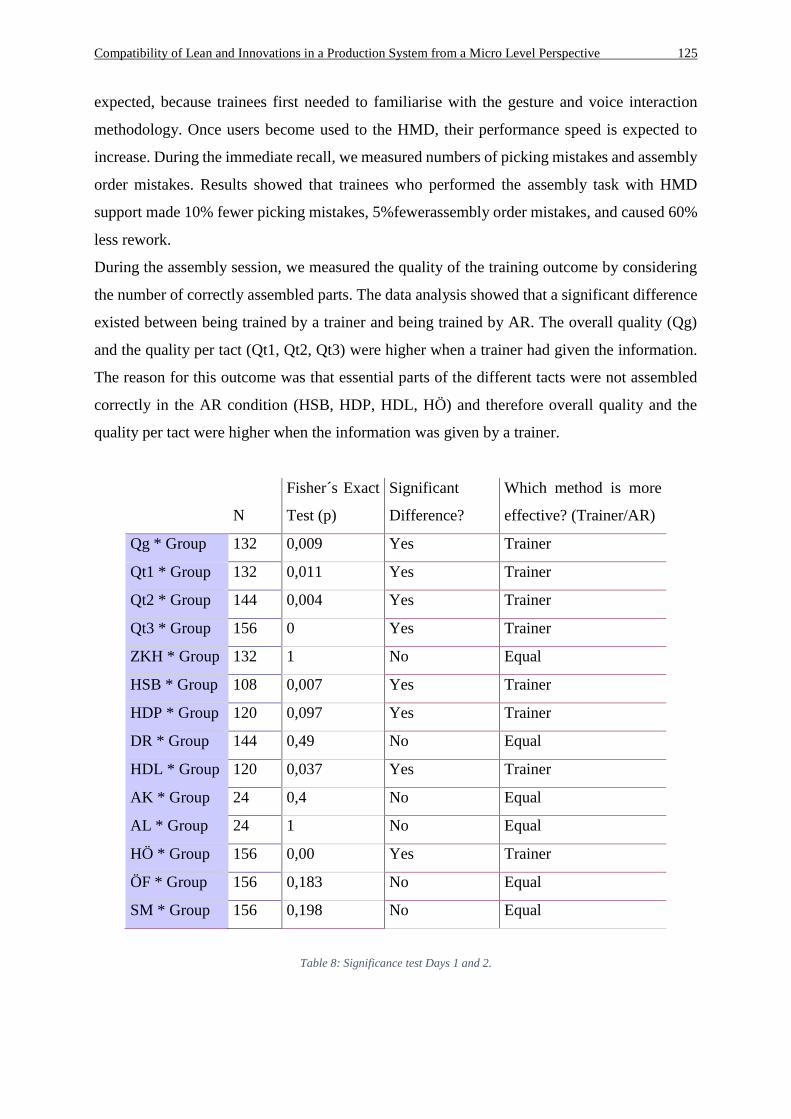
Compatibility of Lean and Innovations in a Production System from a Micro Level Perspective 125
expected, because trainees first needed to familiarise with the gesture and voice interaction
methodology. Once users become used to the HMD, their performance speed is expected to
increase. During the immediate recall, we measured numbers of picking mistakes and assembly
order mistakes. Results showed that trainees who performed the assembly task with HMD
support made 10% fewer picking mistakes, 5%fewerassembly order mistakes, and caused 60%
less rework.
During the assembly session, we measured the quality of the training outcome by considering
the number of correctly assembled parts. The data analysis showed that a significant difference
existed between being trained by a trainer and being trained by AR. The overall quality (Qg)
and the quality per tact (Qt1, Qt2, Qt3) were higher when a trainer had given the information.
The reason for this outcome was that essential parts of the different tacts were not assembled
correctly in the AR condition (HSB, HDP, HDL, HÖ) and therefore overall quality and the
quality per tact were higher when the information was given by a trainer.
N
Fisher´s Exact
Test (p)
Significant
Difference?
Which method is more
effective? (Trainer/AR)
Qg * Group 132 0,009 Yes Trainer
Qt1 * Group 132 0,011 Yes Trainer
Qt2 * Group 144 0,004 Yes Trainer
Qt3 * Group 156 0 Yes Trainer
ZKH * Group 132 1 No Equal
HSB * Group 108 0,007 Yes Trainer
HDP * Group 120 0,097 Yes Trainer
DR * Group 144 0,49 No Equal
HDL * Group 120 0,037 Yes Trainer
AK * Group 24 0,4 No Equal
AL * Group 24 1 No Equal
HÖ * Group 156 0,00 Yes Trainer
ÖF * Group 156 0,183 No Equal
SM * Group 156 0,198 No Equal
Table 8: Significance test Days 1 and 2.
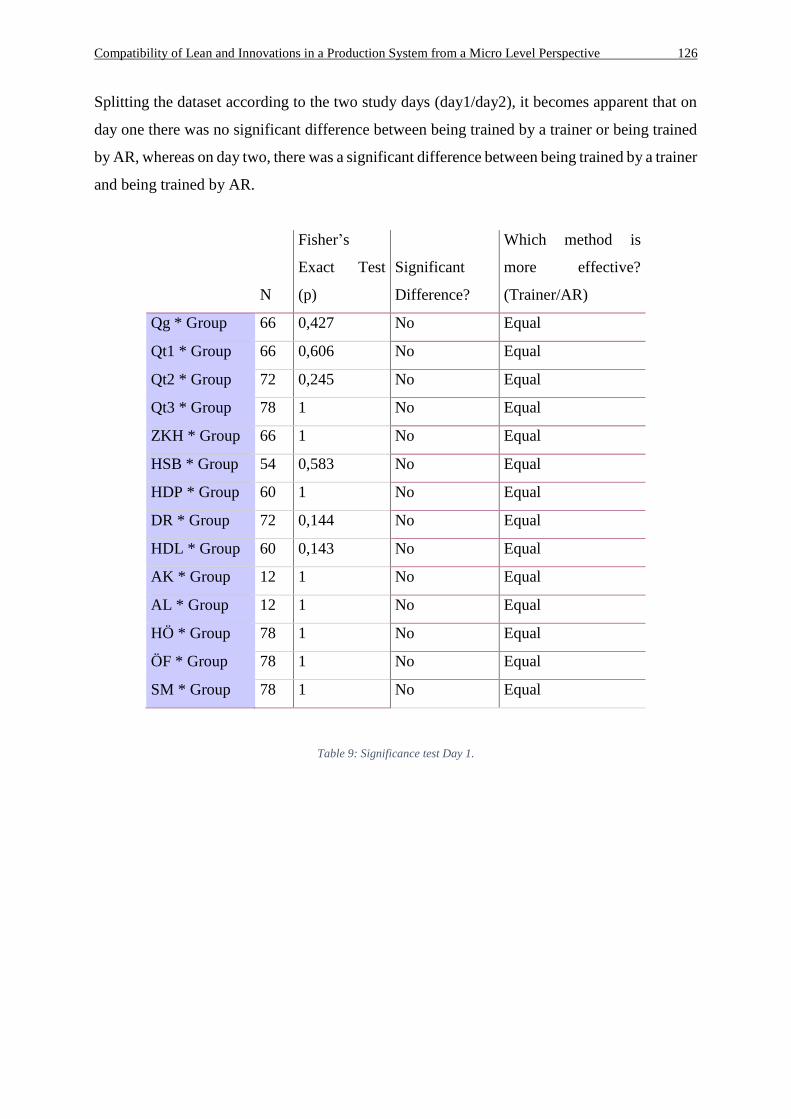
Compatibility of Lean and Innovations in a Production System from a Micro Level Perspective 126
Splitting the dataset according to the two study days (day1/day2), it becomes apparent that on
day one there was no significant difference between being trained by a trainer or being trained
by AR, whereas on day two, there was a significant difference between being trained by a trainer
and being trained by AR.
N
Fisher’s
Exact Test
(p)
Significant
Difference?
Which method is
more effective?
(Trainer/AR)
Qg * Group 66 0,427 No Equal
Qt1 * Group 66 0,606 No Equal
Qt2 * Group 72 0,245 No Equal
Qt3 * Group 78 1 No Equal
ZKH * Group 66 1 No Equal
HSB * Group 54 0,583 No Equal
HDP * Group 60 1 No Equal
DR * Group 72 0,144 No Equal
HDL * Group 60 0,143 No Equal
AK * Group 12 1 No Equal
AL * Group 12 1 No Equal
HÖ * Group 78 1 No Equal
ÖF * Group 78 1 No Equal
SM * Group 78 1 No Equal
Table 9: Significance test Day 1.
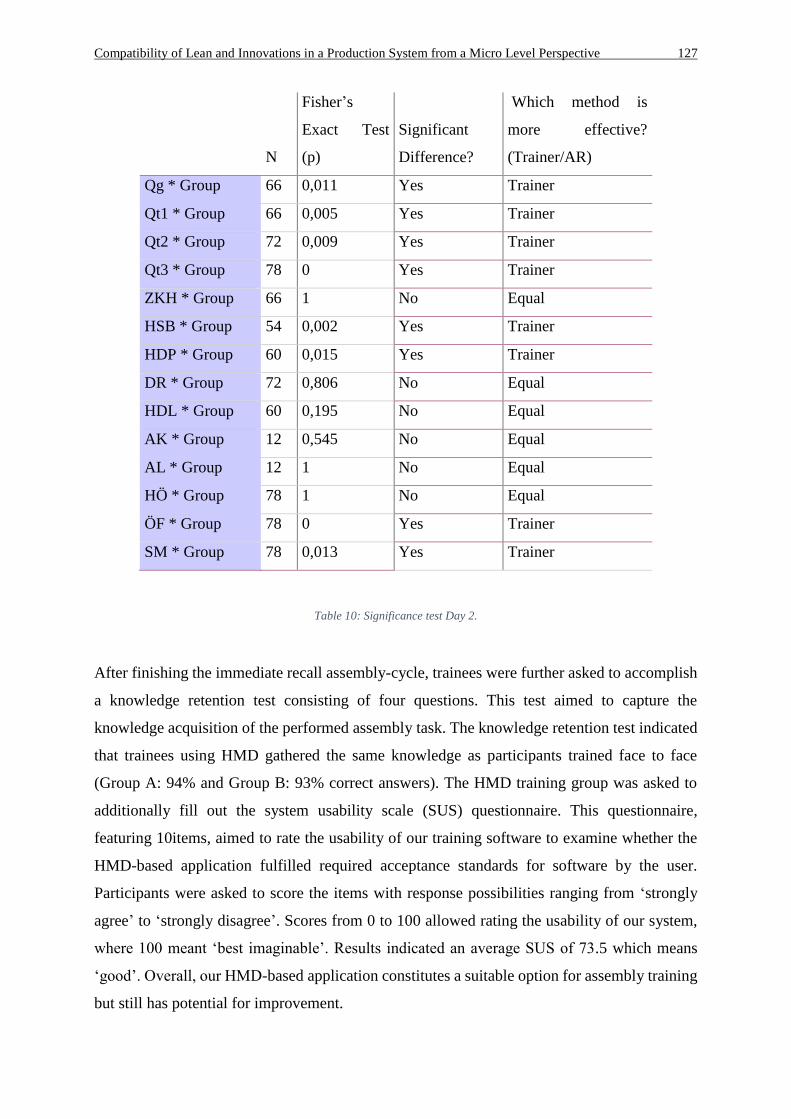
Compatibility of Lean and Innovations in a Production System from a Micro Level Perspective 127
N
Fisher’s
Exact Test
(p)
Significant
Difference?
Which method is
more effective?
(Trainer/AR)
Qg * Group 66 0,011 Yes Trainer
Qt1 * Group 66 0,005 Yes Trainer
Qt2 * Group 72 0,009 Yes Trainer
Qt3 * Group 78 0 Yes Trainer
ZKH * Group 66 1 No Equal
HSB * Group 54 0,002 Yes Trainer
HDP * Group 60 0,015 Yes Trainer
DR * Group 72 0,806 No Equal
HDL * Group 60 0,195 No Equal
AK * Group 12 0,545 No Equal
AL * Group 12 1 No Equal
HÖ * Group 78 1 No Equal
ÖF * Group 78 0 Yes Trainer
SM * Group 78 0,013 Yes Trainer
Table 10: Significance test Day 2.
After finishing the immediate recall assembly-cycle, trainees were further asked to accomplish
a knowledge retention test consisting of four questions. This test aimed to capture the
knowledge acquisition of the performed assembly task. The knowledge retention test indicated
that trainees using HMD gathered the same knowledge as participants trained face to face
(Group A: 94% and Group B: 93% correct answers). The HMD training group was asked to
additionally fill out the system usability scale (SUS) questionnaire. This questionnaire,
featuring 10items, aimed to rate the usability of our training software to examine whether the
HMD-based application fulfilled required acceptance standards for software by the user.
Participants were asked to score the items with response possibilities ranging from ‘strongly
agree’ to ‘strongly disagree’. Scores from 0 to 100 allowed rating the usability of our system,
where 100 meant ‘best imaginable’. Results indicated an average SUS of 73.5 which means
‘good’. Overall, our HMD-based application constitutes a suitable option for assembly training
but still has potential for improvement.
Compatibility of Lean and Innovations in a Production System from a Micro Level Perspective 128
In this study, we compared two different methods of how to train an assembly task (face-to-
face vs. AR-to-face). We built an application for a real engine assembly training task and tested
the effects on time, quality, picking mistakes, assembly order mistakes, rework, and knowledge
retention. The significant quality differences between the two study days could be traced backed
to several influencing factors. First, possible process instabilities with regard to the training
process itself could have caused these differences. Using HMDs influenced the training
preparation, training conduct, and training follow-up. Furthermore the face-to-face training
process was well known by the trainer because it has been performed for several years, whereas
the AR training process had only been performed for a few months. Therefore, not every process
step in the AR training was performed as fluently as in the face-to-face training. Second,
individual differences in using communication and information technology and the personal
motivation in using new technologies could also affect the variable quality.
In conclusion, it seems AR-based training can be an alternative to face-to-face training but still
retains some weaknesses that could not entirely be overcome by including lean principles into
to the application. Considering future work, we want to improve our application by providing
more user control, adding gamification elements, offering different user modes ranging from a
tutorial level to an expert level, and using multimodal information as well as various feedback
modalities. Furthermore, we plan to conduct more user studies using a more complex assembly
training tasks.
5.3. Value stream analysis—Can AR training also be used in complex tasks such as value
stream analysis and how should AR training sessions be designed for more complex
industrial training tasks?
This section deals with the following question if and how AR training ca be used effectively in
complex industrial tasks and how the AR training sessions should be designed for more
complex industrial training tasks to achieve the best results. As an example an AR based
Training for value stream analysis will be used to answer the questions empirically.
5.3.1. AR-Based Value Stream Analysis
The term ‘value stream’ describes all stations with associated processes and actions that a
product or service undergoes from the supplier to the customer. Value stream analysis/value
stream design is one of the most important elements in a lean production system with a focus
on improving all processes of a company. In the value stream analysis, the current state of a
Compatibility of Lean and Innovations in a Production System from a Micro Level Perspective 129
process is detected and visualised, whereas in a value stream design the target process is
presented. The value stream analysis is the basis for optimising a process by reducing waste
(Rother and Schook, 2009).
The central idea of value stream analysis is always to take the customer’s point of view,
because the customer determines the requirements for the production as a whole and for each
individual production process. The value stream is based on the customer and defines added
value and waste exclusively due to its needs (Erlach, 2010). With rising digitisation, the
customer perspective is moving even further towards the centre. While in the common value
stream the customer had no or just a little contact with the different stations within the value
stream, the digitisation of products and processes allows an interaction between both. At each
station, customer-specific demand can be included as well as different information displayed
along the production process, such as the current state of completion, test results, or
instructions for the future product utilisation (Hartmann, Meudt, Seifermann and Metternich,
2018).
The goal is to enable a continuous product flow with the shortest throughput time. However,
not all activities within a process increase the value of a service or product. Value-adding
activities are those activities that increase the value of a product or service from the
customer’s perspective. Non-value-added activities are those activities that are currently being
performed, although they do not increase the value from the customer’s perspective. The
elimination, reduction, or simplification of non-value-added activities in the development of
the target state are essential in the value stream design. The value stream analysis creates a
high level of transparency of the process flows. Clearly recognisable are the processes that do
not contribute to value creation (waste/non-value-adding activities). The value stream analysis
is used in addition to the identification of waste mainly for the presentation of delivery and
lead times (Rother and Schook, 2009; Erlacher, 2010).Whereas information in this classic
view of waste within the value stream was used primarily for production control, with new
upcoming methods for collecting and analysing data, information flows play an even more
important role and must be designed efficiently. Today, information flow is not only used for
production control but also for preventing equipment downtime and the interpretation of real-
time data. Therefore, it must have a reasonably defined usage to prevent waste (Hartmann,
Meudt, Seifermann and Metternich, 2018).
Every process participant has different ideas about a process. It is crucial to find a common
language and a common understanding of the current and future process. To know the true
Compatibility of Lean and Innovations in a Production System from a Micro Level Perspective 130
state of the process, there is no need for discussions at the desk. It is essential to go the
production area and watch the process (Hartmann, Meudt, Seifermann and Metternich, 2018).
5.3.2. Lean Approach in AR-Based Value Stream Analysis Training
The agile mindset has found its way into the corporate strategy, with business model innovation
and lean startup. To protect themselves from the digital disruption of their business models,
established companies adapt the innovation methods of lean startup and business model
innovation for their innovation projects as previously described in Chapter 4. However, how
can traditional methods of lean management such as value stream analysis and design cope with
these upcoming methods? The management of ideas and visual design as well as iterative
prototyping and design thinking are in their basic understanding not counterpoints to the classic
lean principles of pull, takt, flow, zero contraction, and so on. Meaningful use and interaction
of these approaches must be forced by companies to cope with future market and industry
challenges. Moreover, not only must a rethinking of traditional production methods be made to
innovative approaches on the production side, but also the currently used training methods of
lean management must be accompanied by technological progress and new thinking.
In contrast to the previously mentioned use case, the focus hereafter does not lie on taking lean
principles into account during the creation of the application, but on using new
technology/innovation to display lean methods.
5.3.3. Technology—Hardware and Software
In this section, we describe the hardware and software used in our experiment. The study was
conducted with the HL as already described in detail in subsection5.1.3.2.Again, the software
for the HL was the game engine Unity3D. Our application followed the same four-level
structure, which is shown in Figure 50.
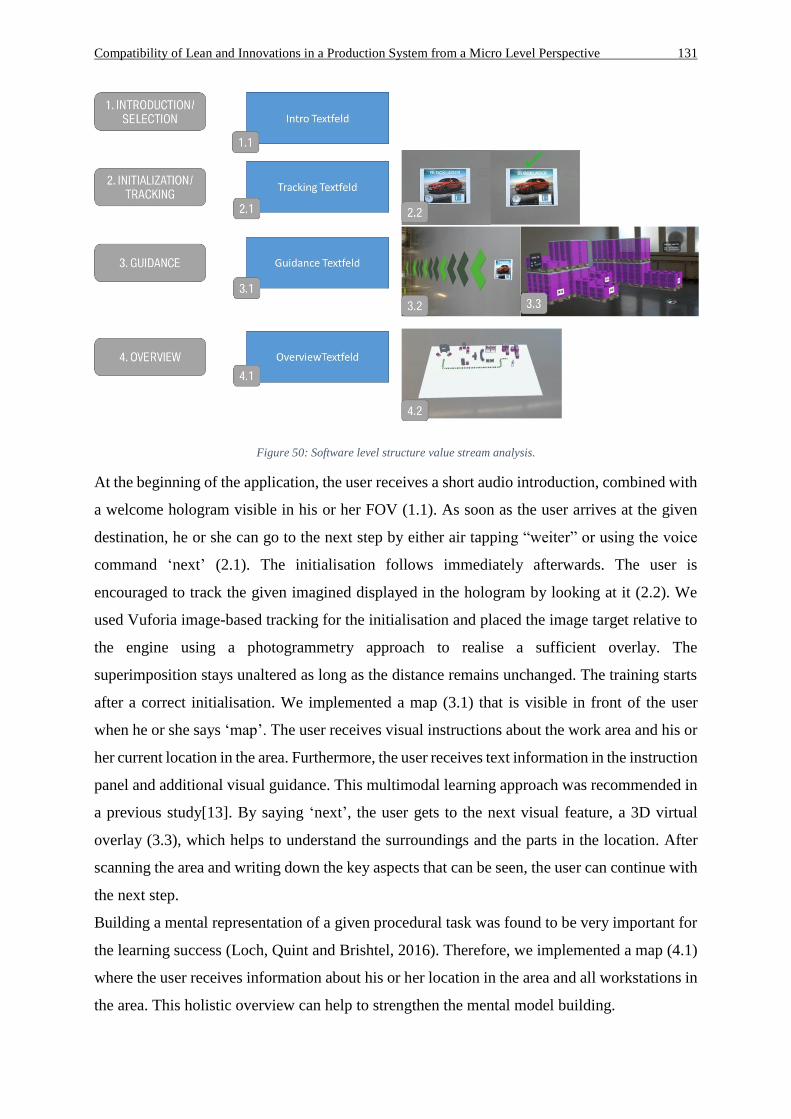
Compatibility of Lean and Innovations in a Production System from a Micro Level Perspective 131
Figure 50: Software level structure value stream analysis.
At the beginning of the application, the user receives a short audio introduction, combined with
a welcome hologram visible in his or her FOV (1.1). As soon as the user arrives at the given
destination, he or she can go to the next step by either air tapping “weiter” or using the voice
command ‘next’ (2.1). The initialisation follows immediately afterwards. The user is
encouraged to track the given imagined displayed in the hologram by looking at it (2.2). We
used Vuforia image-based tracking for the initialisation and placed the image target relative to
the engine using a photogrammetry approach to realise a sufficient overlay. The
superimposition stays unaltered as long as the distance remains unchanged. The training starts
after a correct initialisation. We implemented a map (3.1) that is visible in front of the user
when he or she says ‘map’. The user receives visual instructions about the work area and his or
her current location in the area. Furthermore, the user receives text information in the instruction
panel and additional visual guidance. This multimodal learning approach was recommended in
a previous study[13]. By saying ‘next’, the user gets to the next visual feature, a 3D virtual
overlay (3.3), which helps to understand the surroundings and the parts in the location. After
scanning the area and writing down the key aspects that can be seen, the user can continue with
the next step.
Building a mental representation of a given procedural task was found to be very important for
the learning success (Loch, Quint and Brishtel, 2016). Therefore, we implemented a map (4.1)
where the user receives information about his or her location in the area and all workstations in
the area. This holistic overview can help to strengthen the mental model building.
Compatibility of Lean and Innovations in a Production System from a Micro Level Perspective 132
The entire software was developed based on previous comprehensive demand analysis
(Werrlich, Nitsche and Notni, 2017), general software design guidelines according to the DIN
EN ISO 9241-110 [14], and domain-specific recommendations (Ergonomics of human-system
interaction, 2006; Regenbrecht, Baratoff and Wilke, 2005).We evaluated this software product
to find weaknesses and compare this learning approach with the established face-to-face
training. The next section describes our methodology in detail.
5.3.4. User Study
We conducted a user study with nine experts to analyse how the app needed to be designed and
optimised for the training sessions. The aim was to identify formative weaknesses through a
formal-analytical procedure and inspection method (walkthrough) and to optimise the
method/application based on these results. The basis for this was the generated qualitative data.
The following subsections describe the study design, explain the procedure, introduce the
hardware setup, provide detailed information about the participants, and report the results.
5.3.4.1.Design
A qualitative study design was employed by conducting expert based evaluation in combination
with walkthroughs. For this usability evaluation technique, experts were chosen based on their
special knowledge and experience resulting from their specific functions within the
organisation (Dünser, Grasset, Billinghurst, 2009).Obtaining answers for the following
hypotheses was the main focus of the interviews:
H0: AR cannot be used in a reasonable way for the value stream analysis training without any
limitations/influence on ergonomic aspects, information intake, and interaction.
H1: AR can be used in a reasonable way for the value stream analysis training without any
limitations/influence on ergonomic aspects, information intake, and interaction.
5.3.4.2.Apparatus and Setup
The application starts with an introduction to provide the user with an understanding of the task
and individual voice commands.
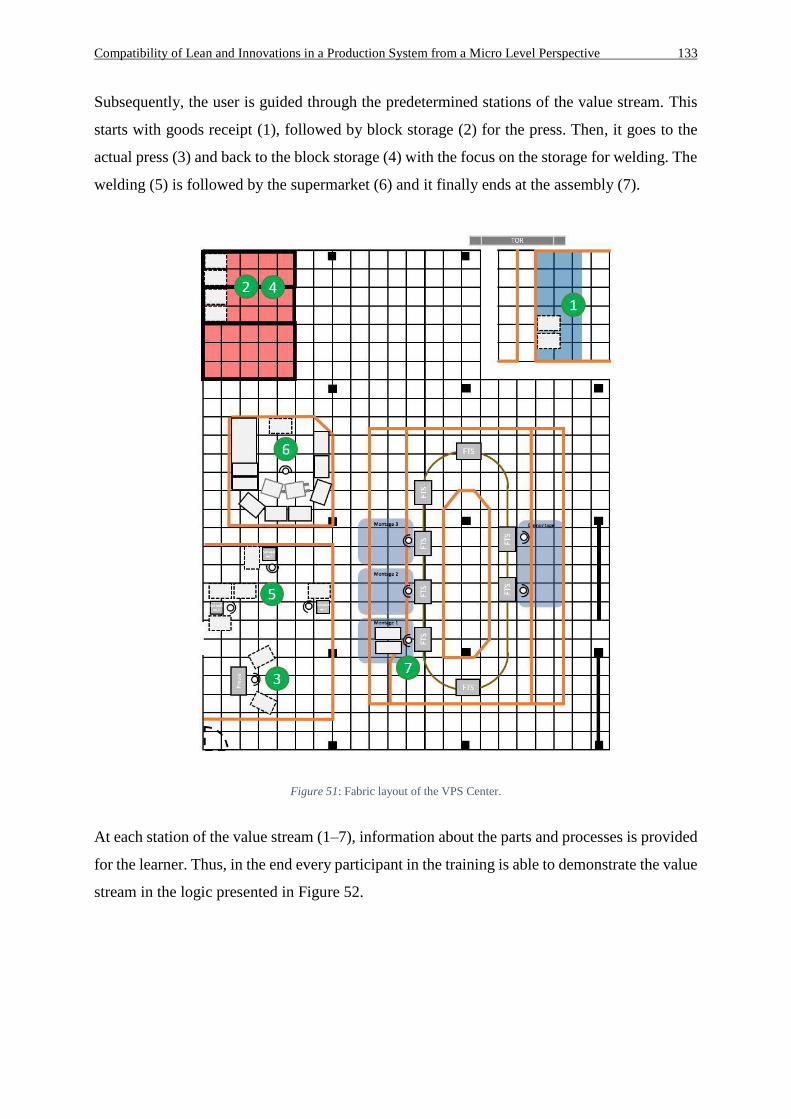
Compatibility of Lean and Innovations in a Production System from a Micro Level Perspective 133
Subsequently, the user is guided through the predetermined stations of the value stream. This
starts with goods receipt (1), followed by block storage (2) for the press. Then, it goes to the
actual press (3) and back to the block storage (4) with the focus on the storage for welding. The
welding (5) is followed by the supermarket (6) and it finally ends at the assembly (7).
Figure 51: Fabric layout of the VPS Center.
At each station of the value stream (1–7), information about the parts and processes is provided
for the learner. Thus, in the end every participant in the training is able to demonstrate the value
stream in the logic presented in Figure 52.
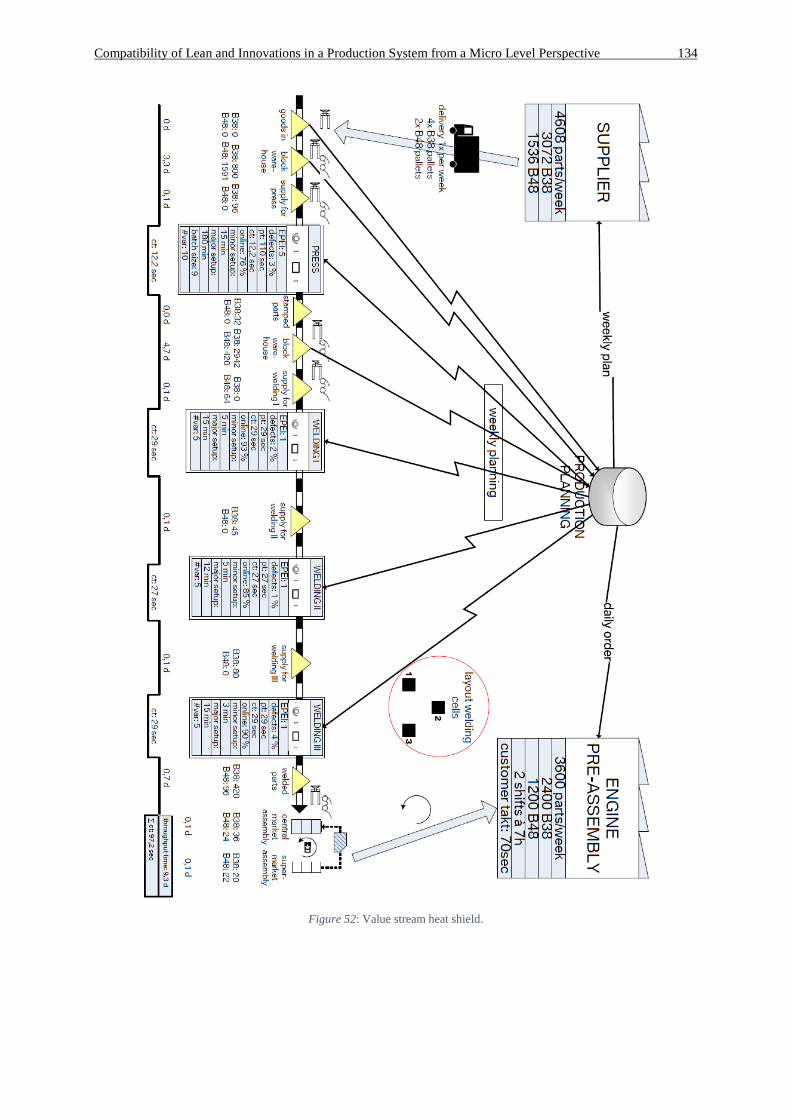
Compatibility of Lean and Innovations in a Production System from a Micro Level Perspective 134
Figure 52: Value stream heat shield.
Compatibility of Lean and Innovations in a Production System from a Micro Level Perspective 135
5.3.4.3.Procedure
A total of three expert groups tested the value stream application with the HL. The interviews
were conducted with the think-aloud method while testing the application in the VPS Center
Training area. All sessions were recorded and influencing or disruptive factors were noted by
the interviewers.
The interview was semi-structured focusing on the five main categories of ergonomics,
instructions, interaction, information take in, and general usability. The interviews with the
expert groups were conducted on three different days and every session lasted 1 hour and 30
minutes.
5.3.4.4.Participants
A total of nine experts tested the application, comprising six men and three woman aged from
27 to 60 years. Group A consisted of two IT specialists of the BMW Group having at least 5
years’ experience in AR applications and AR training; Group B consisted of three consulting
experts of the BMW Group who conduct value stream analysis and design projects on a daily
basis in the organisation; and Group C consisted of four VPS trainers of the BMW Group who
conduct lean management trainings on a daily basis. Therefore, Group A evaluated the
application methodology from a technological point of view; Group B evaluated it from a
practitioner/methodologist point of view; and Group C evaluated it from a training point of
view.
5.3.4.5.Results
As a result of the interviews, the various experiences of the experts regarding value stream
projects, AR-technology, and training resulted in five influencing factors (ergonomics,
instructions, interaction, information take in, and general usability), so-called fields of action
that, in regard to the transfer process in the training session may have a driving or inhibiting
effect. Below, the fields of action are named and their meaning, conduct, and optimisation are
briefly described.
Ergonomics. One of the most crucial factors that must be taken into consideration while
creating an application is the ergonomic aspect. Typical for AR applications is the so-called
simulator sickness, motion or cyber sickness that can occur while using HMDs. Symptoms such
as nausea or/and visual-induced dizziness appear while wearing an HMD, because the virtual
Compatibility of Lean and Innovations in a Production System from a Micro Level Perspective 136
image cannot adapt to the head movement of the user in real time (Biocca, 1992;Dörner &
Steinicke, 2013).
The large size of the training area as well as the high number of virtual objects that must be
displayed by the HL led to several ergonomic limitations. First, based on tracking problems
when placing objects into the real world, the visual objects were distorted and flickering
(Groups A and B). Second, getting used to seeing virtual elements needs time. Perception in
general includes the interpretation of information in a reasonable way for the individual to react
to their surroundings (Malim, 1994).
Third, the limited field of view is a problem in large training areas because the head must be
moved even more often, and that extra head movement results in the aforementioned motion
sickness symptoms.
In addition, the weight of the HMD in combination with the wearing duration of 60 minutes
was mentioned as a negative ergonomic aspect (Groups A and B). In particular, the guidance
arrows on the floor intensified this feeling.
As a solution, the guidance arrows were placed higher to eliminate looking at the floor to reduce
strain on the back, neck, and shoulders. In addition, the training concept was customised in a
way that participants were not wearing the HL for the whole training session but were able to
take it off every 10–15 minutes. A high intensity and contrast of colours used, for example, on
the white map and magenta boxes were minimised to decrease intensity on the eyes.
Instruction. The user only benefits from the application if he or she understands what to do.
Therefore, the structure of the application as presented in figure 50 is one of the most vital
aspects. Instructions can be divided into three main categories—textual, visual, and acoustic
(Brough, Schwartz and Gupta, 2007).
Textual: A well-maintained home screen, a so-called intro, can thus be of great use to introduce
the user to the functionality of the application. Experience has shown that it is often the case
that overly-long running texts are only skimmed over by users because they simply do not want
to have to read a lot within the application.
Visual: The timely display of a microphone symbol reminds the user of the voice commands
and provides guidance in the application. In addition, the display of arrows to move from one
learning station to another is featured to ensure guidance in the application.
Compatibility of Lean and Innovations in a Production System from a Micro Level Perspective 137
Acoustic: For example, an audio file can be played at the welding station, which tells the
participant which welding cell should now be started (Ackermann, 2018). Furthermore,
acoustic instructions always depend on the environment in which the application is used. Since
the volume level in the WPS centre is relatively low, the instructions would be clear; however,
it may still happen that audio instructions are easily overheard.
Only the combination of textual, visual, and acoustic instructions achieves the best effect and
increases the attention of the participants.
Interaction. Game-based learning is already commonplace in schools and can be beneficial in
training situations as well (Werrlich, et al., 2018). Human–device interactions are a critical issue
in AR knowledge. While most people are willing to learn new knowledge, they want to have
more fun during training because these sessions often take a lot of time and are designed to be
very serious. To implement these gamification elements that create a playful effect for the
participant, green glowing animated arrows on the ground were realised in the value stream
app, which were regarded as ‘very good’ (Schilberg, 2018) as well as ‘cool’ (Nguyen, 2018).
Within the training area, however, the pathfinding must be well-engineered and optimally
functioning so that under no circumstances is it possible for participants get into areas that are
not part of the training session. The animation of the arrows was seen as a first good start but,
to create an even more playful impression, a pathfinding solution should be added and the
arrows that have already been passed should be virtually deleted, which was suggested by
Group A. The first version of this more playful interaction is the creation of a virtual route train
guiding the user from the supermarket to the assembly, responding to the movements of the
participant. The route train as a signpost was very well received across groups, especially by
Group A (Nguyen, 2018) and was even referred to as ‘unbelievable’ (Group B). One should,
however, make sure that the route train remains within the field of vision while following it. If
necessary, it should only show the way symbolically to reduce head movements and to protect
the neck again (Group B).
The mini-map schematically shows a miniature version of the layout of the training area of the
value stream. Users receive a top view and locate themselves immediately in the value stream
on the basis of a tiny avatar. Expert group B suggested additional information, such as
measurements, to what extent the individual stations stand apart from each other, and that the map
should not only represent the value stream schematically but also display the complete layout of the
area, including ancillary areas that have nothing to do with the value stream to obtain the overall
picture, providing more information to the user. Thus, the learner is integrated into the virtual
Compatibility of Lean and Innovations in a Production System from a Micro Level Perspective 138
world in the first-person perspective and as an avatar, the graphical counterpart of the user in
the virtual world. The presentation as an avatar promotes the presence experience of the learner
(Slater & Usoh, 1993).
To convey the processes and information at individual stations even more playfully, pressing
equipment, virtual and animated employees should be implemented at the station; for example,
removing the parts from the corresponding boxes to machines (Group B). In addition the
process times should be taken into account, such that the virtual employee really takes the time
and the participant receives and controls this information (Group C). This would enhance the
first-person experience and depict the complexity of the task. Adding to this a background
noise, which is typically present within a factory, should be played (in a certain volume) in the
glasses to generate an even more immersive experience (Group C). This enhances the principle
of sensory scaling, in which directly perceptible sensory impressions (e.g., sound) can be
directly experienced by subjects by being transformed into perceptible stimuli (e.g., by setting
noise; Jenewein & Hundt, 2009).
Regardless of gamification elements, the AR application needs to be designed to receive
positive feedback, which is realised with an acoustic positive confirmation sound in the
application. This sound was seen as very helpful by Group A.
Furthermore, a help command should be integrated that can be called at any time. The most
intuitive method for the participant to call this function would be by means of the voice
command ‘Help’ (Group A). Information that is not familiar to the participant should have a
small help button that displays a window with more detailed explanations after selection. With
a high number of participants, it may occur that individuals do not dare to ask something. This
is useful, for example, for abbreviations in machine descriptions of the systems, as they should
not simply be written out. This is justified by the fact that in reality they are also abbreviated in
the respective data boxes of the machines (Group B).
Information intake. Using AR technology, it is possible to create learning environments that
are impossible to implement with conventional training strategies, and therefore stand out from
traditional pedagogical approaches (Kozma, 1991). In connection with augmented learning
environments participants are regarded as active information processors (Reinmann-Rothmeier
& Mandl, 1998) (constructive instruction theories: Kontogiannis, 1999, Schaper, 2000). The
acquisition of knowledge and skills is a result of a targeted examination of the learning content.
Using AR, virtual objects can be faded into the user’s field of vision in a way that they appear
to be actually present. One main focus of the value stream application is to keep the
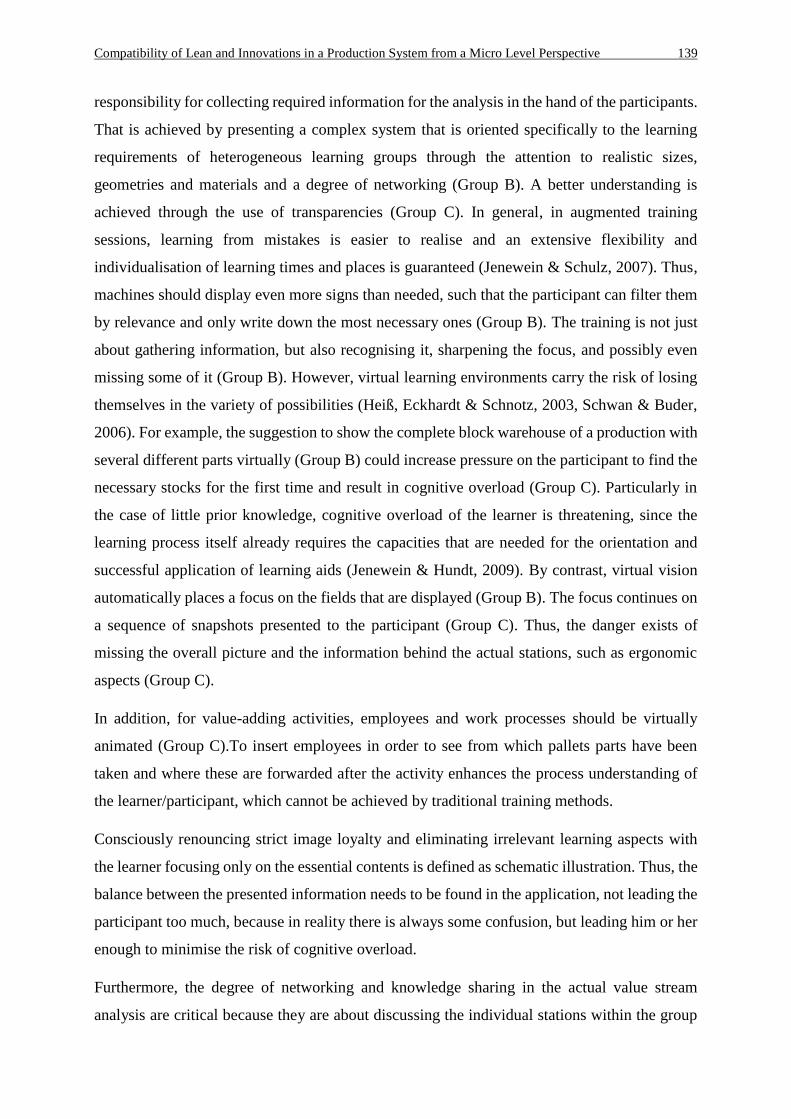
Compatibility of Lean and Innovations in a Production System from a Micro Level Perspective 139
responsibility for collecting required information for the analysis in the hand of the participants.
That is achieved by presenting a complex system that is oriented specifically to the learning
requirements of heterogeneous learning groups through the attention to realistic sizes,
geometries and materials and a degree of networking (Group B). A better understanding is
achieved through the use of transparencies (Group C). In general, in augmented training
sessions, learning from mistakes is easier to realise and an extensive flexibility and
individualisation of learning times and places is guaranteed (Jenewein & Schulz, 2007). Thus,
machines should display even more signs than needed, such that the participant can filter them
by relevance and only write down the most necessary ones (Group B). The training is not just
about gathering information, but also recognising it, sharpening the focus, and possibly even
missing some of it (Group B). However, virtual learning environments carry the risk of losing
themselves in the variety of possibilities (Heiß, Eckhardt & Schnotz, 2003, Schwan & Buder,
2006). For example, the suggestion to show the complete block warehouse of a production with
several different parts virtually (Group B) could increase pressure on the participant to find the
necessary stocks for the first time and result in cognitive overload (Group C). Particularly in
the case of little prior knowledge, cognitive overload of the learner is threatening, since the
learning process itself already requires the capacities that are needed for the orientation and
successful application of learning aids (Jenewein & Hundt, 2009). By contrast, virtual vision
automatically places a focus on the fields that are displayed (Group B). The focus continues on
a sequence of snapshots presented to the participant (Group C). Thus, the danger exists of
missing the overall picture and the information behind the actual stations, such as ergonomic
aspects (Group C).
In addition, for value-adding activities, employees and work processes should be virtually
animated (Group C).To insert employees in order to see from which pallets parts have been
taken and where these are forwarded after the activity enhances the process understanding of
the learner/participant, which cannot be achieved by traditional training methods.
Consciously renouncing strict image loyalty and eliminating irrelevant learning aspects with
the learner focusing only on the essential contents is defined as schematic illustration. Thus, the
balance between the presented information needs to be found in the application, not leading the
participant too much, because in reality there is always some confusion, but leading him or her
enough to minimise the risk of cognitive overload.
Furthermore, the degree of networking and knowledge sharing in the actual value stream
analysis are critical because they are about discussing the individual stations within the group
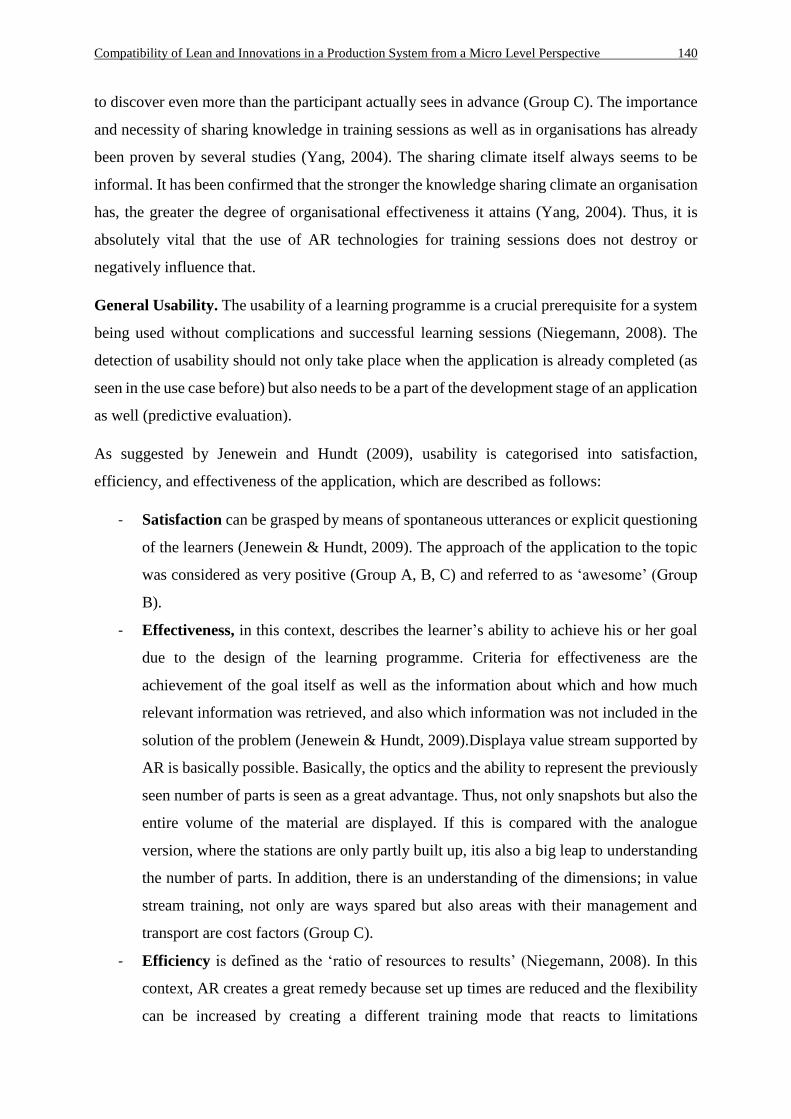
Compatibility of Lean and Innovations in a Production System from a Micro Level Perspective 140
to discover even more than the participant actually sees in advance (Group C). The importance
and necessity of sharing knowledge in training sessions as well as in organisations has already
been proven by several studies (Yang, 2004). The sharing climate itself always seems to be
informal. It has been confirmed that the stronger the knowledge sharing climate an organisation
has, the greater the degree of organisational effectiveness it attains (Yang, 2004). Thus, it is
absolutely vital that the use of AR technologies for training sessions does not destroy or
negatively influence that.
General Usability. The usability of a learning programme is a crucial prerequisite for a system
being used without complications and successful learning sessions (Niegemann, 2008). The
detection of usability should not only take place when the application is already completed (as
seen in the use case before) but also needs to be a part of the development stage of an application
as well (predictive evaluation).
As suggested by Jenewein and Hundt (2009), usability is categorised into satisfaction,
efficiency, and effectiveness of the application, which are described as follows:
- Satisfaction can be grasped by means of spontaneous utterances or explicit questioning
of the learners (Jenewein & Hundt, 2009). The approach of the application to the topic
was considered as very positive (Group A, B, C) and referred to as ‘awesome’ (Group
B).
- Effectiveness, in this context, describes the learner’s ability to achieve his or her goal
due to the design of the learning programme. Criteria for effectiveness are the
achievement of the goal itself as well as the information about which and how much
relevant information was retrieved, and also which information was not included in the
solution of the problem (Jenewein & Hundt, 2009).Displaya value stream supported by
AR is basically possible. Basically, the optics and the ability to represent the previously
seen number of parts is seen as a great advantage. Thus, not only snapshots but also the
entire volume of the material are displayed. If this is compared with the analogue
version, where the stations are only partly built up, itis also a big leap to understanding
the number of parts. In addition, there is an understanding of the dimensions; in value
stream training, not only are ways spared but also areas with their management and
transport are cost factors (Group C).
- Efficiency is defined as the ‘ratio of resources to results’ (Niegemann, 2008). In this
context, AR creates a great remedy because set up times are reduced and the flexibility
can be increased by creating a different training mode that reacts to limitations
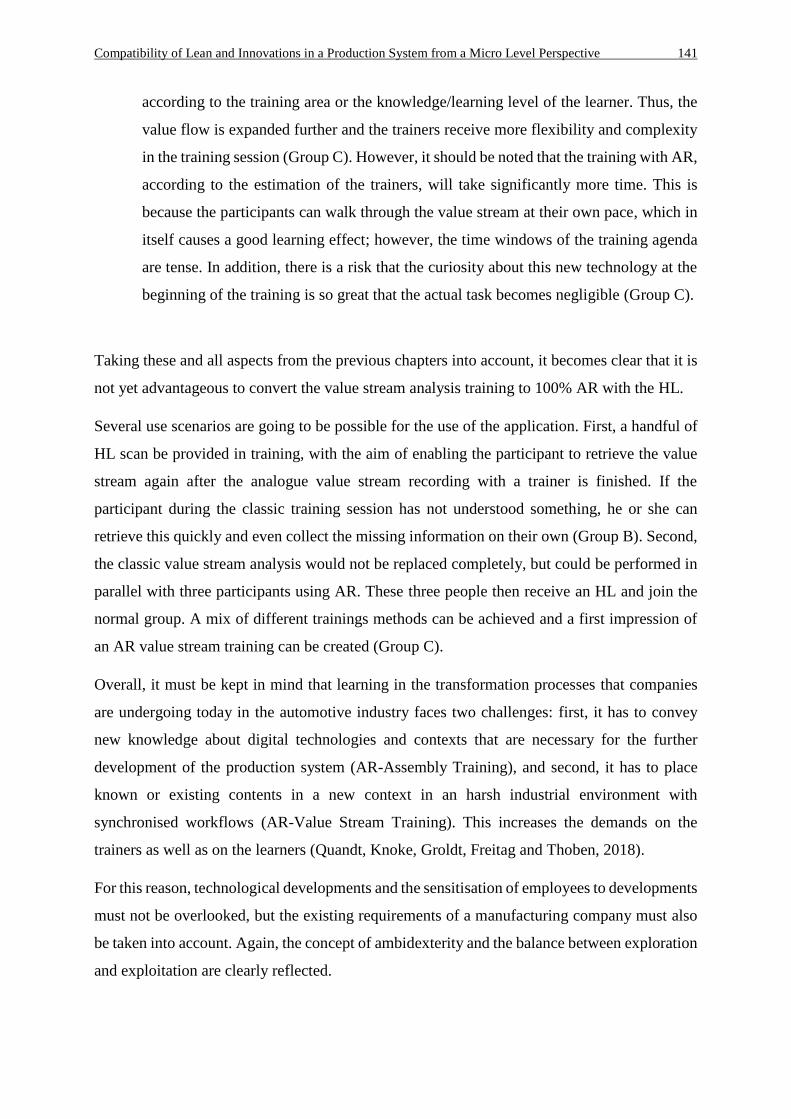
Compatibility of Lean and Innovations in a Production System from a Micro Level Perspective 141
according to the training area or the knowledge/learning level of the learner. Thus, the
value flow is expanded further and the trainers receive more flexibility and complexity
in the training session (Group C). However, it should be noted that the training with AR,
according to the estimation of the trainers, will take significantly more time. This is
because the participants can walk through the value stream at their own pace, which in
itself causes a good learning effect; however, the time windows of the training agenda
are tense. In addition, there is a risk that the curiosity about this new technology at the
beginning of the training is so great that the actual task becomes negligible (Group C).
Taking these and all aspects from the previous chapters into account, it becomes clear that it is
not yet advantageous to convert the value stream analysis training to 100% AR with the HL.
Several use scenarios are going to be possible for the use of the application. First, a handful of
HL scan be provided in training, with the aim of enabling the participant to retrieve the value
stream again after the analogue value stream recording with a trainer is finished. If the
participant during the classic training session has not understood something, he or she can
retrieve this quickly and even collect the missing information on their own (Group B). Second,
the classic value stream analysis would not be replaced completely, but could be performed in
parallel with three participants using AR. These three people then receive an HL and join the
normal group. A mix of different trainings methods can be achieved and a first impression of
an AR value stream training can be created (Group C).
Overall, it must be kept in mind that learning in the transformation processes that companies
are undergoing today in the automotive industry faces two challenges: first, it has to convey
new knowledge about digital technologies and contexts that are necessary for the further
development of the production system (AR-Assembly Training), and second, it has to place
known or existing contents in a new context in an harsh industrial environment with
synchronised workflows (AR-Value Stream Training). This increases the demands on the
trainers as well as on the learners (Quandt, Knoke, Groldt, Freitag and Thoben, 2018).
For this reason, technological developments and the sensitisation of employees to developments
must not be overlooked, but the existing requirements of a manufacturing company must also
be taken into account. Again, the concept of ambidexterity and the balance between exploration
and exploitation are clearly reflected.
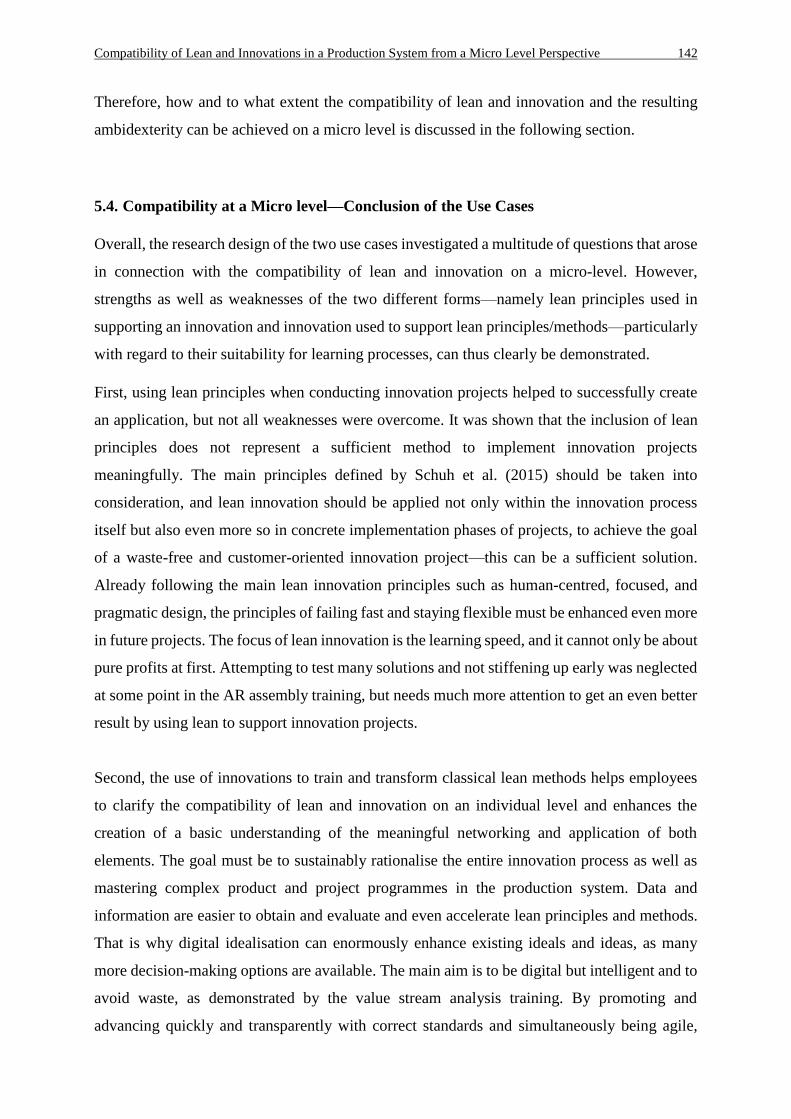
Compatibility of Lean and Innovations in a Production System from a Micro Level Perspective 142
Therefore, how and to what extent the compatibility of lean and innovation and the resulting
ambidexterity can be achieved on a micro level is discussed in the following section.
5.4. Compatibility at a Micro level—Conclusion of the Use Cases
Overall, the research design of the two use cases investigated a multitude of questions that arose
in connection with the compatibility of lean and innovation on a micro-level. However,
strengths as well as weaknesses of the two different forms—namely lean principles used in
supporting an innovation and innovation used to support lean principles/methods—particularly
with regard to their suitability for learning processes, can thus clearly be demonstrated.
First, using lean principles when conducting innovation projects helped to successfully create
an application, but not all weaknesses were overcome. It was shown that the inclusion of lean
principles does not represent a sufficient method to implement innovation projects
meaningfully. The main principles defined by Schuh et al. (2015) should be taken into
consideration, and lean innovation should be applied not only within the innovation process
itself but also even more so in concrete implementation phases of projects, to achieve the goal
of a waste-free and customer-oriented innovation project—this can be a sufficient solution.
Already following the main lean innovation principles such as human-centred, focused, and
pragmatic design, the principles of failing fast and staying flexible must be enhanced even more
in future projects. The focus of lean innovation is the learning speed, and it cannot only be about
pure profits at first. Attempting to test many solutions and not stiffening up early was neglected
at some point in the AR assembly training, but needs much more attention to get an even better
result by using lean to support innovation projects.
Second, the use of innovations to train and transform classical lean methods helps employees
to clarify the compatibility of lean and innovation on an individual level and enhances the
creation of a basic understanding of the meaningful networking and application of both
elements. The goal must be to sustainably rationalise the entire innovation process as well as
mastering complex product and project programmes in the production system. Data and
information are easier to obtain and evaluate and even accelerate lean principles and methods.
That is why digital idealisation can enormously enhance existing ideals and ideas, as many
more decision-making options are available. The main aim is to be digital but intelligent and to
avoid waste, as demonstrated by the value stream analysis training. By promoting and
advancing quickly and transparently with correct standards and simultaneously being agile,
Compatibility of Lean and Innovations in a Production System from a Micro Level Perspective 143
improvements and concepts will be of even greater importance. Furthermore, the focus must
continue to be on exchanges and networks, because only through the exchange of information
at the digital and personal/informal levels can progress can be achieved.
People continue to be one of the most important factors a company possesses to survive on the
market. Therefore, the micro level of compatibility of both elements should by no means be
ignored. It could be shown that, especially at a project level, it makes sense to strengthen the
mindset regarding the compatibility and usability of lean for innovation and vice versa. As
already shown at the macro and meso levels, it is not only crucial to anchor new and radical
ideas in existing systems but also to further develop the existing/old proven technologies and
methods with new ones.
A central result of the scientific explanatory approach to the mechanisms of change, with
reference to the basic ground for development, is that it is ultimately network actors on an
employee and project level who drive the transformation of production systems. This applies
both to change impulses and change strains within the system. Thus, the decline of
manufacturing companies cannot be attributed to radical changes but rather to the inability to
adequately respond to these changes (Ehrenmann, 2014). This is where ambidexterity and
complexity play a crucial role by influencing the establishment of an efficient social system
(e.g., employees and organisational culture) that can overcome these inabilities. As mentioned
earlier (subsection2.4.3.),the parallelism of the necessary but not economically resilient
investment in strategic innovations on the one hand, and the profitable, efficiency-oriented
optimisation of the core business on the other, becomes obvious and resembles the paradoxes
and contradictions that inevitably arise in the organisation and therefore need to be explained
by managers. The classical management instruments obviously do not take into account the
peculiarities of the challenges faced by the automotive industry and are able to solve the
paradoxes and contradictions in the organisation. It is therefore necessary to examine the extent
to which these instruments are able to support the necessary ambidexterity without losing sight
of the human factor and simplify complexity at a social system level.
Conclusion 145
6. Conclusion
In this work, the importance of lean and innovation—as a relevant form of ambidexterity for
the development as well as production and distribution of innovative products and processes—
was demonstrated. It is only through cooperation or the ability to combine the two
approaches/strategies (exploration and exploitation) that the strengths of the individual network
members can lead to efficient process management. The increasing importance of this
ambidexterity on all levels—macro, meso, and micro—can be proven both theoretically by the
evolutionary-economic approach and empirically by a survey with different empirical tools.
After considering the advantages and disadvantages as well as the attempt to classify OEMs in
their use of exploration and exploitation within patent applications, the innovation project
within the company with AR underscored the areas in which competitive advantages can be
achieved compared with conventional forms and strategies. The remarks in this chapter
illustrate the great competitive potential of lean and innovation within a whole industry and the
participating companies on the market.
Moreover, with the transformation of the automotive sector towards e-mobility and the
anticipated structural changes along the value chain as a result of digitisation, industry and
especially OEMs must reassess and, if necessary, redefine their position on the market. 2019
and 2020 are challenging years for the international automotive markets. In 2019 the European
passenger car market (EU-28 and EFTA) exceeded its 2018 result. While in Europe a growth
from 1.0 % for newly registered passenger cars can be seen, other large volume markets
returned varying results. Asian markets showed weak development, Russian market contracted
and in the US, the light vehicle market (passenger cars and light trucks) showed a decrease of -
1.0%. (VDA, 2020)
In terms of global competitiveness and market access, the analysed OEMs are in a strong
position in the automotive industry and are now competitive. In this way, opportunities offered
by new technologies, innovations, changes in demand, and growth in international markets can
be exploited. However, today, what still contributes to being able to compete in the future can
slow or even prevent the future viability of tomorrow. Thus, the balance between exploitation
and exploration strategies is more necessary and important than ever before.
Furthermore, a holistic rethinking of the macro, meso, and micro levels is required. At each
level, stable structures and methods must be linked to new ideas and technologies, as illustrated
in this work in the example of lean and innovation. Programmes to rebuild the electro mobility
market, technology leaps, national and international laboratories for new mobility, reorientation
Conclusion 146
of infrastructure policy, research funding, employment and skill initiatives, and structural
policy initiatives are measures that must be taken to ensure a competitive industry in the future
(Wells, 2010; Goodwin, 2012; Manderscheid, 2014)
Referencing the increase in patent applications from 1979 until 2007/2008, the decrease
during the financial crises, followed by an increase since 2010, it was shown that companies
have applied for more patents in the field of H01/H02 (electrical drive strain) from 2010
onwards, due to the innovation potential in battery technology and charging infrastructure.
The fact that an average of only 10% of all patents are explorative innovations and the
percentage of explorative innovations of the electrical drive strain (15%) is 5% higher than
the percentage of explorative innovations of the combustion drive strain (10%), shows that the
automakers, with their 90–10/85–15 approach, have found a balance between radical and
incremental innovation, thereby being lean and agile. This balance seems to blend in with the
corporate culture, leadership, and other industry-specific challenges. Moreover, it could
therefore be displayed that it is crucial to establish a form of innovation that suits the
respective area and topic, but also the company’s own organisational culture.
Especially in times of transformation, stronger investments in R&D are future-oriented and a
prerequisite for the continuation of technological leadership and ensuring the competitiveness
of OEMs. However, by setting the right framework, it is still essential that innovations must
find their way into the market.
As new topics always require new skills, the qualification and further training of employees is
more crucial than ever. People continue to be one of the most valuable factors a company has
to survive on the market. However, people becoming impeded in the transformation of the
sector due to a lack of qualifications must be prevented. The shift in mobility offerings require
a creative inclusion and the compatibility of innovations to secure good working conditions
along old and new value chains. The micro-level of compatibility of both elements, lean and
innovation, should by no means be ignored. It could be shown that especially at a project level
it makes sense to strengthen the mindset regarding the compatibility and usability of lean for
innovation and vice versa. As already shown at the macro- and meso-levels, it is not only
significant to anchor new and radical ideas in existing systems but also to further develop the
existing/old proven technologies and methods with new ones. The combination of being agile
and lean therefore plays a key role within a lean production system and has a main influence
on innovation. However, with traditional thinking centred solely on immediate benefit and fear
of change and failure, tomorrow’s big ideas are hard to find in today’s mainstream markets. In

Conclusion 147
future research, the question should be answered of to what extent the potential can best be
exploited through the use of business management instruments. Due to not considering the
peculiarities of the challenges faced by the automotive industry, the classical instruments of
innovation management evidently are failing. Therefore it is crucial to identify possible deficits
and adapt the instruments to the changed conditions by means of the modification, redesign, or
design of new methods. Moreover, it is necessary to examine the extent to which these
instruments are able to support the necessary ambidexterity without losing sight of the human
factor. Subsequently, indispensable requirements for efficient and effective use of classical
instruments as well as the use of new methods must be defined.
Bibliography 148
Bibliography
Books, Magazine, Papers
Abernathy, W. J. & Utterback, J.M. (1982) Patterns of industrial innovation. In: Tushman,
M.L. & Moore,W.L. (Eds.), Readings in the Management of Innovation.( Boston; Pitman), pp.
97-108.
Afuah, A. (1998) Innovation Management. Strategies, Implementation, and Profits (Oxford:
Oxford University Press).
Ahmed, A., Ahmad, S., Ehsan, N., Mirza, E. & Sarwar, S. Z. (2010) Agile Software
Development: Impact on productivity and quality, pp. 287 - 291.
Altschuller, G. S. (1998) Erfinden. Wege zur Lösung technischer Probleme (Cottbus: PI-
Planung und Innovation).
Ancona, D. G., Goodman, P. S., Lawrence, B. S. & Tushman M. L. (2001) Time: A new
research lens. Academy of Management Review, 26, pp. 645-663.
Arthur, B. W. (2013) Complexity economics: A different framework for economic thought
(Santa Fe: Santa Fe Institute Working Paper 2013-04-012, Santa Fe Institute).
Arvanitis, S. & Stucki, T. (2014) The impact of venture capital on the persistence of
innovation activities of start-ups. Small Business Economics, 42, pp. 849- 870.
ATZ Heavy Duty worldw (2019) Shaping Digitalization (Cham: Springer Nature
Switzerland AG).
Atkinson, S. R. & Moffat, J. (2005) The Agile Organization: From Information Networks to
Complex Effects and Agility (Washington, DC: CCRP Publications Series).
Bakker, S. & Jacco Farla, J. (2015) Electrification of the car - Will the momentum last?
Introduction to the special issue. Environmental Innovation and Societal Transitions, 14, pp. 1-
4.
Baltes, G. H. & Freyth, A. (2017) Veränderungsintelligenz - Agiler, innovativer,
unternehmerischer den Wandel unserer Zeit meistern (Wiesbaden: Springer Gabler).
Bandura, A. (1982) Self efficacy mechanism in human agency. American Psychologist, 37, pp.
122-147.
Bangor, A.; Kortum, P. T. & Miller, J. T. (2008) An Empirical Evaluation of the System
Usability Scale. International Journal of Human-Computer Interaction, pp. 574– 594.
Bates, K. A., Flynn, E. J. & Flynn, B. B. (2009) The pressure to perform. Innovation, cost,
and the lean revolution. Business Horizons, 52, pp. 215-221.
Bauer, R. A. (1960) Consumer behavior as risk taking. In R. S. Hancock (Ed.), Dynamic
marketing for a changing world (Chicago: American Marketing Association), pp. 389-398.
Bauer, W., Hämmerle, M., Schlund, S. & Vocke, C. (2015) Transforming to a hyper-
connected society and economy - towards an "Industry 4.0". Procedia manufacturing, 3, pp.
417-424.
Baum, J. A. & Silverman, B.S. (2004) Picking winners or building them? Alliance,
intellectual, and human capital as selection criteria in venture financing and performance of
biotechnology startups. Journal of business venturing, 19, pp. 411-436.
Bennett, N. & Lemoine, G. J. (2014a) What VUCA Really Means for you. Harvard Business
Review, 92, pp. 1-27.
Bibliography 149
Bennett, N. & Lemoine, G. J. (2014b) What a Difference a Word Makes: Understanding
Threats to Performance in a VUCA World. Business Horizons, 57, pp. 311-317.
Benson, D. & Ziedonis, R.H. (2009) Corporate venture capital as a window on new
technologies: Implications for the performance of corporate investors when acquiring startups.
Organization Science, 20, pp. 329-351.
Bhawe, N. & Zahra, S. A. (2019) Inducing heterogeneity in local entrepreneurial ecosystems:
the role of MNEs. Small Business Economics, 52, pp. 437-454.
Bergman, B. & Klefsjö, B. (2010) Quality from customer needs to customer satisfaction
(Lund: Studentlitteratur).
Bernhauer E. (1958) Eine Interpretation der Konjunkturtheorie Joseph Schumpeters
(Frankfurt am Main: Frankfurt am Main 1958).
Bhasin, S. (2008) Lean and performance measurement. Journal of Manufacturing Technology
Management, 19, pp. 670-684.
Bierly, P. E. & Chakrabarti, A. (1996) Technological learning, strategic flexibility, and new
product development in the pharmaceutical industry. IEEE Transactions on Engineering
Management, 43, pp. 368-380.
Biocca, F. (1992) Will simulation sickness slow down the diffusion of virtual environments
technology? Presence, 3, pp. 334‐343.
Blättel-Mink, B. (2006) Kompendium der Innovationsforschung (Wiesbaden: Springer
Gabler).
Blümel, E. & Jenewein, K. (2005) Kompetenzentwicklung in realen und virtuellen
Arbeitsumgebungen - Eckpunkte eines Forschungsprogramms. In: Schenk, M. (Hrsg.): Virtual
Reality und Augmented Reality zum Planen, Testen und Betreiben technischer Systeme
(Magdeburg : IFF).
Bodensteiner K. (2011) Internationale Diffusion von Innovationen. In: Mann A. (eds)
Herausforderungen der internationalen marktorientierten Unternehmensführung (Wiesbaden:
Springer Gabler).
Böhme, G. (1997) Ethik im Kontext. Über den Umgang mit ernsten Frage (Suhrkamp:
Frankfurt am Main).
Booz, Allen&Hamilton (1982) Newproductmanagementforthe1980’s (New York: Booz,
Allen & Hamilton, Inc)
Bricken, M. (1990) A Description of the Human Interface Technology Laboratory ís Virtual
Worlds (Seattle: University of Washington, Human Interface Technology Laboratory,
Technischer Bericht).
Brough, J. E., Schwartz, M., Gupta, S. K., Anand, D. K.; Kavetsky, R., et al. (2007)
Towards the development of a virtual environment-based training system for mechanical
assembly operations. Virtual Reality, 11, pp. 11- 189.
Brown, J., & Agnew, N. (1982) Corporate Agility. Business Horizons, pp. 29-33.
Buchmann, T. & Pyka, A. (2012) Innovation Networks. Economics and Theory of the Firm,
eds. Dietrich, M. & Krafft J. (Cheltenham: Edward Elgar Publishing), pp. 466-484.
Buchmann, T. & Pyka, A. (2015) The evolution of innovation networks: the case of a publicly
funded German automotive network. Economics of Innovation and New Technology, 24, pp.
114-139.
Bibliography 150
Buenstorf, G. (2015) Schumpeterian incumbents and industry evolution. Journal of
Evolutionary Economics, pp. 129-213.
Burggräf, P., Lorber, C., Pyka, A., Wagner, J. & Weisser, T. (2020) Kaizen 4.0 towards an
Integrated Framework for the Lean-Industry 4.0 Transformation. Proceedings of the Future
Technologies Conference (FTC), pp. 692-709.
Burkhart, S. & Hanser, F. (2018) Einfluss globaler Megatrends auf das digitale Betriebliche
Gesundheitsmanagement. In: Matusiewicz D., Kaiser L. (eds) Digitales Betriebliches
Gesundheitsmanagement (Wiesbaden: FOM-Edition Springer Gabler).
Cainarca, G. C., Colombo, M. G. & Mariotti, S. (1992) Agreements between firms and the
technological life cycle model: Evidence from information technologies. Research Policy, 21,
pp. 45-62.
Carbonell, P., Rodriguez-Escudero, A.I. & Pujari, D. (2012) Performance effects of
involving lead users and close customers in new service development. Journal of Services
Marketing, 26, pp. 497-509.
Carlsson, B. & Eliasson, G. (2003) Industrial Dynamics and Growth. Industry and Innovation,
10, pp. 435- 456.
Carmeli, A. & Halevi, M. (2009) How top management team behavioral integration and
behavioral complexity enable organizational ambidexterity: The moderating role of contextual
ambidexterity. The Leadership Quarterly, 20, pp. 207-218.
Chandy, R. K., & Tellis, G. J. (1998) Organizing for radical product innovation: The
overlooked role of willingness to cannibalize. Journal of Marketing Research, 35, pp.120-132.
Chell, E., Haworth, J. & Brearley, S. (1991) The entrepreneurial personality. Concepts, cases
and categories (London: Routledge).
Chen,H. & Taylor, R. (2009) Exploring the impact of lean management on innovation
capability. PICMET '09 - 2009 Portland International Conference on Management of
Engineering & Technology, pp. 826-834.
Chenavaz, R. (2012) Dynamic pricing, product and process innovation. European Journal of
Operational Research, 222, pp. 553-557.
Cheng, Y. T. & Van de Ven, A. H. (1996) Learning the innovation journey: Order out of
chaos? Organ. Sci., 7, pp. 593-614.
Choi, K., Narasimhan, R. & Kim, S. W. (2016) Opening the technological innovation black
box: The case of the electronics industry in Korea. European Journal of Operational Research,
250, pp. 192-203.
Christensen, C., M. (1997) The Innovator’s Dilemma: When New Technologies Cause Great
Firms to Fail (Boston, MA: Harvard Business Review Press).
Christensen, C.M., Baumann, H., Ruggles, R. &Sadtler, T.M. (2006) Disruptive
innovation for social change. Harvard Business Review, 84, pp. 94-101.
Christensen, C. M., Raynar, M. & Donald, R. (2015) What is Disruptive Innovation?
Harvard Business Review, 12, pp.44-53.
Coles J. W. & Hesterly W. S. (1998) Transaction costs, quality, and economies of scale:
Examining contracting choices in the hospital industry. Journal of Corporate Finance, 4, pp.
321-345.
Conboy, K. (2009) Agility from First Principles: Reconstructing the Concept af Agility in
Information Systems Development. Information Systems Research, pp. 329-254.
Bibliography 151
Cook K. S. & Whitmeyer J. M. (1992) Two approaches to social structure: Exchange theory
and network analysis. Annual Review of Sociology, 18, pp. 109-127.
Cooper, R. G. (2008) Perspective: The Stage-Gate1 idea-to-launch process: Update, what’s
new, and NexGen systems. Journal of Product Innovation Management, 25, pp. 213-232.
Corsten, H., Gössinger, R. & Schneider, H. (2006) Grundlagen des Innovationsmanagements
(München: Vahlen).
Damanpour, F. & Wischnevsky, J.D. (2006) Research on innovation in organizations:
distinguishing innovation-generating from innovation-adopting organizations. Journal of
Engineering and Technology Management, 23, pp. 269-291.
Damanpour, F., Walker, R. M. & Avellaneda, C. N. (2009) Combative effects of innovation
types and organizational performance: A longitudinal study of service organizations. Journal
of Management Studies, 46, pp. 650-675.
Dan, Y & Chieh, H.C. (2008) A reflective review of disruptive innovation theory," PICMET
'08 - 2008 Portland International Conference on Management of Engineering & Technology,
pp. 402-414.
Deci, E. L. & Ryan, R. M. (1987) The support of autonomy and the control of
behavior. Journal of Personality and Social Psychology, 53, pp. 1024-1037.
De Treville, S. & Antonakis, J. (2006). Could lean production job design be intrinsically
motivating? Contextual, configurational and levels-of-analysis issue. Journal of Operations
Management, 24, pp. 99-123.
Dewar, R. & Dutton, J. (1986) The adoption of radical and incremental innovations: an
empirical analysis. Management Science, 32, pp. 1422-1433.
Dickmann, P. (2015) Schlanker Materialfuss mit Lean Production, Kanban und Innovationen
(Berlin: Springer).
Dopfer,K., Foster, J. & Potts, J. (2004) Micro-meso-macro. Journal of Evolutionary
Economics, 14, pp 263-279.
Dünser, A., Grasset, R. & Billinghurst, M. (2008) A survey of evaluation techniques used in
augmented reality studies. SIGGRAPH 2008.
Duschek, S. (2002) Innovation in Netzwerken: Renten - Relationen - Regeln (Wiesbaden:
Springer).
Dybå, T. & Dingsøyr, T. (2008) Empirical studies of agile software development: A systematic
review. Information and Software Technology, 50, pp. 833-859.
Dyer J. H. (1997) Effective interfirm collaboration: How firms minimize transaction costs and
maximize transaction value. Strategic Management Journal, 18, pp. 535-556.
Dyer J. H. &Chu W. (2003) The role of trustworthiness in reducing transaction costs and
improving performance: Empirical evidence from the United States, Japan, and Korea.
Organization Science, 14, pp. 57-68.
Dyer, J., Gregersen, H. & Christensen, C. M. (2011) The innovator’s DNA (Boston, MA:
Harvard Business Review Press).
Dyer, J. & Nobeoka, K. (2000) Creating and Managing a High-Performance Knowledge-
Sharing Network: The Toyota Case. Strategic Management Journal, 21, pp. 345-367.
Ehrenmann, F. (2014) Kosten und Zeiteffizienter Wandel von Produktionssystemen
(Wiesbaden: Springer).
Bibliography 152
Enders, A., König, A., Hungenberg, H., & Engelbertz, T. (2009) Towards an integrated
perspective of strategy: The value-process framework. Journal of Strategy and Management.
2, pp. 76-96.
Ergonomics of human-system interaction - Part 110: Dialogue principles (ISO
9241110:2006); Deutsche Fassung EN ISO 9241-110:2006.
Erlach, K.(2010) Der Weg zur schlanken Fabrik (Berlin: Springer).
Ernst, H. (1996) Patentinformationen für die strategische Planung von Forschung und
Entwicklung (Wiesbaden: Springer).
Fischer, E.P. & Wiegandt, K. (Hrsg.) (2012) Dimensionen der Zeit. Die Entschleunigung
unseres Lebens (Frankfurt am Main: Fischer Taschenbuch).
Flaig, G. & Stadler, M. (1994) Success breeds success. The dynamics of the innovation
process. Empirical Economics, 19, pp.55-68.
Fleming, A. (1947) Nobel Lecture on Penicillin. Les Prix Nobel en 1945, p. 155. (Stockholm
1947).
Freeman, L. C. (1979) Centrality in social networks: I. Conceptual clarifications. Social
Networks, 1, pp. 215-239.
Förster, K. & Wendler, R. (2012) Theorien und Konzepte zu Agilität in Organisationen.
Dresden (Dresden: Dresdner Beiträge zur Wirtschaftsinformatik, Nr. 63/12).
Fores, B. & Camison, C. (2016) Does incremental and radical innovation performance depend
on different types of knowledge accumulation capabilities and organizational size? Journal of
Business Research, 69, pp. 831-848.
Ganguly, A., Nilchiani, R. & Farr, J. (2009) Evaluating agility in corporate enterprises.
International Journal of Production Economics, pp. 410-423.
Garcia Sanz, F. (Hrsg.) (2007) Die Automobilindustrie auf dem Weg zur globalen
Netzwerkkompetenz. Effiziente und flexible Supply Chains erfolgreich gestalten (Berlin:
Springer).
Gassmann, O.& Sutter, P. (2013) Praxiswissen Innovationsmanagement - Von der Idee zum
Markterfolg (München: Carl Hanser Verlag).
Gerybadze A. (2003) Gruppendynamik und Verstehen in Innovation Communities. In:
Herstatt C., Verworn B. (eds) Management der frühen Innovationsphasen (Wiesbaden:
Gabler Verlag).
Gerybadze, A. & Reger, G. (1999) Globalization of R&D: recent changes in the management
of innovation in transnational corporations. Research Policy, 28, pp. 251–274.
Ghoshal S. & Moran P. (1996) Bad for practice: A critique of transaction cost theory. Academy
of Management Review, 21, pp. 13-47.
Glazier, S. (1995) Inventing around your competitors’ patents. Managing Intellectual
Property, pp. 10-14.
Goebel, P. (1991) Kreativität und kreative Persönlichkeiten - eine Untersuchung über
erfolgreiche Unternehmensgründer. Zeitschrift für Psychosomatische Medizin, 37, pp. 146-156.
Gonzalez-Franco, M., Pizarro, R.; Cermeron, J.; Li, K.; Thorn, J.; Hutabarat, W.;
Tiwari, A. & Bermell-Garcia, P. (2017) Immersive Mixed Reality for Manufacturing
Training. Frontiers in Robotics and AI, 4, pp. 1-8.
Bibliography 153
Goodwin, P. (2012). Peak travel, peak car and the future of mobility. Presented at the
international transport forum, Leipzig.
Grafstein, E. (2012) The waiting game: The emergency patient as a customer. Canadian
Journal of Emergency Medicine, 14(4), 203-206.
Graupp, P. & Wrona, R. J. (2016): The TWI workbook: Essential skills of supervisors (New
York: Taylor Francis).
Grossman, G.M. & Helpman, E. (1991) Innovation and Growth in the Global Economy
(Cambridge, MA:MIT Press).
Gunday, G., Ulusoy, G., Kilic, K. & Alpkan, L.(2011) Effects of innovation types on firm
performance. International Journal of Production Economics, 133, pp. 662-676.
Gundlach, C. & Nähler, H. T. (2006) TRIZ- Theorie des erfinderischen Problemlösens. In:
Carsten Gundlach (Hg.): Innovation mit TRIZ. Konzepte, Werkzeuge, Praxisanwendungen.
(Düsseldorf: Düsseldorf: Symposion)
Güttner A. & Sommer-Dittrich, T. (2008) Current Issues at OEMs and Suppliers. In: Parry
G., Graves A. (eds) Build To Order (London: Springer).
Hack, A. (2005) Startuperfolg und die Wahl von Risikokapitalgebern: Ökonomische Analyse
mit empirischer Validierung für den deutschen Markt.Management, Organisation und
ökonomische Analyse (Wiesbaden: Deutscher Universitätsverlag).
Hagen, Ø. & Larssaether, S. (2000) A Critical Look at Business's Response to the
Environmental Challenge: Is Eco-efficiency a Result of Single loop Problem solving? Business
Strategy and the Environment Conference, Leeds18-19September.
Hagerstrand, T. (1968) Innovation diffusion as a spatial process (Chicago: University
Chicago Press).
Haid, A. & Münter, M. T. (1999) Neuere Entwicklungen in der industrieökonomischen
Forschung und die aktuelle Berichterstattung über die technologische Leistungsfähigkeit
Deutschlands (Berlin: Deutsches Institut für Wirtschaftsforschung).
Hall, R.W. (1987) Attaining Manufacturing Excellence: Just in Time, Total Quality, Total
People Involvement (Homewood Ill: Dow Jones-Irwin).
Hartmann, L., Meudt, T., Seifermann, S. & Metternich J. (2018) Value stream method 4.0:
holistic, ethod to analyse and design value stream in the digital age. Procedia CIRP, 78, pp.
249-254.
Hauschildt, J. (1997) Innovationsmanagement (München: Vahlen).
Hauschildt, J. (1998) Widerstand gegen Innovationen: Erscheinungsbild, Ursachen und
Wirkungen (Kiel: Manuskripte aus den Instituten für Betriebswirtschaftslehre der Universität
Kiel, 478).
Hauschildt, J., Salomo, S., Schultz, C. & Kock, A. (2016) Innovationsmanagement
(München: Vahlen).
He, Z. & Wong, P. (2004) Exploration vs. Exploitation: An Empirical Test of the
Ambidexterity Hypothesis. Organization Science, 15, pp.481-494.
Hellmer, F.(2002) Mythos Netzwerke: regionale Innovationsprozesse zwischen Kontinuität
und Wandel (Berlin: Springer).
Bibliography 154
Henderson, R. & Clark, K. (1990) Architecture innovation: the reconfiguration of existing
product technologies and the failure of established firms. Administrative Science Quarterly, 35,
pp.9-30.
Herb, R., Herb, T. & Kohnhauser, V. (2000) TRIZ - der systematische Weg zur Innovation.
Werkzeuge, Praxisbeispiele, Schritt-für-Schritt-Anleitungen (Landsberg/Lech: Mi, Verl.
Moderne Industrie).
Herrmann-Pillath, C. (2002): Grundriß der Evolutionsökonomik (München: Wilhelm Fink
Verlag).
Holm, M., Adamson, G., Moore, P. & Wang, L. (2016) Why I want to be a Future Swedish
Shop-floor Operator. Procedia CIRP, 41, pp. 1101–1106.
Holweg M. (2008) The Evolution of Competition in the Automotive Industry. In: Parry G.,
Graves A. (eds) Build To Order (London: Springer).
Hooper, P., Jukes, S. & Stubbs, M. (2000) SME Environmental Performance and the Business
Support Network: Problem solving not Panacea. The Business Strategy and the Environment
Conference, Leeds, 18-19 September.
Hopp, W.J. & Spearman, M.L. (2004) To pull or not to pull: what is the question?
Manufacturing and Service Operations Management, 6, pp. 133-148.
Hořejší, P. (2015) Augmented Reality System for Virtual Training of Parts Assembly.
Procedia Engineering, 100, pp. 699–706.
Horney, N., Pasmore, B. & O’Shea, T. (2010) Leadership agility: A business imperative for
a VUCA world. People & Strategy, 33, pp. 34-42.
Hundertmark, H. (2013) Beziehungsmanagement in der Automobilindustrie: OEM
Relationship Management als Sonderfall des CRM (Wiesbaden: Springer Gabler).
Hutter, M., Knoblauch, H., Rammert, W. & Windeler, A. (2016) Innovationsgesellschaft
heute: Die reflexive Herstellung des Neuen (Wiesbaden: Springer).
Isaksen, S.G., Dorval, K.B. & Treffinger, D.J. (2010) Creative approaches to problem
solving: A framework for innovation and change (Wiesbaden: Springer).
Jenewein, K. & Schulz, T. (2007) Didaktische Potentiale des Lernens mit interaktiven VR‐
Systemen, dargestellt am Training des Instandhaltungspersonals mit dem virtuellen System
„Airbus A320“. In: GfA (Hrsg.), Kompetenzentwicklung in realen und virtuellen
Arbeitssystemen (Dortmund: GfA‐Press), pp. 323‐326.
Jensen, P. (1980) Talcott Parsons: Eine Einführung (Stuttgart: Teubner).
Jaworski, J. & Zurlino, F. (2007) Innovationskultur: Vom Leidensdruck zur Leidenschaft
(Droege: Frankfurt am Main).
Johansen, B. & Euchner, J. (2013) Navigating the VUCA World. Research-Technology
Management, 56, 1, 10-15,
Judge, T. A., Thoresen, C. J., Pucik, V. & Welbourne, T. M. (1999) Managerial coping with
organizational change: A dispositional perspective. Journal of Applied Psychology, 84, 107-
122.
Jullien, B. (2010) Wie krisenanfällig ist die Automobilindustrie? Eine Analyse am Beispiel des
französischen Automobilmarkts (DGAP-Analyse Frankreich, 2) (Berlin: Forschungsinstitut
der Deutschen Gesellschaft für Auswärtige Politik e.V).
Bibliography 155
Karki. M. M. S. (1997) Patent citation analysis: A policy analysis tool. World Patent
Information, 19, 4, December 1997, pp. 269-272
King, P. L., (2009) Lean for the Process Industries-Dealing with Complexity Imprint (New
York: Productivity Press).
Kley, T. (2018) Widerstand gegen Innovationen in Unternehmen: Empirische
Wirkungsanalysen in der industriellen Forschung und Entwicklung (Bochum: Institut für
angewandte Innovationsforschung (IAI) e.V. an der Ruhr-Universität Bochum).
Kastner (2011) Patentrecherche und Bewertung (München: Chair for Network Architectures
and Services, Department of Computer Science, Technische Universität München).
Kaufmann, T. (2015) Geschäftsmodelle in Industrie 4.0 und dem Internet der Dinge: Der Weg
vom Anspruch in die Wirklichkeit (Berlin: Springer).
Kemp, R. & Rotmans, J. (2005) The Management of the Co-Evolution of Technical,
Environmental and Social Systems. In: Weber, M. & Hemmelskamp, J. (Hrsg.): Towards
environmental innovation systems (Berlin: Springer) pp. 33-55
De Jong, J.P.J., Kemp, R.G. M, Folkeringa, M. & Wubben, E.F.M. (2003) Innovation and
firm performance. Scales Research Reports, EIM Business and Policy Research.
Kessler T. & Buck C. (2017) How Digitization Affects Mobility and the Business Models of
Automotive OEMs. In: Khare A., Stewart B., Schatz R. (eds) Phantom Ex Machina (Cham:
Springer).
King, A. S. (1985) Self-analysis and assessment of entrepreneurial potential. Simulation and
Games. 16, 399-416.
Kolk, A. & Levy, D. (2004) Multinationals and global climate change: Issue for the automotive
and oil industries. Global Strategic Management, 9, pp. 171–193.
Koltze, K. & Souchkov, V.(2011) Systematische Innovation. TRIZ- Anwendung in der
Produkt- und Prozessentwicklung (München: Hanser).
Koplyay, T., Li, L., & Rochfort, P . (2010) Hi-Tech Innovation Strategies and the Market Life
Cycle. Proceedings of the 27th American Society for Engineering Management Huntsville,
Alabama, October 25-28.
Koplyay T. & Mitchell B. (2014a) Evolution of complexity in high technology markets and
its consequences. Institute of Industrial Engineers, Proceedings of IEE Conference 2014,
Montreal, pp. 1-4.
Koplyay T., Mitchell B. (2014b) The Evolution of Complexity within Firms. Institute of
Industrial Engineers, Proceedings of IEE Conference, Montreal, pp. 1-4.
Kristiansen, J. N. & Gertsen, F. (2014) Reviewing Radical Innovation Typology: Remedying
Innovation Type Confusion. The International Society for Professional Innovation
Management (ISPIM) Conference Proceedings, Manchester, pp. 1-16.
Krys, C. (2017) Megatrends – Rahmenbedingungen für unternehmerische Nachhaltigkeit.
In: Wunder T. (eds) CSR und Strategisches Management. Management-Reihe Corporate
Social Responsibility (Heidelberg: Springer Gabler).
Kuhl, J. (2001) Motivation und Persönlichkeit. Interaktionen psychischer Systeme (Göttingen:
Hogrefe).
Lavie, D. (2006) The competitive advantage of interconnected firms: An extension of the
Resource-Based View. Academy of Management Review, 31, pp. 638-658.
Bibliography 156
Larminie J. &Lowry J. (2003) Electric vehicle technology explained (Chichester. John Wiley
& Sons).
Lefcourt, H. M. (1976) Locus of control (Hillsdale: NJ Erlbaum).
Leitner, K.H. (2016) “No“ and “slow“ innovation strategies as response to increased
innovation speed. In: Reflexive innovation: Alternative approaches on the proinnovation bias,
Godin, B., Vinck,D. (Eds) (Cheltenham: Edward Elgar), pp. 1 - 14.
Levinthal, D. A. &March, J. G. (1993). The myopia of learning. Strategic Management
Journal, 14, pp. 95-112.
Lewin, K. (1947) Group decisions and social change. In Newcomb, T. M. and Hartley, E. L.
(Eds), Readings in Social Psychology (New York: Henry Holt).
Li, S. D., & Ni, J. (2016) A dynamic analysis of investment in process and product innovation
with learning-by-doing. Economics Letters, 145, pp. 104-108.
Li, S., Subba Rao, S., Ragu-Nathan, T.S. & Ragu-Nathan, B. (2005) Development and
validation of a measurement instrument for studying supply chain management practices.
Journal of Operations Management, 23, pp. 618-641.
Lichtenthaler, U. (2009) Absorptive capacity, environmental turbulence, and the
complementarity of organizational learning process. Academy of Management Journal, 52, pp.
822-846.
Lieberman, M.B. & Montgomery, D.B. (1988) First-mover advantages. Strategic
Management Journal, 9, pp. 41-58.
Lin, L. H. & Ho, Y. L. (2016) Institutional Pressures and Environmental Performance in the
Global Automotive Industry: The Mediating Role of Organizational Ambidexterity. Long
Range Planning, 49, pp. 764-775.
Linton, J. (2009) De-babelizing the language of innovation. Technovation, 29, pp. 729-737.
Livotov, P. & Petrov, V. (2010) TRIZ-Innovationstechnologie. Produktentwicklung und
Problemlösung (Hannover: TriS Europe).
Loch, F., Quint, F. & Brishtel, I. (2016) Comparing Video and Augmented Reality Assistance
in Manual Assembly. In: 2016 12th International Conference 2016, pp. 147– 150.
Lorber C. & Stäudel T. (2019) VPS Learing Factory. In: Abele, E., Metternich, J., Tisch, M.
(eds) Learning Factories. Concepts, Guidelines, Best-Practice Examples. (Berlin: Springer),
pp. 335-459.
Lucas, H.C. & Goh, J. M. (2009) Disruptive technology: How Kodak missed the digital
photography revolution. The Journal of Strategic Information Systems, 18, pp. 46-55
Lyons B. R. (1995) Specific investment, economies of scale, and the make-or-buy decision: A
test of transaction cost theory. Journal of Economic Behavior and Organization, 26, pp. 431-
443.
Mack, O. & Khare, A. (Ed) (2016) Managing in a VUCA World (Heidelberg: Springer).
Mahajan, V., Muller, E., & Bass, M. (1990) New product diffusion models in marketing: A
review and directions for research. Journal of Marketing, 54, pp. 1-26.
Mahmood, I.P. & Rufin, C. (2005) Government's dilemma: the role of government in
imitation and innovation. Academy of Management Review, 30, pp. 338-360.
Bibliography 157
Manderscheid, K. (2014) The Movement Problem, the Car and Future Mobility Regimes:
Automobility as Dispositif and Mode of Regulation. Mobilities, 9, pp. 604-626.
Mantovani, A. (2006) Complementarity between product and process innovation in a
monopoly setting. Economics of Innovation and New Technology, 15, pp. 219-234.
March, J. G. (1991) Exploration and exploitation in organizational learning. Organization
Science, 2, pp. 71-87.
Markham, S. K., Green, S. G. & Basu, R. (1991) Champions and antagonists: Relationships
with R&D project characteristics and management. Journal of Engineering and Technology
Management, 8, pp. 217-242.
Markides, C. (2006) Disruptive Innovation: In Need of Better Theory. Journal of product
innovation management, 23, pp. 19-25.
Maxton, G. P. & Wormald, J., (2004) Time for a Model Change: Re-engineering the Global
Automotive Industry (Cambridge Cambridge University Press).
McClelland, D. C. (1987) Characteristics of successful entrepreneurs. Journal of Creative
Behavior, 3, pp. 219-233.
McKone, K.E. & Weiss, E.N. (1999) Total productive maintenance: bridging the gap between
practice and research. Production and Operations Management, 7, pp. 335-351.
McLachlin, R. (1997) Management initiatives and just-in-time manufacturing. Journal of
Operations Management,15, pp. 271-292.
Meffert, H. (1976) Die Durchsetzung von Innovationen in der Unternehmung und im Markt.
ZfB, 46, pp.77-100.
Miner, J. B., Smith, N. R. & Bracker, J. S. (1994) Role of entrepreneurial task motivation in
the growth of technically; Interpretations from follow-up data. Journal of Applied Psychology,
79, pp. 627-630.
Mirow, C. (2010) Innovationsbarrieren (Wiesbaden: Gabler).
Möser, K. (2002) Die Geschichte des Autos. (Frankfurt am Main/New York: Springer)
Mohr, H.W. (1977) Bestimmungsgründe für die Verbreitung von neuen Technologien (Berlin:
Duncker & Humblot).
Monden, Y. (1983) Toyota Production System: A Practical Approach to Production
Management (Norcross, GA:Industrial Engineers and Management Press).
Moser, P. (2012) Innovation without Patents: Evidence from World’s Fairs.The Journal of Law
and Economics,55, pp. 43-74.
Müller, G. F. & Gappisch, C. (2002) Existenzgründung - Persönlichkeit als Startkapital.
Wirtschaftspsychologie, 4, pp. 28-33.
Naisbitt, J. (1982) Megatrends. Ten new directions transforming our lives. (New York:
Warner Books).
Nakicenovic, N. & Schulz, N. B. (2011) World in Transition - A Social Contract for
Sustainability. In: Welt im Wandel: Gesellschaftsvertrag fuer eine Grosse Transformation
(WBGU: Flagship Report).
Narasimhan, R., Swink, M. & Kim, S.W. (2006) Disentangling leanness and agility: an
empirical investigation. Journal of Operations Management, 24, 5, pp. 440-457.
Bibliography 158
Nohria N. & Eccles R. C. (1992) Networks and organizations: Structure, form, and action.
(Boston: Harvard Business School Press).
OECD (2005) Oslo manual: Guidelines for collecting and interpreting innovation Data (Paris:
OECD).
Ohno, T. (1988) Toyota production system: beyond large-scale production (Cambrigde:
Productivity press).
Oreg, S. (2003) Resistance to Change: Developing an Individual Differences Measure. Journal
of Applied Psychology, 88, pp. 680-693.
Ouchi, W. (1981) Theory Z: How American business can meet the Japanese challenge.
Business Horizons, 24, pp. 82-83.
Parsons, T. (1978) Action Theory and Human Condition (New York: Free Press).
Parsons, T., Bales, R., & Shils, E. (1953) Working Papers of the Theory of Action (Berlin:
Free Press).
Peres, R., Muller, E. & Mahajan, V. (2010) Innovation diffusion and new product growth
models: A critical review and research directions. International Journal of Research in
Marketing, 27, pp. 91-106.
Pérez-Luño, A., Valle Cabrera, R. & Wiklund, J. (2007a) Innovation and imitation as
sources of sustainable competitive advantage. Management Research, 5, pp. 67-79.
Pérez-Luño, A., Valle-Cabrera, R. & Wiklund, J. (2007b). Risk, proactivity and
uncertainties as determinants of the decision to imitate or to innovate. International Journal of
Technology Intelligence and Planning, 3, pp. 343-354.
Pérez-Luño, A., Wiklund, J. & Valle-Cabrera, R. (2011) The dual nature of innovative
activity: How entrepreneurial orientation influences innovation generation and adoption.
Journal of Business Venturing, 26, pp. 555-571.
Pelz B. & Mahlmann R. (2015) Der Zwang zu wachsen und seine Folgen. In: Manager im
Würgegriff (Wiesbaden: Springer Gabler).
Porter, M. (1980)Competitive strategy (New York: Free Press).
Pongratz, H. J.& Trinczek, R. (2005) BOHICA! Change zwischen Akzeptanz und
Widerstand (München: Manuskript, Lehrstuhl für Soziologie, TU München).
Power, D., Sohal, A. & Rahman, S. (2001) Critical success factors in agile supply chain
management ‐ An empirical study. International Journal of Physical Distribution & Logistics
Management, 31, pp. 247-265.
Pyka, A. (1999) Der kollektive Innovationsprozeß - Eine theoretische Analyse informeller
Netzwerke und absorptiver Fähigkeiten, In: Volkswirtschaftliche Schriften, 498, (Berlin:
Duncker und Humblot).
Pyka, A. (2000) Informal Networks and Industry Life Cycles. Technovation, 20, pp. 25-35.
Pyka, A. (2002) Innovation Networks in Economics: From the Incentive-Based to the
Knowledge-Based Approaches. European Journal of Innovation Management, 5, pp 152-163.
Pyka, A., Gilbert, N., & AhrweilerP. (2007) Simulating Knowledge-Generation and
Distribution Processes in Innovation Collaborations and Networks. Cybernetics and Systems:
An International Journal, 38, pp. 667-693.
Bibliography 159
Pyka A., Gilbert N. & Ahrweiler P. (2009) Agent-Based Modelling of Innovation Networks
– The Fairytale of Spillover. In: Pyka A., Scharnhorst A. (eds) Innovation Networks.
Understanding Complex Systems (Berlin: Springer).
Quandt, M., Knoke, B., Groldt, C., Freitag M. & Thoben, K. (2018) General Requirements
for Industrial Augmented Reality Applications. Procedia CIRP, 72, pp. 1130-1135.
Regenbrecht, H.; Baratoff, G.; Wilke, W. (2005): Augmented Reality Projects in the
Automotive and Aerospace Industries. In: IEEE Computer Graphics and Applications, S. 48–
56. DOI: 10.1109/MCG.2005.124.
Reichhart A. & Holweg M. (2008) Build-to-Order: Impacts, Trends and Open s. In: Parry G.,
Graves A. (eds) Build To Order. (London: Springer).
Ringen, G.,Holtskog, H. & Martinsen, K. (2012) User friendly framework for measuring
product and process novelty in the early stages of product development. Procedia CIRP, pp.
513-518
Rios, H., González, E., Rodriguez, C., Siller, H. R. & Contero, M. (2013) A Mobile Solution
to Enhance Training and Execution of Troubleshooting Techniques of the Engine Air Bleed
System on Boeing 737. Procedia Computer Science, pp. 161–170.
Rodriguez, A. & Rodriguez, Y. (2015) Metaphors for today’s leadership: VUCA world,
millennial and “Cloud Leaders”. Journal of Management Development, 34, pp. 854-866.
Rogers, E. M. (1962) Diffusion of innovations (1st ed.) (New York: Free Press).
Rogers, E. M. (2003) Diffusion of innovations (5th ed.) (New York: Free Press).
Rother, M. & Shook, J. (2009) Learning to see: Value-stream mapping to create value and
eliminate muda (Cambridge, MA: Lean Enterprise Inst).
Rürup, M., Röbken, H., Emmerich, M. & Dunkake, I. (2015) Netzwerke im Bildungswesen
- Eine Einführung in ihre Analyse und Gestaltung (Wiesbaden: Springer Fachmedien).
Rumelt, R. (1991) How much does industry matter? Strategic Management Journal, 12, pp.
167-186.
Sakakibara, S., Flynn, B.B. & Schroeder, R.G. (1993) A framework and measurement
instrument for just-in-time manufacturing. Production and Operations Management, 2, pp.
177-194.
Salancik, G. (1995) WANTED: A Good Network Theory of Organization. Administrative
Science Quarterly, 40, pp. 345-349.
Sarkar, A. (2016) We live in a VUCA World: the importance of responsible leadership.
Development and Learning in Organizations, 30, pp. 9-12.
Savelsberg, E., Dorndorf, U. & Weiler, A. (2018) Agile Optimierung in Unternehmen: Das
Unplanbare digital managen (Freiburg: Hafe Group).
Saviotti, P. P. and Pyka, A. (2004) Economic Development by Creation of New Sectors.
Journalof Evolutionary Economics, 14, pp. 1-36.
Seufert, S., Meier, C., Schneider, C., Schuchmann, D. & Krapf, J. (2017)
Geschäftsmodelle für inner- und überbetriebliche Bildungsanbieter in einer zunehmend
digitalisierten Welt. In Erpenbeck, J. & Sauter, W. (eds) Handbuch Kompetenzentwicklung im
Netz : Bausteine einer neuen Lernwelt. (Stuttgart : Schäffer-Poeschel Verlag), pp. 429-448.
Bibliography 160
Schiefele, U. & Pekrun, R. (1996) Psychologische Modelle des fremdgesteuerten und
selbstgesteuerten Lernens. In F. E. Weinert (eds) Psychologie des Lernens und der Instruktion
(Göttingen: Hogrefe), pp. 249-278.
Schmidt, S. (2009) Die Diffusion komplexer Produkte und Systeme: Ein systemdynamischer
Ansatz (Wiesbaden: Springer).
Schmitz, U. (1995) Lean Production als Unternehmensstrategie- ein Überblick. In: Lean
Production I: Idee-Konzept-Erfahrungen in Deutschland (Köln: Wirtschaftsverlag Bachem
GmbH), pp. 17-42.
Schneider, L., Günther, J. & Brandenburg, B. (2010) Innovation and skills from a sectoral
perspective: a linked employer-employee analysis. Economics of Innovation and New
Technology,19, pp. 185-202.
Schmoch, U. (1999) Eignen sich Patente als Innovationsindikatoren, In: Boch, R. (Ed):
Patentschutz und Innovation in Geschichte und Gegenwart (Frankfurt: Peter Lang), pp. 113-
126.
Scholz V.& Kempf M. (2016) Autonomes Fahren: Autos im moralischen Dilemma?. In:
Proff H. & Fojcik T. (eds) Nationale und internationale Trends in der Mobilität
(Wiesbaden: Springer Gabler).
Schuh, G. (2007) Lean Innovation - Die Handlungsanleitung. In: Schuh, G. & Wiegand, B.
(eds) 4. Lean Management Summit - Aachener Management Tage (Aachen Apprimus-
Verlag), p. 7.
Schuh, G., Lenders, M. & Schöning, S. (2007) Mit Lean Innovation zu mehr Erfolg -
Ergebnisse der Erhebung (Aachen: Apprimus-Verlag), pp. 3.
Schulze, A., MacDuffie, A. P. &Täube, F. A. (2015) Introduction: knowledge generation and
innovation diffusion in the global automotive industry - change and stability during turbulent
times, Industrial and Corporate Change, 24, pp. 603-611,
Schumpeter, J. A. (1982) Theorie der wirtschaftlichen Entwicklung (Berlin: Springer).
Schumpeter, J. A. (2005/1947) Kapitalismus, Sozialismus und Demokratie (Tübingen:
Francke).
Sciulli, D. & Gerstein, D. (1985) Social Theory and Talcott Parsons in the 1980s. Annual
Review of Sociology, 11, pp. 369-87.
Shah, R. & Ward, P.T. (2003) Lean manufacturing: context, practice bundles, and
performance. Journal of Operations Management, 21, pp. 129-149.
Sharifi, H., Colquhoun, G., Barclay, I. & Dann, Z. (2001) Agile manufacturing: a
management and operational framework. Proceedings of the Institution of Mechanical
Engineering, pp. 857-868.
Sharma, S., Sarkar, D. &Gupta, D. (2012) Agile processes and methodologies: A conceptual
study. International Journal on Computer Science and Engineering, 4, pp. 892-898.
Siegfried, P. (2016) Hidden Champions - die unbekannten Marktführer: Geutebrück, Rolls
Royce/Liebherr, Mustang, Roto Frank, Heinrich W, Band 1 (München: Akademische
Verlagsgemeinschaft München).
Skarp, F. &Gadde, L. E. (2008) Problem solving in the upgrading of product offerings — A
case study from the steel industry. Industrial Marketing Management, 37, pp. 725-737.
Bibliography 161
Snowden, D. & Boone, M. (2007) A Leaders Framework for Decision Making. Harvard
Business Review, 1, pp. 69-77.
Song C. (2016) Grundlagen und Bedeutung von Patenten. In: Früherkennung von
konvergierenden Technologien. Betriebswirtschaftliche Studien in forschungsintensiven
Industrien ( Wiesbaden: Springer Gabler).
Sugimori, Y., Kusunoki, K., Cho, F. & Uchikawa, S. (1977) Toyota Production System and
Kanban system: materialization of just-intime and respect-for-human system. International
Journal of Production Research, 15, pp. 553-564.
Stacey, R. (2001) Complexity and the group matrix. Group Analysis, 34, pp. 221-241.
Stark, J. (2005) Product Lifecycle Management - 21st Century Paradigm for Product
Realization (New York: Springer).
Stark J. (2015) Product Lifecycle Management. In: Product Lifecycle Management ( 1)
Decision Engineering (Cham:Springer).
Stearns, P.N. (2018) The industrial revolution in world history (New York: Taylor Francis).
Stimson, J., Carmines, E. & Zeller, R. (1978) Interpreting Polynomial Regression.
Sociological Methods & Research, 6, pp. 515-524.
Taylor, M. & Taylor, A. (2012) The technology lifecycle: Conceptualization and managerial
implication. International Journal of Production Economics, 140, pp. 541-553.
Thom, N. (1980) Grundlagen des betrieblichen Innovationsmanagements (Königstein/Ts:
Hanstein).
Tien, J.M. J. (2013) Big Data: Unleashing information Syst. Sci. Syst. Eng., 22, pp 127-151.
Tollefson, J. (2008) Car industry: Charging up the future. Nature, pp. 436-456.
Townsend, J. D. & Calantone R. J. (2013) Evolution and Transformation of Innovation in the
Global Automotive Industry. Journal of Product Innovation Management, 31, pp.4-7.
Tushman, M. L. & O’Reilly, C. A. (2002) The innovative organization. (Boston, MA: Harvard
Business School Publishing).
Urban, J.R. & Hauser, G.L. (1993) Design and Marketing of New Products (New Jersey:
Prentice-Hall).
Utterback,M. J. & Abernathy, J.W.(1975) A dynamic model of process and product
innovation. OMEGA, 3, pp. 639-656.
Van de Ven, A. H., Polley, D. E., Garud, R.& Venkataraman, S. (1999) The innovation
journey (New York: Oxford University Press).
Varis, M. & Littunen, H. (2010) Types of innovation, sources of information and performance
in entrepreneurial SMEs. European Journal of Innovation Management,13, pp.128-154.
Visser, M., Weerd-Nederhof, P., Faems, D., Song, M., Van Looy, B. & Visscher, K. (2010)
Structural ambidexterity in NPD processes: A firm-level assessment of the impact of
differentiated structures on innovation performance. Technovation, 30, pp. 291-299.
Vyatkin, V. (2007) Now that’s smart! Industrial Electronic Magazine,1, pp.17-29.
Wanberg, C. R. & Banas, J. T. (2000) Predictors and outcomes of openness to changes in a
reorganizing workplace. Journal of Applied Psychology, 85, pp. 132-142.
Wang, X.; Ong, S. K. & Nee, A. Y. C. (2016) A comprehensive survey of augmented reality
assembly research. Advances in Manufacturing, pp. 1–22.
Bibliography 162
Warsen, J. & Krinke, S. (2013) Das Lebenszyklus-Konzept von Volkswagen. In:
Siebenpfeiffer W. (ed) Energieeffiziente Antriebstechnologien (Wiesbaden: Springer).
Wasserman, S. & Faust ,K. (1994). Social Network Analysis: Methods and Applications
(Cambridge: Cambridge University Press).
Weissberg, (2006) Creativity: Understanding innovation in problem solving, science,
invention, and the arts. (New Jersey: Wiley & Sons).
Wells, C. (2012) A car country (Washington:University of Washington Press).
Wells, P. (2010). The Automotive Industry in an Era of Eco-Austerity (Cheltenham: Edward
Elgar Publishing).
Wells, P. & Nieuwenhuis, P. (2012) Transition failure: Understanding continuity in the
automotive industry. Technological Forecasting and Social Change, 79, pp. 1681-1692.
Werrlich, S.; Eichstetter, E.; Nitsche, K. & Notni, G. (2017) An Overview of Evaluations
Using Augmented Reality for Assembly Training Tasks. International Journal of Computer
and Information Engineering, 11, pp. 1068–1074.
Werrlich, S., Lorber, C., Nguyen, P. A., Yanez, C. E. & Notni, G. (2018) Assembly
Training: Comparing the Effects of Head-Mounted Displays and Face-toFace Training. In:
Chen J., Fragomeni G. (eds) Virtual, Augmented and Mixed Reality: Interaction, Navigation,
Visualization, Embodiment, and Simulation, pp. 462–476.
Werrlich, S., Nitsche, K. & Notni, G. (2017): Demand Analysis for an Augmented Reality
based Assembly Training. Proceedings of the 10th International Conference on PErvasive
Technologies Related to Assistive Environments, pp. 416–422.
Wilkesmann, U. (1999) Lernen in Organisationen. Die Inszenierung von kollektiven
Lernprozessen (Frankfurt/New York: Campus).
Williams, L. K. & McGuire, S. J. (2008) Economic creativity and innovation implementation:
the entrepreneurial drivers of growth? Evidence from 63 countries. Small Business
Economics, 34, pp. 391-412.
Winkelhake U. (2018a) Car Mobility 2040. In: The Digital Transformation of the
Automotive Industry (Cham: Springer).
Winkelhake U. (2018b) Information Technology as an Enabler of Digitisation. In: The
Digital Transformation of the Automotive Industry (Cham: Springer).
Winkelhake U. (2018c) Roadmap for Sustainable Digitisation. In: The Digital
Transformation of the Automotive Industry (Cham: Springer).
Witte, E. (1973)Organisation von Innovationsentscheidungen: Das Promotoren-Modell
(Göttingen: Schwartz & Co).
Wolf C. & Best H. (2010) Lineare Regressionsanalyse. In: Wolf, C. & Best, H. (eds) Handbuch
der sozialwissenschaftlichen Datenanalyse (Wiesbaden: VS Verlag für Sozialwissenschaften).
Womack, J.P. & Jones, D.T. (1996) Lean Thinking: Banish Waste and Create Wealth in Your
Corporation (New York: Simon & Schuster).
Womack, J., & Jones, D. (2003) Lean Thinking, Banish Waste and Create Wealth in Your
Corporation (rev.) (New York: Free Press).
Womack, J.P., Jones, D.T. & Roos, D. (1990) The Machine that Changed the World. (New
York: Harper Perennial).
Bibliography 163
Xiao, J., Zhou, X. & Hu, W. M. (2017) Welfare analysis of the vehicle Quota System in China.
International Economic Review, 58, pp. 617-650.
Yamashina, H., Ito, T. & Kawada H. (2002) Innovative product development process by
integrating QFD and TRIZ. International Journal of Production Research, 40, pp. 1031-1050.
Yang, J.T. (2004) Job‐related knowledge sharing: comparative case studies. Journal of
Knowledge Management, 8, pp.118-126.
Yan S.H. (2007) Decision-making in self-reconfiguration of knowledgeable manufacturing
system. International Journal of Production Research, 45, pp. 2735-2758.
Zairi, M. (2000) Managing customer satisfaction: a best practice perspective. The TQM
Magazine, 12, pp. 389-394.
Zentes, J., Swoboda, B. & Morschett, D. (2003) Kooperationen, Allianzen und Netzwerke -
Grundlagen, "Metaanalyse" und Kurzarbriss. In: Zentes, J., Swoboda, B. & Morschett, D.:
Kooperationen, Allianzen und Netzwerke: Grundlagen, Ansätze, Perspektiven (Wiesbaden:
Springer), pp. 3-34.
Zhang, Z. (2011) Towards theory building in agile manufacturing strategies-Case studies of an
agility taxonomy. International Journal of Production Economics, pp. 303-312.
Zhou, K.Z. (2006) Innovation, imitation, and new product performance: the case of China.
Industrial Marketing Management, 35, pp. 394-402.
Zündorf, L. (1994) Manager- und Expertennetzwerke in innovativen
Problemverarbeitungsprozessen, In: Sydow, J. & Windeler, A. (eds) Management
interorganisationaler Beziehungen, (Opladen), pp. 244-257.
References Internet
Acatech / BDI (Ed) (2017) Innovationsindikator 2017. Schwerpunkt Digitale Transformation.
Unter Mitarbeit von Weissenberger-Eibl, M.A., Frietsch, R., Schubert, T., Bachlechner, D.,
Beckert, B. &Friedewald, M. acatech - Deutsche Akademie der Technikwissenschaft e.V. /
Bundesverband der Deutschen Industrie e.V. (BDI). Berlin. Link
http://publica.fraunhofer.de/dokumente/N-461384.html. (access 09.10.2017)
Agile Manifesto. (2001). Link: http://agilemanifesto.org/ (access10.10. 2017)
Amirault, J., Chien, J., Garg, S., Gibbons, D., Ross, B., Tang, M., Xing, J., Sidhu, I.,
Kaminsky, P. & Tenderich, B. (2009) The electric vehicle battery landscape: opportunities
and challenges. Center for Entrepreneurship & Technology, Link:
http://large.stanford.edu/courses/2011/ph240/zhong1/docs/BatteryBrief_final.pdf (access
01.08.2018)
Driffield, N. and Karoglou, M. (2016) Brexit and foreign investment in the UK. Social Science
Research Network, Link: http://papers.ssrn.com/sol3/papers.cfm?abstract_id=2775954 (access
20.10.2017).
EPO (2015) Annual Report of the European Patent Office. Link: https://www.epo.org/about-
us/annual-reports-statistics/annual-report/2015.html (access 05.05.2016)
EPO (2018) Jahresbericht 2018. Interview mit EPA-Präsident António Campinos. Link:
https://www.epo.org/about-us/annual-reports-statistics/annual-
report/2018/insights/interview_de.html (access 02.02.2020)
Patentgesetz (1936) Bundesministerium der Justiz. Link:
https://www.bgbl.de/xaver/bgbl/start.xav?start=%2F%2F*%5B%40attr_id%3D%27bgbl1510

Bibliography 164
48.pdf%27%5D#__bgbl__%2F%2F*%5B%40attr_id%3D%27bgbl151048.pdf%27%5D__15
92374349135 (access 02.03.2019)
Schwan, S. & Buder, J. (2001) Didaktische Konzeption. Link: http://milca.sfs.uni‐
tuebingen.de/proj_intern/Eval/eval_descr.htm (access 21.10.2016)
Slaby, S. (2005) Online Recherche in Patentdatenbanken. Link:
https://docplayer.org/14024495-Online-recherche-in-patentdatenbanken-dr-susanna-
slaby.html (access 01.08.2018)
Spath, D. (2013) Produktionsarbeit der Zukunft - Industrie 4.0. Link:
https://www.iao.fraunhofer.de/images/iao-news/produktionsarbeit-der-zukunft.pdf (access
03.08.2019)
VDA (2020) European passenger car market shows modest growth in 2019. Link:
https://www.vda.de/en/press/press-releases/20200116-european-passenger-car-market-shows-
modest-growth-in-2019 (access 02.02.2020)
Zaburdaeva, L., Zobel, D. (2006) TRIZ - Schlüssel zum Erfolg oder Luftblase? Link:
http://www.trizonline.de/uploads/media/artikel_2006_03_01.pdf, (access 23.05.2018).
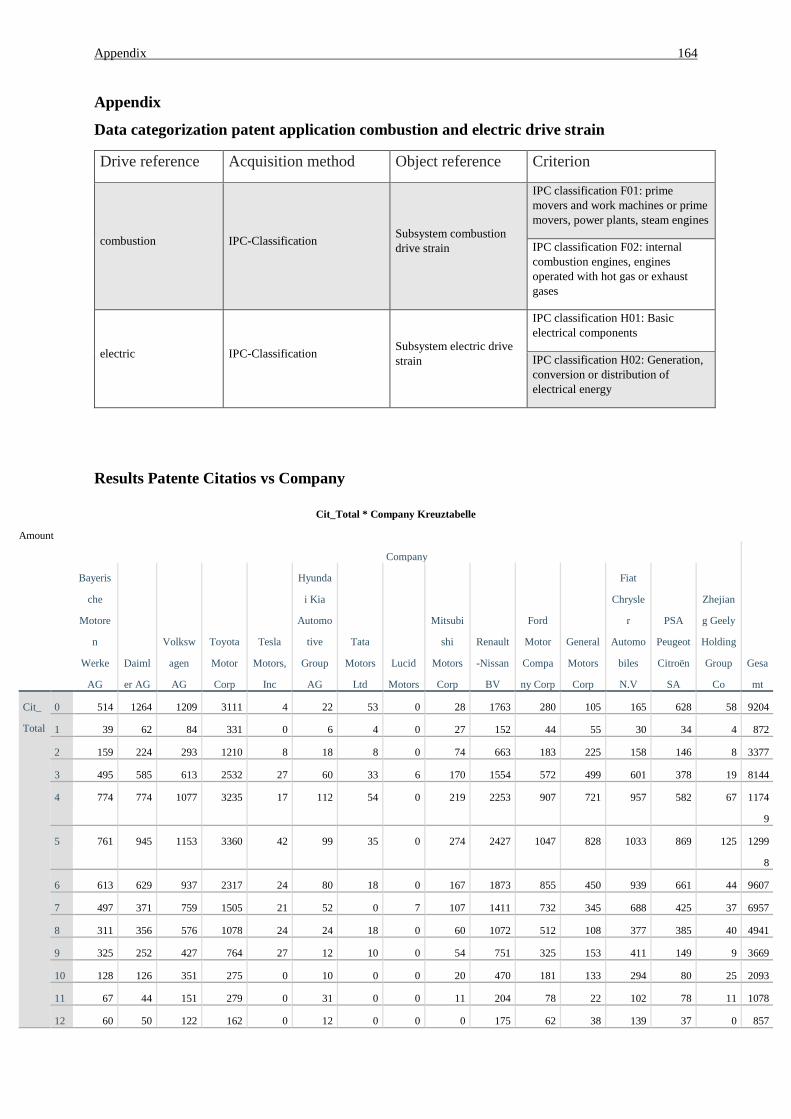
Appendix 164
Appendix
Data categorization patent application combustion and electric drive strain
Drive reference Acquisition method Object reference Criterion
combustion IPC-Classification Subsystem combustion
drive strain
IPC classification F01: prime
movers and work machines or prime
movers, power plants, steam engines
IPC classification F02: internal
combustion engines, engines
operated with hot gas or exhaust
gases
electric IPC-Classification Subsystem electric drive
strain
IPC classification H01: Basic
electrical components
IPC classification H02: Generation,
conversion or distribution of
electrical energy
Results Patente Citatios vs Company
Cit_Total * Company Kreuztabelle
Amount
Company
Gesa
mt
Bayeris
che
Motore
n
Werke
AG
Daiml
er AG
Volksw
agen
AG
Toyota
Motor
Corp
Tesla
Motors,
Inc
Hyunda
i Kia
Automo
tive
Group
AG
Tata
Motors
Ltd
Lucid
Motors
Mitsubi
shi
Motors
Corp
Renault
-Nissan
BV
Ford
Motor
Compa
ny Corp
General
Motors
Corp
Fiat
Chrysle
r
Automo
biles
N.V
PSA
Peugeot
Citroën
SA
Zhejian
g Geely
Holding
Group
Co
Cit_
Total
0 514 1264 1209 3111 4 22 53 0 28 1763 280 105 165 628 58 9204
1 39 62 84 331 0 6 4 0 27 152 44 55 30 34 4 872
2 159 224 293 1210 8 18 8 0 74 663 183 225 158 146 8 3377
3 495 585 613 2532 27 60 33 6 170 1554 572 499 601 378 19 8144
4 774 774 1077 3235 17 112 54 0 219 2253 907 721 957 582 67 1174
9
5 761 945 1153 3360 42 99 35 0 274 2427 1047 828 1033 869 125 1299
8
6 613 629 937 2317 24 80 18 0 167 1873 855 450 939 661 44 9607
7 497 371 759 1505 21 52 0 7 107 1411 732 345 688 425 37 6957
8 311 356 576 1078 24 24 18 0 60 1072 512 108 377 385 40 4941
9 325 252 427 764 27 12 10 0 54 751 325 153 411 149 9 3669
10 128 126 351 275 0 10 0 0 20 470 181 133 294 80 25 2093
11 67 44 151 279 0 31 0 0 11 204 78 22 102 78 11 1078
12 60 50 122 162 0 12 0 0 0 175 62 38 139 37 0 857

Appendix 165
13 53 13 85 78 0 0 0 0 13 132 40 0 30 14 0 458
14 28 56 87 115 0 0 0 0 14 85 28 14 14 14 0 455
15 30 20 95 0 0 0 0 0 0 15 15 0 32 15 0 222
16 35 0 66 17 0 0 0 0 0 58 49 0 36 0 0 261
17 0 0 70 17 0 0 0 0 0 0 53 17 34 0 20 211
18 0 0 19 0 0 0 0 0 0 36 0 0 0 0 0 55
19 21 0 19 0 0 0 0 0 0 0 0 0 38 0 0 78
20 20 0 0 0 0 0 0 0 0 0 0 0 0 0 0 20
21 0 0 0 21 0 0 0 0 0 0 21 0 21 0 0 63
22 0 0 0 22 0 0 0 0 0 0 24 0 0 0 0 46
25 0 0 26 0 0 0 0 0 0 0 0 0 28 0 0 54
26 0 0 0 0 0 0 0 0 0 0 0 0 30 0 0 30
30 0 0 0 0 0 0 0 0 0 0 0 0 31 0 0 31
31 0 0 0 0 0 0 0 0 0 0 0 0 32 0 0 32
Gesamt 4930 5771 8219 20429 194 538 233 13 1238 15094 6008 3713 6220 4495 467 7756
2
Appendix 166
Curriculum Vitae
Name: Carolin Pischl
Address: Alpspitzstraße 2,
82491 Grainau
Germany
Telephone: +49 176 32722849
E-Mail: [email protected]
Nationality: German
Date of Birth: 22.05.1990
Professional Experience
06/2018-until today BMW Group Munich
Specialist Production, Department of Technical Planning
07/2016-until today University of Hohenheim
PhD Student at the Institute of Innovation Economics
02/2016-06/2018 BMW Group Munich
BMW PhD Program (Department Production System and
Planning)
06/2015-12/2015 BMW Group Munich
Internship: human resources development and change management
08/2014-04/2015 Prisma World AG, Zurich
Working Student (Project Consultant): Assessments und HR-IT
Software
04/2014-08/2014 BMW Group, Munich
Bachelor thesis: human resources development
The ideal design of training products considering a cost-benefit
analysis
10/2013- 04/2014 BMW Group, Munich
Internship: human resources development
07/ 2013– 10/ 2013 Personic GmbH, Munich
Internship: HR Consulting, Recruiting
08/2012 – 09/2012 Kbo-Lech-Mangfall-Klinik, Garmisch-Partenkirchen
Internship: clinical Psychology
Appendix 167
05/2010 – 01/2012 Wellcon-Gesellschaft für Prävention und
Arbeitsmedizin, Innsbruck
Back Office: Secretary
Education
09/2014-03/2016 University of Zurich
Master of Science Social, Organisational and Business Psychology
10/2009-07/2013 Leopold-Franzens-University of Innsbruck
Bachelor of Science Psychology
02/2010-03/2010 Asian Studies Program Philippines 2010 in Quezon City at the
University of the Philippines and in Cebu at the University of
San Carlos
2000-2009 Werdenfels-Gymnasium, Garmisch-Partenkirchen
1996-2000 Grund- und Hauptschule, Mittenwald (elementary school)
________________________________________
Carolin Pischl
Grainau, 07.07.2020
Appendix 168
Appendix 169
Appendix 170
Appendix 171
Co-Authorship Declaration
Tim Weisser
Carolin Pischl (geb. Lorber), [email protected]
Kaizen 4.0 towards an Integrated Framework for the Lean-Industry 4.0
Transformation
Proceedings for the Future Technology Conference (FTC), pp. 692-709.
Univ.-Prof. Dr.-Ing. Peter Burggräf, [email protected]
Dr.-Ing. Johannes Wagner, [email protected]
Prof. Dr. Andreas Pyka, [email protected]
Tim Weisser, [email protected]
x
x
Appendix 172
Univ.-Prof. Dr.-Ing. Peter Burggräf and Dr.-Ing. Johannes Wagner
Carolin Pischl (geb. Lorber), [email protected]
Kaizen 4.0 towards an Integrated Framework for the Lean-Industry 4.0
Transformation
Proceedings for the Future Technology Conference (FTC), pp. 692-709.
Univ.-Prof. Dr.-Ing. Peter Burggräf, [email protected]
Dr.-Ing. Johannes Wagner, [email protected]
Prof. Dr. Andreas Pyka, [email protected]
Tim Weisser, [email protected]
x
x
Appendix 173
Prof. Dr. Andreas Pyka
Carolin Pischl (geb. Lorber), [email protected]
Kaizen 4.0 towards an Integrated Framework for the Lean-Industry 4.0
Transformation
Proceedings for the Future Technology Conference (FTC), pp. 692-709.
Univ.-Prof. Dr.-Ing. Peter Burggräf, [email protected]
Dr.-Ing. Johannes Wagner, [email protected]
Prof. Dr. Andreas Pyka, [email protected]
Tim Weisser, [email protected]
x
x
Appendix 174
Stefan Werrlich
Carolin Pischl (geb. Lorber), [email protected]
Assembly Training: Comparing the Effects of Head-Mounted Displays and Face-to-Face Training
Chen J., Fragomeni G. (Eds) Virtual, Augmented and Mixed Reality: Interaction, Navigation, Visualization,
Embodiment and Simulation, pp. 462-476.
Stefan Werrlich, [email protected]
Carlos Emilio Franco Yanez, [email protected]
Phuc-Anh Nguyen, [email protected]
Univ.-Prof. Dr. rer. Nat. Gunther Notni; Technische Universität Ilmenau; qualimess@tu-
illmenau.de
x
x
Appendix 175
Univ.-Prof. Dr. rer. nat. Gunther Notni
Carolin Pischl (geb. Lorber), [email protected]
Assembly Training: Comparing the Effects of Head-Mounted Displays and Face-to-Face Training
Chen J., Fragomeni G. (Eds) Virtual, Augmented and Mixed Reality: Interaction, Navigation, Visualization,
Embodiment and Simulation, pp. 462-476.
Stefan Werrlich, [email protected]
Carlos Emilio Franco Yanez, [email protected]
Phuc-Anh Nguyen, [email protected]
Univ.-Prof. Dr. rer. Nat. Gunther Notni; Technische Universität Ilmenau; qualimess@tu-
illmenau.de
x
x
Appendix 176
Carlos Emilio Franco Yanez
Carolin Pischl (geb. Lorber), [email protected]
Assembly Training: Comparing the Effects of Head-Mounted Displays and Face-to-Face Training
Chen J., Fragomeni G. (Eds) Virtual, Augmented and Mixed Reality: Interaction, Navigation, Visualization,
Embodiment and Simulation, pp. 462-476.
Stefan Werrlich, [email protected]
Carlos Emilio Franco Yanez, [email protected]
Phuc-Anh Nguyen, [email protected]
Univ.-Prof. Dr. rer. Nat. Gunther Notni; Technische Universität Ilmenau; qualimess@tu-
illmenau.de
x
x
Appendix 177
Phuc-Anh Nguyen
Carolin Pischl (geb. Lorber), [email protected]
Assembly Training: Comparing the Effects of Head-Mounted Displays and Face-to-Face Training
Chen J., Fragomeni G. (Eds) Virtual, Augmented and Mixed Reality: Interaction, Navigation, Visualization,
Embodiment and Simulation, pp. 462-476.
Stefan Werrlich, [email protected]
Carlos Emilio Franco Yanez, [email protected]
Phuc-Anh Nguyen, [email protected]
Univ.-Prof. Dr. rer. Nat. Gunther Notni; Technische Universität Ilmenau; qualimess@tu-
illmenau.de
x
x

Appendix 178
Tobias Stäudel
Carolin Pischl (geb. Lorber), [email protected]
VPS Center
Lorber C. & Stäudel T. (2019) VPS Center. In: Abele, E., Metternich, J., Tisch, M. (Eds) Learning
Factories. Concepts, Guidelines, Best-Practice Examples (Berlin: Springer), pp. 458-459.
Tobias, Stäudel, Tobias.Stä[email protected]
x
x
Appendix 179
Burggräf, P., Lorber, C., Pyka, A., Wagner, J. & Weisser, T. (2020) Kaizen 4.0 towards an
Integrated Framework for the Lean-Industry 4.0 Transformation. Proceedings of the Future
Technologies Conference (FTC), pp. 692-709.
Deutsch: Konkrete Konzepte, Methoden und Technologieprojekte auf operativer Ebene
können nicht mehr mit etablierten Methoden aus den Feldern Lean und Industrie 4.0 umgesetzt
werden um den steigenden Kundenansprüchen, wachsendem Wettbewerbsdruck, und streben
nach Individualität im Produktdesign gerecht zu werden. Eine zielgerichtete Auswahl und
Bewertung von Projekten ist nötig, um gesteckte Ziele zu erreichen und wettbewerbsfähig zu
bleiben. Als Basis dient die Arbeit von Spath et al. 2017 und Schuh et al. 2017, um in einem
modellbasierten Ansatz die Komplexitätsreduktion bei anspruchsvollen
Entscheidungsfindungen bei der Transformationen von Lean zu Digitalisierung und Industrie
4.0 zu erörtern und anhand eines Reifegrad- und Verfahrensmodell darzustellen, wie Projekte
ausgewählt und beurteilt werden können, die der Zielkonfiguration den Unternehmens
entsprechen.
English: Concrete concepts, methods and technology projects at the operational level can no
longer be implemented with established methods from the fields of Lean and Industry 4.0 in
order to meet increasing customer demands, growing competitive pressure and strive for
individuality in product design. A targeted selection and evaluation of projects is necessary in
order to achieve and maintain set goals. The work by Spath et al. 2017 and Schuh et al. 2017 is
the basis, in order to establish a model-based approach to discuss the reduction of complexity
in demanding decision-making in the transformation from lean to digitization and Industry 4.0
and to use a maturity and process model to illustrate how projects can be selected and evaluated
that correspond to the company's target configuration.
Lorber C. & Stäudel T. (2019) VPS Learing Factory. In: Abele, E., Metternich, J., Tisch, M.
(eds) Learning Factories. Concepts, Guidelines, Best-Practice Examples. (Berlin: Springer),
pp. 335-459.
Deutsch: Die Motivation, der Hintergrund und die didaktischen Grundlagen der Lernfabrik
zum Thema WPS werden erörtert. Das VPS Center dient als Best-Practice-Beispiele einer
Lernfabrik und wird detailliert und strukturiert vorgestellt. Es werden der aktuelle Stand der
Lehrplangestaltung sowie deren Einsatz zur Förderung von Lernen und Forschung sowie
Potenziale und Grenzen aufgezeigt. Anhand praktischer Beispiel wird aufgezeigt wie die
Lernfabrik im Trainingsalltag eingesetzt wird um unterschiedliche Zielgruppen im
Produktionsprozess zu schulen. Zusätzlich wird anhand von Beispielen wie Augmented
Reality erörtert, welchen nutzen die Lernfabrik für Forschungsthemen darstellt.
English: The motivation, the background and the didactic basics of the learning factory on the
subject of VPS are discussed. The VPS Center of the BMW Group serves as best practice
examples of a learning factory and is presented in a detailed and structured manner. The
current status of curriculum design and its use to promote learning and research as well as
potential and limits are shown. Using practical examples, it is shown how the learning factory
is used in everyday training to train different target groups in the production process. In
addition, examples such as augmented reality are used to discuss the benefits the learning
factory provides for research topics.
Appendix 180
Werrlich, S., Lorber, C., Nguyen, P. A., Yanez, C. E. & Notni, G. (2018) Assembly
Training: Comparing the Effects of Head-Mounted Displays and Face-toFace Training. In:
Chen J., Fragomeni G. (eds) Virtual, Augmented and Mixed Reality: Interaction, Navigation,
Visualization, Embodiment, and Simulation, pp. 462–476.
Deutsch: Interaktive Assistenzsysteme (z. B. Head Mounted Displays) dienen in heutigen
Trainingssituationen dazu Mitarbeiter möglichst Realitätsnah zu schulen. In dieser Arbeit wird
mittels einer empirischen Studie in der BMW internen Lernfabrik der Unterschied zwischen
konventionellem Anlernen mit einem Trainer versus Anlernen durch Augemented Reality
Brillen untersucht. Die Ergebnisse zeigen, dass es keinen Unterschied zwischen den beiden
Anlernmethoden gibt, und sogar durch HMD-Unterstützung 10 % weniger
Kommissionierfehler, 5 % weniger Montage Fehler und 60% weniger Nacharbeit verursacht
wurden. Die HMD-Anlernmethode stellte sich allerdings als deutlich langsamer im Vergleich
zu einem Trainer heraus.
English: Interactive assistance systems (e.g. Head Mounted Displays) are used in today's
training situations to train employees as realistically as possible. This work uses an empirical
study in the BMW internal learning factory to investigate the difference between conventional
learning with a trainer versus learning with augmented reality glasses. The results show that
there is no difference between the two training methods and that even with HMD support, 10%
fewer picking errors, 5% fewer assembly errors and 60% less rework were caused. However,
the HMD learning method turned out to be significantly slower compared to a trainer.

![SQF 2000 [Compatibility Mode]](https://img.dokumen.tips/doc/110x75/635f3d63baefa9d0dc042eb7/sqf-2000-compatibility-mode.jpg)


![Penelitian Deskriptif.ppt [Compatibility Mode]](https://img.dokumen.tips/doc/110x75/635d0314a3fa66b45c0e313c/penelitian-deskriptifppt-compatibility-mode.jpg)
![SEJARAH OLAHRAGA [Compatibility Mode]](https://img.dokumen.tips/doc/110x75/631f15353b43b66d3c0f9a14/sejarah-olahraga-compatibility-mode.jpg)


![cjc 2021.02.03[Compatibility Mode]](https://img.dokumen.tips/doc/110x75/631345ddaca2b42b580d1e73/cjc-20210203compatibility-mode.jpg)


![MotionInOneDimension [Compatibility Mode]](https://img.dokumen.tips/doc/110x75/6321f138ae0f5e819105ac57/motioninonedimension-compatibility-mode.jpg)

