Embed Size (px)
Citation preview

NBER WORKING PAPER SERIES
TECHNOLOGICAL PROGRESS AND HEALTH CONVERGENCE:THE CASE OF PENICILLIN IN POST-WAR ITALY
Marcella AlsanVincenzo AtellaJay BhattacharyaValentina Conti
Iván Mejía-GuevaraGrant Miller
Working Paper 25541http://www.nber.org/papers/w25541
NATIONAL BUREAU OF ECONOMIC RESEARCH1050 Massachusetts Avenue
Cambridge, MA 02138February 2019
We would like to thank Giovanni Vecchi for useful discussion and comments during the early stage of this research project. Alsan gratefully acknowledges support from the Eunice Kennedy Shriver National Institute of Child Health and Human Development (NICHD) 5K01-HD084709. Bhattacharya thanks the National Institute on Aging (NIA) for support for this work through the Stanford Center for Demography and Economics of Health and Aging (5P30AG017253). Lena Schoemaker, Afia Khan, Anlu Xing and Morgan Foy provided excellent research assistance. The views expressed herein are those of the authors and do not necessarily reflect the views of the National Bureau of Economic Research.
NBER working papers are circulated for discussion and comment purposes. They have not been peer-reviewed or been subject to the review by the NBER Board of Directors that accompanies official NBER publications.
© 2019 by Marcella Alsan, Vincenzo Atella, Jay Bhattacharya, Valentina Conti, Iván Mejía-Guevara, and Grant Miller. All rights reserved. Short sections of text, not to exceed two paragraphs, may be quoted without explicit permission provided that full credit, including © notice, is given to the source.
Technological Progress and Health Convergence: The Case of Penicillin in Post-War ItalyMarcella Alsan, Vincenzo Atella, Jay Bhattacharya, Valentina Conti, Iván Mejía-Guevara,and Grant MillerNBER Working Paper No. 25541February 2019JEL No. I10,J10,N00
ABSTRACT
Throughout history, technological progress has transformed population health, but the distributional effects of these gains are unclear. New substitutes for older, more expensive health technologies can produce convergence in population health outcomes, but may also be prone to “elite capture” leading to divergence. This paper studies the case of penicillin using detailed mortality statistics and exploiting its sharply-timed introduction in Italy after World War II. We find penicillin reduced both the mean and standard deviation of infectious diseases mortality, leading to substantial convergence across disparate regions of Italy. Our results do not appear to be confounded by competing risks or mortality patterns associated with World War II.
Marcella AlsanStanford Medical SchoolCenter for Health Policy/PCOR117 Encina Commons, Room 218Stanford, CA 94304and [email protected]
Vincenzo AtellaUniversity of Rome Tor [email protected]
Jay Bhattacharya117 Encina CommonsCHP/PCORStanford UniversityStanford, CA 94305-6019and [email protected]
Valentina ContiFood and Agriculture Organization ofthe United NationsViale delle Terme di CaracallaRome [email protected]
Iván Mejía-GuevaraCenter for Population Health SciencesStanford UniversityStanford, CA [email protected]
Grant MillerCHP/PCORStanford University117 Encina CommonsStanford, CA 94305-6019and [email protected]
I Introduction
Technological progress in medicine has been described as a leading explanation for the in-
crease in post-World War II era (Davis 1956; Preston 1975; Easterlin 1999; Mokyr 2002;
Acemoglu and Johnson 2007) and is often put forth as a solution to health challenges in
developing countries. Yet technological progress can also have unintended consequences for
the distribution of disease. If only elites can afford a health technology, or if a technology is
a private good that might substitute for public good provision, such innovation could widen
health disparities, at least initially (Mosca 1939; Olson 1965; Kremer and Willis 2016; Ashraf
et al. 2016). Alternatively, “breakthrough” health technologies that are less expensive may
supplant older, more expensive ones may encourage population health convergence.
In this paper, we analyze the effects of the introduction of penicillin, arguably one of
the most important medical technologies of the twentieth century (Tomes 1990, 1998). Dis-
covered to kill Staphylococcus bacteria by Alexander Fleming in 1928 – and successfully
isolated and produced by Howard Florey, Ernst Chain, and Norman Heatley in 1939 –
this new “miracle drug” quickly became the first-line treatment for pneumonia, diphtheria,
syphilis, gonorrhea, scarlet fever, and other infectious diseases (Dowling 1977; Levy 1992).1
Penicillin’s achievements were preceded by those of sulfa agents, the first chemotherapy de-
veloped to fight infection and the subject of scholarship by Jayachandran, Lleras-Muney
and Smith (2010), who find the introduction of sulfa drugs led to impressive reductions in
maternal mortality and pneumonia deaths in the historical United States.2
We build off the Jayachandran et al. (2010) study in two ways: first, by exploring the
role penicillin had on average mortality in Italy following its introduction by the United
1The Lancet published a high-profile article in 1943 entitled “General and Local Administration of Peni-cillin,” describing the effectiveness of penicillin in treating wounded soldiers in North Africa (Florey andFlorey 1943). Some scholars estimate that penicillin saved at least 300,000 lives during the Second WorldWar (Dowling 1977; Levy 1992; Ratcliff 1945).
2Conybeare (1948), Loudon (1988), and Mackenbach and Looman (1998) also provide suggestive evidenceon the importance of antibiotics. By contrast, some studies suggest that penicillin did not have the dramaticeffect commonly attributed to it (Hemminki and Paakkulainen (1976) studying Finland and Sweden, forexample).
1
Nations in the aftermath of World War II, and second, and more generally, by documenting
the effects of the technology on the distribution of mortality.3 Some scholars suggest that the
distribution of new technologies, even inexpensive ones, often benefit the elite first (Brenzel
and Claquin 1994). Others suggest that more portable technologies which do not require
large scale infrastructure investments are less prone to elite capture and have considerable
potential to improve population health (Acemoglu and Robinson 2008; Mosca 1939; Olson
1965). For penicillin, this could be particularly true given that political decision-making
often targeted expensive water and sanitation infrastructure – which can greatly reduce the
spread of infectious diseases – towards more elite neighborhoods and communities (Bigatti
2014; Massarutto 2011; Picci 2002; Troesken 2004). Finally, technological progress may
be “necessary” but not “sufficient” for health convergence – institutions may be critical to
ensure benefits are distributed to those most in need.
To study the distributional consequences of the introduction of penicillin, we assemble a
dataset of Italian vital records spanning much of the twentieth century (Atella, Francisci and
Vecchi, 2017). We use these data to estimate the contribution of penicillin to infectious dis-
ease mortality decline in Italy during the twentieth century. Focusing on the years between
1924 and 1955, we first establish its average effect on mortality by interacting the sharp tim-
ing of penicillin introduction with causes of death sensitive to penicillin, controlling for time-
and region-level effects as well as regional linear time trends. We then estimate penicillin’s
effect on the distribution of mortality in four ways: first, by analyzing changes in the age
distribution of deaths over time, using Kolmogorov-Smirnov (KS) tests to detect significant
differences in these distributions year-by-year; second, using our econometric approach akin
to our framework for studying mean reductions in mortality rates, but testing for differential
declines by initial level of infectious disease death rates; third, testing for β-convergence,
following the literature on macroeconomic growth and economic convergence (Barro and
Sala-i-Martin 1992); and, fourth, testing for σ-convergence by estimating the relationship
3Sulfa drugs are distinct from beta-lactam antibiotics, of which penicillin is the first developed (Mandell,Douglas and Bennett 2010).
2
between penicillin introduction and changes in the standard deviation of regional mortality
rates (Janssen et al. 2016).
We find sharply-timed reductions in penicillin-sensitive mortality rates across Italy that
closely coincide with the introduction of penicillin in 1947. There are no trend differences
between penicillin-sensitive and penicillin-insensitive diseases prior to 1947, and the subse-
quent decline of about 0.3 deaths per thousand annually represents a 66% reduction relative
to the average rate of penicillin-sensitive deaths in earlier years. Then, using all four esti-
mation approaches, we find clear evidence of mortality rate convergence across regions of
Italy. Relative to years prior to 1947, the introduction of penicillin reduced the disper-
sion of penicillin-sensitive mortality rates across regions by 68%, explaining 40% of all-cause
convergence over this period.
We also consider two important threats to the internal validity of our analyses. The
first is competing risks. Because our estimation framework relies on comparisons between
penicillin-sensitive and penicillin-insensitive diseases, reductions in penicillin-sensitive deaths
could mechanically increase non-communicable disease (NCD) mortality as those benefitting
from penicillin live long enough to suffer and die from non-infectious causes. We show that
competing risks are not a threat in practice because the decline in penicillin sensitive death
rates is present when examining a simple change over time (i.e. not making comparisons with
NCDs). Furthermore, even when the sample time frame is limited to a very short window
following pencillin’s debut, thereby reducing the movement of infectious disease survivors
into deaths due to non-infectious causes, we still find statistically significant and medically
meaningful effects. The second issue is that penicillin was introduced shortly after the end of
World War II. Infectious disease mortality rates commonly surge during wartime (Erdem et
al. 2011; Zapor and Moran 2005), so their decline relative to non-infectious mortality rates
could partly reflect the end of conflict and regression to the mean. However, our results
are similar across areas with varying degrees of war-related destruction and are robust to
excluding years 1943–1945 (the years of most intense conflict in Italy) from our estimation.
3
The paper proceeds as follows. Section II provides historical background on public health
in Italy and the introduction of penicillin, and Section III describes the construction of the
dataset. Section IV focuses on the role of penicillin for mean reductions in mortality, and
examines penicillin’s contributions to population health convergence. Section V presents es-
timation results. Section VI considers competing risks and presents other robustness checks,
and Section VII concludes.
II Background
II.A Early Efforts to Combat Infectious Disease Mortality in Italy
At the time of unification in 1861, life expectancy at birth in Italy was approximately 29
years, and the crude death rate was about 35 per 1,000 people (Atella, Francisci and Vecchi,
2017). In 1887, Francesco Crispi’s government introduced the country’s first sanitary reforms
under the Crispi-Pagliani law.4 However, infectious disease deaths in Italy did not begin to
decline until the early twentieth century, which historians link to improvements in municipal
hygiene under provisions of the law governing water quality and sanitation in urban areas
(Giovannini 1996; Giuntini 1999; Pogliano 1984). During fascist rule (1920-1943), public
health initiatives targeted the so-called “triple endemic diseases:” malaria, syphilis, and
tuberculosis.5
Italy’s nascent healthcare system and reforms often failed to reach its poorest members
(Giovannini 1996; Giuntini 1999; Pogliano 1984).6 Municipal authorities were responsible
for providing healthcare to the indigent, yet in practice private charitable organizations
4The establishment of a health system is interpreted by historians as one of the most important achieve-ments of Italian “political and moral life” at the beginning of the new Kingdom [Croce (1928), cited inCosmacini (2005), p. 345].
5The most important provisions focused on malaria were issued between 1923 and 1934 through a seriesof laws designed to arrive at a thorough land reclamation operation (bonifica integrale). The ConsolidationAct on the reclamation of marshlands was approved with Royal Decree no. 3256 of 30 December 1923. Lawno. 3134 of 24 December 1928, called the “Mussolini Law,” granted financial resources to land reclamationand provided for integration regarding the supply of drinking water and the construction of rural buildings,hamlets, and roads.
6The law’s principles of universalism became effective only in 1978, when the Italian National HealthService System (SSN) was established.
4
provided these services (Opere Pie, or “Pious Organizations”).7 A Royal Decree in 1884
established that private firms could invest in the water sector (Ermano and Massarutto
2012). Massarutto (2011) argues this decree and the ensuing privatization directed water
supply towards the wealthy in urban areas. As late as the 1950s, only 52% of private houses
in Italy received potable water (Doria 2010), and only 7% had all three utilities: potable
water, adequate sanitation, and electricity (Barra Bagnasco 1996).8
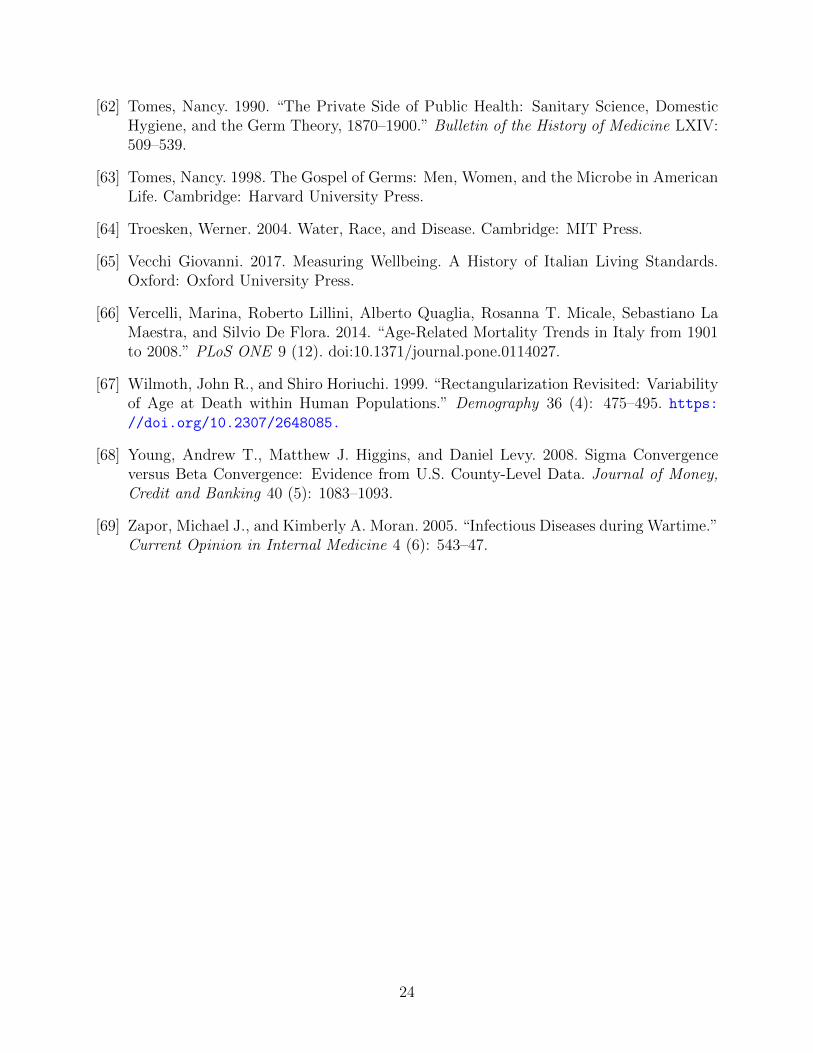
Mortality rates in Italy declined on average during the early- to mid-1900s (see Figure
1), though wide regional health disparities in infectious disease mortality were prevalent at
the beginning of this period (Figure 2, Panel A). Nationally, life expectancy at birth in Italy
rose to 40-45 years – but varied by as much as 12 years across regions.9 These regional
disparities peaked in 1925-1930, remained high until WWII, and then declined sharply at
the end of the war. Understanding whether the introduction of penicillin contributed to the
compression of regional mortality rates is a central focus of this paper.
II.B The Advent of Penicillin in Italy
The supply of penicillin in Italy began in 1947 (Luzzi 2004). In its early stage of distribution
(1945 and 1946) penicillin was available in Italy through international aid only, imported by
the UNRRA (United Nations Relief and Rehabilitation Administration) channel and limited
in quantity. At that time the black market was flourishing. Therefore, having enough money
and connections, people could reach for the drug (the initial distribution of penicillin in Italy
by the US Army started with the main intent of using it to treat the spreading of venereal
7The “non-poor” generally used services provided by individual private-practice doctors (medici libero-esercenti) who made home visits.
8Until the end of WWII, national public spending for infrastructure was concentrated in the North. Onpublic investments in water, a Royal Decree issued in 1884 created a dualism in the management of waterservices: water was public, but private companies could invest in the sector once awarded government licenses(Ermano 2012). As a result, water was largely provided to wealthy families in urban areas (Massarutto2011). Although many subsequent laws governing water management were issued between 1861 and 1950,universalism in the water sector was not achieved until the late 1950s (Mantelli and Temporelli 2007).Modern water infrastructure in poorer southern regions was completed only in the late 1980s (Mantelli andTemporelli, 2007).
9During the 1920s the regional variation in life expectancy at birth was almost as large as that estimatedfor Indian states between 2011 and 2016 – ranging from 61.5 years in Madhya Pradesh to 77 years in Kerala(Ponnapalli et al., 2013).
5
diseases). To resolve this problem ENDIMEA (Ente Nazionale Distribuzione Medicinali
agli Alleati) was established, which began its work on October 1st, 1944. Since January
1st, 1945, each provincial health office began to communicate to the General Directorate
of Public Health (DGSP), within the Ministry of the Interior, estimates of the demand for
medicines for the quarter. The DGSP, based on the requests and the availability of drugs,
granted the drugs to the applicants, informing ENDIMEA to ship the product to the local
private wholesalers. Once the wholesaler collected the drugs, he was responsible for the
distribution of medicines to the Provincial Health Offices. The latter also had an obligation
to follow the drug during the journey from the wholesaler warehouse to the pharmacies or
hospitals, in order to prevent theft and illegal sales.10
Italian patients could receive the new drug free of charge if requested by their physicians.
Provincial Health Offices were held accountable for any shortages of medicines, and phar-
macists received a high margin for the sale of antibiotics, which discouraged the emergence
of an underground market favoring the wealthy (Battini 1946; Luzzi 2004).
III Data
III.A Vital Statistics Data11
The Italian National Statistical Office (ISTAT) provides national vital statistics in annual
Health Statistics Yearbooks (Annuario di Statistiche Sanitarie) starting from 1887. Vital
statistics for years 1924-1955 were digitized at the region-year-cause of death level.12
Harmonizing Regions. ISTAT data provides death counts for Italy’s regions over time.
10 The Italian health authorities were responsible for any shortages of medicines. In the spring of 1945the drug became available via physician prescription, but only in the City Public Health Offices (Ufficiod’Igiene). In 1947, the pharmaceutical company “SPA Milan” became the first private Italian company tomarket antibiotics, selling Supercillin (in vials) and Prontocillin (tablets). A year later, the Anglo-Americanmonopoly over penicillin was broken by Domenico Marotta, then-director of the Istituto Superiore di Sanit,who called Ernst Chain to lead the International Centre for Microbiological Chemistry in Rome.
11For a complete description of the vital statistics, see Appendix A.12To the best of our knowledge, formal demographic analyses of the quality and completeness of Italy’s
historical mortality statistics have not been published. However, Italian vital statistics back to the nineteenthcentury are included in the Human Mortality Database (HMD), and data quality is a central criterion forHMD inclusion. http://www.mortality.org/. (Data documentation for Italy HMD available at: http:
//www.mortality.org/hmd/ITA/InputDB/ITAcom.pdf).
6
Due to changes in administrative regional borders over our period of investigation, we had
to aggregate some regions. From 1924 until the end of WWII, Italy was organized into
18 administrative regions with only minor changes across region borders. The only excep-
tion was the establishment of Valle dAosta in September 1945. For this reason, to obtain
a harmonized regional dataset from 1924 to 1954 we treat Piedmont and Valle dAosta as
a single region. Thus, our sample includes the following 18 regions: Piedmont and Valle
d’Aosta, Lombardy, Trentino Alto Adige, Veneto, Friuli Venezia Giulia, Liguria, Emilia Ro-
magna, Tuscany, Umbria, Marche, Lazio, Abruzzi and Molise, Campania, Apulia, Basilicata,
Calabria, Sicily and Sardinia.13
Harmonizing Cause of Death. Officially, ISTAT assumed the responsibility of collecting
mortality data at individual level only in 1930, following Law no. 2238 issued in December
1929. Previously, the statistical office was within the Ministry of Agriculture, Industry and
Trade via Indagine sulle cause di morte. ISTAT collects this information using an official
reporting format (“Scheda di morte”) following international standards recommended by the
World Health Organization (WHO). These individual death certificates consist of two parts.
A general practitioner or coroner certifies the first part and ascribes cause. The “initial
cause” – disease or trauma – is recorded, which may have led to additional complications
but initiated a causal chain leading to death. Diagnostic codes are then assigned to each
death using WHO International Classification of Diseases (ICD) criteria. The second part
is completed by a municipal civil registrar and includes information about the demographic
and social characteristics of the deceased.
Causes of death reported in Italy’s vital records change over time. We therefore use
categories that can be consistently identified and tracked across all study years, effectively
adopting the classification used in 1956–1957 for all years of our analysis (1924–1955).14 We
13For sake of completeness, in December 1963 the region of Molise was established by splitting the “Abruzziand Molise” into two distinct regions. This last change brought Italy to have the current administrativestructure based on 20 regions.
14The 17 causes of death are the following: infective and parasitic diseases; tumors; allergic and endocrineglands diseases; blood and hematopoietic diseases; psychic and personality disorders; nervous system diseases;circulatory system diseases; respiratory system diseases; digestive system diseases; genitourinary system dis-
7
then classify each of these causes that can be consistently tracked over time according to
whether or not it can be treated with penicillin. Ultimately, this process yields 79 penicillin-
insensitive, 15 penicillin-sensitive, and 15 unclassified diseases.15 In our analysis of cause-
specific mortality we exclude unclassified deaths.
Constructing war related destruction indicator. We measure destruction related to World
War II using the number of military and civilian deaths directly related to war causes at the
regional level that occurred between 1940 and 1945 (ISTAT 1957).16
Constructing Rates. Finally, using death counts by region, year, and cause, we construct
mortality rates using data on regional populations in Italy over time. Specifically, to create
population denominators, we use regional population counts from Italy’s decennial popula-
tion censuses provided by ISTAT. For inter-censual years, population estimates accounting
for births and deaths provides estimates of this population construction process using several
sources of population data (Vecchi, 2017; see Appendix A for more details).17
eases; complications of pregnancy; skin and tissue diseases; bones and locomotive organs diseases; congenitalmalformations; early childhood particular diseases; senility and pathologic states; accidents, traumatisms,and poisonings. The coding system adopted during years 1924–1955 has changed from the InternationalAnalytical Classification (IAC) to the ISTAT Intermediate Classification (IIC) adopted in subsequent years.Moreover, from 1958 onwards, there is a higher disaggregation of diseases with respect to years 1956–1957,due to the inclusion of new death-related causes.
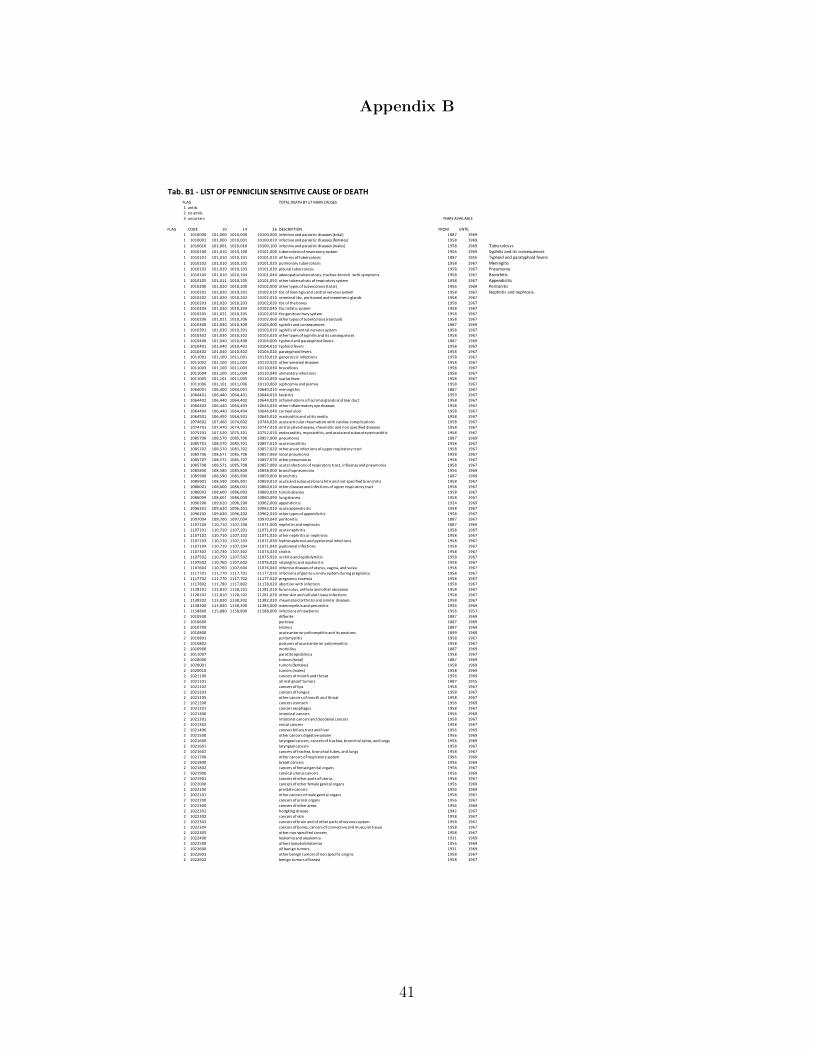
15The list of “penicillin-sensitive” and “penicillin-insensitive” categories of death are reported in AppendixB.
16The war victims are quantified according to the region of actual death, delivering a space/time quan-tification of war conflicts. WWII severity indicator in Italy is provided by the official publication “Mortie dispersi per cause belliche negli anni 1940–45” (The dead and the missing due to war causes between1940–1945) (ISTAT, 1957). The intensity of war destruction was quantified based at the median. Regionsabove-median conflict deaths are: Piedmont-Valle d’Aosta, Veneto, Friuli Venezia Giulia, Emilia Romagna,Toscana, Umbria, Marche, Lazio. Lombardy, Trentino Alto Adige, Abruzzi and Molise, Campania, Puglia,Basilicata, Campania, Sicilia, Sardegna. See Atella, Di Porto, and Kopinska (2017) for a detailed descriptionof the data used. WWII-related death rates were then computed by dividing death county by the averageregional population between 1940–1945.
17Population estimates were interpolated into age bins of 0–25, 26–30, 31–35, 36–40, 41–45, 46–50, 51–55, 56–60, 61–65, 66–70, 71–75, and 76+ by using known population data for years 1921–1927, 1931–1936,1943–1950, 1953, 1957, and 1959–1961. To estimate missing population data, we broke the age bins intoseparate individual age columns and assumed a uniform population distribution for each age within an agebin. We interpolated missing age-specific population by taking the current year’s age-specific populationand adding the previous year’s age-specific mortality to get the previous year’s age-specific population. Weuse the same methodology in the opposite direction by interpolating the age-specific population data ofthe subsequent year by taking the current year’s age-specific population and subtracting the current year’spopulation age-specific mortality. Afterwards, we re-aggregated the age columns into the original age binsfor the population controls of our study.
8
Our final sample contains region-year-cause of death observations for years 1924–1959.
Table 1 shows descriptive statistics on all-cause mortality for penicillin-sensitive and penicillin-
insensitive diseases before and after penicillin introduction.
III.B Human Mortality Database (HMD) Data
We also use national-level data on age-specific deaths from the Human Mortality Database
(HMD) in two ways (HMD 2017).18 First, because the regional vital statistics do not contain
information about deaths by age, precluding age-adjustment, we control for age-specific
population counts.19 Second, we directly examine changes in the age distribution of deaths
over time as an alternative strategy for studying mortality convergence.
III.C Graphical Analysis
Mortality Decline by Cause. As Figure 1 shows, Italy’s total mortality rate fell substantially
between 1924 and 1955. However, this decline varied dramatically by cause – and in particu-
lar, by penicillin sensitivity. Panel A of Figure 2 shows that with the official introduction of
penicillin in 1947, the decline in regional mortality rates for penicillin-sensitive causes accel-
erated sharply. Moreover, the variance in regional death rates sensitive to penicillin became
markedly more compressed beginning in 1947, with substantial convergence occurring by
the mid-1950s. Panel B of Figure 2 demonstrates regional mortality rates for non-infectious
causes did not decline over the entire period – nor did their variance.20
18National-level HMD estimates are constructed by HMD investigators using vital statistics, populationcensuses, and population estimates directly from ISTAT and from other researchers working on behalf ofISTAT. Death counts in the Italian vital statistics are based on the de facto population (“popolazione pre-sente”) until 1980 and on the de jure population (“popolazione residente”) afterwards. Therefore, mortalityrates before 1981 in the HMD are based on population estimates of the de facto population, calculated fromcensus counts to consider this change in the coverage of vital statistics (Glei 2015). Death counts from thevital statistics are also adjusted both to include missing military deaths during World Wars I and II andto spatially redistribute deaths by age and calendar year (Jdanov et al. 2008). For the period 1937–51,intercensal survival methods are used to derive population estimates using pre- and post-war census counts(Jdanov et al. 2008).
19This data is also available online at:http://www.mortality.org/20More work is required to address concerns about the confounding role of World War II given that
infectious disease deaths often exceed direct casualties due to conflict (Erdem et al. 2011; Zapor and Moran2005). We address this issue later in Section VI.B. Further, one might also argue that WWII has favoredinternal migration flows from poorer to richer regions, thus contributing to higher differentials among regionalmortality rates. Atella, Deb and Kopinska (2019) show that the phenomenon of migration within Italian
9
Mortality Decline by Age. Figure 3 depicts the age distribution of period life table deaths
in Italy for years between 1924 and 1955. The figure reveals substantial reductions in infant
and child mortality over time (which are generally due to infectious causes, mostly penicillin-
sensitive (Vercelli et al. 2014)). As a result, deaths appear to become more concentrated at
older ages – a pattern consistent with convergence, although the timing of this compression
is less readily evident (Section VI investigates this issue more closely).
Standard Deviation and Average Life Expectancy : Figure 4 shows both life expectancy
at birth and the standard deviation of age at death across regions (a common indicator
used in the literature to measure mortality convergence and lifespan inequality (Edwards
and Tuljapurkar 2005; Gillespie et al. 2014)) by year. Life expectancy at birth increases
from 51.5 in 1924 to 57.6 in 1939, declines abruptly during WWII until the 1943 Italian
armistice, recovers quickly to its pre-war level, and continues to increase in the post-war
years. The standard deviation of age at death declines little during the pre-war period (as
life expectancy at birth is rising), remains relatively constant during WWII, and then declines
precipitously beginning in the late 1940s (around the time that penicillin was introduced)
and throughout the post-war period. This rapid decline beginning in the latter 1940s is
suggestive of mortality convergence.
Standard Deviation by Cause: Figure 5 shows the standard deviation of regional death
rates separately for the all-cause mortality rates, penicillin-sensitive mortality rates, and
penicillin-insensitive mortality rates over time. Before WWII, the standard deviation tra-
jectories of penicillin-sensitive and -insensitive mortality rates were similar. Both experience
disruptions during the war period, but after 1947 the standard deviation of penicillin-sensitive
mortality rates across regions converges, while the standard deviation of penicillin-insensitive
mortality rate slightly diverges.
regions began in earnest in 1951.
10
IV Estimation
IV.A Mortality Decline
Building on graphical evidence shown in Figures 2 and 4, our empirical strategy tests for
sharply-timed differential trend breaks in penicillin-sensitive mortality rates (relative to
penicillin-insensitive mortality rates) coincident with the introduction of penicillin in 1947.
Specifically, we estimate:
mict = α + γi + δt + θc + β(Ipostt ∗ Sensitivec) +Xitϕ+ γi ∗ t+ εict,(1)
for regions i, causes of death c, and years t. mict is a region-cause-year specific death rate
(specified both in level and natural log form). Ipostt is a dummy variable equal to one for
observations in years 1947 or later, Sensitive is a dummy variable for whether or not cause
c is sensitive to penicillin, and X is a vector of covariates including interpolated population
estimates in discrete age categories. We include year, region, and disease fixed effects, and
our preferred specification also includes linear time trends interacted with region dummies.
Standard errors are clustered by region, and we report p-values corresponding to block
bootstrapped standard errors.21
We also assess the temporal dynamics of the introduction of penicillin by substituting a
vector of year dummy variables for , Ipostt in Equation (1):
mict = α + γi + δt + θc +∑j
ρj(Sensitivec ∗ Ijt ) +Xitϕ+ γi ∗ t+ εict,(2)
where Ijt is a vector of j year dummy variables and all other variables are defined as before.
21To assess the robustness of our results, we also estimate variants of specification (1), using both levelsand log specifications and including region-specific linear time trends.
11
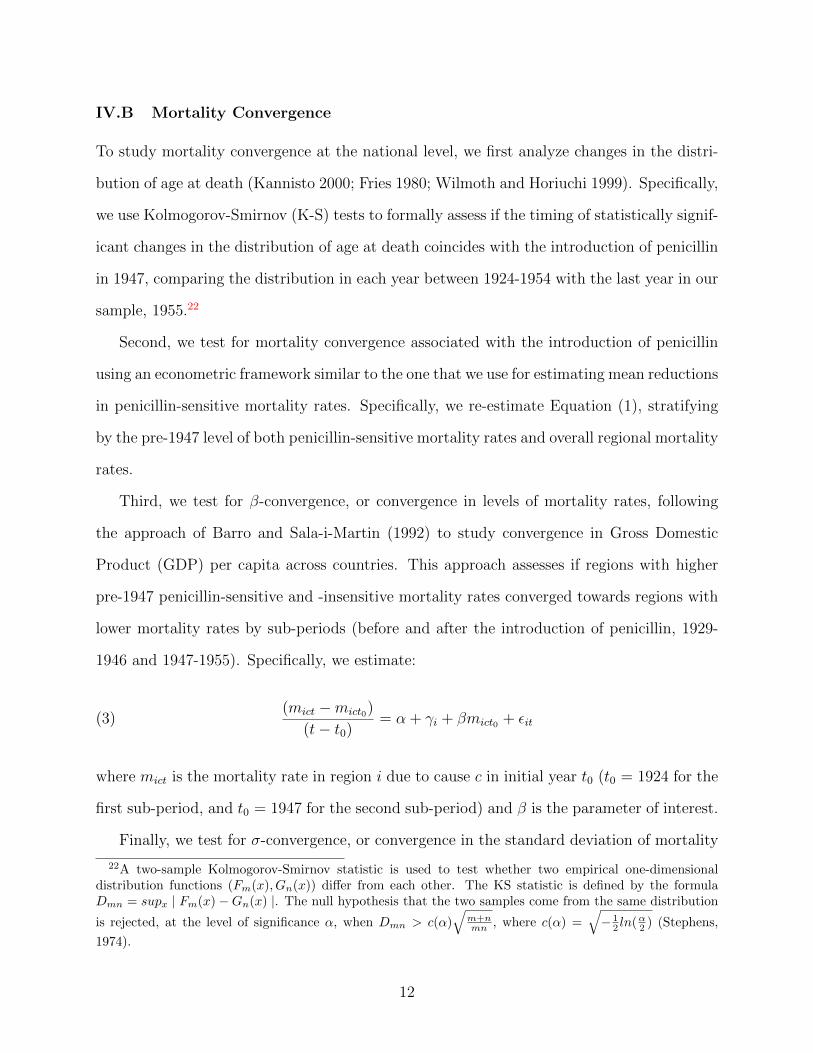
IV.B Mortality Convergence
To study mortality convergence at the national level, we first analyze changes in the distri-
bution of age at death (Kannisto 2000; Fries 1980; Wilmoth and Horiuchi 1999). Specifically,
we use Kolmogorov-Smirnov (K-S) tests to formally assess if the timing of statistically signif-
icant changes in the distribution of age at death coincides with the introduction of penicillin
in 1947, comparing the distribution in each year between 1924-1954 with the last year in our
sample, 1955.22
Second, we test for mortality convergence associated with the introduction of penicillin
using an econometric framework similar to the one that we use for estimating mean reductions
in penicillin-sensitive mortality rates. Specifically, we re-estimate Equation (1), stratifying
by the pre-1947 level of both penicillin-sensitive mortality rates and overall regional mortality
rates.
Third, we test for β-convergence, or convergence in levels of mortality rates, following
the approach of Barro and Sala-i-Martin (1992) to study convergence in Gross Domestic
Product (GDP) per capita across countries. This approach assesses if regions with higher
pre-1947 penicillin-sensitive and -insensitive mortality rates converged towards regions with
lower mortality rates by sub-periods (before and after the introduction of penicillin, 1929-
1946 and 1947-1955). Specifically, we estimate:
(mict −mict0)
(t− t0)= α + γi + βmict0 + εit(3)
where mict is the mortality rate in region i due to cause c in initial year t0 (t0 = 1924 for the
first sub-period, and t0 = 1947 for the second sub-period) and β is the parameter of interest.
Finally, we test for σ-convergence, or convergence in the standard deviation of mortality
22A two-sample Kolmogorov-Smirnov statistic is used to test whether two empirical one-dimensionaldistribution functions (Fm(x), Gn(x)) differ from each other. The KS statistic is defined by the formulaDmn = supx | Fm(x)−Gn(x) |. The null hypothesis that the two samples come from the same distribution
is rejected, at the level of significance α, when Dmn > c(α)√
m+nmn , where c(α) =
√− 1
2 ln(α2 ) (Stephens,
1974).
12
rates, across regions of Italy by re-estimating Equation (1) using the standard deviation
of cause-specific mortality rates by region as the dependent variable (Janssen et al. 2016;
Young et al. 2008).
V Results
V.A Mortality Decline
Table 2 reports results obtained by estimating Equation (1). Conditioning on year, region,
and disease fixed effects as well as the regional age distribution, mortality rates among
diseases sensitive to penicillin relative to those insensitive fell by approximately 0.3 per
thousand (and is statistically distinguishable from zero, p < 0.01) with the introduction
of penicillin. Relative to the mean mortality rate among deaths due to these causes prior
to 1947 (0.469, see Table 1), this represents a reduction of 58%.23 Column 2 adds region-
specific linear time trends. In both cases, the estimate of β is robust, with the mortality
rate decline associated with the introduction of penicillin remaining at about 0.3 per 1,000.
Columns 3 and 4 repeat this estimation for log mortality, showing robust reductions in
penicillin-sensitive mortality rates.
Figure 6 then examines the dynamic pattern of mortality decline associated with penicillin
introduction in Italy, showing estimates and 95% confidence intervals for each year-specific
ρj in Equation (2). Prior to the introduction of penicillin, there is little evidence of pre-
existing declines in penicillin sensitive mortality rates (relative to insensitive ones). Year-
specific estimates drop with the introduction of penicillin in 1947 and become negative and
statistically different from zero by 1948 (and in all subsequent years) with the diffusion of
penicillin. By the end of our study period in 1955, these year-specific estimates approach a
decline of 2.8 per 1,000 deaths.
23To estimate this effect we divide the post-1947 mean average reduction in the cause-specific mortality(regression coefficient in the first column of Table 2: -0.272), by the mean mortality rate for penicillin-sensitivecauses in the baseline period, between 1924–1946.
13
V.B Mortality Convergence
Figure 7 first shows year-by-year K-S p-values for tests of differences between each year’s
distribution of age at death against the distribution in 1955 (the last year in our sample).
These p-values remain constant at nearly 0 for all years prior to the introduction of an-
tibiotics, indicating strongly significant differences from 1955 – and then beginning in 1947,
these p-values rapidly rise to 1 (indicating no difference from 1955). This sharply-timed
compression in Italy’s age distribution of deaths is highly consistent with the introduction
of antibiotics leading to convergence in mortality rates.
Table 3 reports estimates obtained from Equation (1), stratified by level of penicillin-
sensitive mortality rates prior to 1947 (above and below the median). The first and second
columns show that after 1947, penicillin-sensitive mortality rates declined more in regions
with higher (above median) initial rates (by 0.29 per 1,000) than in those with lower (below
median) initial rates (0.26 per 1,000) – and significantly so. Compared to the mean of the
pre-1947 penicillin-sensitive cause-specific mortality, these changes represent reductions of
61% and 55%, respectively.
Table 4 reports β-convergence estimates from Equation (3). Comparing penicillin-
sensitive mortality rates before vs. after the introduction of penicillin, the estimate of β
is almost four times greater after penicillin introduction (-0.075 vs. -0.021). Alternatively,
for penicillin-insensitive mortality rates, the estimate is not statistically significant prior to
1947 – and is positive and statistically different from 0 afterwards, suggesting divergence in
penicillin-insensitive mortality rates.
Finally, Table 5 (columns (1) and (2)) present estimates of sigma convergence by using the
standard deviation of deaths across regions and years for each of the two disease categories as
the dependent variable. We find that the standard deviation of penicillin-sensitive mortality
declines after penicillin is introduced (-0.113, p < 0.01) – but not the standard deviation
of penicillin-insensitive mortality (-0.004). The results remain consistent after truncating
the sample in 1950 (row 2): the standard deviation of penicillin-sensitive mortality declines
14
significantly (-0.089, p < 0.01), but not for penicillin-insensitive mortality (-0.009).24
VI Identification and Threats to Validity
In this section, we discuss two potential treats to our interpretation of the effects of the
introduction of antibiotics on infectious disease mortality. In Section VI.A, we consider the
problem of competing risks – specifically, the survival benefit of antibiotics increased the
exposure of the population to death from non-infectious causes. In Section VI.B, we discuss
how the chaotic end to World War II may have affected infectious disease mortality in Italy
during our sample period.
VI.A Competing Risks
In our context, the competing risks problem concerns a possible increase in non-communicable
disease (NCD) mortality resulting from fewer people dying from infectious disease mortality
as a result of the introduction of penicillin. This phenomenon can influence our estimates
given that we compare penicillin-sensitive vs. penicillin-insensitive death rates over time
(Tsiatis, 1975; Peterson, 1976; Honore and Lleras-Muney 2006). In this section we study the
influence that competing risks has on our estimation of the contribution of penicillin to the
mortality decline in Italy.25 We present a simple framework for defining the particular com-
peting risk problem inherent in our main estimating equation, and describe an alternative
approach to bound the estimates.
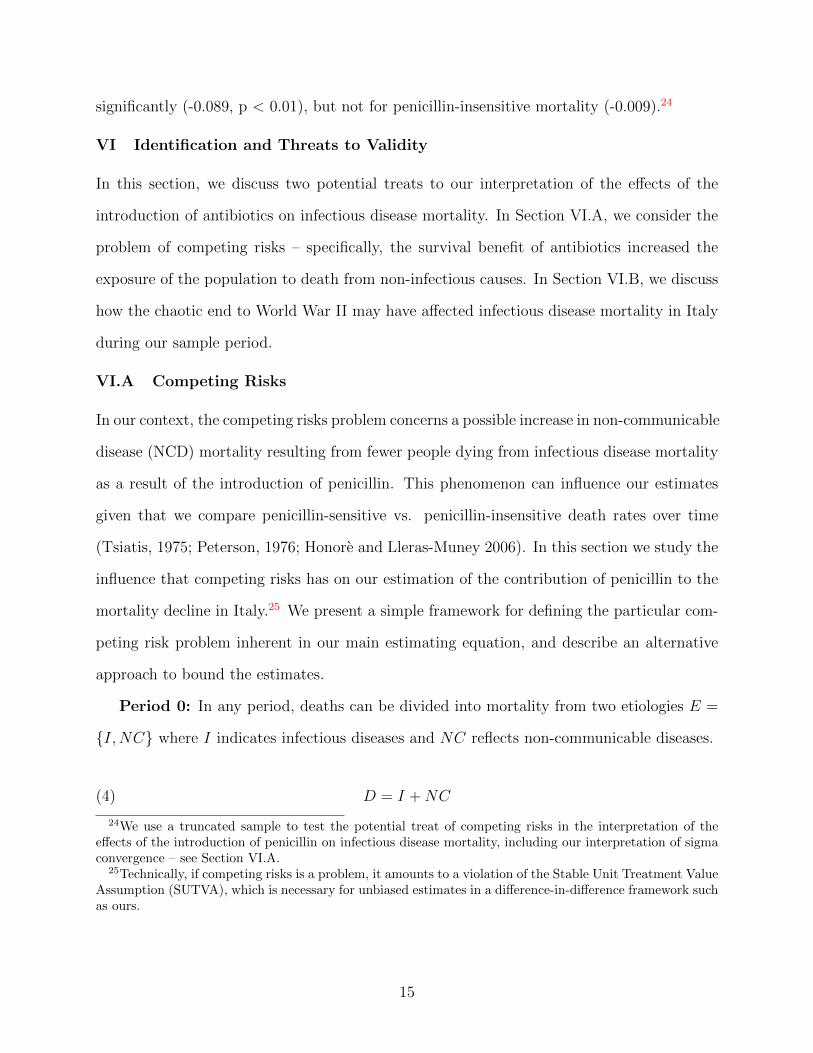
Period 0: In any period, deaths can be divided into mortality from two etiologies E =
{I,NC} where I indicates infectious diseases and NC reflects non-communicable diseases.
D = I +NC(4)
24We use a truncated sample to test the potential treat of competing risks in the interpretation of theeffects of the introduction of penicillin on infectious disease mortality, including our interpretation of sigmaconvergence – see Section VI.A.
25Technically, if competing risks is a problem, it amounts to a violation of the Stable Unit Treatment ValueAssumption (SUTVA), which is necessary for unbiased estimates in a difference-in-difference framework suchas ours.
15
note that deaths from etiology E can be expressed as the mortality rate from E multiplied
by the number of susceptible from that etiology at time t: E = µe,t ∗ SE,t. We assume that
mortality rate from non-communicable disease is exogenous to penicillin and, after period 0,
there are N0 persons surviving in this closed population without births or migration.
Period 1: At the beginning of period 1, penicillin, p, is introduced which immediately treats
and cures those afflicted with infectious diseases, leading to a direct decline in mortality
associated with diseases of infectious etiology:
D1 = SI,1µI,1(p) + SNC,1µNC(5)
Period 2: By period 2, there are now indirect effects of penicillin, since those weaker
individuals that otherwise would have died from infectious disease are now alive (e.g. the
harvesting effect of infections has been reduced). These spared lives increase the size of the
susceptible non-communicable disease population:
SNC,2 = N0 − SI,1µI,1(p)− SNC,1µNC .(6)
Recall that ∂µI,i
∂p< 0 by the pharmacology of penicillin and ∂SNC,2
∂p> 0 by equation 6.
Hence the total effect of penicillin over time reflects both the direct effect on infectious deaths
and its indirect effect on non-communicable susceptibles.
Our difference-in-differences estimate compares the changes in infectious and non-communicable
diseases related deaths, before vs. after the introduction of penicillin:26
(SI,2µI,2(p)− SI,0µI,0
)−(SNC,2(p)µNC − SNC,0µNC
)(7)
Given that the first term is negative (by the direct effects of penicillin) and the second, in
26Equation 7 is normalized by total population in our empirical framework. Note there is also a positiveeffect on susceptibles for infectious diseases at the beginning of period 2, but we ignore that detail sinceit is dwarfed by the first order effect of penicillin which is to reduce the mortality associated with manycommunicable causes.
16
the absence of an overall secular decline in mortality, is positive (by the indirect effects of
penicillin), our estimates are biased away from the null.27 Yet in our setting, there may
be a very prominent secular decline in mortality for all causes – which is why a difference-
in-differences framework is preferred. Thus, estimates from both the simple and double
differences are biased, the former by a secular decline and mis-attribution of penicillin to
secular patterns, and the latter by competing risks.
To gauge the relative importance of these two sources of bias, we zoom in on the pe-
riod very soon after penicillin was introduced (i.e. Period 1), so that our difference-in-
differences estimator is not influenced by competing risks (i.e. there is no indirect effects on
non-communicable disease):(SI,1µI,1(p)− SI,0µI,0
)−(SNC,1µNC − SNC,0µNC
). Shortly af-
ter penicillin is introduced, we are more likely to isolate the direct effect of penicillin on the
infectious disease mortality as the harvesting and death for more chronic, non-communicable
entities would not have not had time to occur. Specifically, we estimate the effect of peni-
cillin on sensitive (i.e. infectious) and insensitive (i.e. non-communicable) causes in a pre
vs. post framework and using the full vs. a truncated time period.
These results are gathered in Table 5. For the truncated sample, ending in the year 1950
– three years following the introduction of penicillin into Italy – the results demonstrate that
both sensitive and insensitive mortality decline (row (2) columns (3) and (4)) though the
effect is much larger for the former. The estimates point to an important secular decline
in mortality, independent of penicillin, hence the negative post coefficient in column (4).
The difference-in-differences estimate ((−0.486) − (−.0363)) is about −0.12, smaller than
the main estimates in Table 2 and a lower bound on penicillin’s effects.
Using the full sample, with an end year of 1955, the effect of penicillin introduction on
insensitive causes is more positive, reflecting the competing risk issue. Yet the magnitude
of this change is slight and statistically indistinguishable from the estimates using the 1950
cutoff. Moreover, the fact that the difference-in-differences point estimates are increasing
27In the presence of a secular decline, the second term will be less negative than in the counterfactual ofabsent an indirect effect of penicillin.
17
over time as per our event study is attributable to the first term in equation 7: the direct
effect of penicillin on infectious disease mortality (see row (3)). As discussed above, this
likely reflects the technology’s diffusion. When turning to sigma convergence, there is no
major concern for competing risks in any specification: convergence is limited to infectious
causes.
In summary, the framework and results presented in this subsection show that the com-
peting risks problem in our context is small, given that a longer time window does not greatly
bias the second term in equation 7 in a positive direction. On the other hand, controlling for
a secular decline in mortality – which is what differencing out of non-communicable causes
affords – is important for obtaining less biased estimates.
VI.B The End of World War II
Another potential concern with our results is the influence of the end of World War II on
infectious disease rates. Because infectious disease mortality rates commonly surge during
wartime (Erdem et al. 2011; Zapor and Moran 2005), their decline relative to non-infectious
mortality rates could partly reflect the end of conflict. Figure 2 (Panel A) provides at least
some prima facie evidence that this is not an important concern in our case – mortality rates
sensitive to penicillin are declining until 1930, generally remain stable through 1945 (rather
than rising), and then resume their decline. However, we probe this issue further in two
ways.
First, we test for differential penicillin effects in areas with varying degrees of war-related
destruction. Specifically, we re-estimate Equation (1) separately for regions with above-
and below-median degrees of war intensity, measured using conflict-related mortality rates
between 1940 and 1945.28 Columns 3 and 4 of Table 3 report estimates separately for regions
with higher and lower intensity of exposure to WWII. In general, the penicillin effect is larger
in areas with lower war intensity (0.29 per 1,000) relative to those with higher war intensity
28This data is available in “Morti e dispersi per cause belliche negli anni 1940–45” (ISTAT, 1957) and is alsoonline at https:lipari.istat.it/digibib/causedimorte/IST3413mortiedispersipercausebellicheanni1940 45+OCRottimizz.pdf.
18
(0.26 per 1,000), and this difference is statistically significant.29
Second, we simply exclude years 1943–1945 (the years of greatest conflict in Italy) from
our sample and again re-estimate Equation (1). Columns 5 and 6 of Table 3 show these
results – the estimates are statistically equivalent to those that include these years.
VII Conclusion
Although technological progress in health has produced dramatic gains in life expectancy
around the globe over the past century, it can also have unintended consequences for the dis-
tribution of disease. Health technologies that are inexpensive and substitute for older, more
expensive ones may lead to population health convergence, but they could also dispropor-
tionately benefit elites, widening health disparities. Notably, there has been little empirical
evidence to date on the consequences of major new health technologies for the distribution
of health in populations.
Studying the seminal case of penicillin and focusing on Italy using newly digitized vital
statistics over several decades, we find that the introduction of penicillin not only reduced av-
erage infectious disease mortality rates dramatically (by 58%), but it also led to a substantial
reduction in the variance of mortality rates across Italian regions. Specifically, the standard
deviation in the age of death fell by nearly eight years after the introduction of penicillin
– a decline of 27%. Our findings relate to the scholarship of researchers investigating post-
World War II health convergence across countries, such as Acemoglu and Johnson (2007)
and Deaton (2006), we find that the distribution of penicillin, at least in Italy, played an im-
portant role in such convergence and suggest an important role for point-of-care technologies
in reducing health inequalities.
29We test for the significance of the difference between the coefficients obtained in the separate models bypooling the samples used in both models, and specifying a triple interaction that includes an indicator forhigh and low destruction. The coefficient for this interactions term was statistically significant (p-values <0.01).
19
References
[1] Acemoglu, Daron, and Simon Johnson. 2007. “Disease and Development: The Effect ofLife Expectancy on Growth.” Journal of Political Economy 115: 925–985.
[2] Acemoglu, Daron, and James A. Robinson. 2008. “Persistence of Power, Elites, andInstitutions.” American Economic Review 98 (1): 267–93.
[3] Ashraf, Nava, Edward L. Glaeser, and Giacomo A. M. Ponzetto. 2016. “Infrastructure,Incentives, and Institutions.” American Economic Review 106 (5): 77–82.
[4] Atella, Vincenzo, Partha Deb, and Joanna A. Kopinska. 2019. “Heterogeneity in long-term health outcomes of Migrants within Italy.” Journal of Health Economics 63: 19–33.
[5] Atella, Vincenzo, Edoardo Di Porto, and Joanna Kopinska. 2017. “Stress, Famine andthe Fetal Programming: The Long Term Effect of WWII in Italy.” CEIS Research Paper385.
[6] Atella, Vincenzo, Silvia Francisci, and Giovanni Vecchi. 2017. “Health.” In MeasuringWellbeing: A History of Italian Living Standards, edited by Giovanni Vecchi, OxfordUniversity Press.
[7] Barra Bagnasco, M. 1996. “Housing and Workshop Construction in the City.” In TheWestern Greeks, 353–60, edited by G. Pugliese Carratelli. Milan.
[8] Battini, B. 1946. “Servizio di distribuzione della penicillina, in ACISP, Notiziariodell’Amministrazione Sanitaria 1944–1945.” Fascicolo unico, Roma, 226–32.
[9] Barro, Robert J., and Xavier Sala-i-Martin. 1992. “Convergence.” The Journal of Po-litical Economy 100 (2): 223–51.
[10] Bigatti, Giorgio. 2014. “Da bere per tutti. Servizi idrici e politiche dell’acqua in Italiatra Otto e Novecento. Uno sguardo di sintesi.” TST n◦ 26: 110–27.
[11] Brenzel, Logan, and Pierre Claquin. 1994. “Immunization Programs and Their Costs.”Social Science & Medicine 39 (4): 527–36. doi:10.1016/0277-9536(94)90095-7.
[12] Conybeare, John. 1948. “The Effects on Mortality of Recent Advances in Treatment.”Journal of the Institute of Actuaries 74: 57–81.
[13] Cosmacini, Giorgio, 2005. “Storia della medicina e della sanita in Italia.” Roma: Lat-erza.
[14] Croce, Benedetto. 1928. “Storia d’Italia dal 1871 al 1915.” Bari: Laterza.
[15] Davis, Kingsley. 1956. “The Amazing Decline of Mortality in Underdeveloped Areas.”American Economic Review 46 (2): 305–18.
[16] Deaton, A. 2006. The Great Escape: A Review Essay on Fogel’s The Escape fromHunger and Premature Death 1700-2100. Journal of Economic Literature 44 (1): 106-114.
20
[17] Doria, Miguel de Franca. 2010. “Factors Influencing Public Perception of Drinking WaterQuality.” Water policy 12 (1): 1–19.
[18] Dowling, Harry. 1977. Fighting Infection: Conquests of the Twentieth Century. Cam-bridge: Harvard University Press.
[19] Easterlin, Richard. 1999. “How Beneficent Is the Market? A Look at the Modern Historyof Mortality.” European Review of Economic History 3 (3): 257–94.
[20] Edwards, Ryan D., and Shripad Tuljapurkar. 2005. “Inequality in Life Spans and a NewPerspective on Mortality Convergence across Industrialized Countries.” Population andDevelopment Review 31 (4): 645–674.
[21] Erdem, Hakan, Ahmet Tetik, Ozgur Arun, Bulent Ahmet Besirbellioglu, Omer Coskun,and Can Polat Eyigun. 2011. “War and Infection in the Pre-Antibiotic Era: The ThirdOttoman Army in 1915.” Scandinavian Journal of Infectious Diseases 43 (9): 690–95.doi:10.3109/00365548.2011.577801.
[22] Ermano, Paolo. 2012. “Gli investimenti nel servizio idrico in Italia: un’analisi storica.”DIES Working Paper 3/2012.
[23] Ermano, Paolo, and Antonio Massarutto. 2012. “L’acqua come bene economico: profiliallocativi e distributivi.” Diritto Pubblico Comparato ed Europeo, 1-2012.
[24] Florey, M. E., and Howard W. Florey. 1943. “General and Local Administration ofPenicillin.” Lancet 1 (387).
[25] Fries, James F. 1980. “Aging, Natural Death, and the Compression of Morbidity.” NewEngland Journal of Medicine 303 (3): 130–5. doi:10.1056/NEJM198007173030304.
[26] Gillespie, Duncan O. S., Meredith V. Trotter, and Shripad D. Tuljapurkar. 2014. “Diver-gence in Age Patterns of Mortality Change Drives International Divergence in LifespanInequality.” Demography 51 (3): 1003–17. doi 10.1007/s13524-014-0287-8.
[27] Giovannini, Carla. 1996. “Risanare la citta‘. L’utopia igienista di fine Ottocento.” Angelied., Milano.
[28] Giuntini, Andrea. 1999. “Gli ingegneri sanitari e l’utopia igienista.” In Giuntini, A.,Minesso, M., Gli ingegneri in Italia tra 800 e 900, Milano, Franco Angeli, 117–128.
[29] Glei, Dana. 2015. “About Mortality Data for Italy.” Retrieved from http://www.
mortality.org/hmd/ITA/InputDB/ITAcom.pdf (February 14, 2017)
[30] Golini A., Ciucci L., Caselli G. and Istat - Reparto studi sulla popolazione, 1983. Ri-costruzione della popolazione residente per sesso, et e regione. Anni 1952-1972”. Uni-versit degli Studi di Roma “La Spienza”, Dipartimento di Scienze Demografiche, Fontie strumenti, n.1.
21
[31] Hemminki, Elina, and Anneli Paakkulainen. 1976. “The Effect of Antibiotics on Mor-tality from Infectious Diseases in Sweden and Finland.” Am J Public Health. 66 (12):1180–4.
[32] Honore, Bo E., and Adriana Lleras-Muney. 2006. “Bounds in Competing Risks Modelsand the War on Cancer.” Econometrica 74 (6): 1675–98.
[33] Human Mortality Database (HMD). University of California, Berkeley (USA), and MaxPlanck Institute for Demographic Research (Germany). Available at www.mortality.orgor www.humanmortality.de (data downloaded on Jan 28th, 2017).
[34] ICD (International Classification of Diseases), 1948.http://www.wolfbane.com/icd/icd6h.htm
[35] ISTAT (National Institute of Statistics) 1956, Annuario di Statistiche Sanitarie (VolumeII 1956).
[36] ISTAT (National Institute of Statistics) 1957a, Annuario di Statistiche Sanitarie (Vol-ume III, 1957).
[37] ISTAT (National Institute of Statistics) 1957b. “Morti e dispersi per cause belliche neglianni 1940–45.” Rome.
[38] ISTAT (National Institute of Statistics) 1958, Cause di morte 1888-1955, 1958, Roma.
[39] Janssen, Fanny, Anthe van den Hande, Joop de Beer, and Leo J. G. van Wissen. 2016.“Sigma and Beta Convergence in Regional Mortality.” Demographic Research 35: 81–116.
[40] Jayachandran, Seema, Adriana Lleras-Muney, and Kimberly V. Smith. 2010. “ModernMedicine and the Twentieth Century Decline in Mortality: Evidence on the Impact ofSulfa Drugs.” American Economic Journal: Applied Economics 2 (2): 118–46.
[41] Jdanov, Dmitri A., Dana A. Glei, and Domantas Jasilionis. 2008. “A Modeling Approachfor Estimating Total Mortality for Italy during the First and Second World Wars.”Center for the Economics and Demography of Aging (CEDA) Papers : Paper 2008-0001CL.
[42] Kannisto, Vaino. 2000. “Measuring the Compression of Mortality.” Demographic Re-search 3. doi:10.4054/DemRes.2000.3.6.
[43] Kremer, Michael, and Jack Willis. 2016. “Guns, Latrines, and Land Reform: PrivateExpectations and Public Policy.” NBER Working Paper 21915.
[44] Levy, Stuart B. 1992. The Antibiotic Paradox: How Miracle Drugs Are Destroying theMiracle. New York: Plenum Press.
[45] Loudon, Irvine. 1988. “Maternal Mortality: 1800–1950. Some Regional and Interna-tional Comparisons.” Social History of Medicine 1: 183–228.
22
[46] Luzzi Saverio. 2004. “Salute e sanita nell’Italia Repubblicana.” Donzelli Editore, Roma.
[47] Mackenbach, Johan P., and Caspar W. Looman. 1988. “Secular Trends of InfectiousDisease Mortality in the Netherlands, 1911–1978: Quantitative Estimates of ChangesCoinciding with the Introduction of Antibiotics.” International Journal of Epidemiology17 (3): 618–624.
[48] Mandell Gerald, John Douglas and Raphael Bennett, 2010 Principles and Practices ofInfectious Disease Routledge Press : Philadelphia, PA.
[49] Mantelli, Francesco, and Giorgio Temporelli. 2007. “L’acqua nella storia.” Milano,Franco Angeli.
[50] Massarutto, Antonio. 2011. “Privati dell’acqua.” Bologna, Il Mulino.
[51] Mokyr, Joel. 2002. “Innovation in an Historical Perspective: Tales of Technology andEvolution.” In Technological Innovation and Economic Performance, edited by BennSteil, David G. Victor, and Richard R. Nelson, 23–46. Princeton: Princeton UniversityPress.
[52] Mosca, Gaetano. 1939. The Ruling Class. New York: McGraw-Hill.
[53] Olson, Mancur C. 1965. The Logic of Collective Action; Public Goods and the Theoryof Groups. Cambridge: Harvard University Press.
[54] Picci, Lucio. 2002. “Le opere pubbliche dall’unita d’Italia: l’informazione statistica.”Rivista di Politica Economica.
[55] Pogliano, Claudio. 1984. “Scienza e stirpe: eugenica in Italia 1912-1939.” Passato ePresente 5, Rivista di storia contemporanea: 61–97.
[56] Ponnapalli, Ramani, Krishna M. Ponnapalli, and A. Subbiah. 2013. “Aging and theDemographic Transition in India and Its States: A Comparative Perspective.” Interna-tional Journal of Asian Social Science 3 (1): 171–193.
[57] Peterson, A. V. 1976. “Bounds for a joint distribution function with fixed sub-distribution functions: Application to competing risks.” Proceedings of the NationalAcademy of Sciences 73(1), 11-13.
[58] Preston, Samuel H. 1975. “The Changing Relation between Mortality and Level ofEconomic Development.” Population Studies 29 (2): 231–248.
[59] Ratcliff, J.D. 1945. “Yellow Magic: The Story of Penicillin. Random House”.
[60] Stephens, M. A. 1974. “EDF Statistics for Goodness of Fit and Some Comparisons.”Journal of the American Statistical Association 69 (347): 730–737. doi:10.2307/2286009.
[61] Tsiatis, A. 1975. “A nonidentifiability aspect of the problem of competing risks.” Pro-ceedings of the National Academy of Sciences, 72(1), 20-22.
23
[62] Tomes, Nancy. 1990. “The Private Side of Public Health: Sanitary Science, DomesticHygiene, and the Germ Theory, 1870–1900.” Bulletin of the History of Medicine LXIV:509–539.
[63] Tomes, Nancy. 1998. The Gospel of Germs: Men, Women, and the Microbe in AmericanLife. Cambridge: Harvard University Press.
[64] Troesken, Werner. 2004. Water, Race, and Disease. Cambridge: MIT Press.
[65] Vecchi Giovanni. 2017. Measuring Wellbeing. A History of Italian Living Standards.Oxford: Oxford University Press.
[66] Vercelli, Marina, Roberto Lillini, Alberto Quaglia, Rosanna T. Micale, Sebastiano LaMaestra, and Silvio De Flora. 2014. “Age-Related Mortality Trends in Italy from 1901to 2008.” PLoS ONE 9 (12). doi:10.1371/journal.pone.0114027.
[67] Wilmoth, John R., and Shiro Horiuchi. 1999. “Rectangularization Revisited: Variabilityof Age at Death within Human Populations.” Demography 36 (4): 475–495. https://doi.org/10.2307/2648085.
[68] Young, Andrew T., Matthew J. Higgins, and Daniel Levy. 2008. Sigma Convergenceversus Beta Convergence: Evidence from U.S. County-Level Data. Journal of Money,Credit and Banking 40 (5): 1083–1093.
[69] Zapor, Michael J., and Kimberly A. Moran. 2005. “Infectious Diseases during Wartime.”Current Opinion in Internal Medicine 4 (6): 543–47.
24
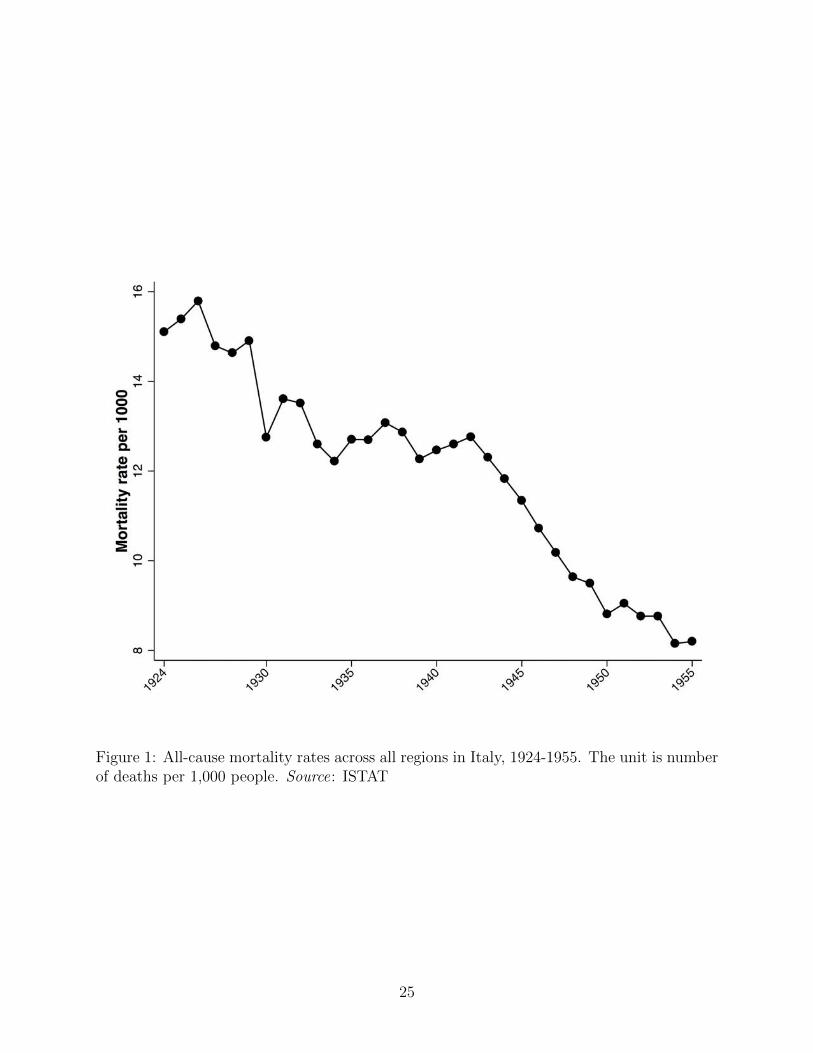
Figure 1: All-cause mortality rates across all regions in Italy, 1924-1955. The unit is numberof deaths per 1,000 people. Source: ISTAT
25
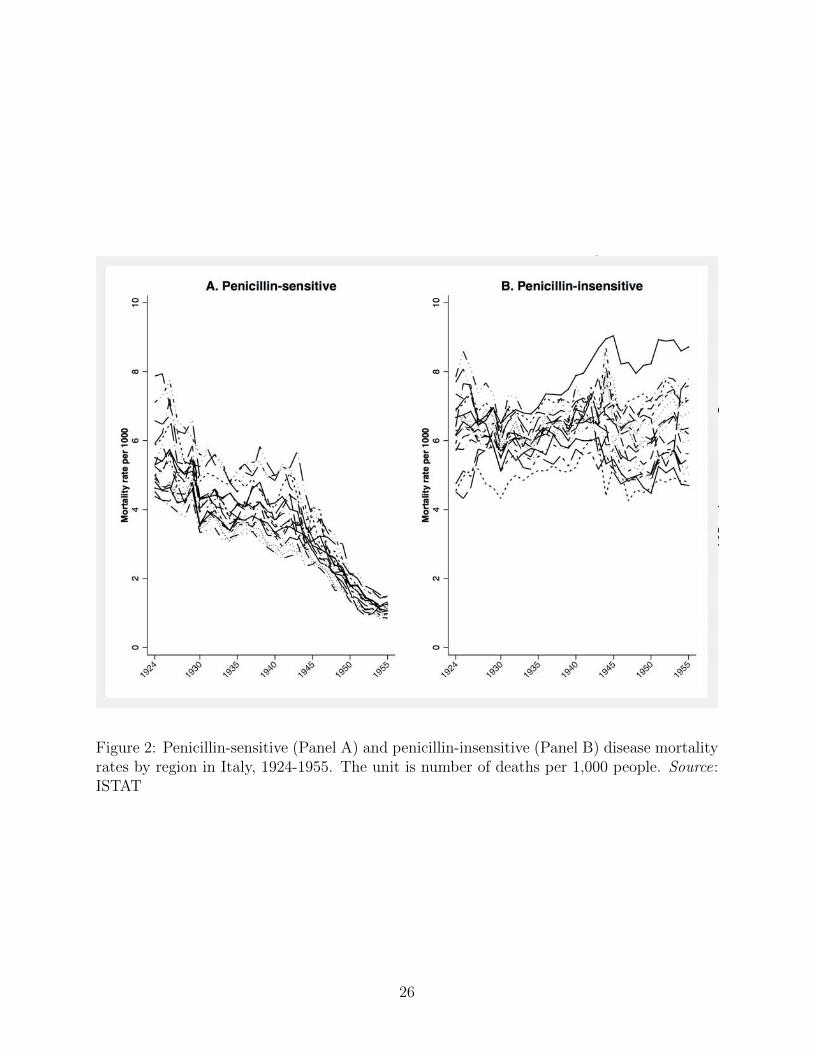
Figure 2: Penicillin-sensitive (Panel A) and penicillin-insensitive (Panel B) disease mortalityrates by region in Italy, 1924-1955. The unit is number of deaths per 1,000 people. Source:ISTAT
26
Figure 3: Period life-table distributions of age at death in Italy for selected years between1924 and 1955. The unit is the logarithm of the probability density of deaths. Source:Human Mortality Database (HMD)
27
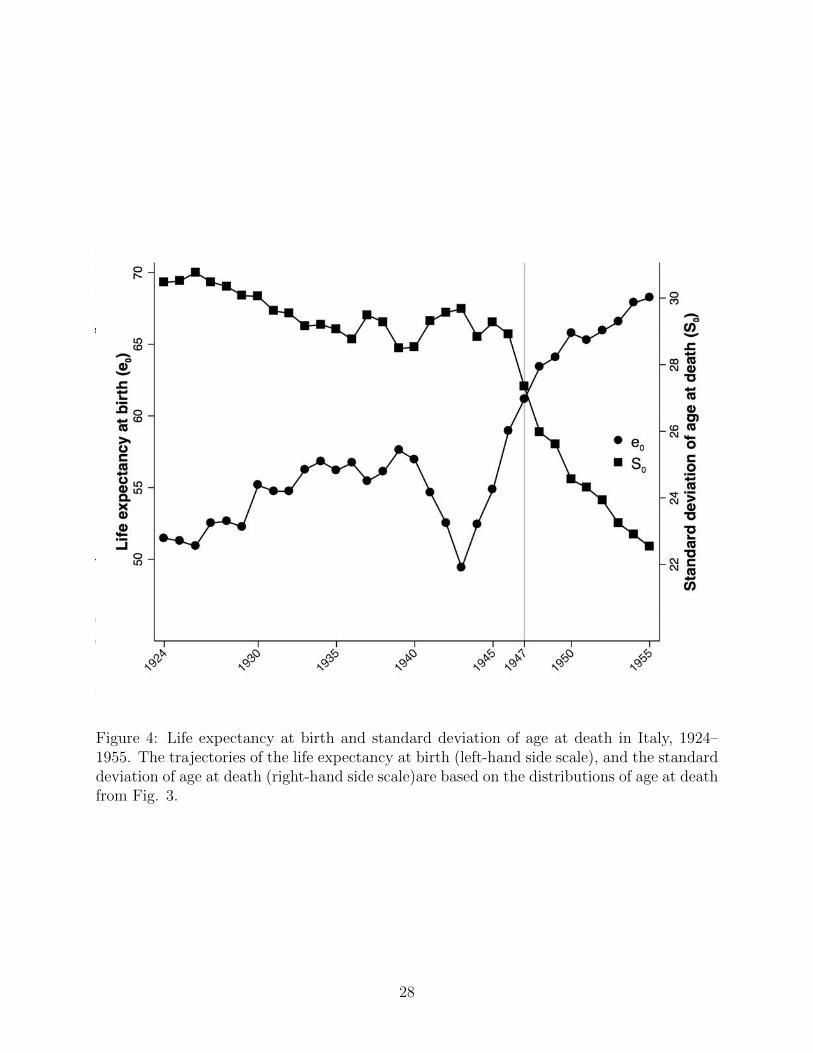
Figure 4: Life expectancy at birth and standard deviation of age at death in Italy, 1924–1955. The trajectories of the life expectancy at birth (left-hand side scale), and the standarddeviation of age at death (right-hand side scale)are based on the distributions of age at deathfrom Fig. 3.
28
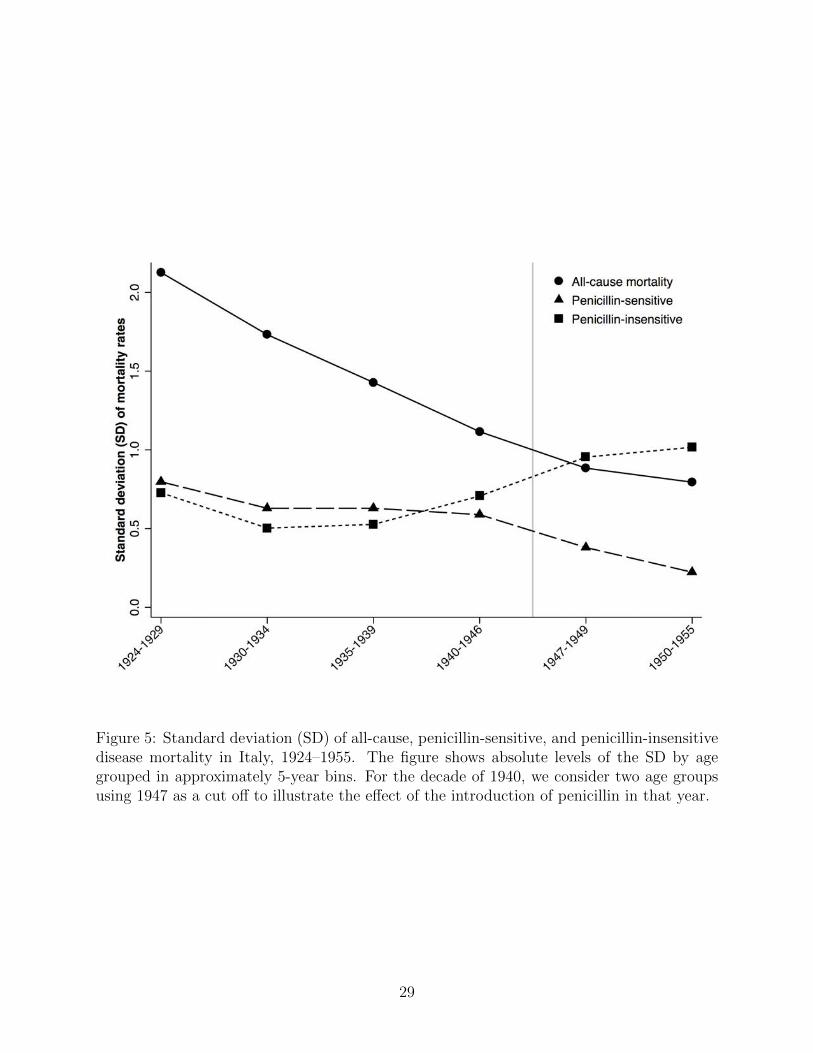
Figure 5: Standard deviation (SD) of all-cause, penicillin-sensitive, and penicillin-insensitivedisease mortality in Italy, 1924–1955. The figure shows absolute levels of the SD by agegrouped in approximately 5-year bins. For the decade of 1940, we consider two age groupsusing 1947 as a cut off to illustrate the effect of the introduction of penicillin in that year.
29
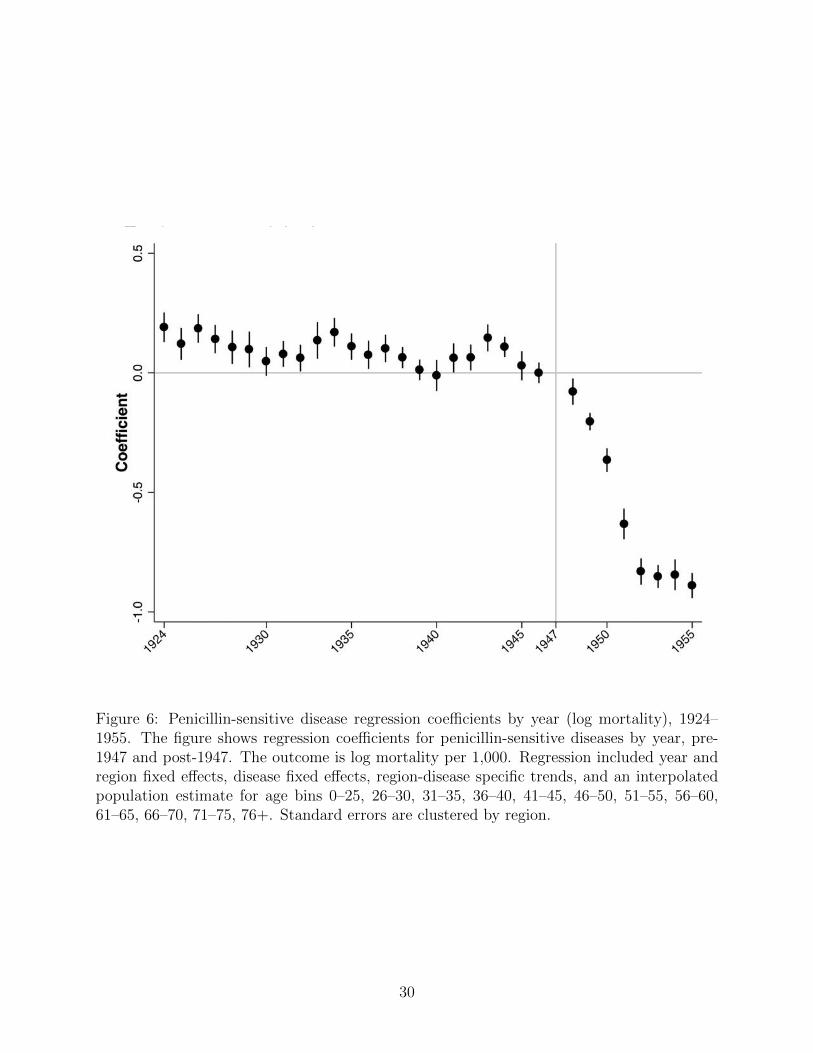
Figure 6: Penicillin-sensitive disease regression coefficients by year (log mortality), 1924–1955. The figure shows regression coefficients for penicillin-sensitive diseases by year, pre-1947 and post-1947. The outcome is log mortality per 1,000. Regression included year andregion fixed effects, disease fixed effects, region-disease specific trends, and an interpolatedpopulation estimate for age bins 0–25, 26–30, 31–35, 36–40, 41–45, 46–50, 51–55, 56–60,61–65, 66–70, 71–75, 76+. Standard errors are clustered by region.
30
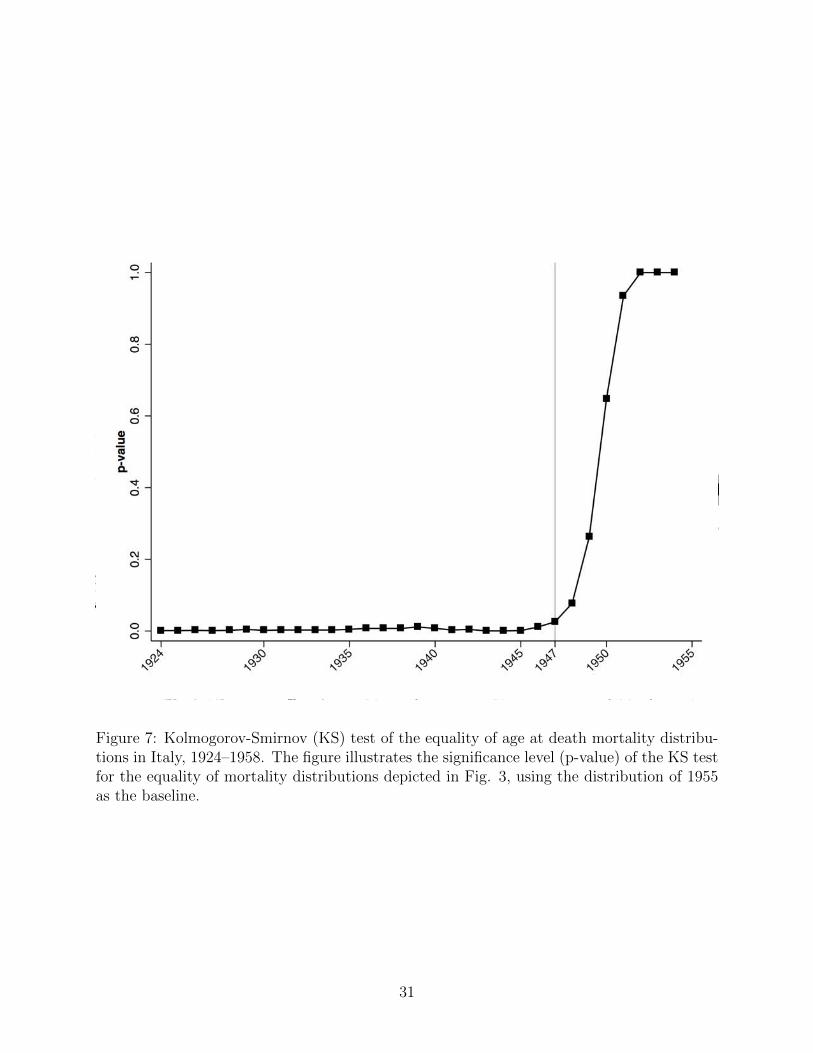
Figure 7: Kolmogorov-Smirnov (KS) test of the equality of age at death mortality distribu-tions in Italy, 1924–1958. The figure illustrates the significance level (p-value) of the KS testfor the equality of mortality distributions depicted in Fig. 3, using the distribution of 1955as the baseline.
31
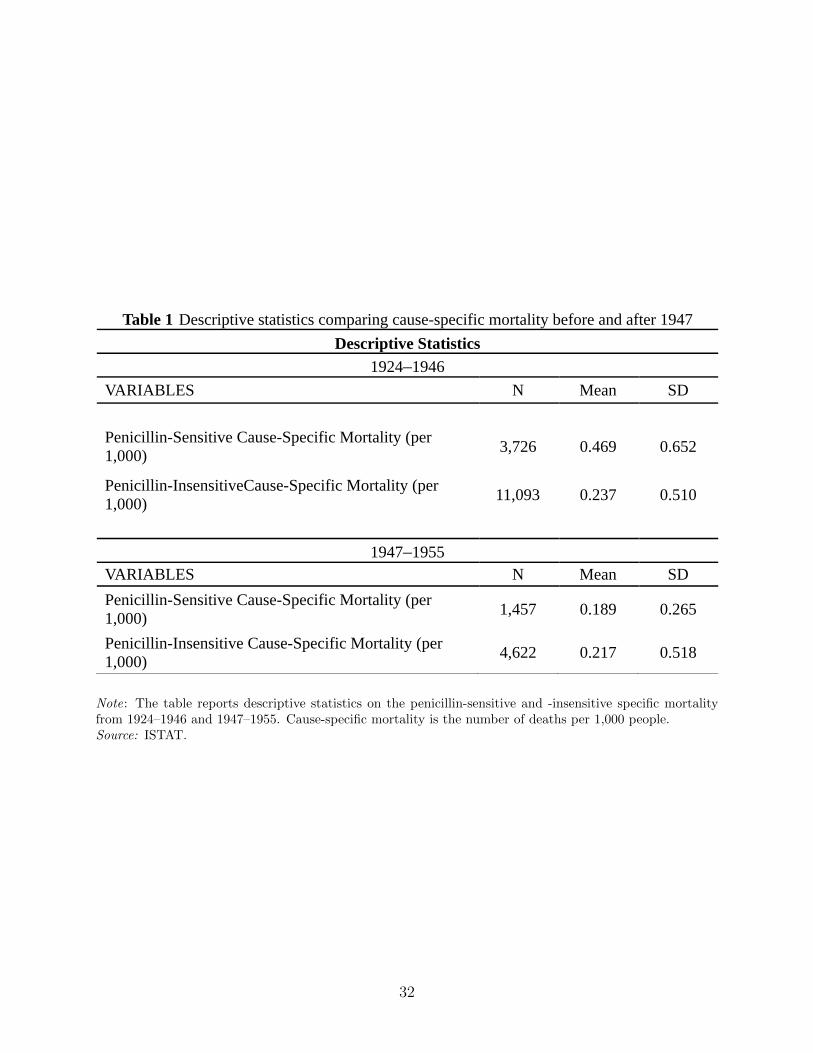
Table 1 Descriptive statistics comparing cause-specific mortality before and after 1947
Descriptive Statistics
1924–1946
VARIABLES N Mean SD
Penicillin-Sensitive Cause-Specific Mortality (per 1,000)
3,726 0.469 0.652
Penicillin-InsensitiveCause-Specific Mortality (per 1,000)
11,093 0.237 0.510
1947–1955VARIABLES N Mean SD
Penicillin-Sensitive Cause-Specific Mortality (per 1,000)
1,457 0.189 0.265
Penicillin-Insensitive Cause-Specific Mortality (per 1,000)
4,622 0.217 0.518
Note: The table reports descriptive statistics on the penicillin-sensitive and -insensitive specific mortalityfrom 1924–1946 and 1947–1955. Cause-specific mortality is the number of deaths per 1,000 people.Source: ISTAT.
32
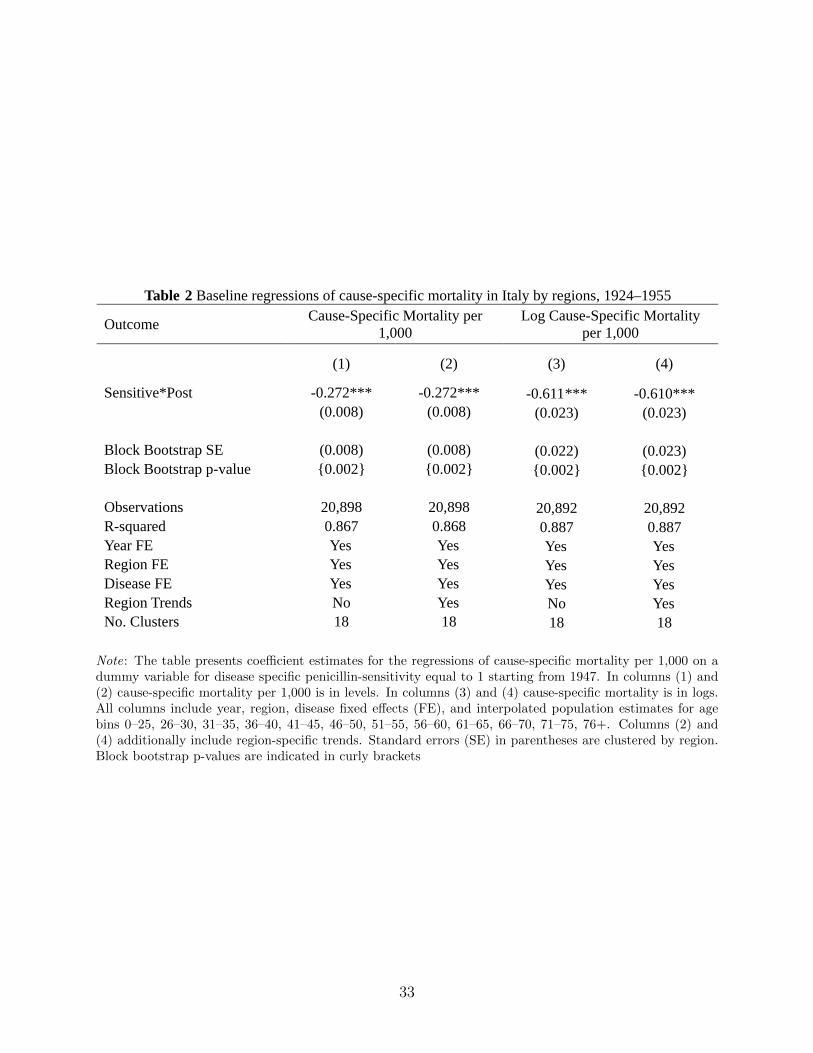
Table 2 Baseline regressions of cause-specific mortality in Italy by regions, 1924–1955
OutcomeCause-Specific Mortality per
1,000 Log Cause-Specific Mortality
per 1,000
(1) (2) (3) (4)
Sensitive*Post -0.272*** -0.272*** -0.611*** -0.610***(0.008) (0.008) (0.023) (0.023)
Block Bootstrap SE (0.008) (0.008) (0.022) (0.023)Block Bootstrap p-value {0.002} {0.002} {0.002} {0.002}
Observations 20,898 20,898 20,892 20,892R-squared 0.867 0.868 0.887 0.887Year FE Yes Yes Yes YesRegion FE Yes Yes Yes YesDisease FE Yes Yes Yes YesRegion Trends No Yes No YesNo. Clusters 18 18 18 18
Note: The table presents coefficient estimates for the regressions of cause-specific mortality per 1,000 on adummy variable for disease specific penicillin-sensitivity equal to 1 starting from 1947. In columns (1) and(2) cause-specific mortality per 1,000 is in levels. In columns (3) and (4) cause-specific mortality is in logs.All columns include year, region, disease fixed effects (FE), and interpolated population estimates for agebins 0–25, 26–30, 31–35, 36–40, 41–45, 46–50, 51–55, 56–60, 61–65, 66–70, 71–75, 76+. Columns (2) and(4) additionally include region-specific trends. Standard errors (SE) in parentheses are clustered by region.Block bootstrap p-values are indicated in curly brackets
33
Table 3 Regression results by median of pre-1947 characteristics in Italy, 1924–1955Sensitivity to WWII Mortality
Approach 1: Varying Degrees of War-Related Destruction
Approach 2: Same as Columns(1) and (2), but Excluding Years
Between 1943–1945
Sample
Above the Median of All-Cause Pre-1947 Mortality
Below the Median of All-
Cause Pre-1947 Mortality
Regions with High Destruction
Regions with Low
Destruction
Above the Median of All-Cause Pre-1947 Mortality
Below the Median of All-Cause Pre-
1947 Mortality
(1) (2) (3) (4) (5) (6)
Sensitive*Post -0.287*** -0.257*** -0.257*** -0.287*** -0.303*** -0.271***(0.012) (0.011) (0.011) (0.012) (0.012) (0.012)
Block Bootstrap SE (0.011) (0.010) (0.010) (0.012) (0.012) (0.011)Block Bootstrap p-value {0.002} {0.004} {0.004} {0.002} {0.004} {0.002}
Observations 10,484 10,414 10,414 10,484 9,460 9,408R-squared 0.875 0.901 0.899 0.873 0.873 0.899Year FE Yes Yes Yes Yes Yes YesRegion FE Yes Yes Yes Yes Yes YesDisease FE Yes Yes Yes Yes Yes YesRegion by Year FE Yes Yes Yes Yes Yes YesRegion Trends Yes Yes Yes Yes Yes Yes
Note: The table presents coefficient estimates for the regressions of cause-specific mortality per 1,000 onan indicator variable for disease specific penicillin-sensitivity after year 1947 in comparison to the pre-1947regional mortality (columns 1-2), and in regions with high and low WWII destruction above the median(columns 3-4). High and low cutoffs are determined respectively by being above and below the median ofthe given sub sample mortality. Columns 5 and 6 present coefficient estimates for the regressions of annualchange of cause-specific mortality per 1,000 on the region-cause specific mortality at a baseline year, basedon the first sub-period (1924–1946) and for the second sub-period (1947–1955), respectively. The baselineyear is 1924 for the first sub-period, while it is 1947 for the second sub-period. The values in parenthesesrepresent robust standard errors (SE). We test the statistical significance of the difference between thecoefficient estimates from columns (1) vs. (2), (3) vs. (4), and (5) vs. (6) by pooling the samples from thecorresponding models and looking at the significance level of the estimate of a triple interaction term, that weconstruct using the indicator variables for disease specific penicillin-sensitivity, post-47 level of mortality, andthe corresponding characteristic [e.g., for columns (1) and (2), the interaction term using the pooled sampleis Sensitive*Post*(High Penicillin-Sensitive Mortality)]. Cause-specific mortality per 1,000 is in levels. Allcolumns include year, region, disease fixed effects, region-specific trends, and an interpolated populationestimate for age bins 0–25, 26–30, 31–35, 36–40, 41–45, 46–50, 51–55, 56–60, 61–65, 66–70, 71–75, 76+.Standard errors in parentheses are clustered by region. Block bootstrap p-values are indicated in curlybrackets.
34
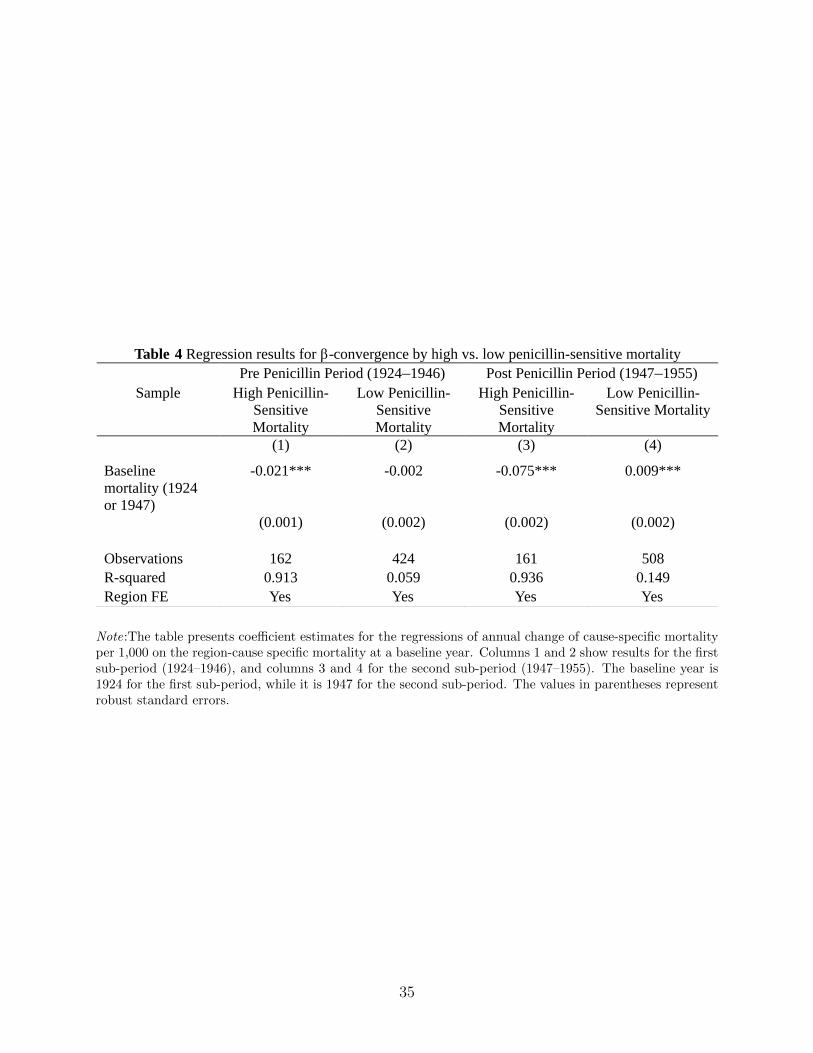
Table 4 Regression results for β-convergence by high vs. low penicillin-sensitive mortalityPre Penicillin Period (1924–1946) Post Penicillin Period (1947–1955)
Sample High Penicillin-Sensitive Mortality
Low Penicillin-Sensitive Mortality
High Penicillin-Sensitive Mortality
Low Penicillin-Sensitive Mortality
(1) (2) (3) (4)
Baseline mortality (1924or 1947)
-0.021*** -0.002 -0.075*** 0.009***
(0.001) (0.002) (0.002) (0.002)
Observations 162 424 161 508R-squared 0.913 0.059 0.936 0.149Region FE Yes Yes Yes Yes
Note:The table presents coefficient estimates for the regressions of annual change of cause-specific mortalityper 1,000 on the region-cause specific mortality at a baseline year. Columns 1 and 2 show results for the firstsub-period (1924–1946), and columns 3 and 4 for the second sub-period (1947–1955). The baseline year is1924 for the first sub-period, while it is 1947 for the second sub-period. The values in parentheses representrobust standard errors.
35
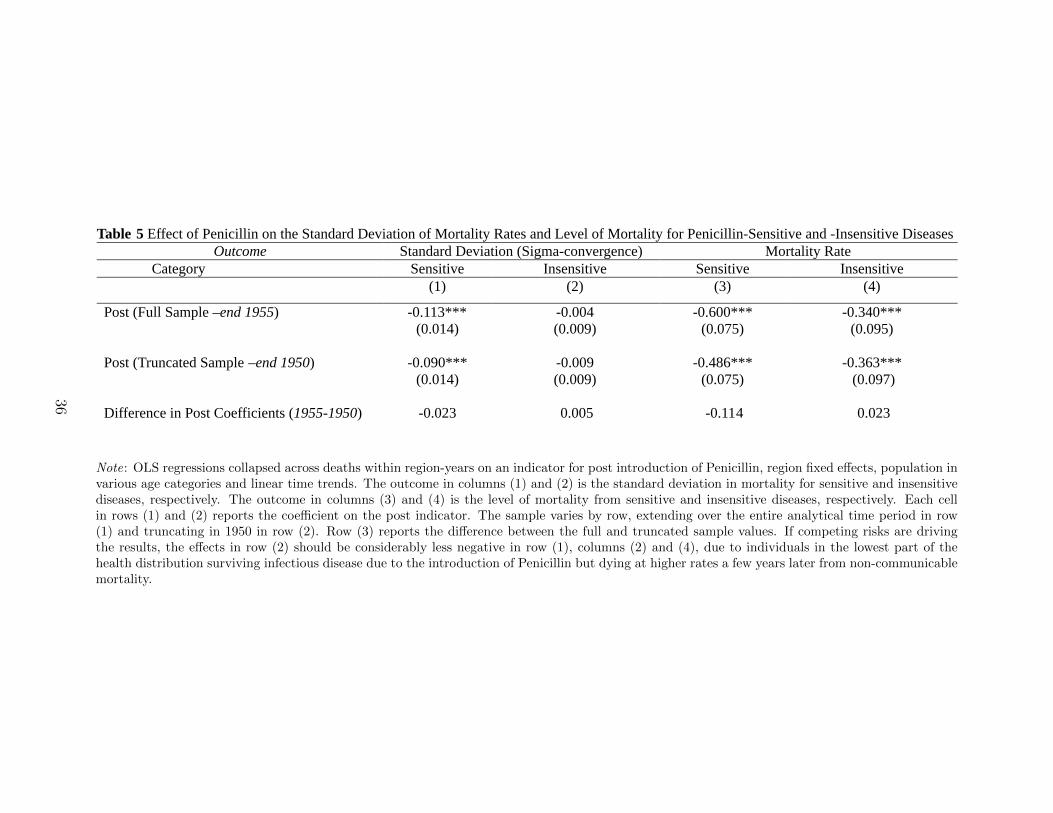
Table 5 Effect of Penicillin on the Standard Deviation of Mortality Rates and Level of Mortality for Penicillin-Sensitive and -Insensitive DiseasesOutcome Standard Deviation (Sigma-convergence) Mortality Rate
Category Sensitive Insensitive Sensitive Insensitive(1) (2) (3) (4)
Post (Full Sample –end 1955) -0.113*** -0.004 -0.600*** -0.340***(0.014) (0.009) (0.075) (0.095)
Post (Truncated Sample –end 1950) -0.090*** -0.009 -0.486*** -0.363***(0.014) (0.009) (0.075) (0.097)
Difference in Post Coefficients (1955-1950) -0.023 0.005 -0.114 0.023
Note: OLS regressions collapsed across deaths within region-years on an indicator for post introduction of Penicillin, region fixed effects, population invarious age categories and linear time trends. The outcome in columns (1) and (2) is the standard deviation in mortality for sensitive and insensitivediseases, respectively. The outcome in columns (3) and (4) is the level of mortality from sensitive and insensitive diseases, respectively. Each cellin rows (1) and (2) reports the coefficient on the post indicator. The sample varies by row, extending over the entire analytical time period in row(1) and truncating in 1950 in row (2). Row (3) reports the difference between the full and truncated sample values. If competing risks are drivingthe results, the effects in row (2) should be considerably less negative in row (1), columns (2) and (4), due to individuals in the lowest part of thehealth distribution surviving infectious disease due to the introduction of Penicillin but dying at higher rates a few years later from non-communicablemortality.
36
Appendix A
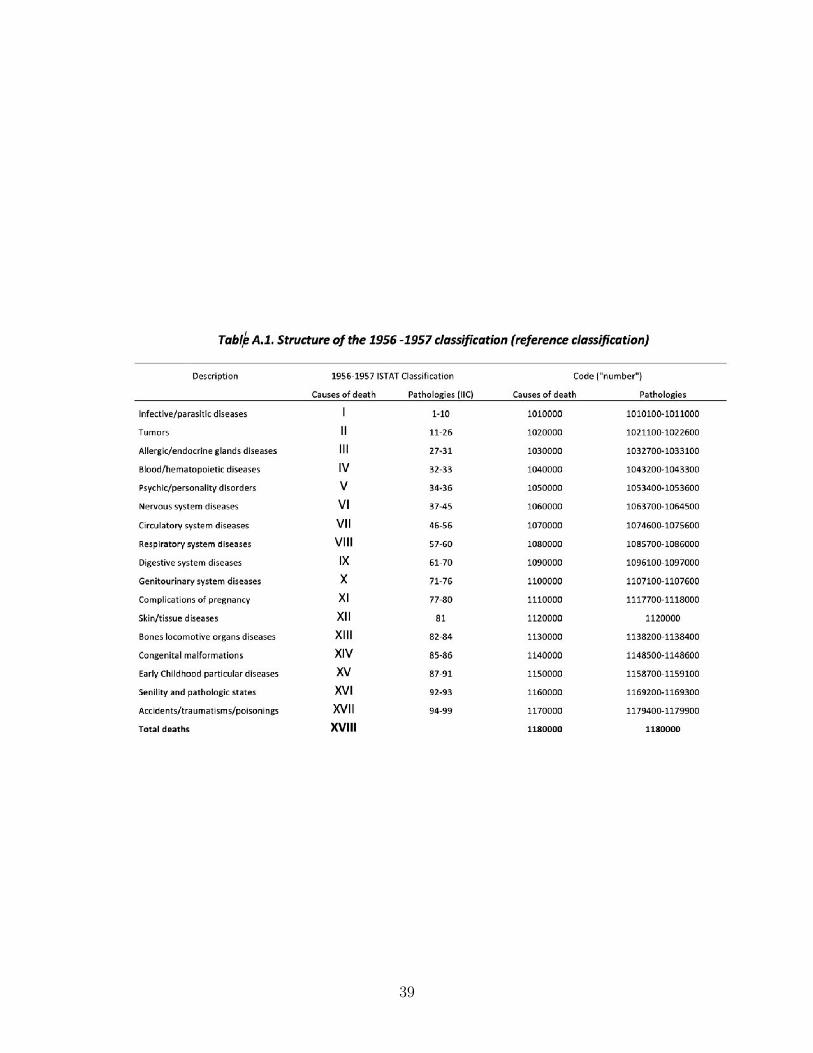
A.1 - The data-set on Causes of Death in Italy (1924-1955)In Italy data on mortality are collected routinely by the Italian National Statistical Office
(ISTAT) since 1888 and are published in the Health Statistics Yearbooks (Annuari di Statis-tiche Sanitarie). As disease classifications have changed over time, we can identify 5 timeintervals, based on 5 different classifications: 1888-1955, 1956-1957, 1958-1967, 1968-1969and after 1969. For our study we focus on the 1888-1955 period, although for conveniencewe use the classification adopted in 1956-1957 as our reference classification (it presentsthe less disaggregated set of information: 17 main causes of death and 99 more specificpathologies) and, therefore, we have re-organized the 1888-1955 classifications to reflect the1956-1957 classification.
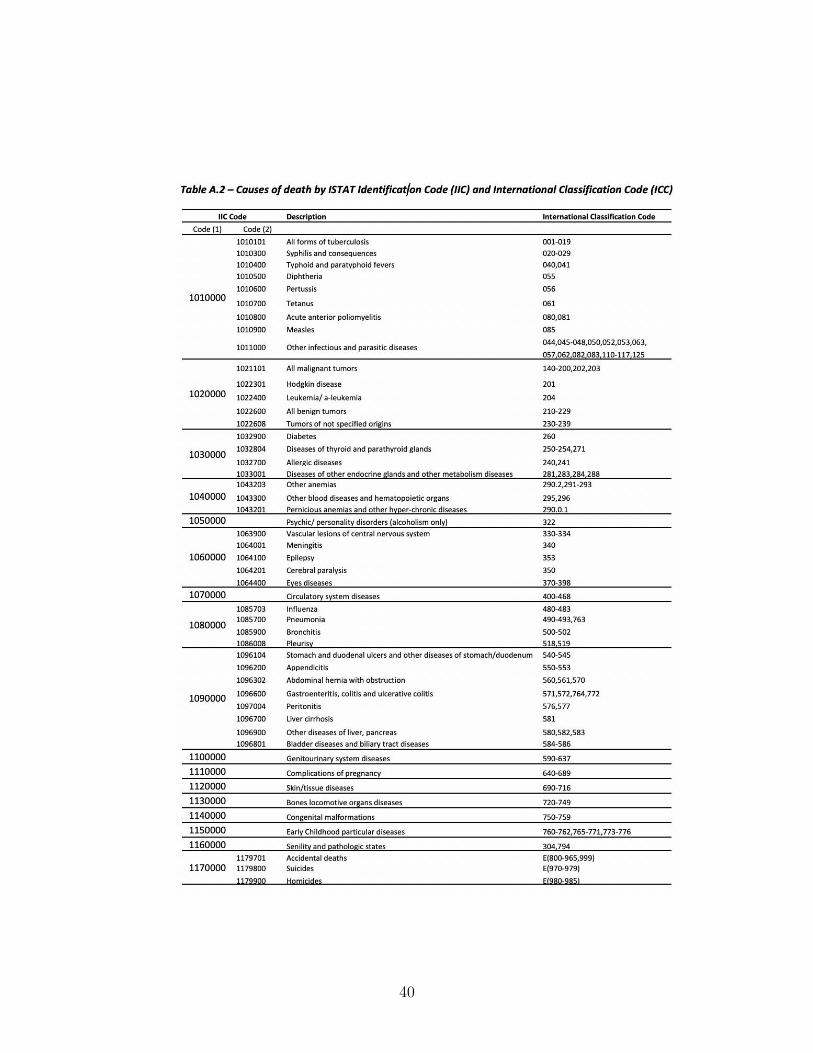
Originally, data for the period 1888-1955 were available only on paper in a single docu-ment printed by ISTAT (ISTAT, 1958) and presented in form of time series by region andcause of death. For our purposes all tables have been scanned and saved in form of excelfiles. These row data have been further processed and double-checked in order to avoiderrors from the scanning process. During the 1888-1955 period the classification follows theInternational Analytical Classification (IAC) code, which was approved in 1948 (ICD, 1948)and adopted in Italy from 1951. The reconstruction of the time series before year 1951 hasbeen carried out by ISTAT. The classification adopted in 1956 and 1957 has changed fromthe IAC to the ISTAT Intermediate Classification (IIC) coding system. Table A.1 providesa detailed list of all diseases with the relative IIC code, while Table A.2 provides a linkbetween the IIC and the IAC coding system.
The first column provides a brief description of the 17 main causes of death; the secondcolumn reports the ISTAT classification used to identify causes (ranging from I to XVII)and pathologies (ranging from 1 to 99); the third column describes the identification codethat we implemented starting from the ISTAT classification. It consists of 7 digits: the first3 digits denote 1 out of the 17 causes of death (101 to 117); the following 2 digits denote 1out of the 99 pathologies (from 01 to 99). The final 2 digits range from 00 to 10: they equalzero for any of the 99 pathologies resulting from the 1956-1957 classification, and take ondifferent values (from 01 to 10) for further disaggregation of pathologies possibly occurredeither between years 1888-1955. In terms of regional disaggregation it is worth mentioningthat until 1923 data refers to the Italian partition of territories prior to the WWI; from 1924to 1942, data are referred to the borders established after WWI; from 1943 onward, to theborders after the WWII. Data prior to 1943 are referred, for each region, to the partition ofterritories adopted at that time. Thus, the comparability across territories is imperfect forthose regions that have experienced border changes from 1927 (i.e., Veneto, Friuli-VeneziaGiulia, Umbria, Lazio, Abruzzi, Molise and Campania). To account for these geograph-ical border changes and in order to have an harmonized regional disaggregation, we havegrouped together Abruzzi and Molise and Piedmont and Valle dAosta, that leads to have thedataset disaggregated in the following 18 regions: Piedmont and Valle dAosta, Lombardy,Trentino Alto Adige, Veneto, Friuli Venezia Giulia, Liguria, Emilia Romagna, Tuscany, Um-bria, Marche, Lazio, Abruzzi and Molise, Campania, Apulia, Basilicata, Calabria, Sicily andSardinia.
37
A.2 - Construction of mortality ratesMortality rates are obtained dividing number of deaths by resident population. Unfor-
tunately, data on resident population by region is available only starting from 1922 and isobtained through a reconstruction made by Golini, Ciucci, Caselli and ISTAT (1983). Asit is only from 1924 that Italy was organized in 18 administrative regions (with only minorchanges with small borderline municipalities changing regions after that date) we decided tostart our analysis starts in 1924. For all these reasons we limit our analysis from 1924 to 1955.
38
39
40
Appendix B
Tab. B1 - LIST OF PENNICILIN SENSITIVE CAUSE OF DEATHTOTAL DEATH BY 17 MAIN CAUSES
1 antib.2 no antib.3 uncertain
FLAG CODE 10 14 26 DESCRIPTION FROM UNTIL1 1010000 101,000 1010,000 10100,000 infective and parasitic diseases (total) 1887 19691 1010001 101,000 1010,001 10100,010 infective and parasitic diseases (females) 1958 19691 1010010 101,001 1010,010 10100,100 infective and parasitic diseases (males) 1958 1969 Tubercolosys1 1010100 101,010 1010,100 10101,000 tubercolosis of respiratory system 1956 1969 Syphilis and its consequences1 1010101 101,010 1010,101 10101,010 all forms of tubercolosis 1887 1955 Typhoid and paratyphoid fevers1 1010102 101,010 1010,102 10101,020 pulmonary tubercolosis 1958 1967 Meningitis1 1010103 101,010 1010,103 10101,030 pleural tubercolosis 1958 1967 Pneumonia1 1010104 101,010 1010,104 10101,040 adenopatia tubercolosis, tracheo-bronch. with symptoms 1958 1967 Bronchitis1 1010105 101,011 1010,105 10101,050 other tubercolosis of respiratory system 1958 1967 Appendicitis1 1010200 101,020 1010,200 10102,000 other types of tubercolosis (total) 1956 1969 Peritonitis1 1010201 101,020 1010,201 10102,010 tbc of meningis and central nervous system 1958 1967 Nephritis and nephrosis.1 1010202 101,020 1010,202 10102,020 intestinal tbc, peritoneal and mesenteric glands 1958 19671 1010203 101,020 1010,203 10102,030 tbc of the bones 1958 19671 1010204 101,020 1010,204 10102,040 tbc linfatic system 1958 19671 1010205 101,021 1010,205 10102,050 tbc genitourinary system 1958 19671 1010206 101,021 1010,206 10102,060 other types of tubercolosis (residual) 1958 19671 1010300 101,030 1010,300 10103,000 syphilis and consequences 1887 19691 1010301 101,030 1010,301 10103,010 syphilis of central nervous system 1958 19671 1010302 101,030 1010,302 10103,020 other types of syphilis and its consequences 1958 19671 1010400 101,040 1010,400 10104,000 typhoid and paratyphoid fevers 1887 19691 1010401 101,040 1010,401 10104,010 typhoid fevers 1958 19671 1010402 101,040 1010,402 10104,020 paratyphoid fevers 1958 19671 1011001 101,100 1011,001 10110,010 gonococcic infections 1958 19671 1011002 101,100 1011,002 10110,020 other venereal diseases 1958 19671 1011003 101,100 1011,003 10110,030 brucellosis 1958 19671 1011004 101,100 1011,004 10110,040 alimentary infections 1958 19671 1011005 101,101 1011,005 10110,050 scarlat fever 1958 19671 1011006 101,101 1011,006 10110,060 septicemia and piemia 1958 19671 1064001 106,400 1064,001 10640,010 meningithis 1887 19671 1064401 106,440 1064,401 10644,010 keratitis 1959 19671 1064402 106,440 1064,402 10644,020 inflammations of lacrimal glands and tear duct 1958 19671 1064403 106,440 1064,403 10644,030 other inflammatory eye diseases 1958 19671 1064404 106,440 1064,404 10644,040 corneal ulcer 1958 19671 1064501 106,450 1064,501 10645,010 mastoiditis and otitis media 1958 19671 1074602 107,460 1074,602 10746,020 acute articular rheumatism with cardiac complications 1958 19671 1074701 107,470 1074,701 10747,010 mitral valve diseases, rheumatic and non specified diseases 1958 19671 1075201 107,520 1075,201 10752,010 endocarditis, myocarditis, and acute and subacute pericarditis 1958 19671 1085700 108,570 1085,700 10857,000 pneumonia 1887 19691 1085701 108,570 1085,701 10857,010 acute tonsillitis 1958 19671 1085702 108,570 1085,702 10857,020 other acute infections of upper respiratory tract 1958 19671 1085706 108,571 1085,706 10857,060 lobar pneumonia 1958 19671 1085707 108,571 1085,707 10857,070 other pneumonias 1958 19671 1085708 108,571 1085,708 10857,080 acute infections of respiratory tract, influenza and pneumonia 1958 19671 1085800 108,580 1085,800 10858,000 bronchopneumonia 1956 19691 1085900 108,590 1085,900 10859,000 bronchitis 1887 19691 1085901 108,590 1085,901 10859,010 acute and subacute bronchitis and not-specified bronchitis 1958 19671 1086001 108,600 1086,001 10860,010 other diseases and infections of upper respiratory tract 1958 19671 1086003 108,600 1086,003 10860,030 tonsils abscess 1958 19671 1086009 108,601 1086,009 10860,090 lung abscess 1958 19671 1096200 109,620 1096,200 10962,000 appendicitis 1924 19691 1096201 109,620 1096,201 10962,010 acute appendicitis 1958 19671 1096202 109,620 1096,202 10962,020 other types of appendicitis 1958 19671 1097004 109,700 1097,004 10970,040 peritonitis 1887 19671 1107100 110,710 1107,100 11071,000 nephritis and nephrosis 1887 19691 1107101 110,710 1107,101 11071,010 acute nephritis 1958 19671 1107102 110,710 1107,102 11071,020 other nephritis or nephrosis 1958 19671 1107103 110,710 1107,103 11071,030 hydronephrosis and pyelorenal infections 1958 19671 1107104 110,710 1107,104 11071,040 pyelorenal infections 1958 19671 1107302 110,730 1107,302 11073,020 cistitis 1958 19671 1107502 110,750 1107,502 11075,020 orchitis and epididymitis 1958 19671 1107602 110,760 1107,602 11076,020 salpingitis and oophoritis 1958 19671 1107604 110,760 1107,604 11076,040 infective diseases of uterus, vagina, and vulva 1958 19671 1117701 111,770 1117,701 11177,010 infections of genito urinary system during pregnancy 1958 19671 1117702 111,770 1117,702 11177,020 pregnancy toxemia 1958 19671 1117802 111,780 1117,802 11178,020 abortion with infection 1958 19671 1128101 112,810 1128,101 11281,010 furunculus, anthrax and other abscesses 1958 19671 1128102 112,810 1128,102 11281,020 other skin and cellulat tissue infections 1958 19671 1138202 113,820 1138,202 11382,020 rheumatoid arthritis and similar diseases 1958 19671 1138300 113,830 1138,300 11383,000 osteomyelitis and periostitis 1956 19691 1158800 115,880 1158,800 11588,000 infections of newborns 1956 19572 1010500 difterite 1887 19692 1010600 pertosse 1887 19692 1010700 tetanus 1887 19692 1010800 acute anterior poliomyelitis and its postums 1899 19692 1010801 poliomyelitis 1958 19672 1010802 postums of acute anterior poliomyelitis 1958 19672 1010900 morbillus 1887 19692 1011007 parotite epidemica 1958 19672 1020000 tumors (total) 1887 19692 1020001 tumors (females) 1958 19692 1020010 tumors (males) 1958 19692 1021100 cancers of mouth and throat 1956 19692 1021101 all malignant tumors 1887 19552 1021102 cancers of lips 1958 19672 1021103 cancers of tongue 1958 19672 1021105 other cancers of mouth and throat 1958 19672 1021200 cancers stomach 1956 19692 1021201 cancers esophagus 1958 19672 1021300 intestinal cancers 1956 19692 1021301 intestinal cancers and duodenal cancers 1958 19672 1021302 rectal cancers 1958 19672 1021400 cancers biliary tract and liver 1956 19692 1021500 other cancers digestive system 1956 19692 1021600 laryngeal cancers, cancers of trachea, bronchial tubes, and lungs 1956 19692 1021601 laryngeal cancers 1958 19672 1021602 cancers of trachea, bronchial tubes, and lungs 1958 19672 1021700 other cancers of respiratory system 1956 19692 1021800 breast cancers 1956 19692 1021802 cancers of female genital organs 1958 19672 1021900 cervical uterus cancers 1956 19692 1021901 cancers of other parts of uterus 1958 19672 1022000 cancers of other female genital organs 1956 19692 1022100 prostate cancers 1956 19692 1022101 other cancers of male genital organs 1958 19672 1022200 cancers of urinal organs 1956 19672 1022300 cancers of other areas 1956 19692 1022301 hodgking disease 1942 19672 1022302 cancers of skin 1958 19672 1022303 cancers of brain and of other parts of nervous system 1958 19672 1022304 cancers of bones, cancers of connective and muscular tissue 1958 19672 1022305 other non-specified cancers 1958 19672 1022400 leukemia and aleukemia 1931 19692 1022500 others lymphoblastomas 1956 19692 1022600 all benign tumors 1931 19692 1022601 other benign tumors of non specific origins 1958 19672 1022602 benign tumors of breast 1958 1967
YEARS AVAILABLE
FLAG
41
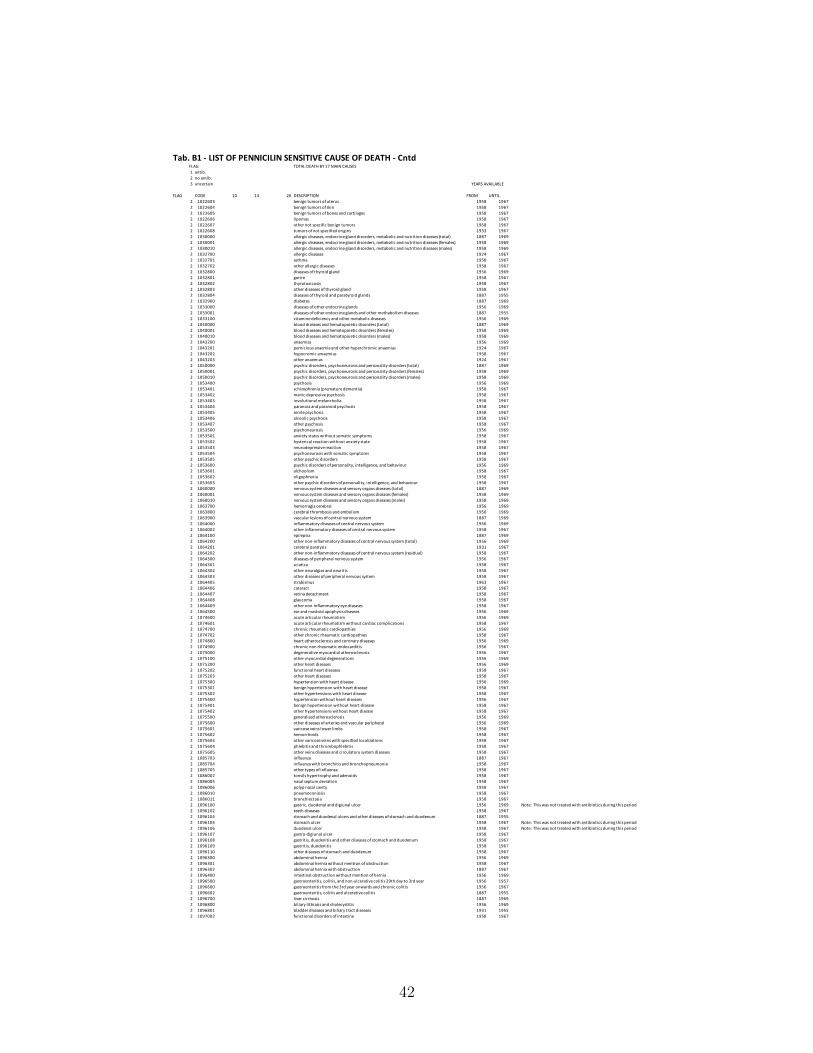
Tab. B1 - LIST OF PENNICILIN SENSITIVE CAUSE OF DEATH - CntdTOTAL DEATH BY 17 MAIN CAUSES
1 antib.2 no antib.3 uncertain
FLAG CODE 10 14 26 DESCRIPTION FROM UNTIL2 1022603 benign tumors of uterus 1958 19672 1022604 benign tumors of skin 1958 19672 1022605 benign tumors of bones and cartilages 1958 19672 1022606 lipomas 1958 19672 1022607 other not specific benign tumors 1958 19672 1022608 tumors of not specified origins 1933 19672 1030000 allergic diseases, endocrine gland disorders, metabolic and nutrition diseases (total) 1887 19692 1030001 allergic diseases, endocrine gland disorders, metabolic and nutrition diseases (females) 1958 19692 1030010 allergic diseases, endocrine gland disorders, metabolic and nutrition diseases (males) 1958 19692 1032700 allergic diseases 1924 19672 1032701 asthma 1958 19672 1032702 other allergic diseases 1958 19672 1032800 diseases of thyroid gland 1956 19692 1032801 goitre 1958 19672 1032802 thyrotoxicosis 1958 19672 1032803 other diseases of thyroid gland 1958 19672 1032804 diseases of thyroid and paratyroid glands 1887 19552 1032900 diabetes 1887 19692 1033000 diseases of other endocrine glands 1956 19692 1033001 diseases of other endocrine glands and other methabolism diseases 1887 19552 1033100 vitamine deficiency and other metabolic diseases 1956 19692 1040000 blood diseases and hematopoietic disorders (total) 1887 19692 1040001 blood diseases and hematopoietic disorders (females) 1958 19692 1040010 blood diseases and hematopoietic disorders (males) 1958 19692 1043200 anaemias 1956 19692 1043201 pernicious anaemia and other hyperchromic anaemias 1924 19672 1043202 hypocromic amaemias 1958 19672 1043203 other anaemias 1924 19672 1050000 psychic disorders, psychoneurosis and personality disorders (total) 1887 19692 1050001 psychic disorders, psychoneurosis and personality disorders (females) 1958 19692 1050010 psychic disorders, psychoneurosis and personality disorders (males) 1958 19692 1053400 psychosis 1956 19692 1053401 schizophrenia (premature dementia) 1958 19672 1053402 manic depressive psychosis 1958 19672 1053403 involutional melancholia 1958 19672 1053404 paranoia and paranoid psychosis 1958 19672 1053405 senile psychosis 1958 19672 1053406 alcoolic psychosis 1958 19672 1053407 other psychosis 1958 19672 1053500 psychoneurosis 1956 19692 1053501 anxiety states without somatic symptoms 1958 19672 1053502 hysterical reaction without anxiety state 1958 19672 1053503 neurodepressive reaction 1958 19672 1053504 psychoneurosis with somatic symptoms 1958 19672 1053505 other psychic disorders 1958 19672 1053600 psychic disorders of personality, intelligence, and behaviour 1956 19692 1053601 alchoolism 1958 19672 1053602 oligophrenia 1958 19672 1053603 other psychic disorders of personality, intelligence, and behaviour 1958 19672 1060000 nervous system diseases and sensory organs diseases (total) 1887 19692 1060001 nervous system diseases and sensory organs diseases (females) 1958 19692 1060010 nervous system diseases and sensory organs diseases (males) 1958 19692 1063700 hemorragia cerebral 1956 19692 1063800 cerebral thrombosis and embolism 1956 19692 1063900 vascular lesions of central nervous system 1887 19692 1064000 inflammatory diseases of central nervous system 1956 19692 1064002 other inflammatory diseases of central nervous system 1958 19672 1064100 epilepsia 1887 19692 1064200 other non-inflammatory diseases of central nervous system (total) 1956 19692 1064201 cerebral paralysis 1931 19672 1064202 other non-inflammatory diseases of central nervous system (residual) 1958 19672 1064300 diseases of peripheral nervous system 1956 19672 1064301 sciatica 1958 19672 1064302 other neuralgias and neuritis 1958 19672 1064303 other diseases of peripheral nervous system 1958 19672 1064405 strabismus 1963 19672 1064406 cataract 1958 19672 1064407 retina detachment 1958 19672 1064408 glaucoma 1958 19672 1064409 other non-inflammatory eye diseases 1958 19672 1064500 ear and mastoid apophysis diseases 1956 19692 1074600 acute articular rheumatism 1956 19692 1074601 acute articular rheumatism without cardiac complications 1958 19672 1074700 chronic rheumatic cardiopathies 1956 19692 1074702 other chronic rheumatic cardiopathies 1958 19672 1074800 heart atherosclerosis and coronary diseases 1956 19692 1074900 chronic non rheumatic endocarditis 1956 19672 1075000 degenerative myocardial atherosclerosis 1956 19672 1075100 other myocardial degenerations 1956 19692 1075200 other heart diseases 1956 19692 1075202 functional heart diseases 1958 19672 1075203 other heart diseases 1958 19672 1075300 hypertension with heart disease 1956 19692 1075301 benign hypertension with heart disease 1958 19672 1075302 other hypertensions with heart disease 1958 19672 1075400 hypertension without heart diseases 1956 19672 1075401 benign hypertension without heart disease 1958 19672 1075402 other hypertensions without heart disease 1958 19672 1075500 generalized atherosclerosis 1956 19692 1075600 other diseases of arteries and vascular peripheral 1956 19692 1075601 varicose veins lower limbs 1958 19672 1075602 hemorrhoids 1958 19672 1075603 other varicose veins with specified localizations 1958 19672 1075604 phlebitis and thrombophlebitis 1958 19672 1075605 other veins diseases and circulatory system diseases 1958 19672 1085703 influenza 1887 19672 1085704 influenza with bronchitis and bronchopneumonia 1958 19672 1085705 other types of influenza 1958 19672 1086002 tonsils hypertrophy and adenoids 1958 19672 1086005 nasal septum deviation 1958 19672 1086006 polyp nasal cavity 1958 19672 1086010 pneumoconiosis 1958 19672 1086011 bronchiectasia 1958 19672 1096100 gastric, duodenal and digiunal ulcer 1956 1969 Note: This was not treated with antibiotics during this period2 1096102 teeth diseases 1958 19672 1096104 stomach and duodenal ulcers and other diseases of stomach and duodenum 1887 19552 1096105 stomach ulcer 1958 1967 Note: This was not treated with antibiotics during this period2 1096106 duodenal ulcer 1958 1967 Note: This was not treated with antibiotics during this period2 1096107 gastro-digiunal ulcer 1958 19672 1096108 gastritis, duodenitis and other diseases of stomach and duodenum 1958 19672 1096109 gastritis, duodenitis 1958 19672 1096110 other diseases of stomach and duodenum 1958 19672 1096300 abdominal hernia 1956 19692 1096301 abdominal hernia without mention of obstruction 1958 19672 1096302 abdominal hernia with obstruction 1887 19672 1096400 intestinal obstruction without mention of hernia 1956 19692 1096500 gastroenteritis, colitis, and non-ulcerative colitis 29th day to 3rd year 1956 19572 1096600 gastroenteritis from the 3rd year onwards and chronic colitis 1956 19672 1096602 gastroenteritis, colitis and ulcerative colitis 1887 19552 1096700 liver cirrhosis 1887 19692 1096800 biliary lithiasis and cholecystitis 1956 19692 1096801 bladder diseases and biliary tract diseases 1931 19552 1097002 functional disorders of intestine 1958 1967
FLAG
YEARS AVAILABLE
42
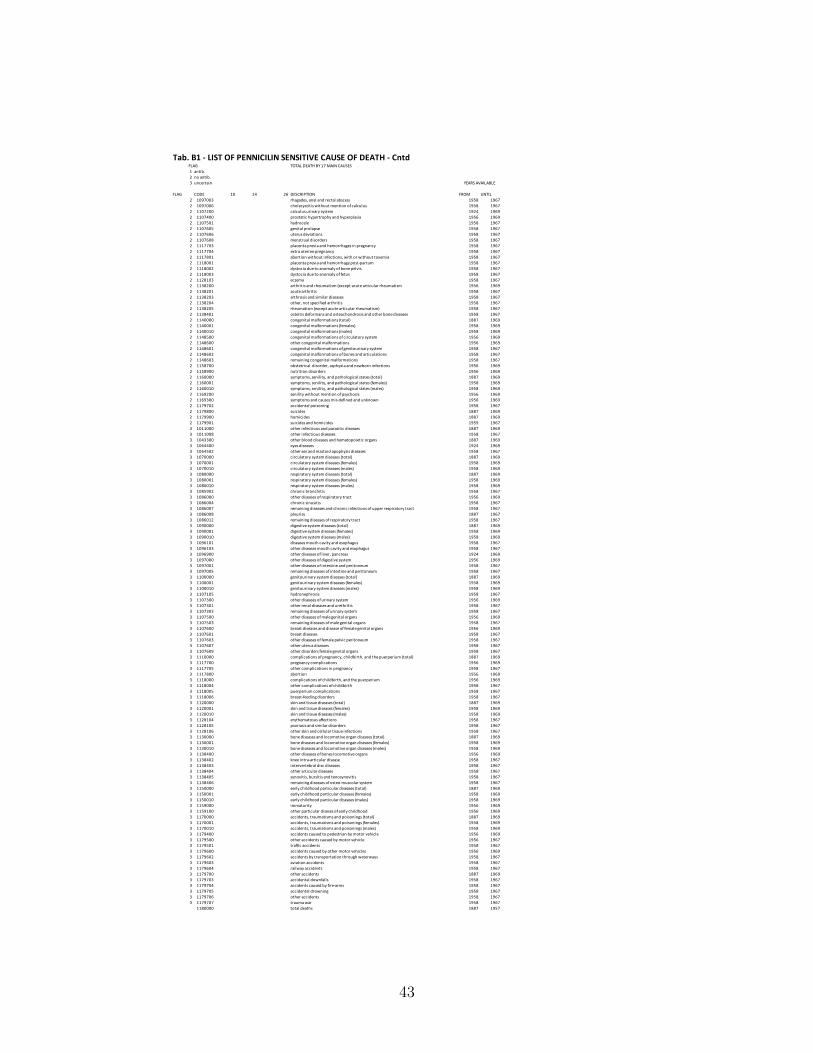
Tab. B1 - LIST OF PENNICILIN SENSITIVE CAUSE OF DEATH - CntdTOTAL DEATH BY 17 MAIN CAUSES
1 antib.2 no antib.3 uncertain
FLAG CODE 10 14 26 DESCRIPTION FROM UNTIL2 1097003 rhagades, anal and rectal abscess 1958 19672 1097006 cholecystitis without mention of calculus 1958 19672 1107200 calculus urinary system 1924 19692 1107400 prostatic hypertrophy and hyperplasia 1956 19692 1107501 hydrocele 1958 19672 1107605 genital prolapse 1958 19672 1107606 uterus deviations 1958 19672 1107608 menstrual disorders 1958 19672 1117703 placenta previa and hemorrhages in pregnancy 1958 19672 1117704 extra uterine pregnancy 1958 19672 1117801 abortion without infections, with or without toxemia 1958 19672 1118001 placenta previa and hemorrhage post-partum 1958 19672 1118002 dystocia due to anomaly of bone pelvis 1958 19672 1118003 dystocia due to anomaly of fetus 1958 19672 1128103 eczema 1958 19672 1138200 arthritis and rheumatism (except acute articular rheumatism 1956 19692 1138201 acute arthritis 1958 19672 1138203 arthrosis and similar diseases 1958 19672 1138204 other, not specified arthritis 1958 19672 1138205 rheumatism (except acute articular rheumatism) 1958 19672 1138401 osteitis deformans and osteochondrosis and other bone diseases 1958 19672 1140000 congenital malformations (total) 1887 19692 1140001 congenital malformations (females) 1958 19692 1140010 congenital malformations (males) 1958 19692 1148500 congenital malformations of circulatory system 1956 19692 1148600 other congenital malformations 1956 19692 1148601 congenital malformations of genitourinary system 1958 19672 1148602 congenital malformations of bones and articulations 1958 19672 1148603 remaining congenital malformations 1958 19672 1158700 obstetrical disorder, asphyxia and newborn infections 1956 19692 1158900 nutrition disorders 1956 19692 1160000 symptoms, senility, and pathological states (total) 1887 19692 1160001 symptoms, senility, and pathological states (females) 1958 19692 1160010 symptoms, senility, and pathological states (males) 1958 19692 1169200 senility without mention of psychosis 1956 19692 1169300 symptoms and causes mis-defined and unknown 1956 19692 1179702 accidental poisoning 1958 19672 1179800 suicides 1887 19692 1179900 homicides 1887 19692 1179901 suicides and homicides 1959 19673 1011000 other infectious and parasitic diseases 1887 19693 1011008 other infectious diseases 1958 19673 1043300 other blood diseases and hematopoietic organs 1887 19693 1064400 eyes diseases 1924 19693 1064502 other ear and mastoid apophysis diseases 1958 19673 1070000 circulatory system diseases (total) 1887 19693 1070001 circulatory system diseases (females) 1958 19693 1070010 circulatory system diseases (males) 1958 19693 1080000 respiratory system diseases (total) 1887 19693 1080001 respiratory system diseases (females) 1958 19693 1080010 respiratory system diseases (males) 1958 19693 1085902 chronic bronchitis 1958 19673 1086000 other diseases of respiratory tract 1956 19693 1086004 chronic sinusitis 1958 19673 1086007 remaining diseases and chronic infections of upper respiratory tract 1958 19673 1086008 pleurisy 1887 19673 1086012 remaining diseases of respiratory tract 1958 19673 1090000 digestive system diseases (total) 1887 19693 1090001 digestive system diseases (females) 1958 19693 1090010 digestive system diseases (males) 1958 19693 1096101 diseases mouth cavity and esophagus 1958 19673 1096103 other diseases mouth cavity and esophagus 1958 19673 1096900 other diseases of liver, pancreas 1924 19693 1097000 other diseases of digestive system 1956 19693 1097001 other diseases of intestine and peritoneum 1958 19673 1097005 remaining diseases of intestine and peritoneum 1958 19673 1100000 genitourinary system diseases (total) 1887 19693 1100001 genitourinary system diseases (females) 1958 19693 1100010 genitourinary system diseases (males) 1958 19693 1107105 hydronephrosis 1958 19673 1107300 other diseases of urinary system 1956 19693 1107301 other renal diseases and urethritis 1958 19673 1107303 remaining diseases of urinary system 1958 19673 1107500 other diseases of male genital organs 1956 19693 1107503 remaining diseases of male genital organs 1958 19673 1107600 breast diseases and disease of female genital organs 1956 19693 1107601 breast diseases 1958 19673 1107603 other diseases of female pelvic peritoneum 1958 19673 1107607 other uterus diseases 1958 19673 1107609 other disorders female genital organs 1958 19673 1110000 complications of pregnancy, childbirth, and the puerperium (total) 1887 19693 1117700 pregnancy complications 1956 19693 1117705 other complications in pregnancy 1958 19673 1117800 abortion 1956 19693 1118000 complications of childbirth, and the puerperium 1956 19693 1118004 other complications of childbirth 1958 19673 1118005 puerperium complications 1958 19673 1118006 breast-feeding disorders 1958 19673 1120000 skin and tissue diseases (total) 1887 19693 1120001 skin and tissue diseases (females) 1958 19693 1120010 skin and tissue diseases (males) 1958 19693 1128104 erythematosus affections 1958 19673 1128105 psoriasis and similar disorders 1958 19673 1128106 other skin and cellular tissue infections 1958 19673 1130000 bone diseases and locomotive organ diseases (total) 1887 19693 1130001 bone diseases and locomotive organ diseases (females) 1958 19693 1130010 bone diseases and locomotive organ diseases (males) 1958 19693 1138400 other diseases of bones locomotive organs 1956 19693 1138402 knee intra-articular disease 1958 19673 1138403 intervertebral disc diseases 1958 19673 1138404 other articular diseases 1958 19673 1138405 synovitis, bursitis and tenosynovitis 1958 19673 1138406 remaining diseases of osteo-muscolar system 1958 19673 1150000 early childhood particular diseases (total) 1887 19693 1150001 early childhood particular diseases (females) 1958 19693 1150010 early childhood particular diseases (males) 1958 19693 1159000 immaturity 1956 19693 1159100 other particular diseses of early childhood 1956 19693 1170000 accidents, traumatisms and poisonings (total) 1887 19693 1170001 accidents, traumatisms and poisonings (females) 1958 19693 1170010 accidents, traumatisms and poisonings (males) 1958 19693 1179400 accidents caused to pedestrian by motor vehicle 1956 19693 1179500 other accidents caused by motor vehicle 1956 19673 1179501 traffic accidents 1958 19673 1179600 accidents caused by other motor vehicles 1956 19693 1179602 accidents by transportation through waterways 1958 19673 1179603 aviation accidents 1958 19673 1179604 railway accidents 1958 19673 1179700 other accidents 1887 19693 1179703 accidental downfalls 1958 19673 1179704 accidents caused by fire-arms 1958 19673 1179705 accidental drowning 1958 19673 1179706 other accidents 1958 19673 1179707 trauma war 1958 1967
1180000 total deaths 1887 1957
YEARS AVAILABLE
FLAG
43


