Embed Size (px)
Citation preview

The protectedpdf technology is © Copyright 2006 Vitrium Systems Inc. All Rights Reserved. Patents Pending.

UVA-F-1484 Version 2.3
This case was prepared by Robert F. Bruner and Sean D. Carr as a basis for classroom discussion rather than to illustrate effective or ineffective management. The case complements “Battle for Value: Federal Express Corporation vs. United Parcel Service of America, Inc.” (UVA-F-1115), prepared by Robert F. Bruner and Derick Bulkley. Copyright 2005 by the University of Virginia Darden School Foundation, Charlottesville, VA. All rights reserved. To order copies, send an e-mail to [email protected]. No part of this publication may be reproduced, stored in a retrieval system, used in a spreadsheet, or transmitted in any form or by any means—electronic, mechanical, photocopying, recording, or otherwise—without the permission of the Darden School Foundation. ◊
THE BATTLE FOR VALUE, 2004: FEDEX CORP. VS. UNITED PARCEL SERVICE, INC.
FedEx will produce superior financial returns for shareowners by providing high value-added supply chain, transportation, business, and related information services through focused operating companies competing collectively, and managed collaboratively, under the respected FedEx brand.
—FedEx mission statement (excerpt)
We serve the evolving distribution, logistics, and commerce needs of our customers worldwide, offering excellence and value in all we do. We sustain a financially strong company, with broad employee ownership, that provides a long-term competitive return to our shareowners.
—UPS mission statement (excerpt)
On June 18, 2004, the United States and China reached a landmark air-transportation
agreement that quintupled the number of commercial cargo flights between the two countries. The agreement also allowed for the establishment of air-cargo hubs in China and landing rights for commercial airlines at any available airport. The pact represented the most dramatic liberalization of air traffic in the history of the two nations, and FedEx Corporation and United Parcel Service, Inc. (UPS), the only U.S. all-cargo carriers then permitted to serve the vast Chinese market,1 were certain to be the primary beneficiaries of this opportunity.
News of the transportation agreement did not come as a major surprise to most observers
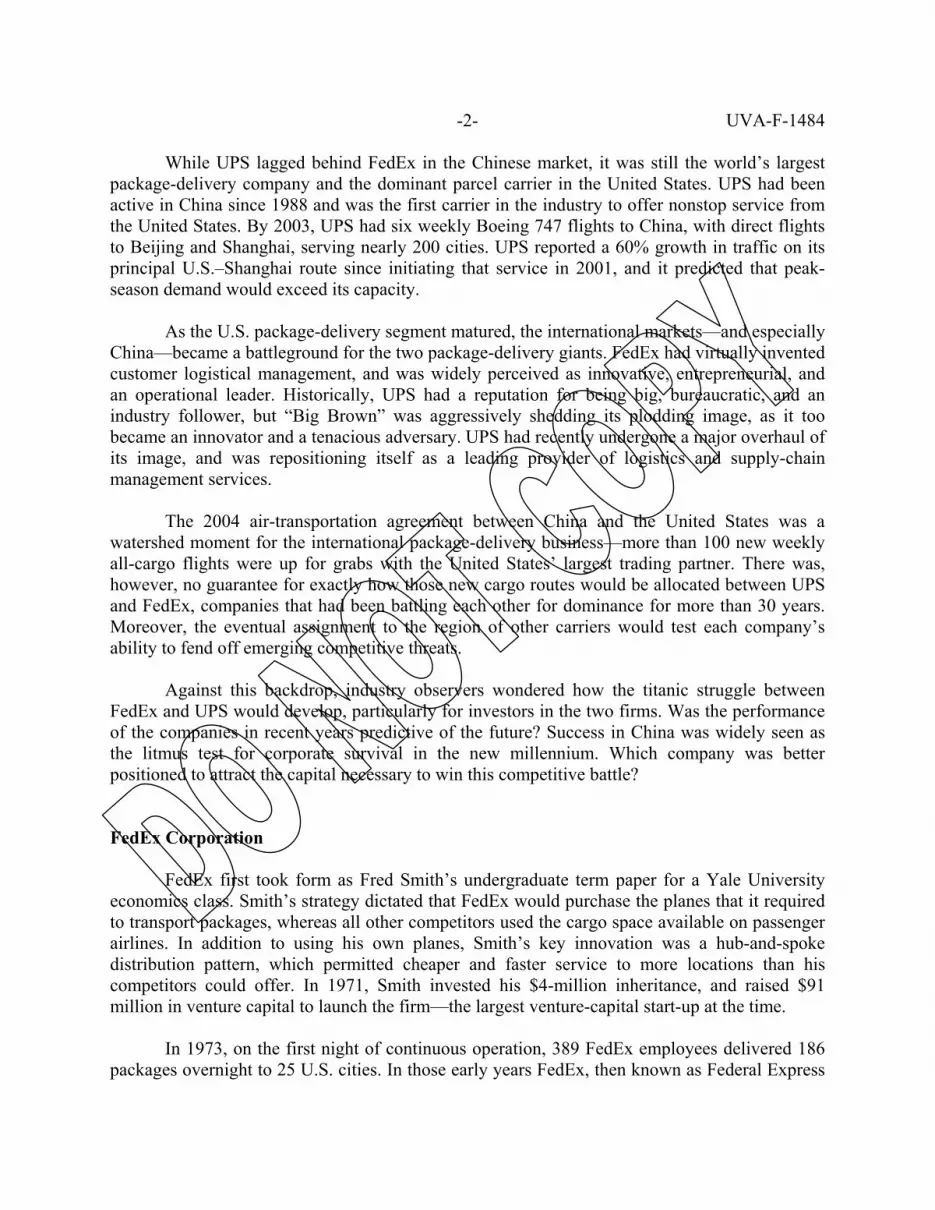
as U.S. and Chinese negotiators had been in talks since at least February. The stock prices of both companies had been rising steadily since those talks began, but FedEx’s share price had rocketed at a rate nearly five times faster than UPS’s.2 Exhibit 1 presents an illustration of recent stock-price patterns for the two firms relative to the S&P 500 Index. FedEx had the largest foreign presence in China, with 11 weekly flights—almost twice as many as UPS. The company served 220 Chinese cities, and flew directly to Beijing, Shenzhen, and Shanghai. FedEx’s volumes in China had grown by more than 50% between 2003 and 2004.
1 Northwest Airlines served China through both all-cargo and all-passenger services. 2 Between February 18 and June 18, 2004, FedEx’s stock price rose 13.9%, whereas UPS’s grew 3.1%.
UVA-F-1484
-2-
While UPS lagged behind FedEx in the Chinese market, it was still the world’s largest package-delivery company and the dominant parcel carrier in the United States. UPS had been active in China since 1988 and was the first carrier in the industry to offer nonstop service from the United States. By 2003, UPS had six weekly Boeing 747 flights to China, with direct flights to Beijing and Shanghai, serving nearly 200 cities. UPS reported a 60% growth in traffic on its principal U.S.–Shanghai route since initiating that service in 2001, and it predicted that peak-season demand would exceed its capacity.
As the U.S. package-delivery segment matured, the international markets—and especially
China—became a battleground for the two package-delivery giants. FedEx had virtually invented customer logistical management, and was widely perceived as innovative, entrepreneurial, and an operational leader. Historically, UPS had a reputation for being big, bureaucratic, and an industry follower, but “Big Brown” was aggressively shedding its plodding image, as it too became an innovator and a tenacious adversary. UPS had recently undergone a major overhaul of its image, and was repositioning itself as a leading provider of logistics and supply-chain management services.
The 2004 air-transportation agreement between China and the United States was a
watershed moment for the international package-delivery business—more than 100 new weekly all-cargo flights were up for grabs with the United States’ largest trading partner. There was, however, no guarantee for exactly how those new cargo routes would be allocated between UPS and FedEx, companies that had been battling each other for dominance for more than 30 years. Moreover, the eventual assignment to the region of other carriers would test each company’s ability to fend off emerging competitive threats.
Against this backdrop, industry observers wondered how the titanic struggle between
FedEx and UPS would develop, particularly for investors in the two firms. Was the performance of the companies in recent years predictive of the future? Success in China was widely seen as the litmus test for corporate survival in the new millennium. Which company was better positioned to attract the capital necessary to win this competitive battle? FedEx Corporation
FedEx first took form as Fred Smith’s undergraduate term paper for a Yale University
economics class. Smith’s strategy dictated that FedEx would purchase the planes that it required to transport packages, whereas all other competitors used the cargo space available on passenger airlines. In addition to using his own planes, Smith’s key innovation was a hub-and-spoke distribution pattern, which permitted cheaper and faster service to more locations than his competitors could offer. In 1971, Smith invested his $4-million inheritance, and raised $91 million in venture capital to launch the firm—the largest venture-capital start-up at the time.
In 1973, on the first night of continuous operation, 389 FedEx employees delivered 186
packages overnight to 25 U.S. cities. In those early years FedEx, then known as Federal Express

UVA-F-1484
-3-
Corporation, experienced severe losses, and Smith was nearly ousted from his chair position. By 1976, FedEx finally saw a modest profit of $3.6 million on an average daily volume of 19,000 packages. Through the rest of the 1970s, FedEx continued to grow by expanding services, acquiring more trucks and aircraft, and raising capital. The formula was successful. In 1981, FedEx generated more revenue than any other U.S. air-delivery company.
By 1981, competition in the industry had started to rise. Emery Air Freight began to
imitate FedEx’s hub system and to acquire airplanes, and UPS began to move into the overnight air market. The United States Postal Service (USPS) positioned its overnight letter at half the price of FedEx’s, but quality problems and FedEx’s “absolutely positively overnight” ad campaign quelled that potential threat. In 1983, FedEx reached $1 billion in revenues and seemed poised to own the market for express delivery.
During the 1990s, FedEx proved itself as an operational leader, even receiving the
prestigious Malcolm Baldrige National Quality Award from the President of the United States. FedEx was the first company ever to win in the service category. Part of this success could be attributed to deregulation and to operational strategy, but credit could also be given to FedEx’s philosophy of “People-Service-Profit,” which reflected its emphasis on customer focus, total quality management, and employee participation. Extensive attitude surveying, a promote-from-within policy, effective grievance procedures that sometimes resulted in a chat with Fred Smith himself, and an emphasis on personal responsibility and initiative not only earned FedEx a reputation as a great place to work, but also helped to keep the firm largely free of unions.
FedEx’s growth occurred within the context of fundamental change in the business
environment. Deregulation of the domestic airline industry permitted larger planes to replace smaller ones, thereby permitting FedEx to purchase several Boeing 727s, which helped reduce its unit costs. Trucking industry deregulation also permitted FedEx to establish an integrated regional trucking system that lowered its unit costs on short-haul trips, enabling the company to compete more effectively with UPS. Rising inflation and global competitiveness compelled manufacturers to manage inventories more closely and to emulate the just-in-time (JIT) supply programs of the Japanese, creating a heightened demand for FedEx’s rapid and carefully monitored movement of packages. And, finally, technological innovations enabled FedEx to achieve important advances in customer ordering, package tracking, and process monitoring.
By the end of 2003, FedEx had nearly $15.4 billion in assets and net income of $830 million on revenues of about $22.5 billion. Exhibit 2 provides FedEx’s financial and analytical ratios. The company had about 50,000 ground vehicles, 625 aircraft, 216,500 full- and part-time employees, and shipped more than 5.4 million packages daily.

UVA-F-1484
-4-
United Parcel Service, Inc. Founded in 1907, United Parcel Service, Inc., was the largest package-delivery company
in the world. Consolidated parcel delivery, both on the ground and through the air, was the primary business of the company, although increasingly the company offered more specialized transportation and logistics services.
Known in the industry as Big Brown, UPS had its roots in Seattle, Washington, where
19-year-old Jim Casey started a bicycle-messenger service called American Messenger Company. After merging with a rival firm, Motorcycle Delivery Company, the company focused on department-store deliveries, and that remained true until the 1940s. Renamed United Parcel Service of America, UPS started an air-delivery service in 1929 by putting packages on commercial passenger planes. The company entered its strongest period of growth during the post–World War II economic boom and, by 1975, UPS had reached a milestone when it could promise package delivery to every address in the continental United States. That same year the company expanded outside the country with its first delivery to Ontario, Canada. The following year, UPS began service in West Germany with 120 of its trademark-brown delivery vans.
The key to the success of UPS, later headquartered in Atlanta, Georgia, was efficiency.
According to BusinessWeek, “Every route is timed down to the traffic light. Each vehicle was engineered to exacting specifications. And the drivers … endure a daily routine calibrated down to the minute.”3 But this demand for machinelike precision met with resistance by UPS’s heavily unionized labor force. Of those demands, UPS driver Mark Dray said:
…drivers are expected to keep precise schedules (with hours broken down into hundredths) that do not allow for variables such as weather, traffic conditions, and package volume. If they’re behind, they’re reprimanded, and if they’re ahead of schedule, their routes are lengthened.4
In its quest for efficiency, UPS experienced several major strikes resulting from changes in labor practices and driver requirements. In August 1997, the 190,000 teamsters employed at UPS went on strike for 15 days before agreeing to a new five-year contract. In addition to large wage increases, the new agreement called for the creation of 10,000 new full-time jobs and the shifting of 10,000 part-time workers into full-time positions. The strike cost UPS $700 million in lost revenue, resulting in less than 1% sales growth for the year (1996) and a decline in profits to $909 million from $1.15 billion.
For most of the company’s history, UPS stock was owned solely by UPS’s managers,
their families, former employees, or charitable foundations owned by UPS. The company acted
3 Todd Vogel and Chuck Hawkins, “Can UPS Deliver the Goods in a New World?” BusinessWeek (4 June
1990). 4 Jill Hodges, “Driving Negotiations; Teamsters Survey Says UPS Drivers among Nation’s Most Stressed
Workers,” Star Tribune (9 June 1993).

UVA-F-1484
-5-
as the market-maker in its own shares, buying or selling shares at a fair market value5 determined by the board of directors each quarter. By the end of the millennium, however, having shrugged off the lingering effects of the strike and having emerged as a newly revitalized company with strong forward momentum, company executives determined that UPS needed the added flexibility of publicly traded stock in order to pursue a more aggressive acquisition strategy.
In November 1999, UPS initiated a two-for-one stock split, whereby the company
exchanged each existing UPS share for two Class A shares. The company then sold 109.4 million newly created Class B shares on the New York Stock Exchange in an initial public offering (IPO) that raised $5.266 billion, net of issuance costs. UPS used the majority of these proceeds to repurchase 68 million shares of the Class A stock. Following a holding period after the IPO, Class A shares were convertible to Class B, and could be traded or sold accordingly. Although both shares of stock had the same economic interest in the company, Class A shares entitled holders to ten votes per share while the Class B shareowners were entitled to one vote.
Until the stock split and IPO in 1999, the financially and operationally conservative
company had been perceived as slow and plodding. Although much larger than FedEx, UPS had not chosen to compete directly in the overnight delivery market until 1982, largely because of the enormous cost of building an air fleet. But after going public UPS initiated an aggressive series of acquisitions, beginning with a Miami-based freight carrier operating in Latin America and a franchise-based chain of stores providing packing, shipping, and mail services called Mail Boxes Etc. (later renamed the UPS Store) with more than 4,300 domestic and international locations.
More assertive than ever before, the UPS of the new millennium was the product of
extensive reengineering efforts and a revitalized business focus. While the company had traditionally been the industry’s low-cost provider, in recent years the company had been investing heavily in information technology, aircraft, and facilities to support service innovations, maintain quality, and reduce costs. In early 2003, the company revamped its logo for the first time since 1961, and emphasized its activities in the wider supply-chain industry. “The small-package market in the United States is about a $60-billion market. The worldwide supply-chain market is about a $3.2-trillion market,” said Mike Eskew, UPS’s chair and CEO. “It’s everything from the moment something gets made until it gets delivered for final delivery, and then after market, it’s parts replacement.”6
By 2003, UPS offered package-delivery services throughout the United States and in
more than 200 countries and territories, and moved more than 13 million packages and documents through its network every day. Domestic package operations accounted for 76% of revenues in 2002; international (15%); nonpackage (9%). In the United States, it was estimated
5 In setting its share price, the board considered a variety of factors, including past and current earnings, earnings estimates, the ratio of UPS’s common stock to its debt, the business and outlook of UPS, and the general economic climate. The opinions of outside advisers were sometimes considered. The stock price had never decreased in value. The employee stock purchases were often financed with stock hypothecation loans from commercial banks. As the shares provided the collateral for those loans, the assessment made by the outside lenders provided some external validation for the share price.
6 Harry R. Weber, “UPS, FedEx Rivalry: A Study in Contrasts,” Associated Press Newswires, 21 May 2004.

UVA-F-1484
-6-
that the company’s delivery system carried goods having a value in excess of 6% of the U.S. gross domestic product.7 The company employed 360,000 people (of whom 64% were unionized), and owned 88,000 ground vehicles and 583 aircraft.
At year-end 2003, UPS reported assets, revenues, and profits of $28.9 billion, $33.4 billion, and $2.9 billion, respectively. Exhibit 3 provides UPS’s financial and analytical ratios. The company’s financial conservatism was reflected in its AAA bond rating. Competition in the Express-Delivery Market
The $45-billion domestic U.S. package-delivery market could be segmented along at least three dimensions: weight, mode of transit, and timeliness of service. The weight categories consisted of letters (weighing 0−2.0 pounds), packages (2.0−70 pounds), and freight (over 70 pounds). The mode of transit categories were simply air and ground. Finally, time categories were overnight, deferred delivery (second-day), three-day delivery, and, lastly, regular delivery, which occurred four or more days after pickup.
The air-express segment was a $25-billion portion of the U.S. package-delivery industry,
and was concentrated in letters and packages, overnight and deferred, and air or air-and-ground. While virtually all of FedEx’s business activities were in the air-express segment of the package-delivery industry, only about 22% of UPS’s revenues were derived from its next-day air business. FedEx and UPS’s competition for dominance of the $25-billion domestic air-express delivery market foreshadowed an unusually challenging future.
Exhibit 4 provides a detailed summary of the major events marking the competitive
rivalry between FedEx and UPS. Significant dimensions of this rivalry included the following:
• Customer focus. Both companies emphasized their focus on the customer. This meant listening carefully to the customer’s needs, providing customized solutions rather than standardized products, and committing to service relationships.
• Price competition. UPS boldly entered the market by undercutting the price of FedEx’s overnight letter by half. But by the late 1990s, both firms had settled into a predictable pattern of regular price increases. Exhibit 5 provides a summary of recent rate increases.
• Operational reengineering. Given the intense price competition, the reduction of unit costs became a priority. Cost reduction was achieved through the exploitation of economies of scale, investment in technology, and business-process reengineering, which sought to squeeze unnecessary steps and costs out of the service process.
• Information technology. Information management became central to the operations of both UPS and FedEx. Every package handled by FedEx, for instance, was logged into COSMOS (Customer, Operations, Service, Master On-line System), which transmitted
7 “United Parcel Service, Inc.– SWOT Analysis,” Datamonitor Company Profiles (16 July 2004).

UVA-F-1484
-7-
data from package movements, customer pickups, invoices, and deliveries to a central database at the Memphis, Tennessee, headquarters. UPS relied on DIADs (Delivery Information Acquisition Devices), which were handheld units that drivers used to scan package barcodes and record customer signatures.
• Service expansion. FedEx and UPS increasingly pecked at each other’s service offerings. FedEx, armed with volume discounts and superb quality, went after the big clients that had previously used UPS without thought. UPS copied FedEx’s customer interfaces by installing 11,500 drop-off boxes to compete with FedEx’s 12,000 boxes, 165 drive-through stations, and 371 express-delivery stores. UPS also began Saturday pickups and deliveries to match FedEx’s schedule. FedEx bought $200 million in ground vehicles to match UPS.
• Logistics services. The largest innovations entailed offering integrated logistics services to large corporate clients. These services were aimed at providing total inventory control to customers, including purchase orders, receipt of goods, order entry and warehousing, inventory accounting, shipping, and accounts receivable. The London design-company Laura Ashley, for instance, retained FedEx to store, track, and ship products quickly to individual stores worldwide. Similarly, Dell Computer retained UPS to manage its total inbound and outbound shipping.
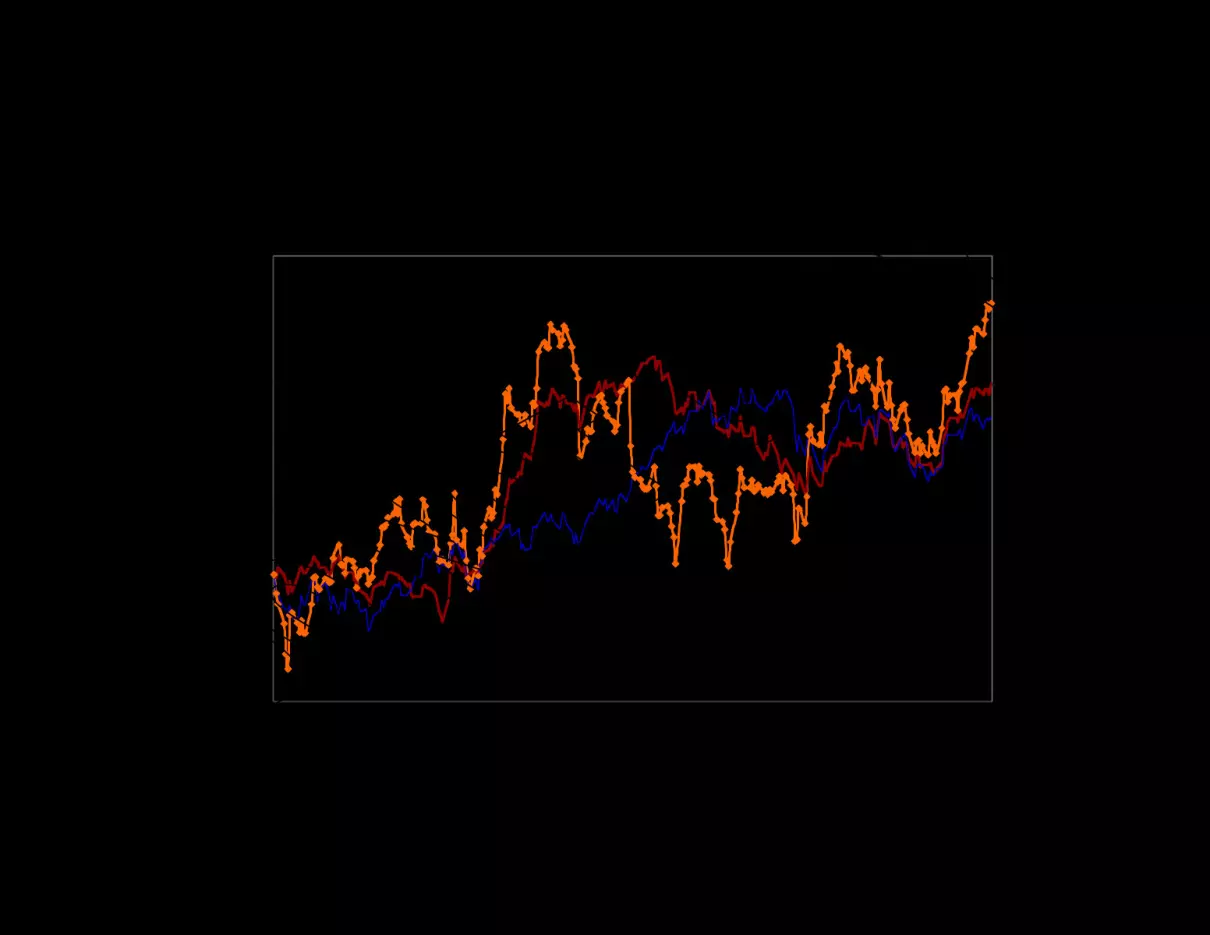
The impact of the fierce one-upmanship occurring between FedEx and UPS was clearly reflected in their respective investment expenditures. Between 1992 and 2003, capital expenditures for FedEx and UPS rose at an annualized rate of 34.64% and 36.78%, respectively. During this period, the two companies matched each other’s investments in capital almost exactly. (Exhibit 6 provides a graphical representation of the firms’ cumulative capital-investment expenditures.) International Package-Delivery Market
By 2004, express cargo aircraft carried nearly 50% of all international trade, measured by
value.8 Yet throughout the 1990s, international delivery had remained only a small part of the revenues for UPS and FedEx. After making significant investments in developing European delivery capabilities, FedEx eventually relinquished its hub in Europe in 1992 by selling its Brussels, Belgium, operation to DHL. Analysts estimated that FedEx had lost $1 billion in Europe since its entry there in 1984. FedEx would continue to deliver to Europe, but relied on local partners. In 1995, FedEx expanded its routes in Latin America and the Caribbean, and later introduced FedEx AsiaOne, a next-business-day service between Asian countries and the United States via a hub in Subic Bay, Philippines.
UPS did not break into the European market in earnest until 1988, with the acquisition of
10 European courier services. To enhance its international delivery systems, UPS created a system that coded and tracked packages and automatically billed customers for customs’ duties and taxes. UPS hoped that its international service would account for one-third of total revenue
8 Alexandara Harney and Dan Roberts, “Comment & Analysis,” Financial Times, 9 August 2004.

UVA-F-1484
-8-
by 2000. In May 1995, it announced that it would spend more than $1 billion to expand its European operations during the next five years. Exhibit 7 presents international and domestic (U.S.) segment data for FedEx and UPS.
According to economic and industry experts, China would become the world’s second-
largest economy within 11 years and the largest by 2039. It was already the world’s largest market for mobile phones and a key center for the production of textiles, computer chips, and other high-tech products. According to recent economic projections, inter-Asia trade was projected to grow at a rate of 16.8% annually through 2005.9
The overall market for air cargo in China had been growing at 30% a year and was
expected to increase at nearly that pace for the next five years.10 FedEx and UPS focused primarily on the import/export package market and not the intra-China domestic market, using local partners to pick up and deliver parcels within the country (although, by December 2005, each company would be permitted to own completely package operations in China). One industry source believed the domestic parcel market was approximately $800 million, while China’s export-import market was nearly $1 billion. “As it becomes the workshop of the world,” one observer noted, “teeming factories along the Pearl and Yangtze river deltas represent both the start of the world’s supply chain and the source of some of its biggest transport bottlenecks.”11
The newly announced U.S.–China air-service agreement would allow an additional 195
weekly flights for each country—111 by all-cargo carriers and 84 by passenger airlines—resulting in a total of 249 weekly flights by the end of a six-year phase-in period. The two countries also agreed to allow their carriers to serve any city in the other country. Until that time, Chinese carriers were limited to twelve U.S. cities, and U.S. passenger carriers could fly to only five Chinese cities. The agreement also provided that when carriers established cargo hubs in the other country, they would be granted a high degree of operating flexibility. According to U.S. Transportation Secretary Norman Mineta, “This agreement represents a giant step forward in creating an international air-transportation system that meets the needs of the new global marketplace.”
UPS and FedEx both welcomed the news. “This provides an extraordinary opportunity
for strengthening commercial supply chains that support growing international trade between the United States and China and throughout the world,” said Mike Eskew, UPS chair and CEO, who added that the hub provision in the agreement would facilitate that process. Fred Smith, chair and CEO of FedEx, said, “We think China is a huge opportunity for the company. We have significant expansion plans in the country, reflecting its fantastic growth and unique position as one of the world’s top manufacturing centers.”12
9 UPS press release, 4 November 2004. 10 Morgan Stanley, 6 April 2004. 11 Alexandara Harney and Dan Roberts, “Comment & Analysis,” Financial Times, 9 August 2004. 12 Dan Roberts, “FedEx Plans Expanded Services in China,” Financial Times, 23 June 2004.

UVA-F-1484
-9-
Performance Assessment
Virtually all interested observers—customers, suppliers, investors, and employees—watched the competitive struggle between UPS and FedEx for hints about the next stage of the drama. The conventional wisdom was that if a firm were operationally excellent, strong financial performance would follow. Indeed, FedEx had set a goal of producing “superior financial returns,” while UPS targeted “a long-term competitive return.” Had the two firms achieved their goals? Moreover, did the trends in financial performance suggest whether strong performance could be achieved in the future? In pursuit of the answers to those questions, the following exhibits afford several possible avenues of analysis.
EPS, market values, and returns Exhibit 8 presents the share prices, earnings per share (EPS), and price-earnings ratios
for the two firms. Also included is the annual total return from holding each share (percentage gain in share price plus dividend yield). Some analysts questioned the appropriateness of using UPS’s fair market-value share price before the 1999 IPO, because it had been set by the board of directors rather than in an open market.
Ratio analysis Exhibits 2 and 3 present a variety of analytical ratios computed from the financial
statements of each firm. Economic profit (economic value added, or EVA™) analysis EVA reflects the value created or destroyed each year by deducting a charge for capital
from the firm’s net operating profit after taxes (NOPAT).
EVA = Operating profits − Capital charge = NOPAT − (K × Capital)
The capital charge was determined by multiplying the cost of capital, K, by the capital employed in the business or operation. This computation could be done by either of two methods, both of which would yield the same answer; they are presented in the exhibits for the sake of illustration. The operating approach works with the asset side of the balance sheet, and computes NOPAT directly from the income statement. The capital approach works with the right-hand side of the balance sheet, and computes NOPAT indirectly (i.e., by adjusting net income).
Estimating capital: Exhibits 9 and 10 calculate the actual amount of capital from both an
operating and a capital approach. Included in capital are near-capital items that represent economic value employed on behalf of the firm, such as the present value of operating leases, amortized goodwill, and losses. The rationale for including losses and write-offs in continuing capital is that such losses represent unproductive assets or a failed investment. Were they

UVA-F-1484
-10-
excluded from the capital equation, the sum would only count successful efforts and would not accurately reflect the performance of the firm.
Estimating NOPAT: Exhibits 9 and 10 calculate NOPAT with a similar regard for losses
and write-offs. Here, the aim is to arrive at the actual cash generated by the concern. To do so, the exhibits add increases in deferred taxes back into income because it is not a cash expense, and calculate the interest expense of the leased operating assets as if they were leased capital assets.
Estimating cost of capital: The capital charge applied against NOPAT should be based on
a blend of the costs of all the types of capital the firm employs, or the weighted-average cost of capital (WACC). The cost of debt (used for both debt and leases) is the annual rate consistent with each firm’s bond rating (BBB for FedEx and AAA for UPS). The cost of equity may be estimated in a variety of ways. In the analysis here, the capital asset pricing model (CAPM)13 was employed. FedEx’s beta and cost of equity are used in estimating FedEx’s cost of capital. Because UPS’s beta was unobservable, the analysis that follows uses the average annual betas for UPS’s publicly held peer firms: FedEx, Air Express, Airborne Freight, Roadway, Yellow Transport, and J.B. Hunt Transport.
Estimating EVA and MVA: In Exhibits 9 and 10, the stock of capital and the flow of cash
are used to calculate the actual return and, with the introduction of the WACC, to calculate the EVA. These exhibits present the EVA calculated each year and cumulatively over time. The panel at the bottom of each exhibit estimates the market value created or destroyed (or the market value added [MVA]) over the observation period. MVA is calculated as the difference between the current market value of the company and its investment base. The market value created could be compared with cumulative EVA. In theory, the following relationships would hold:
MVA = Present value of all future EVA MVA = Market value of debt and equity − Capital
Thus, Market value = Capital + Present value of all future EVA
In other words, maximizing the present value of EVA would amount to maximizing the market value of the firm.
13 The CAPM describes the cost of equity as the sum of the risk-free rate of return and a risk premium. The risk
premium is the average risk premium for a large portfolio of stocks times the risk factor (beta) for the company. A beta equal to 1.0 suggests that the company is just as risky as the market portfolio; less than 1.0 suggests lower risk; greater than 1.0 implies greater risk.

UVA-F-1484
-11-
Outlook for FedEx and UPS About 70%14 of FedEx’s common shares were held by institutional investors that, it could
be assumed, were instrumental in setting the prices for the company’s shares. Typically, those investors absorbed the thinking of the several securities analysts who followed FedEx and UPS in 2004. Exhibit 11 contains excerpts from various equity reports, which indicate the outlook held by those analysts.
Observers of the air-express package-delivery industry pondered the recent performance
of the two leading firms and their prospects. What had been the impact of the intense competition between the two firms? Which firm was doing better? The companies faced a watershed moment with the dramatic liberalization of the opportunities in China. Might their past performance contain clues about the prospects for future competition?
14 Officers, directors, and employees of FedEx owned 7% of the shares; the remainder, about 23%, was owned
by individual investors not affiliated with the company.
UVA-F-1484
-12-
Exhibit 1
THE BATTLE FOR VALUE, 2004: FEDEX CORP. VS. UNITED PARCEL SERVICE, INC.
UPS and FedEx Price Patterns
June 18, 2003 to September 3, 2004 , p ,
0.90
0.95
1.00
1.05
1.10
1.15
1.20
1.25
Jun-03
Jul-03
Aug-03
Sep-03
Oct-03
Nov-03
Dec-03
Jan-04
Feb-04
Mar-04
Apr-04
May-04
Jun-04
Inde
x (1
8-Ju
n-03
= 1
.00)
UPS
FedEx
S&P 500
Source of data: Datastream (case writer’s analysis).

UVA-F-1484
-13-
Exhibit 2
THE BATTLE FOR VALUE, 2004: FEDEX CORP. VS. UNITED PARCEL SERVICE, INC. Financial and Analytical Ratios for FedEx
FEDEX CORP 1992 1993 1994 1995 1996 1997 1998 1999 2000 2001 2002 2003
Activity AnalysisAverage days outstanding 44.10 42.60 41.82 41.79 42.67 44.11 39.74 44.57 46.98 46.98 44.25 41.54 365/receivables turnoverWorking capital turnover (42.21) (817.85) 37.64 103.73 93.51 67.84 208.05 47.08 46.37 98.37 28.50 37.11 Sales/average net working capitalFixed assets turnover 2.21 2.25 2.46 2.53 2.50 2.49 2.67 2.56 2.58 2.42 2.48 2.58 Sales/average net fixed assetsTotal asset turnover 1.38 1.35 1.42 1.46 1.53 1.51 1.64 1.58 1.58 1.47 1.49 1.46 Sales/average total assets
Liquidity AnalysisCurrent ratio 0.87 0.99 1.15 1.05 1.07 1.09 1.03 1.13 1.14 1.06 1.25 1.18 Current assets/current liab.Cash ratio 0.06 0.11 0.26 0.20 0.06 0.06 0.08 0.12 0.02 0.04 0.11 0.16 (Cash + mkt securities)/curr. liab.Cash from operations ratio 0.38 0.50 0.50 0.58 0.58 0.51 0.61 0.64 0.56 0.63 0.76 0.56 Cash from operations/curr. liab.Defensive interval 0.70 0.78 0.91 0.92 0.68 0.72 0.80 0.92 0.94 0.87 0.92 1.02
Long-Term Debt and Solvency AnalysisDebt/equity ratio 1.24 1.21 0.95 0.70 0.52 0.51 0.41 0.29 0.37 0.36 0.28 0.28 Total debt/total equityTimes interest earned 1.36 1.82 2.92 3.73 4.31 5.06 6.42 7.78 7.83 6.58 6.98 10.51 EBIT/interest expenseFixed-charge coverage ratio 0.34 0.46 0.64 0.65 0.61 0.57 0.74 0.75 0.72 0.65 0.61 0.83 EBIT/(rental exp. and int. exp.)Capital expenditure ratio 0.15 0.21 0.22 0.28 0.23 0.22 0.29 0.27 0.23 0.25 0.27 0.22 Cash from operations/CAPEXCash from operations/debt ratio 0.27 0.36 0.42 0.65 0.71 0.66 1.04 1.29 0.91 0.96 1.23 0.93 Cash from operations/total debt
Profitability AnalysisMargin before interest and tax 3.67% 4.67% 6.26% 6.29% 6.07% 5.94% 6.82% 6.93% 6.69% 6.09% 5.79% 6.54% EBIT/salesNet profit margin (1.51%) 0.69% 2.41% 3.17% 3.00% 3.14% 3.17% 3.76% 3.77% 2.98% 3.45% 3.69% Net income/salesReturn on assets 1.63% 4.38% 6.45% 7.09% 6.75% 6.51% 6.94% 7.33% 7.32% 5.74% 6.38% 6.30% (NI + int. exp.)/avg total assetsReturn on total equity (7.20%) 3.22% 10.62% 13.25% 11.95% 12.19% 12.70% 13.54% 14.38% 9.90% 10.85% 11.39% Net income/average total equityFinancial leverage effect (21.85%) 7.43% 26.64% 28.87% 32.51% 35.85% 29.48% 35.63% 42.35% 28.59% 31.87% 44.36% Net income/operating income
Growth '92-'93 '93-'94 '94-'95 '95-'96 '96-'97 '97-'98 '98-'99 '99-'00 '00-'01 '01-'02 '02-'03 CAGR ('92 - '03)Sales 3.42% 8.60% 10.76% 9.39% 12.13% 37.79% 5.67% 8.84% 7.52% 4.98% 9.12% 11.53% (92-03)Book assets 6.04% 3.44% 7.36% 4.13% 13.83% 27.02% 9.93% 8.25% 15.73% 3.54% 11.39% 9.81% (92-03)Net income bef unusual (gain) loss (196.51%) 86.11% 45.61% 3.42% 17.37% 37.91% 26.73% 9.03% (15.10%) 24.07% 14.48% 25.20% (93-03)Net income (147.34%) 279.40% 45.61% 3.42% 17.37% 39.26% 25.51% 9.03% (15.10%) 21.50% 16.90% 35.51% (93-03)Operating income 31.67% 45.51% 11.40% 5.53% 9.65% 58.27% 7.43% 4.99% (2.14%) (0.16%) 23.30% 13.64% (92-03)
(Cash + AR + cash taxes)/(rents + gross CAPEX)
Source of data: DataStream (Thomson Financial).

UVA-F-1484
-14-
Exhibit 3
THE BATTLE FOR VALUE, 2004: FEDEX CORP. VS. UNITED PARCEL SERVICE, INC.
Financial and Analytical Ratios for UPS
UPS 1992 1993 1994 1995 1996 1997 1998 1999 2000 2001 2002 2003
Activity AnalysisAverage days outstanding 23.13 23.11 25.66 30.50 34.81 38.57 37.68 39.67 44.79 53.16 54.92 51.60 365/receivables turnoverWorking capital turnover 267.78 4,748.29 161.79 80.63 20.39 20.81 14.51 3.90 11.35 10.33 9.82 7.72 Sales/average net working capitalFixed assets turnover 2.59 2.63 2.52 2.34 2.19 2.04 2.18 2.34 2.41 2.28 2.30 2.41 Sales/average net fixed assetsTotal asset turnover 1.83 1.86 1.75 1.66 1.50 1.41 1.45 1.17 1.37 1.24 1.19 1.16 Sales/average total assets
Liquidity AnalysisCurrent ratio 1.03 1.00 1.04 1.09 1.35 1.32 1.46 2.65 1.58 1.64 1.57 1.79 Current assets/current liab.Cash ratio 0.06 0.12 0.09 0.07 0.12 0.14 0.44 1.50 0.43 0.35 0.54 0.72 (Cash + mkt securities)/curr. liab.Cash from operations ratio 0.69 0.74 0.56 0.66 0.60 0.73 0.77 0.53 0.61 0.84 1.01 0.84 Cash from operations/curr. liab.Defensive interval 1.71 1.83 1.47 1.36 1.38 1.60 3.12 5.13 3.07 2.82 4.98 4.57
Long-Term Debt and Solvency AnalysisDebt/equity ratio 0.23 0.22 0.24 0.34 0.44 0.43 0.36 0.19 0.37 0.50 0.37 0.26 Total debt/total equityTimes interest earned 18.68 23.59 20.85 17.19 13.71 7.38 12.17 16.08 19.58 16.83 23.15 36.41 EBIT/interest expenseFixed-charge coverage ratio 18.68 23.59 20.85 17.19 13.71 7.38 12.17 16.08 19.58 16.83 23.15 36.41 EBIT/(rental exp. and int. exp.)Capital expenditure ratio 0.23 0.26 0.21 0.22 0.19 0.22 0.25 0.19 0.22 0.29 0.41 0.33 Cash from operations/CAPEXCash from operations/debt ratio 1.67 2.04 1.43 1.13 0.74 0.94 1.10 0.92 0.76 0.75 1.22 1.22 Cash from operations/total debt
Profitability AnalysisMargin before interest and tax 7.74% 8.20% 7.95% 10.29% 9.07% 7.56% 12.47% 14.74% 15.19% 12.69% 12.81% 13.16% EBIT/salesNet profit margin 3.12% 4.55% 4.82% 4.96% 5.12% 4.05% 7.02% 3.26% 9.86% 7.83% 10.18% 8.65% Net income/salesReturn on assets 6.47% 9.10% 9.10% 9.24% 8.65% 7.16% 11.69% 4.91% 14.61% 10.68% 12.73% 10.44% (NI + int. exp.)/avg total assetsReturn on total equity 13.87% 20.53% 20.30% 20.25% 19.42% 14.93% 24.27% 7.08% 30.14% 23.41% 25.55% 19.51% Net income/average total equityFinancial leverage effect 35.59% 46.16% 58.39% 53.41% 60.16% 36.82% 60.70% 39.72% 107.00% 61.51% 56.55% 62.38% Net income/operating income
Growth '92-'93 '93-'94 '94-'95 '95-'96 '96-'97 '97-'98 '98-'99 '99-'00 '00-'01 '01-'02 '02-'03 CAGRSales 7.65% 10.08% 7.51% 6.29% 0.40% 10.37% 9.13% 10.05% 2.94% 2.04% 7.08% 7.32% (92-03)Book assets 5.93% 16.80% 13.08% 18.26% 6.41% 7.26% 35.01% (5.99%) 13.73% 6.99% 9.68% 8.12% (92-03)Net income bef unusual (gain) loss 5.82% 16.51% 10.57% 9.88% (20.68%) 91.53% (49.28%) 232.28% (17.35%) 34.19% (10.94%) 14.25% (92-03)Net income 56.86% 16.51% 10.57% 9.88% (20.68%) 91.53% (49.28%) 232.28% (18.23%) 32.64% (8.93%) 18.83% (92-03)Operating income 14.08% 6.74% 39.21% (6.33%) (16.31%) 81.98% 29.06% 13.39% (14.02%) 3.01% 10.01% 12.35% (92-03)
(Cash + AR + cash taxes)/(rents + gross CAPEX)
Source of data: DataStream (Thomson Financial).

UVA-F-1484
-15-
Exhibit 4
THE BATTLE FOR VALUE, 2004: FEDEX CORP. VS. UNITED PARCEL SERVICE, INC.
Timeline of Competitive Developments
FedEx Corp. United Parcel Service, Inc.
• Offers 10:30 a.m. delivery 1982 • Establishes next-day air service • Acquires Gelco Express and launches
operations in Asia-Pacific 1984
• Establishes European hub in Brussels 1985 • Begins intercontinental air service between United States and Europe
• Introduces handheld barcode scanner to capture detailed package information
1986
• Offers warehouse services for IBM, National Semiconductor, Laura Ashley
1987
1988 • Establishes UPS’s first air fleet • Offers automated customs service
• Acquires Tiger International to expand its international presence
1989 • Expands international air service to 180 countries
• Wins Malcolm Baldrige National Quality Award
1990 • Introduces 10:30 a.m. guarantee for next-day air
1991 • Begins Saturday delivery • Offers electronic-signature tracking
• Offers two-day delivery 1992 • Expands delivery to over 200 countries 1993 • Provides supply-chain solutions
through UPS Logistics Group • Launches Web site for package tracking 1994 • Launches Web site for package
tracking • Acquires air routes serving China • Establishes Latin American division
1995 • Offers guaranteed 8 a.m. overnight delivery
• Creates new hub at Roissy–Charles de Gaulle Airport in France
1999 • Makes UPS stock available through a public offering
• Launches business-to-consumer home-delivery service
2000 • Acquires all-cargo air service in Latin America
• Carries U.S. Postal Service packages • Acquires American Freightways Corp.
2001 • Acquires Mail Boxes Etc. retail franchise
• Begins direct flights to China • Expands home delivery to cover 100%
of the U.S. population 2002 • Offers guaranteed next-day home
delivery • Acquires Kinko’s retail franchise • Establishes Chinese headquarters
2003 • Contracts with Yangtze River Express for package delivery within China
• Reduces domestic ground-delivery time

UVA-F-1484
-16-
Exhibit 5
THE BATTLE FOR VALUE, 2004: FEDEX CORP. VS. UNITED PARCEL SERVICE, INC. Summary of Announced List-Rate Increases
UPS 1998 1999 2000 2001 2002 2003 2004 AverageDate implemented 2/8/02 2/9/03 2/8/04 2/6/05 1/8/06 1/7/07 1/6/08
UPS ground 3.6% 2.5% 3.1% 3.1% 3.5% 3.9% 1.9% 3.1%U.S. domestic air 3.3% 2.5% 3.5% 3.7% 4.0% 3.2% 2.9% 3.3%U.S. export 0.0% 0.0% 2.9% 2.9% 3.9% 2.9% 2.9% 2.2%Residential premium 1 1.00$ 1.00$ 1.00$ 1.05$ 1.10$ 1.15$ 1.40$ Commercial premium 2 N/A N/A N/A N/A N/A N/A 1.00$
FedEx 1998 1999 2000 2001 2002 2003 2004 AverageDate implemented 2/16/02 2/9/03 2/2/04 2/2/05 1/8/06 1/7/07 1/6/08
FedEx ground 3.6% 2.5% 3.1% 3.1% 3.5% 3.9% 1.9% 3.1%U.S. domestic air 3.5% 2.8% 0.0% 4.9% 3.5% 3.5% 2.5% 3.0%U.S. export 0.0% 0.0% 0.0% 2.9% 3.5% 3.5% 2.5% 1.8%Residential premium-express 2 N/A N/A N/A N/A 1.35$ 1.40$ 1.75$ Residential premium-ground 2 N/A N/A N/A 1.30$ 1.35$ 1.40$ 1.75$ Residential premium-home delivery 2 N/A N/A N/A 1.05$ 1.10$ 1.15$ 1.40$ Commercial premium-express 2 N/A N/A N/A N/A 1.50$ 1.75$ 1.00$ Commercial premium-ground 2 N/A N/A N/A N/A N/A N/A 1.00$ Sources of data: UPS, FedEx, and Morgan Stanley.
1 The residential premium was an additional charge for deliveries of express letters and packages to residential addresses, a price distinction UPS had applied to residential ground deliveries for the previous 10 years to offset the higher cost of providing service to them. 2The commercial premium was applied to products shipped to remote locations and/or select zip codes.
UVA-F-1484
-17-
Exhibit 6
THE BATTLE FOR VALUE, 2004: FEDEX CORP. VS. UNITED PARCEL SERVICE, INC.
Cumulative Capital Expenditures for FedEx and UPS
$0.0
$5.0
$10.0
$15.0
$20.0
$25.0
1992 1993 1994 1995 1996 1997 1998 1999 2000 2001 2002 2003
Bill
ions
(US$
)
FEDEX CORP UNITED PARCEL SERVICE
Sources of data: Company regulatory filings.

UVA-F-1484
-18-
Exhibit 7
THE BATTLE FOR VALUE, 2004: FEDEX CORP. VS. UNITED PARCEL SERVICE, INC.
Geographic Segment Information (values in millions of U.S. dollars)
FedEx Corp. 1992 1993 1994 1995 1996 1997 1998a 1999 2000 2001 2002 2003U.S. domestic:
Revenue: 5,195 5,668 5,195 6,839 7,466 8,322 9,665 12,910 13,805 14,858 15,968 17,277 Identifiable assets: 3,941 4,433 4,884 5,322 5,449 6,123 6,873 6,506 7,224 8,637 8,627 9,908
International:Revenue: 2,355 2,140 2,280 2,553 2,807 3,198 3,589 3,863 4,452 4,771 4,639 5,210 Identifiable assets: 1,522 1,360 1,109 1,112 1,250 1,503 1,503 1,001 7,224 1,254 1,520 1,536
Consolidated:Revenue: 7,550 7,808 7,474 9,392 10,274 11,520 13,255 16,773 18,257 19,629 20,607 22,487 Identifiable assets: 5,463 5,793 5,992 6,433 6,699 7,625 8,376 7,507 14,448 9,891 10,147 11,444
United Parcel Service Inc. 1992 1993 1994 1995 1996 1997 1998a 1999 2000 2001 2002 2003U.S. domestic:
Revenue: 14,722 15,823 17,298 18,243 20,108 20,238 22,252 24,093 26,325 26,163 26,284 26,968 Identifiable assets: 7,873 8,539 9,902 11,157 9,376 10,063 9,832 10,725 12,477 13,717 14,129 14,915
International:Revenue: 1,797 1,960 2,278 2,802 2,260 2,220 2,536 2,959 3,446 4,158 4,988 6,517 Identifiable assets: 1,164 1,214 1,280 1,488 1,323 1,372 1,810 2,111 2,061 3,050 2,874 3,567
Consolidated:Revenue: 16,519 17,782 19,576 21,045 22,368 22,458 24,788 27,052 29,771 30,321 31,272 33,485 Identifiable assets: 9,038 9,754 11,182 12,645 10,699 11,435 11,642 12,836 14,538 16,767 17,003 18,482
Sources of data: Company regulatory filings. a FASB Statement No. 131 (Disclosures about Segments of an Enterprise and Related Information ), established the standard to be used by enterprises to identify and report information about operating segments and for related disclosures about products and services, geographic areas, and major customers.

UVA-F-1484
-19-
Exhibit 8 THE BATTLE FOR VALUE, 2004: FEDEX CORP.
VS. UNITED PARCEL SERVICE, INC. Equity Prices and Returns for FedEx and UPS
United Parcel Service, Inc. 1992 1993 1994 1995 1996 1997 1998 1999 2000 2001 2002 2003Stock price1, December 31 $9.25 $10.38 $11.75 $13.13 $14.63 $15.38 $20.00 $69.00 $58.75 $54.50 $63.08 $74.55Dividends per share1 $0.25 $0.25 $0.28 $0.32 $0.34 $0.35 $0.22 $0.58 $0.68 $0.76 $0.76 $0.92EPS, basic incl. extra items1 $0.44 $0.70 $0.81 $0.92 $1.00 $0.82 $1.59 $0.79 $2.54 $2.13 $2.84 $2.57
P/E multiple 21.26 14.82 14.42 14.34 14.55 18.64 12.58 87.34 23.13 25.59 22.21 29.01Capital appreciation 12.16% 13.25% 11.70% 11.43% 5.13% 30.08% 245.00% (14.86%) (7.23%) 15.74% 18.18%Cumul. compound annual return2 12.16% 27.03% 41.89% 58.11% 66.22% 116.22% 645.95% 535.14% 489.19% 581.95% 705.95%
FedEx Corp. 1992 1993 1994 1995 1996 1997 1998 1999 2000 2001 2002 2003Stock price, December 31 $10.19 $12.25 $19.13 $14.97 $19.16 $26.19 $32.06 $54.81 $35.50 $40.00 $53.95 $63.98Dividends per share $0.00 $0.00 $0.00 $0.00 $0.00 $0.00 $0.00 $0.00 $0.00 $0.00 $0.00 $0.20EPS, basic incl. extra items ($0.53) $0.25 $0.91 $1.32 $1.35 $1.56 $1.72 $2.13 $2.36 $2.02 $2.38 $2.79
P/E multiple nmf 50.00 20.96 11.36 14.22 16.79 18.70 25.73 15.04 19.80 22.67 22.93 Capital appreciation 20.25% 56.12% (21.73%) 27.97% 36.70% 22.43% 70.96% (35.23%) 12.68% 34.88% 18.59%Cumul. compound annual return2 20.25% 87.73% 46.93% 88.04% 157.06% 214.72% 438.04% 248.47% 292.64% 429.57% 528.02%
Standard & Poor's 500 Index 1992 1993 1994 1995 1996 1997 1998 1999 2000 2001 2002 2003Index level 435.71 466.45 459.27 615.93 740.74 970.43 1,229.23 1,469.25 1,320.28 1,148.08 879.82 1,111.92
Annual return 7.06% (1.54%) 34.11% 20.26% 31.01% 26.67% 19.53% (10.14%) (13.04%) (23.37%) 26.38%Cumul. compound annual return2 7.06% 5.41% 41.36% 70.01% 122.72% 182.12% 237.21% 203.02% 163.50% 101.93% 155.20%
Cumul. Market-Adjusted Returns 1993 1994 1995 1996 1997 1998 1999 2000 2001 2002 2003UPS 5.11% 21.62% 0.53% (11.90%) (56.51%) (65.90%) 408.74% 332.12% 325.69% 480.02% 550.75%FedEx 13.19% 82.32% 5.57% 18.03% 34.33% 32.60% 200.83% 45.45% 129.14% 327.64% 372.83%
Source of data: Standard & Poor’s Research Insight, annual reports. 1 These data have been adjusted for the two-for-one stock split and initial public offering completed by UPS in November 1999. Prior to 1999, UPS shares were not publicly traded and the company acted as a market-maker for its own stock. 2 Compound annual return calculation: (Current year price − Beginning year price)/Beginning year price.

UVA-F-1484
-20-
Exhibit 9
THE BATTLE FOR VALUE, 2004: FEDEX CORP. VS. UNITED PARCEL SERVICE, INC.
Economic Profit Analysis for FedEx
FedEx Corp. 1992 1993 1994 1995 1996 1997 1998 1999 2000 2001 2002 2003
Return on Net Assets (RONA)Net operating profit after tax ($mm) $187 $176 $363 $405 $419 $499 $727 $726 $866 $750 $881 $1,418Beginning capital ($mm) $4,078 $4,344 $4,456 $4,655 $5,081 $5,663 $6,882 $7,863 $8,636 $10,090 $10,870 $12,050RONA (NOPAT/beginning capital) 4.59% 4.05% 8.16% 8.70% 8.25% 8.82% 10.56% 9.23% 10.03% 7.43% 8.10% 11.77%
Weighted-Average Cost of Capital (WACC)Long-term debt ($mm) $1,798 $1,882 $1,632 $1,325 $1,325 $1,398 $1,385 $1,360 $1,776 $1,900 $1,800 $1,709Shares outstanding (mm) 216 219 224 225 228 230 295 298 284 297 298 299Share price ($) $10 $12 $19 $15 $19 $26 $32 $55 $36 $40 $54 $64Market value of equity ($mm) $2,205 $2,682 $4,274 $3,363 $4,359 $6,018 $9,453 $16,333 $10,098 $11,893 $16,087 $19,104Tax rate (%) 23% 46% 46% 43% 43% 43% 45% 41% 39% 37% 38% 38%Long-term U.S. gov't. bonds (%) 7.97% 6.80% 7.53% 7.01% 7.07% 6.89% 5.94% 5.79% 6.19% 5.65% 5.55% 4.76%Senior Baa-rated debt (%) 9.20% 8.11% 8.71% 8.27% 8.46% 8.16% 7.33% 7.69% 8.87% 7.94% 7.96% 6.58%Risk premium (%) 5.6% 5.6% 5.6% 5.6% 5.6% 5.6% 5.6% 5.6% 5.6% 5.6% 5.6% 5.6%Beta 1.10 1.15 1.20 1.20 1.40 1.35 1.30 1.15 1.20 1.20 1.20 1.10Cost of equity1 (%) 14.13% 13.24% 14.25% 13.73% 14.91% 14.45% 13.22% 12.23% 12.91% 12.37% 12.27% 10.92%WACC 10.99% 9.72% 11.61% 11.18% 12.56% 12.61% 12.05% 11.64% 11.79% 11.35% 11.53% 10.36%
Economic Value Added (EVA)RONA (NOPAT/beginning capital) 4.59% 4.05% 8.16% 8.70% 8.25% 8.82% 10.56% 9.23% 10.03% 7.43% 8.10% 11.77%WACC 10.99% 9.72% 11.61% 11.18% 12.56% 12.61% 12.05% 11.64% 11.79% 11.35% 11.53% 10.36%Spread (6.39%) (5.67%) (3.46%) (2.48%) (4.30%) (3.79%) (1.48%) (2.41%) (1.75%) (3.92%) (3.43%) 1.41%x beginning capital ($mm) $4,078 $4,344 $4,456 $4,655 $5,081 $5,663 $6,882 $7,863 $8,636 $10,090 $10,870 $12,050EVA (annual) ($261) ($246) ($154) ($115) ($219) ($215) ($102) ($190) ($151) ($396) ($373) $170EVA (cumulative) ($261) ($507) ($661) ($777) ($995) ($1,210) ($1,312) ($1,502) ($1,653) ($2,049) ($2,422) ($2,252)
Market Value Added (MVA)Market value of equity ($mm) $2,205 $2,682 $4,274 $3,363 $4,359 $6,018 $9,453 $16,333 $10,098 $11,893 $16,087 $19,104Long-term debt ($mm) 1,798 1,882 1,632 1,325 1,325 1,398 1,385 1,360 1,776 1,900 1,800 1,709Capital (market value) ($mm) 4,002 4,565 5,907 4,687 5,684 7,416 10,838 17,693 11,874 13,793 17,887 20,813
Book value of equity ($mm) 1,580 1,671 1,925 2,246 2,576 2,963 3,961 4,664 4,785 5,900 6,545 7,288 Long-term debt ($mm) 1,798 1,882 1,632 1,325 1,325 1,398 1,385 1,360 1,776 1,900 1,800 1,709Capital (book value) ($mm) 3,378 3,554 3,557 3,570 3,901 4,360 5,346 6,023 6,561 7,801 8,345 8,997 MVA (market value - book value) $625 $1,011 $2,350 $1,117 $1,783 $3,056 $5,492 $11,670 $5,313 $5,993 $9,542 $11,816
Sources of data: Value Line Investment Survey, Standard & Poor’s Research Insight, Bloomberg LP, Datastream. 1 The cost of equity was derived using the capital asset pricing model (CAPM).

UVA-F-1484
-21-
Exhibit 10 THE BATTLE FOR VALUE, 2004: FEDEX CORP.
VS. UNITED PARCEL SERVICE, INC. Economic Profit Analysis for UPS
United Parcel Service, Inc. 1992 1993 1994 1995 1996 1997 1998 1999 2000 2001 2002 2003
Return on Net Assets (RONA)Net operating profit after tax ($mm) $914 $888 $944 $1,448 $1,545 $1,379 $1,909 $3,215 $2,955 $2,846 $2,589 $3,309Beginning capital ($mm) $6,932 $7,195 $8,280 $9,679 $11,796 $12,514 $13,350 $18,845 $17,161 $20,007 $20,802 $23,391RONA (NOPAT/beginning capital) 13.19% 12.34% 11.40% 14.96% 13.10% 11.02% 14.30% 17.06% 17.22% 14.23% 12.45% 14.15%
Weighted-Average Cost of Capital (WACC)Long-term debt ($mm) $862 $852 $1,127 $1,729 $2,573 $2,583 $2,191 $1,912 $2,981 $4,648 $3,495 $3,149Shares outstanding1 (mm) 1,190 1,160 1,160 1,140 1,140 1,124 1,095 1,211 1,135 1,121 1,123 1,129Share price1 ($) $9 $10 $12 $13 $15 $15 $20 $69 $59 $55 $63 $75
Market value of equity1 ($mm) $11,008 $12,035 $13,630 $14,963 $16,673 $17,282 $21,896 $83,538 $66,663 $61,068 $70,839 $84,167Tax rate (%) 40% 43% 40% 39% 40% 41% 40% 58% 39% 38% 35% 34%Long-term U.S. gov't. bonds (%) 7.97% 6.80% 7.53% 7.01% 7.07% 6.89% 5.94% 5.79% 6.19% 5.65% 5.55% 4.76%Senior Baa-rated debt (%) 8.34% 7.36% 8.08% 7.71% 7.78% 7.53% 6.71% 6.90% 7.99% 7.16% 6.66% 5.47%Risk premium (%) 5.6% 5.6% 5.6% 5.6% 5.6% 5.6% 5.6% 5.6% 5.6% 5.6% 5.6% 5.6%Beta2 1.24 1.13 1.16 1.18 1.18 1.14 1.08 1.15 1.11 1.09 0.95 0.80Cost of equity3 (%) 14.92% 13.15% 14.02% 13.64% 13.68% 13.27% 11.99% 12.23% 12.41% 11.75% 10.87% 9.24%WACC 14.20% 12.58% 13.32% 12.72% 12.47% 12.12% 11.26% 12.02% 12.09% 11.23% 10.56% 9.04%
Economic Value Added (EVA)RONA (NOPAT/beginning capital) 13.19% 12.34% 11.40% 14.96% 13.10% 11.02% 14.30% 17.06% 17.22% 14.23% 12.45% 14.15%WACC 14.20% 12.58% 13.32% 12.72% 12.47% 12.12% 11.26% 12.02% 12.09% 11.23% 10.56% 9.04%Spread (1.01%) (0.24%) (1.91%) 2.24% 0.63% (1.10%) 3.04% 5.04% 5.13% 2.99% 1.89% 5.11%x beginning capital ($mm) $6,932 $7,195 $8,280 $9,679 $11,796 $12,514 $13,350 $18,845 $17,161 $20,007 $20,802 $23,391EVA (annual) ($mm) ($70) ($17) ($158) $217 $74 ($138) $405 $949 $881 $599 $392 $1,195EVA (cumulative) ($mm) ($70) ($87) ($246) ($28) $45 ($92) $313 $1,262 $2,143 $2,741 $3,133 $4,328
Market Value Added (MVA)Market value of equity1 ($mm) $11,008 $12,035 $13,630 $14,963 $16,673 $17,282 $21,896 $83,538 $66,663 $61,068 $70,839 $84,167Long-term Debt ($mm) 862 852 1,127 1,729 2,573 2,583 2,191 1,912 2,981 4,648 3,495 3,149Capital (market value) ($mm) 11,870 12,887 14,757 16,692 19,246 19,865 24,087 85,450 69,644 65,716 74,334 87,316
Book value of equity ($mm) 3,720 3,945 4,647 5,151 5,901 6,087 7,173 12,474 9,735 10,248 12,455 14,852 Long-term debt ($mm) 862 852 1,127 1,729 2,573 2,583 2,191 1,912 2,981 4,648 3,495 3,149Capital (book value) ($mm) 4,583 4,797 5,775 6,880 8,474 8,670 9,364 14,386 12,716 14,896 15,950 18,001 MVA (market value - book value) $7,287 $8,090 $8,983 $9,812 $10,772 $11,195 $14,723 $71,064 $56,928 $50,820 $58,384 $69,315
Sources of data: Value Line Investment Survey, Standard & Poor’s Research Insight, Bloomberg LP, DataStream.
1 These data have been adjusted for the two-for-one stock split and initial public offering completed by UPS in November 1999. Prior to 1999, UPS shares were not publicly traded and the company acted as a market-maker for its own stock. 2 For the period 1992–2001, this figure reflects the average betas for peer firms. 3 The cost of equity was derived using the capital asset pricing model (CAPM).

UVA-F-1484
-22-
Exhibit 11
THE BATTLE FOR VALUE, 2004: FEDEX CORP. VS. UNITED PARCEL SERVICE, INC.
Equity Analysts’ Outlook for FedEx and UPS
FedEx Corporation
Analyst
Comments
Morgan Stanley’s J.J. Valentine, April 6, 2004
It was refreshing to hear FedEx’s management highlight some of the risks in China as we sense these issues are too often overlooked by the bulls. Some of these issues include:
• lack of legal framework • different interpretations of laws by regional and local governments • nonperforming loans that put pressure on China’s banking sector • liability by government for retirement program of state-owned enterprises • widening gap between the urban and the rural standard of living • government that often dictates commercial relationships
One issue that’s not as much a risk as it is a challenge is finding skilled, educated labor. This was a recurring theme that we heard during our visit to Asia, namely that China has a large unskilled workforce to produce cheap products, but it is becoming increasingly difficult to find skilled labor for the service industry, such as parcel delivery or logistics.
Value Line Investment Survey’s W.R. Perkowitz Jr., Dec. 12, 2003
The international business should drive long-term growth. Unlike the domestic express business, which has reached maturity, the international market remains in the growth stage. Indeed, growth rates in this sector mirror the rate of domestic expansion in the late 1980s. Furthermore, demand for this service should rise going forward, as a greater amount of manufacturing capacity is outsourced to Asia. Finally, since a large portion of FedEx’s cost structure is fixed, and it has ample capacity to serve additional business, any increases in volume should flow directly to the bottom line.
United Parcel Service Inc.
Analyst
Comments
Value Line Investment Survey’s D. Y. Fung, Dec. 12, 2003
United Parcel Service’s third-quarter 2003 results were better than we expected…. This gain was driven by record-breaking results in the international and nonpackage segments. Indeed, both units experienced advances in volume and margins, which led to bottom-line increases of 171% and 61% respectively. Importantly, growth of these two businesses has resulted in greater earnings diversity at UPS. This has helped to protect investors from the cyclical downturn in the U.S. economy in the past two years. Going forward, we believe international and nonpackage will continue along their positive growth trajectory, while generating a higher portion of the company’s net earnings.