Embed Size (px)
Citation preview
Electronic copy available at: http://ssrn.com/abstract=2061393
The Adoption of Proportional Representation ∗
Lucas Leemann† and Isabela Mares‡
Abstract
The debate between economic and political explanations of the adoption of proportional rep-
resentation (PR) has occupied an important place in recent years. The existing tests of these
competing explanations have generated inconclusive results. We re-examine this debate and
argue that the causal mechanisms affecting politician’s decisions to reform the electoral system
operate at different levels of analysis. Reformulating Rokkan’s hypotheses, we show that both
partisan dissatisfaction with the translation of seats to votes and strong electoral competition
at the level of the district affect the decisions of politicians to support changes in electoral
institutions. In the empirical part, we evaluate the relative importance of (a) district level
electoral competition and vulnerability to the rise of social democratic candidates (b) partisan
calculations arising from disproportionalities in the allocation of votes to seats and (c) economic
conditions at the district level, more specifically variation in skill profiles and ‘co-specific in-
vestments’ in explaining legislators’ support for the adoption of proportional representation.
Article: p. 2-27References: p. 28-30Appendix: p. 31-47
∗ First draft: 3/20/2012; this version: 3/6/2013. We would like to thank Kate Baldwin, Pablo Beramendi,Matthew Carnes, Holger Döring, Miriam Golden, Shigeo Hirano, John Huber, Kimuli Kasara, Yotam Margalit, KevinMazur, Pierce O’Reilly, Susan Stokes, Pavithra Suryanarayan, Didac Queralt, Fabio Wasserfallen, Steven Wilkinsonand seminar participants at Princeton University, Lund University, and Sciences Po Paris for helpful comments andideas. Isabela Mares gratefully acknowledges financial support from the Center for the Study of Democratic Politics,Princeton University during writing this article.
† Department of Political Science, Columbia University; International Affairs Building; 420 W 118th Street; NewYork City; email: [email protected]
‡ Department of Political Science, Columbia University; International Affairs Building; 420 W 118th Street; NewYork City; email: [email protected]
1
Electronic copy available at: http://ssrn.com/abstract=2061393
1 The Adoption of Proportional Representation: One Phenomenon and a
Plethora of Explanations
The study of the process of reform of electoral institutions during the first decades of the twentieth
century and the adoption of proportional representation by some countries has been at the center
of comparative research in recent years (Boix, 1999; Benoit, 2004; Colomer, 2005; Blais, Dobrzyn-
ska and Indridason, 2005; Cusack, Iversen and Soskice, 2007; Calvo, 2009; Kreuzer, 2010; Cusack,
Iversen and Soskice, 2010; Renwick, 2010). This renewed interest in the origin of these political
choices has been partly motivated by a related literature examining the importance of proportional
representation in affecting a range of political outcomes, including the level of government expendi-
tures, the types of social spending programs, levels of inequality and so on (Lijphart, 1990; Huber
et al., 1993; Alesina et al. 2001; Person and Tabellini, 2004, 2005). While these studies have ad-
vanced a wide range of competing hypotheses about the economic and political determinants of
these electoral reforms, the empirical tests formulated to adjudicate among these competing expla-
nations remain inadequate. This empirical deficit arises because the core theoretical concepts of the
literature have been either measured at a level of aggregation that is, we believe, uninformative or
not measured at all.
Like any change in electoral rules, the adoption of proportional representation poses an immedi-
ate puzzle: why do politicians engage in risk-taking behavior and decide to replace the institutional
rules on the basis of which they have been elected? Existing explanations for the reform of elec-
toral institutions and the adoption of proportional representation cluster in two broad explanatory
families, stressing either economic transformations or changes in the broader political environment
as the source of political anxiety among right wing politicians. Let us consider the larger political
changes first.
Both hypotheses - stressing either the rise of Social Democracy or disproportionality in the al-
location of votes to seats - as determinants for demand for changes in electoral institutions can be
traced back to the work of Braunias (Braunias 1932, see also Rokkan, 1970: 157-58). Contempo-
rary studies seeking to explain the adoption of proportional representation have tested one of the
two Rokkanian hypotheses. Boix (1999) has provided a cross-national test of the first Rokkanian
hypothesis. In recent years, Calvo (2009) has revived this second Rokkanian explanation and has
provided simulations informed by comparative cases to illustrate this logic.
2
In Rokkan’s original study, the two political hypotheses acted as substitutes. Rokkan conjectured
that in some countries - such as Germany, Norway or Sweden - the socialist mobilization played a
significant role in accounting for the adoption of proportional representation, while in other coun-
tries - such as Belgium, Denmark or Switzerland - considerations about the disproportionality of the
translation of seats to votes were the primary factor in accounting for the motivation of politicians
to adopt changes in electoral institutions (Rokkan, 1970: 157). In this paper we argue, however,
that the two political hypotheses are complements, rather than substitutes. Both explanations can
operate within the same case, but capture constraints on the activity of legislators that operate
at different levels. The first political explanation locates the salient constraint at the level of the
electoral district, in district-specific electoral vulnerabilities encountered by candidates on the po-
litical right that face social democratic challengers. By contrast, the second Rokkanian explanation
locates the salient constraint at the level of the party. An important task for the analysis is to
identify the relative importance of district specific vulnerabilities and partisan variables in affecting
the preferences of legislators for changes in the design of electoral institutions.
The alternative, economic perspective has been articulated by Cusack, Iversen and Soskice
(2007).1 According to this approach, “the choice of electoral systems is endogenous to the struc-
ture of economic interests” (Cusack et al. 2007: 388). The key structural economic conditions that
are hypothesized to generate differences in political preferences and variation in political outcomes
(adoption versus non-adoption of proportional representation) are the presence of ‘co-specific as-
sets’, in other words, investments in human capital that are jointly made by employers and workers
(Cusack et al. 2007). Cusack et al. hypothesize that in economies characterized by ‘consensual la-
bor relations’ and high levels of ‘co-specific’ assets, economic actors consider majoritarian electoral
rules as potentially detrimental to their long-term economic interests. First-past-the-post electoral
systems allow groups with a narrow geographic base to capture political power and enact legislation
that could potentially harm actors that had made long-term economic investments. In the presence
of significant investments in skills, Cusack et al. predict that the most significant interest groups
and the political parties to which they are tied will demand the adoption of proportional represen-
tation. By contrast, majoritarian institutions persist in economies with lower levels of co-specific
assets. In contrast to the first family of explanations, economic hypotheses about the adoption of1See Rogowski (1987) for an economically motivated alternative explanation of PR adoption. In this explanation
it is not the skill level but the degree to which a country is involved in international trade.
3
proportional representation derive their political predictions about the demand for changes in elec-
toral institutions from the distribution of economic endowments and less from partisan or electoral
considerations.
All explanations, political or economic in nature, are framed at a theoretical level that is quite
abstract. Ultimately, they seek to explain choices made by individual legislators. As a consequence,
many of these persistent disagreements cannot be resolved with the existing cross-national data.
Additional leverage can be gained, however, by shifting to a lower level of empirical aggregation,
the individual politician. This move to the individual level is desirable for a number of reasons.
First, the dominant empirical strategy pursued in contemporary research which is premised
on quantitative analysis of variation among a small number of countries is severely constrained
by the small number of observations. The number of observations in cross-national studies is
relatively low, varying from 24 in the original Boix paper of 1999 to 12 in some of the specifications
presented in Cusack et al. (2007). This small number of cases, coupled with a high multicollinearity
among competing variables has limited our ability to assess the relative importance of competing
explanations. This constraint might also explain why so far scholars have been unable to test all
three explanations of the adoption of proportional representation, but have tested only one or two
theories at a time. Second, an analysis that is situated at the individual level is also preferable
because some of the central predictions of the first political hypothesis – stressing the importance
of electoral vulnerabilities – are located at the level of the electoral district. Existing studies that
have relied on cross-national data have measured many of the relevant variables capturing political
competition at a level of analysis that is too aggregated and, thus, uninformative (Cox, 1997).
The difficulty and real challenge for an empirical evaluation of competing explanations of PR
adoption using roll call data is the development of measures of the core explanatory variables of
the economic explanation, the level of ‘co-specific assets’. We take up this challenge in this paper
and develop precise estimates of the ratio of skilled workers at the level of the electoral district.
This allows us bring competing explanations about the adoption of proportional representation to
a common empirical unit of analysis and assess, for the first time, the relative effect of structural
economic conditions at the level of the district, electoral competition and partisanship on individual
level support for the adoption of proportional representation.
4
Our paper examines a decisive vote taken by the German Reichstag as a result of which Ger-
many adopted proportional representation.2 The German case occupies a central position in all
explanations that have been advanced to explain the adoption of proportional representation. Con-
sider first its importance for political explanations of changes in electoral institutions. The existing
literature treats Germany as the paradigmatic case that illustrates the importance of the Social
Democratic threat as the catalyzing factor leading to a change in the position of right wing parties
over the desirability of proportional representation. This interpretation of the German case goes
back to the classic studies of the adoption of proportional representation, such as Braunias (1932)
or Rokkan (1970). As Rokkan argued, in countries where “hostility and distrust” among existing
parties on the right was too strong, the latter found it impossible to make common cause against
the socialist threat. As such, they preferred proportional representation, a system that guaranteed
them the ability to compete independently (Rokkan 1970: 158). This account, however, has dif-
ficulties in explaining the diverging positions taken by different parties on the political right over
the question of electoral reform change. While the catholic Zentrum and the German Conservative
Party opposed the adoption of proportional representation, both the National Liberals and the Free
Liberals supported the adoption of changes in electoral institutions. Thus, it appears that both
political explanations seem to capture important determinants of the motivations of politicians to
support changes in electoral institutions, but so far no study has attempted to disentangle the
relative explanatory power of these two explanations.
Germany is also the case that motivates the economic explanation of the adoption of pro-
portional representation. The extensive network of vocational training (Thelen, 2004) that was
well-established during the 19th century led to the development of a workforce characterized by
high ratios of skilled workers and an unusually high level of vocational skills (Kaiserliches Statistis-
ches Amt 1899: 73; Bade, 1980). The central hypothesis advanced by Cusack, Iversen and Soskice
suggests that the regional variation in the distribution of human capital has important political
consequences both for the adoption of proportional representation and for democratization more
broadly. Germany occupies, thus, an asymmetric position for economic and political explanations
and represents a ‘hard’ case for Rokkanian explanations (George and Bennett, 2005). Due to this
asymmetry, empirical results that disconfirm importance of human capital as a predictor of the2This represents the only recorded vote on the issue of proportional representation taken by the German Reichstag
during the period between 1870 and 1918.
5
adoption of proportional representation in the German case can weaken our confidence in the com-
parative explanatory power of the economic approach to the origin of proportional representation.
The following section explores the tensions among the two political hypotheses concerning the
determinants of support of changes in electoral institutions and formulates both the hypotheses and
the empirical strategy used to assess the relative importance of partisan considerations and district
level electoral competition on legislator support for changes in electoral institutions. We turn next
to the economic explanation, discuss its empirical predictions and then discuss our measures of
human capital distributions across electoral districts.
2 Economic Conditions, Political Competition and the Change of Electoral
Institutions
Stein Rokkan’s shadow looms over much of the contemporary research seeking to explain the adop-
tion of proportional representation in Europe during the first decades of the twentieth century
(Rokkan, 1970). Two of the dominant hypotheses concerning the adoption of proportional represen-
tation can be traced back to his work. The first of these argues that incumbent elites support the
adoption of proportional representation to avoid a complete electoral disaster in the face of social
democratic mobilization (Rokkan, 1970). Boix takes up this hypothesis and argues that if parties
on the political right are equally balanced in their electoral strength, but unable to coordinate on
a common candidate (either at the level of the constituency or nationally), then they are likely
to support the adoption of proportional representation (see Blais et al., 2005). By contrast, the
incentives to adopt changes in electoral institutions are weaker if one party dominates the elec-
toral arena (Boix, 1999, p.612).
Rokkan’s second hypothesis – taken up in current research by Ernesto Calvo (2009) – attempts
to specify conditions under which incumbent parties on the right favored changes in electoral insti-
tutions even in the absence of social democratic threats. This hypothesis suggests that parties with
a geographical dispersed distribution of votes also faced incentives to demand changes in electoral
institutions, as multiparty competition increased the seat-vote disproportionality of the electoral
results. According to this logic, the adoption of proportional representation is regarded as a mech-
anism to reduce the “severity of the partisan bias and of electoral regimes to districting problems”
(Calvo, 2009, p.256).
6
The two Rokkanian hypotheses differ in the relative importance placed on the social democratic
threat. Both hypotheses stress, however, ‘electoral coordination’ (or failure thereof) of incumbent
parties as a critical variable influencing the decision of incumbents to support or oppose changes in
electoral rules and the adoption of proportional representation. Critics have noted that the notion
of electoral coordination is theoretically unclear and poorly operationalized empirically. Cusack et
al. note two limitations of the test of electoral coordination presented in Boix (Cusack, Iversen and
Soskice, 2007, p.375). The first is the failure to take account of the opportunities for coordination
created in electoral systems that used runoffs. Runoffs allowed parties on the political right that
competed in the first round to form electoral alliances in the second round to oppose a social
democratic candidate. Cusack et al. note some limitations of the empirical test of the Rokkanian
notion of electoral coordination employed by Boix and argue that the variable used by Boix, the
“effective number of parties” fails to distinguish between cases in which one party on the right is
dominant from cases where parties of the right are equally sized (Cusack, Iversen and Soskice, 2007,
p.375). A similar critique is presented by Blais, Dobrzynska and Indridason (2005) who argue that
the incentives of all parties to switch to proportional representation are stronger in countries which
require a majority rather then just plurality of the votes to take a district.
While raising these criticisms, Cusack et al. do not propose a superior empirical solution. It is
impossible to measure district level electoral competition with cross-national data. Using aggregate
data we cannot learn whether or not there was coordination on the right. Clearly, runoffs could
alleviate potential coordination problems among parties on the right. However, while runoffs induce
some electoral coordination during the second round, they do not necessarily produce electoral
coordination among right wing parties (Bertram, 1964; Fairnbairn, 1990; Reibel, 2007). Parties on
the political right have a range of possible strategies during runoffs. These include the formation
of pre-electoral coalitions which are restricted to right wing parties, political support for the left
wing candidate over the right wing opponent (in districts where a candidate on the right encounters
a candidate on the left during runoffs) or recommendation to their voters to abstain during the
second round (and their de facto refusal to endorse any of the remaining candidates). We provide a
number of examples in the appendix to illustrate how abstention recommendations contributed to
the Social Democratic victories (see section A1).
Studies emphasizing the economic foundations of proportional representation do not derive the
demand for the adoption of proportional representation from partisan expectations about their
7
electoral survival, but from the expectations of leading economic groups (employers and labor) about
the different regulations that might emerge under different electoral rules. Thus, what distinguishes
the trajectory of PR from non-PR adopters is the level and depth of investment in skills made
during the early stages of industrialization. As Cusack et al. formulate their hypothesis linking
specific assets and proportional representation:“Two broad alternative patterns of labor and skill regulation in industry can be found at thiscritical period in the early twentieth century. They relate to the question of the control ofskilled formation and the content of skilled jobs. The first possible alternative, which we findsubsequently in each of the PR adopters, was some form of cooperative agreement between busi-ness and unions: in exchange for collective bargaining rights and monitoring of skill formation,business would have managerial control of the shop floor and determine training levels. Thisalternative had major implications for the politics of regulation because skills in this system areco-specific assets. [...] Unions and employers become vulnerable to opportunism and holdup andthey consequently need credible long-run guarantees which include an appropriate frameworkagreement at the political level to underwrite the relevant labor market and social security in-stitutions and rules. The political system has to be such that the agreement cannot be changedby a change of government without the consent of other groups. This requires not just a systemof proportional representations to enable the different groups to be represented through parties,but also a political system that allows for consensus decision making in the regulatory areasthat concern them” (2007: 328)
We interpret the argument as generating two testable empirical implications. The first is that
in countries or regions where investments in specific skills are higher, economic actors seek to
establish proportional systems of representation either independently or through their partisan
representatives. By contrast, the demand for proportional levels of representation is lower in regions
with lower levels of co-specific assets. Secondly, regions characterized by high levels of investment
in skills also experience more consensual relations in the industrial sphere and among parties.
Yet, despite the straightforward nature of this empirical implication, Cusack et al. have not yet
provided a direct empirical test of their theory. In their cross-national analysis, the variable used
to test the importance of ‘co-specific assets’ is a composite variable that includes the strength of
employer associations and the existence of rural cooperatives and pre-existing guilds. The other
indicator, the strength of employer associations is a problematic empirical measure. As Kuo (2010)
has illustrated, most employer associations that existed in Europe prior to World War I (and thus
prior to the adoption of proportional representation) were established with the explicit goal to
repress labor movements. The existence of a coordinated employer association does not proxy for
harmonious labor relations and co-specific investments, the critical variable of this theory.
The most recent APSR paper which restates the asset-specific explanation and offers limited
qualitative evidence discussing electoral reforms in Imperial Germany does not provide any direct
8
measures of human capital development across German regions. Saxony, Württemberg and Baden
are used interchangeably as being, presumably, cases that share similarly high endowments of human
capital (which is the hypothesized factor leading to the adoption of proportional representation).
Cusack et al. provide no empirical evidence to support these conjectures. At the turn of the century,
Baden and Württemberg are relatively underdeveloped regions of the German Empire, displaying
levels of agricultural employment that are higher than the respective levels in the Reich (Hohls and
Kaelble, 1989, p.167- 187).3 Our estimates of human capital development – which computes ratios
of skilled workers – present roughly similar patterns. The national average is 36.2% (sd: 9.0) and
while Saxony reaches 52.7% (sd: 3.01) we find that Baden has 36.8% (sd: 2.8) and Württemberg
is slightly below average with 35.8% (sd: 1.47). These measures do not support the argument that
all three regions (Saxony, Baden, and Württemberg) share high endowments in human capital (see
also Fremdling and Tilly, 1979). Thus, qualitative assessment of 19th century economic realities
(which are likely to be based on 20th century outcomes) turn out to be inaccurate. Given that the
core explanatory variable (distribution of ‘asset specific investments’) takes different values across
these regions, it cannot serve as the common explanation for subnational electoral reforms.
While the debate between economic and political explanations of the adoption of proportional
representation has occupied a visible place in prominent publications, it has not yet been resolved.
Quite the contrary. This inconclusiveness has several reasons. Existing explanations have been
brought to the data only imperfectly. Ambiguity exists as to what constitutes electoral coordination
and how it should be operationalized. Many of the existing tests of the first Rokkanian hypotheses
have only assessed the effects of variation in national level competitiveness on the probability of
transition to proportional representation. This remains both an imperfect test of the first Rokkanian
hypothesis which has to be tested using more disaggregated subnational and district level measures.
The empirical assessment of economic explanations is a necessary step in the evaluation of competing
explanations for the adoption of proportional representation. For this endeavour, the lack of a
measure of the core explanatory variable, the co-specific assets, is an outstanding difficulty.3At the time of the 1895 census, the share of the labor force employed in agriculture in Baden and Württemberg
stood at 44 and 45%, respectively. The average agricultural share for the entire Reich stood at 37%. By contrast,Saxony’s share of agricultural employment stood at 17%. These relative levels of economic development did notchange much until 1905-1907, the period when the last economic census prior to World War I was assessed. Theemployment shares in agriculture in Baden declined from 45 to 40% but remained relatively stable in Württembergat 45%. In both regions, levels of industrial development continued to be below that of the Empire (which stood at35% in 1905). By contrast, Saxony’s share of agricultural employment stood at 13% in 1905. The figures are basedon the aggregate results of both economic censuses presented in Hohls and Kaelble (1989: 167- 208).
9
3 A Theoretical Re-Formulation of the Rokkanian hypotheses
The two political hypotheses locate the prime determinant of legislator’s calculation about the
attractiveness of different electoral rules at different levels of analysis, the individual district versus
the party. The first hypothesis highlights electoral vulnerabilities at the level of the district. In this
hypothesis the general contestation of a race, the availability or absence of coalition partners, the
strength of the contender on the left and the potentially scarring experience of a runoff are likely
to affect the decision of a politician to support changes in electoral institutions. By contrast, the
second political hypothesis locates the important determinant at the level of the party and not the
district. Partisan preferences over the desirability of different electoral rules are influenced by the
attractiveness (or its absence) of the way in which the policy status quo allocates votes to seats.
In their calculation about the relative attractiveness of different electoral rules, politicians are
constrained both by district-specific factors and by the general considerations of their party. The
partisan and district level incentives can reinforce each other for support of particular electoral rules
but they can also come into tension. Consider the case of a politician representing a party from the
right that experiences an unfavorable distribution of votes to seats and, who has been elected by
a narrow margin in a runoff against a social democratic opponent. For this particular politician,
the constituency level incentives and the partisan incentives reinforce each other and one expects
this politician to support the adoption of proportional representation. Partisan and district-specific
electoral incentives may however come into tension.
By hypothesizing that the two political explanations about the origin of proportional represen-
tation highlight political incentives that are located at different levels of analysis, we challenge a
number of statements made by Rokkan. Instead of viewing the two political hypotheses as separate
roads to proportional representation undertaken by different countries, we argue that both logics
can be at work within the same country. The two hypotheses specify different constraints on the
behaviour of legislators. To formulate this point more starkly, there are no two roads to proportional
representations, but two distinct sets of political constraints on the behaviour of politicians, which
operate at the level of the district and party respectively. A legislator-based account of the origin
of proportional representation allows us to disentangle the relative effects of these constraints.
10
3.1 District-Level Vulnerabilities versus Partisan Constraints
To test the implications of the first Rokkanian hypothesis, we examine the consequences of district
specific factors on the probability of support of changes in electoral institutions. We hypothesize
that three variables linked to the contestability of a race are likely to affect the support of the
legislator for changes in electoral institutions. The first is whether the politician is elected in the
first round or a runoff. All things equal, we hypothesize that politicians elected in runoffs are more
vulnerable than politicians elected during the first round. Runoffs are themselves an indicator of
coordination difficulties for parties on the right. As such, we hypothesize that politicians on the right
elected during runoffs are more likely to support changes in electoral institutions than politicians
elected during the first round. A second district-specific factor that is likely to affect preferences
towards electoral institutions is the margin of victory. All things equal, politicians elected in races
with larger margins are more likely to support the policy status quo than politicians elected in
more contested races with narrower margins. A final prediction of the first Rokkanian hypothesis
is that the magnitude of the threat of the social democratic party (as measured by the vote share
of the Social Democratic candidate during the first round) is likely to increase support for changes
in electoral institutions.
We include three variables to test for these hypotheses linking electoral vulnerability in the
district and preferences for changes in electoral institutions. They include a variable that takes the
value 1 when the politician was elected during runoffs, a measure of the margin of victory during
the decisive electoral round and a measure of the vote share of the Social Democratic candidate.
In combination, these variables allow us to capture only the theoretical expectations laid out by
the first Rokkanian hypothesis. They capture district-specific electoral constraints. They remain
insufficient in capturing the full set of political constraints and considerations facing the politician.
To understand the latter, we need to consider partisan considerations about the effects of the
electoral formula on the electoral fate of the party. We turn to a discussion of these considerations
next.
3.2 Partisan Preferences about Changes of Electoral Rules
The second political hypothesis formulates its predictions at the level of the party rather than
district. In this hypothesis, the key variable that is likely to affect the preferences of parties about
11
the adoption of proportional representation is the disproportionality in the allocation of seat to
votes under the existing electoral rules. Parties that benefit from the current allocation of seats
to votes (by obtaining a higher seat than vote share) are likely to favor the policy status quo. By
contrast, parties that lose from the allocation of seats to votes are likely to favor changes in electoral
institutions and the adoption of proportional representation.
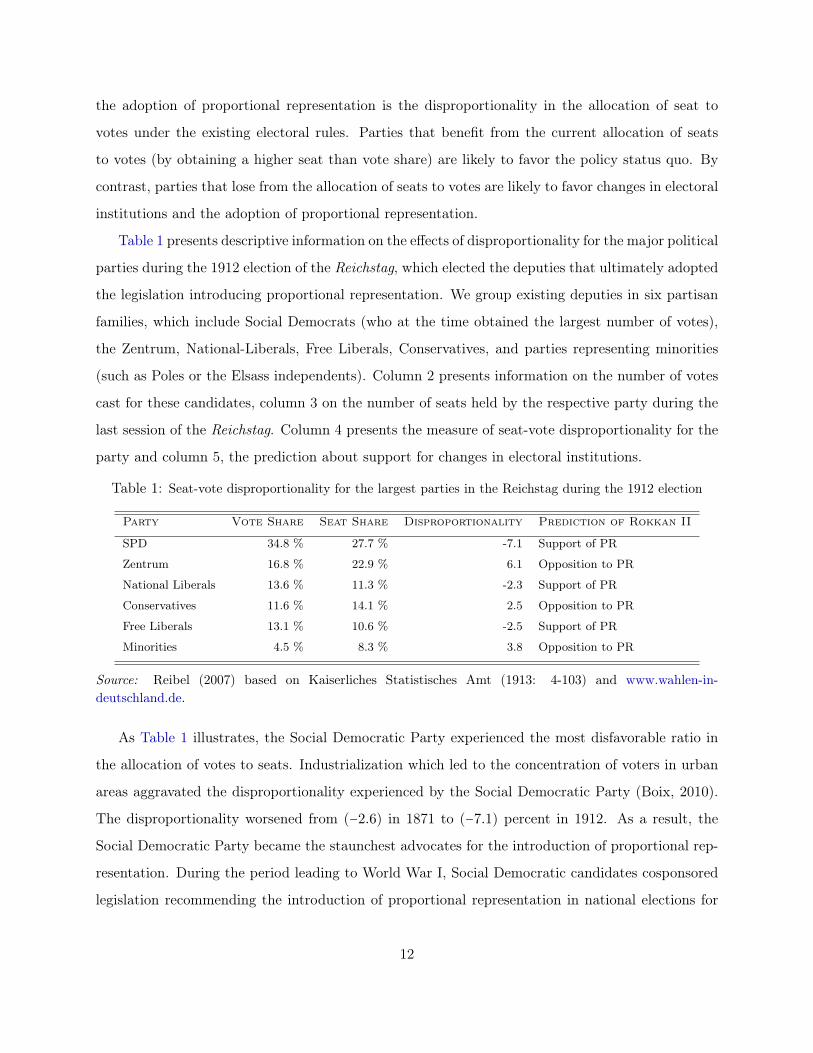
Table 1 presents descriptive information on the effects of disproportionality for the major political
parties during the 1912 election of the Reichstag, which elected the deputies that ultimately adopted
the legislation introducing proportional representation. We group existing deputies in six partisan
families, which include Social Democrats (who at the time obtained the largest number of votes),
the Zentrum, National-Liberals, Free Liberals, Conservatives, and parties representing minorities
(such as Poles or the Elsass independents). Column 2 presents information on the number of votes
cast for these candidates, column 3 on the number of seats held by the respective party during the
last session of the Reichstag. Column 4 presents the measure of seat-vote disproportionality for the
party and column 5, the prediction about support for changes in electoral institutions.
Table 1: Seat-vote disproportionality for the largest parties in the Reichstag during the 1912 election
Party Vote Share Seat Share Disproportionality Prediction of Rokkan II
SPD 34.8 % 27.7 % -7.1 Support of PR
Zentrum 16.8 % 22.9 % 6.1 Opposition to PR
National Liberals 13.6 % 11.3 % -2.3 Support of PR
Conservatives 11.6 % 14.1 % 2.5 Opposition to PR
Free Liberals 13.1 % 10.6 % -2.5 Support of PR
Minorities 4.5 % 8.3 % 3.8 Opposition to PR
Source: Reibel (2007) based on Kaiserliches Statistisches Amt (1913: 4-103) and www.wahlen-in-deutschland.de.
As Table 1 illustrates, the Social Democratic Party experienced the most disfavorable ratio in
the allocation of votes to seats. Industrialization which led to the concentration of voters in urban
areas aggravated the disproportionality experienced by the Social Democratic Party (Boix, 2010).
The disproportionality worsened from (−2.6) in 1871 to (−7.1) percent in 1912. As a result, the
Social Democratic Party became the staunchest advocates for the introduction of proportional rep-
resentation. During the period leading to World War I, Social Democratic candidates cosponsored
legislation recommending the introduction of proportional representation in national elections for
12
the Reichstag and actively advanced similar proposals during discussions of electoral reforms of the
subnational parliaments Schmädeke (1995). Several studies assume that Social Democratic parties
were supportive of the adoption of proportional representation. As recent studies have pointed
out, this assumption may be inaccurate and cannot adequately account for the observed empirical
variation in the preferences of Social Democratic parties across Europe on the question of electoral
reform (Ahmed, 2010; Penadés, 2008). We can, however, derive theoretically the preferences of
Social Democrats by taking seat-vote disproportionality into account.
Among the parties on the right, the two prominent losers in the allocation of votes to seats were
the Free Liberals and National Liberals. The disproportionality index during the 1912 elections
stood at (−2.5) for Free Liberals and at (−2.3) for National Liberals. In contrast to Social Democrats
that had been disfavored by the allocation of votes to seats during all elections of the period, for the
two parties on the right the disproportionality in the allocation of votes to seats was a more recent
phenomenon that came into place during the last elections of the Reichstag (Duverger, 1963: 375).
Party leaders from these two parties embraced the idea of proportional representation later than
the Social Democrats and the question about the advantage of this electoral reform remained the
subject of significant intra-party disagreement (Gagel, 1958, p.125-141). For Free Liberals, the push
for the adoption of proportional representation originated with party leaders from Southern German
states where the presence of catholic minorities in some districts could lead to the waste of votes won
by the Free Liberal candidates under the existing single member electoral system (Simon, 1969).
The two large political parties on the right that benefited from the allocation of seats to votes
were the Zentrum and the Conservatives. Party leaders from both parties understood the electoral
advantage of existing electoral institutions and rejected the introduction of proposals calling for
the adoption of proportional representation (on Zentrum: Penadés, 2011; on Conservatives: Kühne,
1994). This opposition to any reform of the electoral system remained one of the issues that brought
these two parties – which had been bitter enemies during the Kulturkampf – together and led to the
creation of the ‘black-blue’ electoral alliance during the 1912 election (Bertram, 1964; Reibel, 2007).
An internal report commissioned by the German Interior Ministry (Reichsamt des Innern) in
the immediate aftermath of the 1912 election noted the divergent rates of success of different parties
of the right in translating their votes into seats. The report observed that while the “Liberal Party
obtained over 3 million votes in 1912, it was able to obtain only 4 seats in the first round, while
13
the Zentrum obtained over 80 seats with only 2 million votes. The explanation for this fact is”,
the report noted, “that there are no areas where there are only Liberals; rather there are areas
where there are Liberals and either Conservatives, or Zentrum or Social Democrats” (Bundesarchiv
Berlin Lichterfeld R1501/192-193). Prominent liberal politicians also noted the worsening seat vote
disproportionality encountered by their party and began to advocate the adoption of proportional
representation (Brandenburg 1917: 30, Gagel 1958: 128).
The Social Democrats had militated for changes in electoral institutions beginning with the 1891
Erfurt congress. By contrast, Free Liberal and National Liberal politicians began to advocate the
adoption of proportional representation only much later (Gagel, 1958). This shift in the position
on the desirability of electoral reform advocated by these two parties on the right guaranteed the
formation of an encompassing political coalition supporting the adoption of proportional represen-
tation. The political factor that motivated this change in strategy among these two parties on the
right was the worsening of their seat-vote disproportionality.
Let us consider how considerations about the translation of votes to seats affected the policy
positions of a range of parties on the question of electoral reform. From the perspective of the Social
Democratic Party, calculations of their expected vote share under this alternative electoral rule (that
used as input the number of votes received during the 1907 election) revealed an expected gain of
76 seats (from 43 to 117 seats) (Andersen, 2000: 343; Fricke, 1961). Both National Liberal and
Free Liberal Parties that experienced losses in the translation of votes to seats under the existing
electoral rules also favored the adoption of proportional representation (Andersen 2000: 343, Gagel
1958: 143). By contrast, the two other parties on the right that gained from the allocation of the
votes to seats under single-member electoral rules – the conservatives and the Zentrum – opposed
changes in electoral rules. A recommendation of the Ministry of Interior summarizes the fear of
Conservatives about changes in electoral rules. The adoption of proportional representation, this
study showed, would reduce the seat share of conservative parties by 8 seats (as compared to the
1912 results) and “cannot be regarded as a cure against the existing inequalities in representation”.
The expected loss of seats for the Zentrum, as compared to its 1912 electoral results, stood at 32
seats (Bundesarchiv Berlin Lichterfeld R1501/343).
We have begun to explore the implication of the second Rokkanian logic for the preferences on
reform of electoral institutions. Parties losing from the allocation of votes to seats (Social Democrats,
14
National Liberals and Free Liberals) supported the introduction of proportional representation. By
contrast, winners of vote seat disproportionality (Conservatives and Zentrum) opposed it. How
constraining were these desiderata of party leaders on the decisions made by individual legislators
during the actual vote of electoral reforms? Our empirical analysis allows us to explore these
questions and examine whether individual legislators internalized these needs of their respective
parties and of the relative effect of district specific vulnerabilities in affecting their calculations. To
test how the disproportionality in the allocation of votes to seats affects the preferences of party
leaders, we include the measure of disproportionality (SEAT VOTE DISPR.) as additional control
in our analysis of the vote choice of legislators.
3.3 Asset Specific Investments and the adoption of proportional representation
Both Rokkanian explanations are political explanations. They locate the source of demand for
changes in electoral institutions in either electoral vulnerabilities at the district or in partisan
calculations. The causal chain presupposed by these hypotheses is relatively short: politicians, it is
hypothesized, respond either to their increased electoral vulnerability or to calculations about the
translation of votes into seats. By contrast, economic explanations locate the source of political
demand for electoral change in economic conditions at the district level. The causal chain linking
these economic factors the actions of legislators is long and tenuous. In this alternative explanation,
politicians favor the adoption of proportional representation not because it serves an immediate
political need but because they expect that proportional representation will produce more favorable
labor regulation that will protect the ‘asset specific investments’ made by employers and firms in
their districts (Cusack, Iversen and Soskice 2007 and 2010). Let us suspend possible questions about
the farsightedness of politicians and assume that this logic captures plausible political constraint on
the activity of legislators (e.g. Andrews and Jackman, 2005). The empirical question that we seek
to answer is whether structural conditions at the district level affect the political choices made by
legislators once we control for all the other relevant political factors (Rokkan 1 and Rokkan 2) that
presuppose a much shorter causal chain.
In section 2, we have noted that non-Rokkanian approaches have not yet tested the core ele-
ment of their explanation – which hypothesizes that support for proportional representation can be
predicted by high levels of ‘asset specific’ investment. We seek to remedy these shortcomings and
15
replace the imprecise characterizations of variation in ‘co-specific assets’ with actual measures of
human capital development across German electoral districts. While difficult and computationally
intensive, it is possible to compute measures of the distribution of human capital across German
regions prior to the adoption of proportional representation.
We use two distinct sources of the German occupational census to compute this measure. First,
we start with tables of the ratio between skilled and unskilled workers. As part of its 1895 census,
the German Statistical Agency has collected information on the ratio between skilled and unskilled
workers in 183 occupations, which includes 161 industrial occupations and 22 occupations in ser-
vices. The definition of skilled workers (“gelernte Arbeiter”) employed by the Statistical Agency
is straightforward (but somewhat laconic): “skilled workers (gelernte Arbeiter) are those workers
that require some training. By contrast, unskilled workers (ungelernte Arbeiter) – in other words
manual workers, handymen and other workers in services – which do not have existing training”
(Kaiserliches Statistisches Amt 1899: 73). The study noted that the number of skilled workers is
very high in Germany (nearly 50% of workers employed in industry). “The economic relations in
industry – which requires particular abilities and skills which can be learned or acquired through
persistent exercise are the decisive factor which explain these high ratios of skills” (Kaiserliches
Statistisches Amt 1893: 73). We present the disaggregated levels of skills for all 161 occupations in
the appendix (Table A8, p. 42) and provide further information on this measure in the appendix
(see section A2).
Our second input is Germany’s occupational census. In addition to the information on skill
profiles of occupation, the 1895 occupational census (Gewerbezählung) contains extremely disaggre-
gated information on the employment shares across these 180 occupations in 1003 German localities.
These two sources allow us to estimate the ratio of skilled to unskilled industrial workers across each
locality. In a final stage, we aggregate localities at the district level to obtain measures of the density
of human capital across the 397 electoral districts of Imperial Germany. Using the number of skilled
workers in each district as an input, we compute two measures of skill profiles that differ in their
respective denominator. The first is a measure of skills as a percentage workers employed in industry
(SKILL). The second is a ratio of skilled workers to all employed persons in the district (SKILL
LEVEL). Finally, we also use a measure of skills aggregated at a higher level which corresponds to
the 29 subnational political units (SKILL REGION). We present the results using the second and
third measure of skills in the appendix of the paper (Table 5, Table 6, Table 7, and Table 8).
16
4 Empirical Analysis: Explaining Individual-Level Support for the Adoption of
Proportional Representation
The dependent variable in our analysis is the support for a bill recommending the adoption of pro-
portional representation and “the creation of larger electoral districts” (Stenographische Berichte
des Deutschen Reichstages, 13. Legislaturperiode, Volume 323, p. 5962-5964). The bill was ap-
proved by a rather narrow political margin of 10% points, with 55% of deputies voting in favor,
45% deputies opposing it and 3 casting invalid ballots. The vote in the Reichstag represents the
endpoint of an intense (but relatively short) period of parliamentary negotiations of changes in
electoral institutions for elections to the second chamber of the national parliament. We conducted
an extensive search of all legislative bills recommending the introduction of proportional representa-
tion throughout the 13 legislative sessions of the Reichstag between 1870 and 1912, but only found
legislative initiatives recommending the adoption of proportional representation during the 13th
Reichstag that was elected in 1912.
4.1 Empirical Evidence for Motivations to Change Electoral Systems
We attempt to solve the puzzle presented by the existing literature on the origin of proportional
representation; competing explanations of this political choice differ widely in their postulated causal
mechanisms. Our test is decisive in adjudicating among these competing explanations for a number
of reasons.
First, it has the crucial advantage that it is carried out at the appropriate level of analysis,
the individual level. Since the decision to change an electoral system is made by a politician
representing a district we should be relying on district-specific measures; we can use the margin
of victory in a district instead of relying on a country-wide average to gauge the closeness of vote
outcomes. Secondly, it allows us to test for a range of additional factors –most notably the partisan
concerns about disproportionality – that have not yet been incorporated into a economic models
explaining electoral system change. Finally, our measures of the theoretical concepts invoked by
various explanations (such as asset specific investments) are, we believe, more precise than the
existing indicators of coordination used in cross-national research. The latter measures are both
quite distant from the core variables that are hypothesized to affect the outcomes (‘skills’) and also
susceptible to measurement error (Kreuzer, 2010).
17
We carry out a full test that includes the salient variables in each of the main hypotheses in
the literature, including the second Rokkanian hypothesis. We use predictors originating from all
three political explanations: district specific vulnerabilities and socialist threat (Rokkan I), vote-
seat disproportionalities (Rokkan II) and levels of skills acquired through the vocational training
system (Cusack, Iversen and Soskice, 2010). This is not only the first test that includes all the
variables but also the first time that these hypotheses are tested at the district level, which is the
correct level for an empirical test.
The models presented in Table 2 and Table 3 operationalize all three hypotheses. Our test of the
second Rokkanian hypothesis is the degree of disproportionality in the translation of votes to seats.
We use the dataset on electoral politics in Imperial Germany (ICPSR 1984) which we cross-check
with Reibel (2007) to determine the partisanship of the winning politician in each district.
The measure of disproportionality (SEAT VOTE DISPR) takes higher values if the share of seats
held by each party is higher than its share of votes. Thus, a positive number reflects a party that
gains from the existing electoral arrangement. Negative numbers indicate parties whose fortunes
might improve under proportional representation (see Table 1). We use three variables to test for
the effects of the district specific uncertainties postulated by the first Rokkanian hypothesis on the
decision of legislators to support proportional representation: a measure of the strength of the Social
Democratic party in a district (SOCIALVOTE), a measure of the decisive electoral round which
takes the value 1 if the politician is elected during the second round (SECOND), and a measure of
the closeness of the race among non-socialist parties in the first round (RIGHT MARGIN).
Three additional explanatory variables model differences in economic and social conditions across
districts. We use our skill measure (SKILL) presented in Section 3.3 to account for the consequences
of different ’investments in co-specific assets’, the critical explanatory variable proposed by Cusack,
Iversen and Soskice. Our measure of differences in economic development is a variable that captures
the share of the labor force that is not employed in agriculture (NON AGRICULTURE). We also
measure the share of catholics (CATHOLICS) in a district to account for the possible effects of
religious heterogeneity. This measure is consistent with cross-national analyses of the effects of
religious fragmentation with the probability of adoption of proportional representation (Boix, 1999).
18
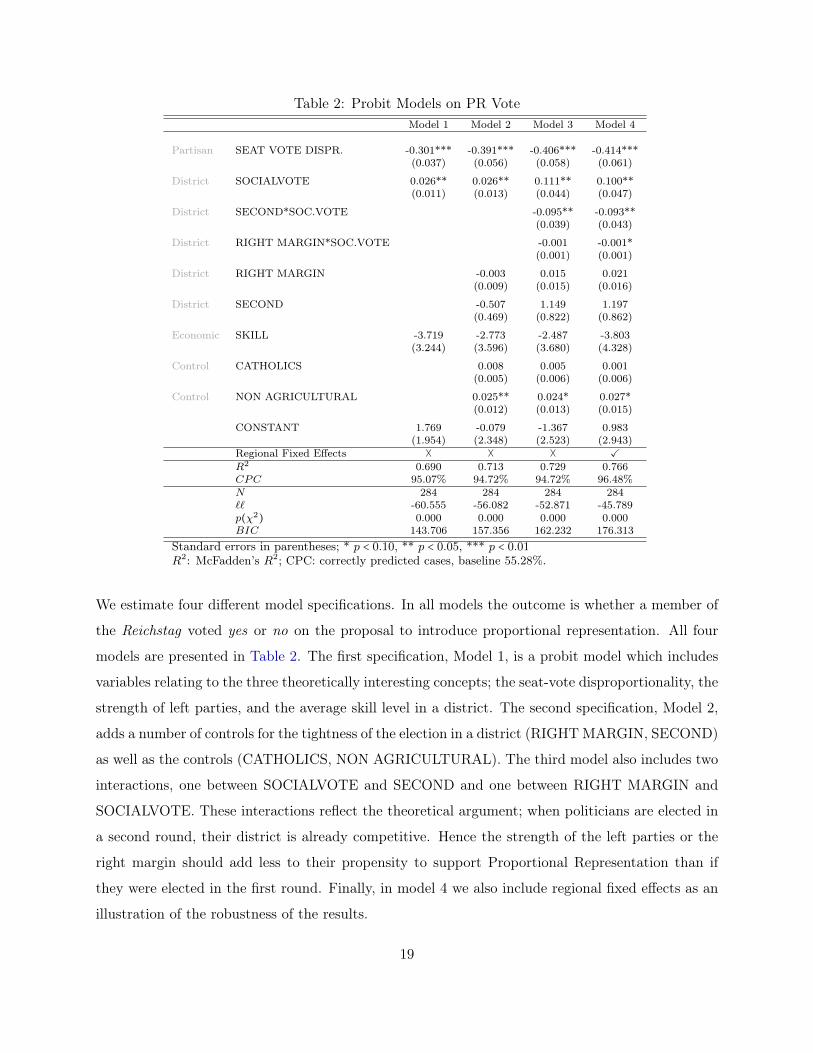
Table 2: Probit Models on PR VoteModel 1 Model 2 Model 3 Model 4
Partisan SEAT VOTE DISPR. -0.301*** -0.391*** -0.406*** -0.414***(0.037) (0.056) (0.058) (0.061)
District SOCIALVOTE 0.026** 0.026** 0.111** 0.100**(0.011) (0.013) (0.044) (0.047)
District SECOND*SOC.VOTE -0.095** -0.093**(0.039) (0.043)
District RIGHT MARGIN*SOC.VOTE -0.001 -0.001*(0.001) (0.001)
District RIGHT MARGIN -0.003 0.015 0.021(0.009) (0.015) (0.016)
District SECOND -0.507 1.149 1.197(0.469) (0.822) (0.862)
Economic SKILL -3.719 -2.773 -2.487 -3.803(3.244) (3.596) (3.680) (4.328)
Control CATHOLICS 0.008 0.005 0.001(0.005) (0.006) (0.006)
Control NON AGRICULTURAL 0.025** 0.024* 0.027*(0.012) (0.013) (0.015)
CONSTANT 1.769 -0.079 -1.367 0.983(1.954) (2.348) (2.523) (2.943)
Regional Fixed Effects � � � ✓R2 0.690 0.713 0.729 0.766CPC 95.07% 94.72% 94.72% 96.48%N 284 284 284 284�� -60.555 -56.082 -52.871 -45.789p(χ2) 0.000 0.000 0.000 0.000BIC 143.706 157.356 162.232 176.313
Standard errors in parentheses; * p < 0.10, ** p < 0.05, *** p < 0.01R2: McFadden’s R2; CPC: correctly predicted cases, baseline 55.28%.
We estimate four different model specifications. In all models the outcome is whether a member of
the Reichstag voted yes or no on the proposal to introduce proportional representation. All four
models are presented in Table 2. The first specification, Model 1, is a probit model which includes
variables relating to the three theoretically interesting concepts; the seat-vote disproportionality, the
strength of left parties, and the average skill level in a district. The second specification, Model 2,
adds a number of controls for the tightness of the election in a district (RIGHT MARGIN, SECOND)
as well as the controls (CATHOLICS, NON AGRICULTURAL). The third model also includes two
interactions, one between SOCIALVOTE and SECOND and one between RIGHT MARGIN and
SOCIALVOTE. These interactions reflect the theoretical argument; when politicians are elected in
a second round, their district is already competitive. Hence the strength of the left parties or the
right margin should add less to their propensity to support Proportional Representation than if
they were elected in the first round. Finally, in model 4 we also include regional fixed effects as an
illustration of the robustness of the results.
19
As hypothesized, we find a negative effect for seat-vote disproportionality across all specifica-
tions. The more disadvantageous the seat-vote ratio under majoritarian elections is for a party, the
more likely it will be that its members support a change to proportional representation (Rokkan
II). An increase in the strength of the left parties in a district increases the likelihood that the
politicians will support a change in electoral rules (Rokkan I). Finally, there is no effect for the av-
erage skill level in a district on the willingness of the representative to support changes in electoral
institutions. A comparison of the estimates from Model 2 (without interactions) and Model 3 (with
interactions) shows how the size of the coefficient for SOCIALVOTE more than triples while the
interaction (with SECOND) is negative and significant. The explanation for the increase in the size
of the coefficient for SOCIALVOTE is that we now allow the model to have two different effects for
SOCIALVOTE: one for politicians elected in the first round and one for those politicians elected
in the second round. The left threat exerts an effect for politicians which were elected in the first
round while those representatives which had to face a run-off are already in competitive districts
and the left threat should affect them less.The change of β̂SOCIALVOTE from Model 2 to Model 3 is
consistent with the theoretical predictions of the first Rokkanian hypothesis. Finally, adding fixed
effects does not change the estimates in any meaningful way with the exception that the interaction
between RIGHT MARGIN and SOCIALVOTE achieves statistical significance.4
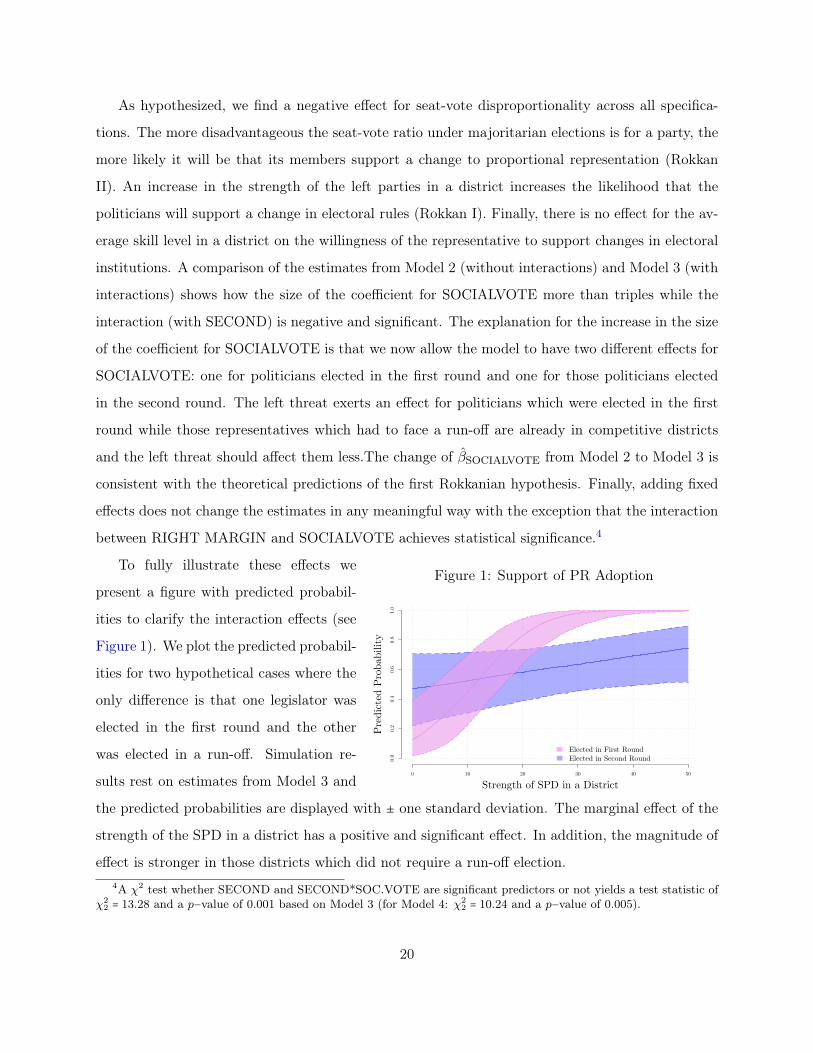
Figure 1: Support of PR Adoption
0 10 20 30 40 50
0.0
0.2
0.4
0.6
0.8
1.0
Strength of SPD in a District
Pred
icted
Pro
babi
lity
Elected in First RoundElected in Second Round
To fully illustrate these effects we
present a figure with predicted probabil-
ities to clarify the interaction effects (see
Figure 1). We plot the predicted probabil-
ities for two hypothetical cases where the
only difference is that one legislator was
elected in the first round and the other
was elected in a run-off. Simulation re-
sults rest on estimates from Model 3 and
the predicted probabilities are displayed with ± one standard deviation. The marginal effect of the
strength of the SPD in a district has a positive and significant effect. In addition, the magnitude of
effect is stronger in those districts which did not require a run-off election.4A χ2 test whether SECOND and SECOND*SOC.VOTE are significant predictors or not yields a test statistic of
χ22 = 13.28 and a p−value of 0.001 based on Model 3 (for Model 4: χ2
2 = 10.24 and a p−value of 0.005).
20
Finally we turn our attention to the economic predictors. In all specifications we find that the
average skill ratio of a district has no significant influence on the probability of a legislator voting
yes on the adoption of proportional representation. But we do find an effect for economic modern-
ization (NON AGRICULTURE) but this effect is not robust and disappears in alternative model
specifications. The non-finding for SKILL does not depend on the inclusion of NON AGRICUL-
TURE; all models support the null hypothesis that there is no relation between the probability of
a yes vote and the average skill level.5
In addition to these results, we perform a number of robustness checks and present all the
estimation results in the appendix. We present the same models but use two alternative measures
of skilled labor force – skill level of total work force as well as a measure of skill that is aggregated
over regions. The results are presented in Table 5 and Table 7 in the appendix. Among these
alternative models presented in the appendix, we also estimate a model that examines the vote
choice of non-socialist representatives in the Reichstag only and excludes the Social Democratic
candidates. The results reinforce our confidence in the explanatory value of the electoral threat of
the left on the political support for changes in electoral rules (see Table 11 in the appendix). Finally,
we also re-estimate alternative models where we include a measure of population size to control for
possible effects of malapportionment (Table 9 in the appendix). In all specifications the results
remain stable; the seat-vote disproportionality has a significant and negative effect on support for
proportional representation, the strength of the left vote in a district has a positive and significant
effect, and there is no statistical relation between skill levels and voting behavior.
The two Rokkanian arguments do not apply to the same level of analysis. The left threat is
a district-level variable whereas the seat vote disproportionality is a party-level variable. To take
these different levels fully into account empirically, we re-estimate Models 1 through 4 including re-
specifications that take the hierarchical data structure into account (Steenbergen and Jones, 2002;
Gelman and Hill, 2007). Table 3 presents the estimation results for Models 5 through 8 which
are hierarchical probit models, where the first level is the district level and the second level is the
partisan level.
Again, the outcome variable in both models is the vote of a single member of parliament. The
specification is identical to the models in Table 2 with the exception that we model the seat vote5In an estimation of Model 4 that excludes NON AGRICULTURE, we find β̂SKILL = −4.5 and a p−value of 0.289.
21
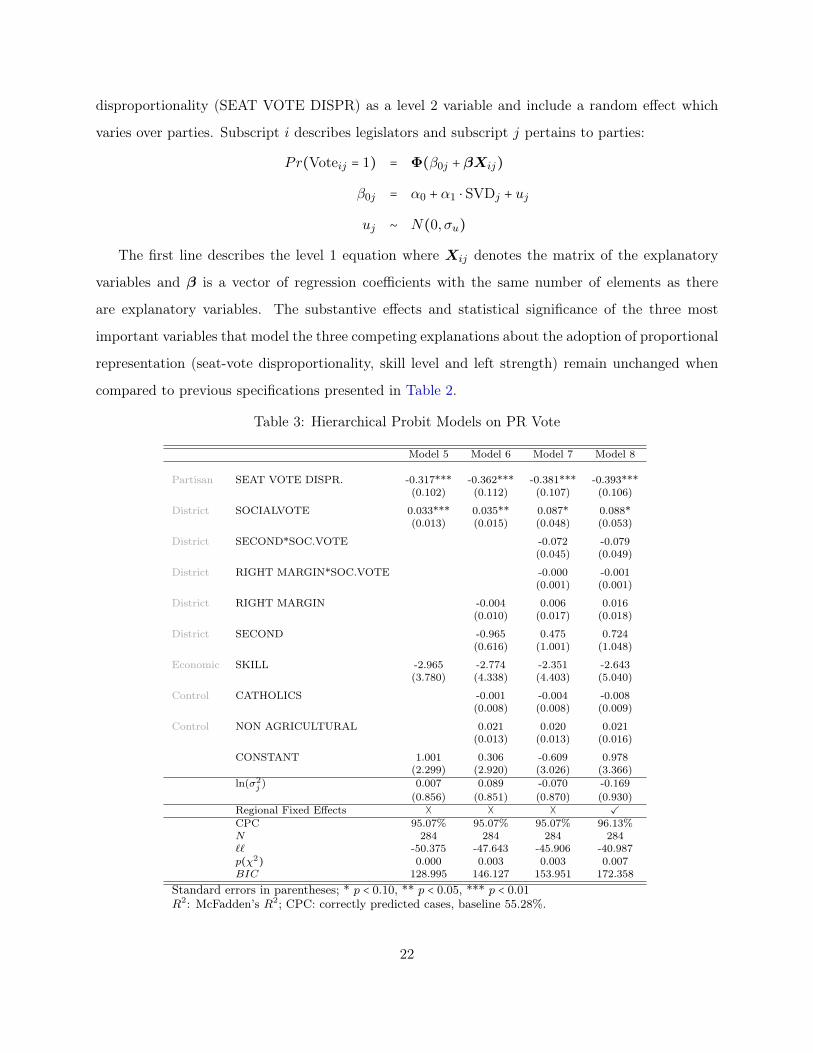
disproportionality (SEAT VOTE DISPR) as a level 2 variable and include a random effect which
varies over parties. Subscript i describes legislators and subscript j pertains to parties:
Pr(Voteij = 1) = Φ(β0j +βXij)β0j = α0 + α1 ⋅ SVDj + ujuj ∼ N(0,σu)
The first line describes the level 1 equation where Xij denotes the matrix of the explanatory
variables and β is a vector of regression coefficients with the same number of elements as there
are explanatory variables. The substantive effects and statistical significance of the three most
important variables that model the three competing explanations about the adoption of proportional
representation (seat-vote disproportionality, skill level and left strength) remain unchanged when
compared to previous specifications presented in Table 2.
Table 3: Hierarchical Probit Models on PR Vote
Model 5 Model 6 Model 7 Model 8
Partisan SEAT VOTE DISPR. -0.317*** -0.362*** -0.381*** -0.393***(0.102) (0.112) (0.107) (0.106)
District SOCIALVOTE 0.033*** 0.035** 0.087* 0.088*(0.013) (0.015) (0.048) (0.053)
District SECOND*SOC.VOTE -0.072 -0.079(0.045) (0.049)
District RIGHT MARGIN*SOC.VOTE -0.000 -0.001(0.001) (0.001)
District RIGHT MARGIN -0.004 0.006 0.016(0.010) (0.017) (0.018)
District SECOND -0.965 0.475 0.724(0.616) (1.001) (1.048)
Economic SKILL -2.965 -2.774 -2.351 -2.643(3.780) (4.338) (4.403) (5.040)
Control CATHOLICS -0.001 -0.004 -0.008(0.008) (0.008) (0.009)
Control NON AGRICULTURAL 0.021 0.020 0.021(0.013) (0.013) (0.016)
CONSTANT 1.001 0.306 -0.609 0.978(2.299) (2.920) (3.026) (3.366)
ln(σ2j ) 0.007 0.089 -0.070 -0.169
(0.856) (0.851) (0.870) (0.930)Regional Fixed Effects � � � ✓CPC 95.07% 95.07% 95.07% 96.13%N 284 284 284 284�� -50.375 -47.643 -45.906 -40.987p(χ2) 0.000 0.003 0.003 0.007BIC 128.995 146.127 153.951 172.358
Standard errors in parentheses; * p < 0.10, ** p < 0.05, *** p < 0.01R2: McFadden’s R2; CPC: correctly predicted cases, baseline 55.28%.
22
Moreover, the effects of these variables do not change across all models presented in Table 3.
In these specifications, the measure of economic development (NON AGRICULTURAL) no longer
reaches statistical significance at conventional levels, when compared to Table 2. The coefficients of
the interaction between the second round and the social democratic vote and the right margin and
the social democratic vote also do not reach statistical significance. These changes notwithstanding,
we find that the tests of the relevant theoretical hypotheses remain unchanged. The skill level in
a district has no effect on the probability that a legislator in the Reichstag will support a change
of the electoral system. By contrast, political variables exercise a considerable effect. Increases
in seat-vote disproportionality and the strength of the left-wing candidate competing in a district
increase the probability of support for proportional representation.
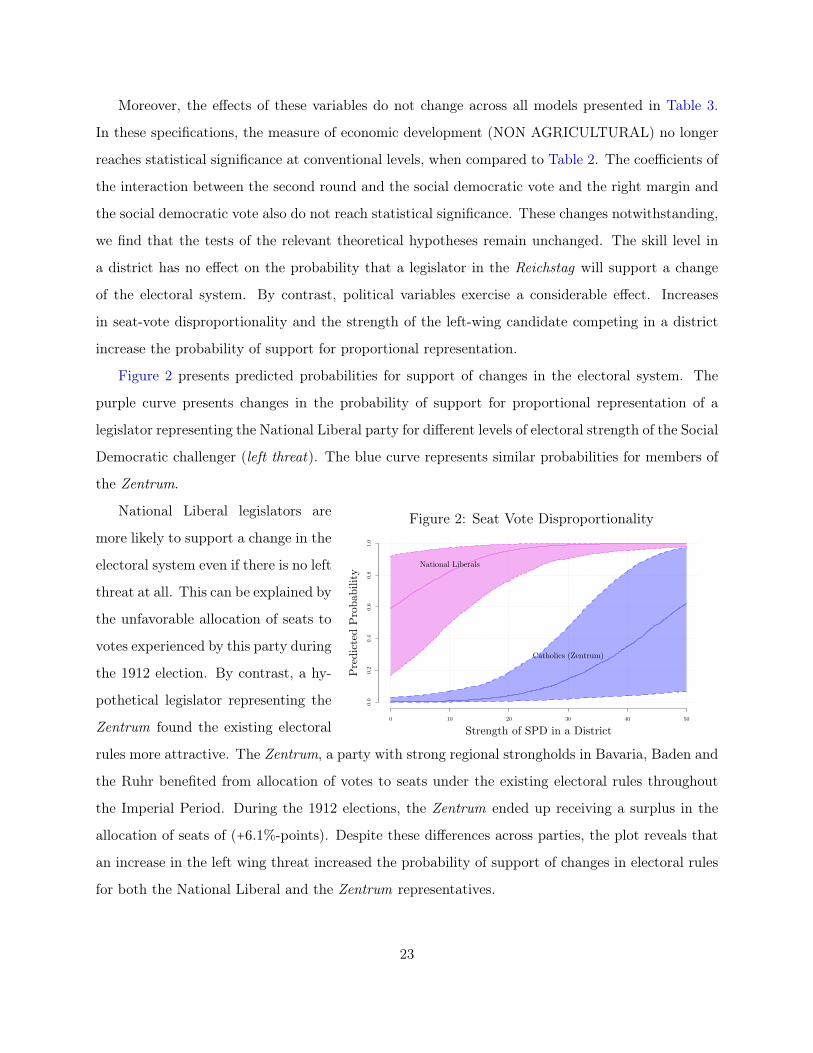
Figure 2 presents predicted probabilities for support of changes in the electoral system. The
purple curve presents changes in the probability of support for proportional representation of a
legislator representing the National Liberal party for different levels of electoral strength of the Social
Democratic challenger (left threat). The blue curve represents similar probabilities for members of
the Zentrum.
Figure 2: Seat Vote Disproportionality
0 10 20 30 40 50
0.0
0.2
0.4
0.6
0.8
1.0
Strength of SPD in a District
Pred
icted
Pro
babi
lity National Liberals
Catholics (Zentrum)
National Liberal legislators are
more likely to support a change in the
electoral system even if there is no left
threat at all. This can be explained by
the unfavorable allocation of seats to
votes experienced by this party during
the 1912 election. By contrast, a hy-
pothetical legislator representing the
Zentrum found the existing electoral
rules more attractive. The Zentrum, a party with strong regional strongholds in Bavaria, Baden and
the Ruhr benefited from allocation of votes to seats under the existing electoral rules throughout
the Imperial Period. During the 1912 elections, the Zentrum ended up receiving a surplus in the
allocation of seats of (+6.1%-points). Despite these differences across parties, the plot reveals that
an increase in the left wing threat increased the probability of support of changes in electoral rules
for both the National Liberal and the Zentrum representatives.
23
One might object to the operationalization of skill level as a district variable and claim that the
skill mechanism rather works through the party. In that logic, the individual representative might
be responsive even if his own district is not endowed with a high skill level but rather most other
members of his party have districts with above average skill levels. We also provide estimation results
for that operationalization where we first aggregate average skill level for each party separately to
the party level (average of skill level for all districts held by a party) and add this variable as a
party-level variable to the hierarchical model.The results are substantively identical to the models
presented in Table 3. There is a negative and significant effect for seat-vote disproportionality, a
positive and significant effect for the strength of the left in a district and no relationship between the
skill level and the propensity to support proportional representation (see Table 10 in the appendix).6
4.2 Party Defection and Left Threat
The two political variables that impinge upon the political decisions of legislators – the left threat
in individual districts vs. party interests – reinforce each other on some occasions, but can, on other
occasions, pull in different directions. In this section, we examine those cases where legislators
defected from their party position and voted against the party’s interest. Can such defections be
explained by individual-district motivations?
To illustrate how district-level and partisan consideration can come into conflict with each
other, consider the case of politicians, from the two parties opposing the adoption of proportional
representations – Zentrum and Conservatives – , who face a strong social democratic threat in
their district. In this case, partisan considerations pull the politician towards support for existing
electoral rules, while district-level calculations pull in the direction of changes in electoral systems.
The defection of these politicians from the position advocated by their party can be explained by
district level competition. This is the case, for example of Eugen Schatz – a Zentrum politician
from Saargemünd-Forbach who supported the adoption of proportional representation. Schatz had
won his seat with a narrow margin against a Social Democratic opponent. Albert Thumann, a
politician from Gebweiler and another Zentrum politician who defected from the position of his
party – had also clinched victory narrowly (with a majority of 55 percent of the votes) against a
Social Democratic challenger.6We also estimated a model in which we let the coefficients vary over parties and uncover the same estimates with
respect to significance level and direction of effect.
24
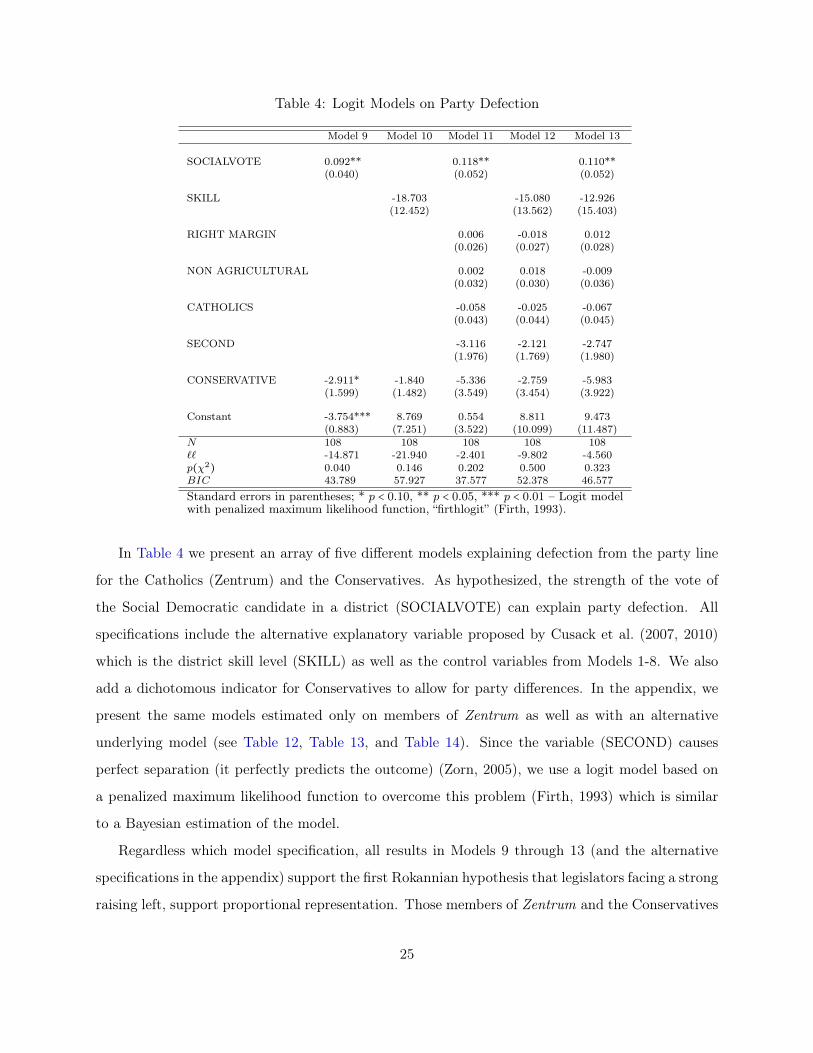
Table 4: Logit Models on Party Defection
Model 9 Model 10 Model 11 Model 12 Model 13
SOCIALVOTE 0.092** 0.118** 0.110**(0.040) (0.052) (0.052)
SKILL -18.703 -15.080 -12.926(12.452) (13.562) (15.403)
RIGHT MARGIN 0.006 -0.018 0.012(0.026) (0.027) (0.028)
NON AGRICULTURAL 0.002 0.018 -0.009(0.032) (0.030) (0.036)
CATHOLICS -0.058 -0.025 -0.067(0.043) (0.044) (0.045)
SECOND -3.116 -2.121 -2.747(1.976) (1.769) (1.980)
CONSERVATIVE -2.911* -1.840 -5.336 -2.759 -5.983(1.599) (1.482) (3.549) (3.454) (3.922)
Constant -3.754*** 8.769 0.554 8.811 9.473(0.883) (7.251) (3.522) (10.099) (11.487)
N 108 108 108 108 108�� -14.871 -21.940 -2.401 -9.802 -4.560p(χ2) 0.040 0.146 0.202 0.500 0.323BIC 43.789 57.927 37.577 52.378 46.577Standard errors in parentheses; * p < 0.10, ** p < 0.05, *** p < 0.01 – Logit modelwith penalized maximum likelihood function, “firthlogit” (Firth, 1993).
In Table 4 we present an array of five different models explaining defection from the party line
for the Catholics (Zentrum) and the Conservatives. As hypothesized, the strength of the vote of
the Social Democratic candidate in a district (SOCIALVOTE) can explain party defection. All
specifications include the alternative explanatory variable proposed by Cusack et al. (2007, 2010)
which is the district skill level (SKILL) as well as the control variables from Models 1-8. We also
add a dichotomous indicator for Conservatives to allow for party differences. In the appendix, we
present the same models estimated only on members of Zentrum as well as with an alternative
underlying model (see Table 12, Table 13, and Table 14). Since the variable (SECOND) causes
perfect separation (it perfectly predicts the outcome) (Zorn, 2005), we use a logit model based on
a penalized maximum likelihood function to overcome this problem (Firth, 1993) which is similar
to a Bayesian estimation of the model.
Regardless which model specification, all results in Models 9 through 13 (and the alternative
specifications in the appendix) support the first Rokannian hypothesis that legislators facing a strong
raising left, support proportional representation. Those members of Zentrum and the Conservatives
25
who defected from the party line were facing considerably stronger left candidates in their districts.7
Those members of Zentrum who voted against their party line faced significantly stronger left
contenders in their districts. This illustrates the strength of Rokkan’s two hypotheses when they are
allowed to jointly explain the same observations on the party level as well as the individual district
level. We have now not only established that the two Rokkanian hypotheses can explain the overall
vote outcome and the adoption of PR, but we also illustrated that Rokkan I (Social Democratic
vote share as threat) explains party defection among those parties that share an electoral advantage
from using SMD and thereby shows that these two explanations are not two different roads leading
to PR but arguments which apply simultaneously at different levels of analysis within the same
case.
5 Conclusion
We have started this paper by noting a paradoxical situation in the recent literature examining the
origin of proportional representation. The flurry of papers in prominent publications notwithstand-
ing, one was left wondering which of explanations does a better job in accounting for the choice
of electoral rules in European countries during the first decades of the 20th century. The current
debate has been framed as a horse-race between the first Rokkanian hypothesis and the economic
arguments formulated by Cusack et al. (2007), to the neglect of alternative explanations (which
are also Rokkanian in origin) that attribute an important role to partisan calculations (exception is
Calvo 2009).
In this paper, we have argued that political demand for the adoption of proportional represen-
tation can be attributed to factors that operate at two distinct levels. One set of considerations
operate at the level of the party. Disproportionalities in the translation of votes to seats and per-
ceptions of possible gains in the allocation of seats under the new electoral rules affect partisan
considerations about the desirability of changes in electoral rules. These factors explain variation in
the partisan positions among parties on the right and the position of social democratic parties on
the issue of electoral reforms. A second set of factors that impinge upon the decisions of politicians
operate at the level of the electoral district. Here vulnerability to electoral competition from left7Testing the difference in means of SPD vote share, we find a test statistic of t = 2.60 and a p−value of 0.013.We
also used a non-parametric test, randomization inference, which yields the same result. The average vote share ofSPD in the districts of the six deviators is significantly higher than the average SPD vote share in any random draw ofsix members of the Zentrum. We used 100,000 randomization and found a p−value of 0.02 (Gerber and Green, 2012).
26
wing candidates can explain some additional variation in political support for changes in electoral
rules among candidates on the political right and the willingness of the latter to support or deviate
from the position advocated by their parties. While these political hypotheses go back to the work
of Rokkan, we reformulate and clarify the Rokkanian conjectures. We argue that it is more use-
ful to think about the two political hypotheses about the adoption of proportional representation
as identifying complementary constraints on politicians, rather than as ’separate paths’ chosen by
different countries. Empirically, we demonstrate that both logics are at work within the same case
and that they identify different sources of demand for changes in electoral rules.
Our paper also proposes a new empirical strategy to examine the question of changes in electoral
rules that departs from a reliance on a cross-national analysis. We propose to change the unit of
analysis from countries to individual legislators and bring back individual politicians to the center
of the analysis. This empirical strategy has several advantages over cross-national research. The
first is that it allows us to test existing explanations at the salient level, the level of the district,
rather than the level of the country. Secondly, it allows to consider all the relevant political and
economic hypotheses and not just a subset of the latter. Finally, we improve upon existing studies
by developing more precise measures of the salient political and economic variables.
We find that political support for the adoption of proportional representation was affected by
partisan considerations about the disproportionality in the translation of seats to votes and by po-
litical conditions in a district. We do not find that legislative support can be explained by skill levels
regardless of the many alternative specifications we employ. Our empirical analysis disconfirms the
economic hypothesis about the adoption of proportional representation. But given that Germany
is a ‘hard case’ for Rokkanian explanations, we believe that our findings weaken significantly our
confidence in the comparative explanatory power of economic hypotheses for the adoption of pro-
portional representation. Our findings also qualify the Rokkanian hypothesis about the importance
of the Social Democratic threat as a determinant of the adoption of proportional representation in
Germany. We show that political choices made by German legislators over the adoption of pro-
portional representation can be explained by a combination of partisan dissatisfaction and district
level vulnerabilities. Contra Rokkan, we show that choices over electoral rules are affected by a
combination of partisan and electoral considerations and not by district level vulnerabilities to the
Social Democratic threat only.
27
References
Ahmed, Amel. 2010. “Reading history forward: The origins of electoral systems in European democracies.”Comparative Political Studies 43(8-9):1059–1088.
Alesina, Alberto, Edward Glaeser and Bruce Sacerdote. 2001. Why Doesn’t the US Have a European-StyleWelfare System? Technical report National Bureau of Economic Research.
Anderson, Margaret Lavinia. 2000. Practicing Democracy: Elections and Political Culture in Imperial Ger-many. Princeton: Princeton University Press.
Andrews, Josephine T. and Robert W. Jackman. 2005. “Strategic fools: electoral rule choice under extremeuncertainty.” Electoral Studies 24(1):65–84.
Bade, Klaus. 1980. Massenwanderung und Arbeitsmarkt im deutschen Nordosten 1880- 1914. Archiv fürSozialgeschichte.
Benoit, Kenneth. 2004. “Models of electoral system change.” Electoral studies 23(3):363–389.
Bertram, Juergen. 1964. Die Wahlen zum deutschen Reichstag vom Jahre 1912: Parteien und Verbände inder Innenpolitik des wilhelminischen Reiches. Droste.
Blais, André, Agnieszka Dobrzynska and Indridi Indridason. 2005. “To adopt or not to adopt proportionalrepresentation: the politics of institutional choice.” British Journal of Political Science pp. 182–190.
Boix, Carles. 1999. “Setting the Rules of the Game: The Choice of Electoral Systems in Advanced Democ-racies.” The American Political Science Review 93(3):609–624.
Boix, Carles. 2010. “Electoral markets, party strategies, and proportional representation.” American PoliticalScience Review 104(2):404–413.
Brandenburg, Erich. 1917. 50 Jahre Nationalliberale Partei: 1867-1917. Schriftenvertriebsstelle der Nation-alliberalen Partei Deutschlands, Kalkoff.
Braunias, Karl. 1932. Das parlamentarische Wahlrecht: ein Handbuch über die Bildung der gesetzgebendenKörperschaften in Europa. Vol. 2 W. de Gruyter & co.
Bundesarchiv, Berlin Lichterfeld. 1912. Betrachtungen über die Einteilung der Reichstagswahlkreise. R1501/309-363.
Calvo, Ernesto. 2009. “The Competitive Road to Proportional Representation. Partisan biases and electoralregime change under increasing party competition.” World Politics 61(2):254–95.
Colomer, Josep M. 2005. “It’s parties that choose electoral systems (or, Duverger’s laws upside down).”Political Studies 53(1):1–21.
Cox, Gary W. 1997. Making Votes Count: Strategic Coordination in the World’s Electoral Systems. Cam-bridge: Cambridge University Press.
Cusack, Thomas, Torben Iversen and David Soskice. 2007. “Economic Interests and the Origins of ElectoralSystems.” The American Political Science Review 101(3):373–391.
Cusack, Thomas, Torben Iversen and David Soskice. 2010. “Coevolution of Capitalism and Political Repre-sentation: The Choice of Electoral Systems.” The American Political Science Review 104(2):393–403.
28
Duverger, Maurice. 1954. Political parties: Their organization and activity in the modern state. New York:John Wiley.
Fairbairn, Brett. 1990. “Authority vs. democracy: Prussian Officials in the German Elections of 1898 and1903.” The Historical Journal 33(4):811– 838.
Firth, David. 1993. “Bias Reduction of Maximum Likelihood Estimates.” Biometrika 80(1):27–38.
Fremdling, Rainer and Richard Tilly. 1979. Industrialisierung und Raum. Studien zur regionalen Differen-zierung im Deutschland des 19.Jahrhunderts. Stuttgart: Klett-Cotta.
Fricke, Dieter. 1961. “Der deutsche Imperialismus und die Reichstagswahlen von 1907.” Zeitschrift fürGeschichstwissenschaft 9(3):538– 576.
Gagel, Walter. 1958. Die Wahlrechtsfrage in der Geschichte der deutschen liberalen Parteien: 1848-1918.Vol. 12 Droste Verlag.
Gelman, Andrew and Jennifer Hill. 2007. Data Analysis Using Regression and Multilevel/Hierarchical Models.Cambridge: Cambridge University Press.
George, Alexander L. and Andrew Bennett. 2005. Case Studies and Theory Development in the SocialSciences. Cambridge: MIT Press.
Gerber, Alan S. and Donald P. Green. 2012. Field Experiments: Design, Analysis, and Interpretation. NewYork: W.W. Norton.
Hatschek, Julius. 1920. Kommentar zum Wahlgesetz und zur Wahlordnung im Deutschen Kaiserreich. Berlinund Leipzig: Walter de Gruyter.
Hohls, Rüdiger and Hartmut Kaelble. 1989. Die regionale Erwerbsstruktur im deutschen Reich und in derBundesrepublik Deutschland. St. Katharinen : Scripta Mercaturae Verlag.
Huber, Evelyne, Charles Ragin and John D Stephens. 1993. “Social democracy, Christian democracy, con-stitutional structure, and the welfare state.” American Journal of Sociology pp. 711–749.
Kaiserliches-Statistisches-Amt. 1898. Statistik des Deutschen Reichs. [Band 112]. Berlin: Verlag desKoniglich Preussischen Statistischen Bureaus.
Kaiserliches-Statistisches-Amt. 1899a. Die berufliche und soziale Gliederung des deutschen Volkes nach derBerufszählung vom 14. Juni 1895. Berlin: Verlag des Koniglich Preussischen Statistischen Bureaus.
Kaiserliches-Statistisches-Amt. 1899b. Statistik des Deutschen Reichs. Volumes 117 and 118. Berlin: VonPuttkammer und Mühlbrecht.
Kaiserliches-Statistisches-Amt. 1907. Gewerbliche Betriebsstatistik. Berlin: Von Puttkammer undMühlbrecht.
Kaiserliches-Statistisches-Amt. 1909. Statistik des Deutschen Reiches, Neue Folge, Volumes 218 and 219.Berlin: Von Puttkammer und Mühlbrecht.
Kaiserliches-Statistisches-Amt. 1913. Die Reichstagswahlen von 1912. In Statistik des Deutschen Reiches,Band 250, Zweites Heft. Berlin: Von Puttkammer und Mühlbrecht.
29
Kreuzer, Marcus. 2010. “Historical Knowledge and Quantitative Analysis: The Case of the Origins ofProportional Representation.” The American Political Science Review 104(2):369–392.
Kühne, Thomas. 1994. Landtagswahlen zwischen korporativer Tradition und politischem Massenmarkt. InDreiklassenwahlrecht und Wahlkultur in Preussen 1867-1914. Düsseldorf : Droste.
Kuo, Alexander. 2010. The political origin of firms’ strategies. PhD thesis Department of Political Science,Stanford University.
Lijphart, Arend. 1990. “The political consequences of electoral laws, 1945-85.” The American Political ScienceReview pp. 481–496.
Luebbert, Gregory M. 1991. Liberalism, fascism, or social democracy: Social classes and the political originsof regimes in interwar Europe. Oxford University Press, USA.
Penadés, Alberto. 2008. “The Institutional Preferences or Early Socialist Parties: Choosing Rules for Gov-ernment.” Controlling Governments – Voters, Institutions, and Accountability José María Maravall.
Penadés, Alberto. 2011. “Electoral Reform in Early Democracies: The Right Wing.” Presented at the Con-ference on Historical Political and Economic Development in Western Europe: Recent Advances inComparative Politics, Madrid .
Person, Torsten and Guido Tabellini. 2004. “Constitutions and economic policy.” The Journal of EconomicPerspectives 18(1):75–98.
Persson, Torsten and Guido E. Tabellini. 2005. The economic effects of constitutions. The MIT Press.
Reibel, Carl-Wilhelm. 2007. Handbuch der Reichstagswahlen 1890- 1918. Bundnisse, Ergebnisse, Kandi-daten. Düsseldorf: Droste.
Renwick, Alan. 2010. The Politics of Electoral Reform: Changing the Rules of Democracy. CambridgeUniversity Press.
Rogowski, Ronald. 1987. “Trade and the variety of democratic institutions.” International Organization41(02):203–223.
Rokkan, Stein. 1970. Citizens Elections Parties. New York: David McKay Co.
Schmädeke, Jurgen. 1995. Wählerbewegung im Wilhelminischen Deutschland: die Reichstagswahlen von 1890bis 1912. Berlin: Akademie Verlag.
Simon, Klaus. 1969. Die württembergischen Demokraten: ihre Stellung und Arbeit im Parteien- und Verfas-sungssystem in Wurttemberg und im Deutschen Reich 1890-1920. Vol. 52 Kohlhammer.
Steenbergen, Marco R. and Bradford S. Jones. 2002. “Modeling Multilevel Data Structures.” AmericanJournal of Political Science 46:218–237.
Thelen, Kathleen. 2004. How Institutions Evolve: The Political Economy of Skills in Germany, Britain, theUnited States and Japan. New York: Cambridge University Press.
Zorn, Christoper. 2005. “A Solution to Separation in Binary Response Models.” Political Analysis 13(2):157–170.
30
Appendix
Appendix A1: How Vote Abstention Recommendations led to Social Democratic
Victories p. 32
Appendix A2: A Measure of Skill Level p. 32
Appendix A3: Alternative Skill Measures p. 33
A3.1: Skill Level of Entire Labor Force p. 33
A3.2: Skill Level as a Regional Measure p. 34
Appendix A4: Effect of District Population Size p. 36
Appendix A5: Skills as a Party Level Variable p. 38
Appendix A6: Model Estimation on Non-Left Politicians p. 38
Appendix A7: Party Defection p. 40
Appendix A8: Skilled and Unskilled workers in 1895 p. 42
31
Appendix A1: How Vote Abstention Recommendations led to Social Democratic
Victories
To illustrate how recommendations to their voters for abstention made by parties on the rightcontributed to the victory of the Social Democratic candidate, consider the following examples(from the 1912 election): In Potsdam-Osthavelland Spandau, the candidates in the runoff were arepresentative of the Imperial Party and a Social Democratic candidates. The Free Liberal Party(‘Fortschrittliche Volkpartei’), which had received 24 percent of the votes in the first round, recom-mended their voters to abstain, which led to the victory of the Social Democratic candidate. (Reibel2007: 163). In Heiligenstadt Worbis, a Free Liberal candidate encountered a Socialist in runoffs.In this case, an electoral committee of the ‘united conservative parties’ (‘Vereinigte RechtstehendeParteien’), which included National Liberals, Conservatives and the Economic Union recommendedtheir voters abstention during runoffs. This led to the victory of the Social Democratic candidate,Cohn (Reibel 2007: 530). This within-country variation in the electoral strategies during runoffsis conditioned by distinct distributions of voter preferences across districts, by previous patterns ofelectoral competition and so on. One specific form of failed coordination occurs when a right partyrecommends abstention in the second round and supports neither of the candidates. This is mostsevere if one of the two remaining candidates belongs to the Social Democrats. During the 1912election, we can identify at least 13 districts in which a non-socialist party recommended absten-tion and the Social Democrats eventually won the district in the run-off. While runoffs offer anopportunity to coordinate, due to conflicts within the right the presence of runoffs is not sufficientto assure coordination.
Appendix A2: A Measure of Skill Level
The data on skill distributions has the following structure. Every occupation is classified first ac-cording to agriculture, mining and producing industry, or trade and commerce. Within these broadcategories there are two further levels. To illustrate this, consider the occupational classificationof goldsmiths. This person makes jewelry and therefore (s)he is in the second sector (mining andproducing industry), within that sector (s)he belongs to the vocational group “V” (metalworkingclass) . If the person does not use copper but gold (s)he is in the vocational group “V” and a type“a” (metalworking with gold or silver). Germany’s 1895 occupational census collected informationon the ratio of skilled to unskilled workers at this very low level of occupational aggregation. Weknow exactly how many people employed in “Va” were skilled.
Unfortunately, as part of the 1905 census, the German Statistical Office did not collect similardata measuring the ratio of skilled to unskilled workers for each occupation. The only informationthat exists in the 1905 census is a comparative table on the number of apprentices (Lehrlinge) foreach occupation, which compares the 1895 and 1905 census. Given that this table reveals that theovertime change in these ratios is very small, one can assume that the skill ratio remains constantover time for each occupation. What changes, however, is the occupational make-up of a district.This requires us to recalculate the skill ratio using the information collected as part of the 1905
32
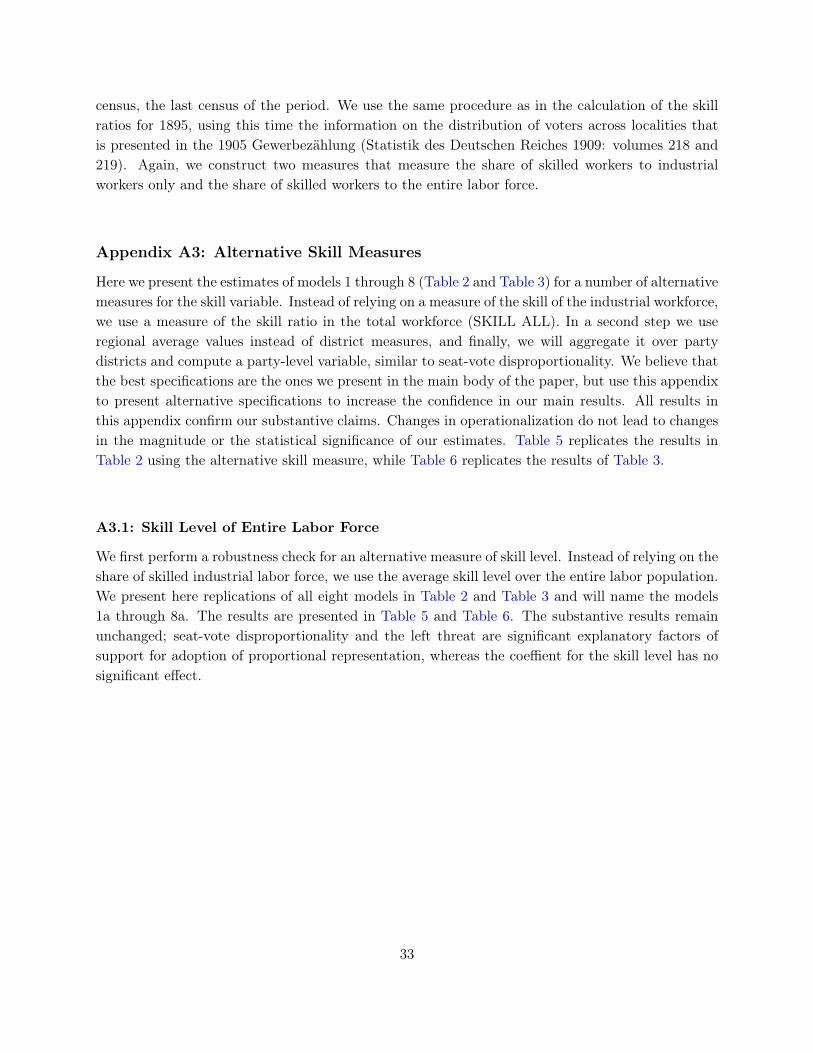
census, the last census of the period. We use the same procedure as in the calculation of the skillratios for 1895, using this time the information on the distribution of voters across localities thatis presented in the 1905 Gewerbezählung (Statistik des Deutschen Reiches 1909: volumes 218 and219). Again, we construct two measures that measure the share of skilled workers to industrialworkers only and the share of skilled workers to the entire labor force.
Appendix A3: Alternative Skill Measures
Here we present the estimates of models 1 through 8 (Table 2 and Table 3) for a number of alternativemeasures for the skill variable. Instead of relying on a measure of the skill of the industrial workforce,we use a measure of the skill ratio in the total workforce (SKILL ALL). In a second step we useregional average values instead of district measures, and finally, we will aggregate it over partydistricts and compute a party-level variable, similar to seat-vote disproportionality. We believe thatthe best specifications are the ones we present in the main body of the paper, but use this appendixto present alternative specifications to increase the confidence in our main results. All results inthis appendix confirm our substantive claims. Changes in operationalization do not lead to changesin the magnitude or the statistical significance of our estimates. Table 5 replicates the results inTable 2 using the alternative skill measure, while Table 6 replicates the results of Table 3.
A3.1: Skill Level of Entire Labor Force
We first perform a robustness check for an alternative measure of skill level. Instead of relying on theshare of skilled industrial labor force, we use the average skill level over the entire labor population.We present here replications of all eight models in Table 2 and Table 3 and will name the models1a through 8a. The results are presented in Table 5 and Table 6. The substantive results remainunchanged; seat-vote disproportionality and the left threat are significant explanatory factors ofsupport for adoption of proportional representation, whereas the coeffient for the skill level has nosignificant effect.
33
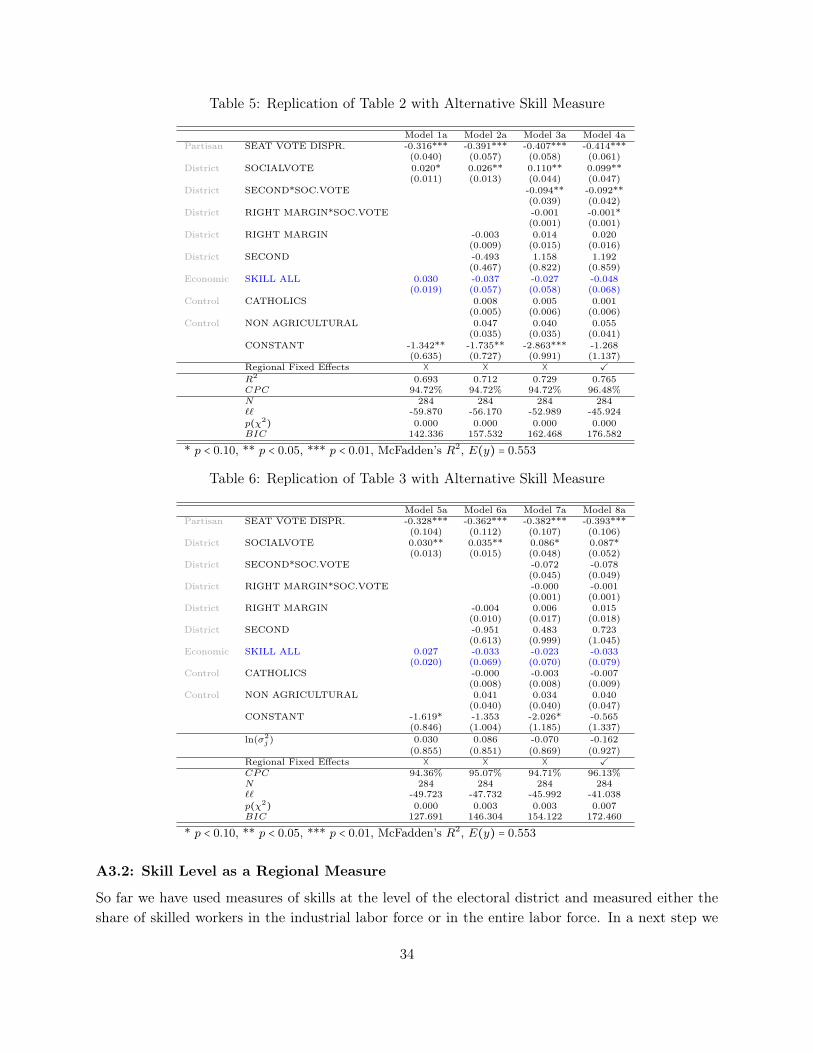
Table 5: Replication of Table 2 with Alternative Skill Measure
Model 1a Model 2a Model 3a Model 4aPartisan SEAT VOTE DISPR. -0.316*** -0.391*** -0.407*** -0.414***
(0.040) (0.057) (0.058) (0.061)District SOCIALVOTE 0.020* 0.026** 0.110** 0.099**
(0.011) (0.013) (0.044) (0.047)District SECOND*SOC.VOTE -0.094** -0.092**
(0.039) (0.042)District RIGHT MARGIN*SOC.VOTE -0.001 -0.001*
(0.001) (0.001)District RIGHT MARGIN -0.003 0.014 0.020
(0.009) (0.015) (0.016)District SECOND -0.493 1.158 1.192
(0.467) (0.822) (0.859)Economic SKILL ALL 0.030 -0.037 -0.027 -0.048
(0.019) (0.057) (0.058) (0.068)Control CATHOLICS 0.008 0.005 0.001
(0.005) (0.006) (0.006)Control NON AGRICULTURAL 0.047 0.040 0.055
(0.035) (0.035) (0.041)CONSTANT -1.342** -1.735** -2.863*** -1.268
(0.635) (0.727) (0.991) (1.137)Regional Fixed Effects � � � ✓R2 0.693 0.712 0.729 0.765CPC 94.72% 94.72% 94.72% 96.48%N 284 284 284 284�� -59.870 -56.170 -52.989 -45.924p(χ2) 0.000 0.000 0.000 0.000BIC 142.336 157.532 162.468 176.582
* p < 0.10, ** p < 0.05, *** p < 0.01, McFadden’s R2, E(y) = 0.553Table 6: Replication of Table 3 with Alternative Skill Measure
Model 5a Model 6a Model 7a Model 8aPartisan SEAT VOTE DISPR. -0.328*** -0.362*** -0.382*** -0.393***
(0.104) (0.112) (0.107) (0.106)District SOCIALVOTE 0.030** 0.035** 0.086* 0.087*
(0.013) (0.015) (0.048) (0.052)District SECOND*SOC.VOTE -0.072 -0.078
(0.045) (0.049)District RIGHT MARGIN*SOC.VOTE -0.000 -0.001
(0.001) (0.001)District RIGHT MARGIN -0.004 0.006 0.015
(0.010) (0.017) (0.018)District SECOND -0.951 0.483 0.723
(0.613) (0.999) (1.045)Economic SKILL ALL 0.027 -0.033 -0.023 -0.033
(0.020) (0.069) (0.070) (0.079)Control CATHOLICS -0.000 -0.003 -0.007
(0.008) (0.008) (0.009)Control NON AGRICULTURAL 0.041 0.034 0.040
(0.040) (0.040) (0.047)CONSTANT -1.619* -1.353 -2.026* -0.565
(0.846) (1.004) (1.185) (1.337)ln(σ2
j ) 0.030 0.086 -0.070 -0.162(0.855) (0.851) (0.869) (0.927)
Regional Fixed Effects � � � ✓CPC 94.36% 95.07% 94.71% 96.13%N 284 284 284 284�� -49.723 -47.732 -45.992 -41.038p(χ2) 0.000 0.003 0.003 0.007BIC 127.691 146.304 154.122 172.460
* p < 0.10, ** p < 0.05, *** p < 0.01, McFadden’s R2, E(y) = 0.553A3.2: Skill Level as a Regional Measure
So far we have used measures of skills at the level of the electoral district and measured either theshare of skilled workers in the industrial labor force or in the entire labor force. In a next step we
34
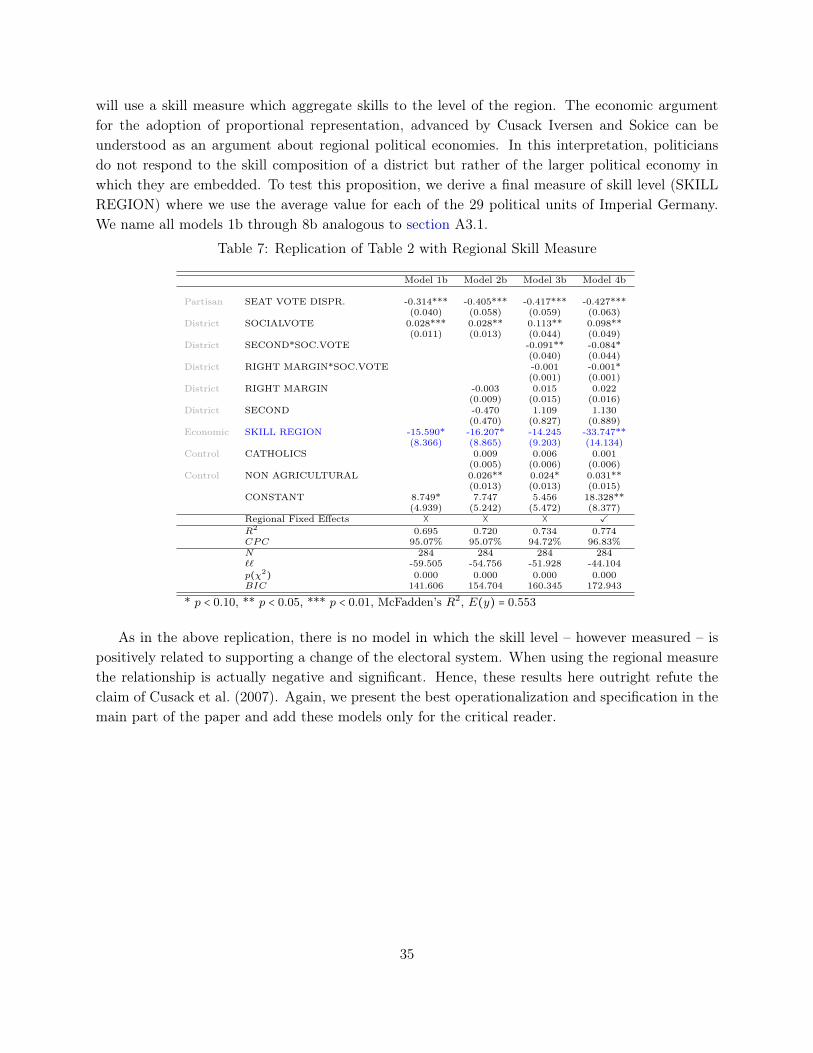
will use a skill measure which aggregate skills to the level of the region. The economic argumentfor the adoption of proportional representation, advanced by Cusack Iversen and Sokice can beunderstood as an argument about regional political economies. In this interpretation, politiciansdo not respond to the skill composition of a district but rather of the larger political economy inwhich they are embedded. To test this proposition, we derive a final measure of skill level (SKILLREGION) where we use the average value for each of the 29 political units of Imperial Germany.We name all models 1b through 8b analogous to section A3.1.
Table 7: Replication of Table 2 with Regional Skill Measure
Model 1b Model 2b Model 3b Model 4b
Partisan SEAT VOTE DISPR. -0.314*** -0.405*** -0.417*** -0.427***(0.040) (0.058) (0.059) (0.063)
District SOCIALVOTE 0.028*** 0.028** 0.113** 0.098**(0.011) (0.013) (0.044) (0.049)
District SECOND*SOC.VOTE -0.091** -0.084*(0.040) (0.044)
District RIGHT MARGIN*SOC.VOTE -0.001 -0.001*(0.001) (0.001)
District RIGHT MARGIN -0.003 0.015 0.022(0.009) (0.015) (0.016)
District SECOND -0.470 1.109 1.130(0.470) (0.827) (0.889)
Economic SKILL REGION -15.590* -16.207* -14.245 -33.747**(8.366) (8.865) (9.203) (14.134)
Control CATHOLICS 0.009 0.006 0.001(0.005) (0.006) (0.006)
Control NON AGRICULTURAL 0.026** 0.024* 0.031**(0.013) (0.013) (0.015)
CONSTANT 8.749* 7.747 5.456 18.328**(4.939) (5.242) (5.472) (8.377)
Regional Fixed Effects � � � ✓R2 0.695 0.720 0.734 0.774CPC 95.07% 95.07% 94.72% 96.83%N 284 284 284 284�� -59.505 -54.756 -51.928 -44.104p(χ2) 0.000 0.000 0.000 0.000BIC 141.606 154.704 160.345 172.943
* p < 0.10, ** p < 0.05, *** p < 0.01, McFadden’s R2, E(y) = 0.553As in the above replication, there is no model in which the skill level – however measured – is
positively related to supporting a change of the electoral system. When using the regional measurethe relationship is actually negative and significant. Hence, these results here outright refute theclaim of Cusack et al. (2007). Again, we present the best operationalization and specification in themain part of the paper and add these models only for the critical reader.
35
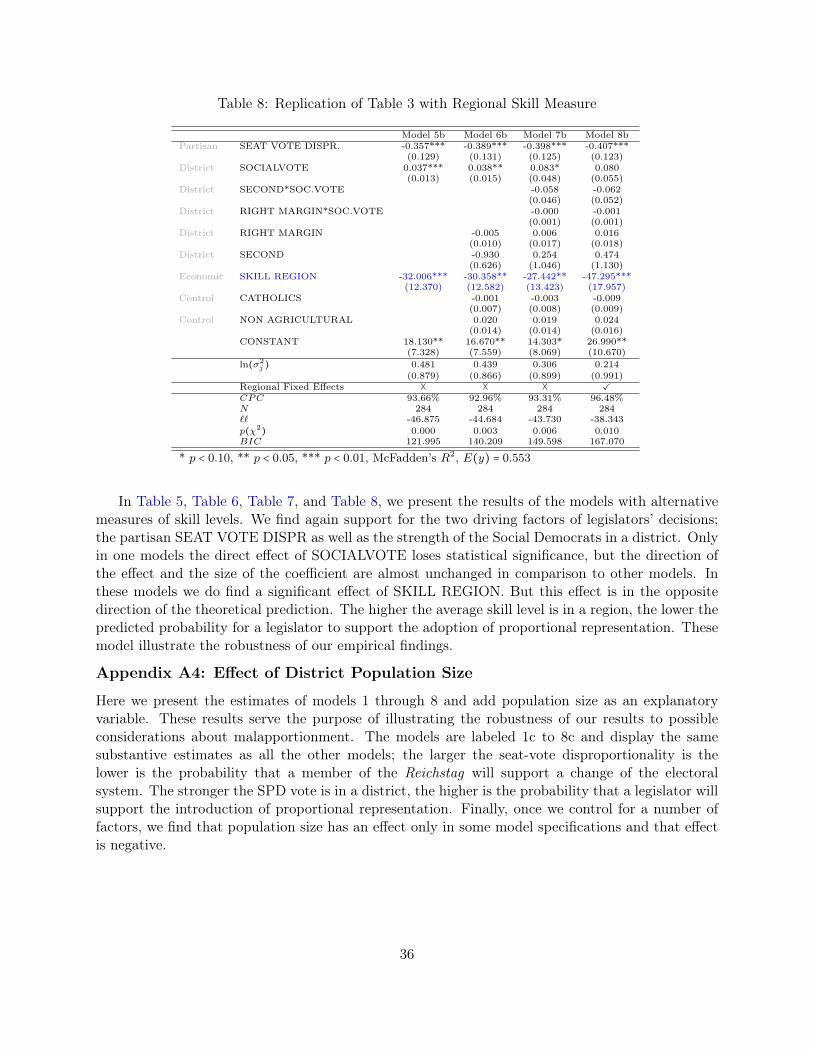
Table 8: Replication of Table 3 with Regional Skill Measure
Model 5b Model 6b Model 7b Model 8bPartisan SEAT VOTE DISPR. -0.357*** -0.389*** -0.398*** -0.407***
(0.129) (0.131) (0.125) (0.123)District SOCIALVOTE 0.037*** 0.038** 0.083* 0.080
(0.013) (0.015) (0.048) (0.055)District SECOND*SOC.VOTE -0.058 -0.062
(0.046) (0.052)District RIGHT MARGIN*SOC.VOTE -0.000 -0.001
(0.001) (0.001)District RIGHT MARGIN -0.005 0.006 0.016
(0.010) (0.017) (0.018)District SECOND -0.930 0.254 0.474
(0.626) (1.046) (1.130)Economic SKILL REGION -32.006*** -30.358** -27.442** -47.295***
(12.370) (12.582) (13.423) (17.957)Control CATHOLICS -0.001 -0.003 -0.009
(0.007) (0.008) (0.009)Control NON AGRICULTURAL 0.020 0.019 0.024
(0.014) (0.014) (0.016)CONSTANT 18.130** 16.670** 14.303* 26.990**
(7.328) (7.559) (8.069) (10.670)ln(σ2
j ) 0.481 0.439 0.306 0.214(0.879) (0.866) (0.899) (0.991)
Regional Fixed Effects � � � ✓CPC 93.66% 92.96% 93.31% 96.48%N 284 284 284 284�� -46.875 -44.684 -43.730 -38.343p(χ2) 0.000 0.003 0.006 0.010BIC 121.995 140.209 149.598 167.070
* p < 0.10, ** p < 0.05, *** p < 0.01, McFadden’s R2, E(y) = 0.553
In Table 5, Table 6, Table 7, and Table 8, we present the results of the models with alternativemeasures of skill levels. We find again support for the two driving factors of legislators’ decisions;the partisan SEAT VOTE DISPR as well as the strength of the Social Democrats in a district. Onlyin one models the direct effect of SOCIALVOTE loses statistical significance, but the direction ofthe effect and the size of the coefficient are almost unchanged in comparison to other models. Inthese models we do find a significant effect of SKILL REGION. But this effect is in the oppositedirection of the theoretical prediction. The higher the average skill level is in a region, the lower thepredicted probability for a legislator to support the adoption of proportional representation. Thesemodel illustrate the robustness of our empirical findings.
Appendix A4: Effect of District Population Size
Here we present the estimates of models 1 through 8 and add population size as an explanatoryvariable. These results serve the purpose of illustrating the robustness of our results to possibleconsiderations about malapportionment. The models are labeled 1c to 8c and display the samesubstantive estimates as all the other models; the larger the seat-vote disproportionality is thelower is the probability that a member of the Reichstag will support a change of the electoralsystem. The stronger the SPD vote is in a district, the higher is the probability that a legislator willsupport the introduction of proportional representation. Finally, once we control for a number offactors, we find that population size has an effect only in some model specifications and that effectis negative.
36
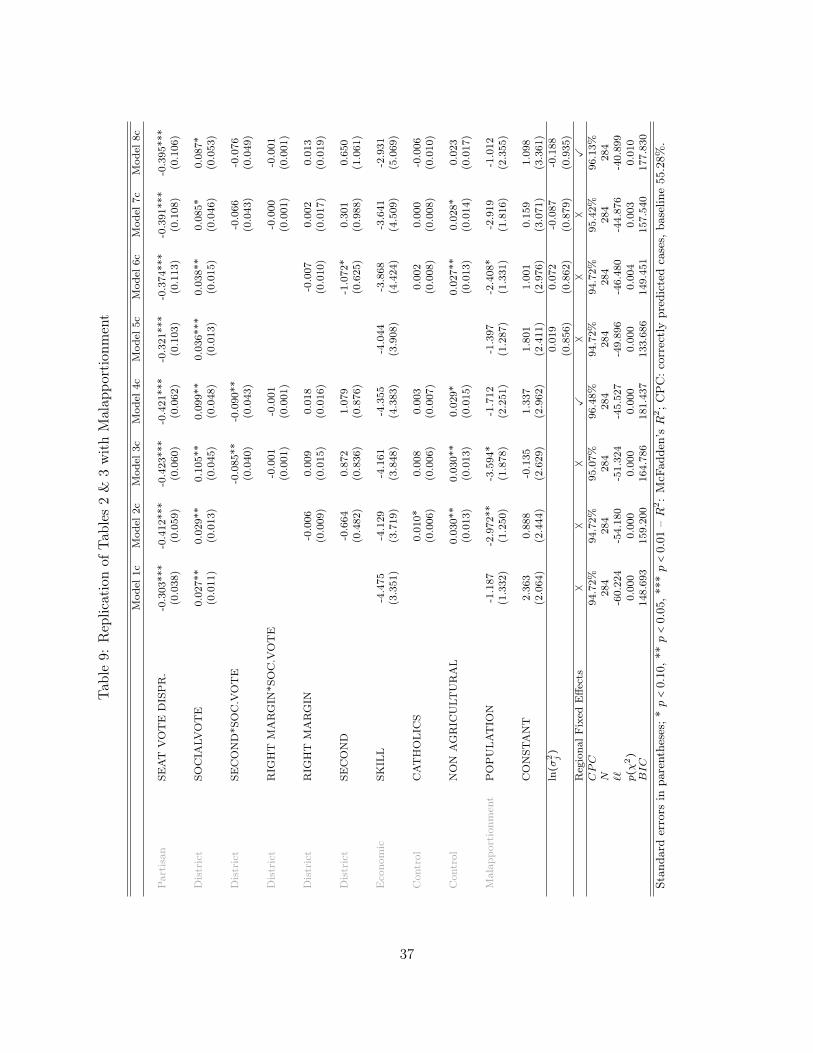
Tabl
e9:
Rep
licat
ion
ofTa
bles
2&
3w
ith
Mal
appo
rtio
nmen
t
Mod
el1c
Mod
el2c
Mod
el3c
Mod
el4c
Mod
el5c
Mod
el6c
Mod
el7c
Mod
el8c
Par
tisa
nSE
AT
VO
TE
DIS
PR
.-0
.303
***
-0.4
12**
*-0
.423
***
-0.4
21**
*-0
.321
***
-0.3
74**
*-0
.391
***
-0.3
95**
*(0
.038
)(0
.059
)(0
.060
)(0
.062
)(0
.103
)(0
.113
)(0
.108
)(0
.106
)
Dis
tric
tSO
CIA
LVO
TE
0.02
7**
0.02
9**
0.10
5**
0.09
9**
0.03
6***
0.03
8**
0.08
5*0.
087*
(0.0
11)
(0.0
13)
(0.0
45)
(0.0
48)
(0.0
13)
(0.0
15)
(0.0
46)
(0.0
53)
Dis
tric
tSE
CO
ND
*SO
C.V
OT
E-0
.085
**-0
.090
**-0
.066
-0.0
76(0
.040
)(0
.043
)(0
.043
)(0
.049
)
Dis
tric
tR
IGH
TM
AR
GIN
*SO
C.V
OT
E-0
.001
-0.0
01-0
.000
-0.0
01(0
.001
)(0
.001
)(0
.001
)(0
.001
)
Dis
tric
tR
IGH
TM
AR
GIN
-0.0
060.
009
0.01
8-0
.007
0.00
20.
013
(0.0
09)
(0.0
15)
(0.0
16)
(0.0
10)
(0.0
17)
(0.0
19)
Dis
tric
tSE
CO
ND
-0.6
640.
872
1.07
9-1
.072
*0.
301
0.65
0(0
.482
)(0
.836
)(0
.876
)(0
.625
)(0
.988
)(1
.061
)
Eco
nom
icSK
ILL
-4.4
75-4
.129
-4.1
61-4
.355
-4.0
44-3
.868
-3.6
41-2
.931
(3.3
51)
(3.7
19)
(3.8
48)
(4.3
83)
(3.9
08)
(4.4
24)
(4.5
09)
(5.0
69)
Con
trol
CAT
HO
LIC
S0.
010*
0.00
80.
003
0.00
20.
000
-0.0
06(0
.006
)(0
.006
)(0
.007
)(0
.008
)(0
.008
)(0
.010
)
Con
trol
NO
NA
GR
ICU
LTU
RA
L0.
030*
*0.
030*
*0.
029*
0.02
7**
0.02
8*0.
023
(0.0
13)
(0.0
13)
(0.0
15)
(0.0
13)
(0.0
14)
(0.0
17)
Mal
appo
rtio
nmen
tP
OP
ULAT
ION
-1.1
87-2
.972
**-3
.594
*-1
.712
-1.3
97-2
.408
*-2
.919
-1.0
12(1
.332
)(1
.250
)(1
.878
)(2
.251
)(1
.287
)(1
.331
)(1
.816
)(2
.355
)
CO
NST
AN
T2.
363
0.88
8-0
.135
1.33
71.
801
1.00
10.
159
1.09
8(2
.064
)(2
.444
)(2
.629
)(2
.962
)(2
.411
)(2
.976
)(3
.071
)(3
.361
)ln(σ2 j)
0.01
90.
072
-0.0
87-0
.188
(0.8
56)
(0.8
62)
(0.8
79)
(0.9
35)
Reg
iona
lFix
edE
ffect
s�
��
✓�
��
✓CPC
94.7
2%94
.72%
95.0
7%96
.48%
94.7
2%94
.72%
95.4
2%96
.13%
N28
428
428
428
428
428
428
428
4��
-60.
224
-54.
180
-51.
324
-45.
527
-49.
896
-46.
480
-44.
876
-40.
899
p(χ2)
0.00
00.
000
0.00
00.
000
0.00
00.
004
0.00
30.
010
BIC
148.
693
159.
200
164.
786
181.
437
133.
686
149.
451
157.
540
177.
830
Stan
dard
erro
rsin
pare
nthe
ses;
*p<0.
10,*
*p<0.
05,*
**p<0.
01–R
2:
McF
adde
n’sR
2;C
PC
:cor
rect
lypr
edic
ted
case
s,ba
selin
e55
.28%
.
37
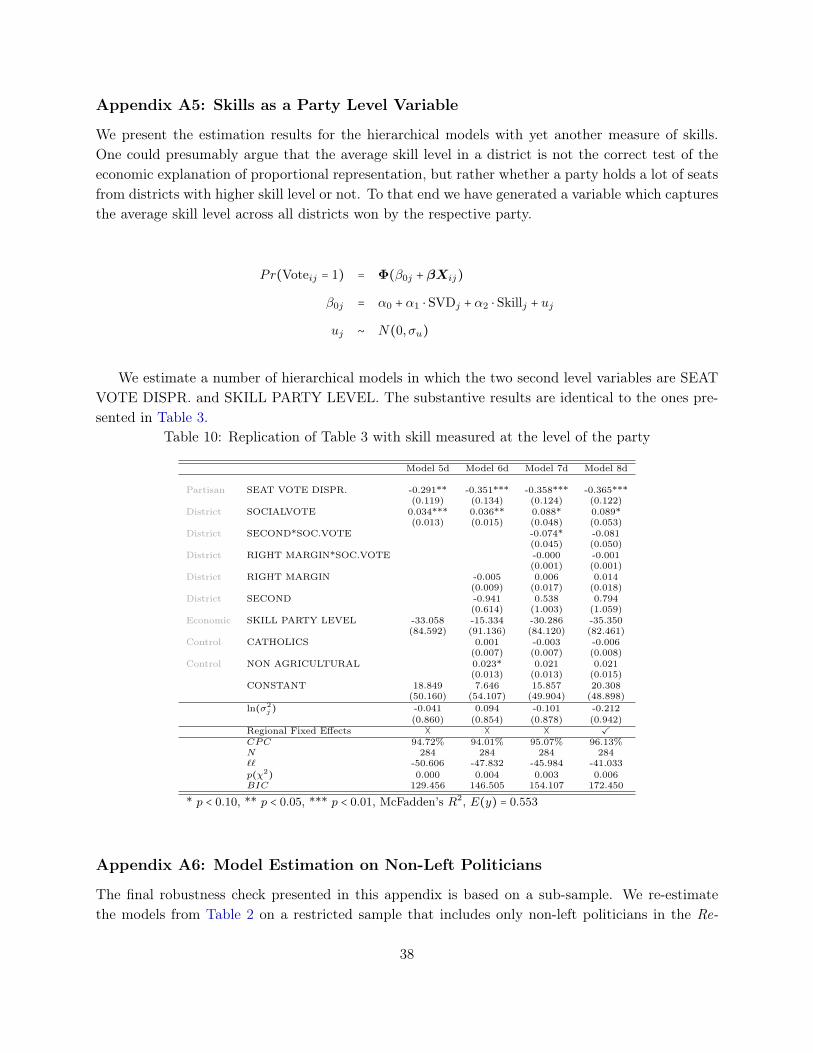
Appendix A5: Skills as a Party Level Variable
We present the estimation results for the hierarchical models with yet another measure of skills.One could presumably argue that the average skill level in a district is not the correct test of theeconomic explanation of proportional representation, but rather whether a party holds a lot of seatsfrom districts with higher skill level or not. To that end we have generated a variable which capturesthe average skill level across all districts won by the respective party.
Pr(Voteij = 1) = Φ(β0j +βXij)β0j = α0 + α1 ⋅ SVDj + α2 ⋅ Skillj + uj
uj ∼ N(0,σu)
We estimate a number of hierarchical models in which the two second level variables are SEATVOTE DISPR. and SKILL PARTY LEVEL. The substantive results are identical to the ones pre-sented in Table 3.
Table 10: Replication of Table 3 with skill measured at the level of the party
Model 5d Model 6d Model 7d Model 8d
Partisan SEAT VOTE DISPR. -0.291** -0.351*** -0.358*** -0.365***(0.119) (0.134) (0.124) (0.122)
District SOCIALVOTE 0.034*** 0.036** 0.088* 0.089*(0.013) (0.015) (0.048) (0.053)
District SECOND*SOC.VOTE -0.074* -0.081(0.045) (0.050)
District RIGHT MARGIN*SOC.VOTE -0.000 -0.001(0.001) (0.001)
District RIGHT MARGIN -0.005 0.006 0.014(0.009) (0.017) (0.018)
District SECOND -0.941 0.538 0.794(0.614) (1.003) (1.059)
Economic SKILL PARTY LEVEL -33.058 -15.334 -30.286 -35.350(84.592) (91.136) (84.120) (82.461)
Control CATHOLICS 0.001 -0.003 -0.006(0.007) (0.007) (0.008)
Control NON AGRICULTURAL 0.023* 0.021 0.021(0.013) (0.013) (0.015)
CONSTANT 18.849 7.646 15.857 20.308(50.160) (54.107) (49.904) (48.898)
ln(σ2j ) -0.041 0.094 -0.101 -0.212
(0.860) (0.854) (0.878) (0.942)Regional Fixed Effects � � � ✓CPC 94.72% 94.01% 95.07% 96.13%N 284 284 284 284�� -50.606 -47.832 -45.984 -41.033p(χ2) 0.000 0.004 0.003 0.006BIC 129.456 146.505 154.107 172.450
* p < 0.10, ** p < 0.05, *** p < 0.01, McFadden’s R2, E(y) = 0.553
Appendix A6: Model Estimation on Non-Left Politicians
The final robustness check presented in this appendix is based on a sub-sample. We re-estimatethe models from Table 2 on a restricted sample that includes only non-left politicians in the Re-
38
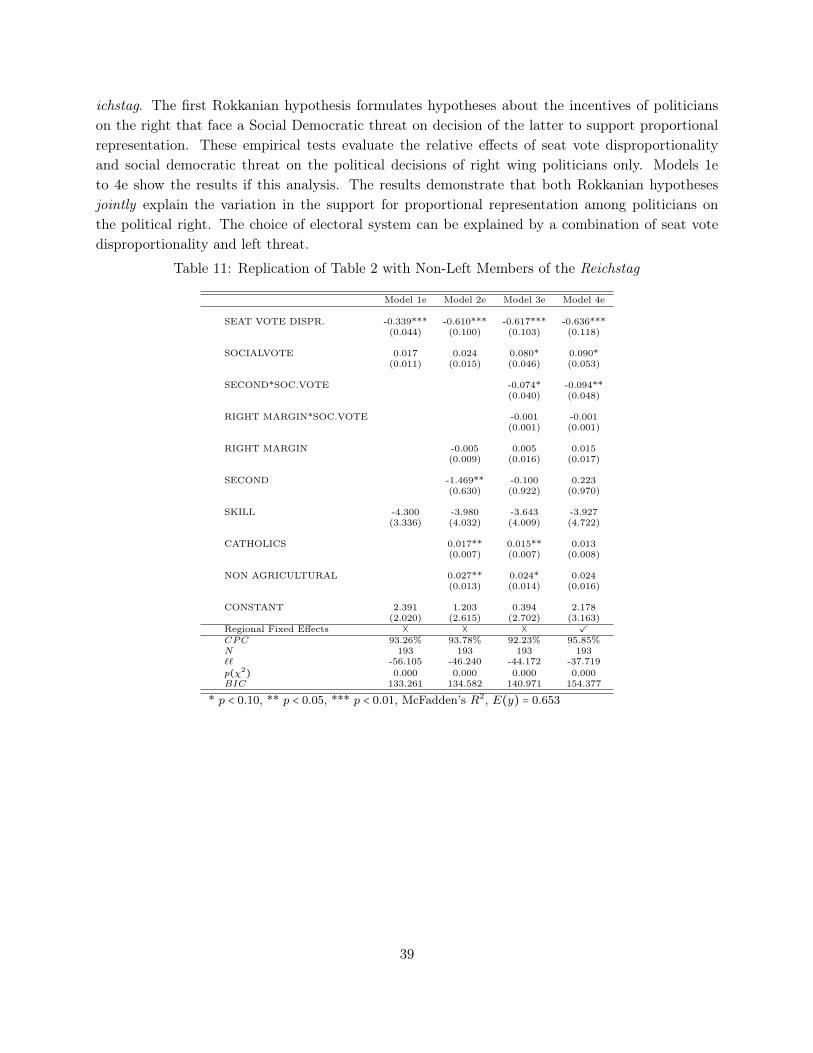
ichstag. The first Rokkanian hypothesis formulates hypotheses about the incentives of politicianson the right that face a Social Democratic threat on decision of the latter to support proportionalrepresentation. These empirical tests evaluate the relative effects of seat vote disproportionalityand social democratic threat on the political decisions of right wing politicians only. Models 1eto 4e show the results if this analysis. The results demonstrate that both Rokkanian hypothesesjointly explain the variation in the support for proportional representation among politicians onthe political right. The choice of electoral system can be explained by a combination of seat votedisproportionality and left threat.
Table 11: Replication of Table 2 with Non-Left Members of the Reichstag
Model 1e Model 2e Model 3e Model 4e
SEAT VOTE DISPR. -0.339*** -0.610*** -0.617*** -0.636***(0.044) (0.100) (0.103) (0.118)
SOCIALVOTE 0.017 0.024 0.080* 0.090*(0.011) (0.015) (0.046) (0.053)
SECOND*SOC.VOTE -0.074* -0.094**(0.040) (0.048)
RIGHT MARGIN*SOC.VOTE -0.001 -0.001(0.001) (0.001)
RIGHT MARGIN -0.005 0.005 0.015(0.009) (0.016) (0.017)
SECOND -1.469** -0.100 0.223(0.630) (0.922) (0.970)
SKILL -4.300 -3.980 -3.643 -3.927(3.336) (4.032) (4.009) (4.722)
CATHOLICS 0.017** 0.015** 0.013(0.007) (0.007) (0.008)
NON AGRICULTURAL 0.027** 0.024* 0.024(0.013) (0.014) (0.016)
CONSTANT 2.391 1.203 0.394 2.178(2.020) (2.615) (2.702) (3.163)
Regional Fixed Effects � � � ✓CPC 93.26% 93.78% 92.23% 95.85%N 193 193 193 193�� -56.105 -46.240 -44.172 -37.719p(χ2) 0.000 0.000 0.000 0.000BIC 133.261 134.582 140.971 154.377
* p < 0.10, ** p < 0.05, *** p < 0.01, McFadden’s R2, E(y) = 0.653
39
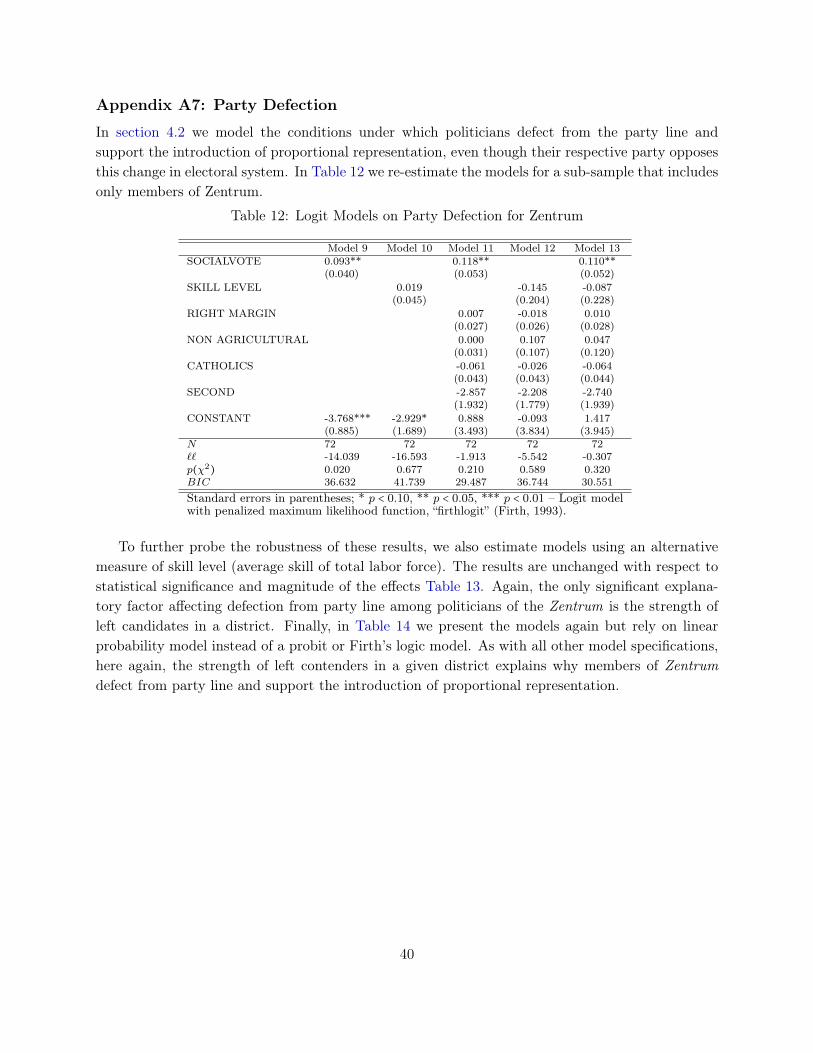
Appendix A7: Party Defection
In section 4.2 we model the conditions under which politicians defect from the party line andsupport the introduction of proportional representation, even though their respective party opposesthis change in electoral system. In Table 12 we re-estimate the models for a sub-sample that includesonly members of Zentrum.
Table 12: Logit Models on Party Defection for Zentrum
Model 9 Model 10 Model 11 Model 12 Model 13SOCIALVOTE 0.093** 0.118** 0.110**
(0.040) (0.053) (0.052)SKILL LEVEL 0.019 -0.145 -0.087
(0.045) (0.204) (0.228)RIGHT MARGIN 0.007 -0.018 0.010
(0.027) (0.026) (0.028)NON AGRICULTURAL 0.000 0.107 0.047
(0.031) (0.107) (0.120)CATHOLICS -0.061 -0.026 -0.064
(0.043) (0.043) (0.044)SECOND -2.857 -2.208 -2.740
(1.932) (1.779) (1.939)CONSTANT -3.768*** -2.929* 0.888 -0.093 1.417
(0.885) (1.689) (3.493) (3.834) (3.945)N 72 72 72 72 72�� -14.039 -16.593 -1.913 -5.542 -0.307p(χ2) 0.020 0.677 0.210 0.589 0.320BIC 36.632 41.739 29.487 36.744 30.551Standard errors in parentheses; * p < 0.10, ** p < 0.05, *** p < 0.01 – Logit modelwith penalized maximum likelihood function, “firthlogit” (Firth, 1993).
To further probe the robustness of these results, we also estimate models using an alternativemeasure of skill level (average skill of total labor force). The results are unchanged with respect tostatistical significance and magnitude of the effects Table 13. Again, the only significant explana-tory factor affecting defection from party line among politicians of the Zentrum is the strength ofleft candidates in a district. Finally, in Table 14 we present the models again but rely on linearprobability model instead of a probit or Firth’s logic model. As with all other model specifications,here again, the strength of left contenders in a given district explains why members of Zentrumdefect from party line and support the introduction of proportional representation.
40
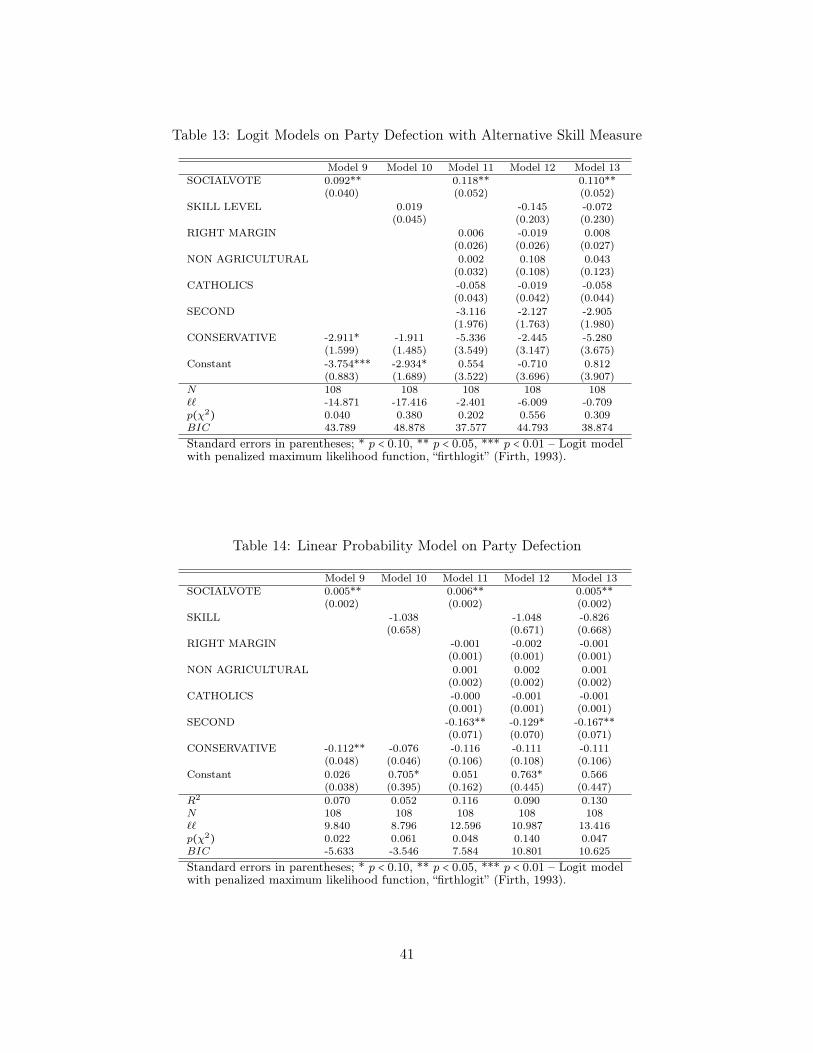
Table 13: Logit Models on Party Defection with Alternative Skill Measure
Model 9 Model 10 Model 11 Model 12 Model 13SOCIALVOTE 0.092** 0.118** 0.110**
(0.040) (0.052) (0.052)SKILL LEVEL 0.019 -0.145 -0.072
(0.045) (0.203) (0.230)RIGHT MARGIN 0.006 -0.019 0.008
(0.026) (0.026) (0.027)NON AGRICULTURAL 0.002 0.108 0.043
(0.032) (0.108) (0.123)CATHOLICS -0.058 -0.019 -0.058
(0.043) (0.042) (0.044)SECOND -3.116 -2.127 -2.905
(1.976) (1.763) (1.980)CONSERVATIVE -2.911* -1.911 -5.336 -2.445 -5.280
(1.599) (1.485) (3.549) (3.147) (3.675)Constant -3.754*** -2.934* 0.554 -0.710 0.812
(0.883) (1.689) (3.522) (3.696) (3.907)N 108 108 108 108 108�� -14.871 -17.416 -2.401 -6.009 -0.709p(χ2) 0.040 0.380 0.202 0.556 0.309BIC 43.789 48.878 37.577 44.793 38.874Standard errors in parentheses; * p < 0.10, ** p < 0.05, *** p < 0.01 – Logit modelwith penalized maximum likelihood function, “firthlogit” (Firth, 1993).
Table 14: Linear Probability Model on Party Defection
Model 9 Model 10 Model 11 Model 12 Model 13SOCIALVOTE 0.005** 0.006** 0.005**
(0.002) (0.002) (0.002)SKILL -1.038 -1.048 -0.826
(0.658) (0.671) (0.668)RIGHT MARGIN -0.001 -0.002 -0.001
(0.001) (0.001) (0.001)NON AGRICULTURAL 0.001 0.002 0.001
(0.002) (0.002) (0.002)CATHOLICS -0.000 -0.001 -0.001
(0.001) (0.001) (0.001)SECOND -0.163** -0.129* -0.167**
(0.071) (0.070) (0.071)CONSERVATIVE -0.112** -0.076 -0.116 -0.111 -0.111
(0.048) (0.046) (0.106) (0.108) (0.106)Constant 0.026 0.705* 0.051 0.763* 0.566
(0.038) (0.395) (0.162) (0.445) (0.447)R2 0.070 0.052 0.116 0.090 0.130N 108 108 108 108 108�� 9.840 8.796 12.596 10.987 13.416p(χ2) 0.022 0.061 0.048 0.140 0.047BIC -5.633 -3.546 7.584 10.801 10.625Standard errors in parentheses; * p < 0.10, ** p < 0.05, *** p < 0.01 – Logit modelwith penalized maximum likelihood function, “firthlogit” (Firth, 1993).
41
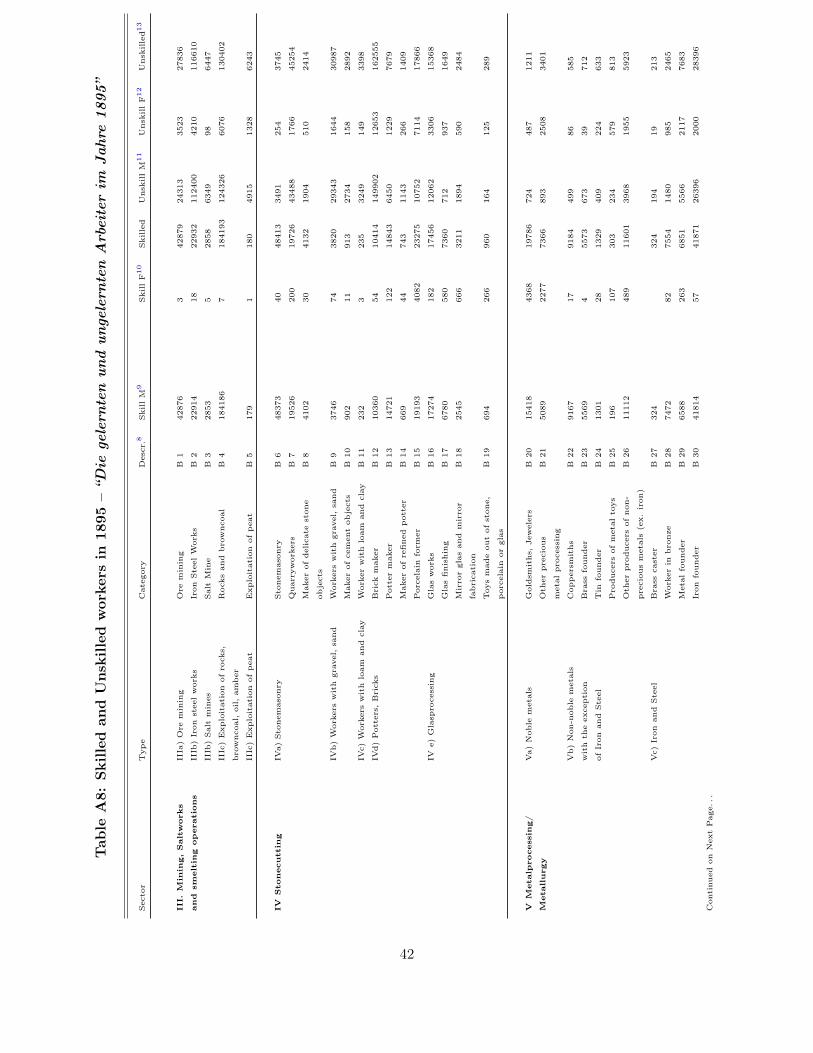
Tab
leA
8:Sk
illed
and
Uns
kille
dw
orke
rsin
1895
–“D
iege
lern
ten
und
unge
lern
ten
Arb
eite
rim
Jahr
e18
95”
Sec
tor
Typ
eC
ateg
ory
Des
cr.8
Ski
llM
9Ski
llF10
Ski
lled
Unsk
illM
11
Unsk
illF12
Unsk
ille
d13
III.
Min
ing,
Sal
twor
ks
IIIa
)O
rem
inin
gO
rem
inin
gB
142
876
342
879
2431
335
2327
836
and
smel
ting
oper
atio
ns
IIIb
)Ir
onst
eelw
orks
Iron
Ste
elW
orks
B2
2291
418
2293
211
2400
4210
1166
10
IIIb
)Sal
tm
ines
Sal
tM
ine
B3
2853
528
5863
4998
6447
IIIc
)Exp
loitat
ion
ofro
cks,
Roc
ksan
dbro
wnco
alB
418
4186
718
4193
1243
2660
7613
0402
bro
wnco
al,oi
l,am
ber
IIIc
)Exp
loitat
ion
ofpea
tExp
loitat
ion
ofpea
tB
517
91
180
4915
1328
6243
IVSto
nec
utt
ing
IVa)
Sto
nem
ason
rySto
nem
ason
ryB
648
373
4048
413
3491
254
3745
Quar
ryw
orke
rsB
719
526
200
1972
643
488
1766
4525
4
Mak
erof
del
icat
est
one
B8
4102
3041
3219
0451
024
14
obje
cts
IVb)
Wor
kers
with
grav
el,sa
nd
Wor
kers
with
grav
el,sa
nd
B9
3746
7438
2029
343
1644
3098
7
Mak
erof
cem
ent
obje
cts
B10
902
1191
327
3415
828
92
IVc)
Wor
kers
with
loam
and
clay
Wor
ker
with
loam
and
clay
B11
232
323
532
4914
933
98
IVd)
Pot
ters
,B
rick
sB
rick
mak
erB
1210
360
5410
414
1499
0212
653
1625
55
Pot
ter
mak
erB
1314
721
122
1484
364
5012
2976
79
Mak
erof
refined
pot
ter
B14
669
4474
311
4326
614
09
Por
cela
info
rmer
B15
1919
340
8223
275
1075
271
1417
866
IVe)
Gla
spro
cess
ing
Gla
sw
orks
B16
1727
418
217
456
1206
233
0615
368
Gla
sfinis
hin
gB
1767
8058
073
6071
293
716
49
Mirro
rgl
asan
dm
irro
rB
1825
4566
632
1118
9459
024
84
fabrica
tion
Toy
sm
ade
out
ofst
one,
B19
694
266
960
164
125
289
por
cela
inor
glas
VM
etal
pro
cess
ing/
Va)
Nob
lem
etal
sG
oldsm
iths,
Jew
eler
sB
2015
418
4368
1978
672
448
712
11
Met
allu
rgy
Oth
erpre
ciou
sB
2150
8922
7773
6689
325
0834
01
met
alpro
cess
ing
Vb)
Non
-nob
lem
etal
sC
opper
smiths
B22
9167
1791
8449
986
585
with
the
exce
ption
Bra
ssfo
under
B23
5569
455
7367
339
712
ofIr
onan
dSte
elT
info
under
B24
1301
2813
2940
922
463
3
Pro
duce
rsof
met
alto
ysB
2519
610
730
323
457
981
3
Oth
erpro
duce
rsof
non
-B
2611
112
489
1160
139
6819
5559
23
pre
ciou
sm
etal
s(e
x.iron
)
Vc)
Iron
and
Ste
elB
rass
cast
erB
2732
432
419
419
213
Wor
ker
inbro
nze
B28
7472
8275
5414
8098
524
65
Met
alfo
under
B29
6588
263
6851
5566
2117
7683
Iron
founder
B30
4181
457
4187
126
396
2000
2839
6
Con
tinu
edon
Nex
tPag
e...
42
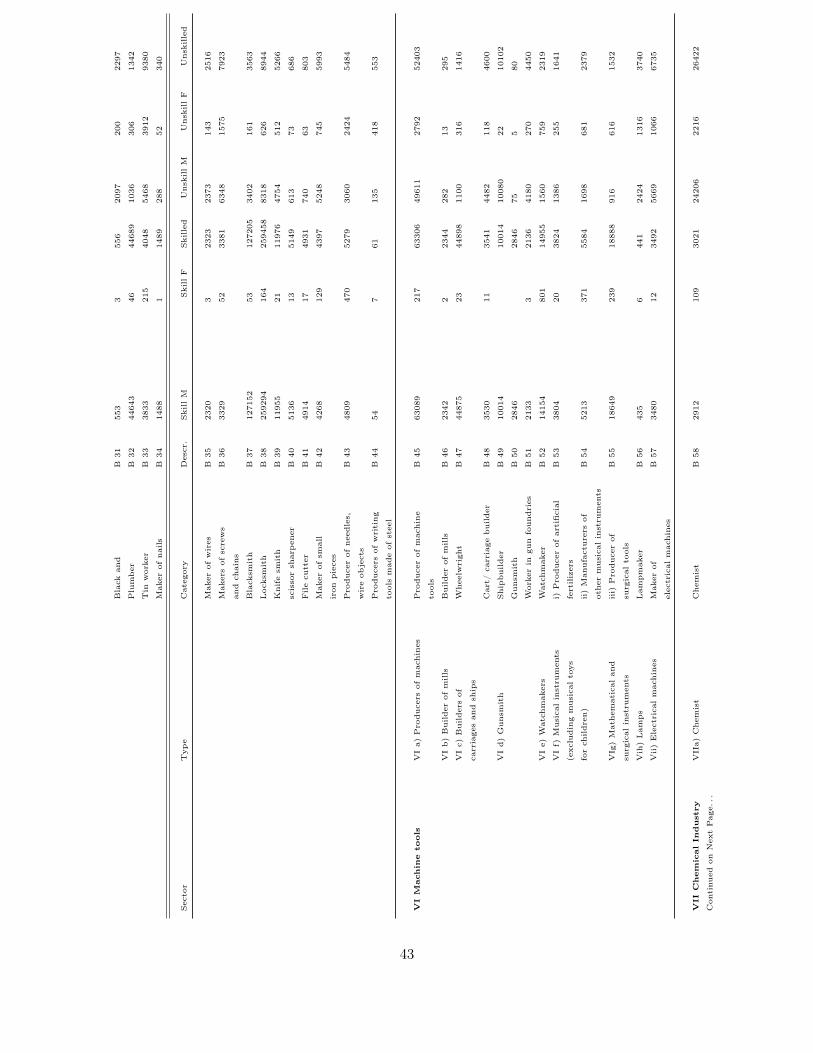
Bla
ckan
dB
3155
33
556
2097
200
2297
Plu
mber
B32
4464
346
4468
910
3630
613
42
Tin
wor
ker
B33
3833
215
4048
5468
3912
9380
Mak
erof
nai
lsB
3414
881
1489
288
5234
0
Sec
tor
Typ
eC
ateg
ory
Des
cr.
Ski
llM
Ski
llF
Ski
lled
Unsk
illM
Unsk
illF
Unsk
ille
d
Mak
erof
wires
B35
2320
323
2323
7314
325
16
Mak
ers
ofsc
rew
sB
3633
2952
3381
6348
1575
7923
and
chai
ns
Bla
cksm
ith
B37
1271
5253
1272
0534
0216
135
63
Loc
ksm
ith
B38
2592
9416
425
9458
8318
626
8944
Knife
smith
B39
1195
521
1197
647
5451
252
66
scis
sor
shar
pen
erB
4051
3613
5149
613
7368
6
File
cutt
erB
4149
1417
4931
740
6380
3
Mak
erof
smal
lB
4242
6812
943
9752
4874
559
93
iron
pie
ces
Pro
duce
rof
nee
dle
s,B
4348
0947
052
7930
6024
2454
84
wire
obje
cts
Pro
duce
rsof
writing
B44
547
6113
541
855
3
tool
sm
ade
ofst
eel
VI
Mac
hin
eto
ols
VI
a)Pro
duce
rsof
mac
hin
esPro
duce
rof
mac
hin
eB
4563
089
217
6330
649
611
2792
5240
3
tool
s
VI
b)
Builder
ofm
ills
Builder
ofm
ills
B46
2342
223
4428
213
295
VI
c)B
uilder
sof
Whee
lwrigh
tB
4744
875
2344
898
1100
316
1416
carr
iage
san
dsh
ips
Car
t/ca
rria
gebuilder
B48
3530
1135
4144
8211
846
00
VI
d)
Gunsm
ith
Ship
builder
B49
1001
410
014
1008
022
1010
2
Gunsm
ith
B50
2846
2846
755
80
Wor
ker
ingu
nfo
undries
B51
2133
321
3641
8027
044
50
VI
e)W
atch
mak
ers
Wat
chm
aker
B52
1415
480
114
955
1560
759
2319
VI
f)M
usi
calin
stru
men
tsi)
Pro
duce
rof
artifici
alB
5338
0420
3824
1386
255
1641
(exc
ludin
gm
usi
calto
ysfe
rtiliz
ers
for
childre
n)
ii)
Man
ufa
cture
rsof
B54
5213
371
5584
1698
681
2379
other
musi
calin
stru
men
ts
VIg
)M
athem
atic
alan
diii)
Pro
duce
rof
B55
1864
923
918
888
916
616
1532
surg
ical
inst
rum
ents
surg
ical
tool
s
Vih
)Lam
ps
Lam
pm
aker
B56
435
644
124
2413
1637
40
Vii)
Ele
ctrica
lm
achin
esM
aker
ofB
5734
8012
3492
5669
1066
6735
elec
tric
alm
achin
es
VII
Chem
ical
Indust
ryV
IIa)
Chem
ist
Chem
ist
B58
2912
109
3021
2420
622
1626
422
Con
tinu
edon
Nex
tPag
e...
43
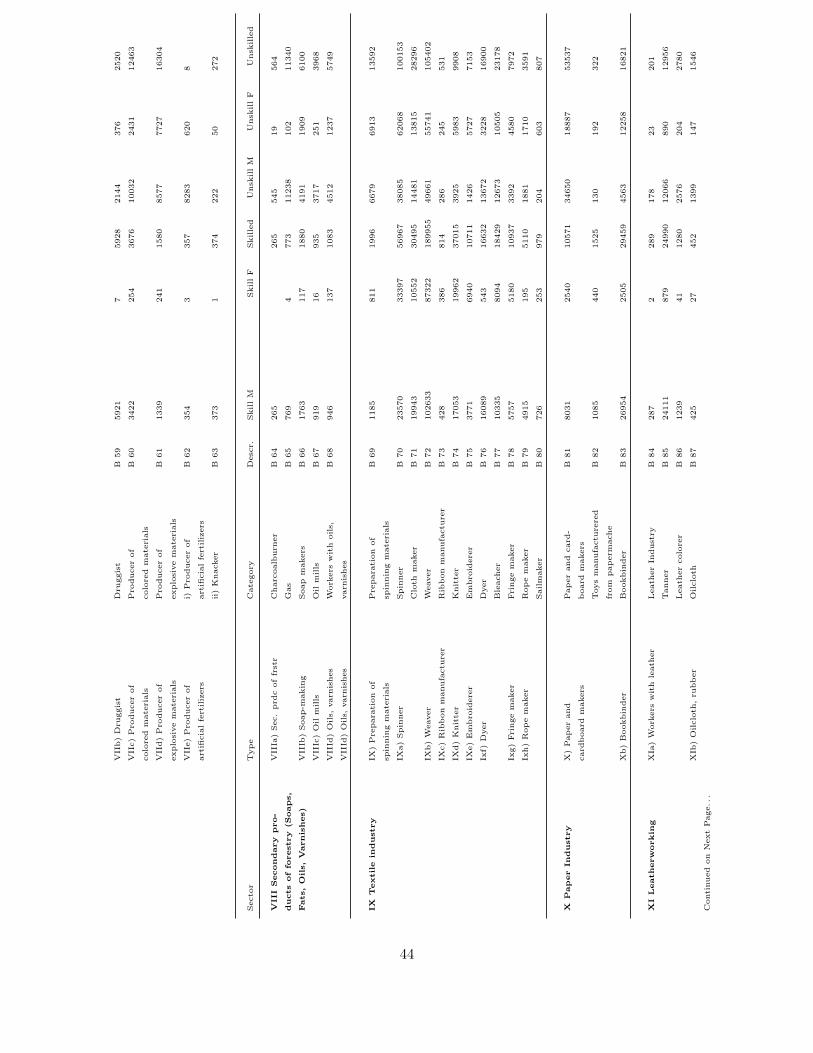
VII
b)
Dru
ggis
tD
rugg
ist
B59
5921
759
2821
4437
625
20
VII
c)Pro
duce
rof
Pro
duce
rof
B60
3422
254
3676
1003
224
3112
463
colo
red
mat
eria
lsco
lore
dm
ater
ials
VII
d)
Pro
duce
rof
Pro
duce
rof
B61
1339
241
1580
8577
7727
1630
4
explo
sive
mat
eria
lsex
plo
sive
mat
eria
ls
VII
e)Pro
duce
rof
i)Pro
duce
rof
B62
354
335
782
8362
08
artifici
alfe
rtiliz
ers
artifici
alfe
rtiliz
ers
ii)
Knac
ker
B63
373
137
422
250
272
Sec
tor
Typ
eC
ateg
ory
Des
cr.
Ski
llM
Ski
llF
Ski
lled
Unsk
illM
Unsk
illF
Unsk
ille
d
VII
ISec
ondar
ypro
-V
IIIa
)Sec
.prd
cof
frst
rC
har
coal
burn
erB
6426
526
554
519
564
duct
sof
fore
stry
(Soa
ps,
Gas
B65
769
477
311
238
102
1134
0
Fat
s,O
ils,
Var
nis
hes
)V
IIIb
)Soa
p-m
akin
gSoa
pm
aker
sB
6617
6311
718
8041
9119
0961
00
VII
Ic)
Oil
mills
Oil
mills
B67
919
1693
537
1725
139
68
VII
Id)
Oils,
varn
ishes
Wor
kers
with
oils
,B
6894
613
710
8345
1212
3757
49
VII
Id)
Oils,
varn
ishes
varn
ishes
IXTex
tile
indust
ryIX
)Pre
par
atio
nof
Pre
par
atio
nof
B69
1185
811
1996
6679
6913
1359
2
spin
nin
gm
ater
ials
spin
nin
gm
ater
ials
IXa)
Spin
ner
Spin
ner
B70
2357
033
397
5696
738
085
6206
810
0153
Clo
thm
aker
B71
1994
310
552
3049
514
481
1381
528
296
IXb)
Wea
ver
Wea
ver
B72
1026
3387
322
1899
5549
661
5574
110
5402
IXc)
Rib
bon
man
ufa
cture
rR
ibbon
man
ufa
cture
rB
7342
838
681
428
624
553
1
IXd)
Knitte
rK
nitte
rB
7417
053
1996
237
015
3925
5983
9908
IXe)
Em
bro
ider
erEm
bro
ider
erB
7537
7169
4010
711
1426
5727
7153
Ixf)
Dye
rD
yer
B76
1608
954
316
632
1367
232
2816
900
Ble
acher
B77
1033
580
9418
429
1267
310
505
2317
8
Ixg)
Fringe
mak
erFringe
mak
erB
7857
5751
8010
937
3392
4580
7972
Ixh)
Rop
em
aker
Rop
em
aker
B79
4915
195
5110
1881
1710
3591
Sai
lmak
erB
8072
625
397
920
460
380
7
XPap
erIn
dust
ryX
)Pap
eran
dPap
eran
dca
rd-
B81
8031
2540
1057
134
650
1888
753
537
card
boa
rdm
aker
sboa
rdm
aker
s
Toy
sm
anufa
cture
red
B82
1085
440
1525
130
192
322
from
pap
erm
ache
Xb)
Boo
kbin
der
Boo
kbin
der
B83
2695
425
0529
459
4563
1225
816
821
XI
Lea
ther
wor
kin
gX
Ia)
Wor
kers
with
leat
her
Lea
ther
Indust
ryB
8428
72
289
178
2320
1
Tan
ner
B85
2411
187
924
990
1206
689
012
956
Lea
ther
colo
rer
B86
1239
4112
8025
7620
427
80
XIb
)O
ilcl
oth,ru
bber
Oilcl
oth
B87
425
2745
213
9914
715
46
Con
tinu
edon
Nex
tPag
e...
44
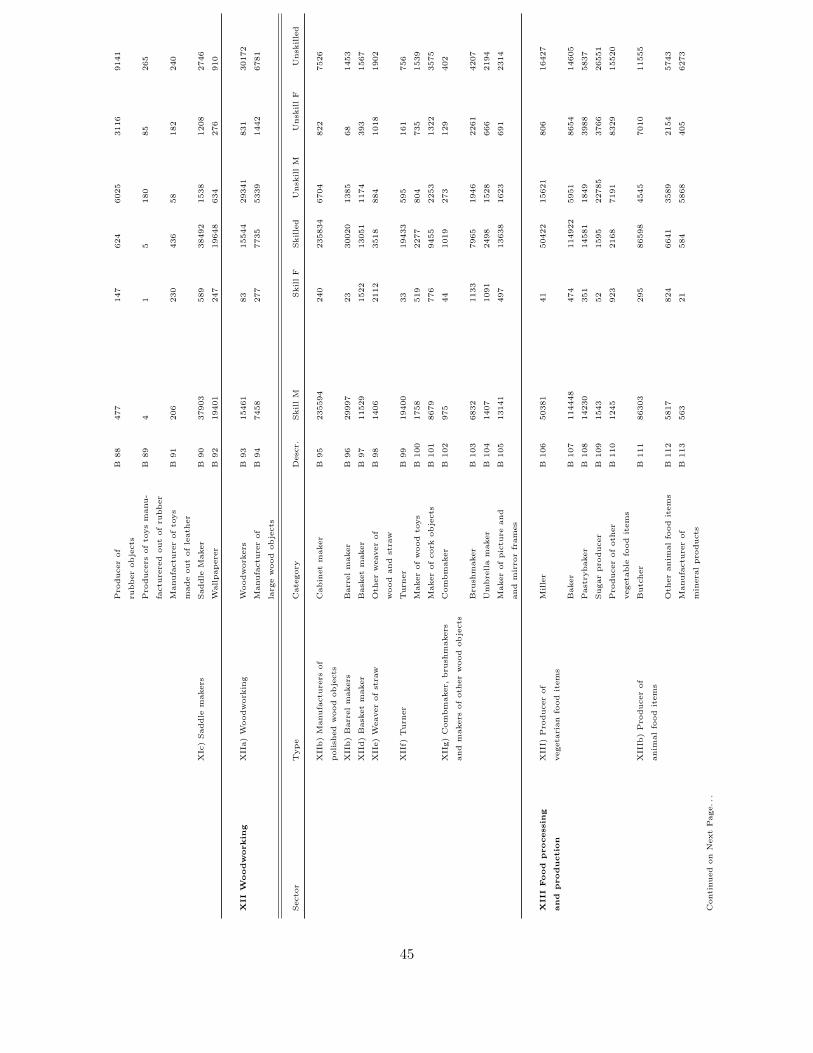
Pro
duce
rof
B88
477
147
624
6025
3116
9141
rubber
obje
cts
Pro
duce
rsof
toys
man
u-
B89
41
518
085
265
fact
ure
red
out
ofru
bber
Man
ufa
cture
rof
toys
B91
206
230
436
5818
224
0
mad
eou
tof
leat
her
XIc
)Sad
dle
mak
ers
Sad
dle
Mak
erB
9037
903
589
3849
215
3812
0827
46
Wal
lpap
erer
B92
1940
124
719
648
634
276
910
XII
Woodw
orkin
gX
IIa)
Woo
dw
orki
ng
Woo
dw
orke
rsB
9315
461
8315
544
2934
183
130
172
Man
ufa
cture
rof
B94
7458
277
7735
5339
1442
6781
larg
ew
ood
obje
cts
Sec
tor
Typ
eC
ateg
ory
Des
cr.
Ski
llM
Ski
llF
Ski
lled
Unsk
illM
Unsk
illF
Unsk
ille
d
XII
b)
Man
ufa
cture
rsof
Cab
inet
mak
erB
9523
5594
240
2358
3467
0482
275
26
pol
ished
woo
dob
ject
s
XII
b)
Bar
relm
aker
sB
arre
lm
aker
B96
2999
723
3002
013
8568
1453
XII
d)
Bas
ket
mak
erB
aske
tm
aker
B97
1152
915
2213
051
1174
393
1567
XII
e)W
eave
rof
stra
wO
ther
wea
ver
ofB
9814
0621
1235
1888
410
1819
02
woo
dan
dst
raw
XII
f)Turn
erTurn
erB
9919
400
3319
433
595
161
756
Mak
erof
woo
dto
ysB
100
1758
519
2277
804
735
1539
Mak
erof
cork
obje
cts
B10
186
7977
694
5522
5313
2235
75
XII
g)C
ombm
aker
,bru
shm
aker
sC
ombm
aker
B10
297
544
1019
273
129
402
and
mak
ers
ofot
her
woo
dob
ject
s
Bru
shm
aker
B10
368
3211
3379
6519
4622
6142
07
Um
bre
lla
mak
erB
104
1407
1091
2498
1528
666
2194
Mak
erof
pic
ture
and
B10
513
141
497
1363
816
2369
123
14
and
mirro
rfr
ames
XII
IFood
pro
cess
ing
XII
I)Pro
duce
rof
Mille
rB
106
5038
141
5042
215
621
806
1642
7
and
pro
duct
ion
vege
tarian
food
item
s
Bak
erB
107
1144
4847
411
4922
5951
8654
1460
5
Pas
tryb
aker
B10
814
230
351
1458
118
4939
8858
37
Suga
rpro
duce
rB
109
1543
5215
9522
785
3766
2655
1
Pro
duce
rof
other
B11
012
4592
321
6871
9183
2915
520
vege
table
food
item
s
XII
Ib)
Pro
duce
rof
Butc
her
B11
186
303
295
8659
845
4570
1011
555
anim
alfo
oditem
s
Oth
eran
imal
food
item
sB
112
5817
824
6641
3589
2154
5743
Man
ufa
cture
rof
B11
356
321
584
5868
405
6273
min
eral
pro
duct
s
Con
tinu
edon
Nex
tPag
e...
45
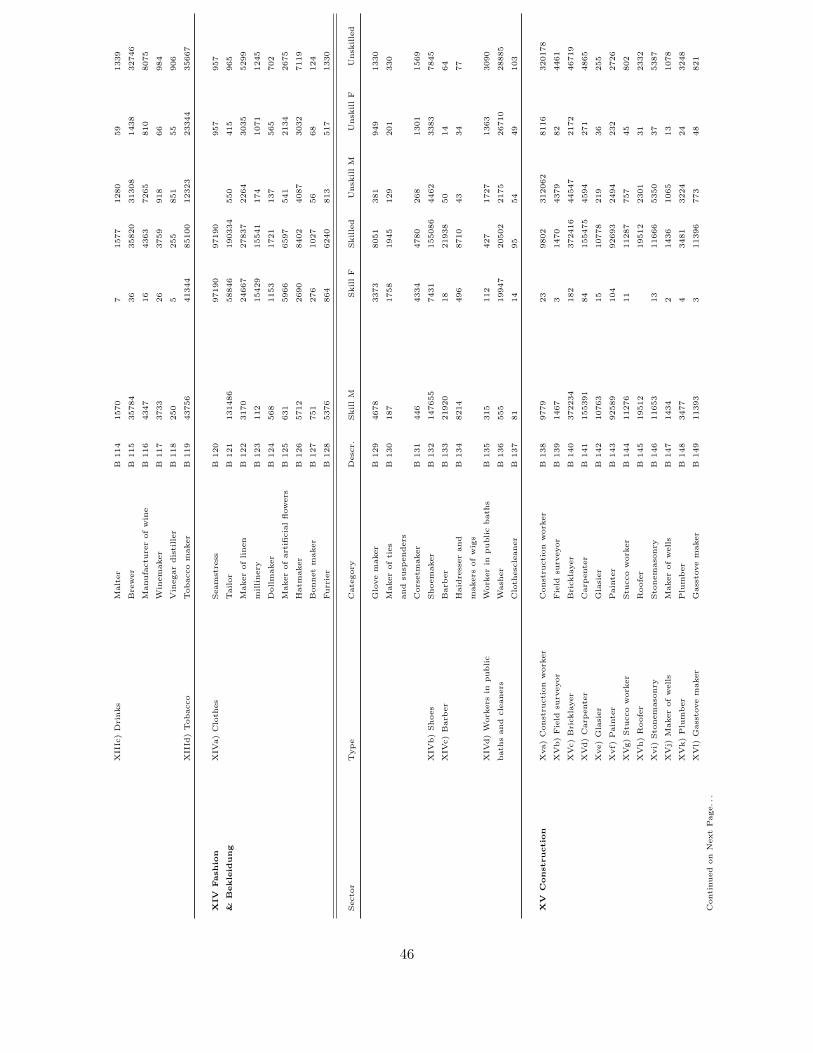
XII
Ic)
Drinks
Mal
ter
B11
415
707
1577
1280
5913
39
Bre
wer
B11
535
784
3635
820
3130
814
3832
746
Man
ufa
cture
rof
win
eB
116
4347
1643
6372
6581
080
75
Win
emak
erB
117
3733
2637
5991
866
984
Vin
egar
dis
tiller
B11
825
05
255
851
5590
6
XII
Id)
Tob
acco
Tob
acco
mak
erB
119
4375
641
344
8510
012
323
2334
435
667
XIV
Fas
hio
nX
IVa)
Clo
thes
Sea
mst
ress
B12
097
190
9719
095
795
7
&B
ekle
idung
Tai
lor
B12
113
1486
5884
619
0334
550
415
965
Mak
erof
linen
B12
231
7024
667
2783
722
6430
3552
99
milliner
yB
123
112
1542
915
541
174
1071
1245
Dol
lmak
erB
124
568
1153
1721
137
565
702
Mak
erof
artifici
alflow
ers
B12
563
159
6665
9754
121
3426
75
Hat
mak
erB
126
5712
2690
8402
4087
3032
7119
Bon
net
mak
erB
127
751
276
1027
5668
124
Furr
ier
B12
853
7686
462
4081
351
713
30
Sec
tor
Typ
eC
ateg
ory
Des
cr.
Ski
llM
Ski
llF
Ski
lled
Unsk
illM
Unsk
illF
Unsk
ille
d
Glo
vem
aker
B12
946
7833
7380
5138
194
913
30
Mak
erof
ties
B13
018
717
5819
4512
920
133
0
and
susp
ender
s
Cor
setm
aker
B13
144
643
3447
8026
813
0115
69
XIV
b)
Shoe
sShoe
mak
erB
132
1476
5574
3115
5086
4462
3383
7845
XIV
c)B
arber
Bar
ber
B13
321
920
1821
938
5014
64
Hai
dre
sser
and
B13
482
1449
687
1043
3477
mak
ers
ofw
igs
XIV
d)
Wor
kers
inpublic
Wor
ker
inpublic
bat
hs
B13
531
511
242
717
2713
6330
90
bat
hs
and
clea
ner
sW
asher
B13
655
519
947
2050
221
7526
710
2888
5
Clo
thes
clea
ner
B13
781
1495
5449
103
XV
Con
stru
ctio
nX
va)
Con
stru
ctio
nw
orke
rC
onst
ruct
ion
wor
ker
B13
897
7923
9802
3120
6281
1632
0178
XV
b)
Fie
ldsu
rvey
orFie
ldsu
rvey
orB
139
1467
314
7043
7982
4461
XVc)
Brick
laye
rB
rick
laye
rB
140
3722
3418
237
2416
4454
721
7246
719
XVd)
Car
pen
ter
Car
pen
ter
B14
115
5391
8415
5475
4594
271
4865
Xve
)G
lasi
erG
lasi
erB
142
1076
315
1077
821
936
255
Xvf
)Pai
nter
Pai
nter
B14
392
589
104
9269
324
9423
227
26
XVg)
Stu
cco
wor
ker
Stu
cco
wor
ker
B14
411
276
1111
287
757
4580
2
XV
h)
Roo
fer
Roo
fer
B14
519
512
1951
223
0131
2332
Xvi
)Sto
nem
ason
rySto
nem
ason
ryB
146
1165
313
1166
653
5037
5387
XV
j)M
aker
ofw
ells
Mak
erof
wel
lsB
147
1434
214
3610
6513
1078
XV
k)Plu
mber
Plu
mber
B14
834
774
3481
3224
2432
48
XV
l)G
asst
ove
mak
erG
asst
ove
mak
erB
149
1139
33
1139
677
348
821
Con
tinu
edon
Nex
tPag
e...
46
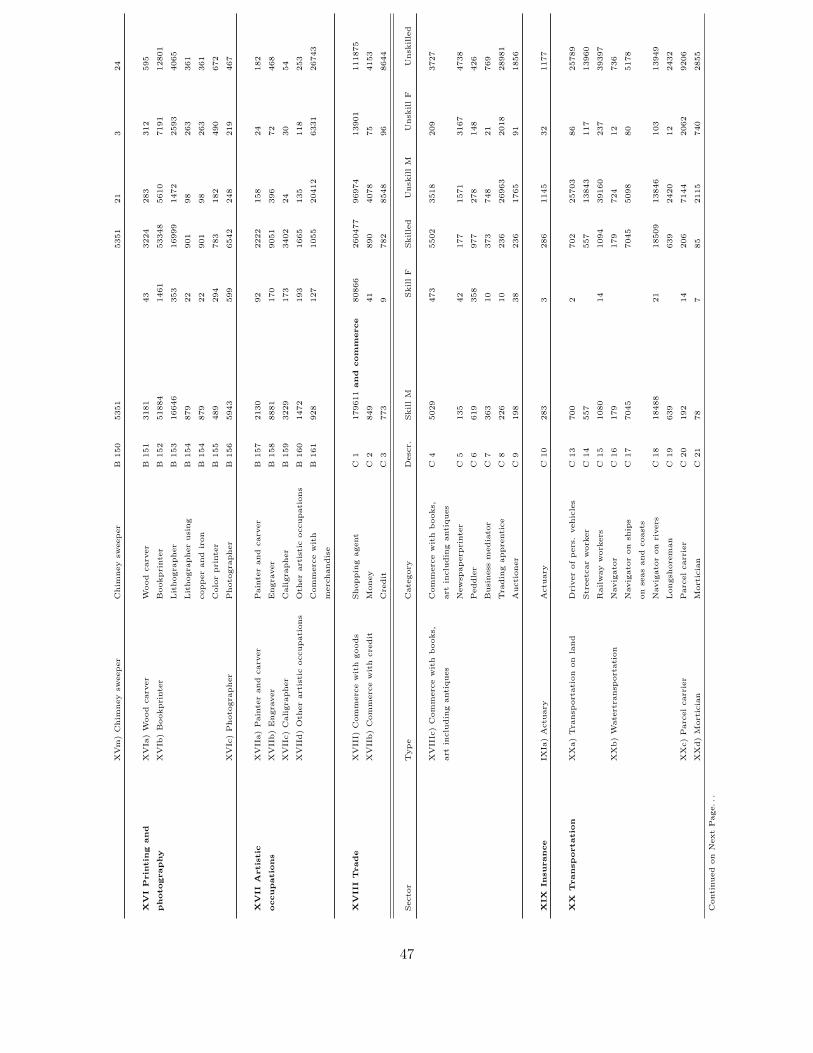
XVm
)C
him
ney
swee
per
Chim
ney
swee
per
B15
053
5153
5121
324
XV
IPri
nti
ng
and
XV
Ia)
Woo
dca
rver
Woo
dca
rver
B15
131
8143
3224
283
312
595
phot
ogra
phy
XV
Ib)
Boo
kprint
erB
ookp
rint
erB
152
5188
414
6153
348
5610
7191
1280
1
Lithog
rapher
B15
316
646
353
1699
914
7225
9340
65
Lithog
rapher
usi
ng
B15
487
922
901
9826
336
1
copper
and
iron
B15
487
922
901
9826
336
1
Col
orprint
erB
155
489
294
783
182
490
672
XV
Ic)
Phot
ogra
pher
Phot
ogra
pher
B15
659
4359
965
4224
821
946
7
XV
IIA
rtis
tic
XV
IIa)
Pai
nter
and
carv
erPai
nter
and
carv
erB
157
2130
9222
2215
824
182
occ
upat
ions
XV
IIb)
Engr
aver
Engr
aver
B15
888
8117
090
5139
672
468
XV
IIc)
Cal
igra
pher
Cal
igra
pher
B15
932
2917
334
0224
3054
XV
IId)
Oth
erar
tist
icoc
cupat
ions
Oth
erar
tist
icoc
cupat
ions
B16
014
7219
316
6513
511
825
3
Com
mer
cew
ith
B16
192
812
710
5520
412
6331
2674
3
mer
chan
dis
e
XV
III
Tra
de
XV
III)
Com
mer
cew
ith
good
sShop
pin
gag
ent
C1
1796
11an
dco
mm
erce
8086
626
0477
9697
413
901
1118
75
XV
IIb)
Com
mer
cew
ith
cred
itM
oney
C2
849
4189
040
7875
4153
Cre
dit
C3
773
978
285
4896
8644
Sec
tor
Typ
eC
ateg
ory
Des
cr.
Ski
llM
Ski
llF
Ski
lled
Unsk
illM
Unsk
illF
Unsk
ille
d
XV
IIIc
)C
omm
erce
with
boo
ks,
Com
mer
cew
ith
boo
ks,
C4
5029
473
5502
3518
209
3727
art
incl
udin
gan
tiqu
esar
tin
cludin
gan
tiqu
es
New
spap
erprint
erC
513
542
177
1571
3167
4738
Ped
dle
rC
661
935
897
727
814
842
6
Busi
nes
sm
edia
tor
C7
363
1037
374
821
769
Tra
din
gap
pre
ntic
eC
822
610
236
2696
320
1828
981
Auct
ioner
C9
198
3823
617
6591
1856
XIX
Insu
rance
IXIa
)A
ctuar
yA
ctuar
yC
1028
33
286
1145
3211
77
XX
Tra
nsp
orta
tion
XX
a)Tra
nsp
orta
tion
onla
nd
Drive
rof
per
s.ve
hic
les
C13
700
270
225
703
8625
789
Str
eetc
arw
orke
rC
1455
755
713
843
117
1396
0
Rai
lway
wor
kers
C15
1080
1410
9439
160
237
3939
7
XX
b)
Wat
ertr
ansp
orta
tion
Nav
igat
orC
1617
917
972
412
736
Nav
igat
oron
ship
sC
1770
4570
4550
9880
5178
onse
asan
dco
asts
Nav
igat
oron
rive
rsC
1818
488
2118
509
1384
610
313
949
Lon
gshor
eman
C19
639
639
2420
1224
32
XX
c)Par
celca
rrie
rPar
celca
rrie
rC
2019
214
206
7144
2062
9206
XX
d)
Mor
tici
anM
ortici
anC
2178
785
2115
740
2855
Con
tinu
edon
Nex
tPag
e...
47
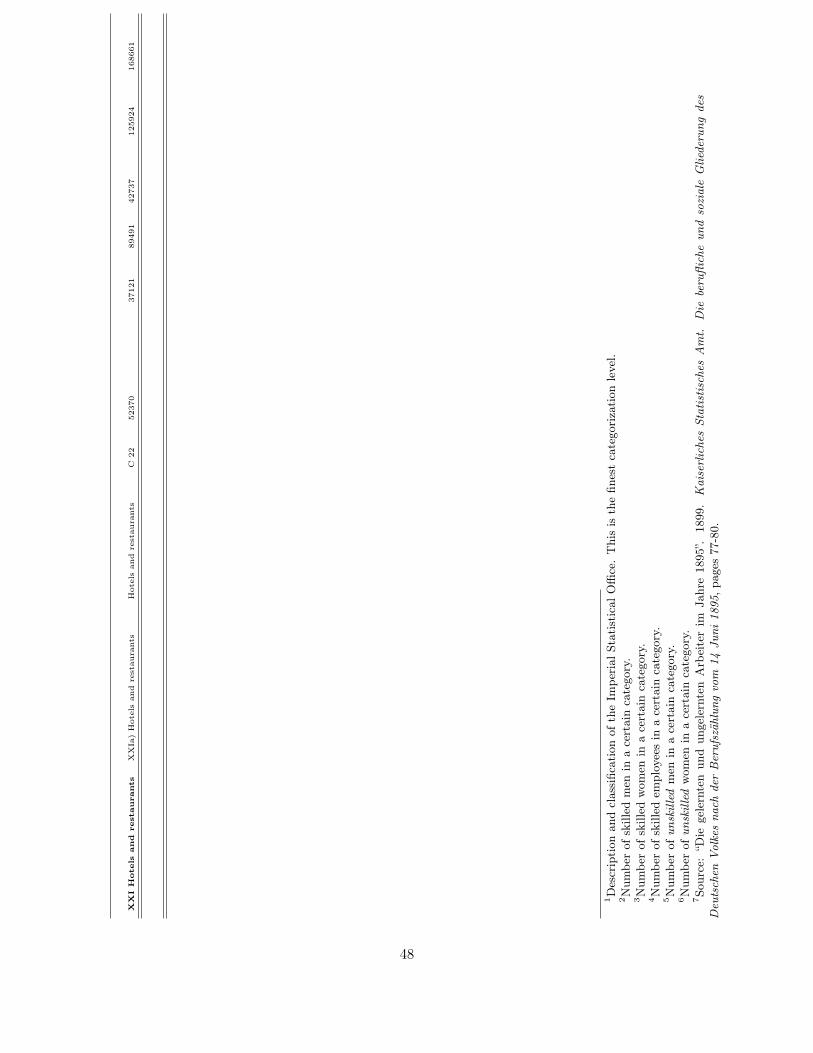
XX
IH
otel
san
dre
stau
rants
XX
Ia)
Hot
els
and
rest
aura
nts
Hot
els
and
rest
aura
nts
C22
5237
037
121
8949
142
737
1259
2416
8661
1D
escr
ipti
onan
dcl
assi
ficat
ion
ofth
eIm
peri
alSt
atis
tica
lOffi
ce.
Thi
sis
the
fines
tca
tego
riza
tion
leve
l.2N
umbe
rof
skill
edm
enin
ace
rtai
nca
tego
ry.
3N
umbe
rof
skill
edw
omen
ina
cert
ain
cate
gory
.4N
umbe
rof
skill
edem
ploy
ees
ina
cert
ain
cate
gory
.5N
umbe
rof
unsk
illed
men
ina
cert
ain
cate
gory
.6N
umbe
rof
unsk
illed
wom
enin
ace
rtai
nca
tego
ry.
7So
urce
:“D
iege
lern
ten
und
unge
lern
ten
Arb
eite
rim
Jahr
e18
95”.
1899
.K
aise
rlic
hes
Stat
istis
ches
Am
t.D
iebe
rufli
che
und
sozi
ale
Glie
deru
ngde
sD
euts
chen
Vol
kes
nach
der
Ber
ufsz
ählu
ngvo
m14
Juni
1895
,pag
es77
-80.
48


