Embed Size (px)
Citation preview

The Admixture Structure and Genetic Variation of theArchipelago of Cape Verde and Its Implications forAdmixture Mapping StudiesSandra Beleza1*¤, Joana Campos1, Jailson Lopes2,3, Isabel Ines Araujo3, Ana Hoppfer Almada3, Antonio
Correia e Silva3, Esteban J. Parra4, Jorge Rocha1,2,5
1 IPATIMUP, Instituto de Patologia e Imunologia Molecular da Universidade do Porto, Porto, Portugal, 2CIBIO, Centro de Investigacao em Biodiversidade e Recursos
Geneticos, Vairao, Portugal, 3Universidade de Cabo Verde, Cidade da Praia, Cabo Verde, 4Department of Anthropology, University of Toronto at Mississauga, Mississauga,
Ontario, Canada, 5Departamento de Biologia, Faculdade de Ciencias da Universidade do Porto, Porto, Portugal
Abstract
Recently admixed populations offer unique opportunities for studying human history and for elucidating the genetic basisof complex traits that differ in prevalence between human populations. Historical records, classical protein markers, andpreliminary genetic data indicate that the Cape Verde islands in West Africa are highly admixed and primarily descendedfrom European males and African females. However, little is known about the variation in admixture levels, admixturedynamics and genetic diversity across the islands, or about the potential of Cape Verde for admixture mapping studies. Wehave performed a detailed analysis of phenotypic and genetic variation in Cape Verde based on objective skin colormeasurements, socio-economic status (SES) evaluations and data for 50 autosomal, 34 X-chromosome, and 21 non-recombinant Y-chromosome (NRY) markers in 845 individuals from six islands of the archipelago. We find extensive geneticadmixture between European and African ancestral populations (mean West African ancestry = 0.57, sd = 0.08), withindividual African ancestry proportions varying considerably among the islands. African ancestry proportions calculatedwith X and Y-chromosome markers confirm that the pattern of admixture has been sex-biased. The high-resolution NRY-STRs reveal additional patterns of variation among the islands that are most consistent with differentiation after admixture.The differences in the autosomal admixture proportions are clearly evident in the skin color distribution across the islands(Pearson r = 0.54, P-value,2e–16). Despite this strong correlation, there are significant interactions between SES and skincolor that are independent of the relationship between skin color and genetic ancestry. The observed distributions ofadmixture, genetic variation and skin color and the relationship of skin color with SES relate to historical and social eventstaking place during the settlement history of Cape Verde, and have implications for the design of association studies usingthis population.
Citation: Beleza S, Campos J, Lopes J, Araujo II, Hoppfer Almada A, et al. (2012) The Admixture Structure and Genetic Variation of the Archipelago of Cape Verdeand Its Implications for Admixture Mapping Studies. PLoS ONE 7(11): e51103. doi:10.1371/journal.pone.0051103
Editor: John H. Relethford, State University of New York College at Oneonta, United States of America
Received August 8, 2012; Accepted October 30, 2012; Published November 30, 2012
Copyright: � 2012 Beleza et al. This is an open-access article distributed under the terms of the Creative Commons Attribution License, which permitsunrestricted use, distribution, and reproduction in any medium, provided the original author and source are credited.
Funding: This work was supported by the Portuguese Institution ‘‘Fundacao para a Ciencia e a Tecnologia’’ (FCT; PTDC/BIA-BDE/64044/2006). SB was supportedby FCT (SFRH/BPD/21887/2005). JL was supported by a Calouste Gulbenkian Foundation fellowship. The funders had no role in study design, data collection andanalysis, decision to publish, or preparation of the manuscript.
Competing Interests: The authors have declared that no competing interests exist.
* E-mail: [email protected]
¤ Current address: Genetics Department, Stanford University School of Medicine, Palo Alto, California, United States of America
Introduction
Populations with peculiar genetic structures offer unique
opportunities for studying human population history and for
understanding the genetic basis of complex traits. In particular,
recently admixed populations that trace their ancestry to multiple
continents are especially well suited for identifying genes for traits
and diseases that differ in prevalence between parental populations
[1]. Given their history of recent admixture, African-American
populations have been the focus of numerous population genetic
and admixture mapping studies [2–13]. Individual African
ancestry distributions of African-American population groups
from across the United States were shown to be highly skewed
toward higher values, with mean African contributions varying
between 70–95% [3,8,9,11–13]. Despite this skewed distribution
and less admixture than the theoretical optimal of 50% from each
parental population, African-Americans have been used success-
fully in mapping studies of complex genetic traits like white cell
count [6,10], body mass index [2], and diseases like prostate
cancer [4] and renal disease [5]. However, given the cultural and
genetic heterogeneity of admixed groups, it is essential that
multiple admixed populations are studied to fully appreciate the
relationship between the genetic, historical and environmental
determinants of those traits.
The population of Cape Verde has great potential for
admixture studies due to its well-documented history of contact
between European colonizers and enslaved African peoples. Cape
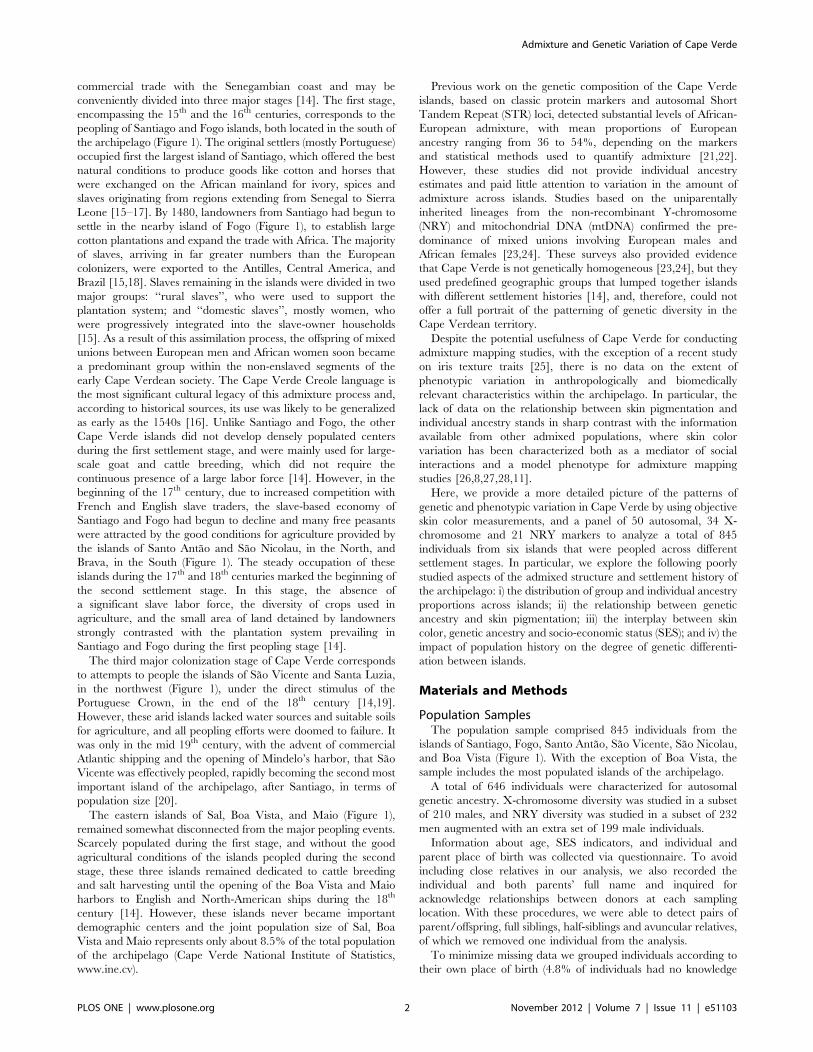
Verde is an archipelago located 450 km off the coast of Senegal,
comprising ten islands that were uninhabited when first discovered
by the Portuguese in the 1460s (Figure 1). The settlement process
ensuing the initial discovery was mainly driven by the prospects of
PLOS ONE | www.plosone.org 1 November 2012 | Volume 7 | Issue 11 | e51103
commercial trade with the Senegambian coast and may be
conveniently divided into three major stages [14]. The first stage,
encompassing the 15th and the 16th centuries, corresponds to the
peopling of Santiago and Fogo islands, both located in the south of
the archipelago (Figure 1). The original settlers (mostly Portuguese)
occupied first the largest island of Santiago, which offered the best
natural conditions to produce goods like cotton and horses that
were exchanged on the African mainland for ivory, spices and
slaves originating from regions extending from Senegal to Sierra
Leone [15–17]. By 1480, landowners from Santiago had begun to
settle in the nearby island of Fogo (Figure 1), to establish large
cotton plantations and expand the trade with Africa. The majority
of slaves, arriving in far greater numbers than the European
colonizers, were exported to the Antilles, Central America, and
Brazil [15,18]. Slaves remaining in the islands were divided in two
major groups: ‘‘rural slaves’’, who were used to support the
plantation system; and ‘‘domestic slaves’’, mostly women, who
were progressively integrated into the slave-owner households
[15]. As a result of this assimilation process, the offspring of mixed
unions between European men and African women soon became
a predominant group within the non-enslaved segments of the
early Cape Verdean society. The Cape Verde Creole language is
the most significant cultural legacy of this admixture process and,
according to historical sources, its use was likely to be generalized
as early as the 1540s [16]. Unlike Santiago and Fogo, the other
Cape Verde islands did not develop densely populated centers
during the first settlement stage, and were mainly used for large-
scale goat and cattle breeding, which did not require the
continuous presence of a large labor force [14]. However, in the
beginning of the 17th century, due to increased competition with
French and English slave traders, the slave-based economy of
Santiago and Fogo had begun to decline and many free peasants
were attracted by the good conditions for agriculture provided by
the islands of Santo Antao and Sao Nicolau, in the North, and
Brava, in the South (Figure 1). The steady occupation of these
islands during the 17th and 18th centuries marked the beginning of
the second settlement stage. In this stage, the absence of
a significant slave labor force, the diversity of crops used in
agriculture, and the small area of land detained by landowners
strongly contrasted with the plantation system prevailing in
Santiago and Fogo during the first peopling stage [14].
The third major colonization stage of Cape Verde corresponds
to attempts to people the islands of Sao Vicente and Santa Luzia,
in the northwest (Figure 1), under the direct stimulus of the
Portuguese Crown, in the end of the 18th century [14,19].
However, these arid islands lacked water sources and suitable soils
for agriculture, and all peopling efforts were doomed to failure. It
was only in the mid 19th century, with the advent of commercial
Atlantic shipping and the opening of Mindelo’s harbor, that Sao
Vicente was effectively peopled, rapidly becoming the second most
important island of the archipelago, after Santiago, in terms of
population size [20].
The eastern islands of Sal, Boa Vista, and Maio (Figure 1),
remained somewhat disconnected from the major peopling events.
Scarcely populated during the first stage, and without the good
agricultural conditions of the islands peopled during the second
stage, these three islands remained dedicated to cattle breeding
and salt harvesting until the opening of the Boa Vista and Maio
harbors to English and North-American ships during the 18th
century [14]. However, these islands never became important
demographic centers and the joint population size of Sal, Boa
Vista and Maio represents only about 8.5% of the total population
of the archipelago (Cape Verde National Institute of Statistics,
www.ine.cv).
Previous work on the genetic composition of the Cape Verde
islands, based on classic protein markers and autosomal Short
Tandem Repeat (STR) loci, detected substantial levels of African-
European admixture, with mean proportions of European
ancestry ranging from 36 to 54%, depending on the markers
and statistical methods used to quantify admixture [21,22].
However, these studies did not provide individual ancestry
estimates and paid little attention to variation in the amount of
admixture across islands. Studies based on the uniparentally
inherited lineages from the non-recombinant Y-chromosome
(NRY) and mitochondrial DNA (mtDNA) confirmed the pre-
dominance of mixed unions involving European males and
African females [23,24]. These surveys also provided evidence
that Cape Verde is not genetically homogeneous [23,24], but they
used predefined geographic groups that lumped together islands
with different settlement histories [14], and, therefore, could not
offer a full portrait of the patterning of genetic diversity in the
Cape Verdean territory.
Despite the potential usefulness of Cape Verde for conducting
admixture mapping studies, with the exception of a recent study
on iris texture traits [25], there is no data on the extent of
phenotypic variation in anthropologically and biomedically
relevant characteristics within the archipelago. In particular, the
lack of data on the relationship between skin pigmentation and
individual ancestry stands in sharp contrast with the information
available from other admixed populations, where skin color
variation has been characterized both as a mediator of social
interactions and a model phenotype for admixture mapping
studies [26,8,27,28,11].
Here, we provide a more detailed picture of the patterns of
genetic and phenotypic variation in Cape Verde by using objective
skin color measurements, and a panel of 50 autosomal, 34 X-
chromosome and 21 NRY markers to analyze a total of 845
individuals from six islands that were peopled across different
settlement stages. In particular, we explore the following poorly
studied aspects of the admixed structure and settlement history of
the archipelago: i) the distribution of group and individual ancestry
proportions across islands; ii) the relationship between genetic
ancestry and skin pigmentation; iii) the interplay between skin
color, genetic ancestry and socio-economic status (SES); and iv) the
impact of population history on the degree of genetic differenti-
ation between islands.
Materials and Methods
Population SamplesThe population sample comprised 845 individuals from the
islands of Santiago, Fogo, Santo Antao, Sao Vicente, Sao Nicolau,
and Boa Vista (Figure 1). With the exception of Boa Vista, the
sample includes the most populated islands of the archipelago.
A total of 646 individuals were characterized for autosomal
genetic ancestry. X-chromosome diversity was studied in a subset
of 210 males, and NRY diversity was studied in a subset of 232
men augmented with an extra set of 199 male individuals.
Information about age, SES indicators, and individual and
parent place of birth was collected via questionnaire. To avoid
including close relatives in our analysis, we also recorded the
individual and both parents’ full name and inquired for
acknowledge relationships between donors at each sampling
location. With these procedures, we were able to detect pairs of
parent/offspring, full siblings, half-siblings and avuncular relatives,
of which we removed one individual from the analysis.
To minimize missing data we grouped individuals according to
their own place of birth (4.8% of individuals had no knowledge
Admixture and Genetic Variation of Cape Verde
PLOS ONE | www.plosone.org 2 November 2012 | Volume 7 | Issue 11 | e51103
about one of the parent’s, mainly the father’s, place of birth).
However, the results were not significantly different from analyses
based on combined self and parent’s place of birth.
All population samples were collected with informed consent
according to procedures approved by the IPATIMUP Human
Subjects Committee and by the National Ethical Committee for
Health Research of Cape Verde.
Skin PigmentationObjective skin color measurements were taken with the
handheld narrow-band reflectometer DSMII ColorMeter (Cortex
Technology, Denmark). The DSMII ColoMeter is an updated
version of the DermaSpectrometer (Cortex Technology, Den-
mark) used in previous studies [8,11], which holds a new design of
the optics to ensure minimal sensitivity to environmental light.
The melanin content was quantified by the melanin index (M
index) provided by the instrument, which equals 1006log (1/%
reflectance at 655 nm) [29].
For each subject, three consecutive measurements were taken
on the unexposed upper inner side of each arm and the six
measures were averaged to yield a mean M index value per
individual.
Ancestry Informative MarkersTo estimate population and individual admixture proportions,
we selected a panel of 50 autosomal and 34 X-chromosome
Ancestry Informative Markers (AIMs), showing allele frequency
differentials (d) .0.5 between Europeans and West Africans (mean
0.748, range from 0.53 to 1.00) [11,30]. Detailed information
about these panels is provided in Tables S1 and S2. Autosomal
AIMS were genotyped using allele-specific PCR with universal
energy transfer-labeled primers [31] at Prevention Genetics
(Marshfield, Wisconsin, USA) and X-chromosome AIMS were
genotyped using Sequenom iPLEX technology at the Gulbenkian
Institute genotyping service (Lisbon, Portugal).
NRY MarkersSamples were genotyped for 10 NRY unique event polymorph-
isms (Y-UEPs M213, M91, YAP, SRY4064, M2, M35, M78,
M81, 12f2, and M269) with a hierarchical approach based in the
Y-Chromosome Consortium (YCC) phylogeny [32], using direct
reading of the PCR product in acrylamide gels, restriction
fragment length analysis, direct sequencing, or allele-specific
PCR, according to previously described methods [33,34]. Eleven
NRY Short Tandem Repeats (STRs; DYS19, DYS389I,
DYS389II, DYS385, DYS390, DYS391, DYS392, DYS393,
DYS437, DYS438, and DYS439) were genotyped in the same
individuals with the Promega Powerplex Y System (Promega
Corporation, Madison, Wisconsin, USA). Y-chromosome hap-
logroups defined by binary markers were named according to the
most recent YCC guidelines [32].
Statistical AnalysesGenetic ancestry. Group and individual ancestry estimates
based in autosomal and X-chromosome AIMS were calculated
with the software ADMIXMAP v3.7 for Windows [35,36]. The
program requires multilocus genotypes of the admixed individuals
and the allele frequencies from each parental population. We
specified a model with no ‘‘dispersion’’ of allele frequencies, in
which the allele frequencies in the unadmixed populations
(European and West African) are assumed to be identical to the
corresponding ancestry-specific allele frequencies in the admixed
population.
Figure 1. Map of Cape Verde. The number of individuals characterized for autosomal AIMs (NAIM), X-chromosome AIMs (NX) and NRY (NY) isdepicted for each sampled island.doi:10.1371/journal.pone.0051103.g001
Admixture and Genetic Variation of Cape Verde
PLOS ONE | www.plosone.org 3 November 2012 | Volume 7 | Issue 11 | e51103

Since individual West African ancestry distributions were
approximately normal in all islands, we examined differences in
the distributions between islands with standard one-way analysis of
variance (ANOVA). These analyses were performed in the R
statistical computing environment (http://www.r-project.org/).
Male-specific ancestral contributions to the Cape Verdean gene
pool were evaluated with binary NRY markers, using the ADMIX
2.0 program [37], not taking into account molecular distances
between haplogroups, and assuming four parental populations:
Iberian Peninsula, West Africa, North Africa and Sephardic Jews.
In performing this 4-way ancestry analysis, we used the increased
resolution of NRY to narrow down the European contribution to
the Iberian Peninsula and further discriminate the contributions of
northern Africans and Sephardic Jews, two populations also
reported to have migrated to the islands [15,16,24]. Details about
comparative dataset assembled for the NRY admixture analysis
are provided in Table S3.
Relationship of skin color, ancestry and SES. Total skin
M index distribution, and per island and per sex distributions were
examined for normality and log-transformed to achieve an
approximate normal distribution. Differences between islands
and between sexes were assessed using one-way ANOVA. The
relationship between age and skin color was assessed by the
parametric Pearson correlation test. All these statistical analyses
were performed in the R statistical computing environment.
We measured SES using 3 variables: self-reported education,
occupation and household amenities. Education was assessed with
a five-level ordinal categorical variable corresponding to: i) up to 2
years in school; ii) 6th grade; iii) uncompleted high school; iv)
completed high school or uncompleted college; v) completed
college, vocational or professional training. For occupation, we
created three non-ordered categories: 1) ‘‘white collar’’ profes-
sions, combining technical/managerial/administrative activities;
2) ‘‘blue collar’’ occupations, combining craftsman/machine
operator/laborer and farming/fishing work; and 3) ‘‘other
occupations’’, including housewife and other occupations. Re-
garding household amenities, we performed a principal compo-
nent analysis (PCA) on number-coded answers to 10 questions
made in accordance to the census prepared by the Cape Verde
National Institute of Statistics (www.ine.cv; see supplementary
note for more details on the household amenities measured). Here
we use scores on the two first principal components, which explain
64% of the variation in household amenity features.
To evaluate the relationship between skin pigmentation and
genetic ancestry, we performed linear regression analysis on the
estimated proportion of West African ancestry for the overall
sample, including sex and age as covariates. The relationship
among SES, skin color, and genetic ancestry, was evaluated
through multiple regression analyses on the M index and on the
estimated proportion of West African ancestry for the overall
sample and for each island, including sex and age as covariates.
The analyses were performed in the R statistical computing
environment.
Genetic differentiation between the islands. We used the
increased resolution of NRY in discriminating between closely
related populations to assess the patterns of genetic differentiation
within the archipelago. Pairwise FST and RST genetic distances for
NRY binary marker haplogroups and STR-based haplotype
variation, respectively, were calculated with the ARLEQUIN
3.11 software package [38]. Multidimensional scaling (MDS)
based on FST and RST distance matrices was performed using the
STATISTICA software package. Haplotype matching analyses
among the islands were performed with the full STR set, excepting
the DYS385 locus, due to its duplicated status. The relationships
between NRY-STR based haplotypes sampled in different islands
were assessed in networks constructed with NETWORK 4.5
software (http://www.fluxus-engineering.com). To resolve exten-
sive reticulation, the reduced-median [39] and median-joining
[40] algorithms were applied sequentially and intrahaplogroup
variance-based weighting was used as previously described [41].
Chromosomes carrying NRY-STR allele duplications were
omitted from the analysis.
Results
Variation in Population Admixture and IndividualAncestry Across Islands
Autosomal AIMS. The distribution of individual West
African (WAfr) ancestry estimated with 50 autosomal AIMs in
the six sampled islands from the Cape Verde archipelago is
displayed in Figure 2A. The average proportion of West African
admixture in the total sample of 646 individuals (0.5760.08) is
notably smaller than the average levels of 79–96.5% previously
reported for African-American populations with a similar panel of
markers [7,8,11] The data also clearly show that admixture levels
are not uniformly distributed across the archipelago (F= 39.59,
df= 6, P= 2.2e–16). The highest and lowest mean West African
ancestry levels are found in Santiago (mean WAfr = 0.65; n = 124)
and Fogo islands (mean WAfr = 0.53; n = 126), respectively
(highest P-value found in one-way ANOVA comparisons with
other islands is less than 0.0004). In the North (Figure 1), the
islands of Santo Antao (n = 136), Sao Vicente (n = 84), and Sao
Nicolau (n = 110), all with mean WAfr = 0.56, form a cluster with
significantly lower West African ancestry than Santiago and Boa
Vista (highest P-value 0.0006). Finally Boa Vista (mean
WAfr = 0.59, n = 66) has an intermediate position, showing
significantly higher individual West African ancestry values than
the northern cluster and Fogo (highest P-value 0.0002).
X-chromosome AIMS. Figure 2B displays the distribution of
individual West African (WAfr) ancestry calculated with 34 X-
chromosome AIMs in 210 males from the six sampled islands.
Consistent with the autosomal data, the mean level of African
ancestry is highest in Santiago (mean WAfr = 0.76; n = 25). The
other islands are clearly more admixed, with mean West African
ancestry proportions ranging from 0.62 in Boa Vista (n = 21) to
0.70 in Santo Antao (n = 42), and showing intermediate levels in
Fogo (0.63; n = 64), Sao Vicente (0.67; n = 24) and Sao Nicolau
(0.64; n = 34). Overall, the proportions of African ancestry
calculated with the X-chromosome are significantly higher than
those obtained with the autosomal markers (Figure 2A and B;
Wilcoxon signed rank test P-value= 1.8e–05), confirming that the
admixture pattern was sex biased, mostly involving European man
and African women.
NRY. Figure 3 shows the distribution of 10 NRY haplogroups
defined by 10 binary markers in 431 males. The most frequent
haplogroup in the total sample is R1b1b2 (42.7%), followed by
E1b1a (18.8%); for all other haplogroups, frequencies are lower
than 10%. R1b1b2 is the most common lineage in European
populations, with frequencies ranging from 20% to 80% at the
continental level [42] and from 59% to 66% in the Iberia
Peninsula [43,34]. E1b1a is typical of Africa, comprising ,60–
85% of NRY lineages in sub-Saharan populations, and specifically
81–85% in West African populations [33,44–47]. The observed
haplogroup distribution pattern confirms that the Cape Verdean
paternal component is mainly derived from Europe, as previously
reported [24].
To formally assess the paternal contribution of different
populations, we performed an admixture analysis, using the
Admixture and Genetic Variation of Cape Verde
PLOS ONE | www.plosone.org 4 November 2012 | Volume 7 | Issue 11 | e51103

approach implemented in Admix 2.0 [37] and treating the Cape
Verdean population as a result of admixture of four parental
populations: Iberian Peninsula, West Africa, North Africa and the
Sephardic Jewish population (Table 1). This 4-way admixture
analysis was prompted by previous suggestions, based on genetic
and historical data, that enslaved North Africans and Iberian Jews
represented non-negligible fractions of African and European
parental groups, respectively [15,16,24].
According to the admixture analysis, the majority of male
contributions to Cape Verde were derived from the Iberian
Peninsula (0.68). The second most important contribution (0.27)
came from West Africa, while contributions from Northern Africa
and Sephardic Jews seem to have been residual (,0.03 each, with
wide confidence intervals).
As with the autosomal and X-chromosome data, NRY-based
admixture estimates are not homogeneous across islands (Table 1;
Figure 2C). Santiago is again the island with the highest mean level
of West African ancestry (0.57), while Fogo, in spite of its
proximity to Santiago, has a much lower African contribution
(0.09) that is closer to Boa Vista (0.05) in the East, and to Sao
Figure 2. Admixture structure and skin color variation in Cape Verde. A-B) Individual West African ancestry distributions obtained withautosomal AIMs (A) and X-chromosome AIMS (B). C) Average group ancestry obtained with NRY-UEP markers. D) Skin pigmentation distributionsamong the Cape Verde islands.doi:10.1371/journal.pone.0051103.g002
Admixture and Genetic Variation of Cape Verde
PLOS ONE | www.plosone.org 5 November 2012 | Volume 7 | Issue 11 | e51103

Nicolau (0.1) in the North (Figure 1). Santo Antao (0.36) and Sao
Vicente (0.21), also in the North, have larger NRY African levels
that are intermediate between those of Santiago and of the other
islands.
Relationship of Individual Ancestry and SkinPigmentation
The overall distribution of skin pigmentation as measured by
the melanin (M) index, ranges from 29.6 to 97.9 with a mean of
Figure 3. Phylogenetic tree of Y-UEP haplogroups studied in the Cape Verde sample. Haplogroup nomenclature as proposed by the YCC[32] and defining UEPs assayed are shown along the branches in bold and black. Mutations in italics and grey were not assayed in this studied. Thetable shows absolute frequencies (percentage) of the haplogroups found in each island and in the total archipelago.doi:10.1371/journal.pone.0051103.g003
Table 1. Estimated admixture proportions (6 standard deviation) of Y-chromosome lineages from Cape Verde. Empty cellscorrespond to unsupported parental populations.
Parental Population
Hybrid Population Iberian Peninsula West Africa North Africa Sephardic Jews
Santo Antao 0.60160.110 0.35960.069 – 0.04160.090
Sao Vicente 0.75160.118 0.21260.061 – 0.03760.099
Sao Nicolau 0.90160.056 0.09960.056 – –
Boa Vista 0.93360.124 0.04560.051 0.02260.111 –
Fogo 0.74360.073 0.09260.022 0.10460.041 0.06060.065
Santiago 0.34260.070 0.57360.056 0.000460.035 0.08460.061
Total 0.68060.043 0.26660.023 0.02860.021 0.02660.035
doi:10.1371/journal.pone.0051103.t001
Admixture and Genetic Variation of Cape Verde
PLOS ONE | www.plosone.org 6 November 2012 | Volume 7 | Issue 11 | e51103

53.4 (median of 51.3). Because we measured skin color with an
updated version of the reflectometer employed in previous studies
of African-Americans populations [8,11], our data are not directly
comparable to these studies.
Skin pigmentation levels do not differ between sexes (male
average skin M index = 53.8; female average skin M index = 53.2;
P= 0.622), and are not correlated with age (P= 0.813), but are
clearly different among islands (F= 21.603, df= 6, P-value = 2.2e–
16), mimicking the patterns of variation in autosomal West African
ancestry levels (Figure 2A and 2D). Individuals from Santiago are
significantly darker than individuals from the other islands (mean
skin M index = 63.2; highest P-value 2.21e–5 in one-way ANOVA
pairwise comparisons). The neighboring island of Fogo (mean skin
M index = 50.2) harbors the lightest skin M values, together with
Santo Antao (mean skin M index = 50.6), Sao Vicente (mean skin
M index = 50.2) and Sao Nicolau (mean skin M index = 51.6) in
the North (Figure 1). Boa Vista island stands in an intermediate
position (mean skin M index = 54.8), being significantly darker
than Fogo and the northern islands (highest P-value 0.034), but
significantly lighter than Santiago (P-value 2.2e–05).
In the total Cape Verde sample, skin pigmentation is
significantly correlated with individual ancestry, with a clear trend
towards darker pigmentations with increasing levels of West
African ancestry (Pearson r= 0.54, P-value ,2e–16; including sex
as a covariate). Although our panel of autosomal AIMs includes
five markers located within pigmentation candidate genes (Table
S1), this correlation is still significant after removing these loci
from the calculations, (Pearson r= 0.49, P,2e–16).
Relationship between SES with Genetic Ancestry andSkin Pigmentation
To evaluate the relationships among SES, genetic ancestry, and
skin pigmentation, we performed multiple regression analyses
considering education (five ordered categories), occupation (three
non-ordered categories) and household amenities (PC1 and PC2
from PC analysis of 10 categories) as dependent variables, and
individual West African ancestry based on autosomal data and
skin color as independent variables, while controlling for sex and
age (Table 2). In the total sample all three SES measures were
significantly associated with skin color, but not with the proportion
of West African ancestry. There is an inverse relationship between
skin color and education, occupation status, and the quality of
household amenities.
Because admixture proportions and skin color are not
homogeneous across islands, we also tested for associations in
each island (Table 2). For this analysis, we clustered the northern
islands of Santo Antao, Sao Vicente, and Sao Nicolau in a single
group, since admixture proportions and skin color distributions did
not vary significantly among these islands. Except for Boa Vista,
which has the lowest sample size (n = 66), skin color was associated
with at least two indicators of SES in each island.
Genetic Differentiation between IslandsTo further evaluate the relationships among different islands, we
performed MDS analyses using pairwise genetic distances based
on NRY haplogroups defined by binary markers, and NRY
haplotypes defined by STRs (Figure 4). In the MDS plot
calculated from FST distances and haplogroup frequency data,
Santiago is clearly distinguished from the other islands in the first
dimension, reflecting its higher levels of West African male
ancestry (Figure 4A; Table 1). The plot based on RST distances
and NRY haplotypes provides a better resolution of the differences
among islands by uncovering additional genetic structure that is
less related to the admixture process (Figure 4B). As with Y-UEP
data (Figure 4A), the first axis of this plot separates Santiago from
the other islands and most likely reflects differences in admixture
proportions across the archipelago (Figure 4B). However, the
second axis has a North-South geographic orientation, showing
that islands with similar levels of admixture may harbor different
NRY lineage profiles. Overall, the MDS plot for NRY haplotype
variation is somewhat reminiscent of the geographic map of the
archipelago, separating Fogo and Santiago from each other and
from Sao Antao, Sao Vicente, and Sao Nicolau, which form
a group of islands in the northern part of the archipelago (Figures 1
and 4B), with Boa Vista standing in an intermediate position.
To further trace the spread of STR-defined lineages across the
archipelago, we have also studied the patterns of haplotype sharing
among islands. The highest percentage of individual Y-chromo-
somes with no matches on other islands was found in Santiago
(81%), followed by Boa Vista and Sao Vicente (51%), Fogo (38%),
Sao Nicolau (35%), and Santo Antao (31%). Table 3 shows, for
each pair of islands, the proportions of shared NRY lineages
sampled in one island (rows) that are also observed in the other
island (columns). For example, as much as 81% of shared
individual Y-chromosomes from Fogo are also observed in
Santiago, while only 62% of shared chromosomes sampled in
Santiago were found in Fogo, showing that this island harbors
a subset of Santiago’s NRY variation, despite the significant
divergence in the genetic composition and admixture structure of
the two islands (Figures 2 and 4). Moreover, most of Fogo’s lineage
matches with Santiago are exclusive (Figure S1). This pattern
likely reflects the first population movement within Cape Verde,
involving the colonization of Fogo by Santiago inhabitants during
the first peopling stage. A similar asymmetry in lineage sharing
patterns suggests that the inhabitants of Sao Nicolau had an
important role in the settlement of Boa Vista (Table 3). Santo
Antao and Sao Vicente, the two closest inhabited islands in the
archipelago (Figure 1), also have high levels of haplotype sharing
(60–64%), consistent with the historically documented coloniza-
tion of Sao Vicente with settlers from Santo Antao, followed by
subsequent gene-flow between the two islands [20]. In general, the
lineages sampled in the three northern islands and Boa Vista have
lower levels of haplotype sharing with both Santiago and Fogo
(Table 3), in accordance with the North-South discrimination
observed in the second dimension of the MDS plot based on RST
genetic distances (Figure 4B). However, lineages from Sao Vicente
and Sao Nicolau still show moderate sharing levels with Fogo
(,43%), suggesting that this island might have been an important
source of settlers in the northward migrations during the second
colonization stage of the archipelago.
To better understand the phylogeographic relationships un-
derlying lineage sharing patterns, we further compared the NRY-
STR haplotype diversity within the most frequent haplogroups
through network analysis (Figure 5). It is clear that Santiago
harbors the more heterogeneous lineage composition, with a higher
number of single and low frequent haplotypes than other islands.
In contrast, the patterns of haplotype distribution within major
lineages in Fogo [R1b1b2 (M269), J (12f2), F(xR1b1b2,J) (M213),
and E1b1b1a (M78)] are strikingly the opposite and show clear
signs of founding effects, with a relatively small number of different
haplotypes, fewer rare haplotypes, and more haplotypes with
intermediate frequencies (Figure 5). Intriguingly, one of Fogo’s
most common lineages within the R1b1b2 haplogroup (4% in
Fogo; marked with an asterisk in Figure 5) is associated with the
surname ‘‘Montrond’’, which was introduced in the island at the
end of the 19th century by the French immigrant Armand
Montrond, who is known to have enjoyed a remarkably high
reproductive success [48].
Admixture and Genetic Variation of Cape Verde
PLOS ONE | www.plosone.org 7 November 2012 | Volume 7 | Issue 11 | e51103

Table 2. Multiple regression coefficients (b) and significance value (P) for regression of SES on skin color (M index), proportion ofWest African ancestry (Wafr), sex and age.
North Cluster Boa Vista Fogo Santiago Total
b P b P b P b P b P
House.PC1a
Constant 22.911 0.022 0.225 0.873 0.483 0.844 22.119 0.018 24.15 3.30e206
Sex (male = 0, female = 1) 20.068 0.525 20.237 0.378 0.18 0.417 20.186 0.410 20.076 0.382
Age (years) 20.001 0.820 0.015 0.255 0.004 0.72 0.012 0.266 0.002 0.584
M index 0.609 0.077 0.023 0.157 0.287 0.663 0.026 0.011 1.04c 5.60e205
Wafr 0.678 0.427 23.132 0.234 23.019 0.101 0.719 0.655 20.01 0.988
House.PC2a
Constant 2.507 0.004 2.378 0.040 1.967 0.129 0.738 0.147 2.303 4.50e205
Sex (male = 0, female = 1) 0.126 0.085 20.250 0.250 0.092 0.431 20.041 0.751 0.057 0.294
Age (years) 0.004 0.219 20.006 0.562 20.007 0.216 20.01 0.093 20.001 0.788
M index 20.752 0.001 20.016 0.222 20.287 0.406 20.014 0.016 20.598c 0.0003
Wafr 0.364 0.531 21.746 0.410 21.139 0.238 0.726 0.430 0.107 0.788
Occupationb
Constant 14.468 3.00e-204 1.310 0.740 31.889 0.0006 6.256 0.002 17.895 4.30e213
Sex (male = 0, female = 1) 20.881 0.008 20.007 0.992 22.556 0.006 20.434 0.357 20.85 0.0002
Age (years) 20.084 2.76e208 20.086 0.033 20.165 0.0001 20.057 0.014 20.088 3. 8e216
M index 22.492 0.021 20.047 0.245 27.948 0.001 20.089 0.0002 23.74 5.70e208
Wafr 20.867 0.723 6.873 0.335 13.089 0.06 2.946 0.395 1.732 0.282
Education
Constant 4.108 3.16e207 1.290 0.138 4.024 0.002 2.246 6.20e208 3.527 1.30e212
Sex (male = 0, female = 1) 0.048 0.475 0.082 0.623 0.044 0.687 0.075 0.482 0.056 0.24
Age (years) 20.016 8.86e207 20.018 0.018 20.022 0.0004 20.014 0.011 20.017 6.90e214
M index 20.621 0.004 0.002 0.869 20.629 0.07 20.013 0.013 20.519 0.0003
Wafr 20.158 0.762 0.292 0.854 0.2 0.829 0.108 0.886 0.221 0.521
aPC1 and PC2 were estimated on the basis of 10 household amenity categories.bWhite collar occupations are associated with smaller M-index values.cInspection of PC plots shows an inverse correlation between M index and quality of household amenities.doi:10.1371/journal.pone.0051103.t002
Figure 4. MDS plots illustrating the genetic structure within the Cape Verde archipelago. A) MDS plot of the FST genetic distance matrixestimated from Y-UEP haplogroup data (Stress value = 0.0000, p,0.01). B) MDS plot of the RST genetic distance matrix estimated from NRY-STRhaplotype data (Stress value= 0.0000, p,0.01). Stress value significance was assessed as according to [60].doi:10.1371/journal.pone.0051103.g004
Admixture and Genetic Variation of Cape Verde
PLOS ONE | www.plosone.org 8 November 2012 | Volume 7 | Issue 11 | e51103

Discussion
In this study we present an analysis of admixture and
background population structure of the archipelago of Cape
Verde using genetic information from autosomal and X-chromo-
some AIMS, and NRY-specific polymorphisms. The relevance of
genotyped sample in terms of size and geographic coverage of the
archipelago, as well as the large discriminating power of assayed
markers allowed us to add substantial detail to the understanding
of the historical factors that have shaped the patterns of genetic
diversity within and among local island populations.
Admixture Structure of the Archipelago of Cape VerdePopulation-based admixture proportions estimated with 50
autosomal AIMs confirm our expectations based on historical
evidence of extensive genetic admixture between Europeans and
Africans in Cape Verde. As far as we know, Cape Verde is
presently one of the most highly admixed populations resulting
from the mixing of European and African parental contributions
[7,9,11,12,49,13], and may be only paralleled by some regions in
Brazil [27,50,51]. Moreover, the comparison of African ancestry
proportions calculated with X, Y-chromosome and autosomal
markers confirms that admixture involved predominantly Euro-
pean men and African women, like in many other societies
emerging from the Atlantic slave trade [33,52,27,53].
Table 3. Proportion of NRY-STR haplotypes sampled in one population (rows) that are also found in other populations (columns).
Island Santo Antao Sao Nicolau Sao Vicente Fogo Santiago Boa vista
Santo Antao - 0.417 0.638 0.25 0.25 0.194
Sao Nicolau 0.464 – 0.393 0.428 0.25 0.357
Sao Vicente 0.608 0.304 – 0.434 0.217 0.13
Fogo 0.175 0.209 0.198 – 0.814 0.128
Santiago 0.238 0.286 0.19 0.619 – 0.048
Boa vista 0.462 0.769 0.308 0.231 0.077 –
doi:10.1371/journal.pone.0051103.t003
Figure 5. Median-joining (MJ) networks of the 11 NRY-STR haplotypes found within the most frequent Cape Verdean lineages.Circles represent haplotypes, with areas proportional to frequency; lines between circles represent NRY-STR mutational steps, with lengthproportional to haplotype mutational divergence. In E), the circle marked with an asterisk corresponds to the Montrond lineage in Fogo Island.doi:10.1371/journal.pone.0051103.g005
Admixture and Genetic Variation of Cape Verde
PLOS ONE | www.plosone.org 9 November 2012 | Volume 7 | Issue 11 | e51103

The African ancestry proportions estimated with different
panels of markers also revealed substantial variation in admixture
among the sampled islands, with Santiago showing significantly
higher levels of African ancestry than the other islands. This
variation is generally consistent with the settlement history of the
archipelago, since Santiago was the first island to be peopled and
its economy was initially based on a plantation system that largely
depended on African slaves [17]. In turn, the islands of Santo
Antao, Sao Vicente, Sao Nicolau and Boavista, which show
significantly lower African admixture levels than Santiago, were
mostly populated by admixed free peasants that migrated
northwards after the decline of the slave-based economy [17].
There is, however, an apparent discordance to this general
pattern: Fogo island displays low African ancestry levels that are
similar to the northern islands, even though its settlement history is
concurrent with Santiago and based on the same slave labor
system [17]. It is likely that this discrepancy resulted from
differential survival and integration levels of ‘‘rural slave’’
communities after slavery was abolished. According to this
interpretation, the emergent societies of the islands of Fogo and
Santiago would have been divided into two major subgroups with
very different reproductive success: one composed by the offspring
of mixed unions between European men and ‘‘domestic’’ slave
women, which later became the major ruling segment of the Cape
Verde society; and the other composed by the ‘‘rural slaves’’ who,
due to their higher mortalities (both pre- and post-reproductive,)
had to be continuously replaced by other enslaved Africans from
the mainland. Historical work has shown that the slave labor
system was more extreme and lasted longer in Fogo than in
Santiago [14]. In addition, it is likely that the relative proportions
of ‘‘rural slaves’’ and admixed rulers were higher in Santiago than
in Fogo, because of the larger size of the former. In this setting, the
higher levels of African ancestry presently observed in Santiago
were likely to be caused by demographic and social conditions
favoring the attenuation of cultural mediated forms of differential
reproductive success [54,55] between admixed rulers and former
slaves.
Impact of Admixture on Skin Color VariationTo test for the impact of the admixture process on phenotypic
variation, we obtained quantitative measurements of skin color,
a phenotype that is highly divergent between Cape Verde’s
parental populations. There are well-established correlations
between skin color and individual ancestry that depend on the
admixture dynamics [56,8,11] which can also be observed in Cape
Verde.
The differences in the admixture proportions among the islands
of the archipelago are clearly evident in the skin pigmentation
distribution across the islands, since individuals from islands with
higher levels of European ancestry tend to have significantly
lighter skin colors than individuals from islands where African
ancestry predominates (Figure 2). Overall, the correlation between
skin color and African ancestry is high, indicating that the
distribution of individual African ancestry in Cape Verde is
tagging efficiently skin color allele variants, and that this
population provides a good model for studying the genetic
architecture of pigmentary traits. Mapping studies of pigmentation
should include population samples from all the islands in order to
fully analyze the whole spectrum of phenotypic and of individual
admixture variation in the archipelago. However, there is the
trade-off of increased population stratification due to the
differences in the admixture levels among islands, which can give
rise to spurious associations between the genotypes and the
phenotype. This implies that the mapping design has to include
a larger numbers of AIMs in order to sufficiently adjust for the
admixture stratification.
Relationship between Skin Color, Genetic Ancestry andSES
We investigated the social impact of skin color in Cape Verde
by analyzing its relationship with SES and genetic ancestry. Our
study may be considered preliminary, since we only used three
categorical variables to evaluate SES. A more thorough evaluation
of these variables and of other unmeasured socioeconomic
differences and how these affect skin color variation is in order.
Notwithstanding, the fact that the correlations analyzed were
consistent across all three SES measures and that the results were
similar when comparing the different islands strengthens our
conclusions. We observed significant correlations between SES
and skin color, as measured by reflectometry, after adjusting for
genetic ancestry, but no correlations between SES and genetic
ancestry. This finding suggests that although genetic ancestry is
significantly correlated with skin color, it does not fully capture the
effect of skin color on the social dimensions of the contemporary
population of Cape Verde.
The perception of skin color as a basis for social stratification
was also observed in other admixed populations [26–28]. These
complex social interactions not only impact the cultural, social,
and genetic variation dynamics, but may also have implications for
the distribution of genetic and environmental disease risk factors.
In one well-documented example, social classification of color has
been shown to differ from skin color, as measured by re-
flectometry, and increased blood pressure was found to be
associated with the former, but not with the latter, through
interaction with SES [26,57]. In other instances, reported
associations of disease risk with genetic ancestry did not persist
after taking socioeconomic variables into consideration, suggesting
that ethnic health disparities can be better explained by
sociocultural rather than genetic factors [58,59].
Our observation, together with these results, indicate that
culturally perceived color, objective measures of skin pigmentation
and genetic ancestry may not always be adequate proxies of each
other, and their relationship with socioeconomic risk factors needs
to be carefully evaluated to completely understand how human
biological diversity shapes variation in disease patterns.
Genetic Differentiation within the ArchipelagoTo investigate the genetic relationship among the Cape Verde
Islands, we focused on the patterns of NRY variation, since the
higher sensitivity of Y chromosome to genetic drift provides
adequate resolution to study microevolutionary events occurring
since colonization. Moreover, as the maternal contribution was
almost exclusively derived from Africa [23], the NRY is more
likely to better capture the diverse origins of Cape Verde settlers
than mtDNA.
We found that patterns of NRY-UEP variation essentially
reflect differences in admixture proportions between islands, while
NRY-STR variation reveals additional patterns of population
differentiation (Figure 4). One major aspect of this differentiation
is the separation of the northern islands of Santo Antao, Sao
Vicente and Sao Nicolau from the southernmost islands of
Santiago and Fogo (Figure 1 and 4). Moreover, whereas the three
northern islands likely experienced high levels of gene flow and are
closely related to each other, the southern islands Santiago and
Fogo are clearly differentiated, in spite of the geographic proximity
of the two islands and the presence of founder lineages in Fogo
that can be traced to Santiago (Table 3).
Admixture and Genetic Variation of Cape Verde
PLOS ONE | www.plosone.org 10 November 2012 | Volume 7 | Issue 11 | e51103

Taking into consideration the historical data [14], these patterns
could be interpreted in two ways. According to one hypothesis,
a substantial part of the North-to-South genetic differentiation can
be attributed to demographic events (admixture, drift and founder
effects) ensuing the initial settlement of Santiago and Fogo, without
further significant exogenous contributions besides the regular
importation of slaves to the two southern islands. Alternatively, the
North and South genetic clusters could result from separate
migrations coming from Europe (mainly Portugal) and the West
Coast of Africa, which then evolved in parallel before converging
into a common cultural and social background.
Consistent with the first hypothesis, we found that Santiago is
the most genetically diverse island of the archipelago (Figure 5),
and played particularly important role in the settling of Fogo
(Table 3), where evidence for founder effects is especially striking
(Figure 5). However, the two peopling hypotheses are not mutually
exclusive and we also find a significant genetic component that is
exclusive to each island.
All these results, together with the admixture analysis, are
concordant in indicating that the most likely scenario for the
colonization of the Cape Verde archipelago may lie in between the
two stated hypotheses, suggesting that the various groups of islands
have a shared genetic history that results from a common origin in
Santiago, followed by differentiation through genetic drift and
subsequent input of independent external migrations.
In conclusion, our work demonstrates that Cape Verde is
a highly admixed population with substantial geographic hetero-
geneity resulting from different historical and demographic events
that have taken place during and since the colonization period.
The wide distribution of individual African ancestry anticipates
that Cape Verde holds great potential for analyzing the genetic
basis of complex phenotypic traits differing between Africans and
Europeans, provided that the study has enough resolution to
extract ancestry information to control for population stratification
and that differences in SES are carefully taken into account.
Supporting Information
Figure S1 Patterns of NRY-STR haplotype sharing between the
Cape Verde islands. Only Y-chromosomes found to be shared
between at least one pair of islands were included in the
calculations.
(PDF)
Table S1 Characteristics of the 50 autosomal AIMS. The table
shows the physical and genetic locations, frequencies of the
reference sequence allele and allele frequency differences between
European and West African parental populations (d).
(DOC)
Table S2 Characteristics of the 34 X-chromosome AIMS. The
table shows the physical and genetic locations, frequencies of the
reference sequence allele and allele frequency differences between
European and West African parental populations (d).
(DOC)
Table S3 Populations used for Y-chromosome admixture
estimation.
(DOC)
Note S1 Assessment of household amenities.
(PDF)
Acknowledgments
Many residents of Cape Verde provided invaluable contributions by
participating in and/or helping to organize sample collection; we are
especially grateful to the University of Cape Verde administration for their
support.
Author Contributions
Performed the experiments: SB JC JL. Analyzed the data: SB EJP JR.
Contributed reagents/materials/analysis tools: SB JR. Wrote the paper: SB
JR. Collected the data: SB JC JL IIA AHA JR. Conceived the study: SB
JR. Supported conception of the study: ACS.
References
1. Winkler CA, Nelson GW, Smith MW (2010) Admixture mapping comes of age.
Annu Rev Genomics Hum Genet 11: 65–89.
2. Basu A, Tang H, Arnett D, Gu CC, Mosley T, et al. (2009) Admixture mapping
of quantitative trait loci for BMI in African Americans: evidence for loci on
chromosomes 3q, 5q, and 15q. Obesity (Silver Spring) 17: 1226–1231.
3. Bryc K, Auton A, Nelson MR, Oksenberg JR, Hauser SL, et al. (2010) Genome-
wide patterns of population structure and admixture in West Africans and
African Americans. Proc Natl Acad Sci U S A 107: 786–791.
4. Freedman ML, Haiman CA, Patterson N, McDonald GJ, Tandon A, et al.
(2006) Admixture mapping identifies 8q24 as a prostate cancer risk locus in
African-American men. Proc Natl Acad Sci U S A 103: 14068–14073.
5. Kao WH, Klag MJ, Meoni LA, Reich D, Berthier-Schaad Y, et al. (2008)
MYH9 is associated with nondiabetic end-stage renal disease in African
Americans. Nat Genet 40: 1185–1192.
6. Nalls MA, Wilson JG, Patterson NJ, Tandon A, Zmuda JM, et al. (2008)
Admixture mapping of white cell count: genetic locus responsible for lower white
blood cell count in the Health ABC and Jackson Heart studies. Am J Hum
Genet 82: 81–87.
7. Parra EJ, Kittles RA, Argyropoulos G, Pfaff CL, Hiester K, et al. (2001)
Ancestral proportions and admixture dynamics in geographically defined
African Americans living in South Carolina. Am J Phys Anthropol 114: 18–29.
8. Parra EJ, Kittles RA, Shriver MD (2004) Implications of correlations between
skin color and genetic ancestry for biomedical research. Nat Genet 36: S54–60.
9. Parra EJ, Marcini A, Akey J, Martinson J, Batzer MA, et al. (1998) Estimating
African American admixture proportions by use of population-specific alleles.
Am J Hum Genet 63: 1839–1851.
10. Reich D, Nalls MA, Kao WH, Akylbekova EL, Tandon A, et al. (2009) Reduced
neutrophil count in people of African descent is due to a regulatory variant in the
Duffy antigen receptor for chemokines gene. PLoS Genet 5: e1000360.
11. Shriver MD, Parra EJ, Dios S, Bonilla C, Norton H, et al. (2003) Skin
pigmentation, biogeographical ancestry and admixture mapping. Hum Genet
112: 387–399.
12. Tishkoff SA, Reed FA, Friedlaender FR, Ehret C, Ranciaro A, et al. (2009) The
genetic structure and history of Africans and African Americans. Science 324:
1035–1044.
13. Zakharia F, Basu A, Absher D, Assimes TL, Go AS, et al. (2009) Characterizing
the admixed African ancestry of African Americans. Genome Biol 10: R141.
14. Correia e Silva A (2002) Dinamicas de decomposicao e recomposicao de espacos
e sociedades. In: Santos MEM, editor. Historia geral de Cabo Verde. Lisbon,
Praia: Instituto de Investigacao Cientıfica Tropical, Instituto Nacional de
Investigacao, Promocao e Patrimonio Culturais de Cabo Verde. 1–66.
15. Baleno IC (2001) Povoamento e Formacao da Sociedade. In: Albuquerque LS,
M.E., editor. Historia Geral de Cabo Verde Lisbon, Praia: Instituto de
Investigacao Cientıfica Tropical, Instituto Nacional de Investigacao, Promocao e
Patrimonio Culturais de Cabo Verde. 125–177.
16. Carreira A (1983) Cabo Verde, formacao e extincao de uma sociedade
escravocrata (1460–1878). Lisbon: Comissao da Comunidade Economica
Europeia, Instituto Caboverdeano do Livro.
17. Correia e Silva A (2001) Espaco, ecologia e economia interna. In: de
Albuquerque L, Santos MEM, editors. Historia geral de Cabo Verde. Lisbon,
Praia: Instituto de Investigacao Cientıfica Tropical, Instituto Nacional de
Investigacao, Promocao e Patrimonio Culturais de Cabo Verde.
18. Russell-Wood AJR (1998) The Portuguese Empire, 1415–1808: A World on the
Move. Baltimore, Maryland: Johns Hopkins University Press. 289 p.
19. Curtin PD (1998) The Rise and Fall of the Plantation Complex: Essays in
Atlantic History. Cambridge: Cambridge University Press.
20. Correia e Silva A (2000) Nos tempos do Porto Grande do Mindelo. Praia,
Mindelo: Centro Cultural Portugues. 203 p.
21. Fernandes AT, Velosa R, Jesus J, Carracedo A, Brehm A (2003) Genetic
differentiation of the Cabo Verde archipelago population analysed by STR
polymorphisms. Ann Hum Genet 67: 340–347.
22. Parra EJ, Ribeiro JC, Caeiro JL, Riveiro A (1995) Genetic structure of the
population of Cabo Verde (west Africa): evidence of substantial European
admixture. Am J Phys Anthropol 97: 381–389.
Admixture and Genetic Variation of Cape Verde
PLOS ONE | www.plosone.org 11 November 2012 | Volume 7 | Issue 11 | e51103

23. Brehm A, Pereira L, Bandelt HJ, Prata MJ, Amorim A (2002) Mitochondrial
portrait of the Cabo Verde archipelago: the Senegambian outpost of Atlanticslave trade. Ann Hum Genet 66: 49–60.
24. Goncalves R, Rosa A, Freitas A, Fernandes A, Kivisild T, et al. (2003) Y-
chromosome lineages in Cabo Verde Islands witness the diverse geographicorigin of its first male settlers. Hum Genet 113: 467–472.
25. Quillen EE, Guiltinan JS, Beleza S, Rocha J, Pereira RW, et al. (2011) Iristexture traits show associations with iris color and genomic ancestry. Am J Hum
Biol 23: 567–569.
26. Gravlee CC, Dressler WW (2005) Skin pigmentation, self-perceived color, andarterial blood pressure in Puerto Rico. Am J Hum Biol 17: 195–206.
27. Parra FC, Amado RC, Lambertucci JR, Rocha J, Antunes CM, et al. (2003)Color and genomic ancestry in Brazilians. Proc Natl Acad Sci U S A 100: 177–
182.28. Santos RV, Fry PH, Monteiro S, Maio MC, Rodrigues JC, et al. (2009) Color,
race, and genomic ancestry in Brazil: dialogues between anthropology and
genetics. Curr Anthropol 50: 787–819.29. Shriver MD, Parra EJ (2000) Comparison of narrow-band reflectance
spectroscopy and tristimulus colorimetry for measurements of skin and haircolor in persons of different biological ancestry. Am J Phys Anthropol 112: 17–
27.
30. Smith MW, Patterson N, Lautenberger JA, Truelove AL, McDonald GJ, et al.(2004) A high-density admixture map for disease gene discovery in african
americans. Am J Hum Genet 74: 1001–1013.31. Myakishev MV, Khripin Y, Hu S, Hamer DH (2001) High-throughput SNP
genotyping by allele-specific PCR with universal energy-transfer-labeledprimers. Genome Res 11: 163–169.
32. Consortium Y (2002) A nomenclature system for the tree of human Y-
chromosomal binary haplogroups. Genome Res 12: 339–348.33. Beleza S, Gusmao L, Amorim A, Carracedo A, Salas A (2005) The genetic
legacy of western Bantu migrations. Hum Genet 117: 366–375.34. Beleza S, Gusmao L, Lopes A, Alves C, Gomes I, et al. (2006) Micro-
phylogeographic and demographic history of Portuguese male lineages. Ann
Hum Genet 70: 181–194.35. Hoggart CJ, Parra EJ, Shriver MD, Bonilla C, Kittles RA, et al. (2003) Control
of confounding of genetic associations in stratified populations. Am J HumGenet 72: 1492–1504.
36. Hoggart CJ, Shriver MD, Kittles RA, Clayton DG, McKeigue PM (2004)Design and analysis of admixture mapping studies. Am J Hum Genet 74: 965–
978.
37. Dupanloup I, Bertorelle G (2001) Inferring admixture proportions frommolecular data: extension to any number of parental populations. Mol Biol
Evol 18: 672–675.38. Excoffier L, Laval G., Schneider S. (2005) Arlequin ver. 3.0: An integrated
software package for population genetics data analysis. Evolutionary Bioinfor-
matics Online 1: 47–50.39. Bandelt HJ, Forster P, Sykes BC, Richards MB (1995) Mitochondrial portraits of
human populations using median networks. Genetics 141: 743–753.40. Bandelt HJ, Forster P, Rohl A (1999) Median-joining networks for inferring
intraspecific phylogenies. Mol Biol Evol 16: 37–48.41. Coelho M, Sequeira F, Luiselli D, Beleza S, Rocha J (2009) On the edge of
Bantu expansions: mtDNA, Y chromosome and lactase persistence genetic
variation in southwestern Angola. BMC Evol Biol 9: 80.
42. Balaresque P, Bowden GR, Adams SM, Leung HY, King TE, et al. (2010) A
predominantly neolithic origin for European paternal lineages. PLoS Biol 8:e1000285.
43. Adams SM, Bosch E, Balaresque PL, Ballereau SJ, Lee AC, et al. (2008) The
genetic legacy of religious diversity and intolerance: paternal lineages ofChristians, Jews, and Muslims in the Iberian Peninsula. Am J Hum Genet 83:
725–736.44. Cruciani F, Santolamazza P, Shen P, Macaulay V, Moral P, et al. (2002) A back
migration from Asia to sub-Saharan Africa is supported by high-resolution
analysis of human Y-chromosome haplotypes. Am J Hum Genet 70: 1197–1214.45. Rosa A, Ornelas C, Jobling MA, Brehm A, Villems R (2007) Y-chromosomal
diversity in the population of Guinea-Bissau: a multiethnic perspective. BMCEvol Biol 7: 124.
46. Semino O, Santachiara-Benerecetti AS, Falaschi F, Cavalli-Sforza LL, UnderhillPA (2002) Ethiopians and Khoisan share the deepest clades of the human Y-
chromosome phylogeny. Am J Hum Genet 70: 265–268.
47. Underhill PA, Passarino G, Lin AA, Shen P, Mirazon Lahr M, et al. (2001) Thephylogeography of Y chromosome binary haplotypes and the origins of modern
human populations. Ann Hum Genet 65: 43–62.48. Montrond AA (2008) Francois Louis Armand Fourchent De Montrond. A
Semana. Cape Verde.
49. Tomas G, Seco L, Seixas S, Faustino P, Lavinha J, et al. (2002) The peopling ofSao Tome (Gulf of Guinea): origins of slave settlers and admixture with the
Portuguese. Hum Biol 74: 397–411.50. Giolo SR, Soler JM, Greenway SC, Almeida MA, de Andrade M, et al. (2012)
Brazilian urban population genetic structure reveals a high degree of admixture.Eur J Hum Genet 20: 111–116.
51. Pena SD, Di Pietro G, Fuchshuber-Moraes M, Genro JP, Hutz MH, et al. (2011)
The genomic ancestry of individuals from different geographical regions ofBrazil is more uniform than expected. PLoS One 6: e17063.
52. Carvalho-Silva DR, Santos FR, Rocha J, Pena SD (2001) The phylogeographyof Brazilian Y-chromosome lineages. Am J Hum Genet 68: 281–286.
53. Trovoada MJ, Pereira L, Gusmao L, Abade A, Amorim A, et al. (2004) Pattern
of mtDNA variation in three populations from Sao Tome e Principe. Ann HumGenet 68: 40–54.
54. Heyer E, Sibert A, Austerlitz F (2005) Cultural transmission of fitness: genes takethe fast lane. Trends Genet 21: 234–239.
55. Zerjal T, Xue Y, Bertorelle G, Wells RS, Bao W, et al. (2003) The genetic legacyof the Mongols. Am J Hum Genet 72: 717–721.
56. Bonilla C, Shriver MD, Parra EJ, Jones A, Fernandez JR (2004) Ancestral
proportions and their association with skin pigmentation and bone mineraldensity in Puerto Rican women from New York city. Hum Genet 115: 57–68.
57. Gravlee CC, Dressler WW, Bernard HR (2005) Skin color, social classification,and blood pressure in southeastern Puerto Rico. Am J Public Health 95: 2191–
2197.
58. Florez JC, Price AL, Campbell D, Riba L, Parra MV, et al. (2009) Strongassociation of socioeconomic status with genetic ancestry in Latinos: implications
for admixture studies of type 2 diabetes. Diabetologia 52: 1528–1536.59. Gravlee CC, Non AL, Mulligan CJ (2009) Genetic ancestry, social classification,
and racial inequalities in blood pressure in Southeastern Puerto Rico. PLoS One4: e6821.
60. Sturrock K, Rocha J. (2000) A Multidimensional Scaling Stress Evaluation
Table. Field Methods 12: 49–60.
Admixture and Genetic Variation of Cape Verde
PLOS ONE | www.plosone.org 12 November 2012 | Volume 7 | Issue 11 | e51103


