Embed Size (px)
Citation preview

Human MutationRESEARCH ARTICLE
Measurement of Admixture Proportions and Descriptionof Admixture Structure in Different U.S. Populations
Indrani Halder,1 Bao-Zhu Yang,2,5 Henry R. Kranzler,6 Murray B. Stein,7,8 Mark D. Shriver,1 and Joel Gelernter2–5�
1Department of Anthropology, Pennsylvania State University, University Park, Pennsylvania; 2Department of Psychiatry, Division of Human
Genetics, Yale University School of Medicine, New Haven, Connecticut; 3Department of Genetics, Yale University School of Medicine, New
Haven, Connecticut; 4Department of Neurobiology, Yale University School of Medicine, New Haven, Connecticut; 5VA CT Healthcare Center
116A2, West Haven, Connecticut; 6Alcohol Research Center, Department of Psychiatry, University of Connecticut School of Medicine,
Farmington, Connecticut; 7Department of Psychiatry, University of California, San Diego, La Jolla, California; 8Department of Family and
Preventive Medicine, University of California, San Diego, La Jolla, California
Communicated by Pui-Yan KwokReceived 29 November 2008; accepted revised manuscript 24 April 2009.
Published online 12 May 2009 in Wiley InterScience (www.interscience.wiley.com). DOI 10.1002/humu.21045
ABSTRACT: Variation in individual admixture proportionsleads to heterogeneity within populations. Though novelmethods and marker panels have been developed toquantify individual admixture, empirical data describingindividual admixture distributions are limited. Weinvestigated variation in individual admixture in fourU.S. populations (European American [EA], AfricanAmerican [AA], Hispanics from Connecticut [EastCoast, or EC], and Hispanics from California [WestCoast, or WC]) assuming three-way intermixture amongEuropeans, Africans, and Indigenous Americans. Ad-mixture estimates were inferred using a panel of 36microsatellites and one SNP, which have significant allelefrequency differences between ancestral populations, andby using both a maximum likelihood (ML)-based methodand a Bayesian method implemented in the programSTRUCTURE. Simulation studies showed that estimatesobtained with this marker panel are within 96% ofexpected values. EAs had the lowest non-Europeanadmixture with both methods, but showed greaterhomogeneity with STRUCTURE than with ML. Allother samples showed a high degree of variation inadmixture estimates with both methods, were highlyconcordant, and showed evidence of admixture stratifica-tion. With both methods, AA subjects had on average,16% European and o10% Indigenous American admix-ture. EC Hispanics had higher mean African admixtureand the WC Hispanics had higher mean IndigenousAmerican admixture, possibly reflecting their differentcontinental origins.Hum Mutat 30:1299–1309, 2009. & 2009 Wiley-Liss, Inc.
KEY WORDS: admixture stratification; geographic hetero-geneity; demographic history
Introduction
Understanding the genetic structure of populations is of geneticand anthropological interest. It is also of practical importance forthe valid control of population stratification in case-controlassociation studies. Each individual in a population has a uniquegenetic history. Thus, evaluating genetic variation within andbetween populations has important consequences for bothforensic and medical genetics. The United States has threepredominant population groups. According to recent estimatesof the U.S. Census Bureau [2008] (Table NC-EST2007-03),African Americans (AAs) represent 12.3% of the total U.S.population. This category designates a range of people, includingthose of exclusively African origin with little or no mixed ancestryand people of African descent who have substantial non-Africanadmixture. Hispanics (or Latinos) represent 15% of the total U.S.population and include Mexican Americans, Puerto Ricans,Cubans, and others who speak Spanish; i.e., they are categorizedbased on language and cultural identity rather than ancestry.These populations may, depending on the particular groupsampled, have very different individual admixture proportions[Halder et al., 2008].
The prevalence of many diseases differs between populationsand there is evidence that some of the differences reflect groupgenetic differences—for example, hypertension and prostatecancer in AAs [Douglas et al., 1996; Hoffman et al., 2001] anddiabetes in American Indians [Martinez, 1993; Songer andZimmet, 1995] (for a more detailed summary, see Table 1 inHalder and Shriver, 2003). Understanding the genetic structure ofpopulations and exploring biogeographical heterogeneity mayyield a better understanding of the genetic processes and,eventually, disease etiology in these populations, thereby decom-posing the sources of variation (i.e., environmental, genetic, andgene–environment interactions) that contribute to the disease.Understanding and characterizing such variation will also help theforensic community and efforts can be made to construct regionaldatabases.
The process of intermixture between populations (or indivi-duals within populations) that have been geographically separatedresults in a newly admixed population. Different models havebeen proposed to explain and model the process of admixture[Long, 1991; Pfaff et al., 2001]. The two extreme cases are‘‘hybrid isolation,’’ in which admixture occurs in a single
OFFICIAL JOURNAL
www.hgvs.org
& 2009 WILEY-LISS, INC.
Additional Supporting Information may be found in the online version of this article.
Current address of Indrani Halder: Cardiovascular Institute, University of
Pittsburgh Medical Center, Pittsburgh, PA 15213.�Correspondence to: Joel Gelernter, MD, Yale University School of Medicine,
Department of Psychiatry, Division of Human Genetics in Psychiatry, VA CT 116A2,
950 Campbell Avenue, West Haven, CT 06516. E-mail: [email protected]

generation between different ancestral populations, and ‘‘contin-uous gene flow,’’ in which admixture occurs through successivegenerations between one or more of the ancestral populationsand the new admixed population. Contemporary admixedpopulations usually have histories in which both processeshave contributed, thereby creating a compound distributionof individual admixture proportions in the population.The investigation and interpretation of this variation inindividual admixture levels within a population are importantfor modeling population structure and controlling type I and typeII errors caused by undetected stratification in genetic associationstudies.
To study the genetic variation within and between populations,we conducted individual admixture analysis in four U.S. residentpopulations: EA, AA, and two Hispanic populations from twodifferent regions, referred to henceforth as East Coast Hispanics(EC) and West Coast Hispanics (WC). Although certainassumptions are inherent in the measurement of biogeographicalancestry and admixture, the estimates provide an initial basis forunderstanding the genetic variability in population samples. Priorliterature has shown that substantial variation in individualadmixture proportions exist in the AA, EC, and WC populations[Bonilla et al., 2004a,b; Parra et al., 2001; Reiner et al., 2005;Shriver et al., 2005; Halder et al., 2008]. In contrast, EAs aregenerally assumed to be more homogenous although not devoid
of genetic stratification [Bauchet et al., 2007]. Using a panel of 37microsatellites and one SNP marker, which are informative ofcontinental origin, we investigated variation in individualadmixture proportions in the four U.S. populations.
Subjects and Methods
Populations
Three of the populations studied in this report were recruited atthe University of Connecticut Health Center (Farmington, CT) aspart of larger studies of the genetics of alcohol and drugdependence and affective disorders. These include unrelatedindividuals who self-identified as European Americans (EA)(N 5 652), African Americans (AA) (N 5 228), and Hispanics(EC) (N 5 102). Details on sample collection and characteristicshave been described previously [Yang et al., 2005a; Luo et al.,2005]. Subjects were evaluated using the Diagnostic and StatisticalManual 4th edition (DSM-IV) Structured Clinical Interview forthe DSM (SCID), and individuals with a primary diagnosis of amajor psychotic illness (schizophrenia or schizoaffective disorder)were excluded from analysis. The fourth sample consisted of 89unrelated Hispanic individuals recruited from Southern California(WC) as part of a previously reported study of affective disorders[Stein et al., 2004]. Although detailed familial ancestry was notspecifically asked for, each subject self-identified as belonging tothe racial group in which they have been included. Neither were allsubjects free of major complex diseases. Since no phenotypes werestudied in the current report, subjects were randomly selectedfrom the larger cohorts irrespective of their phenotypic status.
Ancestral allele frequencies and genotypes were ascertained in59 Spanish, 88 Mexican, and 78 individuals from Sierra Leone,who have been described and used previously for individualadmixture estimation [Shriver et al., 2003; Bonilla et al., 2005].These samples served as reference European (EU), IndigenousAmerican (IA), and West African (AF) ancestral groups,respectively. The Mexican sample from Guerrero, Mexico, hasbeen shown to have very low European or African admixture[Bonilla, 2005] and was used as a representative IA population. Allsubjects provided written informed consent and InstitutionalReview Board (IRB) approvals were obtained prior to studyinitiation.
Genetic Markers
The ancestry informative markers (AIMs) used in the presentstudy are the same as those we have described previously [Stein et al.,2004; Yang et al., 2005a,b] and included 36 microsatellites and oneSNP (FY; rs2814778). Of the short tandem repeats (STRs), 15 loci areused in forensic analyses as part of the combined DNA identificationsystem (CODIS: D8S1179, D21S11, D7S820, CSF1PO, D3S1358,TH01, D13S317, D16S539, D2S1338, D19S443, vWA, TPOX,D18S51, D5S818, and FGA). An additional panel of 21 markerswas selected from published reports. These markers typically havehigh allele frequency differences between European and Africanpopulations as well as between EA and AA, and in some cases,between Hispanic and Asian populations [Smith et al., 2001] andincluded the markers D1S196, D1S2628, D2S162, D2S319, D5S407,D5S410, D6S1610, D7S640, D7S657, D8S272, D8S1827, D9S175,D10S197, D10S1786, D11S935, D12S352, D14S68, D15S1002,D16S3017, D17S799, and D22S274. Genotyping was conducted asreported previously [Yang et al., 2005a, b]. Some of the current
Table 1. dc Values For All Pairwise Comparisons
Markers AF-EU AF-IA EU-IA
CSF1PO 0.232 0.211 0.140
D10S1786 0.470 0.545 0.516
D10S197 0.424 0.307 0.275
D11S935 0.756 0.583 0.337
D12S352 0.283 0.574 0.635
D13S317 0.265 0.519 0.452
D14S68 0.292 0.422 0.225
D15S1002 0.573 0.560 0.405
D16S3017 0.447 0.347 0.530
D16S539 0.181 0.231 0.246
D17S799 0.522 0.668 0.541
D18S51 0.320 0.310 0.204
D19S433 0.244 0.533 0.372
D1S196 0.270 0.337 0.160
D1S2628 0.624 0.479 0.339
D21S11 0.227 0.356 0.215
D22S274 0.339 0.377 0.372
D2S1338 0.447 0.352 0.424
D2S162 0.473 0.599 0.185
D3S1358 0.150 0.299 0.328
D5S407 0.369 0.419 0.371
D5S410 0.516 0.667 0.523
D5S818 0.207 0.510 0.331
D6S1610 0.456 0.517 0.412
D7S2469 0.360 0.359 0.359
D7S640 0.532 0.577 0.450
D7S657 0.682 0.503 0.393
D7S820 0.125 0.429 0.403
D8S1179 0.230 0.402 0.243
D8S1827 0.409 0.534 0.124
D8S272 0.458 0.552 0.428
D9S175 0.494 0.743 0.515
FGA 0.246 0.312 0.264
FY 0.968 0.980 0.012
TH01 0.421 0.483 0.369
TPOX 0.210 0.377 0.233
VWA 0.131 0.333 0.296
Total d 14.354 17.305 12.626
Average d 0.388 0.468 0.341
1300 HUMAN MUTATION, Vol. 30, No. 9, 1299–1309, 2009

subjects were included in our prior reports but most were genotypedspecifically for this study.
Individual Admixture Estimation
Individual admixture was estimated using both a maximumlikelihood (ML) method and a separate Bayesian method asimplemented in the program STRUCTURE [Pritchard et al., 2000;Falush et al., 2003]. A software program, MLIAE, was written toimplement the ML method, as previously described [Hanis et al.,1986; Chakraborty and Weiss, 1988]. The algorithm computes theprobability of observing a marker genotype given ancestral allelefrequencies at a locus. Summing over the logs of individual locusprobabilities combines information across multiple loci. Theadmixture proportion that maximizes the probability of obtainingthe observed genotype is the ML estimate (MLE) of ancestry for theindividual. Estimates of individual admixture in the EA, AA, and thetwo Hispanic samples were calculated under a trihybrid (i.e., k 5 3)model of admixture between EU, AF, and IA populations.
The models in STRUCTURE were set up to incorporate andidentify ancestral populations by specifying both the ‘‘Usepopinfo’’and ‘‘Popflag’’ options and allowing for admixture. Separatemodels were set up to analyze EA, AA, EC, and WC, but eachmodel included 59 Spanish, 88 Mexican, and 78 African ancestralindividuals. In addition, allele frequencies were specified as beinguncorrelated and a separate ‘‘alpha’’ parameter (that characterizesthe distribution of admixture proportions in each individual) wasassumed for each population to allow for variation in ancestryproportions among individuals from different populations. Thenumber of subpopulations (K) was specified from 1 to 3. Foradequate convergence of the STRUCTURE algorithm, runs ofdifferent lengths were simulated. Final runs consisted of 40,000burn-in iterations followed by an additional 80,000 for parameterestimation. For all other options the default parameters were used.
Sample Characterization
Allele frequency estimates and exact tests for Hardy-Weinbergequilibrium (HWE) were carried out using Genepop software[Rousset and Raymond, 1995]. All statistical analyses (other thanthose described above) were carried out in SPSS v10 (SPSS, Inc.,Chicago, IL). Comparisons between group means were testedusing t-tests. The individual admixture distributions betweengroups were compared using the Kolmogorov-Smirnov test fortwo samples. Marker information content for ancestry wasestimated as the composite d (dc) value, which is an extensionof biallelic d, the difference in allele frequencies of twopopulations, to a multiallelic situation [Shriver et al., 1997]. dc
is defined as:
dc ¼ 1=2�Xn
i¼1
jfiA � fiBj ð1Þ
where fiA and fiB are the frequencies of the ith allele in the twopopulations, A and B, being compared at a locus. We alsocomputed marker informativeness for ancestry estimation, In, asdefined previously [Rosenberg et al., 2003] using the programInfocalc v1.1 available at Dr. Rosenberg’s website (http://rosenberglab.bioinformatics.med.umich.edu/infocalc.html).
Detection of Stratification Related to Admixture
We used STRUCTURE [Pritchard et al., 2000; Falush et al., 2003]to test for the presence of subpopulations within the sample being
studied. STRUCTURE requires as input a predefined number ofpopulations (K); we tested for K 5 1–3. These STRUCTURE runsdid not include subjects from predefined ancestral populations. Amodel with admixture, uncorrelated allele frequencies, and separatealpha parameters was specified, and the program was run with30,000 burn-in iterations followed by 70,000 iterations for parameterestimation. The values of log Probability of Data for K 5 1, 2, and 3were compared to evaluate the presence of stratification. We alsoused the Individual Ancestry Correlation test [Shriver et al., 2005],in which the original marker panel is split randomly into twononoverlapping sets of markers [Pfaff et al., 2001]. The procedure ofrandomly splitting markers was repeated 20 times and ancestry wasestimated separately with each of the different (20� 2) sets ofmarkers. Significant correlation between half-sets was used to inferpresence of stratification.
Simulation Studies
Simulated data sets were generated using an algorithmdescribed previously [Halder et al., 2008]. First, we simulated1000 unadmixed individuals from each of the EU, AF, and IAancestral populations. Since each individual is expected to have100% ancestry from one ancestral group, we compared measuredadmixture proportions to the expected 100% ancestry from apopulation and ascertained ‘‘population bias’’ (total ancestry fromnoncontributing populations, e.g., total non-EU admixture in asimulated individual who is expected to be 100% EU) and the‘‘ancestry bias’’(total contribution from one noncontributingpopulation to other populations in the analysis, e.g., the % IAancestry in simulated 100% EU individuals) of the marker panel.
Results
Allele Frequencies and Ancestry Informativenessof Markers
Allele frequencies for all markers in all populations are shown inSupp. Table S1. We have previously reported the allele frequenciesof these markers for EU and AF populations [Yang et al., 2005b]and reproduce them here to demonstrate marker dc values andcompare them to allele frequencies in other populations studiedhere. All markers within each population were tested forconsistency with HWE expectations and those not consistentwith HWE are indicated in Supp. Table S1. The EU, AF, and IApopulations were used to ascertain ancestral allele frequencies forsubsequent admixture analyses.
Allele frequency differences (dc) between the ancestral popula-tions are shown in Table 1. The total dc value for pairwisecomparisons was highest between AF and IA and lowest betweenthe IA and EU. Markers with dZ0.3 have previously been shown inempirical studies to be particularly useful for ancestry estimation[Parra et al., 1998; Collins-Schramm et al., 2002; Shriver et al.,2003; Bonilla et al., 2004a,b]. The proportion of markers withdZ0.3 was 22/36 for the EU-AF comparison, 33/36 for the AF-IAcomparison, and 23/36 for the EU-IA comparison. That said,markers were not excluded from the panel if they had dco0.3 forany one pairwise comparison and two markers (CSF1PO andD16S539) did have dco0.3 for all pairwise comparisons. The onlySNP in this panel, FY, is an African ancestry-specific marker andshows nearly 100% allele frequency difference between the Africanand non-African ancestral populations.
HUMAN MUTATION, Vol. 30, No. 9, 1299–1309, 2009 1301

Ancestry informativeness (In) of markers assuming a three-wayadmixture model with equal priors showed that In values rangedfrom 0.07 to 0.572 (Supp. Table S2). In values within and inclusiveof 0.131 and 0.216 correspond to a d5 0.5 and are consideredhighly informative for ancestry information [Rosenberg et al.,2003]. In this panel, 27 out of 36 markers are above the lowerrange of this In value (i.e., 40.131).
Individual Admixture Proportions in U.S. Populations
Table 2 shows mean admixture estimates obtained with eachmethod and the correlations between these estimates. Histogramsdepicting frequency of individual admixture distributions ob-tained using ML are shown in Figure 1, and those obtained withSTRUCTURE are shown in Figure 2. Triangle plots depicting thedistribution of individual admixture in each population using MLand STRUCTURE are shown in Supp. Figures S1 and S2. ML and
STRUCTURE estimates showed significant correlations andsimilar trends in all population samples. Figure 3 shows thecorrelation between ML and STRUCTURE estimates for theancestral group contributing maximally to a population.
Both methods detected high mean EU admixture andsignificant (Po0.0001) non-EU admixture in the EA sample,indicating that for some of the EA individuals, we were able todetect non-EU admixture. However, mean estimates obtained withthe two methods were significantly different (Po0.0001) for eachancestry axis (Table 2). STRUCTURE estimates were more tightlyclustered compared to ML estimates (compare Supp. Figs. S1 andS2). This discrepancy was also reflected in the lower correlationsbetween estimates obtained with the two methods when comparedto correlations observed in AA, EC, and WC (Table 2).
Individual admixture estimates showed wider distribution inAA, EC, and WC groups, in comparison to the EA sample.Although correlations between estimates obtained with ML and
Table 2. Mean7Standard Deviations of Estimates of Individual Admixture�
ML STRUCTURE Correlations
Population (N) IA EU AF IA EU AF IA EU AF
EA (652) 0.1070.1 0.8470.12 0.0670.07 0.0170.01 0.9870.02 0.0170.02 0.43 0.267 0.214
AA (228) 0.0870.08 0.1770.14 0.7570.15 0.0470.02 0.1670.07 0.8170.08 0.689 0.796 0.841
EC (102) 0.1970.16 0.5970.19 0.2270.18 0.1770.10 0.6570.13 0.1870.12 0.924 0.917 0.914
WC (89) 0.3670.18 0.5370.2 0.1170.14 0.3670.10 0.5670.11 0.0870.07 0.967 0.944 0.926
�ML and STRUCTURE means significantly different (Po0.0001) for all ancestry axes in all populations. P-values for all Spearman’s rank correlation coefficients o0.0001.
Figure 1. Histograms showing the distribution of individual admixture estimates in all four populations using the maximum likelihood method.The X-axis represents proportional ancestry bins, the Y-axis represents number of individuals who have admixture proportions within thedesignated bins. White bars represent proportional European admixture, black bars represent proportional West African admixture, and graybars represent proportional Indigenous American admixture. EA, European Americans; AA, African Americans; ECH, East Coast Hispanics fromCT; WCH, West Coast Hispanics from CA.
1302 HUMAN MUTATION, Vol. 30, No. 9, 1299–1309, 2009

STRUCTURE were higher in these three population samplescompared to the EA sample (Table 2; Fig. 3), the meanswere significantly different for all populations across all ancestrygroups (Table 2). With both methods, the AA sample had highmean EU and mean AF admixture and much lower but significant(Po0.0001) nonzero IA admixture. In the two Hispanic groups,mean EU admixture was the highest, with substantial AF andIA admixture (Table 2). The histograms in Figures 1 and 2 furtherdemonstrate that ancestry estimates for the three admixedpopulations are bound within certain limits of ancestry propor-tions; e.g., ML estimates indicate that 35% of AA show noIA ancestry, but in contrast, using STRUCTURE, 35% ofAAs show 0.05 IA ancestry. However, not all individuals whohave 0 IA admixture with ML show 0.05 IA ancestry withSTRUCTURE.
Despite significant correlations in admixture estimates obtainedwith the two methods (Fig. 3), the absolute values of the estimatesfor each ancestry axis differed significantly (Table 2). In general,STRUCTURE estimates showed tighter clustering compared toML estimates (see Supp. Figs. S1 and S2). The most strikingdiscrepancies between STRUCTURE and ML estimates wereobserved in the EA sample, in which the STRUCTURE methodyielded results that showed most individuals to have 95 to100% EU ancestry, whereas ML estimates had a wider range of50 to 100%.
Difference in Admixture Proportions Between TwoHispanic Samples
Two-sample t-tests comparing mean admixture proportionsshowed that IA and AF estimates obtained with both ML andSTRUCTURE are significantly different (Po0.0001 for all)between the EC and WC samples (Table 2), and persistafter Bonferroni correction is applied to account for multiplecorrections. EC had significantly higher AF admixture (ML:22% in EC vs. 11% in WC; STRUCTURE: 18% in EC vs. 8% inWC), while WC had significantly higher IA admixture (ML:36% in WC vs. 19% in EC; STRUCTURE: 36% in WC vs. 17% inEC). Although ML estimated EU admixture proportions didnot vary between the groups, STRUCTURE estimated EUadmixture was significantly higher in EC compared to WC(65% vs. 56%).
We compared the difference in distributions of individualadmixture estimates using a two-sample Kolmogorov-Smirnovtest (Table 3). We rejected the null hypothesis that samples arefrom the same distribution at a significance level of P 5 0.016(after Bonferroni correction for multiple testing). For the MLestimates, significant differences were observed for AF and IA(Po0.0001 for both), but not for EU (P 5 0.195). However,estimates obtained with STRUCTURE show significant differencesfor all ancestry axes (Po0.0001). Together, these tests indicate that
Figure 2. Histograms showing the distribution of individual admixture estimates in all four populations using STRUCTURE. The X-axisrepresents proportional ancestry bins, the Y-axis represents number of individuals who have admixture proportions within the designated bins.White bars represent proportional European admixture, black bars represent proportional West African admixture, and gray bars representproportional Indigenous American admixture. EA, European Americans; AA, African Americans; ECH, East Coast Hispanics from CT; WCH, WestCoast Hispanics from CA. Compare the tighter clustering in Figure 2 with the clustering in Figure 1.
HUMAN MUTATION, Vol. 30, No. 9, 1299–1309, 2009 1303

there are significant differences in admixture proportions betweenEC and WC samples.
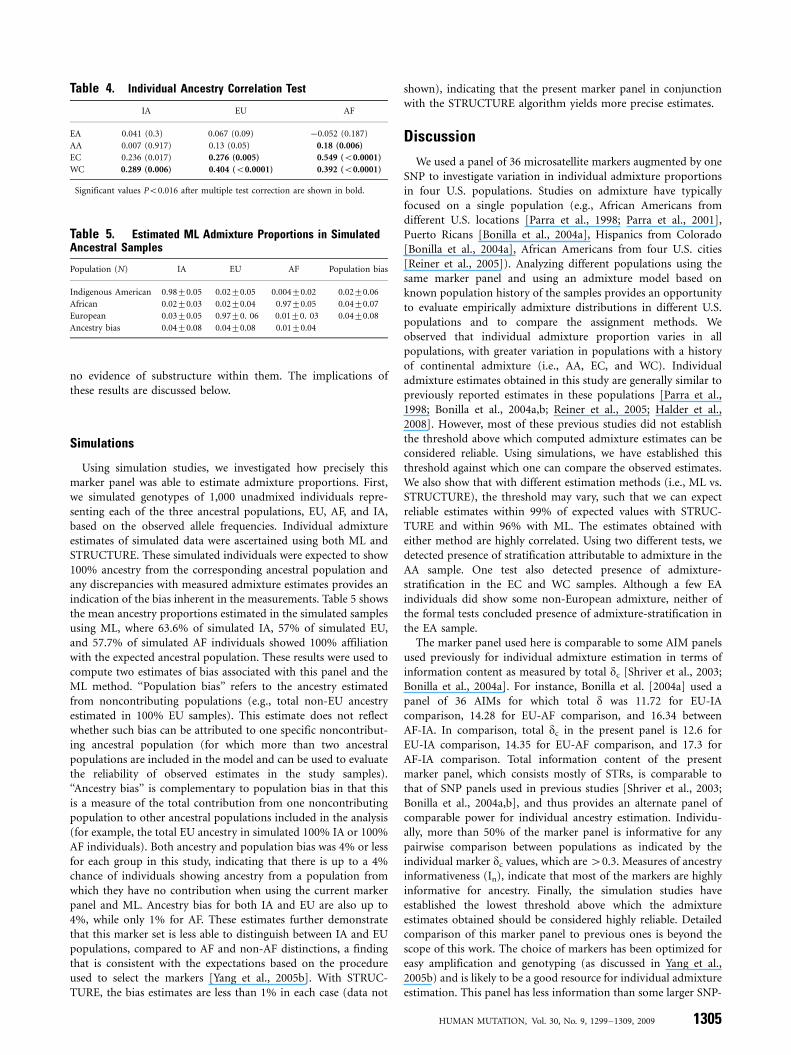
Tests for Admixture Stratification
Results of the Individual Ancestry Correlation Test (IACT)using ML estimates are shown in Table 4. AA, EC, and WCsamples all show evidence of admixture stratification, withsignificant correlations observed between estimates obtained withnonsyntenic marker panels for the ancestral group that con-
tributes maximally to that sample. However, no evidence ofadmixture stratification was detected in the EA sample.
Using STRUCTURE, we tested for the presence of subpopula-tions, as measured by deviations from HWE and linkageequilibrium in the sample, given the genotypes, by specifyingmodels with predefined numbers of subpopulations (K 5 1, 2, or3) and not including any ancestral population. In the AA sample,individuals were assigned to two subpopulations with greaterprobability than to one or three subpopulations. In the othersamples, EA, EC, and WC, K 5 1 was the best option, indicating
Figure 3. Correlations between individual admixture estimates obtained with ML and STRUCTURE for the ancestral group that contributesmaximally to a population. STRUCTURE estimates are shown in the X-axis and ML estimates are shown on the Y-axis. EA, European Americans;AA, African Americans; ECH, East Coast Hispanics from CT; WCH, West Coast Hispanics from CA. Individual European admixture is shown forEA, ECH, and WCH; individual West African admixture is shown for AA. Higher correlations are observed in the AA, EC, and WC samplescompared to the EA sample. All correlations are highly significant.
Table 3. Comparing Admixture in Two Hispanic Populations
t-test (P value) K-S test (P value)
Admixture axis MLE STR MLE STR
EU 2.06 (0.041) 4.88 (o0.0001) 0.1534 (0.195) 0.3262 (o0.0001)
AF 4.76 (o0.0001) 0.769 (o0.0001) 0.3594 (o0.0001) 0.5974 (o0.0001)
IA �6.62 (o0.0001) �12.73 (o0.0001) 0.545 (o0.0001) 0.7643 (o0.0001)
K-S, Kolmogorov-Smirnov.
1304 HUMAN MUTATION, Vol. 30, No. 9, 1299–1309, 2009
no evidence of substructure within them. The implications ofthese results are discussed below.
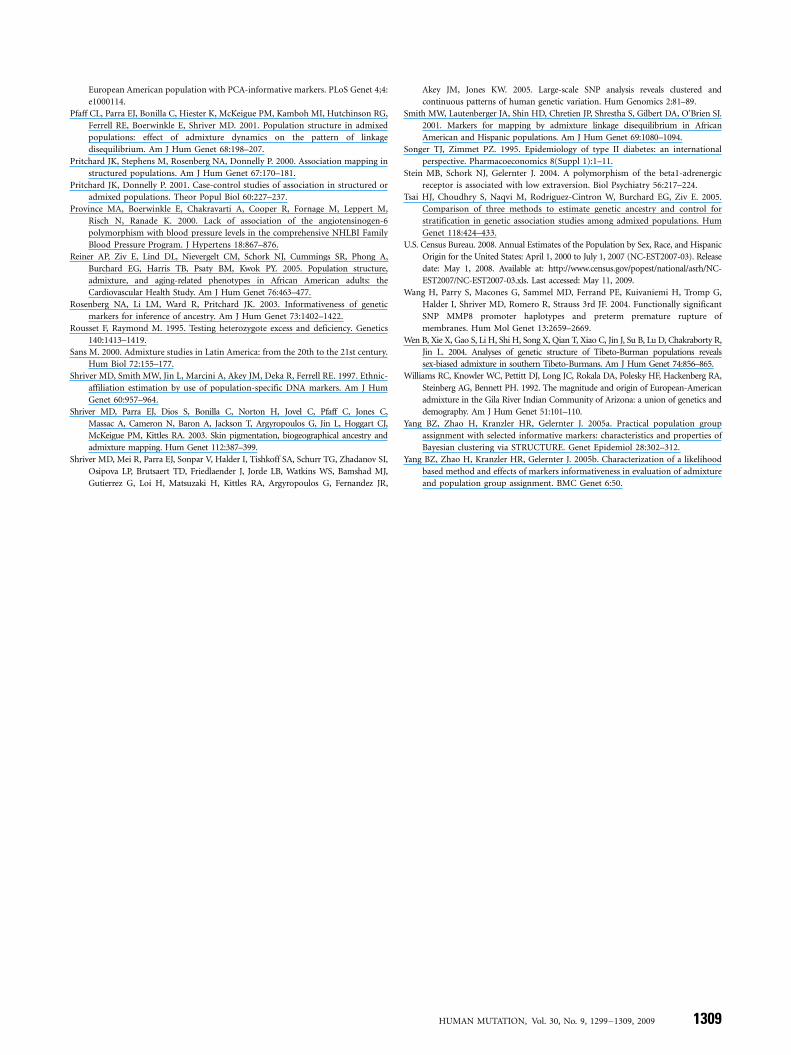
Simulations
Using simulation studies, we investigated how precisely thismarker panel was able to estimate admixture proportions. First,we simulated genotypes of 1,000 unadmixed individuals repre-senting each of the three ancestral populations, EU, AF, and IA,based on the observed allele frequencies. Individual admixtureestimates of simulated data were ascertained using both ML andSTRUCTURE. These simulated individuals were expected to show100% ancestry from the corresponding ancestral population andany discrepancies with measured admixture estimates provides anindication of the bias inherent in the measurements. Table 5 showsthe mean ancestry proportions estimated in the simulated samplesusing ML, where 63.6% of simulated IA, 57% of simulated EU,and 57.7% of simulated AF individuals showed 100% affiliationwith the expected ancestral population. These results were used tocompute two estimates of bias associated with this panel and theML method. ‘‘Population bias’’ refers to the ancestry estimatedfrom noncontributing populations (e.g., total non-EU ancestryestimated in 100% EU samples). This estimate does not reflectwhether such bias can be attributed to one specific noncontribut-ing ancestral population (for which more than two ancestralpopulations are included in the model and can be used to evaluatethe reliability of observed estimates in the study samples).‘‘Ancestry bias’’ is complementary to population bias in that thisis a measure of the total contribution from one noncontributingpopulation to other ancestral populations included in the analysis(for example, the total EU ancestry in simulated 100% IA or 100%AF individuals). Both ancestry and population bias was 4% or lessfor each group in this study, indicating that there is up to a 4%chance of individuals showing ancestry from a population fromwhich they have no contribution when using the current markerpanel and ML. Ancestry bias for both IA and EU are also up to4%, while only 1% for AF. These estimates further demonstratethat this marker set is less able to distinguish between IA and EUpopulations, compared to AF and non-AF distinctions, a findingthat is consistent with the expectations based on the procedureused to select the markers [Yang et al., 2005b]. With STRUC-TURE, the bias estimates are less than 1% in each case (data not
shown), indicating that the present marker panel in conjunctionwith the STRUCTURE algorithm yields more precise estimates.
Discussion
We used a panel of 36 microsatellite markers augmented by oneSNP to investigate variation in individual admixture proportionsin four U.S. populations. Studies on admixture have typicallyfocused on a single population (e.g., African Americans fromdifferent U.S. locations [Parra et al., 1998; Parra et al., 2001],Puerto Ricans [Bonilla et al., 2004a], Hispanics from Colorado[Bonilla et al., 2004a], African Americans from four U.S. cities[Reiner et al., 2005]). Analyzing different populations using thesame marker panel and using an admixture model based onknown population history of the samples provides an opportunityto evaluate empirically admixture distributions in different U.S.populations and to compare the assignment methods. Weobserved that individual admixture proportion varies in allpopulations, with greater variation in populations with a historyof continental admixture (i.e., AA, EC, and WC). Individualadmixture estimates obtained in this study are generally similar topreviously reported estimates in these populations [Parra et al.,1998; Bonilla et al., 2004a,b; Reiner et al., 2005; Halder et al.,2008]. However, most of these previous studies did not establishthe threshold above which computed admixture estimates can beconsidered reliable. Using simulations, we have established thisthreshold against which one can compare the observed estimates.We also show that with different estimation methods (i.e., ML vs.STRUCTURE), the threshold may vary, such that we can expectreliable estimates within 99% of expected values with STRUC-TURE and within 96% with ML. The estimates obtained witheither method are highly correlated. Using two different tests, wedetected presence of stratification attributable to admixture in theAA sample. One test also detected presence of admixture-stratification in the EC and WC samples. Although a few EAindividuals did show some non-European admixture, neither ofthe formal tests concluded presence of admixture-stratification inthe EA sample.
The marker panel used here is comparable to some AIM panelsused previously for individual admixture estimation in terms ofinformation content as measured by total dc [Shriver et al., 2003;Bonilla et al., 2004a]. For instance, Bonilla et al. [2004a] used apanel of 36 AIMs for which total d was 11.72 for EU-IAcomparison, 14.28 for EU-AF comparison, and 16.34 betweenAF-IA. In comparison, total dc in the present panel is 12.6 forEU-IA comparison, 14.35 for EU-AF comparison, and 17.3 forAF-IA comparison. Total information content of the presentmarker panel, which consists mostly of STRs, is comparable tothat of SNP panels used in previous studies [Shriver et al., 2003;Bonilla et al., 2004a,b], and thus provides an alternate panel ofcomparable power for individual ancestry estimation. Individu-ally, more than 50% of the marker panel is informative for anypairwise comparison between populations as indicated by theindividual marker dc values, which are 40.3. Measures of ancestryinformativeness (In), indicate that most of the markers are highlyinformative for ancestry. Finally, the simulation studies haveestablished the lowest threshold above which the admixtureestimates obtained should be considered highly reliable. Detailedcomparison of this marker panel to previous ones is beyond thescope of this work. The choice of markers has been optimized foreasy amplification and genotyping (as discussed in Yang et al.,2005b) and is likely to be a good resource for individual admixtureestimation. This panel has less information than some larger SNP-
Table 4. Individual Ancestry Correlation Test�
IA EU AF
EA 0.041 (0.3) 0.067 (0.09) �0.052 (0.187)
AA 0.007 (0.917) 0.13 (0.05) 0.18 (0.006)
EC 0.236 (0.017) 0.276 (0.005) 0.549 (o0.0001)
WC 0.289 (0.006) 0.404 (o0.0001) 0.392 (o0.0001)
�Significant values Po0.016 after multiple test correction are shown in bold.
Table 5. Estimated ML Admixture Proportions in SimulatedAncestral Samples
Population (N) IA EU AF Population bias
Indigenous American 0.9870.05 0.0270.05 0.00470.02 0.0270.06
African 0.0270.03 0.0270.04 0.9770.05 0.0470.07
European 0.0370.05 0.9770. 06 0.0170. 03 0.0470.08
Ancestry bias 0.0470.08 0.0470.08 0.0170.04
HUMAN MUTATION, Vol. 30, No. 9, 1299–1309, 2009 1305

AIM panels, but it can provide good estimates of individualadmixture. This marker set has some advantages. Many of themarkers are from the standard CODIS panel and have been widelygenotyped in several populations [Budowle et al., 2001] while othersare from previously published studies [Smith et al., 2001] and arepart of standard Marshfield marker panels. Thus, obtaining ancestralallele frequencies from other populations is straightforward. Severalexisting genotype–phenotype databases (for example, those basedon reports from the Framingham Heart (http://www.framinghamheartstudy.org/), HyperGen (http://www.biostat.wustl.edu/hypergen/hypergen.shtml), GenNet [Province et al., 2000], andGenoa [Daniels et al., 2004] studies) have all used the Marshfieldpanel of markers (http://research.marshfieldclinic.org/genetics/GeneticResearch/screeningsets.asp) and should already have manyof these marker genotypes available. Genotyping the additionalCODIS markers included in the current panel may add more valuethan genotyping an entirely new SNP AIM panel for individualadmixture estimation in these samples. With the threshold ofaccurate admixture estimates now defined by our simulation studies,this panel should prove to be an important resource in populationbased studies. We chose to use a three-way admixture modelcomparing EU, AF, and IA populations because of the closeassociation among these populations in the United States for aslong as 500 years. While the history of migration and admixture is awell documented and a continuing process in AA, EC, and WCpopulations, EAs are a more homogeneous group. However, giventhe close association of the populations in the continental UnitedStates, it is likely that some EA individuals have non-Europeanadmixture. Indeed, both admixture estimation methods showed lowlevels of non-European admixture in this sample. The biologicalsignificance of this variation or the possible effects that this may haveon phenotype-association studies warrants further investigation. Aninteresting aspect of our results is the difference in admixtureestimates between the EC and WC samples. The term ‘‘Hispanic’’denotes individuals who share a common language rather than ashared geographical origin and includes Mexicans, Cubans, PuertoRicans, and numerous other South and Central American popula-tions. Depending on the demographic history of the populationsampled, the admixture proportions may differ. In our study, the ECsample from Connecticut is more likely to be of Puerto Rican originand has higher AF admixture compared to the WC sample. Incontrast, the WC sample recruited from California has greaterMexican contribution, reflected in higher detected IA admixturecompared to the EC sample. These results further illustrate whygenetic association studies in different ‘‘Hispanic’’ groups may yieldvery different results, if the phenotype being tested varies as afunction of genetic ancestry.
Individual admixture estimates obtained with STRUCTUREand ML were highly correlated in AA, EC and WC, and to a lesserextent in EA. While correlation in admixture estimates obtainedwith different methods may be used as an indicator of reliability ofthese estimates [Shriver et al., 2003, 2005; Bonilla et al., 2004a,b;Reiner et al., 2005], we also found that the estimates differedsignificantly based on the method used. This is exemplified in thetighter clustering of STRUCTURE estimates compared to MLestimates (see for instance Supp. Figs. S1 and S2), and likelyreflects the differences in statistical theories underlying theestimation procedures. Simulation studies have shown that withlarge sample sizes and large panels of AIMs, Bayesian and MLestimates will be asymptotically equivalent [McKeigue et al., 2005;Tsai et al., 2005]. But the assumptions underlying each estimationmethod are different and the results should be interpreted afterconsidering these assumptions. ML relies on prespecification of
the exact ancestral allele frequencies. More precise estimates ofancestry depend on: 1) appropriate ancestral populations beingspecified; 2) use of adequate sample sizes used to estimateancestral allele frequencies; 3) use of a complete data set with fewmissing genotypes; and 4) use of a sufficiently informative panelof AIMs. Estimates for each individual depend on the exactmarkers genotyped in that individual, and since each locus istreated as an independent observation, the information inherentin linked loci cannot be used explicitly (unless haplotypes aremodeled and haplotype frequencies are used). The sample size ofthe admixed population under investigation has no effect on theestimate of any one individual. In contrast, the Bayesian MarkovChain Monte Carlo (MCMC) methods have been proposed totake into account the inherent uncertainty in: 1) choice ofancestral populations, i.e., the admixture model assumed; 2) theallele frequency estimates in ancestral populations; and 3)ambiguities arising due to missing data. The STRUCTUREalgorithm uses admixed and unadmixed individuals to makeinferences for any one individual and simultaneously infers allelefrequencies in all populations (admixed and nonadmixed) andancestry proportions in all individuals in the sample. We haveincluded ancestral populations and specified the ‘‘Usepopinfo’’option to augment the inference. In addition, the Bayesianframework allows individuals of known (e.g., more homogeneous)ancestry to be included with the EA, AA, EC, and WC samples foradditional information when inferring the ancestry of eachunknown individual. The ML estimates for each individual areindependent of others in the sample, while other individualsincluded in the sample influence the STRUCTURE estimates.
The AA, EC, and WC samples in our study were smaller than theEA sample and have wider variation in individual admixtureestimates. The continuum of admixture estimates is captured byboth methods, leading to higher correlations. In the larger EAsample (N 5 652), true non-European admixture for most indivi-duals is much lower, which influences the STRUCTURE estimatesobtained for the few individuals who do have higher non-Europeanadmixture. Although we have relatively large numbers of individuals,we used a relatively small marker set, which could also partly explainthe discrepancies between the estimates obtained with the twomethods. The convergence of the STRUCTURE algorithm indicatesthat the observed estimates are the best possible ones, given the data.Just as the ML assumes fixed ancestral allele frequencies, theSTRUCTURE algorithm assumes a unimodal Dirichlet priordistribution, for both allele frequencies and ancestry estimates. Ifthe true distributions of these parameters in the samples weredifferent, it would skew the admixture estimates. In our simulationstudies too, we observed that the bias with STRUCTURE was lowerthan that with ML. We speculate that when true variation amongindividuals in the EA sample being studied is low, the effect of a fewindividuals who are genetically distant from the majority ofindividuals (i.e., having higher admixture) is minimized in a largersample than in a smaller sample. When the sample size is small,including a few individuals who are very different from the otherswill have a more appreciable effect. However, when there is greatervariation in the sample, in this case due to substantial historicallydocumented admixture, the sample size of the admixed populationis less of an issue. Other statistical approaches like the principalcomponents method may be more suitable for detecting stratifica-tion in the EA sample [Paschou et al., 2008].
The differences in statistical procedures also contribute to thedifferent results obtained in EC and WC with the two tests forstratification. Evidence of admixture-stratification in EC and WCwas detected only with the IAC test and not with STRUCTURE.
1306 HUMAN MUTATION, Vol. 30, No. 9, 1299–1309, 2009

The known history of admixture in these populations suggeststhat ancestry proportions are likely to follow a continuum ratherthan occurring as distinct subgroups. Indeed, plots of admixtureestimates (Supp. Figs. S1 and S2) show this, using both methods.Using STRUCTURE, evidence of admixture-stratification isdetected by deviations from HWE and linkage equilibrium. It istheoretically possible that random mating within the EC and WCsamples used here resulted in situations where neither of theassumptions of the algorithm were violated and hence, theprogram did not detect any evidence for subpopulations. On theother hand, the IACT examines relative differences betweenindividuals in the population. If ancestry proportions varysubstantially within the population, then on average, all regionsof the genomes in each individual will reflect this variation. Therelative differences between individuals will be retained irrespec-tive of the part of the genome used to infer admixture proportionsfor each individual. This relative genetic distance betweenindividuals is examined by inferring individual admixture usingnonsyntenic marker panels. Indeed, previous simulation studieshave shown that without admixture-stratification, no associationis observed between admixture proportions estimated withdifferent sets of markers [Pfaff et al., 2001]. Thus, despite notdetecting presence of admixture-stratification using STRUC-TURE, variation in individual admixture in AA, EC, and WCare indicators of possible confounding in case–control associa-tions if not taken into consideration, since disease risk andprevalence may vary with admixture proportions.
The small amounts of IA ancestry detected in some of theAA individuals may lead to questions about whether this ancestryaxis is real or an artifact of the population model. STRUCTUREresults showed that a K 5 2 model is a better fit to the data asopposed to a K 5 3 model and the IACTs did not show anystratification along the IA axis. The distinction to be made here isbetween the population and the individual. While IA ancestry inthe overall population may indeed be as low as to appear anartifact (i.e., not detectable by some formal tests), a fewindividuals could still have significant IA ancestry that is differentfrom their EU ancestry. We have shown that this marker panel isable to distinguish between EU and IA ancestry within the rangeof error identified by the simulation studies. Given the demo-graphic history of the United States and the known culturalhistories of these particular populations, low levels of IA ancestryis expected in the general African American population, while forsome individuals the IA ancestry could be very high. We foundmean IA ancestry in AA to be at least 4% with both methods,which is at the significant threshold for ML estimates and abovethe threshold for the STRUCTURE estimates. It is possible thatthe few individuals who showed high IA ancestry contributed tothis overall mean. For these specific individuals, this ancestrycomponent is indeed useful to adequately attribute a portion oftheir genetic heritage to IA ancestry as opposed to EU ancestry. Ina population-based study, however, such as admixture mapping,such individuals may not provide any additional information. Insuch cases the few individuals who have high IA ancestry mayeither be outliers (and hence ideally be removed from subsequentanalysis) or simply not contribute enough information as tosubstantially alter the results of a genotype–phenotype associationor admixture mapping study with a reduced ancestral populationmodel. We have previously demonstrated this phenomenon in asample of Puerto Ricans [Halder et al., 2008]. Since our goal inthis study was to quantify individual admixture, we have used thethree-population model, which we believe to be adequatelyrepresentative of the underlying demographics.
Choice of ancestral populations included in the analysis has asignificant effect on admixture estimates obtained with anystatistical method. We have used a sample of Spanish individualsas a representative European ancestral population. While thissample is apparently adequate to analyze the two Hispanicsamples, there are clear limitations for the analyses in AA andEA samples when using this Southern European ancestral group.Most obvious European ancestors of EA populations include theBritish, Irish, German, and Italian populations, and the mostappropriate ancestral EU population would be one that includesrepresentation from these specific European populations. Givenless variability among different European populations, this issue isperhaps less important than restricting the variation within theAfrican continent by only using a single AF ancestral group. Weused a West African population from Sierra Leone based on thehistorical contributions of this region to the modern African-American gene pool. Thus, adding more African and Europeanpopulations would qualitatively enhance the ancestral allelefrequency estimates. Nonetheless, the distributions in admixtureestimates obtained provide empirical evidence describing varia-tion in individual admixture in different U.S. population samples.
The simulation of unadmixed individuals indicates that thepresent marker panel easily has sufficient power to distinguishbetween the three ancestral populations, using either statisticalmethod. In the simulated samples, individual admixture in theWest African ancestral sample showed equal variation along bothof the non-African axes, whereas in the EA and IA samplesvariation was greater along the EU-IA axis. This possibly reflectsthe more recent shared common ancestry between these popula-tions and lower total IA-EU dc (since the markers were initiallyselected to have high African vs. non-African discrimination).While the large sample sizes (N 5 1,000) may have affected theSTRUCTURE estimates, which shows 499% ancestry for eachancestral population, ML, which is unaffected by sample size,shows that there is o5% chance of ancestry bias or populationbias using this marker panel. Theoretically, for samples ofindividuals simulated to have no admixture, all individuals areexpected to show 100% ancestry from one population. Observedvariations in individual admixture is a function of the ancestryinformation content of the marker panel and the method used formaking inferences. For instance, for a set of 90 SNP markers inwhich alternate alleles are fixed in different populations, ancestryestimates are observed as expected (i.e., all individual have 100%ancestry from the expected ancestral group using any method ofadmixture estimation; I.H. unpublished results), when allindividuals who are being studied are from one population andhave no history of admixture.
Though the current microsatellite panel has good discrimina-tory power, it is limited in not having such definitive ancestryinformation content. Based on computed dc levels, this panelcompares to some SNP panels reported previously for individualadmixture estimation (e.g., Shriver et al., 2003 reported a panel of34 AIMs with summed d values of 15.8 (AF-EU), 17.2 (AF-IA),and 12.55 (IA-EU); Bonilla et al., 2004b reported a panel of 35AIMs with summed d values of 14.4 (AF-EU), 16.6 (AF-IA), and11.7 (IA-EU)). However, this measure consolidates informationacross multiple loci, which can have important consequences.When biallelic SNPs are used, assigning ancestry to an allele is astraightforward process, since frequencies of only two possiblealleles have to be considered. In contrast, for multiallelic loci, thereis a greater chance that some alleles will be missing in ancestralpopulations that exist in moderate frequency in the admixedsample, due to stochastic variation. MLE will treat such alleles as
HUMAN MUTATION, Vol. 30, No. 9, 1299–1309, 2009 1307

missing. In such cases, it may be more efficient to use linkedmarkers in Bayesian MCMC methods (like STRUCTURE), whichcan incorporate information in linked markers for makinginferences of individual ancestry.
In conclusion, this study provides a description of individualadmixture distribution in different U.S. populations and showsthat individual admixture varies in all populations, more in thosewith a known recent history of admixture. Such variation may notlead to the creation of distinct subgroups, but rather a continuumof individual admixture proportions that, unless accounted for, islikely to affect case–control associations. Comparisons of the twoHispanic groups further suggest that there is geographic hetero-geneity among samples that reflects the demographic histories ofthe populations. Finally, as the simulations indicate, the markerpanel described here can be used reliably for inferring individualadmixture proportions in different U.S. populations.
Acknowledgments
We thank the volunteer individuals who participated in this research study,
and Ann Marie Lacobelle and Gregory Dalton-Kay for their excellent
technical assistance. The work presented here was supported by the NIH
(grants R01 DA12690 to J.G., R01 DA12849 to J.G., K01 DA024758 to
B.-Z.Y., MH64122 to M.B.S, K24 AA13736 and M01-RR06192 to H.R.K.);
and the U.S. Department of Veterans Affairs (Merit Review to J.G. and the
VA Connecticut–Massachusetts Mental Illness Research, Education and
Clinical Center (MIRECC)).
References
Bauchet M, McEvoy B, Pearson LN, Quillen EE, Sarkisian T, Hovhannesyan K, Deka R,
Bradley DG, Shriver MD. 2007. Measuring European population stratification with
microarray genotype data. Am J Hum Genet 80.5:948–956.
Bertoni B, Budowle B, Sans M, Barton SA, Chakraborty R. 2003. Admixture in
Hispanics: distribution of ancestral population contributions in the Continental
United States. Hum Biol 75:1–11.
Bonilla C, Parra EJ, Pfaff CL, Dios S, Marshall JA, Hamman RF, Ferrell RE, Hoggart CL,
McKeigue PM, Shriver MD. 2004a. Admixture in the Hispanics of the San Luis
Valley, Colorado, and its implications for complex trait gene mapping. Ann Hum
Genet 68(Pt 2):139–153.
Bonilla C, Shriver MD, Parra EJ, Jones A, Fernandez JR. 2004b. Ancestral proportions
and their association with skin pigmentation and bone mineral density in
Puerto Rican women from New York City. Hum Genet 115:57–68.
Bonilla C, Gutierrez G, Parra EJ, Kline C, Shriver MD. 2005. Admixture analysis of a
rural population of the State of Guerrero, Mexico. Am J Phys Anthropol
128:861–869.
Budowle B, Shea B, Niezgoda S, Chakraborty R. 2001. CODIS STR loci data from 41
sample populations. J Forensic Sci 46:453–489.
Chakraborty R, Weiss KM. 1988. Admixture as a tool for finding linked genes and
detecting that difference from allelic association between loci. Proc Natl Acad Sci
USA 85:9119–9123.
Collins-Schramm HE, Phillips CM, Operario DJ, Lee JS, Weber JL, Hanson RL,
Knowler WC, Cooper R, Li H, Seldin MF. 2002. Ethnic-difference markers for
use in mapping by admixture linkage disequilibrium. Am J Hum Genet
70:737–750.
Collins-Schramm HE, Chima B, Morii T, Wah K, Figueroa Y, Criswell LA, Hanson RL,
Knowler WC, Silva G, Belmont JW, Seldin MF. 2004. Mexican American
ancestry-informative markers: examination of population structure and marker
characteristics in European Americans, Mexican Americans, Amerindians and
Asians. Hum Genet 114:263–271.
Daniels PR, Kardia SL, Hanis CL, Brown CA, Hutchinson R, Boerwinkle E, Turner
ST, Genetic Epidemiology Network of Arteriopathy Study. 2004. Familial
aggregation of hypertension treatment and control in the Genetic Epidemiology
Network of Arteriopathy (GENOA) Study. Am J Med 116:676–681.
Devlin B, Roeder K, Wasserman L. 2001. Genomic control, a new approach to
genetic-based association studies. Theor Popul Biol 60:155–166.
Douglas JG, Thibonnier M, Wright Jr JT. 1996. Essential hypertension: racial/ethnic
differences in pathophysiology. J Assoc Acad Minor Phys 7:16–21.
Falush D, Stephens M, Pritchard JK. 2003. Inference of population structure using
multilocus genotype data: linked loci and correlated allele frequencies. Genetics
164:1567–1587.
Fernandez JR, Shriver MD, Beasley TM, Rafla-Demetrious N, Parra E, Albu J,
Nicklas B, Ryan AS, McKeigue PM, Hoggart CL, Weinsier RL, Allison DB. 2003.
Association of African genetic admixture with resting metabolic rate and obesity
among women. Obes Res 11:904–911.
Gardner Jr LI, Stern MP, Haffner SM, Gaskill SP, Hazuda HP, Relethford JH,
Eifler CW. 1984. Prevalence of diabetes in Mexican Americans. Relationship to
percent of gene pool derived from Native American sources. Diabetes 33:86–92.
Gresham D, Morar B, Underhill PA, Passarino G, Lin AA, Wise C, Angelicheva D,
Calafell F, Oefner PJ, Shen P, Tournev I, de Pablo R, Kucinskas V, Perez-Lezaun A,
Marushiakova E, Popov V, Kalaydjieva L. 2001. Origins and divergence of the
Roma gypsies. Am J Hum Genet 69:1314–1331.
Halder I, Shriver MD. 2003. Measuring and using admixture to study the genetics of
complex diseases. Hum Genomics 1:52–62.
Halder I, Shriver M, Thomas M, Fernandez J, Frudakis T. 2008. A panel of ancestry
informative markers for estimating individual biogeographical ancestry and
admixture from four continents: utility and applications. Hum Mutat 29:
648–658.
Hanis CL, Chakraborty R, Ferrell RE, Schull WJ. 1986. Individual admixture
estimates: disease associations and individual risk of diabetes and gallbladder
disease among Mexican-Americans in Starr County, Texas. Am J Phys Anthropol
70:433–441.
Heiman GA, Hodge SE, Gorroochurn P, Zhang J, Greenberg DA. 2004. Effect of
population stratification on case-control association studies. I. Elevation in false
positive rates and comparison to confounding risk ratios: a simulation study.
Hum Hered 58:30–39.
Helgason A, Sigureth ardottir S, Nicholson J, Sykes B, Hill EW, Bradley DG,
Bosnes V, Gulcher JR, Ward R, Stefansson K. 2000. Estimating Scandinavian
qand Gaelic ancestry in the male settlers of Iceland. Am J Hum Genet 67:
697–717.
Hoffman RM, Gilliland FD, Eley JW, Harlan LC, Stephenson RA, Stanford JL,
Albertson PC, Hamilton AS, Hunt WC, Potosky AL. 2001. Racial and ethnic
differences in advanced-stage prostate cancer: the Prostate Cancer Outcomes
Study. J Natl Cancer Inst 93:388–395.
Hoffman RM, Harlan LC, Klabunde CN, Gilliland FD, Stephenson RA, Hunt WC,
Potosky AL. 2003. Racial differences in initial treatment for clinically localized
prostate cancer. Results from the prostate cancer outcomes study. J Gen Intern
Med 18:845–853.
Hoggart CJ, Parra EJ, Shriver MD, Bonilla C, Kittles RA, Clayton DG, McKeigue PM.
2003. Control of confounding of genetic associations in stratified populations.
Am J Hum Genet 72:1492–1504.
Kayser M, Brauer S, Schadlich H, Prinz M, Batzer MA, Zimmerman PA, Boatin BA,
Stoneking M. 2003. Y chromosome STR haplotypes and the genetic structure of
U.S. populations of African, European, and Hispanic ancestry. Genome Res
13:624–634.
Koller DL, Peacock M, Lai D, Foroud T, Econs MJ. 2004. False positive rates in
association studies as a function of degree of stratification. J Bone Miner Res
19:1291–1295.
Kumar S, Tamura K, Jakobsen IB, Nei M. 2001. MEGA2: molecular evolutionary
genetics analysis software. Bioinformatics 17:1244–1245.
Long JC. 1991. The genetic structure of admixed populations. Genetics 127:417–428.
Long JC, Williams RC, McAuley JE, Medis R, Partel R, Tregellas WM, South SF,
Rea AE, McCormick SB, Iwaniec U. 1991. Genetic variation in Arizona Mexican
Americans: estimation and interpretation of admixture proportions. Am J Phys
Anthropol 84:141–157.
Luo X, Kranzler HR, Zuo L, Wang S, Blumberg HP, Gelernter J. 2005. CHRM2 gene
predisposes to alcohol dependence, drug dependence and affective disorders:
results from an extended case-control structured association study. Hum Mol
Genet 14:2421–2434.
Martinez NC. 1993. Diabetes and minority populations. Focus on Mexican
Americans. Nurs Clin North Am 28:87–95.
McKeigue PM. 2005. Prospects for admixture mapping of complex traits. Am J Hum
Genet 76:1–7.
Molokhia M, Hoggart C, Patrick AL, Shriver M, Parra E, Ye J, Silman AJ, McKeigue PM.
2003. Relation of risk of systemic lupus erythematosus to west African admixture
in a Caribbean population. Hum Genet 112:310–318.
Parra EJ, Marcini A, Akey J, Martinson J, Batzer MA, Cooper R, Forrester T,
Allison DB, Deka R, Ferrell RE, Shriver MD. 1998. Estimating African American
admixture proportions by use of population-specific alleles. Am J Hum Genet
63:1839–1851.
Parra EJ, Kittles RA, Argyropoulos G, Pfaff CL, Hiester K, Bonilla C, Sylvester N,
Parrish-Gause D, Garvey WT, Jin L, McKeigue PM, Kamboh MI, Ferrell RE,
Pollitzer WS, Shriver MD. 2001. Ancestral proportions and admixture dynamics
in geographically defined African Americans living in South Carolina. Am J
Phys Anthropol 114:18–29.
Paschou P, Drineas P, Lewis J, Nievergelt CM, Nickerson DA, Smith JD, Ridker PM,
Chasman DI, Krauss RM, Ziv E. 2008. Tracing sub-structure in the
1308 HUMAN MUTATION, Vol. 30, No. 9, 1299–1309, 2009
European American population with PCA-informative markers. PLoS Genet 4;4:
e1000114.
Pfaff CL, Parra EJ, Bonilla C, Hiester K, McKeigue PM, Kamboh MI, Hutchinson RG,
Ferrell RE, Boerwinkle E, Shriver MD. 2001. Population structure in admixed
populations: effect of admixture dynamics on the pattern of linkage
disequilibrium. Am J Hum Genet 68:198–207.
Pritchard JK, Stephens M, Rosenberg NA, Donnelly P. 2000. Association mapping in
structured populations. Am J Hum Genet 67:170–181.
Pritchard JK, Donnelly P. 2001. Case-control studies of association in structured or
admixed populations. Theor Popul Biol 60:227–237.
Province MA, Boerwinkle E, Chakravarti A, Cooper R, Fornage M, Leppert M,
Risch N, Ranade K. 2000. Lack of association of the angiotensinogen-6
polymorphism with blood pressure levels in the comprehensive NHLBI Family
Blood Pressure Program. J Hypertens 18:867–876.
Reiner AP, Ziv E, Lind DL, Nievergelt CM, Schork NJ, Cummings SR, Phong A,
Burchard EG, Harris TB, Psaty BM, Kwok PY. 2005. Population structure,
admixture, and aging-related phenotypes in African American adults: the
Cardiovascular Health Study. Am J Hum Genet 76:463–477.
Rosenberg NA, Li LM, Ward R, Pritchard JK. 2003. Informativeness of genetic
markers for inference of ancestry. Am J Hum Genet 73:1402–1422.
Rousset F, Raymond M. 1995. Testing heterozygote excess and deficiency. Genetics
140:1413–1419.
Sans M. 2000. Admixture studies in Latin America: from the 20th to the 21st century.
Hum Biol 72:155–177.
Shriver MD, Smith MW, Jin L, Marcini A, Akey JM, Deka R, Ferrell RE. 1997. Ethnic-
affiliation estimation by use of population-specific DNA markers. Am J Hum
Genet 60:957–964.
Shriver MD, Parra EJ, Dios S, Bonilla C, Norton H, Jovel C, Pfaff C, Jones C,
Massac A, Cameron N, Baron A, Jackson T, Argyropoulos G, Jin L, Hoggart CJ,
McKeigue PM, Kittles RA. 2003. Skin pigmentation, biogeographical ancestry and
admixture mapping. Hum Genet 112:387–399.
Shriver MD, Mei R, Parra EJ, Sonpar V, Halder I, Tishkoff SA, Schurr TG, Zhadanov SI,
Osipova LP, Brutsaert TD, Friedlaender J, Jorde LB, Watkins WS, Bamshad MJ,
Gutierrez G, Loi H, Matsuzaki H, Kittles RA, Argyropoulos G, Fernandez JR,
Akey JM, Jones KW. 2005. Large-scale SNP analysis reveals clustered and
continuous patterns of human genetic variation. Hum Genomics 2:81–89.
Smith MW, Lautenberger JA, Shin HD, Chretien JP, Shrestha S, Gilbert DA, O’Brien SJ.
2001. Markers for mapping by admixture linkage disequilibrium in African
American and Hispanic populations. Am J Hum Genet 69:1080–1094.
Songer TJ, Zimmet PZ. 1995. Epidemiology of type II diabetes: an international
perspective. Pharmacoeconomics 8(Suppl 1):1–11.
Stein MB, Schork NJ, Gelernter J. 2004. A polymorphism of the beta1-adrenergic
receptor is associated with low extraversion. Biol Psychiatry 56:217–224.
Tsai HJ, Choudhry S, Naqvi M, Rodriguez-Cintron W, Burchard EG, Ziv E. 2005.
Comparison of three methods to estimate genetic ancestry and control for
stratification in genetic association studies among admixed populations. Hum
Genet 118:424–433.
U.S. Census Bureau. 2008. Annual Estimates of the Population by Sex, Race, and Hispanic
Origin for the United States: April 1, 2000 to July 1, 2007 (NC-EST2007-03). Release
date: May 1, 2008. Available at: http://www.census.gov/popest/national/asrh/NC-
EST2007/NC-EST2007-03.xls. Last accessed: May 11, 2009.
Wang H, Parry S, Macones G, Sammel MD, Ferrand PE, Kuivaniemi H, Tromp G,
Halder I, Shriver MD, Romero R, Strauss 3rd JF. 2004. Functionally significant
SNP MMP8 promoter haplotypes and preterm premature rupture of
membranes. Hum Mol Genet 13:2659–2669.
Wen B, Xie X, Gao S, Li H, Shi H, Song X, Qian T, Xiao C, Jin J, Su B, Lu D, Chakraborty R,
Jin L. 2004. Analyses of genetic structure of Tibeto-Burman populations reveals
sex-biased admixture in southern Tibeto-Burmans. Am J Hum Genet 74:856–865.
Williams RC, Knowler WC, Pettitt DJ, Long JC, Rokala DA, Polesky HF, Hackenberg RA,
Steinberg AG, Bennett PH. 1992. The magnitude and origin of European-American
admixture in the Gila River Indian Community of Arizona: a union of genetics and
demography. Am J Hum Genet 51:101–110.
Yang BZ, Zhao H, Kranzler HR, Gelernter J. 2005a. Practical population group
assignment with selected informative markers: characteristics and properties of
Bayesian clustering via STRUCTURE. Genet Epidemiol 28:302–312.
Yang BZ, Zhao H, Kranzler HR, Gelernter J. 2005b. Characterization of a likelihood
based method and effects of markers informativeness in evaluation of admixture
and population group assignment. BMC Genet 6:50.
HUMAN MUTATION, Vol. 30, No. 9, 1299–1309, 2009 1309


