Embed Size (px)
Citation preview

2067
Environmental Toxicology and Chemistry, Vol. 25, No. 8, pp. 2067–2076, 2006� 2006 SETAC
Printed in the USA0730-7268/06 $12.00 � .00
Environmental Toxicology
TESTS OF BIOACCUMULATION MODELS FOR POLYCHLORINATED BIPHENYLCOMPOUNDS: A STUDY OF YOUNG-OF-THE-YEAR BLUEFISH IN THE HUDSON
RIVER ESTUARY, USA
LAWRENCE A. LEBLANC,*† JEFFREY A. BUCKEL,‡ DAVID O. CONOVER,§ and BRUCE J. BROWNAWELL§†School of Marine Sciences, University of Maine, 5741 Libby Hall, Orono, Maine 04469-5741, USA
‡Center for Marine Science and Technology, Department of Zoology, North Carolina State University, 303 College Circle, Morehead City,North Carolina 28557, USA
§Marine Sciences Research Center, State University of New York at Stony Brook, Stony Brook, New York 11794-5000, USA
(Received 1 July 2005; Accepted 22 December 2005)
Abstract—A field-based study regarding uptake of polychlorinated biphenyl compounds (PCBs) by young-of-the-year (YOY)bluefish (Pomatomus saltatrix) was initiated to test a steady-state model of bioaccumulation and trophic transfer in a rapidly growingfish. Determination of prey composition as well as size-dependent growth and specific consumption rates for YOY bluefish fromseparate field and laboratory studies enabled the input of these species-specific parameters into the model. Furthermore, the timeand duration of the exposure of YOY bluefish to dissolved PCBs from a well-characterized system (Hudson River, USA) was wellknown. Patterns of accumulation of individual PCB congeners differed relative to the accumulation of total PCBs, with the greatestnet accumulation occurring for the higher-molecular-weight congeners. Comparison of lipid-normalized bioaccumulation factors(BAFs) with the octanol–water partition coefficients of individual PCB congeners revealed bluefish to be above the BAFs predictedby lipid-based equilibrium partitioning, suggesting that uptake from food is an important source of PCBs in YOY bluefish.Comparison of measured BAFs with values predicted by a steady-state, food-chain model showed good first-order agreement.
Keywords—Polychlorinated biphenyls Bluefish Hudson River Bioaccumulation modeling Trophic transfer
INTRODUCTION
Much laboratory and field work has been conducted re-garding the uptake and depuration of polychlorinated biphenylcompounds (PCBs) and other hydrophobic organic contami-nants by a wide variety of species (for review, see Connell[1]). Hydrophobic organic contaminants can be taken up fromwater as well as from ingested food [2,3]. Various steady-stateand kinetic descriptions have been proposed to model organismbody burden as a function of exposure regime (i.e., concen-trations in water and food) and mechanisms of uptake. A recentarticle by Arnot and Gobas [4] provides an excellent synopsisof the history and development of bioaccumulation models.For predictive purposes in a nonsteady-state system (e.g., inmigratory fish), it becomes essential to understand the mech-anisms and routes of PCB uptake. The Hudson River (USA)has received a substantial loading of PCBs in past years, andit continues to receive reduced levels of PCB inputs, whichhas resulted in the accumulation of PCBs in the aquatic foodweb [5–8]. A steady-state model developed by Thomann [9,10]and applied to the Hudson River [7] provides a frameworkwith which to evaluate important factors affecting the uptakeof hydrophobic organic contaminants from water and trophictransfer of these contaminants in a nonsteady-state or pseu-dosteady-state system.
A field-based study of PCB uptake in young-of-the-year(YOY) bluefish (Pomatomus saltatrix) was initiated as a testof the Thomann steady-state bioaccumulation model with arapidly growing fish in a well-studied system [11] (http://www.hudsonriver.org/). Exposure concentrations in waters and
* To whom correspondence may be addressed([email protected]).
sediments of the Hudson River estuary, especially for dis-solved water concentrations, have been characterized by anumber of studies [5]. Unique to the present study was thatthe time and duration of exposure of these YOY fish to dis-solved PCB concentrations was well known, based on pub-lished studies of YOY fish of this species in the Hudson Riverestuary [12–15]. Also, composition of prey species as well asweight-specific growth and consumption rates had been de-termined for these YOY bluefish [15,16]. Data from the afore-mentioned study provided more direct measures than typicallyare available when calibrating bioaccumulation models anduseful tests for the effects of growth and consumption rate,both of which are extremely high in YOY bluefish [17–19].
Partitioning models
Models that predict fish body burdens of hydrophobic or-ganic compounds either assume equilibrium partitioning be-tween the water column and the organism or account for uptakeand elimination kinetics of exchange between the organismand the external environment.
The simplest models of hydrophobic organic contaminantuptake by organisms are equilibrium partitioning models,which assume that a compound partitions between the envi-ronment (water column or sediment) and the lipids of theorganism. The partitioning of an organic compound into anorganism can be predicted by the degree of lipophilicity ofthe chemical compound, which often is measured by its oc-tanol–water partition coefficient (Kow) [20–23]. The degree towhich the partitioning of an organic chemical approaches anequilibrium condition can be investigated in open systems (i.e.,the environment) by calculating bioaccumulation factors(BAFs) and bioconcentration factors (BCFs). The BAF is de-

2068 Environ. Toxicol. Chem. 25, 2006 L.A. LeBlanc et al.
Table 1. Description of parameters used in the steady-statebioaccumulation model
k � uptake rate [(L/d)/kg wet wt]u
3 �gk � 10 (w /p)E,u
where g is a respiration parameter (g � 0.2), p � the % lipid fraction,and w � wet weight (in grams).
E, an estimate of efficiency of transfer across gill surfaces, varieswith log Kow and is based on laboratory-based exposure studiesas follows:
log E � �2.6 � 0.5 log K , for log K � 2–5ow ow
E � 0.8, for log K � 5–6ow
log E � 2.9 � 0.5 log K , for log K � 6–10.ow ow
K � chemical excretion rate (d�1), calculated from model K � ku/Kow
(Source: Thomann [10])
� � chemical assimilation efficiency(�g chemical absorbed/�g chemical ingested):
Two estimates:1) � is fixed at a value of 0.52) � varies with log Kow
For Cl-2 homologues: � � 0.71For Cl-3 homologues: � � 0.8For Cl-4 homologues: � � 0.8For Cl-5 homologues: � � 0.63For Cl-6� homologues: � � 0.35
(Source: Thomann [10])� weight specific consumption rateC�i, i�1
[kg(w) of prey/kg(w) predator/d]
where w � wet weight (in kg)
(Source: Consumption rates derived from field data [14])Ci,i�1 � weight specific consumption rate
[kg(lipid) of prey/kg(lipid) predator/d]Ci,i�1 � · [(pi�1/pi )]C�i, i�1
G � weight specific growth rate (d�1)(Source: Growth rates derived from field data [14])
Gi is the growth rate of the lipid fraction. Because lipids are rea-sonably constant during this growing season, growth rates on awet weight basis were used.
fined by several authors (see, e.g., [2,10]) as the ratio of thechemical tissue concentration because of uptake from bothwater and food routes (�g/kg lipid wt) to the water columnconcentration (�g/L). When exposure results solely from wa-ter, this ratio is called the BCF. These coefficients assume asteady-state, but not necessarily an equilibrium, condition.Normalizing the BAF or BCF to lipid weight assumes thatdifferent species of organisms with similar lipid compositionin different environments can be compared for their potentialto accumulate nonionic hydrophobic organic compounds.
Results from field studies have produced measured BAFsthat exceed those predicted by equilibrium partitioning models[2,10]. Those authors have concluded that uptake from food(trophic transfer) accounts for the elevated tissue concentra-tions. Extensive work by Gobas et al. (see, e.g., [24–26]) andothers [27,28] elucidated mechanisms of dietary uptake andelimination and quantified their relative importance in modelsof laboratory and field-based exposures.
Thomann food-chain model
Models developed by Thomann and Connolly [29] and byThomann [9,10] account for uptake from water as well as fromfood. These models take into account the position of an or-ganism in the food chain by allowing a predator at level i tofeed on prey, which are at level i � 1. Important physiologicalparameters, such as growth rate (Gi, kg lipid/d), food con-sumption rate (Ci,i�1, kg lipid prey/kg lipid predator/d), chem-ical assimilation efficiency (�, �g chemical absorbed/�gchemical ingested), chemical uptake rate (ku, L/d/kg wet wt),and chemical excretion rate (Ki, �g/d) are either measured orestimated from literature values. Models with these parametershave been applied in the Great Lakes (USA) [29], New BedfordHarbor (USA) [30], and the Hudson River (USA) [7,31]. Thegeneral predictive equation for the model at steady state is
� ·Ck vi,i�1 i, i�1u i�1BAF � � · (1)K � G K � G ci i i i
where vi�1 is the lipid-normalized chemical concentration inthe prey species (�g/kg lipid) and c is the chemical concen-tration in the water to which the prey species is exposed (�g/L). The term vi�1/c is the BCF of the prey (L/kg lipid).
How these terms are estimated is presented in Table 1. Thefirst term on the right side of Equation 1 is the contributionfrom water to the whole-body concentration, and the secondterm represents the contribution from the diet. Given the ex-tremely rapid growth rates and consumption rates mentionedpreviously, YOY bluefish should provide a sensitive test forsome of the parameters in the Thomann model.
MATERIALS AND METHODS
Acetone, hexane, and methylene chloride were from Bur-dick and Jackson (pesticide-residue grade; Muskegon, MI,USA). Analytical standards used for surrogate and injectionstandards, as well as the PCB Aroclor standards, were pur-chased from Ultra Scientific (North Kingson, RI, USA). Flor-isil (60/100 mesh) was purchased from Supelco (Bellefonte,PA, USA), and alumina (100–200 mesh) and silica gel (100–200 mesh) were from Bio-Rad Laboratories (Richmond, CA,USA).
Field collection
Collections of YOY bluefish were made with 30- and 60-m beach seine nets at several sites in the Hudson River during
the late spring to early fall of 1993 (Fig. 1). Samples werewrapped in solvent-rinsed aluminum foil, placed on dry ice,and transported back to the laboratory, where they were storedfrozen at �20�C until analysis.
Water was sampled at several locations on five cruises alongthe Hudson River estuary from 1991 to 1993 [32]. Four sam-ples collected in Haverstraw Bay from these cruises, alongwith two samples collected off Croton Point in HaverstrawBay, during August 1993 were used to calculate mean dis-solved PCB concentrations. Whole water was sampled with asolvent-rinsed, 22-L, glass separatory funnel affixed in aweighted aluminum cage or, at Croton Point, with a stainless-steel pressure cylinder. On board the ship, samples were filteredunder positive pressure, using high-purity nitrogen, through aglass-fiber filter (14.2 cm, grade GF/F; Whatman International,Maidstone, UK) placed in a stainless-steel filter housing (Mil-lipore, Bedford MA, USA). The filtered water was collectedin 4-L, amber-glass bottles, each containing 100 ml of meth-ylene chloride.
Sample preparation
Whole-body samples of bluefish (two to three individuals/sample) were homogenized, after removal of the stomachs,using a Kinematica polytron (Brinkmann Instruments, West-burg, NY, USA) or a Virtis homogenizer (Virtis, Boston, MA,

PCB uptake in young-of-the-year bluefish Environ. Toxicol. Chem. 25, 2006 2069
Fig. 1. Location of Croton Point in the Hudson River estuary (USA) along with the position of the gill nets and beach seines used for bluefishand prey collections. NJ � New Jersey; CT � Connecticut; NY � New York. Map reprinted from Buckel and Conover [14].
Table 2. Instrumental conditions for polychlorinatedbiphenyl analysis
Injection port temperature 375�CDetector temperature 375�CColumn flow rate 3 ml/minCarrier gas HydrogenAnalytical column J & W DB-5a capillary column
(length, 30 m; internal diameter,37 mm; film thickness, 25 �m)
Temperature program 40�C for 2 min, ramp to 120�C at30�C/min, then ramp from 120 to240�C at 2�C/min, and hold for10 min
a J & W DB-5 is a brand name that refers to the column phase; inthis instance, it is for a 5% phenyl-methyl polysiloxane.
USA). Prey species also were homogenized in this manner(with stomachs intact). Before homogenization, total length,fork length, and wet weight were measured for each individual.
Polychlorinated biphenyl congeners 29 (2,4,5-trichlorobi-phenyl) and 143 (2,2�,3,4,5,6�-hexachlorobiphenyl) were add-ed as surrogate standards at the beginning of the extractionprocedures. Approximately 4 g wet weight of homogenate wasextracted three times with 25 ml of acetone in 50-ml Corexcentrifuge tubes (Fisher Scientific, Pittsburgh, PA, USA). Eachsample was homogenized with three 1-min blendings. Extractswere decanted into a 1,000-ml separatory funnel containing500 ml of NaCl-saturated, pre-extracted, deionized water andthen extracted three times with 50 ml of hexane. The hexaneextracts were combined and reduced in volume to 10 ml. Twomilliliters were removed from each extract for determinationof lipid weight, and the rest was reduced in volume to 1 mlfor open-column chromatography.
Interfering lipids were removed from tissue extracts by pas-

2070 Environ. Toxicol. Chem. 25, 2006 L.A. LeBlanc et al.
Table 3. Parameter values used for the Thomann model
Sampledate(1993)
Growth rate,Gi (d�1)
Excretionrate,
Ki (d�1)a
Consumptionrate,
Ci,i�1 (d�1)C:Gratio
Chemicaluptake rate,ku (L/d/kg)
LogpreyBCFb
June 30August 4Sept 11
0.0320.0450.026
0.0170.0180.006
0.0950.2080.039
3.04.61.5
2657028324
9447
6.66.56.4
a For congener 70, log Kow � 6.2.b BCF � lipid-normalized bioconcentration factor; for log Kow � 6.2. For bioaccumulation factor cal-
culations plotted in Figure 6, � is fixed at 0.5.
Table 4. Mean dissolved polychlorinated biphenyl congenerconcentrations from Haverstraw Bay (USA)
Congener no.a Log Kowb
Concentration(ng/L)
RSDc
(%)
10/4d
9/78/5
19/1418
4.845.065.075.025.24
0.090.020.040.071.10
89.1143.0
59.957.535.2
15/172416/322628/31
5.305.355.165.665.67
6.130.110.280.111.76
42.560.2
117.229.939.9
33/21/5322524947
5.605.585.845.855.85
0.150.300.641.110.31
64.139.036.728.328.5
4437/4264/414070
5.755.835.955.666.20
0.780.240.440.200.13
52.826.826.765.032.4
66/9592/84
1019986/97
6.206.356.386.396.23
0.340.250.660.170.22
31.139.761.954.471.8
87110/77151/82149118
6.296.366.646.676.74
0.301.320.110.170.32
78.554.181.987.579.2
114153/132/105141138182/187
6.656.926.826.837.20
0.040.470.080.240.07
123.579.186.470.5
105.5174156201180170
7.117.187.627.367.27
0.030.0100.050.12
105.0165.6
0102.4
95.3199196/203208/195194206209
7.207.657.717.808.098.18
0.0040.0040.0020.0010.0010.007
126.0116.8139.2154.9155.4134.3
a Congener naming convention after Ballschmitter and Zell [37].b Log Kow � log of the octanol–water partition coefficient. Hawker et
al. [38].c RSD � relative standard deviation.d Multiple congeners that coelute on the gas chromatography column
were summed as one concentration.
sage of the extract through a 10-cm column consisting of 5 gof 5% water-deactivated florisil topped with 2 g of 5% de-activated alumina. The PCB-containing fraction was elutedfrom the column with 50 ml of hexane and then reduced tofrom 1 to 2 ml for instrumental analysis. Octachloronaphthal-ene was added as an internal standard immediately beforeinstrumental analysis.
Water samples were extracted in 4-L separatory funnelsusing the method described in Achman et al. [32]. Extractswere passed through a column consisting of 7 g of 5% de-activated silica gel (100–200 mesh; Bio-Rad Laboratories).Polychlorinated biphenyl congeners 29 and 143 were addedas surrogate standards, and octachloronaphthalene was addedas an internal standard, as described above.
Instrumental analysis
Samples were injected onto a Hewlett-Packard 5890A gaschromatograph (Hewlett-Packard now Agilent Technologies,Palo Alto, CA, USA) with a DB-5 fused silica capillary column(length, 30 m; inner diameter, 0.25 mm; film thickness, 0.25�M; J&W Scientific, Cupertino, CA, USA) and an electron-capture detector (Agilent Technologies). Instrumental condi-tions and temperature programming are listed in Table 2. Sam-ples were quantified as total PCBs based on a 1:1:1 mixtureof three Aroclor standards (Aroclors 1242, 1254, and 1260)as described by Brownawell and Farrington [33] and on acongener-specific basis. Quantitation was based on the sur-rogate standards, PCB congeners 29 and 143, using peak areas.Recoveries of the surrogate standards were quantified basedon the octachloronaphthalene internal standard. Relative re-sponse factors of individual congeners were determined usingcongener mixes obtained from the National Research Councilof Canada (Ottawa, ON).
Recoveries of surrogate standards were between 75 and100%, with a mean recovery (standard deviation) of 84.5% 8.3%. Blank concentrations of total PCBs (normalized to meanhomogenate wet wt) ranged from 18.3 to 29.9 ng/g and neverexceeded 3% of sample values.
Model parameters
Table 1 lists the sources of the parameters used in the Thom-ann model. The actual values used in the model calculationsfor these parameters are listed in Table 3. Growth rates andconsumption rates were determined from field collections dur-ing the spring and summer seasons of 1993 in the HudsonRiver [14,15] at the same times and from the same populationof fish collected for PCB analysis. Mean dissolved concentra-tions (Table 4), body burden concentrations of PCBs, and lipidweights of predator and prey (Table 5) were determined bythe methods described above. The uptake rate, ku, was esti-mated according to the method described by Thomann [10],

PCB uptake in young-of-the-year bluefish Environ. Toxicol. Chem. 25, 2006 2071
Table 5. Total polychlorinated biphenyls (PCBs; ng/g wet wt) for young-of-the-year bluefish and preyspecies homogenates collected at Croton Point (Hudson River, USA)a
Young-of-the-year bluefish
Collectiondate (1993)
No. ofindividuals
Mean wetwt. (g)
Lipid wt.(% wet)
PCB concn.(ng/g wet wt)
PCB concn.(ng/g lipid wt)
June 30July 28August 4August 11August 24September 11
423333
3.0530.610.217.229.439.6
1.91.51.41.41.33.2
1,1601,2801,0901,8701,0901,060
61,10085,30077,900
134,00083,80033,100
Prey species
Collectiondate/prey species
No. ofindividuals
Meanwet wt. (g)
Bluefish dietcomposition
(%)Lipid wt.(% wet)
PCB concn.(ng/g wet wt)
PCB concn(ng/g lipid wt)
June 30Morone saxatilis 25 0.13 72 1.8 1,360 75,600
August 4Morone saxatilisMenidia menidiaAnchoa mitchilli
43
40
42.360.29
524
34
2.41.21.7
1,530825443
63,80068,80026,100
September 11Morone saxatilisMenidia menidiaAnchoa mitchilli
227
9.722.550.74
2155
9
1.631.4
7961,050
968
49,80035,00069,100
a Congener-specific data are available upon request from the corresponding author.
in which uptake was based on body size and uptake efficiencieswere a function of log Kow based on experimental data (Table1). Chemical assimilation efficiencies (�) were based on twoestimates. The first was a constant value (0.5), and the secondvaried with PCB homologue hydrophobicity [7,10]. Model cal-culations of BAF were made for three dates: June 30, August4, and September 11, when both bluefish and prey were caughtsimultaneously. The three prey species analyzed were stripedbass (Morone saxatilis), bay anchovy (Anchoa mitchilli), andAtlantic silverside (Menidia menidia). For the August andSeptember dates, weighted mean concentrations of all threespecies were based on the diet composition determined foreach date by stomach content analysis [14]. For the June sam-ple, the PCB concentration in striped bass, which represented72% of the known diet on this date, was used (Table 5).
RESULTS
Aqueous concentrations of PCB congeners ranged from0.001 to 6.1 ng/L, with higher concentration and better agree-ment between replicates for the trichlorobiphenyl (Cl-3)through the hexachlorobiphenyl (Cl-6) compounds (Table 4).Lower concentrations and higher variability was seen for hep-ta- and octochlorinated biphenyl compounds.
The concentration of total PCBs in the bluefish over thesummer was surprisingly constant, despite large differences inbody size. Total PCBs in the prey species were more variable(Table 5). Representative whole-body congener concentrations(ng/g lipid) plotted as a function of time and normalized tothe first sampling date (time 0) are shown in Figure 2. Becauseof weekly sampling, the first sampling date represented a res-idence time of no greater than 7 d for these fish. Differencesin the pattern of accumulation between homologue groups canbe seen when plotted in this manner, with the greatest net
accumulation occurring with the most highly chlorinated con-geners. Lower-molecular-weight congeners (e.g., Cl-3) clearlydid not accumulate, and higher-molecular-weight congeners(e.g., Cl-6 and Cl-8) went through a maximum before returningto the original concentrations. Total PCBs in the prey speciesover time were different than those for bluefish. Both stripedbass and silversides had net decreases of total PCBs on a lipid-weight basis over time, whereas bay anchovy had a net increase(Table 5).
In Figure 3, log BAF versus log Kow is plotted for 30 PCBcongeners for the June 30, August 4, and September 11 col-lection dates. The solid line in these graphs is the best-fit linethrough the data, whereas the dashed line is the theoreticalprediction based on equilibrium partitioning between a modellipid (triolein) and water derived by Chiou [22], which has theequation log BCF � 0.893(log Kow) � 0.607. Regression pa-rameters of the best-fit lines for bluefish and prey species forall collection dates are listed in Table 6. During June, con-geners with a log Kow value of 6.5 or less were above theequilibrium prediction, whereas those congeners with a logKow value of between 6.5 to 8 fell on or close to the line.During the month of August, PCB levels in YOY bluefishwere consistently above the equilibrium predictions. By Sep-tember, BAFs were very close to the equilibrium predictions(Fig. 3). With the exception of the September date, bluefishwere above equilibrium at log Kow � 6 by 0.5 log units. Preyspecies showed significant variability and generally wereabove the equilibrium predictions (Table 6).
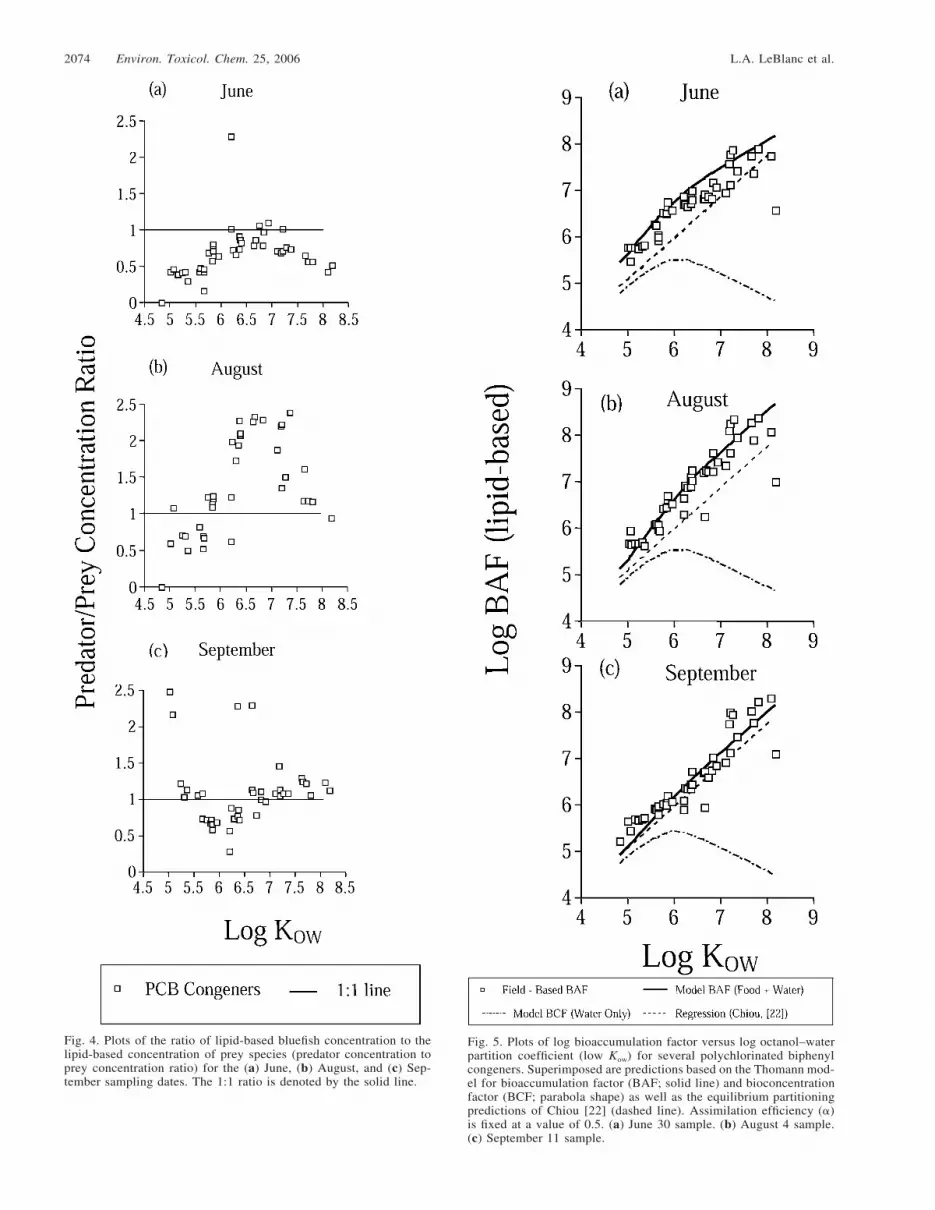
The ratios of lipid-normalized bluefish concentration tomean weighted lipid-normalized concentration of prey (basedon diet composition) reached a maximum at log Kow values of6 to 6.5 and then decreased for the June and August samplingdates (Fig. 4). For the September date, much variability was

2072 Environ. Toxicol. Chem. 25, 2006 L.A. LeBlanc et al.
Fig. 2. Accumulation patterns of selected biphenyl congeners inyoung-of-the-year (YOY) bluefish over time. Concentrations are ona lipid-weight basis (ng/g lipid) and are normalized to the first col-lection date (June 30, 1993). Polychlorinated biphenyl congeners areidentified according to the naming conventions of Ballschmitter andZell [37] and the International Union of Pure and Applied Chemistry(IUPAC): (a) trichloro (24), hexachloro (138), and octachloro (199)biphenyl congeners; (b) trichloro (26), pentachloro (101), and oc-tachloro (196/203) biphenyl congeners.
Fig. 3. Plots of the log lipid-based bioaccumulation factor (BAF)versus the log octanol–water partition coefficient (log Kow) for severalpolychlorinated biphenyl (PCB) congeners: (a) June 30 sample; (b)August 4 sample; and (c) September 11 sample. Superimposed is thebest-fit line through all points (solid line), the equation, and the r2
value of the regression. Also plotted is the theoretical line of Chiou[22] (dashed line; also described in the text). Values of log Kow arefrom Hawker and Connell [38]. BAF � organism concentration (ng/g lipid wt)/water concentration (ng/L).
found in this ratio, and whereas the ratio values were withinthe range of the other two graphs, no consistent trend wasseen.
In Figure 5, model results are compared with the actualmeasurements of BAF for the three dates when bluefish andprey were available. Parameters used in the model were asdescribed in Table 1, and a fixed chemical assimilation effi-ciency (�) of 0.5 was used. Model predictions of BAF matchedthe measured values fairly well for the June and August sam-pling dates, as opposed to the equilibrium partitioning pre-dictions (dashed line), which underpredicted the data. The datawere above (by at least one log unit) the model predictions ofuptake from water only (model BCF). In September, the data
were above the model BAF predictions by approximately 0.5log units.
DISCUSSION
Large differences were seen between accumulation patternsof individual congeners over time compared to the sum of thetotal PCBs. Although the total PCB concentrations varied byless than a factor of two over the entire study, individual PCBcongeners varied by as much as a factor of 12 on a lipid-weight basis (data not shown). These differences were height-ened on the last date, when bluefish lipid weight increased.The trichloro (Cl-3) congeners appeared to come into equilib-

PCB uptake in young-of-the-year bluefish Environ. Toxicol. Chem. 25, 2006 2073
Table 6. Regression parameters for log bioaccumulation factors (BAF) for bluefish and prey species
SpeciesCollection
date Slope Intercept r2Offseta
(log Kow � 6)
Pomatomus saltatrix 6/30/937/28/938/4/938/11/938/24/939/11/95
0.621.020.850.931.080.83
2.760.381.421.170.031.25
0.760.90.810.880.920.85
0.490.540.550.760.560.25
Morone saxatilis 6/30/938/4/939/11/93
0.550.730.87
3.372.171.19
0.750.810.84
0.710.610.44
Menidia menidia
Anchoa mitchilli
8/4/939/11/938/4/939/11/93
0.720.770.730.79
2.241.601.741.78
0.820.860.840.86
0.610.280.170.56
a Offset � log BAF measured (linear regression of log BAF vs log Kow) � log BAF regression [22].
rium with this increasing lipid pool, whereas higher-chlori-nated congeners (Cl-6 and Cl-8) appeared to decrease, whichis consistent with a longer equilibration time for these con-geners and an apparent dilution effect as the lipid pool in thefish increased (Fig. 2).
Clear differences were observed between prey species interms of the accumulation of PCB congeners (Table 5). Thesedifferences, which may be caused by differences in physiologyand lifestyle, indicate the importance of accurately character-izing the prey composition and PCB concentration in the diet.The availability of diet data based on the analysis of a largenumber of stomachs gave us robust estimates of diet percent-ages in bluefish.
Differences in congener accumulation patterns and preda-tor/prey concentration ratios (Fig. 4) reflected differences inthe retention of specific congeners by bluefish. Patterns dif-fered markedly between the three sampling dates, with theAugust date most closely resembling the predictions by Thom-ann [10] for a top predator. Ratios of greater than one wereseen on this date, especially for congeners with log Kow valueshigher than 6.0, indicating biomagnification. This is consistentwith studies reporting greater biomagnification of dietary-de-rived, higher-molecular-weight PCB congeners relative to low-er-molecular-weight congeners in organism tissues [4,24–27].Lower ratios for congeners with log Kow values higher than6.5 are attributed to lower assimilation efficiencies for the morehighly chlorinated congeners (see, e.g., [24,34]). Lower ratiosof predator concentration to prey concentration were observedin June, when the bluefish had just entered the estuary, as wellas in September, when considerable variability may have beencaused by nonsteady-state conditions in this rapidly growing,juvenile fish.
The data show that measured BAFs for bluefish clearly wereabove the values predicted via uptake from water alone, andthe food-chain model did a remarkable job at fitting the data(at least for the June and August dates), indicating that diet isan important source of PCBs for YOY bluefish. These resultsagree with those of Oliver and Niimi [2], who found BAFvalues to be elevated by one or more log units above valuespredicted by equilibrium partitioning for salmonid fish in LakeOntario (USA). Those authors ascribed these elevated valuesto a dietary source. That the model does not fit the data aswell on September 11 may reflect the nonsteady-state increaseof lipids.
Model sensitivity analysis
For this study, the model parameters that were measuredincluded congener concentrations in bluefish and prey, preycomposition in the diet over the season, dissolved water con-centrations, and bluefish growth and consumption rates. Webelieve all these values were robust and likely led to the goodcorrespondence between model and field data. Estimates ofgrowth rates and consumption rates were well constrained be-cause of work by Buckel et al. [16] and by Buckel and Conover[14]. Uptake and excretion rates as well as chemical assimi-lation efficiencies were estimated as described by Thomann[10]. In the present study, � was estimated two ways, first ata level of 0.5 (i.e., 50% efficiency) and then as a function ofKow (0.3–0.8). The effect of varying � was to decrease BAFpredictions at the higher Kow values (Fig. 6a). Uptake rate wasestimated as a function of body (lipid) weight and varied withKow because of the step function E (Table 1). Other estimatesof ku and K from laboratory exposure studies ([35], as de-scribed by Connell [1]) also were utilized and took the formof the following regression equation: Log ku (or log K) � a·logKow � b (Fig. 6). The net result of using all the combinationsof �, ku, and K on model BAF predictions for August 4 ispresented in Figure 6b as a shaded polygon. Variability wasgreater at lower values of low Kow (0.5 log units) than athigher values of Kow (0.2 log units).
The two parameters that affected model predictions to thegreatest extent were growth and consumption rates. Recall thatin the first term of the BAF equation (Eqn. 1), ku (uptake fromwater) is divided by the sum of K � G. Because K is a functionof ku (K � ku /Kow), the important variable becomes growthrate (G). The second term in Equation 1 contains chemicalassimilation efficiency, consumption rate, excretion andgrowth rates, and prey BCF. Because the assimilation effi-ciency was set at 0.5 (i.e., 50%) across all values of log Kow,its effect was neutral. Varying � from 0.3 to 0.8 as a functionof Kow had little effect on the model BAF predictions (Fig.6a). The ratio of consumption rate to growth rate (C/G) there-fore was the most important term. Over the three dates, thisratio varied between 4.6 and 1.5, with the lowest value oc-curring on September 11 (Table 3). Given that prey BCF (i.e.,vi�1/c) varied only by 0.2 log units, the ratio of consumptionto growth rate drove BAF model prediction and is the reasonthat BAF predictions were lower on September 11.
2074 Environ. Toxicol. Chem. 25, 2006 L.A. LeBlanc et al.
Fig. 4. Plots of the ratio of lipid-based bluefish concentration to thelipid-based concentration of prey species (predator concentration toprey concentration ratio) for the (a) June, (b) August, and (c) Sep-tember sampling dates. The 1:1 ratio is denoted by the solid line.
Fig. 5. Plots of log bioaccumulation factor versus log octanol–waterpartition coefficient (low Kow) for several polychlorinated biphenylcongeners. Superimposed are predictions based on the Thomann mod-el for bioaccumulation factor (BAF; solid line) and bioconcentrationfactor (BCF; parabola shape) as well as the equilibrium partitioningpredictions of Chiou [22] (dashed line). Assimilation efficiency (�)is fixed at a value of 0.5. (a) June 30 sample. (b) August 4 sample.(c) September 11 sample.

PCB uptake in young-of-the-year bluefish Environ. Toxicol. Chem. 25, 2006 2075
Fig. 6. (a) Effect of two different estimates of � (�1 � 0.5, solid line;�2 � 0.35–0.8, dashed line) on Thomann model predictions of ac-cumulation factor (BAF) for bluefish collected on August 4 (see Table1 for further explanation). (b) Net effect of all estimates of chemicalassimilation efficiency (�), chemical uptake rate (ku), and chemicalexcretion rate (K) on Thomann model BAF predictions (striped poly-gon represents the range of BAF values calculated). In addition to ku
and K estimates described in Table 1, estimates of ku and K based onlaboratory exposures by Konemann and van Leeuwen [35] as de-scribed by Connell [1] were included. Regression equations were asfollows: Log ku � 0.18·log Kow � 1.98 and log ku � 0.34·log Kow �0.37; log K � �0.41·log Kow � 1.47 and log (1/K) � �0.66·log Kow
� 0.95. (c) Effect of all estimates of ku and i (including the regressionequations listed above) on Thomann model bioconcentration factor(BCF) calculations. (The BCF is the first term of Eqn. 1 in the text).
Uptake from water alone did not account for a significantfraction of the total uptake, especially for PCB congeners withlog Kow values greater than six. The resulting parabolic shapefor the graph of uptake rate versus log Kow was described byKonemann and van Leeuwen [35]. A departure from linearityfor graphs of log BAF versus log Kow has been described inother laboratory-based exposure studies [1,36]. In our model(i.e., the Thomann model), uptake rate and BCF were nonlinearbecause of the term E, an estimate of the efficiency of transferacross the gill membranes based, in part, on the previouslycited laboratory-based exposure studies. Other estimates of ku
and K were closer to the equilibrium partitioning line at logKow values greater than six but still departed from the Chiouregression line [22] by more than one log unit (Fig. 6c). Whatmay be needed are species-specific exposure studies to char-acterize better the uptake and excretion rates of PCBs in YOYbluefish.
CONCLUSION
The major conclusions from the present study are as fol-lows: First, YOY bluefish began rapidly accumulating PCBson entering the Hudson River estuary. Second, differences overtime in the patterns of accumulation of congeners with dif-ferent amounts of chlorine substitution may have reflected dif-ferences in the rates of uptake and excretion between thesehomologue groups. Third, equilibrium partitioning models un-derestimated measured BAFs, demonstrating the importanceof diet in PCB uptake by bluefish. Fourth, the steady-state,food-chain model predicted measured BAF values well, con-sidering the nonsteady-state nature of a rapidly growing fishspecies. Part of the reason for the good fit was the very highgrowth and consumption rates utilized, which were stronglysupported by laboratory and field data. Differences betweenpredicted and measured values on September 11 could havebeen caused by nonsteady-state rapid growth and accompa-nying lipid production in the juvenile bluefish.
Acknowledgement—The authors would like to thank the New YorkDepartment of Environmental Conservation, especially Kim McKownand Byron Young, for sampling support and helpful discussions. Also,Thomas Hurst and Nancy Steinberg from David Conover’s laboratoryat the Marine Sciences Research Center, SUNY Stony Brook, wereessential to this project for sampling, scientific discussion, and gen-erous sharing of expertise in bluefish ecology and physiology . Wealso would like to thank Eric Shultz, Marine Sciences Research Center,for discussions and help on lipid extraction techniques. Support forthis work was provided by a Polgar Research Fellowship awarded tothe primary author, as well as contract 001/94P, both from the HudsonRiver Foundation.
REFERENCES
1. Connell DW. 1990. Bioaccumulation of Xenobiotic Compounds.CRC, Boca Raton, FL, USA.
2. Oliver BG, Niimi AJ. 1988. Trophodynamic analysis of poly-chlorinated biphenyl congeners and other chlorinated hydrocar-bons in the Lake Ontario ecosystem. Environ Sci Technol 22:388–397.
3. Boese BL. 1984. Uptake efficiency of the gills of the English sole(Parophrys vetulus) for four phthalate esters. Can J Fish AquatSci 41:1713–1718.
4. Arnot JA, Gobas FAPC. 2004. A food-web bioaccumulation mod-el for organic chemicals in aquatic ecosystems. Environ ToxicolChem 23:2343–2355.
5. Brown M, Werner MB, Sloan RJ, Simpson KW. 1985. Polychlor-inated biphenyls in the Hudson River. Environ Sci Technol 19:656–661.
6. Armstrong RW, Sloan RJ. 1988. PCB patterns in Hudson Riverfish: II. Migrant and marine species. In Lavett Smith C, ed, Fish-

2076 Environ. Toxicol. Chem. 25, 2006 L.A. LeBlanc et al.
eries Research in the Hudson River. State University of NewYork Press, Albany, NY, USA, pp 304–324.
7. Thomann RV, Mueller JA, Winfield RP, Huang C-R. 1991. Modelof fate and accumulation of PCB homologues in Hudson Estuary.J Environ Eng 117:161–178.
8. Butcher JB, Garvey EA. 2004. PCB loading from sediment inthe Hudson River: Congener signature analysis of pathways. En-viron Sci Technol 38:3232–3238.
9. Thomann RV. 1981. Equilibrium model of fate of microcontam-inants in diverse aquatic food chains. Can J Fish Aquat Sci 38:280–296.
10. Thomann RV. 1989. Bioaccumulation model of organic chemicaldistribution in aquatic food chains. Environ Sci Technol 23:699–707.
11. LeBlanc LA, Brownawell BJ. 1993. Tests of bioaccumulationmodels for PCBs: A Study of young-of-the-year bluefish in theHudson River estuary. Final Report. Polgar Research FellowshipProgram, Hudson River Foundation, New York, NY, USA.
12. Nyman RM, Conover DO. 1988. The relation between spawningseason and the recruitment of the young-of-the-year bluefish, Po-matomus saltatrix, to New York. Fish Bull 86:237–250.
13. McBride RS, Conover DO. 1991. Recruitment of young-of-the-year bluefish Pomatomus saltatrix to the New York Bight: Var-iation in abundance and growth of spring- and summer-spawnedcohorts. Mar Ecol Prog Ser 78:205–216.
14. Buckel JA, Conover DO. 1997. Movements, feeding periods, anddaily ration of piscivorous young-of-the-year bluefish (Pomato-mus saltatrix) in the Hudson River estuary. Fish Bull 95:665–679.
15. Buckel JA, Conover DO, Steinberg ND, McKown KA. 1999.Impact of age-0 bluefish (Pomatomus saltatrix) predation on age-0 fishes in the Hudson River estuary: Evidence for density-de-pendent loss of juvenile striped bass. Can J Fish Aquat Sci 56:275–287.
16. Buckel JA, Steinberg ND, Conover DO. 1995. Effects of tem-perature, salinity, and fish size on growth and consumption ofjuvenile bluefish. J Fish Biol 47:696–706.
17. Chiarella LA, Conover DO. 1990. Spawning season and first-yeargrowth of adult bluefish from the New York Bight. Trans AmFish Soc 119:455–462.
18. Juanes F, Marks RE, McKown KA, Conover DO. 1993. Predationby age-0 bluefish on age-0 anadromous fishes in the Hudson Riverestuary. Trans Am Fish Soc 122:348–356.
19. Buckel JA, Conover DO. 1996. Gastric evacuation rates of pi-scivorous young-of-the-year bluefish. Trans Am Fish Soc 125:591–599.
20. Neely WB, Branson DR, Blau GE. 1974. Partition coefficient tomeasure bioconcentration potential of organic chemicals in fish.Environ Sci Technol 8:1113–1115.
21. Mackay D. 1982. Correlation of bioconcentration factors. EnvironSci Technol 16:274–278.
22. Chiou CT. 1985. Partition coefficients of organic compounds in
lipid–water systems and correlations with fish bioconcentrationfactors. Environ Sci Technol 19:57–62.
23. Hawker DW, Connell DW. 1988. Octanol–water partition coef-ficients of polychlorinated biphenyl congeners. Environ Sci Tech-nol 22:382–387.
24. Gobas FAPC, Muir DCG, Mackay D. 1988. Dynamics of dietarybioaccumulation and fecal elimination of hydrophobic organicchemicals in fish. Chemosphere 17:943–962.
25. Gobas FAPC, McCorquodale JR, Haffner GD. 1993. Intestinalabsorption and biomagnification of organochlorines. EnvironToxicol Chem 12:567–576.
26. Gobas FAPC, Wilcocksan JB, Russell RW, Haffner GD. 1999.Mechanism of biomagnification in fish under laboratory and fieldconditions. Environ Sci Technol 33:133–141.
27. Qiao P, Gobas FAPC, Farrell AP. 2000. Relative contribution ofaqueous and dietary uptake of hydrophobic chemicals to the bodyburden in juvenile rainbow trout. Arch Environ Contam Toxicol39:369–377.
28. Kelly BC, Gobas FAPC, McLachlan MS. 2004. Intestinal ab-sorption and biomagnification of organic contaminants in fish,wildlife, and humans. Environ Toxicol Chem 23:2324–2336.
29. Thomann RV, Connolly JP. 1984. Model of PCB in Lake Michiganlake trout food chain. Environ Sci Technol 18:65–71.
30. Connolly JP. 1991. Application of a food-chain model to poly-chlorinated biphenyl contamination of the lobster and winterflounder food chains in New Bedford Harbor. Environ Sci Technol25:760–770.
31. Thomann RV, Mueller JA, Winfield RP, Huang C-R. 1989. Math-ematical model of the long-term behavior of PCBs in the HudsonRiver estuary. Final Report. Hudson River Foundation, New York,NY, USA.
32. Achman DR, Brownawell BJ, Zhang L. 1996. Exchange of po-lychlorinated biphenyls between sediment and water in the Hud-son River estuary. Estuaries 19:950–965.
33. Brownawell BJ, Farrington JW. 1986. Biogeochemistry of PCBsin interstitial waters of a coastal marine sediment. Geochim Cos-mochim Acta 50:157–169.
34. Niimi AJ, Oliver BG. 1988. Influence of molecular weight andmolecular volume on the dietary absorption efficiency of chem-icals by fish. Can J Fish Aquat Sci 45:222–227.
35. Konemann H, van Leeuwen K. 1980. Toxicokinetics in fish: Ac-cumulation and elimination of six chlorobenzenes by guppies.Chemosphere 9:3–19.
36. Spacie A, Hamelink JL. 1982. Alternative models for describingthe bioconcentration of organics in fish. Environ Toxicol Chem1:309–320.
37. Ballschmitter K, Zell M. 1980. Analysis of polychlorinated bi-phenyls (PCB) by glass capillary chromatography. Fresenius ZAnal Chem 302:20–31.
38. Hawker DW, Connell DW. 1986. Bioconcentration of lipophiliccompounds by some aquatic organisms. Ecotoxicol Environ Saf11:184–197.
39. Hawker DW, Connell DW. 1985. Relationships between partitioncoefficient, uptake rate constant, clearance rate constant, and timeto equilibrium for bioaccumulation. Chemosphere 14:1205–1219.


