Embed Size (px)
Citation preview

Full Terms & Conditions of access and use can be found athttp://www.tandfonline.com/action/journalInformation?journalCode=tgnh20
Download by: [Universita Degli Studi di Firenze] Date: 02 August 2017, At: 03:56
Geomatics, Natural Hazards and Risk
ISSN: 1947-5705 (Print) 1947-5713 (Online) Journal homepage: http://www.tandfonline.com/loi/tgnh20
Testing cost-effective methodologies for flood andseismic vulnerability assessment in communitiesof developing countries (Dajç, northern Albania)
Veronica Pazzi, Stefano Morelli, Francesco Fidolini, Elvis Krymi, NicolaCasagli & Riccardo Fanti
To cite this article: Veronica Pazzi, Stefano Morelli, Francesco Fidolini, Elvis Krymi, Nicola Casagli& Riccardo Fanti (2016) Testing cost-effective methodologies for flood and seismic vulnerabilityassessment in communities of developing countries (Dajç, northern Albania), Geomatics, NaturalHazards and Risk, 7:3, 971-999, DOI: 10.1080/19475705.2015.1004374
To link to this article: http://dx.doi.org/10.1080/19475705.2015.1004374
© 2015 The Author(s). Published by Taylor &Francis.
Published online: 03 Feb 2015.
Submit your article to this journal Article views: 988
View related articles View Crossmark data
Citing articles: 4 View citing articles

Testing cost-effective methodologies for flood and seismicvulnerability assessment in communities of developing countries
(Dajc, northern Albania)
VERONICA PAZZI†*, STEFANOMORELLI†, FRANCESCO FIDOLINI†,ELVIS KRYMIz, NICOLA CASAGLI† and RICCARDO FANTI†
yDepartment of Earth Sciences, University of Firenze, Firenze 50121, Italy
zDepartment of Geography, University of Shkoder “Luigj Gurakuqi”,
Shkoder 4001, Albania
(Received 24 March 2014; accepted 2 January 2015)
Nowadays many developing countries need effective measures to reduce the
disaster related risks. Structural interventions are the most effective to achieve
these aims. Nevertheless, in the absence of adequate financial resources different
low-cost strategies can be used to minimize losses. The purpose of this paper is to
demonstrate that the disaster risk reduction can be gathered building a
community coping capacity. In the case study, flood and seismic analyses have
been carried out using relatively simple and low-cost technologies, fundamental
for governments and research institutions of poorly developed countries. In fact,
through the acquisition and dissemination of these basic information, a reduction
of vulnerability and risk can be achieved. In detail, two methodologies for the
evaluation of hydraulic and seismic vulnerability were tested in the Dajc
municipality (Northern Albania), a high-seismicity region that is also severely
affected by floods. Updated bathymetric, topographic and hydraulic data were
processed with HEC-RAS software to identify sites potentially affected by dykes
overflowing. Besides, the soil-structure interaction effects for three strategic
buildings were studied using microtremors and the Horizontal to Vertical
Spectral Ratio method. This flood and seismic vulnerability analysis was then
evaluated in terms of costs and ease of accessibility in order to suggest the best
use both of the employed devices and the obtained information for designing
good civil protection plans and to inform the population about the right
behaviour in case of threat.
1. Introduction
Geohazards are naturally occurring geological, hydrological or geomorphological
phenomena that can potentially cause damage or uncontrolled risk increase to the
human beings, their properties or the environment (Doornkamp 1989). Among all
the natural occurrences, volcanic eruptions, landslides, floods and earthquakes may
be regarded as the most relevant damaging processes (Alc�antara-Ayala 2002). Their
hazard begins whenever small changes in the initial conditions of the Earth surface
induce sudden modifications in long-term behaviour (Scheidegger 1994). Moreover,
according to McCall (1992) and Lekkas (2000) and many other authors, geohazards
*Corresponding author. Email: [email protected]
� 2015 The Author(s). Published by Taylor & Francis.This is an Open Access article distributed under the terms of the Creative Commons
Attribution-NonCommercial-NoDerivatives License (http://creativecommons.org/licenses/by-nc-nd/4.0/), which permitsnon-commercial re-use, distribution, and reproduction in any medium, provided the original work is properly cited, and
is not altered, transformed, or built upon in any way.
Geomatics, Natural Hazards and Risk, 2016
Vol. 7, No. 3, 971�999, http://dx.doi.org/10.1080/19475705.2015.1004374
Dow
nloa
ded
by [
Uni
vers
ita D
egli
Stud
i di F
iren
ze]
at 0
3:56
02
Aug
ust 2
017
involve also the interaction of human activities and any natural process of the planetthat originates in the solid earth, oceans and atmosphere. Nevertheless, considering
this definition, the experience gained until today in this field has shown that the divi-
sion and differentiation of the two mentioned contributions is very difficult, espe-
cially in the circumstance where a catastrophic event is very much influenced and
made worse by the anthropic intervention (Zulherman et al. 2006). Extreme natural
phenomena causing natural hazards are not deemed as controllable events (Hodgkinson
& Stewart 1991) and sometimes they are perceived to be inevitable, but however their
catastrophic impact is not totally unavoidable and it can be significantly reducedusing different methods of mitigation. Nowadays, in many developing countries,
characterized by heavy concentration of people in restricted areas, poorly regulated
urbanization and uncontrolled land use, a natural hazard can result in severe effects,
even if its original impact was not so critical. The realization of risk maps is an essen-
tial tool for planning effective measures of risk mitigation (from the implementation
of the structural countermeasures up to the improvement of the resilient capacity of
the exposed population) and nowadays several low-cost technologies are available
for such a scope (Tobin & Montz 2004; Paul 2011).Albania, which belongs to the above-mentioned category of countries, is vulnera-
ble to a range of natural events with a catastrophic nature. The exposure of Albanian
population to these occurrences is mainly due to poverty, poor infrastructure and
communications, a rapid urban growth and a range of environmental factors caused
by the human negligence (United Nations Development Programme 2003). The
greatest disaster threats in Albania come from severe earthquakes and riverine floods
both at large and small scale (Allaraj et al. 2012).
As concerns floods, they generally have a pluvial origin and occur duringNovember�March, when 80%�85% of the annual precipitations are concentrated
(Bogdani 2006; Pojani & Tola 2010). The main Albanian rivers flow from the moun-
tainous eastern regions to the western coastal plains (Adriatic lowlands), where more
than 50% of the whole population lives and the demographic growth is continuous
and conspicuous (World Bank 2003). During the major flood events the Adriatic
lowlands, especially close to the main river mouths, can be largely inundated for sev-
eral weeks (Bogdani 2006). Among them the plains of the Drin River in the north
and the Vijos€e river in the south are especially flood-prone (World Bank 2003).On the other hand, Albania is usually affected by intense earthquake activity
(Becchi et al. 2011). The strongest and most destructive recorded events in the last
century were: (i) the Shkoder earthquake on June 1, 1905 (Ms D 6.6); (ii) the lake
Ohrid earthquake on February 18, 1911 (Ms D 6.7); (iii) the Tepelene earthquake on
November 26, 1920 (Ms D 6.4); (iv) the Durres earthquake on December 17, 1926
(Ms D 6.2); and (v) the Montenegro earthquake on April 15, 1979 (Ms D 6.9). In
order to prevent new catastrophic consequences the authorities have begun to take
an interest in the problem insomuch as a detailed seismic zoning of Albania hasstarted in 1995 and it is still underway (United Nations Development Programme
2003).
So, as shown, the geohazards assessment is a crucial point for Albania, which has
undergone a rapid development after the political changes of the 1990s and it still is
undergoing the abandonment of a centralized land management in favour of a more
democratic administration, with critical results for the protection of most of the rural
areas (Deininger et al. 2012). Moreover many people are coming back to their own
country after many years of mass emigration, ruining the national territory with the
972 V. Pazzi et al.
Dow
nloa
ded
by [
Uni
vers
ita D
egli
Stud
i di F
iren
ze]
at 0
3:56
02
Aug
ust 2
017
construction of new houses and facilities without appropriate methods, materials andregulation (Muco et al. 2012). In such social context the exploitation of riverbeds for
the illegally dredging of construction materials disturbs the natural equilibrium of
the watercourses (Pojani & Tola 2010). This results in widespread land degradation
and in a chaotic urban development, which represent a major problem for the
national civil protection. In recent times also the migration from rural areas towards
the big conurbations is prevalent and, since the new suburban areas are usually
located in high-risk parcels, with significant vulnerability to natural hazards, their
rate of sprawl represents a significant further problem (Gaetani et al. 2008). Howeverthe national civil protection system, in terms of subsidiary institutional and volunteer
components, is relatively young in Albania. The progressive decentralization of the
competences triggered by all the political changes is going on together with the acqui-
sition of new information and protocols for the local emergency management and the
risk reduction.
As it happens in many communities, risk reduction and vulnerability often are not the
main worries until the disaster occurs. Residents have other issues that assume priority,
and local administrations do not want to dwell on the hazard vulnerability of theircommunities as it might hurt economic investment and growth (Cutter et al. 2008).
Nevertheless, the economic losses due to natural disasters are always greater than the
investments needed to reduce their impact. In particular many advantages can be
obtained investing in the preparedness and the consciousness of the community about
the risks insisting on that area.
However, several approaches to vulnerability and risk assessment have been devel-
oped in literature, both in theoretic frameworks and in different scale case studies. In
the field of natural hazards, the UNISDR (2009) definitions can be considered thekeystone, even if the exact meaning of “vulnerability” continues to represent a
debated issue, in special when different research fields are involved. An interesting
review on the vulnerability components definition has been recently proposed by
Costa and Kropp (2013) that highlighted the links between some methodologies and
case studies in the field of natural/man-made disasters and climate change analyses.
In the risk-hazard context, the approaches extended from qualitative to strictly quan-
titative methods, with tangible differences between social and environmental con-
texts (Thywissen 2006; Ionescu et al. 2009; Fuchs et al. 2011; Hinkel 2011). In thisframework, referring to the definitions in Birkmann (2006), the main purpose of this
paper is to demonstrate that reduced-cost technologies and methods, whose easy
accessibility is fundamental for government and academic institutions of underdevel-
oped countries, can be effectively used to build community coping capacity, intended
as the way in which people or organizations use available resources and abilities to
face adverse consequences of a disaster (UNISDR 2009). An interesting reference in
this sense is represented by the experience of UNISDR and UN-Habitat in the defini-
tion of tools for the assessment of school and hospital safety for multi-hazards indeveloping countries (UNISDR 2010). In the case study, considering the two more
recurrent natural threats in Albania, a municipality in the district of Shkoder (north-
ern Albania) was chosen to develop two different approaches for the rapid assess-
ment of local vulnerability to floods and seismicity. The approach is then evaluated
in terms of technologies’ cost-effectiveness and ease of accessibility in order to sug-
gest to those organizations dealing with disasters (including local authorities and vol-
unteers) the best use both of the employed devices and the obtained information for
designing good civil protection plans, as well as to correctly manage the considered
Remote Sensing Letters 973
Dow
nloa
ded
by [
Uni
vers
ita D
egli
Stud
i di F
iren
ze]
at 0
3:56
02
Aug
ust 2
017
natural emergencies and to inform the population about the right behaviour in caseof threat.
2. Study area
2.1. Geomorphological context
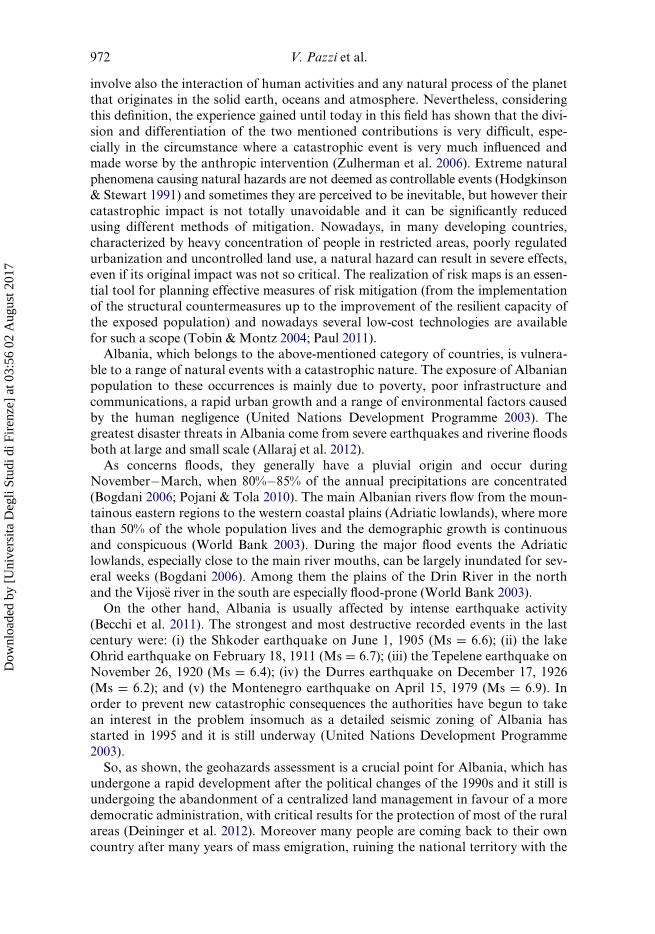
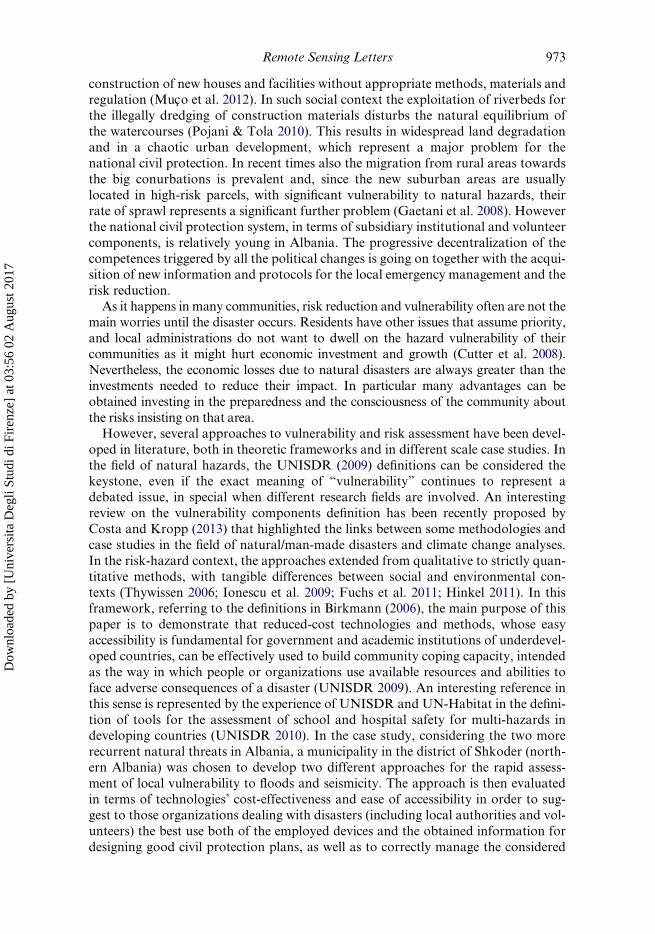
The study area is the municipality of Dajc, located in the Shkoder district (northernAlbania), which is one of the most important hydrographic hubs of the whole coun-
try. The Dajc village rests on a wide alluvial plain, 12 km south-west of Shkoder,
along the left bank of the Buna River, the only emissary of the Shkoder lake (figure 1).
This lake is supplied by a 5,200 km2 drainage basin (20% in Albania, 80% in Monte-
negro; Pano & Avdyli 1984). The Buna River, flowing with a sinuous trend from the
south-eastern reach of the lake in a NE�SW direction, comes to the Adriatic Sea in
correspondence of the city of Velipoj€e. About 2 km south-west of Shkoder, the Buna
River receives the water of the Drin River, which flows from the mountainous regionsin the eastern part of the country. This river encompasses a drainage basin of about
14,200 km2 including Albania, Macedonia and Kosovo (figure 1). As a consequence,
the drainage basin of the Buna–Drin river system extends for about 20,000 km2,
almost half of the total hydrographic surface of Albania.
The Buna River alluvial plain is generally wide, but locally interrupted by NW�SE
oriented and up to 1,600 m high ridges (figure 1(b)) that represent anticlinal folds
involving the rocky substrate. The river has a meandering trend and it is character-
ized by one single channel for most of its course. The alluvial plain is poorly drainedand during the wet season (November�January) it is typically waterlogged. Terrains
are widely used for agricultural aims and houses are concentrated in small villages
dispersed along the riverbeds or not far from them (figure 2).
Figure 1. Location map of the study area. (a) Areal extension of the Buna–Drin drainagebasin (in light blue) and position of the dams (in red) interrupting the Drin River course. (b)Detailed view of the study area. To view this figure in colour, please see the online version ofthe journal.
974 V. Pazzi et al.
Dow
nloa
ded
by [
Uni
vers
ita D
egli
Stud
i di F
iren
ze]
at 0
3:56
02
Aug
ust 2
017

2.2. Climate and hydrology
Northern Albania presents the typical Mediterranean climate (Qiriazi & Sala 2000),
with high precipitation during autumn and winter, sparse during spring and rare in
summer (figure 3). The areal distribution of precipitations is quite complex due to
microclimatic factors related to local reliefs (Grazhdani & Shumka 2007). Thus theAlbanian Alps region represents the area with the mean annual rainfall maximum
Figure 2. The Dajc municipality. (a) Location of the main villages and infrastructure.(b) Geological sketch map (modified after Zacaj et al. 2010).
Figure 3. Chart showing the mean monthly values for rainfall and temperature in theShkoder area.
Remote Sensing Letters 975
Dow
nloa
ded
by [
Uni
vers
ita D
egli
Stud
i di F
iren
ze]
at 0
3:56
02
Aug
ust 2
017

(3,000�3,500 mm/year), while along the coast values are significantly lower (<2,000mm/year). The Albanian Alps region is the area characterized by the highest values
regarding also the daily maximum rainfall, reaching relevant values in the Shkoder
surroundings too (Cetinkaya & Kaymaz 2013).
A dry and hot summer, with high evapotranspiration, and a cold and wet winter,
mainly due to cold humid winds coming from the Adriatic Sea, characterize the
Shkoder district climate. The reliefs parallel to the coast, locally reaching 1,600 m in
height, represent a steep barrier for the westerly winds, causing a rapid uplift of
humid air masses coming from the sea and producing abundant rainfalls on the allu-vial plains behind. As a result the Shkoder district records a mean annual rainfall of
about 1,900 mm/year, with local peaks of 3,000 mm/year in some sectors of the basin.
The mean temperature in January, the coldest month, is about 5 �C, while in July and
August the values reach about 25 �C (Cetinkaya & Kaymaz 2013; figure 3).
Precipitations have clearly a direct impact on the hydrologic balance of the
Shkoder lake and, thus, on the Buna River discharge. According to the change in
precipitation/evapotranspiration rate during the year, the lake level oscillates about
5 m. Just downstream of the lake, the Buna River has a mean annual flow of about320 m3/s (Pano & Avdyli 1984). Nevertheless, downstream of the confluence with the
Drin River, the flow increases dramatically due to the big amount of water supplied
by the latter’s drainage basin. The Drin River comes from the union of two main
streams: the White and Black Drin, flowing in the eastern part of the country. These
two rivers, flowing respectively with a N–S and a S�N trend, converge near the city
of Kukes and there the Drin River starts flowing to the west. The river flow is inter-
rupted by five dams (red lines in figure 1(a)) built to produce electric energy. Two of
them are located upstream of Kukes while the other three are placed downstream ofthe confluence. Such dams significantly altered the hydrological equilibrium of the
Drin River, whose bedload is mostly trapped by the engineering barriers, resulting in
intense erosional phenomena downstream of the dams (Pojani & Tola 2010).
Furthermore the Buna and Drin rivers have not always been confluent. The Drin
River has a minor branch, presently inactive, bifurcating from the major trunk just
downstream the lowermost dam. This branch has been the main river course until
1846�1848, when repeated and dramatic floods promoted the partial abandonment
of this reach and the birth of the confluence with the Buna River (figure 1(b)). It isclear that presently the Buna River, which formerly had a relevantly smaller drainage
basin, downstream of the confluence with the Drin has an undersized riverbed with
respect to the discharge it hosts. As a consequence the hydraulic capacity of the
Buna River results insufficient to drain the huge amounts of water supplied by the
Drin River, especially in case of dams’ opening.
2.3. Geological setting
From a geological point of view the Shkoder area is undoubtedly one of the most
complex of the whole country. This area is crossed by the Shkoder�Peja fault, which
separates the Dinarides to the north from the Hellenides, to the south. These two
chains, representing the southernmost branch of the Alpine orogeny, consist of conti-
nental thrust sheets and previously obducted ophiolites piled up during Late Creta-
ceous to Cenozoic time (Schmidt et al. 2008). The Shkoder�Peja structural
lineament is an active seismogenic transverse fault responsible for many of the
976 V. Pazzi et al.
Dow
nloa
ded
by [
Uni
vers
ita D
egli
Stud
i di F
iren
ze]
at 0
3:56
02
Aug
ust 2
017

earthquakes that affected the area in the recent past. In the surroundings of Shkoderthis fault juxtaposes the calcareous rocks of the Albanian Alps to the north with ter-
rigenous ones to the south. In the study area the latter consist of alternating sand-
stones and mudstones of turbiditic origin and Maastrichtian�Eocene age. These
sedimentary rocks are involved in SW verging folds parallel to the main chain and
represent the rocky substrate, only locally exposed, of the Buna River alluvial plain
sediments between Shkoder and the westernmost carbonatic reliefs. Within the study
area these rocks crop out close to the villages of Belaj, Samrish and Suka-Dajc
(figure 2), where they form an anticline. These deposits rest conformably on a thickcalcareous�dolomitic Cretaceous succession, widely exposed in the reliefs close to
the coast and in the surroundings of the Pentar village.
The Buna River Quaternary alluvial sediments unconformably cover the Creta-
ceous–Eocenic rocks. The alluvial succession, 20�50 m thick, consists of unconsoli-
dated deposits and is composed of a basal interval of sandy gravel (5�30 m thick)
overlaid by a silty sand interval (10�20 m thick).
2.4. Settlements and infrastructures
The study area is a rural territory characterized by small agglomerates (villages) of
few, mainly one-floor houses for a total population of about 5,500 inhabitants. Thesoil use is almost totally agricultural, with some sheep or goat breeding, especially
along the reliefs. The area is reachable only through one main asphalted road depart-
ing from the SH27 National Road � Shkoder�Velipoj€e (figure 2), which connects
the city of Shkoder to the Adriatic coast. At Dajc the main road splits into three
branches: one going through the village and leading to the town hall and the church;
one leading to the village of Samrishti; the third one going to SW to the village of
Pentar. Several unpaved roads depart from the asphalted ones to reach the minor vil-
lages and the isolated houses. Many of the main buildings that can be consideredstrategic from a social and economic point of view are concentrated in Dajc (e.g.
town hall, main church, shops and other economic activities), while the school is
located in Belaj and some other important buildings are placed in Pentar I Ri.
The whole left bank of the Buna River is provided with an earth dyke (figure 2)
that has been recently reinforced with concrete and groynes in the portion directly
facing the chief village. There is no local connection to the right bank, since the only
bridge is that one located in Shkoder, 12 km to NE. A river-crossing service by boat
is provided, even if in a non-continuous way, by some privates on the fluvial reachbetween Dajc and Samrishti.
3. Methodological approaches
The geological risk, which is the expected value of the loss of life, injuries, damage to
property and disruption to the economic activities due to a particular natural phe-
nomenon, is expressed by a formula that links hazard, vulnerability and exposure
value (R D H £ V £ E) (Varnes 1984). Consequently, in order to reduce the risk of
natural hazards becoming disasters, it is necessary to intervene on one or more of the
three components. Forasmuch as the principal geohazard of the study area is floods
and earthquakes, structural interventions aimed at countering the occurrence of
floods and, simultaneously, to make sure the area from earthquakes could be costly
Remote Sensing Letters 977
Dow
nloa
ded
by [
Uni
vers
ita D
egli
Stud
i di F
iren
ze]
at 0
3:56
02
Aug
ust 2
017

in terms of money and time for the considered rural community (Dajc Commune 2008;
table 1). Even the intervention on the exposure value is hardly practicable. In fact
the main concern faced by the local government with regard to housing is currently
linked to the legalization of many buildings that have been built after 1990, illegallyand in an uncontrolled way, motivated by the need for providing shelter to one’s fam-
ily and favoured by the lack of proper control and land management systems from
the local authorities (Dajc Commune 2008). In our opinion also a significant struc-
tural intervention concerning the vulnerability may be costly in such a social context,
and waiting for new and effective non-structural measures (such as laws, restrictions
or surveillance and early warning systems) by the local government, we think that
something more can be made regarding the increase of community coping capacity
and emergency preparedness (sensu UNISDR 2010). This awareness comes fromthe collection of some information during the field survey relating to the economic,
social and attitudinal vulnerability. These information were collected by (i) consulta-
tion of environmental requalification project involving directly or partially this area
(Zacai et al. 2010; VV.AA 2011), (ii) direct observations accompanied by local techni-
cians and (iii) analysis of the wrong behaviour of the population during the last emer-
gencies, observed and reported by the civil protection volunteers, like to save the
cattle rather than themselves. Since vulnerability assessment is understood as a tool
and a pre-condition for effective risk assessment, we concentrated our efforts exclu-sively in this topic. Vulnerability comprises many aspects arising from various physi-
cal, social, economic and environmental factors: in this paper we focus exclusively on
the physical aspect of vulnerability, intended as the whole pre-existing conditions that
are related to those characteristics and properties of the elements at risk. Therefore a
flood and seismic vulnerability analysis was accurately planned and performed by
means of instrumentation suitable to analyse the considered natural events in such a
geomorphological context and consequently to obtain effective data with which to
manage the local capacity. These devices are distinguished by the following features:(i) easy and fast data collection and processing; (ii) portability; (iii) analysis capacity
of large areas in short time; (iv) low cost compared to existing equipment may be used
for the same purposes; (v) worldwide diffusion; (vi) not too complicated learning with
a quick training. The latter point is particularly important because we consider crucial
to convey expertise and diffuse as much as possible appropriate work methodologies
Table 1. Average costs for structural interventions in Albania, as reported by local authori-ties, and for instrumentation used in the field surveys. Instruments are valued according to the
Italian market, while labour is not counted due to its low cost.
Description Cost (k€)
Echosounder 1�5
Tromino 5�10
GPS 6�12
House renovation resisting to earthquakes 35�40
School renovation resisting to earthquakes 45�50
House construction resisting to earthquakes 100
Estimated damage related to 2010�2011 floods 8,000
Economic values exposed to floods and earthquakes (agriculture) 11,000
Economic values exposed to floods and earthquakes (buildings) 15,000
978 V. Pazzi et al.
Dow
nloa
ded
by [
Uni
vers
ita D
egli
Stud
i di F
iren
ze]
at 0
3:56
02
Aug
ust 2
017

to the public administrators who will have to deal with the topic of resilience in thenext future. For this purpose at the end of the work, a two-day course was also per-
formed to expose the main results of the field survey and to begin to train the benefi-
ciaries on local vulnerabilities, emergency behaviours and roles. In addition, after this
theoretical training the local authorities and the volunteers realized the first national
civil protection relief drill in Albania under the supervision of all the Italian institu-
tions involved in this project, in order to highlight the importance of preparedness to
natural disasters.
In conclusion, the methodological approach used in this area was temporarilydeveloped and applied as follows: (i) identification of the most important geological
threats; (ii) selection of the variable of the risk equation to work with: in our case we
decided to evaluate the physical vulnerability since its knowledge is fundamental for
enhance the community coping capacity in developing countries; (iii) selection of
cost-effectiveness instrumentation and easy implementation methodologies suitable
for the aims of the work; (iv) data collection and processing; and (v) representation
of the results mainly by means of maps.
4. Evaluation of the flood susceptibility
A meticulous reconstruction of the topography of the Buna riverbed and its corre-sponding floodplain is essential for an effective hydraulic modelling. In particular,
the extent prediction of the overflowable dykes, and consequently the areas subjected
to direct floodings, inevitably depends on a careful morphological reconstruction of
the perifluvial morphology, including the dykes shape and their spatial distribution,
and the bathymetry of the riverbed itself. For this purpose the basic cartographic
data, available at the offices of the Shkodra district and at the Geography Depart-
ment of University “Luigj Gurakuqi” of Shkodra, were integrated with a DGPS sur-
vey (measurement based on Differential Global Positioning System) along theriverbanks of the Buna River and a bathymetric measurement of the riverbed using a
single beam echosounder altimeter.
4.1. Bathymetric and near-river topographic surveys
The terrestrial topographic mapping was performed with a couple of geodetic GPS
instruments (Leica SR530 devices), each of which is a 24-channel, dual-frequency
GPS receiver of the highest accuracy (Leica 2002). The dual-frequency (L1/L2, fully
independent), on which the measuring system is based, is essential for high-accuracy
results, reduction of ionospheric influences, short rapid-static measurements and fast
ambiguity resolution on the fly (Rizos 2002, 2008).
By using these devices, the operating procedures that can be applied to a topo-graphic survey, such as required for the present work, are based both on static and
dynamic modes. The first applied mode requires that both receivers simultaneously
hold steady above one point in stand-alone acquisitions and uninterruptedly for an
adequate time span. In such configuration, one point must be stationed over an offi-
cially known survey marker and the other over an arbitrarily materialized point in
the work area to use as a reference point for the subsequent dynamic survey. These
measurements, followed by a proper post-processing that puts them in direct correla-
tion, were carried out in order to hook up a new survey point to a national
Remote Sensing Letters 979
Dow
nloa
ded
by [
Uni
vers
ita D
egli
Stud
i di F
iren
ze]
at 0
3:56
02
Aug
ust 2
017
coordinates system, and consequently to obtain a georeferenced and a functional newmarker in study area. The nail that physically represents this latter point was posi-
tioned at the centre of the work area, in a little square facing the church of Dajc,
ensuring its preservation through time, while the known point was found at a linear
distance of about 8.5 km from the other, on the external walls of the Rozafa Castle
in Shkoder. The acquisition time lasted approximately three hours according to the
standard time normally used by the Italian Military Geographic Institute for such
distances (Surace 1993).
Differently, the dynamic mode involves the use of the two receivers that are con-nected to each other via radio modems during the measuring phase. One of them is
kept fixed over the point previously hooked up to the national coordinates system
(functioning as reference in continuous measuring) and the other is moved from time
to time over the points at which the altitudes and coordinates have to be measured
(working as rover with fast acquisitions in separate times). The data exchange
between the base station and the mobile receiver (here feasible for distances less than
2 km because of the antenna’s range) allows each time to calculate in few measure-
ment cycles (corresponding to few seconds) the plano-altimetric location of the roverreceiver with respect to the fixed one and therefore to obtain the absolute coordinates
of every visited point. This measurement procedure (called Real-Time Kinematic
technique or RTK; Peyret et al. 2000), thanks to a favourable geometry of the con-
stellation of satellites in the days of the surveys, enabled a very accurate positioning
of the measured points (§2 cm on average). Thus, such dynamic survey technique,
proved, once again, to be very suitable for the rapid and accurate characterization of
the morphological elements (both natural and anthropogenic) directly associated to
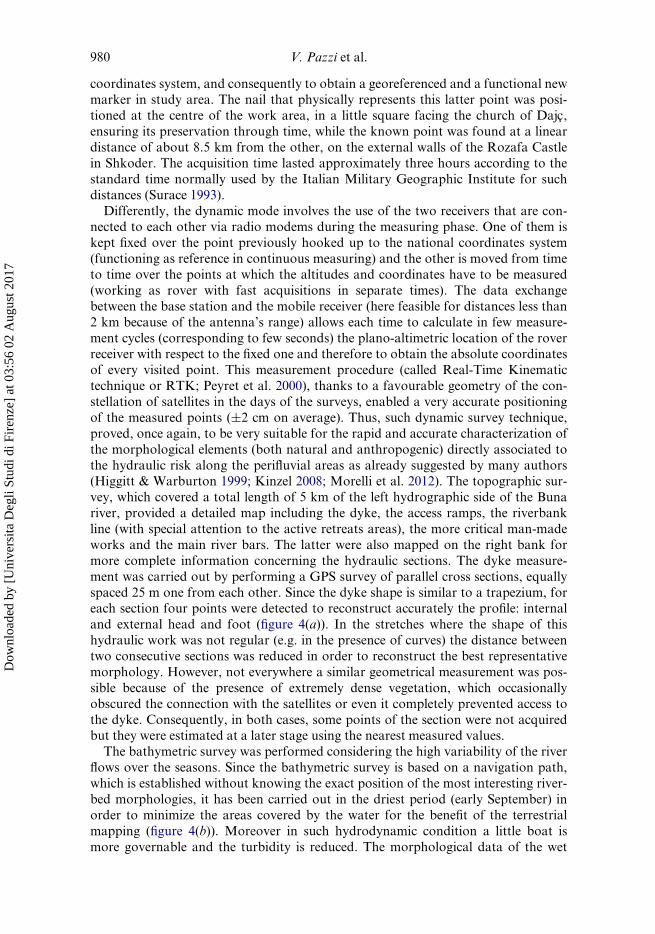
the hydraulic risk along the perifluvial areas as already suggested by many authors(Higgitt & Warburton 1999; Kinzel 2008; Morelli et al. 2012). The topographic sur-
vey, which covered a total length of 5 km of the left hydrographic side of the Buna
river, provided a detailed map including the dyke, the access ramps, the riverbank
line (with special attention to the active retreats areas), the more critical man-made
works and the main river bars. The latter were also mapped on the right bank for
more complete information concerning the hydraulic sections. The dyke measure-
ment was carried out by performing a GPS survey of parallel cross sections, equally
spaced 25 m one from each other. Since the dyke shape is similar to a trapezium, foreach section four points were detected to reconstruct accurately the profile: internal
and external head and foot (figure 4(a)). In the stretches where the shape of this
hydraulic work was not regular (e.g. in the presence of curves) the distance between
two consecutive sections was reduced in order to reconstruct the best representative
morphology. However, not everywhere a similar geometrical measurement was pos-
sible because of the presence of extremely dense vegetation, which occasionally
obscured the connection with the satellites or even it completely prevented access to
the dyke. Consequently, in both cases, some points of the section were not acquiredbut they were estimated at a later stage using the nearest measured values.
The bathymetric survey was performed considering the high variability of the river
flows over the seasons. Since the bathymetric survey is based on a navigation path,
which is established without knowing the exact position of the most interesting river-
bed morphologies, it has been carried out in the driest period (early September) in
order to minimize the areas covered by the water for the benefit of the terrestrial
mapping (figure 4(b)). Moreover in such hydrodynamic condition a little boat is
more governable and the turbidity is reduced. The morphological data of the wet
980 V. Pazzi et al.
Dow
nloa
ded
by [
Uni
vers
ita D
egli
Stud
i di F
iren
ze]
at 0
3:56
02
Aug
ust 2
017
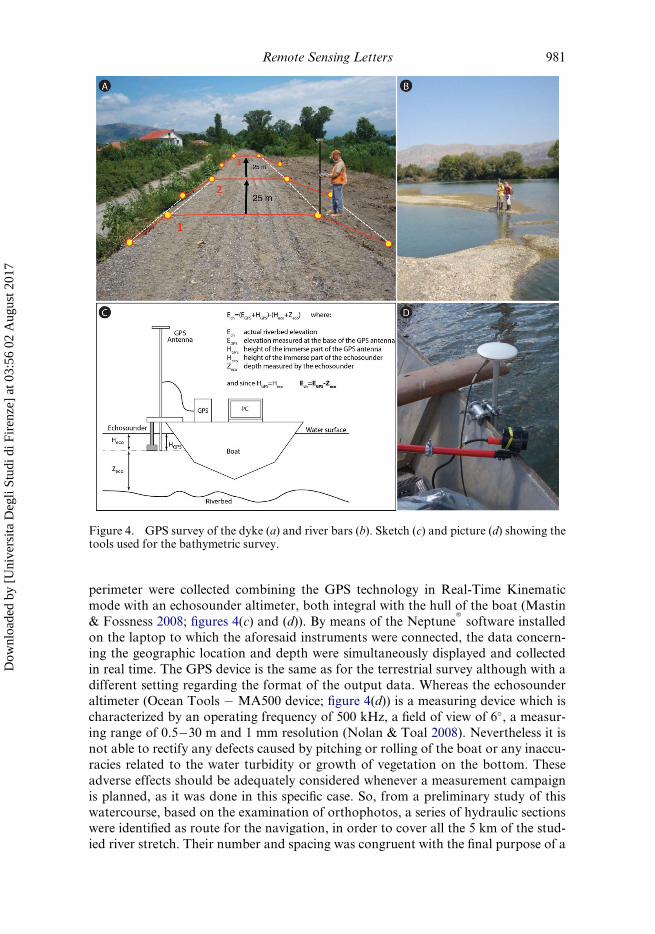
perimeter were collected combining the GPS technology in Real-Time Kinematic
mode with an echosounder altimeter, both integral with the hull of the boat (Mastin
& Fossness 2008; figures 4(c) and (d)). By means of the Neptune�software installed
on the laptop to which the aforesaid instruments were connected, the data concern-
ing the geographic location and depth were simultaneously displayed and collected
in real time. The GPS device is the same as for the terrestrial survey although with a
different setting regarding the format of the output data. Whereas the echosounderaltimeter (Ocean Tools � MA500 device; figure 4(d)) is a measuring device which is
characterized by an operating frequency of 500 kHz, a field of view of 6�, a measur-
ing range of 0.5�30 m and 1 mm resolution (Nolan & Toal 2008). Nevertheless it is
not able to rectify any defects caused by pitching or rolling of the boat or any inaccu-
racies related to the water turbidity or growth of vegetation on the bottom. These
adverse effects should be adequately considered whenever a measurement campaign
is planned, as it was done in this specific case. So, from a preliminary study of this
watercourse, based on the examination of orthophotos, a series of hydraulic sectionswere identified as route for the navigation, in order to cover all the 5 km of the stud-
ied river stretch. Their number and spacing was congruent with the final purpose of a
Figure 4. GPS survey of the dyke (a) and river bars (b). Sketch (c) and picture (d) showing thetools used for the bathymetric survey.
Remote Sensing Letters 981
Dow
nloa
ded
by [
Uni
vers
ita D
egli
Stud
i di F
iren
ze]
at 0
3:56
02
Aug
ust 2
017

detailed mapping. Moreover in order to obtain a digital terrain model of the river-bed, which could be representative of the real morphology, the distance between con-
secutive sections was reduced where the course appeared more irregular (e.g. greater
sinuosity, presence of tributaries or bifurcation of the main channel). Despite the
utmost care in the choice of sections it was not possible to follow all the established
segments during the survey, since the low water level highlighted some obstacles for
navigation. Thirty-four transversal sections were actually followed and by means of
these a high degree of detail was still maintained. In addition also the longitudinal
reaches between sections were measured and recorded obtaining on the whole a
Figure 5. Integration of all the data deriving from GPS and bathymetric surveys with topo-graphic ancillary ones, resulting in a Digital Elevation Model (DEM).
982 V. Pazzi et al.
Dow
nloa
ded
by [
Uni
vers
ita D
egli
Stud
i di F
iren
ze]
at 0
3:56
02
Aug
ust 2
017

dense point cloud along the main channel (figure 5). Finally, where the small depth ofthe riverbed did not allow the navigation the density of the measured points was inte-
grated using only the hand-held GPS device (figure 4(b)).
As concerns the terrestrial topographic mapping, the GPS hardware allowed to
store the RTK data on a PCMCIA card in a Leika proprietary format called raw
data. By their processing with the Leica GeoOffice software an output file in text for-
mat was edited, within which the geographic coordinates of the measured points are
recorded according to the reference system WGS84 (ETRF89) and their correspond-
ing ellipsoidal heights are annotated. Subsequently by using the VERTO softwarethe geographic coordinates were converted into projected coordinates whose carto-
graphic reference system is defined as follows: UTM-WGS84 (the study area falls
within zone 34N). In addition a mathematical transformation was applied to the
height values in order to move from ellipsoidal to orthometric values. At this point
these data were saved in ASCII format and imported into ArcGIS� software to cre-
ate a basic working project on which to base the reconstruction of the terrain model
(figure 5).
In relation to the bathymetric data, the NMEA messages (defined by strings inGGA format) coming from the GPS-RTK measuring were immediately combined
by the Neptune� software with the depth values calculated by the echosounder altim-
eter. In such way the measured coordinates and elevations were obtained for a vast
series of points on the surface of the riverbed. Finally such coordinates were con-
verted into the projected system UTM-WGS84 and the heights were transferred
from ellipsoidal to orthometric values, as in the terrestrial measuring. All the con-
verted data were consequently imported into the previously created ArcGIS� project
through a file in ASCII format. The mapped points were combined with elevationdata deriving from the digitization of contour lines and spot heights of the study
area available base map at 1:10,000 scale. The data integration was performed by
means of the 3D Analyst tool (Create/Modify TIN ! Create TIN from features) in
order to create a digital elevation model (DEM; figure 5) in which all the most useful
topographic information are included for a realistic hydraulic modelling.
4.2. Hydraulic and flood modelling
The hydraulic modelling was carried out by means of HEC-RAS (Hydrologic Engi-
neering Center � River Analysis System), a freeware software designed to perform
one-dimensional (1D) hydraulic calculations for a full network of natural and
anthropic channels (Stratob€erdha et al. 2008; Tetra 2009; Brunner 2010a, 2010b),
and using its ArcGIS� interfacing tool HEC-GeoRAS (Tate & Maidment 1999;
Casas et al. 2006; Ackerman 2009). The software allows to perform four different
analyses: (i) steady flow water surface profile computations, (ii) unsteady flow simu-lation, (iii) movable boundary sediment transport computations and (iv) water qual-
ity analysis. Basing on the purposes of the work, only the steady and the unsteady
flow analyses were carried out. Both analyses allow to model water surface profiles
with subcritical, supercritical or mixed flow regime: the first method solves the 1D
energy equation by means of an iterative procedure called standard step method
(Brunner 2010a, 2010b), while the second solves the 1D Saint Venant equation
adapted by the Barkau’s UNET model (Barkau 1992) by means of an implicit finite
difference method.
Remote Sensing Letters 983
Dow
nloa
ded
by [
Uni
vers
ita D
egli
Stud
i di F
iren
ze]
at 0
3:56
02
Aug
ust 2
017

The hydraulic and flood model can be summarized in seven steps, as sketched in
figure 6. Initially, 39 cross sections were accurately extracted from the collected topo-
graphical data of the studied river reach (figure 5). The roughness coefficients of each
cross section, which represent the surface’s resistance to flow and are integral param-
eters for calculating water depth, were estimated by comparing the actual land use with
the tabulated Manning’s n values (figure 7 and table 2; Chow 1959; Casas et al. 2006;
Brunner 2010b). The land use was obtained by aerial photo interpretation and fieldobservations, so that each section was portioned into several segments (min D 3;
MAX D 8) with homogeneous roughness. As concerns the steady simulation the
water surface profiles were calculated for the mean annual and monthly flows (Pano
& Avdyli 2009; Zacaj et al. 2010) and for a 3,500 m3/s flow, like the one estimated for
the December 2010 flood peak by the local administrations. For the latter analysis a
mixed flow regime was defined, while for the mean flow analysis a subcritical one was
used. The normal depth, given as the river stretch slope (1.25E-04) and calculated bas-
ing on the GPS survey of the water free surface, was established as boundary condi-tion, for all the analyses. On the other hand, the stage hydrograph of the Dajc
Figure 6. Workflow for the hydraulic modelling with HEC-RAS.
984 V. Pazzi et al.
Dow
nloa
ded
by [
Uni
vers
ita D
egli
Stud
i di F
iren
ze]
at 0
3:56
02
Aug
ust 2
017
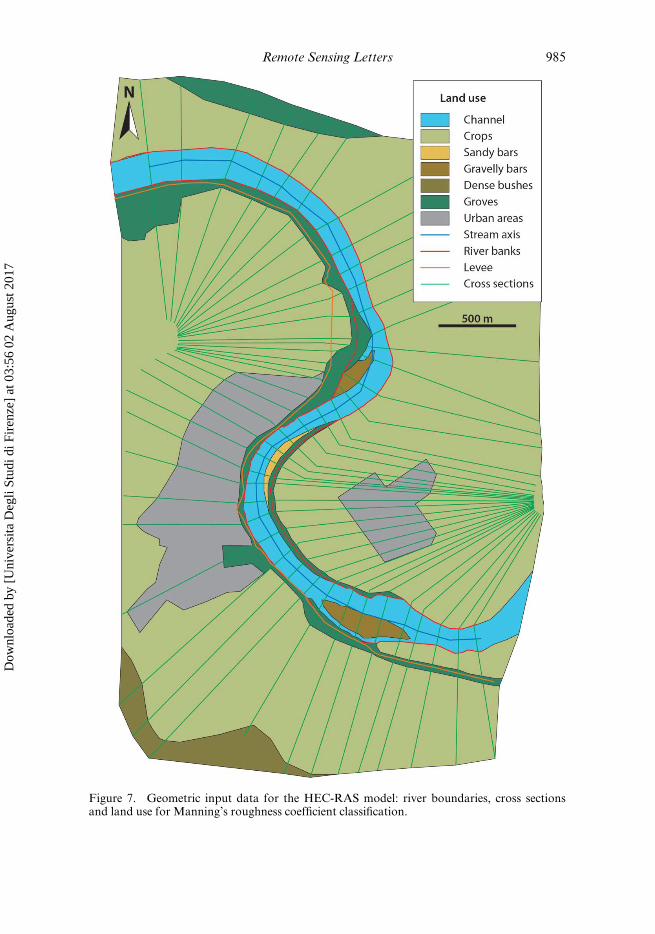
Figure 7. Geometric input data for the HEC-RAS model: river boundaries, cross sectionsand land use for Manning’s roughness coefficient classification.
Remote Sensing Letters 985
Dow
nloa
ded
by [
Uni
vers
ita D
egli
Stud
i di F
iren
ze]
at 0
3:56
02
Aug
ust 2
017

Table 2. Manning’s n coefficients for the different land uses reported in figure 7.
Description Value
Channel (sandy, densely vegetated) 0.035
Crops 0.040�0.050
Sandy bars 0.025
Gravelly bars (with scattered bushes) 0.070�0.080
Dense bushes 0.100
Groves 0.080
Urban areas 0.080
Figure 8. Maps showing unsteady flow simulation results in terms of water height on: (a)November 29, 2010, 12:00 PM; (b) November 30, 2010, 08:00 AM; (c) November 30, 2010,12:00 PM; (d) December 1, 2010, 08:00 AM. (e) Stage hydrograph of the Buna River for thecomputed period (water heights were measured at the Dajc hydrographic station).
986 V. Pazzi et al.
Dow
nloa
ded
by [
Uni
vers
ita D
egli
Stud
i di F
iren
ze]
at 0
3:56
02
Aug
ust 2
017

hydrometric station (N: 19�250, E: 41�590; figure 2(a)) covering the period August 1,2008 to November 30, 2011 was used as boundary condition in the unsteady flow
analysis. In this case a mixed flow regime was defined; the upper stream boundary
condition was the stage hydrograph, while the downstream one was the river stretch
slope. The computational interval was set at one hour, while the hydrograph output
interval was set at eight hours.
The steady and unsteady hydraulic and flood analyses confirm that the right bank is
more prone to flooding, being not protected by dykes. On the left bank dykes are firstly
overflowed near Samrishti (figure 8), where their height is the lowest (h D 6 m a.s.l.),then near Dajc (h D 7 m a.s.l.) and finally near Mushani (h D 7 m a.s.l.), where river
terraces completely lack (figure 8). As expected, the lowered areas are those that are
firstly drowned. Moreover the flood peak characteristics considerably affect the height
of overflowing. The hydraulic and flood analysis results agree with the real data: wet
surfaces correspond to those reported in literature (Zacaj et al. 2010) and by the local
administrations. The results of the steady flow analysis, carried out with a 3,500 m3/s
flow, and the unsteady flow analysis results of the December 6, 2010 event, when the
water height was the highest recorded (7.68 m), are also comparable.
5. Seismic vulnerability assessment of strategic buildings
The seismic vulnerability assessment of the existing buildings is important to understand
the soil-structure interaction effects (Stewart & Fenves 1998): recent studies have shown
that the Horizontal to Vertical Spectral Ratio (HVSR) method (Nakamura 1989) is
able to detect the fundamental vibration modes of the buildings (Mucciarelli et al. 2001;
Gallipoli et al. 2004). To process the environmental noise traces according to the H/V
technique means identifying the origin (natural or anthropogenic) of the H/V peaks and
consequently the ground or building resonant frequency.
5.1. Seismic-noise survey
According to the local administration, three strategic buildings were selected to per-
form the seismic vulnerability analysis: the Dajc town hall (figure 9(a)), the Dajcmain church (figure 9(b)) and the “Luc€e Agraja” secondary school in Belaj village
(figure 9(d)). These buildings were chosen because during the 2010/2011 floods they
served both as operating centres for the crisis management and as shelter for dis-
placed people. Moreover free-field measurements of ambient noise were carried out
in an open area close to Pentar (figure 2), a raised site chosen as a gathering point in
case of emergency. Finally measurements on exposed bedrock were performed in
Pentar and Belaj (figure 2). In order to characterize the main frequencies of the exist-
ing buildings, microtremors measurements were carried out at each floor of theabove-mentioned structures and free-field measures were performed as far as possible
from them, in order to avoid their influence and not on cement, concrete or asphalt
(Gallipoli et al. 2004; Castellaro & Mulargia 2009; Ditommaso et al. 2010). The seis-
mic noise was recorded by means of two Tromino�, the all-in-one compact 3-direc-
tional 24-bit digital tromometers by Micromed (maximum portability: 1 dm3 volume
and 1 kg weight; figure 9(c)) (Castellaro & Mulargia 2009; Ditommaso et al. 2010).
According to the Italian Civil Protection guide lines about microtremors measure-
ments, these instruments were chosen both for their ease of use and for the very small
Remote Sensing Letters 987
Dow
nloa
ded
by [
Uni
vers
ita D
egli
Stud
i di F
iren
ze]
at 0
3:56
02
Aug
ust 2
017
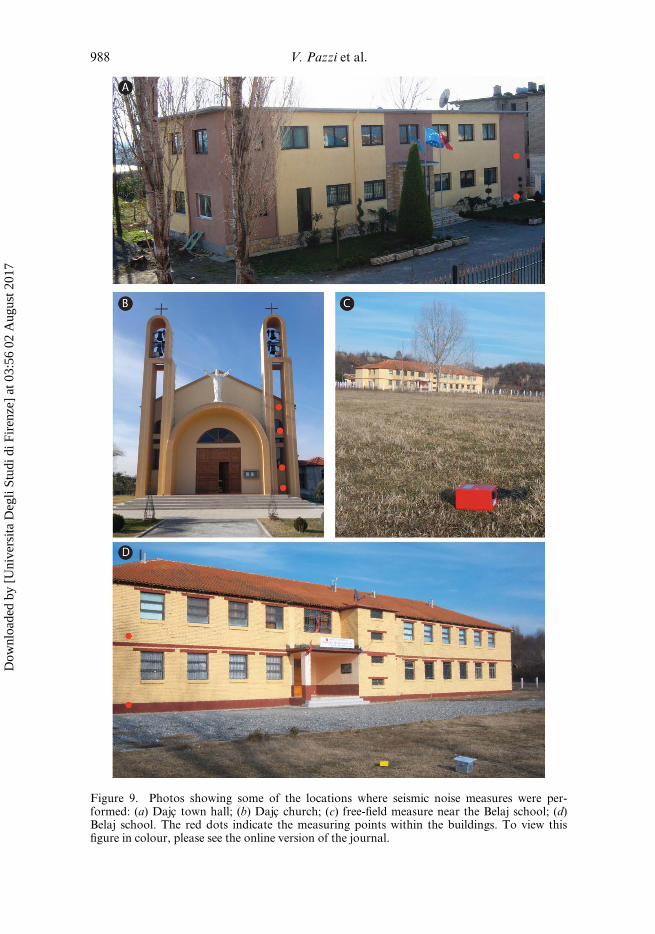
Figure 9. Photos showing some of the locations where seismic noise measures were per-formed: (a) Dajc town hall; (b) Dajc church; (c) free-field measure near the Belaj school; (d)Belaj school. The red dots indicate the measuring points within the buildings. To view thisfigure in colour, please see the online version of the journal.
988 V. Pazzi et al.
Dow
nloa
ded
by [
Uni
vers
ita D
egli
Stud
i di F
iren
ze]
at 0
3:56
02
Aug
ust 2
017

size and the absence of connection cables between geophones, seismograph and data-logger, which considerably reduces the noise induced by instrumentation on the
measures of seismic noise.
Outside of the buildings the instruments were aligned to the geographical north
and left to acquire for 20 minutes, while inside the instrumental north was aligned to
the minor axis of the building and each measurement run for 10 minutes. The instru-
ment�soil coupling was obtained using the pins set supplied with the instrument or
placing it directly on the soil (Ditommaso et al. 2010). The sampling rate was 128 Hz.
5.2. Seismic data analysis and results
The data analysis was carried out using the Grilla� software (by Micromed), that
implements the guidelines for processing ambient vibration data according to the
HVSR technique (Nakamura 1989; SESAME 2004). For each site, as first approxi-mation, the whole trace was subdivided into non-overlapping windows of 20 seconds
and each window was: (i) analysed to keep the most stationary parts of the signal
avoiding the transient; (ii) fast Fourier transformed and (iii) smoothed with triangu-
lar windows with a width equal to 10% of the central frequency. The directionality
degree of each spectral peak was evaluated through directional H/V analysis with an
angular step of 10� (Del Gaudio et al. 2008). Later, some parameters, like the analy-
sis frequency range or the smooth-window width, were changed basing on the first
outcomes in order to improve the analysis results.It is important to remember that the single component spectra (NS, EW and Z) are
the averages computed on each single direction, for each analysis window, while the
final H/V is the ratio between the Euclidean average of the horizontal component
spectra (EW and NS) and the vertical one (Z) for each window (Castellaro &
Mulargia 2009). In the average H/V spectrum (figures 10(a), (e), (g), and (i)) the black
lines enclose the confidence interval (Δ(H/V)) of the H/V curve: because of the prop-
erties of the errors, that are always additive, the H/V confidence interval is narrow if
the confidence intervals of the single components (ΔH and ΔV) are narrow (Castellaro& Mulargia 2009). This is why the transients were removed carefully during the first
signal analysis. If f0i is the central frequency of the ith peak in the spectral components
figures, the natural peaks are clearly marked by an “eye-shaped” detachment of the
horizontal components from the vertical one centred in f0i (SESAME 2004) and by a
H/V curve amplitude<1 around 2f0i (Castellaro &Mulargia 2009).
If the sedimentary cover above the rocky substrate is a homogeneous horizontal
layer over a half-space, the resonance fundamental frequency (f0) is given by the
equation
f0 DVs=4h (1)
where Vs is the S-wave velocity of the coverage and h is its thickness.
In order to identify the fundamental frequencies of the buildings, the internal meas-
urements were referred at the one got outside the building (Ditommaso et al. 2010).
The Dajc town hall building is a two-floor structure (figure 9(a)), rectangular-
shaped, with side-lengths of about 25 £ 10 m, build with reinforced concrete and
bricks. Simultaneous microtremors measurements were carried out at the ground and
the first floor on the western side of the structure. Two free-field measurements, whose
Remote Sensing Letters 989
Dow
nloa
ded
by [
Uni
vers
ita D
egli
Stud
i di F
iren
ze]
at 0
3:56
02
Aug
ust 2
017

Figure 10. (a) The H/V spectral ratio and the three component spectra of the free-field mea-surement carried out in the church garden (in front of the town hall � Dajc village) andemployed as reference for the building vibration analysis. (b) The town hall H0/Hi spectra. (c)The church amplification rate. (d) The church H0/Hi spectra. (e) The H/V spectral ratio andthe three component spectra of the measurement carried out on the outcropping bedrock200 m away from the school (Belaj village). (f) The school H0/Hi spectra. (g) and (h) The H/Vspectral ratio and the three component spectra of the two free-field measurements carried out20 and 60 m, respectively, away from the school. (i) The H/V spectral ratio and the three com-ponent spectra of the measurement carried out on the outcropping bedrock near the Pentar vil-lage. (l) The H/V spectral ratio and the three component spectra of the free-field measurementcarried out on the field that was employed as a gathering place during the last emergency.
990 V. Pazzi et al.
Dow
nloa
ded
by [
Uni
vers
ita D
egli
Stud
i di F
iren
ze]
at 0
3:56
02
Aug
ust 2
017
results are comparable, were carried out in the adjacent garden. The H/V spectralratios of the free-field measurements show a natural peak at 1.88�2 Hz
(figure 10(a)). To evaluate the town hall seismic vulnerability, the ratios between the
internal measurements and the two free-field measurements were calculated. These
ratios are comparable and the results of the ratio with the nearest free-field measure
are shown in figure 10(b): the 2.5 Hz peak can be correlated to the soil effect on the
structure, while the 6.5 Hz peak, clearly visible on all the components, and the 8.2 Hz
peak, visible on the EW direction, are respectively the first and second vibrating mode
of the structure (Ditommaso et al. 2010). The ratiobetween the frequency of the soiland the buildings first vibrating mode (Clinton et al. 2006) is in the range 0.29�0.31.
The Dajc church (figure 9(b)), a reinforced concrete and bricks building, is quite
recent: its aisle is about 35 m and the transepts are about 20 m. During the
2010�2011 floods, as reported by the local authorities, the church suffered differential
settlements between the aisle and the transepts. Because of the church shape, as well
as considering the aforementioned information, the internal measurements were per-
formed in three different places: (i) at four different heights near the east main door
(figure 9(b)); (ii) at two different heights in the south transept and (iii) at two differentheights in the new sacristy, built against the north transept in January 2012. The same
free-field measurements used for the town hall spectral ratio were used, since the church
is so close to the external measuring point as the town hall is. Regarding the inside meas-
ures, only the results of those performed on the eastern side are here reported, because
they resulted more significant: the 6 Hz peak, clearly visible on the EW direction, and
the 8 Hz peak, visible on the NS direction (figure 10(d)), represent the first and second
vibrating mode of the structure respectively (Ditommaso et al. 2010). Figure 10(c)
shows that the amplification increases linearly with the height (Gallipoli et al. 2004).The ratio between the soil frequency and the building’s first vibration frequency
(Clinton et al. 2006) is 0.31�0.33.
The Belaj school (figures 9(c) and (d)) is a two-floor building, rectangular-shaped,
with side-lengths of about 45 £ 15 m, build with reinforced concrete and bricks. It
suffered extensive damages during the 2010�2011 floods, so that the ground floor
classrooms are presently unusable. Simultaneous microtremors measurements were
carried out at the ground and the first floor on the eastern side of the structure. Four
free-field measurements were carried out: two on the exposed bedrock at 120 and200 m from the school and two on the field in front of the school at 20 and 60 m. The
H/V spectral ratio of the measurements carried out on the bedrock, as expected
(Field & Jacob 1995; Lachet et al. 1996), is flat with an amplification value of 1
(figure 10(e)); the H/V spectral ratios of the free-field measurement carried out 20 m
far from the school show a natural peak at 11.25 Hz, while the other shows a natural
peak at 2.97 Hz (figures 10(g) and (h)).
The ratios between the inside measurements and the two free-field measurements
were calculated to evaluate the school seismic vulnerability. These ratios are compa-rable and the ratio with the nearest free-field measure is shown in figure 10(f): the
6 Hz peak clearly visible on the EW direction is the first vibrating mode of the struc-
ture (Ditommaso et al. 2010). The ratio between the frequency of the soil and the first
vibrating mode of the building (Clinton et al. 2006) is 0.49.
In Pentar two measurements were carried out: one on the exposed bedrock and
one on a field used as a gathering point during the last floods: both the H/V spectral
ratios are flat and equal to 1 (figures 10(i)�(l)).
Remote Sensing Letters 991
Dow
nloa
ded
by [
Uni
vers
ita D
egli
Stud
i di F
iren
ze]
at 0
3:56
02
Aug
ust 2
017

6. Discussion
The studied area is very prone to flooding, due to a combination of natural (geomor-
phological, hydraulic) and anthropogenic (dams management, dykes location and
morphology) causes. In the last ten years at least three main flood events occurred inthe area, dramatically affecting the population: (i) many businesses were closed and
many people were out of work; (ii) surface waters were polluted due to the uncon-
trolled circulation of waste water; (iii) schools remained closed for a few weeks; (iv)
agriculture was strongly damaged often with the loss of the entire annual production
(table 1). The local authorities are thus in need of a tool capable of predicting, with a
certain precision, where the dykes are going to be firstly overflowed with a given dis-
charge for the Buna River.
The selected approach for the hydraulic vulnerability evaluation is really cost effec-tive, since it is based on an open source software (HEC-RAS) integrated with a com-
mon ArcGIS� platform. The required input data (hydrological data, river
bathymetry, banks morphology and land use) are already owned or easily achievable
for the local authorities. To test the methodology we processed the data relative to the
last flooding event and verified whereas the modelling results were comparable with
the real observed scenario. The unsteady flow analysis results obtained using the
hydrometric data for the considered flood peaks (December 6, 2010 and January 13,
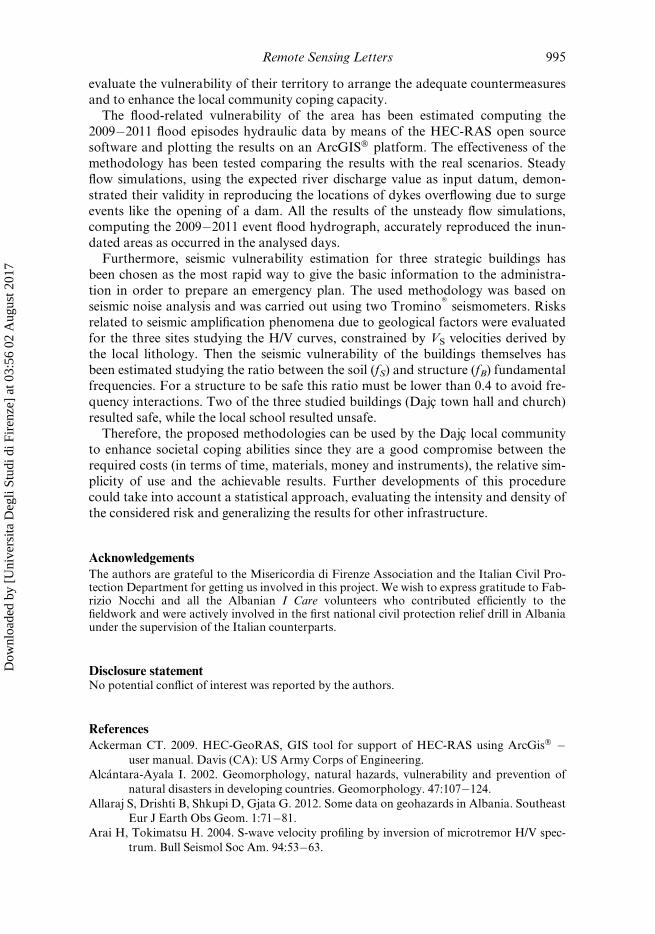
2011) accurately reproduce the real scenarios for those days in terms of dykes over-flowing, as shown by satellite images (ENVISAT ASTAR and TerraSAR-X; figures 11
and 12) elaborated and made available as free data by the Center for Satellite Based
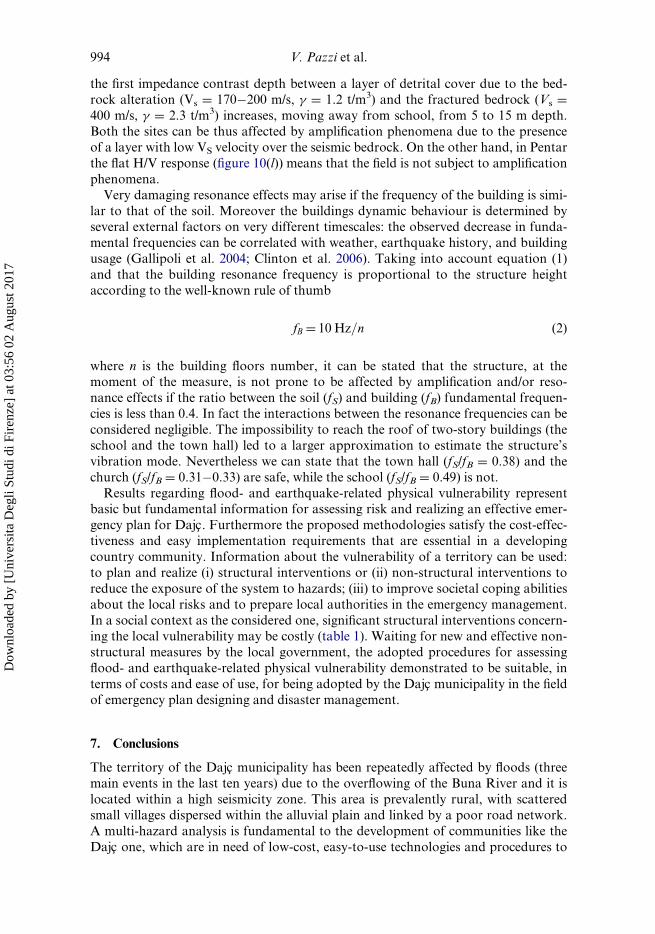
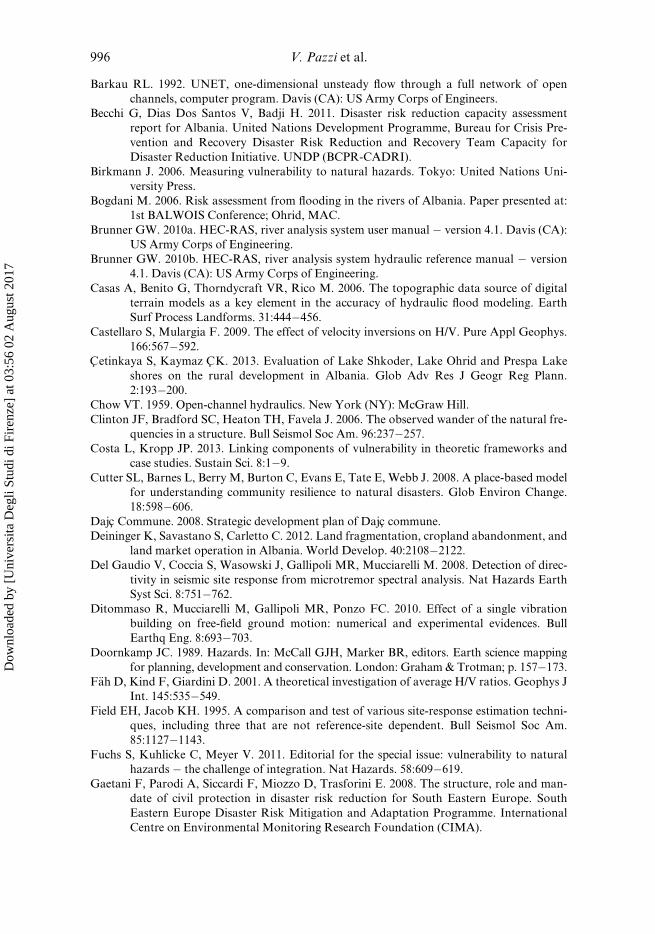
Crisis Information. Moreover, as shown in figure 12, the results obtained by the steady
flow simulation, using as input datum a discharge value of 3,500 m3/s, and those deriv-
ing from the unsteady flow simulation, using the flood hydrograph for the same event,
are comparable. In case a single surge event simulation is needed (i.e. a sudden opening
of the dam), the steady flow analysis demonstrates to be the most effective tool in
terms of required input data, computational time and results. This kind of simulationcan be extremely useful as a forecasting tool to predict the dykes overflowing locations
for a given discharge. The unsteady flow analysis is recommended to evaluate critical
values for hydrometric heights and estimate alert thresholds.
The study area resides in a seismically active area too. A detailed seismic zonation
was besides the aims of the project, thus a rapid method to establish the seismic vul-
nerability of strategic edifices was implemented. This methodology is based on the
usage of relatively simple and low cost instruments (Tromino�), whose major skill is
its high portability. This kind of approach, based on the HVSR Nakamura’s tech-nique (Nakamura 1989), is widely reported in literature (e.g. Mucciarelli et al. 2001;
Gallipoli et al. 2004; Sesame 2004; Del Gaudio et al. 2008; Castellaro & Mulargia
2009; Ditommaso et al. 2010). With reference to equation (1), given the f0 value for
the studied site and deducing the VS values from local geology, it is possible to con-
strain the H/V curves and perform a theoretical fit in terms of Vs to obtain the
approximation of the stratigraphy of the first meters (F€ah et al. 2001; Arai & Toki-
matsu 2004; Castellaro & Mulargia 2009). This fitting was carried out by means of
the Grilla� software and the Vs were drawn from the geological map of the Dajcmunicipality (Zacaj et al. 2010). Therefore the theoretical fit in terms of Vs of the two
free-field measurements carried out in front of the Dajc town hall allowed to detect
the first impedance contrast between a sandy gravel layer (Vs D 198 m/s, g D 2 t/m3)
and the fractured bedrock (Vs D 570 m/s, g D 2.3 t/m3) at about 30�35 m. In Belaj
992 V. Pazzi et al.
Dow
nloa
ded
by [
Uni
vers
ita D
egli
Stud
i di F
iren
ze]
at 0
3:56
02
Aug
ust 2
017
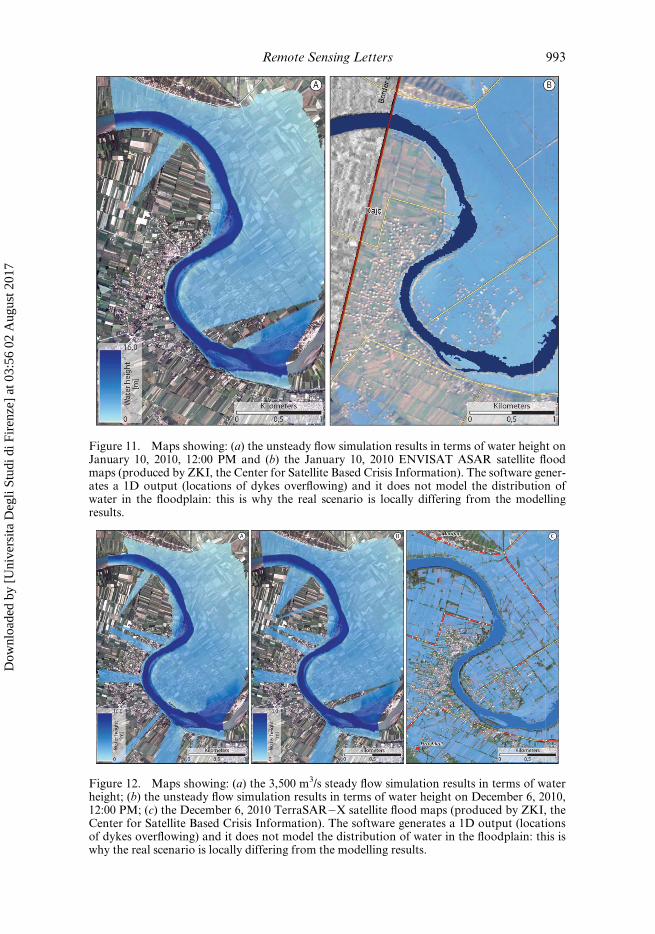
Figure 11. Maps showing: (a) the unsteady flow simulation results in terms of water height onJanuary 10, 2010, 12:00 PM and (b) the January 10, 2010 ENVISAT ASAR satellite floodmaps (produced by ZKI, the Center for Satellite Based Crisis Information). The software gener-ates a 1D output (locations of dykes overflowing) and it does not model the distribution ofwater in the floodplain: this is why the real scenario is locally differing from the modellingresults.
Figure 12. Maps showing: (a) the 3,500 m3/s steady flow simulation results in terms of waterheight; (b) the unsteady flow simulation results in terms of water height on December 6, 2010,12:00 PM; (c) the December 6, 2010 TerraSAR�X satellite flood maps (produced by ZKI, theCenter for Satellite Based Crisis Information). The software generates a 1D output (locationsof dykes overflowing) and it does not model the distribution of water in the floodplain: this iswhy the real scenario is locally differing from the modelling results.
Remote Sensing Letters 993
Dow
nloa
ded
by [
Uni
vers
ita D
egli
Stud
i di F
iren
ze]
at 0
3:56
02
Aug
ust 2
017
the first impedance contrast depth between a layer of detrital cover due to the bed-rock alteration (Vs D 170�200 m/s, g D 1.2 t/m3) and the fractured bedrock (Vs D400 m/s, g D 2.3 t/m3) increases, moving away from school, from 5 to 15 m depth.
Both the sites can be thus affected by amplification phenomena due to the presence
of a layer with low VS velocity over the seismic bedrock. On the other hand, in Pentar
the flat H/V response (figure 10(l)) means that the field is not subject to amplification
phenomena.
Very damaging resonance effects may arise if the frequency of the building is simi-
lar to that of the soil. Moreover the buildings dynamic behaviour is determined byseveral external factors on very different timescales: the observed decrease in funda-
mental frequencies can be correlated with weather, earthquake history, and building
usage (Gallipoli et al. 2004; Clinton et al. 2006). Taking into account equation (1)
and that the building resonance frequency is proportional to the structure height
according to the well-known rule of thumb
fB D 10 Hz=n (2)
where n is the building floors number, it can be stated that the structure, at themoment of the measure, is not prone to be affected by amplification and/or reso-
nance effects if the ratio between the soil (fS) and building (fB) fundamental frequen-
cies is less than 0.4. In fact the interactions between the resonance frequencies can be
considered negligible. The impossibility to reach the roof of two-story buildings (the
school and the town hall) led to a larger approximation to estimate the structure’s
vibration mode. Nevertheless we can state that the town hall (fS/fB D 0.38) and the
church (fS/fB D 0.31�0.33) are safe, while the school (fS/fB D 0.49) is not.
Results regarding flood- and earthquake-related physical vulnerability representbasic but fundamental information for assessing risk and realizing an effective emer-
gency plan for Dajc. Furthermore the proposed methodologies satisfy the cost-effec-
tiveness and easy implementation requirements that are essential in a developing
country community. Information about the vulnerability of a territory can be used:
to plan and realize (i) structural interventions or (ii) non-structural interventions to
reduce the exposure of the system to hazards; (iii) to improve societal coping abilities
about the local risks and to prepare local authorities in the emergency management.
In a social context as the considered one, significant structural interventions concern-ing the local vulnerability may be costly (table 1). Waiting for new and effective non-
structural measures by the local government, the adopted procedures for assessing
flood- and earthquake-related physical vulnerability demonstrated to be suitable, in
terms of costs and ease of use, for being adopted by the Dajc municipality in the field
of emergency plan designing and disaster management.
7. Conclusions
The territory of the Dajc municipality has been repeatedly affected by floods (three
main events in the last ten years) due to the overflowing of the Buna River and it is
located within a high seismicity zone. This area is prevalently rural, with scattered
small villages dispersed within the alluvial plain and linked by a poor road network.
A multi-hazard analysis is fundamental to the development of communities like the
Dajc one, which are in need of low-cost, easy-to-use technologies and procedures to
994 V. Pazzi et al.
Dow
nloa
ded
by [
Uni
vers
ita D
egli
Stud
i di F
iren
ze]
at 0
3:56
02
Aug
ust 2
017
evaluate the vulnerability of their territory to arrange the adequate countermeasuresand to enhance the local community coping capacity.
The flood-related vulnerability of the area has been estimated computing the
2009�2011 flood episodes hydraulic data by means of the HEC-RAS open source
software and plotting the results on an ArcGIS� platform. The effectiveness of the
methodology has been tested comparing the results with the real scenarios. Steady
flow simulations, using the expected river discharge value as input datum, demon-
strated their validity in reproducing the locations of dykes overflowing due to surge
events like the opening of a dam. All the results of the unsteady flow simulations,computing the 2009�2011 event flood hydrograph, accurately reproduced the inun-
dated areas as occurred in the analysed days.
Furthermore, seismic vulnerability estimation for three strategic buildings has
been chosen as the most rapid way to give the basic information to the administra-
tion in order to prepare an emergency plan. The used methodology was based on
seismic noise analysis and was carried out using two Tromino�seismometers. Risks
related to seismic amplification phenomena due to geological factors were evaluated
for the three sites studying the H/V curves, constrained by VS velocities derived bythe local lithology. Then the seismic vulnerability of the buildings themselves has
been estimated studying the ratio between the soil (fS) and structure (fB) fundamental
frequencies. For a structure to be safe this ratio must be lower than 0.4 to avoid fre-
quency interactions. Two of the three studied buildings (Dajc town hall and church)
resulted safe, while the local school resulted unsafe.
Therefore, the proposed methodologies can be used by the Dajc local community
to enhance societal coping abilities since they are a good compromise between the
required costs (in terms of time, materials, money and instruments), the relative sim-plicity of use and the achievable results. Further developments of this procedure
could take into account a statistical approach, evaluating the intensity and density of
the considered risk and generalizing the results for other infrastructure.
Acknowledgements
The authors are grateful to the Misericordia di Firenze Association and the Italian Civil Pro-tection Department for getting us involved in this project. We wish to express gratitude to Fab-rizio Nocchi and all the Albanian I Care volunteers who contributed efficiently to thefieldwork and were actively involved in the first national civil protection relief drill in Albaniaunder the supervision of the Italian counterparts.
Disclosure statementNo potential conflict of interest was reported by the authors.
ReferencesAckerman CT. 2009. HEC-GeoRAS, GIS tool for support of HEC-RAS using ArcGis� �
user manual. Davis (CA): US Army Corps of Engineering.
Alc�antara-Ayala I. 2002. Geomorphology, natural hazards, vulnerability and prevention of
natural disasters in developing countries. Geomorphology. 47:107�124.
Allaraj S, Drishti B, Shkupi D, Gjata G. 2012. Some data on geohazards in Albania. Southeast
Eur J Earth Obs Geom. 1:71�81.
Arai H, Tokimatsu H. 2004. S-wave velocity profiling by inversion of microtremor H/V spec-
trum. Bull Seismol Soc Am. 94:53�63.
Remote Sensing Letters 995
Dow
nloa
ded
by [
Uni
vers
ita D
egli
Stud
i di F
iren
ze]
at 0
3:56
02
Aug
ust 2
017
Barkau RL. 1992. UNET, one-dimensional unsteady flow through a full network of open
channels, computer program. Davis (CA): US Army Corps of Engineers.
Becchi G, Dias Dos Santos V, Badji H. 2011. Disaster risk reduction capacity assessment
report for Albania. United Nations Development Programme, Bureau for Crisis Pre-
vention and Recovery Disaster Risk Reduction and Recovery Team Capacity for
Disaster Reduction Initiative. UNDP (BCPR-CADRI).
Birkmann J. 2006. Measuring vulnerability to natural hazards. Tokyo: United Nations Uni-
versity Press.
Bogdani M. 2006. Risk assessment from flooding in the rivers of Albania. Paper presented at:
1st BALWOIS Conference; Ohrid, MAC.
Brunner GW. 2010a. HEC-RAS, river analysis system user manual � version 4.1. Davis (CA):
US Army Corps of Engineering.
Brunner GW. 2010b. HEC-RAS, river analysis system hydraulic reference manual � version
4.1. Davis (CA): US Army Corps of Engineering.
Casas A, Benito G, Thorndycraft VR, Rico M. 2006. The topographic data source of digital
terrain models as a key element in the accuracy of hydraulic flood modeling. Earth
Surf Process Landforms. 31:444�456.
Castellaro S, Mulargia F. 2009. The effect of velocity inversions on H/V. Pure Appl Geophys.
166:567�592.
Cetinkaya S, Kaymaz CK. 2013. Evaluation of Lake Shkoder, Lake Ohrid and Prespa Lake
shores on the rural development in Albania. Glob Adv Res J Geogr Reg Plann.
2:193�200.
Chow VT. 1959. Open-channel hydraulics. New York (NY): McGraw Hill.
Clinton JF, Bradford SC, Heaton TH, Favela J. 2006. The observed wander of the natural fre-
quencies in a structure. Bull Seismol Soc Am. 96:237�257.
Costa L, Kropp JP. 2013. Linking components of vulnerability in theoretic frameworks and
case studies. Sustain Sci. 8:1�9.
Cutter SL, Barnes L, Berry M, Burton C, Evans E, Tate E, Webb J. 2008. A place-based model
for understanding community resilience to natural disasters. Glob Environ Change.
18:598�606.
Dajc Commune. 2008. Strategic development plan of Dajc commune.
Deininger K, Savastano S, Carletto C. 2012. Land fragmentation, cropland abandonment, and
land market operation in Albania. World Develop. 40:2108�2122.
Del Gaudio V, Coccia S, Wasowski J, Gallipoli MR, Mucciarelli M. 2008. Detection of direc-
tivity in seismic site response from microtremor spectral analysis. Nat Hazards Earth
Syst Sci. 8:751�762.
Ditommaso R, Mucciarelli M, Gallipoli MR, Ponzo FC. 2010. Effect of a single vibration
building on free-field ground motion: numerical and experimental evidences. Bull
Earthq Eng. 8:693�703.
Doornkamp JC. 1989. Hazards. In: McCall GJH, Marker BR, editors. Earth science mapping
for planning, development and conservation. London: Graham & Trotman; p. 157�173.
F€ah D, Kind F, Giardini D. 2001. A theoretical investigation of average H/V ratios. Geophys J
Int. 145:535�549.
Field EH, Jacob KH. 1995. A comparison and test of various site-response estimation techni-
ques, including three that are not reference-site dependent. Bull Seismol Soc Am.
85:1127�1143.
Fuchs S, Kuhlicke C, Meyer V. 2011. Editorial for the special issue: vulnerability to natural
hazards � the challenge of integration. Nat Hazards. 58:609�619.
Gaetani F, Parodi A, Siccardi F, Miozzo D, Trasforini E. 2008. The structure, role and man-
date of civil protection in disaster risk reduction for South Eastern Europe. South
Eastern Europe Disaster Risk Mitigation and Adaptation Programme. International
Centre on Environmental Monitoring Research Foundation (CIMA).
996 V. Pazzi et al.
Dow
nloa
ded
by [
Uni
vers
ita D
egli
Stud
i di F
iren
ze]
at 0
3:56
02
Aug
ust 2
017
Gallipoli MR, Mucciarelli M, Castro RR, Monachesi G, Contri P. 2004. Structure, soil-struc-
ture response and effects of damage based on observations of horizontal-to-vertical
spectral ratios of microtremors. Soil Dyn Earthq Eng. 24:487�495.
Grazhdani S, Shumka S. 2007. An approach to mapping soil erosion by water with application
to Albania. Desalination. 213:263�272.
Higgitt DL, Warburton J. 1999. Applications of differential GPS in upland fluvial geomor-
phology. Geomorphology. 29:121�134.
Hinkel J. 2011. Indicators of vulnerability and adaptive capacity: towards a clarification of the
science�policy interface. Glob Environ Change. 21:198�208.
Hodgkinson PE, Stewart M. 1991. Coping with catastrophe. A handbook of disaster manage-
ment. London: Taylor & Francis/Routledge.
Ionescu C, Klein RJT, Hinkel J, Kumar KSK, Klein R. 2009. Towards a formal framework of
vulnerability to climate change. Environ Model Assess. 14:1�16.
Kinzel PJ. 2008. In-river channel topographic surveys collected prior to and following elevated
flows in the central Platte River, Nebraska, spring 2008. Data Series 380. Reston (VA):
U.S. Geological Survey.
Lachet C, Hatzfeld D, Bard PY, Theodulidis N, Papaioannou C, Savvaidis A. 1996. Site effect
and microzonation in the city of Thessaloniki (Greece). Comparison of different
approaches. Bull Seismol Soc Am. 86:1692�1703.
Leica. 2002. GPS system 500: GPS equipment user manual, version 4.0. Heerbrugg (CH):
Leica Geosystems.
Lekkas EL. 2000. Natural and technological catastrophes. Athens (GR): Access PrePress.
Mastin MC, Fossness RL. 2008. Bathymetry and near-river topography of the Naches and
Yakima rivers at Union Gap and Selah Gap, Yakima Country, Washington, August
2008. Data Series 475. Reston (VA): U.S. Department of the Interior and U.S. Geolog-
ical Survey.
McCall GJH. 1992. Natural and man-made hazards: their increasing importance in the end-
20th century world. In: McCall GJH, Laming DJC, Scott SC, editors. Geohazards �natural and man-made. London: Chapman & Hall; p. 1�4.
Morelli S, Segoni S, Manzo G, Ermini L, Catani F. 2012. Urban planning, flood risk and pub-
lic policy: the case of the Arno River, Firenze, Italy. Appl Geogr. 34:205�218.
Mucciarelli M, Contri P, Monachesi G, Calvano G, Gallipoli MR. 2001. An empirical method
to assess the seismic vulnerability of existing buildings using the HVSR technique.
Pure Appl Geophys. 158:2635�2647.
Muco B, Georgi Alexiev G, Aliaj S, Elezi Z, Grecu B, Mandrescu N, Milutinovic Z, Radulian
M, Ranguelov B, Shkupi D. 2012. Geohazards assessment and mapping of some Bal-
kan countries. Nat Hazards. 64:943�981.
Nakamura Y. 1989. A method for dynamic characteristics estimations of subsurface using
microtremors on the ground surface. Quarterly Report of Railway Technical Research
Institute (RTRI). Vol. 30. Tokyo; p. 25�33.
Nolan SP, Toal D. 2008. A low directivity ultrasonic sensor for collision avoidance and station
keeping on inspection-class AUVs. IMarEST J Mar Eng Technol. 7:1�11.
Pano N, Avdyli B. 1984. [Hydrology of Albania, a monograph]. Tirana: Academy of Science,
Institute of Hydrometeorology; p. 94�146. Albanian.
Pano N, Avdyli B. 2009. A method to estimate Buna River discharge, Albania. Paper pre-
sented at: Hydrology Days 2009. Fort Collins (CO).
Paul BK. 2011. Hazards/disasters: special topics. In: Paul BK, editor. Environmental hazards
and disasters: contexts, perspectives and management. Chichester: Wiley; p. 269�306.
Peyret F, Betaille D, Hintzy G. 2000. High-precision application of GPS in the field of real-
time equipment positioning. Automat Constr. 9:299�314.
Pojani E, Tola M. 2010. The effect of climate change on the water sector with a case study of
Albania: an economic perspective. Paper presented at: 2nd BALWOIS Conference;
Ohrid, MAC.
Remote Sensing Letters 997
Dow
nloa
ded
by [
Uni
vers
ita D
egli
Stud
i di F
iren
ze]
at 0
3:56
02
Aug
ust 2
017

Qiriazi P, Sala S. 2000. Environmental problems of Albania. In: Buchroithner MF, editor.
Remote sensing for environmental data in Albania: a strategy for integrated manage-
ment. NATO Science Series 72. Amsterdam: Springer; p. 13�30
Rizos C. 2002. Making sense of the GPS techniques. In: Bossler J, Jenson J, McMaster R,
Rizos C, editors. Manual of geospatial science and technology. London: Taylor &
Francis; p. 146�161.
Rizos C. 2008. Multi-constellation GNSS/RNSS from the perspective of high accuracy users in
Australia. J Spat Sci. 53:29�63.
Scheidegger AE. 1994. Hazards: singularities in geomorphic systems. Geomorphology.
10:19�25.
Schmidt SM, Bernoulli D, F€ugenschuh B, Matenco L, Schefer S, Schuster R, Tischler M,
Ustaszewski K. 2008. The Alpine-Carpathian-Dinaridic orogenic system: correlation
and evolution of tectonic units. Swiss J Geosci. 101:139�183.
SESAME. 2004. Guidelines for the implementation of the H/V spectral ratio technique on
ambient vibrations. Measurements, processing and interpretation. SESAME Euro-
pean research project, WP12 � Deliverable D23.12, European Commission �Research General Directorate, Project No. EVG1-CT-2000-00026 SESAME.
Stewart JP, Fenves GL. 1998. System identification for evaluating soil-structure interaction
effects in buildings from strong motion recordings. Earthq Eng Struct D. 27:869�885.
Stratob€erdha P, Xhelepi S, Abazi E, Zaimi K. 2008. Hydrologic regime and inundation floods
in the Lezha catchment. Paper presented at: 3rd BALWOIS Conference; Ohrid, MAC.
Surace L. 1993. Il progetto igm95. [The igm95 project]. Bull Geod Sci Aff. 52:219�230. Italian.
Tate E, Maidment D. 1999. Flooding mapping using HEC-RAS and ArcView Gis. CRWR
Online report 99-1.
Tetra Tech. 2009. Lower Puyallup River flood protection investigation, without-project analy-
sis. Seattle (WA). Available from: http://www.co.pierce.wa.us/pc/services/home/envi
ron/water/cip/pretf.htm
Thywissen K. 2006. Components of risk: a comparative glossary. Bonn: United Nations Uni-
versity Institute for Environment and Human Security (UNU-EHS).
Tobin GA, Montz BE. 2004. Natural hazards and technology: vulnerability, risk and commu-
nity response in hazardous environments. In: Brunn SD, Cutter SL, Harrington JW,
editors. Technoearth: geography and technology. Dordrecht: Kluwer Academic Pub-
lishers; p. 547�570.
United Nations Development Programme. 2003. Disaster risk assessment in Albania: execu-
tive summary report. Tirana: UNDP.
United Nations International Strategy for Disaster Reduction. 2009. UNISDR terminology
on disaster risk reduction. Geneva, Switzerland. Available from: http://www.unisdr.
org/files/7817_UNISDRTerminologyEnglish.pdf
[UNISDR] United Nations International Strategy for Disaster Reduction. 2010. One million
safe schools and hospitals assessment and mitigation planning for risk reduction guide.
UNISDR Regional Office for Asia and Pacific. Available from: http://www.unisdr-
apps.net/confluence/download/attachments/4554883/1MSSH_GuideNotes_Assess-
Mit-Planning 070110.pdf
Varnes DJ. 1984. Landslide hazard zonation: a review of principles and practice. Paris:
UNESCO Press.
VV.AA. 2011. Integrated project RIVA � sub project RIVA: environmental requalification of
the basin of Skadar (Albania). Phase 2 � cognitive analysis. FPA Balkans � Line 2.3
environment and sustainable development.
World Bank. 2003. Water resources management in South Eastern Europe. Vol. II � country
water notes and water fact sheets. Washington (DC): World Bank.
Zacaj M, Muceku Y, Kiri E, Dushi E, Dogjani S, Kovaci V. 2010. Kartografimi gjeologjik-
ambjental per planifikimin e territorit. Rast studimi: comuna Dajc Bregu i Bunes,
Shkoder. [Geologic-environmental mapping for territory planning. Case study:
998 V. Pazzi et al.
Dow
nloa
ded
by [
Uni
vers
ita D
egli
Stud
i di F
iren
ze]
at 0
3:56
02
Aug
ust 2
017

municipality of Dajc upon Buna, Shkoder]. Tirana: Polytechnic University of Tirana,
Geosciences Institute. Albanian.
Zulherman MS, Yaakup A, Wongso J. 2006. GIS base modeling of the flood impacts on the
urban development. Paper presented at: International Conference on Construction
Industry 2006: Toward Innovative Approach in Construction and Property Develop-
ment; Kuala Lumpur, Malaysia.
Remote Sensing Letters 999
Dow
nloa
ded
by [
Uni
vers
ita D
egli
Stud
i di F
iren
ze]
at 0
3:56
02
Aug
ust 2
017


