Embed Size (px)
Citation preview

This article was originally published in a journal published byElsevier, and the attached copy is provided by Elsevier for the
author’s benefit and for the benefit of the author’s institution, fornon-commercial research and educational use including without
limitation use in instruction at your institution, sending it to specificcolleagues that you know, and providing a copy to your institution’s
administrator.
All other uses, reproduction and distribution, including withoutlimitation commercial reprints, selling or licensing copies or access,
or posting on open internet sites, your personal or institution’swebsite or repository, are prohibited. For exceptions, permission
may be sought for such use through Elsevier’s permissions site at:
http://www.elsevier.com/locate/permissionusematerial

Autho
r's
pers
onal
co
py
Precambrian Research 150 (2006) 95–121
Tectono-thermal evolution of the Maud Belt: New SHRIMPU–Pb zircon data from Gjelsvikfjella, Dronning
Maud Land, East Antarctica
A. Bisnath a, H.E. Frimmel a,∗,1, R.A. Armstrong b, W.S. Board a
a Department of Geological Sciences, University of Cape Town, Rondebosch 7701, South Africab The Australian National University, Canberra, ACT 0200, Australia
Received 27 April 2004; received in revised form 21 June 2006; accepted 26 June 2006
Abstract
The Maud Belt in Dronning Maud Land (western East Antarctic Craton) preserves a high-grade polyphase tectono-thermalhistory with two orogenic episodes of Mesoproterozoic (1.2–1.0 Ga) and Neoproterozoic (0.6–0.5 Ga) age. New SHRIMP U–Pbzircon data from southern Gjelsvikfjella in the northeastern part of the belt make it possible to differentiate between a series ofmagmatic and metamorphic events. The oldest event recorded is the formation of an extensive 1140–1130 Ma volcanic arc. Thiswas followed by 1104 ± 8 Ma granitoids that might represent, together with so far undated mafic dykes, part of a decompressionmelting-related bimodal suite that reflects the sub-continental Umkondo igneous event. The first high-grade metamorphism isconstrained at 1070 Ma. The metamorphic age data are similar to those obtained from other parts of the Maud Belt, but also fromthe Namaqua-Natal Belt in South Africa, but the preceding arc formation was diachronous in the two belts. This indicates that thetwo belts did not form a continuous volcanic arc unit as suggested in previous models, but became connected only at the end of theMesoproterozoic.
Intense reworking during the Neoproterozoic, probably as a result of continent–continent collision between components ofGondwana, is indicated by ductile refliation, further high-grade metamorphic recrystallisation and metamorphic zircon overgrowthsat approximately 530 Ma. This was followed by late- to post-tectonic magmatism, reflected by 500 Ma granite bodies and 490 Maaplite dykes as well as a 480 Ma gabbro body.© 2006 Elsevier B.V. All rights reserved.
Keywords: Zircon geochronology; Gjelsvikfjella; Maud Belt; East Antarctica; Gondwana
1. Introduction
Dronning Maud Land in East Antarctica records use-ful information for the understanding of both the amal-
∗ Corresponding author. Tel.: +49 931 888 5420;fax: +49 931 888 4620.
E-mail address: [email protected](H.E. Frimmel).
1 Present address: Institute of Mineralogy, University of Wurzburg,Am Hubland, D-97074 Wurzburg, Germany.
gamation and fragmentation of supercontinents, oncetowards the end of the Mesoproterozoic at ca. 1.2–1.0 Ga(equivalent to the ‘Grenvillian’ of North America) andagain towards the late Neoproterozoic to Early Cambrianat ca. 0.6–0.5 Ga (the ‘Pan-African’ of Africa). The tec-tonic framework of East Antarctica is dominated by theEast Antarctic Craton (Tingey, 1991; Krynauw, 1996),fragments of Archaean continental crust (e.g. the Grune-hogna Craton) surrounded by younger orogenic belts,such as the Maud Belt (Fig. 1). Rocks of the Maud Beltare exposed, from southwest to northeast, in the Heime-
0301-9268/$ – see front matter © 2006 Elsevier B.V. All rights reserved.doi:10.1016/j.precamres.2006.06.009

Autho
r's
pers
onal
co
py
96 A. Bisnath et al. / Precambrian Research 150 (2006) 95–121
Fig. 1. Map showing correlations between Africa and East Antarctica within a Gondwana framework (after Reeves and de Wit, 2000; Frimmel,2004). Abbreviations are: Heimefrontfjella (HF), Kirwanveggen (KV), H.U.Sverdrupfjella (SF), Gjelsvikfjella (GF), Muhlig-Hofmannfjella (MH),Central Dronning Maud Land (CDML), Lutzow-Holm Bay (LHB), Shackleton Range (SR) and Grunehogna Craton (GC).
frontfjella, the Kirwanveggen, the H.U. Sverdrupfjella,the Gjelsvikfjella and western Muhlig-Hofmannfjella(Fig. 1). The belt is dominated by Mesoproterozoicsupracrustal and intrusive rocks that were subsequentlyintruded by Neoproterozoic and Early Palaeozoic gran-itoids and mafic rocks (Arndt et al., 1991; Moyes andGroenewald, 1996; Jackson, 1999; Jacobs et al., 1999;Paulsson and Austrheim, 2003). In late Precambrianpalaeogeographic reconstructions the Maud Belt is typi-cally placed as part of the Kalahari Craton (e.g. Hoffman,
1991; Dalziel, 1997), which amalgamated with EastAntarctica during the assembly of Gondwana at ca.500 Ma (e.g. Meert, 2003; Collins and Pisarevsky, 2005).
The penetrative foliation in the Maud Belt has beensuggested to be Mesoproterozoic in age (Groenewald etal., 1995; Grantham et al., 1995; Jackson, 1999) imply-ing that the Maud Belt is a continuous tectonic belt notonly from southwestern to central Dronning Maud Landbut also beyond East Antarctica, linking up with theNamaqua-Natal Belt in South Africa. A growing num-

Autho
r's
pers
onal
co
py
A. Bisnath et al. / Precambrian Research 150 (2006) 95–121 97
ber of geochronological data, however, point to majorstructural reworking of that Mesoproterozoic crust dur-ing Pan-African orogeny. A strong Pan-African thermaloverprint and melt generation has been documented forcentral Dronning Maud Land, at 9◦ to 11◦ E and 72◦ to71◦40′ (Jacobs et al., 1998), where a Pan-African age hasbeen suggested for pervasive east–west trending struc-tures (Jacobs et al., 2003a,b,d).
Further southwest in the Kirwanveggen area, theage of the regional pervasive, northeast-trending fab-ric is equivocal, because of possible co-linearity of thelate Mesoproterozoic and late Neoproterozoic/Cambrianstructures (Jackson, 1999). Recent U–Pb SHRIMP dataon monazite inclusions in fabric-forming minerals froman intervening area in the H.U. Sverdrupfjella (Boardet al., 2005) indicate a Pan-African age for a dominanttop-to-northwest shear fabric there. These data challengethe existing geodynamic models that explain the MaudBelt as an essentially Mesoproterozoic tectonic belt thatexperienced only thermal overprinting during the Pan-African orogeny.
Gjelsvikfjella is situated in the western portion of cen-tral Dronning Maud Land (Fig. 1), at 2◦ to 5◦35′E and71◦46′ to 72◦15′S, and lies east of the Jutulstraumen-Pencksøkket glacier. There the dominant northeasterlystructural trend that defines the Maud Belt in westernDronning Maud Land changes to an easterly trend thatmarks central Dronning Maud Land. Thus, the outcropsof the Gjelsvikfjella provide the linkage between twoextreme domains of the Maud Belt that followed differ-ent tectono-thermal evolutionary paths. Yet, so far littledata has been available for this crucial sector of the MaudBelt.
The aim of this study is, therefore, to fill this gap inour understanding of the Maud Belt by providing newprecise geochronological data on a variety of rock typesthat have been mapped in the area. It complements adetailed study of the metamorphic history (Bisnath andFrimmel, 2005) and of the geochemistry of various gen-erations of (meta-) igneous rocks (Grosch et al., 2004).Some of the principal questions addressed in this studyare the extent to which the Gjelsvikfjella rocks are aproduct of regional rejuvenation of a Mesoproterozoiccrust, or whether they result from Pan-African accre-tion of post-Mesoproterozoic age crust as documentedfor the Shackleton Range (e.g. Talarico et al., 1999) onthe opposite, south-western extension of the Maud Belt(Tessensohn et al., 1999; Bauer et al., 2003a).
Fieldwork was conducted in Gjelsvikfjella in orderto establish the deformation history, relative timing ofevents and to identify important time markers. To resolvethe complex tectono-thermal history of the area, new
SHRIMP U–Pb single zircon data were acquired. Thesenew data from Gjelsvikfjella permit an improvementin the geodynamic model for the Maud Belt and thusin palaeogeographic reconstructions prior to the finalassembly of Gondwana.
2. Regional geology of the Maud Belt
The Maud Belt consists of Mesoproterozoic to EarlyCambrian polyphase deformed upper amphibolite- togranulite-facies metamorphic supracrustal rocks and avariety of pre-, syn- and post-tectonic intrusions. Thebelt is separated by large glaciers from the GrunehognaCraton to the northwest, which consists of Archaeangranite that is overlain by the Mesoproterozoic volcano-sedimentary Ritscherflya Supergroup (Wolmarans andKent, 1982; Moyes et al., 1995). The oldest rocksrecognised throughout the entire belt, from Heimefront-fjella to central Dronning Maud Land, are metavolcanicorthogneisses that yielded U–Pb zircon ages of between1160 and 1140 Ma (Arndt et al., 1991; Harris et al.,1995; Jacobs et al., 1998; Paulsson and Austrheim, 2003;Board et al., 2005). The oldest intrusive rocks (meta-tonalitic gneisses) in the Maud Belt preserve similarages of between 1140 and 1130 Ma (Jacobs et al., 1998;Jackson, 1999; Paulsson and Austrheim, 2003; Board etal., 2005). The overall calc-alkaline signature of theserocks is consistent with the interpretation of them form-ing part of a larger Mesoproterozoic volcanic arc system(Groenewald et al., 1995; Jacobs et al., 1998; Bauer et al.,2003b), with elevated Nd model ages pointing to deriva-tion from an old, heterogeneous, sublithospheric mantle(Grosch and Bisnath, unpublished data).
Megacrystic orthogneisses occur throughout theMaud Belt. Examples are the so-called Fugitive, Isin-gen and Sveabreen megacrystic orthogneisses of H.U.Sverdrupfjella (Groenewald et al., 1995), and megacrys-tic orthogneiss bodies of the Kirwanveggen (Granthamet al., 1995; Harris, 1999). Locally, the alkali feldsparmegacrysts display resorption rims suggesting that theyare older than the matrix (Frimmel, 2004). This is sup-ported by two distinct SHRIMP U–Pb zircon ages of1127 ± 12 and 1061 ± 14 Ma obtained on megacrysticorthogneiss from northern Kirwanveggen, which havebeen interpreted as the age of crystallization and meta-morphic matrix recrystallization, respectively (Harris etal., 1995).
SHRIMP U–Pb zircon ages of between 1080 and1030 Ma that are interpreted to record high-grade meta-morphism have been reported from throughout the MaudBelt. These ages were obtained from metamorphic zir-con overgrowths in the Heimefrontfjella (Arndt et al.,

Autho
r's
pers
onal
co
py
98 A. Bisnath et al. / Precambrian Research 150 (2006) 95–121
Table 1Previous data on the tectono-thermal evolution of H.U. Sverdrupfjella and Kirwanveggen
1991; Jacobs et al., 2003a), Kirwanveggan (Harris et al.,1995; Jackson, 1999), H.U. Sverdrupfjella (Board et al.,2005) and in central Dronning Maud Land (Jacobs et al.,1998).
Grantham et al. (1995) provided a structural summaryfor the rocks in the H.U. Sverdrupfjella and Kirwanveg-gen (Fig. 1) and suggested that groups of kinematicallyequivalent structures are present in both areas. They pro-posed three deformation episodes (D1–D3; Table 1), withlate Mesoproterozoic isoclinal folding and penetrativefabric development (D1) followed by regional warp-ing (D2) associated with the intrusion of post-tectonic(relative to D1) dykes and plutons (Brattskarvet Suite).Finally, brittle fractures and normal faults (D3) havebeen related to the break-up of Gondwana at approxi-mately 170 Ma. Grantham et al. (1995) suggested thatthe main penetrative structures are Mesoproterozoic inage and that colinear reworking occurred during theNeoproterozoic in the central Kirwanveggen area only.
However, Board et al. (2005) documented similar pene-trative fabrics for the southern H.U. Sverdrupfjella to bePan-African in age.
Post-tectonic intrusions of mafic compositionhave been reported from Gjelsvikfjella (Ohta andTørudbakken, 1985) and from central Dronning MaudLand (Jacobs et al., 2003c). The youngest post-tectonicintrusions include the Brattskarvet Suite dated at 489 ±10 Ma (Jackson, unpublished data) in the H.U. Sver-drupfjella area, a syenite body dated at 501 ± 10 Ma(Paulsson and Austrheim, 2003) in the Gjelsvikfjellaarea and aplite dykes at ca. 480–490 Ma that occurthroughout the Maud Belt (Harris et al., 1995; Paulssonand Austrheim, 2003; Jacobs et al., 2003b; Board et al.,2005).
The best record of the metamorphic history of thebelt comes, so far, from the H.U. Sverdrupfjella, wherethree metamorphic episodes (M1–M3) have been distin-guished. Rare remnants of an early pre-tectonic mafic

Autho
r's
pers
onal
co
py
A. Bisnath et al. / Precambrian Research 150 (2006) 95–121 99
granulite-facies assemblage containing orthopyroxene(M1) are believed to correspond to the older metamor-phic zircon overgrowths, dated at between 1080 and1030 Ma. P–T conditions of 8 to 10 kbar and 850 ◦C havebeen estimated for this stage (Groenewald and Hunter,1991). A second metamorphic stage (M2) involved thedecompression from eclogite-facies conditions (M2a) toconditions transitional between amphibolite and gran-ulite facies (P = 5–8 kbar; T = 600 − 790 ◦C; M2b; Boardet al., 2005). Subsequent growth of biotite laths that haveidentical chemical composition to syn-D2 biotite lathshave been ascribed to K-metasomatism (M2c) that out-lasted the main pulse of deformation and was causedby widespread late- to post-orogenic felsic magmatism(Board et al., 2005). Finally, a regional retrogressivemetamorphic event (M3) is evident from chlorite rimson biotite and the formation of epidote. This is ascribedto the break-up of Gondwana and will not be furtherconsidered here.
3. Geology of Gjelsvikfjella
The rocks of the Gjelsvikfjella area comprise polyde-formed, upper amphibolite-facies gneisses derived froma supracrustal sequence that was intruded by variousplutonic and hypabyssal melts. These rocks have beenmigmatised to various degrees with the main pulse ofmigmatisation being syn-tectonic (relative to D2), withanatexis outlasting D2.
Five mappable units have been recognised in theGjelsvikfjella area (Fig. 2). The oldest unit observedis a metasupracrustal sequence (referred to here as theGneiss Complex). It is dominated by biotite–garnetgneiss that occurs as concordant layers alternating withfelsic and mafic gneisses of variable composition. Thebiotite–garnet gneiss contains sillimanite in places withgarnet porphyroblasts and syn-kinematic biotite defin-ing S2. Two varieties of pre-tectonic mafic bodies arepresent in the Gjelsvikfjella area. The first variety occursas mafic lenses and boudins of metabasalt and metagab-bro composed of hornblende and plagioclase occurring atdifferent tectonostratigraphic levels in the Gneiss Com-plex.
The mafic bodies are variably foliated with locallyunfoliated garnet amphibolite cores of larger boudins.These cores are in most cases completely surroundedby hornblende and plagioclase. The garnet amphibolitecores consist of garnet, hornblende (mostly as pseu-domorphs after clinopyroxene), plagioclase and biotitewith minor amounts of quartz, ilmenite, rutile and titan-ite. The second type is garnet-free amphibolite, whichmost likely represents re-equilibrated garnet amphibo-
lite rather than mafic rocks of different composition. Thegarnet-free amphibolite bodies consist of hornblende,plagioclase and biotite with minor amounts of ilmenite,rutile and titanite. Biotite is typically post-tectonic andoccurs as randomly orientated laths.
No evidence of a basement to the above supracrustalsequence has been discovered so far. The oldest plu-tonic rocks are variably migmatised medium- to coarse-grained granitic and tonalitic augen gneisses, collec-tively mapped as Migmatite Gneiss. The leucosomedomains therein are strongly deformed and thus contrastwith the youngest intrusions, which are post-tectonic fel-sic and mafic dykes (Fig. 3E) and stocks.
The Gjelsvikfjella area is distinguished from west-ern Dronning Maud Land by the abundance of post-tectonic mafic dykes (Fig. 3A). These dykes experi-enced lower amphibolite- to greenschist-facies meta-morphism, are medium- to coarse-grained, melanocratic,hornblende–biotite rocks with no preferred orientationof the constituent minerals. In the northern sector ofthe study occurs a meta-gabbro body (Stabben gabbro;Fig. 2). This metagabbro is made up of green hornblende,altered brown augite, brown biotite and plagioclase(andesine-oligoclase). A second, light brown biotite gen-eration is also present that overgrew the brown biotite. Acoarse-grained variety of the Stabben metagabbro con-tains a greater percentage of clinopyroxene and olivine.Accessory phases present are apatite, titanite and zir-con. Preliminary geochemical analyses indicate that thepost-tectonic mafic dykes and the Stabben meta-gabbrohave similar major and trace element distribution pat-terns and also similar isotopic characteristics, suggestingthat both types of intrusions were derived from similarmantle sources and may be temporally linked. A coarse-grained undeformed post-tectonic syenite body nearbyhas been dated at 501 ± 10 Ma (Paulsson and Austrheim,2003). This syenite is bound to the north by the Stabbenmetagabbro and to the south by metasupracrustal rocksof the Gneiss Complex (Figs. 2 and 3B).
Primary structures in the rocks of Gjelsvikfjella havebeen largely obliterated during metamorphism and mag-matism. Five deformation events (D1–D5) are recognisedin the rocks. Relict structures of the first foliation arepreserved in mafic boudins, and rootless isoclinal foldsare interpreted to represent F2 folds. Earlier F1 foldsare difficult to identify, because these folds have beenre-orientated by type-3 fold interference patterns (afterRamsay, 1967) during D2, implying that there was a con-tinual coaxial refolding of earlier D1 structures. TheseF2 folds have been rotated so that the fold axes nowplunge parallel to sub-parallel to the dip direction of theregional pervasive foliation (S2), i.e. they have a reclined

Autho
r's
pers
onal
co
py
100 A. Bisnath et al. / Precambrian Research 150 (2006) 95–121
Fig. 2. Geological map of Gjelsvikfjella area modified after Ohta (1999), also shown are sample localities and equal-area stereographic projectionsof L2 lineations and poles to S2 foliation.
attitude (Fig. 3C). The dominant S2 fabric is parallel tolithological contacts (Fig. 3C and E) and is defined bycompositional banding on a centimetre- to metre-scale.The third fabric (S3) is an axial planar fabric (Fig. 3D),which is preserved as leucosome domains that parallelthe F3 fold axial planes. A fourth deformation event (D4)is evident as broad open folds or regional scale warping.The youngest deformation (D5) caused vertical to sub-vertical fractures that are parallel to post-tectonic doleriteintrusions related to Gondwana break-up (Grantham etal., 1995).
4. Samples and methods
Using standard separation techniques (Wilfley table,magnetic separation, heavy liquids and hand picking),zircon grains were separated from seven samples fromthe Gjelsvikfjella area (Fig. 2). Prior to analysis, pho-tomicrographs and cathodoluminesence (CL) images ofsectioned zircon grains were taken in order to charac-terise the zircon populations, fracture patterns and meta-morphic overgrowths. Ion microprobe analyses of zirconpopulations were carried out using SHRIMP RG at the

Autho
r's
pers
onal
co
py
A. Bisnath et al. / Precambrian Research 150 (2006) 95–121 101
Fig. 3. (A) Post-tectonic dykes that are discordant to the regional foliation; (B) Intrusive relationships (— intrusive contacts) around Stabben;(C) Rootless isoclinal folds showing an early deformation event; (D) Jutulhogget migmatitic gneiss containing leucosomes that are parallel to theaxial plane of F3 folds and sample locality ABA/81; (E) Post-tectonic aplite dykes and locality for sample ABA/32; and (F) Migmatitic gneiss atJutulhogget also showing post-tectonic dyke relationships and sample locality ABA/81.
Research School of Earth Sciences, Australian NationalUniversity, Canberra. SHRIMP analytical methods fol-low those given by Williams (1998) and referencestherein. U/Pb rations have been calibrated relative to1099 Ma Duluth Gabbro reference zircon (see Paces andMiller, 1993) and the data were reduced using the SQUIDExcel Macro of Ludwig (2000). For zircon older than800 Ma common Pb has been corrected using the mea-sured 204Pb/206Pb ratios, for zircon younger than 800 Macommon Pb was corrected using measured 207Pb/206Pband 238U/206Pb ratios, following Tera and Wasserburg(1972), as described in detail by Compston et al. (1992).Uncertainties in the measured ratios are given at onesigma level and the weighted mean age uncertainties at
95% confidence level (plots and calculation using ISO-PLOT/EX; Ludwig, 1999).
The isotopic data were supplemented by analysesof rare earth element (REE) concentrations on selectedzircon grains (Appendix A), using laser ablation induc-tively coupled mass spectrometry (ICPMS) techniquesat the Department of Geological Sciences, Universityof Cape Town. A Perkin Elmer Elan 6000 instrument,coupled to a Cetac LSX-200 laser ablation modulewith a 266nm frequency-quadrupled Nd-YAG laser wasemployed. The NIST 610 and 612 glass standards wereused for zircon analyses. Lower detection limits are typ-ically below 20 ppb for the REE, typical precision andaccuracy range between 1 to 10 relative percent.

Autho
r's
pers
onal
co
py
102 A. Bisnath et al. / Precambrian Research 150 (2006) 95–121
5. Results
5.1. Migmatite Gneiss
Sample ABA/81, a strongly deformed, biotite-richgneiss was collected from Jutulhogget (72◦01′S; 2◦50′E;Figs. 2 and 3F). This fine- to medium-grained rockconsists of quartz (20 vol.%), plagioclase (25 vol.%),K-feldspar (30 vol.%), biotite (10–15 vol.%) and greenhornblende (5–10 vol.%), with trace amounts of zircon,rutile and opaques. Biotite defines the foliation (S2) andis folded into tight to open folds with the fold axialtraces defining a crenulation cleavage (S3) (Fig. 3D).Simultaneously with the S3 development partial melt-ing occurred as indicated by the presence of leucosomedomains that are parallel to the fold axial traces of thecrenulations (Fig. 3D). Sample WBJS3 was collectedfrom a syn-S3 leucosome domain that contains poikilitichornblende, up to 2 cm in length, within these leucosomedomains.
The zircon grains in these two samples are colourless,subhedral to anhedral and 50–300 �m in size. Most ofthe grains are dipyramidal prismatic, with the {1 0 0} and{1 0 1} crystallographic forms dominating, whereas the{2 1 1} pyramidal form is weakly developed. The grainsdisplay variable degrees of rounding with some beingovoid in shape. Cathodoluminescence images (Fig. 5A)show that the zircon cores are characterised by oscil-latory zoning (interpreted as magmatic compositionalzoning), which is rimmed by three different types ofovergrowths. The first overgrowth generation truncatesthe compositional zonation of the core and displays onlyweak CL. The second phase of overgrowth is charac-terised by bright CL, and truncates the first. This brightrim is, in turn, rimmed by an overgrowth that has aweaker CL. The latter appears to have grown parallelto the brightly cathodoluminescent zircon overgrowthimplying that the two types of zircon overgrowths mightbe related to the same event.
Eleven analyses were made of zircon cores from sam-ple ABA/81, and these combined yield an upper interceptage of 1130 ± 19 Ma (Fig. 4A1; MSWD = 0.83; proba-bility of fit = 0.62). Two cores (spot 6.1 and 7.2) that aretexturally different from the other cores under CL gave206Pb/238U ages of 1207 ± 13 and 1204 ± 13 Ma (ABA81; Table 2 and Fig. 5A), respectively. Five analysesof magmatic zircon cores from sample WBJS3 gave an
indistinguishable 207Pb/206Pb age of 1133 ± 16 Ma andone core (spot analysis 53.1; Table 2) gave a 207Pb/206Pbage of 1206 ± 19 Ma (Fig. 4A2; MSWD = 0.54; proba-bility of fit = 0.71). The ca. 1130 Ma ages are interpretedto represent the crystallisation age of the magmatic pro-tolith, whereas the ca. 1200 Ma ages are interpreted torepresent inherited zircon cores.
Three analyses (spots 2.1, 3.2 and 13.1) on thefirst zircon overgrowth with the weak CL in sampleABA/81 (Fig. 4A1 and Table 2) yielded a weightedmean 207Pb/206Pb age of ca. 1070 Ma. The Th/U ratioof this overgrowth ranges from 0.04 to 0.34. In con-trast, spot analyses 7.1 (Fig. 5A), 9.1 and 16.1 (Table 2)gave a weighted mean 207Pb/206Pb age of ca. 530 Mafor the strongly luminescent (i.e. second generation)rims analysed. Rim analyses for sample WSBJ3 on bothweakly (analysis 61.1; Table 2) and strongly (analysis16.2; Table 2) cathodoluminescent zircon overgrowths,i.e. overgrowth phases two and three, yielded indistin-guishable 206Pb/238U ages of 524 ± 8 and 528 ± 8 Maand are therefore considered to have formed during thesame event. The Th/U ratio of overgrowth phases twoand three is variable (0.01–0.86) and overlaps with that ofthe older overgrowth (Table 2). In samples ABA/81 andWBJS3 the older cores are characterised by U contentsranging from 100 to 1569 and 331 to 603 ppm, respec-tively, and Th/U ratios between 0.14 and 1.81 for sampleABA/81 and 0.14 and 0.69 for sample WBJS3. The Ucontent in the first overgrowth for sample ABA/81 is 572to 924 ppm with a Th/U ratio from 0.04 to 0.35. Rangesin the U contents for the second and third zircon over-growth stages in both samples are 272–1399 ppm for thehigh CL overgrowth and 362–3305 ppm for the weak CLovergrowth with both overgrowths having Th/U ratiosof less than 0.05. Such low Th/U ratios are typical ofmetamorphic zircon overgrowths (Williams, 1998). Nosystematic difference exists in the Th/U ratio betweenweakly and strongly cathodoluminescent domains.
Chondrite-normalised REE patterns were obtainedfor zircon grains from both samples ABA/81 and WBJS3by laser ablation ICPMS (Fig. 6A and B). Both the coreand rim (bright CL overgrowth) are enriched in heavyREE relative to light REE with positive Ce and negativeEu anomalies. The rims are less enriched in total REEthan the cores. The chemical and geochronological dataindicate different generations of zircon growth, whichis consistent with the textural observations described.
Fig. 4. U–Pb SHRIMP zircon analyses of samples: (A1 and 2) Migmatite Gneiss, Jutulhogget (ABA/81; WBJS3); (B) Augen Gneiss, von Essen-skarvet (ABA/10A); (C) Mylonitic augen gneiss von Essenskarvet (ABA/10B); (D) Grey Migmatite Gneiss, Terningskarvet (ABA/21); (E) BandedGneiss, Von Essenskarvet (ABA/32); (F) Stabben metagabbro (ABA/64); (G) Aplite dyke, Von Essenskarvet (ABA/69). A–E and G are Wetherillplots whereas F is a Tera Wasserburg plot.

Autho
r's
pers
onal
co
py
A. Bisnath et al. / Precambrian Research 150 (2006) 95–121 103

Autho
r's
pers
onal
co
py
104A
.Bisnath
etal./Precam
brianR
esearch150
(2006)95–121
Table 2SHRIMP U–Pb zircon data for samples ABA/81 and WBJS3
Grain spot ABA/81 U (ppm) Th (ppm) 232Th/238U 206Pb* (ppm) f 206% Radiogenenic ratios Ages (Ma) Disc (%)
207Pb*/206Pb* ±% 207Pb*/235U ±% 206Pb*/238U ±% 206Pb*/238U 207Pb*/206Pb
1.1c 571 396 0.72 98.10 0.03 0.08 0.57 2.17 1.50 0.20 1.30 1175 ±14 1165 ±11 −12.1r 750 95 0.13 118.00 0.03 0.08 0.56 1.92 1.40 0.18 1.30 1086 ±13 1090 ±11 02.2c 111 195 1.81 17.80 0.00 0.08 1.50 1.99 2.20 0.19 1.60 1100 ±16 1132 ±30 33.1c 100 100 1.04 15.50 0.00 0.08 1.50 1.93 2.30 0.18 1.80 1071 ±17 1128 ±31 53.2r 572 195 0.35 85.80 0.00 0.08 1.50 1.83 2.10 0.17 1.40 1038 ±13 1091 ±30 54.1c 701 569 0.84 118.00 0.15 0.08 0.64 2.11 1.30 01.20 1.20 1150 ±12 1151 ±13 05.1c 1579 211 0.14 263.00 0.08 0.08 0.37 2.07 1.20 0.19 1.10 1140 ±12 1133 ±7.3 −16.1c 493 279 0.58 87.20 0.02 0.08 0.83 2.25 1.40 0.21 1.20 1207 ±13 1182 ±16 −27.1r 855 10 0.01 64.00 0.00 0.06 0.76 0.70 1.70 0.09 1.50 539 ±7.6 538 ±17 07.2c 1072 1463 1.41 189.00 0.04 0.08 0.43 2.24 1.30 0.21 1.20 1204 ±13 1174 ±8.5 −38.1rc 165 70 0.44 23.90 0.07 0.07 1.10 1.73 1.70 0.17 1.40 1003 ±13 1059 ±22 59.1r 597 5 0.01 47.10 0.57 0.06 2.30 0.74 2.60 0.09 1.30 564 ±6.7 550 ±50 −2
10.1c 508 417 0.85 90.20 0.00 0.08 0.53 2.23 1.30 2.21 1.20 1211 ±13 1154 ±10 −511.1c 1569 212 0.14 267.00 0.01 0.08 0.45 2.11 1.40 0.20 1.30 1164 ±14 1129 ±9.0 −312.1rc 1805 330 0.19 184.00 0.25 0.07 0.51 1.20 1.20 0.12 1.10 722 ±7.8 1020 ±10 2913.1r 924 37 0.04 123.00 0.08 0.08 1.30 1.61 1.80 0.16 1.30 931 ±11 1075 ±26 1314.1c 1499 1057 0.73 252.00 0.31 0.08 0.64 2.10 1.40 0.20 1.20 1149 ±13 1147 ±13 015.1c 807 305 0.39 139.00 0.16 0.08 0.71 2.16 1.50 0.20 1.30 1173 ±14 1157 ±14 −116.1r 644 538 0.86 45.50 0.67 0.06 1.90 0.65 2.20 0.08 1.20 506 ±5.7 519 ±42 2
WBJS34.1r 272 8 0.03 21.00 0.72 0.0571 0.0013 0.664 0.020 0.0844 0.0015 522 ±9 496 ±51 −59.1r 537 20 0.04 39.00 0.13 0.0582 0.008 0.642 0.014 0.800 0.0013 496 ±8 539 ±29 8
16.1c 476 292 0.61 94.00 0.19 0.0766 0.0008 1.920 0.041 0.1819 0.0031 1077 ±17 1110 ±22 316.2r 1392 35 0.03 108.00 0.09 0.0579 0.0004 0.676 0.012 0.0847 0.0013 524 ±8 527 ±14 128.1rc 456 110 0.24 71.00 0.69 0.0763 0.0013 1.619 0.040 0.1538 0.0026 922 ±14 1104 ±34 1641.1r 1810 69 0.04 140.00 0.04 0.0578 0.0004 0.672 0.012 0.0844 0.0013 522 ±8 521 ±15 043.1c 548 367 0.67 115.00 0.32 0.0775 0.0008 2.018 0.040 0.1888 0.0031 1115 ±17 1134 ±19 243.2r 362 3 0.01 28.00 0.17 0.0567 0.0009 0.665 0.017 0.0850 0.0015 526 ±9 481 ±37 −953.1c 423 272 0.64 94.00 0.08 0.804 0.0008 2.244 0.045 0.2025 0.0033 1189 ±18 1206 ±19 153.2r 1516 50 0.03 117.00 0.07 0.0578 0.0003 0.670 0.011 0.0841 0.0013 520 ±8 521 ±12 056.1r 3303 153 0.05 266.00 0.32 0.0575 0.0002 0.694 0.011 0.0876 0.0013 541 ±8 510 ±9 −658.1c 331 143 0.43 65.00 0.19 0.0781 0.0006 2.018 0.040 0.1875 0.0032 1108 ±17 1149 ±16 458.2rc 746 106 0.14 117.00 0.11 0.0770 0.003296 1.714 0.038 0.1615 0.0032 965 ±18 1121 ±15 1459.1c 351 143 0.41 69.00 0.35 0.0774 0.11 2.003 0.045 0.1876 0.0032 1109 ±17 1132 ±26 261.1r 1526 80 0.05 120.00 0.04 0.0575 0.0010 0.676 0.012 0.0853 0.0013 528 ±8 510 ±14 −365.1c 603 416 0.69 125.00 0.08 0.0773 0.0006 1.989 0.037 0.1866 0.0030 1103 ±16 1130 ±15 265.2rc 399 103 0.26 240.0 0.22 0.0724 0.0007 1.359 0.027 0.1361 0.0022 823 ±12 997 ±20 17
Errors are 1-sigma; f 206% is the proportion of common 206Pb, Pb* is the radiogenic proportion. Error in standard calibration was 0.35% (not included in above errors but required when comparingdata from different mounts). (1) Common Pb corrected using measured 204Pb. For disc (%), 0% denotes a concordant analysis. c: core analysis; rc: mixed ages (rim + core); r: metamorphicovergrowth (rim analysis).

Autho
r's
pers
onal
co
py
A. Bisnath et al. / Precambrian Research 150 (2006) 95–121 105
Fig. 5. Cathodoluminescence images of zircon grains. (A) Migmatite Gneiss, Jutulhogget (ABA/81); (B and C) Grey Migmatite Gneiss, Tern-ingskarvet (ABA/21); (D) Banded Gneiss, Von Essenskarvet (ABA/32). Note: the ∼530 Ma age presented for sample ABA/81 is a 207Pb/206Pb andall other ages are 206Pb/238U; for sample ABA/21 all ages are 207Pb/206Pb ages and for sample ABA/32 the ∼530 Ma age presented is a 206Pb/238Uand all other ages are 207Pb/206Pb ages.
The lower Th/U ratios of the first overgrowth and thelower REE content of the second and third overgrowthsindicate that they crystallised during metamorphism(Williams and Claesson, 1987). Consequently, the ca.1070 and 530 Ma ages most likely represent two meta-morphic events.
5.2. Augen Gneiss, Von Essenskarvet
With the aim of determining the emplacement age ofthe original porphyritic granite and its subsequent meta-morphic history, sample ABA/10A was collected froma thick, massive, coarse-grained augen gneiss layer incentral Von Essenskarvet (72◦12′S; 2◦20′E; Fig. 2). Thesample consists of plagioclase, quartz and K-feldsparin approximately equal proportions. The feldspars aregenerally medium- to coarse-grained with megacrysticplagioclase ranging in size from 1 to 10 cm. Plagioclase(labradorite–bytownite) shows, in places, weak saussuri-tisation and also contains rounded blebs of quartz andelongated quartz inclusions displaying a myrmekitic tex-ture. Two generations of biotite are present. The first gen-eration defines the regional pervasive S2 fabric, whereas
the second shows no preferred orientation and cuts acrossS2. It is interpreted as post-kinematic and could berelated to K-metasomatism that accompanied the nearbypost-tectonic Stabben syenite intrusion. Minor amountsof green hornblende and garnet are present with acces-sory apatite, allanite, zircon and titanite.
Zircon grains in the rock are clear to yellowish-brown and are 20–250 �m in length. Subhedral, elon-gated grains that are dominated by the {1 0 0} prismaticand {1 0 1} pyramidal forms, are common and displayrounded terminations. Most zircon grains contain darkinclusions of less than 10 �m in diameter that were care-fully avoided during analysis. The zircon grains displaywell-developed oscillatory magmatic growth zonation inCL images with some grains showing strongly resorbedtextures. Cathodoluminescence imaging also revealed aweaker luminescent rim that truncates the zoned cores.These rims do not exceed 10 �m in width and are toosmall to be analysed.
A total of 16 zircon core analyses (Table 3) yielded acombined weighted mean 207Pb/206Pb age of 1124.4 ±11 Ma (MSWD = 0.44; probability of fit = 0.96; Fig. 4B).The five least discordant (<5% discordance) zircon

Autho
r's
pers
onal
co
py
106 A. Bisnath et al. / Precambrian Research 150 (2006) 95–121
Fig. 6. Chondrite-normalised REE patterns for the cores and rimsof selected zircon grains from the following samples: (A and B)Migmatite Gneiss, Jutulhogget (ABA/81 and WBJS3); (C) AugenGneiss, Von Essenskarvet (ABA/10A); (D) Mylonitic Augen Gneiss,Von Essenskarvet (ABA/10B). Normalisation values are from Sun andMcDonough (1989).
analyses gave an upper intercept age of 1128 ± 19 Maand a lower intercept 207Pb/206Pb age of 471 ± 95 Ma(Fig. 4B). The upper intercept age and the 207Pb/206Pbcore ages are within error and are interpreted to reflectthe crystallization age of the granite protolith, whereasthe lower intercept age of 471 ± 95 Ma is interpreted torepresent partial Pb loss during Pan-African overprint.Both cores and rims are enriched in heavy REE relativeto light REE with positive Ce and negative Eu anoma-lies (Fig. 6C). The rims are less enriched in total REEthan the cores. Thus, the chemical and geochronologicaldata indicate different stages of zircon growth, which isconsistent with the textural observations described.
5.3. Mylonitic Augen Gneiss, Von Essenskarvet
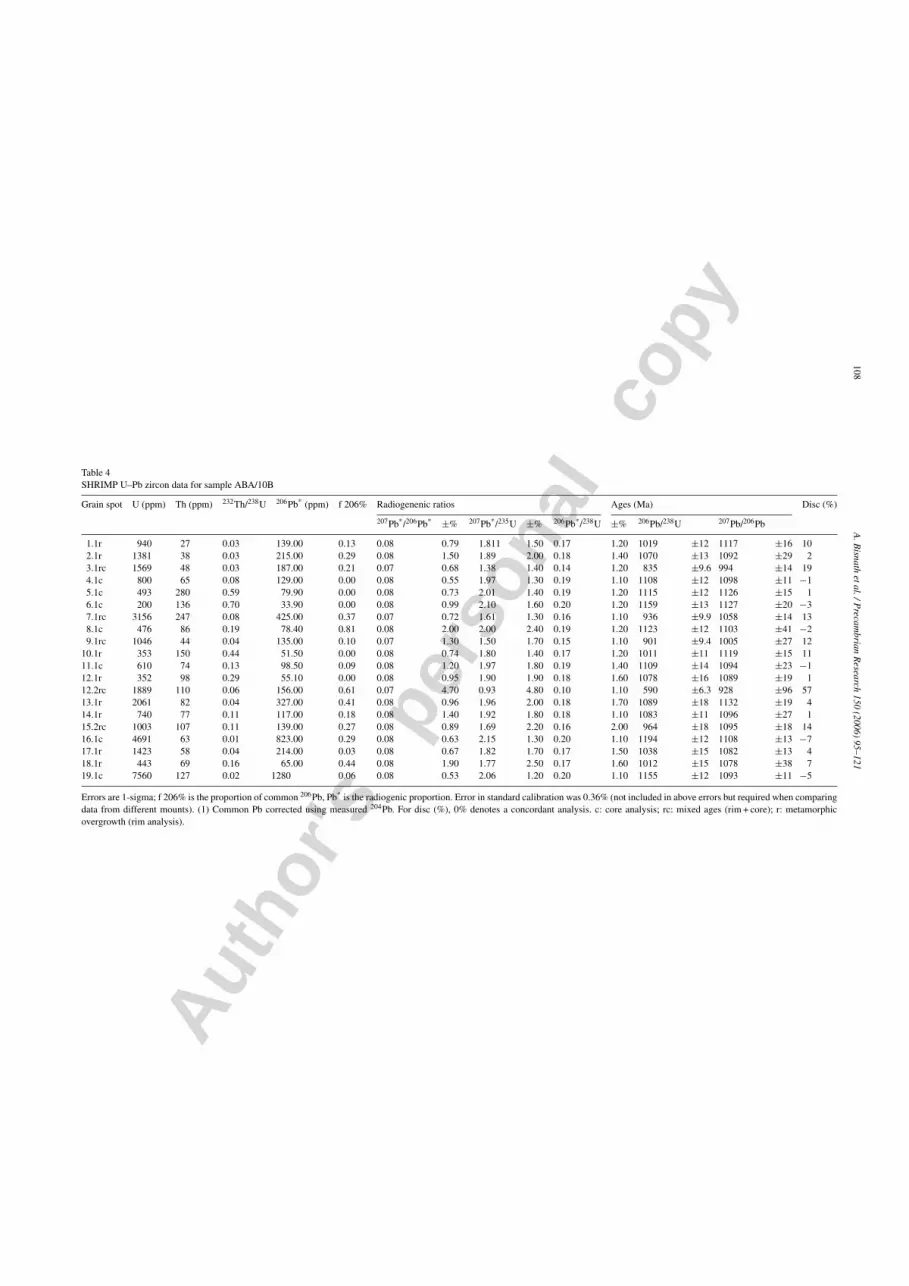
A mylonitic augen gneiss (sample (ABA/10B) fromwestern Von Essenskarvet (72◦13′S; 2◦13′E; Fig. 2)was selected in order to determine the emplacementage of the original porphyritic granite and its subse-quent metamorphic history. The chosen sample is wellfoliated and composed of quartz (30 vol.%), biotite(20 vol.%), microcline (30 vol.%) that displays transfor-mation lamellae (Shelley, 1983) with minor amounts ofplagioclase (10 vol.%), hornblende (10 vol.%), and traceamounts of apatite, zircon and garnet. The quartz grainsare typically stretched out into ribbon and eye shapes.Biotite defines the regional pervasive S2 fabric and par-allels the stretched quartz grains.
Zircon grains in this rock are clear to yellowish-brown and are 20–300 �m in length. They are subhe-dral, elongated grains dominated by the {1 0 0} prismaticand {1 0 1} pyramidal forms. Rounded terminations andmarginal resorption are common. Cathodoluminescenceimages of the zircon grains show oscillatory growthzonation that is interpreted as magmatic. Many grainshave a weakly luminescent rim that truncates the zonedcores. These rims are generally 10–15 �m in width andare too small to be analysed (Table 3).
A total of nine zircon core analyses yielded a com-bined weighted mean 207Pb/206Pb age of 1104 ± 8 Ma(MSWD = 0.94; probability of fit = 0.52; Fig. 4C). Thisage is interpreted as the crystallization age of the por-phyritic granite. A series of strongly discordant zir-con analyses point towards Pb-loss at approximately1070 Ma (Fig. 4C and Table 4), which is interpreted asresulting from a metamorphic overprint. Core analysesshow enrichment in heavy REE relative to light REEwith positive Ce and negative Eu anomalies (Fig. 6D).The REE pattern for this sample is similar to the zir-con core REE patterns produced for samples ABA/81,WBJS3 and ABA/10A. By analogy, sample ABA/10B is

Autho
r's
pers
onal
co
py
A.B
isnathetal./P
recambrian
Research
150(2006)
95–121107
Table 3SHRIMP U–Pb zircon data for sample ABA/10A
Grain spot U (ppm) Th (ppm) 232Th/238U 206Pb* (ppm) f 206% Radiogenenic ratios Ages (Ma) Disc (%)
207Pb*/206Pb* ±% 207Pb*/235U ±% 206Pb*/238U ±% 206Pb/238U 207Pb/206Pb
1.1rc 746 90 0.12 99.00 0.19 0.07 1.10 1.59 2.20 0.15 1.90 924 ±17 1061 ±22 131.2rc 352 230 0.67 50.0 1.06 0.08 2.50 1.72 2.90 0.16 1.50 976 ±13 1105 ±50 122.1c 646 55 0.09 106.0 0.03 0.08 2.10 2.09 4.70 0.19 4.20 1129 ±43 1174 ±41 42.2c 123 65 0.54 19.20 0.00 0.08 1.30 1.91 2.00 0.18 1.60 1076 ±16 1105 ±26 33.1c 683 54 0.08 107.0 0.00 0.08 0.87 1.94 1.60 0.18 1.30 1085 ±13 1120 ±17 33.2c 671 93 0.14 111.00 0.00 0.08 0.56 2.04 1.40 0.19 1.30 1131 ±14 1121 ±11 −14.1c 578 58 0.10 101.00 0.00 0.08 2.30 2.16 4.60 0.20 4.00 1198 ±44 1117 ±45 −74.2c 443 27 0.06 75.80 0.00 0.08 2.60 2.13 3.40 0.20 2.30 1172 ±25 1135 ±51 −35.1c 402 95 0.24 65.80 0.00 0.08 0.87 2.02 1.70 0.19 1.50 1125 ±15 1114 ±17 −16.1c 241 52 0.22 41.50 0.07 0.08 3.40 2.12 5.20 0.20 3.90 1177 ±42 1117 ±69 −57.1rc 689 43 0.06 81.70 0.05 0.07 1.20 1.35 2.20 0.14 1.90 833 ±15 960 ±25 137.2c 327 103 0.33 51.10 0.00 0.08 2.40 1.92 2.80 0.18 1.50 1078 ±15 1105 ±47 28.1c 1578 54 0.04 260.00 0.47 0.08 1.20 2.06 2.10 0.19 1.70 1126 ±17 1156 ±24 38.2rc 466 55 0.12 65.30 2.04 0.08 4.00 1.69 4.40 0.16 1.80 955 ±16 1112 ±80 149.1rc 764 56 0.08 121.00 0.00 0.07 0.99 1.89 2.80 0.18 2.60 1091 ±26 1051 ±20 −49.2c 735 109 0.15 116.00 0.68 0.08 1.40 1.92 2.10 0.18 1.60 1082 ±16 1103 ±28 2
10.1c 527 82 0.16 83.00 0.18 0.08 0.99 1.96 1.70 0.18 1.40 1082 ±14 1136 ±20 511.1c 334 50 0.16 51.00 0.00 0.08 0.87 1.89 1.60 0.18 1.40 1056 ±13 1125 ±17 612.1c 495 29 0.06 80.50 0.00 0.08 2.60 2.06 2.90 0.19 1.40 1118 ±14 1170 ±52 413.1c 491 78 0.16 82.60 0.13 0.08 1.20 2.08 1.90 0.20 1.50 1151 ±15 1130 ±25 −213.2rc 372 49 0.14 43.10 0.07 0.07 1.20 1.34 1.90 0.13 1.40 816 ±11 979 ±25 17
Errors are 1-sigma; f 206% is the proportion of common 206Pb, Pb* is the radiogenic proportion. Error in standard calibration was 0.48% (not included in above errors but required when comparingdata from different mounts). (1) Common Pb corrected using measured 204Pb. For disc (%), 0% denotes a concordant analysis. c: core analysis; rc: mixed ages (rim + core).
Autho
r's
pers
onal
co
py
108A
.Bisnath
etal./Precam
brianR
esearch150
(2006)95–121
Table 4SHRIMP U–Pb zircon data for sample ABA/10B
Grain spot U (ppm) Th (ppm) 232Th/238U 206Pb* (ppm) f 206% Radiogenenic ratios Ages (Ma) Disc (%)
207Pb*/206Pb* ±% 207Pb*/235U ±% 206Pb*/238U ±% 206Pb/238U 207Pb/206Pb
1.1r 940 27 0.03 139.00 0.13 0.08 0.79 1.811 1.50 0.17 1.20 1019 ±12 1117 ±16 102.1r 1381 38 0.03 215.00 0.29 0.08 1.50 1.89 2.00 0.18 1.40 1070 ±13 1092 ±29 23.1rc 1569 48 0.03 187.00 0.21 0.07 0.68 1.38 1.40 0.14 1.20 835 ±9.6 994 ±14 194.1c 800 65 0.08 129.00 0.00 0.08 0.55 1.97 1.30 0.19 1.10 1108 ±12 1098 ±11 −15.1c 493 280 0.59 79.90 0.00 0.08 0.73 2.01 1.40 0.19 1.20 1115 ±12 1126 ±15 16.1c 200 136 0.70 33.90 0.00 0.08 0.99 2.10 1.60 0.20 1.20 1159 ±13 1127 ±20 −37.1rc 3156 247 0.08 425.00 0.37 0.07 0.72 1.61 1.30 0.16 1.10 936 ±9.9 1058 ±14 138.1c 476 86 0.19 78.40 0.81 0.08 2.00 2.00 2.40 0.19 1.20 1123 ±12 1103 ±41 −29.1rc 1046 44 0.04 135.00 0.10 0.07 1.30 1.50 1.70 0.15 1.10 901 ±9.4 1005 ±27 12
10.1r 353 150 0.44 51.50 0.00 0.08 0.74 1.80 1.40 0.17 1.20 1011 ±11 1119 ±15 1111.1c 610 74 0.13 98.50 0.09 0.08 1.20 1.97 1.80 0.19 1.40 1109 ±14 1094 ±23 −112.1r 352 98 0.29 55.10 0.00 0.08 0.95 1.90 1.90 0.18 1.60 1078 ±16 1089 ±19 112.2rc 1889 110 0.06 156.00 0.61 0.07 4.70 0.93 4.80 0.10 1.10 590 ±6.3 928 ±96 5713.1r 2061 82 0.04 327.00 0.41 0.08 0.96 1.96 2.00 0.18 1.70 1089 ±18 1132 ±19 414.1r 740 77 0.11 117.00 0.18 0.08 1.40 1.92 1.80 0.18 1.10 1083 ±11 1096 ±27 115.2rc 1003 107 0.11 139.00 0.27 0.08 0.89 1.69 2.20 0.16 2.00 964 ±18 1095 ±18 1416.1c 4691 63 0.01 823.00 0.29 0.08 0.63 2.15 1.30 0.20 1.10 1194 ±12 1108 ±13 −717.1r 1423 58 0.04 214.00 0.03 0.08 0.67 1.82 1.70 0.17 1.50 1038 ±15 1082 ±13 418.1r 443 69 0.16 65.00 0.44 0.08 1.90 1.77 2.50 0.17 1.60 1012 ±15 1078 ±38 719.1c 7560 127 0.02 1280 0.06 0.08 0.53 2.06 1.20 0.20 1.10 1155 ±12 1093 ±11 −5
Errors are 1-sigma; f 206% is the proportion of common 206Pb, Pb* is the radiogenic proportion. Error in standard calibration was 0.36% (not included in above errors but required when comparingdata from different mounts). (1) Common Pb corrected using measured 204Pb. For disc (%), 0% denotes a concordant analysis. c: core analysis; rc: mixed ages (rim + core); r: metamorphicovergrowth (rim analysis).

Autho
r's
pers
onal
co
py
A. Bisnath et al. / Precambrian Research 150 (2006) 95–121 109
interpreted to be of magmatic origin. The rims were toosmall to be analysed.
5.4. Grey Migmatite Gneiss, Terningskarvet(ABA/21)
A grey migmatite gneiss (Sample ABA/21, 72◦10′S;2◦38′E; Fig. 2) was sampled in order to determine theemplacement age of the granite protolith and its sub-sequent metamorphic history. The chosen sample has agneissose texture and is composed of quartz (30 vol.%),biotite (20 vol.%) and microcline (45 vol.%) that dis-plays transformation lamellae, with trace amounts ofapatite and zircon. Field relationships indicate at leasttwo stages of deformation. F1 folds have been completelyobliterated. Preserved in these rocks are rootless isocli-nal folds (F2) that produced the regional dominant fabric(S2). This was followed by the re-orientation of F2 foldsso that the fold axes now plunge parallel to the dip of theregional pervasive fabric (S2), which is defined by thealignment of biotite grains.
This rock contains colourless to yellow and brown,elongated zircon with a grain size ranging from 20to 300 �m. The grains are subhedral to euhedral anddominated by the {100} prismatic and {101} pyrami-dal forms. They display rounded terminations, in placesleading to an ovoid morphology. Cathodoluminescenceimages (Fig. 5B and C) of the zircon grains showcores that are highly luminescent with well-developed,presumably magmatic oscillatory growth zonation andresorption textures. The grains have a weaker lumines-cent rim that truncates the oscillatory growth zonation.The cores have U concentrations ranging from 139 ppmto 495 ppm and Th/U ratios between 0.21 and 0.71. Incontrast, the rims are enriched in U (2578–8059 ppm)and thus yield lower Th/U ratios (0.01–0.09; Table 5),which is typical of metamorphic zircon overgrowths(Williams, 1998).
Seventeen analyses were made of zircon rims fromsample ABA/21, and these yielded a weighted mean207Pb/206Pb age of 529 ± 4 Ma (MSWD = 1.08; prob-ability of fit = 0.37) with the most concordant analy-sis (spot 3.1) giving a 207Pb/206Pb age of 505 ± 10 Ma(Fig. 4D). These ages are interpreted as dating a meta-morphic overgrowth. Two core analyses (spot 4.2 and8.2; Fig. 5B and C) gave a 207Pb/206Pb age of 1143 ± 41and 1174 ± 45 Ma, respectively. The younger age isinterpreted to represent the crystallisation age of themagmatic protolith whereas the older age is interpretedto represent a mixed age. Two strongly luminescentspots were analysed (spot 1.1 and 9.1; Table 5 andFig. 5C) and yielded a 207Pb/206Pb age of 1048 ± 18
and 1080 ± 13 Ma, respectively, which is within errorof ages obtained for other samples (see above) and isinterpreted to represent an earlier metamorphic event.However, their Th/U ratio (0.26) is relatively high com-pared to typical metamorphic overgrowths.
5.5. Banded Gneiss, Von Essenskarvet
A banded gneiss sample (ABA/32) was collectedfrom the vicinity of Portnipa in western Von Essen-skarvet, (72◦14′S; 2◦22′E; Fig. 2) in order to test theinferred sedimentary origin of the rock, to place con-straints on the age of the source rocks, and also to definethe maximum age of the metasedimentary sequence.The rock is characterised by compositional bandingon the centimetre- to metre-scale (Fig. 3E). This isdue to the alignment of mafic and felsic metamorphicminerals. The banded gneiss unit contains alternatingbands of hornblende-rich, biotite-garnet-rich and felsicbands. The biotite-garnet-rich unit is essentially com-posed of biotite (40 vol.%), garnet (20 vol.%), plagio-clase (20 vol.%), quartz (10 vol.%) and accessory zircon,apatite and in some places sillimanite. The hornblende-rich unit contains bands that display a nematoblastic tex-ture and are made up of hornblende (30 vol.%), plagio-clase (25 vol.%), quartz (15 vol.%), diopside (10 vol.%)and biotite (10 vol.%) with accessory zircon, titaniteand apatite. The biotite occurs along the margins of theclinopyroxene grains. Locally, clinopyroxene is totallyreplaced by hornblende. Quartz is stretched into ribbonshapes. Rounded blebs of quartz are present in plagio-clase grains displaying a myrmekitic texture.
The zircon grains are generally anhedral, 20–250 �min length and dark brown in colour. Cathodolumi-nescence imaging revealed that the majority of thegrains are homogeneous and contain weaker luminescentcores with presumably magmatic compositional zona-tion (Fig. 5D). Some zircon cores contain dark inclu-sions of up to 10 �m in diameter that were avoidedduring analyses. The cores are rimmed by brightlyluminescent margins. A relatively large proportion ofthe zircon grains are fractured and have been infilledwith brightly luminescent zircon (Fig. 5D). The mor-phology of these margins implies that they represent ametamorphic overgrowth. Five concordant analyses ofbright luminescent zircon rims yielded a weighted mean207Pb/206Pb age of 1091 ± 16 Ma (MSWD = 1.9; proba-bility of fit = 0.079; Fig. 4E). These rims have relativelyhigh Th/U ratios ranging from 0.31 to 0.47 (Table 6). Theleast discordant analysis (spot 8.1; Table 6 and Fig. 5D)gave a 207Pb/206Pb age of 1120 ± 9 Ma that is identicalto the calculated upper intercept age of 1120 ± 12 Ma

Autho
r's
pers
onal
co
py
110A
.Bisnath
etal./Precam
brianR
esearch150
(2006)95–121
Table 5SHRIMP U–Pb zircon data for sample ABA/21
Grain spot U (ppm) Th (ppm) 232Th/238U 206Pb* (ppm) f 206% Radiogenenic ratios Ages (Ma) Disc (%)
207Pb*/206Pb* ±% 207Pb*/235U ±% 206Pb*/238U ±% 206Pb/238U 207Pb/206Pb
1.1r 420 116 0.28 60.60 0.17 0.07 0.89 1.72 1.90 0.17 1.70 999 ±16 1048 ±18 51.2r 2958 33 0.01 213.00 0.77 0.06 1.30 0.68 1.70 0.08 1.20 515 ±5.8 575 ±28 102.1r 7916 100 0.01 623.00 0.01 0.06 0.31 0.73 1.10 0.09 1.00 565 ±5.6 517 ±6.9 −93.1r 3368 30 0.01 236.00 0.01 0.06 0.48 0.65 1.20 0.08 1.10 506 ±5.4 505 ±10 04.1r 4244 108 0.03 290.00 0.28 0.06 0.56 0.64 1.20 0.08 1.10 492 ±5.2 536 ±12 84.2c 342 71 0.21 46.10 1.11 0.08 2.10 1.67 2.40 0.16 1.10 931 ±9.9 1143 ±41 195.1r 3735 316 0.09 263.00 2.77 0.06 1.70 0.64 2.10 0.08 1.10 494 ±5.2 534 ±38 85.2r 11249 69 0.01 845.00 0.01 0.06 0.24 0.70 1.10 0.09 1.10 540 ±5.8 530 ±5.3 −26.1r 6782 96 0.01 488.00 0.10 0.06 0.38 0.67 1.10 0.08 1.00 519 ±5.2 539 ±8.2 46.2r 2578 18 0.01 196.00 0.82 0.06 1.30 0.70 1.70 0.09 1.10 543 ±5.5 527 ±29 −37.1r 8056 36 0.00 649.00 0.01 0.06 0.25 0.75 1.10 0.09 1.00 578 ±5.8 541 ±5.4 −78.1r 2216 131 0.06 163.0 0.41 0.06 0.86 0.68 1.40 0.09 1.10 527 ±5.8 524 ±19 −18.2rc 139 96 0.71 18.60 0.96 0.08 2.30 1.69 2.70 0.15 1.30 928 ±12 1174 ±45 219.1r 495 126 0.26 78.10 0.07 0.08 0.63 1.91 1.40 0.18 1.30 1086 ±13 1080 ±13 −1
10.1r 7787 167 0.02 625.00 0.08 0.06 0.48 0.75 1.10 0.09 1.00 575 ±5.7 538 ±11 −710.2r 15815 237 0.02 1,320 – 0.06 0.20 0.78 0.10 0.10 1.00 599 ±5.9 529 ±4.4 −1311.1r 2206 76 0.04 172.00 0.71 0.06 1.40 0.72 1.80 0.09 1.10 556 ±6.0 542 ±30 −312.1r 4912 66 0.01 388.00 0.00 0.06 0.30 0.73 1.10 0.09 1.00 566 ±5.7 523 ±6.7 −813.1r 4604 17 0.00 367.00 0.01 0.06 0.32 0.74 1.10 0.09 1.00 572 ±5.7 524 ±7.1 −914.1r 7768 232 0.03 626.00 0.01 0.06 0.23 0.75 1.10 0.09 1.00 578 ±5.7 524 ±5.0 −1015.1r 4253 73 0.02 330 0.19 0.06 0.52 0.72 1.20 0.09 1.00 556 ±5.6 521 ±11 −7
Errors are 1-sigma; f 206% is the proportion of common 206Pb, Pb* is the radiogenic proportion. Error in standard calibration was 0.48% (not included in above errors but required when comparingdata from different mounts). (1) Common Pb corrected using measured 204Pb. For disc (%), 0% denotes a concordant analysis. c: core analysis; rc: mixed ages (rim + core); r: metamorphicovergrowth (rim analysis).

Autho
r's
pers
onal
co
py
A.B
isnathetal./P
recambrian
Research
150(2006)
95–121111
Table 6SHRIMP U–Pb zircon data for sample ABA/32
Grainspot
U (ppm) Th (ppm) 232Th/238U 206Pb* (ppm) f 206% Radiogenenic ratios Ages (Ma) Disc (%)
207Pb*/206Pb* ±% 207Pb*/235U ±% 206Pb*/238U ±% 206Pb/238U 207Pb/206Pb
1.1rc 324 79 0.25 46.30 5.32 0.07 10.00 1.53 10.00 0.16 1.20 944 ±11 945 ±200 01.2rc 312 83 0.27 42.00 2.33 0.07 4.50 1.55 4.60 0.15 1.20 919 ±10 1018 ±91 101.3c 1277 522 0.42 199.00 0.02 0.08 0.50 1.92 1.50 0.18 1.40 1076 ±14 1110 ±10 32.1c 908 368 0.42 146.00 0.07 0.08 0.64 1.99 1.20 0.19 1.00 1104 ±10 1125 ±13 22.2r 1076 433 0.42 161.00 0.03 0.07 0.56 1.80 1.60 0.17 1.40 1037 ±14 1066 ±11 33.1r 988 397 0.41 154.00 2.00 0.08 3.80 1.86 4.00 0.18 1.00 1056 ±10 1087 ±77 34.1r 571 170 0.31 86.90 1.97 0.08 4.60 1.81 4.70 0.17 1.10 1033 ±11 1082 ±91 55.1c 1762 1194 0.70 288.00 0.01 0.08 0.36 2.02 1.20 0.19 1.10 1123 ±12 1116 ±7.1 −16.1c 1228 539 0.45 185.00 0.07 0.08 0.56 1.86 1.20 0.18 1.00 1042 ±9.9 1116 ±11 76.3rc 242 74 0.31 27.10 3.98 0.07 8.60 1.19 8.70 0.13 1.30 759 ±9.2 893 ±180 157.1c 612 195 0.33 97.30 0.06 0.08 0.68 1.95 1.30 0.18 1.00 1093 ±11 1113 ±14 28.1c 965 393 0.42 157.00 0.00 0.08 0.45 2.01 1.10 0.19 1.00 1119 ±10 1120 ±9.0 09.1rc 268 79 0.31 34.60 0.11 0.07 1.30 1.51 1.80 0.15 1.30 902 ±11 1006 ±25 109.2c 937 372 0.41 143.00 0.00 0.08 0.46 1.87 1.10 0.18 1.00 1056 ±9.9 1102 ±9.2 4
10.1r 152 16 0.11 11.20 0.00 0.06 1.90 0.69 2.30 0.09 1.30 527 ±6.5 566 ±42 712.1r 1008 454 0.47 152.00 0.22 0.08 0.74 1.83 1.30 0.18 1.00 1044 ±9.8 1085 ±15 413.1rc 514 121 0.24 74.20 2.49 0.07 8.00 1.69 8.10 0.16 1.20 978 ±11 1064 ±160 814.1rc 754 296 0.41 102.00 0.15 0.07 0.74 1.58 1.30 0.16 1.10 938 ±9.3 1012 ±15 715.1rc 210 79 0.39 26.60 1.900 0.07 1.10 1.45 1.90 0.15 1.60 888 ±13 964 ±23 815.2rc 564 92 0.17 68.70 1.14 0.07 3.10 1.41 3.60 0.14 1.80 845 ±15 1011 ±62 1616.2r 492 191 0.40 76.40 6.40 0.08 0.59 1.88 1.20 0.18 1.00 1071 ±10 1079 ±12 1
Errors are 1-sigma; f 206% is the proportion of common 206Pb, Pb* is the radiogenic proportion. Error in standard calibration was 0.28% (not included in above errors but required when comparingdata from different mounts). (1) Common Pb corrected using measured 204Pb. For disc (%), 0% denotes a concordant analysis. c: core analysis; rc: mixed ages (rim + core); r: metamorphicovergrowth (rim analysis).

Autho
r's
pers
onal
co
py
112 A. Bisnath et al. / Precambrian Research 150 (2006) 95–121
(MSWD = 0.98; probability of fit = 0.48). As this is theoldest age obtained for this sample, it is interpreted to bethe maximum age of sedimentation. The ca. 1090 Ma agecalculated is interpreted to be dating metamorphic over-growth on the basis of textural and chemical evidenceeven though the Th/U ratio is high when compared totypical metamorphic overgrowths. A calculated lowerintercept age of 527 ± 50 Ma is interpreted to reflect asecond metamorphic event, which finds support form a207Pb/206Pb age of 566 ± 42 Ma on a brightly lumines-cent spot (spot 10.1; Table 6 and Fig. 4E).
5.6. Stabben Metagabbro
The late- to post-tectonic Stabben metagabbro(72◦56′S; 2◦47′E; Figs. 2 and 3B) was sampled inorder to determine its emplacement age. The rock ismedium- to coarse-grained with no preferred orien-tation of the constituent minerals. Xenoliths of thehost gneiss can be found randomly distributed andlocally, the gabbro is cross-cut by pegmatite dykes.The analysed sample (ABA/64) contains saussuritisedplagioclase (25 vol.%), green hornblende (30 vol.%),biotite (25 vol.%), altered clinopyroxene (chloritic rims;10 vol.%), opaques (5 vol.%) and trace amounts ofapatite, titanite and zircon.
The zircon grains are clear and up to 250 �m in length.Their grain boundaries are irregular, and appear to haveirregular zoning that could be a result of rapid graingrowth. Their U concentrations are low (41–829 ppm)with Th/U ratios ranging between 0.80 and 2.92.
Twenty-three analyses were made of zircon cores and21 of these yielded a weighted mean 207Pb/206Pb ageof 487 ± 4 Ma (MSWD = 0.62; probability of fit = 0.84;Fig. 4F). This is interpreted to represent the magmaticcrystallization age of the gabbro body. The remainingtwo spot analyses (17.1 and 20.1; Table 7) gave muchhigher ages of 1165 ± 41 and 1090 ± 81 Ma. Based onthe post-tectonic intrusive field relationships, these agescannot date the emplacement or any other process affect-ing the gabbro, and they are therefore interpreted asinheritance from the host gneiss into which the gabbrointruded.
5.7. Aplite Dyke, Von Essenskarvet
An aplite sample (ABA/69) was collected in westernVon Essenskarvet in the vicinity of Portnipa (72◦14′S;2◦22′E; Fig. 2) from a metre-wide, fine- to medium-grained dyke (Fig. 3E). This aplite dyke is undeformedand its age should thus provide a minimum constrainton the timing of deformation in the area. The sample
is equigranular with a grain size of 0.5 to 1.2 mm andcomposed of microcline (35 vol.%), partly saussuritisedplagioclase (25 vol.%), quartz (25 vol.%), and biotite(10 vol.%), with trace amounts of zircon, apatite andmuscovite.
Zircon in this rock is colourless to light yellowin colour and between 50 �m and 250 �m in length.Cathodoluminescence images reveal two zircon popula-tions. The first population is generally smaller, stubbyand idiomorphic, of dipyramidal prismatic habit withdominance of the {1 0 0} prism and {1 0 1} pyra-midal forms. This population also shows oscillatorygrowth zonation. Its U concentration ranges from 358to 7459 ppm and Th/U ratios are between 0.06 and1.12. The second population is generally elongate, lesseuhedral, with very thin rims and {1 0 0} prism and{1 0 1} pyramidal forms dominating. This generationhas, on average, lower U concentrations (93–848 ppm)with Th/U ratios between 0.67 and 0.12.
The sample yielded a crystallisation age, and thus, byinference, a minimum age for the Pan-African deforma-tion, of 498 ± 5 Ma (MSWD = 1.1) on 13 zircon coreanalyses (Fig. 4G). Analyses on the second popula-tion of zircons (spots 2.1, 7.1, 8.1, 14.1, 18.1 and 19.1;Table 8) produced a less dominant discordant age groupof between 1100 and 950 Ma (not included in concordiadiagram, Fig. 4G) and are interpreted to reflect zirconinheritance from the host rock.
6. Geodynamic model for the Maud Belt
New data acquired in this study, together with recentlypublished data from other parts of the Maud Belt, makeit possible to distinguish a series of tectono-thermalevents and place relatively precise age constraints onthese events (Table 9). Some of these new data are notconsistent with previous models for the tectonic evo-lution along the southern and eastern margins of theKaapvaal-Grunehogna Craton, particularly during lateMesoproterozoic times. The so far oldest rocks knownfrom Gjelsvikfjella formed within an approximately1130 Ma volcanic arc, contemporaneous with arc mag-matism along the entire length of the Maud Belt. Inprevious models (e.g. Groenewald et al., 1991; Jacobs etal., 1993) this arc has been linked with an oceanic islandarc to the south of the craton, remants of which are pre-served in the Natal sector of the Namaqua-Natal Belt inSouth Africa. However, available data from that sector(Cornell et al., 1996; Thomas et al., 1999; Johnston etal., 2001) point to arc magmatism having occurred theresome 70 myr earlier. Further west, in the Namaqua sec-tor of that belt, arc magmatism commenced even earlier

Autho
r's
pers
onal
co
py
A.B
isnathetal./P
recambrian
Research
150(2006)
95–121113
Table 7SHRIMP U–Pb zircon data for sample ABA/64
Grain spot U (ppm) Th (ppm) 232Th/238U 206Pb* (ppm) f 206% Radiogenenic ratios Ages (Ma) Disc (%)
207Pb*/206Pb* ±% 207Pb*/235U ±% 206Pb*/238U ±% 206Pb*/238U 207Pb*/206Pb
1.1c 41 52 1.32 2.91 0.00 0.06 3.50 0.69 4.30 0.08 2.60 511 ±13 639 ±74 202.1c 87 141 1.67 5.87 0.00 0.06 2.90 0.62 3.40 0.08 1.80 487 ±8.4 513 ±64 53.1c 49 63 1.33 3.31 0.00 0.06 3.40 0.65 4.30 0.08 2.60 493 ±12 570 ±75 143.2c 162 314 2.01 11.0 0.00 0.06 2.00 0.63 2.50 0.08 1.50 492 ±7.3 498 ±44 14.1c 156 158 1.04 10.40 0.00 0.06 2.00 0.62 2.50 0.08 1.60 483 ±7.2 536 ±44 105.1c 147 176 1.23 9.90 0.00 0.06 2.10 0.63 2.60 0.08 1.60 486 ±7.4 526 ±46 86.1c 52 40 0.80 3.56 0.00 0.06 3.60 0.65 4.10 0.08 2.00 496 ±9.6 555 ±79 117.1c 255 329 1.33 16.60 0.26 0.06 1.90 0.61 2.60 0.08 1.70 469 ±7.9 540 ±42 138.1c 829 1344 1.68 54.10 0.13 0.06 1.20 0.60 1.90 0.08 1.40 472 ±6.6 514 ±26 89.1c 195 442 2.34 13.00 0.00 0.06 1.80 0.62 2.40 0.08 1.50 480 ±7.0 549 ±40 13
10.1c 312 883 2.92 21.30 0.00 0.06 1.50 0.63 2.10 0.08 1.40 492 ±6.8 508 ±32 311.1c 194 399 2.12 13.20 0.00 0.06 1.90 0.63 2.40 0.08 1.50 491 ±7.2 524 ±42 611.2c 57 59 1.07 3.66 0.00 0.06 5.20 0.62 5.80 0.08 2.50 468 ±11 578 ±110 1912.1c 177 262 1.53 109.0 0.00 0.06 2.60 0.59 4.00 0.07 3.10 448 ±13 595 ±56 2513.1c 60 54 0.93 4.24 3.27 0.07 15.00 0.75 15.00 0.08 2.30 493 ±11 882 ±320 4413.2c 287 324 1.16 18.60 0.00 0.06 2.00 0.59 2.50 0.08 1.50 469 ±6.9 481 ±44 314.1c 112 229 2.11 7.33 0.47 0.06 4.10 0.59 4.50 0.08 1.80 471 ±8.0 457 ±91 −315.1c 109 174 1.65 7.41 1.00 0.06 2.70 0.62 3.20 0.08 1.70 491 ±8.1 486 ±59 −116.1c 211 300 1.47 13.50 0.00 0.06 1.90 0.60 2.40 0.07 1.50 463 ±6.8 539 ±41 1417.1ic 549 166 0.31 88.60 0.09 0.08 2.10 2.04 2.50 0.19 1.40 1108 ±14 1165 ±41 518.1c 84 120 1.48 5.65 0.39 0.06 4.50 0.60 4.80 0.08 1.90 485 ±8.9 429 ±99 −1319.1c 69 74 1.11 4.50 0.00 0.06 3.40 0.61 4.30 0.08 2.70 475 ±12 527 ±74 1020.1ic 616 128 0.21 77.60 1.75 0.08 4.00 1.51 4.50 0.14 1.90 868 ±15 1090 ±81 20
Errors are 1-sigma; f 206% is the proportion of common 206Pb, Pb* is the radiogenic proportion. Error in standard calibration was 0.48% (not included in above errors but required when comparingdata from different mounts). Common Pb corrected using measured 204Pb. Common Pb corrected by assuming 206Pb/238U–207Pb/235U age-concordance. For disc (%), 0% denotes a concordantanalysis. c: core analysis; ic: inherited core.

Autho
r's
pers
onal
co
py
114A
.Bisnath
etal./Precam
brianR
esearch150
(2006)95–121
Table 8SHRIMP U–Pb zircon data for sample ABA/69
Grainspot
U (ppm) Th (ppm) 232Th/238U 206Pb* (ppm) f 206% Radiogenenic ratios Ages (Ma) Disc(%)207Pb*/206Pb* ±% 207Pb*/235U ±% 206Pb*/238U ±% 206Pb/238U 207Pb/206Pb
1.1c 358 97 0.28 24.90 0.10 0.06 1.80 0.66 2.20 0.08 1.30 502 ±6.2 566 ±40 112.1ic 1088 113 0.11 157.00 0.42 0.08 1.90 1.75 2.30 0.17 1.40 999 ±13 1092 ±38 93.1c 2104 173 0.09 155.00 0.00 0.06 0.77 0.69 1.30 0.09 1.00 530 ±5.3 552 ±17 44.1c 7074 2240 0.33 516.00 – 0.06 0.26 0.67 1.10 0.08 1.10 525 ±5.4 492 ±5.8 −75.1c 7459 410 0.06 518.00 0.13 0.06 0.35 0.63 1.10 0.08 1.00 501 ±5.0 486 ±7.8 −36.1c 815 236 0.30 55.20 0.04 0.06 0.93 0.62 1.50 0.08 1.20 489 ±5.6 482 ±21 −27.1ic 720 168 0.24 110.00 0.01 0.08 0.52 1.88 1.20 0.18 1.10 1052 ±11 1124 ±10 68.1ic 848 98 0.12 143.00 0.02 0.08 11.00 2.19 11.00 0.20 3.30 1156 ±35 1222 ±210 59.1c 729 726 1.03 53.10 3.99 0.06 5.50 0.63 5.70 0.08 1.50 504 ±7.1 443 ±120 −1410.1c 751 731 1.01 51.60 0.13 0.06 1.30 0.64 1.80 0.08 1.20 496 ±5.6 531 ±28 711.1c 574 425 0.76 39.20 0.09 0.06 1.10 0.62 1.60 0.08 1.10 492 ±5.2 493 ±25 012.1c 528 181 0.35 69.60 0.06 0.07 0.82 1.50 1.50 0.15 1.20 920 ±11 959 ±17 413.1c 1225 999 0.84 78.60 0.19 0.06 1.10 0.58 1.60 0.07 1.20 464 ±5.2 484 ±24 414.1ic 121 60 0.51 15.50 0.00 0.07 1.90 1.48 2.40 0.15 1.40 892 ±12 990 ±39 1015.1c 741 801 1.12 52.60 1.35 0.06 2.30 0.64 2.50 0.08 1.10 505 ±5.3 489 ±51 −316.1c 609 537 0.91 42.50 0.62 0.06 3.10 0.65 3.30 0.08 1.10 501 ±5.3 534 ±67 617.1c 799 560 0.72 56.00 0.92 0.06 1.80 0.64 2.10 0.08 1.10 502 ±5.3 491 ±40 −218.1ic 116 51 0.45 13.30 0.00 0.07 2.60 1.31 3.70 0.13 2.70 803 ±20 971 ±52 1719.1ic 93 60 0.67 13.90 0.13 0.07 2.50 1.76 2.90 0.17 1.30 1029 ±13 1037 ±51 1
Errors are 1-sigma; f 206% is the proportion of common 206Pb, Pb* is the radiogenic proportion. Error in standard calibration was 0.48% (not included in above errors but required when comparingdata from different mounts). (1) Common Pb corrected using measured 204Pb. For disc (%), 0% denotes a concordant analysis, A103. c: core analysis; ic: inherited core.

Autho
r's
pers
onal
co
py
A.B
isnathetal./P
recambrian
Research
150(2006)
95–121115
Table 9Summary of the most reliable age data for the Maud Belt, Antarctica
Central KirwangeggenSouthwest
NorthernKirwanveggen
Sverdrupfjella Gjelsvikfjella Festninga/Risemedet Central Dronning MaudLand Northeast
Rock type/Mineral dated Jackson (1999) Harris et al. (1995) Board et al. (2005) This study Jacobs et al. (2003a,2003b, 2003d)
Jacobs et al. (1998,2003c)
Stabben Gabbro 483 ± 11a
487.3 ± 4.4
Granite/Aplite Dykes 475 ± 10 480 ± 13b 497 ± 5 486.9 ± 3.8Stabben Syenite 500 ± 8c
Zircon Overgrowths (Rims) 504 ± 6c
Lamprophyre Dyke 523 ± 4.8Charnokite 521.3 ± 3.4Zwiesel Gabbro 527 ± 5Zircon Overgrowths (Rims) 528 ± 6 529 ± 4 528 ± 10 ca. 530Syn-tectonic monazite 539 ± 9Granite Leucosome 558 ± 5.6Zircon Overgrowths (Rims) 585 ± 20 565 ± 11 ca. 570 ca. 570Granite Dykes 980 ± 13PorphyriticGranite Dyke 1011 ± 8Zircon Overgrowths (Rims) 1081 ± 4 1061 ± 14 1035 ± 21 ca. 1070 1061 ± 56 ca. 1080Migmatite Augen Gneiss 1074 ± 11 1103 ± 13 1104 ± 8 1096 ± 8.4 1076 ± 14Grey Migmatite Gneiss 1115 ± 12Augen Gniess 1127 ± 12 1124 ± 11 1123 ± 21Migmatite Augen Gneiss 1137 ± 14
Granite Gneisss 1134 ± 11 1131 ± 25 1133 ± 16 1130 ± 121163 ± 6c
1130 ± 19
Grey Gneiss/Zircon Cores 1143 ± 11 1139 ± 12 1132 ± 16 ca. 1140 1142 ± 21
All ages in (Ma) derived from SHRIMP U–Pb zircon data, except for:a SHRIMP U–Pb titanite age (Jacobs et al., 2003b).b Conventional U–Pb zircon age (Board et al., 2005).c SIMS U–Pb–Th zircon ages (Paulsson and Austrheim, 2003).
Autho
r's
pers
onal
co
py
116 A. Bisnath et al. / Precambrian Research 150 (2006) 95–121
(Frimmel, 2004). Apart from significant differences inthe timing of arc magmatism, different kinematic vectorsfor the accretion of arc material onto the Kaapvaal-Grunehogna Craton speak against a single, continuousvolcanic arc stretching all around the craton from theNamaqua-Natal to the Maud Belt.
For the Natal sector, subduction away from the cra-ton has been suggested to explain the postulated oceanicisland arc there (Jacobs and Thomas, 1994; Arima et al.,2001) and, by analogy, a similar outboard direction ofsubduction has also been suggested for the Maud Belt(Bauer et al., 2003b; Basson et al., 2004). Such a modelimplies a forearc position for the volcano-sedimentaryRitscherflya Supergroup between the Maud Belt and theGrunehogna Craton. The geochemistry of the basin fillpoints to sediment derivation from an active volcanic arcsystem (Basson et al., 2004). Magmatic zircon ages of1131 ± 7 Ma from pyroclastic beds in the lower Ritscher-flya Supergroup (Frimmel, 2004) indicate sedimentationto have occurred at the same time as volcanic arc forma-tion. The arc preserved in the Maud Belt is thereforeregarded as the main source for the sediments and pyro-clastic rocks in the Ritscherflya Basin. The presence ofrare older, inherited zircon grains in the various high-grade metamorphic rocks of the Maud Belt, as estab-lished in this study for the Gjelsvikfjella and by othersfor the Heimefrontfjella (Arndt et al., 1991; Jacobs etal., 1996) and the northern Kirwanveggen (Harris, 1999),ranging from 1200 to 2100 Ma, together with Nd modelages as old as Archaen (Grosch and Bisnath, unpublisheddata), indicate that the Maud arc was not an oceanicisland arc but formed adjacent to an Archean craton,presumably the Grunehogna Craton. Consequently, thedirection of subduction that led to the formation of theMaud arc, is suggested to have been inboard beneath theKaapvaal-Grunehogna Craton (Fig. 7A).
U–Pb single zircon ages of 1128 ± 19 and1104 ± 8 Ma obtained in this study for the AugenGneiss and Mylonitic Augen Gneiss units in Gjelsvikf-jella, respectively, are indistinguishable from an age of1127 ± 12 Ma obtained for a megacrystic augen gneissthat occurs over a strike length of approximately 300 kmalong the western Maud Belt and a second genera-tion of megacrystic orthogneiss that has been dated at1103 ± 13 Ma in the northeastern parts of the MaudBelt (Harris et al., 1995). The older age group around1127 Ma conforms to the final stages of arc develop-ment and the megacrystic granitic protoliths are thereforeinterpreted as products of arc magmatism.
More ambiguous is the interpretation of the age dataclustering around 1100 Ma. Indistinguishable ages havebeen obtained from similar augen gneiss in the Namaqua
Belt (1109 ± 7 Ma; Raith et al., 2003) and from a gra-nophyre in Coats Land (1106 ± 3 Ma; Gose et al., 1997).This is identical to a precise age of 1105 ± 2 Ma (Hansonet al., 1998, 2004) for tholeiitic sills in eastern Zimbabwe(Umkondo Province) and also to that of 1102 ± 8 Maobtained for voluminous tholeiite emplacement in theMid Continental Rift in the southwest Grenville Orogen(Paces and Miller, 1993) as well as in the Warakurnaigneous province of west-central Australia (Wingate etal., 2004). For the contemporaneity of these magmaticevents over a very large area, their cause has beenascribed to a large-scale, but short-lived mantle thermalanomaly (Hanson et al., 1998). Such a thermal anomalywould have led to decompression melting in the lowercrust and upper mantle (Fig. 7B), which, in turn, couldhave formed the megacrystic granites of that particu-lar age group (Frimmel, 2004). Bimodal magmatismis expected for such decompression melting in a pre-sumably thinning crust. Mafic dykes, now present aspre-tectonic amphibolite bodies, might well be expres-sions of the same thermal event, but are awaiting precisedating.
The ca. 1070 Ma ages obtained from metamorphiczircon overgrowths in this study record a period of firsthigh-grade metamorphism. Outcrop-scale expressionsof this metamorphic event are difficult to recognise due tothe intensity of later Pan-African tectono-thermal over-print. Comparable ages for high-grade metamorphism,ranging from 1090 to 1030 Ma, have been reportedfrom most other parts of the Maud Belt (Arndt et al.,1991; Jacobs et al., 1998, 1999, 2003d; Jackson, 1999;Harris, 1999; Paulsson and Austrheim, 2003; Board etal., 2005) and are identical to those reported for compa-rable high-grade metamorphism in the Namaqua-NatalBelt (Robb et al., 1999; Frimmel, 2004). The conti-guity of the Namaqua-Natal and the Maud Belt wastherefore established only at the end of the Mesoprotero-zoic, probably as consequence of continent–continentcollision during amalgamation of the supercontinentRodinia.
The kinematic reconstruction for the continentalcollision phase at the end of the Mesoproterozoic isnow less certain than apparent from previous literature(e.g. Groenewald et al., 1995), since the main defor-mation, top-to-northwest thrusting (D2), has been re-interpreted as being Pan-African in age. The availableinformation on the regional distribution of M1 mineralassemblages is insufficient to establish a metamorphicfield gradient for that time, but remnants of granulite-facies mineral assemblages are now known from theHeimefrontfjella, the H.U. Sverdrupfjella and the easternGjelsvikfjella.

Autho
r's
pers
onal
co
py
A. Bisnath et al. / Precambrian Research 150 (2006) 95–121 117
Fig. 7. Schematic diagram of the crustal evolution of western Dronning Maud Land from a Gjelsvikfjella perspective.
The rocks of the Gjelsvikfjella area were over-printed by a second high-grade tectono-metamorphicevent. The peak metamorphic mineral assemblage andfabric forming (S2) minerals are identical to thosein H.U. Sverdrupfjella for which a Pan-African agehas been established (Board et al., 2005). By anal-ogy, the same age for the main tectonic fabric ofthe study area is inferred. Consequently the variousage data obtained in this study on metamorphic zir-con overgrowths are interpreted as reflecting a majorPan-African tectono-thermal overprint between 540 and530 Ma.
An ophiolite complex preserved in the northernShackleton Range of presumably post-Grenvillian age(Talarico et al., 1999) suggests that an ocean separatedthe Kalahari Craton from the East Antarctic Craton(Tessensohn et al., 1999) sometime between 1030 and600 Ma. This ocean was progressively closed by sub-duction (e.g. Tessensohn et al., 1999) with the onset ofcontinental–continental collision at ca. 570 Ma and themain pulse of collision and syn-tectonic intrusions fol-lowed by peak metamorphism between 540 and 530 Ma.Recently published data by Schmadicke and Will (2006)reveal that mafic to ultramafic rocks in the northern

Autho
r's
pers
onal
co
py
118 A. Bisnath et al. / Precambrian Research 150 (2006) 95–121
Shackleton Range experienced eclogite-facies metamor-phism during Pan-African orogeny. A similar scenariois now established also for the Maud Belt, but thereno evidence of juvenile Neoproterozoic crust has so farbeen discovered. Thus, the question of the location ofthe suture between the Kaapvaal-Grunehogna Cratonand the East Antarctic Craton, possibly representing theboundary between East- and West-Gondwana, remainsunresolved.
The penetrative S2 fabric in the Gjelsvikfjella areahas been affected by both the D3 and D4 events, whichproduced large-scale open folds thereby re-orientatingthe pervasive fabric locally. These open folds are inter-preted to be dome structures that have accommodatedthe emplacement of voluminous late- to post-orogenicigneous bodies that occur in the northern and easternGjelsvikfjella.
In central Dronning Maud Land, H.U. Sverdrupfjellaand Gjelsvikfjella, crustal thickening began at approx-imately 570 Ma with a maximum reached at approxi-mately 540 Ma. This was followed by a phase of exten-sion, which was accompanied by diverse syn-tectonic(relative to the extensional phase) magmatism. In centralDronning Maud Land, the syn-tectonic magmatism ischaracterised by A-type granitoids, charnockite and gab-bro which has been dated at 527 ± 5 Ma and interpretedto represent a phase of late-orogenic collapse followedby post-tectonic (512–490 Ma) magmatism (Jacobs etal., 2003c). The latter is particularly evident in theGjelsvikfjella area, where bimodal magmatism, prob-ably induced by partial decompression-melting of theuppermost mantle and lower crust, is indicated by the487 ± 4 Ma Stabben metagabbro and syenite. Furtherre-heating of the crust at that stage is also evidencedby the younger, contemporaneous zircon overgrowthsestablished in this study (Table 9).
7. Conclusions
The U–Pb SHRIMP zircon ages obtained in this studyshow that Gjelsvikfjella was part of a Pan-African oro-genic belt that can be traced to H.U. Sverdrupfjella(Board et al., 2005) in the west and central DronningMaud Land (Jacobs et al., 1998) in the east. Within thisbelt, a ca. 1130 Ma Mesoproterozoic volcanic arc andpossibly remnants of a back-arc fill became reworked,once during continental collision at the end of the Meso-proterozoic (ca. 1070 Ma) and again during Pan-Africanorogeny with a first stage of dynamic recrystallisation atapproximately 565 Ma, peak of metamorphism reachedat 530 Ma and orogenic collapse-induced bimodal mag-matism between 480 and 500 Ma.
Volcanic arc formation in the Maud Belt seems notto be connected with the formation of oceanic islandarcs along the southern margin of the Kaapvaal Cra-ton (Natal sector of Namaqua-Natal Belt), but occurredlater and as consequence of inboard subduction beneaththe Kaapvaal-Grunehogna Craton, with the RitscherflyaSupergroup having been deposited in a back-arc position.Contiguity between the Maud Belt and the Namaqua-Natal Belt was only achieved at the end of the Meso-proterozoic when both formed part of a possibly globalsuture in the amalgamation of a supercontinent.
Similarity in tectonic, kinematic and metamorphichistory between the Maud Belt and the MozambiqueBelt (East African Orogen; e.g. Grunow et al., 1996;Sacchi et al., 1998; Manhica et al., 2001) points to bothhaving formed a contiguous unit at the end of the Neopro-terozoic. No evidence of juvenile Neoproterozoic crusthas been discovered so far in the Maud Belt. This maybe due to the Maud Belt taking a more central posi-tion in the East African Orogen and its continuation intoEast Antarctica relative to the Shackelton Range. Thelatter would have been in a marginal position that wasnever affected by the same extent of crustal thickeningbecause of lateral escape during continent–continent col-lision. The abundance of late to post-tectonic magmaticrocks in the Maud Belt is explained by the intrusionof hot asthenospheric mantle following the delamina-tion of the root of the thickened orogen in the transitionzone between the central and the marginal (southern-most) part of the orogen as suggested by Jacobs et al.(2003b).
Acknowledgements
G. Doyle and C. Jackson are thanked for their fieldsupport and companionship during the Antarctic fieldseasons. E. Grosch is thanked for his assistance in thefield. S. McCourt is thanked for his helpful input andadvice to an earlier version of this manuscript. Criticalcomments from I.C.W. Fitzsimons and an anonymousreviewer improved an earlier version of the manuscript.A constructive review from A.S. Collins helped to shapethe final product. C. Jackson and G. Viola are thankedfor their input into discussions on the structural geologyof the area. M. Waldron assisted with the acquisitionof cathodoluminescence images and A. Spath assistedwith REE analyses on the LA-ICPMS. This project wasfunded by a grant through the South African NationalAntarctic Programme (Department of EnvironmentalAffairs and Tourism) to H.E. Frimmel. Additional fundswere obtained from The Trans-Antarctica Association(TAA) to A. Bisnath.

Autho
r's
pers
onal
co
py
A. Bisnath et al. / Precambrian Research 150 (2006) 95–121 119
Appendix A. Rare earth element concentrations of individual zircon domains
Sample La Ce Pr Nd Sm Eu Gd Tb Dv Ho Er Tm Yb Lu
ABA10A-17rim 1.06 21.81 1.49 13.04 12.32 0.63 55.32 22.05 233.37 78.54 299.64 55.86 457.26 86.10ABA10A-18rim 1.59 15.49 0.86 5.50 7.80 0.46 36.73 13.79 173.70 65.52 300.14 65.30 614.40 120.45ABA10A-19Acore 15.95 198.52 17.25 105.49 43.94 15.35 85.89 25.84 266.50 88.15 349.23 67.49 580.39 107.98ABA10A-19Bcore 18.11 189.94 17.51 99.68 54.25 8.28 137.29 41.19 416.57 137.00 533.53 101.95 864.43 155.98ABA10A-21core 15.71 105.14 7.88 43.56 21.67 4.26 63.01 22.89 280.89 106.86 480.94 103.57 978.22 195.95ABA10A-23Arim 1.37 11.91 0.84 7.16 11.64 0.20 67.52 29.90 365.62 138.29 611.40 125.37 1069.03 202.83ABA10A-23Brim 0.85 19.27 1.05 6.60 8.43 0.39 48.75 21.72 274.41 106.19 480.43 100.15 904.27 162.62ABA10B-2core 1.80 6.58 0.67 3.10 7.57 0.22 45.52 20.32 252.49 96.56 432.61 89.80 776.89 150.28ABA10B-3core 2.22 9.43 0.76 5.29 9.20 0.22 53.34 23.22 291.10 109.11 470.29 95.35 852.53 159.61ABA81-36rim 21.71 120.27 9.25 61.69 22.32 4.12 35.68 7.71 73.85 21.20 103.47 25.01 279.39 74.41ABA81-37rim 18.30 130.04 8.63 52.69 20.89 5.26 36.12 8.03 71.40 24.79 114.14 28.19 254.08 56.85ABA81-43Acore 38.64 220.38 19.34 109.60 38.71 9.64 64.40 11.30 91.49 28.25 112.10 22.54 222.36 49.98ABA81-43Bcore 43.25 193.69 19.83 114.54 40.97 8.95 43.29 8.84 69.91 22.95 107.25 25.52 298.29 74.96ABA81-44rim 17.25 143.17 11.04 64.40 31.59 6.70 44.53 10.60 99.23 31.76 137.69 31.60 324.40 70.88WBJS#16core 8.81 59.56 3.61 13.94 4.28 0.92 13.93 3.97 39.69 15.48 76.84 15.89 174.07 40.08WBJS#16rim 1.44 7.09 0.59 3.31 1.19 0.23 2.91 0.62 6.52 3.18 17.15 4.40 56.02 15.88
References
Arima, M., Tani, K., Kawate, S., Johnston, S.T., 2001. Geochemicalcharacteristics and tectonic setting of metamorphosed rocks in theTugela terrane, Natal belt, South Africa. Memoirs of National Insti-tute of Polar Research, vol. 55. pp. 1–39.
Arndt, N.T., Todt, W., Chauvel, C., Tapfer, M., Weber, K., 1991. U–Pbzircon age and Nd isotopic composition of granitoids, charnokitesand supracrustal rocks from Heimefrontfjella, Antarctica. Geol.Rundschau 80, 759–777.
Bauer, W., Thomas, R.J., Jacobs, J., 2003a. Proterozoic-Cambrian his-tory of Dronning Maud Land in the context of Gondwana assembly.In: Yoshida, M., Windley, B.F., Dasgupta, S. (Eds.), ProterozoicEast Gondwana: Supercontinent Assembly, Breakup. GeologicalSociety London, Special Publication, pp. 206, 247–269.
Bauer, W., Jacobs, J., Fanning, C.M., Schmidt, R., 2003b. Late Meso-proterozoic arc and back-arc volcanism in the Heimefrontfjella(East Antarctica) and implications for the Palaeogeography at thesoutheastern margin of the Kaapvaal-Grunehogna Craton. Gond-wana Res. 6, 449–465.
Basson, I.J., Perritt, S., Watkeys, M.K., Menzies, A.H., 2004. Geo-chemical correlation between metasediments of the MfongosiGroup of the Natal Sector of the Namaqua-Natal MeatmorphicProvince, South Africa and Ahlmannryggen Group of the Grune-hogna Province, Antarctica. Gondwana Res. 7, 57–73.
Bisnath, A., Frimmel, H.E., 2005. Metamorphic evolution of the MaudBelt: P–T–t path for high-grade gneisses in Gjelsvikfjella, Dron-ning Maud Land, East Antarctica. J. Afr. Earth Sci. 43, 505–524.
Board, W.S., Frimmel, H.E., Armstrong, R.A., 2005. Pan-Africantectonism in the western Maud Belt: P–T–t path for high-gradegneisses in the H.U. Sverdrupfjella, East Antarctica. J. Petrol. 46,671–699.
Collins, A.S., Pisarevsky, S.A., 2005. Amalgamating eastern Gond-wana: the evolution of the Cirum-Indian Orogens. Earth Sci. Rev.71, 229–270.
Compston, W., Williams, I.S., Kirschvink, J.L., Zhang, Z., Ma, G.,1992. Zircon U–Pb ages for the early Cambrian time-scale. J. Geol.Soc. Lond. 149, 171–184.
Cornell, D.H., Thomas, R.J., Bowring, S.A., Armstrong, R.A.,Grantham, G.H., 1996. Protolith interpretation in metamorphicterranes: a back-arc environment with Besshi-type base metalpotential for the Quha formation, Natal Province, South Africa.Precambrian Res. 77, 243–271.
Dalziel, I.W.D., 1997. Neoproterozoic-Palaeozoic geography and tec-tonics: review, hypothesis and environmental speculation. Geol.Soc. Am. Bull. 109, 16–42.
Frimmel, H.E., 2004. Formation of a late Mesoproterozoic supercon-tinent: the South Africa–East Antarctica connection. In: Eriksson,P.G., Altermann, W., Nelson, D.R., Mueller, W.U., Catuneanu, O.(Eds.), The Precambrian Earth: Tempos and Events. Elsevier, Ams-terdam, pp. 240–255.
Gose, W.A., Dalziel, I.W.D., Helper, M.A., Hutson, F., Connelly, J.,1997. Paleomagnetic data and U–Pb isotopic age determinationsfrom Coats Land, Antarctica: implications for late Proterozoicreconstructions. J. Geophys. Res. 102 (B4), 7887–7902.
Grantham, G.H., Jackson, C., Moyes, A.B., Groenewald, P.B., Harris,P.D., Ferrar, G., Krynauw, J.R., 1995. The tectonothermal evolutionof the Kirwanveggen–H.U. Sverdrupfjella area, Dronning MaudLand, Antarctica. Precambrian Res. 75, 209–229.
Groenewald, P.B., Grantham, G.H., Watkeys, M.K., 1991. Geologicalevidence for a Proterozoic to Mesozoic link between southeasternAfrica and Dronning Maud Land, Antarctica. J. Geol. Soc. Lond.148, 1115–1123.
Groenewald, P.B., Hunter, D.R., 1991. Granulites of the northernH.U. Sverdrupfjella, western Dronning Maud Land: metamorphichistory from garnet-pyroxene assemblages, coronas and hydra-tion reactions. In: Thomson, M.R.A., Crame, J.A., Thomson, J.W.(Eds.), Geological Evolution of Antarctica. Cambridge UniversityPress, Cambridge, pp. 61–66.
Groenewald, P.B., Moyes, A.B., Grantham, G.H., Krynauw, J.R., 1995.East Antarctic crustal evolution: geological constraints and mod-elling in western Dronning Maud Land. Precambrian Res. 75,231–250.
Grosch, E.G., Bisnath, A., Frimmel, H.E., Board, W.S., 2004. Geo-chemistry and Tectoning setting of Proterozoic Mafic Rocks inWestern Dronning Maud Land, Antarctica. Geoscience Africa

Autho
r's
pers
onal
co
py
120 A. Bisnath et al. / Precambrian Research 150 (2006) 95–121
2004. Abstract Volume, University of Witwatersrand, Johannes-burg, South Africa, pp. 229–230.
Grunow, A., Henson, R., Wilson, T., 1996. Were Aspects of thePan-African deformation linked to Iapetus opening? Geology 24,1063–1066.
Hanson, R.E., Martin, M.W., Bowring, S.A., Munyanyiwa, H., 1998.U–Pb zircon age for the Umkondo dolerites, eastern Zimbabwe:1.1 Ga large igneous province in southern Africa-East Antarcticaand possible Rodinia correlations. Geology 26, 1143–1146.
Hanson, R.E., Crowley, J.L., Bowring, S.A., Ramezani, J., Cose, W.A.,Dalziel, I.W.D., Pancake, J.A., Seidel, E.K., Blenkinsop, Thomas,G., Mukwakwami, J., 2004. Coeval large-scale magmatism in theKalahari and Laurentian Cratons during Rodinia assembly. Science304, 1126–1129.
Harris, P.D., Moyes, A.B., Fanning, C.M., Armstrong, R.A., 1995.Zircon ion microprobe results from the Maudheim high-gradegneiss terrane, western Dronning Maud Land, Antarctica: Cen-tennial Geocongress (1995). Johannesburg, pp. 240–243.
Harris, P.D., 1999. The geological evolution of Neumayerskarvet in theNorthern Kirwanveggen, Western Dronning Maud Land, Antarc-tica. Unpublished Ph.D. thesis, Rand Afrikaans University, Johan-nesburg.
Hoffman, P.F., 1991. Did the breakout of Laurentia turn Gondwanainside-out? Science 252, 1409–1412.
Jackson, C., 1999. Characterization of Mesoproterozoic to Palaeozoiccrustal evolution of western Dronning Maud Land. Study 3: Defor-mational history and thermochronology of the central Kirwanveg-gen. Unpublished report, Department of Environmental Affairs andTourism, Pretoria, p. 80.
Jacobs, J., Thomas, R.J., Weber, K., 1993. Accretion and indentationtectonics at the southern edge of the Kaapvaal craton during theKibaran (Grenville orogen). Geology 21, 203–206.
Jacobs, J., Thomas, R.J., 1994. Oblique collision at about 1.1 Ga alongthe southern margin of the Kaapvaal continent, south-east Africa.Geol. Rundschau 83, 322–333.
Jacobs, J., Bauer, W., Spaeth, G., Thomas, R.J., Weber, K., 1996.Lithology and structure of the Grenville-aged (1.1 Ga) basementof Heimefrontjella (East Antarctica). Geol. Rundschau 85, 800–821.
Jacobs, J., Fanning, C.M., Henjes-Kunst, F., Olesch, M., Paech, H.-J.,1998. Continuation of the Mozambique Belt into East Antarc-tica: Grenville-age metamorphism and polyphase Pan-Africanhigh-grade events in central Dronning Maud Land. J. Geol. 106,385–406.
Jacobs, J., Hansen, B.T., Henjes-Kunst, F., Thomas, R.J., Bauer, W.,Weber, K., Armstrong, R.A., Cornell, D.H., 1999. New age con-straints on Proterozoic/lower Palaeozoic evolution of Heimfrontf-jella, East Antarctica, and its bearing on Rodinia/Gondwana cor-relations. Terra Antarctica 6, 377–389.
Jacobs, J., Fanning, C.M., Bauer, W., 2003a. Timing of Grenville-agevs Pan-African medium- to high-grade metamorphism in west-ern Dronning Maud Land (East Antarctica) and significance forcorrelations in Rodinia and Gondwana. Precambrian Res. 125,1–20.
Jacobs, J., Bauer, W., Fanning, C.M., 2003b. Late Neoprotero-zoic/Early Palaeozoic events in central Dronning Maud Land andsignificance for the southern extension of the East African Orogeninto East Antarctica. Precambrian Res. 126, 27–53.
Jacobs, J., Klemd, R., Fanning, C.M., Bauer, W., Colombo, F., 2003c.Extensional collapse of the late Neoproterozoic-early PalaeozoicEast African-Antarctic Orogen in central Dronning maud Land,East Antarctica. In: Yoshida, M., Windley, B.F., Dasgupta, S.
(Eds.), Proterozoic East Gondwana: Supercontinent Assembly andBreakup, Geological Society, London. Special Publication, pp.206, 271–285.
Jacobs, J., Bauer, W., Fanning, C.M., 2003d. New age constraintsfor Grenvillian age metamorphism in western central DronningMaud Land (East Antarctica), and implications for the palaeogra-phy of Kalahari in Rodinia. Int. J. Earth Sci. (Geol. Rundschau)92, 301–315.
Johnston, S.T., Armstrong, R., Heaman, L., McCourt, S., Mitchell, A.,Bisnath, A., Arima, M., 2001. Preliminary U–Pb geochronologyof the Tugela terrane, Natal belt, eastern South Africa. Memoirs ofNational Institute of Polar Research, vol. 55. pp. 40–58.
Krynauw, J.R., 1996. A review of the geology of east Antarctica, withspecial reference to the c. 1000 Ma and c. 500 Ma events. TerraAntarctica 3, 77–89.
Ludwig, K.R., 1999. User’s Manual for Isoplot/Ex, Version 2.10,A Geochronological Toolkit for Microsoft Excel. BerkeleyGeochronology Center Special Publication, Berkley, USA.
Ludwig, K.R., 2000. SQUID 1.00, User’s Manual. BerkeleyGeochronology Center Special Publication, Berkley, USA.
Manhica, A.S.T.D., Grantham, G.H., Armstrong, R.A., Guise, P.G.,Kruger, F.J., 2001. Polyphase deformation and metamorphism atthe Kalahari Craton-Mozambique Belt boundary. In: Miller, J.A.,Holdsworth, R.E., Buick, I.S., Hand, M. (Eds.), Continental Reac-tivation and Reworking. Geology Society of London, pp. 184,303–321.
Meert, J.G., 2003. A synopsis of events related to the assembly ofEastern Gondwana. Tectonophysics 362, 1–40.
Moyes, A.B., Krynauw, J.R., Barton, J.M., 1995. The age of theRitscherflya Supergroup and Borgmassivet intrusions, DronningMaud Land (Antarctica). Antarctic Sci. 7, 87–97.
Moyes, A.B., Groenewald, P.B., 1996. Isotopic constraints on Pan-African metamorphism in Dronning Maud Land, Antarctica.Chem. Geol. 129, 247–256.
Ohta, Y., Tørudbakken, B.O., 1985. Geology of the Gjelsvikfjella andwestern Muhlig-Hoffmannfjella, western Dronning Maud Land,East Antarctica. In: Orheim, O. (Ed.), Report of Norwegian Antarc-tic Research Expedition (NARE 1984/85). Norwegian Polar Insti-tute Report Series, Oslo, pp. 35–41.
Ohta, Y. (Ed.), 1999. Nature Environment Map, Dronning Maud Land,Gjelsvikfjella and western Muhlig-Hofmannfjella 1:100,000.Norsk Polarinst. TEMAKART, Nr. 24, 1999.
Paces, J.B., Miller, J.D., 1993. Precise U–Pb ages of DuluthComplex and related mafic intrusions, Northeastern Minnesota:geochronological insights to physical, petrogenic, and paleomag-netic and tectonomagnetic processes associated with the 1.1 Gamid-continent rift system. J. Geophys. Res. 98B, 13997–14013.
Paulsson, O., Austrheim, H., 2003. A geochronological and geo-chemical study of rocks from Gjelsvikfjella, Dronning MaudLand, Antarctica-implications for Mesoproterzoic correlations andassembly of Gondwana. Precambrian Res. 125, 113–138.
Raith, J.G., Cornell, D.H., Frimmel, H.E., de Beer, C.H., 2003. Newinsights into the geology of the Namaqua Tectonic Province, SouthAfrica, from ion probe dating of detrital and metamorphic zircon.J. Geol. 111, 347–366.
Ramsay, J.G., 1967. Folding and Fracturing of Rocks. McGraw-Hill,New York, p. 567.
Reeves, C., de Wit, M.J., 2000. Making ends meet in Gondwana:retracing the transforms of the Indian Ocean and reconnecting con-tinental shear zones. Terra Nova 12, 272–280.
Robb, L.J., Armstrong, R.A., Waters, D.J., 1999. The history ofgranulite-facies metamorphism and crustal growth from single zir-

Autho
r's
pers
onal
co
py
A. Bisnath et al. / Precambrian Research 150 (2006) 95–121 121
con U–Pb geochronology: Namaqualand, South Africa. J. Petrol.40, 1747–1770.
Sacchi, R., Cadoppi, P., Costa, M., 1998. The relationship betweenthe Lurio Belt and the Mozambique. In: Almond, J., Anderson, J.,Booth, P., Chinsamy-Turan, A., Cole, D., DeWit, M.J., Rubridge,B., Smith, R., van Bever Donker, J., Storey, B.C. (Eds.), Gond-wana 10: Event Stratigraphy of Gondwana (abstracts), 28th Juneto 5th July 1998. Cape Town, Journal of African Earth Science. 27,165.
Schmadicke, E., Will, T.M., 2006. First evidence for eclogite faciesmetamorphism in the Shackleton Range, Antarctica: trace ofsuture between East and West Gondwana. Geology 34, 133–136.
Shelley, D., 1983. Igneous and Metamorphic Rocks under theMicroscope: Classification, Texture, Microstructures and MineralPreferred-Orientation. Chapman and Hall, London, p. 445.
Sun, S., McDonough, W.F., 1989. Chemical and isotopic systematics ofocean basalts: implications for mantle composition and processes.In: Saunders, A.D., Norry, M.J. (Eds.), Magmatism in the OceanBasins. Geological Society London, London, pp. 313–345.
Talarico, F., Kleinschmidt, G., Henjes-Kunt, F., 1999. An ophio-lite complex in the northern Shackleton range, Antarctica. TerraAntarctica 6, 317–325.
Tera, F., Wasserburg, G., 1972. U–Th–Pb systematics in three Apollo14 basalts and the problem of initial Pb in lunar rocks. Earth Planet.Sci. Lett. 14, 281–304.
Tessensohn, F., Kleinschimdt, G., Talarico, F., Buggisch, W., Brommer,A., Henjes-Kunst, F., Kroner, U., Millar, I.L., Zeh, A., 1999. Ross-age amalgamation of East and West Gondwana: evidence from theShackleton Range, Antarctica. Terra Antarctica 6, 317–325.
Thomas, R.J., Cornell, D.H., Armstrong, R.A., 1999. Provenance ageand metamorphic history of the Quha Formation, Natal Metamor-phic Province: a U–Th–Pb zircon SHRIMP study. S. Afr. J. Geol.102, 83–88.
Tingey, R.J., 1991. The regional geology of Archaean and Protero-zoic rocks in Antarctica. In: Tingey, R.J. (Ed.), The Geology ofAntarctica. Oxford University Press, Oxford, pp. 1–73.
Wingate, M.T.D., Pirajno, F., Morris, P.A., 2004. The Warakurna largeigneous province: a new Mesoproterozoic large igneous provincein west-central Australia. Geology 32, 105–108.
Williams, I.S., 1998. U–Th–Pb geochronology by ion microprobe. In:McKibben, M.A., Shanks III, W.C., Ridley, W.I. (Eds.), Applica-tions of Microanalytical Techniques to Understanding Mineraliz-ing Processes. Reviews in Economic Geology. 7, 1–35.
Williams, I.S., Claesson, S., 1987. Isotopic evidence for the Precam-brian provenance and Caledonian metamorphism of high gradeparagneisses from the Seve nappes, Scandanavian Caledonides.II. Ion microprobe zircon U–Th–Pb. Contrib. Mineral. Petrol. 97,205–217.
Wolmarans, L.G., Kent, L.E., 1982. Geological investigations in West-ern Dronning Maud Land, Antarctica—a synthesis. S. Afr. J.Antarctic Res. 2, 93.


