Embed Size (px)
Citation preview
Sensors 2008, 8, 1252-1277
sensors ISSN 1424-8220 © 2008 by MDPI
www.mdpi.org/sensors Full Research Paper
Techno-Economic Analysis of Solar Water Heating Systems in Turkey
Can Ertekin 1,*, Recep Kulcu 2 and Fatih Evrendilek 3 1 Department of Agricultural Machinery, Akdeniz University, Faculty of Agriculture, 07070,
Antalya, Turkey. E-mail: [email protected] 2 Department of Agricultural Machinery, Suleyman Demirel University, Faculty of Agriculture,
32260, Cunur, Isparta, Turkey. E-mail: [email protected] 3 Department of Environmental Engineering, Abant Izzet Baysal University, Faculty of Engineering
& Architecture, 14280, Bolu, Turkey. E-mail: [email protected] * Author to whom correspondence should be addressed. Received: 24 January 2008 / Accepted: 19 February 2008 / Published: 25 February 2008
Abstract: In this study, solar water heater was investigated using meteorological and geographical data of 129 sites over Turkey. Three different collector types were compared in terms of absorber material (copper, galvanized sheet and selective absorber). Energy requirement for water heating, collector performances, and economical indicators were calculated with formulations using observed data. Results showed that selective absorbers were most appropriate in terms of coverage rate of energy requirement for water-heating all over Turkey. The prices of selective, copper and galvanized absorber type’s heating systems in Turkey were 740.49, 615.69 and 490.89 USD, respectively. While payback periods (PBPs) of the galvanized absorber were lower, net present values (NPVs) of the selective absorber were higher than the rest. Copper absorber type collectors did not appear to be appropriate based on economical indicators.
Keywords: Solar energy, Solar water heater, Energy conservation.
1. Introduction
Due to the increasing prices of the primary energy resources and their associated serious environmental issues, the use of renewable resources, especially, the solar energy is increasingly on
Sensors 2008, 8
1253
demand in both developing and developed countries. The most common way of using solar energy is through hot water by solar water heaters. Hot water is required for domestic and industrial uses such as houses, hotels, hospitals, and mass-production and service industries. Solar water heaters in various Indian stations were reported to provide 100 L of hot water at an average temperature of 50-70 oC, which can be retained to 40-60 oC until used next day morning [1]. Although solar collectors have a history extending back to about 120 years ago, the requirements of many diverse applications are still continued to be more effectively satisfied with advantages of new materials and manufacturing processes. The total solar collector area installed worldwide is now estimated to be over 58 km2 [2]. For example in Lebanon, 70% of residential houses use electricity to heat their water, 25% use diesel, and 5% use gas, wood, solar and other energy sources [3,4]. The share of solar water heaters in 2002 was 1.7% of total energy demand of Jordan [5]. About 100 km2 of solar collector are expected to be installed in Europe by the year 2010 [6]. The fact that solar water heaters are affordable and a cheap substitute for (non-)commercial fossil fuel-burning renders them increasingly popular.
Turkey receives a high level of solar radiation throughout the year with a mean daily solar energy intensity of 12.96 MJ m-2 d-1 and sunshine duration of about 7.2 h [7]. The solar potential unconstrained by technical, economic or environmental requirements of Turkey is estimated as 88 million tonnes oil equivalent (toe) per year 40% of which is considered economically usable. Three-fourths (24.4 million toe per year) of the economically usable potential is considered suitable for thermal use, with the reminder (8.8 million toe per year) for electricity production [8]. The household energy consumption of Turkey involves electricity, coal, natural gas, petroleum and renewable energy sources. The biggest share comes from wood, but the share of solar energy was only about 1.1% in 2002 [9]. The share of household sector in consumption was 31% in 2002 [9], lower than 40% of the developed countries [10]. Increasing this proportion could decrease the present total fossil fuel-related CO2 emissions of 61.7 Mt (mega ton) carbon (C), and the emission rate of 0.87 t C per capita [11]. In Beirut, a 2.5 m2 flat plate glazed collector with 114 L storage capacity placed at a slope of 33.8o was reported to result in a greenhouse gas reduction of 1.42 t CO2 per year [3].
In Turkey, 11 million m2 of collector surface area (an equivalent of 0.15 m2 collector surface per capita) were installed with a heat output of 0.4 Mtoe in 2005 [12]. This rate was 0.23 m2 for Austria in 2002, 0.28 m2 for Greece in 2002 [13], and 0.82 m2 for in Cyprus in 2003 [14]. Given the present Turkish manufacturing capacity for solar water heater of 1 million m2 per year, the growth in this market is expected to continue, thus increasing the quantity and quality of collectors installed [15]. For example, the installation rate by households was about 4.32% in Taiwan in 2005 [16]. Average annual installation rate between 1995 and 2000 was 6.6% for Spain, 5.2% for Germany, 5.0% for France, 4.0% for Italy, 3.4% for Netherlands, 1.8% for UK and 0.2% for Greece [45].
The most commonly used solar water heating system for domestic needs is through natural circulation type that consists of a flat plate solar collector connected to an insulated storage tank. The sun’s rays pass through the glass and are trapped in the space between the cover and plate or are absorbed by the black body. The circulating water through a conduit system located between the cover and absorber plate is heated and then carried to the storage tank. Flat plate collectors are most suitable when a temperature below 100 oC is required. These are simple to assemble; low cost; simple in design and fabrication; durable; do not require sun-tracking; can work on cloudy days; and require minimum maintenance [17,18]. The average life of typical solar water heating system is generally assumed to be
Sensors 2008, 8
1254
ca. 20 years. Utilization of renewable energy for water heating can increase electrical reserve margins, raise the system load factor, improve load following capabilities and reduce the need for capacity expansion. In addition, using renewable energy sources provides clear opportunities for reductions in CO2, CO, nitrogen oxide, sulfure oxide, particulate matter and volatile organic compounds during power generation [19,20]. When four alternative water heating technologies (standard electric water heating, heat pump water heater, solar hot water system and heat pump desuperheaters) were compared, the solar hot water systems were found to be the most efficient and to have the greatest reduction in electric peak demand [21,22].
The performance of a solar water heater system is highly dependent on its orientation, optical and geometric properties, macro and microclimatic conditions, geographical position, operational parameters, and the period of use [15,18,23-26]. In this study, a techno-economic assessment of the most common solar water heating systems in Turkey was carried out quantifying the rate of solar energy that is gained, required and used, and payback period (PBP) and net present value (NPV) in terms of liquid petroleum gas (LPG) and electricity savings.
2. Design of Solar Water Heaters
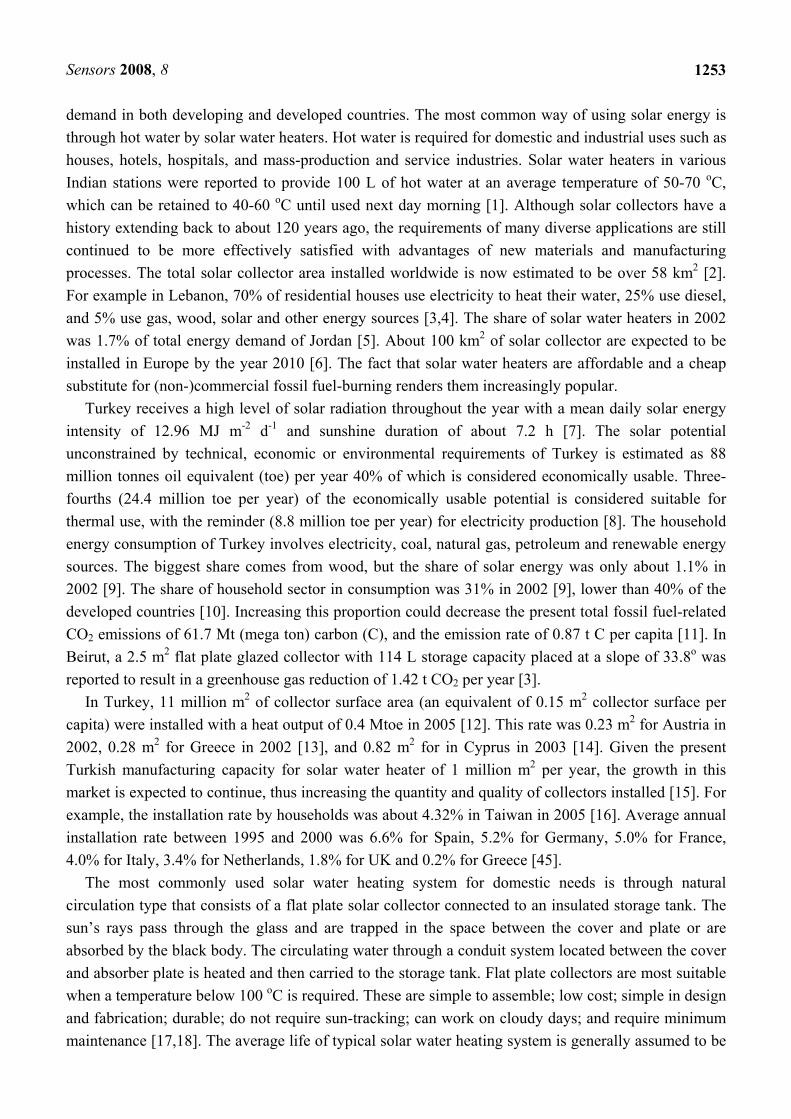
The design of the flat plate collector is shown in Fig. 1. The absorber area of the flat plate collector was 1.82 m2, and two heaters were used in the subsequent calculations.
Figure 1. Components of solar water heating system.
3. Determination of Solar Collector Performance
In this study, meteorological and geographical data of 129 sites over Turkey were used in the calculations. First, the monthly average daily solar radiation on a horizontal surface was converted to hourly solar radiation on a tilted surface.
Cold water storage
Hot water storage
Sensors 2008, 8
1255
The monthly average clearness index (KT) is the ratio of monthly average daily solar radiation on a horizontal surface (H) to monthly average daily extraterrestrial radiation on a horizontal surface (Ho). Ho can be calculated using the following equation [27]:
⎥⎦
⎤⎢⎣
⎡⎟⎠⎞
⎜⎝⎛+⎟
⎠⎞
⎜⎝⎛= δλπδλπ
sinsin180
sincoscos240 ssgs wwfIH , (1)
where Igs is the solar constant (1367 W m-2); f the eccentricity correction factor; λ latitude; δ the solar declination; and ws the mean sunset hour angle for a given month. The eccentricity correction factor, solar declination and sunset hour angle can be estimated thus [28]:
⎟⎠⎞
⎜⎝⎛+=
365360cos033.01 nf , (2)
[ ]23.45 360(284 ) / 365sin nδ = + , (3)
( )1
s .w cos tg tgλ δ−= − , (4)
where n is the number of the day of the year starting from the first of January. In order to determine monthly average daily diffuse solar radiation over Turkey, the following correlation was used [29]:
2 3 4
d
o o o o
1.6932 8.22262 25.5532 37.807 19.8178H H H H HH H H H H
⎛ ⎞ ⎛ ⎞ ⎛ ⎞ ⎛ ⎞= − + − +⎜ ⎟ ⎜ ⎟ ⎜ ⎟ ⎜ ⎟
⎝ ⎠ ⎝ ⎠ ⎝ ⎠ ⎝ ⎠,
(5)
The ratio of hourly total to daily global radiation was calculated as a function of sunshine duration
thus [30 from 28]:
HI
tr = , (6)
Based on sunshine duration and daily global radiation, the hourly global radiation can be estimated.
In the curves shown by Liu and Jordan (1960), the hours are designated by the time for the midpoint of the hour, and days are assumed to be symmetrical about solar noon. The curves were represented by the following equation [31]:
( )⎭⎬⎫
⎩⎨⎧
−+⎥⎦
⎤⎢⎣
⎡= ψ
ππ 1290.4 so
t whCos
Sr ,
(7)
⎥⎥⎦
⎤
⎢⎢⎣
⎡⎟⎟⎠
⎞⎜⎜⎝
⎛−−=Ψ
2
14expsw
h,
(8)
Sensors 2008, 8
1256
where h is hour angle changing 15o per hour, with morning being negative and afternoon being positive, and So is maximum possible sunshine duration calculated as follows [28]:
soS ω152
= , (9)
The ratio of hourly diffuse to daily diffuse radiation can be estimated as follows [28]:
oHoI
dHdI
dr == , (10)
The curves based on the assumption of Liu and Jordan (1960) that Id/Hd is the same as Io/Ho are
shown by the following equation [28]:
swCosswswSin
swCoshCosdr
18024 ππ
−
−= , (11)
The beam radiation can be then calculated as follows [28]:
dIIbI −= , (12) The total solar radiation on the tilted surface was calculated for an hour as the sum of beam,
isotropic diffuse and solar radiation diffusely reflected from the ground as follows [28,32]:
( )g
CosICosdIbRbITI ρββ
2)1(
21 −
++
+= , (13)
where ρg is ground reflectance (equal to 0.2). The geometric factor (Rb) can be calculated as follows [28]:
( )
δλδλδβλδβλ
SinSinCoshCosCosSinCoshCosCos
bR+
−+−=
sin)( , (14)
Second, the useful energy output of a collector, the difference between the absorbed solar radiation
and the thermal losses, can be calculated as follows [28,33,34]:
( ) ( )[ ]aTifTLUTIrFcAuQ −−= ,τα , (15)
where Ac is collector area, Fr is heat removal factor, (τα) is transmittance-absorptance, UL is overall heat loss coefficient, Tf,i is fluid inlet temperature and Ta is ambient air temperature.
The most common three solar heater types according to their absorber plates were taken into consideration in this study and included (1) galvanized black painted iron sheet, (2) copper painted
Sensors 2008, 8
1257
black sheet and (3) selective black surface. The heat removal factor could be calculated as shown below [28]:
⎥⎥⎥⎥⎥
⎦
⎤
⎢⎢⎢⎢⎢
⎣
⎡
⎟⎟⎠
⎞⎜⎜⎝
⎛−
−=pCG
ıFLU
LUpCG
rF exp1 , (16)
where G is fluid flow rate per unit collector area, Cp is specific heat at constant pressure, F′’ is collector efficiency factor, and the latter can be calculated as follows [28]:
( )[ ] ⎪⎭
⎪⎬⎫
⎪⎩
⎪⎨⎧
++−+
=
ifhDbCFDWDLUW
LUıF
,
111
1
π
, (17)
where W is the distance between the tubes, D is the tube diameter, F is the fin efficiency factor, Cb is the bond conductance, and hf,i is the heat transfer coefficient between the fluid and the tube wall. The term “1/Cb” was assumed to be equal to zero in the calculations since minimum value was 0.1 or lower [34].
The fin efficiency factor could be calculated as follows [28]:
( )
( )2
2tanh
DWm
DWm
F−
⎥⎦⎤
⎢⎣⎡ −
= , (18)
where
2
1
⎟⎟⎠
⎞⎜⎜⎝
⎛=
pp
L
kU
mδ
, (19)
and k p is the conductivity, and δp is the thickness of the absorber plate.
The heat transfer coefficient between the fluid and the tube wall (hf,I) can be calculated as follows [34,35]:
DkNu
ifh =, , (20)
where Nusselt number calculated from ( ) ( ) 31
31
PrRe86.1 LDNu = for 2300Re ≤ and 3
1Pr8.0Re027.0=Nu for
2300Re > . The Re is Reynolds, and Pr is Prandantl number in the equations. The transmittance-absorptance was calculated as follows [34,35]:
Sensors 2008, 8
1258
( ) ( ) dρατατα−−
=11
, (21)
where τ is transmission of the cover, α is the absorptance of the absorber plate, and ρd is the reflectance of the glass cover (equal to 0.16).
The overall heat loss coefficient is equal to the sum of top, back and edge heat losses as shown below [33,34]:
eUbUtULU ++= , (22)
These top, back and edge losses can be calculated as follows [35,36 from 37]:
( )( )
( )
( )[ ] Ng
fNpNp
aTpTaTpT
wh
fNaTpT
pT
NtU
−⎟⎟
⎠
⎞
⎜⎜
⎝
⎛ −++−−+
⎟⎠⎞⎜
⎝⎛ ++
+
−
⎪⎪⎪
⎭
⎪⎪⎪
⎬
⎫
⎪⎪⎪
⎩
⎪⎪⎪
⎨
⎧
+
⎥⎥⎦
⎤
⎢⎢⎣
⎡
+
−=
εεε
σ
12110425.0
22
1
131.0
344,
(23)
bLbk
bU = , (24)
8236.1cAeLhcek
eU = , (25)
where 5, += ifp TT , N is number of cover (equal to one in this study),
( )Nwhxwhf 058.012410504.01 +⎟⎠⎞⎜
⎝⎛ −+−= , rw Vh 8.37.5 += , Vr is wind speed (m/s), σ is Stefan-Boltzmann
constant, εp is emissivity of absorber plate, εg is emissivity of glass cover, kb is conductivity of back insulation, Lb is thickness of back insulation, ke is conductivity of edge insulation, Le is thickness of edge insulation, c is perimeter of the collector, and h is height of the collector.
The daily useful energy output of a solar collector for tilt angles of 0 to 90o with one degree intervals was calculated for 129 sites in Turkey. The sum of the daily values for each tilt angle was attained as useful energy gained annually by the collector. The optimum tilt angles were then determined by which receives the highest energy over the year for the three types of solar water heaters.
Third, the energy requirement to heat water to 55 oC for consumption was calculated as follows [38]:
TpCwGssQ Δ= , (26)
where Gw is amount of water (L d-1) (equal to 100 L for one family), ΔT is temperature differences between tap water temperature and required water temperature (equal to 55 oC) [39,40].
Sensors 2008, 8
1259
Finally, the PBPs were calculated by considering savings equivalent in liquid petroleum gas (LPG) and electricity. The calorific values and thermal efficiencies were taken from [41]. The PBPs were estimated based on the relationship shown below [18]:
( )
( )( )
( )( )
( )⎥⎦⎤
⎢⎣⎡
++
⎭⎬⎫
⎩⎨⎧ −⎥⎦
⎤⎢⎣⎡
−−−⎥⎦
⎤⎢⎣⎡
−−
=
ba
CbaME
baME
N
11log
loglog,
(27)
where a is interest rate equal to 0.19, M is maintenance equal to 0.035 and b is inflation rate equal to 0.09 for Turkey [42,43].
The net present value (NPV) was calculated as follows [43]:
( )∑= +
=nn
t ti
CFNPV0 1
, (28)
where CF is cash flow at a given year t, i is discount rate, t is year and n is end of process.
4. Mapping Spatial Variability in Energy Requirements and Coverage Rates
Maps of national energy requirements for water-heating, and coverage rates according to the selective, copper and galvanized absorber plates were created with a grid resolution of 500 m x 500 m from the 129 meteorological stations using the spatial interpolation method of universal kriging in ArcGIS 9.1 [50]. The implementation of kriging necessitates the calculation of a semi-variogram model that defines variance as function of distance, and direction as follows [51]:
[ ]2( )
1
1( ) ( ) ( )2 ( )
N h
k kk
h z x z x hN h
γ=
= − +∑ , (29)
where γ(h) is the semi-variance of variable z as a function of both lag distance or separation distance (h); N(h) is the number of observation pairs of points separated by h used in each summation; and z(xk) is the random variable at location xk.
The degree of spatial auto-correlation for energy requirements and coverage rates was determined using Moran’s Index (I). In the universal kriging, detrending was implemented due to the presence of an overriding drift by the removal of first order trends from all the semi-variogram models and by adding back before predictions were made. In the semi-variogram models, the range (a) corresponds to the distance at which the semi-variogram reaches its asymptote and beyond which there is little or no spatial dependence. The sill defines the asymptotic height of the variogram and consists of nugget (c0) and partial sill (c). The partial sill and the nugget are the spatially correlated component of the variance as a measure of the strength of the spatial dependence and the spatially uncorrelated component of the variance and also what is spatially correlated below the level of the minimum lag size as a measure of the inherent or non-spatial variation, respectively.
Sensors 2008, 8
1260
5. Results and Discussion
Moran’s high I values for energy requirement (kWh year-1) (0.2), coverage rates (%) by the selective (0.15), copper (0.13) and galvanized (0.12) absorber plates revealed the presence of a strong spatial auto-correlation for a robust geostatistical interpolation (P < 0.01). The anisotropic spherical semi-variogram models of universal kriging were implemented to map spatial variability in energy requirement and coverage rates at the national scale. Parameters and cross-validation R2 values for spatially interpolated surface maps are presented in Table 1.
Table 1. Anisotropic spherical semi-variogram model parameters and cross- validation R2 values of universal kriging for mapping spatial variability over Turkey.
Energy
requirement for water-heating (kWh year-1)
Coverage
rate by selective absorber
plate (%)
Coverage rate by copper absorber
plate (%)
Coverage
rate by
galvanized absorber
plate (%)
Range (a) 5.42 6.51 5.09 4.26 Minor range 3.05 2.14 1.26 0.71 Partial sill (c) 8477.6 8.52 15.98 21.67 Nugget effect (c0) 2214.2 21.45 37.15 32.06 Lag size 0.51 0.55 0.43 0.36 Number of lags 12 12 12 12 Neighbors to include (at least)
9(5) 9(5) 9(5) 9(5)
Cross-validation R2 (%)
67.03 49.86 46.29 45.12
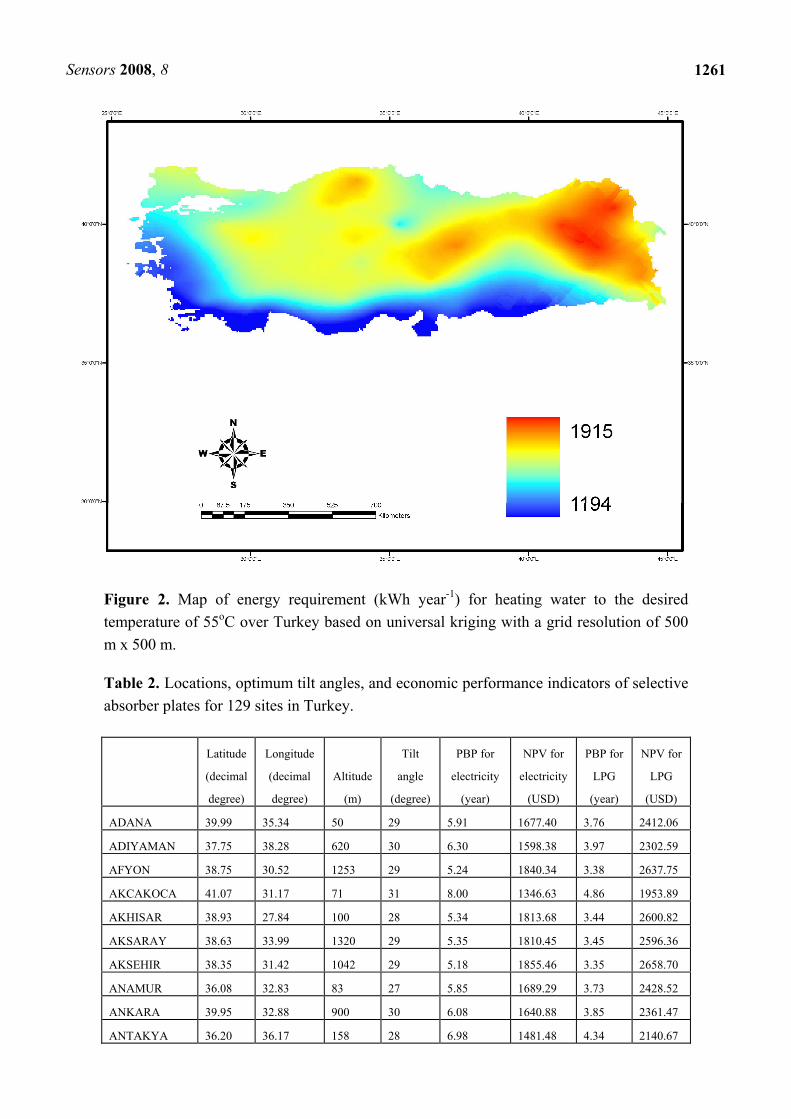
The annual energy requirement of one family of four people for hot water production was
calculated using formula [26]. In order to heat 100 L of water to temperature of 55˚C, the energy required varied between 1418.69 and 1975.08 kWh for 129 sites of Turkey (Fig. 2). It is clear that while the south and west locations of Turkey require less energy, the east locations of Turkey need much more energy to heat water. The reason for this can be attributed to low tap water temperatures in the east.
The useful energy output for the solar heating systems was calculated according to the different tilt angles for 129 sites of Turkey. Results indicated that tilt angles of the solar water heaters receiving the highest solar radiation during the entire year varied according to the absorber plate type (Tables 2 to 4). By using the selective absorber plate, the tilt angles were 25o at minimum and 35o at maximum with an average of 29.32 + 1.68o. In the copper absorber plate, the minimum, maximum and average tilt angles were 22, 33 and 27.09 + 1.75o, respectively. These values were similar for the galvanized absorber plates: 24o (min.), 33o (max.) and 27.1 + 1.70o (mean). The tilt angles for sites can be seen from Tables 2 to 4.
Sensors 2008, 8
1261
Figure 2. Map of energy requirement (kWh year-1) for heating water to the desired temperature of 55oC over Turkey based on universal kriging with a grid resolution of 500 m x 500 m.
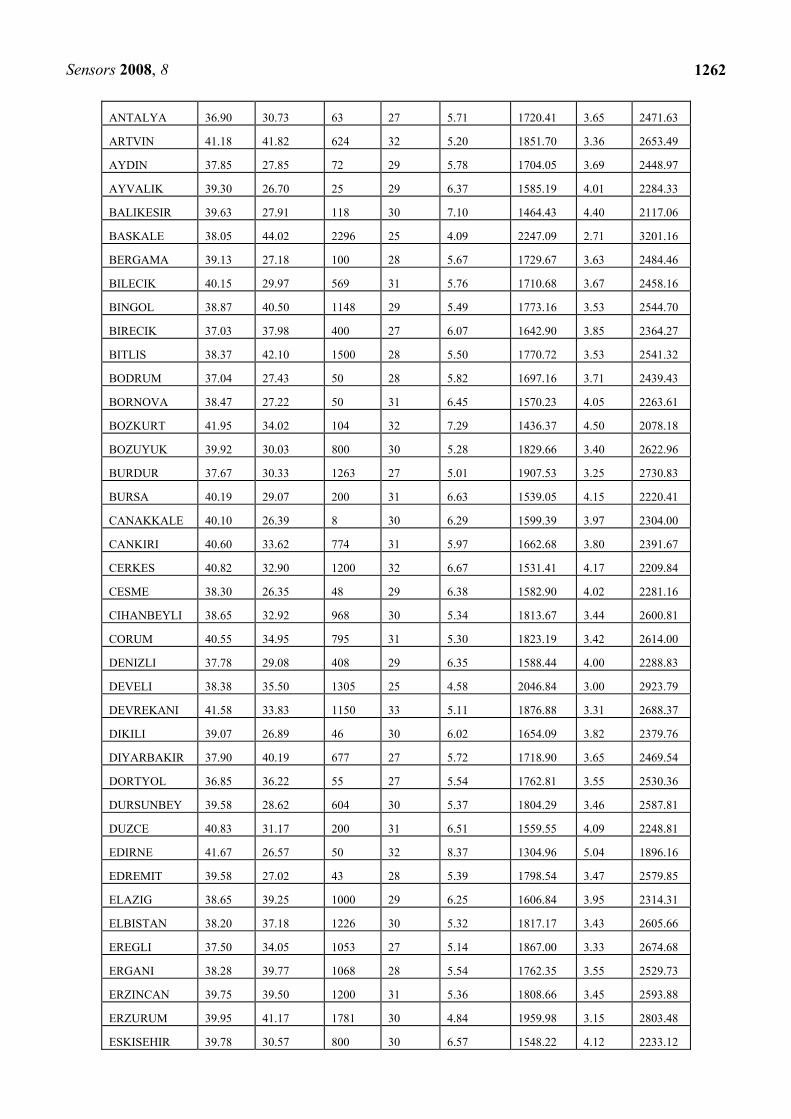
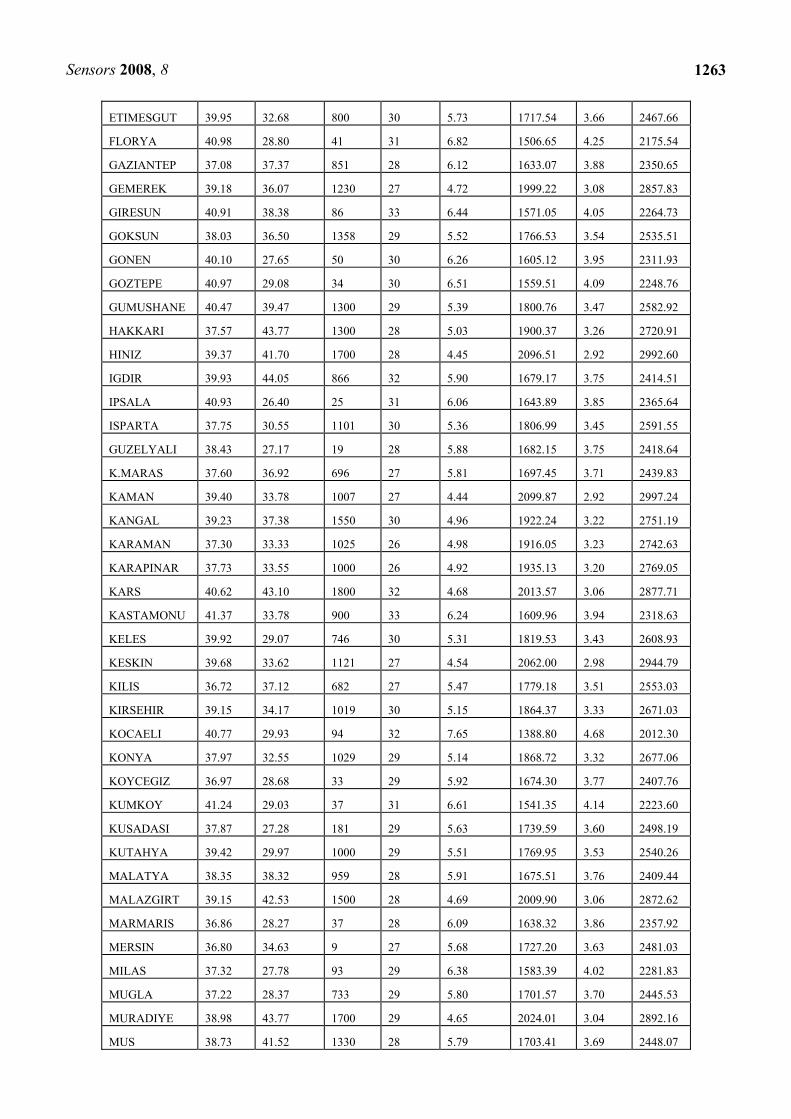
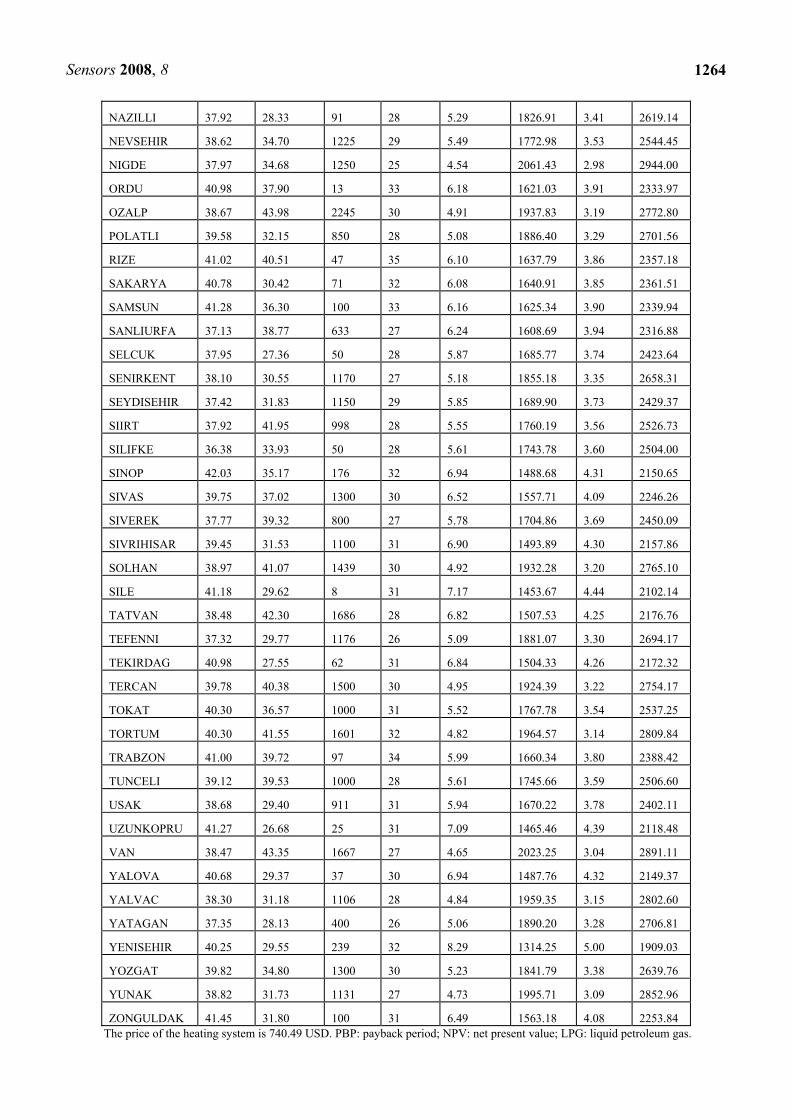
Table 2. Locations, optimum tilt angles, and economic performance indicators of selective absorber plates for 129 sites in Turkey.
Latitude
(decimal
degree)
Longitude
(decimal
degree)
Altitude
(m)
Tilt
angle
(degree)
PBP for
electricity
(year)
NPV for
electricity
(USD)
PBP for
LPG
(year)
NPV for
LPG
(USD)
ADANA 39.99 35.34 50 29 5.91 1677.40 3.76 2412.06
ADIYAMAN 37.75 38.28 620 30 6.30 1598.38 3.97 2302.59
AFYON 38.75 30.52 1253 29 5.24 1840.34 3.38 2637.75
AKCAKOCA 41.07 31.17 71 31 8.00 1346.63 4.86 1953.89
AKHISAR 38.93 27.84 100 28 5.34 1813.68 3.44 2600.82
AKSARAY 38.63 33.99 1320 29 5.35 1810.45 3.45 2596.36
AKSEHIR 38.35 31.42 1042 29 5.18 1855.46 3.35 2658.70
ANAMUR 36.08 32.83 83 27 5.85 1689.29 3.73 2428.52
ANKARA 39.95 32.88 900 30 6.08 1640.88 3.85 2361.47
ANTAKYA 36.20 36.17 158 28 6.98 1481.48 4.34 2140.67
Sensors 2008, 8
1262
ANTALYA 36.90 30.73 63 27 5.71 1720.41 3.65 2471.63
ARTVIN 41.18 41.82 624 32 5.20 1851.70 3.36 2653.49
AYDIN 37.85 27.85 72 29 5.78 1704.05 3.69 2448.97
AYVALIK 39.30 26.70 25 29 6.37 1585.19 4.01 2284.33
BALIKESIR 39.63 27.91 118 30 7.10 1464.43 4.40 2117.06
BASKALE 38.05 44.02 2296 25 4.09 2247.09 2.71 3201.16
BERGAMA 39.13 27.18 100 28 5.67 1729.67 3.63 2484.46
BILECIK 40.15 29.97 569 31 5.76 1710.68 3.67 2458.16
BINGOL 38.87 40.50 1148 29 5.49 1773.16 3.53 2544.70
BIRECIK 37.03 37.98 400 27 6.07 1642.90 3.85 2364.27
BITLIS 38.37 42.10 1500 28 5.50 1770.72 3.53 2541.32
BODRUM 37.04 27.43 50 28 5.82 1697.16 3.71 2439.43
BORNOVA 38.47 27.22 50 31 6.45 1570.23 4.05 2263.61
BOZKURT 41.95 34.02 104 32 7.29 1436.37 4.50 2078.18
BOZUYUK 39.92 30.03 800 30 5.28 1829.66 3.40 2622.96
BURDUR 37.67 30.33 1263 27 5.01 1907.53 3.25 2730.83
BURSA 40.19 29.07 200 31 6.63 1539.05 4.15 2220.41
CANAKKALE 40.10 26.39 8 30 6.29 1599.39 3.97 2304.00
CANKIRI 40.60 33.62 774 31 5.97 1662.68 3.80 2391.67
CERKES 40.82 32.90 1200 32 6.67 1531.41 4.17 2209.84
CESME 38.30 26.35 48 29 6.38 1582.90 4.02 2281.16
CIHANBEYLI 38.65 32.92 968 30 5.34 1813.67 3.44 2600.81
CORUM 40.55 34.95 795 31 5.30 1823.19 3.42 2614.00
DENIZLI 37.78 29.08 408 29 6.35 1588.44 4.00 2288.83
DEVELI 38.38 35.50 1305 25 4.58 2046.84 3.00 2923.79
DEVREKANI 41.58 33.83 1150 33 5.11 1876.88 3.31 2688.37
DIKILI 39.07 26.89 46 30 6.02 1654.09 3.82 2379.76
DIYARBAKIR 37.90 40.19 677 27 5.72 1718.90 3.65 2469.54
DORTYOL 36.85 36.22 55 27 5.54 1762.81 3.55 2530.36
DURSUNBEY 39.58 28.62 604 30 5.37 1804.29 3.46 2587.81
DUZCE 40.83 31.17 200 31 6.51 1559.55 4.09 2248.81
EDIRNE 41.67 26.57 50 32 8.37 1304.96 5.04 1896.16
EDREMIT 39.58 27.02 43 28 5.39 1798.54 3.47 2579.85
ELAZIG 38.65 39.25 1000 29 6.25 1606.84 3.95 2314.31
ELBISTAN 38.20 37.18 1226 30 5.32 1817.17 3.43 2605.66
EREGLI 37.50 34.05 1053 27 5.14 1867.00 3.33 2674.68
ERGANI 38.28 39.77 1068 28 5.54 1762.35 3.55 2529.73
ERZINCAN 39.75 39.50 1200 31 5.36 1808.66 3.45 2593.88
ERZURUM 39.95 41.17 1781 30 4.84 1959.98 3.15 2803.48
ESKISEHIR 39.78 30.57 800 30 6.57 1548.22 4.12 2233.12
Sensors 2008, 8
1263
ETIMESGUT 39.95 32.68 800 30 5.73 1717.54 3.66 2467.66
FLORYA 40.98 28.80 41 31 6.82 1506.65 4.25 2175.54
GAZIANTEP 37.08 37.37 851 28 6.12 1633.07 3.88 2350.65
GEMEREK 39.18 36.07 1230 27 4.72 1999.22 3.08 2857.83
GIRESUN 40.91 38.38 86 33 6.44 1571.05 4.05 2264.73
GOKSUN 38.03 36.50 1358 29 5.52 1766.53 3.54 2535.51
GONEN 40.10 27.65 50 30 6.26 1605.12 3.95 2311.93
GOZTEPE 40.97 29.08 34 30 6.51 1559.51 4.09 2248.76
GUMUSHANE 40.47 39.47 1300 29 5.39 1800.76 3.47 2582.92
HAKKARI 37.57 43.77 1300 28 5.03 1900.37 3.26 2720.91
HINIZ 39.37 41.70 1700 28 4.45 2096.51 2.92 2992.60
IGDIR 39.93 44.05 866 32 5.90 1679.17 3.75 2414.51
IPSALA 40.93 26.40 25 31 6.06 1643.89 3.85 2365.64
ISPARTA 37.75 30.55 1101 30 5.36 1806.99 3.45 2591.55
GUZELYALI 38.43 27.17 19 28 5.88 1682.15 3.75 2418.64
K.MARAS 37.60 36.92 696 27 5.81 1697.45 3.71 2439.83
KAMAN 39.40 33.78 1007 27 4.44 2099.87 2.92 2997.24
KANGAL 39.23 37.38 1550 30 4.96 1922.24 3.22 2751.19
KARAMAN 37.30 33.33 1025 26 4.98 1916.05 3.23 2742.63
KARAPINAR 37.73 33.55 1000 26 4.92 1935.13 3.20 2769.05
KARS 40.62 43.10 1800 32 4.68 2013.57 3.06 2877.71
KASTAMONU 41.37 33.78 900 33 6.24 1609.96 3.94 2318.63
KELES 39.92 29.07 746 30 5.31 1819.53 3.43 2608.93
KESKIN 39.68 33.62 1121 27 4.54 2062.00 2.98 2944.79
KILIS 36.72 37.12 682 27 5.47 1779.18 3.51 2553.03
KIRSEHIR 39.15 34.17 1019 30 5.15 1864.37 3.33 2671.03
KOCAELI 40.77 29.93 94 32 7.65 1388.80 4.68 2012.30
KONYA 37.97 32.55 1029 29 5.14 1868.72 3.32 2677.06
KOYCEGIZ 36.97 28.68 33 29 5.92 1674.30 3.77 2407.76
KUMKOY 41.24 29.03 37 31 6.61 1541.35 4.14 2223.60
KUSADASI 37.87 27.28 181 29 5.63 1739.59 3.60 2498.19
KUTAHYA 39.42 29.97 1000 29 5.51 1769.95 3.53 2540.26
MALATYA 38.35 38.32 959 28 5.91 1675.51 3.76 2409.44
MALAZGIRT 39.15 42.53 1500 28 4.69 2009.90 3.06 2872.62
MARMARIS 36.86 28.27 37 28 6.09 1638.32 3.86 2357.92
MERSIN 36.80 34.63 9 27 5.68 1727.20 3.63 2481.03
MILAS 37.32 27.78 93 29 6.38 1583.39 4.02 2281.83
MUGLA 37.22 28.37 733 29 5.80 1701.57 3.70 2445.53
MURADIYE 38.98 43.77 1700 29 4.65 2024.01 3.04 2892.16
MUS 38.73 41.52 1330 28 5.79 1703.41 3.69 2448.07
Sensors 2008, 8
1264
NAZILLI 37.92 28.33 91 28 5.29 1826.91 3.41 2619.14
NEVSEHIR 38.62 34.70 1225 29 5.49 1772.98 3.53 2544.45
NIGDE 37.97 34.68 1250 25 4.54 2061.43 2.98 2944.00
ORDU 40.98 37.90 13 33 6.18 1621.03 3.91 2333.97
OZALP 38.67 43.98 2245 30 4.91 1937.83 3.19 2772.80
POLATLI 39.58 32.15 850 28 5.08 1886.40 3.29 2701.56
RIZE 41.02 40.51 47 35 6.10 1637.79 3.86 2357.18
SAKARYA 40.78 30.42 71 32 6.08 1640.91 3.85 2361.51
SAMSUN 41.28 36.30 100 33 6.16 1625.34 3.90 2339.94
SANLIURFA 37.13 38.77 633 27 6.24 1608.69 3.94 2316.88
SELCUK 37.95 27.36 50 28 5.87 1685.77 3.74 2423.64
SENIRKENT 38.10 30.55 1170 27 5.18 1855.18 3.35 2658.31
SEYDISEHIR 37.42 31.83 1150 29 5.85 1689.90 3.73 2429.37
SIIRT 37.92 41.95 998 28 5.55 1760.19 3.56 2526.73
SILIFKE 36.38 33.93 50 28 5.61 1743.78 3.60 2504.00
SINOP 42.03 35.17 176 32 6.94 1488.68 4.31 2150.65
SIVAS 39.75 37.02 1300 30 6.52 1557.71 4.09 2246.26
SIVEREK 37.77 39.32 800 27 5.78 1704.86 3.69 2450.09
SIVRIHISAR 39.45 31.53 1100 31 6.90 1493.89 4.30 2157.86
SOLHAN 38.97 41.07 1439 30 4.92 1932.28 3.20 2765.10
SILE 41.18 29.62 8 31 7.17 1453.67 4.44 2102.14
TATVAN 38.48 42.30 1686 28 6.82 1507.53 4.25 2176.76
TEFENNI 37.32 29.77 1176 26 5.09 1881.07 3.30 2694.17
TEKIRDAG 40.98 27.55 62 31 6.84 1504.33 4.26 2172.32
TERCAN 39.78 40.38 1500 30 4.95 1924.39 3.22 2754.17
TOKAT 40.30 36.57 1000 31 5.52 1767.78 3.54 2537.25
TORTUM 40.30 41.55 1601 32 4.82 1964.57 3.14 2809.84
TRABZON 41.00 39.72 97 34 5.99 1660.34 3.80 2388.42
TUNCELI 39.12 39.53 1000 28 5.61 1745.66 3.59 2506.60
USAK 38.68 29.40 911 31 5.94 1670.22 3.78 2402.11
UZUNKOPRU 41.27 26.68 25 31 7.09 1465.46 4.39 2118.48
VAN 38.47 43.35 1667 27 4.65 2023.25 3.04 2891.11
YALOVA 40.68 29.37 37 30 6.94 1487.76 4.32 2149.37
YALVAC 38.30 31.18 1106 28 4.84 1959.35 3.15 2802.60
YATAGAN 37.35 28.13 400 26 5.06 1890.20 3.28 2706.81
YENISEHIR 40.25 29.55 239 32 8.29 1314.25 5.00 1909.03
YOZGAT 39.82 34.80 1300 30 5.23 1841.79 3.38 2639.76
YUNAK 38.82 31.73 1131 27 4.73 1995.71 3.09 2852.96
ZONGULDAK 41.45 31.80 100 31 6.49 1563.18 4.08 2253.84 The price of the heating system is 740.49 USD. PBP: payback period; NPV: net present value; LPG: liquid petroleum gas.
Sensors 2008, 8
1265
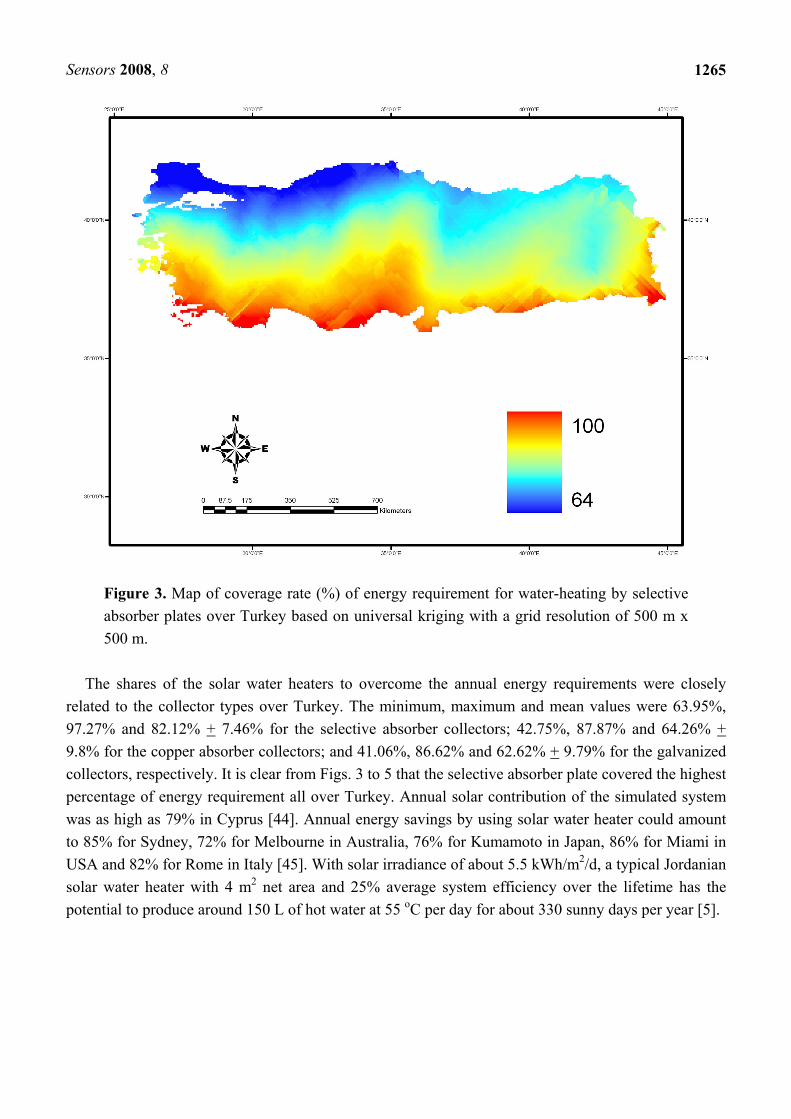
Figure 3. Map of coverage rate (%) of energy requirement for water-heating by selective absorber plates over Turkey based on universal kriging with a grid resolution of 500 m x 500 m.
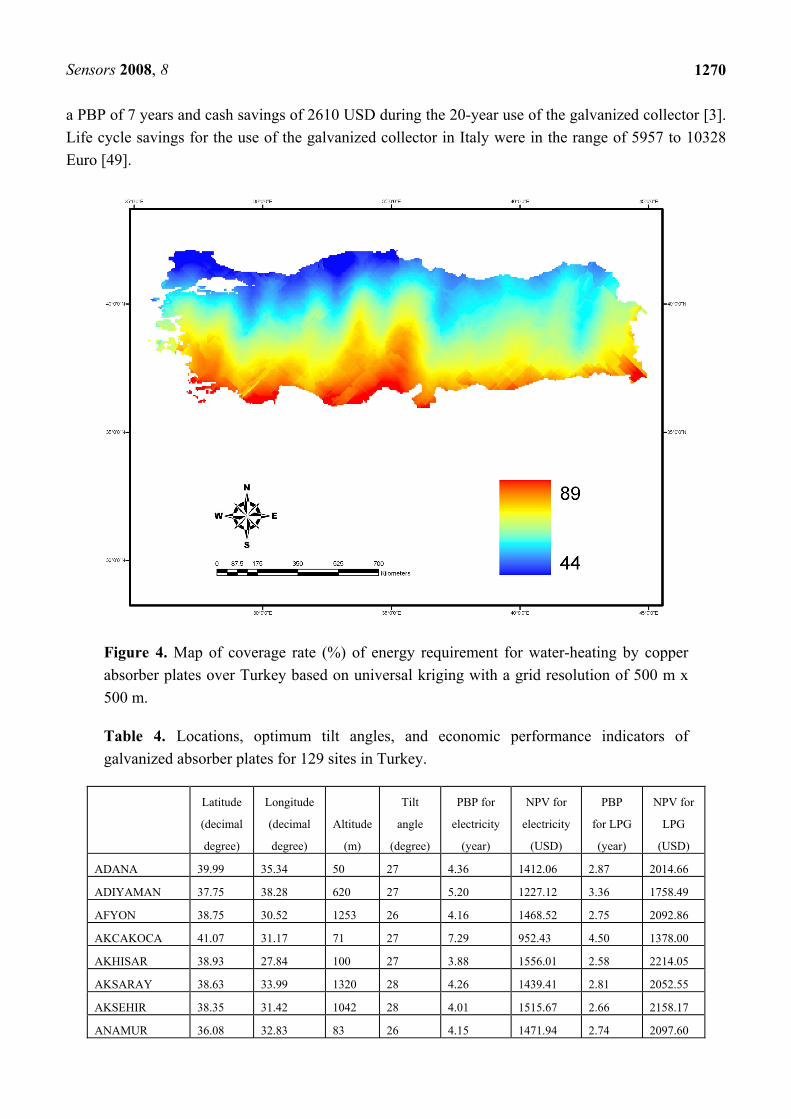
The shares of the solar water heaters to overcome the annual energy requirements were closely
related to the collector types over Turkey. The minimum, maximum and mean values were 63.95%, 97.27% and 82.12% + 7.46% for the selective absorber collectors; 42.75%, 87.87% and 64.26% + 9.8% for the copper absorber collectors; and 41.06%, 86.62% and 62.62% + 9.79% for the galvanized collectors, respectively. It is clear from Figs. 3 to 5 that the selective absorber plate covered the highest percentage of energy requirement all over Turkey. Annual solar contribution of the simulated system was as high as 79% in Cyprus [44]. Annual energy savings by using solar water heater could amount to 85% for Sydney, 72% for Melbourne in Australia, 76% for Kumamoto in Japan, 86% for Miami in USA and 82% for Rome in Italy [45]. With solar irradiance of about 5.5 kWh/m2/d, a typical Jordanian solar water heater with 4 m2 net area and 25% average system efficiency over the lifetime has the potential to produce around 150 L of hot water at 55 oC per day for about 330 sunny days per year [5].
Sensors 2008, 8
1266
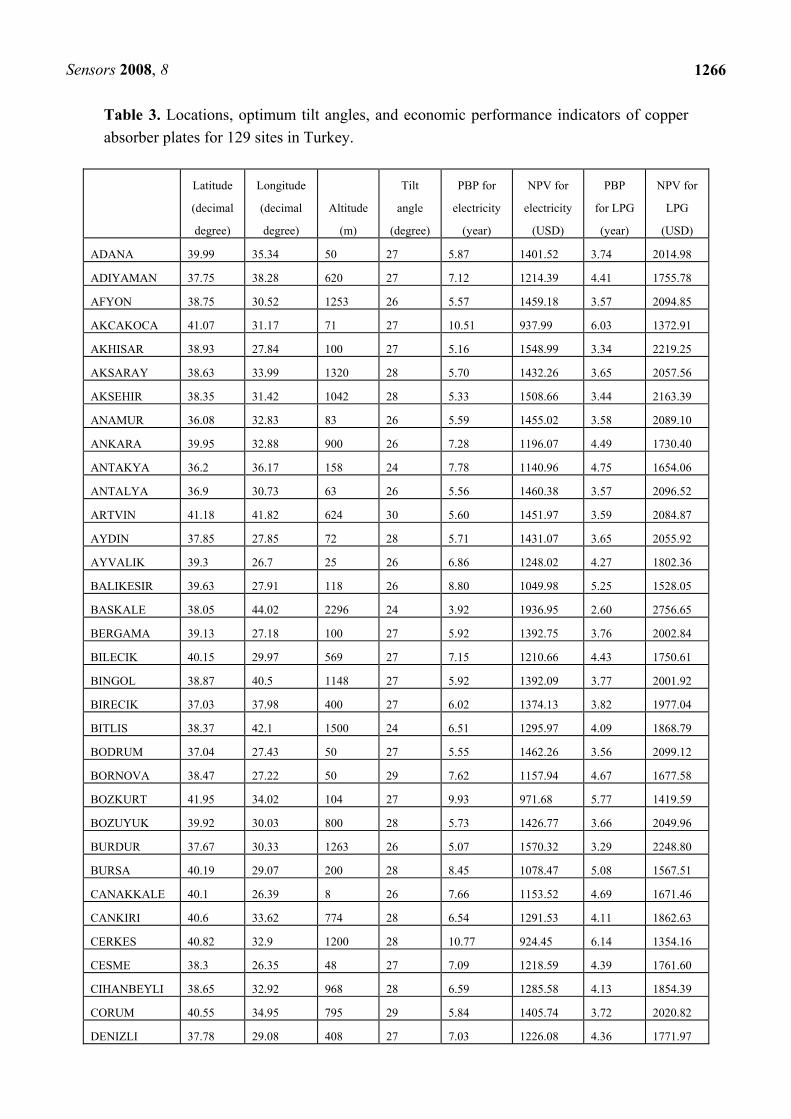
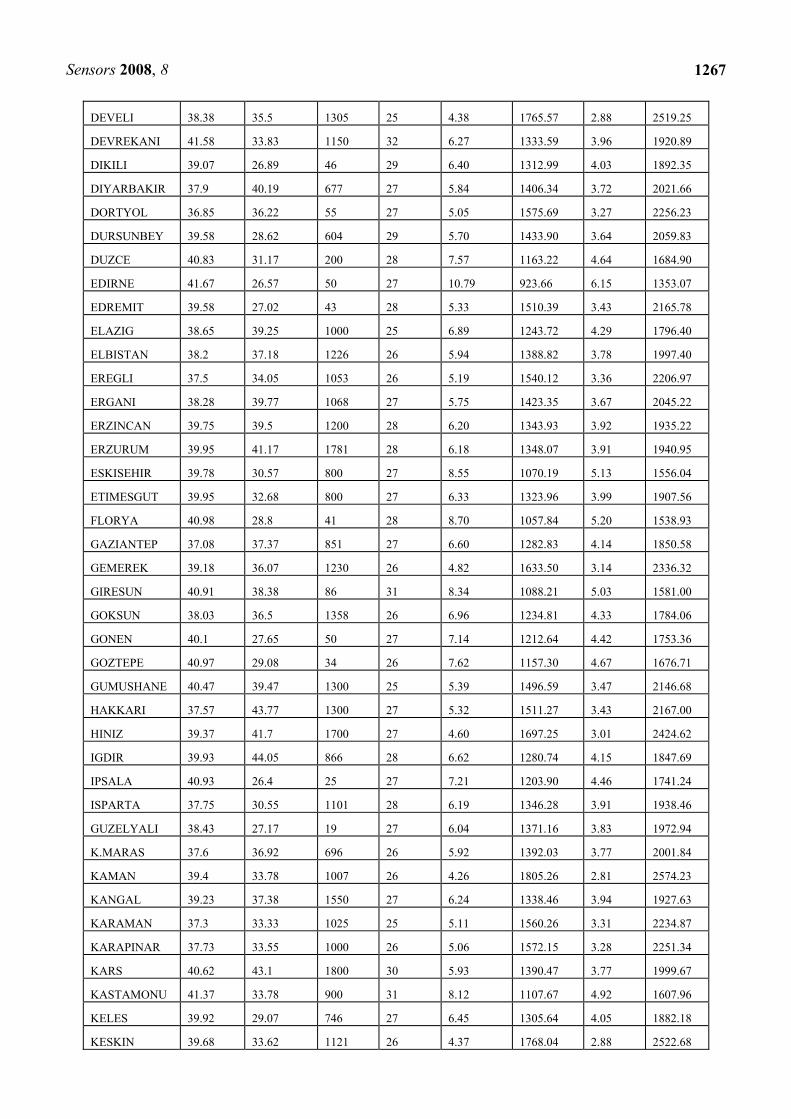
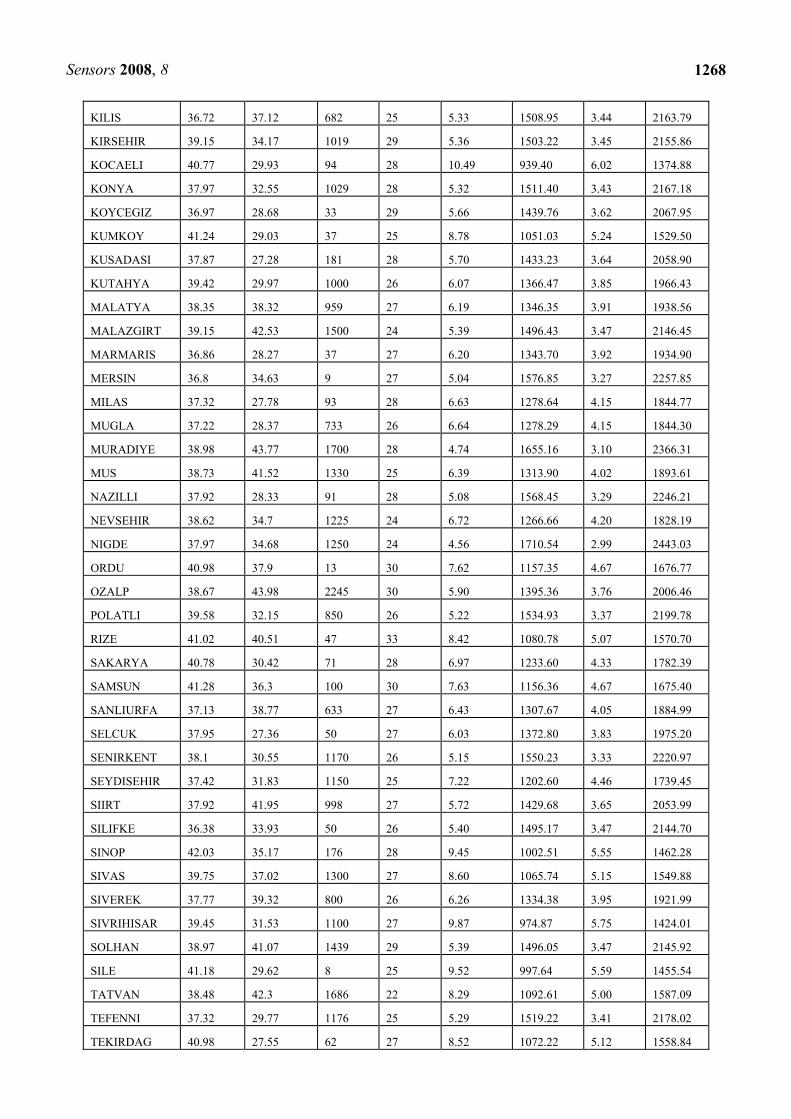
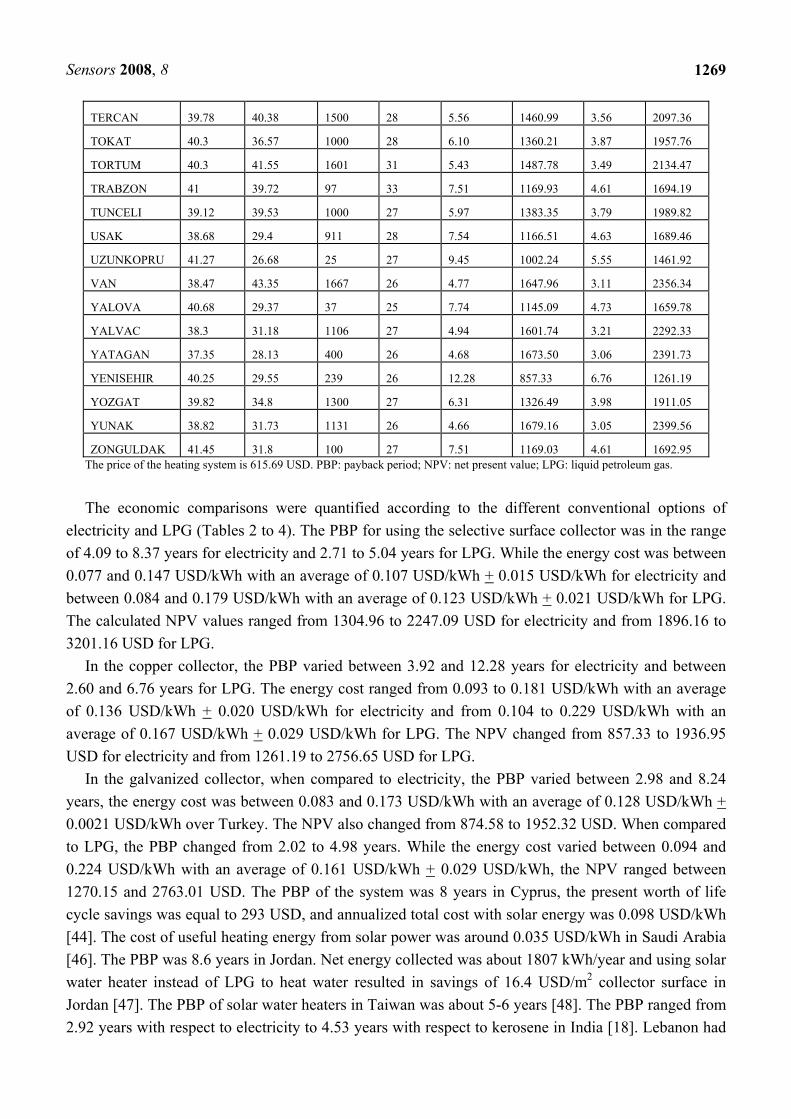
Table 3. Locations, optimum tilt angles, and economic performance indicators of copper absorber plates for 129 sites in Turkey.
Latitude
(decimal
degree)
Longitude
(decimal
degree)
Altitude
(m)
Tilt
angle
(degree)
PBP for
electricity
(year)
NPV for
electricity
(USD)
PBP
for LPG
(year)
NPV for
LPG
(USD)
ADANA 39.99 35.34 50 27 5.87 1401.52 3.74 2014.98
ADIYAMAN 37.75 38.28 620 27 7.12 1214.39 4.41 1755.78
AFYON 38.75 30.52 1253 26 5.57 1459.18 3.57 2094.85
AKCAKOCA 41.07 31.17 71 27 10.51 937.99 6.03 1372.91
AKHISAR 38.93 27.84 100 27 5.16 1548.99 3.34 2219.25
AKSARAY 38.63 33.99 1320 28 5.70 1432.26 3.65 2057.56
AKSEHIR 38.35 31.42 1042 28 5.33 1508.66 3.44 2163.39
ANAMUR 36.08 32.83 83 26 5.59 1455.02 3.58 2089.10
ANKARA 39.95 32.88 900 26 7.28 1196.07 4.49 1730.40
ANTAKYA 36.2 36.17 158 24 7.78 1140.96 4.75 1654.06
ANTALYA 36.9 30.73 63 26 5.56 1460.38 3.57 2096.52
ARTVIN 41.18 41.82 624 30 5.60 1451.97 3.59 2084.87
AYDIN 37.85 27.85 72 28 5.71 1431.07 3.65 2055.92
AYVALIK 39.3 26.7 25 26 6.86 1248.02 4.27 1802.36
BALIKESIR 39.63 27.91 118 26 8.80 1049.98 5.25 1528.05
BASKALE 38.05 44.02 2296 24 3.92 1936.95 2.60 2756.65
BERGAMA 39.13 27.18 100 27 5.92 1392.75 3.76 2002.84
BILECIK 40.15 29.97 569 27 7.15 1210.66 4.43 1750.61
BINGOL 38.87 40.5 1148 27 5.92 1392.09 3.77 2001.92
BIRECIK 37.03 37.98 400 27 6.02 1374.13 3.82 1977.04
BITLIS 38.37 42.1 1500 24 6.51 1295.97 4.09 1868.79
BODRUM 37.04 27.43 50 27 5.55 1462.26 3.56 2099.12
BORNOVA 38.47 27.22 50 29 7.62 1157.94 4.67 1677.58
BOZKURT 41.95 34.02 104 27 9.93 971.68 5.77 1419.59
BOZUYUK 39.92 30.03 800 28 5.73 1426.77 3.66 2049.96
BURDUR 37.67 30.33 1263 26 5.07 1570.32 3.29 2248.80
BURSA 40.19 29.07 200 28 8.45 1078.47 5.08 1567.51
CANAKKALE 40.1 26.39 8 26 7.66 1153.52 4.69 1671.46
CANKIRI 40.6 33.62 774 28 6.54 1291.53 4.11 1862.63
CERKES 40.82 32.9 1200 28 10.77 924.45 6.14 1354.16
CESME 38.3 26.35 48 27 7.09 1218.59 4.39 1761.60
CIHANBEYLI 38.65 32.92 968 28 6.59 1285.58 4.13 1854.39
CORUM 40.55 34.95 795 29 5.84 1405.74 3.72 2020.82
DENIZLI 37.78 29.08 408 27 7.03 1226.08 4.36 1771.97
Sensors 2008, 8
1267
DEVELI 38.38 35.5 1305 25 4.38 1765.57 2.88 2519.25
DEVREKANI 41.58 33.83 1150 32 6.27 1333.59 3.96 1920.89
DIKILI 39.07 26.89 46 29 6.40 1312.99 4.03 1892.35
DIYARBAKIR 37.9 40.19 677 27 5.84 1406.34 3.72 2021.66
DORTYOL 36.85 36.22 55 27 5.05 1575.69 3.27 2256.23
DURSUNBEY 39.58 28.62 604 29 5.70 1433.90 3.64 2059.83
DUZCE 40.83 31.17 200 28 7.57 1163.22 4.64 1684.90
EDIRNE 41.67 26.57 50 27 10.79 923.66 6.15 1353.07
EDREMIT 39.58 27.02 43 28 5.33 1510.39 3.43 2165.78
ELAZIG 38.65 39.25 1000 25 6.89 1243.72 4.29 1796.40
ELBISTAN 38.2 37.18 1226 26 5.94 1388.82 3.78 1997.40
EREGLI 37.5 34.05 1053 26 5.19 1540.12 3.36 2206.97
ERGANI 38.28 39.77 1068 27 5.75 1423.35 3.67 2045.22
ERZINCAN 39.75 39.5 1200 28 6.20 1343.93 3.92 1935.22
ERZURUM 39.95 41.17 1781 28 6.18 1348.07 3.91 1940.95
ESKISEHIR 39.78 30.57 800 27 8.55 1070.19 5.13 1556.04
ETIMESGUT 39.95 32.68 800 27 6.33 1323.96 3.99 1907.56
FLORYA 40.98 28.8 41 28 8.70 1057.84 5.20 1538.93
GAZIANTEP 37.08 37.37 851 27 6.60 1282.83 4.14 1850.58
GEMEREK 39.18 36.07 1230 26 4.82 1633.50 3.14 2336.32
GIRESUN 40.91 38.38 86 31 8.34 1088.21 5.03 1581.00
GOKSUN 38.03 36.5 1358 26 6.96 1234.81 4.33 1784.06
GONEN 40.1 27.65 50 27 7.14 1212.64 4.42 1753.36
GOZTEPE 40.97 29.08 34 26 7.62 1157.30 4.67 1676.71
GUMUSHANE 40.47 39.47 1300 25 5.39 1496.59 3.47 2146.68
HAKKARI 37.57 43.77 1300 27 5.32 1511.27 3.43 2167.00
HINIZ 39.37 41.7 1700 27 4.60 1697.25 3.01 2424.62
IGDIR 39.93 44.05 866 28 6.62 1280.74 4.15 1847.69
IPSALA 40.93 26.4 25 27 7.21 1203.90 4.46 1741.24
ISPARTA 37.75 30.55 1101 28 6.19 1346.28 3.91 1938.46
GUZELYALI 38.43 27.17 19 27 6.04 1371.16 3.83 1972.94
K.MARAS 37.6 36.92 696 26 5.92 1392.03 3.77 2001.84
KAMAN 39.4 33.78 1007 26 4.26 1805.26 2.81 2574.23
KANGAL 39.23 37.38 1550 27 6.24 1338.46 3.94 1927.63
KARAMAN 37.3 33.33 1025 25 5.11 1560.26 3.31 2234.87
KARAPINAR 37.73 33.55 1000 26 5.06 1572.15 3.28 2251.34
KARS 40.62 43.1 1800 30 5.93 1390.47 3.77 1999.67
KASTAMONU 41.37 33.78 900 31 8.12 1107.67 4.92 1607.96
KELES 39.92 29.07 746 27 6.45 1305.64 4.05 1882.18
KESKIN 39.68 33.62 1121 26 4.37 1768.04 2.88 2522.68
Sensors 2008, 8
1268
KILIS 36.72 37.12 682 25 5.33 1508.95 3.44 2163.79
KIRSEHIR 39.15 34.17 1019 29 5.36 1503.22 3.45 2155.86
KOCAELI 40.77 29.93 94 28 10.49 939.40 6.02 1374.88
KONYA 37.97 32.55 1029 28 5.32 1511.40 3.43 2167.18
KOYCEGIZ 36.97 28.68 33 29 5.66 1439.76 3.62 2067.95
KUMKOY 41.24 29.03 37 25 8.78 1051.03 5.24 1529.50
KUSADASI 37.87 27.28 181 28 5.70 1433.23 3.64 2058.90
KUTAHYA 39.42 29.97 1000 26 6.07 1366.47 3.85 1966.43
MALATYA 38.35 38.32 959 27 6.19 1346.35 3.91 1938.56
MALAZGIRT 39.15 42.53 1500 24 5.39 1496.43 3.47 2146.45
MARMARIS 36.86 28.27 37 27 6.20 1343.70 3.92 1934.90
MERSIN 36.8 34.63 9 27 5.04 1576.85 3.27 2257.85
MILAS 37.32 27.78 93 28 6.63 1278.64 4.15 1844.77
MUGLA 37.22 28.37 733 26 6.64 1278.29 4.15 1844.30
MURADIYE 38.98 43.77 1700 28 4.74 1655.16 3.10 2366.31
MUS 38.73 41.52 1330 25 6.39 1313.90 4.02 1893.61
NAZILLI 37.92 28.33 91 28 5.08 1568.45 3.29 2246.21
NEVSEHIR 38.62 34.7 1225 24 6.72 1266.66 4.20 1828.19
NIGDE 37.97 34.68 1250 24 4.56 1710.54 2.99 2443.03
ORDU 40.98 37.9 13 30 7.62 1157.35 4.67 1676.77
OZALP 38.67 43.98 2245 30 5.90 1395.36 3.76 2006.46
POLATLI 39.58 32.15 850 26 5.22 1534.93 3.37 2199.78
RIZE 41.02 40.51 47 33 8.42 1080.78 5.07 1570.70
SAKARYA 40.78 30.42 71 28 6.97 1233.60 4.33 1782.39
SAMSUN 41.28 36.3 100 30 7.63 1156.36 4.67 1675.40
SANLIURFA 37.13 38.77 633 27 6.43 1307.67 4.05 1884.99
SELCUK 37.95 27.36 50 27 6.03 1372.80 3.83 1975.20
SENIRKENT 38.1 30.55 1170 26 5.15 1550.23 3.33 2220.97
SEYDISEHIR 37.42 31.83 1150 25 7.22 1202.60 4.46 1739.45
SIIRT 37.92 41.95 998 27 5.72 1429.68 3.65 2053.99
SILIFKE 36.38 33.93 50 26 5.40 1495.17 3.47 2144.70
SINOP 42.03 35.17 176 28 9.45 1002.51 5.55 1462.28
SIVAS 39.75 37.02 1300 27 8.60 1065.74 5.15 1549.88
SIVEREK 37.77 39.32 800 26 6.26 1334.38 3.95 1921.99
SIVRIHISAR 39.45 31.53 1100 27 9.87 974.87 5.75 1424.01
SOLHAN 38.97 41.07 1439 29 5.39 1496.05 3.47 2145.92
SILE 41.18 29.62 8 25 9.52 997.64 5.59 1455.54
TATVAN 38.48 42.3 1686 22 8.29 1092.61 5.00 1587.09
TEFENNI 37.32 29.77 1176 25 5.29 1519.22 3.41 2178.02
TEKIRDAG 40.98 27.55 62 27 8.52 1072.22 5.12 1558.84
Sensors 2008, 8
1269
TERCAN 39.78 40.38 1500 28 5.56 1460.99 3.56 2097.36
TOKAT 40.3 36.57 1000 28 6.10 1360.21 3.87 1957.76
TORTUM 40.3 41.55 1601 31 5.43 1487.78 3.49 2134.47
TRABZON 41 39.72 97 33 7.51 1169.93 4.61 1694.19
TUNCELI 39.12 39.53 1000 27 5.97 1383.35 3.79 1989.82
USAK 38.68 29.4 911 28 7.54 1166.51 4.63 1689.46
UZUNKOPRU 41.27 26.68 25 27 9.45 1002.24 5.55 1461.92
VAN 38.47 43.35 1667 26 4.77 1647.96 3.11 2356.34
YALOVA 40.68 29.37 37 25 7.74 1145.09 4.73 1659.78
YALVAC 38.3 31.18 1106 27 4.94 1601.74 3.21 2292.33
YATAGAN 37.35 28.13 400 26 4.68 1673.50 3.06 2391.73
YENISEHIR 40.25 29.55 239 26 12.28 857.33 6.76 1261.19
YOZGAT 39.82 34.8 1300 27 6.31 1326.49 3.98 1911.05
YUNAK 38.82 31.73 1131 26 4.66 1679.16 3.05 2399.56
ZONGULDAK 41.45 31.8 100 27 7.51 1169.03 4.61 1692.95 The price of the heating system is 615.69 USD. PBP: payback period; NPV: net present value; LPG: liquid petroleum gas.
The economic comparisons were quantified according to the different conventional options of
electricity and LPG (Tables 2 to 4). The PBP for using the selective surface collector was in the range of 4.09 to 8.37 years for electricity and 2.71 to 5.04 years for LPG. While the energy cost was between 0.077 and 0.147 USD/kWh with an average of 0.107 USD/kWh + 0.015 USD/kWh for electricity and between 0.084 and 0.179 USD/kWh with an average of 0.123 USD/kWh + 0.021 USD/kWh for LPG. The calculated NPV values ranged from 1304.96 to 2247.09 USD for electricity and from 1896.16 to 3201.16 USD for LPG.
In the copper collector, the PBP varied between 3.92 and 12.28 years for electricity and between 2.60 and 6.76 years for LPG. The energy cost ranged from 0.093 to 0.181 USD/kWh with an average of 0.136 USD/kWh + 0.020 USD/kWh for electricity and from 0.104 to 0.229 USD/kWh with an average of 0.167 USD/kWh + 0.029 USD/kWh for LPG. The NPV changed from 857.33 to 1936.95 USD for electricity and from 1261.19 to 2756.65 USD for LPG.
In the galvanized collector, when compared to electricity, the PBP varied between 2.98 and 8.24 years, the energy cost was between 0.083 and 0.173 USD/kWh with an average of 0.128 USD/kWh + 0.0021 USD/kWh over Turkey. The NPV also changed from 874.58 to 1952.32 USD. When compared to LPG, the PBP changed from 2.02 to 4.98 years. While the energy cost varied between 0.094 and 0.224 USD/kWh with an average of 0.161 USD/kWh + 0.029 USD/kWh, the NPV ranged between 1270.15 and 2763.01 USD. The PBP of the system was 8 years in Cyprus, the present worth of life cycle savings was equal to 293 USD, and annualized total cost with solar energy was 0.098 USD/kWh [44]. The cost of useful heating energy from solar power was around 0.035 USD/kWh in Saudi Arabia [46]. The PBP was 8.6 years in Jordan. Net energy collected was about 1807 kWh/year and using solar water heater instead of LPG to heat water resulted in savings of 16.4 USD/m2 collector surface in Jordan [47]. The PBP of solar water heaters in Taiwan was about 5-6 years [48]. The PBP ranged from 2.92 years with respect to electricity to 4.53 years with respect to kerosene in India [18]. Lebanon had
Sensors 2008, 8
1270
a PBP of 7 years and cash savings of 2610 USD during the 20-year use of the galvanized collector [3]. Life cycle savings for the use of the galvanized collector in Italy were in the range of 5957 to 10328 Euro [49].
Figure 4. Map of coverage rate (%) of energy requirement for water-heating by copper absorber plates over Turkey based on universal kriging with a grid resolution of 500 m x 500 m.
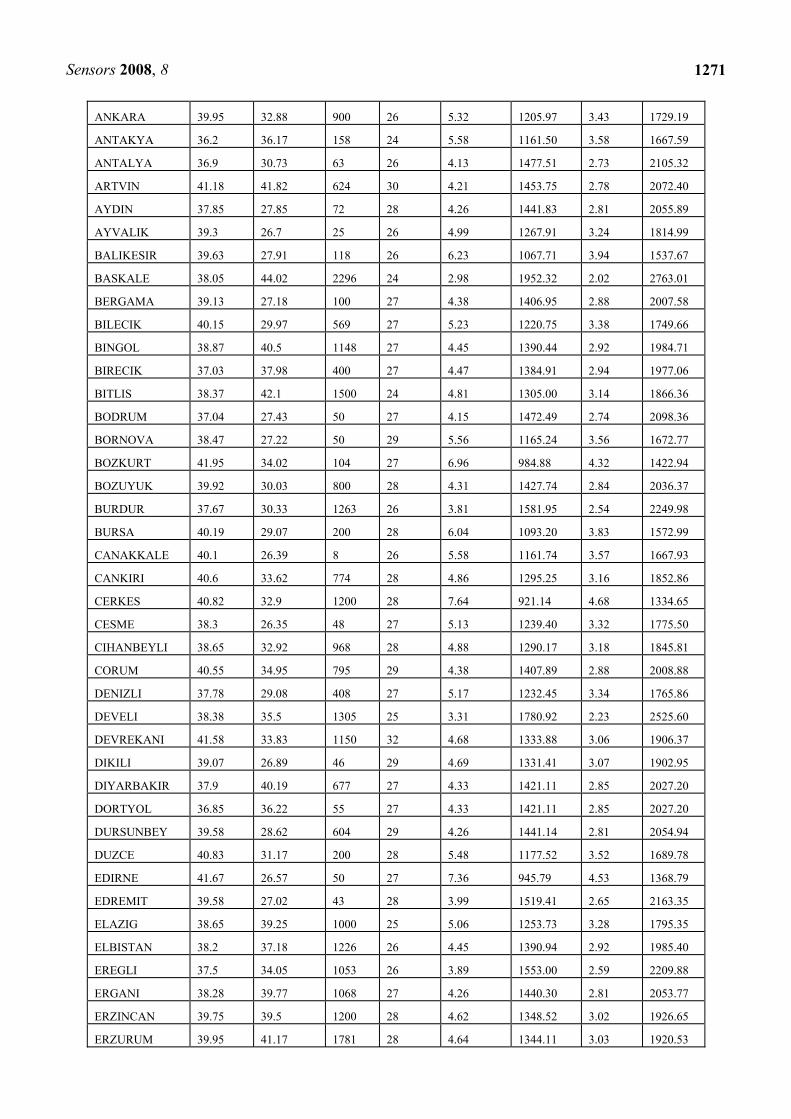
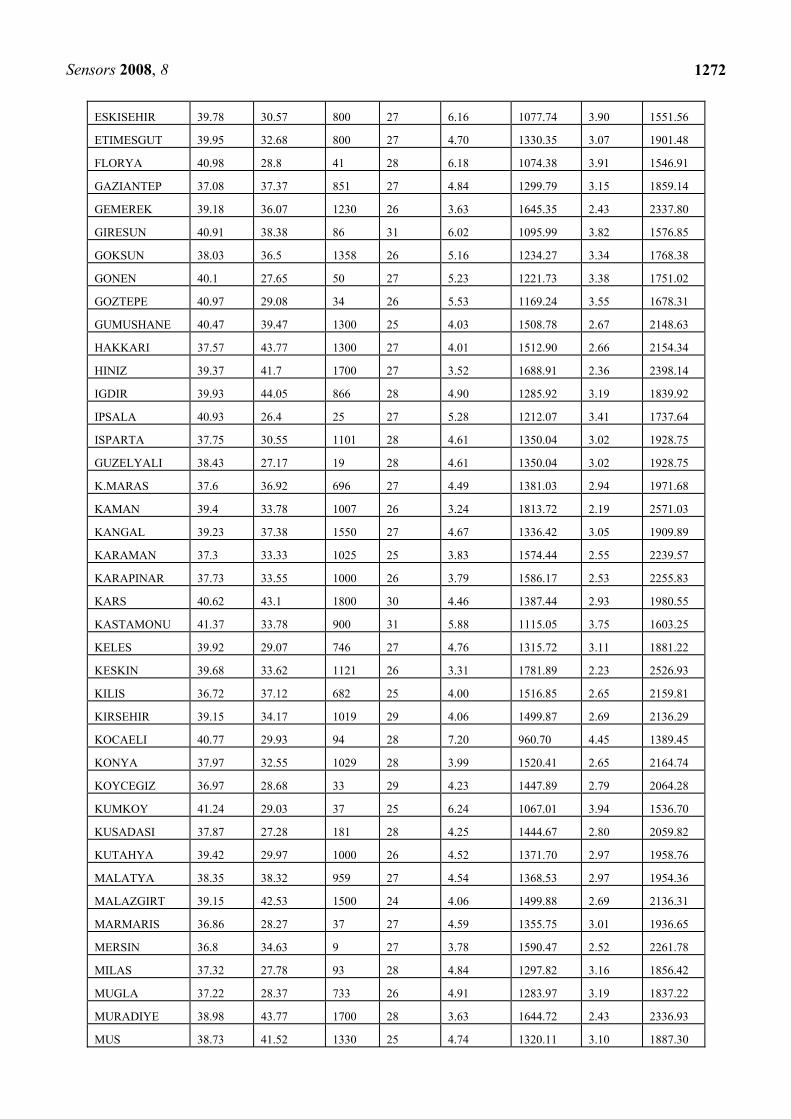
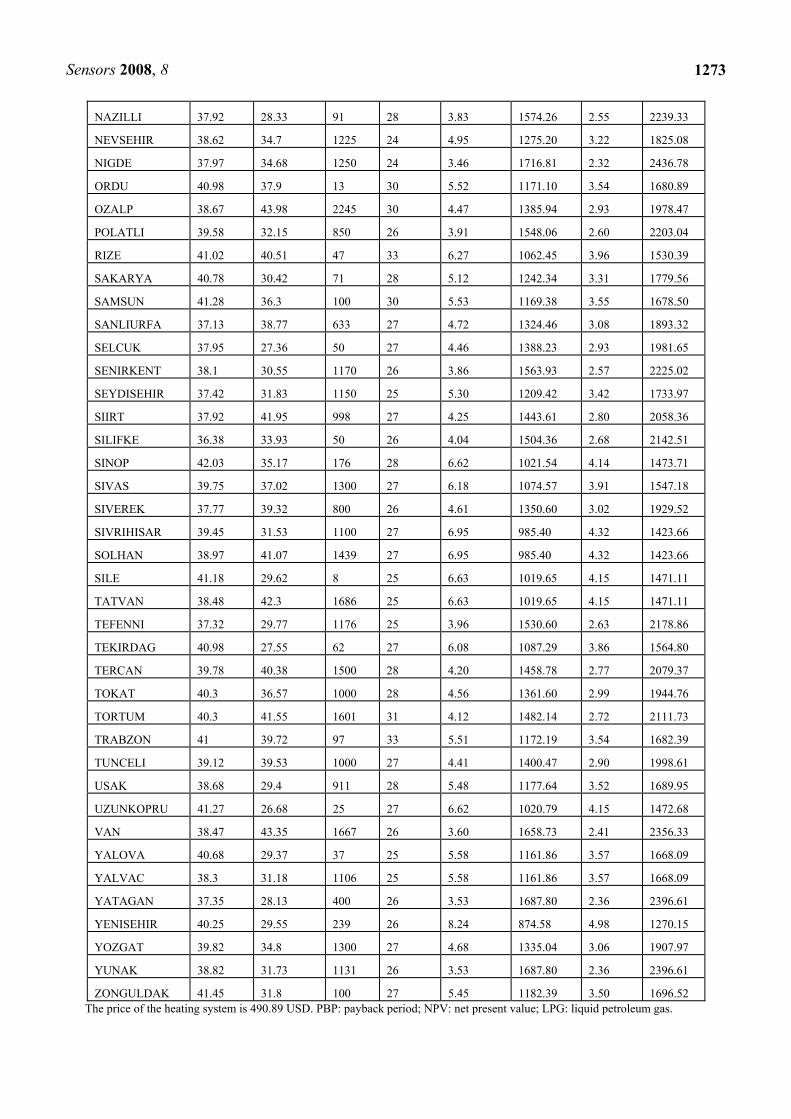
Table 4. Locations, optimum tilt angles, and economic performance indicators of galvanized absorber plates for 129 sites in Turkey.
Latitude
(decimal
degree)
Longitude
(decimal
degree)
Altitude
(m)
Tilt
angle
(degree)
PBP for
electricity
(year)
NPV for
electricity
(USD)
PBP
for LPG
(year)
NPV for
LPG
(USD)
ADANA 39.99 35.34 50 27 4.36 1412.06 2.87 2014.66
ADIYAMAN 37.75 38.28 620 27 5.20 1227.12 3.36 1758.49
AFYON 38.75 30.52 1253 26 4.16 1468.52 2.75 2092.86
AKCAKOCA 41.07 31.17 71 27 7.29 952.43 4.50 1378.00
AKHISAR 38.93 27.84 100 27 3.88 1556.01 2.58 2214.05
AKSARAY 38.63 33.99 1320 28 4.26 1439.41 2.81 2052.55
AKSEHIR 38.35 31.42 1042 28 4.01 1515.67 2.66 2158.17
ANAMUR 36.08 32.83 83 26 4.15 1471.94 2.74 2097.60
Sensors 2008, 8
1271
ANKARA 39.95 32.88 900 26 5.32 1205.97 3.43 1729.19
ANTAKYA 36.2 36.17 158 24 5.58 1161.50 3.58 1667.59
ANTALYA 36.9 30.73 63 26 4.13 1477.51 2.73 2105.32
ARTVIN 41.18 41.82 624 30 4.21 1453.75 2.78 2072.40
AYDIN 37.85 27.85 72 28 4.26 1441.83 2.81 2055.89
AYVALIK 39.3 26.7 25 26 4.99 1267.91 3.24 1814.99
BALIKESIR 39.63 27.91 118 26 6.23 1067.71 3.94 1537.67
BASKALE 38.05 44.02 2296 24 2.98 1952.32 2.02 2763.01
BERGAMA 39.13 27.18 100 27 4.38 1406.95 2.88 2007.58
BILECIK 40.15 29.97 569 27 5.23 1220.75 3.38 1749.66
BINGOL 38.87 40.5 1148 27 4.45 1390.44 2.92 1984.71
BIRECIK 37.03 37.98 400 27 4.47 1384.91 2.94 1977.06
BITLIS 38.37 42.1 1500 24 4.81 1305.00 3.14 1866.36
BODRUM 37.04 27.43 50 27 4.15 1472.49 2.74 2098.36
BORNOVA 38.47 27.22 50 29 5.56 1165.24 3.56 1672.77
BOZKURT 41.95 34.02 104 27 6.96 984.88 4.32 1422.94
BOZUYUK 39.92 30.03 800 28 4.31 1427.74 2.84 2036.37
BURDUR 37.67 30.33 1263 26 3.81 1581.95 2.54 2249.98
BURSA 40.19 29.07 200 28 6.04 1093.20 3.83 1572.99
CANAKKALE 40.1 26.39 8 26 5.58 1161.74 3.57 1667.93
CANKIRI 40.6 33.62 774 28 4.86 1295.25 3.16 1852.86
CERKES 40.82 32.9 1200 28 7.64 921.14 4.68 1334.65
CESME 38.3 26.35 48 27 5.13 1239.40 3.32 1775.50
CIHANBEYLI 38.65 32.92 968 28 4.88 1290.17 3.18 1845.81
CORUM 40.55 34.95 795 29 4.38 1407.89 2.88 2008.88
DENIZLI 37.78 29.08 408 27 5.17 1232.45 3.34 1765.86
DEVELI 38.38 35.5 1305 25 3.31 1780.92 2.23 2525.60
DEVREKANI 41.58 33.83 1150 32 4.68 1333.88 3.06 1906.37
DIKILI 39.07 26.89 46 29 4.69 1331.41 3.07 1902.95
DIYARBAKIR 37.9 40.19 677 27 4.33 1421.11 2.85 2027.20
DORTYOL 36.85 36.22 55 27 4.33 1421.11 2.85 2027.20
DURSUNBEY 39.58 28.62 604 29 4.26 1441.14 2.81 2054.94
DUZCE 40.83 31.17 200 28 5.48 1177.52 3.52 1689.78
EDIRNE 41.67 26.57 50 27 7.36 945.79 4.53 1368.79
EDREMIT 39.58 27.02 43 28 3.99 1519.41 2.65 2163.35
ELAZIG 38.65 39.25 1000 25 5.06 1253.73 3.28 1795.35
ELBISTAN 38.2 37.18 1226 26 4.45 1390.94 2.92 1985.40
EREGLI 37.5 34.05 1053 26 3.89 1553.00 2.59 2209.88
ERGANI 38.28 39.77 1068 27 4.26 1440.30 2.81 2053.77
ERZINCAN 39.75 39.5 1200 28 4.62 1348.52 3.02 1926.65
ERZURUM 39.95 41.17 1781 28 4.64 1344.11 3.03 1920.53
Sensors 2008, 8
1272
ESKISEHIR 39.78 30.57 800 27 6.16 1077.74 3.90 1551.56
ETIMESGUT 39.95 32.68 800 27 4.70 1330.35 3.07 1901.48
FLORYA 40.98 28.8 41 28 6.18 1074.38 3.91 1546.91
GAZIANTEP 37.08 37.37 851 27 4.84 1299.79 3.15 1859.14
GEMEREK 39.18 36.07 1230 26 3.63 1645.35 2.43 2337.80
GIRESUN 40.91 38.38 86 31 6.02 1095.99 3.82 1576.85
GOKSUN 38.03 36.5 1358 26 5.16 1234.27 3.34 1768.38
GONEN 40.1 27.65 50 27 5.23 1221.73 3.38 1751.02
GOZTEPE 40.97 29.08 34 26 5.53 1169.24 3.55 1678.31
GUMUSHANE 40.47 39.47 1300 25 4.03 1508.78 2.67 2148.63
HAKKARI 37.57 43.77 1300 27 4.01 1512.90 2.66 2154.34
HINIZ 39.37 41.7 1700 27 3.52 1688.91 2.36 2398.14
IGDIR 39.93 44.05 866 28 4.90 1285.92 3.19 1839.92
IPSALA 40.93 26.4 25 27 5.28 1212.07 3.41 1737.64
ISPARTA 37.75 30.55 1101 28 4.61 1350.04 3.02 1928.75
GUZELYALI 38.43 27.17 19 28 4.61 1350.04 3.02 1928.75
K.MARAS 37.6 36.92 696 27 4.49 1381.03 2.94 1971.68
KAMAN 39.4 33.78 1007 26 3.24 1813.72 2.19 2571.03
KANGAL 39.23 37.38 1550 27 4.67 1336.42 3.05 1909.89
KARAMAN 37.3 33.33 1025 25 3.83 1574.44 2.55 2239.57
KARAPINAR 37.73 33.55 1000 26 3.79 1586.17 2.53 2255.83
KARS 40.62 43.1 1800 30 4.46 1387.44 2.93 1980.55
KASTAMONU 41.37 33.78 900 31 5.88 1115.05 3.75 1603.25
KELES 39.92 29.07 746 27 4.76 1315.72 3.11 1881.22
KESKIN 39.68 33.62 1121 26 3.31 1781.89 2.23 2526.93
KILIS 36.72 37.12 682 25 4.00 1516.85 2.65 2159.81
KIRSEHIR 39.15 34.17 1019 29 4.06 1499.87 2.69 2136.29
KOCAELI 40.77 29.93 94 28 7.20 960.70 4.45 1389.45
KONYA 37.97 32.55 1029 28 3.99 1520.41 2.65 2164.74
KOYCEGIZ 36.97 28.68 33 29 4.23 1447.89 2.79 2064.28
KUMKOY 41.24 29.03 37 25 6.24 1067.01 3.94 1536.70
KUSADASI 37.87 27.28 181 28 4.25 1444.67 2.80 2059.82
KUTAHYA 39.42 29.97 1000 26 4.52 1371.70 2.97 1958.76
MALATYA 38.35 38.32 959 27 4.54 1368.53 2.97 1954.36
MALAZGIRT 39.15 42.53 1500 24 4.06 1499.88 2.69 2136.31
MARMARIS 36.86 28.27 37 27 4.59 1355.75 3.01 1936.65
MERSIN 36.8 34.63 9 27 3.78 1590.47 2.52 2261.78
MILAS 37.32 27.78 93 28 4.84 1297.82 3.16 1856.42
MUGLA 37.22 28.37 733 26 4.91 1283.97 3.19 1837.22
MURADIYE 38.98 43.77 1700 28 3.63 1644.72 2.43 2336.93
MUS 38.73 41.52 1330 25 4.74 1320.11 3.10 1887.30
Sensors 2008, 8
1273
NAZILLI 37.92 28.33 91 28 3.83 1574.26 2.55 2239.33
NEVSEHIR 38.62 34.7 1225 24 4.95 1275.20 3.22 1825.08
NIGDE 37.97 34.68 1250 24 3.46 1716.81 2.32 2436.78
ORDU 40.98 37.9 13 30 5.52 1171.10 3.54 1680.89
OZALP 38.67 43.98 2245 30 4.47 1385.94 2.93 1978.47
POLATLI 39.58 32.15 850 26 3.91 1548.06 2.60 2203.04
RIZE 41.02 40.51 47 33 6.27 1062.45 3.96 1530.39
SAKARYA 40.78 30.42 71 28 5.12 1242.34 3.31 1779.56
SAMSUN 41.28 36.3 100 30 5.53 1169.38 3.55 1678.50
SANLIURFA 37.13 38.77 633 27 4.72 1324.46 3.08 1893.32
SELCUK 37.95 27.36 50 27 4.46 1388.23 2.93 1981.65
SENIRKENT 38.1 30.55 1170 26 3.86 1563.93 2.57 2225.02
SEYDISEHIR 37.42 31.83 1150 25 5.30 1209.42 3.42 1733.97
SIIRT 37.92 41.95 998 27 4.25 1443.61 2.80 2058.36
SILIFKE 36.38 33.93 50 26 4.04 1504.36 2.68 2142.51
SINOP 42.03 35.17 176 28 6.62 1021.54 4.14 1473.71
SIVAS 39.75 37.02 1300 27 6.18 1074.57 3.91 1547.18
SIVEREK 37.77 39.32 800 26 4.61 1350.60 3.02 1929.52
SIVRIHISAR 39.45 31.53 1100 27 6.95 985.40 4.32 1423.66
SOLHAN 38.97 41.07 1439 27 6.95 985.40 4.32 1423.66
SILE 41.18 29.62 8 25 6.63 1019.65 4.15 1471.11
TATVAN 38.48 42.3 1686 25 6.63 1019.65 4.15 1471.11
TEFENNI 37.32 29.77 1176 25 3.96 1530.60 2.63 2178.86
TEKIRDAG 40.98 27.55 62 27 6.08 1087.29 3.86 1564.80
TERCAN 39.78 40.38 1500 28 4.20 1458.78 2.77 2079.37
TOKAT 40.3 36.57 1000 28 4.56 1361.60 2.99 1944.76
TORTUM 40.3 41.55 1601 31 4.12 1482.14 2.72 2111.73
TRABZON 41 39.72 97 33 5.51 1172.19 3.54 1682.39
TUNCELI 39.12 39.53 1000 27 4.41 1400.47 2.90 1998.61
USAK 38.68 29.4 911 28 5.48 1177.64 3.52 1689.95
UZUNKOPRU 41.27 26.68 25 27 6.62 1020.79 4.15 1472.68
VAN 38.47 43.35 1667 26 3.60 1658.73 2.41 2356.33
YALOVA 40.68 29.37 37 25 5.58 1161.86 3.57 1668.09
YALVAC 38.3 31.18 1106 25 5.58 1161.86 3.57 1668.09
YATAGAN 37.35 28.13 400 26 3.53 1687.80 2.36 2396.61
YENISEHIR 40.25 29.55 239 26 8.24 874.58 4.98 1270.15
YOZGAT 39.82 34.8 1300 27 4.68 1335.04 3.06 1907.97
YUNAK 38.82 31.73 1131 26 3.53 1687.80 2.36 2396.61
ZONGULDAK 41.45 31.8 100 27 5.45 1182.39 3.50 1696.52 The price of the heating system is 490.89 USD. PBP: payback period; NPV: net present value; LPG: liquid petroleum gas.
Sensors 2008, 8
1274
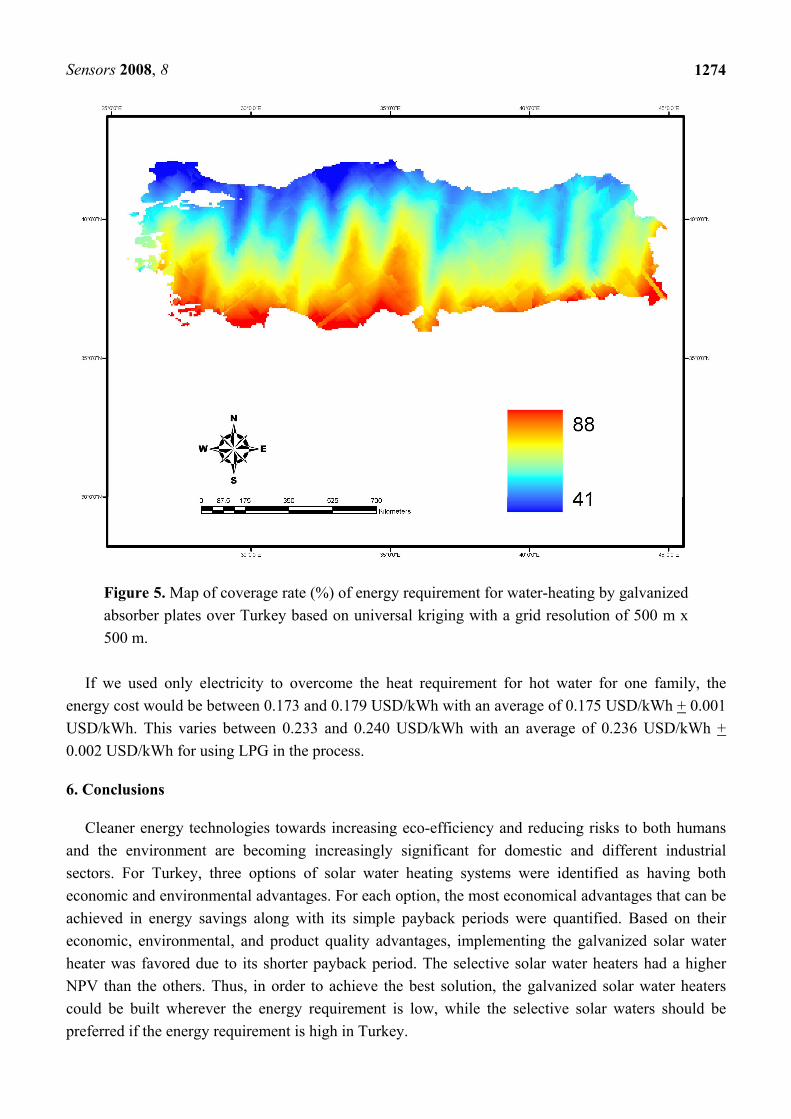
Figure 5. Map of coverage rate (%) of energy requirement for water-heating by galvanized absorber plates over Turkey based on universal kriging with a grid resolution of 500 m x 500 m.
If we used only electricity to overcome the heat requirement for hot water for one family, the
energy cost would be between 0.173 and 0.179 USD/kWh with an average of 0.175 USD/kWh + 0.001 USD/kWh. This varies between 0.233 and 0.240 USD/kWh with an average of 0.236 USD/kWh + 0.002 USD/kWh for using LPG in the process.
6. Conclusions
Cleaner energy technologies towards increasing eco-efficiency and reducing risks to both humans and the environment are becoming increasingly significant for domestic and different industrial sectors. For Turkey, three options of solar water heating systems were identified as having both economic and environmental advantages. For each option, the most economical advantages that can be achieved in energy savings along with its simple payback periods were quantified. Based on their economic, environmental, and product quality advantages, implementing the galvanized solar water heater was favored due to its shorter payback period. The selective solar water heaters had a higher NPV than the others. Thus, in order to achieve the best solution, the galvanized solar water heaters could be built wherever the energy requirement is low, while the selective solar waters should be preferred if the energy requirement is high in Turkey.
Sensors 2008, 8
1275
Acknowledgements
We gratefully acknowledge the research project grant (KARIYER-TOVAG-104O550) from the Scientific and Technological Research Council (TUBITAK) of Turkey and the Research Project Administration Units of Akdeniz University, Suleyman Demirel University, and Abant Izzet Baysal University.
References
1. Nahar, N.M. Year round performance and potential of a natural circulation type of solar water heater in India. Energy and Buildings 2003, 35, 239-247.
2. Norton, B.; Lo, S. Anatomy of a solar collector. Refocus 2006, May/June, 32-35. 3. Houri, A. Solar water heating in Lebanon: current status and future prospects. Renewable Energy
2006, 31, 663-675. 4. Chedid, R.B. Policy development for solar water heaters: the case of Lebanon. Energy Conversion
and Management 2002, 43, 77-86. 5. Hrayshat, E.S.; Al-Soud, M.S. Solar energy in Jordan: current state and prospects. Renewable and
Sustainable Energy Reviews 2004, 8, 193-200. 6. European Commission. Energy for the future: RES white paper for a community strategy and
action plan. European Commission vol. 97, 599, 1997. 7. Anonymous. General Directorate of Electrical Power Resources Survey and Development
Administration. http://www.eie.gov.tr (November 1st, 2007). 8. Anonymous. Turkey Energy Report 1995. World Energy Council-Turkish National Committee:
Ankara, 1996. 9. Anonymous. Turkish Energy Report. World Energy Council, Turkish National Committee:
Ankara, 2002 (in Turkish). 10. Zhai, X.Q.; Wang R.Z. Experiences on solar heating and cooling in China. Renewable and
Sustainable Energy Reviews 2006, doi:10.1016/j.rser.2006.10.022 (in press). 11. Anonymous. http://cdiac.ornl.gov/trends/amis/tur.htm (2007). 12. Inan, D. Time to initiate new steps for conversion of solar energy. Standard 2006, 36-39 (in
Turkish). 13. Anonymous. International Energy Agency, Energy Policies of IEA countries. Turkey-Review,
2005. 14. Maxoulis, C.N.; Charalampous H.P.; Kalogirou, S.A. Cyprus solar water heating cluster: a missed
opportunity. Energy Policy 2007, 35, 3302-3315. 15. Kaygusuz, K.; Sari, A. Renewable energy potential utilization in Turkey. Energy Conversion and
Management 2003, 44, 459-478. 16. Chen, F.; Lu, S.M.; Chang, Y.L. Renewable energy in Taiwan: its developing status and strategy.
Energy 2007, 32, 1634-1646. 17. Paul, J.K. Solar heating and cooling, recent advances. Noyes Data Corporation: New Jersey,
1979. 18. Nahar, N.M. Capital cost and economic viability of thermosyphonic solar water heaters
manufactured from alternate materials in India. Renewable Energy 2002, 26, 623-635.
Sensors 2008, 8
1276
19. Ilkan, M.; Erdil, E.; Egelioglu, F. Renewable energy sources as an alternative to modify the load curve in Northern Cyprus. Energy 2005, 30, 555-572.
20. Diakoulaki, D.; Zervos, A.; Sarafidis, J.; Mirasgedis, S. Cost-benefit analysis for solar water heating systems. Energy Conversion and Management 2001, 42, 1727-1739.
21. Merrigan, T.; Parker D. Electrical use, efficiency and peak demand of electric resistance, heat pump, desuperheater and solar hot water systems. American Council for an Energy Efficient Economy, Asilomar Conference Center, Pacific Grove: CA, 1990.
22. Biaou, A.L.; Bernier M.A. Achieving total domestic hot water production with renewable energy. Building and Environment 2008, 43, 651-660.
23. Shariah, A.; Al-Akhras, M.A.; Al-Omari I.A. Optimizing the tilt angle of solar collectors. Renewable Energy 2002, 26, 587-598.
24. Tang, R.; Wu T. Optimal tilt angles for solar collectors used in China. Applied Energy 2004, 79, 239-248.
25. Ulgen K. Optimum tilt angle for solar collectors. Energy Sources 2006, 28, 1171-1180. 26. Gunerhan, H.; Hepbasli, A. Determination of the optimum tilt angle of solar collectors for
building applications. Building and Environment 2007, 42, 779-783. 27. Klein, S.A. Calculation of monthly average insolation on tilted surfaces. Solar Energy 1977, 19,
325-329. 28. Duffie, J.A.; Beckman, W.A. Solar engineering of thermal process. John Wiley & Sons: New
York, 1991. 29. Tasdemiroglu, E.; Sever, R. Estimation of monthly average daily horizontal diffuse radiation in
Turkey. Energy 1991, 16(4), 787-790. 30. Liu, B.Y.H.; Jordan, R.C. The interrelationship and characteristic distribution of direct, diffuse
and total solar radiation. Solar Energy 1960, 4, 1-9. 31. Munroe, M.M. Estimation of totals of irradiance on a horizontal surface from UK: average
meteorological data. Solar Energy 1980, 24, 235-238. 32. Lunde P.J. Solar thermal engineering: space heating and hot water systems. John Wiley and
Sons: New York, 1980. 33. Hsieh, J.S. Solar energy engineering. Prentice Hall Inc.: New York, 1986. 34. Gordon, J. Solar energy: the state of the art. ISES: 2001. 35. Tiris, M.; Tiris, C.; Erdalli, Y. Solar water heaters. TUBITAK: Kocaeli, 1997 (in Turkish). 36. Klein, S.A. The effects of thermal capacitance upon the performance of flat plate collectors. M.Sc.
Thesis, University of Wisconsin, 1973. 37. Deris, N. Solar energy, solar water heating technique. Sermet Matbaası: Istanbul, 1979 (in
Turkish). 38. Uyarel, A.Y.; Oz, E.S. Solar energy and applications. Birsen Yayınevi: Ankara, 1987 (in
Turkish). 39. Kablan, M.M. Techno-economic analysis of the Jordanian solar water heating system. Energy
2004, 29(7), 1069-1079. 40. Yohanis, Y.G.; Popel, O.; Frid, S.E.; Norton, B. The annual number of days that solar heated
water satisfies a specified demand temperature. Solar Energy 2006, 80, 1021-1030. 41. Anonymous. http://www.igdas.com.tr/ (November 1st, 2007).
Sensors 2008, 8
1277
42. Anonymous. Central Bank of the Republic of Turkey, Inflation Reports. http://www.tcmb.gov.tr/ (November 1st, 2007).
43. Yurdakul, O. Project preparation and evaluation. Çukurova University, Faculty of Agriculture General Publication No: 147, Text Books Publication No: A-48: Adana, 1998 (in Turkish).
44. Kalogirou, S.A.; Papamarcou, C. Modeling of a thermosyphon solar water heating system and simple model validation. Renewable Energy 2000, 21, 471-493.
45. Mills, D.; Morrison, G.L. Optimisation of minimum backup solar water heating system. Solar Energy 2003, 74, 505-511.
46. Alawaji, S.H. Evaluation of solar energy research and its applications in Saudi Arabia-20 years of experience. Renewable and Sustainable Energy Reviews 2001, 5, 59-77.
47. Kablan, M.M. Forecasting the demand on solar water heating systems and their energy savings potential during the period 2001-2005 in Jordan. Energy Conversion and Management 2003, 44, 2027-2036.
48. Chang, K.K.; Lee, T.S.; Lin, W.M.; Chung, K.M. Outlook for solar water heaters in Taiwan. Energy Policy 2008, 36, 66-72.
49. Cardinale, N.; Piccininni, F.; Stefanizzi, P. Economic optimization of low flow solar domestic hot water plants. Renewable Energy 2003, 28, 1899-1914.
50. ESRI Inc. ArcGIS 8.2. ESRI Inc.: Redlands, 2002. 51. Deutsch, C.V.; Journel, A.G. GSLIB: Geostatistical Software Library and User's Guide. Oxford
University Press: Oxford, 1998.
© 2008 by MDPI (http://www.mdpi.org). Reproduction is permitted for noncommercial purposes.