Embed Size (px)
Citation preview
Techno-Economic Analysis of Green Methanol andGreen BTX Production from Syngases
Frederik Meyer ElimarNicolai Hermann Rasmussen
Nikolaj Hornshøj Petersen
Energy Technology, TEPE4-1014, 2021
Master’s Thesis
ST
U
D E N T R E P O R T

SummaryThe use of carbon neutral fuels and chemicals is receiving an increased interest from bothindustry and private consumers, as the need to reduce one’s carbon footprint is increas-ingly encouraged. This carbon reduction requires modification to numerous aspects inindustries and private consumer habits. One of these aspects is to produce carbon neutralfuels and chemicals.
This is the aim of the presented study, which seeks to investigate the feasibility ofproducing Green methanol that may serve as a fuel or it may be converted into otherGreen chemicals. This production of Green methanol is achieved through a process thatconsumes CO2 and H2, which are obtained from carbon capture and water electrolysis.The CO2 is captured from the flue gas of RenoNord, whose CO2 emission serves as thesize to which the remainder of the system is scaled. The CO2 is removed from the flue gasusing an absorber/stripper system, where a solvent is utilised to transport the CO2 fromthe flue gas into a pure CO2 stream for the methanol synthesis. The H2 is produced usingan alkaline electrolyser cell, where water is split into its two constituents, being hydrogenand oxygen. The H2 is used in the methanol synthesis, while the O2 can be sold as aseparate product. The electricity required for all processes is partly supplied by on-sitewind turbines and photovoltaic panels, while the remainder is assumed to be supplied byexternal renewable sources.
The methanol synthesis is done using an adiabatic reactor equipped with a packed cata-lyst consisting of Cu/ZnO/Al3O3, in which hydrogenation of CO2- and a reverse water-gasshift reaction occur. The ensuing product stream consists of water, methanol and dissolvedgases, which is sent through two distillations to yield fuel grade methanol. The methanolmay also be further treated to produce larger organic molecules, i.e. chemicals, such asbenzene, toluene and xylene (BTX). This is achieved in an adiabatic reactor packed witha ZSM-5 catalyst where 13 different reactions occur, yielding 17 species. Similar to themethanol synthesis, the product stream from the BTX synthesis also contains a significantamount of water along with a multitude of Light Gases, Alkanes and Aromatic molecules,which may be separated.
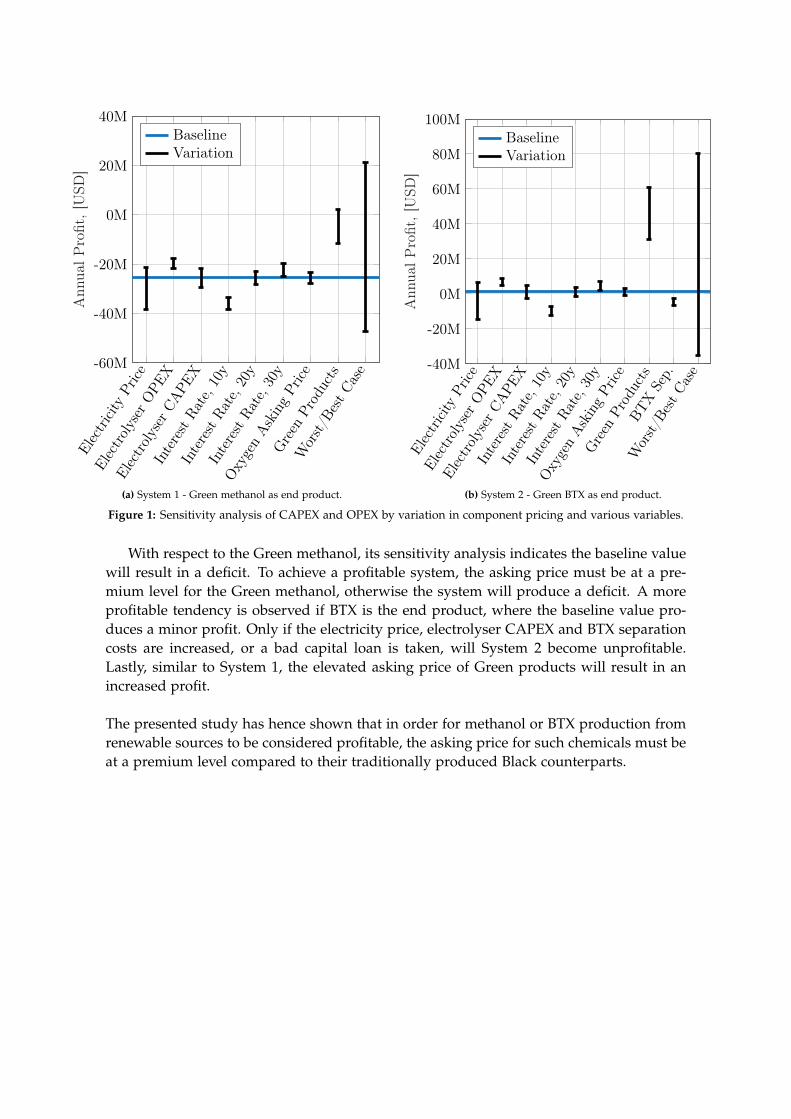
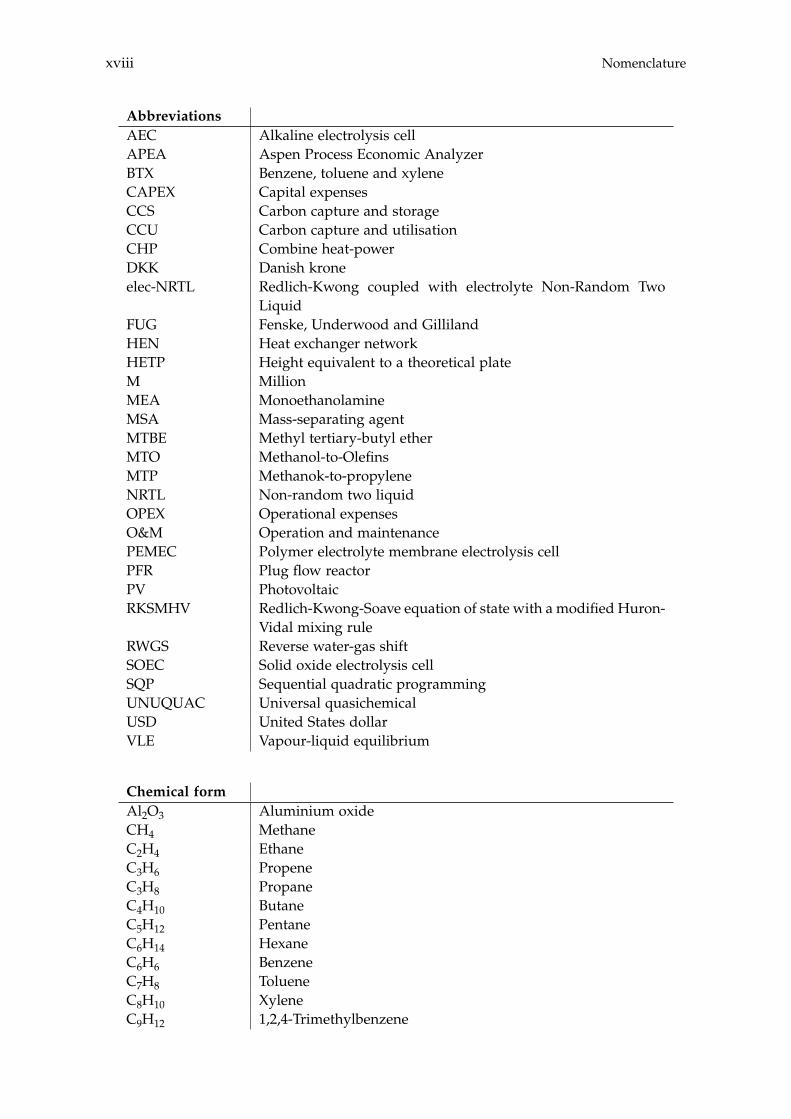
The feasibility of producing either methanol or BTX, also designated as System 1 andSystem 2, respectively, is determined based on a capital expenses (CAPEX) and operationalexpenses (OPEX) analysis of both systems. All components modelled in the Aspen Plussoftware have their CAPEX and OPEX determined by the add-on ’Aspen Process EconomicAnalyzer’, while any additional components are investigated through the literature. Withthe asking price of the products from both systems defined, the profit, when accountingfor the CAPEX and OPEX, can be determined. In order to investigate the sensitivity ofthe potential profits, a sensitivity analysis is conducted for both systems, where the mostinfluential components and parameters are varied to analyse their impact. The results ofthese sensitivity analyses are shown in Figure 1 on page iv.
iii
Elec
tricit
yPr
ice
Elec
trolys
erOP
EX
Elec
trolys
erCA
PEX
Inte
rest
Rate
, 10y
Inte
rest
Rate
, 20y
Inte
rest
Rate
, 30y
Oxyg
enAs
king
Price
Gree
nPr
oduc
ts
Wor
st/Be
stCa
se-60M
-40M
-20M
0M
20M
40M
Ann
ualP
rofit
,[U
SD]
BaselineVariation
(a) System 1 - Green methanol as end product.
Elec
tricit
yPr
ice
Elec
trolys
erOP
EX
Elec
trolys
erCA
PEX
Inte
rest
Rate
, 10y
Inte
rest
Rate
, 20y
Inte
rest
Rate
, 30y
Oxyg
enAs
king
Price
Gree
nPr
oduc
tsBT
XSe
p.
Wor
st/Be
stCa
se
-40M
-20M
0M
20M
40M
60M
80M
100M
Ann
ualP
rofit
,[U
SD]
BaselineVariation
(b) System 2 - Green BTX as end product.
Figure 1: Sensitivity analysis of CAPEX and OPEX by variation in component pricing and various variables.
With respect to the Green methanol, its sensitivity analysis indicates the baseline valuewill result in a deficit. To achieve a profitable system, the asking price must be at a pre-mium level for the Green methanol, otherwise the system will produce a deficit. A moreprofitable tendency is observed if BTX is the end product, where the baseline value pro-duces a minor profit. Only if the electricity price, electrolyser CAPEX and BTX separationcosts are increased, or a bad capital loan is taken, will System 2 become unprofitable.Lastly, similar to System 1, the elevated asking price of Green products will result in anincreased profit.
The presented study has hence shown that in order for methanol or BTX production fromrenewable sources to be considered profitable, the asking price for such chemicals must beat a premium level compared to their traditionally produced Black counterparts.
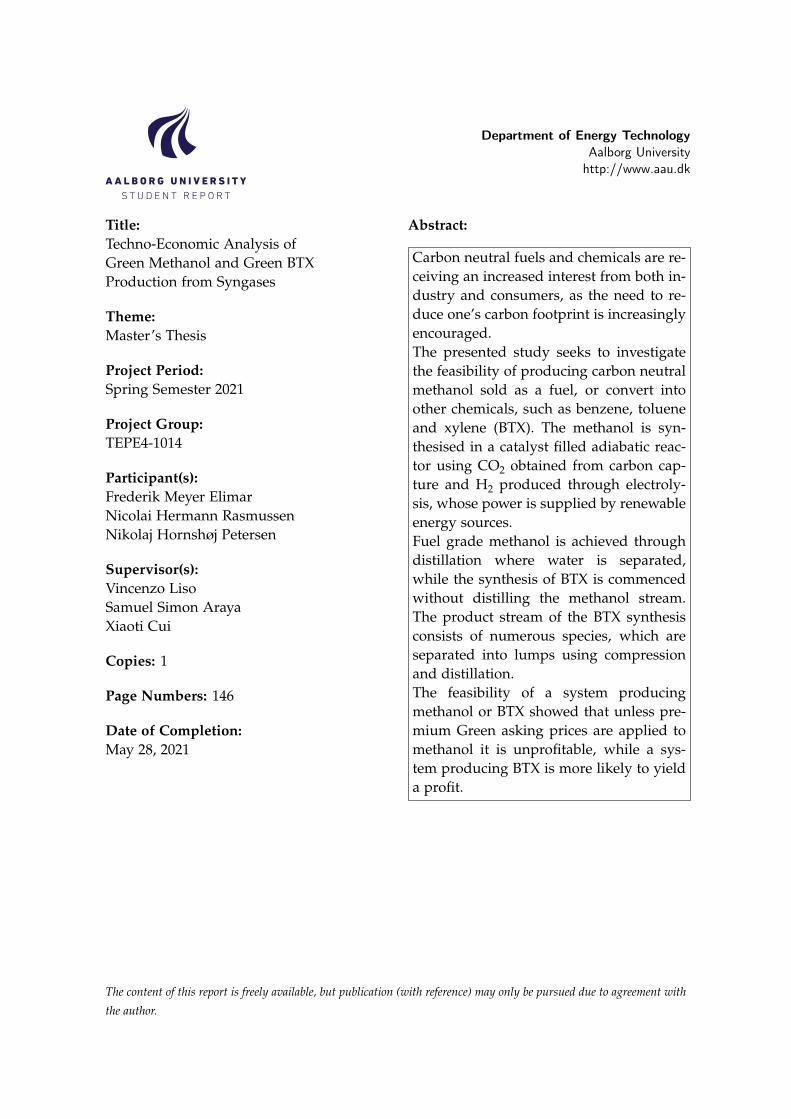
Department of Energy TechnologyAalborg University
http://www.aau.dk
Title:Techno-Economic Analysis ofGreen Methanol and Green BTXProduction from Syngases
Theme:Master’s Thesis
Project Period:Spring Semester 2021
Project Group:TEPE4-1014
Participant(s):Frederik Meyer ElimarNicolai Hermann RasmussenNikolaj Hornshøj Petersen
Supervisor(s):Vincenzo LisoSamuel Simon ArayaXiaoti Cui
Copies: 1
Page Numbers: 146
Date of Completion:May 28, 2021
Abstract:
Carbon neutral fuels and chemicals are re-ceiving an increased interest from both in-dustry and consumers, as the need to re-duce one’s carbon footprint is increasinglyencouraged.The presented study seeks to investigatethe feasibility of producing carbon neutralmethanol sold as a fuel, or convert intoother chemicals, such as benzene, tolueneand xylene (BTX). The methanol is syn-thesised in a catalyst filled adiabatic reac-tor using CO2 obtained from carbon cap-ture and H2 produced through electroly-sis, whose power is supplied by renewableenergy sources.Fuel grade methanol is achieved throughdistillation where water is separated,while the synthesis of BTX is commencedwithout distilling the methanol stream.The product stream of the BTX synthesisconsists of numerous species, which areseparated into lumps using compressionand distillation.The feasibility of a system producingmethanol or BTX showed that unless pre-mium Green asking prices are applied tomethanol it is unprofitable, while a sys-tem producing BTX is more likely to yielda profit.
The content of this report is freely available, but publication (with reference) may only be pursued due to agreement withthe author.

[This page is intentionally left blank]
Contents
Preface xi
Nomenclature xv
1 Motivation and Objective 11.1 Renewable Methanol . . . . . . . . . . . . . . . . . . . . . . . . . . . . . . . . . 2
1.1.1 Renewable Carbon Dioxide . . . . . . . . . . . . . . . . . . . . . . . . . 21.1.2 Renewable Hydrogen . . . . . . . . . . . . . . . . . . . . . . . . . . . . 2
1.2 State of the Art Plants . . . . . . . . . . . . . . . . . . . . . . . . . . . . . . . . 31.3 Plant Sizing . . . . . . . . . . . . . . . . . . . . . . . . . . . . . . . . . . . . . . 31.4 Fluctuating Feedstock Supply and Energy . . . . . . . . . . . . . . . . . . . . 5
1.4.1 Carbon Dioxide . . . . . . . . . . . . . . . . . . . . . . . . . . . . . . . . 51.4.2 Wind Power . . . . . . . . . . . . . . . . . . . . . . . . . . . . . . . . . . 61.4.3 Solar Power . . . . . . . . . . . . . . . . . . . . . . . . . . . . . . . . . . 7
1.5 Overall Process . . . . . . . . . . . . . . . . . . . . . . . . . . . . . . . . . . . . 81.6 Objective . . . . . . . . . . . . . . . . . . . . . . . . . . . . . . . . . . . . . . . . 10
2 System Analysis 112.1 Carbon Capture . . . . . . . . . . . . . . . . . . . . . . . . . . . . . . . . . . . . 11
2.1.1 Combustion Technologies . . . . . . . . . . . . . . . . . . . . . . . . . . 112.1.2 Carbon Capture Technologies . . . . . . . . . . . . . . . . . . . . . . . . 122.1.3 Absorption Carbon Capture . . . . . . . . . . . . . . . . . . . . . . . . 13
2.2 Electrolyser . . . . . . . . . . . . . . . . . . . . . . . . . . . . . . . . . . . . . . 152.3 Storage of Gases . . . . . . . . . . . . . . . . . . . . . . . . . . . . . . . . . . . . 19
2.3.1 Hydrogen Storage Technologies . . . . . . . . . . . . . . . . . . . . . . 192.3.2 Compressed Storage . . . . . . . . . . . . . . . . . . . . . . . . . . . . . 20
2.4 Methanol Synthesis . . . . . . . . . . . . . . . . . . . . . . . . . . . . . . . . . . 202.5 Liquid-Liquid Separation of Methanol . . . . . . . . . . . . . . . . . . . . . . . 23
2.5.1 Distillation . . . . . . . . . . . . . . . . . . . . . . . . . . . . . . . . . . . 242.5.2 Flash Distillation . . . . . . . . . . . . . . . . . . . . . . . . . . . . . . . 262.5.3 Fractional Distillation . . . . . . . . . . . . . . . . . . . . . . . . . . . . 27
2.6 Methanol to Alternative Products . . . . . . . . . . . . . . . . . . . . . . . . . . 35
3 Dynamic Modelling 393.1 Carbon Capture . . . . . . . . . . . . . . . . . . . . . . . . . . . . . . . . . . . . 40
3.1.1 Absorber . . . . . . . . . . . . . . . . . . . . . . . . . . . . . . . . . . . . 413.1.2 Stripper . . . . . . . . . . . . . . . . . . . . . . . . . . . . . . . . . . . . 433.1.3 Additional Components . . . . . . . . . . . . . . . . . . . . . . . . . . . 43
vii
viii Contents
3.1.4 Dynamic Carbon Capture . . . . . . . . . . . . . . . . . . . . . . . . . . 453.2 Storage of Carbon Dioxide . . . . . . . . . . . . . . . . . . . . . . . . . . . . . . 46
3.2.1 Storage Tank Analysis . . . . . . . . . . . . . . . . . . . . . . . . . . . . 463.2.2 Optimisation of Compressor . . . . . . . . . . . . . . . . . . . . . . . . 48
3.3 Electrolysis . . . . . . . . . . . . . . . . . . . . . . . . . . . . . . . . . . . . . . . 503.3.1 Wind Turbines and Photovoltaic Panels . . . . . . . . . . . . . . . . . . 513.3.2 Storage of Hydrogen . . . . . . . . . . . . . . . . . . . . . . . . . . . . . 55
4 Steady State Modelling 594.1 Methanol Synthesis . . . . . . . . . . . . . . . . . . . . . . . . . . . . . . . . . . 59
4.1.1 Optimisation of Methanol Production . . . . . . . . . . . . . . . . . . . 604.2 Separation of Methanol . . . . . . . . . . . . . . . . . . . . . . . . . . . . . . . 63
4.2.1 Degassing of Liquid Phase . . . . . . . . . . . . . . . . . . . . . . . . . 644.2.2 Distillation of Liquid-Liquid . . . . . . . . . . . . . . . . . . . . . . . . 69
4.3 BTX Synthesis . . . . . . . . . . . . . . . . . . . . . . . . . . . . . . . . . . . . . 734.3.1 Feed Composition . . . . . . . . . . . . . . . . . . . . . . . . . . . . . . 774.3.2 Distillation of BTX . . . . . . . . . . . . . . . . . . . . . . . . . . . . . . 82
5 Heat- and Mass Integration 895.1 System 1: Methanol as End Product . . . . . . . . . . . . . . . . . . . . . . . . 905.2 System 2: BTX as End Product . . . . . . . . . . . . . . . . . . . . . . . . . . . 96
6 Economic Assessment of the Systems 1036.1 Economics of Subsystems . . . . . . . . . . . . . . . . . . . . . . . . . . . . . . 103
6.1.1 Carbon Capture . . . . . . . . . . . . . . . . . . . . . . . . . . . . . . . . 1046.1.2 Hydrogen and Carbon Dioxide Storage . . . . . . . . . . . . . . . . . . 1046.1.3 Electrolysis . . . . . . . . . . . . . . . . . . . . . . . . . . . . . . . . . . 1046.1.4 Wind- and Solar Power . . . . . . . . . . . . . . . . . . . . . . . . . . . 1056.1.5 Methanol Synthesis . . . . . . . . . . . . . . . . . . . . . . . . . . . . . . 1056.1.6 BTX Synthesis . . . . . . . . . . . . . . . . . . . . . . . . . . . . . . . . . 1056.1.7 Separation of System 2 Products . . . . . . . . . . . . . . . . . . . . . . 106
6.2 Economics of Additional Parameters . . . . . . . . . . . . . . . . . . . . . . . . 1066.2.1 Electricity Price . . . . . . . . . . . . . . . . . . . . . . . . . . . . . . . . 1066.2.2 Initial CAPEX Loan . . . . . . . . . . . . . . . . . . . . . . . . . . . . . 1076.2.3 Oxygen Production and Price . . . . . . . . . . . . . . . . . . . . . . . . 1076.2.4 Green Chemicals . . . . . . . . . . . . . . . . . . . . . . . . . . . . . . . 1086.2.5 Heating and Cooling . . . . . . . . . . . . . . . . . . . . . . . . . . . . . 108
6.3 CAPEX of the Systems . . . . . . . . . . . . . . . . . . . . . . . . . . . . . . . . 1106.4 OPEX of the Systems . . . . . . . . . . . . . . . . . . . . . . . . . . . . . . . . . 1126.5 Economic Assessment . . . . . . . . . . . . . . . . . . . . . . . . . . . . . . . . 1146.6 Sensitivity Analysis . . . . . . . . . . . . . . . . . . . . . . . . . . . . . . . . . . 115
6.6.1 Sensitivity Analysis for System 1 . . . . . . . . . . . . . . . . . . . . . . 1166.6.2 Sensitivity Analysis for System 2 . . . . . . . . . . . . . . . . . . . . . . 118
7 Discussion 1217.1 Cooling . . . . . . . . . . . . . . . . . . . . . . . . . . . . . . . . . . . . . . . . . 1217.2 Product Distribution of System 2 . . . . . . . . . . . . . . . . . . . . . . . . . . 122
8 Conclusion 123

Contents ix
Bibliography 125
A Acquired Results from the Sensitivity Analysis of Flash Distillation 138
B Distillation Column Diameter 140
C BTX Conversion Rates 145

[This page is intentionally left blank]
Preface
This Master’s Thesis has been written by the project group TEPE4-1014 at the Depart-ment of Energy Technology at Aalborg University, with specialisation in Thermal Energyand Process Engineering during the spring semester of 2021. The objective of this project,prescribed as ’the presented study’ from here on out, is to assess the feasibility of produc-ing Green methanol and determine if it would be lucrative to further convert the producedGreen methanol into other Green chemicals. The Green methanol is produced by a processwhich consumes CO2 and H2. The CO2 is captured from the flue gas exiting the inciner-ation plant of RenoNord, where biomass is combusted. Furthermore, the H2 is acquiredthrough an electrolysis of water which is powered by renewable energy. Two systems aredesigned where the end product of the first system is methanol and chemicals (BTX) forthe second, named System 1 and System 2, respectively. In order to estimate the potentialfeasibility of each system, both must be modelled in order to determine the capital- andoperational expenses of both systems.
During this Master’s Thesis the following software have been utilised:
• Aspen Plus V9 - Performing process modelling.• Aspen Process Economic Analyzer V9 - Estimate component- and utility costs.• Engineering Equation Solver - Look up physical properties of species, and model
the electrolysis process and storage of gases.• Excel - Processing data.• Graph - Extrapolate or interpolate data from literature.• Inkscape - Produce illustrative figures.• Maple - Perform calculations.• MatLAB - Create McCabe-Thiele diagrams.• Overleaf - Writing and formatting the presented study.• PGFPlots - Create plots and other illustrative figures.• WebPlotDigitizer - Extract data from plots and images listed in literature.
Readers’ Guide
On page vii, the Table of Contents can be found. Viewing this document as a PDF theTable of Contents will function with hyper-links allowing fast navigation to the desiredchapters and sections.
The nomenclature on page xv lists the different subscripts, superscripts, abbreviations,chemical formulas, notations and symbols along with their respective units. They will bepresented in alphabetical order.
xi
xii Preface
The bibliography on page 125 presents the sources and literature used in the presentedstudy. The bibliography is structured according to the Harvard format, and is henceordered alphabetically with respect to the authors. The reference will be placed prior tothe subsequent period if refer to the current sentence. Whereas if it placed after the periodit refers to the presented segment.
The units used in the presented study will be following the metric system. Decimal num-bers will be indicated with a dot, while a comma will function as a thousands separator.
The graphs used in the presented study can either be single y-axis graphs or dual y-axisgraphs. In order to distinct between what function is associated to which axis in a dualy-axis graph, a solid lined function will be associated to the left axis, while a dotted line isassociated to the right axis.
All chapters, sections and subsections are labelled with a unique number according to theorder of which they are presented. The figures and tables are numbered similarly, forinstance "Figure 5.3" refers to the third figure in Chapter 5. Viewing in a PDF format thesereferences work as hyperlinks.
When equations are presented they will have a number assigned in the right margin.This number will be used for referencing to the equation. Viewing in a PDF format thereferences work as hyperlinks. The variables used in the equations will only be explainedthe first time they are used.
The final pages of this Master’s thesis consist of the Appendices. The appendices containadditional results or calculations. The appendices will, in contrary to the other chapters,be assigned a letter which is ordered alphabetically.
Finally, it is recommended to read the presented study in a colourised format to get theoptimum visual- and reading experience, mainly in regards to the graphs and figures.
Chapter Structure
Chapter 1 on page 1 will shortly present the required species when producing Greenmethanol, being CO2 and H2, and further also the state of the art of such plants. Addition-ally, the challenges of utilising renewable energy sources will be presented which resultsin a general process design. Finally, the objective of this Master’s Thesis will be presented.
As it is desired to either produce Green methanol or further convert this into otherGreen chemicals, it is necessary to understand each of the subsystems presented in theprocess design. This will be presented in Chapter 2.
Chapter 2 on page 11 describes all the theories, concepts and reactions necessary tomodel each of these subsystems. Some subsystems are modelled as dynamic whereas theremainder are modelled as steady state. The dynamic- and steady state subsystems willbe modelled in Chapter 3 and 4, respectively.
Chapter 3 on page 39 seeks to implement the general theories and concepts for thedynamic subsystems into a dynamic model. This includes the carbon capture and the
Preface xiii
electrolyser due to their fluctuating production. As it is desired to model the consecutivesubsystems as steady state, storage of CO2 and H2 is implemented in order to couple thedynamic- and steady state models.
Chapter 4 on page 59 seeks to implement the general theories and concepts for thesteady state subsystems into two steady state systems, differentiated by their desired endproducts. The first system produces Green methanol, while the second further convertsthe Green methanol into other Green chemicals. With the two complete systems defined,heat- and mass integration between the subsystems can be performed in order to reducethe utility costs of the two systems. This will be done in Chapter 5.
Chapter 5 on page 89 performs heat- and mass integration of the two systems. With thesystems being optimised with respect to the excess heat and mass within each system,the costs of both systems can be estimated in order to determine the feasibility of the twosystems. This will be done in Chapter 6.
Chapter 6 on page 103 performs the feasibility assessment of the two systems. Asensitivity analysis for each system is conducted in order to determine the uncertaintyof the feasibility for both systems, depending on specific parameters. A multitude ofassumptions are made throughout this Master’s thesis, where the most influential requirea discussion.
Chapter 7 on page 121 discusses these assumptions in order to justify if they are acceptable.
Chapter 8 on page 123 concludes the presented Master’s Thesis and summarises theacquired results.
This Master’s Thesis has been written by the following authors:
Signatures of project participants
Frederik Meyer Elimar<[email protected]>
Nicolai Hermann Rasmussen<[email protected]>
Nikolaj Hornshøj Petersen<[email protected]>
Aalborg University, May 28, 2021

[This page is intentionally left blank]
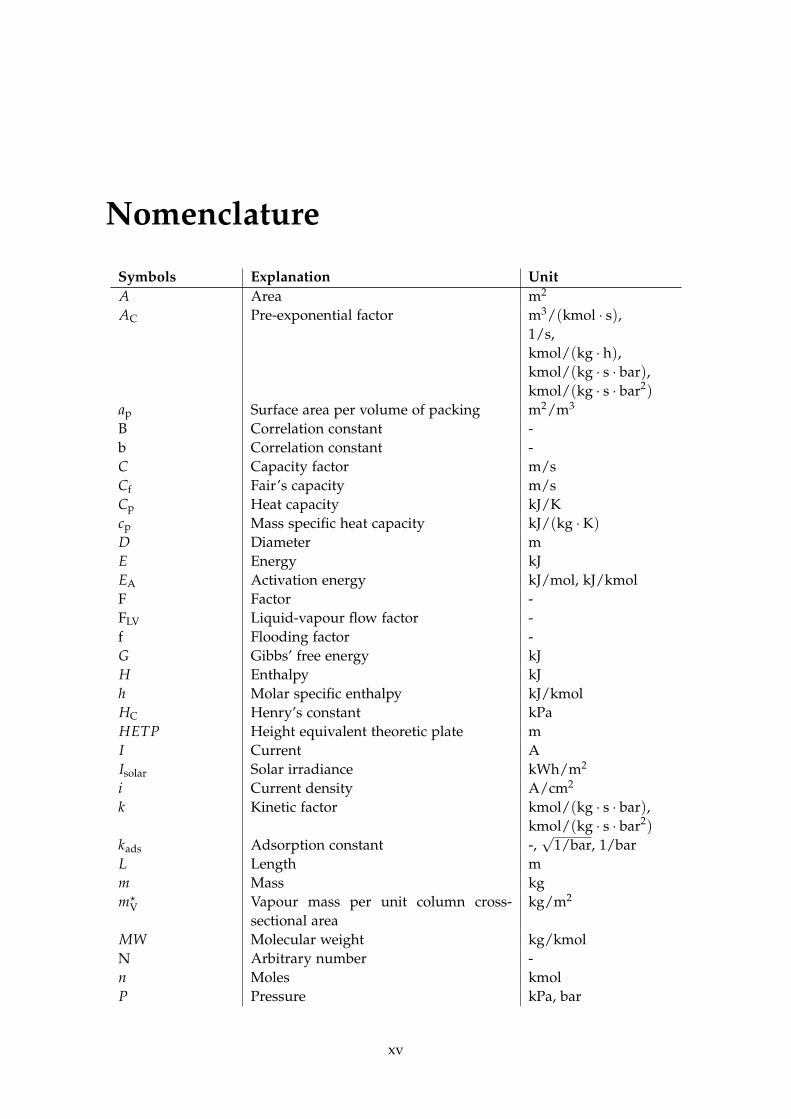
Nomenclature
Symbols Explanation UnitA Area m2
AC Pre-exponential factor m3/(kmol · s),1/s,kmol/(kg · h),kmol/(kg · s · bar),kmol/(kg · s · bar2)
ap Surface area per volume of packing m2/m3
B Correlation constant -b Correlation constant -C Capacity factor m/sCf Fair’s capacity m/sCp Heat capacity kJ/Kcp Mass specific heat capacity kJ/(kg · K)D Diameter mE Energy kJEA Activation energy kJ/mol, kJ/kmolF Factor -FLV Liquid-vapour flow factor -f Flooding factor -G Gibbs’ free energy kJH Enthalpy kJh Molar specific enthalpy kJ/kmolHC Henry’s constant kPaHETP Height equivalent theoretic plate mI Current AIsolar Solar irradiance kWh/m2
i Current density A/cm2
k Kinetic factor kmol/(kg · s · bar),kmol/(kg · s · bar2)
kads Adsorption constant -,p
1/bar, 1/barL Length mm Mass kgm?
V Vapour mass per unit column cross-sectional area
kg/m2
MW Molecular weight kg/kmolN Arbitrary number -n Moles kmolP Pressure kPa, bar
xv
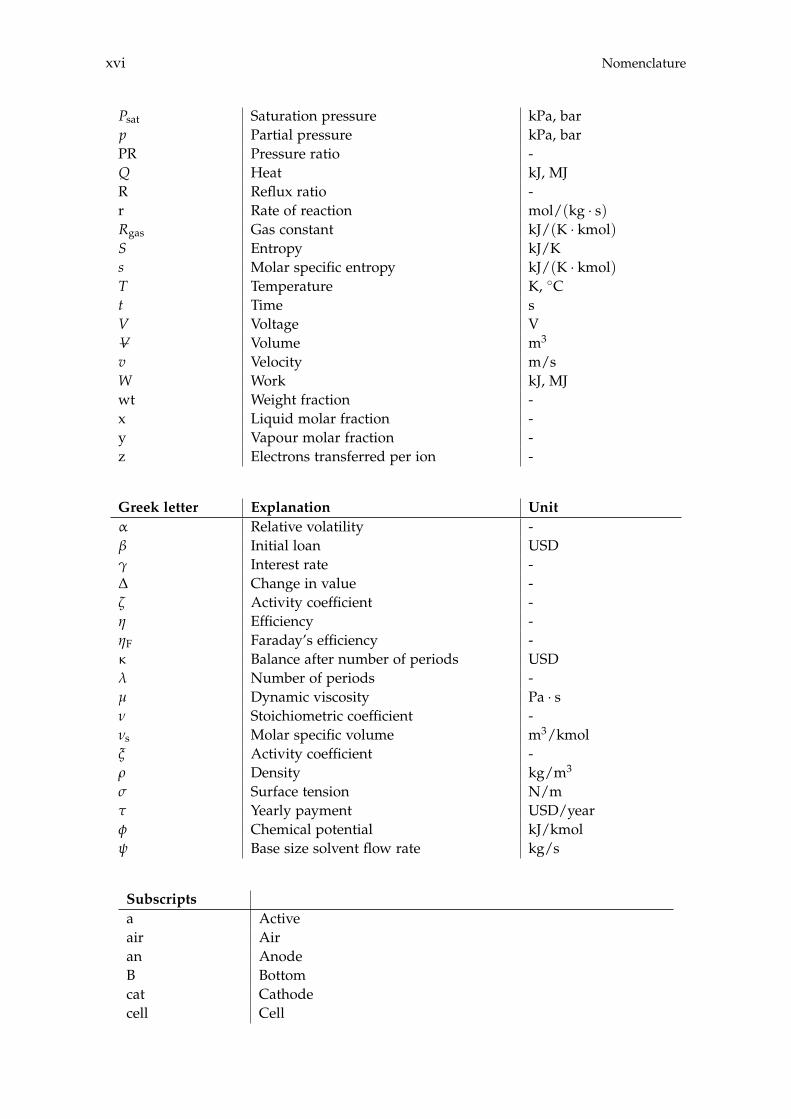
xvi Nomenclature
Psat Saturation pressure kPa, barp Partial pressure kPa, barPR Pressure ratio -Q Heat kJ, MJR Reflux ratio -r Rate of reaction mol/(kg · s)Rgas Gas constant kJ/(K · kmol)S Entropy kJ/Ks Molar specific entropy kJ/(K · kmol)T Temperature K, �Ct Time sV Voltage V�V Volume m3
v Velocity m/sW Work kJ, MJwt Weight fraction -x Liquid molar fraction -y Vapour molar fraction -z Electrons transferred per ion -
Greek letter Explanation Unit↵ Relative volatility -b Initial loan USDg Interest rate -D Change in value -z Activity coefficient -h Efficiency -hF Faraday’s efficiency - Balance after number of periods USDl Number of periods -µ Dynamic viscosity Pa · sn Stoichiometric coefficient -ns Molar specific volume m3/kmolx Activity coefficient -r Density kg/m3
s Surface tension N/mt Yearly payment USD/yearf Chemical potential kJ/kmoly Base size solvent flow rate kg/s
Subscriptsa Activeair Airan AnodeB Bottomcat Cathodecell Cell
Nomenclature xvii
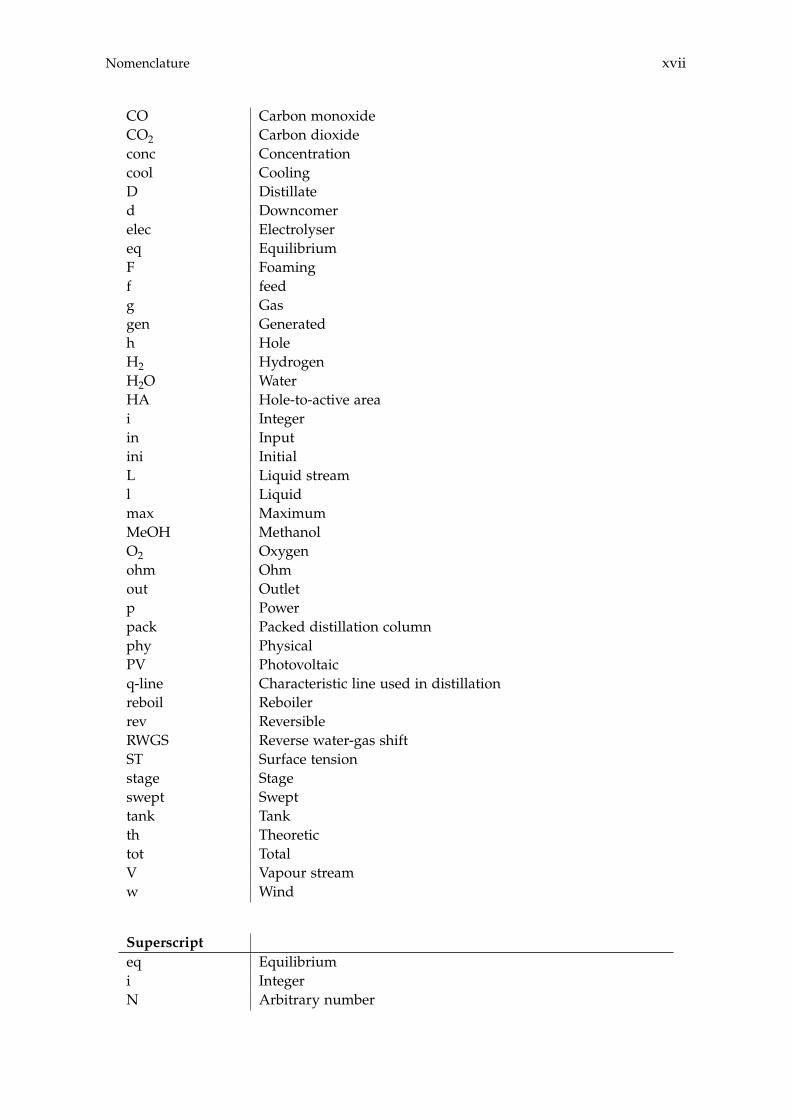
CO Carbon monoxideCO2 Carbon dioxideconc Concentrationcool CoolingD Distillated Downcomerelec Electrolysereq EquilibriumF Foamingf feedg Gasgen Generatedh HoleH2 HydrogenH2O WaterHA Hole-to-active areai Integerin Inputini InitialL Liquid streaml Liquidmax MaximumMeOH MethanolO2 Oxygenohm Ohmout Outletp Powerpack Packed distillation columnphy PhysicalPV Photovoltaicq-line Characteristic line used in distillationreboil Reboilerrev ReversibleRWGS Reverse water-gas shiftST Surface tensionstage Stageswept Swepttank Tankth Theoretictot TotalV Vapour streamw Wind
Superscripteq Equilibriumi IntegerN Arbitrary number
xviii Nomenclature
AbbreviationsAEC Alkaline electrolysis cellAPEA Aspen Process Economic AnalyzerBTX Benzene, toluene and xyleneCAPEX Capital expensesCCS Carbon capture and storageCCU Carbon capture and utilisationCHP Combine heat-powerDKK Danish kroneelec-NRTL Redlich-Kwong coupled with electrolyte Non-Random Two
LiquidFUG Fenske, Underwood and GillilandHEN Heat exchanger networkHETP Height equivalent to a theoretical plateM MillionMEA MonoethanolamineMSA Mass-separating agentMTBE Methyl tertiary-butyl etherMTO Methanol-to-OlefinsMTP Methanok-to-propyleneNRTL Non-random two liquidOPEX Operational expensesO&M Operation and maintenancePEMEC Polymer electrolyte membrane electrolysis cellPFR Plug flow reactorPV PhotovoltaicRKSMHV Redlich-Kwong-Soave equation of state with a modified Huron-
Vidal mixing ruleRWGS Reverse water-gas shiftSOEC Solid oxide electrolysis cellSQP Sequential quadratic programmingUNUQUAC Universal quasichemicalUSD United States dollarVLE Vapour-liquid equilibrium
Chemical formAl2O3 Aluminium oxideCH4 MethaneC2H4 EthaneC3H6 PropeneC3H8 PropaneC4H10 ButaneC5H12 PentaneC6H14 HexaneC6H6 BenzeneC7H8 TolueneC8H10 XyleneC9H12 1,2,4-Trimethylbenzene
Nomenclature xix
C10H14 1,2,4,5-TetramethylbenzeneCO Carbon monoxideCO2 Carbon dioxideCu CopperH2 HydrogenMeOH, CH3OH MethanolN2 NitrogenO2 OxygenZnO Zinc oxide
Notationx Time derivative[x] Concentrationrx Gradientx Time averagex⇠ Time fluctuating

[This page is intentionally left blank]
Chapter 1
Motivation and ObjectiveBefore the reader embarks on reading through the following chapters of the presented study, it ishighly encouraged that the reader reviews the Readers’ Guide presented on page xi in order to geta thorough understanding of the structure in which the following chapters are presented and theirintercorrelation.
The motivation of the presented study originates in the vision of a future where renewableenergy is the main source of energy. The renewable energy is not only of great importancewith respect to the electricity demand, but also for instance in the transport- and chemicalsector. The incorporation of renewable energy into the transport sector is slowly increas-ing from 1.4 % in 2004 to 8 % in 2018 for the members of the European Union [eurostat,2020]. Furthermore, as the technological development continues, indispensable productsare desired to be manufactured from renewable energy sources as well.
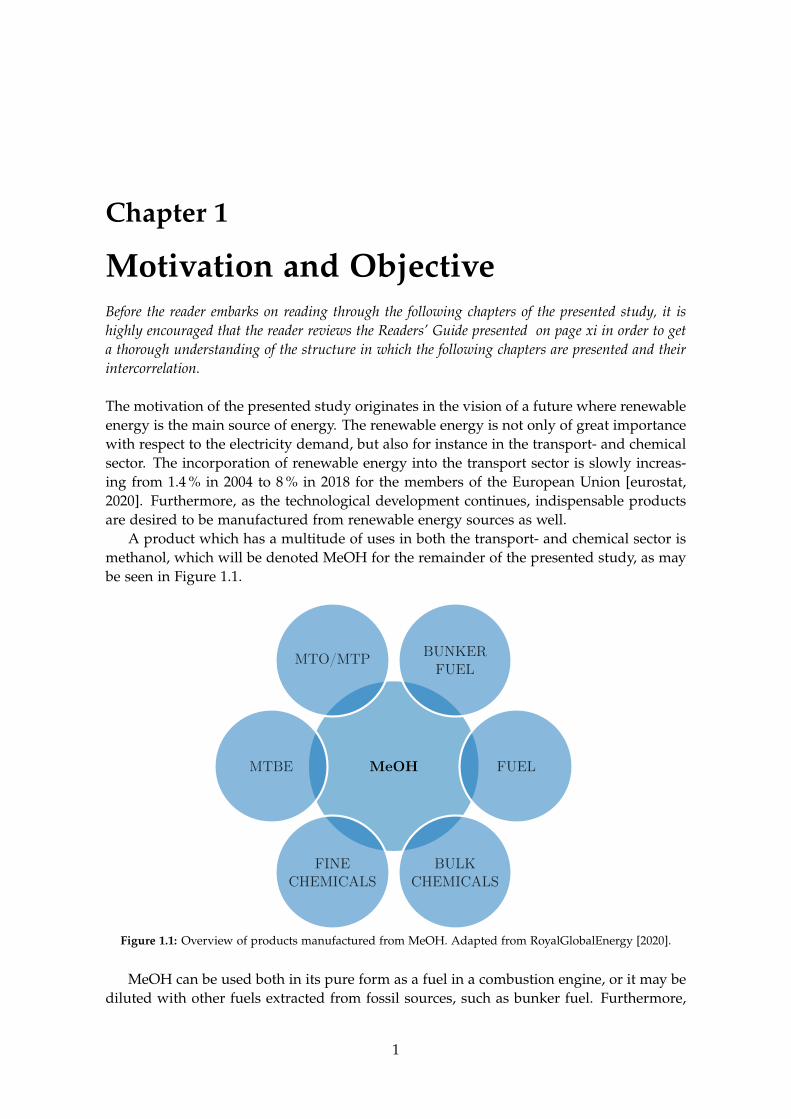
A product which has a multitude of uses in both the transport- and chemical sector ismethanol, which will be denoted MeOH for the remainder of the presented study, as maybe seen in Figure 1.1.
MeOH
BUNKERFUEL
MTO/MTP
MTBE
FINECHEMICALS
BULKCHEMICALS
FUEL
Figure 1.1: Overview of products manufactured from MeOH. Adapted from RoyalGlobalEnergy [2020].
MeOH can be used both in its pure form as a fuel in a combustion engine, or it may bediluted with other fuels extracted from fossil sources, such as bunker fuel. Furthermore,
1
2 Chapter 1. Motivation and Objective
it can be processed into methyl tertiary-butyl ether (MTBE) which can replace otherwisetoxic, yet necessary, additives in the petrol fuel [ICIS, 2010]. Among other chemicals,conversion of MeOH-to-Olefins (MTO) and MeOH-to-propylene (MTP) can be performed,which are used in the plastic production industry [Americanchemistry, 2020][LindeGas,2020]. Due to this variety, it is of interest to further investigate the business potential ofMeOH both as a product but also as an intermediate.
However, in order to ensure the vision of a future where the use of fossil fuels arereduced, the MeOH must be produced from renewable energy sources.
1.1 Renewable Methanol
The classification of renewable MeOH is defined by how the syngases, which are usedto make the MeOH, are produced. In order for the MeOH to be considered Green, thesynthetic gases must be produced from renewable sources with net zero CO2 emission.The traditional MeOH is produced from fossil resources, such as natural gas, coal andcrude oil, which is classified as Black MeOH.[Hobson and Márquez, 2018] Similarly, theMeOH can also be identified as Grey of which the synthetic gases are produced from wasteor by-products, which are only partially renewable.
1.1.1 Renewable Carbon Dioxide
The reactants used to produce Green MeOH are CO2 and H2. As already claimed thesemust be acquired from renewable sources. The source of CO2 could be provided by eitherextracting it from the air directly or from the flue gas of a plant run on biomass. Thetechnologies for capturing CO2 from the atmosphere is however still at a research state ofwhich this method is not viable [Bui et al., 2018].
For instance, the flue gas from biogas plants contains 30 % to 45 % CO2 and inbioethanol plants up to 85 %, both on a volume basis.[Benato et al., 2017][Laude et al.,2011]. As such it would be advantageous to use this produced CO2 to supply the MeOHproduction plant, which will also be economically lucrative for the biomass plant, due tothe ensuing avoidance of carbon emission fees.
1.1.2 Renewable Hydrogen
To achieve a Green MeOH production the second reactant, H2, must as mentioned alsobe obtained through renewable methods. Currently, the vast majority of H2 productionis achieved through reforming of natural gases and other fossil fuels, i.e. Black H2 isproduced, which accounts for about 90 % of the total production.[Liu et al., 2021][Hosseiniand Wahid, 2016]
However, other methods for H2 production exist, such as water electrolysis, where thepotential of utilising renewable energy sources is possible. Several electrolysis technologiesare available, namely the polymer electrolyte membrane electrolysis cell (PEMEC), alkalineelectrolysis cell (AEC), and solid oxide electrolysis cell (SOEC). All three technologies dohowever suffer from various disadvantages such as expensive materials, low durability,and crossover of gases leading to poor purity.[Rashied et al., 2015]
As a result, H2 production from electrolysis remains the more expensive productionmethod, compared to reforming from fossil sources [Acar and Dincer, 2014]. With a con-
1.2. State of the Art Plants 3
tinued interest in using H2 for different processes and technologies like MeOH production,the need for H2 will continue to rise.[Dalena et al., 2018][Okolie et al., 2021]
In comparison to CO2, H2 is the bottleneck in the production of Green MeOH due toits limited availability and price. If the Green H2 was to be produced by electrolysis, itwould be lucrative to utilise the fluctuating production of electricity, where the surpluscan reduce the Green H2 production cost.[Brynolf et al., 2018] Hence, in order for GreenMeOH production to become a reality, it is necessary for the production price of GreenH2 to be reduced to a level similar to that of Black H2. If the production price of GreenH2 cannot decline to the level of Black H2, the need for governmental subsidies may berequired to incentivise the use of Green H2.[Klenert et al., 2018] Even if governmentalsubsidies are not available, Green branding could make the renewable MeOH attractive.
1.2 State of the Art Plants
A pilot plant is already established at Aalborg University, where the production capacityis 300,000 litres of Green MeOH per year. This is a combined H2 and MeOH plant, sincethe H2 is produced by an electrolyser located on site. The CO2 is however supplied by anexternally located biogas plant and as such the pilot plant is not directly coupled to a CO2supply.[Green Hydrogen Systems, 2020] The next step for the Green MeOH technology isto scale from pilot plant to commercial plant.
A Green industrial business park is currently under construction in Skive, where oneof the world’s first commercially scale combined Green H2 and MeOH plants will belocated [GreenLab, 2021]. There will be established a 10 MW MeOH plant and a 12 MWelectrolysis plant [GreenLab, 2019]. The expected production capacity of this MeOH plantis 10 million litres per year, which is equivalent to eliminating the CO2 emission of 7,000cars [GreenLab, 2020]. Additionally, a biogas plant with a production capacity of 19 millionm3 bio-methane per year will also be located in the park. The produced CO2 of the biogasplant will then be used for the MeOH plant [GreenLab Skive Biogas Aps, 2021]. The GreenMeOH production is set to start in 2022 [GreenLab, 2020]. The industrial business parkis coupled to an energy grid powered locally by a 80 MW hybrid wind- and solar powerplant, making the entire park operate on renewable energy [GreenLab, 2019].
1.3 Plant Sizing
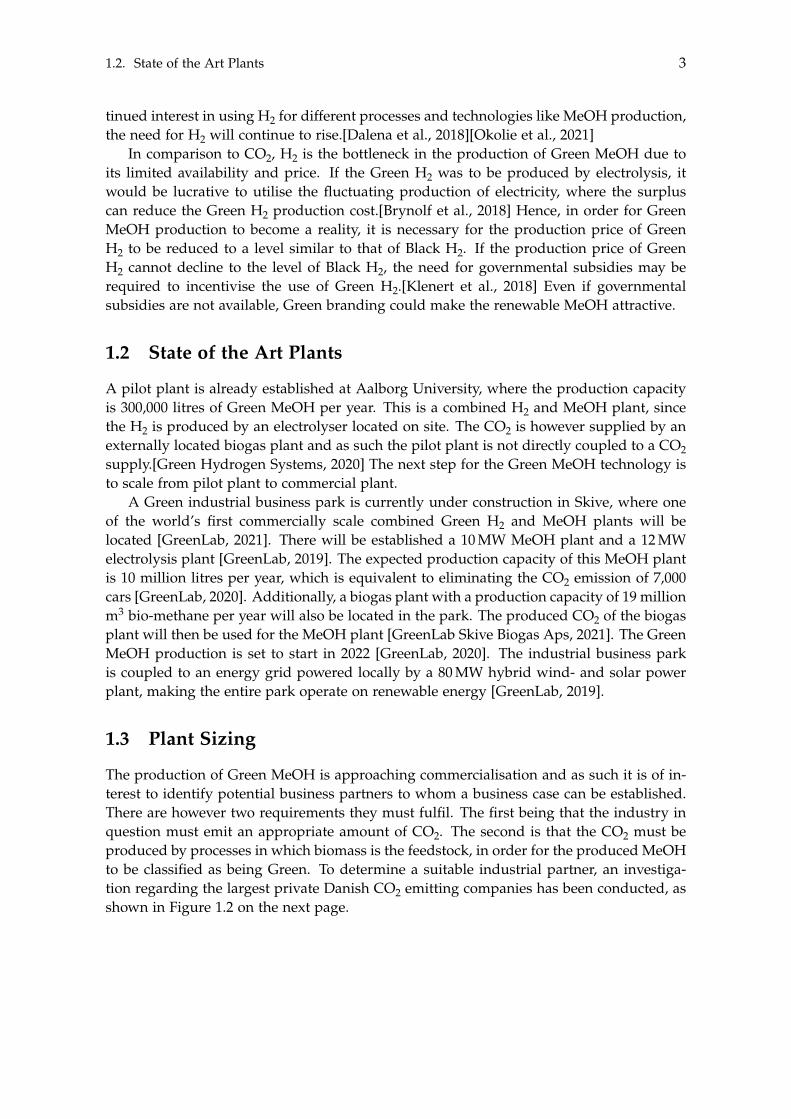
The production of Green MeOH is approaching commercialisation and as such it is of in-terest to identify potential business partners to whom a business case can be established.There are however two requirements they must fulfil. The first being that the industry inquestion must emit an appropriate amount of CO2. The second is that the CO2 must beproduced by processes in which biomass is the feedstock, in order for the produced MeOHto be classified as being Green. To determine a suitable industrial partner, an investiga-tion regarding the largest private Danish CO2 emitting companies has been conducted, asshown in Figure 1.2 on the next page.
4 Chapter 1. Motivation and Objective
0 0.2 0.4 0.6 0.8 1 1.2 1.4 1.6 1.8 2 2.2 2.4
·106
Aalborg PortlandNordic Sugar
ArlaSaint Gobain
RockwoolNLMK DanSteel
CP KelkoAarhusKarlshamn
Triplenine FishArdag Holmegaard
CO2 Emission, [tonnes]Figure 1.2: Top 10 most CO2 emitting private industrial companies in 2018.[DR.DK, 2020]
Due to the governmental restriction, that the Danish greenhouse gas emissions mustbe reduced by 70 % by 2030 [State of Green, 2019], the industrial companies are looking forsolutions to this restriction. For instance, Aalborg Portland A/S states that they requirethe implementation of CO2 capture in order to comply with the greenhouse gas restriction[Nikolajsen, 2019]. From Figure 1.2 it is evident that Aalborg Portland was the largestindustrial emitter in 2018, the company emitted in that year approximately 14 times morethan the second largest. As such Aalborg Portland could be an interesting business partner,since it might be possible to receive governmental subsidies, due to the potential significantdecrease in the Danish net CO2 emission. Yet, the resulting MeOH would not be identifiedas being Green which is a constraint in the presented study. Biomass must be the feedstockof the process and an appropriate biomass could be sorted municipal waste.
According to senior advisor Søren Dyck-Madsen from CONCITO: "The waste incinera-tion plants are obvious for further development in CO2 capture, since the flue gas that exitsthe chimney has a stable and high concentration of CO2, which originates from both fossilsources and biomass based sources. The captured CO2 could either be directly stored un-derground by the CCS-process (Carbon Capture and Storage), or used together with H2 tomake fuels by the CCU-process (Carbon Capture and Utilisation)".[S. Dyck-Madsen, 2020]
As such it is expected that there would be a mutual interest from both industries, ofwhich RenoNord has been chosen. RenoNord is a waste management company which hasone of the most modern incineration plants in Europe [Linkedin, 2021]. This incinerationplant emitted approximately 224,000 tonnes of CO2 in 2019, where 59 wt% was generatedfrom biomass. However, the CO2 must at first be captured from the flue gas, where dif-ferent technologies are available. The efficiencies of these technologies are in the range of80 wt% to 90 wt% [Leung et al., 2014]. As a result, by assuming that 90 wt% of the CO2 iscaptured, a total of approximately 119,000 tonnes of Green CO2 is available to supply theMeOH plant. Throughout the presented study, the dimensioning of the MeOH plant willbe based on this CO2 supply.
1.4. Fluctuating Feedstock Supply and Energy 5
1.4 Fluctuating Feedstock Supply and Energy
To obtain Green CO2 it must be supplied by the combustion of biomass, such is the case atRenoNord. Similarly, to obtain Green H2 the electricity needed for the electrolysis couldbe supplied by wind turbines and photovoltaics (PV) panels.
These two technologies were chosen since they are currently the most presented Greenenergy sources in the Danish renewable electricity production. Wind- and solar power areresponsible for 33.0 % and 3.5 %, respectively, of the total primary energy production inDenmark.[EnergiStyrelsen, 2020]
However, due to the desire of producing MeOH at a continuous rate, it may becomenecessary to store both the CO2 and H2. This is a result of the possibility that the CO2 andenergy supply from the renewable sources may fluctuate.
1.4.1 Carbon Dioxide
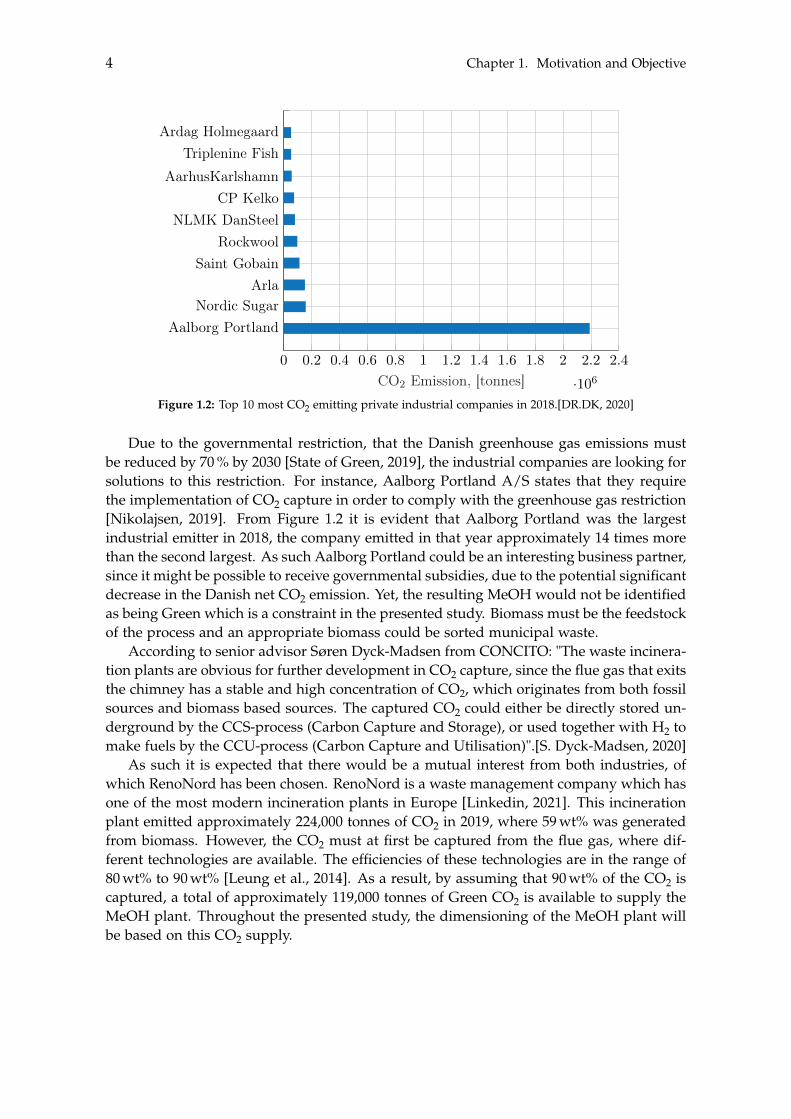
The production of energy from power plants, such as the combined heat-power plant(CHP) of RenoNord, varies according to monthly demand. The fuel burned at RenoNordis converted to both electricity and heat, as shown in Figure 1.3.
Jan Feb Mar Apr May Jun Jul Aug Sep Oct Nov Dec
0.250.50.75
11.251.51.75
22.252.5
·105
Ene
rgy,
[GJ]
Electricity District Heat Total Energy
Figure 1.3: Monthly variation in electricity- and heat production from RenoNord, averaged over the years of2018, 2019 and 2020.[Sørensen, 2020]
As is evident, the energy production is generally slightly lower during the summermonths compared to the higher values seen during the winter months. This is likely due tothe decreased heat requirement during the warm summer months, and as a result the CHPplant produces more electricity. The slight difference in energy production throughout theyear is also reflected in the emitted CO2 as indicated in Figure 1.4 on the following page.
6 Chapter 1. Motivation and Objective
Jan Feb Mar Apr May Jun Jul Aug Sep Oct Nov Dec
0.250.50.75
11.251.51.75
22.252.5
·104
CO
2E
mis
sion
,[to
nnes
] Fossil Feedstock Waste Feedstock Total CO2
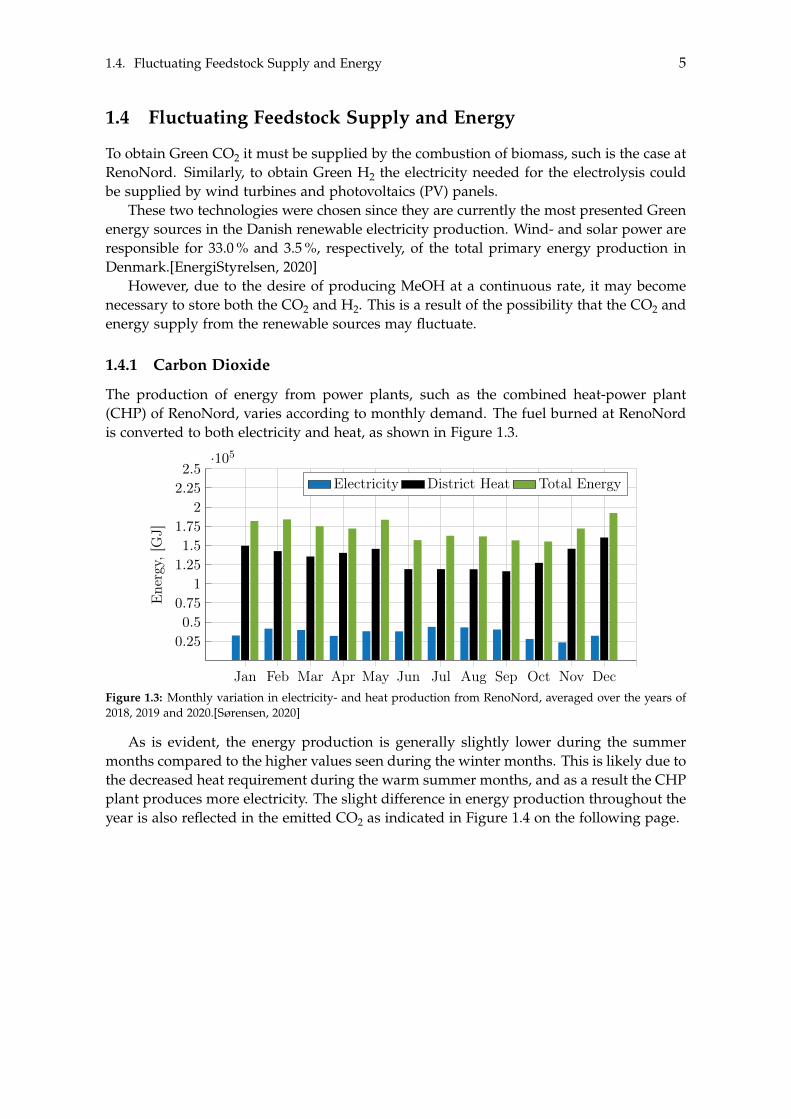
Figure 1.4: Monthly variation in CO2 emission from RenoNord, averaged over the years of 2018, 2019 and2020.[Sørensen, 2020]
Here the same trend is obvious as the CO2 emission is greater in the late autumn untilearly summer. This fluctuating CO2 production must be taken into consideration whenattempting to model a carbon capture plant.
1.4.2 Wind Power
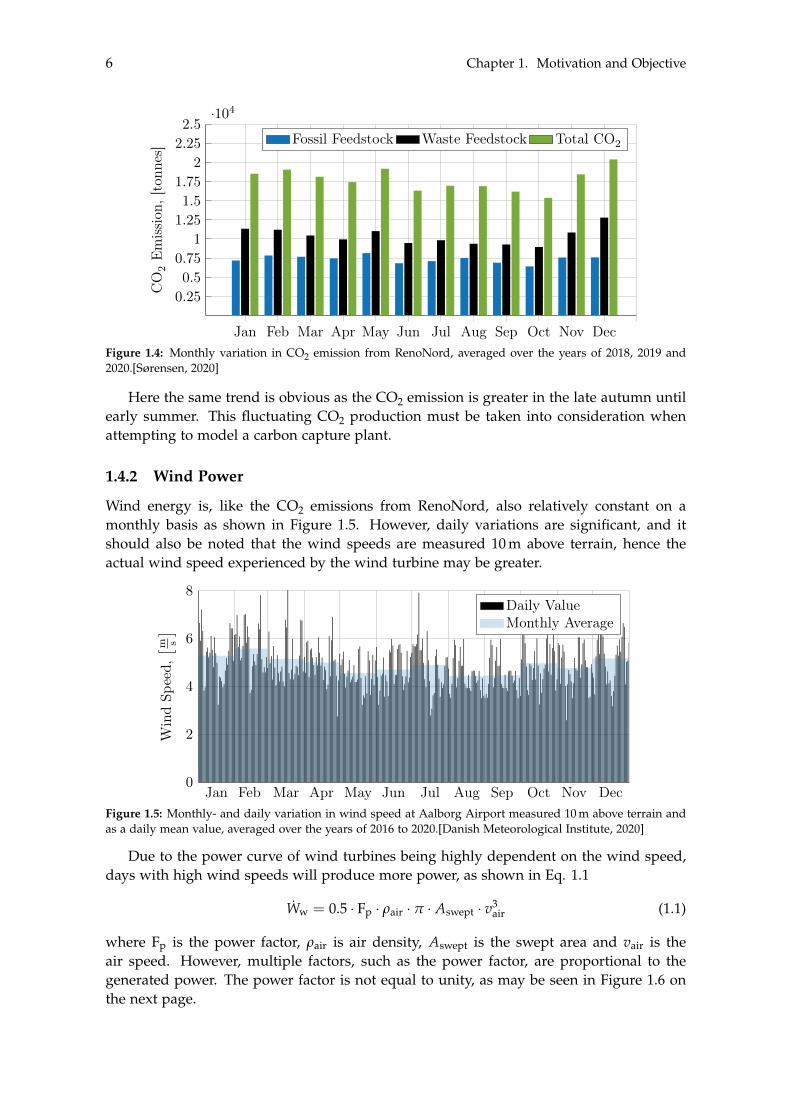
Wind energy is, like the CO2 emissions from RenoNord, also relatively constant on amonthly basis as shown in Figure 1.5. However, daily variations are significant, and itshould also be noted that the wind speeds are measured 10 m above terrain, hence theactual wind speed experienced by the wind turbine may be greater.
Jan Feb Mar Apr May Jun Jul Aug Sep Oct Nov Dec0
2
4
6
8
Win
dSp
eed,
⇥ ms⇤
Daily ValueMonthly Average
Figure 1.5: Monthly- and daily variation in wind speed at Aalborg Airport measured 10 m above terrain andas a daily mean value, averaged over the years of 2016 to 2020.[Danish Meteorological Institute, 2020]
Due to the power curve of wind turbines being highly dependent on the wind speed,days with high wind speeds will produce more power, as shown in Eq. 1.1
Ww = 0.5 · Fp · rair · p · Aswept · v3air (1.1)
where Fp is the power factor, rair is air density, Aswept is the swept area and vair is theair speed. However, multiple factors, such as the power factor, are proportional to thegenerated power. The power factor is not equal to unity, as may be seen in Figure 1.6 onthe next page.
1.4. Fluctuating Feedstock Supply and Energy 7
4 6 8 10 12 14 16 18 20 220
1,000
2,000
3,000
4,000
5,000
Wind Speed,⇥m
s⇤
Pow
er,[
kW]
0
0.2
0.4
0.6
0.8
1
Pow
erFa
ctor
,[-]
Wind PowerPower CurvePower Factor
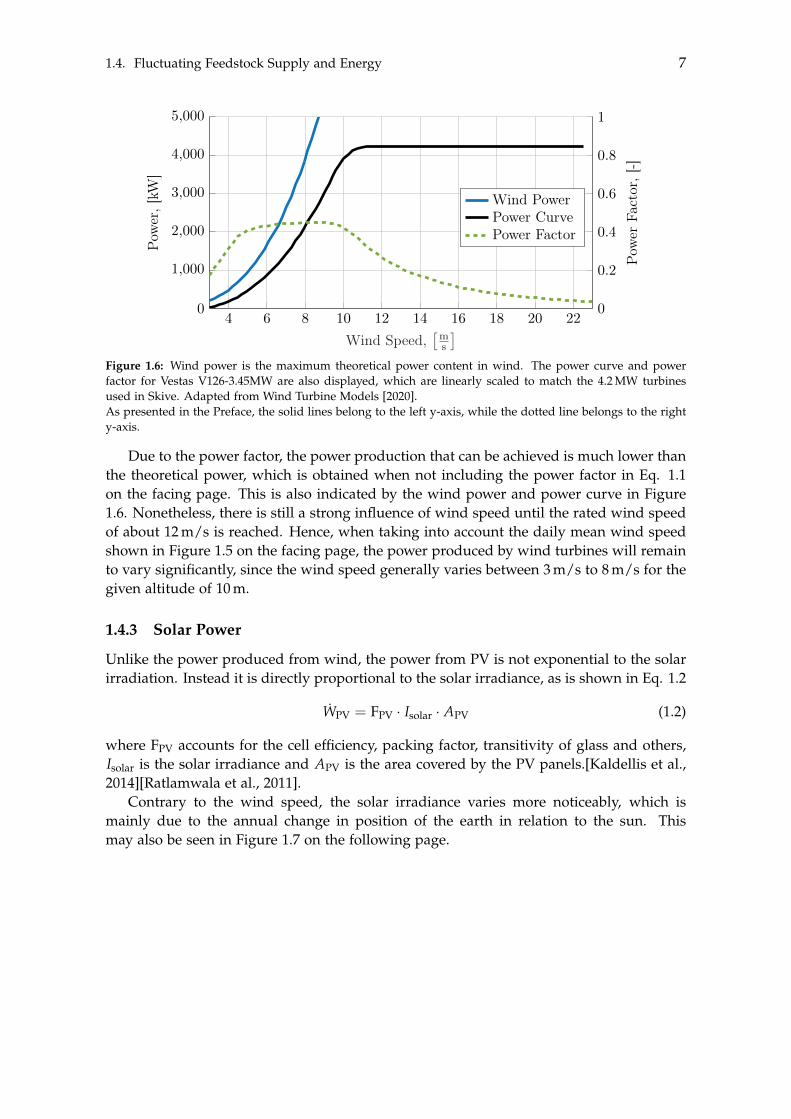
Figure 1.6: Wind power is the maximum theoretical power content in wind. The power curve and powerfactor for Vestas V126-3.45MW are also displayed, which are linearly scaled to match the 4.2 MW turbinesused in Skive. Adapted from Wind Turbine Models [2020].As presented in the Preface, the solid lines belong to the left y-axis, while the dotted line belongs to the righty-axis.
Due to the power factor, the power production that can be achieved is much lower thanthe theoretical power, which is obtained when not including the power factor in Eq. 1.1on the facing page. This is also indicated by the wind power and power curve in Figure1.6. Nonetheless, there is still a strong influence of wind speed until the rated wind speedof about 12 m/s is reached. Hence, when taking into account the daily mean wind speedshown in Figure 1.5 on the facing page, the power produced by wind turbines will remainto vary significantly, since the wind speed generally varies between 3 m/s to 8 m/s for thegiven altitude of 10 m.
1.4.3 Solar Power
Unlike the power produced from wind, the power from PV is not exponential to the solarirradiation. Instead it is directly proportional to the solar irradiance, as is shown in Eq. 1.2
WPV = FPV · Isolar · APV (1.2)
where FPV accounts for the cell efficiency, packing factor, transitivity of glass and others,Isolar is the solar irradiance and APV is the area covered by the PV panels.[Kaldellis et al.,2014][Ratlamwala et al., 2011].
Contrary to the wind speed, the solar irradiance varies more noticeably, which ismainly due to the annual change in position of the earth in relation to the sun. Thismay also be seen in Figure 1.7 on the following page.
8 Chapter 1. Motivation and Objective
Jan Feb Mar Apr May Jun Jul Aug Sep Oct Nov Dec0
2
4
6
8
Sola
rIr
radi
ance
,⇥ kW
hm
2
⇤ Daily ValueSmoothed Variation
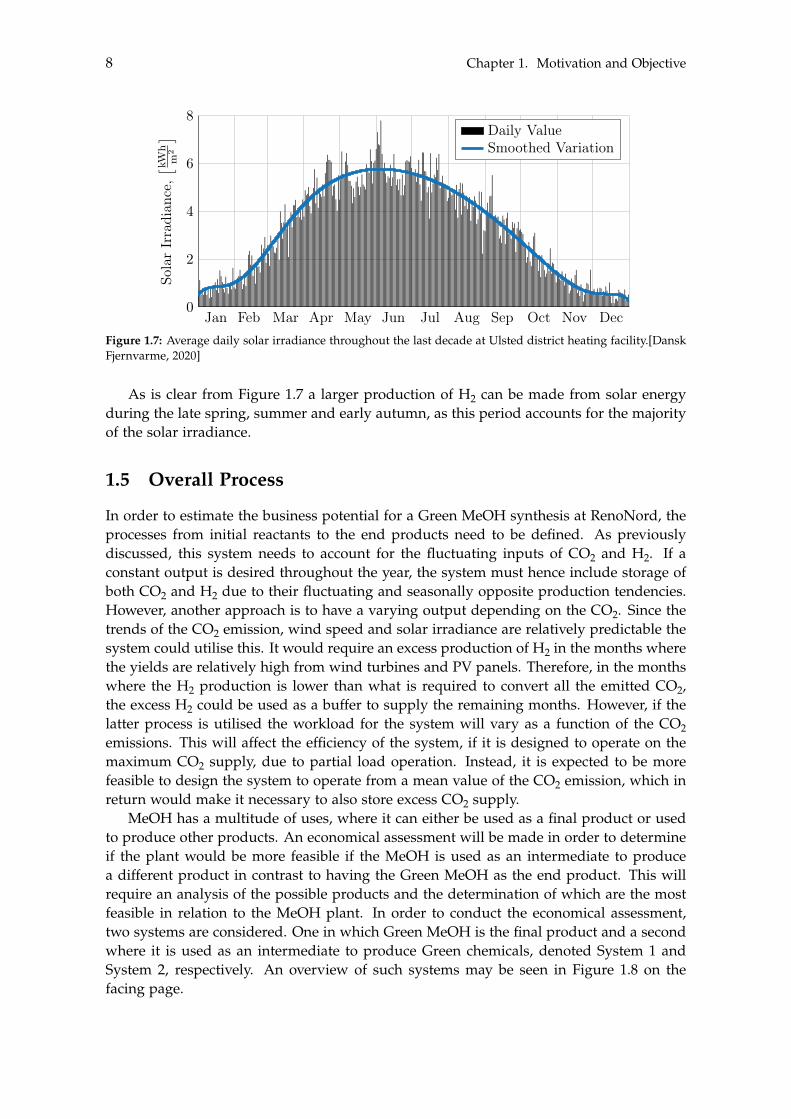
Figure 1.7: Average daily solar irradiance throughout the last decade at Ulsted district heating facility.[DanskFjernvarme, 2020]
As is clear from Figure 1.7 a larger production of H2 can be made from solar energyduring the late spring, summer and early autumn, as this period accounts for the majorityof the solar irradiance.
1.5 Overall Process
In order to estimate the business potential for a Green MeOH synthesis at RenoNord, theprocesses from initial reactants to the end products need to be defined. As previouslydiscussed, this system needs to account for the fluctuating inputs of CO2 and H2. If aconstant output is desired throughout the year, the system must hence include storage ofboth CO2 and H2 due to their fluctuating and seasonally opposite production tendencies.However, another approach is to have a varying output depending on the CO2. Since thetrends of the CO2 emission, wind speed and solar irradiance are relatively predictable thesystem could utilise this. It would require an excess production of H2 in the months wherethe yields are relatively high from wind turbines and PV panels. Therefore, in the monthswhere the H2 production is lower than what is required to convert all the emitted CO2,the excess H2 could be used as a buffer to supply the remaining months. However, if thelatter process is utilised the workload for the system will vary as a function of the CO2emissions. This will affect the efficiency of the system, if it is designed to operate on themaximum CO2 supply, due to partial load operation. Instead, it is expected to be morefeasible to design the system to operate from a mean value of the CO2 emission, which inreturn would make it necessary to also store excess CO2 supply.
MeOH has a multitude of uses, where it can either be used as a final product or usedto produce other products. An economical assessment will be made in order to determineif the plant would be more feasible if the MeOH is used as an intermediate to producea different product in contrast to having the Green MeOH as the end product. This willrequire an analysis of the possible products and the determination of which are the mostfeasible in relation to the MeOH plant. In order to conduct the economical assessment,two systems are considered. One in which Green MeOH is the final product and a secondwhere it is used as an intermediate to produce Green chemicals, denoted System 1 andSystem 2, respectively. An overview of such systems may be seen in Figure 1.8 on thefacing page.
1.5. Overall Process 9
Electrolysis Carbon Capture
Hydrogen Storage Carbon Storage
MeOH Synthesis
Separation Chemical Reactor
H2⇠
CO2⇠
H2 CO2
MeOH + By-products MeOH + By-products
H2O⇠
Power⇠ Flue gas
⇠
MeOH By-products Chemicals
Figure 1.8: Block diagram of the overall processes where either Green MeOH or Green Chemicals are the endproducts.
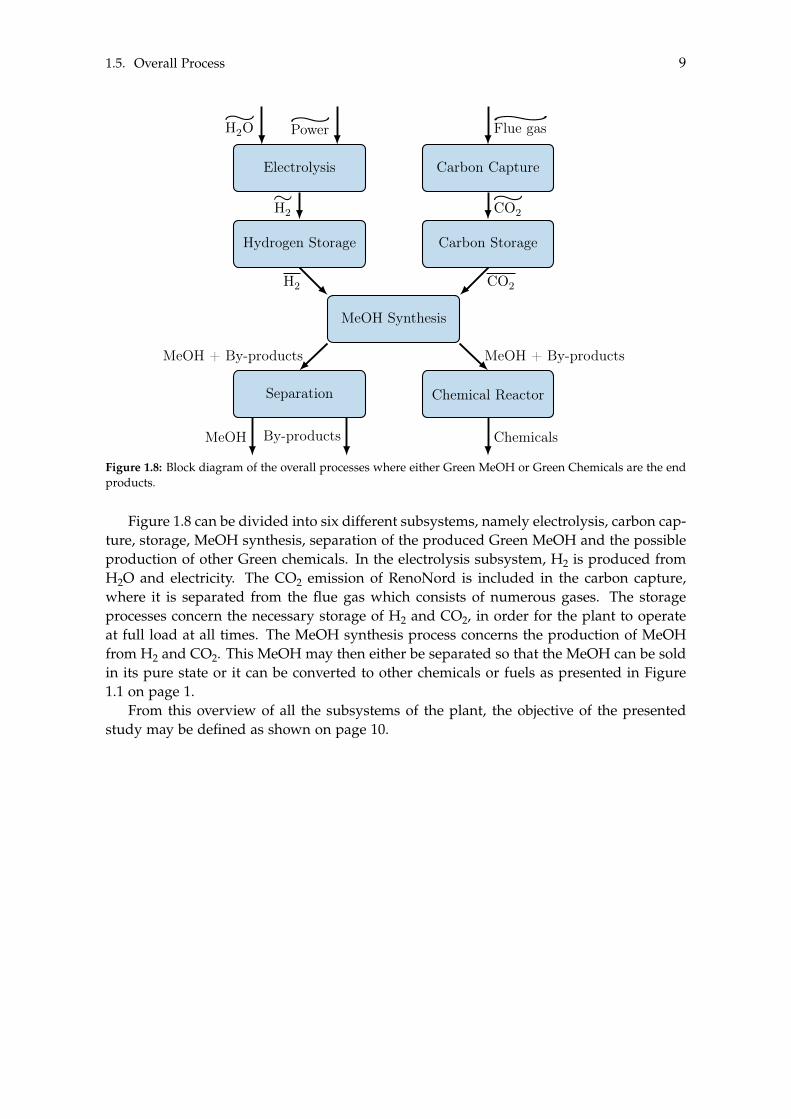
Figure 1.8 can be divided into six different subsystems, namely electrolysis, carbon cap-ture, storage, MeOH synthesis, separation of the produced Green MeOH and the possibleproduction of other Green chemicals. In the electrolysis subsystem, H2 is produced fromH2O and electricity. The CO2 emission of RenoNord is included in the carbon capture,where it is separated from the flue gas which consists of numerous gases. The storageprocesses concern the necessary storage of H2 and CO2, in order for the plant to operateat full load at all times. The MeOH synthesis process concerns the production of MeOHfrom H2 and CO2. This MeOH may then either be separated so that the MeOH can be soldin its pure state or it can be converted to other chemicals or fuels as presented in Figure1.1 on page 1.
From this overview of all the subsystems of the plant, the objective of the presentedstudy may be defined as shown on page 10.
10 Chapter 1. Motivation and Objective
1.6 Objective
The presented study seeks to investigate the business potential of producing Green chem-icals from the carbon neutral CO2 emitted by the waste incineration plant of RenoNordand renewable H2 produced from electrolysis. The objective is to determine the feasibilityof a system producing Green MeOH and to explore if further conversion of the GreenMeOH into other Green chemicals will be more lucrative. In order to make such a study, atechno-economic analysis must be conducted, wherein the design and modelling of the en-tire system is required. This leads to the following problem statement and further researchquestions.
How can a system, in which syngases are converted into Green methanol, be designed, whereuponit may be purified to fuel grade methanol or converted to other chemicals, from which the
economics of these products may be investigated to determine their feasibility?
To answer the problem statement, the following research questions will be investigated,which will indirectly be answered in the following chapters.
• How can the system be designed in order to account for the fluctuating CO2 and H2supply?
• How can a numerical model of the methanol synthesis and the conversion to otherchemicals be made?
• How can an optimisation of the system be done in order to increase its feasibility?
• Which are the most influential parameters in regards to the feasibility and how sen-sitive is the system to these?
Chapter 2
System AnalysisIn order to perform the techno-economic analysis and thereby determine the most prof-itable product, the two systems need to be modelled. However, before the systems aremodelled, an analysis of the subsystems previously shown in Figure 1.8 on page 9, isrequired in order to obtain knowledge of the individual processes and how the subsys-tems operate. These will be outlined in the following sections regarding their belongingtheories, concepts and reactions necessary to model each of these subsystems. Hence,the specific input parameters and component specifications will not be presented untilthe following chapters, where the knowledge presented in this chapter will be used toincorporate the individual subsystems into the two complete systems.
2.1 Carbon Capture
The CO2 required for the MeOH synthesis may be obtained from combustion of carbonrich sources, where different technologies are available for extracting the CO2. Addition-ally, the individual combustion technologies affect the gas composition, hence the CO2concentration. In order to determine the best suited capture technology, the combustiontechnologies will be presented firstly.
2.1.1 Combustion Technologies
In pre-combustion technology the fuel undergoes gasification, i.e. heated under low oxygenconditions, which releases several gases to form a syngas consisting mainly of CO andH2. This syngas may then be used in a water-gas shift reaction to form CO2. In pre-combustion, a CO2 concentration above 20 wt% is obtainable, which can then be separated.However, this technology involves adding additional process steps, mainly in the formof the gasifier.[Leung et al., 2014] Additionally, the feedstock for the gasification processwill, in the case of RenoNord, not be simply coal or natural gas but will instead consistof multiple constituents. Only about 9 wt% of the material received for combustion atRenoNord is primary residue biomass, while the remainder is a mixture of residual wasteat 40 wt%, industrial waste at 28 wt%, and several types of environmentally dangerouswaste.[RenoNord, 2019] This discrepancy may lead to the syngas, if produced by the pre-combustion process, being less pure and containing more undesirable gases compared tothe commonly used coal or natural gas.
In post-combustion technology the feedstock is not pretreated as in pre-combustion. In-stead it is simply fed to the combuster and as a result it is easy to retrofit into power plantswhich are already in operation. Although easy to implement, the CO2 concentration is usu-ally relatively low at about 7 wt% to 14 wt% for coal fired power plants, which is a result
11
12 Chapter 2. System Analysis
of air mainly consisting of N2 and the combustion also producing water and other minorspecies. As a result the CO2 concentration is lower compared to pre-combustion.[Leunget al., 2014]
In oxyfuel-combustion the principle is similar to post-combustion, with the differencebeing that pure O2 is used instead of air. This results in the flue gas containing no N2 andother minor species associated with Nitrogen, hence making higher CO2 concentrationspossible. However, the need for pure O2 increases the price significantly, making thismethod less feasible.[Leung et al., 2014]
Even though different combustion technologies are available, complications occur ifan existing plant was to be modified. Hence, RenoNord would likely continue to utilisethe post-combustion technology, however, oxyfuel-combustion could become a possibil-ity. Besides H2, O2 is also produced from the electrolysis which could be utilised for thecombustion, since the electrolysis would be placed on site, and it should be relatively easyto incorporate. Not only would this affect the concentration of CO2 in the flue gas, butit would also increase the adiabatic flame temperature within the combustor and therebyincrease the power output of RenoNord.
2.1.2 Carbon Capture Technologies
Regardless of the chosen combustion technology, the CO2 still has to be separated from thesyngas or flue gas. Many technologies are available, however, only a few are developed toa degree that can be considered viable.
Absorption utilises a solvent, such as monoethanolamine (MEA) or diethanolamine,which act as a sorbent of the CO2. Many solvents are available, but the MEA solvent isthe most mature and studied solvent [Madeddu et al., 2019]. In this process the CO2 isabsorbed by the solvent, which may then later be stripped to release the absorbed CO2through heating or depressurisation of the solvent [Wilberforce et al., 2021]. The mainadvantages of this technology include high absorption efficiency of more than 90 wt%, aswell as being well established, mature and having easy regeneration of the solvent [Veawabet al., 2002] [Aaron and Tsouris, 2005]. The disadvantages consist of substantial energyrequirements for heating of the solvent and the potential degradation of the solvent.
Contrary to absorption, the Adsorption technology uses a solid sorbent instead of aliquid sorbent, where the CO2 is bound to the surface of the solid. As such the maincriteria for an effective solid sorbent is a large surface area, but also high selectivity towardsbinding CO2 specifically and how easily the sorbent may be regenerated. The adsorbedCO2 can be stripped by lowering the pressure or by heating the sorbent, both resulting inrecovery efficiencies of about 80 wt% [Leung et al., 2014].
As mentioned several other carbon capture technologies are available, such as Chemicallooping combustion, Hydrate-based separation, Membrane separation, and Cryogenic distillation.However, these suffer from being immature in their development or having low outputrates, while the latter mentioned Cryogenic distillation technology requires high concen-trations of CO2 to be feasible [Leung et al., 2014].
Following the comparison presented above, the technology with the best potential forthe presented study is the absorption process with MEA as the solvent. The overall detailsfor how such a subsystem operates is described in the following.
2.1. Carbon Capture 13
2.1.3 Absorption Carbon Capture
As previously mentioned the purpose of a solvent, in this case MEA, is to absorb the CO2from the flue gas. The conceptual principle of this process is outlined in the following.
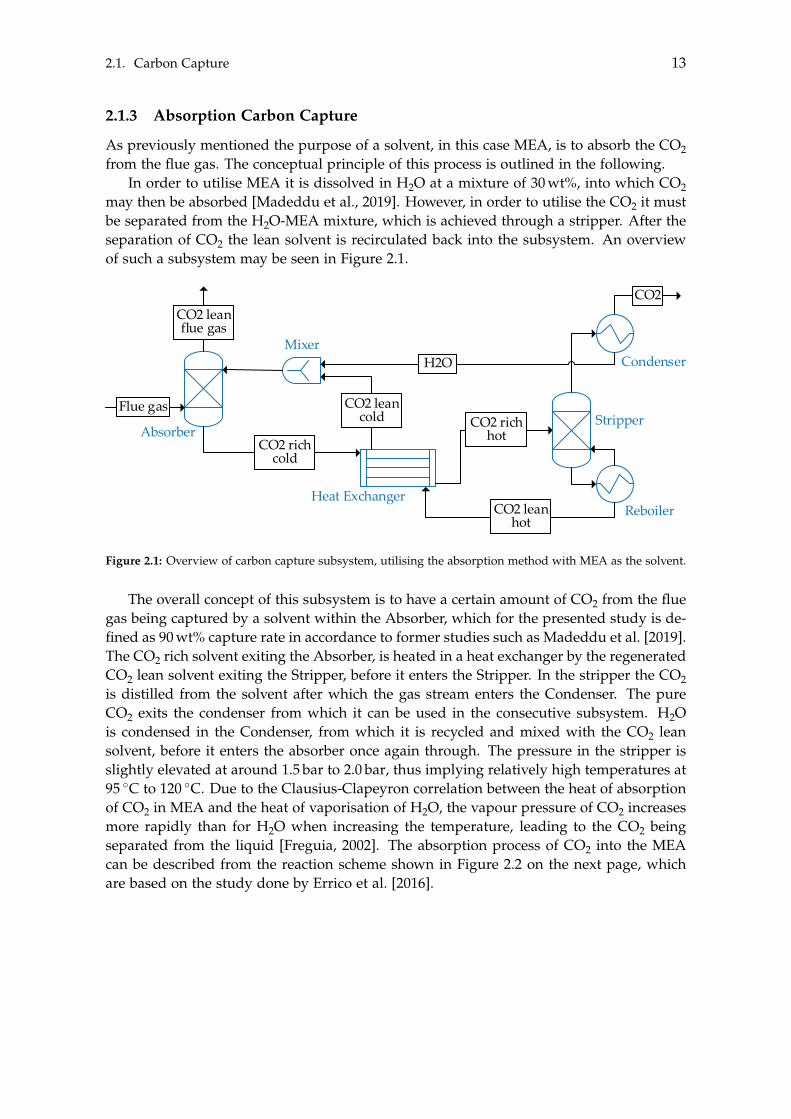
In order to utilise MEA it is dissolved in H2O at a mixture of 30 wt%, into which CO2may then be absorbed [Madeddu et al., 2019]. However, in order to utilise the CO2 it mustbe separated from the H2O-MEA mixture, which is achieved through a stripper. After theseparation of CO2 the lean solvent is recirculated back into the subsystem. An overviewof such a subsystem may be seen in Figure 2.1.
Mixer ReactorReactor Flash
S2
Mixer
hej
Absorber/stripper/packed column BTX&MeOH-Dist/TrayBTX&MeOH-Dist/Tray
Valve
Comp
Pump Heat exchanger
Cooler
Fluid/liquid separator
Tank
CompFlash
Column 1Column 1 Column 2Column 2 Column 3Column 3 Column 4Column 4
BTX synthesis product stream
H2 CO
CH4C2H4
C2H6CO2
C3H6C3H8
C4H10C5H12C6H14
CH3OH
C6H6H2O
C7H8C8H10 C9H12
C10H14
Heater
AbsorberStripper
Heat ExchangerReboiler
Mixer
Flue gas
CO2 rich cold
CO2 richhot
CO2 leanhot
CO2 leancold
CO2 leanflue gas
CO2
CondenserH2O
Figure 2.1: Overview of carbon capture subsystem, utilising the absorption method with MEA as the solvent.
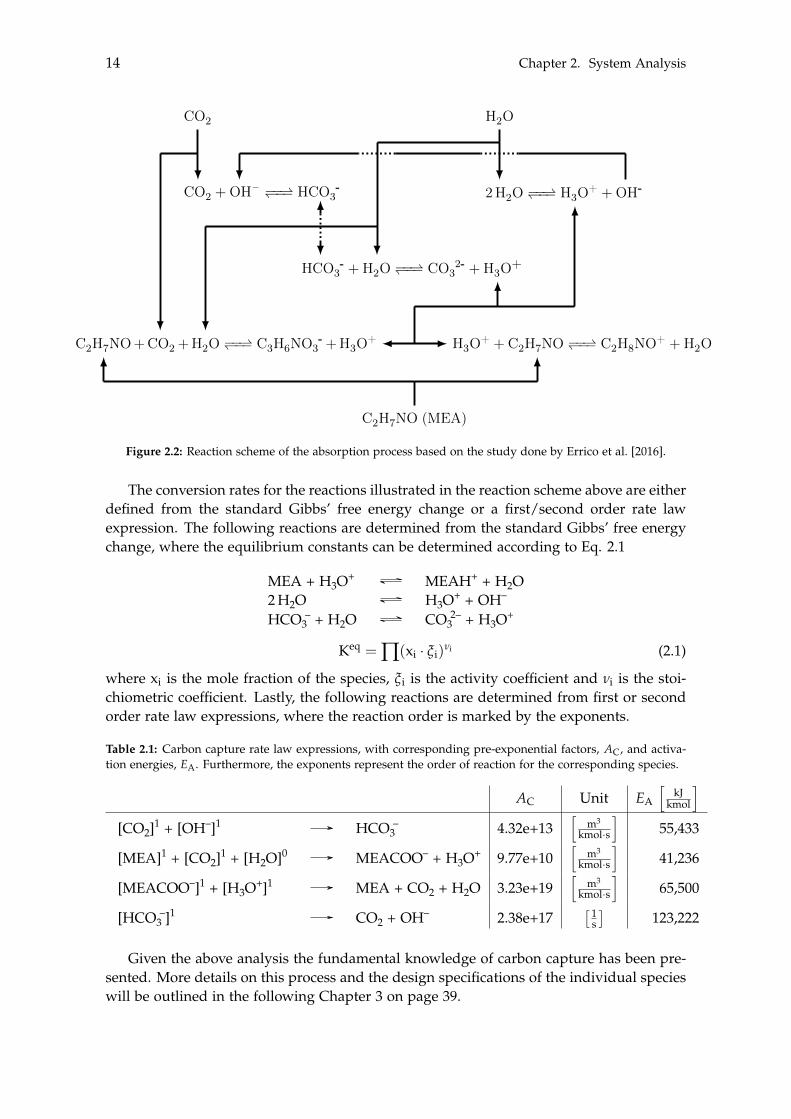
The overall concept of this subsystem is to have a certain amount of CO2 from the fluegas being captured by a solvent within the Absorber, which for the presented study is de-fined as 90 wt% capture rate in accordance to former studies such as Madeddu et al. [2019].The CO2 rich solvent exiting the Absorber, is heated in a heat exchanger by the regeneratedCO2 lean solvent exiting the Stripper, before it enters the Stripper. In the stripper the CO2is distilled from the solvent after which the gas stream enters the Condenser. The pureCO2 exits the condenser from which it can be used in the consecutive subsystem. H2Ois condensed in the Condenser, from which it is recycled and mixed with the CO2 leansolvent, before it enters the absorber once again through. The pressure in the stripper isslightly elevated at around 1.5 bar to 2.0 bar, thus implying relatively high temperatures at95 �C to 120 �C. Due to the Clausius-Clapeyron correlation between the heat of absorptionof CO2 in MEA and the heat of vaporisation of H2O, the vapour pressure of CO2 increasesmore rapidly than for H2O when increasing the temperature, leading to the CO2 beingseparated from the liquid [Freguia, 2002]. The absorption process of CO2 into the MEAcan be described from the reaction scheme shown in Figure 2.2 on the next page, whichare based on the study done by Errico et al. [2016].
14 Chapter 2. System Analysis
HCO -3 + H2O ��*)�� CO 2-
3 + H3O+
C2H7NO+CO2 +H2O ��*)�� C3H6NO -3 +H3O+ H3O+ + C2H7NO ��*)�� C2H8NO+ + H2O
C2H7NO (MEA)
CO2 + OH– ��*)�� HCO -3 2 H2O ��*)�� H3O+ + OH-
CO2 H2O
Figure 2.2: Reaction scheme of the absorption process based on the study done by Errico et al. [2016].
The conversion rates for the reactions illustrated in the reaction scheme above are eitherdefined from the standard Gibbs’ free energy change or a first/second order rate lawexpression. The following reactions are determined from the standard Gibbs’ free energychange, where the equilibrium constants can be determined according to Eq. 2.1
MEA + H3O+ MEAH+ + H2O2 H2O H3O+ + OH–
HCO –3 + H2O CO 2–
3 + H3O+
Keq = ’(xi · xi)ni (2.1)
where xi is the mole fraction of the species, xi is the activity coefficient and ni is the stoi-chiometric coefficient. Lastly, the following reactions are determined from first or secondorder rate law expressions, where the reaction order is marked by the exponents.
Table 2.1: Carbon capture rate law expressions, with corresponding pre-exponential factors, AC, and activa-tion energies, EA. Furthermore, the exponents represent the order of reaction for the corresponding species.
AC Unit EA
hkJ
kmol
i
[CO2]1 + [OH–]1 HCO –3 4.32e+13
hm3
kmol·s
i55,433
[MEA]1 + [CO2]1 + [H2O]0 MEACOO– + H3O+ 9.77e+10h
m3
kmol·s
i41,236
[MEACOO–]1 + [H3O+]1 MEA + CO2 + H2O 3.23e+19h
m3
kmol·s
i65,500
[HCO –3 ]1 CO2 + OH– 2.38e+17
⇥ 1s⇤
123,222
Given the above analysis the fundamental knowledge of carbon capture has been pre-sented. More details on this process and the design specifications of the individual specieswill be outlined in the following Chapter 3 on page 39.
2.2. Electrolyser 15
2.2 Electrolyser
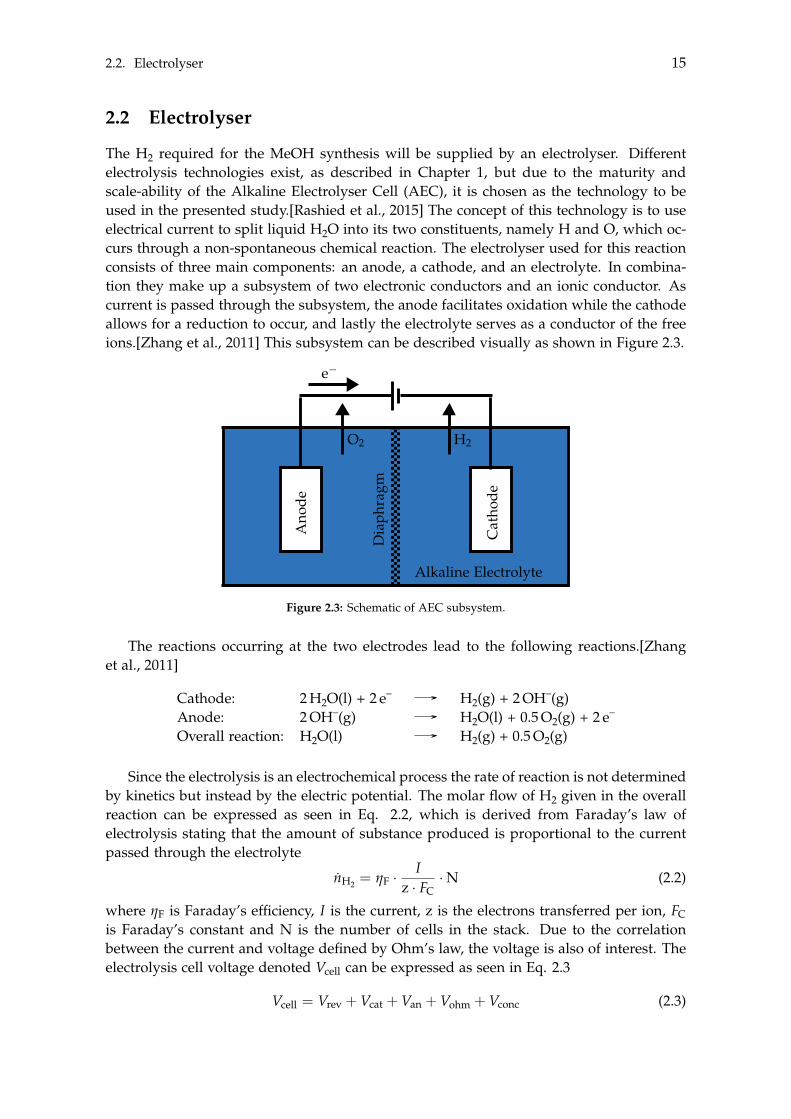
The H2 required for the MeOH synthesis will be supplied by an electrolyser. Differentelectrolysis technologies exist, as described in Chapter 1, but due to the maturity andscale-ability of the Alkaline Electrolyser Cell (AEC), it is chosen as the technology to beused in the presented study.[Rashied et al., 2015] The concept of this technology is to useelectrical current to split liquid H2O into its two constituents, namely H and O, which oc-curs through a non-spontaneous chemical reaction. The electrolyser used for this reactionconsists of three main components: an anode, a cathode, and an electrolyte. In combina-tion they make up a subsystem of two electronic conductors and an ionic conductor. Ascurrent is passed through the subsystem, the anode facilitates oxidation while the cathodeallows for a reduction to occur, and lastly the electrolyte serves as a conductor of the freeions.[Zhang et al., 2011] This subsystem can be described visually as shown in Figure 2.3.
Cat
hode
Ano
de
O2 H2
e�
Alkaline Electrolyte
Dia
phra
gm
Figure 2.3: Schematic of AEC subsystem.
The reactions occurring at the two electrodes lead to the following reactions.[Zhanget al., 2011]
Cathode: 2 H2O(l) + 2 e– H2(g) + 2 OH–(g)Anode: 2 OH–(g) H2O(l) + 0.5 O2(g) + 2 e–
Overall reaction: H2O(l) H2(g) + 0.5 O2(g)
Since the electrolysis is an electrochemical process the rate of reaction is not determinedby kinetics but instead by the electric potential. The molar flow of H2 given in the overallreaction can be expressed as seen in Eq. 2.2, which is derived from Faraday’s law ofelectrolysis stating that the amount of substance produced is proportional to the currentpassed through the electrolyte
nH2 = hF ·I
z · FC· N (2.2)
where hF is Faraday’s efficiency, I is the current, z is the electrons transferred per ion, FCis Faraday’s constant and N is the number of cells in the stack. Due to the correlationbetween the current and voltage defined by Ohm’s law, the voltage is also of interest. Theelectrolysis cell voltage denoted Vcell can be expressed as seen in Eq. 2.3
Vcell = Vrev + Vcat + Van + Vohm + Vconc (2.3)
16 Chapter 2. System Analysis
where V is voltage and the subscripts rev, cat, an, omh and conc denote reversible, cath-ode, anode, ohmic and concentration, respectively. It can be seen that multiple voltagescontribute to the total cell voltage. The first term Vrev is the minimum voltage neededto make the reaction seen in the overall reaction occur. This corresponds to the voltagerequired to reach the electrochemical equilibrium which can be described from the changein Gibbs’ free energy as seen in Eq. 2.4.
DG = z · FC · Vrev (2.4)
Since the change in Gibbs’ free energy can be determined from look-up the value of Vrevcan be defined, from which four terms remain undefined in Eq. 2.3 on the precedingpage. However, these terms are dependent on the physical properties of the electrolyser,from which empirical data is required. A study conducted by Sánchez et al. [2018] madean empirical correlation for an AEC to determine these four terms, based on the currentdensity, temperature and pressure. With all terms determined, Vcell can be defined as inEq. 2.5
Vcell = Vrev + (4.139e-5 + 6.889e-9 · T + 4.471e+7 · P) · i
+ 0.338 · log10
✓�0.015 +
2.002T
+15.243
T2
◆· i + 1
� (2.5)
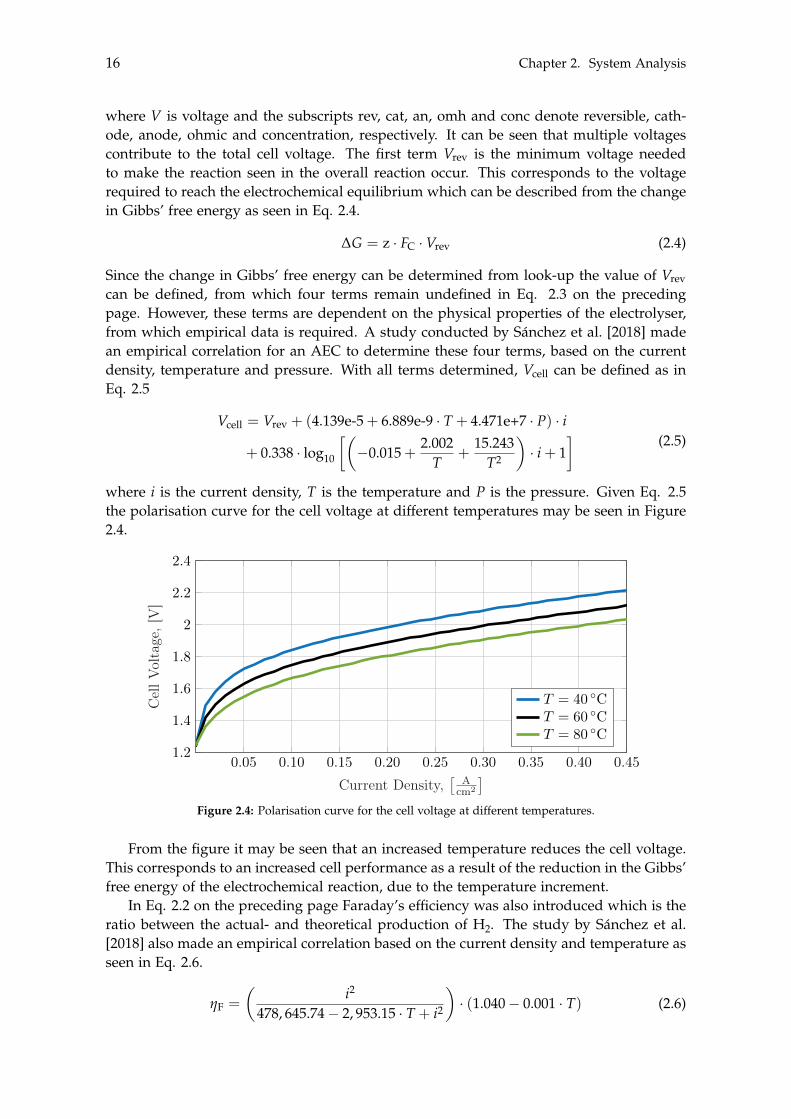
where i is the current density, T is the temperature and P is the pressure. Given Eq. 2.5the polarisation curve for the cell voltage at different temperatures may be seen in Figure2.4.
0.05 0.10 0.15 0.20 0.25 0.30 0.35 0.40 0.451.2
1.4
1.6
1.8
2
2.2
2.4
Current Density,⇥ A
cm2
⇤
Cel
lVol
tage
,[V
]
T = 40 �CT = 60 �CT = 80 �C
Figure 2.4: Polarisation curve for the cell voltage at different temperatures.
From the figure it may be seen that an increased temperature reduces the cell voltage.This corresponds to an increased cell performance as a result of the reduction in the Gibbs’free energy of the electrochemical reaction, due to the temperature increment.
In Eq. 2.2 on the preceding page Faraday’s efficiency was also introduced which is theratio between the actual- and theoretical production of H2. The study by Sánchez et al.[2018] also made an empirical correlation based on the current density and temperature asseen in Eq. 2.6.
hF =
✓i2
478, 645.74 � 2, 953.15 · T + i2
◆· (1.040 � 0.001 · T) (2.6)
2.2. Electrolyser 17
With the Faraday’s efficiency defined, the molar flow of H2 can be determined as outlinedin Eq. 2.2 on page 15. The remaining molar flows can be determined from the stoichio-metric balance, resulting in the molar flow rates shown in Eq. 2.7 and 2.8.
nH2O = nH2 (2.7)
nO2 = nH2 · 0.5 (2.8)
Eq. 2.7 and 2.8 defines the mole balance for the electrolysis, however, the required powerto run the process is also of interest which can be described by Eq. 2.9.
W = N · Vcell · I (2.9)
Furthermore, the energy balance is also of interest where the generated heat can be ex-pressed as described by Eq. 2.10
Qgen = N · I · (Vcell � Vth) (2.10)
where Vth denotes the thermoneutral voltage. Depending on Vcell the reaction can eitherbe endothermic or exothermic which is defined by Vth. Vth defines the voltage at whichthe added thermal energy equals the required electrical energy. This can be described bythe change in enthalpy which is determined as seen in Eq. 2.11
DH = DG � T · DS (2.11)
where S is entropy. Therefore Vth can be defined from the change in enthalpy as may beseen in Eq. 2.12.
Vth =DH
z · FC(2.12)
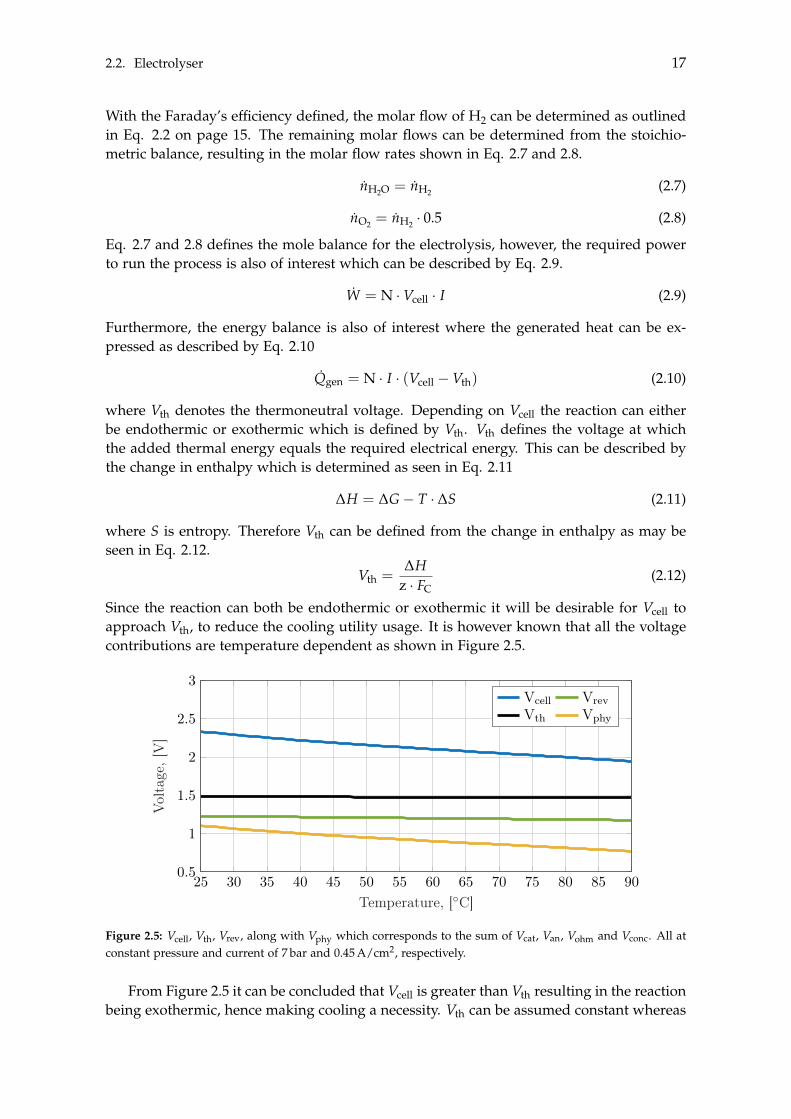
Since the reaction can both be endothermic or exothermic it will be desirable for Vcell toapproach Vth, to reduce the cooling utility usage. It is however known that all the voltagecontributions are temperature dependent as shown in Figure 2.5.
25 30 35 40 45 50 55 60 65 70 75 80 85 900.5
1
1.5
2
2.5
3
Temperature, [�C]
Vol
tage
,[V
]
Vcell VrevVth Vphy
Figure 2.5: Vcell, Vth, Vrev, along with Vphy which corresponds to the sum of Vcat, Van, Vohm and Vconc. All atconstant pressure and current of 7 bar and 0.45 A/cm2, respectively.
From Figure 2.5 it can be concluded that Vcell is greater than Vth resulting in the reactionbeing exothermic, hence making cooling a necessity. Vth can be assumed constant whereas
18 Chapter 2. System Analysis
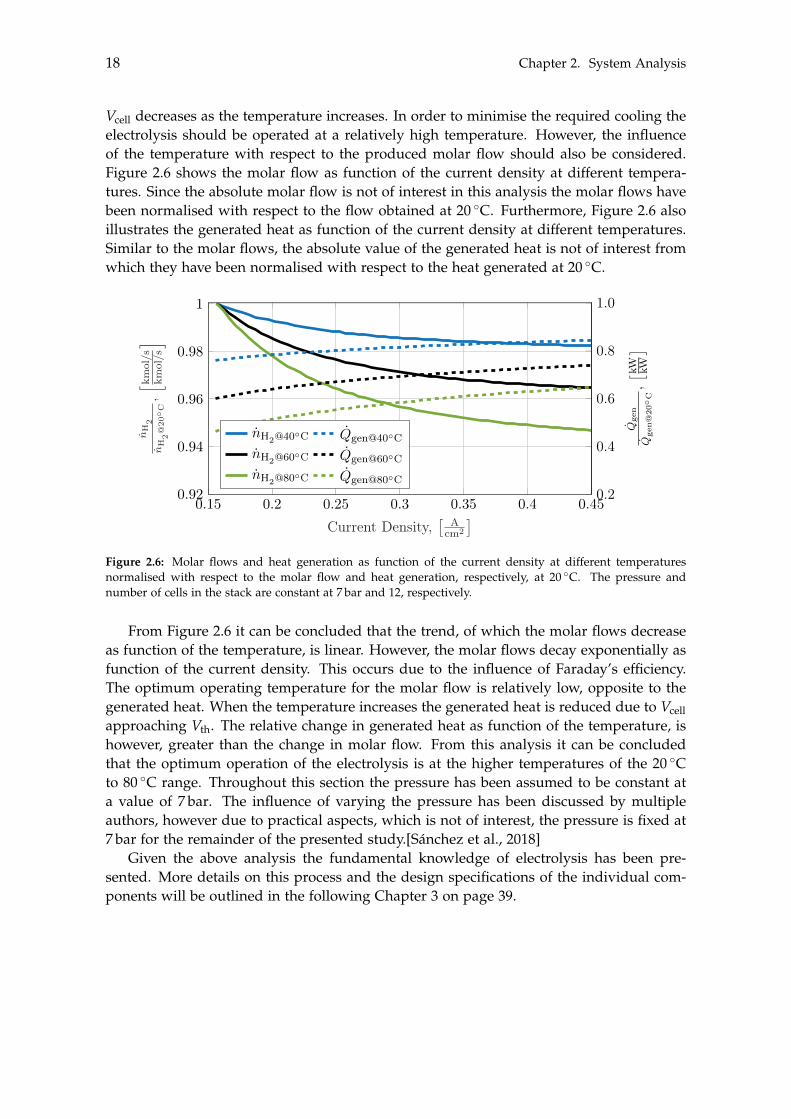
Vcell decreases as the temperature increases. In order to minimise the required cooling theelectrolysis should be operated at a relatively high temperature. However, the influenceof the temperature with respect to the produced molar flow should also be considered.Figure 2.6 shows the molar flow as function of the current density at different tempera-tures. Since the absolute molar flow is not of interest in this analysis the molar flows havebeen normalised with respect to the flow obtained at 20 �C. Furthermore, Figure 2.6 alsoillustrates the generated heat as function of the current density at different temperatures.Similar to the molar flows, the absolute value of the generated heat is not of interest fromwhich they have been normalised with respect to the heat generated at 20 �C.
0.15 0.2 0.25 0.3 0.35 0.4 0.450.92
0.94
0.96
0.98
1
Current Density,⇥ A
cm2
⇤
nH2
nH2@20�C,h km
ol/s
kmol/si
0.2
0.4
0.6
0.8
1.0
Qge
nQ
gen@20�C,⇥ k
W kW⇤
nH2@40�C Qgen@40�C
nH2@60�C Qgen@60�C
nH2@80�C Qgen@80�C
Figure 2.6: Molar flows and heat generation as function of the current density at different temperaturesnormalised with respect to the molar flow and heat generation, respectively, at 20 �C. The pressure andnumber of cells in the stack are constant at 7 bar and 12, respectively.
From Figure 2.6 it can be concluded that the trend, of which the molar flows decreaseas function of the temperature, is linear. However, the molar flows decay exponentially asfunction of the current density. This occurs due to the influence of Faraday’s efficiency.The optimum operating temperature for the molar flow is relatively low, opposite to thegenerated heat. When the temperature increases the generated heat is reduced due to Vcellapproaching Vth. The relative change in generated heat as function of the temperature, ishowever, greater than the change in molar flow. From this analysis it can be concludedthat the optimum operation of the electrolysis is at the higher temperatures of the 20 �Cto 80 �C range. Throughout this section the pressure has been assumed to be constant ata value of 7 bar. The influence of varying the pressure has been discussed by multipleauthors, however due to practical aspects, which is not of interest, the pressure is fixed at7 bar for the remainder of the presented study.[Sánchez et al., 2018]
Given the above analysis the fundamental knowledge of electrolysis has been pre-sented. More details on this process and the design specifications of the individual com-ponents will be outlined in the following Chapter 3 on page 39.
2.3. Storage of Gases 19
2.3 Storage of Gases
In order to obtain a constant MeOH production, storage of CO2 and H2 is needed. Aspresented in Chapter 1, the production of H2 is influenced by the fluctuating supply ofenergy from renewable energy sources, from which it becomes necessary to store the H2.Similarly, the production of CO2 is also fluctuating, due to the change in heat- and elec-tricity demand throughout the year. At standard conditions the density of CO2 and H2 is1.82 kg/m3 and 0.083 kg/m3, respectively, where they are in gaseous state. If the gases areto be stored at these densities it will require disproportionately large containers.
Numerous technologies exists for H2 storage, including adsorption, chemical hydrides andmechanical storage, each with multiple sub-technologies [Durbin and Malardier-Jugroot,2013]. Oppositely, technologies regarding storage of CO2 generally involve suppressingit into geological storage, such as underground reservoirs [Leung et al., 2014]. This sug-gests that the focus of most studies have been on removing the CO2 completely from theecosystem, rather than storing it for further use [Jackson and Brodal, 2018]. Since the tech-nologies regarding storage of H2 is described in more detail compared to CO2, these willbe analysed to gain an understanding of the possibilities.
2.3.1 Hydrogen Storage Technologies
Although it is not desired to store H2 at standard conditions, it is not always required toincrease the density too much, as would be the case when using some of the technologiesmentioned above. Relatively high densities are primarily required in the transport sector,due to spatial restrictions, whereas in stationary systems this requirement is loosened.The most common methods for storage are as liquid or as compressed gas, which aresubcategories to the mechanical storage method.
In compressed storage the H2 is compressed to increase the density, while retaining itsgaseous state. The pressure ranges from 200 bar to 800 bar at ambient temperature, result-ing in densities of 20 kg/m3 to 40 kg/m3, where the reachable pressure is linked to thecosts of the storage unit.[Makridis, 2016]
In liquid storage, also known as cryogenic storage, the H2 is cooled instead of pres-surised. The saturation temperature of H2 is 20 K at standard pressure where the cor-responding density at liquid state is 71 kg/m3, hereby increasing the volumetric energydensity. This concludes that a higher density is achievable for liquid storage comparedto compressed storage, however, the liquid storage of H2 is more energy expensive. Therequired power to compress H2 from 20 bar to 700 bar is 1.36 kWh/kg where the minimumtheoretical energy to liquefy the H2 at standard conditions is 3.3 kWh/kg [Gardiner, 2009].Additionally, the liquid H2 requires continuous cooling to retain its liquid state [Makridis,2016].
Since the two above mentioned storage technologies are simply based on applyingpower to the H2 in order to change its physical properties, they are also applicable forstorage of CO2. From the analysis of the MeOH synthesis it is known that CO2 and H2enter the reactor as gases. Therefore, it is not desirable to make a phase change of the gasesin order to store them since they would have to be converted back into gases, which wouldadd unnecessary entropy to the system. Furthermore, the power required to convert H2into liquid is as stated earlier higher than compressing it. The compression storage istherefore chosen as the technology used for storing both CO2 and H2.
20 Chapter 2. System Analysis
2.3.2 Compressed Storage
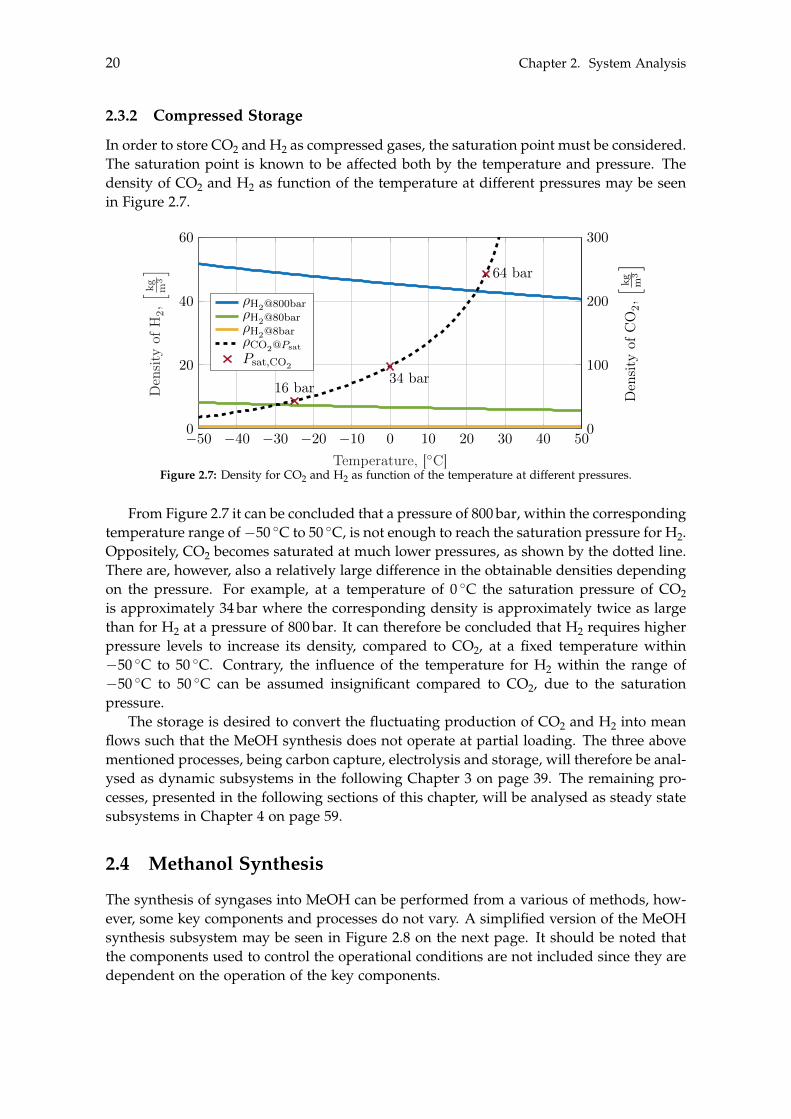
In order to store CO2 and H2 as compressed gases, the saturation point must be considered.The saturation point is known to be affected both by the temperature and pressure. Thedensity of CO2 and H2 as function of the temperature at different pressures may be seenin Figure 2.7.
�50 �40 �30 �20 �10 0 10 20 30 40 500
20
40
60
Temperature, [�C]
Den
sity
ofH
2,h
kg m3
i
0
100
200
300
16 bar 34 bar
64 bar
Den
sity
ofC
O2,
hkg m3
i
⇢H2@800bar
⇢H2@80bar
⇢H2@8bar
⇢CO2@Psat
Psat,CO2
Figure 2.7: Density for CO2 and H2 as function of the temperature at different pressures.
From Figure 2.7 it can be concluded that a pressure of 800 bar, within the correspondingtemperature range of �50 �C to 50 �C, is not enough to reach the saturation pressure for H2.Oppositely, CO2 becomes saturated at much lower pressures, as shown by the dotted line.There are, however, also a relatively large difference in the obtainable densities dependingon the pressure. For example, at a temperature of 0 �C the saturation pressure of CO2is approximately 34 bar where the corresponding density is approximately twice as largethan for H2 at a pressure of 800 bar. It can therefore be concluded that H2 requires higherpressure levels to increase its density, compared to CO2, at a fixed temperature within�50 �C to 50 �C. Contrary, the influence of the temperature for H2 within the range of�50 �C to 50 �C can be assumed insignificant compared to CO2, due to the saturationpressure.
The storage is desired to convert the fluctuating production of CO2 and H2 into meanflows such that the MeOH synthesis does not operate at partial loading. The three abovementioned processes, being carbon capture, electrolysis and storage, will therefore be anal-ysed as dynamic subsystems in the following Chapter 3 on page 39. The remaining pro-cesses, presented in the following sections of this chapter, will be analysed as steady statesubsystems in Chapter 4 on page 59.
2.4 Methanol Synthesis
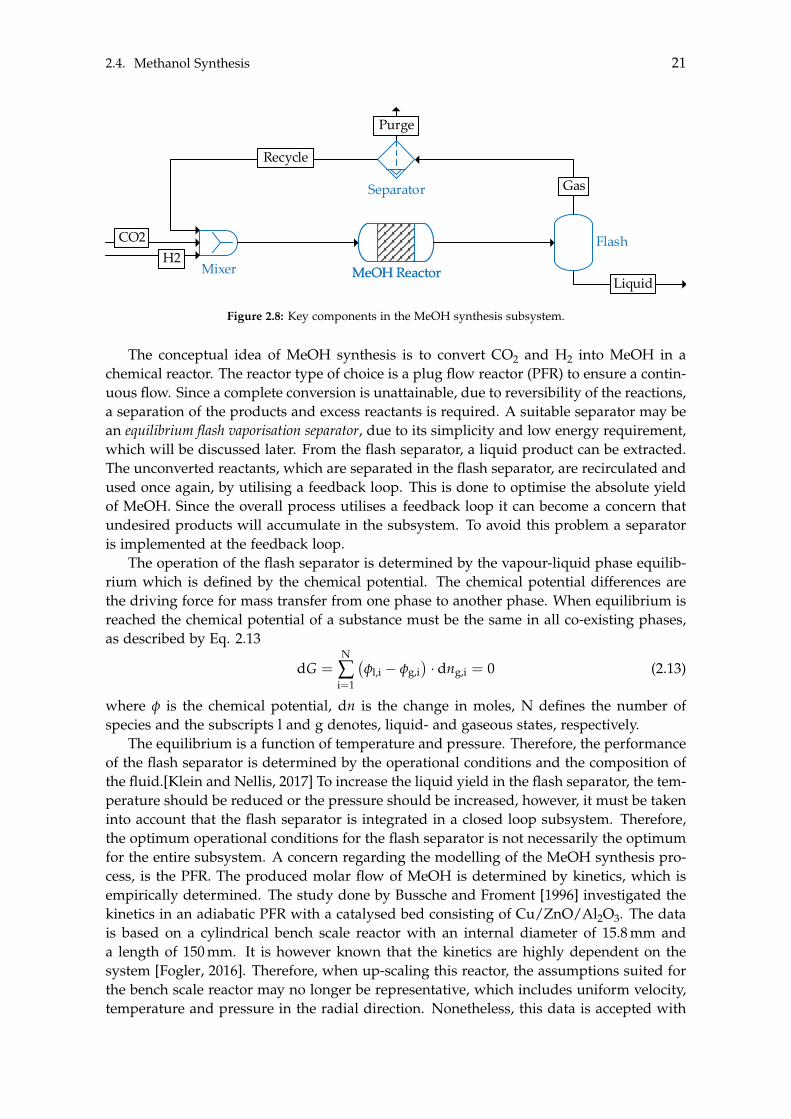
The synthesis of syngases into MeOH can be performed from a various of methods, how-ever, some key components and processes do not vary. A simplified version of the MeOHsynthesis subsystem may be seen in Figure 2.8 on the next page. It should be noted thatthe components used to control the operational conditions are not included since they aredependent on the operation of the key components.
2.4. Methanol Synthesis 21
Mixer ReactorReactor Flash
S2
Mixer
hej
Absorber/stripper/packed column BTX&MeOH-Dist/TrayBTX&MeOH-Dist/Tray
Valve
Comp
Pump Heat exchanger
Cooler
Fluid/liquid separator
Tank
CompFlash
Column 1Column 1 Column 2Column 2 Column 3Column 3 Column 4Column 4
BTX synthesis product stream
H2 CO
CH4C2H4
C2H6CO2
C3H6C3H8 C4H10
C5H12C6H14
CH3OH
C6H6H2O
C7H8C8H10 C9H12
C10H14
Heater
Mixer MeOH ReactorMeOH Reactor
Flash
Separator
Recycle
Gas
Purge
Liquid
H2CO2
Figure 2.8: Key components in the MeOH synthesis subsystem.
The conceptual idea of MeOH synthesis is to convert CO2 and H2 into MeOH in achemical reactor. The reactor type of choice is a plug flow reactor (PFR) to ensure a contin-uous flow. Since a complete conversion is unattainable, due to reversibility of the reactions,a separation of the products and excess reactants is required. A suitable separator may bean equilibrium flash vaporisation separator, due to its simplicity and low energy requirement,which will be discussed later. From the flash separator, a liquid product can be extracted.The unconverted reactants, which are separated in the flash separator, are recirculated andused once again, by utilising a feedback loop. This is done to optimise the absolute yieldof MeOH. Since the overall process utilises a feedback loop it can become a concern thatundesired products will accumulate in the subsystem. To avoid this problem a separatoris implemented at the feedback loop.
The operation of the flash separator is determined by the vapour-liquid phase equilib-rium which is defined by the chemical potential. The chemical potential differences arethe driving force for mass transfer from one phase to another phase. When equilibrium isreached the chemical potential of a substance must be the same in all co-existing phases,as described by Eq. 2.13
dG =N
Âi=1
�fl,i � fg,i
�· dng,i = 0 (2.13)
where f is the chemical potential, dn is the change in moles, N defines the number ofspecies and the subscripts l and g denotes, liquid- and gaseous states, respectively.
The equilibrium is a function of temperature and pressure. Therefore, the performanceof the flash separator is determined by the operational conditions and the composition ofthe fluid.[Klein and Nellis, 2017] To increase the liquid yield in the flash separator, the tem-perature should be reduced or the pressure should be increased, however, it must be takeninto account that the flash separator is integrated in a closed loop subsystem. Therefore,the optimum operational conditions for the flash separator is not necessarily the optimumfor the entire subsystem. A concern regarding the modelling of the MeOH synthesis pro-cess, is the PFR. The produced molar flow of MeOH is determined by kinetics, which isempirically determined. The study done by Bussche and Froment [1996] investigated thekinetics in an adiabatic PFR with a catalysed bed consisting of Cu/ZnO/Al2O3. The datais based on a cylindrical bench scale reactor with an internal diameter of 15.8 mm anda length of 150 mm. It is however known that the kinetics are highly dependent on thesystem [Fogler, 2016]. Therefore, when up-scaling this reactor, the assumptions suited forthe bench scale reactor may no longer be representative, which includes uniform velocity,temperature and pressure in the radial direction. Nonetheless, this data is accepted with
22 Chapter 2. System Analysis
the knowledge that it will differ in a commercial plant.Among others, the MeOH synthesis could be based on the global reactions of the
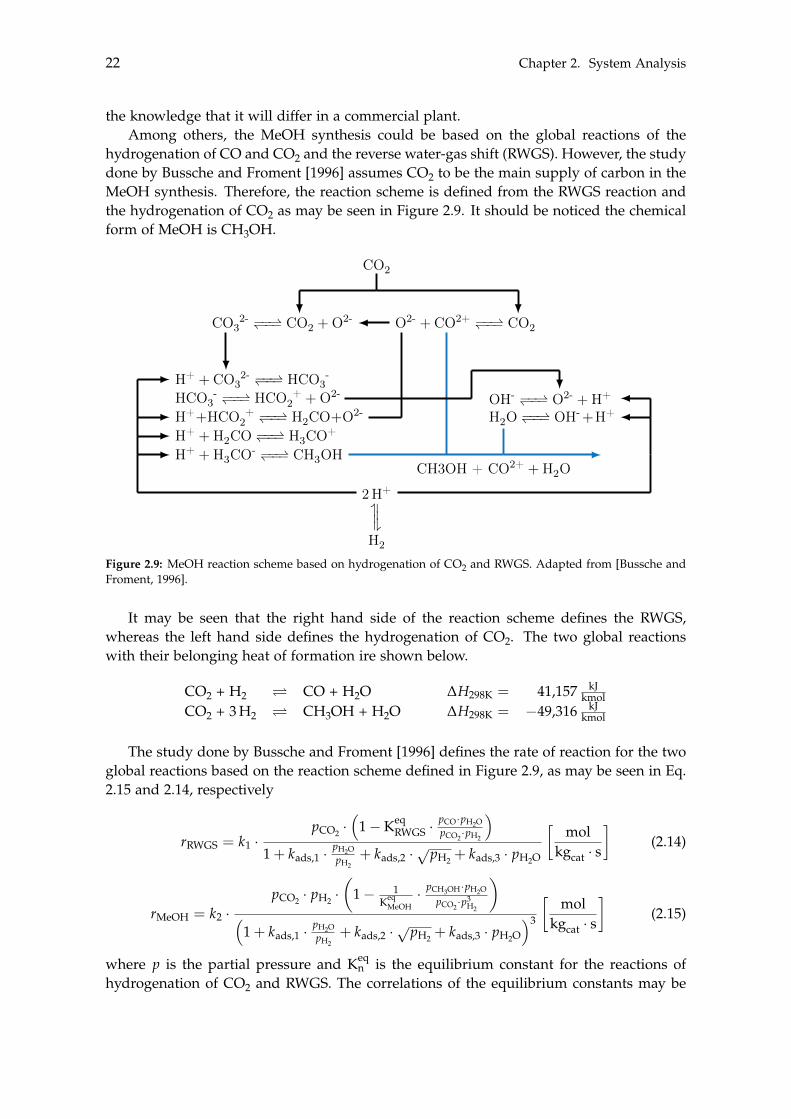
hydrogenation of CO and CO2 and the reverse water-gas shift (RWGS). However, the studydone by Bussche and Froment [1996] assumes CO2 to be the main supply of carbon in theMeOH synthesis. Therefore, the reaction scheme is defined from the RWGS reaction andthe hydrogenation of CO2 as may be seen in Figure 2.9. It should be noticed the chemicalform of MeOH is CH3OH.
H+ + CO 2-3 ��*)�� HCO -
3HCO -
3 ��*)�� HCO +2 + O2-
H++HCO +2 ��*)�� H2CO+O2-
H+ + H2CO ��*)�� H3CO+
H+ + H3CO- ��*)�� CH3OH
OH- ��*)�� O2- + H+
H2O ��*)�� OH-+H+
CO 2-3 ��*)�� CO2 + O2-
CO2
O2- + CO2+ ��*)�� CO2
2 H+
��*
)��
H2
CH3OH + CO2+ + H2O
Figure 2.9: MeOH reaction scheme based on hydrogenation of CO2 and RWGS. Adapted from [Bussche andFroment, 1996].
It may be seen that the right hand side of the reaction scheme defines the RWGS,whereas the left hand side defines the hydrogenation of CO2. The two global reactionswith their belonging heat of formation ire shown below.
CO2 + H2 ⌦ CO + H2O DH298K = 41,157 kJkmol
CO2 + 3 H2 ⌦ CH3OH + H2O DH298K = �49,316 kJkmol
The study done by Bussche and Froment [1996] defines the rate of reaction for the twoglobal reactions based on the reaction scheme defined in Figure 2.9, as may be seen in Eq.2.15 and 2.14, respectively
rRWGS = k1 ·pCO2 ·
⇣1 � Keq
RWGS ·pCO·pH2OpCO2·pH2
⌘
1 + kads,1 ·pH2OpH2
+ kads,2 ·ppH2 + kads,3 · pH2O
mol
kgcat · s
�(2.14)
rMeOH = k2 ·pCO2 · pH2 ·
✓1 � 1
KeqMeOH
· pCH3OH·pH2O
pCO2·p3H2
◆
⇣1 + kads,1 ·
pH2OpH2
+ kads,2 ·ppH2 + kads,3 · pH2O
⌘3
mol
kgcat · s
�(2.15)
where p is the partial pressure and Keqn is the equilibrium constant for the reactions of
hydrogenation of CO2 and RWGS. The correlations of the equilibrium constants may be
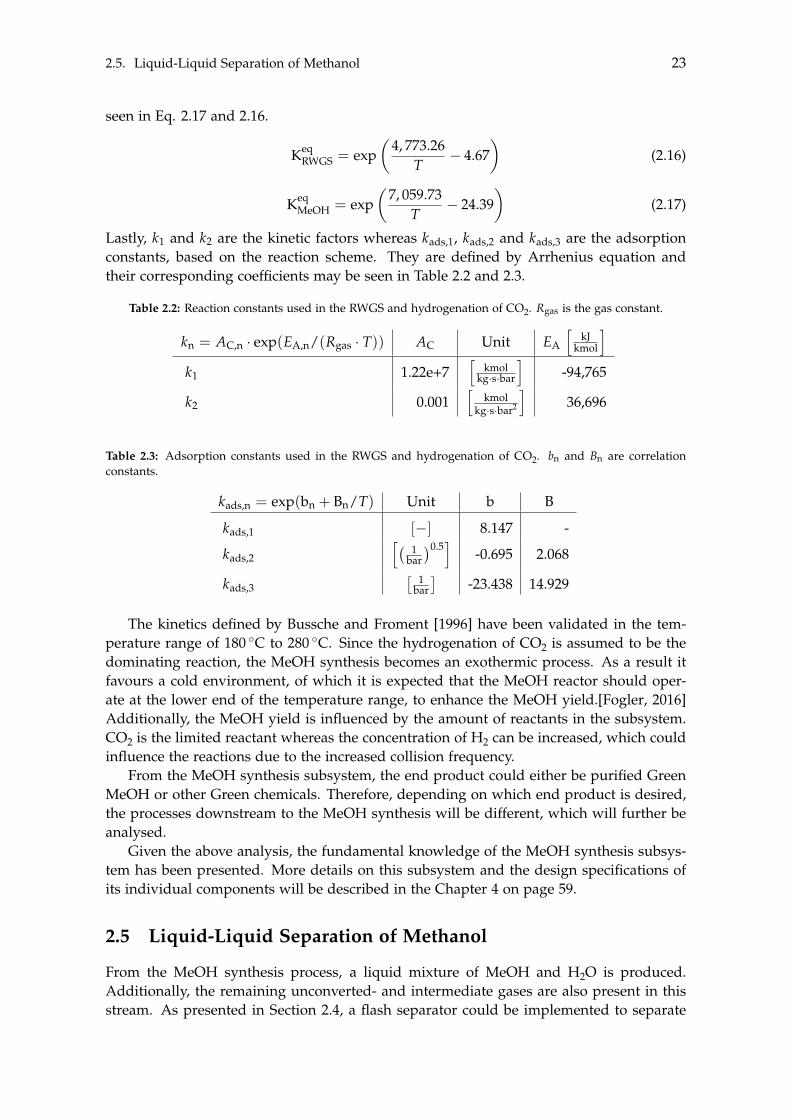
2.5. Liquid-Liquid Separation of Methanol 23
seen in Eq. 2.17 and 2.16.
KeqRWGS = exp
✓4, 773.26
T� 4.67
◆(2.16)
KeqMeOH = exp
✓7, 059.73
T� 24.39
◆(2.17)
Lastly, k1 and k2 are the kinetic factors whereas kads,1, kads,2 and kads,3 are the adsorptionconstants, based on the reaction scheme. They are defined by Arrhenius equation andtheir corresponding coefficients may be seen in Table 2.2 and 2.3.
Table 2.2: Reaction constants used in the RWGS and hydrogenation of CO2. Rgas is the gas constant.
kn = AC,n · exp(EA,n/(Rgas · T)) AC Unit EA
hkJ
kmol
i
k1 1.22e+7h
kmolkg·s·bar
i-94,765
k2 0.001h
kmolkg·s·bar2
i36,696
Table 2.3: Adsorption constants used in the RWGS and hydrogenation of CO2. bn and Bn are correlationconstants.
kads,n = exp(bn + Bn/T) Unit b B
kads,1 [�] 8.147 -
kads,2
h� 1bar
�0.5i
-0.695 2.068
kads,3⇥ 1
bar⇤
-23.438 14.929
The kinetics defined by Bussche and Froment [1996] have been validated in the tem-perature range of 180 �C to 280 �C. Since the hydrogenation of CO2 is assumed to be thedominating reaction, the MeOH synthesis becomes an exothermic process. As a result itfavours a cold environment, of which it is expected that the MeOH reactor should oper-ate at the lower end of the temperature range, to enhance the MeOH yield.[Fogler, 2016]Additionally, the MeOH yield is influenced by the amount of reactants in the subsystem.CO2 is the limited reactant whereas the concentration of H2 can be increased, which couldinfluence the reactions due to the increased collision frequency.
From the MeOH synthesis subsystem, the end product could either be purified GreenMeOH or other Green chemicals. Therefore, depending on which end product is desired,the processes downstream to the MeOH synthesis will be different, which will further beanalysed.
Given the above analysis, the fundamental knowledge of the MeOH synthesis subsys-tem has been presented. More details on this subsystem and the design specifications ofits individual components will be described in the Chapter 4 on page 59.
2.5 Liquid-Liquid Separation of Methanol
From the MeOH synthesis process, a liquid mixture of MeOH and H2O is produced.Additionally, the remaining unconverted- and intermediate gases are also present in thisstream. As presented in Section 2.4, a flash separator could be implemented to separate
24 Chapter 2. System Analysis
the gases from the liquid mixture to ensure that the liquid mole fraction of the mixtureentering the liquid-liquid separation approaches unity. However, depending on the oper-ating conditions for the MeOH synthesis, it could occur that some gases are not separatedand exits along with the MeOH and H2O. This will be analysed when the modelling of theMeOH synthesis has been conducted, from which it can be concluded if further separationof gases is required before the liquid-liquid separation. Currently, it is assumed that allgases are separated from which the liquid-liquid separation can be analysed.
The purity level of MeOH has a direct influence on the asking price, hence it requirespurification if it is the desired end product. As such a liquid-liquid separation is requiredfor the MeOH-H2O mixture. The following section discusses the best suited separationtechnique in order to obtain MeOH at high purity and the designing of this technique.
MeOH is an alcohol which contains a hydroxyl group. This enables the MeOH toeasily form hydrogen bonds with the hydroxyl groups in H2O, resulting in the MeOH-H2O mixture being homogeneous, which is commonly know as a solution.[Dalena et al.,2017]
Numerous separation techniques exists for separating a solution. Due to the mixturebeing a single-phase solution it excludes techniques using barriers, solid agents and sep-aration by external fields such as centrifugal, thermal or electric forces. This identifies therequirement of phase creation or phase addition in order to separate the two liquids. Phasecreation is defined as the conversion of a liquid to vapour which is accomplished by anenergy-separation agent, typically in the form of heat transfer. Phase addition is defined asthe addition of another phase which is done by a mass-separating agent (MSA), in whichthe MSA may be partly immiscible with one of the species. However, the MSA option isnot applicable in commercial plants since it leads to issues, such as product contaminationand the need of additional separators to remove the MSA.[Sorsamäki and Nappa, 2015]This results in phase creation being the most suitable separation technique for the pre-sented application. Phase creation is accomplished by distillation, which will be presentedin the following.
2.5.1 Distillation
The concept of distillation is to separate the species of a solution based on the volatilityof the individual species, hence the relative volatility is the driving factor. The distillationtechnique is generally not recommended for a relative volatility below 1.2, as the difficultyin separating the species results in the technique being infeasible [Sorsamäki and Nappa,2015]. Distillation is carried out by either flash distillation or fractional distillation. Flash dis-tillation is the simplest technique and it is based on producing vapour by boiling the liquidsolution and then condensing the vapour without letting any condensed vapour recircu-late. This technique is well suited for a solution with a high relative volatility, resultingin the species boiling at widely different temperatures. If the volatility of the species aresimilar, the resulting liquid- and vapour streams would become less pure.[McCabe et al.,1993]
The relative volatility is determined in order to justify if the flash distillation, anddistillation technique in general, is suited for this separation process. The solution for thepresented study, is a binary MeOH-H2O solution, where the relative volatility is definedas shown in Eq. 2.18
↵MeOH,H2O =(yMeOH/xMeOH)
(yH2O/xH2O)=
KeqMeOH
KeqH2O
(2.18)
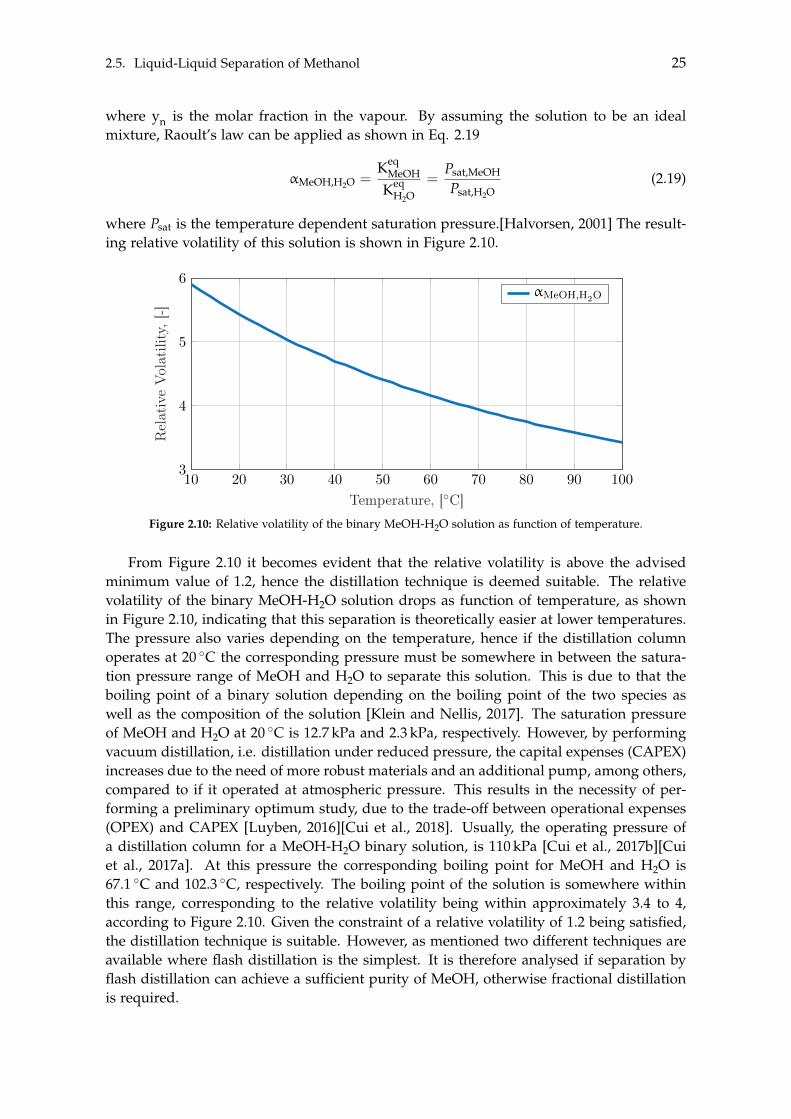
2.5. Liquid-Liquid Separation of Methanol 25
where yn is the molar fraction in the vapour. By assuming the solution to be an idealmixture, Raoult’s law can be applied as shown in Eq. 2.19
↵MeOH,H2O =Keq
MeOH
KeqH2O
=Psat,MeOH
Psat,H2O(2.19)
where Psat is the temperature dependent saturation pressure.[Halvorsen, 2001] The result-ing relative volatility of this solution is shown in Figure 2.10.
10 20 30 40 50 60 70 80 90 1003
4
5
6
Temperature, [�C]
Rel
ativ
eV
olat
ility
,[-]
↵MeOH,H2O
Figure 2.10: Relative volatility of the binary MeOH-H2O solution as function of temperature.
From Figure 2.10 it becomes evident that the relative volatility is above the advisedminimum value of 1.2, hence the distillation technique is deemed suitable. The relativevolatility of the binary MeOH-H2O solution drops as function of temperature, as shownin Figure 2.10, indicating that this separation is theoretically easier at lower temperatures.The pressure also varies depending on the temperature, hence if the distillation columnoperates at 20 �C the corresponding pressure must be somewhere in between the satura-tion pressure range of MeOH and H2O to separate this solution. This is due to that theboiling point of a binary solution depending on the boiling point of the two species aswell as the composition of the solution [Klein and Nellis, 2017]. The saturation pressureof MeOH and H2O at 20 �C is 12.7 kPa and 2.3 kPa, respectively. However, by performingvacuum distillation, i.e. distillation under reduced pressure, the capital expenses (CAPEX)increases due to the need of more robust materials and an additional pump, among others,compared to if it operated at atmospheric pressure. This results in the necessity of per-forming a preliminary optimum study, due to the trade-off between operational expenses(OPEX) and CAPEX [Luyben, 2016][Cui et al., 2018]. Usually, the operating pressure ofa distillation column for a MeOH-H2O binary solution, is 110 kPa [Cui et al., 2017b][Cuiet al., 2017a]. At this pressure the corresponding boiling point for MeOH and H2O is67.1 �C and 102.3 �C, respectively. The boiling point of the solution is somewhere withinthis range, corresponding to the relative volatility being within approximately 3.4 to 4,according to Figure 2.10. Given the constraint of a relative volatility of 1.2 being satisfied,the distillation technique is suitable. However, as mentioned two different techniques areavailable where flash distillation is the simplest. It is therefore analysed if separation byflash distillation can achieve a sufficient purity of MeOH, otherwise fractional distillationis required.
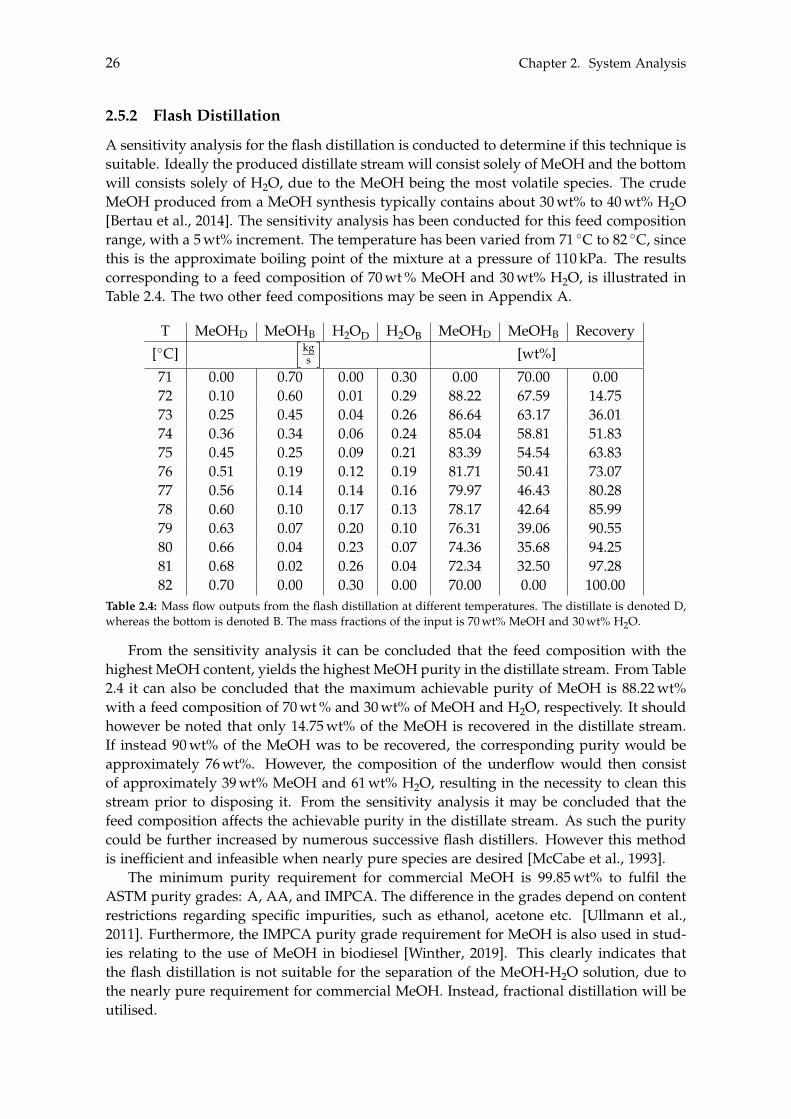
26 Chapter 2. System Analysis
2.5.2 Flash Distillation
A sensitivity analysis for the flash distillation is conducted to determine if this technique issuitable. Ideally the produced distillate stream will consist solely of MeOH and the bottomwill consists solely of H2O, due to the MeOH being the most volatile species. The crudeMeOH produced from a MeOH synthesis typically contains about 30 wt% to 40 wt% H2O[Bertau et al., 2014]. The sensitivity analysis has been conducted for this feed compositionrange, with a 5 wt% increment. The temperature has been varied from 71 �C to 82 �C, sincethis is the approximate boiling point of the mixture at a pressure of 110 kPa. The resultscorresponding to a feed composition of 70 wt % MeOH and 30 wt% H2O, is illustrated inTable 2.4. The two other feed compositions may be seen in Appendix A.
T MeOHD MeOHB H2OD H2OB MeOHD MeOHB Recovery[�C]
hkgs
i[wt%]
71 0.00 0.70 0.00 0.30 0.00 70.00 0.0072 0.10 0.60 0.01 0.29 88.22 67.59 14.7573 0.25 0.45 0.04 0.26 86.64 63.17 36.0174 0.36 0.34 0.06 0.24 85.04 58.81 51.8375 0.45 0.25 0.09 0.21 83.39 54.54 63.8376 0.51 0.19 0.12 0.19 81.71 50.41 73.0777 0.56 0.14 0.14 0.16 79.97 46.43 80.2878 0.60 0.10 0.17 0.13 78.17 42.64 85.9979 0.63 0.07 0.20 0.10 76.31 39.06 90.5580 0.66 0.04 0.23 0.07 74.36 35.68 94.2581 0.68 0.02 0.26 0.04 72.34 32.50 97.2882 0.70 0.00 0.30 0.00 70.00 0.00 100.00
Table 2.4: Mass flow outputs from the flash distillation at different temperatures. The distillate is denoted D,whereas the bottom is denoted B. The mass fractions of the input is 70 wt% MeOH and 30 wt% H2O.
From the sensitivity analysis it can be concluded that the feed composition with thehighest MeOH content, yields the highest MeOH purity in the distillate stream. From Table2.4 it can also be concluded that the maximum achievable purity of MeOH is 88.22 wt%with a feed composition of 70 wt % and 30 wt% of MeOH and H2O, respectively. It shouldhowever be noted that only 14.75 wt% of the MeOH is recovered in the distillate stream.If instead 90 wt% of the MeOH was to be recovered, the corresponding purity would beapproximately 76 wt%. However, the composition of the underflow would then consistof approximately 39 wt% MeOH and 61 wt% H2O, resulting in the necessity to clean thisstream prior to disposing it. From the sensitivity analysis it may be concluded that thefeed composition affects the achievable purity in the distillate stream. As such the puritycould be further increased by numerous successive flash distillers. However this methodis inefficient and infeasible when nearly pure species are desired [McCabe et al., 1993].
The minimum purity requirement for commercial MeOH is 99.85 wt% to fulfil theASTM purity grades: A, AA, and IMPCA. The difference in the grades depend on contentrestrictions regarding specific impurities, such as ethanol, acetone etc. [Ullmann et al.,2011]. Furthermore, the IMPCA purity grade requirement for MeOH is also used in stud-ies relating to the use of MeOH in biodiesel [Winther, 2019]. This clearly indicates thatthe flash distillation is not suitable for the separation of the MeOH-H2O solution, due tothe nearly pure requirement for commercial MeOH. Instead, fractional distillation will beutilised.
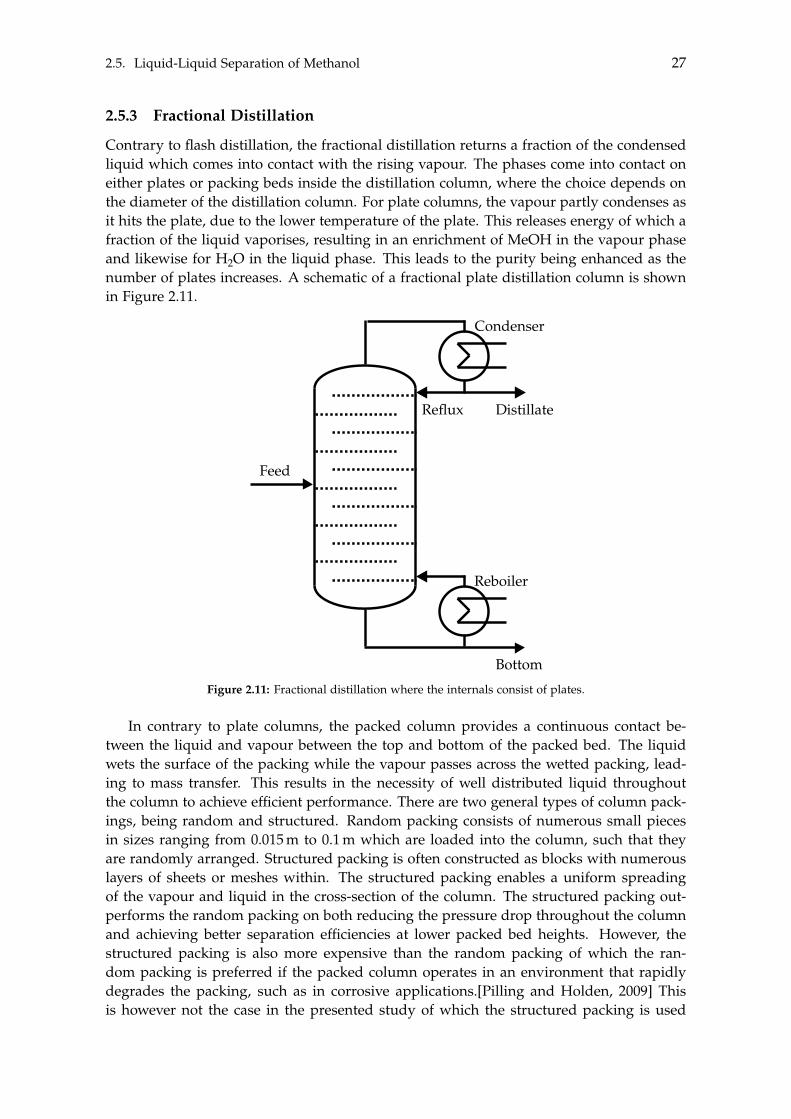
2.5. Liquid-Liquid Separation of Methanol 27
2.5.3 Fractional Distillation
Contrary to flash distillation, the fractional distillation returns a fraction of the condensedliquid which comes into contact with the rising vapour. The phases come into contact oneither plates or packing beds inside the distillation column, where the choice depends onthe diameter of the distillation column. For plate columns, the vapour partly condenses asit hits the plate, due to the lower temperature of the plate. This releases energy of which afraction of the liquid vaporises, resulting in an enrichment of MeOH in the vapour phaseand likewise for H2O in the liquid phase. This leads to the purity being enhanced as thenumber of plates increases. A schematic of a fractional plate distillation column is shownin Figure 2.11.
Feed
Reboiler
Reflux Distillate
Condenser
Bottom
Figure 2.11: Fractional distillation where the internals consist of plates.
In contrary to plate columns, the packed column provides a continuous contact be-tween the liquid and vapour between the top and bottom of the packed bed. The liquidwets the surface of the packing while the vapour passes across the wetted packing, lead-ing to mass transfer. This results in the necessity of well distributed liquid throughoutthe column to achieve efficient performance. There are two general types of column pack-ings, being random and structured. Random packing consists of numerous small piecesin sizes ranging from 0.015 m to 0.1 m which are loaded into the column, such that theyare randomly arranged. Structured packing is often constructed as blocks with numerouslayers of sheets or meshes within. The structured packing enables a uniform spreadingof the vapour and liquid in the cross-section of the column. The structured packing out-performs the random packing on both reducing the pressure drop throughout the columnand achieving better separation efficiencies at lower packed bed heights. However, thestructured packing is also more expensive than the random packing of which the ran-dom packing is preferred if the packed column operates in an environment that rapidlydegrades the packing, such as in corrosive applications.[Pilling and Holden, 2009] Thisis however not the case in the presented study of which the structured packing is used
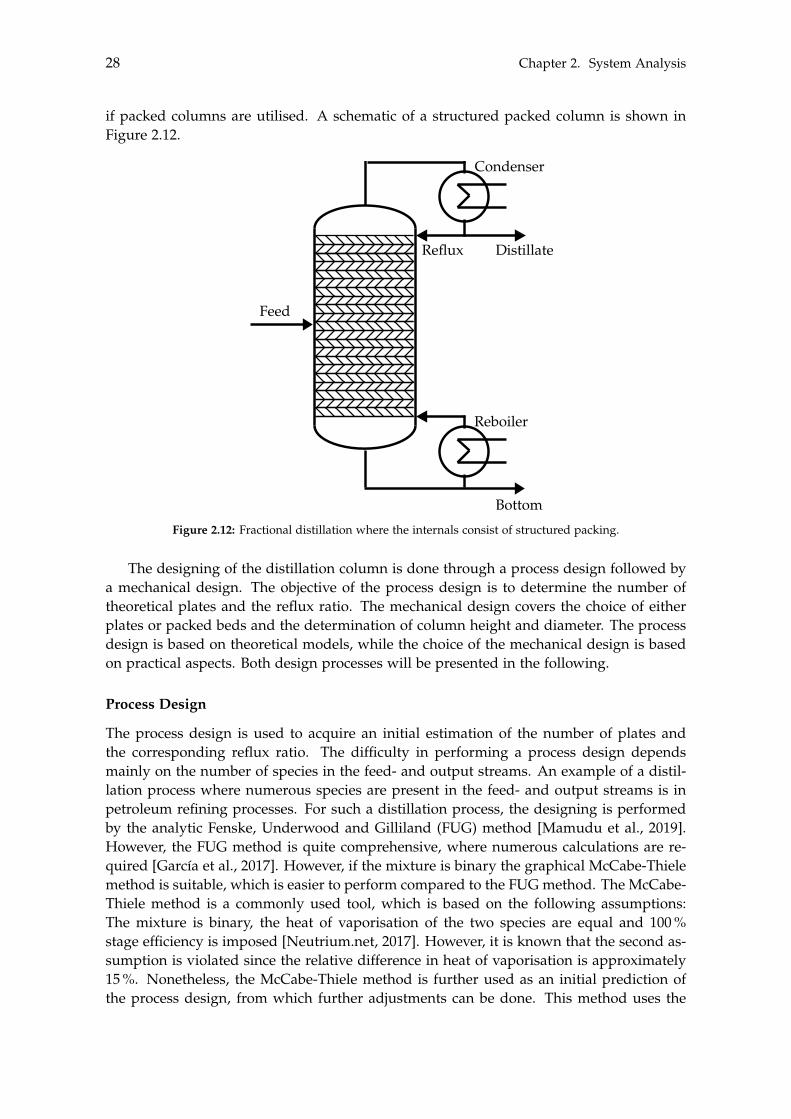
28 Chapter 2. System Analysis
if packed columns are utilised. A schematic of a structured packed column is shown inFigure 2.12.
Feed
Reboiler
Reflux Distillate
Condenser
Bottom
Figure 2.12: Fractional distillation where the internals consist of structured packing.
The designing of the distillation column is done through a process design followed bya mechanical design. The objective of the process design is to determine the number oftheoretical plates and the reflux ratio. The mechanical design covers the choice of eitherplates or packed beds and the determination of column height and diameter. The processdesign is based on theoretical models, while the choice of the mechanical design is basedon practical aspects. Both design processes will be presented in the following.
Process Design
The process design is used to acquire an initial estimation of the number of plates andthe corresponding reflux ratio. The difficulty in performing a process design dependsmainly on the number of species in the feed- and output streams. An example of a distil-lation process where numerous species are present in the feed- and output streams is inpetroleum refining processes. For such a distillation process, the designing is performedby the analytic Fenske, Underwood and Gilliland (FUG) method [Mamudu et al., 2019].However, the FUG method is quite comprehensive, where numerous calculations are re-quired [García et al., 2017]. However, if the mixture is binary the graphical McCabe-Thielemethod is suitable, which is easier to perform compared to the FUG method. The McCabe-Thiele method is a commonly used tool, which is based on the following assumptions:The mixture is binary, the heat of vaporisation of the two species are equal and 100 %stage efficiency is imposed [Neutrium.net, 2017]. However, it is known that the second as-sumption is violated since the relative difference in heat of vaporisation is approximately15 %. Nonetheless, the McCabe-Thiele method is further used as an initial prediction ofthe process design, from which further adjustments can be done. This method uses the
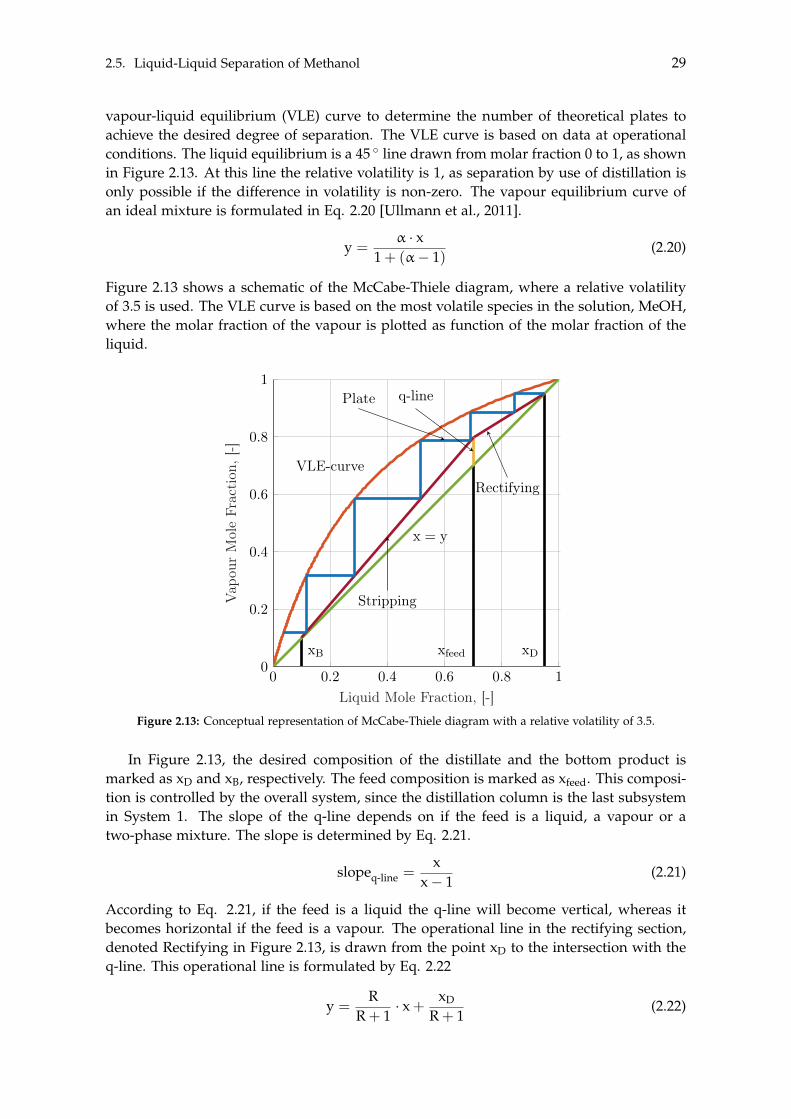
2.5. Liquid-Liquid Separation of Methanol 29
vapour-liquid equilibrium (VLE) curve to determine the number of theoretical plates toachieve the desired degree of separation. The VLE curve is based on data at operationalconditions. The liquid equilibrium is a 45 � line drawn from molar fraction 0 to 1, as shownin Figure 2.13. At this line the relative volatility is 1, as separation by use of distillation isonly possible if the difference in volatility is non-zero. The vapour equilibrium curve ofan ideal mixture is formulated in Eq. 2.20 [Ullmann et al., 2011].
y =↵ · x
1 + (↵� 1)(2.20)
Figure 2.13 shows a schematic of the McCabe-Thiele diagram, where a relative volatilityof 3.5 is used. The VLE curve is based on the most volatile species in the solution, MeOH,where the molar fraction of the vapour is plotted as function of the molar fraction of theliquid.
0 0.2 0.4 0.6 0.8 10
0.2
0.4
0.6
0.8
1
xB xfeed xD
x = y
VLE-curve
Plate q-line
Stripping
Rectifying
Liquid Mole Fraction, [-]
Vap
our
Mol
eFr
acti
on,[
-]
Figure 2.13: Conceptual representation of McCabe-Thiele diagram with a relative volatility of 3.5.
In Figure 2.13, the desired composition of the distillate and the bottom product ismarked as xD and xB, respectively. The feed composition is marked as xfeed. This composi-tion is controlled by the overall system, since the distillation column is the last subsystemin System 1. The slope of the q-line depends on if the feed is a liquid, a vapour or atwo-phase mixture. The slope is determined by Eq. 2.21.
slopeq-line =x
x � 1(2.21)
According to Eq. 2.21, if the feed is a liquid the q-line will become vertical, whereas itbecomes horizontal if the feed is a vapour. The operational line in the rectifying section,denoted Rectifying in Figure 2.13, is drawn from the point xD to the intersection with theq-line. This operational line is formulated by Eq. 2.22
y =R
R + 1· x +
xD
R + 1(2.22)
30 Chapter 2. System Analysis
where R is the external reflux ratio defined by Eq. 2.23
R =nL
nD(2.23)
where the subscripts L and D denote the liquid stream returning to the column and thedistillate stream, respectively. The higher the reflux ratio the fewer equilibrium plates arerequired, but this also increases the energy demand. A reflux ratio can be chosen freely,where two extreme cases exist, referred to as total reflux and minimum reflux. The totalreflux is when the operational line, denoted Rectifying in Figure 2.13 on the previous page,intersects with the q-line at point xfeed. This yields the lowest number of theoretical plates,however, no distillate is produced as it is all returned to the column. The minimum refluxis when the intersection of the operation line on the q-line is at the equilibrium curve.This results in the necessity of infinite plates in order to accomplish the separation. Theoperating line in the stripping section is then drawn from the intersection point of theq-line to the point xB.
The number of theoretical plates can be determined by counting the number of timesthe horizontal steps touches the VLE curve, counting from xD to xB. From this procedure itcan be concluded that there is a correlation between the number of theoretical plates andreflux ratio, where the choice of this combination is essential from an economical pointof view. This is due to the reflux ratio influencing the OPEX and the number of platesimpacts the CAPEX
Mechanical Design
The purpose of the mechanical design is to select either plates or packing as the internalsand calculate the height and diameter of the column. The choice of column internalsis often based on the column diameter, where packing is preferred for smaller columnswhere the diameter is below 1 m, while plates are mainly used in larger columns wherethe diameter is above 1 m. Not only are packed columns more feasible comparedto plate columns at small diameters, but the accessibility of plate columns at thesediameters are also limited which results in difficulties when installing or maintainingthe plates.[Ibrahim, 2014] This concludes that packing will be used if the diameter of thecolumn is less than 1 m and plates are utilised if the diameter is greater than 1 m. Sincethe height and diameter are determined differently for the plate- and packed column, themechanical design must be performed by both procedures in order to determine whichare best suited, from the resulting diameters.
Plate ColumnIn order to determine the height of the plate column, the number of actual plates mustfirstly be defined. The actual number of plates is determined by performing the processdesign which estimates the number of theoretical plates, from which the number of platesare increased to correct for non-ideal conditions. The height of the column between the topplate and the bottom plate is proportionally increasing as function of the number of actualplates, where the proportionality factor is the plate spacing. For reasons of accessibility theminimum plate spacing is within the range of 0.45 m to 0.60 m, depending on the diameterof the column. Greater plate spacing results in lower column diameter, which will be pre-sented afterwards, however it increases the height of the column. As such an economicaltrade-off needs to be considered between the column height and diameter.[Ibrahim, 2014]In general the plate spacing is dependent on the diameter of the column, where:
2.5. Liquid-Liquid Separation of Methanol 31
• Plate spacing = 0.45 m for column diameter less than 1.5 m
• Plate spacing = 0.60 m for column diameter in the range of 1.5 m to 6.0 m
• Plate spacing = 0.75 m for column diameter greater than 6.0 m
Due to practical aspects, an additional 1.22 m is added, to the column height, above thetop plate in order to keep liquid from entering the condenser. Furthermore, an additional3.05 m is added to the column height, below the bottom plate, in order to ensure sufficientsurge capacity. From this the total column height can be determined.[Seader et al., 2011]A maximum height of 53 m is recommended, due to wind load and foundation consider-ations [Coker, 2007]. If the estimated height of the distillation column extends 53 m, eitherthe plate spacing must be reduced which would reduce the height, or the single columnmust be split into multiple smaller distillation columns in series.
Proper dimensioning of the column diameter is crucial, since it influences the plateefficiency, pressure drop throughout the column and the performance in general. In orderfor the distillation column to operate efficiently, the following conditions must be fulfilled:
• The liquid flows from plate to plate only at the downcomers, which is located at theperiphery of the plate.
• The liquid does not weep through the gaps in the plates.
• The liquid is not carried by the vapour to the plate above.
• The vapour only flows through the gaps of the plate.
• The vapour is not carried down by the liquid in the downcomers.
These criteria can be fulfilled by dimensioning the diameter of the column in accordanceto the vapour flow rate. Weeping will occur if the vapour flow rate is insufficient. Op-positely, if this flow rate is too great the vapour will carry the liquid to the above plate.The general design procedure is to estimate the maximum allowable vapour velocity, andthereby reduce it by 20 wt% as a safety factor.[Seader et al., 2011] The maximum allowablevapour velocity is defined by the Sounders-Brown equation shown in Eq. 2.24
vmax = C ·s
rL � rV
rV(2.24)
where C is the capacity factor, r is the density and the subscripts L and V denotes the liquidand vapour streams, respectively. The capacity factor can be determined theoretically,where numerous factors are included such as the droplet diameter and the drag coefficient.However, it is usually obtained from correlations based on empirical data acquired fromexperiments. Different factors are included depending on the chosen correlation, wherea well known and often used capacity correlation is the Fair’s capacity (CF) as shown inFigure 2.14 on the next page.[Stichlmair, 2010]
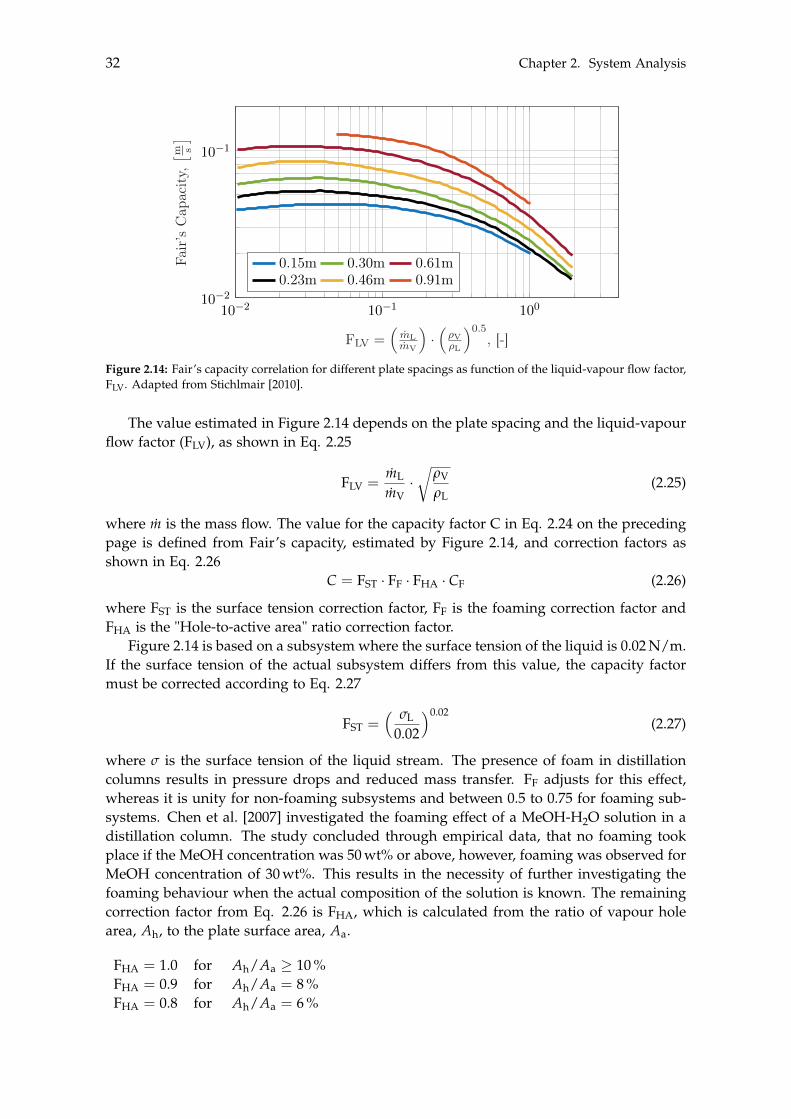
32 Chapter 2. System Analysis
10�2 10�1 10010�2
10�1
FLV =⇣
mLmV
⌘·⇣⇢V⇢L
⌘0.5, [-]
Fair
’sC
apac
ity,⇥ m
s⇤
0.15m 0.30m 0.61m0.23m 0.46m 0.91m
Figure 2.14: Fair’s capacity correlation for different plate spacings as function of the liquid-vapour flow factor,FLV. Adapted from Stichlmair [2010].
The value estimated in Figure 2.14 depends on the plate spacing and the liquid-vapourflow factor (FLV), as shown in Eq. 2.25
FLV =mL
mV·r
rV
rL(2.25)
where m is the mass flow. The value for the capacity factor C in Eq. 2.24 on the precedingpage is defined from Fair’s capacity, estimated by Figure 2.14, and correction factors asshown in Eq. 2.26
C = FST · FF · FHA · CF (2.26)
where FST is the surface tension correction factor, FF is the foaming correction factor andFHA is the "Hole-to-active area" ratio correction factor.
Figure 2.14 is based on a subsystem where the surface tension of the liquid is 0.02 N/m.If the surface tension of the actual subsystem differs from this value, the capacity factormust be corrected according to Eq. 2.27
FST =⇣ sL
0.02
⌘0.02(2.27)
where s is the surface tension of the liquid stream. The presence of foam in distillationcolumns results in pressure drops and reduced mass transfer. FF adjusts for this effect,whereas it is unity for non-foaming subsystems and between 0.5 to 0.75 for foaming sub-systems. Chen et al. [2007] investigated the foaming effect of a MeOH-H2O solution in adistillation column. The study concluded through empirical data, that no foaming tookplace if the MeOH concentration was 50 wt% or above, however, foaming was observed forMeOH concentration of 30 wt%. This results in the necessity of further investigating thefoaming behaviour when the actual composition of the solution is known. The remainingcorrection factor from Eq. 2.26 is FHA, which is calculated from the ratio of vapour holearea, Ah, to the plate surface area, Aa.
FHA = 1.0 for Ah/Aa � 10 %FHA = 0.9 for Ah/Aa = 8 %FHA = 0.8 for Ah/Aa = 6 %
2.5. Liquid-Liquid Separation of Methanol 33
The ratio of Ah/Aa is typically in the range of 5 % to 15 %. A low hole area percent-age allows higher efficiency for the plate, however, it comes at the expense of increasedpressure drop. As such, the hole area percentage of the plate is chosen depending onthe operating conditions of the distillation column, whereas the typical ranges are 5 % to10 % for pressure levels relatively close to ambient pressure and 10 % to 16 % for vacuum.[SeperationTechnology.com, 2012] [Chuang and Nandakumar, 2000] Since the operationalpressure is 110 kPa, as presented in 2.5.1 on page 24, a hole area ratio of 8 % is chosen ofwhich the corresponding value for FHA becomes 0.9.
With the definition of all the parameters in Eq. 2.24 on page 31 made, the maximumallowable vapour velocity can be calculated. Given the maximum vapour velocity, thecorresponding diameter can be determined from the continuity equation as seen in Eq.2.28
D =
0
@ 4 · mV
f · p · vmax ·⇣
1 � AdAtot
⌘· rV
1
A0.5
(2.28)
where f is the flooding factor, Atot is the total column cross-sectional area and Ad is thecross-sectional area of the downcomer. The ratio Ad/Atot in Eq. 2.28 is estimated by theliquid-vapour flow factor, outlined in [Seader et al., 2011], to be:
Ad/Atot = 0.1 for FLV 0.1Ad/Atot = 0.1 + FLV�0.1
9 for 0.1 < FLV < 1.0Ad/Atot = 0.2 for FLV � 1.0
This concludes the mechanical design procedure for plate columns. The followingpresents the mechanical design procedure for fractional distillation utilising packedcolumns.
Packed ColumnThe packed column has continuous contact with liquid and vapour throughout the col-umn, however, it is analysed in the mechanical design procedure as being a segmentedcolumn. The packed portion of the column is divided into segments of equal height. Theheight of these segments are known as the height equivalent to a theoretical plate (HETP).The height of the column can then be calculated by the number of equilibrium plates andthe HETP-value, as shown in Eq. 2.29
L = Neq · HETP (2.29)
where Neq is the number of theoretical equilibrium plates. The number of theoreticalequilibrium plates is determined from the McCabe-Thiele method, as earlier presented.The HETP-value is measured experimentally and it varies with the packing type, sizeand vapour flow rate. It is however known that most packings of the same size haveapproximately the same HETP-value, leading to a simplified estimation of the HETP-valueas shown in Eq. 2.30
HETP =100ap
+ 0.10 (2.30)
where ap is the surface area per volume of packing. Eq. 2.30 is, however, restricted to lowviscous fluids at low to moderate pressure. This results in corrections to the HETP-valueif the liquid dynamic viscosity is above 0.04 Pa · s, however, this is not necessary in the
34 Chapter 2. System Analysis
presented study since the viscosities of H2O and MeOH are in the order of 0.001 Pa · s.A typical HETP-value for industrial applications is within 0.3 m to 0.6 m.[Wankat, 2012]An investigation of the market for structured packings will be performed, in order todetermine which packing is best suited and estimate a realistic value of ap.
There are numerous manufacturers of structured packings who all have different prod-ucts depending on the customer’s needs. A well-known manufacturer of packing is theSwiss company ’Sulzer’, who likewise have multiple products. These products are de-signed to operate at specific conditions, for instance in corrosive- or reactive environments,or at vacuum pressure or pressurised conditions. None of these conditions are howeverpresent in the presented study, since the feed stream consists of a MeOH-H2O solutionand the distillation column operates at 110 kPa. Hence, the "Mellapak" packing is chosen,which according to Sulzer, is an ’all-rounder’ packing, which is typically used in refineryapplications, operating from vacuum to moderate pressure [Sulzer, 2021b].
There exists numerous types of the Mellapak packing where an example is the "Mel-lapak 250.Y" and "Mellapak 250.X" [Sulzer, 2021a]. The conventional notation of the typeincludes two geometric indicators, the first is a number that specifies the ap value, whichcan range from 2 m2/m3 to 750 m2/m3 [Sulzer, 2021a]. The second is the channel flowangle relative to horizontal, where Y and X denotes values of 45 � and 60 �, respectively[Lassauce et al., 2014]. The general trade-off in the performance of packing is in the rela-tion between the HETP-value and pressure drop. The HETP-value describes the efficiencyof the packing where a high efficiency yields a low HETP-value. It is typically the ap valueshown in Eq. 2.30 on the previous page which is increased if the objective is to enhancethe efficiency, however, by increasing ap the pressure drop rises as well. The pressure dropdepends both on the ap value and the flow conditions, where a general allowable pressuredrop in packed columns are 1 kPa/m.[Lassauce et al., 1994] This results in the necessity toacquire experimental results in order to determine the most feasible packing type. How-ever, the Mellapak 250.Y is widely used in industrial applications and Yang et al. [2003]used this packing for a MeOH-H2O solution. As such the Mellapak 250.Y is utilised eventhough a more feasible alternative might be available.
Similar to the height of the column, the diameter of this packed bed column must alsobe determined. This is done as described by Towler and Sinnott [2008]. The vapour massflow rate per unit column cross-sectional area is determined of which it can be used tocalculate the required diameter corresponding to this mass flow. However, in order todetermine this mass flow, a correlation factor Fpack is required to be determined as may beseen in Eq. 2.31
m?V =
0
B@Fpack · rV · (rL � rV)
13.1 · ap ·⇣
µLrL
⌘0.1
1
CA
0.5
(2.31)
where µ is dynamic viscosity. In order to determine Fpack the liquid-vapour flow factor,FLV, is calculated and used in Figure 2.15 on the next page. Furthermore, the pressure dropmust also be determined, where it should be noted that values above 0.8 kPa or below0.08 kPa, should be avoided to prevent flooding or attain sufficient liquid distribution,respectively.
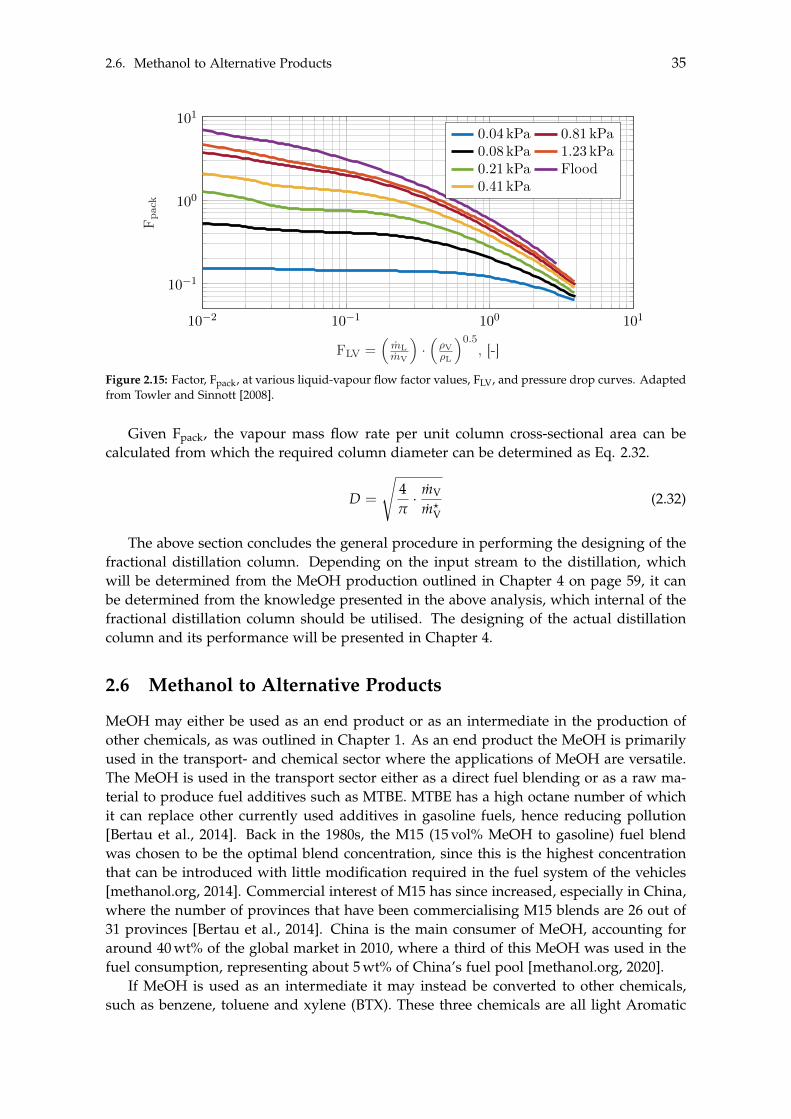
2.6. Methanol to Alternative Products 35
10�2 10�1 100 101
10�1
100
101
FLV =⇣
mLmV
⌘·⇣⇢V⇢L
⌘0.5, [-]
F pac
k0.04 kPa 0.81 kPa0.08 kPa 1.23 kPa0.21 kPa Flood0.41 kPa
Figure 2.15: Factor, Fpack, at various liquid-vapour flow factor values, FLV, and pressure drop curves. Adaptedfrom Towler and Sinnott [2008].
Given Fpack, the vapour mass flow rate per unit column cross-sectional area can becalculated from which the required column diameter can be determined as Eq. 2.32.
D =
s4p· mV
m?V
(2.32)
The above section concludes the general procedure in performing the designing of thefractional distillation column. Depending on the input stream to the distillation, whichwill be determined from the MeOH production outlined in Chapter 4 on page 59, it canbe determined from the knowledge presented in the above analysis, which internal of thefractional distillation column should be utilised. The designing of the actual distillationcolumn and its performance will be presented in Chapter 4.
2.6 Methanol to Alternative Products
MeOH may either be used as an end product or as an intermediate in the production ofother chemicals, as was outlined in Chapter 1. As an end product the MeOH is primarilyused in the transport- and chemical sector where the applications of MeOH are versatile.The MeOH is used in the transport sector either as a direct fuel blending or as a raw ma-terial to produce fuel additives such as MTBE. MTBE has a high octane number of whichit can replace other currently used additives in gasoline fuels, hence reducing pollution[Bertau et al., 2014]. Back in the 1980s, the M15 (15 vol% MeOH to gasoline) fuel blendwas chosen to be the optimal blend concentration, since this is the highest concentrationthat can be introduced with little modification required in the fuel system of the vehicles[methanol.org, 2014]. Commercial interest of M15 has since increased, especially in China,where the number of provinces that have been commercialising M15 blends are 26 out of31 provinces [Bertau et al., 2014]. China is the main consumer of MeOH, accounting foraround 40 wt% of the global market in 2010, where a third of this MeOH was used in thefuel consumption, representing about 5 wt% of China’s fuel pool [methanol.org, 2020].
If MeOH is used as an intermediate it may instead be converted to other chemicals,such as benzene, toluene and xylene (BTX). These three chemicals are all light Aromatic
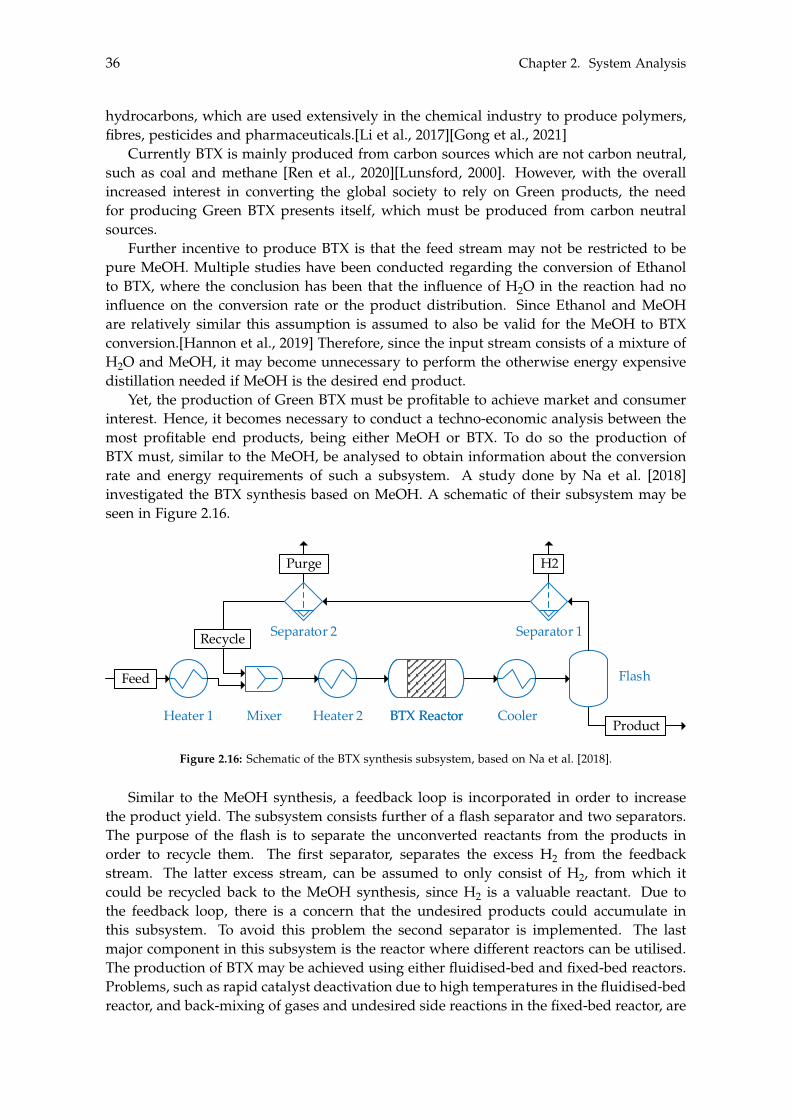
36 Chapter 2. System Analysis
hydrocarbons, which are used extensively in the chemical industry to produce polymers,fibres, pesticides and pharmaceuticals.[Li et al., 2017][Gong et al., 2021]
Currently BTX is mainly produced from carbon sources which are not carbon neutral,such as coal and methane [Ren et al., 2020][Lunsford, 2000]. However, with the overallincreased interest in converting the global society to rely on Green products, the needfor producing Green BTX presents itself, which must be produced from carbon neutralsources.
Further incentive to produce BTX is that the feed stream may not be restricted to bepure MeOH. Multiple studies have been conducted regarding the conversion of Ethanolto BTX, where the conclusion has been that the influence of H2O in the reaction had noinfluence on the conversion rate or the product distribution. Since Ethanol and MeOHare relatively similar this assumption is assumed to also be valid for the MeOH to BTXconversion.[Hannon et al., 2019] Therefore, since the input stream consists of a mixture ofH2O and MeOH, it may become unnecessary to perform the otherwise energy expensivedistillation needed if MeOH is the desired end product.
Yet, the production of Green BTX must be profitable to achieve market and consumerinterest. Hence, it becomes necessary to conduct a techno-economic analysis between themost profitable end products, being either MeOH or BTX. To do so the production ofBTX must, similar to the MeOH, be analysed to obtain information about the conversionrate and energy requirements of such a subsystem. A study done by Na et al. [2018]investigated the BTX synthesis based on MeOH. A schematic of their subsystem may beseen in Figure 2.16.
Mixer ReactorReactor Flash
S2
Mixer
hej
Absorber/stripper/packed column
BTX&MeOH-Dist/TrayBTX&MeOH-Dist/TrayValve
Comp
Pump Heat exchanger
Cooler
Fluid/liquid separator
Tank
CompFlash
Column 1Column 1 Column 2Column 2 Column 3Column 3 Column 4Column 4
BTX synthesis product stream
H2 CO CH4C2H4
C2H6CO2C3H6C3H8
C4H10C5H12C6H14CH3OH
C6H6H2O
C7H8C8H10 C9H12
C10H14
Heater 1 Mixer Heater 2 BTX ReactorBTX Reactor Cooler
Flash
Waste
Purge
Recycle
Feed
Product
H2
Separator 2 Separator 1
Figure 2.16: Schematic of the BTX synthesis subsystem, based on Na et al. [2018].
Similar to the MeOH synthesis, a feedback loop is incorporated in order to increasethe product yield. The subsystem consists further of a flash separator and two separators.The purpose of the flash is to separate the unconverted reactants from the products inorder to recycle them. The first separator, separates the excess H2 from the feedbackstream. The latter excess stream, can be assumed to only consist of H2, from which itcould be recycled back to the MeOH synthesis, since H2 is a valuable reactant. Due tothe feedback loop, there is a concern that the undesired products could accumulate inthis subsystem. To avoid this problem the second separator is implemented. The lastmajor component in this subsystem is the reactor where different reactors can be utilised.The production of BTX may be achieved using either fluidised-bed and fixed-bed reactors.Problems, such as rapid catalyst deactivation due to high temperatures in the fluidised-bedreactor, and back-mixing of gases and undesired side reactions in the fixed-bed reactor, are
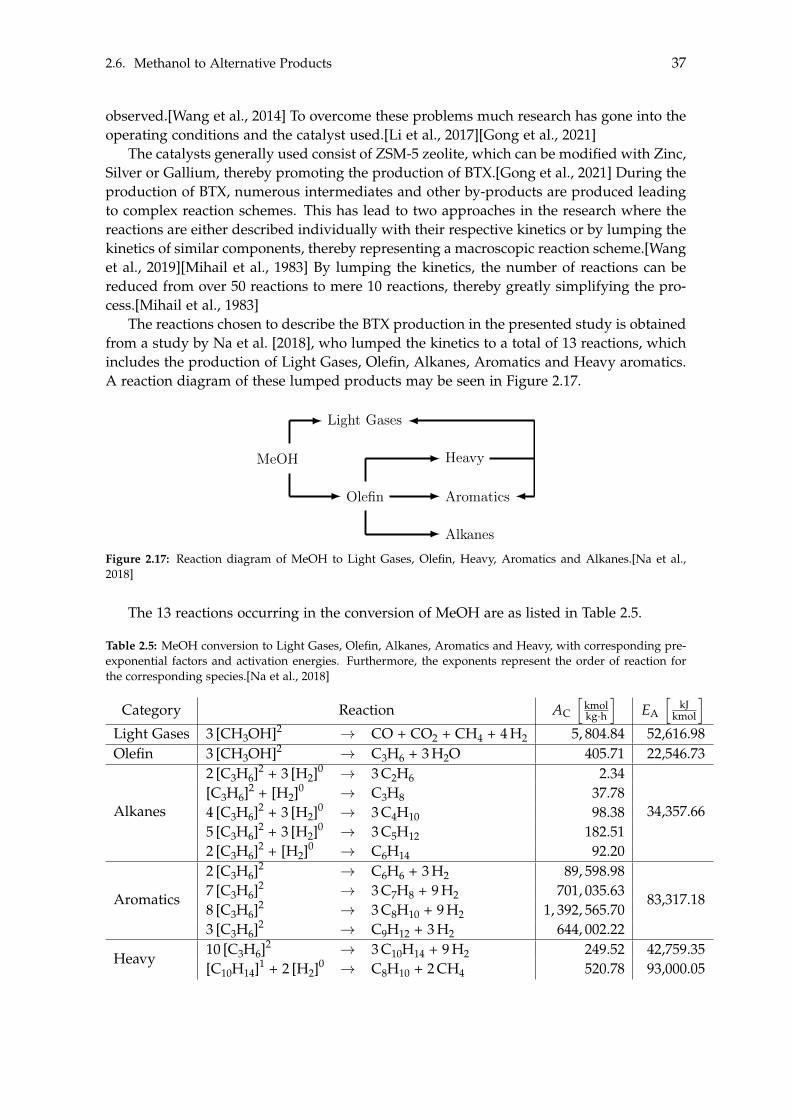
2.6. Methanol to Alternative Products 37
observed.[Wang et al., 2014] To overcome these problems much research has gone into theoperating conditions and the catalyst used.[Li et al., 2017][Gong et al., 2021]
The catalysts generally used consist of ZSM-5 zeolite, which can be modified with Zinc,Silver or Gallium, thereby promoting the production of BTX.[Gong et al., 2021] During theproduction of BTX, numerous intermediates and other by-products are produced leadingto complex reaction schemes. This has lead to two approaches in the research where thereactions are either described individually with their respective kinetics or by lumping thekinetics of similar components, thereby representing a macroscopic reaction scheme.[Wanget al., 2019][Mihail et al., 1983] By lumping the kinetics, the number of reactions can bereduced from over 50 reactions to mere 10 reactions, thereby greatly simplifying the pro-cess.[Mihail et al., 1983]
The reactions chosen to describe the BTX production in the presented study is obtainedfrom a study by Na et al. [2018], who lumped the kinetics to a total of 13 reactions, whichincludes the production of Light Gases, Olefin, Alkanes, Aromatics and Heavy aromatics.A reaction diagram of these lumped products may be seen in Figure 2.17.
MeOH
Light Gases
Olefin Aromatics
Heavy
AlkanesFigure 2.17: Reaction diagram of MeOH to Light Gases, Olefin, Heavy, Aromatics and Alkanes.[Na et al.,2018]
The 13 reactions occurring in the conversion of MeOH are as listed in Table 2.5.
Table 2.5: MeOH conversion to Light Gases, Olefin, Alkanes, Aromatics and Heavy, with corresponding pre-exponential factors and activation energies. Furthermore, the exponents represent the order of reaction forthe corresponding species.[Na et al., 2018]
Category Reaction AC
hkmolkg·h
iEA
hkJ
kmol
i
Light Gases 3 [CH3OH]2 ! CO + CO2 + CH4 + 4 H2 5, 804.84 52,616.98Olefin 3 [CH3OH]2 ! C3H6 + 3 H2O 405.71 22,546.73
Alkanes
2 [C3H6]2 + 3 [H2]0 ! 3 C2H6 2.34
34,357.66[C3H6]2 + [H2]0 ! C3H8 37.784 [C3H6]2 + 3 [H2]0 ! 3 C4H10 98.385 [C3H6]2 + 3 [H2]0 ! 3 C5H12 182.512 [C3H6]2 + [H2]0 ! C6H14 92.20
Aromatics
2 [C3H6]2 ! C6H6 + 3 H2 89, 598.98
83,317.187 [C3H6]2 ! 3 C7H8 + 9 H2 701, 035.638 [C3H6]2 ! 3 C8H10 + 9 H2 1, 392, 565.703 [C3H6]2 ! C9H12 + 3 H2 644, 002.22
Heavy10 [C3H6]2 ! 3 C10H14 + 9 H2 249.52 42,759.35[C10H14]1 + 2 [H2]0 ! C8H10 + 2 CH4 520.78 93,000.05
38 Chapter 2. System Analysis
As shown in Figure 2.17 on the previous page and further also in Table 2.5 on thepreceding page MeOH is converted to Light Gases and an Olefin. The Olefin serves asthe reactant for all consecutive Alkanes, Aromatics and Heavy reactions. The Aromaticsinclude benzene, toluene, xylene and 1,2,4-Trimethylbenzene, denoted C6H6, C7H8, C8H10and C9H12, respectively. These Aromatics are the desired products, however, in their re-actions H2 is produced. This increases the amount of H2, which is a reactant for theproduction of Alkanes, thereby promoting its production.
The implementation of these reactions will be further discussed in Chapter 4 onpage 59, where the combined system modelling of MeOH to BTX is presented.
Throughout this chapter the different processes and components have been analysed and discussedfrom which the actual implementation can be performed. The subsequent chapter will present theimplementation of the dynamic models, whereas Chapter 4 on page 59 will present the implementa-tion of the steady state models.
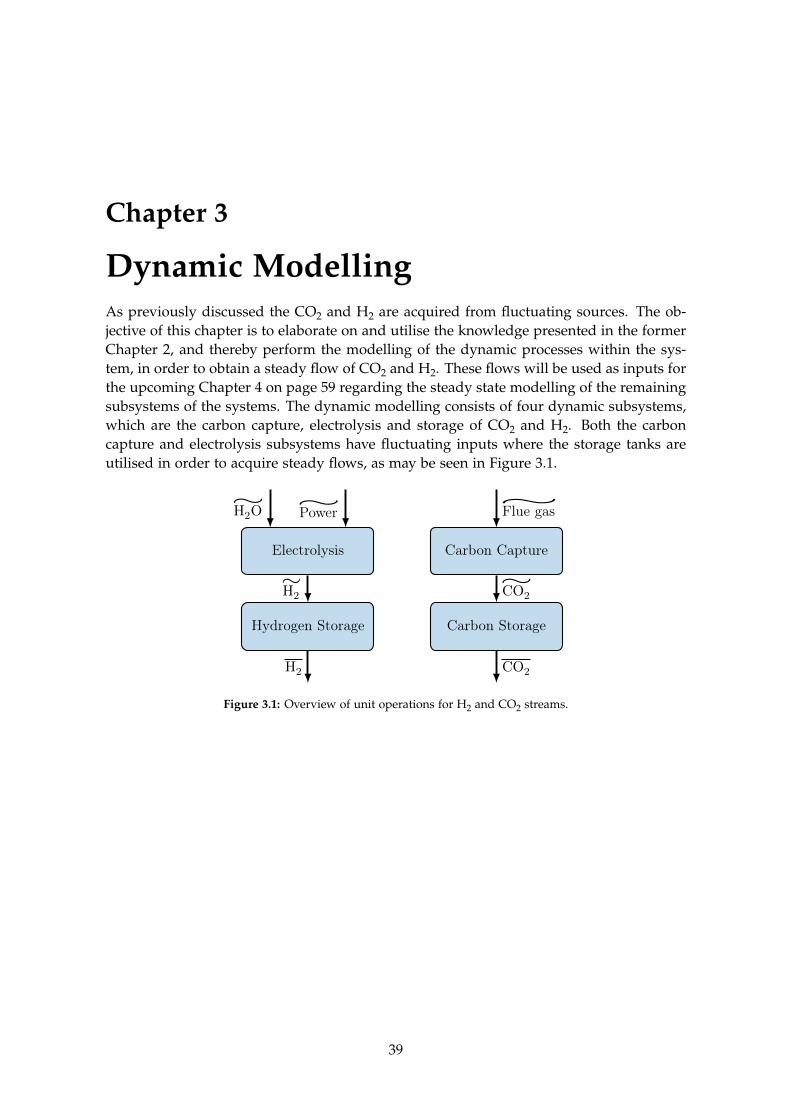
Chapter 3
Dynamic ModellingAs previously discussed the CO2 and H2 are acquired from fluctuating sources. The ob-jective of this chapter is to elaborate on and utilise the knowledge presented in the formerChapter 2, and thereby perform the modelling of the dynamic processes within the sys-tem, in order to obtain a steady flow of CO2 and H2. These flows will be used as inputs forthe upcoming Chapter 4 on page 59 regarding the steady state modelling of the remainingsubsystems of the systems. The dynamic modelling consists of four dynamic subsystems,which are the carbon capture, electrolysis and storage of CO2 and H2. Both the carboncapture and electrolysis subsystems have fluctuating inputs where the storage tanks areutilised in order to acquire steady flows, as may be seen in Figure 3.1.
Electrolysis Carbon Capture
Hydrogen Storage Carbon Storage
H2O⇠
Power⇠ Flue gas
⇠
H2⇠
CO2⇠
H2 CO2
Figure 3.1: Overview of unit operations for H2 and CO2 streams.
39
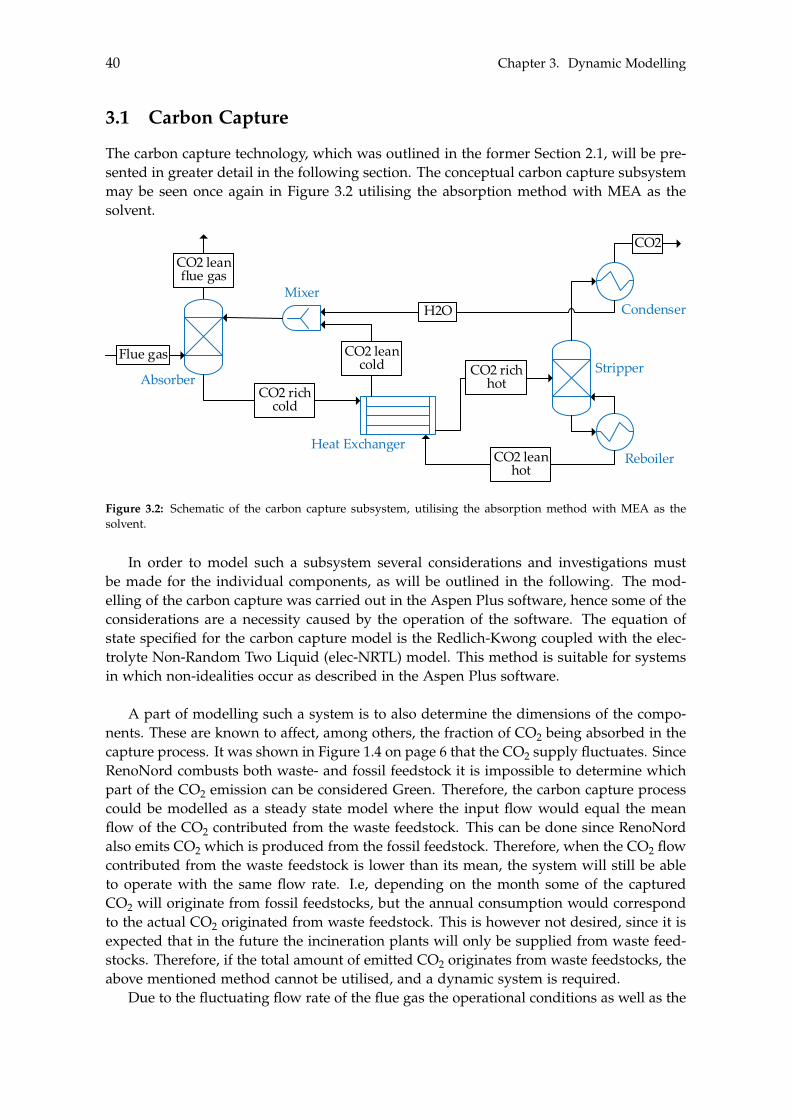
40 Chapter 3. Dynamic Modelling
3.1 Carbon Capture
The carbon capture technology, which was outlined in the former Section 2.1, will be pre-sented in greater detail in the following section. The conceptual carbon capture subsystemmay be seen once again in Figure 3.2 utilising the absorption method with MEA as thesolvent.
Mixer ReactorReactor Flash
S2
Mixer
hej
Absorber/stripper/packed column BTX&MeOH-Dist/TrayBTX&MeOH-Dist/Tray
Valve
Comp
Pump Heat exchanger
Cooler
Fluid/liquid separator
Tank
CompFlash
Column 1Column 1 Column 2Column 2 Column 3Column 3 Column 4Column 4
BTX synthesis product stream
H2 CO
CH4C2H4
C2H6CO2
C3H6C3H8
C4H10C5H12C6H14
CH3OH
C6H6H2O
C7H8C8H10 C9H12
C10H14
Heater
AbsorberStripper
Heat ExchangerReboiler
Mixer
Flue gas
CO2 rich cold
CO2 richhot
CO2 leanhot
CO2 leancold
CO2 leanflue gas
CO2
CondenserH2O
Figure 3.2: Schematic of the carbon capture subsystem, utilising the absorption method with MEA as thesolvent.
In order to model such a subsystem several considerations and investigations mustbe made for the individual components, as will be outlined in the following. The mod-elling of the carbon capture was carried out in the Aspen Plus software, hence some of theconsiderations are a necessity caused by the operation of the software. The equation ofstate specified for the carbon capture model is the Redlich-Kwong coupled with the elec-trolyte Non-Random Two Liquid (elec-NRTL) model. This method is suitable for systemsin which non-idealities occur as described in the Aspen Plus software.
A part of modelling such a system is to also determine the dimensions of the compo-nents. These are known to affect, among others, the fraction of CO2 being absorbed in thecapture process. It was shown in Figure 1.4 on page 6 that the CO2 supply fluctuates. SinceRenoNord combusts both waste- and fossil feedstock it is impossible to determine whichpart of the CO2 emission can be considered Green. Therefore, the carbon capture processcould be modelled as a steady state model where the input flow would equal the meanflow of the CO2 contributed from the waste feedstock. This can be done since RenoNordalso emits CO2 which is produced from the fossil feedstock. Therefore, when the CO2 flowcontributed from the waste feedstock is lower than its mean, the system will still be ableto operate with the same flow rate. I.e, depending on the month some of the capturedCO2 will originate from fossil feedstocks, but the annual consumption would correspondto the actual CO2 originated from waste feedstock. This is however not desired, since it isexpected that in the future the incineration plants will only be supplied from waste feed-stocks. Therefore, if the total amount of emitted CO2 originates from waste feedstocks, theabove mentioned method cannot be utilised, and a dynamic system is required.
Due to the fluctuating flow rate of the flue gas the operational conditions as well as the
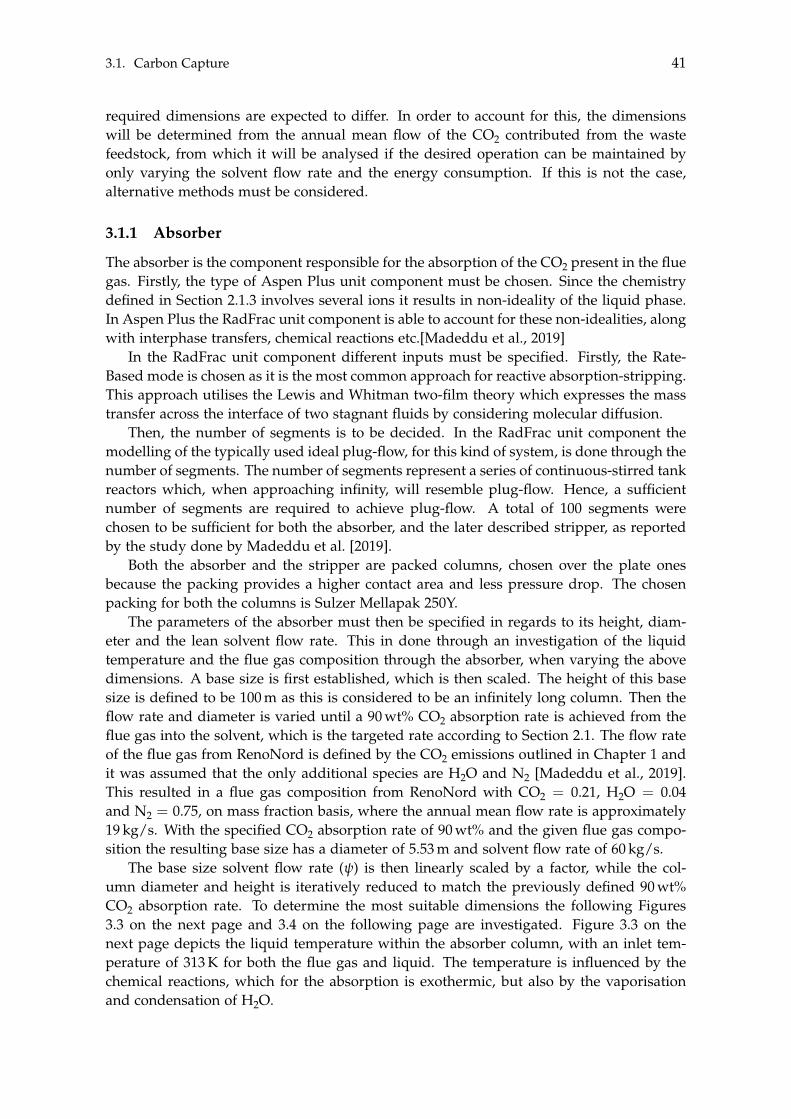
3.1. Carbon Capture 41
required dimensions are expected to differ. In order to account for this, the dimensionswill be determined from the annual mean flow of the CO2 contributed from the wastefeedstock, from which it will be analysed if the desired operation can be maintained byonly varying the solvent flow rate and the energy consumption. If this is not the case,alternative methods must be considered.
3.1.1 Absorber
The absorber is the component responsible for the absorption of the CO2 present in the fluegas. Firstly, the type of Aspen Plus unit component must be chosen. Since the chemistrydefined in Section 2.1.3 involves several ions it results in non-ideality of the liquid phase.In Aspen Plus the RadFrac unit component is able to account for these non-idealities, alongwith interphase transfers, chemical reactions etc.[Madeddu et al., 2019]
In the RadFrac unit component different inputs must be specified. Firstly, the Rate-Based mode is chosen as it is the most common approach for reactive absorption-stripping.This approach utilises the Lewis and Whitman two-film theory which expresses the masstransfer across the interface of two stagnant fluids by considering molecular diffusion.
Then, the number of segments is to be decided. In the RadFrac unit component themodelling of the typically used ideal plug-flow, for this kind of system, is done through thenumber of segments. The number of segments represent a series of continuous-stirred tankreactors which, when approaching infinity, will resemble plug-flow. Hence, a sufficientnumber of segments are required to achieve plug-flow. A total of 100 segments werechosen to be sufficient for both the absorber, and the later described stripper, as reportedby the study done by Madeddu et al. [2019].
Both the absorber and the stripper are packed columns, chosen over the plate onesbecause the packing provides a higher contact area and less pressure drop. The chosenpacking for both the columns is Sulzer Mellapak 250Y.
The parameters of the absorber must then be specified in regards to its height, diam-eter and the lean solvent flow rate. This in done through an investigation of the liquidtemperature and the flue gas composition through the absorber, when varying the abovedimensions. A base size is first established, which is then scaled. The height of this basesize is defined to be 100 m as this is considered to be an infinitely long column. Then theflow rate and diameter is varied until a 90 wt% CO2 absorption rate is achieved from theflue gas into the solvent, which is the targeted rate according to Section 2.1. The flow rateof the flue gas from RenoNord is defined by the CO2 emissions outlined in Chapter 1 andit was assumed that the only additional species are H2O and N2 [Madeddu et al., 2019].This resulted in a flue gas composition from RenoNord with CO2 = 0.21, H2O = 0.04and N2 = 0.75, on mass fraction basis, where the annual mean flow rate is approximately19 kg/s. With the specified CO2 absorption rate of 90 wt% and the given flue gas compo-sition the resulting base size has a diameter of 5.53 m and solvent flow rate of 60 kg/s.
The base size solvent flow rate (y) is then linearly scaled by a factor, while the col-umn diameter and height is iteratively reduced to match the previously defined 90 wt%CO2 absorption rate. To determine the most suitable dimensions the following Figures3.3 on the next page and 3.4 on the following page are investigated. Figure 3.3 on thenext page depicts the liquid temperature within the absorber column, with an inlet tem-perature of 313 K for both the flue gas and liquid. The temperature is influenced by thechemical reactions, which for the absorption is exothermic, but also by the vaporisationand condensation of H2O.
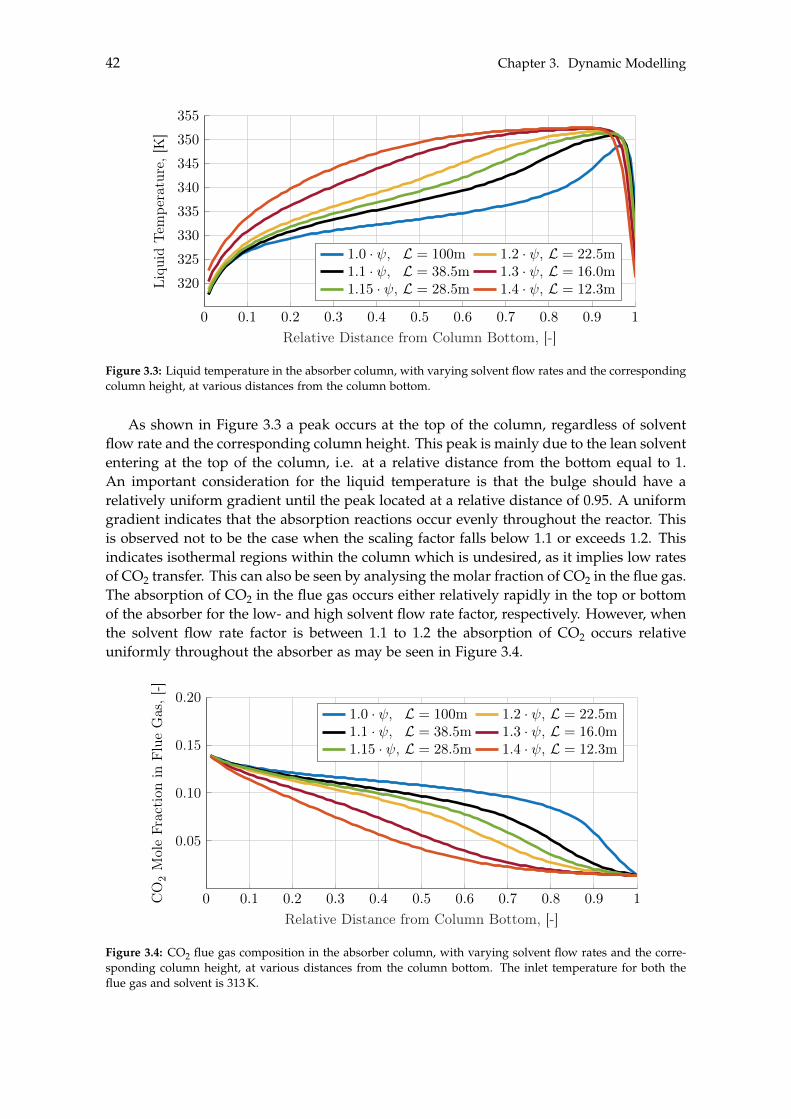
42 Chapter 3. Dynamic Modelling
0 0.1 0.2 0.3 0.4 0.5 0.6 0.7 0.8 0.9 1
320
325
330
335
340
345
350
355
Relative Distance from Column Bottom, [-]
Liqu
idTe
mpe
ratu
re,[
K]
1.0 · , L = 100m 1.2 · , L = 22.5m1.1 · , L = 38.5m 1.3 · , L = 16.0m1.15 · , L = 28.5m 1.4 · , L = 12.3m
Figure 3.3: Liquid temperature in the absorber column, with varying solvent flow rates and the correspondingcolumn height, at various distances from the column bottom.
As shown in Figure 3.3 a peak occurs at the top of the column, regardless of solventflow rate and the corresponding column height. This peak is mainly due to the lean solvententering at the top of the column, i.e. at a relative distance from the bottom equal to 1.An important consideration for the liquid temperature is that the bulge should have arelatively uniform gradient until the peak located at a relative distance of 0.95. A uniformgradient indicates that the absorption reactions occur evenly throughout the reactor. Thisis observed not to be the case when the scaling factor falls below 1.1 or exceeds 1.2. Thisindicates isothermal regions within the column which is undesired, as it implies low ratesof CO2 transfer. This can also be seen by analysing the molar fraction of CO2 in the flue gas.The absorption of CO2 in the flue gas occurs either relatively rapidly in the top or bottomof the absorber for the low- and high solvent flow rate factor, respectively. However, whenthe solvent flow rate factor is between 1.1 to 1.2 the absorption of CO2 occurs relativeuniformly throughout the absorber as may be seen in Figure 3.4.
0 0.1 0.2 0.3 0.4 0.5 0.6 0.7 0.8 0.9 1
0.05
0.10
0.15
0.20
Relative Distance from Column Bottom, [-]
CO
2M
ole
Frac
tion
inFl
ueG
as,[
-]
1.0 · , L = 100m 1.2 · , L = 22.5m1.1 · , L = 38.5m 1.3 · , L = 16.0m1.15 · , L = 28.5m 1.4 · , L = 12.3m
Figure 3.4: CO2 flue gas composition in the absorber column, with varying solvent flow rates and the corre-sponding column height, at various distances from the column bottom. The inlet temperature for both theflue gas and solvent is 313 K.
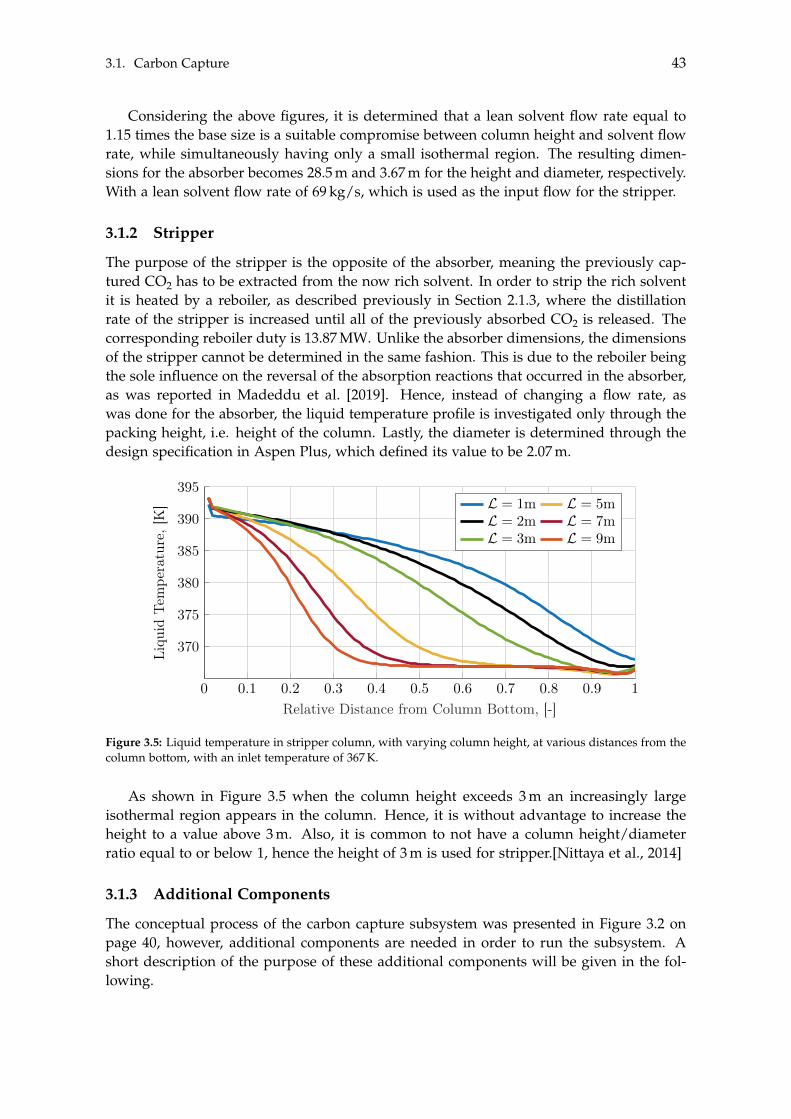
3.1. Carbon Capture 43
Considering the above figures, it is determined that a lean solvent flow rate equal to1.15 times the base size is a suitable compromise between column height and solvent flowrate, while simultaneously having only a small isothermal region. The resulting dimen-sions for the absorber becomes 28.5 m and 3.67 m for the height and diameter, respectively.With a lean solvent flow rate of 69 kg/s, which is used as the input flow for the stripper.
3.1.2 Stripper
The purpose of the stripper is the opposite of the absorber, meaning the previously cap-tured CO2 has to be extracted from the now rich solvent. In order to strip the rich solventit is heated by a reboiler, as described previously in Section 2.1.3, where the distillationrate of the stripper is increased until all of the previously absorbed CO2 is released. Thecorresponding reboiler duty is 13.87 MW. Unlike the absorber dimensions, the dimensionsof the stripper cannot be determined in the same fashion. This is due to the reboiler beingthe sole influence on the reversal of the absorption reactions that occurred in the absorber,as was reported in Madeddu et al. [2019]. Hence, instead of changing a flow rate, aswas done for the absorber, the liquid temperature profile is investigated only through thepacking height, i.e. height of the column. Lastly, the diameter is determined through thedesign specification in Aspen Plus, which defined its value to be 2.07 m.
0 0.1 0.2 0.3 0.4 0.5 0.6 0.7 0.8 0.9 1
370
375
380
385
390
395
Relative Distance from Column Bottom, [-]
Liqu
idTe
mpe
ratu
re,[
K] L = 1m L = 5m
L = 2m L = 7mL = 3m L = 9m
Figure 3.5: Liquid temperature in stripper column, with varying column height, at various distances from thecolumn bottom, with an inlet temperature of 367 K.
As shown in Figure 3.5 when the column height exceeds 3 m an increasingly largeisothermal region appears in the column. Hence, it is without advantage to increase theheight to a value above 3 m. Also, it is common to not have a column height/diameterratio equal to or below 1, hence the height of 3 m is used for stripper.[Nittaya et al., 2014]
3.1.3 Additional Components
The conceptual process of the carbon capture subsystem was presented in Figure 3.2 onpage 40, however, additional components are needed in order to run the subsystem. Ashort description of the purpose of these additional components will be given in the fol-lowing.
44 Chapter 3. Dynamic Modelling
After the absorber, a separator is placed with a split fraction of 1 wt%, which is imposedto remove convergence problems associated with the later presented makeup stream.
Following the separator a pump is placed, which is implemented to increase the pres-sure of the rich solvent to a value of 5 bar. This is done to raise the vapour pressure ofCO2, as was explained in Section 2.1.3. The value is however higher than the required cho-sen pressure in the Stripper of 1.8 bar. The additional pressure is only required to avoidpartial vaporisation in the upcoming Heat exchanger, which could result in corrosive acidbreakout.[Madeddu et al., 2019] Then the cold rich solvent enters a counter-current heatexchanger, where it is heated by utilising the lean solvent exiting the Reboiler of the Strip-per. The rich solvent is raised to a temperature of 100 �C, as was explained in Section2.1.3.
The now heated rich solvent is then reduced in pressure through a pressure valve,since the corrosive acid breakout is no longer of concern and the pressure required for theStripper is only 1.8 bar.
After the earlier presented Stripper, the vapour, in the form of CO2 and H2O, enters acondenser unit. The objective of the condenser is to separate the CO2 from the stream, byconverting the H2O to liquid state. It is essential that the CO2 stream becomes pure, sinceany significant content of H2O has undesired influence on the downstream subsystem ofthe storage. The performance of the condenser is dependent on the operational condition,where high pressure and low temperature yield the highest degree of separation, whilenot crossing the freezing point of H2O. A sensitivity analysis has been conducted, to inves-tigate if sufficient separation can be achieved by the condenser. This sensitivity analysisconcluded that a moisture content of 0.1 wt% is acquired at the operational conditions of5 bar and 5 �C, which is deemed sufficient. In order to achieve this condensation, threecomponents are incorporated, being a compressor, cooler and flash separator. The vapourmixture is firstly compressed to the desired pressure and further cooled. After the cooler,the separation of the CO2 and H2O can be achieved from a flash separator.
Lastly, the cooled and depressurised lean solvent exiting the Stripper, enters a mixertogether with the condensed H2O stream and a makeup stream. The makeup stream isrequired to resupply the subsystem with a small proportion of H2O vapour which is lostthrough the drain. The newly combined lean solvent flow is slightly cooled to matchthe desired inlet stream temperature to the absorber. Following this stream the cycle iscomplete and the loop may continue its operation as may be seen in Figure 3.6 on thefacing page.
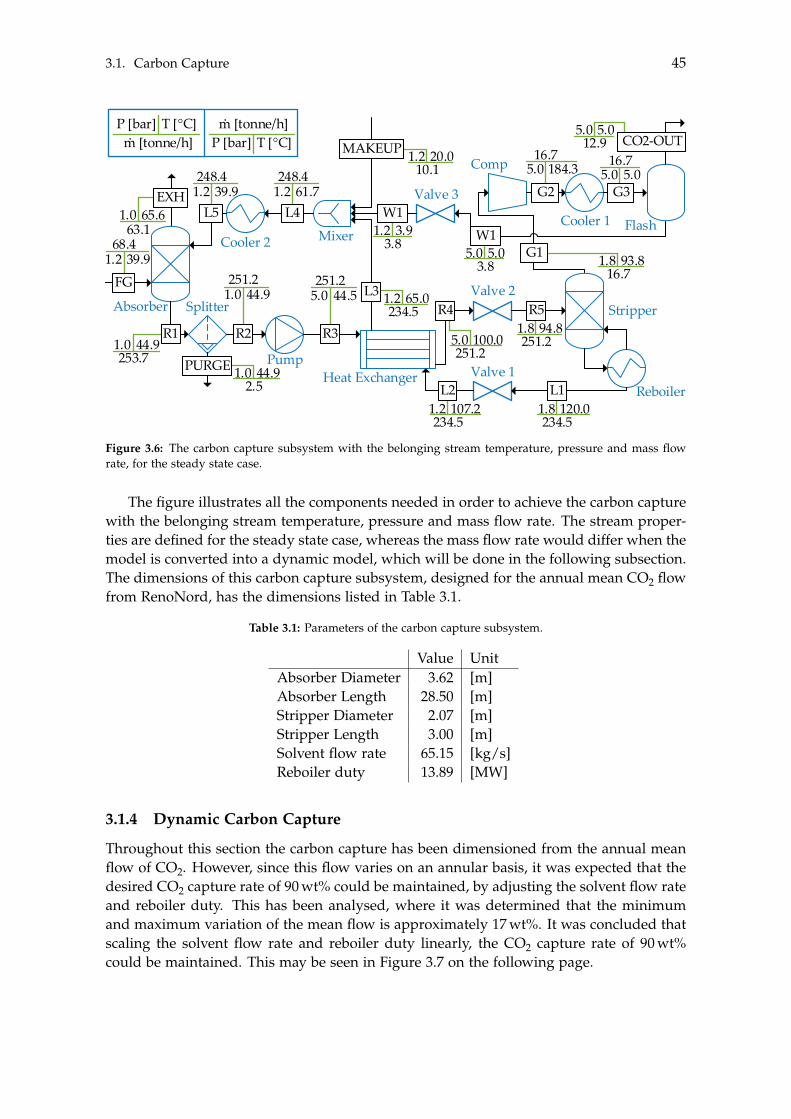
3.1. Carbon Capture 45
Mixer ReactorReactor Flash
S2
Mixer
hej
Absorber/stripper/packed column BTX&MeOH-Dist/TrayBTX&MeOH-Dist/Tray
Valve
Comp
Pump Heat exchanger
Cooler
Fluid/liquid separator
Tank
CompFlash
Column 1Column 1 Column 2Column 2 Column 3Column 3 Column 4Column 4
BTX synthesis product stream
H2 CO
CH4C2H4
C2H6CO2
C3H6C3H8
C4H10C5H12C6H14
CH3OH
C6H6H2O
C7H8C8H10 C9H12
C10H14
Heater
Absorber Stripper
Heat ExchangerReboiler
FlashMixer
Splitter
PumpValve 1
Valve 2
Valve 3
Comp
Cooler 2
Heater
MAKEUP
FG
EXH
R1 R2 R3
R4 R5
L1L2
L3
CO2-OUT
G1W1
L4L5 W1
PURGE
68.439.91.2
65.663.1
1.0
248.439.91.2
248.461.71.2
20.010.1
1.2
251.244.91.0
251.244.55.0
44.9253.7
1.0
44.92.5
1.0
107.2234.5
1.2 120.0234.5
1.8
3.93.8
1.2
65.0234.5
1.2
100.0251.2
5.094.8
251.21.8
5.03.8
5.0
Cooler 1
G2 G3
16.7184.35.0 16.7
5.05.0
5.012.9
5.0
93.816.7
1.8
T [°C]m [tonne/h]
P [bar]. T [°C]
m [tonne/h]P [bar]
.
Figure 3.6: The carbon capture subsystem with the belonging stream temperature, pressure and mass flowrate, for the steady state case.
The figure illustrates all the components needed in order to achieve the carbon capturewith the belonging stream temperature, pressure and mass flow rate. The stream proper-ties are defined for the steady state case, whereas the mass flow rate would differ when themodel is converted into a dynamic model, which will be done in the following subsection.The dimensions of this carbon capture subsystem, designed for the annual mean CO2 flowfrom RenoNord, has the dimensions listed in Table 3.1.
Table 3.1: Parameters of the carbon capture subsystem.
Value UnitAbsorber Diameter 3.62 [m]Absorber Length 28.50 [m]Stripper Diameter 2.07 [m]Stripper Length 3.00 [m]Solvent flow rate 65.15 [kg/s]Reboiler duty 13.89 [MW]
3.1.4 Dynamic Carbon Capture
Throughout this section the carbon capture has been dimensioned from the annual meanflow of CO2. However, since this flow varies on an annular basis, it was expected that thedesired CO2 capture rate of 90 wt% could be maintained, by adjusting the solvent flow rateand reboiler duty. This has been analysed, where it was determined that the minimumand maximum variation of the mean flow is approximately 17 wt%. It was concluded thatscaling the solvent flow rate and reboiler duty linearly, the CO2 capture rate of 90 wt%could be maintained. This may be seen in Figure 3.7 on the following page.
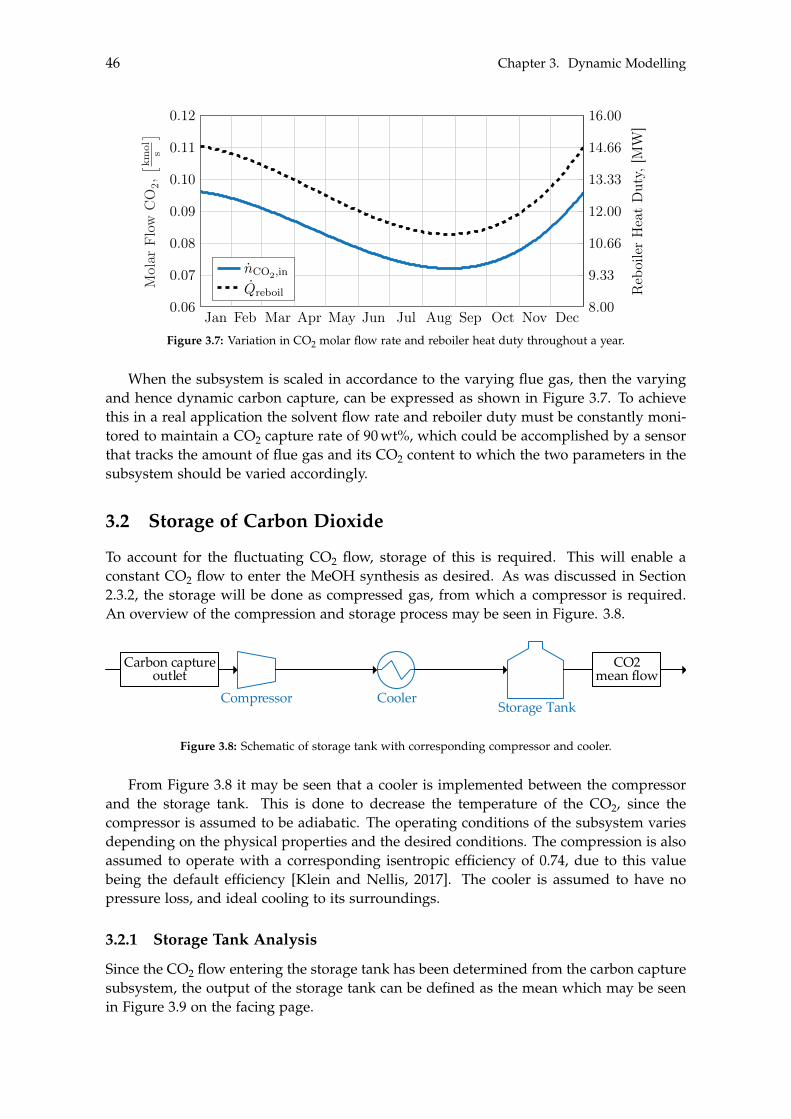
46 Chapter 3. Dynamic Modelling
Jan Feb Mar Apr May Jun Jul Aug Sep Oct Nov Dec0.06
0.07
0.08
0.09
0.10
0.11
0.12
Mol
arFl
owC
O2,
⇥ km
ol s⇤
8.00
9.33
10.66
12.00
13.33
14.66
16.00
Reb
oile
rH
eat
Dut
y,[M
W]
nCO2,in
Qreboil
Figure 3.7: Variation in CO2 molar flow rate and reboiler heat duty throughout a year.
When the subsystem is scaled in accordance to the varying flue gas, then the varyingand hence dynamic carbon capture, can be expressed as shown in Figure 3.7. To achievethis in a real application the solvent flow rate and reboiler duty must be constantly moni-tored to maintain a CO2 capture rate of 90 wt%, which could be accomplished by a sensorthat tracks the amount of flue gas and its CO2 content to which the two parameters in thesubsystem should be varied accordingly.
3.2 Storage of Carbon Dioxide
To account for the fluctuating CO2 flow, storage of this is required. This will enable aconstant CO2 flow to enter the MeOH synthesis as desired. As was discussed in Section2.3.2, the storage will be done as compressed gas, from which a compressor is required.An overview of the compression and storage process may be seen in Figure. 3.8.
Mixer ReactorReactor Flash
S2
Mixer
hej
Absorber/stripper/packed column BTX&MeOH-Dist/TrayBTX&MeOH-Dist/Tray
Valve
Comp
Pump Heat exchanger
Cooler
Fluid/liquid separator
Tank
CompFlash
Column 1Column 1 Column 2Column 2 Column 3Column 3 Column 4Column 4
BTX synthesis product stream
H2 CO
CH4C2H4
C2H6CO2
C3H6C3H8
C4H10C5H12C6H14
CH3OH
C6H6H2O
C7H8C8H10 C9H12
C10H14
Heater
Compressor CoolerStorage Tank
Carbon captureoutlet
CO2mean flow
Figure 3.8: Schematic of storage tank with corresponding compressor and cooler.
From Figure 3.8 it may be seen that a cooler is implemented between the compressorand the storage tank. This is done to decrease the temperature of the CO2, since thecompressor is assumed to be adiabatic. The operating conditions of the subsystem variesdepending on the physical properties and the desired conditions. The compression is alsoassumed to operate with a corresponding isentropic efficiency of 0.74, due to this valuebeing the default efficiency [Klein and Nellis, 2017]. The cooler is assumed to have nopressure loss, and ideal cooling to its surroundings.
3.2.1 Storage Tank Analysis
Since the CO2 flow entering the storage tank has been determined from the carbon capturesubsystem, the output of the storage tank can be defined as the mean which may be seenin Figure 3.9 on the facing page.
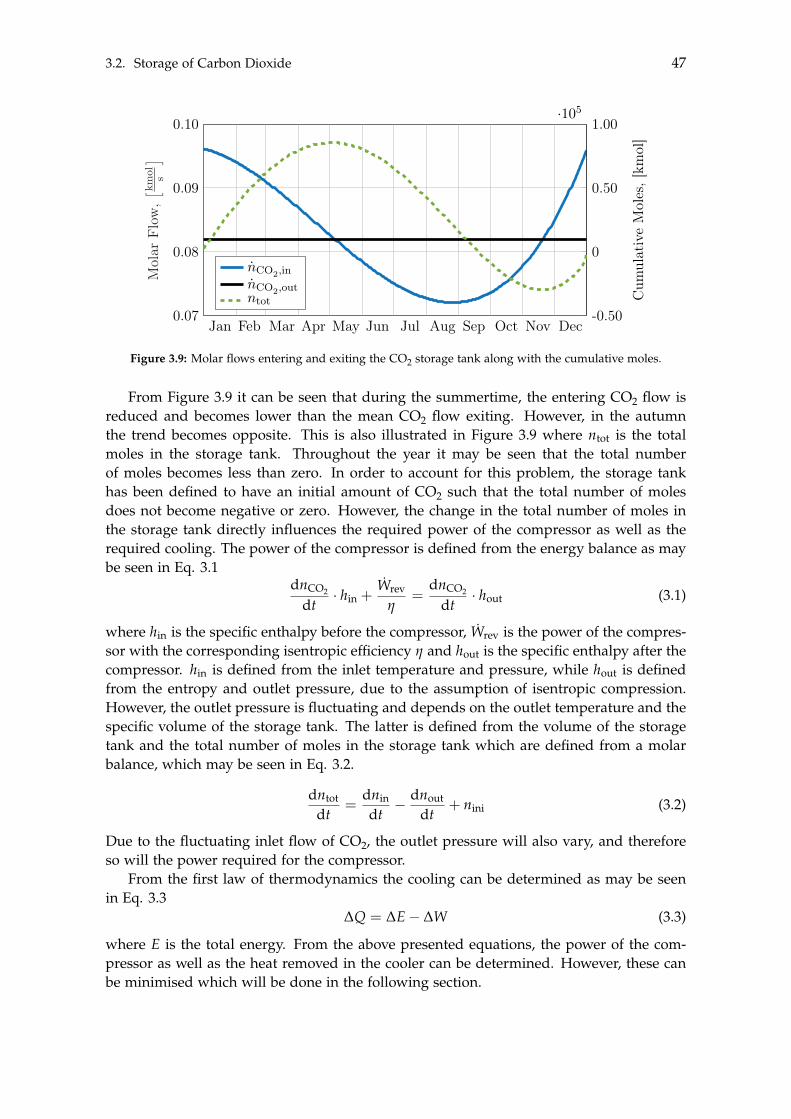
3.2. Storage of Carbon Dioxide 47
Jan Feb Mar Apr May Jun Jul Aug Sep Oct Nov Dec0.07
0.08
0.09
0.10
Mol
arFl
ow,⇥ k
mol s⇤
-0.50
0
0.50
1.00·105
Cum
ulat
ive
Mol
es,[
kmol
]
nCO2,in
nCO2,out
ntot
Figure 3.9: Molar flows entering and exiting the CO2 storage tank along with the cumulative moles.
From Figure 3.9 it can be seen that during the summertime, the entering CO2 flow isreduced and becomes lower than the mean CO2 flow exiting. However, in the autumnthe trend becomes opposite. This is also illustrated in Figure 3.9 where ntot is the totalmoles in the storage tank. Throughout the year it may be seen that the total numberof moles becomes less than zero. In order to account for this problem, the storage tankhas been defined to have an initial amount of CO2 such that the total number of molesdoes not become negative or zero. However, the change in the total number of moles inthe storage tank directly influences the required power of the compressor as well as therequired cooling. The power of the compressor is defined from the energy balance as maybe seen in Eq. 3.1
dnCO2
dt· hin +
Wrev
h=
dnCO2
dt· hout (3.1)
where hin is the specific enthalpy before the compressor, Wrev is the power of the compres-sor with the corresponding isentropic efficiency h and hout is the specific enthalpy after thecompressor. hin is defined from the inlet temperature and pressure, while hout is definedfrom the entropy and outlet pressure, due to the assumption of isentropic compression.However, the outlet pressure is fluctuating and depends on the outlet temperature and thespecific volume of the storage tank. The latter is defined from the volume of the storagetank and the total number of moles in the storage tank which are defined from a molarbalance, which may be seen in Eq. 3.2.
dntot
dt=
dnin
dt� dnout
dt+ nini (3.2)
Due to the fluctuating inlet flow of CO2, the outlet pressure will also vary, and thereforeso will the power required for the compressor.
From the first law of thermodynamics the cooling can be determined as may be seenin Eq. 3.3
DQ = DE � DW (3.3)
where E is the total energy. From the above presented equations, the power of the com-pressor as well as the heat removed in the cooler can be determined. However, these canbe minimised which will be done in the following section.
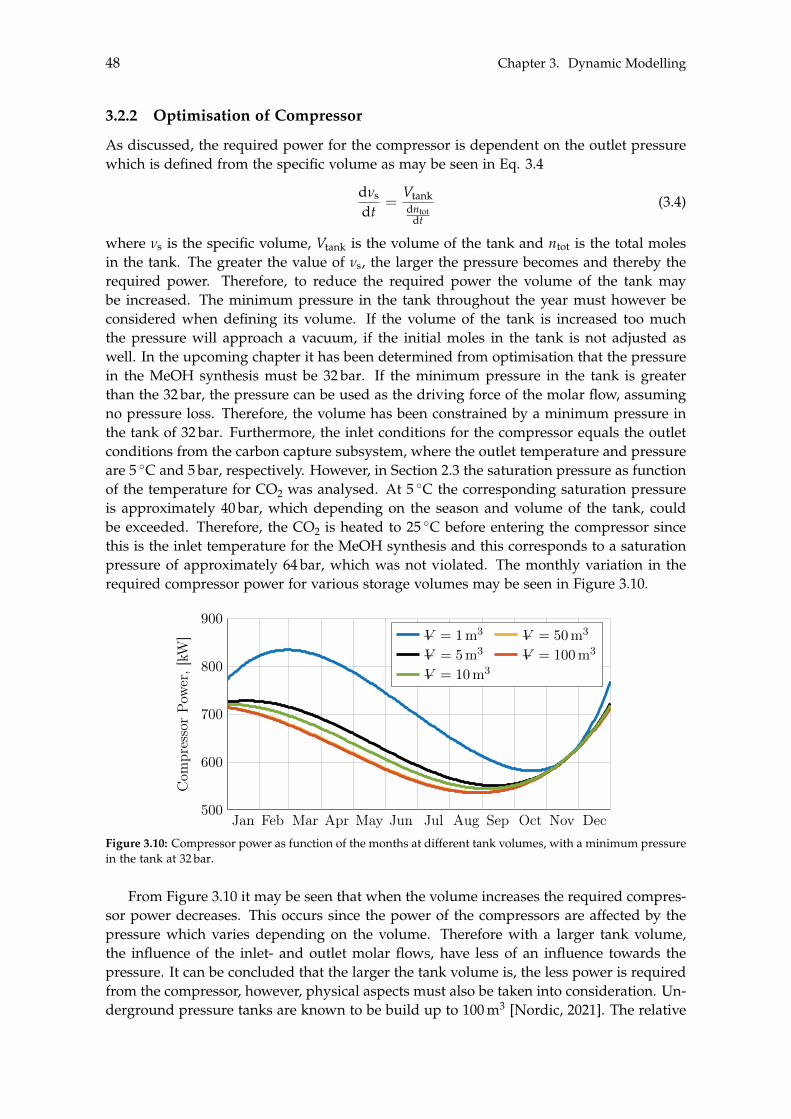
48 Chapter 3. Dynamic Modelling
3.2.2 Optimisation of Compressor
As discussed, the required power for the compressor is dependent on the outlet pressurewhich is defined from the specific volume as may be seen in Eq. 3.4
dns
dt=
Vtankdntot
dt
(3.4)
where ns is the specific volume, Vtank is the volume of the tank and ntot is the total molesin the tank. The greater the value of ns, the larger the pressure becomes and thereby therequired power. Therefore, to reduce the required power the volume of the tank maybe increased. The minimum pressure in the tank throughout the year must however beconsidered when defining its volume. If the volume of the tank is increased too muchthe pressure will approach a vacuum, if the initial moles in the tank is not adjusted aswell. In the upcoming chapter it has been determined from optimisation that the pressurein the MeOH synthesis must be 32 bar. If the minimum pressure in the tank is greaterthan the 32 bar, the pressure can be used as the driving force of the molar flow, assumingno pressure loss. Therefore, the volume has been constrained by a minimum pressure inthe tank of 32 bar. Furthermore, the inlet conditions for the compressor equals the outletconditions from the carbon capture subsystem, where the outlet temperature and pressureare 5 �C and 5 bar, respectively. However, in Section 2.3 the saturation pressure as functionof the temperature for CO2 was analysed. At 5 �C the corresponding saturation pressureis approximately 40 bar, which depending on the season and volume of the tank, couldbe exceeded. Therefore, the CO2 is heated to 25 �C before entering the compressor sincethis is the inlet temperature for the MeOH synthesis and this corresponds to a saturationpressure of approximately 64 bar, which was not violated. The monthly variation in therequired compressor power for various storage volumes may be seen in Figure 3.10.
Jan Feb Mar Apr May Jun Jul Aug Sep Oct Nov Dec500
600
700
800
900
Com
pres
sor
Pow
er,[
kW] �V = 1m3 �V = 50m3
�V = 5m3 �V = 100m3
�V = 10m3
Figure 3.10: Compressor power as function of the months at different tank volumes, with a minimum pressurein the tank at 32 bar.
From Figure 3.10 it may be seen that when the volume increases the required compres-sor power decreases. This occurs since the power of the compressors are affected by thepressure which varies depending on the volume. Therefore with a larger tank volume,the influence of the inlet- and outlet molar flows, have less of an influence towards thepressure. It can be concluded that the larger the tank volume is, the less power is requiredfrom the compressor, however, physical aspects must also be taken into consideration. Un-derground pressure tanks are known to be build up to 100 m3 [Nordic, 2021]. The relative
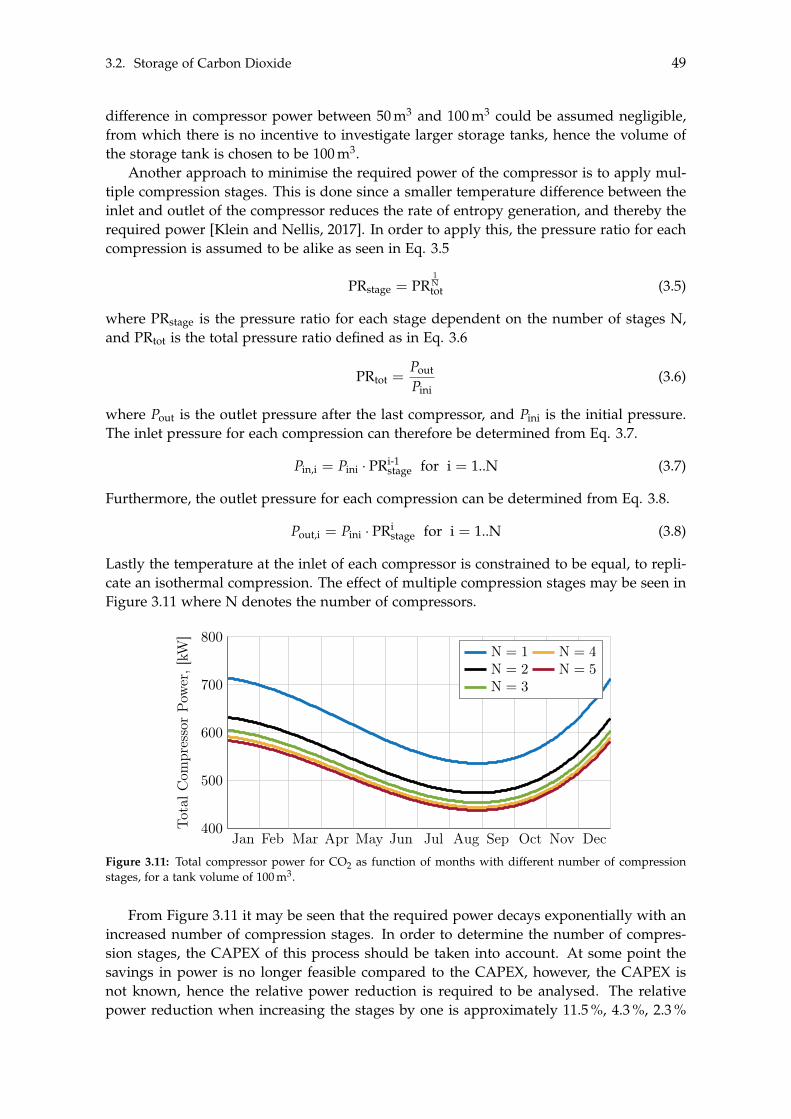
3.2. Storage of Carbon Dioxide 49
difference in compressor power between 50 m3 and 100 m3 could be assumed negligible,from which there is no incentive to investigate larger storage tanks, hence the volume ofthe storage tank is chosen to be 100 m3.
Another approach to minimise the required power of the compressor is to apply mul-tiple compression stages. This is done since a smaller temperature difference between theinlet and outlet of the compressor reduces the rate of entropy generation, and thereby therequired power [Klein and Nellis, 2017]. In order to apply this, the pressure ratio for eachcompression is assumed to be alike as seen in Eq. 3.5
PRstage = PR1Ntot (3.5)
where PRstage is the pressure ratio for each stage dependent on the number of stages N,and PRtot is the total pressure ratio defined as in Eq. 3.6
PRtot =Pout
Pini(3.6)
where Pout is the outlet pressure after the last compressor, and Pini is the initial pressure.The inlet pressure for each compression can therefore be determined from Eq. 3.7.
Pin,i = Pini · PRi-1stage for i = 1..N (3.7)
Furthermore, the outlet pressure for each compression can be determined from Eq. 3.8.
Pout,i = Pini · PRistage for i = 1..N (3.8)
Lastly the temperature at the inlet of each compressor is constrained to be equal, to repli-cate an isothermal compression. The effect of multiple compression stages may be seen inFigure 3.11 where N denotes the number of compressors.
Jan Feb Mar Apr May Jun Jul Aug Sep Oct Nov Dec400
500
600
700
800
Tota
lCom
pres
sor
Pow
er,[
kW]
N = 1 N = 4N = 2 N = 5N = 3
Figure 3.11: Total compressor power for CO2 as function of months with different number of compressionstages, for a tank volume of 100 m3.
From Figure 3.11 it may be seen that the required power decays exponentially with anincreased number of compression stages. In order to determine the number of compres-sion stages, the CAPEX of this process should be taken into account. At some point thesavings in power is no longer feasible compared to the CAPEX, however, the CAPEX isnot known, hence the relative power reduction is required to be analysed. The relativepower reduction when increasing the stages by one is approximately 11.5 %, 4.3 %, 2.3 %
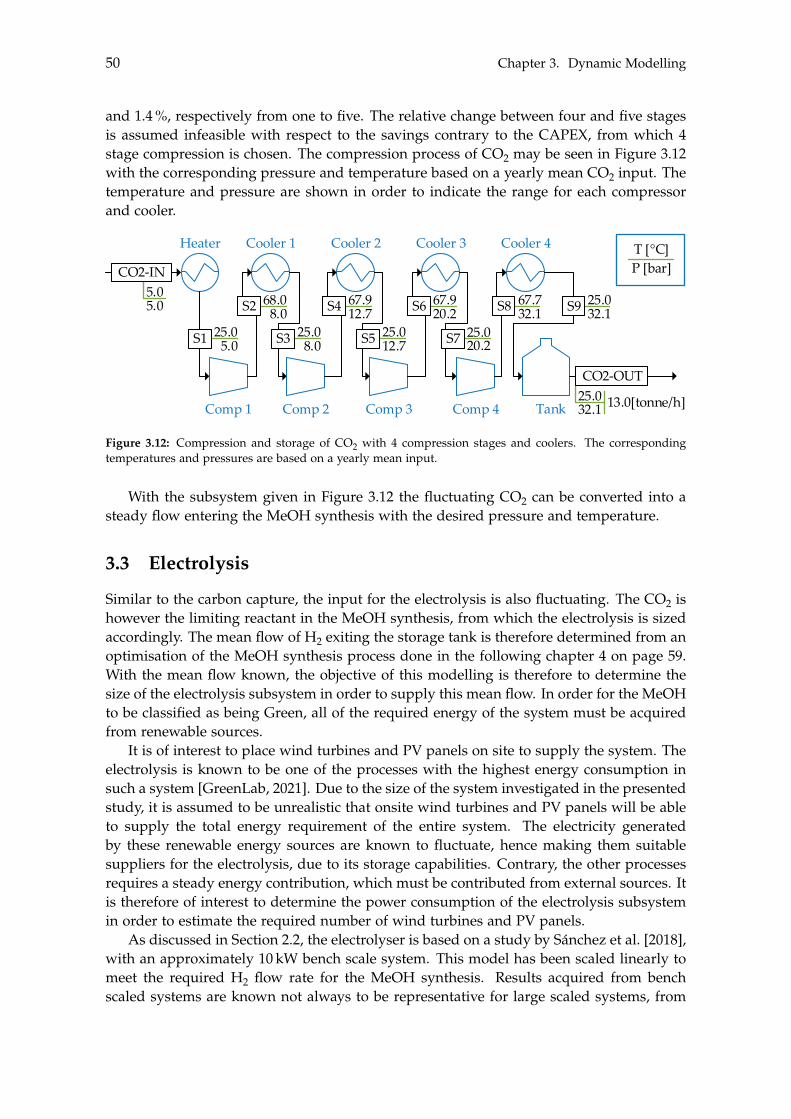
50 Chapter 3. Dynamic Modelling
and 1.4 %, respectively from one to five. The relative change between four and five stagesis assumed infeasible with respect to the savings contrary to the CAPEX, from which 4stage compression is chosen. The compression process of CO2 may be seen in Figure 3.12with the corresponding pressure and temperature based on a yearly mean CO2 input. Thetemperature and pressure are shown in order to indicate the range for each compressorand cooler.
5.0
Mixer
S2
hej
Heater 1 Mixer
Splitter
Waste
Waste
Recycle
Feed
Cooler 1
Comp 1 Comp 2 Comp 3 Comp 4
Heater Cooler 3Cooler 2 Cooler 4
Tank
25.08.0
68.0
8.025.0
12.767.9
12.725.0
20.225.0
20.267.9
32.167.7
32.125.0
S3 S5 S7
S2 S4 S6 S8 S9
S1
5.05.0
32.125.0 13.0
CO2-OUT
[tonne/h]
P [bar]T [°C]
CO2-IN
Figure 3.12: Compression and storage of CO2 with 4 compression stages and coolers. The correspondingtemperatures and pressures are based on a yearly mean input.
With the subsystem given in Figure 3.12 the fluctuating CO2 can be converted into asteady flow entering the MeOH synthesis with the desired pressure and temperature.
3.3 Electrolysis
Similar to the carbon capture, the input for the electrolysis is also fluctuating. The CO2 ishowever the limiting reactant in the MeOH synthesis, from which the electrolysis is sizedaccordingly. The mean flow of H2 exiting the storage tank is therefore determined from anoptimisation of the MeOH synthesis process done in the following chapter 4 on page 59.With the mean flow known, the objective of this modelling is therefore to determine thesize of the electrolysis subsystem in order to supply this mean flow. In order for the MeOHto be classified as being Green, all of the required energy of the system must be acquiredfrom renewable sources.
It is of interest to place wind turbines and PV panels on site to supply the system. Theelectrolysis is known to be one of the processes with the highest energy consumption insuch a system [GreenLab, 2021]. Due to the size of the system investigated in the presentedstudy, it is assumed to be unrealistic that onsite wind turbines and PV panels will be ableto supply the total energy requirement of the entire system. The electricity generatedby these renewable energy sources are known to fluctuate, hence making them suitablesuppliers for the electrolysis, due to its storage capabilities. Contrary, the other processesrequires a steady energy contribution, which must be contributed from external sources. Itis therefore of interest to determine the power consumption of the electrolysis subsystemin order to estimate the required number of wind turbines and PV panels.
As discussed in Section 2.2, the electrolyser is based on a study by Sánchez et al. [2018],with an approximately 10 kW bench scale system. This model has been scaled linearly tomeet the required H2 flow rate for the MeOH synthesis. Results acquired from benchscaled systems are known not always to be representative for large scaled systems, from
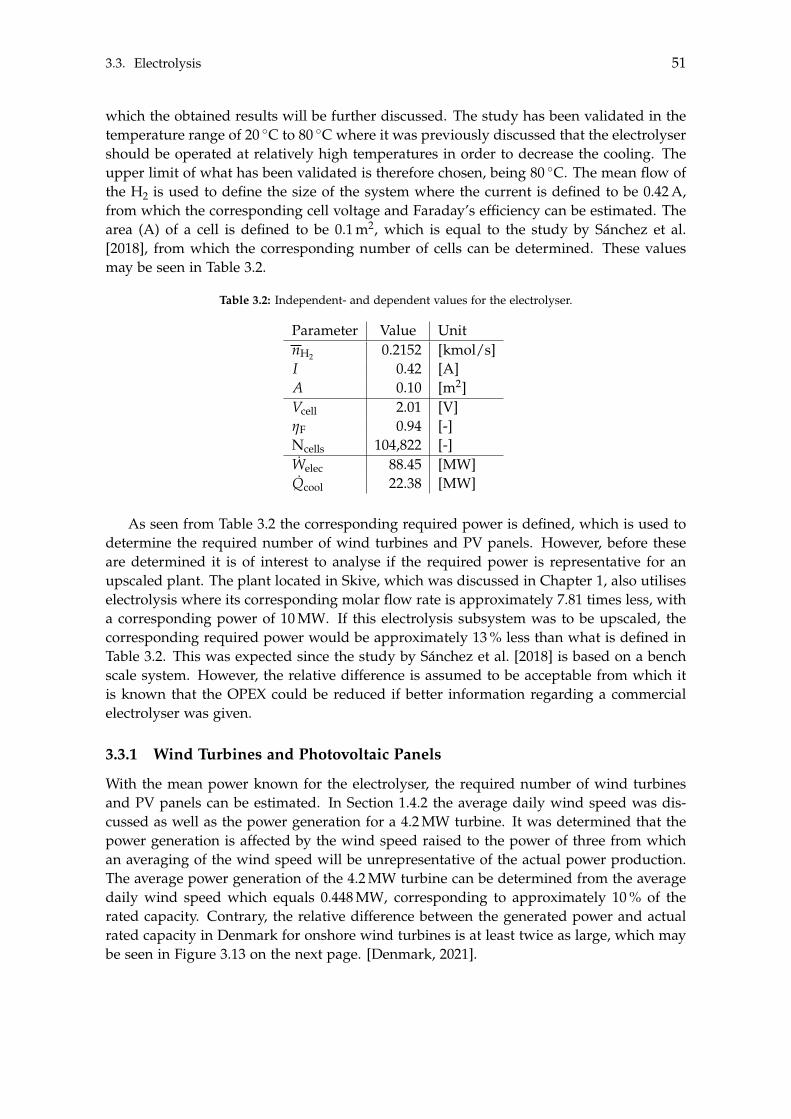
3.3. Electrolysis 51
which the obtained results will be further discussed. The study has been validated in thetemperature range of 20 �C to 80 �C where it was previously discussed that the electrolysershould be operated at relatively high temperatures in order to decrease the cooling. Theupper limit of what has been validated is therefore chosen, being 80 �C. The mean flow ofthe H2 is used to define the size of the system where the current is defined to be 0.42 A,from which the corresponding cell voltage and Faraday’s efficiency can be estimated. Thearea (A) of a cell is defined to be 0.1 m2, which is equal to the study by Sánchez et al.[2018], from which the corresponding number of cells can be determined. These valuesmay be seen in Table 3.2.
Table 3.2: Independent- and dependent values for the electrolyser.
Parameter Value UnitnH2 0.2152 [kmol/s]I 0.42 [A]A 0.10 [m2]Vcell 2.01 [V]hF 0.94 [-]Ncells 104,822 [-]Welec 88.45 [MW]Qcool 22.38 [MW]
As seen from Table 3.2 the corresponding required power is defined, which is used todetermine the required number of wind turbines and PV panels. However, before theseare determined it is of interest to analyse if the required power is representative for anupscaled plant. The plant located in Skive, which was discussed in Chapter 1, also utiliseselectrolysis where its corresponding molar flow rate is approximately 7.81 times less, witha corresponding power of 10 MW. If this electrolysis subsystem was to be upscaled, thecorresponding required power would be approximately 13 % less than what is defined inTable 3.2. This was expected since the study by Sánchez et al. [2018] is based on a benchscale system. However, the relative difference is assumed to be acceptable from which itis known that the OPEX could be reduced if better information regarding a commercialelectrolyser was given.
3.3.1 Wind Turbines and Photovoltaic Panels
With the mean power known for the electrolyser, the required number of wind turbinesand PV panels can be estimated. In Section 1.4.2 the average daily wind speed was dis-cussed as well as the power generation for a 4.2 MW turbine. It was determined that thepower generation is affected by the wind speed raised to the power of three from whichan averaging of the wind speed will be unrepresentative of the actual power production.The average power generation of the 4.2 MW turbine can be determined from the averagedaily wind speed which equals 0.448 MW, corresponding to approximately 10 % of therated capacity. Contrary, the relative difference between the generated power and actualrated capacity in Denmark for onshore wind turbines is at least twice as large, which maybe seen in Figure 3.13 on the next page. [Denmark, 2021].
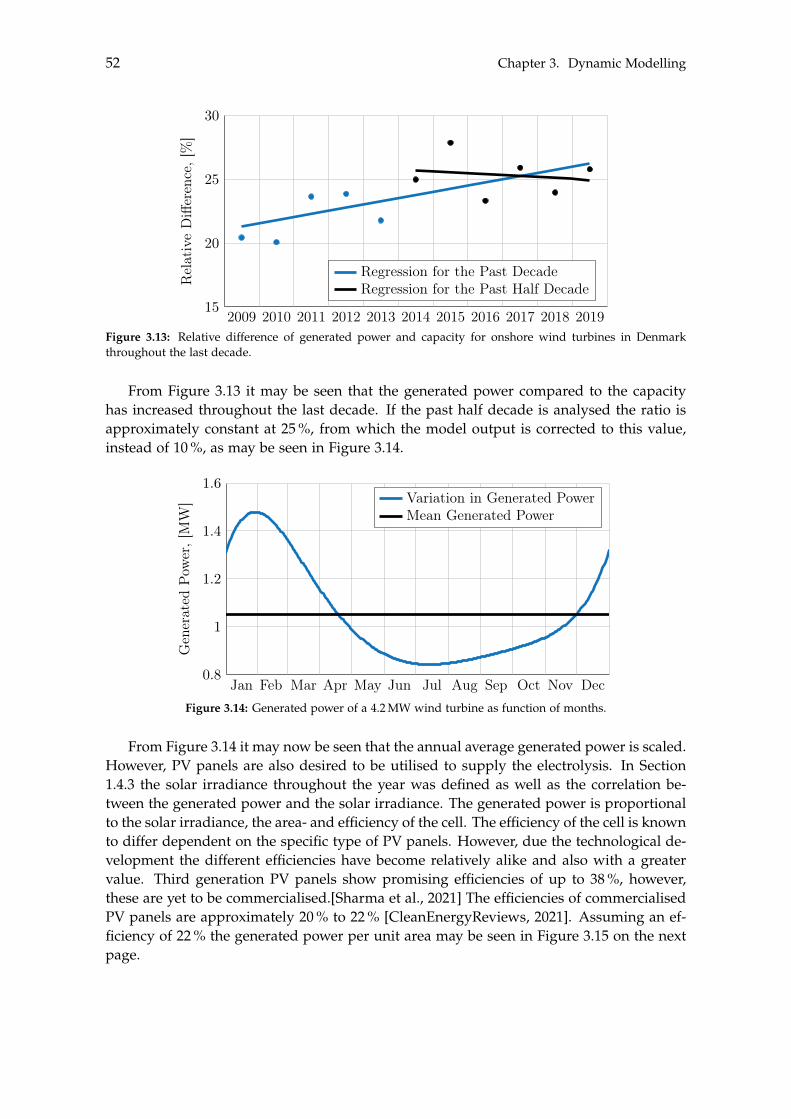
52 Chapter 3. Dynamic Modelling
2009 2010 2011 2012 2013 2014 2015 2016 2017 2018 201915
20
25
30
Rel
ativ
eD
iffer
ence
,[%
]
Regression for the Past DecadeRegression for the Past Half Decade
Figure 3.13: Relative difference of generated power and capacity for onshore wind turbines in Denmarkthroughout the last decade.
From Figure 3.13 it may be seen that the generated power compared to the capacityhas increased throughout the last decade. If the past half decade is analysed the ratio isapproximately constant at 25 %, from which the model output is corrected to this value,instead of 10 %, as may be seen in Figure 3.14.
Jan Feb Mar Apr May Jun Jul Aug Sep Oct Nov Dec0.8
1
1.2
1.4
1.6
Gen
erat
edPo
wer
,[M
W] Variation in Generated Power
Mean Generated Power
Figure 3.14: Generated power of a 4.2 MW wind turbine as function of months.
From Figure 3.14 it may now be seen that the annual average generated power is scaled.However, PV panels are also desired to be utilised to supply the electrolysis. In Section1.4.3 the solar irradiance throughout the year was defined as well as the correlation be-tween the generated power and the solar irradiance. The generated power is proportionalto the solar irradiance, the area- and efficiency of the cell. The efficiency of the cell is knownto differ dependent on the specific type of PV panels. However, due the technological de-velopment the different efficiencies have become relatively alike and also with a greatervalue. Third generation PV panels show promising efficiencies of up to 38 %, however,these are yet to be commercialised.[Sharma et al., 2021] The efficiencies of commercialisedPV panels are approximately 20 % to 22 % [CleanEnergyReviews, 2021]. Assuming an ef-ficiency of 22 % the generated power per unit area may be seen in Figure 3.15 on the nextpage.
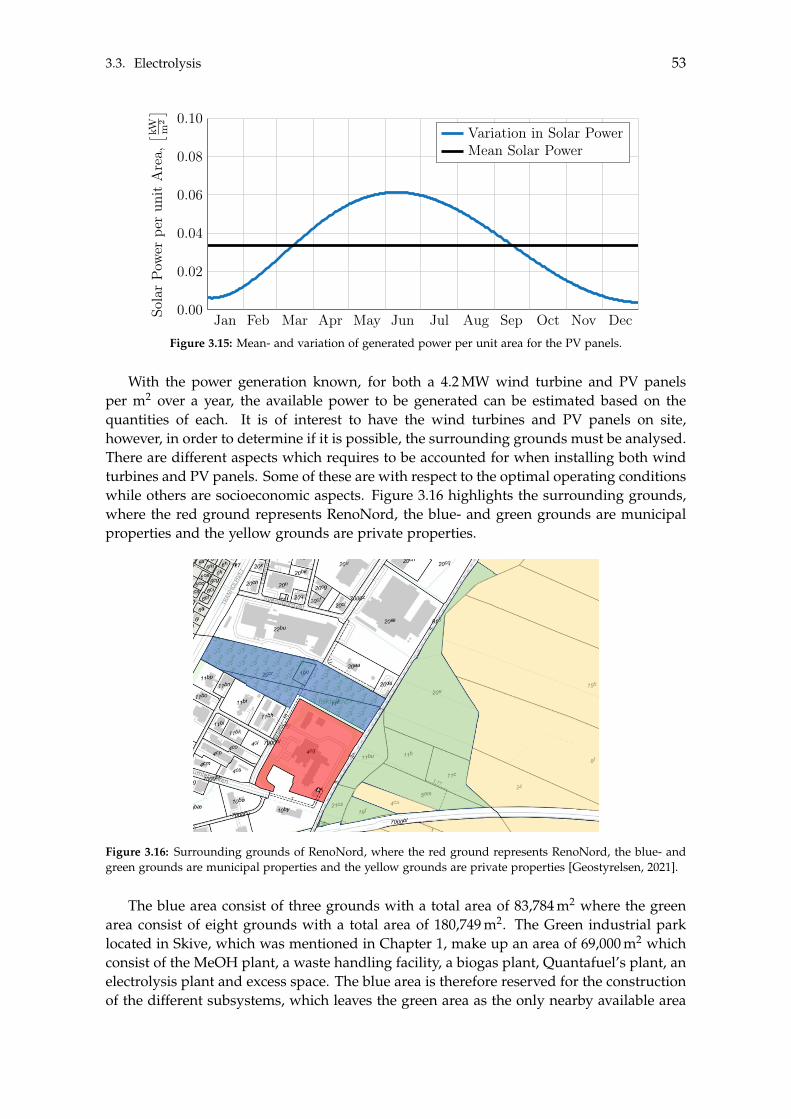
3.3. Electrolysis 53
Jan Feb Mar Apr May Jun Jul Aug Sep Oct Nov Dec0.00
0.02
0.04
0.06
0.08
0.10
Sola
rPo
wer
per
unit
Are
a,⇥ k
W m2
⇤Variation in Solar PowerMean Solar Power
Figure 3.15: Mean- and variation of generated power per unit area for the PV panels.
With the power generation known, for both a 4.2 MW wind turbine and PV panelsper m2 over a year, the available power to be generated can be estimated based on thequantities of each. It is of interest to have the wind turbines and PV panels on site,however, in order to determine if it is possible, the surrounding grounds must be analysed.There are different aspects which requires to be accounted for when installing both windturbines and PV panels. Some of these are with respect to the optimal operating conditionswhile others are socioeconomic aspects. Figure 3.16 highlights the surrounding grounds,where the red ground represents RenoNord, the blue- and green grounds are municipalproperties and the yellow grounds are private properties.
Figure 3.16: Surrounding grounds of RenoNord, where the red ground represents RenoNord, the blue- andgreen grounds are municipal properties and the yellow grounds are private properties [Geostyrelsen, 2021].
The blue area consist of three grounds with a total area of 83,784 m2 where the greenarea consist of eight grounds with a total area of 180,749 m2. The Green industrial parklocated in Skive, which was mentioned in Chapter 1, make up an area of 69,000 m2 whichconsist of the MeOH plant, a waste handling facility, a biogas plant, Quantafuel’s plant, anelectrolysis plant and excess space. The blue area is therefore reserved for the constructionof the different subsystems, which leaves the green area as the only nearby available area
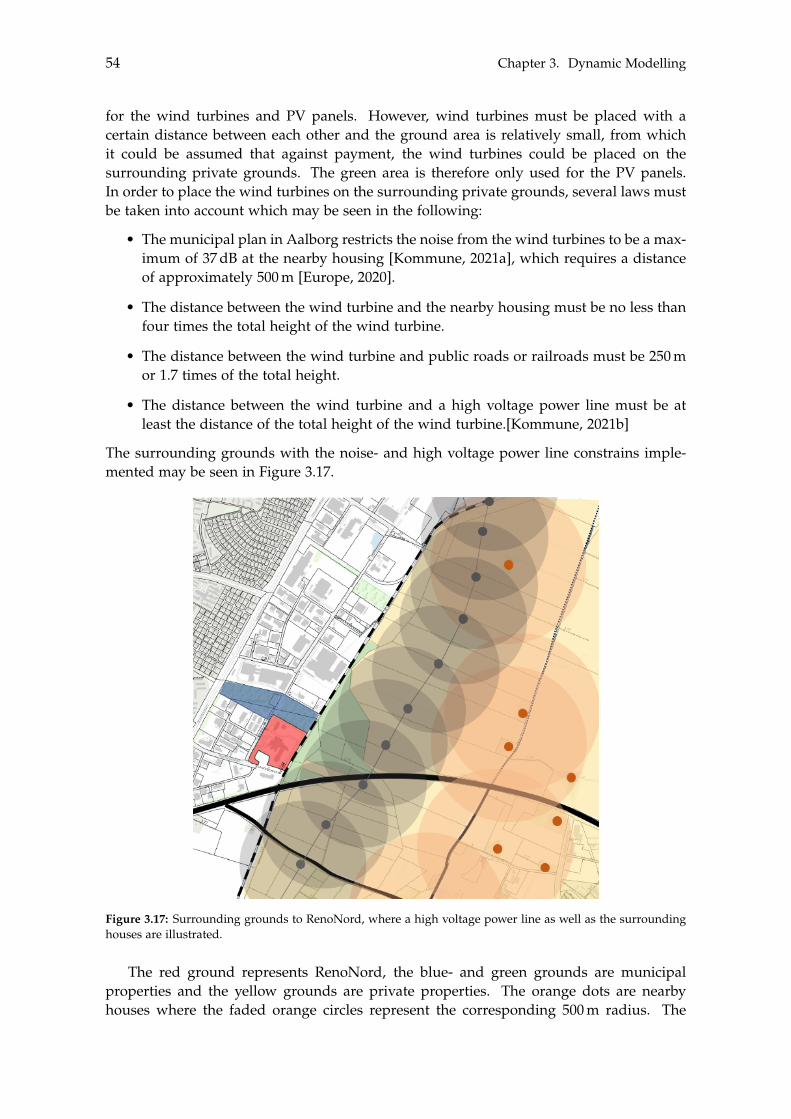
54 Chapter 3. Dynamic Modelling
for the wind turbines and PV panels. However, wind turbines must be placed with acertain distance between each other and the ground area is relatively small, from whichit could be assumed that against payment, the wind turbines could be placed on thesurrounding private grounds. The green area is therefore only used for the PV panels.In order to place the wind turbines on the surrounding private grounds, several laws mustbe taken into account which may be seen in the following:
• The municipal plan in Aalborg restricts the noise from the wind turbines to be a max-imum of 37 dB at the nearby housing [Kommune, 2021a], which requires a distanceof approximately 500 m [Europe, 2020].
• The distance between the wind turbine and the nearby housing must be no less thanfour times the total height of the wind turbine.
• The distance between the wind turbine and public roads or railroads must be 250 mor 1.7 times of the total height.
• The distance between the wind turbine and a high voltage power line must be atleast the distance of the total height of the wind turbine.[Kommune, 2021b]
The surrounding grounds with the noise- and high voltage power line constrains imple-mented may be seen in Figure 3.17.
Figure 3.17: Surrounding grounds to RenoNord, where a high voltage power line as well as the surroundinghouses are illustrated.
The red ground represents RenoNord, the blue- and green grounds are municipalproperties and the yellow grounds are private properties. The orange dots are nearbyhouses where the faded orange circles represent the corresponding 500 m radius. The
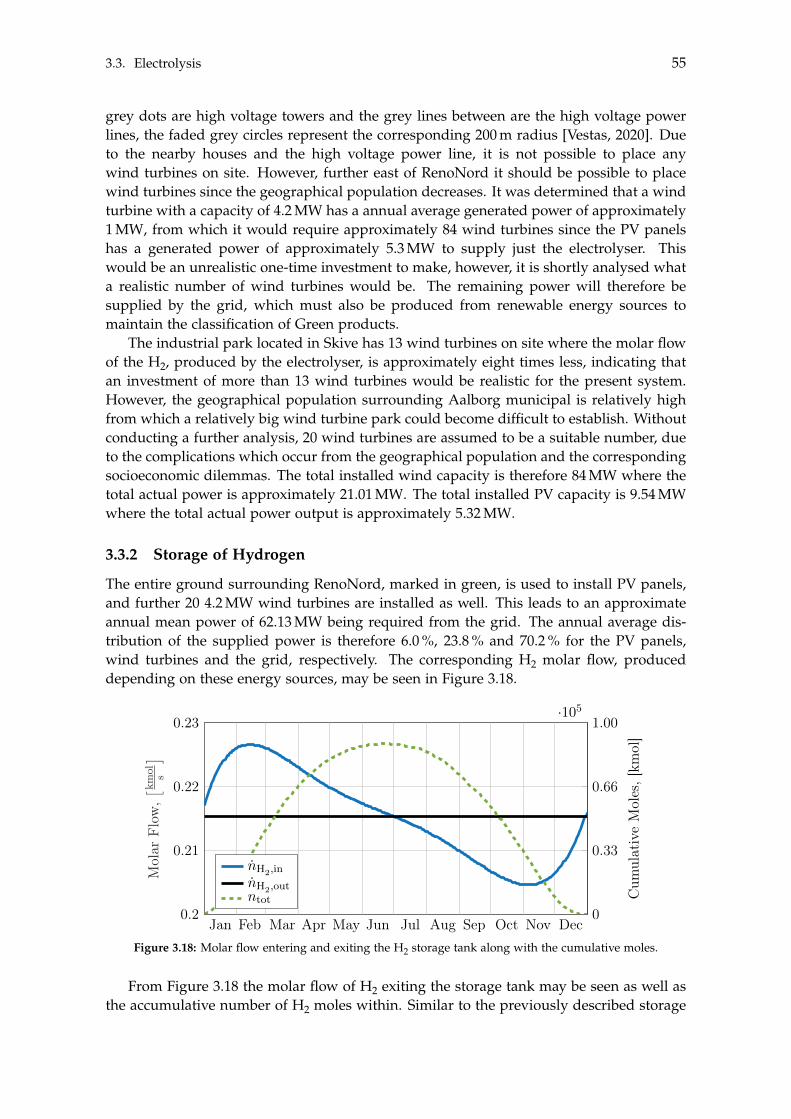
3.3. Electrolysis 55
grey dots are high voltage towers and the grey lines between are the high voltage powerlines, the faded grey circles represent the corresponding 200 m radius [Vestas, 2020]. Dueto the nearby houses and the high voltage power line, it is not possible to place anywind turbines on site. However, further east of RenoNord it should be possible to placewind turbines since the geographical population decreases. It was determined that a windturbine with a capacity of 4.2 MW has a annual average generated power of approximately1 MW, from which it would require approximately 84 wind turbines since the PV panelshas a generated power of approximately 5.3 MW to supply just the electrolyser. Thiswould be an unrealistic one-time investment to make, however, it is shortly analysed whata realistic number of wind turbines would be. The remaining power will therefore besupplied by the grid, which must also be produced from renewable energy sources tomaintain the classification of Green products.
The industrial park located in Skive has 13 wind turbines on site where the molar flowof the H2, produced by the electrolyser, is approximately eight times less, indicating thatan investment of more than 13 wind turbines would be realistic for the present system.However, the geographical population surrounding Aalborg municipal is relatively highfrom which a relatively big wind turbine park could become difficult to establish. Withoutconducting a further analysis, 20 wind turbines are assumed to be a suitable number, dueto the complications which occur from the geographical population and the correspondingsocioeconomic dilemmas. The total installed wind capacity is therefore 84 MW where thetotal actual power is approximately 21.01 MW. The total installed PV capacity is 9.54 MWwhere the total actual power output is approximately 5.32 MW.
3.3.2 Storage of Hydrogen
The entire ground surrounding RenoNord, marked in green, is used to install PV panels,and further 20 4.2 MW wind turbines are installed as well. This leads to an approximateannual mean power of 62.13 MW being required from the grid. The annual average dis-tribution of the supplied power is therefore 6.0 %, 23.8 % and 70.2 % for the PV panels,wind turbines and the grid, respectively. The corresponding H2 molar flow, produceddepending on these energy sources, may be seen in Figure 3.18.
Jan Feb Mar Apr May Jun Jul Aug Sep Oct Nov Dec0.2
0.21
0.22
0.23
Mol
arFl
ow,⇥ k
mol s⇤
0
0.33
0.66
1.00·105
Cum
ulat
ive
Mol
es,[
kmol
]
nH2,in
nH2,out
ntot
Figure 3.18: Molar flow entering and exiting the H2 storage tank along with the cumulative moles.
From Figure 3.18 the molar flow of H2 exiting the storage tank may be seen as well asthe accumulative number of H2 moles within. Similar to the previously described storage
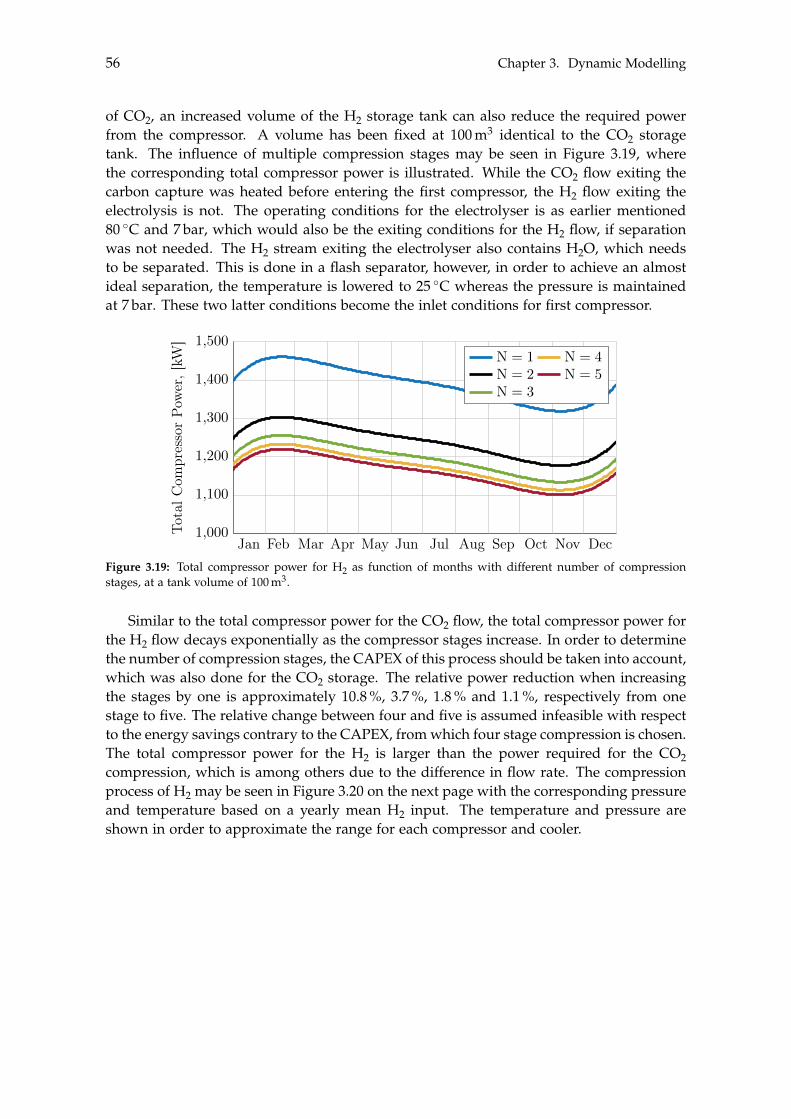
56 Chapter 3. Dynamic Modelling
of CO2, an increased volume of the H2 storage tank can also reduce the required powerfrom the compressor. A volume has been fixed at 100 m3 identical to the CO2 storagetank. The influence of multiple compression stages may be seen in Figure 3.19, wherethe corresponding total compressor power is illustrated. While the CO2 flow exiting thecarbon capture was heated before entering the first compressor, the H2 flow exiting theelectrolysis is not. The operating conditions for the electrolyser is as earlier mentioned80 �C and 7 bar, which would also be the exiting conditions for the H2 flow, if separationwas not needed. The H2 stream exiting the electrolyser also contains H2O, which needsto be separated. This is done in a flash separator, however, in order to achieve an almostideal separation, the temperature is lowered to 25 �C whereas the pressure is maintainedat 7 bar. These two latter conditions become the inlet conditions for first compressor.
Jan Feb Mar Apr May Jun Jul Aug Sep Oct Nov Dec1,000
1,100
1,200
1,300
1,400
1,500
Tota
lCom
pres
sor
Pow
er,[
kW]
N = 1 N = 4N = 2 N = 5N = 3
Figure 3.19: Total compressor power for H2 as function of months with different number of compressionstages, at a tank volume of 100 m3.
Similar to the total compressor power for the CO2 flow, the total compressor power forthe H2 flow decays exponentially as the compressor stages increase. In order to determinethe number of compression stages, the CAPEX of this process should be taken into account,which was also done for the CO2 storage. The relative power reduction when increasingthe stages by one is approximately 10.8 %, 3.7 %, 1.8 % and 1.1 %, respectively from onestage to five. The relative change between four and five is assumed infeasible with respectto the energy savings contrary to the CAPEX, from which four stage compression is chosen.The total compressor power for the H2 is larger than the power required for the CO2compression, which is among others due to the difference in flow rate. The compressionprocess of H2 may be seen in Figure 3.20 on the next page with the corresponding pressureand temperature based on a yearly mean H2 input. The temperature and pressure areshown in order to approximate the range for each compressor and cooler.
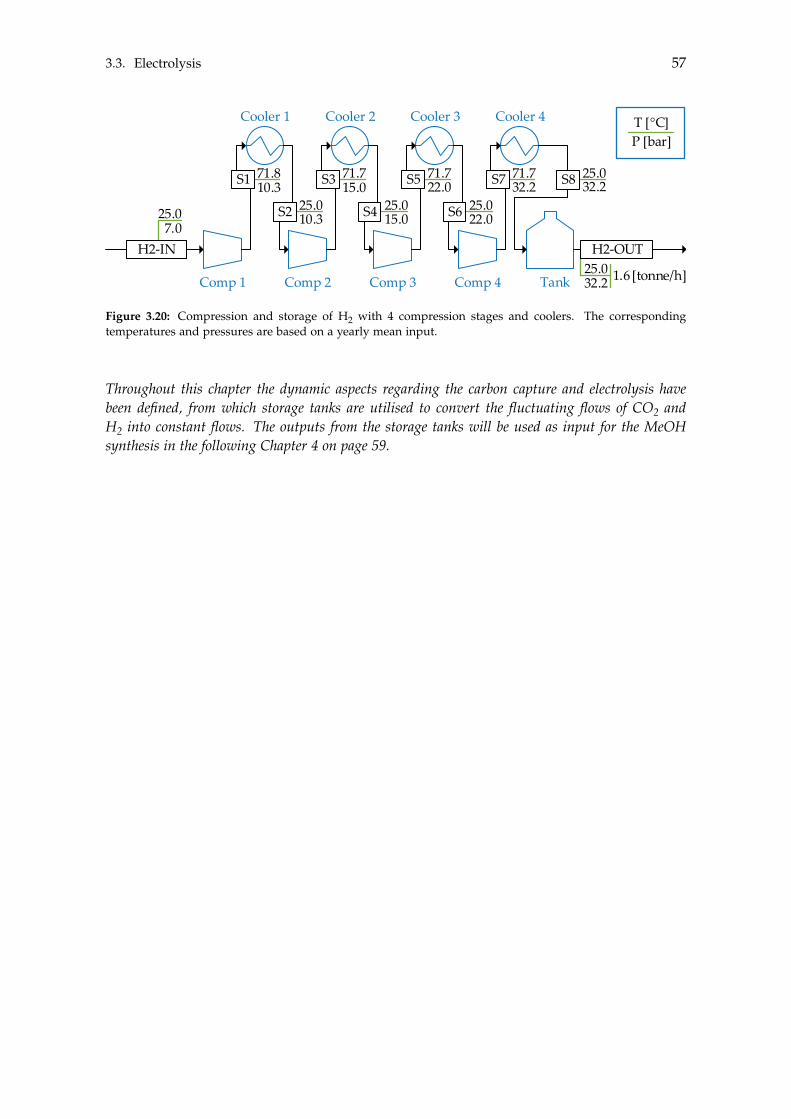
3.3. Electrolysis 57
7.0
Mixer
S2
hej
Heater 1 Mixer
Splitter
Waste
Waste
Recycle
Feed
Cooler 1
Comp 1 Comp 2 Comp 3 Comp 4
Cooler 3Cooler 2 Cooler 4
Tank
25.0
10.371.8
10.325.0
15.071.7
15.025.0
22.025.0
22.071.7
32.271.7
32.225.0
S2 S4 S6
S1 S3 S5 S7 S8
32.225.0 1.6
H2-OUT
[tonne/h]
P [bar]T [°C]
H2-IN
Figure 3.20: Compression and storage of H2 with 4 compression stages and coolers. The correspondingtemperatures and pressures are based on a yearly mean input.
Throughout this chapter the dynamic aspects regarding the carbon capture and electrolysis havebeen defined, from which storage tanks are utilised to convert the fluctuating flows of CO2 andH2 into constant flows. The outputs from the storage tanks will be used as input for the MeOHsynthesis in the following Chapter 4 on page 59.

[This page is intentionally left blank]
Chapter 4
Steady State ModellingFrom the previous chapter, the fluctuating flows of CO2 and H2 have, by means of storage,been converted into steady state flows which are desired for the following processes, whichis the MeOH synthesis and the subsequent subsystems. The steady state inputs are desiredto avoid partial loading which entails a reduced efficiency.
4.1 Methanol Synthesis
The objective of the MeOH synthesis is to determine the liquid flow exiting the flash sep-aration, where the inputs for this subsystem are CO2 and H2. In order to acquire validresults, a representative equation of state must be chosen. Due to the relatively high pres-sures used in the MeOH synthesis, which will be the outcome of this model, the Redlich-Kwong-Soave equation of state with a modified Huron-Vidal mixing rule (RKSMHV) ischosen. The Peng-Robinson equation of state with a modified Huron-Vidal mixing rulecould also have been utilised, however, the study done by [Ghanbari et al., 2017] investi-gated the difference between both equations of states, yet, without the modified mixingrule. They concluded the use of the Redlich-Kwong-Soave equation of state should bechosen if modification to the equation of state is done, which is the case for the presentedstudy.
The molar flow of CO2 is the limiting reactant and is determined from the carboncapture whereas the molar flow of H2 is adjusted to optimise the MeOH yield. From themolar flow of H2, the corresponding electrolysis subsystem and size of the H2 storage wasdefined. A schematic of the MeOH synthesis can be seen in Figure 4.1 on the next page.As was discussed in section 2.4 the subsystem consists of a reactor where pure CO2 and H2enters along with the gases from the feedback-loop. The gases exiting the reactor enters aflash separator in order to separate the products from unconverted reactants. Additionally,a separator is implemented to avoid accumulation of unwanted products.
59
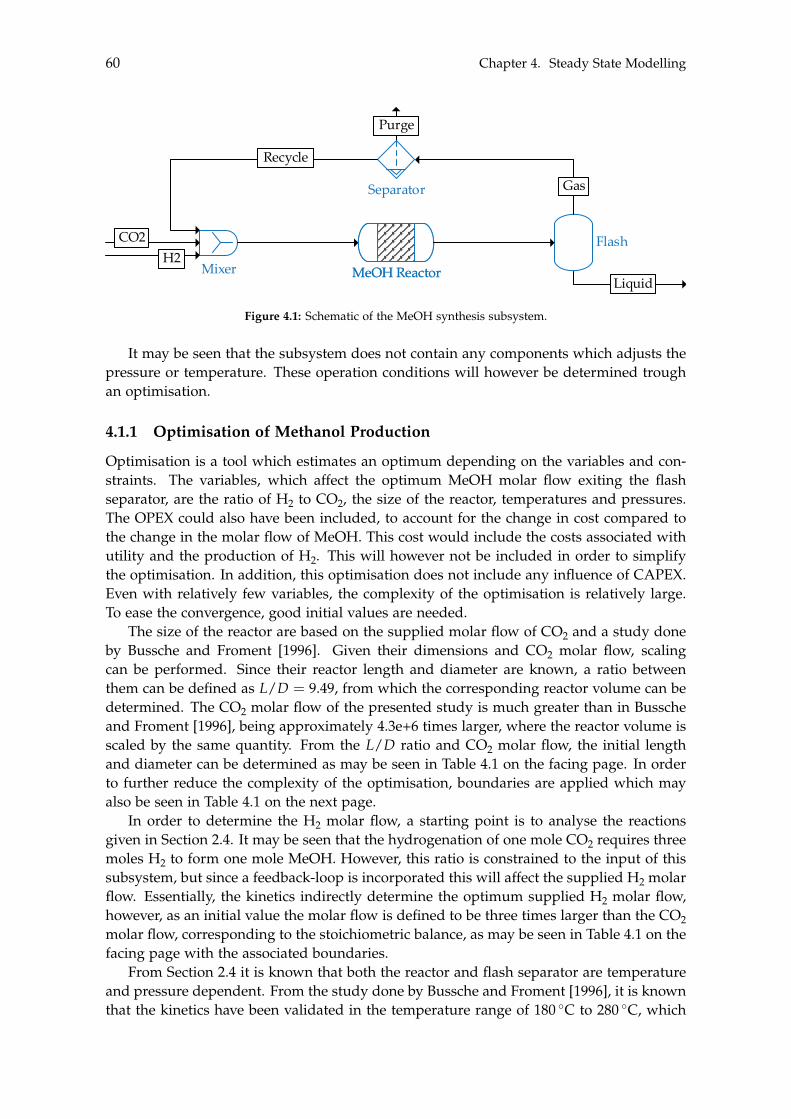
60 Chapter 4. Steady State Modelling
Mixer ReactorReactor Flash
S2
Mixer
hej
Absorber/stripper/packed column BTX&MeOH-Dist/TrayBTX&MeOH-Dist/Tray
Valve
Comp
Pump Heat exchanger
Cooler
Fluid/liquid separator
Tank
CompFlash
Column 1Column 1 Column 2Column 2 Column 3Column 3 Column 4Column 4
BTX synthesis product stream
H2 CO
CH4C2H4
C2H6CO2
C3H6C3H8 C4H10
C5H12C6H14
CH3OH
C6H6H2O
C7H8C8H10 C9H12
C10H14
Heater
Mixer MeOH ReactorMeOH Reactor
Flash
Separator
Recycle
Gas
Purge
Liquid
H2CO2
Figure 4.1: Schematic of the MeOH synthesis subsystem.
It may be seen that the subsystem does not contain any components which adjusts thepressure or temperature. These operation conditions will however be determined troughan optimisation.
4.1.1 Optimisation of Methanol Production
Optimisation is a tool which estimates an optimum depending on the variables and con-straints. The variables, which affect the optimum MeOH molar flow exiting the flashseparator, are the ratio of H2 to CO2, the size of the reactor, temperatures and pressures.The OPEX could also have been included, to account for the change in cost compared tothe change in the molar flow of MeOH. This cost would include the costs associated withutility and the production of H2. This will however not be included in order to simplifythe optimisation. In addition, this optimisation does not include any influence of CAPEX.Even with relatively few variables, the complexity of the optimisation is relatively large.To ease the convergence, good initial values are needed.
The size of the reactor are based on the supplied molar flow of CO2 and a study doneby Bussche and Froment [1996]. Given their dimensions and CO2 molar flow, scalingcan be performed. Since their reactor length and diameter are known, a ratio betweenthem can be defined as L/D = 9.49, from which the corresponding reactor volume can bedetermined. The CO2 molar flow of the presented study is much greater than in Busscheand Froment [1996], being approximately 4.3e+6 times larger, where the reactor volume isscaled by the same quantity. From the L/D ratio and CO2 molar flow, the initial lengthand diameter can be determined as may be seen in Table 4.1 on the facing page. In orderto further reduce the complexity of the optimisation, boundaries are applied which mayalso be seen in Table 4.1 on the next page.
In order to determine the H2 molar flow, a starting point is to analyse the reactionsgiven in Section 2.4. It may be seen that the hydrogenation of one mole CO2 requires threemoles H2 to form one mole MeOH. However, this ratio is constrained to the input of thissubsystem, but since a feedback-loop is incorporated this will affect the supplied H2 molarflow. Essentially, the kinetics indirectly determine the optimum supplied H2 molar flow,however, as an initial value the molar flow is defined to be three times larger than the CO2molar flow, corresponding to the stoichiometric balance, as may be seen in Table 4.1 on thefacing page with the associated boundaries.
From Section 2.4 it is known that both the reactor and flash separator are temperatureand pressure dependent. From the study done by Bussche and Froment [1996], it is knownthat the kinetics have been validated in the temperature range of 180 �C to 280 �C, which
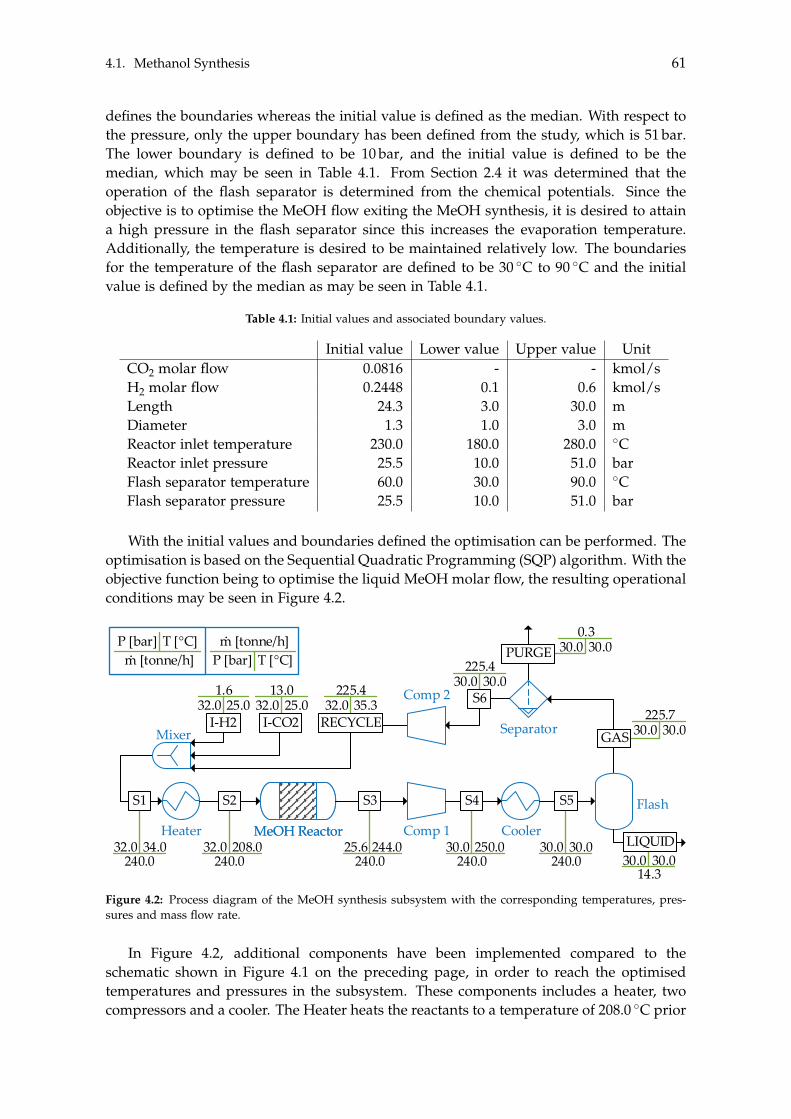
4.1. Methanol Synthesis 61
defines the boundaries whereas the initial value is defined as the median. With respect tothe pressure, only the upper boundary has been defined from the study, which is 51 bar.The lower boundary is defined to be 10 bar, and the initial value is defined to be themedian, which may be seen in Table 4.1. From Section 2.4 it was determined that theoperation of the flash separator is determined from the chemical potentials. Since theobjective is to optimise the MeOH flow exiting the MeOH synthesis, it is desired to attaina high pressure in the flash separator since this increases the evaporation temperature.Additionally, the temperature is desired to be maintained relatively low. The boundariesfor the temperature of the flash separator are defined to be 30 �C to 90 �C and the initialvalue is defined by the median as may be seen in Table 4.1.
Table 4.1: Initial values and associated boundary values.
Initial value Lower value Upper value UnitCO2 molar flow 0.0816 - - kmol/sH2 molar flow 0.2448 0.1 0.6 kmol/sLength 24.3 3.0 30.0 mDiameter 1.3 1.0 3.0 mReactor inlet temperature 230.0 180.0 280.0 �CReactor inlet pressure 25.5 10.0 51.0 barFlash separator temperature 60.0 30.0 90.0 �CFlash separator pressure 25.5 10.0 51.0 bar
With the initial values and boundaries defined the optimisation can be performed. Theoptimisation is based on the Sequential Quadratic Programming (SQP) algorithm. With theobjective function being to optimise the liquid MeOH molar flow, the resulting operationalconditions may be seen in Figure 4.2.
0.330.030.0
30.014.3
30.030.0
240.030.0250.0
240.030.0208.0
240.032.034.0
240.032.0
225.430.030.0225.4
35.332.01.6
25.032.0
Mixer
Mixer ReactorReactor Flash
S2
Mixer
hej
Absorber/stripper/packed column BTX&MeOH-Dist/TrayBTX&MeOH-Dist/Tray
Valve
Comp
Pump Heat exchanger
Cooler
Fluid/liquid separator
Tank
Heater
MeOH ReactorMeOH Reactor
Flash
SeparatorRECYCLEGAS
PURGE
Comp 2
S3
CoolerHeater
S2S1 S5
I-H2
LIQUIDComp 1
S4
Cooler 2
EXHS1S2
68
6663
1.0
248401.2
248621.2
T [°C]m [tonne/h]
P [bar]. T [°C]
m [tonne/h]P [bar]
.
13.025.032.0
I-CO2
S6225.7
30.030.0
244.0240.0
25.6
Figure 4.2: Process diagram of the MeOH synthesis subsystem with the corresponding temperatures, pres-sures and mass flow rate.
In Figure 4.2, additional components have been implemented compared to theschematic shown in Figure 4.1 on the preceding page, in order to reach the optimisedtemperatures and pressures in the subsystem. These components includes a heater, twocompressors and a cooler. The Heater heats the reactants to a temperature of 208.0 �C prior
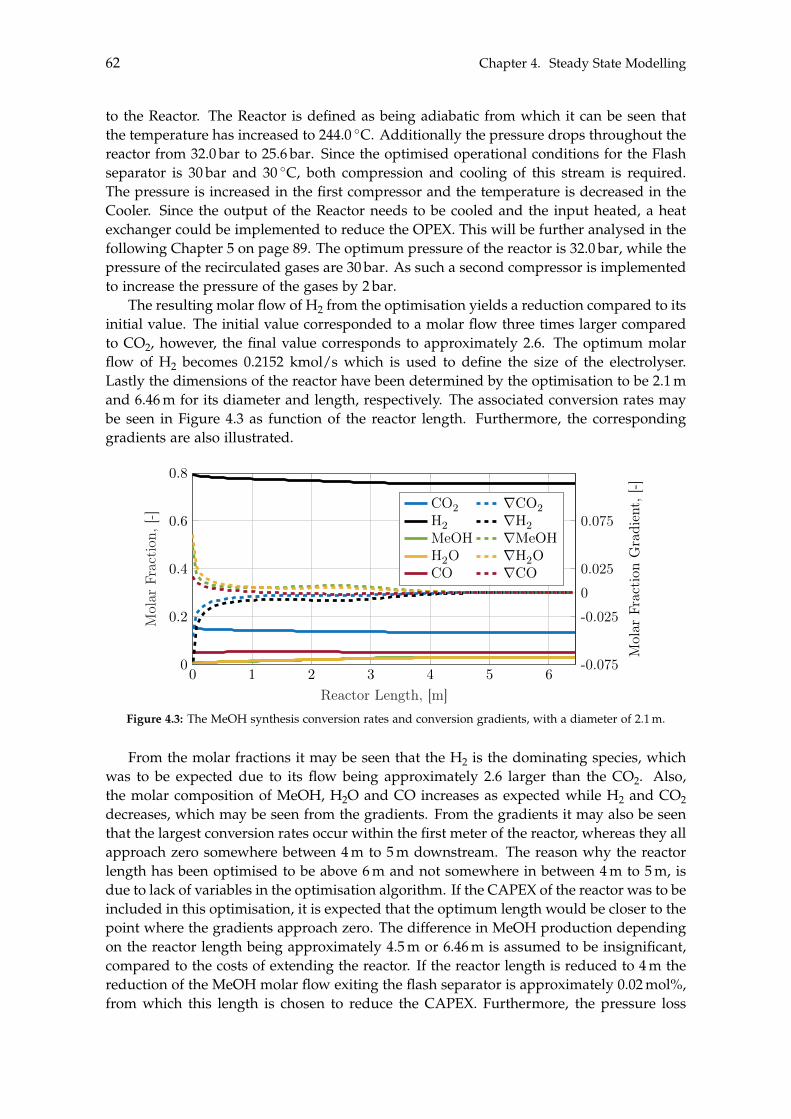
62 Chapter 4. Steady State Modelling
to the Reactor. The Reactor is defined as being adiabatic from which it can be seen thatthe temperature has increased to 244.0 �C. Additionally the pressure drops throughout thereactor from 32.0 bar to 25.6 bar. Since the optimised operational conditions for the Flashseparator is 30 bar and 30 �C, both compression and cooling of this stream is required.The pressure is increased in the first compressor and the temperature is decreased in theCooler. Since the output of the Reactor needs to be cooled and the input heated, a heatexchanger could be implemented to reduce the OPEX. This will be further analysed in thefollowing Chapter 5 on page 89. The optimum pressure of the reactor is 32.0 bar, while thepressure of the recirculated gases are 30 bar. As such a second compressor is implementedto increase the pressure of the gases by 2 bar.
The resulting molar flow of H2 from the optimisation yields a reduction compared to itsinitial value. The initial value corresponded to a molar flow three times larger comparedto CO2, however, the final value corresponds to approximately 2.6. The optimum molarflow of H2 becomes 0.2152 kmol/s which is used to define the size of the electrolyser.Lastly the dimensions of the reactor have been determined by the optimisation to be 2.1 mand 6.46 m for its diameter and length, respectively. The associated conversion rates maybe seen in Figure 4.3 as function of the reactor length. Furthermore, the correspondinggradients are also illustrated.
0 1 2 3 4 5 60
0.2
0.4
0.6
0.8
Reactor Length, [m]
Mol
arFr
acti
on,[
-]
-0.075
-0.02500.025
0.075
Mol
arFr
acti
onG
radi
ent,
[-]
CO2 rCO2H2 rH2MeOH rMeOHH2O rH2OCO rCO
Figure 4.3: The MeOH synthesis conversion rates and conversion gradients, with a diameter of 2.1 m.
From the molar fractions it may be seen that the H2 is the dominating species, whichwas to be expected due to its flow being approximately 2.6 larger than the CO2. Also,the molar composition of MeOH, H2O and CO increases as expected while H2 and CO2decreases, which may be seen from the gradients. From the gradients it may also be seenthat the largest conversion rates occur within the first meter of the reactor, whereas they allapproach zero somewhere between 4 m to 5 m downstream. The reason why the reactorlength has been optimised to be above 6 m and not somewhere in between 4 m to 5 m, isdue to lack of variables in the optimisation algorithm. If the CAPEX of the reactor was to beincluded in this optimisation, it is expected that the optimum length would be closer to thepoint where the gradients approach zero. The difference in MeOH production dependingon the reactor length being approximately 4.5 m or 6.46 m is assumed to be insignificant,compared to the costs of extending the reactor. If the reactor length is reduced to 4 m thereduction of the MeOH molar flow exiting the flash separator is approximately 0.02 mol%,from which this length is chosen to reduce the CAPEX. Furthermore, the pressure loss
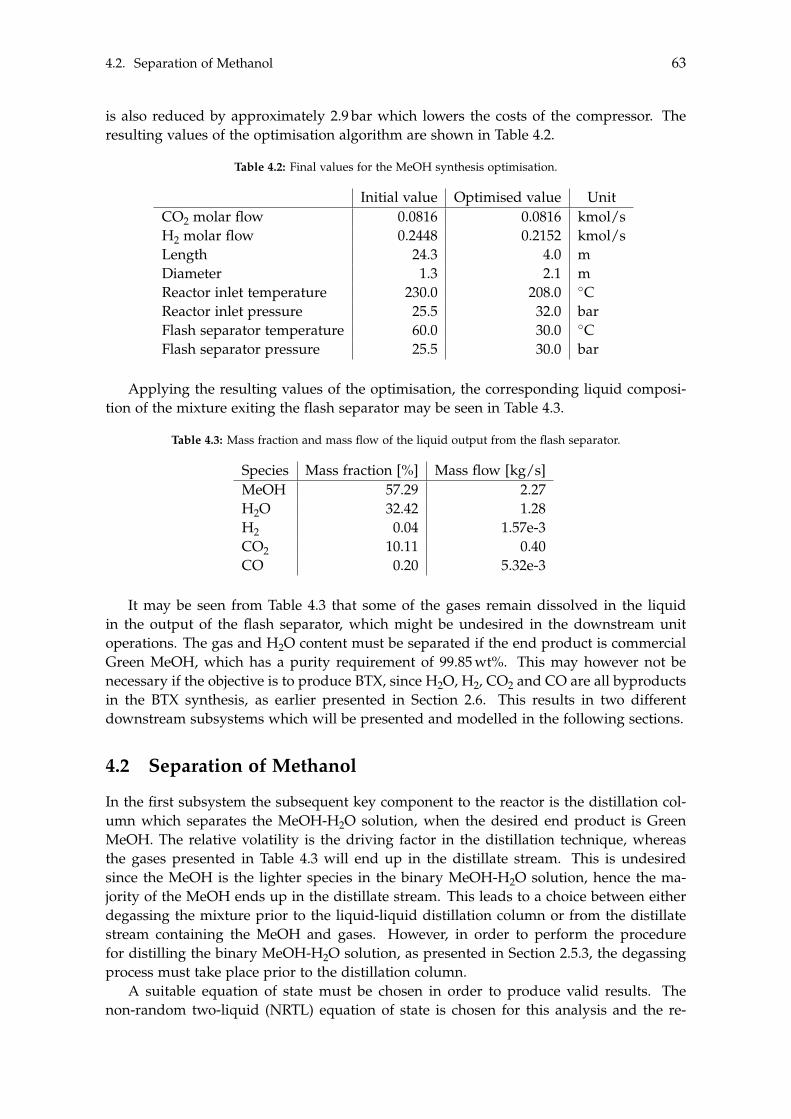
4.2. Separation of Methanol 63
is also reduced by approximately 2.9 bar which lowers the costs of the compressor. Theresulting values of the optimisation algorithm are shown in Table 4.2.
Table 4.2: Final values for the MeOH synthesis optimisation.
Initial value Optimised value UnitCO2 molar flow 0.0816 0.0816 kmol/sH2 molar flow 0.2448 0.2152 kmol/sLength 24.3 4.0 mDiameter 1.3 2.1 mReactor inlet temperature 230.0 208.0 �CReactor inlet pressure 25.5 32.0 barFlash separator temperature 60.0 30.0 �CFlash separator pressure 25.5 30.0 bar
Applying the resulting values of the optimisation, the corresponding liquid composi-tion of the mixture exiting the flash separator may be seen in Table 4.3.
Table 4.3: Mass fraction and mass flow of the liquid output from the flash separator.
Species Mass fraction [%] Mass flow [kg/s]MeOH 57.29 2.27H2O 32.42 1.28H2 0.04 1.57e-3CO2 10.11 0.40CO 0.20 5.32e-3
It may be seen from Table 4.3 that some of the gases remain dissolved in the liquidin the output of the flash separator, which might be undesired in the downstream unitoperations. The gas and H2O content must be separated if the end product is commercialGreen MeOH, which has a purity requirement of 99.85 wt%. This may however not benecessary if the objective is to produce BTX, since H2O, H2, CO2 and CO are all byproductsin the BTX synthesis, as earlier presented in Section 2.6. This results in two differentdownstream subsystems which will be presented and modelled in the following sections.
4.2 Separation of Methanol
In the first subsystem the subsequent key component to the reactor is the distillation col-umn which separates the MeOH-H2O solution, when the desired end product is GreenMeOH. The relative volatility is the driving factor in the distillation technique, whereasthe gases presented in Table 4.3 will end up in the distillate stream. This is undesiredsince the MeOH is the lighter species in the binary MeOH-H2O solution, hence the ma-jority of the MeOH ends up in the distillate stream. This leads to a choice between eitherdegassing the mixture prior to the liquid-liquid distillation column or from the distillatestream containing the MeOH and gases. However, in order to perform the procedurefor distilling the binary MeOH-H2O solution, as presented in Section 2.5.3, the degassingprocess must take place prior to the distillation column.
A suitable equation of state must be chosen in order to produce valid results. Thenon-random two-liquid (NRTL) equation of state is chosen for this analysis and the re-
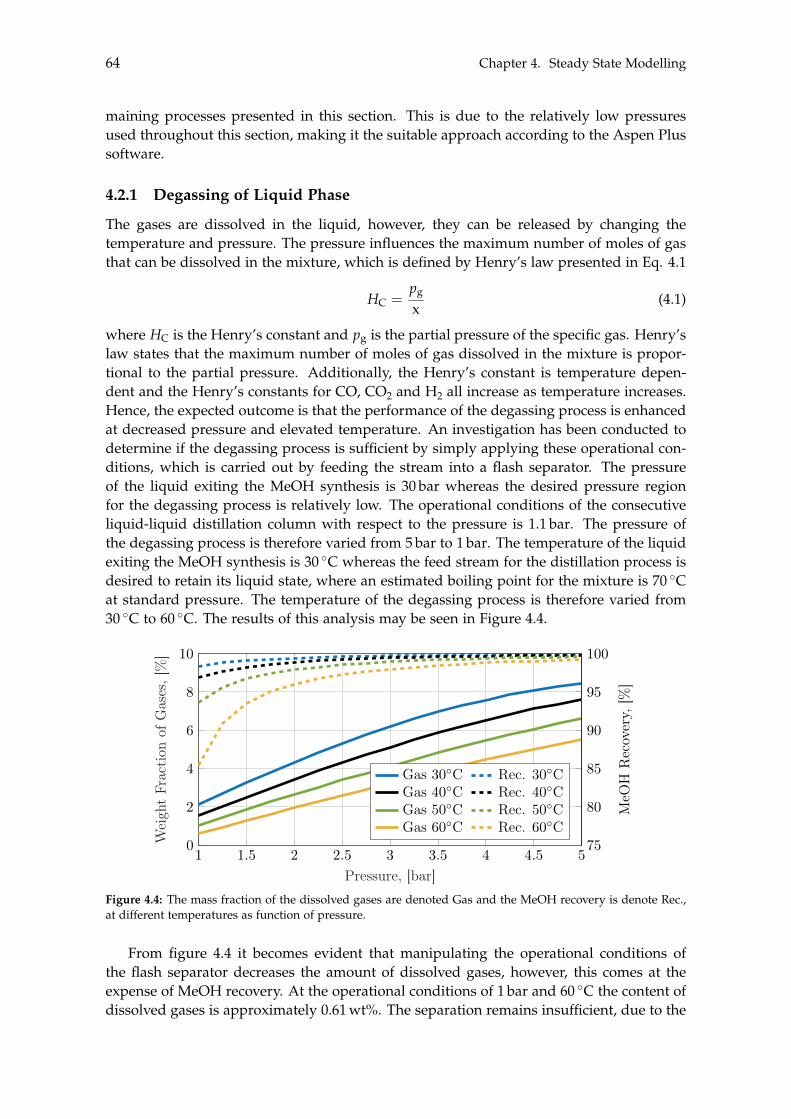
64 Chapter 4. Steady State Modelling
maining processes presented in this section. This is due to the relatively low pressuresused throughout this section, making it the suitable approach according to the Aspen Plussoftware.
4.2.1 Degassing of Liquid Phase
The gases are dissolved in the liquid, however, they can be released by changing thetemperature and pressure. The pressure influences the maximum number of moles of gasthat can be dissolved in the mixture, which is defined by Henry’s law presented in Eq. 4.1
HC =pg
x(4.1)
where HC is the Henry’s constant and pg is the partial pressure of the specific gas. Henry’slaw states that the maximum number of moles of gas dissolved in the mixture is propor-tional to the partial pressure. Additionally, the Henry’s constant is temperature depen-dent and the Henry’s constants for CO, CO2 and H2 all increase as temperature increases.Hence, the expected outcome is that the performance of the degassing process is enhancedat decreased pressure and elevated temperature. An investigation has been conducted todetermine if the degassing process is sufficient by simply applying these operational con-ditions, which is carried out by feeding the stream into a flash separator. The pressureof the liquid exiting the MeOH synthesis is 30 bar whereas the desired pressure regionfor the degassing process is relatively low. The operational conditions of the consecutiveliquid-liquid distillation column with respect to the pressure is 1.1 bar. The pressure ofthe degassing process is therefore varied from 5 bar to 1 bar. The temperature of the liquidexiting the MeOH synthesis is 30 �C whereas the feed stream for the distillation process isdesired to retain its liquid state, where an estimated boiling point for the mixture is 70 �Cat standard pressure. The temperature of the degassing process is therefore varied from30 �C to 60 �C. The results of this analysis may be seen in Figure 4.4.
1 1.5 2 2.5 3 3.5 4 4.5 50
2
4
6
8
10
Pressure, [bar]
Wei
ght
Frac
tion
ofG
ases
,[%
]
75
80
85
90
95
100
MeO
HR
ecov
ery,
[%]
Gas 30�C Rec. 30�CGas 40�C Rec. 40�CGas 50�C Rec. 50�CGas 60�C Rec. 60�C
Figure 4.4: The mass fraction of the dissolved gases are denoted Gas and the MeOH recovery is denote Rec.,at different temperatures as function of pressure.
From figure 4.4 it becomes evident that manipulating the operational conditions ofthe flash separator decreases the amount of dissolved gases, however, this comes at theexpense of MeOH recovery. At the operational conditions of 1 bar and 60 �C the content ofdissolved gases is approximately 0.61 wt%. The separation remains insufficient, due to the
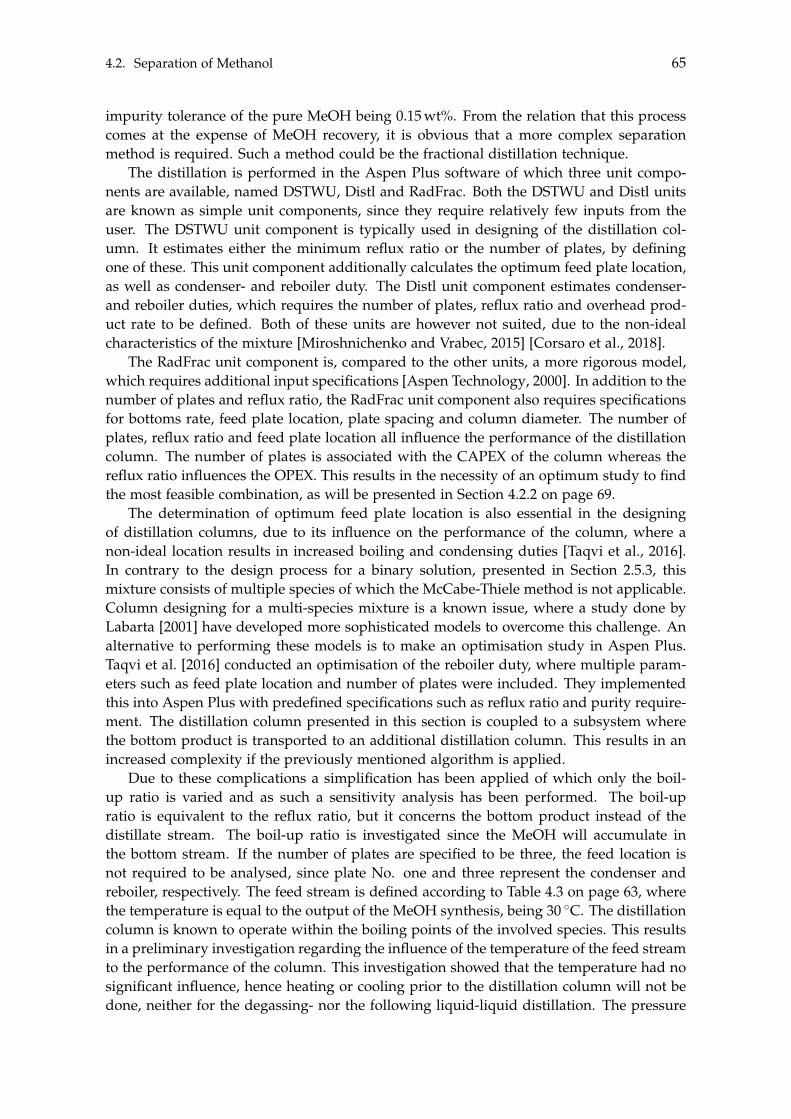
4.2. Separation of Methanol 65
impurity tolerance of the pure MeOH being 0.15 wt%. From the relation that this processcomes at the expense of MeOH recovery, it is obvious that a more complex separationmethod is required. Such a method could be the fractional distillation technique.
The distillation is performed in the Aspen Plus software of which three unit compo-nents are available, named DSTWU, Distl and RadFrac. Both the DSTWU and Distl unitsare known as simple unit components, since they require relatively few inputs from theuser. The DSTWU unit component is typically used in designing of the distillation col-umn. It estimates either the minimum reflux ratio or the number of plates, by definingone of these. This unit component additionally calculates the optimum feed plate location,as well as condenser- and reboiler duty. The Distl unit component estimates condenser-and reboiler duties, which requires the number of plates, reflux ratio and overhead prod-uct rate to be defined. Both of these units are however not suited, due to the non-idealcharacteristics of the mixture [Miroshnichenko and Vrabec, 2015] [Corsaro et al., 2018].
The RadFrac unit component is, compared to the other units, a more rigorous model,which requires additional input specifications [Aspen Technology, 2000]. In addition to thenumber of plates and reflux ratio, the RadFrac unit component also requires specificationsfor bottoms rate, feed plate location, plate spacing and column diameter. The number ofplates, reflux ratio and feed plate location all influence the performance of the distillationcolumn. The number of plates is associated with the CAPEX of the column whereas thereflux ratio influences the OPEX. This results in the necessity of an optimum study to findthe most feasible combination, as will be presented in Section 4.2.2 on page 69.
The determination of optimum feed plate location is also essential in the designingof distillation columns, due to its influence on the performance of the column, where anon-ideal location results in increased boiling and condensing duties [Taqvi et al., 2016].In contrary to the design process for a binary solution, presented in Section 2.5.3, thismixture consists of multiple species of which the McCabe-Thiele method is not applicable.Column designing for a multi-species mixture is a known issue, where a study done byLabarta [2001] have developed more sophisticated models to overcome this challenge. Analternative to performing these models is to make an optimisation study in Aspen Plus.Taqvi et al. [2016] conducted an optimisation of the reboiler duty, where multiple param-eters such as feed plate location and number of plates were included. They implementedthis into Aspen Plus with predefined specifications such as reflux ratio and purity require-ment. The distillation column presented in this section is coupled to a subsystem wherethe bottom product is transported to an additional distillation column. This results in anincreased complexity if the previously mentioned algorithm is applied.
Due to these complications a simplification has been applied of which only the boil-up ratio is varied and as such a sensitivity analysis has been performed. The boil-upratio is equivalent to the reflux ratio, but it concerns the bottom product instead of thedistillate stream. The boil-up ratio is investigated since the MeOH will accumulate inthe bottom stream. If the number of plates are specified to be three, the feed location isnot required to be analysed, since plate No. one and three represent the condenser andreboiler, respectively. The feed stream is defined according to Table 4.3 on page 63, wherethe temperature is equal to the output of the MeOH synthesis, being 30 �C. The distillationcolumn is known to operate within the boiling points of the involved species. This resultsin a preliminary investigation regarding the influence of the temperature of the feed streamto the performance of the column. This investigation showed that the temperature had nosignificant influence, hence heating or cooling prior to the distillation column will not bedone, neither for the degassing- nor the following liquid-liquid distillation. The pressure
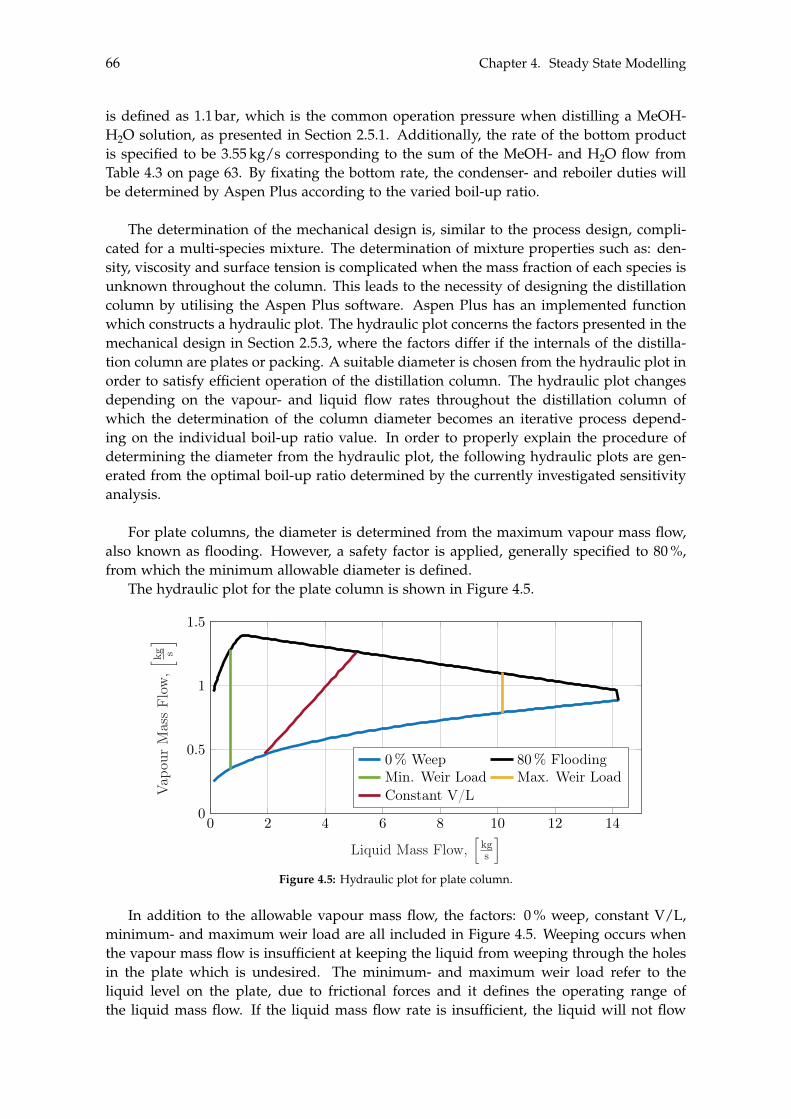
66 Chapter 4. Steady State Modelling
is defined as 1.1 bar, which is the common operation pressure when distilling a MeOH-H2O solution, as presented in Section 2.5.1. Additionally, the rate of the bottom productis specified to be 3.55 kg/s corresponding to the sum of the MeOH- and H2O flow fromTable 4.3 on page 63. By fixating the bottom rate, the condenser- and reboiler duties willbe determined by Aspen Plus according to the varied boil-up ratio.
The determination of the mechanical design is, similar to the process design, compli-cated for a multi-species mixture. The determination of mixture properties such as: den-sity, viscosity and surface tension is complicated when the mass fraction of each species isunknown throughout the column. This leads to the necessity of designing the distillationcolumn by utilising the Aspen Plus software. Aspen Plus has an implemented functionwhich constructs a hydraulic plot. The hydraulic plot concerns the factors presented in themechanical design in Section 2.5.3, where the factors differ if the internals of the distilla-tion column are plates or packing. A suitable diameter is chosen from the hydraulic plot inorder to satisfy efficient operation of the distillation column. The hydraulic plot changesdepending on the vapour- and liquid flow rates throughout the distillation column ofwhich the determination of the column diameter becomes an iterative process depend-ing on the individual boil-up ratio value. In order to properly explain the procedure ofdetermining the diameter from the hydraulic plot, the following hydraulic plots are gen-erated from the optimal boil-up ratio determined by the currently investigated sensitivityanalysis.
For plate columns, the diameter is determined from the maximum vapour mass flow,also known as flooding. However, a safety factor is applied, generally specified to 80 %,from which the minimum allowable diameter is defined.
The hydraulic plot for the plate column is shown in Figure 4.5.
0 2 4 6 8 10 12 140
0.5
1
1.5
Liquid Mass Flow,h
kgs
i
Vap
our
Mas
sFl
ow,h kg s
i
0% Weep 80% FloodingMin. Weir Load Max. Weir LoadConstant V/L
Figure 4.5: Hydraulic plot for plate column.
In addition to the allowable vapour mass flow, the factors: 0 % weep, constant V/L,minimum- and maximum weir load are all included in Figure 4.5. Weeping occurs whenthe vapour mass flow is insufficient at keeping the liquid from weeping through the holesin the plate which is undesired. The minimum- and maximum weir load refer to theliquid level on the plate, due to frictional forces and it defines the operating range ofthe liquid mass flow. If the liquid mass flow rate is insufficient, the liquid will not flow
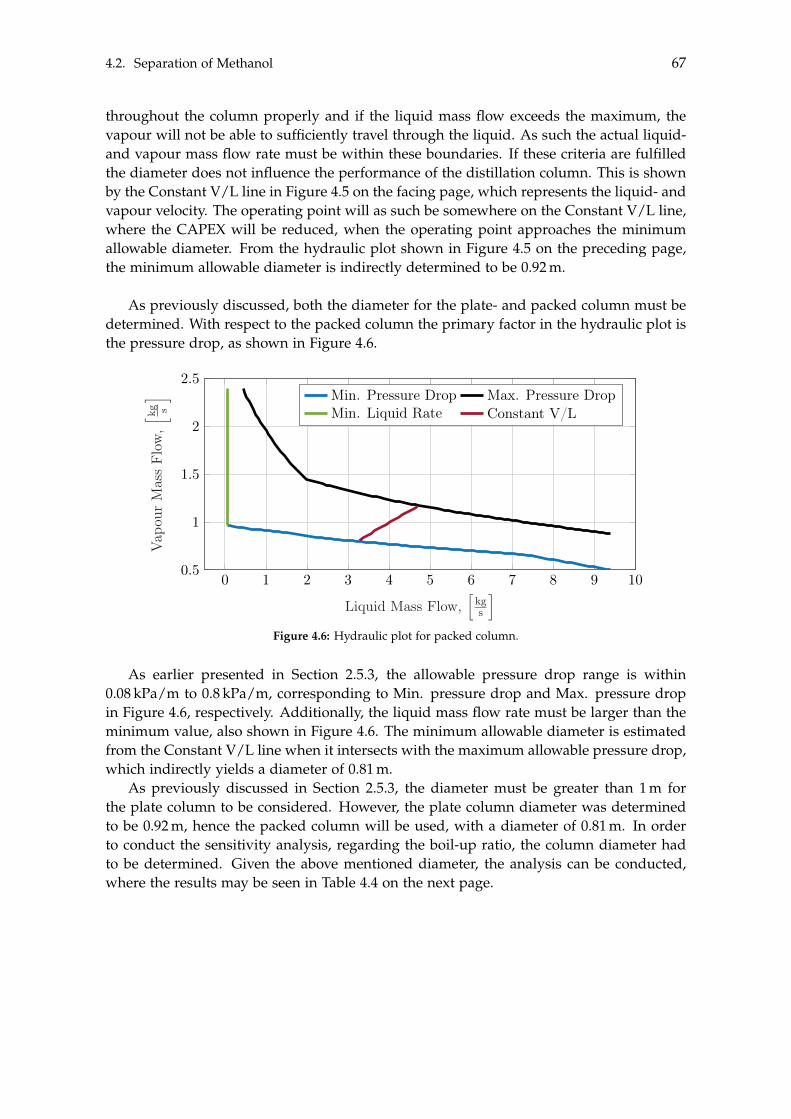
4.2. Separation of Methanol 67
throughout the column properly and if the liquid mass flow exceeds the maximum, thevapour will not be able to sufficiently travel through the liquid. As such the actual liquid-and vapour mass flow rate must be within these boundaries. If these criteria are fulfilledthe diameter does not influence the performance of the distillation column. This is shownby the Constant V/L line in Figure 4.5 on the facing page, which represents the liquid- andvapour velocity. The operating point will as such be somewhere on the Constant V/L line,where the CAPEX will be reduced, when the operating point approaches the minimumallowable diameter. From the hydraulic plot shown in Figure 4.5 on the preceding page,the minimum allowable diameter is indirectly determined to be 0.92 m.
As previously discussed, both the diameter for the plate- and packed column must bedetermined. With respect to the packed column the primary factor in the hydraulic plot isthe pressure drop, as shown in Figure 4.6.
0 1 2 3 4 5 6 7 8 9 100.5
1
1.5
2
2.5
Liquid Mass Flow,h
kgs
i
Vap
our
Mas
sFl
ow,h kg s
i Min. Pressure Drop Max. Pressure DropMin. Liquid Rate Constant V/L
Figure 4.6: Hydraulic plot for packed column.
As earlier presented in Section 2.5.3, the allowable pressure drop range is within0.08 kPa/m to 0.8 kPa/m, corresponding to Min. pressure drop and Max. pressure dropin Figure 4.6, respectively. Additionally, the liquid mass flow rate must be larger than theminimum value, also shown in Figure 4.6. The minimum allowable diameter is estimatedfrom the Constant V/L line when it intersects with the maximum allowable pressure drop,which indirectly yields a diameter of 0.81 m.
As previously discussed in Section 2.5.3, the diameter must be greater than 1 m forthe plate column to be considered. However, the plate column diameter was determinedto be 0.92 m, hence the packed column will be used, with a diameter of 0.81 m. In orderto conduct the sensitivity analysis, regarding the boil-up ratio, the column diameter hadto be determined. Given the above mentioned diameter, the analysis can be conducted,where the results may be seen in Table 4.4 on the next page.
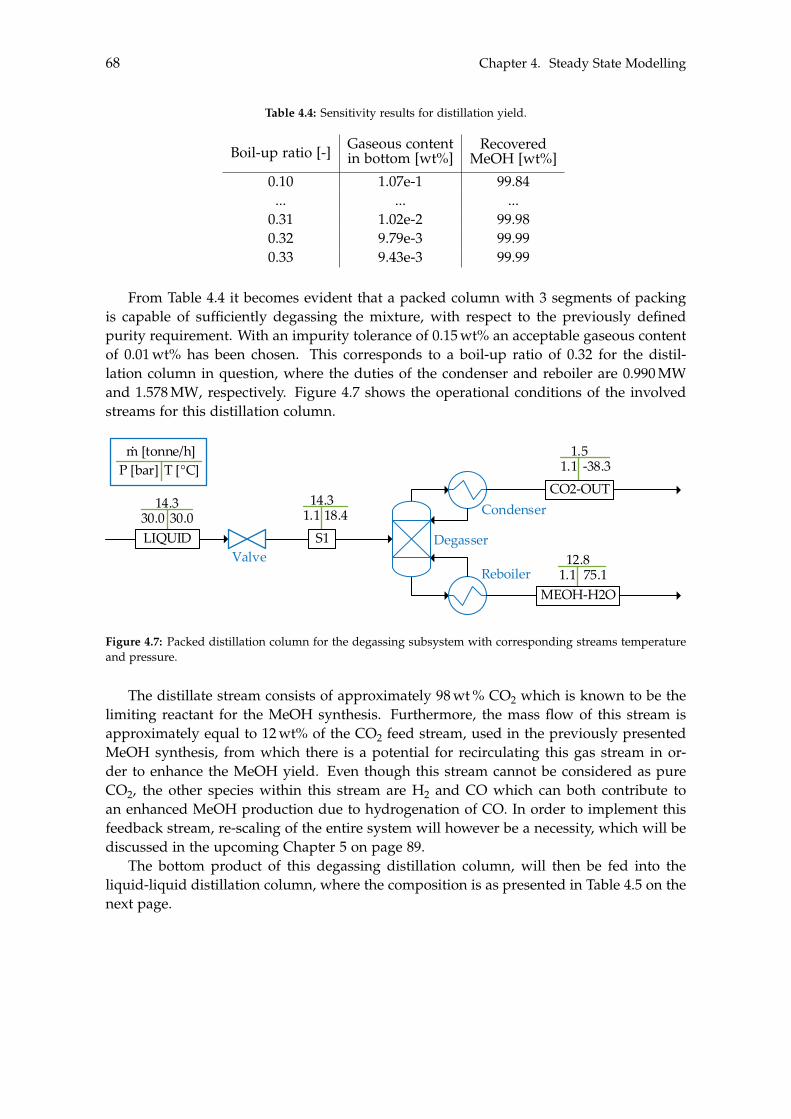
68 Chapter 4. Steady State Modelling
Table 4.4: Sensitivity results for distillation yield.
Boil-up ratio [-] Gaseous contentin bottom [wt%]
RecoveredMeOH [wt%]
0.10 1.07e-1 99.84... ... ...
0.31 1.02e-2 99.980.32 9.79e-3 99.990.33 9.43e-3 99.99
From Table 4.4 it becomes evident that a packed column with 3 segments of packingis capable of sufficiently degassing the mixture, with respect to the previously definedpurity requirement. With an impurity tolerance of 0.15 wt% an acceptable gaseous contentof 0.01 wt% has been chosen. This corresponds to a boil-up ratio of 0.32 for the distil-lation column in question, where the duties of the condenser and reboiler are 0.990 MWand 1.578 MW, respectively. Figure 4.7 shows the operational conditions of the involvedstreams for this distillation column.
1.5-38.31.1
14.318.41.1
Mixer ReactorReactor Flash
S2
Mixer
hej
Absorber/stripper/packed column
BTX&MeOH-Dist/TrayBTX&MeOH-Dist/TrayValve
Comp
Pump Heat exchanger
Cooler
Fluid/liquid separator
Tank
CompFlash
Column 1Column 1 Column 2Column 2 Column 3Column 3 Column 4Column 4
BTX synthesis product stream
H2 CO CH4C2H4
C2H6CO2C3H6C3H8
C4H10C5H12C6H14CH3OH
C6H6H2O
C7H8C8H10 C9H12
C10H14
Waste
ValveS1
Condenser
Reboiler
Degasser
14.330.030.0
T [°C]m [tonne/h]
P [bar]
.
LIQUID
CO2-OUT
12.875.11.1
MEOH-H2O
Figure 4.7: Packed distillation column for the degassing subsystem with corresponding streams temperatureand pressure.
The distillate stream consists of approximately 98 wt % CO2 which is known to be thelimiting reactant for the MeOH synthesis. Furthermore, the mass flow of this stream isapproximately equal to 12 wt% of the CO2 feed stream, used in the previously presentedMeOH synthesis, from which there is a potential for recirculating this gas stream in or-der to enhance the MeOH yield. Even though this stream cannot be considered as pureCO2, the other species within this stream are H2 and CO which can both contribute toan enhanced MeOH production due to hydrogenation of CO. In order to implement thisfeedback stream, re-scaling of the entire system will however be a necessity, which will bediscussed in the upcoming Chapter 5 on page 89.
The bottom product of this degassing distillation column, will then be fed into theliquid-liquid distillation column, where the composition is as presented in Table 4.5 on thenext page.
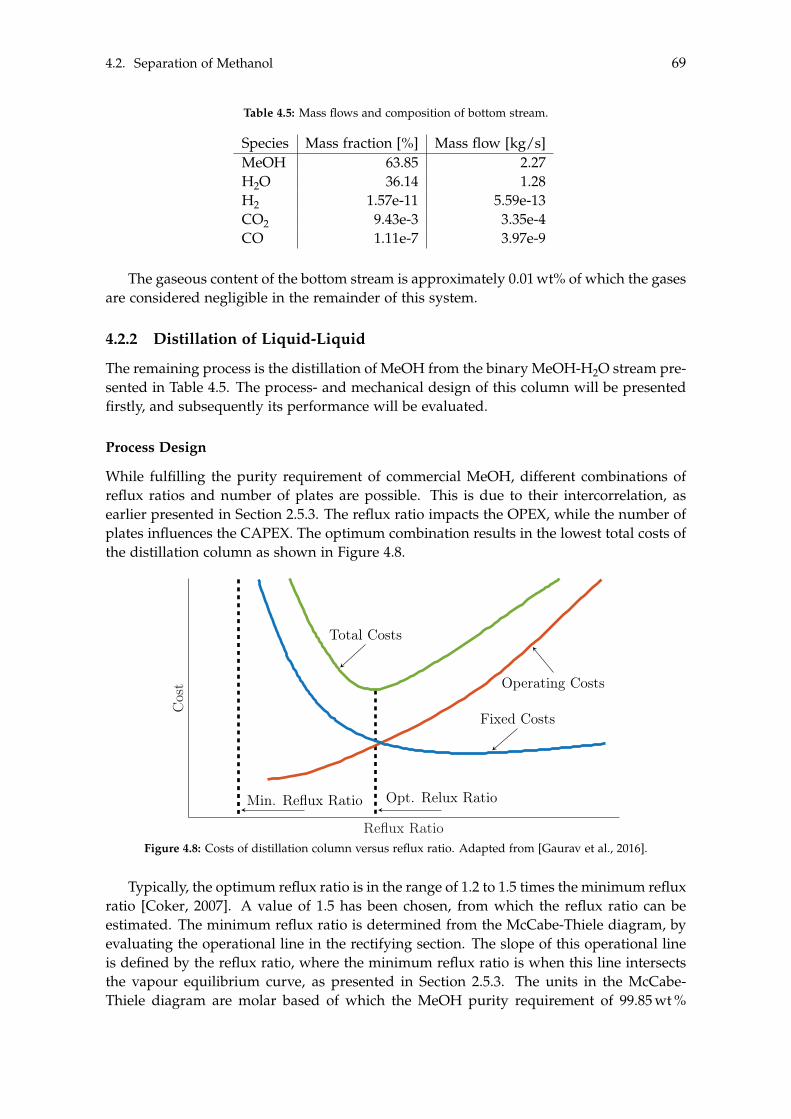
4.2. Separation of Methanol 69
Table 4.5: Mass flows and composition of bottom stream.
Species Mass fraction [%] Mass flow [kg/s]MeOH 63.85 2.27H2O 36.14 1.28H2 1.57e-11 5.59e-13CO2 9.43e-3 3.35e-4CO 1.11e-7 3.97e-9
The gaseous content of the bottom stream is approximately 0.01 wt% of which the gasesare considered negligible in the remainder of this system.
4.2.2 Distillation of Liquid-Liquid
The remaining process is the distillation of MeOH from the binary MeOH-H2O stream pre-sented in Table 4.5. The process- and mechanical design of this column will be presentedfirstly, and subsequently its performance will be evaluated.
Process Design
While fulfilling the purity requirement of commercial MeOH, different combinations ofreflux ratios and number of plates are possible. This is due to their intercorrelation, asearlier presented in Section 2.5.3. The reflux ratio impacts the OPEX, while the number ofplates influences the CAPEX. The optimum combination results in the lowest total costs ofthe distillation column as shown in Figure 4.8.
Min. Reflux Ratio Opt. Relux Ratio
Fixed Costs
Operating Costs
Total Costs
Reflux Ratio
Cos
t
Figure 4.8: Costs of distillation column versus reflux ratio. Adapted from [Gaurav et al., 2016].
Typically, the optimum reflux ratio is in the range of 1.2 to 1.5 times the minimum refluxratio [Coker, 2007]. A value of 1.5 has been chosen, from which the reflux ratio can beestimated. The minimum reflux ratio is determined from the McCabe-Thiele diagram, byevaluating the operational line in the rectifying section. The slope of this operational lineis defined by the reflux ratio, where the minimum reflux ratio is when this line intersectsthe vapour equilibrium curve, as presented in Section 2.5.3. The units in the McCabe-Thiele diagram are molar based of which the MeOH purity requirement of 99.85 wt %
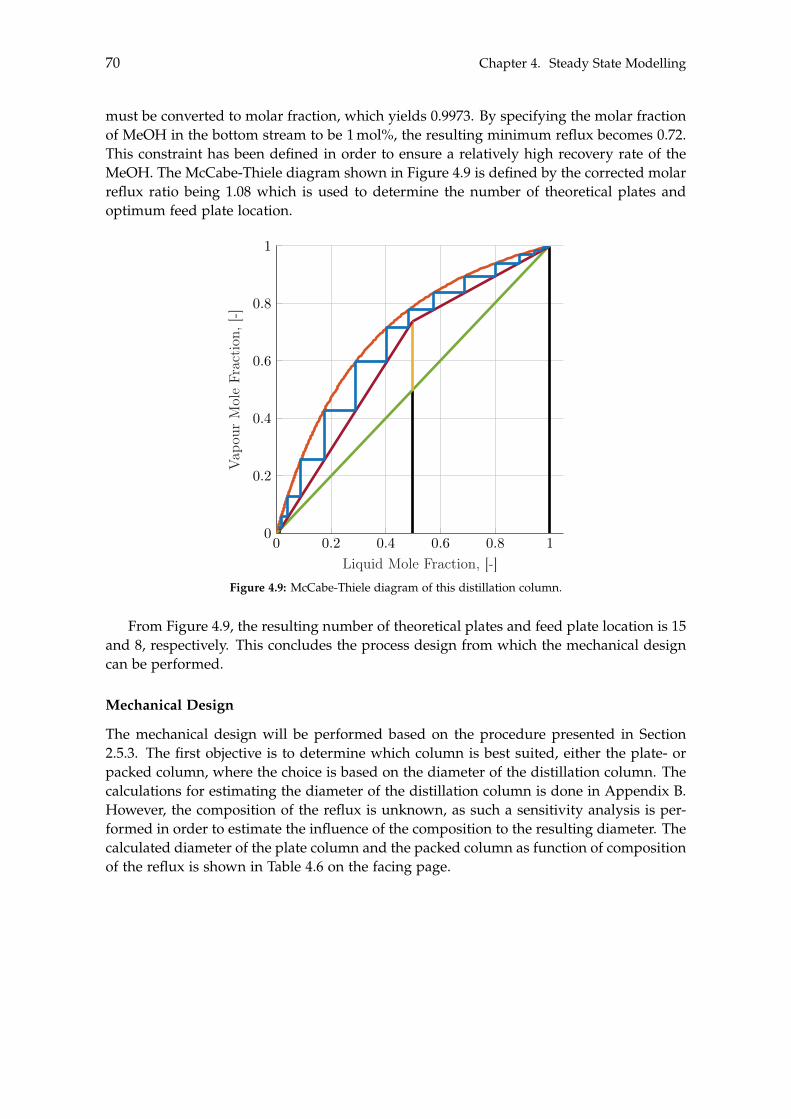
70 Chapter 4. Steady State Modelling
must be converted to molar fraction, which yields 0.9973. By specifying the molar fractionof MeOH in the bottom stream to be 1 mol%, the resulting minimum reflux becomes 0.72.This constraint has been defined in order to ensure a relatively high recovery rate of theMeOH. The McCabe-Thiele diagram shown in Figure 4.9 is defined by the corrected molarreflux ratio being 1.08 which is used to determine the number of theoretical plates andoptimum feed plate location.
0 0.2 0.4 0.6 0.8 10
0.2
0.4
0.6
0.8
1
Liquid Mole Fraction, [-]
Vap
our
Mol
eFr
acti
on,[
-]
Figure 4.9: McCabe-Thiele diagram of this distillation column.
From Figure 4.9, the resulting number of theoretical plates and feed plate location is 15and 8, respectively. This concludes the process design from which the mechanical designcan be performed.
Mechanical Design
The mechanical design will be performed based on the procedure presented in Section2.5.3. The first objective is to determine which column is best suited, either the plate- orpacked column, where the choice is based on the diameter of the distillation column. Thecalculations for estimating the diameter of the distillation column is done in Appendix B.However, the composition of the reflux is unknown, as such a sensitivity analysis is per-formed in order to estimate the influence of the composition to the resulting diameter. Thecalculated diameter of the plate column and the packed column as function of compositionof the reflux is shown in Table 4.6 on the facing page.
4.2. Separation of Methanol 71
Table 4.6: Column diameter as function of composition.
MeOH compositionof reflux [wt%] Plate column [m] Packed column [m]
0 1.30 1.4510 1.51 1.4820 1.54 1.5130 1.57 1.5340 1.60 1.5550 1.42 1.5860 1.45 1.6070 1.50 1.6380 1.55 1.6690 1.60 1.70100 1.67 1.74
From Table 4.6 it is evident that the column diameter is within the range of 1.30 m to1.74 m, where it also is shown that the diameter of the column increases as function ofthe MeOH composition of the reflux. In general the resulting diameter for the packedcolumn is larger than for plate column, except in the MeOH composition range of 10 wt %to 40 wt %, due to the influence of foaming occurring in a plate column. The foamingwas previously assumed to be present within this composition range. Since the calculatedcolumn diameter is larger than 1 m, it is concluded that the plate column is best suited fordistilling the MeOH-H2O solution. It is expected that the reflux will consist of insignificantamounts of H2O due to the purity requirement of MeOH being 99.85 wt % of which thediameter of 1.67 m is chosen.
The height of the plate column is determined by Eq. 4.2
L = plate spacing · N + 1.22 + 3.05 (4.2)
where N is the number of plates and the constants are due to practical aspects as presentedin Section 2.5.3. By defining the number of plates to be 15 and a plate spacing of 0.60 m,the height of the plate column becomes 13.27 m. This concludes the both the process-and mechanical design of the column of which it will be implemented in Aspen Plus todetermine its performance.
Model
The distillation column is modelled according to the presented design specifications. Ad-ditionally, the distillate rate is specified of which Aspen Plus determines the correspond-ing condenser- and reboiler duty. The distillate rate is specified according to Table 4.5 onpage 69, where the distillate rate is set to equal the mass flow of MeOH. The results of thisdistillation column is shown in Table 4.7.
MeOHD MeOHB H2OD H2OB MeOHD MeOHB Recoveryhkgs
i[wt%]
2.24 0.03 0.03 1.26 98.76 2.18 98.77
Table 4.7: Mass flow and composition outputs from the distillation column. The distillate is denoted D,whereas the bottom is denoted B. The mass fraction of the input is 63.86 wt % and 36.14 wt % of MeOH andH2O, respectively.
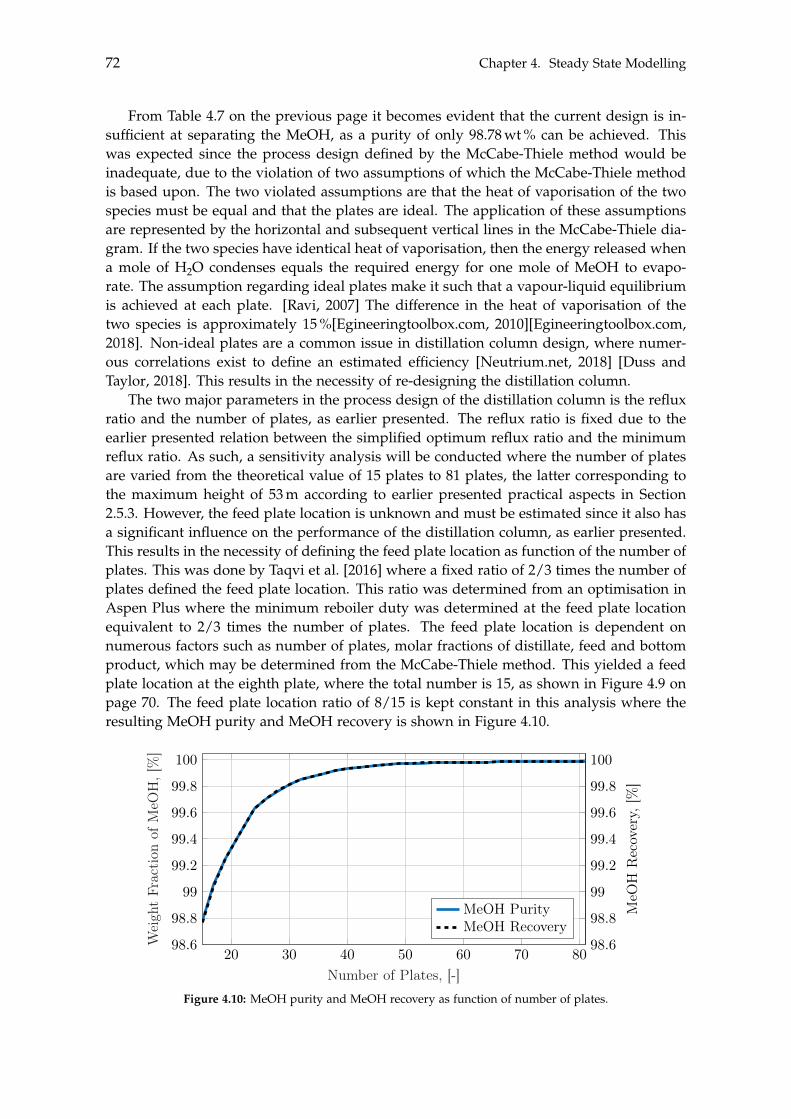
72 Chapter 4. Steady State Modelling
From Table 4.7 on the previous page it becomes evident that the current design is in-sufficient at separating the MeOH, as a purity of only 98.78 wt % can be achieved. Thiswas expected since the process design defined by the McCabe-Thiele method would beinadequate, due to the violation of two assumptions of which the McCabe-Thiele methodis based upon. The two violated assumptions are that the heat of vaporisation of the twospecies must be equal and that the plates are ideal. The application of these assumptionsare represented by the horizontal and subsequent vertical lines in the McCabe-Thiele dia-gram. If the two species have identical heat of vaporisation, then the energy released whena mole of H2O condenses equals the required energy for one mole of MeOH to evapo-rate. The assumption regarding ideal plates make it such that a vapour-liquid equilibriumis achieved at each plate. [Ravi, 2007] The difference in the heat of vaporisation of thetwo species is approximately 15 %[Egineeringtoolbox.com, 2010][Egineeringtoolbox.com,2018]. Non-ideal plates are a common issue in distillation column design, where numer-ous correlations exist to define an estimated efficiency [Neutrium.net, 2018] [Duss andTaylor, 2018]. This results in the necessity of re-designing the distillation column.
The two major parameters in the process design of the distillation column is the refluxratio and the number of plates, as earlier presented. The reflux ratio is fixed due to theearlier presented relation between the simplified optimum reflux ratio and the minimumreflux ratio. As such, a sensitivity analysis will be conducted where the number of platesare varied from the theoretical value of 15 plates to 81 plates, the latter corresponding tothe maximum height of 53 m according to earlier presented practical aspects in Section2.5.3. However, the feed plate location is unknown and must be estimated since it also hasa significant influence on the performance of the distillation column, as earlier presented.This results in the necessity of defining the feed plate location as function of the number ofplates. This was done by Taqvi et al. [2016] where a fixed ratio of 2/3 times the number ofplates defined the feed plate location. This ratio was determined from an optimisation inAspen Plus where the minimum reboiler duty was determined at the feed plate locationequivalent to 2/3 times the number of plates. The feed plate location is dependent onnumerous factors such as number of plates, molar fractions of distillate, feed and bottomproduct, which may be determined from the McCabe-Thiele method. This yielded a feedplate location at the eighth plate, where the total number is 15, as shown in Figure 4.9 onpage 70. The feed plate location ratio of 8/15 is kept constant in this analysis where theresulting MeOH purity and MeOH recovery is shown in Figure 4.10.
20 30 40 50 60 70 8098.6
98.8
99
99.2
99.4
99.6
99.8
100
Number of Plates, [-]
Wei
ght
Frac
tion
ofM
eOH
,[%
]
98.6
98.8
99
99.2
99.4
99.6
99.8
100
MeO
HR
ecov
ery,
[%]
MeOH PurityMeOH Recovery
Figure 4.10: MeOH purity and MeOH recovery as function of number of plates.
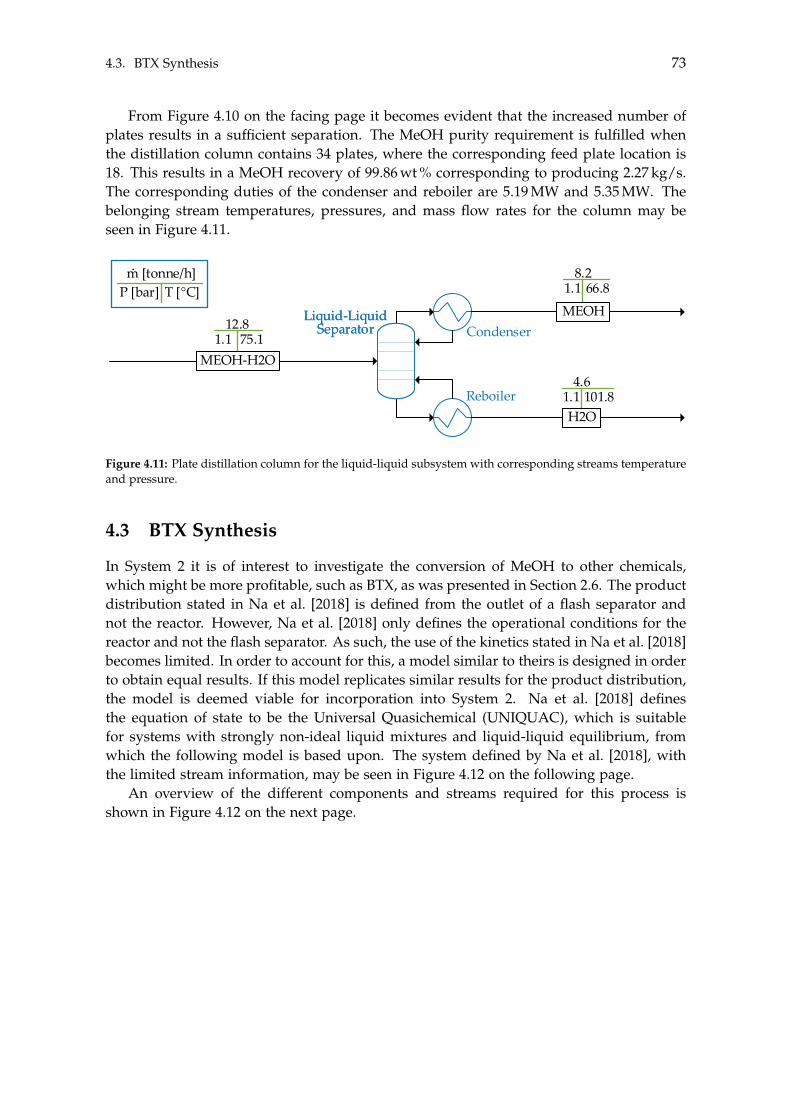
4.3. BTX Synthesis 73
From Figure 4.10 on the facing page it becomes evident that the increased number ofplates results in a sufficient separation. The MeOH purity requirement is fulfilled whenthe distillation column contains 34 plates, where the corresponding feed plate location is18. This results in a MeOH recovery of 99.86 wt % corresponding to producing 2.27 kg/s.The corresponding duties of the condenser and reboiler are 5.19 MW and 5.35 MW. Thebelonging stream temperatures, pressures, and mass flow rates for the column may beseen in Figure 4.11.
Mixer ReactorReactor Flash
S2
Mixer
hej
Absorber/stripper/packed column
BTX&MeOH-Dist/TrayBTX&MeOH-Dist/TrayValve
Comp
Pump Heat exchanger
Cooler
Fluid/liquid separator
Tank
Waste
8.266.81.1
Condenser
Reboiler
T [°C]m [tonne/h]
P [bar]
.
MEOH
4.6101.81.1
H2O
Liquid-LiquidSeparator
Liquid-LiquidSeparator12.8
75.11.1MEOH-H2O
Figure 4.11: Plate distillation column for the liquid-liquid subsystem with corresponding streams temperatureand pressure.
4.3 BTX Synthesis
In System 2 it is of interest to investigate the conversion of MeOH to other chemicals,which might be more profitable, such as BTX, as was presented in Section 2.6. The productdistribution stated in Na et al. [2018] is defined from the outlet of a flash separator andnot the reactor. However, Na et al. [2018] only defines the operational conditions for thereactor and not the flash separator. As such, the use of the kinetics stated in Na et al. [2018]becomes limited. In order to account for this, a model similar to theirs is designed in orderto obtain equal results. If this model replicates similar results for the product distribution,the model is deemed viable for incorporation into System 2. Na et al. [2018] definesthe equation of state to be the Universal Quasichemical (UNIQUAC), which is suitablefor systems with strongly non-ideal liquid mixtures and liquid-liquid equilibrium, fromwhich the following model is based upon. The system defined by Na et al. [2018], withthe limited stream information, may be seen in Figure 4.12 on the following page.
An overview of the different components and streams required for this process isshown in Figure 4.12 on the next page.
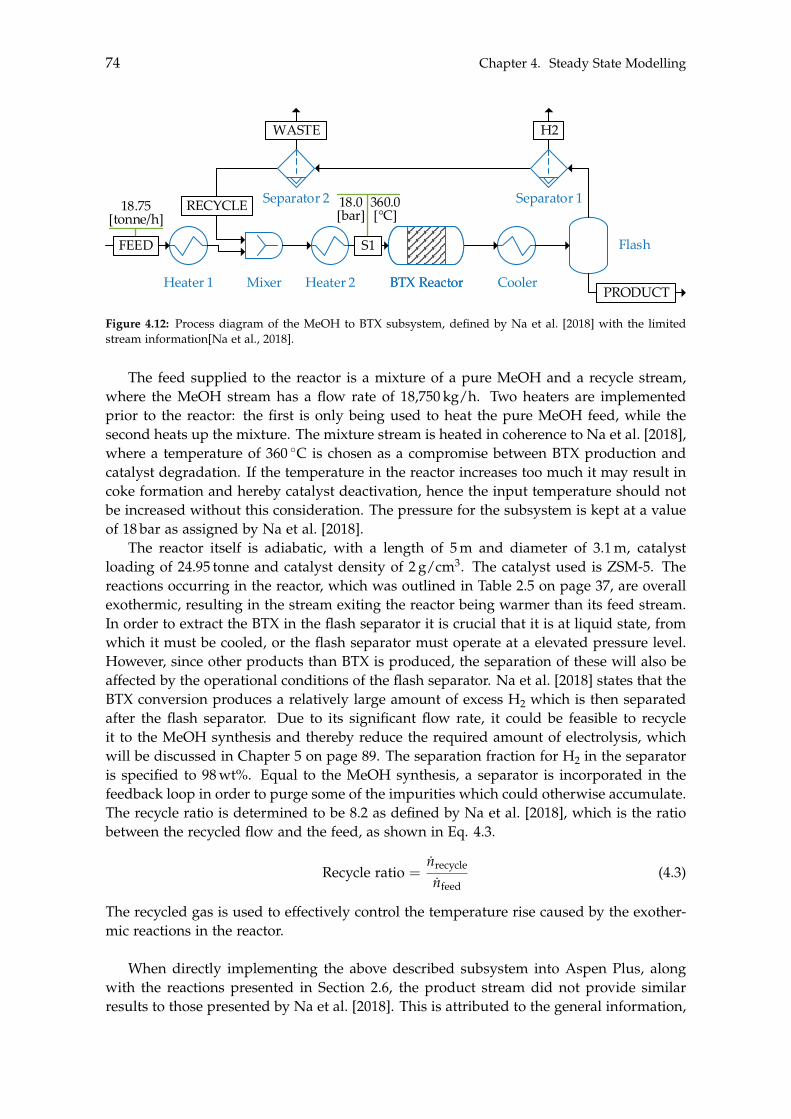
74 Chapter 4. Steady State Modelling
Mixer ReactorReactor Flash
S2
Mixer
hej
Absorber/stripper/packed column
BTX&MeOH-Dist/TrayBTX&MeOH-Dist/TrayValve
Comp
Pump Heat exchanger
Cooler
Fluid/liquid separator
Tank
CompFlash
Column 1Column 1 Column 2Column 2 Column 3Column 3 Column 4Column 4
BTX synthesis product stream
H2 CO CH4C2H4
C2H6CO2C3H6C3H8
C4H10C5H12C6H14CH3OH
C6H6H2O
C7H8C8H10 C9H12
C10H14
Heater 1 Mixer Heater 2 BTX ReactorBTX Reactor Cooler
Flash
Waste
WASTE
RECYCLE
FEED
PRODUCT
H2
Separator 2 Separator 118.75 [tonne/h]
360.0 [°C]
18.0 [bar]
S1
Figure 4.12: Process diagram of the MeOH to BTX subsystem, defined by Na et al. [2018] with the limitedstream information[Na et al., 2018].
The feed supplied to the reactor is a mixture of a pure MeOH and a recycle stream,where the MeOH stream has a flow rate of 18,750 kg/h. Two heaters are implementedprior to the reactor: the first is only being used to heat the pure MeOH feed, while thesecond heats up the mixture. The mixture stream is heated in coherence to Na et al. [2018],where a temperature of 360 �C is chosen as a compromise between BTX production andcatalyst degradation. If the temperature in the reactor increases too much it may result incoke formation and hereby catalyst deactivation, hence the input temperature should notbe increased without this consideration. The pressure for the subsystem is kept at a valueof 18 bar as assigned by Na et al. [2018].
The reactor itself is adiabatic, with a length of 5 m and diameter of 3.1 m, catalystloading of 24.95 tonne and catalyst density of 2 g/cm3. The catalyst used is ZSM-5. Thereactions occurring in the reactor, which was outlined in Table 2.5 on page 37, are overallexothermic, resulting in the stream exiting the reactor being warmer than its feed stream.In order to extract the BTX in the flash separator it is crucial that it is at liquid state, fromwhich it must be cooled, or the flash separator must operate at a elevated pressure level.However, since other products than BTX is produced, the separation of these will also beaffected by the operational conditions of the flash separator. Na et al. [2018] states that theBTX conversion produces a relatively large amount of excess H2 which is then separatedafter the flash separator. Due to its significant flow rate, it could be feasible to recycleit to the MeOH synthesis and thereby reduce the required amount of electrolysis, whichwill be discussed in Chapter 5 on page 89. The separation fraction for H2 in the separatoris specified to 98 wt%. Equal to the MeOH synthesis, a separator is incorporated in thefeedback loop in order to purge some of the impurities which could otherwise accumulate.The recycle ratio is determined to be 8.2 as defined by Na et al. [2018], which is the ratiobetween the recycled flow and the feed, as shown in Eq. 4.3.
Recycle ratio =nrecycle
nfeed(4.3)
The recycled gas is used to effectively control the temperature rise caused by the exother-mic reactions in the reactor.
When directly implementing the above described subsystem into Aspen Plus, alongwith the reactions presented in Section 2.6, the product stream did not provide similarresults to those presented by Na et al. [2018]. This is attributed to the general information,
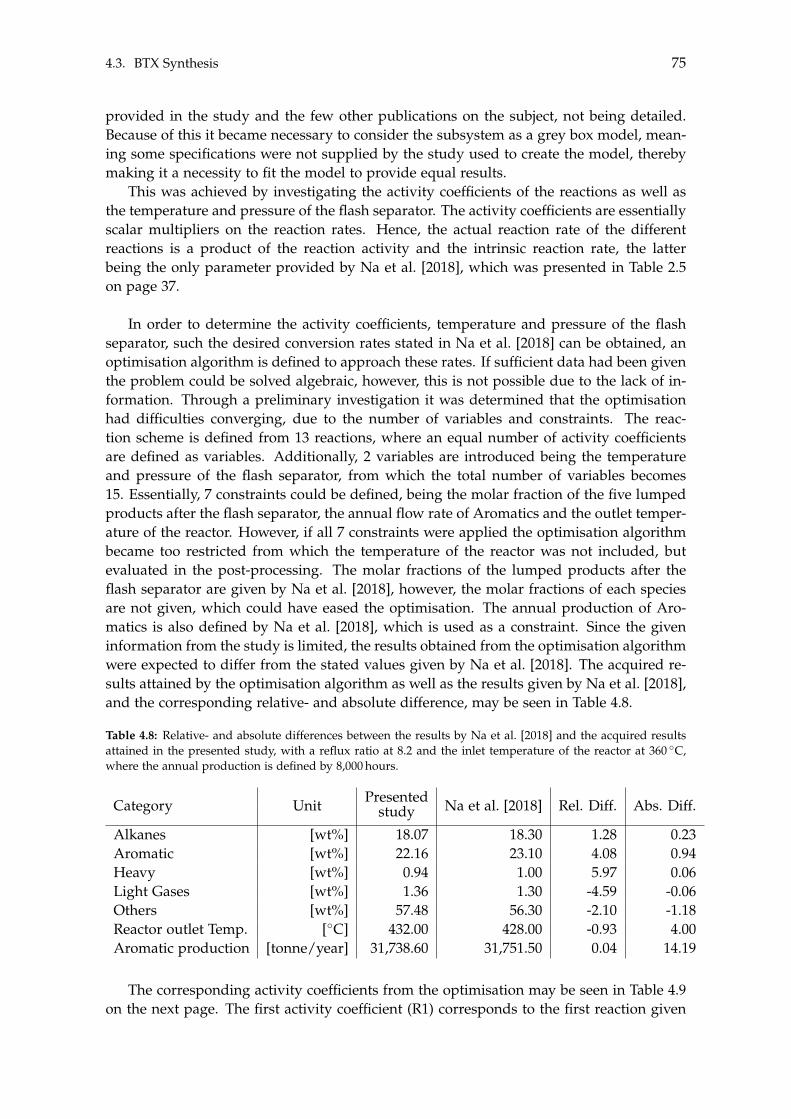
4.3. BTX Synthesis 75
provided in the study and the few other publications on the subject, not being detailed.Because of this it became necessary to consider the subsystem as a grey box model, mean-ing some specifications were not supplied by the study used to create the model, therebymaking it a necessity to fit the model to provide equal results.
This was achieved by investigating the activity coefficients of the reactions as well asthe temperature and pressure of the flash separator. The activity coefficients are essentiallyscalar multipliers on the reaction rates. Hence, the actual reaction rate of the differentreactions is a product of the reaction activity and the intrinsic reaction rate, the latterbeing the only parameter provided by Na et al. [2018], which was presented in Table 2.5on page 37.
In order to determine the activity coefficients, temperature and pressure of the flashseparator, such the desired conversion rates stated in Na et al. [2018] can be obtained, anoptimisation algorithm is defined to approach these rates. If sufficient data had been giventhe problem could be solved algebraic, however, this is not possible due to the lack of in-formation. Through a preliminary investigation it was determined that the optimisationhad difficulties converging, due to the number of variables and constraints. The reac-tion scheme is defined from 13 reactions, where an equal number of activity coefficientsare defined as variables. Additionally, 2 variables are introduced being the temperatureand pressure of the flash separator, from which the total number of variables becomes15. Essentially, 7 constraints could be defined, being the molar fraction of the five lumpedproducts after the flash separator, the annual flow rate of Aromatics and the outlet temper-ature of the reactor. However, if all 7 constraints were applied the optimisation algorithmbecame too restricted from which the temperature of the reactor was not included, butevaluated in the post-processing. The molar fractions of the lumped products after theflash separator are given by Na et al. [2018], however, the molar fractions of each speciesare not given, which could have eased the optimisation. The annual production of Aro-matics is also defined by Na et al. [2018], which is used as a constraint. Since the giveninformation from the study is limited, the results obtained from the optimisation algorithmwere expected to differ from the stated values given by Na et al. [2018]. The acquired re-sults attained by the optimisation algorithm as well as the results given by Na et al. [2018],and the corresponding relative- and absolute difference, may be seen in Table 4.8.
Table 4.8: Relative- and absolute differences between the results by Na et al. [2018] and the acquired resultsattained in the presented study, with a reflux ratio at 8.2 and the inlet temperature of the reactor at 360 �C,where the annual production is defined by 8,000 hours.
Category Unit Presentedstudy Na et al. [2018] Rel. Diff. Abs. Diff.
Alkanes [wt%] 18.07 18.30 1.28 0.23Aromatic [wt%] 22.16 23.10 4.08 0.94Heavy [wt%] 0.94 1.00 5.97 0.06Light Gases [wt%] 1.36 1.30 -4.59 -0.06Others [wt%] 57.48 56.30 -2.10 -1.18Reactor outlet Temp. [�C] 432.00 428.00 -0.93 4.00Aromatic production [tonne/year] 31,738.60 31,751.50 0.04 14.19
The corresponding activity coefficients from the optimisation may be seen in Table 4.9on the next page. The first activity coefficient (R1) corresponds to the first reaction given
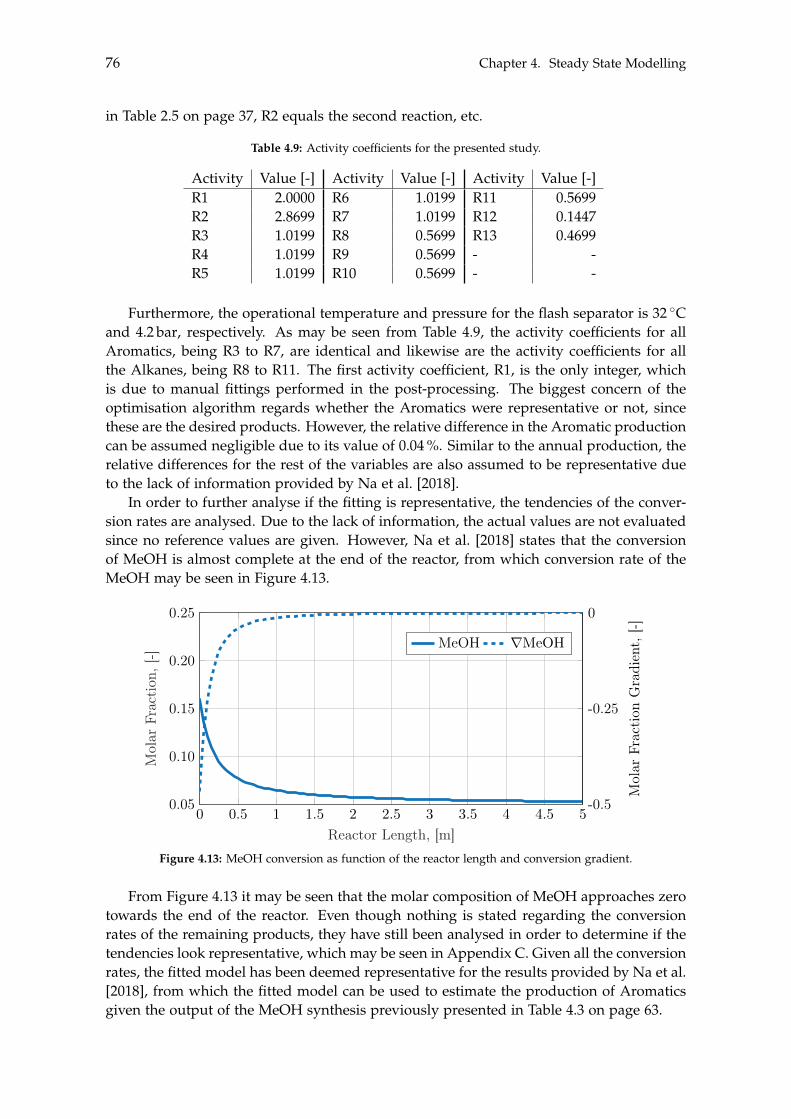
76 Chapter 4. Steady State Modelling
in Table 2.5 on page 37, R2 equals the second reaction, etc.
Table 4.9: Activity coefficients for the presented study.
Activity Value [-] Activity Value [-] Activity Value [-]R1 2.0000 R6 1.0199 R11 0.5699R2 2.8699 R7 1.0199 R12 0.1447R3 1.0199 R8 0.5699 R13 0.4699R4 1.0199 R9 0.5699 - -R5 1.0199 R10 0.5699 - -
Furthermore, the operational temperature and pressure for the flash separator is 32 �Cand 4.2 bar, respectively. As may be seen from Table 4.9, the activity coefficients for allAromatics, being R3 to R7, are identical and likewise are the activity coefficients for allthe Alkanes, being R8 to R11. The first activity coefficient, R1, is the only integer, whichis due to manual fittings performed in the post-processing. The biggest concern of theoptimisation algorithm regards whether the Aromatics were representative or not, sincethese are the desired products. However, the relative difference in the Aromatic productioncan be assumed negligible due to its value of 0.04 %. Similar to the annual production, therelative differences for the rest of the variables are also assumed to be representative dueto the lack of information provided by Na et al. [2018].
In order to further analyse if the fitting is representative, the tendencies of the conver-sion rates are analysed. Due to the lack of information, the actual values are not evaluatedsince no reference values are given. However, Na et al. [2018] states that the conversionof MeOH is almost complete at the end of the reactor, from which conversion rate of theMeOH may be seen in Figure 4.13.
0 0.5 1 1.5 2 2.5 3 3.5 4 4.5 50.05
0.10
0.15
0.20
0.25
Reactor Length, [m]
Mol
arFr
acti
on,[
-]
-0.5
-0.25
0M
olar
Frac
tion
Gra
dien
t,[-]
MeOH rMeOH
Figure 4.13: MeOH conversion as function of the reactor length and conversion gradient.
From Figure 4.13 it may be seen that the molar composition of MeOH approaches zerotowards the end of the reactor. Even though nothing is stated regarding the conversionrates of the remaining products, they have still been analysed in order to determine if thetendencies look representative, which may be seen in Appendix C. Given all the conversionrates, the fitted model has been deemed representative for the results provided by Na et al.[2018], from which the fitted model can be used to estimate the production of Aromaticsgiven the output of the MeOH synthesis previously presented in Table 4.3 on page 63.
4.3. BTX Synthesis 77
4.3.1 Feed Composition
The fitted model is implemented into the subsystem of the presented study, of which thefeed is based on the output of the MeOH synthesis subsystem. The model is originallybased on an input stream of pure MeOH, whereas the input in this subsystem consistsof: MeOH, H2O, CO, CO2 and H2. As earlier presented in Chapter 2.6 there should be noinfluence of H2O on the conversion of MeOH to Aromatics, however, the H2O could stillbenefit the overall subsystem. In the study done by Na et al. [2018], they utilise a feedbackloop in order to control the temperature of the reactor due to the overall reactions beingexothermic. However, since the input for this subsystem also contains H2O, which doesnot react, it is expected to absorb some of the released heat due to its relatively high heatcapacity. The feedback ratio is as previously stated 8.2, meaning the recycled stream is 8.2larger than the input of pure MeOH. If this ratio would be reduced due to the additionalcontent of H2O it could essentially reduce the size of the subsystem.
Secondly, the input stream also consists of CO and CO2 which could affect the reac-tions. However, the kinetics defined by Na et al. [2018] do not include any reactions inwhich these gases are reactants, even though they constitute a relatively large molar frac-tion throughout the reactor. This leads to the hypothesis that the reactions would havebeen included in the kinetic data, if they were occurring. Lastly, H2 is also present in thefeed stream which is used as a reactant in the reactions regarding Alkanes, and it becomesa by-product for the Aromatics reactions. However, as previously discussed, there is arelatively large amount of excess H2 in the subsystem, from which the additional contentof H2 might not affect the reactions.
78 Chapter 4. Steady State Modelling
Even though a change in the composition of the feed does not affect the kinetics, itshould be investigated whether some of the species in the feed must be removed prior tothe reactor for other reasons. It is assumed that the H2O should not to be removed beforethe reactor, since it as mentioned can be used to cool the reactor and thereby reduce therecycle ratio. Contrary, CO, CO2 and H2 may affect the product flow rate compositionnegatively. This may occur since they are more volatile compared to the Alkanes, as suchthese could be recycled instead of the Alkanes. If the amount of recycled Alkanes isreduced due to this, the total flow rate of Alkanes could be reduced. In order to analyseif this hypothesis is valid, two simulations will be conducted, one with- and one withoutCO, CO2 and H2 in the feed stream.
Prior to this implementation of the different feed streams, two adjustments have beenmade to the model. Firstly, the recycle ratio has been adjusted for each feed stream,in order to maintain the previously defined outlet temperature of 432 �C. Secondly, thevolume of the reactor is scaled to match the flow rate defined by the MeOH synthesis.In order to apply scaling, the ratio between the diameter and length of the reactor iskept constant. This has been done in order to maintain a space velocity relatively closeto the initial value given from the previous model done with only MeOH as the feed.When scaling the reactor, the total catalyst mass must be taken into account, since theconversion rate unit is defined as kmol/(kg · h) where the mass represents the total massof the catalyst. If the reactor volume is reduced, the total mass of the catalyst must also bereduced by the same factor.
Given these considerations three simulations have been conducted in order to inves-tigate the composition of the lumped products in the product stream, as well as theirindividual mass flow rates. The first simulation, denoted S1 in Table 4.10 on the nextpage, is the reference results defined by a feed stream only consisting of MeOH, and aninput feed flow rate of 18,750 kg/h, which is the rate given in Na et al. [2018]. The secondsimulation, denoted S2 in Table 4.10, is defined with a feed- flow rate and compositionequal to the exiting flow of the MeOH synthesis, where MeOH, H2, H2O, CO2 and CO arepresent. The third simulation, denoted S3 in Table 4.10, is defined with a feed- flow rateand composition equal to the exiting flow after the degassing process has been applied,from which only MeOH and H2O are present as presented in Table 4.5 on page 69.
The mass flow rates of each simulation, denoted S1m, S2m and S3m, respectively, arealso listed. The mass flow rates of the Alkanes, Aromatics and Heavy for S2m and S3mhave been scaled relative to their individual difference to the amount of MeOH enteringin the feed stream, which is denoted S2m* and S3m*. This has been done in order to makethem comparable to the reference mass flow rate, S1m. The amount of MeOH in the feedstream for S2 and S3 are approximately 2.3 times less than the reference mass flow rate inS1. Lastly, the ratio between scaled mass flow rates of S2m* and S3m* relative to S1 havebeen analysed in order to investigate the influence of the gases in the feed stream.
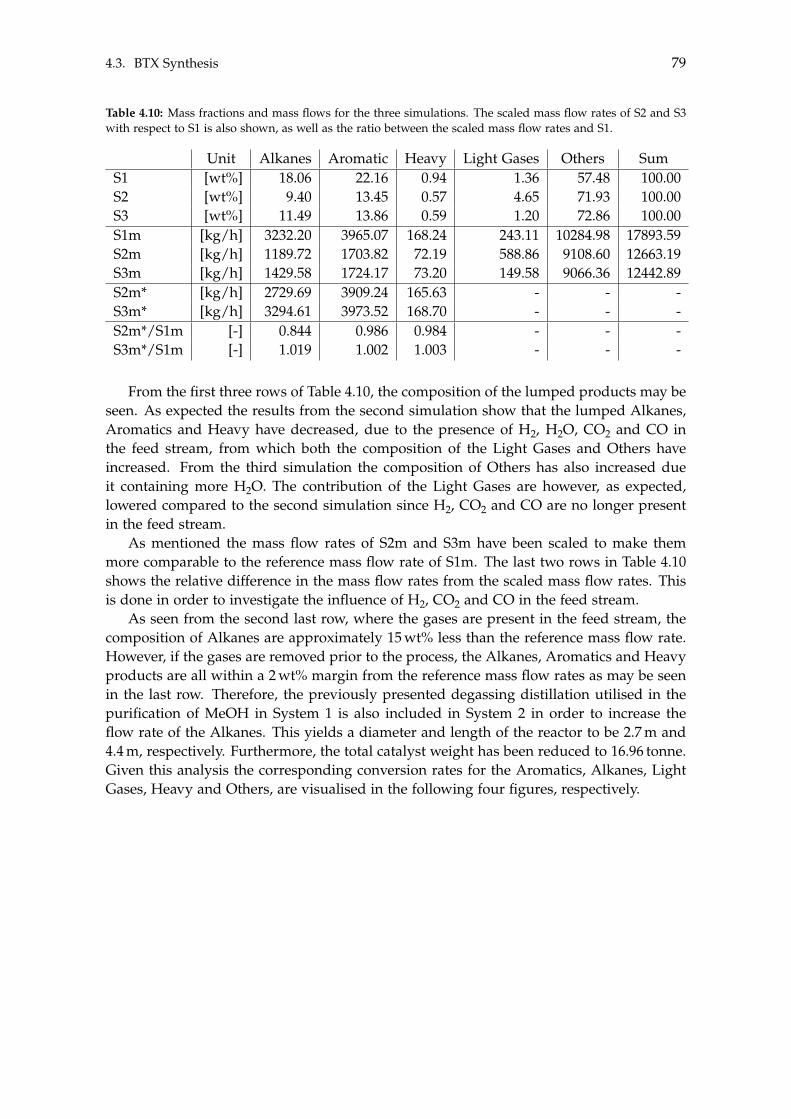
4.3. BTX Synthesis 79
Table 4.10: Mass fractions and mass flows for the three simulations. The scaled mass flow rates of S2 and S3with respect to S1 is also shown, as well as the ratio between the scaled mass flow rates and S1.
Unit Alkanes Aromatic Heavy Light Gases Others SumS1 [wt%] 18.06 22.16 0.94 1.36 57.48 100.00S2 [wt%] 9.40 13.45 0.57 4.65 71.93 100.00S3 [wt%] 11.49 13.86 0.59 1.20 72.86 100.00S1m [kg/h] 3232.20 3965.07 168.24 243.11 10284.98 17893.59S2m [kg/h] 1189.72 1703.82 72.19 588.86 9108.60 12663.19S3m [kg/h] 1429.58 1724.17 73.20 149.58 9066.36 12442.89S2m* [kg/h] 2729.69 3909.24 165.63 - - -S3m* [kg/h] 3294.61 3973.52 168.70 - - -S2m*/S1m [-] 0.844 0.986 0.984 - - -S3m*/S1m [-] 1.019 1.002 1.003 - - -
From the first three rows of Table 4.10, the composition of the lumped products may beseen. As expected the results from the second simulation show that the lumped Alkanes,Aromatics and Heavy have decreased, due to the presence of H2, H2O, CO2 and CO inthe feed stream, from which both the composition of the Light Gases and Others haveincreased. From the third simulation the composition of Others has also increased dueit containing more H2O. The contribution of the Light Gases are however, as expected,lowered compared to the second simulation since H2, CO2 and CO are no longer presentin the feed stream.
As mentioned the mass flow rates of S2m and S3m have been scaled to make themmore comparable to the reference mass flow rate of S1m. The last two rows in Table 4.10shows the relative difference in the mass flow rates from the scaled mass flow rates. Thisis done in order to investigate the influence of H2, CO2 and CO in the feed stream.
As seen from the second last row, where the gases are present in the feed stream, thecomposition of Alkanes are approximately 15 wt% less than the reference mass flow rate.However, if the gases are removed prior to the process, the Alkanes, Aromatics and Heavyproducts are all within a 2 wt% margin from the reference mass flow rates as may be seenin the last row. Therefore, the previously presented degassing distillation utilised in thepurification of MeOH in System 1 is also included in System 2 in order to increase theflow rate of the Alkanes. This yields a diameter and length of the reactor to be 2.7 m and4.4 m, respectively. Furthermore, the total catalyst weight has been reduced to 16.96 tonne.Given this analysis the corresponding conversion rates for the Aromatics, Alkanes, LightGases, Heavy and Others, are visualised in the following four figures, respectively.
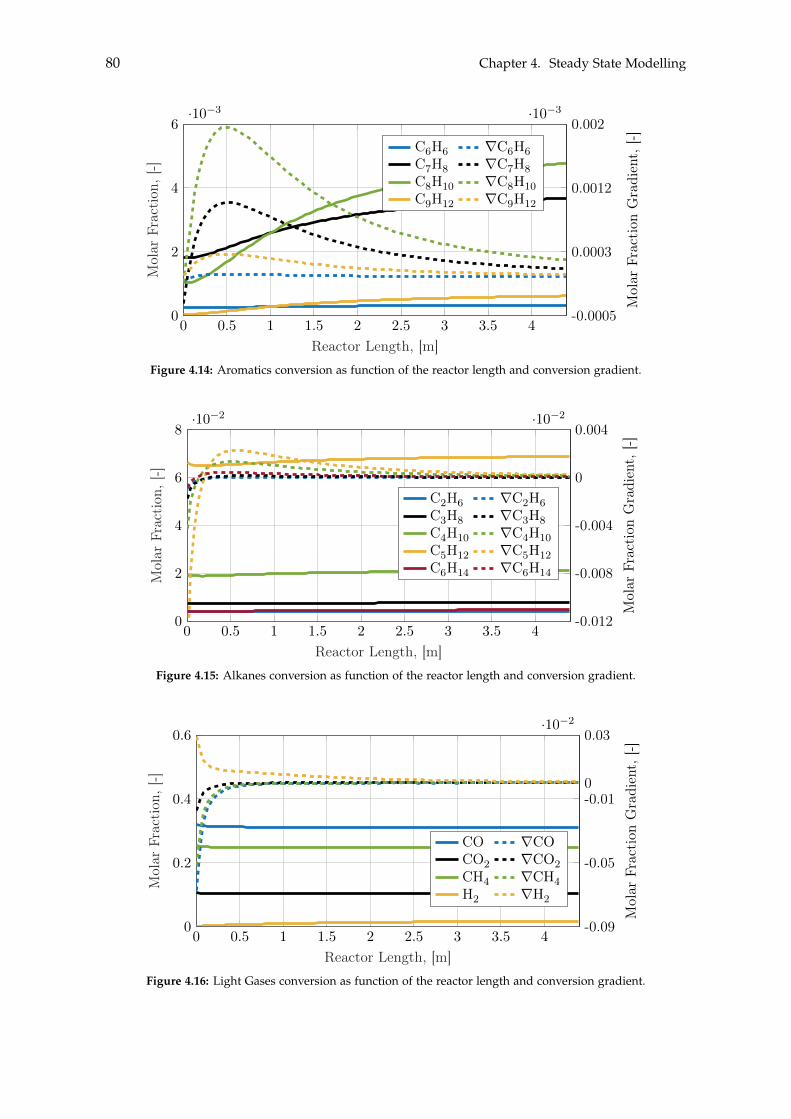
80 Chapter 4. Steady State Modelling
0 0.5 1 1.5 2 2.5 3 3.5 40
2
4
6·10�3
Reactor Length, [m]
Mol
arFr
acti
on,[
-]
-0.0005
0.0003
0.0012
0.002·10�3
Mol
arFr
acti
onG
radi
ent,
[-]C6H6 rC6H6C7H8 rC7H8C8H10 rC8H10C9H12 rC9H12
Figure 4.14: Aromatics conversion as function of the reactor length and conversion gradient.
0 0.5 1 1.5 2 2.5 3 3.5 40
2
4
6
8·10�2
Reactor Length, [m]
Mol
arFr
acti
on,[
-]
-0.012
-0.008
-0.004
0
0.004·10�2
Mol
arFr
acti
onG
radi
ent,
[-]
C2H6 rC2H6C3H8 rC3H8C4H10 rC4H10C5H12 rC5H12C6H14 rC6H14
Figure 4.15: Alkanes conversion as function of the reactor length and conversion gradient.
0 0.5 1 1.5 2 2.5 3 3.5 40
0.2
0.4
0.6
Reactor Length, [m]
Mol
arFr
acti
on,[
-]
-0.09
-0.05
-0.010
0.03·10�2
Mol
arFr
acti
onG
radi
ent,
[-]
CO rCOCO2 rCO2CH4 rCH4H2 rH2
Figure 4.16: Light Gases conversion as function of the reactor length and conversion gradient.
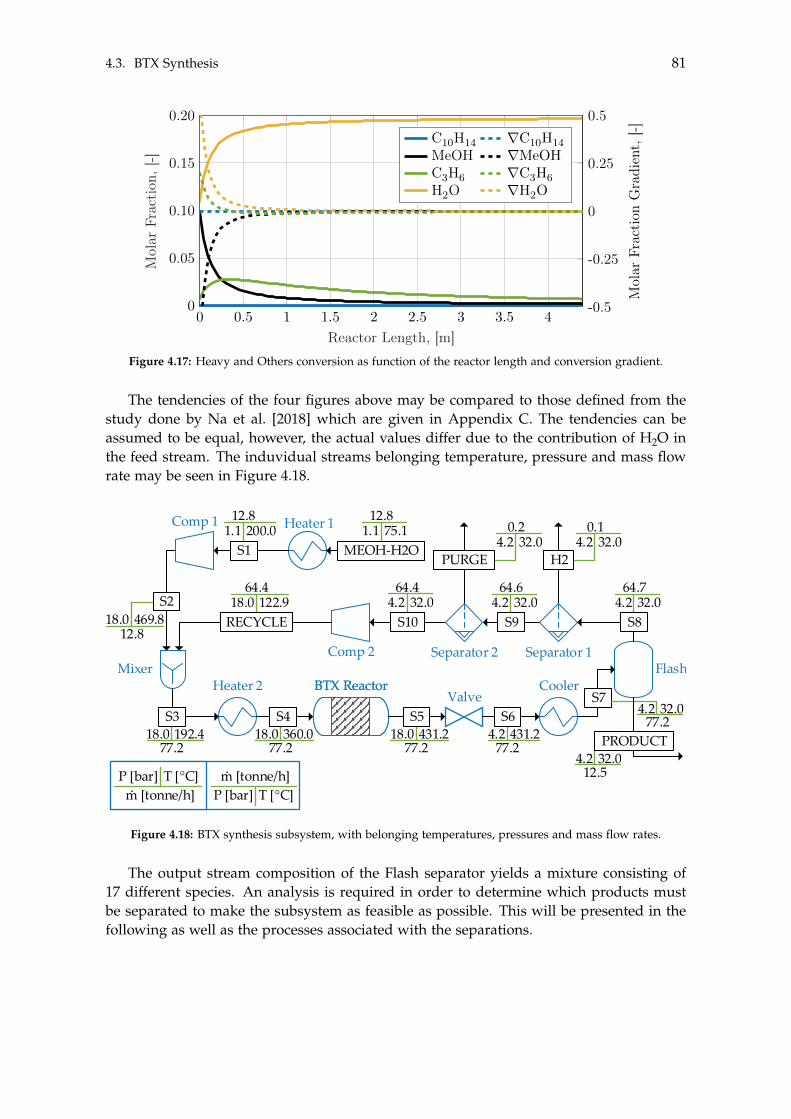
4.3. BTX Synthesis 81
0 0.5 1 1.5 2 2.5 3 3.5 40
0.05
0.10
0.15
0.20
Reactor Length, [m]
Mol
arFr
acti
on,[
-]
-0.5
-0.25
0
0.25
0.5
Mol
arFr
acti
onG
radi
ent,
[-]C10H14 rC10H14MeOH rMeOHC3H6 rC3H6H2O rH2O
Figure 4.17: Heavy and Others conversion as function of the reactor length and conversion gradient.
The tendencies of the four figures above may be compared to those defined from thestudy done by Na et al. [2018] which are given in Appendix C. The tendencies can beassumed to be equal, however, the actual values differ due to the contribution of H2O inthe feed stream. The induvidual streams belonging temperature, pressure and mass flowrate may be seen in Figure 4.18.
0.132.04.2
0.232.04.2
32.012.5
4.2
Mixer ReactorReactor Flash
S2
Mixer
hej
Absorber/stripper/packed column
BTX&MeOH-Dist/TrayBTX&MeOH-Dist/TrayValve
Comp
Pump Heat exchanger
Cooler
Fluid/liquid separator
Tank
Waste
Heater 1
MixerHeater 2 BTX ReactorBTX Reactor Cooler
Flash
PURGE H2
Separator 2 Separator 1
Valve
Comp 1
Comp 2
S2
S7
T [°C]m [tonne/h]
P [bar]. T [°C]
m [tonne/h]P [bar]
.
64.4122.918.0
64.432.04.2
64.632.04.2
S9S10
64.732.04.2
192.477.2
18.0 360.077.2
18.0
RECYCLE
S4S3431.2
77.218.0 431.2
77.24.2
S6S5 32.077.2
4.2
PRODUCT
S8
12.8200.01.1
469.812.8
18.0
12.875.11.1
MEOH-H2OS1
Figure 4.18: BTX synthesis subsystem, with belonging temperatures, pressures and mass flow rates.
The output stream composition of the Flash separator yields a mixture consisting of17 different species. An analysis is required in order to determine which products mustbe separated to make the subsystem as feasible as possible. This will be presented in thefollowing as well as the processes associated with the separations.
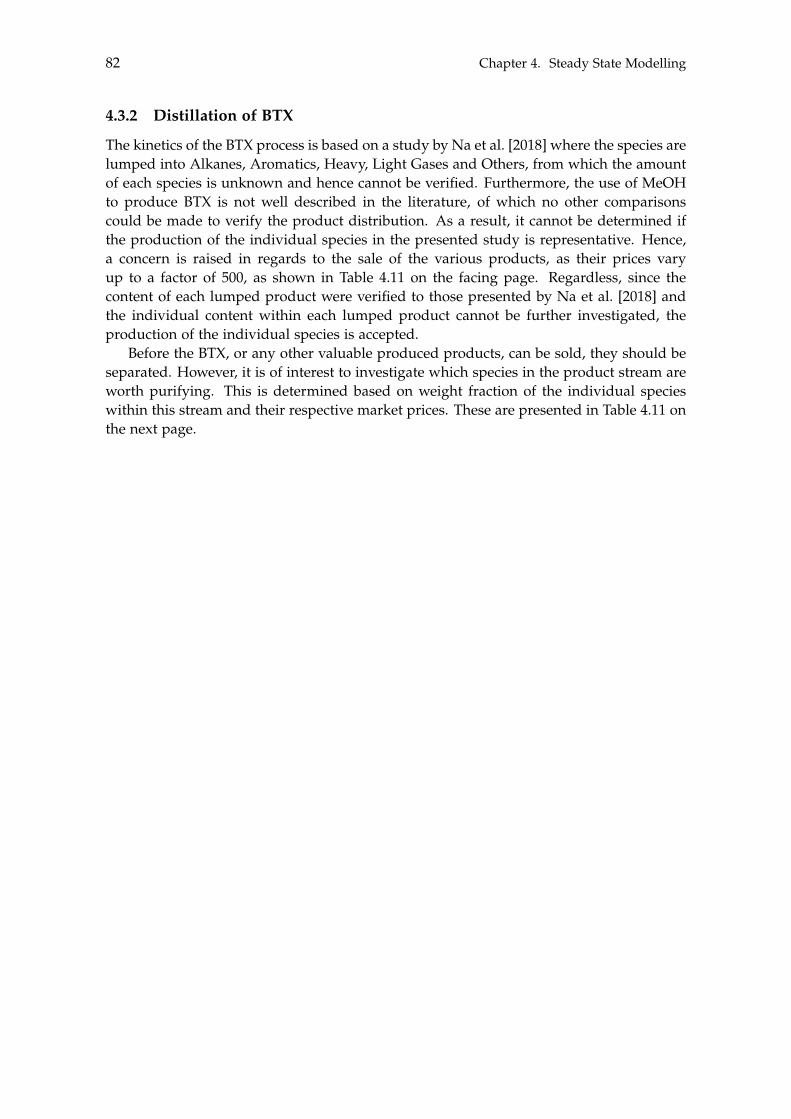
82 Chapter 4. Steady State Modelling
4.3.2 Distillation of BTX
The kinetics of the BTX process is based on a study by Na et al. [2018] where the species arelumped into Alkanes, Aromatics, Heavy, Light Gases and Others, from which the amountof each species is unknown and hence cannot be verified. Furthermore, the use of MeOHto produce BTX is not well described in the literature, of which no other comparisonscould be made to verify the product distribution. As a result, it cannot be determined ifthe production of the individual species in the presented study is representative. Hence,a concern is raised in regards to the sale of the various products, as their prices varyup to a factor of 500, as shown in Table 4.11 on the facing page. Regardless, since thecontent of each lumped product were verified to those presented by Na et al. [2018] andthe individual content within each lumped product cannot be further investigated, theproduction of the individual species is accepted.
Before the BTX, or any other valuable produced products, can be sold, they should beseparated. However, it is of interest to investigate which species in the product stream areworth purifying. This is determined based on weight fraction of the individual specieswithin this stream and their respective market prices. These are presented in Table 4.11 onthe next page.
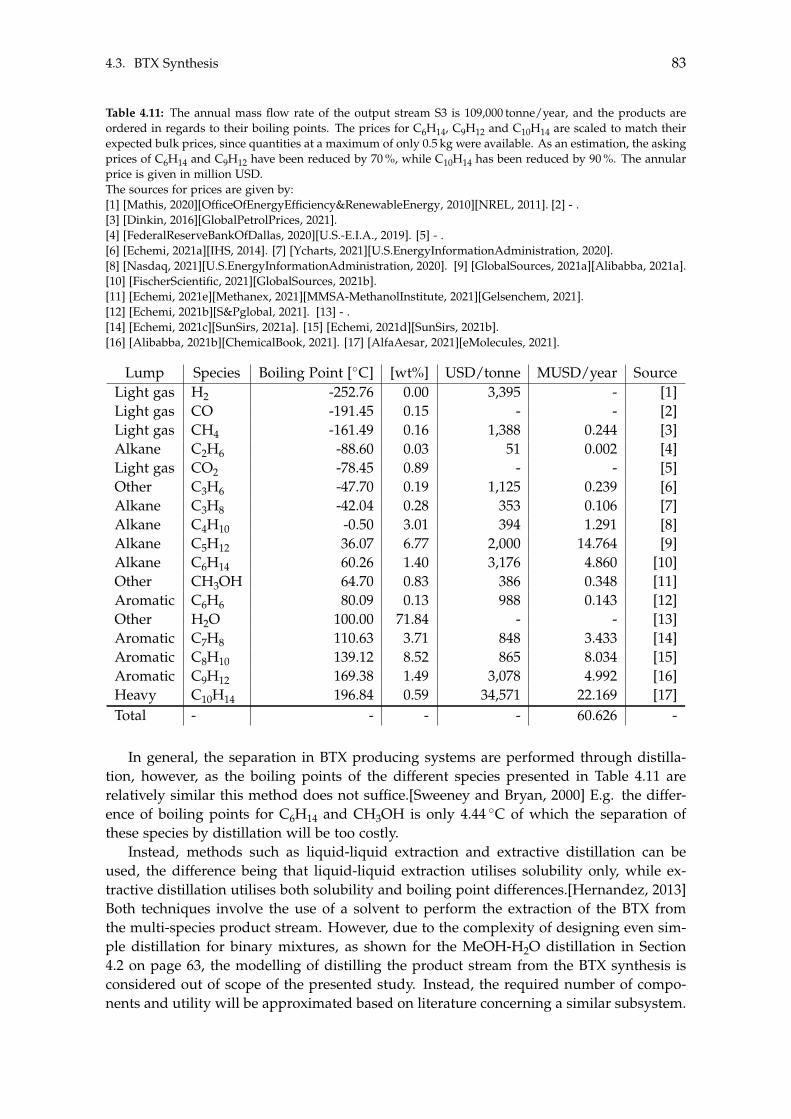
4.3. BTX Synthesis 83
Table 4.11: The annual mass flow rate of the output stream S3 is 109,000 tonne/year, and the products areordered in regards to their boiling points. The prices for C6H14, C9H12 and C10H14 are scaled to match theirexpected bulk prices, since quantities at a maximum of only 0.5 kg were available. As an estimation, the askingprices of C6H14 and C9H12 have been reduced by 70 %, while C10H14 has been reduced by 90 %. The annularprice is given in million USD.The sources for prices are given by:[1] [Mathis, 2020][OfficeOfEnergyEfficiency&RenewableEnergy, 2010][NREL, 2011]. [2] - .[3] [Dinkin, 2016][GlobalPetrolPrices, 2021].[4] [FederalReserveBankOfDallas, 2020][U.S.-E.I.A., 2019]. [5] - .[6] [Echemi, 2021a][IHS, 2014]. [7] [Ycharts, 2021][U.S.EnergyInformationAdministration, 2020].[8] [Nasdaq, 2021][U.S.EnergyInformationAdministration, 2020]. [9] [GlobalSources, 2021a][Alibabba, 2021a].[10] [FischerScientific, 2021][GlobalSources, 2021b].[11] [Echemi, 2021e][Methanex, 2021][MMSA-MethanolInstitute, 2021][Gelsenchem, 2021].[12] [Echemi, 2021b][S&Pglobal, 2021]. [13] - .[14] [Echemi, 2021c][SunSirs, 2021a]. [15] [Echemi, 2021d][SunSirs, 2021b].[16] [Alibabba, 2021b][ChemicalBook, 2021]. [17] [AlfaAesar, 2021][eMolecules, 2021].
Lump Species Boiling Point [�C] [wt%] USD/tonne MUSD/year SourceLight gas H2 -252.76 0.00 3,395 - [1]Light gas CO -191.45 0.15 - - [2]Light gas CH4 -161.49 0.16 1,388 0.244 [3]Alkane C2H6 -88.60 0.03 51 0.002 [4]Light gas CO2 -78.45 0.89 - - [5]Other C3H6 -47.70 0.19 1,125 0.239 [6]Alkane C3H8 -42.04 0.28 353 0.106 [7]Alkane C4H10 -0.50 3.01 394 1.291 [8]Alkane C5H12 36.07 6.77 2,000 14.764 [9]Alkane C6H14 60.26 1.40 3,176 4.860 [10]Other CH3OH 64.70 0.83 386 0.348 [11]Aromatic C6H6 80.09 0.13 988 0.143 [12]Other H2O 100.00 71.84 - - [13]Aromatic C7H8 110.63 3.71 848 3.433 [14]Aromatic C8H10 139.12 8.52 865 8.034 [15]Aromatic C9H12 169.38 1.49 3,078 4.992 [16]Heavy C10H14 196.84 0.59 34,571 22.169 [17]Total - - - - 60.626 -
In general, the separation in BTX producing systems are performed through distilla-tion, however, as the boiling points of the different species presented in Table 4.11 arerelatively similar this method does not suffice.[Sweeney and Bryan, 2000] E.g. the differ-ence of boiling points for C6H14 and CH3OH is only 4.44 �C of which the separation ofthese species by distillation will be too costly.
Instead, methods such as liquid-liquid extraction and extractive distillation can beused, the difference being that liquid-liquid extraction utilises solubility only, while ex-tractive distillation utilises both solubility and boiling point differences.[Hernandez, 2013]Both techniques involve the use of a solvent to perform the extraction of the BTX fromthe multi-species product stream. However, due to the complexity of designing even sim-ple distillation for binary mixtures, as shown for the MeOH-H2O distillation in Section4.2 on page 63, the modelling of distilling the product stream from the BTX synthesis isconsidered out of scope of the presented study. Instead, the required number of compo-nents and utility will be approximated based on literature concerning a similar subsystem.
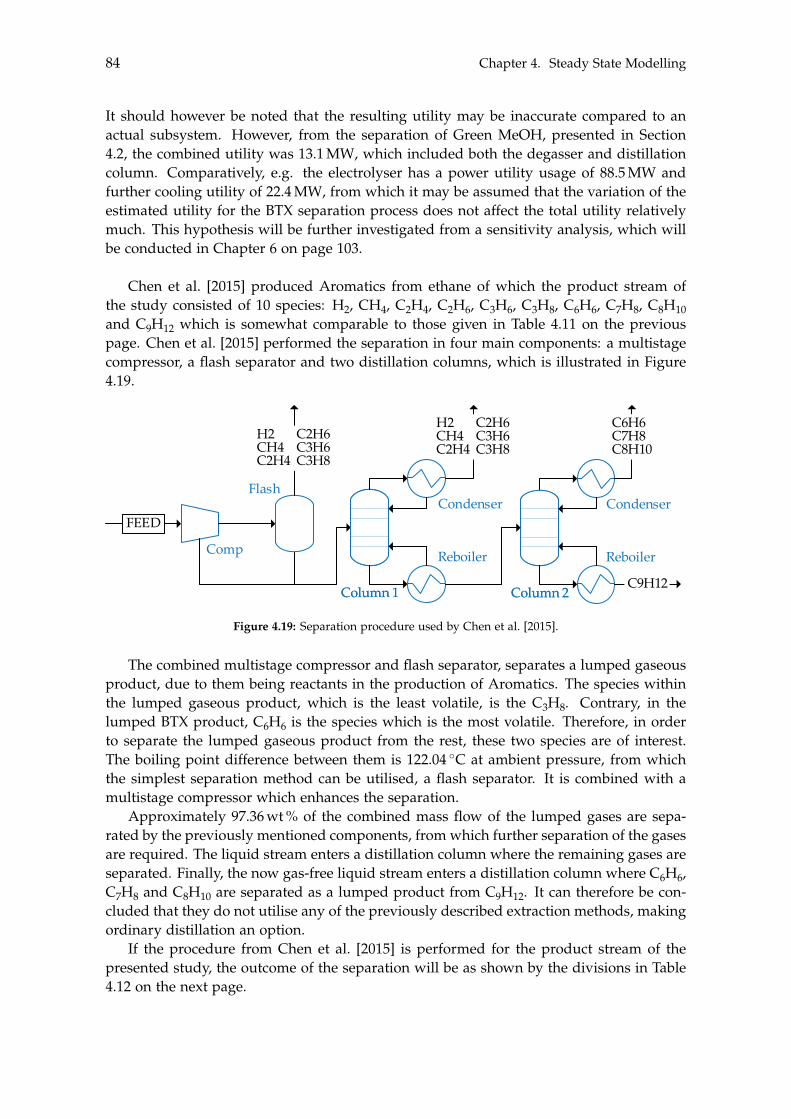
84 Chapter 4. Steady State Modelling
It should however be noted that the resulting utility may be inaccurate compared to anactual subsystem. However, from the separation of Green MeOH, presented in Section4.2, the combined utility was 13.1 MW, which included both the degasser and distillationcolumn. Comparatively, e.g. the electrolyser has a power utility usage of 88.5 MW andfurther cooling utility of 22.4 MW, from which it may be assumed that the variation of theestimated utility for the BTX separation process does not affect the total utility relativelymuch. This hypothesis will be further investigated from a sensitivity analysis, which willbe conducted in Chapter 6 on page 103.
Chen et al. [2015] produced Aromatics from ethane of which the product stream ofthe study consisted of 10 species: H2, CH4, C2H4, C2H6, C3H6, C3H8, C6H6, C7H8, C8H10and C9H12 which is somewhat comparable to those given in Table 4.11 on the previouspage. Chen et al. [2015] performed the separation in four main components: a multistagecompressor, a flash separator and two distillation columns, which is illustrated in Figure4.19.
Mixer ReactorReactor Flash
S2
Mixer
hej
Absorber/stripper/packed column
BTX&MeOH-Dist/TrayBTX&MeOH-Dist/TrayValve
Comp
Pump Heat exchanger
Cooler
Fluid/liquid separator
Tank
Comp
Flash
Column 2Column 2
FEED
Waste
Condenser
Reboiler
Column 1Column 1
Condenser
Reboiler
CompFlash
Column 1Column 1 Column 2Column 2
FEED
H2 CH4C2H4
C2H6C3H6C3H8
C6H6C7H8C8H10
C9H12
H2 CH4C2H4
C2H6C3H6C3H8
H2 CH4C2H4
C2H6C3H6C3H8
H2 CH4C2H4
C2H6C3H6C3H8
C6H6C7H8C8H10
C9H12
Figure 4.19: Separation procedure used by Chen et al. [2015].
The combined multistage compressor and flash separator, separates a lumped gaseousproduct, due to them being reactants in the production of Aromatics. The species withinthe lumped gaseous product, which is the least volatile, is the C3H8. Contrary, in thelumped BTX product, C6H6 is the species which is the most volatile. Therefore, in orderto separate the lumped gaseous product from the rest, these two species are of interest.The boiling point difference between them is 122.04 �C at ambient pressure, from whichthe simplest separation method can be utilised, a flash separator. It is combined with amultistage compressor which enhances the separation.
Approximately 97.36 wt % of the combined mass flow of the lumped gases are sepa-rated by the previously mentioned components, from which further separation of the gasesare required. The liquid stream enters a distillation column where the remaining gases areseparated. Finally, the now gas-free liquid stream enters a distillation column where C6H6,C7H8 and C8H10 are separated as a lumped product from C9H12. It can therefore be con-cluded that they do not utilise any of the previously described extraction methods, makingordinary distillation an option.
If the procedure from Chen et al. [2015] is performed for the product stream of thepresented study, the outcome of the separation will be as shown by the divisions in Table4.12 on the next page.
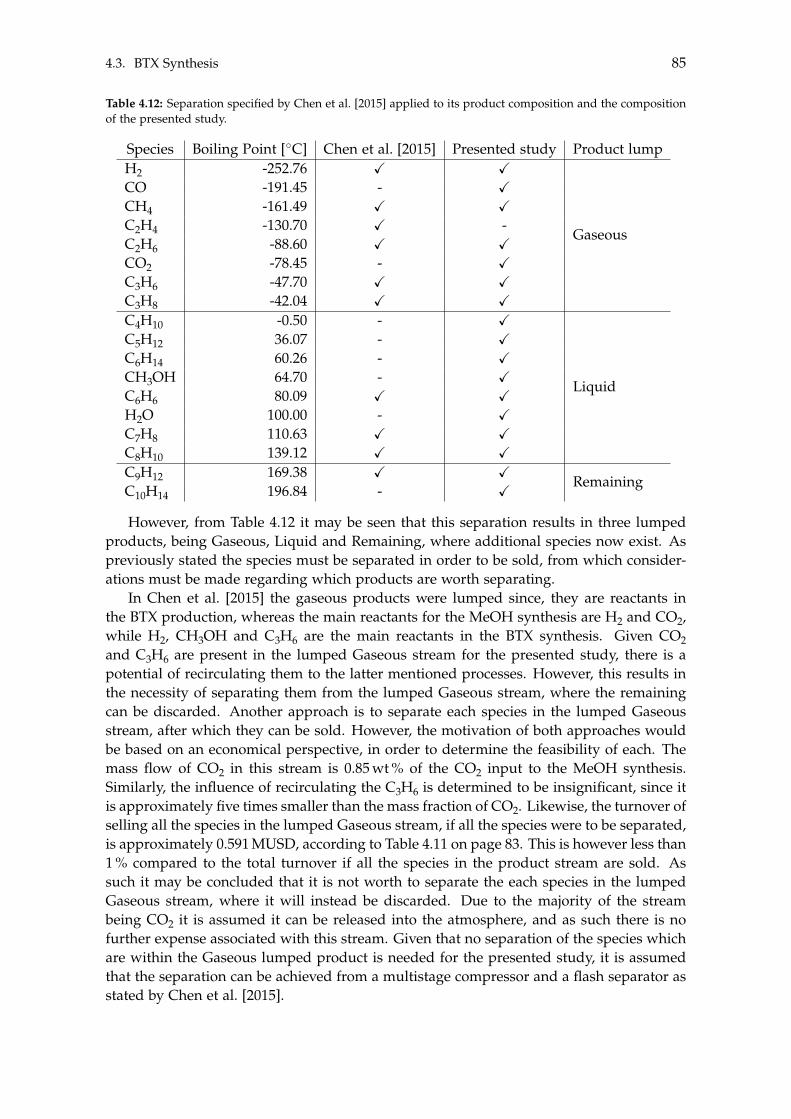
4.3. BTX Synthesis 85
Table 4.12: Separation specified by Chen et al. [2015] applied to its product composition and the compositionof the presented study.
Species Boiling Point [�C] Chen et al. [2015] Presented study Product lumpH2 -252.76 X X
Gaseous
CO -191.45 - XCH4 -161.49 X XC2H4 -130.70 X -C2H6 -88.60 X XCO2 -78.45 - XC3H6 -47.70 X XC3H8 -42.04 X XC4H10 -0.50 - X
Liquid
C5H12 36.07 - XC6H14 60.26 - XCH3OH 64.70 - XC6H6 80.09 X XH2O 100.00 - XC7H8 110.63 X XC8H10 139.12 X XC9H12 169.38 X X
RemainingC10H14 196.84 - X
However, from Table 4.12 it may be seen that this separation results in three lumpedproducts, being Gaseous, Liquid and Remaining, where additional species now exist. Aspreviously stated the species must be separated in order to be sold, from which consider-ations must be made regarding which products are worth separating.
In Chen et al. [2015] the gaseous products were lumped since, they are reactants inthe BTX production, whereas the main reactants for the MeOH synthesis are H2 and CO2,while H2, CH3OH and C3H6 are the main reactants in the BTX synthesis. Given CO2and C3H6 are present in the lumped Gaseous stream for the presented study, there is apotential of recirculating them to the latter mentioned processes. However, this results inthe necessity of separating them from the lumped Gaseous stream, where the remainingcan be discarded. Another approach is to separate each species in the lumped Gaseousstream, after which they can be sold. However, the motivation of both approaches wouldbe based on an economical perspective, in order to determine the feasibility of each. Themass flow of CO2 in this stream is 0.85 wt % of the CO2 input to the MeOH synthesis.Similarly, the influence of recirculating the C3H6 is determined to be insignificant, since itis approximately five times smaller than the mass fraction of CO2. Likewise, the turnover ofselling all the species in the lumped Gaseous stream, if all the species were to be separated,is approximately 0.591 MUSD, according to Table 4.11 on page 83. This is however less than1 % compared to the total turnover if all the species in the product stream are sold. Assuch it may be concluded that it is not worth to separate the each species in the lumpedGaseous stream, where it will instead be discarded. Due to the majority of the streambeing CO2 it is assumed it can be released into the atmosphere, and as such there is nofurther expense associated with this stream. Given that no separation of the species whichare within the Gaseous lumped product is needed for the presented study, it is assumedthat the separation can be achieved from a multistage compressor and a flash separator asstated by Chen et al. [2015].
86 Chapter 4. Steady State Modelling
The rest of this product stream consists of the lumped Liquid- and Remaining streampresented in Table 4.12 on the preceding page. The rest of the separations will be per-formed by distillation, from which the boiling point becomes the decisive variable.
The Liquid lumped product consists of three Alkanes, three Aromatics, H2O andMeOH. It would be of interest to separate each species within the Liquid lumped prod-uct, however, this will not be done. The study of Chen et al. [2015] assumes BTX can besold as one lumped product, from which it is also assumed that the three Alkanes can besold as one. However, the least volatile species of the three Alkanes is C6H14 which has aboiling point approximately 4 �C lower than MeOH. This could result in the distillation ofAlkanes being infeasible, as earlier presented, whereas an alternative method could be theextraction- or extractive distillation processes. In order to avoid the alternative methods, asimplification has instead been made, which is that this stream, consisting of MeOH andAlkanes, can be sold as one product. As such the distillation method is utilised where thedistilled product consists of MeOH and the previously mentioned Alkanes.
The remaining species in the lumped Liquid stream is BTX and H2O. Since Chen et al.[2015] states that it is possible to sell BTX as a lumped product, it is also the approachof the presented study. However, as may be seen in Table 4.12 on the previous page theboiling point of H2O is in between the boiling point of C6H6 and C7H8. This leads totwo approaches, either being to separate C6H6 and then H2O by distillation, from whichC6H6 can be sold separately and further C7H8 and C8H10 as a lumped product. Otherwisethe H2O can be separated from this mixture by the extraction- or extractive distillationmethod from which the three Aromatics can be sold as a lumped product. However,the income of C6H6 is only associated with a turnover of 0.143 MUSD/year, which isapproximately 0.21 % compared to the total revenue if all the species are sold individuallyas shown in Table 4.11 on page 83. Since the turnover with respect to C6H6 is deemedinsignificant another approach can be made, which is to distil the C6H6 along with theH2O and afterwards sell C7H8 and C8H10 as a lumped product.
The content of H2O in the distillate stream will become 99.82 wt %. Due to this rel-atively high purity, it might be a possibility to discard the stream into a water reservoirand hereby not result in an additional expense. However, C6H6 is known to be a toxicchemical, as such it must be further investigated if the content of C6H6 is sufficiently lowto be discarded, or if a purification process is required [for Disease Control and Preven-tion, 2021]. The amount of C6H6 permitted in waste water, which is to be discarded into awater reservoir, is not publicly available, but an estimate can be made based on the restric-tions for drinking water. This assumption is based on the expectation that the tolerance ofchemicals in drinking water is similar to those in waste water. The maximum allowablecontent of C6H6, and other Aromatics, within drinking water in Denmark is 0.001 mg/kg[Scientific, 2003]. Since the current concentration of C6H6 within the stream is 1,800 mg/kgit becomes a necessity to purify this stream. Numerous methods exists for treating H2Ocontaining C6H6 such as solvent stripping and biological treatment, yet, these processesare considered out of scope for modelling in the presented study [ATSDR, 2007]. It willinstead be further discussed and accounted for in Chapter 6 on page 103.
With the Liquid lumped product being separated, only C9H12 and C10H14 remain,which can be separated by a distillation column due to the difference in their boilingpoints being 27.46 �C. The separation process of the products produced by the BTX syn-thesis, is as such achieved from six key components: one multistage compressor, one flashseparator and four distillation columns, as shown in Figure 4.20 on the facing page.
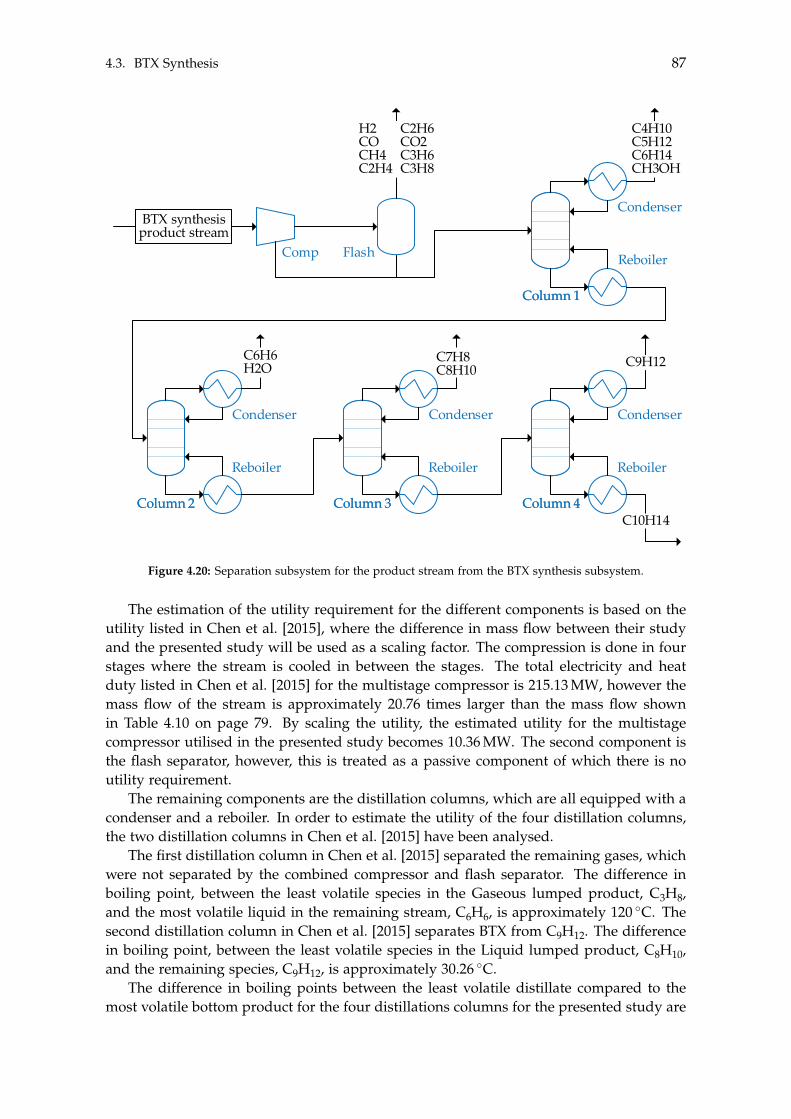
4.3. BTX Synthesis 87
Mixer ReactorReactor Flash
S2
Mixer
hej
Absorber/stripper/packed column
BTX&MeOH-Dist/TrayBTX&MeOH-Dist/TrayValve
Comp
Pump Heat exchanger
Cooler
Fluid/liquid separator
Tank
Comp Flash
Column 2Column 2
BTX synthesis product stream
H2 CO CH4C2H4
C2H6CO2C3H6C3H8
Waste
Condenser
Reboiler
C6H6H2O
Column 1Column 1
Condenser
Reboiler
C4H10C5H12C6H14CH3OH
Column 3Column 3
Condenser
Reboiler
Column 4Column 4
Condenser
Reboiler
C10H14
C9H12C7H8C8H10
Figure 4.20: Separation subsystem for the product stream from the BTX synthesis subsystem.
The estimation of the utility requirement for the different components is based on theutility listed in Chen et al. [2015], where the difference in mass flow between their studyand the presented study will be used as a scaling factor. The compression is done in fourstages where the stream is cooled in between the stages. The total electricity and heatduty listed in Chen et al. [2015] for the multistage compressor is 215.13 MW, however themass flow of the stream is approximately 20.76 times larger than the mass flow shownin Table 4.10 on page 79. By scaling the utility, the estimated utility for the multistagecompressor utilised in the presented study becomes 10.36 MW. The second component isthe flash separator, however, this is treated as a passive component of which there is noutility requirement.
The remaining components are the distillation columns, which are all equipped with acondenser and a reboiler. In order to estimate the utility of the four distillation columns,the two distillation columns in Chen et al. [2015] have been analysed.
The first distillation column in Chen et al. [2015] separated the remaining gases, whichwere not separated by the combined compressor and flash separator. The difference inboiling point, between the least volatile species in the Gaseous lumped product, C3H8,and the most volatile liquid in the remaining stream, C6H6, is approximately 120 �C. Thesecond distillation column in Chen et al. [2015] separates BTX from C9H12. The differencein boiling point, between the least volatile species in the Liquid lumped product, C8H10,and the remaining species, C9H12, is approximately 30.26 �C.
The difference in boiling points between the least volatile distillate compared to themost volatile bottom product for the four distillations columns for the presented study are

88 Chapter 4. Steady State Modelling
in the range of 10.6 �C to 30.26 �C. As such the following estimations of utility for the fourdistillation columns, will be based on the utility for the second distillation column listedby Chen et al. [2015]. The total utility of the condenser and reboiler for this distillationcolumn is 16.96 MW with an input mass flow of 57,076 kg/hr.
The first distillation column in the presented study will separate the Alkanes andCH3OH as a lumped product, where the mass flow of the feed stream is approximately4.67 times less than the feed stream of the reference distillation column, of which the scaledutility becomes 3.64 MW. This procedure is repeated for the remaining three distillationcolumns where their utility becomes 3.19 MW, 0.53 MW and 0.08 MW, respectively. Thetotal utility of the four distillation columns hence becomes 7.44 MW. However, as previ-ously discussed, these values may not be representative which will be further analysed inthe sensitivity analysis in Chapter 6 on page 103.
Throughout this chapter the steady state subsystems have been defined from which either MeOH orBTX may be produced. Additionally, combining the dynamic subsystems presented in Chapter 3with these steady state subsystems, System 1 and System 2 may be defined. With System 1 and 2defined, heat- and mass integration within both systems may be incorporated as will be done in thefollowing Chapter 5 on the next page.
Chapter 5
Heat- and Mass Integration
Throughout Chapter 3 and 4 the different subsystems have been modelled independentlyof each other, with the exception that the output stream from one subsystem was definedas the inlet for the subsequent subsystem. However, by coupling the subsystems, optimi-sation can be performed in order to reduce the OPEX, which can be done with respect tothe mass- and energy balances. Some of the individual subsystems produce species whichcan be used as inputs in other processes. Furthermore, the temperature varies throughoutthe two systems from �38 �C to 431 �C, hence heat exchangers can be implemented toexchange energy between the streams in the system, and thereby decrease the requiredutility. These modifications will reduce the OPEX, however, it should also be mentionedthat these modifications will increase the CAPEX, due to the introduction of additionalcomponents. Furthermore, these additional components will also increase the complexityof the overall system, meaning more maintenance are required which affects the OPEX.This aspect will be used to determine where it should be feasible to implement feedbackloops as well as heat exchangers.
The above mentioned analysis will only be done for the two steady state subsystems,which is the MeOH synthesis to purified MeOH and the MeOH synthesis to BTX, whilethe dynamic subsystems of electrolysis, carbon capture and gas storage are omitted asexplained below.
The carbon capture has three mass stream outlets, being the CO2 stream, a drain andthe remaining flue gas. However, none of the two latter mass streams can be utilisedelsewhere in the overall system, hence mass integration for the carbon capture will notbe done. Heat integration is however also of interest, where a heat exchanger is alreadyimplemented. This is incorporated in order to preheat the CO2 rich solvent before thestripper, and cool the CO2 lean solvent before the absorber. A cooler is also implementedbefore entering the absorber. However, no additional cold streams are available to removethis excess energy, neither by the carbon capture subsystem, nor from the steady statesubsystems with the heat integration presented later in this chapter. Further mass- or heatintegration for the carbon capture will therefore not be done. Similar to the carbon capture,the electrolyser and the storage subsystems for CO2 and H2 also require cooling, however,as discussed no excess cooling streams are available making external utility a necessity.From the upcoming analysis it is determined that relatively large quantities of H2O exitsthe steady state subsystems which could be recycled to the electrolyser. However, sincethese are not modelled in the same software, this feedback is not recycled, but it willbe further discussed when determining the OPEX for the electrolyser in Chapter 6 onpage 103.
89
90 Chapter 5. Heat- and Mass Integration
The following analysis will therefore only be conducted for the two steady state sub-systems, one where Green MeOH is the desired end product, and the other where BTX isthe desired end product.
5.1 System 1: Methanol as End Product
The integration of heat exchangers are based on its influence on the economic balancebetween CAPEX and OPEX. In order to perform the heat exchanger integration the energycontent within each individual stream are analysed, determined by the mass flow andthe specific heat capacity. Figure 5.1 on the next page illustrates the entire steady statesubsystem of System 1, with the stream names and their belonging heat capacity andtemperature.
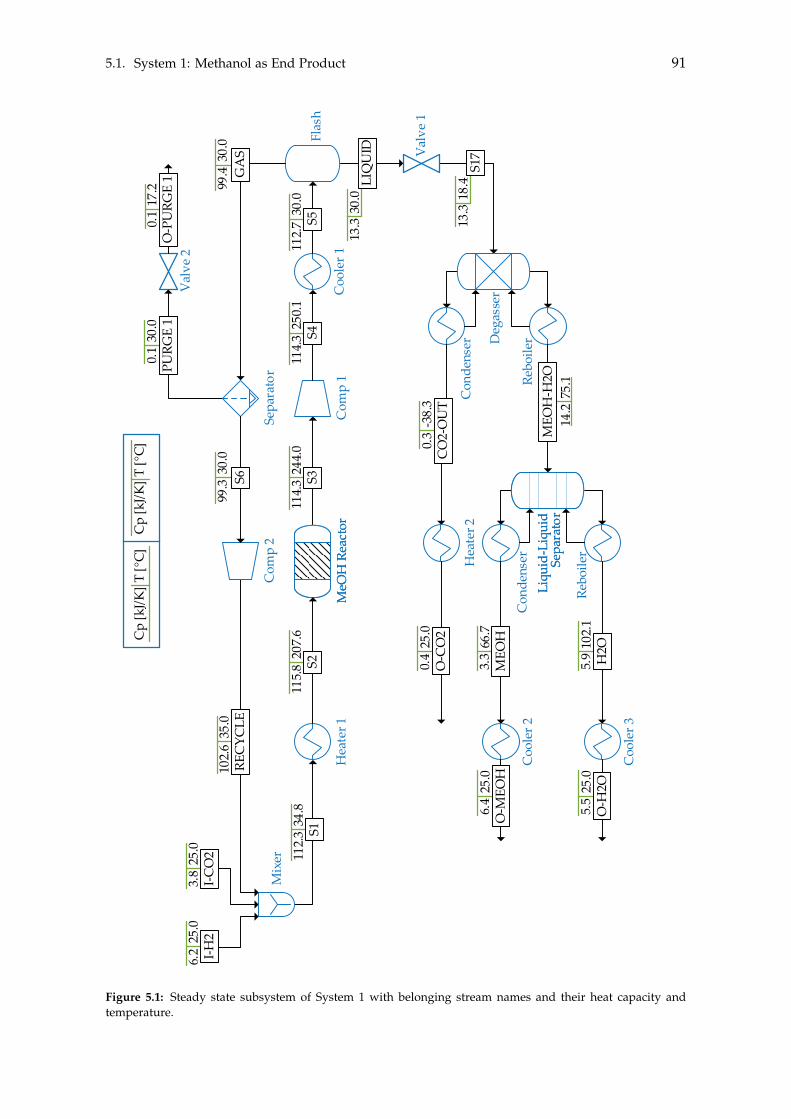
5.1. System 1: Methanol as End Product 91
Val
ve 2
Mix
er
MeO
H R
eact
orM
eOH
Rea
ctor
Flas
h
Sepa
rato
rC
omp
2
Com
p 1
Val
ve 1
Con
dens
er
Rebo
ilerD
egas
ser
Con
dens
er
Rebo
iler
Liqu
id-L
iqui
dSe
para
tor
Liqu
id-L
iqui
dSe
para
tor
Hea
ter 1
Coo
ler 1
Coo
ler 3
6.2
25.0
30.0
99.3
30.0
13.3
30.0
99.4
-38.
30.
3
66.7
3.3
102.
15.
925
.05.
5
18.4
13.3
75.1
14.2
T [°
C]C
p [k
J/K]
Hea
ter 2
Coo
ler 2
25.0
6.4
3.8
25.0
102.
635
.0
112.
334
.811
5.8
207.
611
4.3
244.
011
4.3
250.
111
2.7
30.0
0.1
30.0
0.1
17.2
25.0
0.4
T [°
C]C
p [k
J/K] S6
S2S3
GA
S
I-H2
O-P
URG
E 1
I-CO
2
PURG
E 1
S5S4
CO
2-O
UT
MEO
H
H2O
O-H
2O
REC
YCLE
S1
MEO
H-H
2O
O-M
EOH
O-C
O2
LIQ
UID
S17
Figure 5.1: Steady state subsystem of System 1 with belonging stream names and their heat capacity andtemperature.
92 Chapter 5. Heat- and Mass Integration
From Figure 5.1 on the preceding page it can at first be concluded that the heat capacityfor the majority of the streams within the feedback loop of the MeOH synthesis, are morethan 10 times greater than the streams outside the feedback loop. This was expected due tothe relatively large difference in the mass flow from the input of CO2 and H2 compared tothe recycled stream, which corresponds to relatively large utility requirements for Heater1 and Cooler 1. From streams S1 , S2 , S4 and S5 it can be concluded that the feedwhich enters this subsystem must be heated from 35 �C to 208 �C and cooled from 250 �Cto 30 �C, which has been done by Heater 1 and Cooler 1, respectively. Instead a heatexchanger can be utilised, where a countercurrent heat exchanger is used in order to obtaina greater heat transfer compared to a cocurrent heat exchanger. This type of heat exchangerwill be used for any additional heat exchangers which are to be implemented, all with apinch temperature of 10 �C since this value is commonly used [Klein and Nellis, 2017].The objective of implementing heat exchangers is to reduce the utility and if possible,the number of heaters and coolers. In order to determine whether Heater 1 or Cooler 1can be removed, the theoretical amount of heat transfer between the two streams mustbe determined from an energy balance as in Eq. 5.1. This energy balance determinesthe theoretical equilibrium temperature for two streams which can be used in order toimplement a heat exchanger
m1 · cp,1 · (T1 � Teq) = m2 · cp,2 · (Teq � T2) (5.1)
where cp,n is the individual specific heat capacity and Teq is the equilibrium temperature.Since the temperature of S1 and S5 are similar, neither Heater 1 nor the Cooler 1 can beremoved, however, their utilities can be decreased if a heat exchanger is implemented.
In order to further utilise the energy within the stream S5 , a second heat exchangercan be implemented. The recycled stream RECYCLE has a temperature of 35 �C fromwhich further heat transfer should be possible. When implementing heat exchangers thequality of the energy for the different streams must be taken into account where the tem-perature is the decisive variable. The stream S4 should therefore firstly supply heat toS1 and thereafter RECYCLE in order to reduce the utility of Heater 1 and Cooler 1.
If the purifying process of the produced MeOH is analysed it may be seen that the fi-nal temperatures of streams CO2-OUT , MEOH and H2O are �38 �C, 67 �C and 102 �C,respectively. Since these are the end products, they should be heated or cooled to ambi-ent temperatures. Stream CO2-OUT is the only stream which needs heating whereasMEOH and H2O require cooling. From Figure 5.1 on the preceding page it may be seen
that the heat capacity of CO2-OUT is relatively low compared to the other two streams.Due to its relatively low heat capacity only one of the other two streams can be cooled.H2O consists of approximately 100 wt% H2O which could potentially be recycled to the
electrolyser. However, a purifier might be a necessity in order to achieve the purity re-quirement in the electrolyser. Since the electrolyser operates at 80 �C it could be feasibleto maintain the energy within the H2O such that less heat is required for the electrolyser,assuming the purifier can operate at elevated temperatures. Regardless of this assumption,the MeOH must be cooled, from which stream MEOH is chosen to be cooled by streamCO2-OUT . Since the assumption regarding the recycling of the H2O stream H2O can-
not be verified at this point, the stream is cooled to 25 �C similar to MEOH . As mentionthere is a relatively large difference between stream CO2-OUT and MEOH with respectto their individual heat capacity, and furthermore the MeOH exiting the liquid-liquid sep-
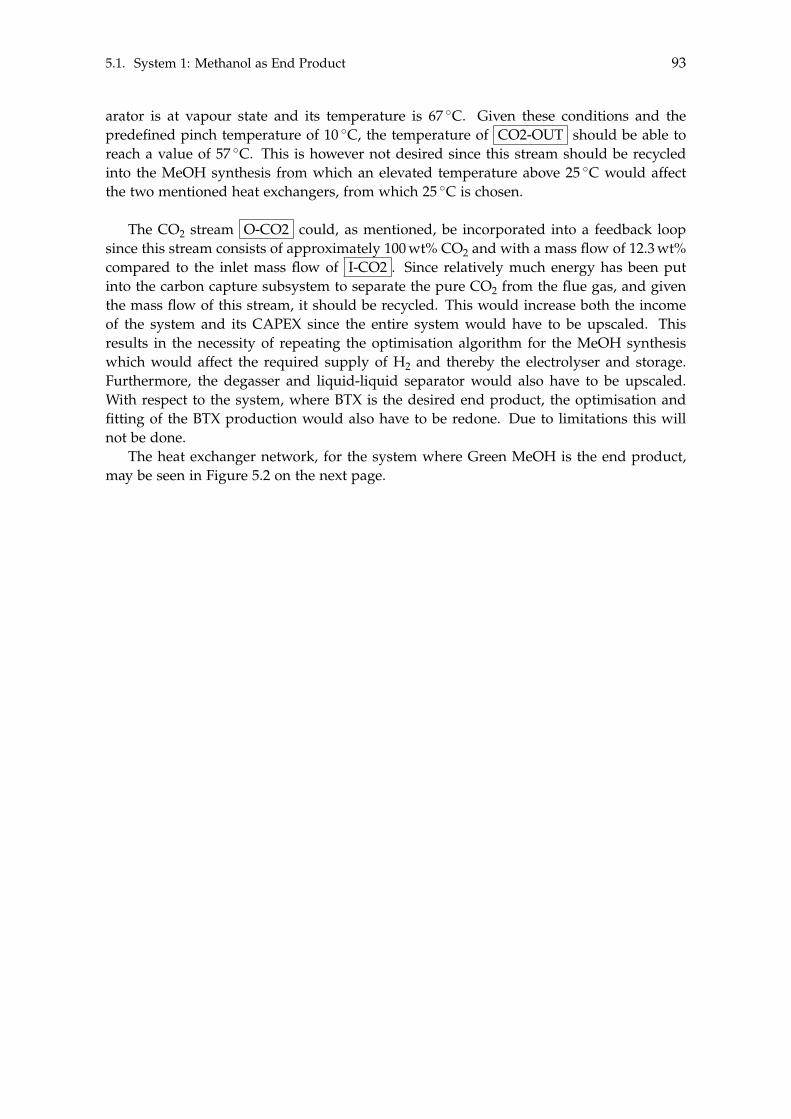
5.1. System 1: Methanol as End Product 93
arator is at vapour state and its temperature is 67 �C. Given these conditions and thepredefined pinch temperature of 10 �C, the temperature of CO2-OUT should be able toreach a value of 57 �C. This is however not desired since this stream should be recycledinto the MeOH synthesis from which an elevated temperature above 25 �C would affectthe two mentioned heat exchangers, from which 25 �C is chosen.
The CO2 stream O-CO2 could, as mentioned, be incorporated into a feedback loopsince this stream consists of approximately 100 wt% CO2 and with a mass flow of 12.3 wt%compared to the inlet mass flow of I-CO2 . Since relatively much energy has been putinto the carbon capture subsystem to separate the pure CO2 from the flue gas, and giventhe mass flow of this stream, it should be recycled. This would increase both the incomeof the system and its CAPEX since the entire system would have to be upscaled. Thisresults in the necessity of repeating the optimisation algorithm for the MeOH synthesiswhich would affect the required supply of H2 and thereby the electrolyser and storage.Furthermore, the degasser and liquid-liquid separator would also have to be upscaled.With respect to the system, where BTX is the desired end product, the optimisation andfitting of the BTX production would also have to be redone. Due to limitations this willnot be done.
The heat exchanger network, for the system where Green MeOH is the end product,may be seen in Figure 5.2 on the next page.
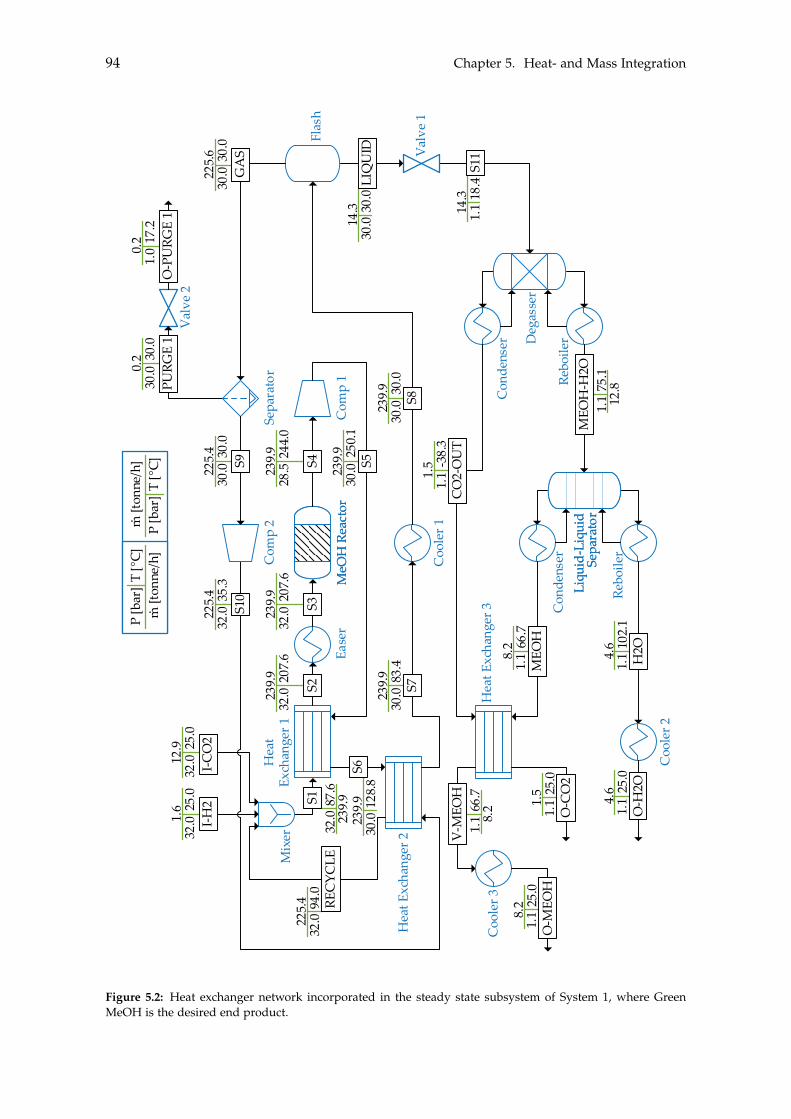
94 Chapter 5. Heat- and Mass Integration
Hea
t Exc
hang
er 3
244.
028
.5
Val
ve 2
Mix
er
MeO
H R
eact
orM
eOH
Rea
ctor
Flas
h
Sepa
rato
rC
omp
2
Com
p 1
S9
Val
ve 1
Con
dens
er
Rebo
ilerD
egas
ser
Con
dens
er
Rebo
iler
Liqu
id-L
iqui
dSe
para
tor
Liqu
id-L
iqui
dSe
para
tor
Hea
t Ex
chan
ger 1
Ease
r
Hea
t Exc
hang
er 2
Coo
ler 1
Coo
ler 3
Coo
ler 2
S2S3
S4
GA
SS1
0
32.0
25.0
I-H2
O-P
URG
E 1
25.0
32.0
35.3
32.0
30.0
30.0
17.2
1.0
30.0
30.0
30.0
30.0
207.
632
.0
128.
830
.0
94.0
32.0
30.0
30.0
I-CO
2
PURG
E 1
207.
632
.0
83.4
30.0 S7
30.0
30.0 S8
250.
130
.0 S5 -38.
31.
1C
O2-
OU
T
25.0
1.1
O-M
EOH
25.0
1.1
O-C
O2
66.7
1.1
MEO
H 102.
11.
1 H2O
25.0
1.1
O-H
2O
REC
YCLE
87.6
32.0
S1
S6LI
QU
ID
18.4
1.1
S11
66.7
1.1
V-M
EOH
75.1
1.1
MEO
H-H
2O
T [°
C]m
[ton
ne/h
]P
[bar
].
T [°
C]m
[ton
ne/h
]P
[bar
]
.
1.6
12.9
225.
422
5.4
0.2
0.2
225.
6
14.3 14
.3
1.5
4.6
4.6
1.5
8.2
8.2
8.2
239.
9
239.
923
9.9
225.
4
239.
923
9.9
239.
9
239.
9
239.
9
12.8
Figure 5.2: Heat exchanger network incorporated in the steady state subsystem of System 1, where GreenMeOH is the desired end product.
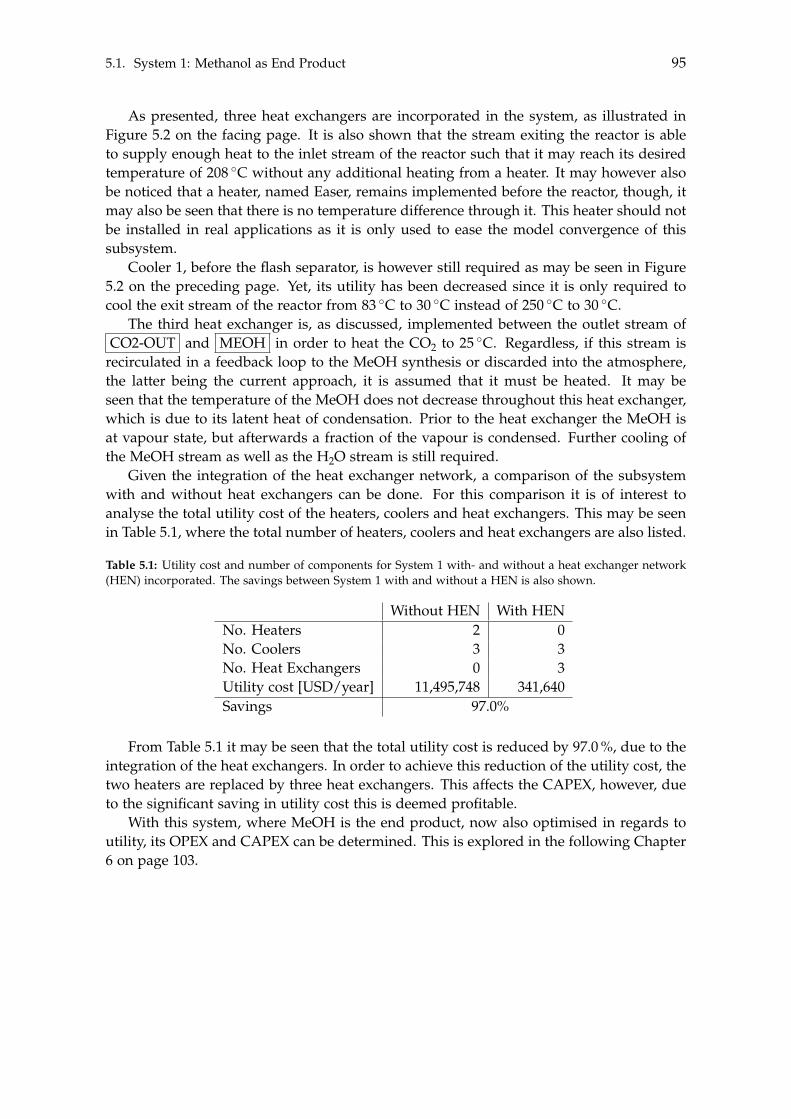
5.1. System 1: Methanol as End Product 95
As presented, three heat exchangers are incorporated in the system, as illustrated inFigure 5.2 on the facing page. It is also shown that the stream exiting the reactor is ableto supply enough heat to the inlet stream of the reactor such that it may reach its desiredtemperature of 208 �C without any additional heating from a heater. It may however alsobe noticed that a heater, named Easer, remains implemented before the reactor, though, itmay also be seen that there is no temperature difference through it. This heater should notbe installed in real applications as it is only used to ease the model convergence of thissubsystem.
Cooler 1, before the flash separator, is however still required as may be seen in Figure5.2 on the preceding page. Yet, its utility has been decreased since it is only required tocool the exit stream of the reactor from 83 �C to 30 �C instead of 250 �C to 30 �C.
The third heat exchanger is, as discussed, implemented between the outlet stream ofCO2-OUT and MEOH in order to heat the CO2 to 25 �C. Regardless, if this stream is
recirculated in a feedback loop to the MeOH synthesis or discarded into the atmosphere,the latter being the current approach, it is assumed that it must be heated. It may beseen that the temperature of the MeOH does not decrease throughout this heat exchanger,which is due to its latent heat of condensation. Prior to the heat exchanger the MeOH isat vapour state, but afterwards a fraction of the vapour is condensed. Further cooling ofthe MeOH stream as well as the H2O stream is still required.
Given the integration of the heat exchanger network, a comparison of the subsystemwith and without heat exchangers can be done. For this comparison it is of interest toanalyse the total utility cost of the heaters, coolers and heat exchangers. This may be seenin Table 5.1, where the total number of heaters, coolers and heat exchangers are also listed.
Table 5.1: Utility cost and number of components for System 1 with- and without a heat exchanger network(HEN) incorporated. The savings between System 1 with and without a HEN is also shown.
Without HEN With HENNo. Heaters 2 0No. Coolers 3 3No. Heat Exchangers 0 3Utility cost [USD/year] 11,495,748 341,640Savings 97.0%
From Table 5.1 it may be seen that the total utility cost is reduced by 97.0 %, due to theintegration of the heat exchangers. In order to achieve this reduction of the utility cost, thetwo heaters are replaced by three heat exchangers. This affects the CAPEX, however, dueto the significant saving in utility cost this is deemed profitable.
With this system, where MeOH is the end product, now also optimised in regards toutility, its OPEX and CAPEX can be determined. This is explored in the following Chapter6 on page 103.

96 Chapter 5. Heat- and Mass Integration
5.2 System 2: BTX as End Product
In this system, where the BTX synthesis is incorporated as an extension to System 1 with-out the liquid-liquid separator, the heat exchanger network until and including the MeOHsynthesis subsystem is kept equal. However, in order to produce the BTX a second reac-tor is implemented, from which relatively large temperature differences occur once again,similar to the MeOH synthesis. This may be seen in Figure 5.3 on the next page where theentire steady state subsystem of System 2, with the stream names and their belonging heatcapacity and temperature are illustrated.
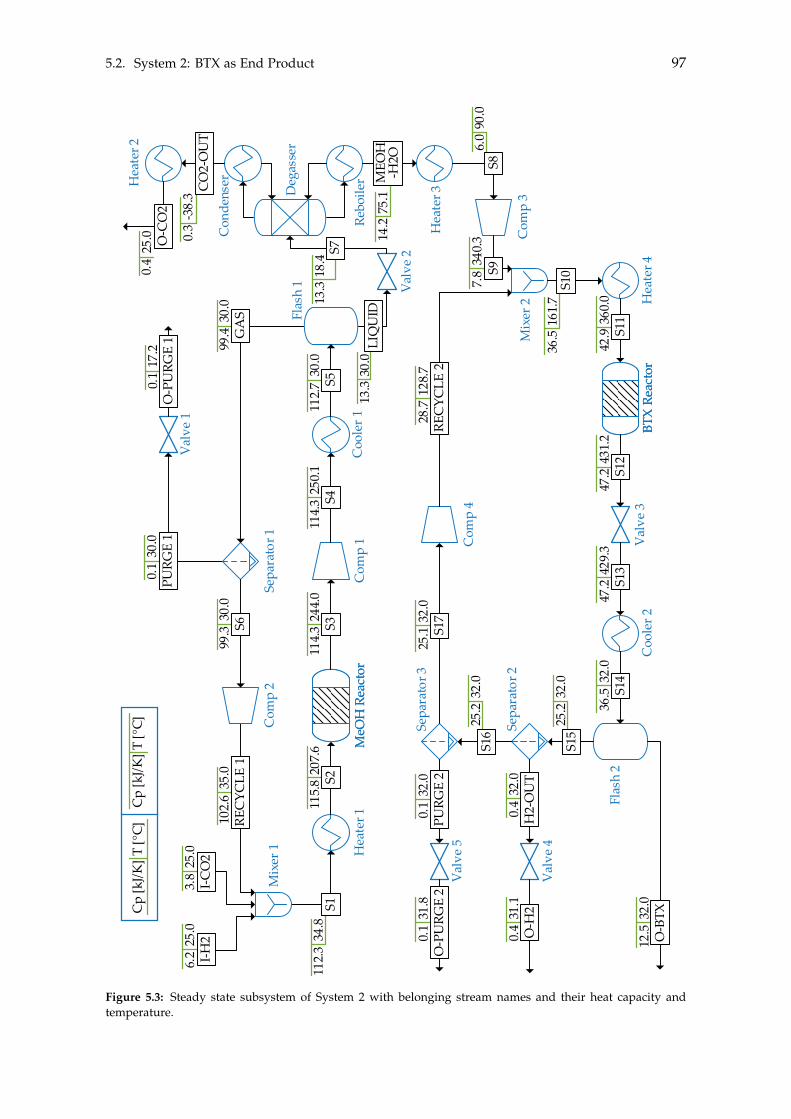
5.2. System 2: BTX as End Product 97
Val
ve 4
Val
ve 5
Hea
ter 3
Com
p 3
Hea
ter 4
BTX
Rea
ctor
BTX
Rea
ctor
Val
ve 3
Mix
er 2
Coo
ler 2
Flas
h 2
Sepa
rato
r 2
Sepa
rato
r 3
Com
p 4
Con
dens
er
Rebo
iler
Deg
asse
r
Val
ve 1
Mix
er 1
MeO
H R
eact
orM
eOH
Rea
ctor
Flas
h 1
Sepa
rato
r 1C
omp
2
Com
p 1
Hea
ter 1
Coo
ler 1
6.2
25.0
T [°
C]C
p [k
J/K]
3.8
25.0
102.
635
.0
0.1
17.2
T [°
C]C
p [k
J/K]
115.
820
7.6
114.
324
4.0
99.3
30.0
0.1
30.0
114.
325
0.1
112.
730
.0
99.4
30.0
0.3
-38.
3
7.8
340.
3
28.7
128.
725
.132
.0
6.0
90.0
0.4
32.0
0.4
31.1
0.1
31.8
0.1
32.0
12.5
32.0
36.5
32.0
47.2
429.
347
.243
1.2
42.9
360.
0
36.5
161.
7
112.
334
.8
30.0
13.3
75.1
14.2
Val
ve 2
18.4
13.3
Hea
ter 2
0.4
25.0
25.2
32.0
25.2
32.0
S2
I-H2
O-P
URG
E 1
I-CO
2
PURG
E 1
REC
YCLE
1
S3S4
GA
SS6
S9
S10
S11
S12
S13
S14
S15
O-B
TX
S16
H2-
OU
TO
-H2
O-P
URG
E 2
PURG
E 2
S17
REC
YCLE
2
LIQ
UID
MEO
H-H
2O S8
S7O-C
O2
CO
2-O
UT
S5S1
Figure 5.3: Steady state subsystem of System 2 with belonging stream names and their heat capacity andtemperature.
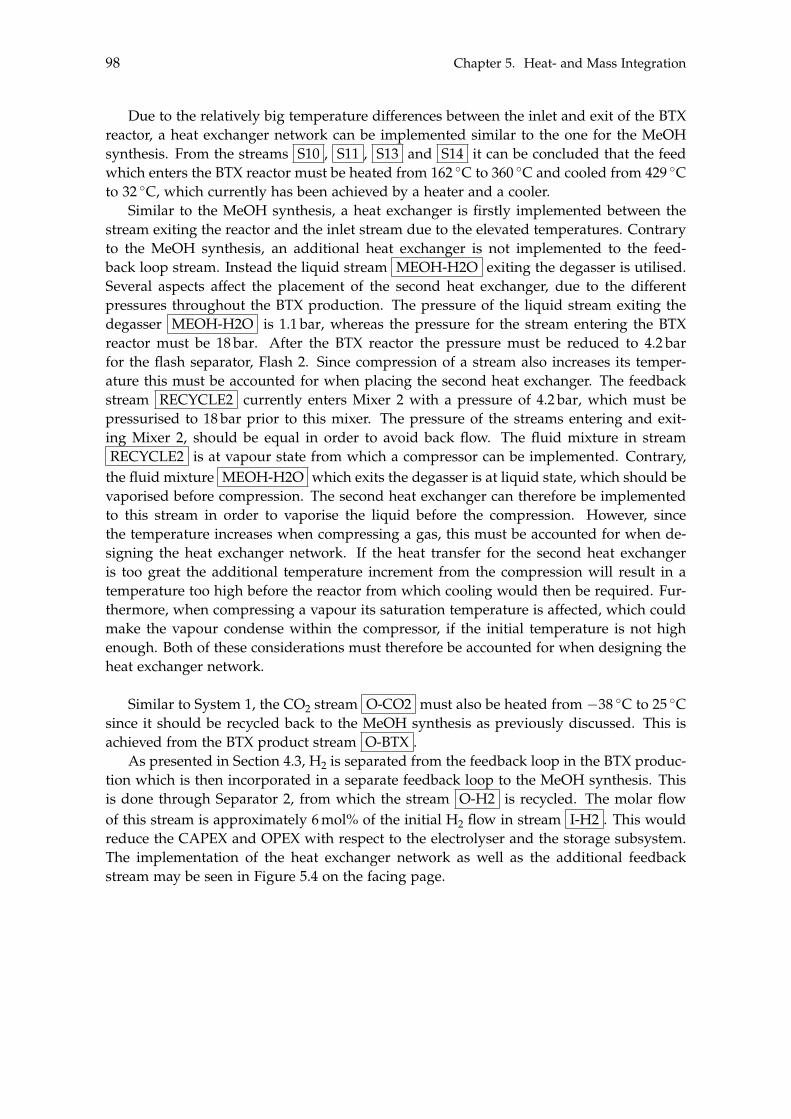
98 Chapter 5. Heat- and Mass Integration
Due to the relatively big temperature differences between the inlet and exit of the BTXreactor, a heat exchanger network can be implemented similar to the one for the MeOHsynthesis. From the streams S10 , S11 , S13 and S14 it can be concluded that the feedwhich enters the BTX reactor must be heated from 162 �C to 360 �C and cooled from 429 �Cto 32 �C, which currently has been achieved by a heater and a cooler.
Similar to the MeOH synthesis, a heat exchanger is firstly implemented between thestream exiting the reactor and the inlet stream due to the elevated temperatures. Contraryto the MeOH synthesis, an additional heat exchanger is not implemented to the feed-back loop stream. Instead the liquid stream MEOH-H2O exiting the degasser is utilised.Several aspects affect the placement of the second heat exchanger, due to the differentpressures throughout the BTX production. The pressure of the liquid stream exiting thedegasser MEOH-H2O is 1.1 bar, whereas the pressure for the stream entering the BTXreactor must be 18 bar. After the BTX reactor the pressure must be reduced to 4.2 barfor the flash separator, Flash 2. Since compression of a stream also increases its temper-ature this must be accounted for when placing the second heat exchanger. The feedbackstream RECYCLE2 currently enters Mixer 2 with a pressure of 4.2 bar, which must bepressurised to 18 bar prior to this mixer. The pressure of the streams entering and exit-ing Mixer 2, should be equal in order to avoid back flow. The fluid mixture in streamRECYCLE2 is at vapour state from which a compressor can be implemented. Contrary,
the fluid mixture MEOH-H2O which exits the degasser is at liquid state, which should bevaporised before compression. The second heat exchanger can therefore be implementedto this stream in order to vaporise the liquid before the compression. However, sincethe temperature increases when compressing a gas, this must be accounted for when de-signing the heat exchanger network. If the heat transfer for the second heat exchangeris too great the additional temperature increment from the compression will result in atemperature too high before the reactor from which cooling would then be required. Fur-thermore, when compressing a vapour its saturation temperature is affected, which couldmake the vapour condense within the compressor, if the initial temperature is not highenough. Both of these considerations must therefore be accounted for when designing theheat exchanger network.
Similar to System 1, the CO2 stream O-CO2 must also be heated from �38 �C to 25 �Csince it should be recycled back to the MeOH synthesis as previously discussed. This isachieved from the BTX product stream O-BTX .
As presented in Section 4.3, H2 is separated from the feedback loop in the BTX produc-tion which is then incorporated in a separate feedback loop to the MeOH synthesis. Thisis done through Separator 2, from which the stream O-H2 is recycled. The molar flowof this stream is approximately 6 mol% of the initial H2 flow in stream I-H2 . This wouldreduce the CAPEX and OPEX with respect to the electrolyser and the storage subsystem.The implementation of the heat exchanger network as well as the additional feedbackstream may be seen in Figure 5.4 on the facing page.
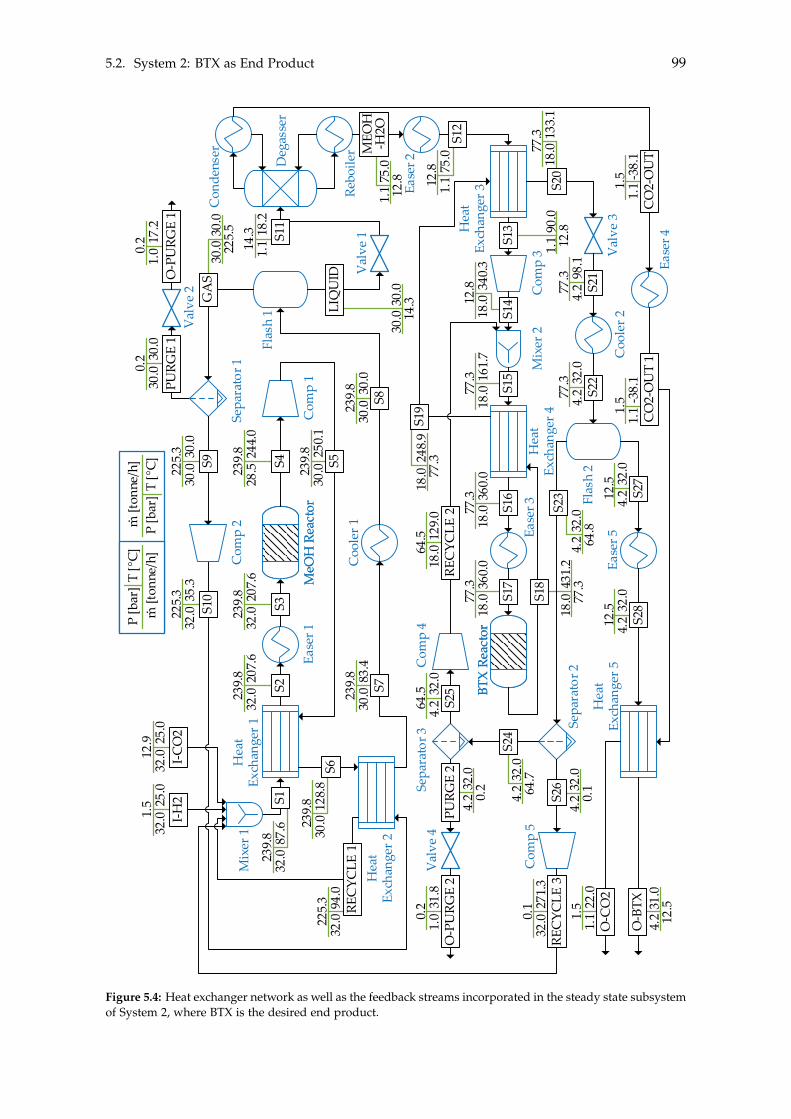
5.2. System 2: BTX as End Product 99
244.
028
.5
Val
ve 2
Mix
er 1
MeO
H R
eact
orM
eOH
Rea
ctor
Flas
h 1
Sepa
rato
r 1C
omp
2
Com
p 1
Val
ve 1
Hea
t Ex
chan
ger 1
Ease
r 1
Hea
t Ex
chan
ger 2
Coo
ler 1
32.0
25.0
25.0
32.0
35.3
32.0
30.0
30.0
17.2
1.0
30.0
30.0
207.
632
.0
128.
830
.094
.032
.0
207.
632
.0
83.4
30.0
30.0
30.0
250.
130
.0
T [°
C]m
[ton
ne/h
]P
[bar
].
T [°
C]m
[ton
ne/h
]P
[bar
]
.1.
512
.9
225.
322
5.3
0.2
0.2
239.
8
239.
822
5.3
239.
823
9.8
239.
8
239.
8
239.
8
Hea
t Ex
chan
ger 3Ea
ser 2
Com
p 3
Hea
t Ex
chan
ger 4
Ease
r 3
BTX
Rea
ctor
BTX
Rea
ctor
Val
ve 3
Mix
er 2
Coo
ler 2
Flas
h 2
Ease
r 5H
eat
Exch
ange
r 5
Ease
r 4
Sepa
rato
r 2
Sepa
rato
r 3C
omp
4
Con
dens
er
Rebo
iler
Deg
asse
r
Val
ve 4
Com
p 5
18.0
129.
064
.54.
232
.064
.5
1.1
22.0
1.5
4.2
32.0
12.5
4.2
32.0
12.5
1.1
-38.
11.
54.2
32.0
77.3
4.2
98.1
77.3
1.1
-38.
11.
5
18.0
133.
177
.3
1.1
75.0
12.8
1.0
31.8
0.2
32.0
4.2 0.
2
32.0
4.2 64
.7
31.0
4.2 12
.5
431.
218
.0 77.3
32.0
4.2 64
.8
18.0
161.
777
.318
.036
0.0
77.3
18.0
360.
077
.318
.034
0.3
12.8
90.0
1.1 12
.8
248.
918
.0 77.3
30.0
30.0 14
.3
1.1
18.2
14.330
.030
.0 225.
5
75.0
1.1 12
.8
32.0
4.2 0.
1
32.0
271.
30.
1
87.6
32.023
9.8
S9
S2S3
S4
S10
I-H2
O-P
URG
E 1
I-CO
2PU
RGE
1
S7S8
S5
S1
S6LI
QU
ID
S11
CO
2-O
UT
O-C
O2
O-B
TXS2
8
S18
S17
S16
S15
S14
S13
S24
S25
REC
YCLE
2PU
RGE
2O
-PU
RGE
2
REC
YCLE
1
S19
S23
S26
REC
YCLE
3
GA
S
MEO
H-H
2O
S12
S20
CO
2-O
UT
1
S21
S22
S27
Figure 5.4: Heat exchanger network as well as the feedback streams incorporated in the steady state subsystemof System 2, where BTX is the desired end product.
100 Chapter 5. Heat- and Mass Integration
From Figure 5.4 on the previous page it may be seen that the heat exchanger networkwith respect to the MeOH synthesis is equal to system 1, as mentioned. Three additionalheat exchangers, Heat Exchanger 3, Heat Exchanger 4 and Heat Exchanger 5, are imple-mented in the MeOH to BTX process. Heat Exchanger 4 is incorporated between the outletand inlet of the BTX reactor, whereas Heat Exchanger 3 is incorporated before the com-pression of the liquid output from the degasser. Given these two heat exchangers andfurther the compressors Comp 3 and Comp 4, the heater before the BTX reactor can beremoved. However, similar to the MeOH production a heater, denoted Easer, is still im-plemented before the BTX reactor, whose function remains to ease the model convergence.In total, five heaters, which have no contribution to the system except easing the modelconvergence, are implemented in Figure 5.4 on the preceding page named Easer 1 to Easer5. Cooler 2 located before the flash separator Flash 2 remains, but its utility has been de-creased since it is only required to cool the exit stream of the BTX reactor from 98.1 �C to32 �C instead of 429 �C to 32 �C.
The last heat exchanger, Heat Exchanger 5, is used to heat the CO2 stream O-CO2 .However, due the temperature of the BTX product stream S28 being 32 �C and the pinchtemperature defined as 10 �C, the outlet temperature of O-CO2 is limited to 21 �C. Thislimit is imposed since the product stream O-BTX exits at a temperature of 31 �C. It wasdesired to heat the O-CO2 stream to 25 �C. As it should be heated regardless if it isused in a feedback loop to the MeOH synthesis or discarded into the atmosphere, thelatter being the current approach. It is however determined that an additional heater isnot necessary due to its heat capacity being insignificantly small compared to the recycledMeOH stream RECYCLE1 . The BTX product stream O-BTX exits at a temperatureof 31 �C which is accepted since further separation of the individual species is requiredanyway. Lastly, it may also be seen from Figure 5.4 on the previous page that the separatedH2 is recycled back to the MeOH synthesis.
Given the integration of the heat exchanger network, a comparison of the system withand without heat exchangers can be done. For this comparison it is of interest to analysethe total utility costs for the heaters, coolers and heat exchangers. This may be seen inTable 5.2, where the total number of heaters, coolers and heat exchangers are also listed.
Table 5.2: Utility cost and number of components for System 2 with and without a heat exchanger network(HEN) incorporated. The savings between System 2 with and without a HEN is also shown.
Without HEN With HENNo. Heaters 4 0No. Coolers 2 2No. Heat Exchangers 0 5Utility cost [USD/year] 18,228,859 484,603Savings 97.3%
From Table 5.2 it may be seen the total utility cost is reduced by 97.3 %, due to theintegration of the heat exchangers. In order to achieve this reduction of the utility cost, thefour heaters are replaced by five heat exchangers. This affects the CAPEX, however, dueto the significant saving in utility cost this is deemed profitable.
With this system, where BTX is the end product, now also optimised in regards toutility, it may be determined what the costs of construction and operation are. This isexplored in the following Chapter 6 on page 103.

5.2. System 2: BTX as End Product 101
Throughout this chapter heat- and mass integration for the steady state subsystems of System 1 and2 have been conducted. This yielded a reduction in the utility of the heaters and coolers of 97.0 %and 97.3 % for System 1 and 2, respectively. Additionally, mass integration was performed forSystem 2, where the H2, produced in the BTX synthesis, was recirculated to the MeOH synthesis.With System 1 and 2 defined, the CAPEX and OPEX for both can be estimated, which will be donein the following Chapter 6 on page 103.

[This page is intentionally left blank]
Chapter 6
Economic Assessment of the SystemsThis chapter seeks to investigate the economic aspects of the two systems described inthe previous chapters. The economic aspects will concern the equipment cost, cost ofoperation, income from sale of products and loan repayment. The costs of some of theseparameters are deemed difficult to estimate, of which a cost range will be listed. A baselinevalue will therefore be defined from which a sensitivity analysis for each system willfurther investigate the influence of these varying parameters. The goal of this economicanalysis is therefore to assess the feasibility of the two systems and thereby indicate ifthey produce a profit or deficit. The rate of exchange has been fixed at 0.16 DKK/USD inaccordance to the rate on the 1st of May, 2021.
6.1 Economics of Subsystems
The initial equipment investment and cost of operation are often classified as capital ex-penditures (CAPEX) and operational expenditures (OPEX), respectively. CAPEX consistsof all facets in regards to initial purchase of any equipment, installation of the equipment,acquisition of land and further development of used technologies. OPEX concerns dayto day expenditures such as maintenance of equipment, and in the case of the presentedstudy the consumption of utility and other feed materials for the system. Hence, in sum-mation, CAPEX is any one-time expenses which will last for many years to come, whileOPEX is continuously paid expenses on a daily to annual basis.
In order to estimate the feasibility of the two different systems, it is therefore necessaryto investigate both the CAPEX and OPEX in conjunction to determine the potential profitof the systems. To do so the CAPEX and OPEX of the individual subsystems must bedetermined, which will be presented in Section 6.3 on page 110 and 6.4 on page 112.
It should be noted that any CAPEX and OPEX not listed in the sections below, arevalues determined by the Aspen Plus Process Economic Analyzer (APEA). The price esti-mated by APEA includes the equipment and installation costs. Equipment cost concernsthe bare cost of the components that make up the system. Installation cost concerns anymaterial used to construct the system and other expenditures. Together they make up theexpected total cost of constructing the given system, which is hence the CAPEX. Regard-ing OPEX, APEA estimates the demand for electricity, cooling and heating for the differentcomponents in the subsystem.
Before considering the given CAPEX- and OPEX values, it should be noted from whichyear the respective values originate. In APEA, the CAPEX and OPEX are both determinedusing a price basis from the year of 2015, as may be reviewed in the APEA help menu.Similarly, for any subsystem not determined in APEA, the price is dependent on the spe-cific year that the sources acquired their prices from. As a result, it would be a complicated
103
104 Chapter 6. Economic Assessment of the Systems
process if these values were to be converted to values of the year 2021. Although a roughestimate could be achieved by considering both the inflation rate and a price index for ev-ery component of every subsystem, it was chosen not to account for either. Therefore, thevarious values displayed in the following tables, are based on the values acquired directlyfrom their source of origin.
6.1.1 Carbon Capture
The CAPEX and OPEX of the carbon capture subsystem is determined by APEA. How-ever, the cost of the solvent used, MEA, is based on the current market price. The pricepresented by Echemi [2021f] is from 2021, while the price in Intratec [2007] is from 2007.Since the lowest price presented by Intratec [2007] matches the price by Echemi [2021f], thisprice is assumed to be representative of the current market value being 1,400 USD/tonne.In ASPEN Plus, only the flow rate of the MEA can be defined, and since no pipe sizes arespecified, the total amount of MEA in the subsystem cannot be specified. It can howeverbe approximated from the volume of the absorber and stripper, since they are assumed tocontribute most of the total volume for the subsystem. Their combined volume is 310 m3,where the absorber constitutes 300 m3 of this volume. The volume occupied by the solventin the absorber is presumed to be 10 vol%, and the concentration of MEA in the solvent is30 wt%, from which the resulting volume of MEA is approximately 9 m3. Which, when itsdensity is accounted for, equals about 10 tonne thereby costing a total of 14,000 USD.
With respect to the degradation of the solvent, this has been investigated by Davis andRochelle [2009]. They present a MEA degradation rate of about 13.5 wt% on an annualbasis under conditions similar to those observed in the carbon capture subsystem. Hence,13.5 wt% of the MEA must be replaced annually, resulting in an additional OPEX.
The CAPEX and OPEX of the carbon capture subsystem are listed in the Tables inSection 6.3 and 6.4.
6.1.2 Hydrogen and Carbon Dioxide Storage
The CAPEX of the two storage tanks, where the first stores CO2 and the second stores H2,are assumed equal due to their pressure and volume being identical at 32 bar and 100 m3.An investment cost is estimated by C. van Leeuwen [2018], resulting in 45.6 USD/m3.Furthermore, they estimate an operation and maintenance (O&M) cost, which due to therelatively low pressure in the storage tank, is taken as 0.5 % of the initial CAPEX.
The storage units also require compression before their respective stream may enterthe MeOH reactor, hence a multistage compressor is required as presented in Chapter 3,which is determined through APEA.
The CAPEX and OPEX of the H2 and CO2 storage subsystems are listed in the Tablesin Section 6.3 and 6.4.
6.1.3 Electrolysis
The CAPEX of the electrolyser is based on Brynolf et al. [2018], where a price inter-val is given for the expected alkaline electrolyser cost in 2030, where an interval of480 USD/kW to 1,080 USD/kW is given, with the baseline specified to equal the medianbeing 780 USD/kW. Hence, the CAPEX of the electrolyser is determined according to itspower input.
6.1. Economics of Subsystems 105
The OPEX for the electrolyser includes its O&M, power consumption, stack replace-ment and its H2O supply. The O&M is defined by Brynolf et al. [2018] to equal about3.5 % of the baseline CAPEX. Additionally, the stacks are specified to have a lifetime ofapproximately 10.85 years, after which a stack replacement is required. The cost of this re-placement is specified to equal 50 % of the baseline CAPEX cost, hence this annual OPEXcan be expressed as 4.6 % of the baseline CAPEX of the electrolyser.[Brynolf et al., 2018]
Regarding the H2O supply to the electrolyser, it must be taken into account that it op-erates on purified H2O. To achieve purified H2O, a demineraliser subsystem is required.Firstly, the tap water is acquired from the local water supply, which has an asking priceof 2.2 USD/m3 [AalborgForsyning, 2021b]. However, in order to reduce this expense, theexcess H2O produced in both systems could be recirculated. The demineralisation of H2Ois achieved using a subsystem similar to the one constructed by Commission [2000]. Theinput H2O investigated by Commission [2000] contains more than three times the maxi-mum allowable amount of Na+ and Cl– ions in Danish tap water, hence if only these ionswere to be removed the subsystem of the presented study would be overdimensioned.Although the recirculated H2O in the present study contains other species than the impu-rities present in Commission [2000], which is MeOH for System 1 and C6H6 in System 2,the overdimensioning is assumed to equalise this. Hence, the CAPEX and OPEX of theH2O demineraliser is determined by scaling their system to match the given flow rate inthe presented study, the costs of which are listed in the Tables in Section 6.3 and 6.4.
6.1.4 Wind- and Solar Power
Wind- and solar power is desired, not only to produce free power in the long term, butalso to compensate for the relatively large power consumption of the systems, which ismainly attributed to the electrolyser. The total installed wind- and solar capacity are, asmentioned in 3.3.1, 84 MW and 9.54 MW, respectively. The CAPEX and OPEX of bothtechnologies are based on Agency [2019], where their CAPEX are listed as 1,325 USD/kWand 750 USD/kW, while their OPEX are 30 USD/kW and 9.5 USD/kW, for wind- andsolar power, respectively.
6.1.5 Methanol Synthesis
The CAPEX and OPEX of the MeOH synthesis subsystem is determined by APEA. How-ever, the cost of the catalyst, Cu/ZnO/Al2O3, used in the reactor must be estimated byalternative means. The price is approximated based on the information provided by Cat-Cost [2020], where the catalyst price can be estimated based on its metallic composition.This resulted in a price of about 17,500 USD/tonne.
Regarding the degradation of the catalyst, this is investigated by Alarifi [2016]. Theypresent a catalyst degradation rate resulting in a lifetime of four years, meaning all of thecatalyst must be fully replaced at this frequency, resulting in an additional OPEX.
The CAPEX and OPEX of the MeOH synthesis subsystem are listed in the Tables inSection 6.3 and 6.4.
6.1.6 BTX Synthesis
Similar to the MeOH synthesis, the CAPEX and OPEX of the BTX synthesis subsystem isalso determined by APEA. However, the cost of the catalyst, ZSM-5, used in the reactoris based on Hannon et al. [2020] and Alibaba [2021], where an interval of approximately
106 Chapter 6. Economic Assessment of the Systems
5,000 USD/tonne to 30,000 USD/tonne is reported. Due to the difficulty of estimatingwhich price is representative, the median price is taken.
The degradation of this catalyst is investigated by Hannon et al. [2020]. They presentthe catalyst degradation rate which results in a lifetime of nine months, meaning all of thecatalyst must be fully replaced at this frequency, resulting in an additional OPEX.
The CAPEX and OPEX of the BTX synthesis subsystem are listed in the Tables inSection 6.3 and 6.4.
6.1.7 Separation of System 2 Products
The modelling associated with the separating of the products produced by System 2 wasconcluded to be out of scope for the presented study. Instead, the number of componentsand their required utility were estimated based on literature concerning a similar subsys-tem. This resulted in a separation subsystem with a multistage compressor, a flash vesseland four distillation columns. The utility of each component was estimated based on therequired utility listed in this literature and scaled by the difference in mass flow to thepresented study. This procedure is repeated when estimating the equipment costs of eachof the latter mentioned components. It is likely that the equipment costs cannot be scaledlinearly, however, since the modelling has not been performed for the components it hasbeen assumed.
According to Chen et al. [2015] the cost of the multistage compressor and flash vesselare approximately 32,137,300 USD and 496,300 USD, respectively. The distillation column,which is to be scaled, is coupled to a condenser and reboiler where the cost of the entireunit is 1,688,200 USD.
The multistage vessel have both the highest utility requirement according to Section4.3.2, further it is also the component with the highest cost. This indicates that it maybe beneficial to investigate if other components could replace the multistage compressor.However, the subsystem defined by Chen et al. [2015] is similar to the subsystem of thepresented study, as such the components remains the same.
If the cost is scaled linearly the cost of the multistage compressor and flash vessel be-comes 1,548,000 USD and 23,900 USD, respectively. The cost of each of the four distillationcolumns becomes 358,000 USD, 313,800 USD, 52,100 USD and 7,900 USD.
6.2 Economics of Additional Parameters
The previous section concerned the economics of each subsystem, whereas this sectionincludes the economics of additional parameters which affect both systems.
6.2.1 Electricity Price
The costs associated with electricity is of significant importance due to the relatively largeconsumption of power for both systems, which is mainly attributed to the electrolyser.Hence, it is assumed that the determination of the economics of the systems are sensi-tive to a variation in electricity prices. The price of the electricity is specified accordingto Energistyrelsen [2021b], Energistyrelsen [2021c] and eurostat [2021], corresponding to0.043 USD/kWh, 0.05 USD/kWh and 0.073 USD/kWh, respectively. It should be notedthat these prices are only achievable since both systems exceed an annual power con-sumption of 150 GWh.
6.2. Economics of Additional Parameters 107
6.2.2 Initial CAPEX Loan
Due to the relatively large CAPEX of the two systems, presented in Table 6.1 and 6.2,it is deemed a necessity to borrow the capital from financial institutions, such as a bank.However, it is difficult to gather decent estimates for such loans without making an enquiryto the banks. Due to these difficulties, the interest rate and payback period will be variedbetween 1 % to 5 % and 10 years to 30 years, respectively, in the sensitivity analysis inSection 6.6 on page 115.
6.2.3 Oxygen Production and Price
O2 is a byproduct produced in the electrolyser, which has not earlier been evaluated in thepresented study. However, the produced O2 mass flow from the electrolyser is 3.44 kg/sin System 1 and 3.25 kg/s in System 2 of which the production volume is considered sig-nificant. The difference in O2 production is due to the recirculation of excess H2 producedfrom the BTX synthesis, as such the production volume of the electrolyser in System 2 isreduced.
The possible usage of O2 in RenoNord’s incineration plant was evaluated in Section2.1, which concluded that it would increase the concentration of CO2 in the flue gas sincethe flue gas would contain less N2. This would result in a reduction of the dimensions ofthe absorber in the Carbon Capture subsystem, since it was dimensioned in regards to themass flow of flue gas. Additionally, it was mentioned that utilising O2 in the incinerationplant may increase the adiabatic flame temperature within the combustor, hence increasethe power output of the incineration plant. The O2 can therefore be used on site by theincineration plant of RenoNord, or it could be sold.
A company which is known to have a high consumption of O2 is Rockwool, which islocated in Hobro approximately 36 km from the incineration plant of RenoNord. Currently,the O2 is supplied to their factory by trucks, from which it could be lucrative to install apipeline between the proposed plant of the presented study and Rockwool. From a similarstudy it was concluded that Rockwool would support such a deal.[EnergiNet, 2018]
It is difficult to estimate the possible revenue associated with the sale of O2 to Rock-wool, since the asking price would have to be negotiated. It is of interest for Rockwool topurchase the O2 cheap compared to other suppliers, meanwhile it is of interest for the pre-sented study to sell the O2 without further processing. This could be possible if a pipelinewas to be connected between RenoNord and Rockwool, where the distance of 36 km isdeemed to not pose any problems. The assumption is made according to pipelines thattransport natural gas, which are known to exceed more than 1,000 km [Husseini, 2018].Since the O2 will be delivered to Rockwool by pipelines, the asking price will be based onthe costs associated with onsite production costs. A study done by Dorris et al. [2016] es-timates the asking price to be within 26 USD/tonne to 40 USD/tonne [Dorris et al., 2016].It should however be noted that this price range is based on literature from 2005 and 2007of which this asking price range might not be representative. It is expected that the askingprice will be lowered as the technology develops. Yet, FRED [2021] states the opposite,where the asking price of O2 has only increased since 2003. As a result, it becomes uncer-tain if the current asking price associated with onsite production of O2 should be above orbelow the range of 26 USD/tonne to 40 USD/tonne. This will be accounted for in the sen-sitivity analysis by varying the asking price of O2 from 20 USD/tonne to 60 USD/tonne,with the baseline being 40 USD/tonne.
108 Chapter 6. Economic Assessment of the Systems
6.2.4 Green Chemicals
The asking prices for the MeOH and the products produced from the BTX synthesis,previously listed in Table 4.11 on page 83, were all asking prices for what is consideredBlack chemicals. This classification is equal to the one initially presented for, for exampleH2, which can be classified as either Black, Grey or Green, depending on its productionmethod.
The classification ’Green product’ is a relatively modern term, from which prices forthe products under consideration are difficult to estimate. It is expected that Green prod-ucts are more expensive than Black products, due to additional production expenditures.Although Green products are more expensive to produce, it provides companies with theoption of branding their products as being Green, making them able to charge a premiumprice for their products.[Klenert et al., 2018] The ability to sell Green products at premiumprices are stated by EnergiNet [2019] and DrivKraftDanmark [2021], where bio-diesel isshown to have a value of 1.6 to 2.0 times the value of Black diesel. Similarly, Mikulski[2018] states a Green MeOH price which is approximately two times the price of BlackMeOH.
The support towards the use of Green products is hence assumed to also be applicableto the products of consideration in the presented study. Hence, the influence of being ableto sell these products at premium prices will be investigated during the sensitivity analysisin Section 6.6.
6.2.5 Heating and Cooling
Independently of which system is of consideration, external cooling and heating is re-quired. Chapter 5 concluded that the utility costs associated with heaters and coolerscould be reduced by heat integration. This reduced the utility costs of these componentsby 97 % and 97.3 % for System 1 and System 2, respectively. However, additional com-ponents require heating such as the reboilers that are coupled to the distillation columns,which become an expense determined by APEA. This is represented in Table 6.3 and 6.4where the heating is provided by steam.
APEA also determines the costs associated with cooling, yet this is not used. Thecooling could instead become an income rather than an expense, if the excess heat issold as district heating. The plant of the presented study will be located next to theincineration plant RenoNord which is already coupled to the district heating network,of which it is expected that the installation costs associated with coupling this plant tothe network, will be insignificant. Depending on the season of the year, the temperatureof the water returning from the consumers vary. However, independently of the seasonthe temperature should drop approximately 30 �C to 35 �C from the initial temperatureat the consumers.[Forsyning, 2020] Assuming an inlet temperature of 40 �C and an outlettemperature of 75 �C the integration of the district heat network into both systems can beanalysed.
In System 1, the distilled H2O exits the distillation column at a temperature of 102 �Cwhich could be used for district heating, since it must be cooled. However, it is expectedthat this revenue is insignificant due to its relatively low mass flow compared to otherstreams in this system. As such district heating will not be integrated for System 1.
In System 2, the output of the BTX reactor is cooled to 137 �C by two heat exchangersafter which it is cooled by a cooler to 32 �C. The mass flow rate for this stream comparedto the formerly mentioned stream in System 1 is approximately 22 times larger. Given
6.2. Economics of Additional Parameters 109
the elevated temperature and mass flow a part of the heat, removed by the cooler, couldinstead be utilised in the district heating network. The heat transfer for this heat exchangeris determined from the inlet and outlet temperature for the district heating stream, yieldinga total of approximately 327,000 GJ on an annual basis. The price at which the energy canbe sold is 4.15 USD/GJ, corresponding to a total income of approximately 1,300,000 USD[PwC.dk, 2020].
Additional cooling is required for different components throughout the systems, wheredistrict cooling could be an option. A district cooling network is currently being es-tablished which transfers energy to the quarry located near Rørdal. This network willbe available for industrial partners in the eastern part of Aalborg, which also includesRenoNord, and it is already connected to Aalborg University Hospital.[AalborgForsyning,2021a] According to AalborgForsyning [2021a], the pipelines are placed relatively close toRenoNord and as such it is expected to be possible to connect to these pipelines, hence theinstillation costs would be minor. Utilising the district cooling would be an expense, how-ever, it is expected that this expense will be insignificant compared to the overall OPEX ofthe plant, as such its influence is excluded in the remainder of the presented study. Theassumption regarding cooling from district cooling will be further discussed in Chapter 7on page 121.
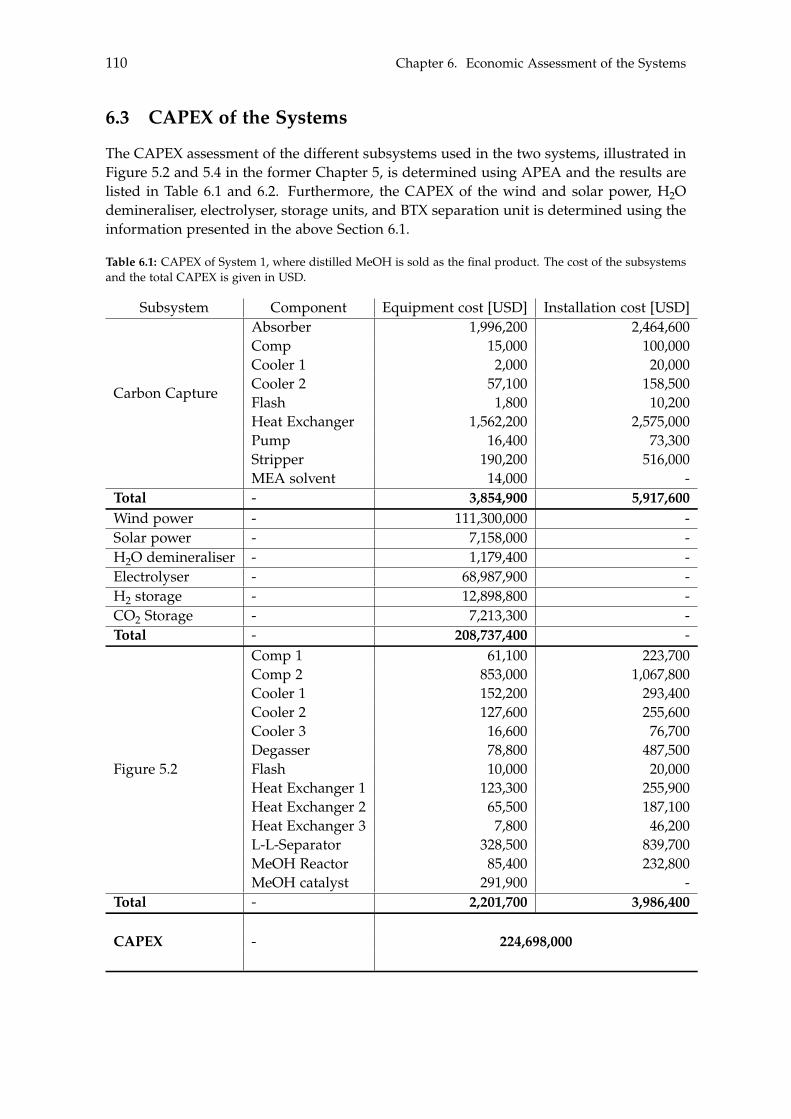
110 Chapter 6. Economic Assessment of the Systems
6.3 CAPEX of the Systems
The CAPEX assessment of the different subsystems used in the two systems, illustrated inFigure 5.2 and 5.4 in the former Chapter 5, is determined using APEA and the results arelisted in Table 6.1 and 6.2. Furthermore, the CAPEX of the wind and solar power, H2Odemineraliser, electrolyser, storage units, and BTX separation unit is determined using theinformation presented in the above Section 6.1.
Table 6.1: CAPEX of System 1, where distilled MeOH is sold as the final product. The cost of the subsystemsand the total CAPEX is given in USD.
Subsystem Component Equipment cost [USD] Installation cost [USD]
Carbon Capture
Absorber 1,996,200 2,464,600Comp 15,000 100,000Cooler 1 2,000 20,000Cooler 2 57,100 158,500Flash 1,800 10,200Heat Exchanger 1,562,200 2,575,000Pump 16,400 73,300Stripper 190,200 516,000MEA solvent 14,000 -
Total - 3,854,900 5,917,600Wind power - 111,300,000 -Solar power - 7,158,000 -H2O demineraliser - 1,179,400 -Electrolyser - 68,987,900 -H2 storage - 12,898,800 -CO2 Storage - 7,213,300 -Total - 208,737,400 -
Figure 5.2
Comp 1 61,100 223,700Comp 2 853,000 1,067,800Cooler 1 152,200 293,400Cooler 2 127,600 255,600Cooler 3 16,600 76,700Degasser 78,800 487,500Flash 10,000 20,000Heat Exchanger 1 123,300 255,900Heat Exchanger 2 65,500 187,100Heat Exchanger 3 7,800 46,200L-L-Separator 328,500 839,700MeOH Reactor 85,400 232,800MeOH catalyst 291,900 -
Total - 2,201,700 3,986,400
CAPEX - 224,698,000
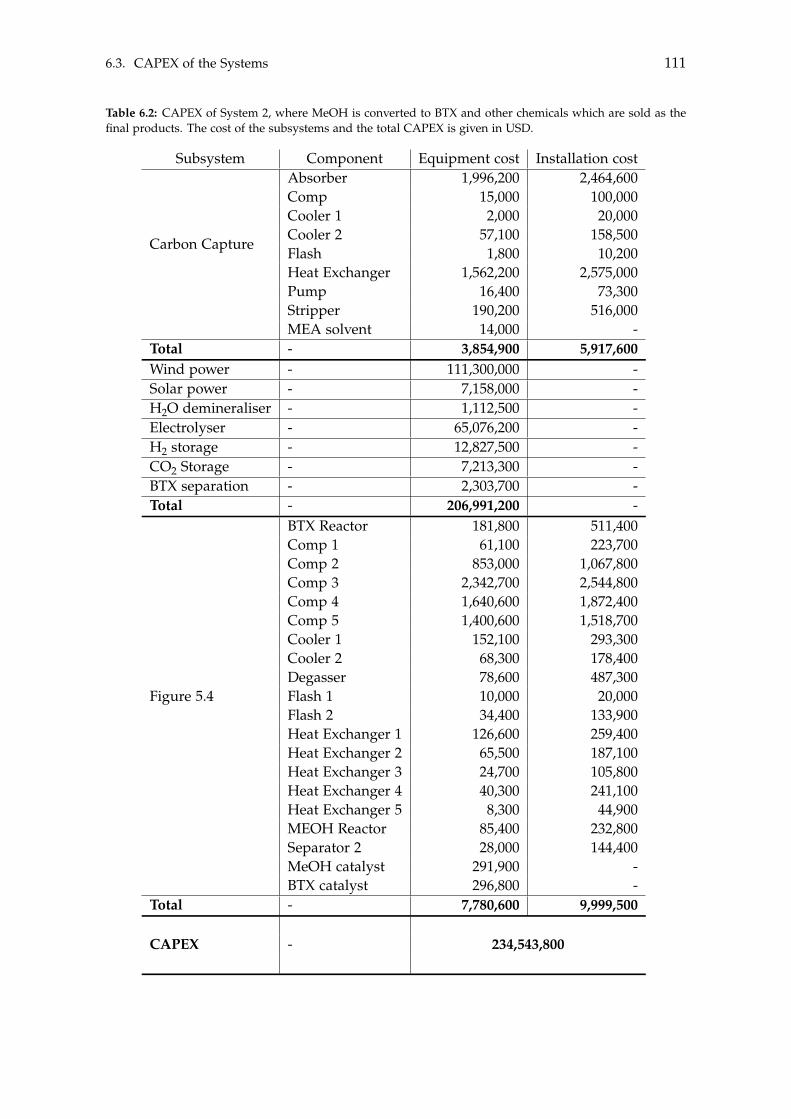
6.3. CAPEX of the Systems 111
Table 6.2: CAPEX of System 2, where MeOH is converted to BTX and other chemicals which are sold as thefinal products. The cost of the subsystems and the total CAPEX is given in USD.
Subsystem Component Equipment cost Installation cost
Carbon Capture
Absorber 1,996,200 2,464,600Comp 15,000 100,000Cooler 1 2,000 20,000Cooler 2 57,100 158,500Flash 1,800 10,200Heat Exchanger 1,562,200 2,575,000Pump 16,400 73,300Stripper 190,200 516,000MEA solvent 14,000 -
Total - 3,854,900 5,917,600Wind power - 111,300,000 -Solar power - 7,158,000 -H2O demineraliser - 1,112,500 -Electrolyser - 65,076,200 -H2 storage - 12,827,500 -CO2 Storage - 7,213,300 -BTX separation - 2,303,700 -Total - 206,991,200 -
Figure 5.4
BTX Reactor 181,800 511,400Comp 1 61,100 223,700Comp 2 853,000 1,067,800Comp 3 2,342,700 2,544,800Comp 4 1,640,600 1,872,400Comp 5 1,400,600 1,518,700Cooler 1 152,100 293,300Cooler 2 68,300 178,400Degasser 78,600 487,300Flash 1 10,000 20,000Flash 2 34,400 133,900Heat Exchanger 1 126,600 259,400Heat Exchanger 2 65,500 187,100Heat Exchanger 3 24,700 105,800Heat Exchanger 4 40,300 241,100Heat Exchanger 5 8,300 44,900MEOH Reactor 85,400 232,800Separator 2 28,000 144,400MeOH catalyst 291,900 -BTX catalyst 296,800 -
Total - 7,780,600 9,999,500
CAPEX - 234,543,800
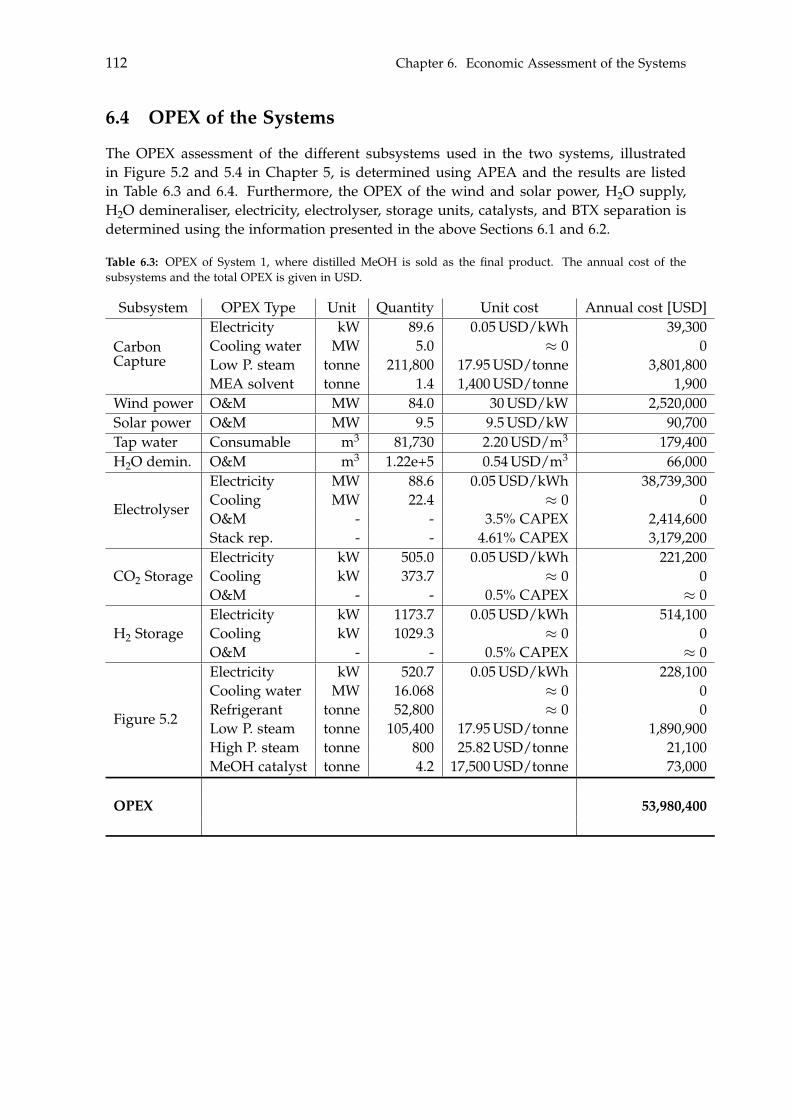
112 Chapter 6. Economic Assessment of the Systems
6.4 OPEX of the Systems
The OPEX assessment of the different subsystems used in the two systems, illustratedin Figure 5.2 and 5.4 in Chapter 5, is determined using APEA and the results are listedin Table 6.3 and 6.4. Furthermore, the OPEX of the wind and solar power, H2O supply,H2O demineraliser, electricity, electrolyser, storage units, catalysts, and BTX separation isdetermined using the information presented in the above Sections 6.1 and 6.2.
Table 6.3: OPEX of System 1, where distilled MeOH is sold as the final product. The annual cost of thesubsystems and the total OPEX is given in USD.
Subsystem OPEX Type Unit Quantity Unit cost Annual cost [USD]
CarbonCapture
Electricity kW 89.6 0.05 USD/kWh 39,300Cooling water MW 5.0 ⇡ 0 0Low P. steam tonne 211,800 17.95 USD/tonne 3,801,800MEA solvent tonne 1.4 1,400 USD/tonne 1,900
Wind power O&M MW 84.0 30 USD/kW 2,520,000Solar power O&M MW 9.5 9.5 USD/kW 90,700Tap water Consumable m3 81,730 2.20 USD/m3 179,400H2O demin. O&M m3 1.22e+5 0.54 USD/m3 66,000
Electrolyser
Electricity MW 88.6 0.05 USD/kWh 38,739,300Cooling MW 22.4 ⇡ 0 0O&M - - 3.5% CAPEX 2,414,600Stack rep. - - 4.61% CAPEX 3,179,200
CO2 StorageElectricity kW 505.0 0.05 USD/kWh 221,200Cooling kW 373.7 ⇡ 0 0O&M - - 0.5% CAPEX ⇡ 0
H2 StorageElectricity kW 1173.7 0.05 USD/kWh 514,100Cooling kW 1029.3 ⇡ 0 0O&M - - 0.5% CAPEX ⇡ 0
Figure 5.2
Electricity kW 520.7 0.05 USD/kWh 228,100Cooling water MW 16.068 ⇡ 0 0Refrigerant tonne 52,800 ⇡ 0 0Low P. steam tonne 105,400 17.95 USD/tonne 1,890,900High P. steam tonne 800 25.82 USD/tonne 21,100MeOH catalyst tonne 4.2 17,500 USD/tonne 73,000
OPEX 53,980,400
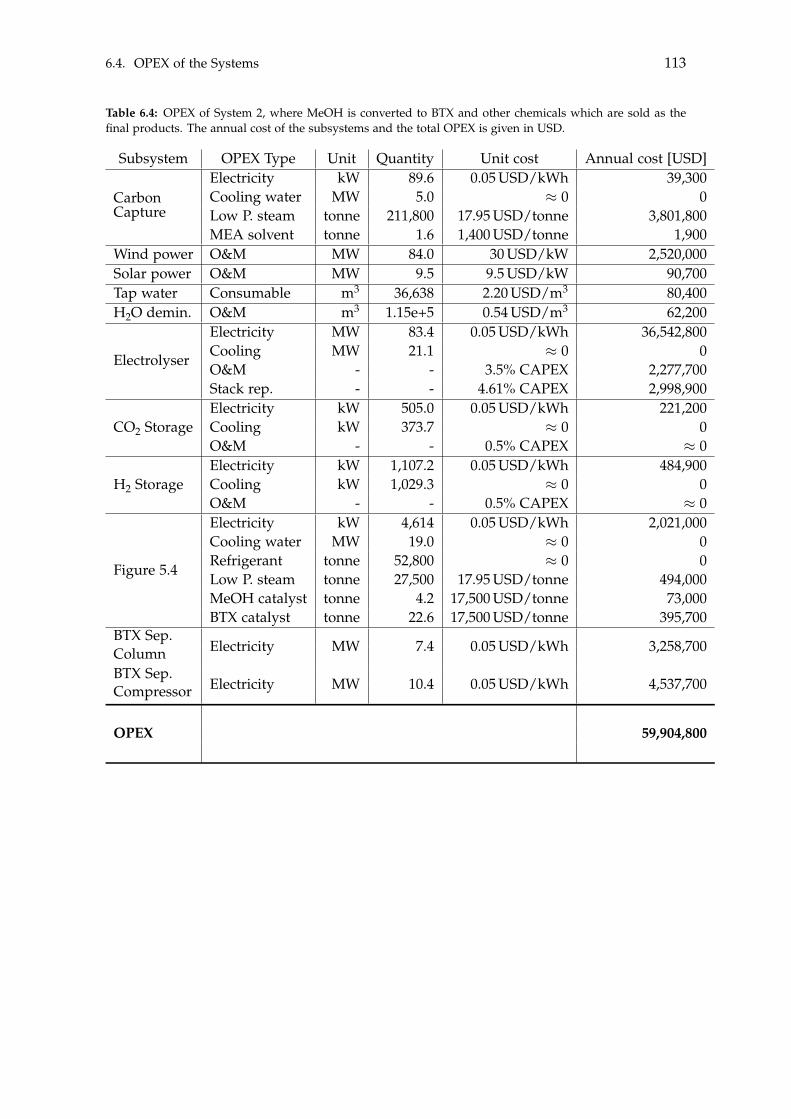
6.4. OPEX of the Systems 113
Table 6.4: OPEX of System 2, where MeOH is converted to BTX and other chemicals which are sold as thefinal products. The annual cost of the subsystems and the total OPEX is given in USD.
Subsystem OPEX Type Unit Quantity Unit cost Annual cost [USD]
CarbonCapture
Electricity kW 89.6 0.05 USD/kWh 39,300Cooling water MW 5.0 ⇡ 0 0Low P. steam tonne 211,800 17.95 USD/tonne 3,801,800MEA solvent tonne 1.6 1,400 USD/tonne 1,900
Wind power O&M MW 84.0 30 USD/kW 2,520,000Solar power O&M MW 9.5 9.5 USD/kW 90,700Tap water Consumable m3 36,638 2.20 USD/m3 80,400H2O demin. O&M m3 1.15e+5 0.54 USD/m3 62,200
Electrolyser
Electricity MW 83.4 0.05 USD/kWh 36,542,800Cooling MW 21.1 ⇡ 0 0O&M - - 3.5% CAPEX 2,277,700Stack rep. - - 4.61% CAPEX 2,998,900
CO2 StorageElectricity kW 505.0 0.05 USD/kWh 221,200Cooling kW 373.7 ⇡ 0 0O&M - - 0.5% CAPEX ⇡ 0
H2 StorageElectricity kW 1,107.2 0.05 USD/kWh 484,900Cooling kW 1,029.3 ⇡ 0 0O&M - - 0.5% CAPEX ⇡ 0
Figure 5.4
Electricity kW 4,614 0.05 USD/kWh 2,021,000Cooling water MW 19.0 ⇡ 0 0Refrigerant tonne 52,800 ⇡ 0 0Low P. steam tonne 27,500 17.95 USD/tonne 494,000MeOH catalyst tonne 4.2 17,500 USD/tonne 73,000BTX catalyst tonne 22.6 17,500 USD/tonne 395,700
BTX Sep.Column Electricity MW 7.4 0.05 USD/kWh 3,258,700
BTX Sep.Compressor Electricity MW 10.4 0.05 USD/kWh 4,537,700
OPEX 59,904,800
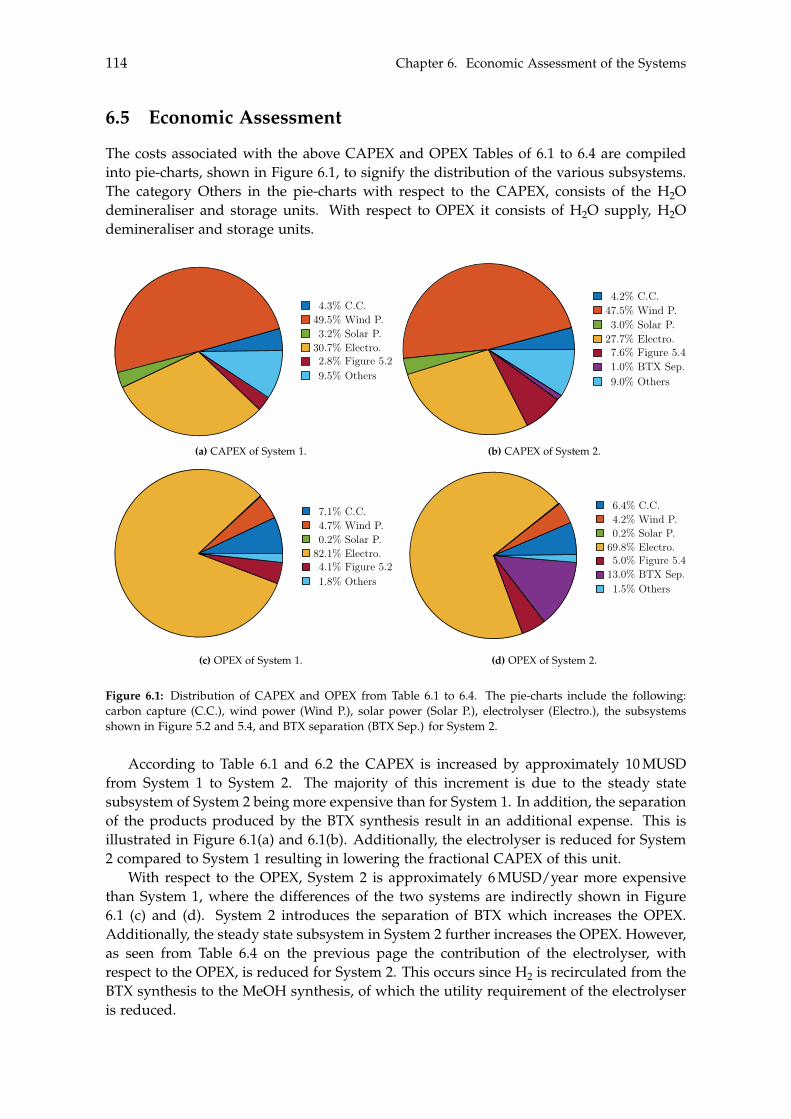
114 Chapter 6. Economic Assessment of the Systems
6.5 Economic Assessment
The costs associated with the above CAPEX and OPEX Tables of 6.1 to 6.4 are compiledinto pie-charts, shown in Figure 6.1, to signify the distribution of the various subsystems.The category Others in the pie-charts with respect to the CAPEX, consists of the H2Odemineraliser and storage units. With respect to OPEX it consists of H2O supply, H2Odemineraliser and storage units.
4.3% C.C.49.5% Wind P.3.2% Solar P.
30.7% Electro.2.8% Figure 5.29.5% Others
(a) CAPEX of System 1.
4.2% C.C.47.5% Wind P.3.0% Solar P.
27.7% Electro.7.6% Figure 5.41.0% BTX Sep.9.0% Others
(b) CAPEX of System 2.
7.1% C.C.4.7% Wind P.0.2% Solar P.
82.1% Electro.4.1% Figure 5.21.8% Others
(c) OPEX of System 1.
6.4% C.C.4.2% Wind P.0.2% Solar P.
69.8% Electro.5.0% Figure 5.4
13.0% BTX Sep.1.5% Others
(d) OPEX of System 2.
Figure 6.1: Distribution of CAPEX and OPEX from Table 6.1 to 6.4. The pie-charts include the following:carbon capture (C.C.), wind power (Wind P.), solar power (Solar P.), electrolyser (Electro.), the subsystemsshown in Figure 5.2 and 5.4, and BTX separation (BTX Sep.) for System 2.
According to Table 6.1 and 6.2 the CAPEX is increased by approximately 10 MUSDfrom System 1 to System 2. The majority of this increment is due to the steady statesubsystem of System 2 being more expensive than for System 1. In addition, the separationof the products produced by the BTX synthesis result in an additional expense. This isillustrated in Figure 6.1(a) and 6.1(b). Additionally, the electrolyser is reduced for System2 compared to System 1 resulting in lowering the fractional CAPEX of this unit.
With respect to the OPEX, System 2 is approximately 6 MUSD/year more expensivethan System 1, where the differences of the two systems are indirectly shown in Figure6.1 (c) and (d). System 2 introduces the separation of BTX which increases the OPEX.Additionally, the steady state subsystem in System 2 further increases the OPEX. However,as seen from Table 6.4 on the previous page the contribution of the electrolyser, withrespect to the OPEX, is reduced for System 2. This occurs since H2 is recirculated from theBTX synthesis to the MeOH synthesis, of which the utility requirement of the electrolyseris reduced.
6.6. Sensitivity Analysis 115
6.6 Sensitivity Analysis
Given the CAPEX and the OPEX, a sensitivity analysis can be conducted for each system.As discussed, some of the parameters with respect to both the CAPEX and OPEX arerelatively unreliable, meaning their values may not be representative. Even though this isthe case for multiple parameters, only a few are of interest due to their expected significantinfluence towards the profit. Within the first eight rows in Table 6.5 on the following pageare the parameters which are of interest for both systems, whereas the last row is onlyinvestigated when considering System 2. In total, seven parameters are of interest for bothsystems: the electricity price, CAPEX and OPEX of the electrolyser, the interest rate andpayback period for the loan, the asking price of the O2 and lastly the asking prices for theproducts.
The price of the electricity, as well as the interest rate and payback period, are param-eters which are affected by the size of the system. Independent of which end product isdesired, the total electricity demand is of a magnitude which corresponds to the cheapestavailable prices, since both exceeds 150 GWh/year. However, these values differ, and fur-thermore they have a significant influence on the profit. A baseline value of 0.05 USD/kWhwas chosen, where the minimum and maximum value were defined to be 0.043 USD/kWhto 0.073 USD/kWh due to the variation in the literature. The interest rate and paybackperiod are dependent on multiple aspects, however both of these values are expected tohave a relatively large impact towards the profit. An interest rate of 3 % and a paybackperiod of 20 years were chosen to define as the baseline values. Due to their influence,these have been cross varied as may be seen in Table 6.5 on the next page, such that theinterest rate and payback period has been investigate for 1-, 3- and 5 % for 10-, 20- and30 years.
As discussed, the electrolyser has the greatest power consumption within the systemsindependent of which end product is desired. In Section 3.3 it was stated that the modelof the electrolyser was based on empirical data obtained from a bench scaled setup. Itwas further also concluded that if a commercial electrolyser was to be scaled, the powerconsumption could be reduced by 13 %. Therefore, as the baseline value for the electrol-yser is defined from the bench scaled model, the influence of a power consumption being90 % and 80 % of the baseline power consumption is investigated. Similar to the powerconsumption for the electrolyser, its CAPEX is also known to vary due to technological de-velopment. The baseline value for the CAPEX has been defined to be 780 USD/kW wherethe influence of a lower value at 480 USD/kW and an increased value at 1,080 USD/kWare further analysed. The primary product from the electrolyser is the H2, however O2 isalso produced, which could be sold. As previously discussed the price of the O2 can varyfrom which it is included in the sensitivity analysis. The baseline value is defined by anasking price of 40 USD/tonne from which it has been varied by ±50 %.
The last parameter which is expected to influence both systems is the asking price forthe end products. Initially the asking prices of the products were defined to equal thoseproduced from non-renewable sources. However, it is expected that the asking pricesshould be greater when the products are produced from renewable sources. All of theproduct prices have therefore been upscaled by a factor of 1.5 and 2.0 in the sensitivityanalysis.
For System 2, an additional parameter is of interest, which is the separation of the prod-ucts produced from the BTX synthesis. As stated in Section 2.6 the product stream, when
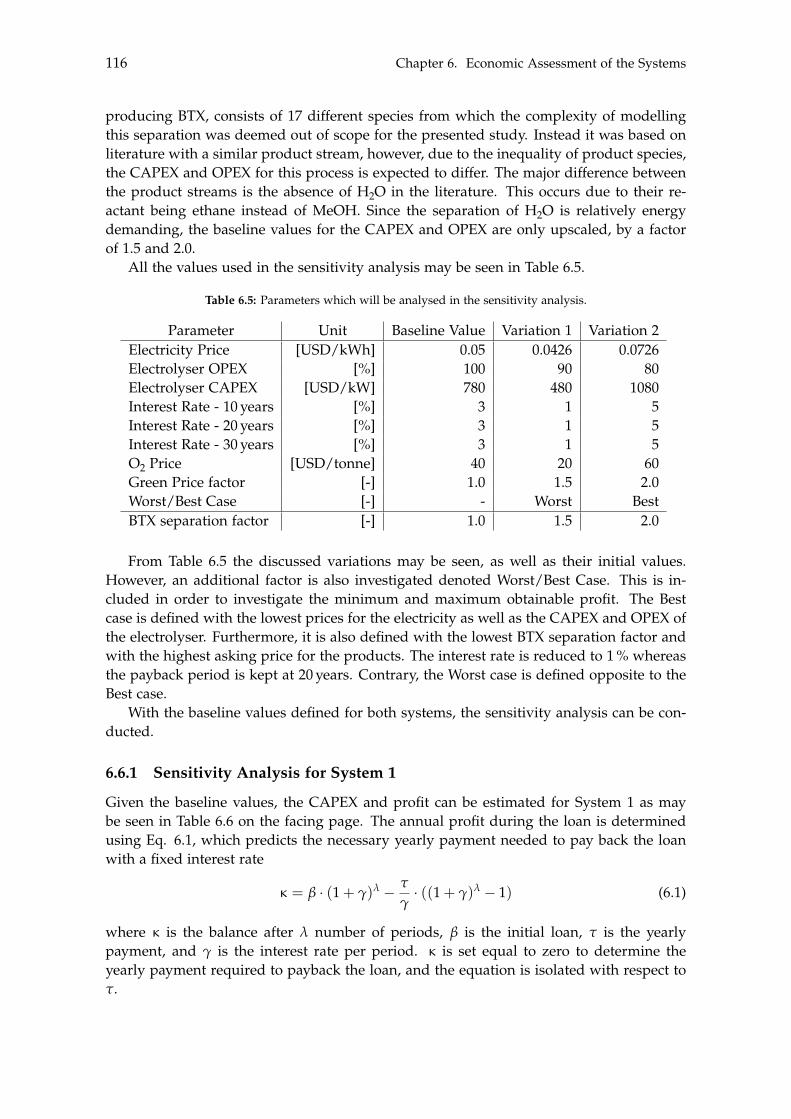
116 Chapter 6. Economic Assessment of the Systems
producing BTX, consists of 17 different species from which the complexity of modellingthis separation was deemed out of scope for the presented study. Instead it was based onliterature with a similar product stream, however, due to the inequality of product species,the CAPEX and OPEX for this process is expected to differ. The major difference betweenthe product streams is the absence of H2O in the literature. This occurs due to their re-actant being ethane instead of MeOH. Since the separation of H2O is relatively energydemanding, the baseline values for the CAPEX and OPEX are only upscaled, by a factorof 1.5 and 2.0.
All the values used in the sensitivity analysis may be seen in Table 6.5.
Table 6.5: Parameters which will be analysed in the sensitivity analysis.
Parameter Unit Baseline Value Variation 1 Variation 2Electricity Price [USD/kWh] 0.05 0.0426 0.0726Electrolyser OPEX [%] 100 90 80Electrolyser CAPEX [USD/kW] 780 480 1080Interest Rate - 10 years [%] 3 1 5Interest Rate - 20 years [%] 3 1 5Interest Rate - 30 years [%] 3 1 5O2 Price [USD/tonne] 40 20 60Green Price factor [-] 1.0 1.5 2.0Worst/Best Case [-] - Worst BestBTX separation factor [-] 1.0 1.5 2.0
From Table 6.5 the discussed variations may be seen, as well as their initial values.However, an additional factor is also investigated denoted Worst/Best Case. This is in-cluded in order to investigate the minimum and maximum obtainable profit. The Bestcase is defined with the lowest prices for the electricity as well as the CAPEX and OPEX ofthe electrolyser. Furthermore, it is also defined with the lowest BTX separation factor andwith the highest asking price for the products. The interest rate is reduced to 1 % whereasthe payback period is kept at 20 years. Contrary, the Worst case is defined opposite to theBest case.
With the baseline values defined for both systems, the sensitivity analysis can be con-ducted.
6.6.1 Sensitivity Analysis for System 1
Given the baseline values, the CAPEX and profit can be estimated for System 1 as maybe seen in Table 6.6 on the facing page. The annual profit during the loan is determinedusing Eq. 6.1, which predicts the necessary yearly payment needed to pay back the loanwith a fixed interest rate
= b · (1 + g)l � t
g· ((1 + g)l � 1) (6.1)
where is the balance after l number of periods, b is the initial loan, t is the yearlypayment, and g is the interest rate per period. is set equal to zero to determine theyearly payment required to payback the loan, and the equation is isolated with respect tot.
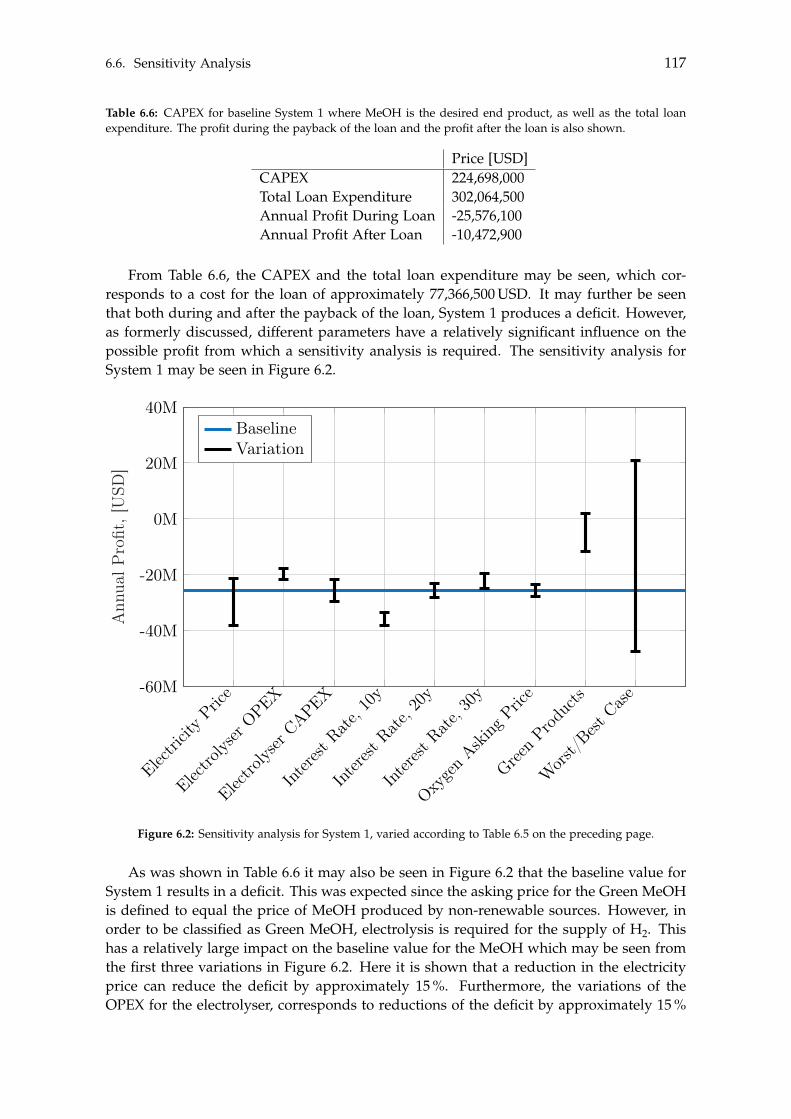
6.6. Sensitivity Analysis 117
Table 6.6: CAPEX for baseline System 1 where MeOH is the desired end product, as well as the total loanexpenditure. The profit during the payback of the loan and the profit after the loan is also shown.
Price [USD]CAPEX 224,698,000Total Loan Expenditure 302,064,500Annual Profit During Loan -25,576,100Annual Profit After Loan -10,472,900
From Table 6.6, the CAPEX and the total loan expenditure may be seen, which cor-responds to a cost for the loan of approximately 77,366,500 USD. It may further be seenthat both during and after the payback of the loan, System 1 produces a deficit. However,as formerly discussed, different parameters have a relatively significant influence on thepossible profit from which a sensitivity analysis is required. The sensitivity analysis forSystem 1 may be seen in Figure 6.2.
Elect
ricity
Price
Elect
rolyse
r OPEX
Elect
rolyse
r CAPEX
Intere
stRate
, 10y
Intere
stRate
, 20y
Intere
stRate
, 30y
Oxyge
n Asking
Price
Green Pr
oduc
ts
Wors
t/Best
Case-60M
-40M
-20M
0M
20M
40M
Ann
ualP
rofit
,[U
SD]
BaselineVariation
Figure 6.2: Sensitivity analysis for System 1, varied according to Table 6.5 on the preceding page.
As was shown in Table 6.6 it may also be seen in Figure 6.2 that the baseline value forSystem 1 results in a deficit. This was expected since the asking price for the Green MeOHis defined to equal the price of MeOH produced by non-renewable sources. However, inorder to be classified as Green MeOH, electrolysis is required for the supply of H2. Thishas a relatively large impact on the baseline value for the MeOH which may be seen fromthe first three variations in Figure 6.2. Here it is shown that a reduction in the electricityprice can reduce the deficit by approximately 15 %. Furthermore, the variations of theOPEX for the electrolyser, corresponds to reductions of the deficit by approximately 15 %
118 Chapter 6. Economic Assessment of the Systems
and 30 %. Lastly, with respect to electrolyser, the CAPEX has also been varied whichcorresponds to a change in the baseline value by ±12 %. It can therefore be concluded thatas an isolated component the electrolyser has a relatively significant influence towards thepossible profit, from which more precise values with respect to the electrolyser is requiredin order to determine the possible profit.
From the consecutive three variations, the influence of the interest rate linked with thepayback period may be seen. As expected it can be concluded that with a higher interestrate, the deficit increases. Likewise, the shorter the payback period, the greater the deficitbecomes. The latter occurs since the price for the loan decreases as the payback periodis shortened, however, the loan has to be payed back faster which affects the possibleprofit during the payback period. Also, the relative change between 10- and 20 years isgreater than for 20- and 30 years, which is due to the influence of the interest rate. It cantherefore be concluded that the interest rate has a relatively significant influence towardsthe possible profit.
Additionally, the asking price of O2 was varied. It may be seen that this variation hasthe smallest influence towards the baseline value. It was varied by ±50 % from the baselinevalue corresponding to a change in the deficit by approximately ±9 %. It can hereby beconcluded that the asking price for the O2 is the least significant value of those which werevaried.
From Figure 6.2 on the previous page it may be seen that the variation of the askingprice for the end products has the greatest influence on the baseline value as an isolatedparameter. Yet, by up-scaling the asking price of the Green MeOH by a factor of 1.5System 1 will remain unprofitable, whereas a factor of 2.0 corresponds to a profit of ap-proximately 2,056,300 USD. This trend was expected since the production of MeOH fromnon-renewable sources are well developed, resulting in relatively cheap prices. However,by producing Green MeOH the processes are more energy demanding as was concludeddue to the electrolyser. It can therefore be concluded that it is necessary to increase theasking price for the Green MeOH in order to produce a profit. This influence may furtheralso be seen in the last variation which is the Worst- and Best case. From this analysis itcan be concluded that the Worst case results in a deficit of 47,445,500 USD, whereas theBest case results in a profit of approximately 21,041,000 USD.
From the sensitivity analysis regarding System 1, it can be concluded that the baselinevalue produces a deficit. It can further be concluded that the model is mostly sensitive withrespect to the asking price for the Green MeOH. Therefore, in order to estimate if System1 can become profitable, a precise value for the asking price of the produced Green MeOHis required.
6.6.2 Sensitivity Analysis for System 2
Given the baseline values, the CAPEX and profit can be estimated for System 2 whereBTX is the desired end product as may be seen in Table 6.7 on the facing page. Theannual profit during the loan is determined using Eq. 6.1 on page 116, which predicts thenecessary yearly payment needed to pay back the loan with a fixed interest rate.
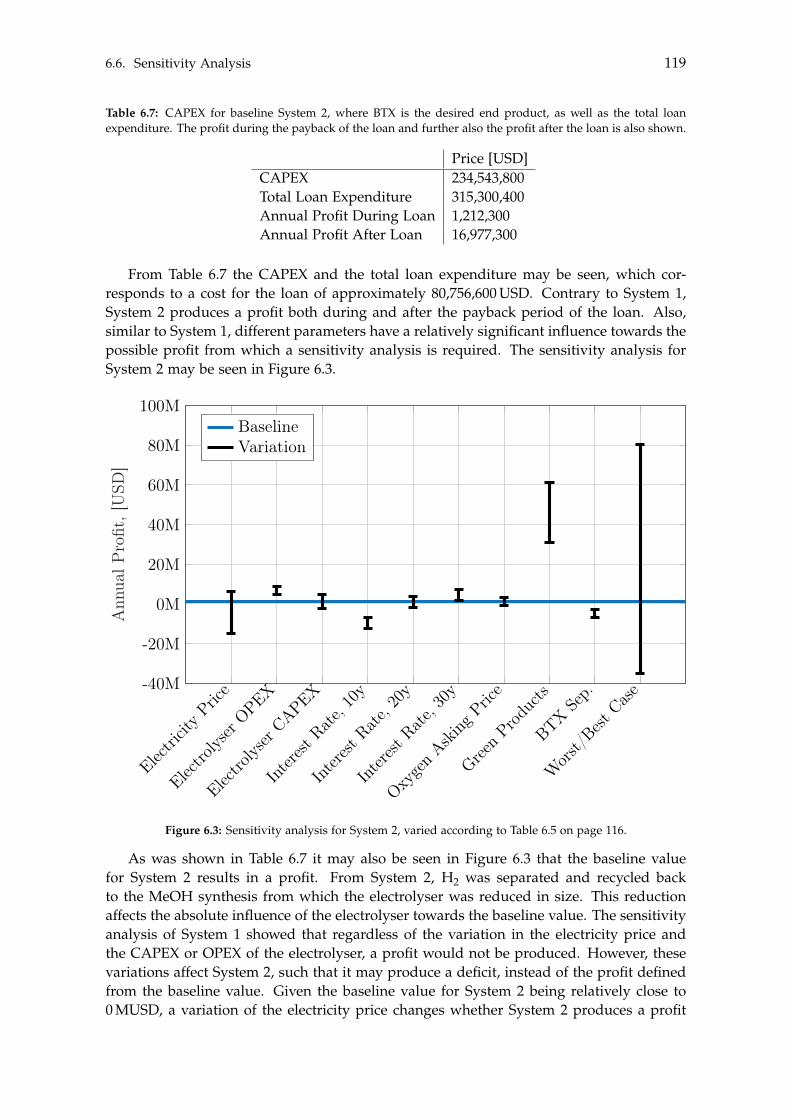
6.6. Sensitivity Analysis 119
Table 6.7: CAPEX for baseline System 2, where BTX is the desired end product, as well as the total loanexpenditure. The profit during the payback of the loan and further also the profit after the loan is also shown.
Price [USD]CAPEX 234,543,800Total Loan Expenditure 315,300,400Annual Profit During Loan 1,212,300Annual Profit After Loan 16,977,300
From Table 6.7 the CAPEX and the total loan expenditure may be seen, which cor-responds to a cost for the loan of approximately 80,756,600 USD. Contrary to System 1,System 2 produces a profit both during and after the payback period of the loan. Also,similar to System 1, different parameters have a relatively significant influence towards thepossible profit from which a sensitivity analysis is required. The sensitivity analysis forSystem 2 may be seen in Figure 6.3.
Elect
ricity
Price
Elect
rolyse
r OPEX
Elect
rolyse
r CAPEX
Intere
stRate
, 10y
Intere
stRate
, 20y
Intere
stRate
, 30y
Oxyge
n Asking
Price
Green Pr
oduc
ts
BTXSe
p.
Wors
t/Best
Case-40M
-20M
0M
20M
40M
60M
80M
100M
Ann
ualP
rofit
,[U
SD]
BaselineVariation
Figure 6.3: Sensitivity analysis for System 2, varied according to Table 6.5 on page 116.
As was shown in Table 6.7 it may also be seen in Figure 6.3 that the baseline valuefor System 2 results in a profit. From System 2, H2 was separated and recycled backto the MeOH synthesis from which the electrolyser was reduced in size. This reductionaffects the absolute influence of the electrolyser towards the baseline value. The sensitivityanalysis of System 1 showed that regardless of the variation in the electricity price andthe CAPEX or OPEX of the electrolyser, a profit would not be produced. However, thesevariations affect System 2, such that it may produce a deficit, instead of the profit definedfrom the baseline value. Given the baseline value for System 2 being relatively close to0 MUSD, a variation of the electricity price changes whether System 2 produces a profit
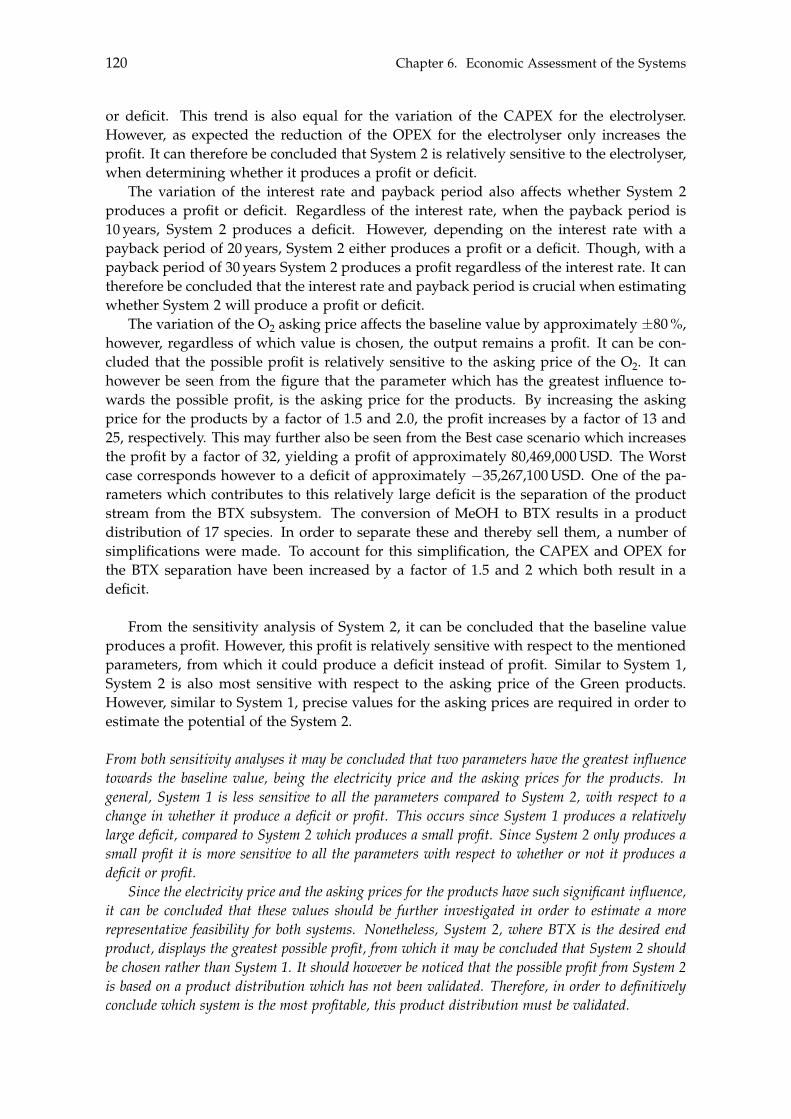
120 Chapter 6. Economic Assessment of the Systems
or deficit. This trend is also equal for the variation of the CAPEX for the electrolyser.However, as expected the reduction of the OPEX for the electrolyser only increases theprofit. It can therefore be concluded that System 2 is relatively sensitive to the electrolyser,when determining whether it produces a profit or deficit.
The variation of the interest rate and payback period also affects whether System 2produces a profit or deficit. Regardless of the interest rate, when the payback period is10 years, System 2 produces a deficit. However, depending on the interest rate with apayback period of 20 years, System 2 either produces a profit or a deficit. Though, with apayback period of 30 years System 2 produces a profit regardless of the interest rate. It cantherefore be concluded that the interest rate and payback period is crucial when estimatingwhether System 2 will produce a profit or deficit.
The variation of the O2 asking price affects the baseline value by approximately ±80 %,however, regardless of which value is chosen, the output remains a profit. It can be con-cluded that the possible profit is relatively sensitive to the asking price of the O2. It canhowever be seen from the figure that the parameter which has the greatest influence to-wards the possible profit, is the asking price for the products. By increasing the askingprice for the products by a factor of 1.5 and 2.0, the profit increases by a factor of 13 and25, respectively. This may further also be seen from the Best case scenario which increasesthe profit by a factor of 32, yielding a profit of approximately 80,469,000 USD. The Worstcase corresponds however to a deficit of approximately �35,267,100 USD. One of the pa-rameters which contributes to this relatively large deficit is the separation of the productstream from the BTX subsystem. The conversion of MeOH to BTX results in a productdistribution of 17 species. In order to separate these and thereby sell them, a number ofsimplifications were made. To account for this simplification, the CAPEX and OPEX forthe BTX separation have been increased by a factor of 1.5 and 2 which both result in adeficit.
From the sensitivity analysis of System 2, it can be concluded that the baseline valueproduces a profit. However, this profit is relatively sensitive with respect to the mentionedparameters, from which it could produce a deficit instead of profit. Similar to System 1,System 2 is also most sensitive with respect to the asking price of the Green products.However, similar to System 1, precise values for the asking prices are required in order toestimate the potential of the System 2.
From both sensitivity analyses it may be concluded that two parameters have the greatest influencetowards the baseline value, being the electricity price and the asking prices for the products. Ingeneral, System 1 is less sensitive to all the parameters compared to System 2, with respect to achange in whether it produce a deficit or profit. This occurs since System 1 produces a relativelylarge deficit, compared to System 2 which produces a small profit. Since System 2 only produces asmall profit it is more sensitive to all the parameters with respect to whether or not it produces adeficit or profit.
Since the electricity price and the asking prices for the products have such significant influence,it can be concluded that these values should be further investigated in order to estimate a morerepresentative feasibility for both systems. Nonetheless, System 2, where BTX is the desired endproduct, displays the greatest possible profit, from which it may be concluded that System 2 shouldbe chosen rather than System 1. It should however be noticed that the possible profit from System 2is based on a product distribution which has not been validated. Therefore, in order to definitivelyconclude which system is the most profitable, this product distribution must be validated.
Chapter 7
DiscussionIn this chapter the most considerable assumptions will be discussed. The first concernsthe cooling and the second concerns the product distribution of System 2. A significantamount of cooling is required throughout the two systems, where an initial assumptionwas applied that it could mainly be supplied by district cooling. With respect to theproduct distribution for System 2, this assumption was made due to literature listing thespecies as lumped products. However, this clearly influenced the feasibility of System 2 aspresented in 6.
7.1 Cooling
Cooling is required throughout the systems which was either supplied by the districtheating network or district cooling. If district heating is utilised the cooling could become arevenue, whereas the district cooling could be supplied from the quarry located in Rørdal.Regarding district heating, only one stream was chosen, in System 2, to transfer energy,due to the constraint that the integration of district heating must result in an income.However, the Danish government has designed the law regarding district heating suchthat it is not profitable for companies to rely on this income to be significant in their totalprofit. This has been done in order to force companies to become more energy efficient[Energistyrelsen, 2021a]. Therefore, since the additional income is used as the constraint,it results in only one stream being utilised, from which the remaining cooling must besupplied from district cooling. The required district cooling of System 1 was determinedto be 44.86 MW and 46.46 MW for System 2, according to Table 6.3 and 6.4 on page 113. Ithas been assumed that the district cooling is supplied from the quarry located in Rørdal.A district cooling network from the formerly mentioned quarry, is already connected to"Aalborg University Hospital" where the pipelines are located near RenoNord. As suchit is expected that the installation costs would be insignificant if either system of thispresented study was to be connected. Even though this cooling system should be fairlyeasy to access, the capacity must be considered. The currently established district coolingnetwork has a capacity of 7.3 MW which is able to be upgraded to a capacity of 11.0 MW[Pedersen, 2021]. This suffices the cooling requirement of "Aalborg University Hospital" ofwhich it is expected that an excess cooling of at least 3.7 MW would be available from thequarry located in Rørdal. Yet, this does not suffice the cooling requirement of the systemsof the presented study, hence an alternative solution must be made. As such the coolingof "Nordjylland Power Station" will be investigated in order to assess if the cooling of thesystems of the presented study could utilise the same cooling procedure.
This power station is a coal fired combined heat- and power plant located just northof Aalborg, by the coast of the Limfjord. The cooling of the power plant is supplied by
121
122 Chapter 7. Discussion
water from the fjord, after which the heated water is discharged back into the fjord. It wasassessed in 1993, prior to the establishment of the plant, that it would not significantlyimpact the fjord if this method was utilised [Amt, 1993]. The temperature difference be-tween the inlet and outlet of the cooling water is 12 �C and its maximum volume flowis estimated to be 27 m3/s [Naturstyrelsen, 2011][Kommune, 2011]. Applying the sametemperature difference, the corresponding volume flow of cooling water in the presentedstudy can be compared to the quantity used by this power station, to estimate if it wouldbe realistic to utilise the fjord to cool the systems. Assuming the H2O to be at standardconditions for the calculations, the corresponding volume flows of System 1 and System2 become 0.89 m3/s and 0.93 m3/s, respectively. However, even if this implementation isdeemed achievable, it would require further agreement with Aalborg municipality andthe Danish government due to the possible environmental impact. Utilising this method,the assumption regarding negligible OPEX associated with cooling is accepted. Yet, thisimplementation might increase the CAPEX significantly which should also be included.
7.2 Product Distribution of System 2
In Table 4.11 on page 83 the prices for the different species produced in the BTX synthesiswere shown where it was found that they varied from 51 USD/tonne to 34,571 USD/tonne.Since the distribution of the species has not been validated, the income for the productsformed in the BTX synthesis may not be representative, due to this relatively large pricevariation. The study of which the reaction scheme is based on, only defines the lumpedproduct distribution of the Light Gases, Alkanes, Aromatics, Others and Heavy. Since theindividual molar fraction of the species within these lumped products cannot be validatedand their individual prices vary significantly, the profit for these products may not be rep-resentative. This could influence the economics such that System 1 may be more lucrativethan System 2. Therefore, in order to validate the possible income of selling the products itis required that experiments are conducted in order to determine the product distributionof each species.
Chapter 8
ConclusionThe objective of the presented study was to conduct a techno-economic analysis, in orderto determine if the production of Green methanol would be more profitable comparedto converting it to Green BTX. In order to make this assessment, modelling of the entiresystem was required, from the initial constituents being the CO2 captured in the flue gasof RenoNord and the H2 dissociated from H2O electrolysis. Two models were designed,one for each system, depending on the desired end product. Both models were designedequally up to the point where the produced methanol should either be distilled or con-verted into BTX.
Both the carbon capture and electrolyser were made as dynamic models, due to thefluctuation of the CO2 flow caused by variations in heat and electricity produced byRenoNord. Furthermore, the electricity supplied to the electrolyser varied, due to it partlybeing supplied from renewable sources. The renewable energy was partly produced by20 4.2 MW wind turbines and PV panels with a capacity of 9.5 MW, while the remainderwas supplied by the grid. The modelling of the carbon capture subsystem was based onliterature. The electrolyser was based on a bench scaled system, where it was determinedthat the energy contribution could be reduced by 13 % if it was scaled according to theperformance of a commercialised electrolyser. It was of interest to operate the methanolsynthesis at steady state in order to avoid partial loading which could reduce its efficiency.In order to achieve this, storage of both CO2 and H2 was incorporated to convert thefluctuating inputs into steady state outputs. The methanol synthesis was also based ona literature, from which an optimisation algorithm was implemented, in order to achievethe highest yield of methanol. The end product for the first system was Green methanolfrom which two different distillations were implemented to achieve high purity Greenmethanol. The purpose of the first distillation, was to remove the gases which were dis-solved in the liquid. Secondly, a liquid-liquid distillation was implemented in order toseparate the remaining mixture, consisting of water and methanol.
System 2 was implemented as a continuation of System 1 after its first distillation,where only the liquids remained from the methanol synthesis. The BTX synthesis wasalso based on literature. The conversion of methanol into BTX is unexplored from whichlimited data were available. The study, from which the BTX conversion was based upon,only defined the lumped product distributions and not the individual species. As suchit became difficult to verify the resulting product distribution. In order replicate the re-sults listed in the study, an optimisation algorithm was implemented which resulted inacceptable differences, from which the product distribution was defined. Following theBTX synthesis, separation of these products was required. The methanol to BTX con-version resulted in 17 species from which modelling this separation would be complex.Instead the separation of these species would be based on literature. A relatively similar
123
124 Chapter 8. Conclusion
study was found, which defined a separation subsystem for the products acquired fromthe conversion of Ethane to BTX. The major difference, between the presented study andthis literature, was the water that occurred when converting methanol to BTX comparedto Ethane to BTX. However, from the study a separation subsystem was defined such thatthe most profitable species could be separated.
With both systems defined, heat integration was applied for both systems in order toreduce their utilities. This resulted in a utility cost reduction for heaters, coolers and heatexchangers at 97.0 % and 97.3 % for System 1 and System 2, respectively. Before concludingwhich system would be the most profitable, a sensitivity analysis was conducted for eachsystem in order to investigate the influence of different parameters, which were expectedto significantly influence the profit. From these sensitivity analyses it was determined thatSystem 1, where methanol was the desired end product, produced a deficit, contrary toSystem 2 where BTX was the desired end product. System 1 produced an annual deficitof 25,576,100 USD but showed the potential profit of 21,041,000 USD when considering theBest case. System 2 produced an annual profit of 1,212,300 USD but showed a potentialprofit of 80,469,000 USD when considering the Best case scenario. Initially, the askingprices were based on products which were produced from non-renewable sources. How-ever, the products of the presented study were produced from renewable sources fromwhich they could be classified as Green products, of which it was expected that theseproducts had a greater asking price. As such the asking prices of the products were variedin the sensitivity analysis, which concluded that these had the greatest influence on theirprofitability.
Initially, it could be concluded that System 2 was the most profitable system, however,one simplification must be taken into account, which was with respect to the separation ofthe products produced in the BTX subsystem. The Alkanes: C4H10, C5H12 and C6H14 wereseparated as one lumped product along with the excess methanol, and sold as one, whichwas known to not be representative. BTX consist of benzene, toluene and xylene wherethe two latter species were separated together and sold as one. The benzene was separatedalong with the excess water and further discarded due to its relatively low annual amount.Both C9H12 and C10H14 were separated and sold individually.
The presented study can hence conclude that two robust models have been designed whichcan be used to determine which end product is most profitable. Yet, it is necessary to ac-quire precise prices for the end products to determine the profitability of the two systems,as well as the product distribution of the BTX production.
Bibliography
AalborgForsyning. Fjernkøling, 2021a. URL https://aalborgforsyning.dk/erhverv/Koling.
AalborgForsyning. Erhvervskunder (ekskl. moms, inkl. statslig afgift) ved aal-borg vand a/s, 2021b. URL https://aalborgforsyning.dk/media/m0sjx52j/vand-erhverv-februar-2021.pdf.
D. Aaron and C. Tsouris. Separation of co2 from flue gas: A review. Separation Science andTechnology, 40(1-3):321–348, 2005. doi:https://doi.org/10.1081/SS-200042244.
C. Acar and I. Dincer. Comparative assessment of hydrogen production methods fromrenewable and non-renewable sources. International Journal of Hydrogen Energy, 39(1):1–12, 2014. doi:https://doi.org/10.1016/j.ijhydene.2013.10.060.
I. R. E. Agency. Renewable power generation costs in 2019, 2019. URLhttps://www.irena.org/-/media/Files/IRENA/Agency/Publication/2020/Jun/IRENA_Power_Generation_Costs_2019.pdf.
A. Alarifi. Modeling, analysis and optimization of the gas-phase methanol synthesisprocess, 2016. URL https://uwspace.uwaterloo.ca/bitstream/handle/10012/10156/Alarifi_Abdulaziz.pdf;jsessionid=C880FAA24C9CA88BB72A2E805937E763?sequence=1.
AlfaAesar. L04493 1,2,4,5-tetramethylbenzene, 97+%, 2021. URL https://www.alfa.com/en/catalog/L04493/.
Alibaba. zeolite zsm 5 catalyst, 2021. URL https://www.alibaba.com/showroom/zeolite-zsm-5-catalyst.html.
Alibabba. Alibabba, 2021a. URL duct-detail/Pentane-Pentane-China-Supplier-Pentane-ISO_1600144634772.html?spm=a2700.7724857.normal_offer.d_title.5bdd56e5yyBfp3&s=p.
Alibabba. Iso sgs 99% pseudocumene psc, 2021b. URL https://www.alibaba.com/product-detail/ISO-SGS-99-Pseudocumene-PSC-1_1600200294473.html?spm=a2700.7724857.normal_offer.d_title.5887735bqC7CBS.
Americanchemistry. Olefins uses and benefits, 2020. URL https://www.americanchemistry.com/olefinspanel/Uses-and-Benefits.html.
N. Amt. Regionplan nordjyland tillæg nr.26. Technical report, MiljøministerietNaturstyrelsen, 1993. URL https://naturstyrelsen.dk/media/nst/Attachments/RPT026.pdf.
125
126 Bibliography
I. Aspen Technology. Aspen plus user guide, 2000. URL https://web.ist.utl.pt/ist11038/acad/Aspen/AspUserGuide10.pdf.
ATSDR. Toxicological profile for benzene, 2007. URL https://wwwn.cdc.gov/TSP/ToxProfiles/ToxProfiles.aspx?id=40&tid=14.
A. Benato, A. Macor, and A. Rossetti. Biogas engine emissions: Stan-dards and on-site measurements. Energy Procedia, 126( ):398–405, 2017.doi:https://doi.org/10.1016/j.egypro.2017.08.278.
M. Bertau, H. Offermanns, L. Plass, F. Schmidt, and H.-J. Wernicke. Methanol: The BasicChemical and Energy Feedstock of the Future, volume Springer, edition, 2014. ISBN978-3-642-39708-0.
S. Brynolf, M. Taljegard, M. Grahn, and J. Hansson. Electrofuels for the transport sector:A review of production costs. Renewable and Sustainable Energy Reviews, 81(2):1887–1905,2018. doi:https://doi.org/10.1016/j.rser.2017.05.288.
M. Bui, C. Adjiman, A. Bardow, E. Anthony, A. Boston, S. Brown, P. Fennell, S. Fuss,A. Galindo, and L. Hackett. Carbon capture and storage (ccs): the way forward. Energy& Environmental Science, (5): , 2018. doi:https://doi.org/10.1039/c7ee02342a.
K. M. V. Bussche and G. F. Froment. A steady-state kinetic model for methanol synthe-sis and the water gas shift reaction on a commercial cu/zno/al2o3 catalyst. Journal ofcatalysis, 161(0156):1–10, 1996. doi:-.
A. Z. C. van Leeuwen. Innovative large-scale energy storage technologies and power-to-gas concepts after optimisation, 2018. URL https://www.storeandgo.info/fileadmin/downloads/deliverables_2019/20190801-STOREandGO-D8.3-RUG-Report_on_the_costs_involved_with_PtG_technologies_and_their_potentials_across_the_EU.pdf.
CatCost. Catcost spreadsheet (version 1.0.4), 2020. URL https://catcost.chemcatbio.org/documentation?fbclid=IwAR1OA4XxgS0MVaTiCi5u8_750p8rHcvkAOlroKvrYTkxm292J6gQeletYCQ.
ChemicalBook. Cas database list, 2021. URL https://www.chemicalbook.com/Price/1-2-4-Trimethylbenzene.htm.
A. Chen, F. Crowley, J. Lym, and P. Sanchez. Production of btx from ethane, 2015. URLhttps://repository.upenn.edu/cbe_sdr/73/.
G. Chen, T. Cai, K. Chaung, and A. Afacan. Foaming effect on random pack-ing performance. Chemical Engineering Research and Design, 85(2):278–282, 2007.doi:https://doi.org/10.1205/cherd06095.
K. T. Chuang and K. Nandakumar. Tray column: Design, 2000. URL https://hobbybrennen.ch/download/file.php?id=1818.
CleanEnergyReviews. Most efficient solar panels, 2021. URL https://www.cleanenergyreviews.info/blog/most-efficient-solar-panels.
A. Coker. Ludwig’s Applied Process Design for Chemical and Petrochemical Plants, volume 1.Gulf Professional Publishing, 4 edition, 2007. ISBN 978-0-7506-7766-0.
Bibliography 127
E. Commission. Demineralised water production from river water using membrane sep-aration technology, 2000. URL https://webgate.ec.europa.eu/life/publicWebsite/project/details/1306.
C. Corsaro, F. Mallamace, S. Vasi, S. Chen, H. E. Stanley, and D. Mallamace. Contrastingmicroscopic interactions determine the properties of water/methanol solutions. Frontiersof Physics, 13( ): , 2018. doi:10.1007/s11467-017-0685-7.
C. Cui, X. Li, H. Sui, and J. Sun. Optimization of coal-based methanol distillation schemeusing process superstructure method to maximize energy efficiency. Energy, 119( ):110–120, 2017a. doi:https://doi.org/10.1016/j.energy.2016.12.065.
C. Cui, J. Sun, and X. Li. A hybrid design combining double-effect thermal integra-tion and heat pump to the methanol distillation process for improving energy effi-ciency. Chemical Engineering and Processing: Process Intensification, 119( ):81–92, 2017b.doi:https://doi.org/10.1016/j.cep.2017.06.003.
C. Cui, S. Liu, and J. Sun. Optimal selection of operating pressure for distil-lation columns. Chemical Engineering Research and Design, 137( ):291–307, 2018.doi:https://doi.org/10.1016/j.cherd.2018.07.0281.
F. Dalena, A. Senatore, A. Marino, A. Gordano, M. Basile, and A. Basile. Methanol, volumeElsevier, edition, 2017. ISBN 978-0-444-63903-5.
F. Dalena, A. Senatore, M. Basile, S. Knani, A. Basile, and A. Lulianelli. Advances inmethanol production and utilization, with particular emphasis toward hydrogen gen-eration via membrane reactor technology. Multidisciplinary Digital Publishing Institute, 8(98): , 2018. doi:https://doi.org/10.3390/membranes8040098.
Danish Meteorological Institute. Vejrarkiv. https://www.dmi.dk/vejrarkiv/, 2020. Seen:10/02-2021.
Dansk Fjernvarme. Solvarme. http://www.solvarmedata.dk/, 2020. Seen: 10/02-2021.
J. Davis and G. Rochelle. Thermal degradation of monoethanolamineat stripper conditions. Energy Procedia, 1(1):327–333, 2009.doi:https://doi.org/10.1016/j.egypro.2009.01.045.
W. Denmark. Antal vindmøller og kapacitet, 2021. URL https://winddenmark.dk/tal-fakta/fakta-om-vind-danmark/antal-vindmoeller-kapacitet.
S. Dinkin. Increasing the profit ratio, 2016. URL https://www.thespacereview.com/article/2893/1#:~:text=Liquid%20methane%20costs%20about%20%241.35,which%20fuel%20will%20be%20cheaper.
C. Dorris, E. Lu, S. Park, and F. Toro. High-purity oxygen production using mixedionic-electronic conduction sorbents, 2016. URL https://repository.upenn.edu/cgi/viewcontent.cgi?article=1080&context=cbe_sdr.
DR.DK. Danske CO2-giganter øger udslip, men slipper forat betale klima-afgifter. https://www.dr.dk/nyheder/penge/danske-co2-giganter-oeger-udslip-men-slipper-betale-klima-afgifter, 2020.Seen: 11/02-2021.
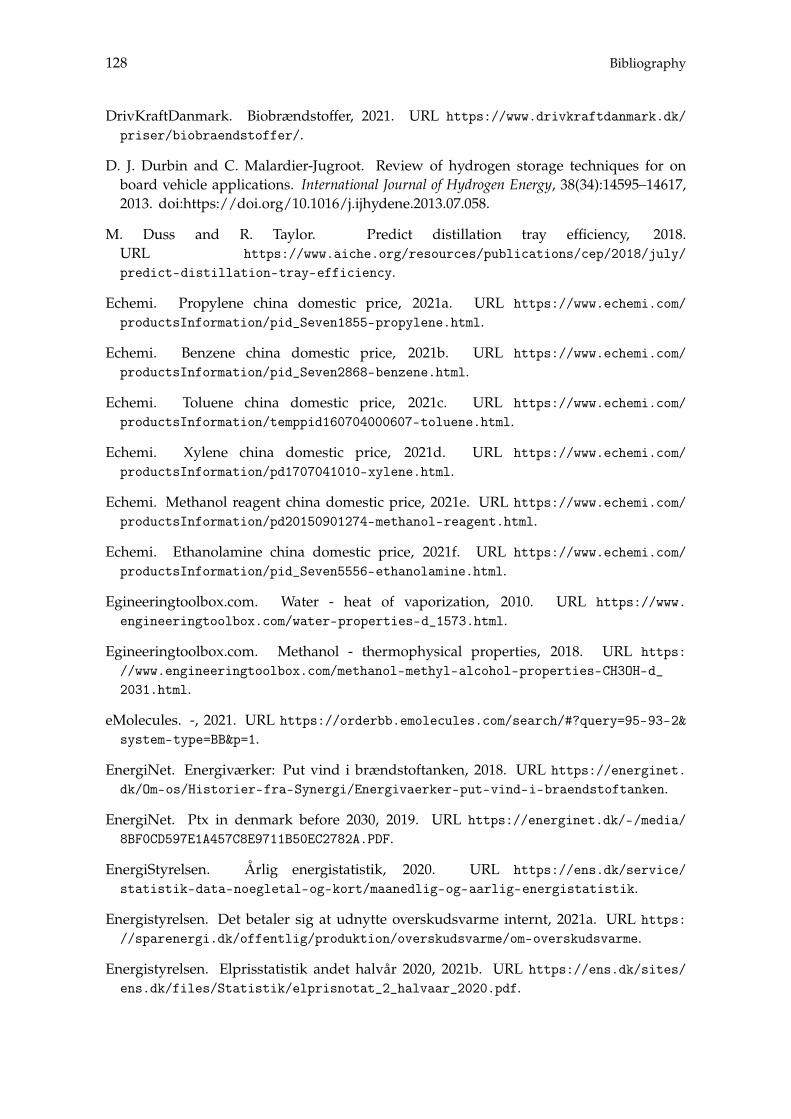
128 Bibliography
DrivKraftDanmark. Biobrændstoffer, 2021. URL https://www.drivkraftdanmark.dk/priser/biobraendstoffer/.
D. J. Durbin and C. Malardier-Jugroot. Review of hydrogen storage techniques for onboard vehicle applications. International Journal of Hydrogen Energy, 38(34):14595–14617,2013. doi:https://doi.org/10.1016/j.ijhydene.2013.07.058.
M. Duss and R. Taylor. Predict distillation tray efficiency, 2018.URL https://www.aiche.org/resources/publications/cep/2018/july/predict-distillation-tray-efficiency.
Echemi. Propylene china domestic price, 2021a. URL https://www.echemi.com/productsInformation/pid_Seven1855-propylene.html.
Echemi. Benzene china domestic price, 2021b. URL https://www.echemi.com/productsInformation/pid_Seven2868-benzene.html.
Echemi. Toluene china domestic price, 2021c. URL https://www.echemi.com/productsInformation/temppid160704000607-toluene.html.
Echemi. Xylene china domestic price, 2021d. URL https://www.echemi.com/productsInformation/pd1707041010-xylene.html.
Echemi. Methanol reagent china domestic price, 2021e. URL https://www.echemi.com/productsInformation/pd20150901274-methanol-reagent.html.
Echemi. Ethanolamine china domestic price, 2021f. URL https://www.echemi.com/productsInformation/pid_Seven5556-ethanolamine.html.
Egineeringtoolbox.com. Water - heat of vaporization, 2010. URL https://www.engineeringtoolbox.com/water-properties-d_1573.html.
Egineeringtoolbox.com. Methanol - thermophysical properties, 2018. URL https://www.engineeringtoolbox.com/methanol-methyl-alcohol-properties-CH3OH-d_2031.html.
eMolecules. -, 2021. URL https://orderbb.emolecules.com/search/#?query=95-93-2&system-type=BB&p=1.
EnergiNet. Energiværker: Put vind i brændstoftanken, 2018. URL https://energinet.dk/Om-os/Historier-fra-Synergi/Energivaerker-put-vind-i-braendstoftanken.
EnergiNet. Ptx in denmark before 2030, 2019. URL https://energinet.dk/-/media/8BF0CD597E1A457C8E9711B50EC2782A.PDF.
EnergiStyrelsen. Årlig energistatistik, 2020. URL https://ens.dk/service/statistik-data-noegletal-og-kort/maanedlig-og-aarlig-energistatistik.
Energistyrelsen. Det betaler sig at udnytte overskudsvarme internt, 2021a. URL https://sparenergi.dk/offentlig/produktion/overskudsvarme/om-overskudsvarme.
Energistyrelsen. Elprisstatistik andet halvår 2020, 2021b. URL https://ens.dk/sites/ens.dk/files/Statistik/elprisnotat_2_halvaar_2020.pdf.
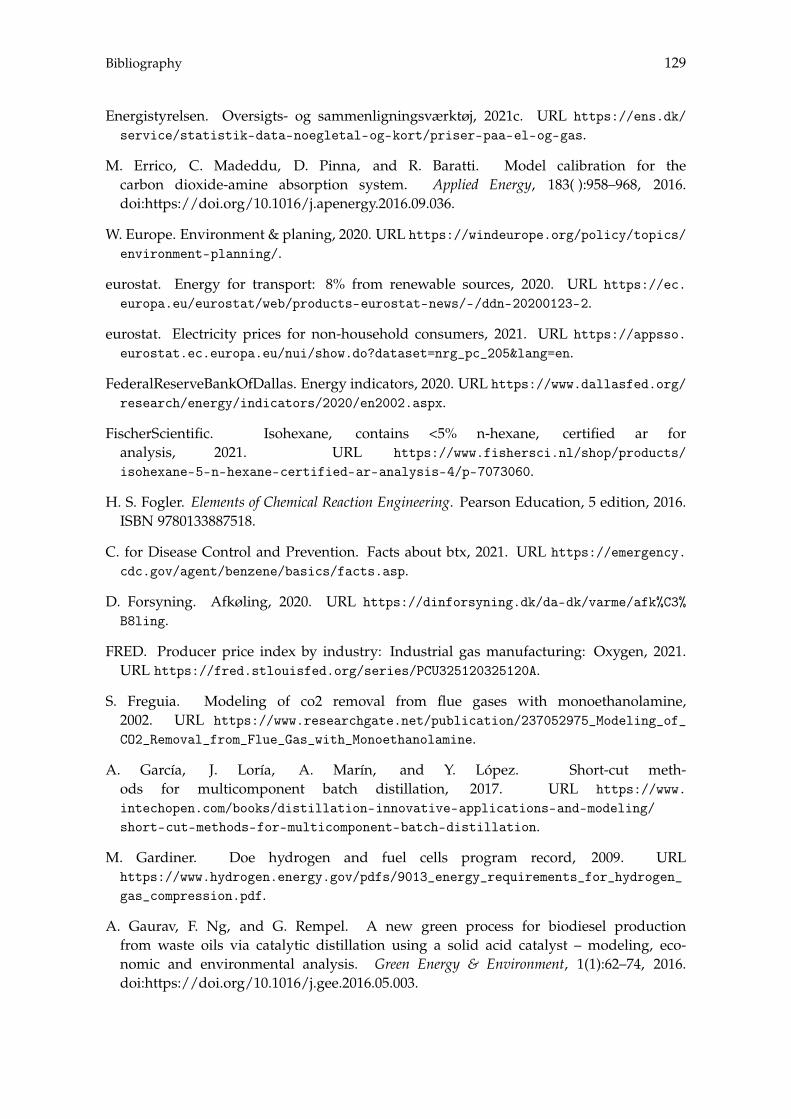
Bibliography 129
Energistyrelsen. Oversigts- og sammenligningsværktøj, 2021c. URL https://ens.dk/service/statistik-data-noegletal-og-kort/priser-paa-el-og-gas.
M. Errico, C. Madeddu, D. Pinna, and R. Baratti. Model calibration for thecarbon dioxide-amine absorption system. Applied Energy, 183( ):958–968, 2016.doi:https://doi.org/10.1016/j.apenergy.2016.09.036.
W. Europe. Environment & planing, 2020. URL https://windeurope.org/policy/topics/environment-planning/.
eurostat. Energy for transport: 8% from renewable sources, 2020. URL https://ec.europa.eu/eurostat/web/products-eurostat-news/-/ddn-20200123-2.
eurostat. Electricity prices for non-household consumers, 2021. URL https://appsso.eurostat.ec.europa.eu/nui/show.do?dataset=nrg_pc_205&lang=en.
FederalReserveBankOfDallas. Energy indicators, 2020. URL https://www.dallasfed.org/research/energy/indicators/2020/en2002.aspx.
FischerScientific. Isohexane, contains <5% n-hexane, certified ar foranalysis, 2021. URL https://www.fishersci.nl/shop/products/isohexane-5-n-hexane-certified-ar-analysis-4/p-7073060.
H. S. Fogler. Elements of Chemical Reaction Engineering. Pearson Education, 5 edition, 2016.ISBN 9780133887518.
C. for Disease Control and Prevention. Facts about btx, 2021. URL https://emergency.cdc.gov/agent/benzene/basics/facts.asp.
D. Forsyning. Afkøling, 2020. URL https://dinforsyning.dk/da-dk/varme/afk%C3%B8ling.
FRED. Producer price index by industry: Industrial gas manufacturing: Oxygen, 2021.URL https://fred.stlouisfed.org/series/PCU325120325120A.
S. Freguia. Modeling of co2 removal from flue gases with monoethanolamine,2002. URL https://www.researchgate.net/publication/237052975_Modeling_of_CO2_Removal_from_Flue_Gas_with_Monoethanolamine.
A. García, J. Loría, A. Marín, and Y. López. Short-cut meth-ods for multicomponent batch distillation, 2017. URL https://www.intechopen.com/books/distillation-innovative-applications-and-modeling/short-cut-methods-for-multicomponent-batch-distillation.
M. Gardiner. Doe hydrogen and fuel cells program record, 2009. URLhttps://www.hydrogen.energy.gov/pdfs/9013_energy_requirements_for_hydrogen_gas_compression.pdf.
A. Gaurav, F. Ng, and G. Rempel. A new green process for biodiesel productionfrom waste oils via catalytic distillation using a solid acid catalyst – modeling, eco-nomic and environmental analysis. Green Energy & Environment, 1(1):62–74, 2016.doi:https://doi.org/10.1016/j.gee.2016.05.003.
130 Bibliography
Gelsenchem. Historical methanol pricing, 2021. URL https://www.gelsenchem.de/en/historical-methanol-pricing/.
Geostyrelsen. Matrikelkort, 2021. URL https://kort.matrikel.dk/spatialmap?fbclid=IwAR2m1CwI_uHuatT2D3sevMRicr9ZjqB3BjHWTLwuF3EIxYDDv7fmfjCKKjQ.
M. Ghanbari, M. Ahmadi, and A. Lashanizadegan. A comparison between peng-robinsonand soave-redlich-kwong cubic equations of state from modification perspective. Cryo-genics, 84(1):13–19, 2017. doi:https://doi.org/10.1016/j.cryogenics.2017.04.001.
GlobalPetrolPrices. Methane prices, 2021. URL https://www.globalpetrolprices.com/methane_prices/#:~:text=Methane%20prices%2C%2026%2DApr%2D,0.79%20U.S.%20Dollar%20per%20liter.
GlobalSources. Qingdao eastchem inc., normal pentane price, 2021a. URLhttps://www.globalsources.com/si/AS/Qingdao-Eastchem/6008835305510/pdtl/Normal-Pentane-Price-109-66-0/1139998874.htm.
GlobalSources. Liangxin petrochemical technology development co. ltd, 2021b. URLhttps://www.globalsources.com/si/AS/Liangxin-Petrochemical/6008843210595/pdtl/isohexane/1045127099.htm?AGGType=pure.
Q. Gong, T. Fang, Y. Xie, R. Zhang, M. Liu, F. Barzagli, J. Li, Z. Hu, and Z. Zhu.High-efficiency conversion of methanol to btx aromatics over a zn-modified nanosheet-hzsm-5 zeolite. Industrial & Engineering CHemistry Research, 64(4):1633–1641, 2021.doi:https://doi.org/10.1021/acs.iecr.0c06342.
Green Hydrogen Systems. First eMethanol plant in Denmark produces liquid electricity. https://greenhydrogen.dk/1235-2/, 2020. Seen: 10/02-2021.
GreenLab. GreenLab to be catalyst for global P2X market. https://www.greenlab.dk/knowledge/greenlab-to-be-catalyst-for-global-energy-market-within-p2x/,2019. Seen: 10/02-2021.
GreenLab. How CO2 is turned into green fuel. https://www.greenlab.dk/knowledge/reintegrate-makes-green-methanol/, 2020. Seen: 10/02-2021.
GreenLab. Greenlab - mainpage, 2021. URL https://www.greenlab.dk/.
GreenLab Skive Biogas Aps. Anlægget. https://greenlabskivebiogas.dk/anlaegget/,2021. Seen: 10/02-2021.
I. Halvorsen. Minimum Energy Requirements in Complex Distillation Arrangements, volumeNorwegian University of Science and Technology, edition, 2001. ISBN 82-471-5304-1.
J. Hannon, L. Lynd, O. Andrade, P. Benavides, G. Beckham, M. Biddy, N. Brown,M. Chagas, B. Davison, T. Foust, T. Junqueira, M. Laser, Z. Li, T. Richard,L. Tao, G. Tuskan, M. Wang, J. Woods, and C. Wyman. Technoeconomic andlife-cycle analysis of single-step catalytic conversion of wet ethanol into fungiblefuel blendstocks. Proceedings of the National Academy of Sciences, 117(23):–, 2019.doi:http://dx.doi.org/10.1073/pnas.1821684116.
Bibliography 131
J. R. Hannon, L. R. Lynd, O. Andrade, P. T. Benavides, G. T. Beckham, M. J. Biddy,N. Brown, M. F. Chagas, B. H. Davison, T. Foust, T. L. Junqueira, M. S. Laser, Z. Li, T. R. L.Tao, G. A. Tuskan, M. Wang, W. Woods, and C. E. Wyman. Technoeconomic and life-cycle analysis of single-step catalytic conversion of wet ethanol into fungible fuel blend-stocks. PNAS, 117(23):12576–12583, 2020. doi:https://doi.org/10.1073/pnas.1821684116.
J. P. G. Hernandez. Extractive distillation with ionic liquids as solvents : selection andconceptual process design, 2013. URL https://doi.org/10.6100/IR751728.
C. Hobson and C. Márquez. Renewable methanol report. Technical report,Methanol Institute, 2018. URL https://www.methanol.org/wp-content/uploads/2019/01/MethanolReport.pdf.
S. E. Hosseini and M. A. Wahid. Hydrogen production from renewableand sustainable energy resources: Promising green energy carrier for cleandevelopment. Renewable and Sustainable Energy Reviews, 57:850–866, 2016.doi:https://doi.org/10.1016/j.rser.2015.12.112.
T. Husseini. Transporting oil and gas: the world’s longest pipelines, 2018. URL https://www.offshore-technology.com/features/worlds-longest-pipelines/.
H. Ibrahim. Design of fractionation columns, 2014. URL https://www.intechopen.com/books/matlab-applications-for-the-practical-engineer/design-of-fractionation-columns.
ICIS. Methyl tertiary butyl ether (mtbe) uses and market data, 2010.URL https://www.icis.com/explore/resources/news/2007/11/05/9076054/methyl-tertiary-butyl-ether-mtbe-uses-and-market-data/.
IHS. Global propylene market, 2014. URL http://cdn.ihs.com/www/pdf/asia-chem-conf/Carr.pdf.
Intratec. Monoethanolamine price chart sample, 2007. URL https://www.intratec.us/chemical-markets/monoethanolamine-price.
S. Jackson and E. Brodal. A comparison of the energy consumption for co2 compressionprocess alternatives. IOP Conference Series: Earth and Environmental Science, 167( ): , 2018.doi:https://doi.org/10.1088/1755-1315/167/1/012031.
J. K. Kaldellis, M. Kapsali, and K. A. Kavadias. Temperature and wind speed impact on theefficiency of pv installations. experience obtained from outdoor measurements in greece.Renewable Energy, 66( ):612–624, 2014. doi:https://doi.org/10.1016/j.renene.2013.12.041.
S. Klein and G. Nellis. Thermodynamics, volume Cambridge University Press, 3 edition,2017. ISBN 978-0-521-19570-6.
D. Klenert, L. Mattauch, E. Combet, O. Edenhofer, C. Hepburn, R. Rafaty, and N. Stern.Making carbon pricing work for citizens. nature climate change, 8:669–677, 2018.doi:https://doi.org/10.1038/s41558-018-0201-2.
A. Kommune. Lokalplan 5-9-101. Technical report, Aalborg Kommune, 2011. URL http://apps.aalborgkommune.dk/images/teknisk/PLANBYG/lokplan/05/5-9-101.pdf.
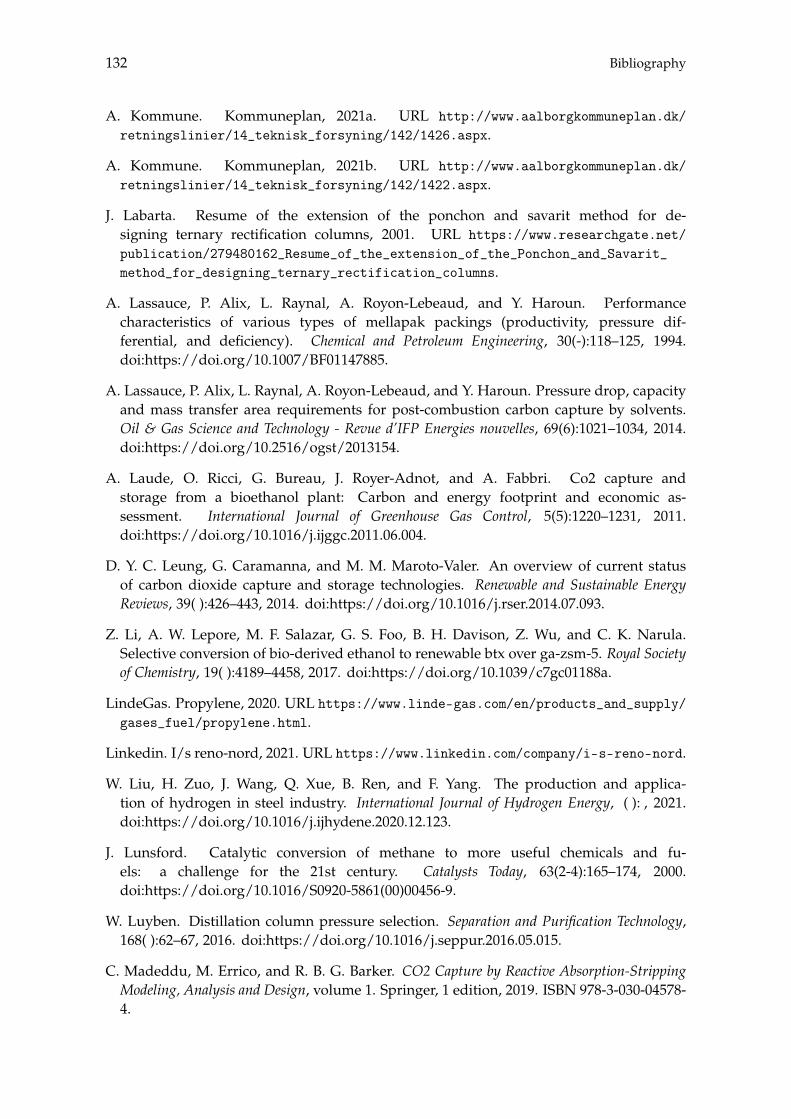
132 Bibliography
A. Kommune. Kommuneplan, 2021a. URL http://www.aalborgkommuneplan.dk/retningslinier/14_teknisk_forsyning/142/1426.aspx.
A. Kommune. Kommuneplan, 2021b. URL http://www.aalborgkommuneplan.dk/retningslinier/14_teknisk_forsyning/142/1422.aspx.
J. Labarta. Resume of the extension of the ponchon and savarit method for de-signing ternary rectification columns, 2001. URL https://www.researchgate.net/publication/279480162_Resume_of_the_extension_of_the_Ponchon_and_Savarit_method_for_designing_ternary_rectification_columns.
A. Lassauce, P. Alix, L. Raynal, A. Royon-Lebeaud, and Y. Haroun. Performancecharacteristics of various types of mellapak packings (productivity, pressure dif-ferential, and deficiency). Chemical and Petroleum Engineering, 30(-):118–125, 1994.doi:https://doi.org/10.1007/BF01147885.
A. Lassauce, P. Alix, L. Raynal, A. Royon-Lebeaud, and Y. Haroun. Pressure drop, capacityand mass transfer area requirements for post-combustion carbon capture by solvents.Oil & Gas Science and Technology - Revue d’IFP Energies nouvelles, 69(6):1021–1034, 2014.doi:https://doi.org/10.2516/ogst/2013154.
A. Laude, O. Ricci, G. Bureau, J. Royer-Adnot, and A. Fabbri. Co2 capture andstorage from a bioethanol plant: Carbon and energy footprint and economic as-sessment. International Journal of Greenhouse Gas Control, 5(5):1220–1231, 2011.doi:https://doi.org/10.1016/j.ijggc.2011.06.004.
D. Y. C. Leung, G. Caramanna, and M. M. Maroto-Valer. An overview of current statusof carbon dioxide capture and storage technologies. Renewable and Sustainable EnergyReviews, 39( ):426–443, 2014. doi:https://doi.org/10.1016/j.rser.2014.07.093.
Z. Li, A. W. Lepore, M. F. Salazar, G. S. Foo, B. H. Davison, Z. Wu, and C. K. Narula.Selective conversion of bio-derived ethanol to renewable btx over ga-zsm-5. Royal Societyof Chemistry, 19( ):4189–4458, 2017. doi:https://doi.org/10.1039/c7gc01188a.
LindeGas. Propylene, 2020. URL https://www.linde-gas.com/en/products_and_supply/gases_fuel/propylene.html.
Linkedin. I/s reno-nord, 2021. URL https://www.linkedin.com/company/i-s-reno-nord.
W. Liu, H. Zuo, J. Wang, Q. Xue, B. Ren, and F. Yang. The production and applica-tion of hydrogen in steel industry. International Journal of Hydrogen Energy, ( ): , 2021.doi:https://doi.org/10.1016/j.ijhydene.2020.12.123.
J. Lunsford. Catalytic conversion of methane to more useful chemicals and fu-els: a challenge for the 21st century. Catalysts Today, 63(2-4):165–174, 2000.doi:https://doi.org/10.1016/S0920-5861(00)00456-9.
W. Luyben. Distillation column pressure selection. Separation and Purification Technology,168( ):62–67, 2016. doi:https://doi.org/10.1016/j.seppur.2016.05.015.
C. Madeddu, M. Errico, and R. B. G. Barker. CO2 Capture by Reactive Absorption-StrippingModeling, Analysis and Design, volume 1. Springer, 1 edition, 2019. ISBN 978-3-030-04578-4.
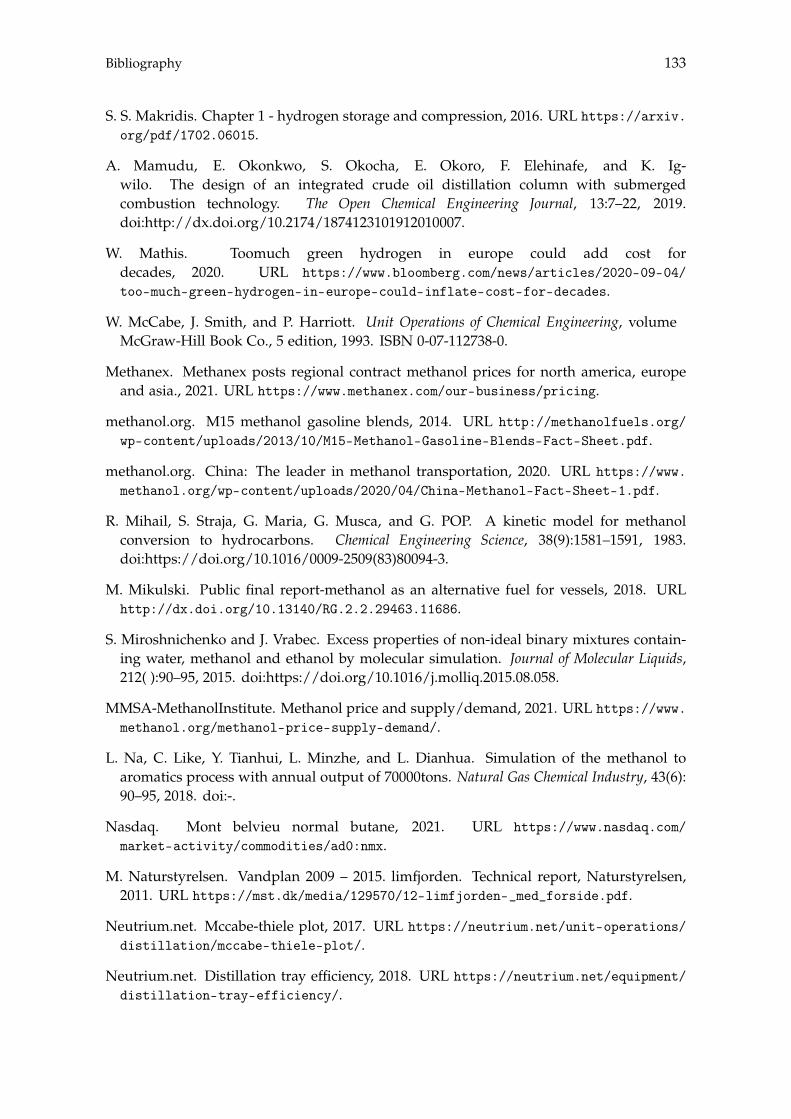
Bibliography 133
S. S. Makridis. Chapter 1 - hydrogen storage and compression, 2016. URL https://arxiv.org/pdf/1702.06015.
A. Mamudu, E. Okonkwo, S. Okocha, E. Okoro, F. Elehinafe, and K. Ig-wilo. The design of an integrated crude oil distillation column with submergedcombustion technology. The Open Chemical Engineering Journal, 13:7–22, 2019.doi:http://dx.doi.org/10.2174/1874123101912010007.
W. Mathis. Toomuch green hydrogen in europe could add cost fordecades, 2020. URL https://www.bloomberg.com/news/articles/2020-09-04/too-much-green-hydrogen-in-europe-could-inflate-cost-for-decades.
W. McCabe, J. Smith, and P. Harriott. Unit Operations of Chemical Engineering, volumeMcGraw-Hill Book Co., 5 edition, 1993. ISBN 0-07-112738-0.
Methanex. Methanex posts regional contract methanol prices for north america, europeand asia., 2021. URL https://www.methanex.com/our-business/pricing.
methanol.org. M15 methanol gasoline blends, 2014. URL http://methanolfuels.org/wp-content/uploads/2013/10/M15-Methanol-Gasoline-Blends-Fact-Sheet.pdf.
methanol.org. China: The leader in methanol transportation, 2020. URL https://www.methanol.org/wp-content/uploads/2020/04/China-Methanol-Fact-Sheet-1.pdf.
R. Mihail, S. Straja, G. Maria, G. Musca, and G. POP. A kinetic model for methanolconversion to hydrocarbons. Chemical Engineering Science, 38(9):1581–1591, 1983.doi:https://doi.org/10.1016/0009-2509(83)80094-3.
M. Mikulski. Public final report-methanol as an alternative fuel for vessels, 2018. URLhttp://dx.doi.org/10.13140/RG.2.2.29463.11686.
S. Miroshnichenko and J. Vrabec. Excess properties of non-ideal binary mixtures contain-ing water, methanol and ethanol by molecular simulation. Journal of Molecular Liquids,212( ):90–95, 2015. doi:https://doi.org/10.1016/j.molliq.2015.08.058.
MMSA-MethanolInstitute. Methanol price and supply/demand, 2021. URL https://www.methanol.org/methanol-price-supply-demand/.
L. Na, C. Like, Y. Tianhui, L. Minzhe, and L. Dianhua. Simulation of the methanol toaromatics process with annual output of 70000tons. Natural Gas Chemical Industry, 43(6):90–95, 2018. doi:-.
Nasdaq. Mont belvieu normal butane, 2021. URL https://www.nasdaq.com/market-activity/commodities/ad0:nmx.
M. Naturstyrelsen. Vandplan 2009 – 2015. limfjorden. Technical report, Naturstyrelsen,2011. URL https://mst.dk/media/129570/12-limfjorden-_med_forside.pdf.
Neutrium.net. Mccabe-thiele plot, 2017. URL https://neutrium.net/unit-operations/distillation/mccabe-thiele-plot/.
Neutrium.net. Distillation tray efficiency, 2018. URL https://neutrium.net/equipment/distillation-tray-efficiency/.
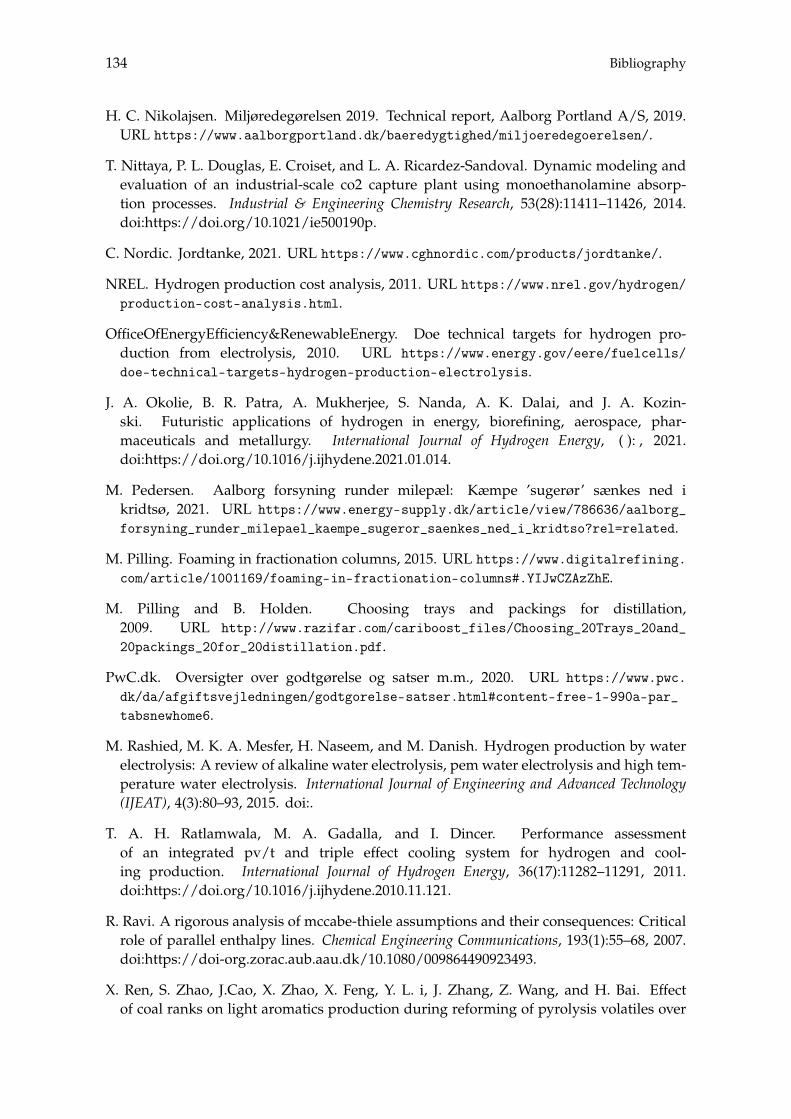
134 Bibliography
H. C. Nikolajsen. Miljøredegørelsen 2019. Technical report, Aalborg Portland A/S, 2019.URL https://www.aalborgportland.dk/baeredygtighed/miljoeredegoerelsen/.
T. Nittaya, P. L. Douglas, E. Croiset, and L. A. Ricardez-Sandoval. Dynamic modeling andevaluation of an industrial-scale co2 capture plant using monoethanolamine absorp-tion processes. Industrial & Engineering Chemistry Research, 53(28):11411–11426, 2014.doi:https://doi.org/10.1021/ie500190p.
C. Nordic. Jordtanke, 2021. URL https://www.cghnordic.com/products/jordtanke/.
NREL. Hydrogen production cost analysis, 2011. URL https://www.nrel.gov/hydrogen/production-cost-analysis.html.
OfficeOfEnergyEfficiency&RenewableEnergy. Doe technical targets for hydrogen pro-duction from electrolysis, 2010. URL https://www.energy.gov/eere/fuelcells/doe-technical-targets-hydrogen-production-electrolysis.
J. A. Okolie, B. R. Patra, A. Mukherjee, S. Nanda, A. K. Dalai, and J. A. Kozin-ski. Futuristic applications of hydrogen in energy, biorefining, aerospace, phar-maceuticals and metallurgy. International Journal of Hydrogen Energy, ( ): , 2021.doi:https://doi.org/10.1016/j.ijhydene.2021.01.014.
M. Pedersen. Aalborg forsyning runder milepæl: Kæmpe ’sugerør’ sænkes ned ikridtsø, 2021. URL https://www.energy-supply.dk/article/view/786636/aalborg_forsyning_runder_milepael_kaempe_sugeror_saenkes_ned_i_kridtso?rel=related.
M. Pilling. Foaming in fractionation columns, 2015. URL https://www.digitalrefining.com/article/1001169/foaming-in-fractionation-columns#.YIJwCZAzZhE.
M. Pilling and B. Holden. Choosing trays and packings for distillation,2009. URL http://www.razifar.com/cariboost_files/Choosing_20Trays_20and_20packings_20for_20distillation.pdf.
PwC.dk. Oversigter over godtgørelse og satser m.m., 2020. URL https://www.pwc.dk/da/afgiftsvejledningen/godtgorelse-satser.html#content-free-1-990a-par_tabsnewhome6.
M. Rashied, M. K. A. Mesfer, H. Naseem, and M. Danish. Hydrogen production by waterelectrolysis: A review of alkaline water electrolysis, pem water electrolysis and high tem-perature water electrolysis. International Journal of Engineering and Advanced Technology(IJEAT), 4(3):80–93, 2015. doi:.
T. A. H. Ratlamwala, M. A. Gadalla, and I. Dincer. Performance assessmentof an integrated pv/t and triple effect cooling system for hydrogen and cool-ing production. International Journal of Hydrogen Energy, 36(17):11282–11291, 2011.doi:https://doi.org/10.1016/j.ijhydene.2010.11.121.
R. Ravi. A rigorous analysis of mccabe-thiele assumptions and their consequences: Criticalrole of parallel enthalpy lines. Chemical Engineering Communications, 193(1):55–68, 2007.doi:https://doi-org.zorac.aub.aau.dk/10.1080/009864490923493.
X. Ren, S. Zhao, J.Cao, X. Zhao, X. Feng, Y. L. i, J. Zhang, Z. Wang, and H. Bai. Effectof coal ranks on light aromatics production during reforming of pyrolysis volatiles over
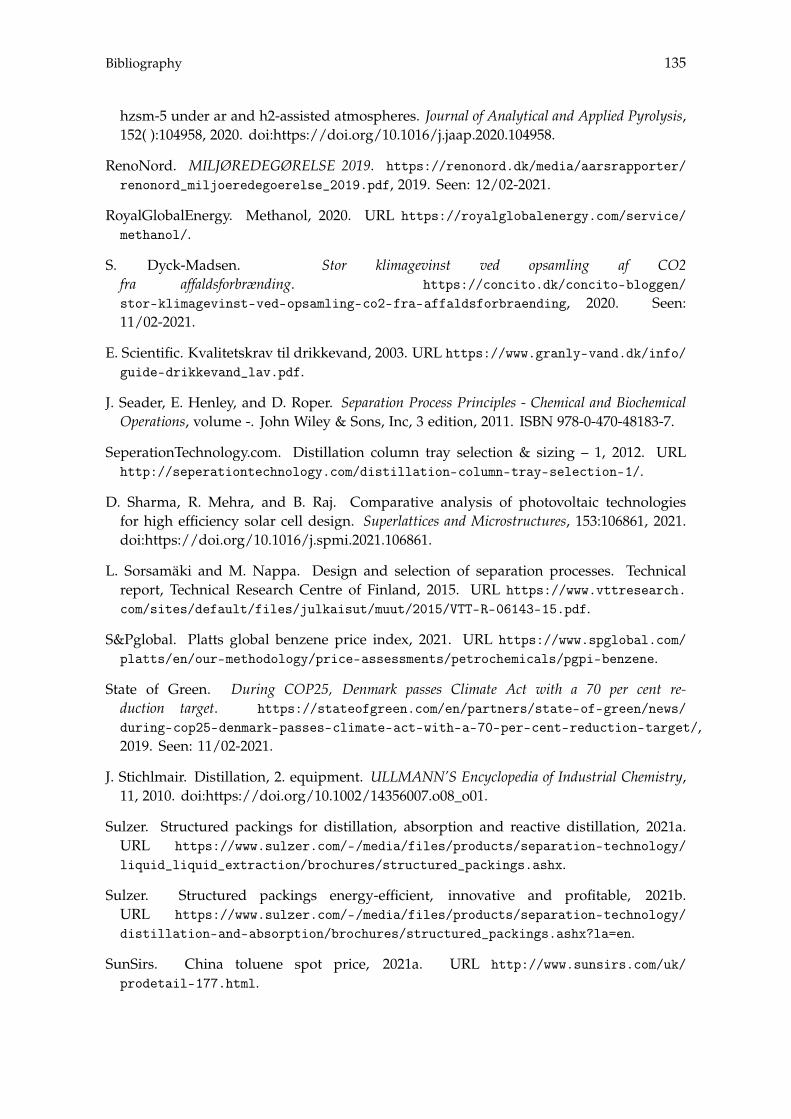
Bibliography 135
hzsm-5 under ar and h2-assisted atmospheres. Journal of Analytical and Applied Pyrolysis,152( ):104958, 2020. doi:https://doi.org/10.1016/j.jaap.2020.104958.
RenoNord. MILJØREDEGØRELSE 2019. https://renonord.dk/media/aarsrapporter/renonord_miljoeredegoerelse_2019.pdf, 2019. Seen: 12/02-2021.
RoyalGlobalEnergy. Methanol, 2020. URL https://royalglobalenergy.com/service/methanol/.
S. Dyck-Madsen. Stor klimagevinst ved opsamling af CO2fra affaldsforbrænding. https://concito.dk/concito-bloggen/stor-klimagevinst-ved-opsamling-co2-fra-affaldsforbraending, 2020. Seen:11/02-2021.
E. Scientific. Kvalitetskrav til drikkevand, 2003. URL https://www.granly-vand.dk/info/guide-drikkevand_lav.pdf.
J. Seader, E. Henley, and D. Roper. Separation Process Principles - Chemical and BiochemicalOperations, volume -. John Wiley & Sons, Inc, 3 edition, 2011. ISBN 978-0-470-48183-7.
SeperationTechnology.com. Distillation column tray selection & sizing – 1, 2012. URLhttp://seperationtechnology.com/distillation-column-tray-selection-1/.
D. Sharma, R. Mehra, and B. Raj. Comparative analysis of photovoltaic technologiesfor high efficiency solar cell design. Superlattices and Microstructures, 153:106861, 2021.doi:https://doi.org/10.1016/j.spmi.2021.106861.
L. Sorsamäki and M. Nappa. Design and selection of separation processes. Technicalreport, Technical Research Centre of Finland, 2015. URL https://www.vttresearch.com/sites/default/files/julkaisut/muut/2015/VTT-R-06143-15.pdf.
S&Pglobal. Platts global benzene price index, 2021. URL https://www.spglobal.com/platts/en/our-methodology/price-assessments/petrochemicals/pgpi-benzene.
State of Green. During COP25, Denmark passes Climate Act with a 70 per cent re-duction target. https://stateofgreen.com/en/partners/state-of-green/news/during-cop25-denmark-passes-climate-act-with-a-70-per-cent-reduction-target/,2019. Seen: 11/02-2021.
J. Stichlmair. Distillation, 2. equipment. ULLMANN’S Encyclopedia of Industrial Chemistry,11, 2010. doi:https://doi.org/10.1002/14356007.o08_o01.
Sulzer. Structured packings for distillation, absorption and reactive distillation, 2021a.URL https://www.sulzer.com/-/media/files/products/separation-technology/liquid_liquid_extraction/brochures/structured_packings.ashx.
Sulzer. Structured packings energy-efficient, innovative and profitable, 2021b.URL https://www.sulzer.com/-/media/files/products/separation-technology/distillation-and-absorption/brochures/structured_packings.ashx?la=en.
SunSirs. China toluene spot price, 2021a. URL http://www.sunsirs.com/uk/prodetail-177.html.
136 Bibliography
SunSirs. Chemical spot price:xylene, 2021b. URL http://www.sunsirs.com/commodity-price/petail-Xylene-1222.html.
W. A. Sweeney and P. F. Bryan. Kirk-othmer encyclopedia of chemicaltechnology, btx processing. ECT, 4(3):264–277, 2000. doi:https://doi-org.zorac.aub.aau.dk/10.1002/0471238961.02202419230505.a01.
M. Sánchez, E. Amores, L. Rodrígues, and C. Clemente-Jul. Semi-empirical modeland experimental validation for the performance evaluation of a 15 kw alkaline wa-ter electrolyzer. International Journal of Hydrogen Energy, 43(45):20332–20345, 2018.doi:https://doi.org/10.1016/j.ijhydene.2018.09.029.
S. M. Sørensen. [email protected], renonord, co2 emission, 2020.
S. Taqvi, L. Tufa, and S. Muhadozir. Optimization and dynamics of dis-tillation column using aspen plus. Procedia Engineering, 148( ):978–984, 2016.doi:https://doi.org/10.1016/j.proeng.2016.06.484.
G. Towler and R. Sinnott. Chemical Engineering Design: Principles, practice and economics ofplants and process design., volume -. Elsevier, 1 edition, 2008. ISBN 978-0-7506-8423-1.
F. Ullmann, Y. Y. W. GERHARTZ, F. Campbell, R. Pfefferkorn, and J. Rounsaville. ULL-MANN’S Encyclopedia of Industrial Chemistry, volume Wiley-VCH, 7 edition, 2011. ISBN9783527306732.
U.S.-E.I.A. Natural gas weekly update, 2019. URL https://www.eia.gov/naturalgas/weekly/archivenew_ngwu/2019/02_14/.
U.S.EnergyInformationAdministration. Prices for hydrocarbon gas liquids,2020. URL https://www.eia.gov/energyexplained/hydrocarbon-gas-liquids/prices-for-hydrocarbon-gas-liquids.php.
A. Veawab, A. Aroonwilas, and P. Tontiwachwuthikul. Co2 absorption performance ofaqueous alkanolamines in packed columns. ACS Division of Fuel Chemistry, Preprints,47:49–50, 2002. URL https://www.researchgate.net/publication/283837909_CO2_absorption_performance_of_aqueous_alkanolamines_in_packed_columns.
Vestas. 4 mw platform, 2020. URL https://www.vestas.com/en/products/4-mw-platform/v150-4_2_mw#!
A. Viswanath, T. Ghosh, D. Prasad, N. Dutt, and K. Rani. Viscosity of Liquids Theory,Estimation, Experiment, and Data., volume -. Springer, 1 edition, 2007. ISBN 978-1-4020-5482-2.
T. Wang, X. Tang, X. Huang, W. Qian, Y. Cui, X. Hui, W. Yang, and F. WEI. Conversionof methanol to aromatics in fluidized bed reactor. Catalysts Today, 233( ):8–13, 2014.doi:https://doi.org/10.1016/j.cattod.2014.02.007.
T. Wang, X. Tang, X. Huang, W. Qian, Y. Cui, X. Hui, W. Yang, and F. WEI.Deactivation kinetics of individual c6–c9 aromatics’ generation from methanolover zn and p comodified hzsm-5. Royal Society of Chemistry, 9( ):22327, 2019.doi:https://doi.org/10.1039/c9ra02587a.
Bibliography 137
P. Wankat. Separation Process Engineering: Includes Mass Transfer Analysis, volume -. PrenticeHall, 3 edition, 2012. ISBN 978-0-13-138227-5.
T. Wilberforce, A. G. Olabi, E. T. Sayed, K. Elsaid, and M. A. Abdelkareem. Pro-gess in carbon capture technologies. Science of the Total Environment, 761( ): , 2021.doi:https://doi.org/10.1016/j.scitotenv.2020.143203.
Wind Turbine Models. Vestas V126-3.45. https://en.wind-turbine-models.com/turbines/1249-vestas-v126-3.45, 2020. Seen: 10/02-2021.
K. Winther. Methanol as motor fuel. Technical report, Dansk Technological Institute, 2019.URL http://danskbiomethanol.dk/Papers/Report%20DK.pdf.
N. Yang, K. Chuang, A. Afacan, M. Resetarits, and M. Binkley. Improving the efficiencyand capacity of methanol-water distillation trays. Industrial & Engineering ChemistryResearch, 42(25):6601–6606, 2003. doi:https://doi.org/10.1021/ie030407n.
Ycharts. Mont belvieu propane spot price, 2021. URL https://ycharts.com/indicators/mont_belvieu_propane_spot_price.
J. Zhang, L. Zhang, H. Liu, A. Sun, R. Liu, and R. Liu. Electrochemical Technologies for EnergyStorage and Conversion, volume Weinheim, Germany : Wiley-VCH, edition, 2011. ISBN3-527-32869-6.
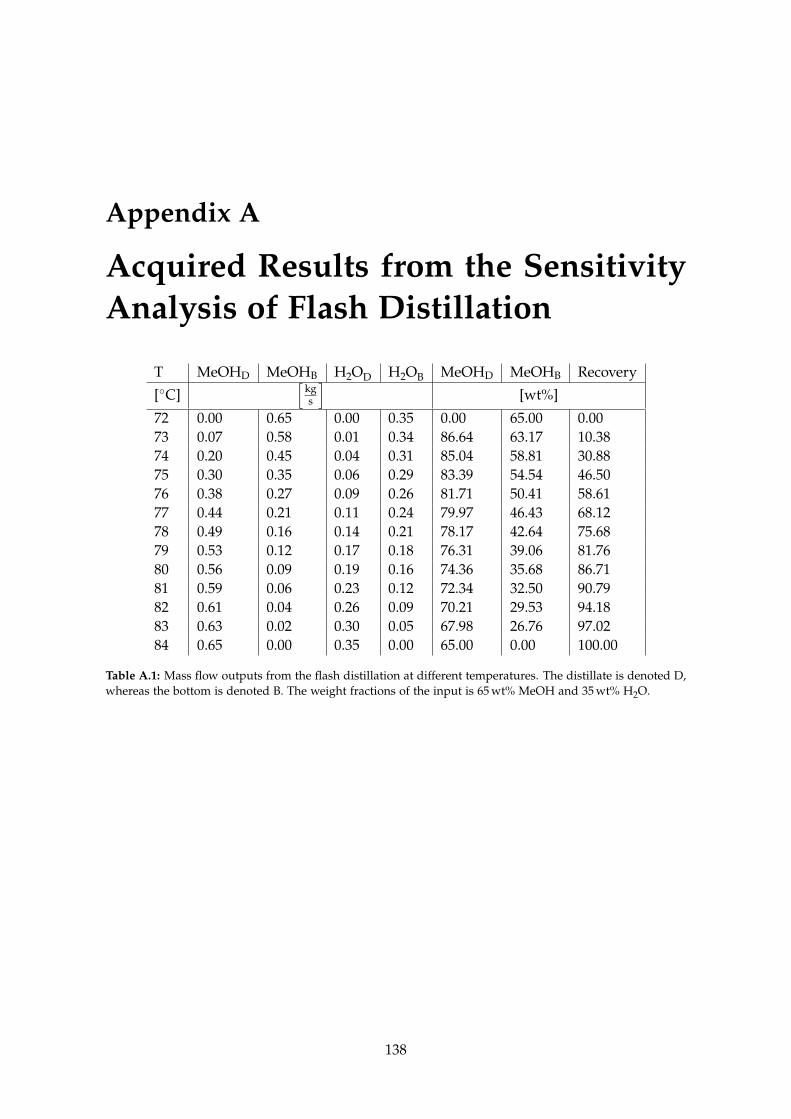
Appendix A
Acquired Results from the SensitivityAnalysis of Flash Distillation
T MeOHD MeOHB H2OD H2OB MeOHD MeOHB Recovery[�C]
hkgs
i[wt%]
72 0.00 0.65 0.00 0.35 0.00 65.00 0.0073 0.07 0.58 0.01 0.34 86.64 63.17 10.3874 0.20 0.45 0.04 0.31 85.04 58.81 30.8875 0.30 0.35 0.06 0.29 83.39 54.54 46.5076 0.38 0.27 0.09 0.26 81.71 50.41 58.6177 0.44 0.21 0.11 0.24 79.97 46.43 68.1278 0.49 0.16 0.14 0.21 78.17 42.64 75.6879 0.53 0.12 0.17 0.18 76.31 39.06 81.7680 0.56 0.09 0.19 0.16 74.36 35.68 86.7181 0.59 0.06 0.23 0.12 72.34 32.50 90.7982 0.61 0.04 0.26 0.09 70.21 29.53 94.1883 0.63 0.02 0.30 0.05 67.98 26.76 97.0284 0.65 0.00 0.35 0.00 65.00 0.00 100.00
Table A.1: Mass flow outputs from the flash distillation at different temperatures. The distillate is denoted D,whereas the bottom is denoted B. The weight fractions of the input is 65 wt% MeOH and 35 wt% H2O.
138
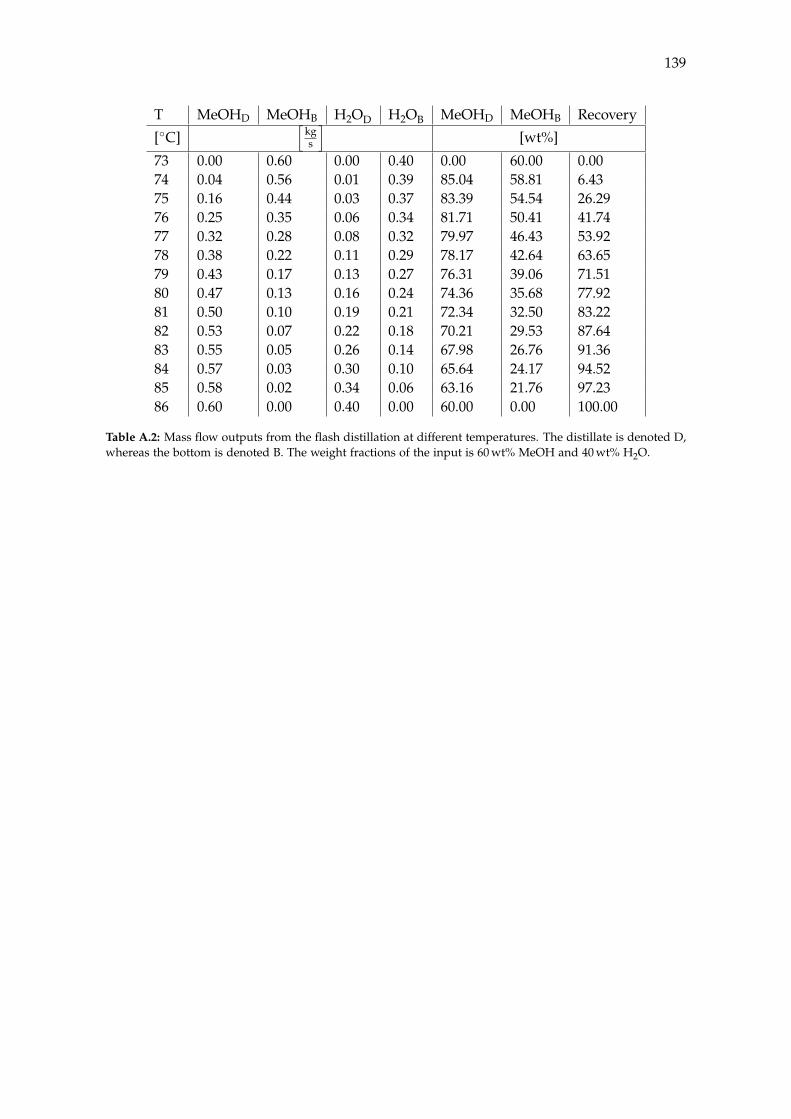
139
T MeOHD MeOHB H2OD H2OB MeOHD MeOHB Recovery[�C]
hkgs
i[wt%]
73 0.00 0.60 0.00 0.40 0.00 60.00 0.0074 0.04 0.56 0.01 0.39 85.04 58.81 6.4375 0.16 0.44 0.03 0.37 83.39 54.54 26.2976 0.25 0.35 0.06 0.34 81.71 50.41 41.7477 0.32 0.28 0.08 0.32 79.97 46.43 53.9278 0.38 0.22 0.11 0.29 78.17 42.64 63.6579 0.43 0.17 0.13 0.27 76.31 39.06 71.5180 0.47 0.13 0.16 0.24 74.36 35.68 77.9281 0.50 0.10 0.19 0.21 72.34 32.50 83.2282 0.53 0.07 0.22 0.18 70.21 29.53 87.6483 0.55 0.05 0.26 0.14 67.98 26.76 91.3684 0.57 0.03 0.30 0.10 65.64 24.17 94.5285 0.58 0.02 0.34 0.06 63.16 21.76 97.2386 0.60 0.00 0.40 0.00 60.00 0.00 100.00
Table A.2: Mass flow outputs from the flash distillation at different temperatures. The distillate is denoted D,whereas the bottom is denoted B. The weight fractions of the input is 60 wt% MeOH and 40 wt% H2O.
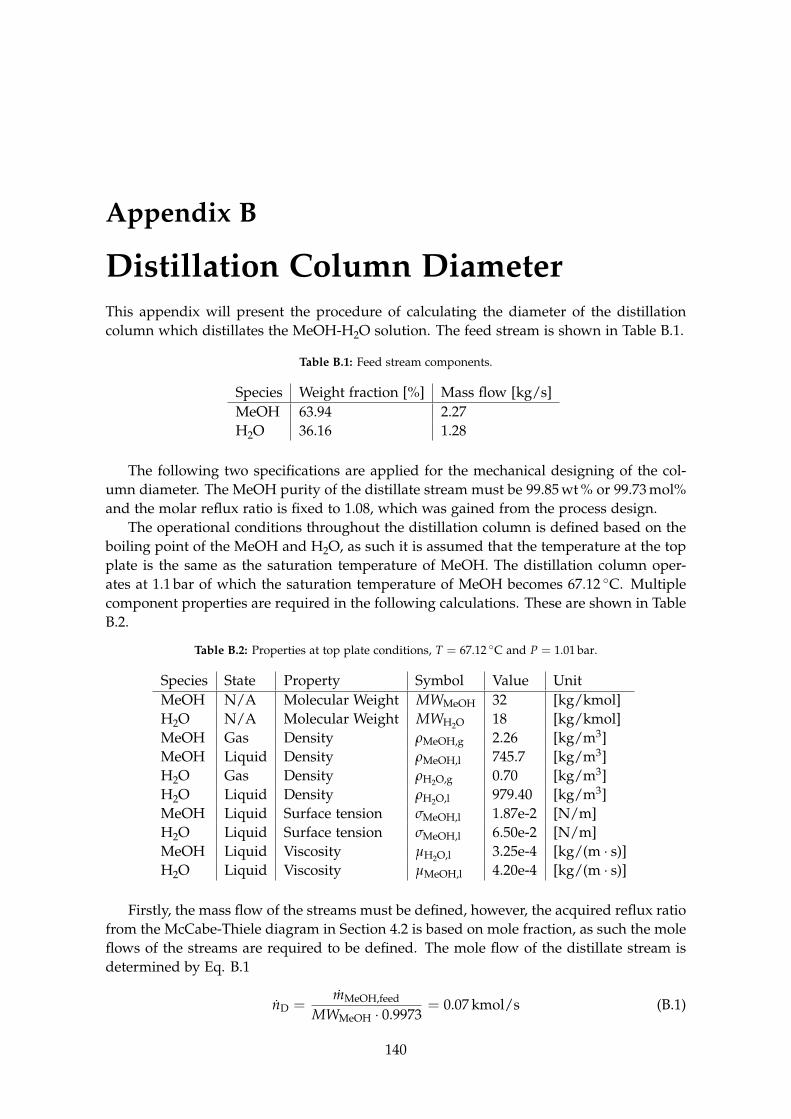
Appendix B
Distillation Column DiameterThis appendix will present the procedure of calculating the diameter of the distillationcolumn which distillates the MeOH-H2O solution. The feed stream is shown in Table B.1.
Table B.1: Feed stream components.
Species Weight fraction [%] Mass flow [kg/s]MeOH 63.94 2.27H2O 36.16 1.28
The following two specifications are applied for the mechanical designing of the col-umn diameter. The MeOH purity of the distillate stream must be 99.85 wt % or 99.73 mol%and the molar reflux ratio is fixed to 1.08, which was gained from the process design.
The operational conditions throughout the distillation column is defined based on theboiling point of the MeOH and H2O, as such it is assumed that the temperature at the topplate is the same as the saturation temperature of MeOH. The distillation column oper-ates at 1.1 bar of which the saturation temperature of MeOH becomes 67.12 �C. Multiplecomponent properties are required in the following calculations. These are shown in TableB.2.
Table B.2: Properties at top plate conditions, T = 67.12 �C and P = 1.01 bar.
Species State Property Symbol Value UnitMeOH N/A Molecular Weight MWMeOH 32 [kg/kmol]H2O N/A Molecular Weight MWH2O 18 [kg/kmol]MeOH Gas Density rMeOH,g 2.26 [kg/m3]MeOH Liquid Density rMeOH,l 745.7 [kg/m3]H2O Gas Density rH2O,g 0.70 [kg/m3]H2O Liquid Density rH2O,l 979.40 [kg/m3]MeOH Liquid Surface tension sMeOH,l 1.87e-2 [N/m]H2O Liquid Surface tension sMeOH,l 6.50e-2 [N/m]MeOH Liquid Viscosity µH2O,l 3.25e-4 [kg/(m · s)]H2O Liquid Viscosity µMeOH,l 4.20e-4 [kg/(m · s)]
Firstly, the mass flow of the streams must be defined, however, the acquired reflux ratiofrom the McCabe-Thiele diagram in Section 4.2 is based on mole fraction, as such the moleflows of the streams are required to be defined. The mole flow of the distillate stream isdetermined by Eq. B.1
nD =mMeOH,feed
MWMeOH · 0.9973= 0.07 kmol/s (B.1)
140
141
where n is molar flow, the subscript D denotes the distillate stream, m is mass flow, MW isthe molecular weight and 0.9973 is the molar fraction purity requirement. The mole flowof the vapour stream is determined based on the distillate stream and the reflux ratio asshown in Eq. B.2
nV = nD · (1 + R) = 0.15 kmol/s (B.2)
where R is the reflux ratio and the subscript V denotes the vapour stream. The mole flowof the liquid stream is determined by subtracting the distillate stream from the vapourstream as shown in Eq. B.3
nL = nV � nD = 0.08 kmol/s (B.3)
where L denotes the liquid stream. The mass flow rate of the distillate stream is thendetermined by the composition of each component and their molecular weight as shownin Eq. B.4
mD = nD · xMeOH,D · MWMeOH + nD · xH2O,D · MWH2O = 2.63 kg/s (B.4)
where x is the molar fraction within the liquid. This procedure repeats for the liquidstream, however, the composition of this stream is unknown of which a sensitivity anal-ysis is conducted in order to determine the influence of the composition on the resultingdiameter. As such the MeOH composition of the liquid stream is varied between 0 wt %to 100 wt %. The following presents the calculations, when the liquid consists of 50 wt %of MeOH in the liquid stream. At first the equivalent molar fraction of MeOH is based onthe weight fraction by Eq. B.5
xMeOH,L =wtMeOH,l/MWMeOH
wtMeOH,l/MWMeOH + wtH2O,l/MWH2O= 0.36 (B.5)
where wt is the weight fraction and l denotes that the property is based on the speciebeing on liquid state. The molar fraction of H2O is then determined by subtracting themolar fraction of MeOH, calculated in Eq. B.5, from unity. Then, the liquid mass flow isdetermined by Eq. B.6.
mL = nL · xMeOH,L · MWMeOH + nL · xH2O,L · MWH2O = 1.76 kg/s (B.6)
Finally, the vapour mass flow is calculated by adding the distillate- and liquid mass flowas shown in Eq. B.7.
mv = mD + mL = 4.03 kg/s (B.7)
The weight fraction of the MeOH in the vapour stream is determined by Eq. B.8.
wtMeOH,V =mD · wtMeOH,D + mL · wtMeOH,L
mV= 0.78 (B.8)
The weight fraction of the H2O in the vapour stream is then defined by subtracting theresult of Eq. B.8 from unity. The density of both the liquid- and vapour stream is thendetermined by Eq. B.9 and B.10
rL = rMeOH,l · wtMeOH,L + rH2O,l · wtH2O,L = 862.55 kg/m3 (B.9)
rV = rMeOH,g · wtMeOH,V + rH2O,g · wtH2O,V = 1.18 kg/m3 (B.10)
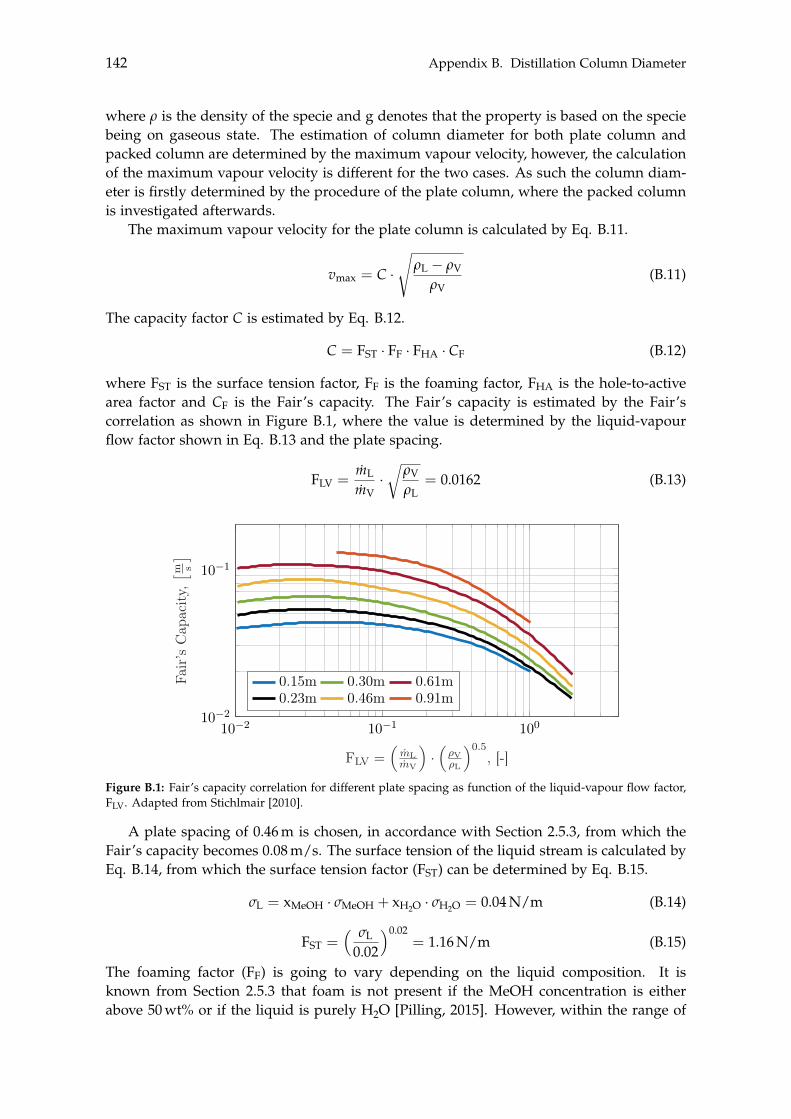
142 Appendix B. Distillation Column Diameter
where r is the density of the specie and g denotes that the property is based on the speciebeing on gaseous state. The estimation of column diameter for both plate column andpacked column are determined by the maximum vapour velocity, however, the calculationof the maximum vapour velocity is different for the two cases. As such the column diam-eter is firstly determined by the procedure of the plate column, where the packed columnis investigated afterwards.
The maximum vapour velocity for the plate column is calculated by Eq. B.11.
vmax = C ·s
rL � rV
rV(B.11)
The capacity factor C is estimated by Eq. B.12.
C = FST · FF · FHA · CF (B.12)
where FST is the surface tension factor, FF is the foaming factor, FHA is the hole-to-activearea factor and CF is the Fair’s capacity. The Fair’s capacity is estimated by the Fair’scorrelation as shown in Figure B.1, where the value is determined by the liquid-vapourflow factor shown in Eq. B.13 and the plate spacing.
FLV =mL
mV·r
rV
rL= 0.0162 (B.13)
10�2 10�1 10010�2
10�1
FLV =⇣
mLmV
⌘·⇣⇢V⇢L
⌘0.5, [-]
Fair
’sC
apac
ity,⇥ m
s⇤
0.15m 0.30m 0.61m0.23m 0.46m 0.91m
Figure B.1: Fair’s capacity correlation for different plate spacing as function of the liquid-vapour flow factor,FLV. Adapted from Stichlmair [2010].
A plate spacing of 0.46 m is chosen, in accordance with Section 2.5.3, from which theFair’s capacity becomes 0.08 m/s. The surface tension of the liquid stream is calculated byEq. B.14, from which the surface tension factor (FST) can be determined by Eq. B.15.
sL = xMeOH · sMeOH + xH2O · sH2O = 0.04 N/m (B.14)
FST =⇣ sL
0.02
⌘0.02= 1.16 N/m (B.15)
The foaming factor (FF) is going to vary depending on the liquid composition. It isknown from Section 2.5.3 that foam is not present if the MeOH concentration is eitherabove 50 wt% or if the liquid is purely H2O [Pilling, 2015]. However, within the range of
143
0 % < wtMeOH < 50 % it is unsure if foaming occurs and how significant it is. If foaming ispresent in the liquid, the foaming factor is between 0.5 to 0.75 depending on the amountof foam. As such it is a complicated endeavour to properly determine this factor with-out experimental data. As an estimate the foaming factor is set to 0.5 within the formermentioned range of the MeOH composition of 0 % < wtMeOH < 50 %. The remaining un-known in Eq. B.12 on the preceding page is (FHA), which was defined to be 0.9 accordingto Section 2.5.3. Since all the unknowns in Eq. B.11 on the facing page are determined, thediameter of the distillation column can be determined, as shown in Eq. B.16.
D =
0
@ 4 · mV
f · p · vmax ·⇣
1 � AdAtot
⌘· rV
1
A0.5
(B.16)
The remaining unknown in Eq. B.16 is the flooding factor f and the ratio Ad/Atot. Theflooding factor is set to 0.8 in accordance to Section 2.5.3 and Ad/Atot is determined bythe following
Ad/Atot = 0.1 for FLV 0.1Ad/Atot = 0.1 + FLV�0.1
9 for 0.1 < FLV < 1.0Ad/Atot = 0.2 for FLV � 1.0
Since Eq. B.13 on the preceding page yielded approximately 0.02 the correspondingAd/Atot becomes 0.1. Applying this values to Eq. B.16 the diameter becomes 1.60 m.This diameter was determined from a plate spacing of 0.46 m, which is suitable when thediameter of the distillation column is less than 1.50 m. Instead the plate spacing shouldbe 0.60 m which is suited when the column diameter ranges from 1.50 m to 6.00 m. Byapplying the new value for plate spacing, the diameter of the plate column becomes 1.42 m.Similar to the tray column, the packed column will be based on a correlation.
The determination of maximum vapour velocity for packed column is estimated by Eq.B.17.
m?max =
0
B@Fpack · rV · (rL � rV)
13.1 · ap ·⇣
µLrL
⌘0.1
1
CA
0.5
(B.17)
The unknowns in Eq. B.17 are the correlation factor (Fpack), the surface area per volumeof packing (ap) and the dynamic viscosity of the liquid (µL). The correlation factor isestimated by Figure B.2 on the next page to be 3.35 when a pressure drop of 0.8 kPa isapplied and FLV = 0.0162.
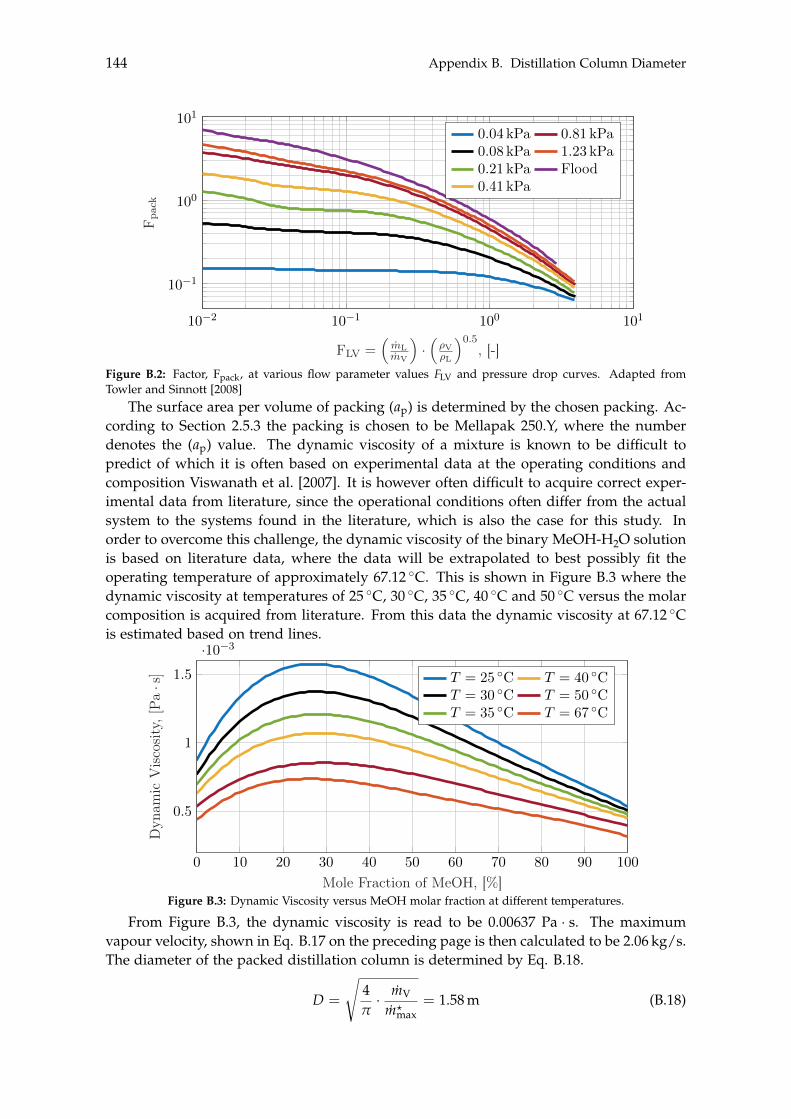
144 Appendix B. Distillation Column Diameter
10�2 10�1 100 101
10�1
100
101
FLV =⇣
mLmV
⌘·⇣⇢V⇢L
⌘0.5, [-]
F pac
k0.04 kPa 0.81 kPa0.08 kPa 1.23 kPa0.21 kPa Flood0.41 kPa
Figure B.2: Factor, Fpack, at various flow parameter values FLV and pressure drop curves. Adapted fromTowler and Sinnott [2008]
The surface area per volume of packing (ap) is determined by the chosen packing. Ac-cording to Section 2.5.3 the packing is chosen to be Mellapak 250.Y, where the numberdenotes the (ap) value. The dynamic viscosity of a mixture is known to be difficult topredict of which it is often based on experimental data at the operating conditions andcomposition Viswanath et al. [2007]. It is however often difficult to acquire correct exper-imental data from literature, since the operational conditions often differ from the actualsystem to the systems found in the literature, which is also the case for this study. Inorder to overcome this challenge, the dynamic viscosity of the binary MeOH-H2O solutionis based on literature data, where the data will be extrapolated to best possibly fit theoperating temperature of approximately 67.12 �C. This is shown in Figure B.3 where thedynamic viscosity at temperatures of 25 �C, 30 �C, 35 �C, 40 �C and 50 �C versus the molarcomposition is acquired from literature. From this data the dynamic viscosity at 67.12 �Cis estimated based on trend lines.
0 10 20 30 40 50 60 70 80 90 100
0.5
1
1.5
·10�3
Mole Fraction of MeOH, [%]
Dyn
amic
Vis
cosi
ty,[
Pa·s] T = 25 �C T = 40 �CT = 30 �C T = 50 �CT = 35 �C T = 67 �C
Figure B.3: Dynamic Viscosity versus MeOH molar fraction at different temperatures.
From Figure B.3, the dynamic viscosity is read to be 0.00637 Pa · s. The maximumvapour velocity, shown in Eq. B.17 on the preceding page is then calculated to be 2.06 kg/s.The diameter of the packed distillation column is determined by Eq. B.18.
D =
s4p· mV
m?max
= 1.58 m (B.18)
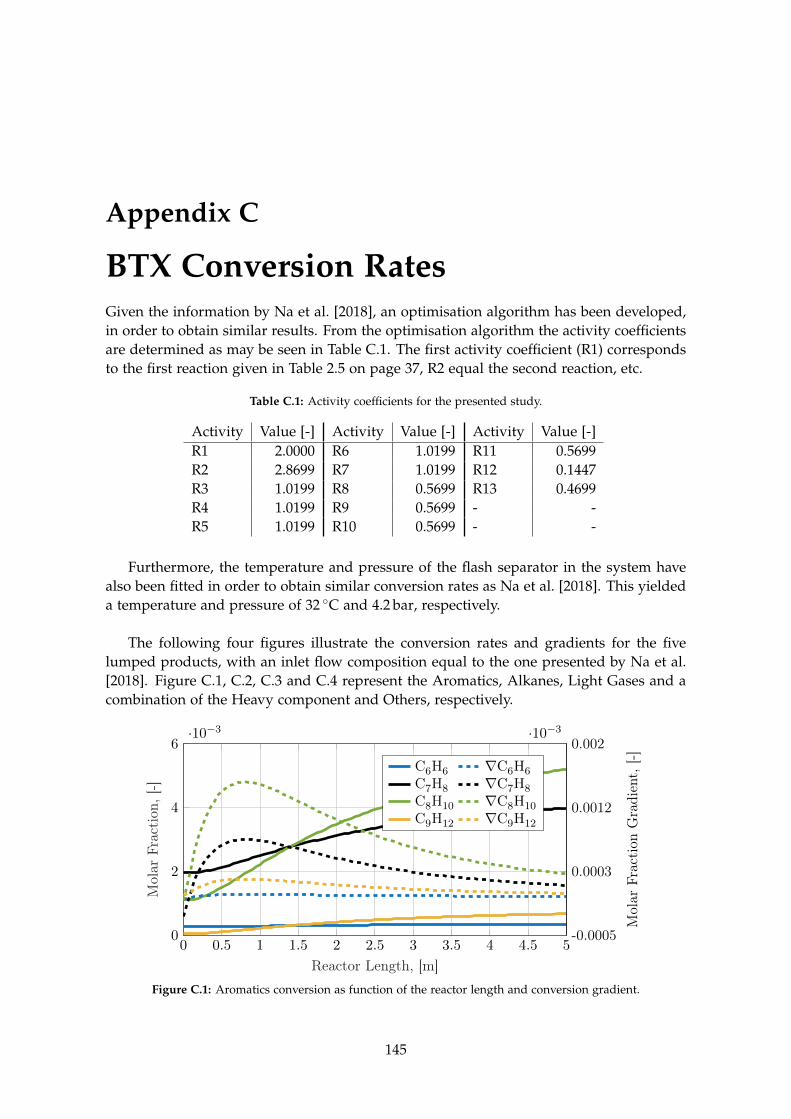
Appendix C
BTX Conversion RatesGiven the information by Na et al. [2018], an optimisation algorithm has been developed,in order to obtain similar results. From the optimisation algorithm the activity coefficientsare determined as may be seen in Table C.1. The first activity coefficient (R1) correspondsto the first reaction given in Table 2.5 on page 37, R2 equal the second reaction, etc.
Table C.1: Activity coefficients for the presented study.
Activity Value [-] Activity Value [-] Activity Value [-]R1 2.0000 R6 1.0199 R11 0.5699R2 2.8699 R7 1.0199 R12 0.1447R3 1.0199 R8 0.5699 R13 0.4699R4 1.0199 R9 0.5699 - -R5 1.0199 R10 0.5699 - -
Furthermore, the temperature and pressure of the flash separator in the system havealso been fitted in order to obtain similar conversion rates as Na et al. [2018]. This yieldeda temperature and pressure of 32 �C and 4.2 bar, respectively.
The following four figures illustrate the conversion rates and gradients for the fivelumped products, with an inlet flow composition equal to the one presented by Na et al.[2018]. Figure C.1, C.2, C.3 and C.4 represent the Aromatics, Alkanes, Light Gases and acombination of the Heavy component and Others, respectively.
0 0.5 1 1.5 2 2.5 3 3.5 4 4.5 50
2
4
6·10�3
Reactor Length, [m]
Mol
arFr
acti
on,[
-]
-0.0005
0.0003
0.0012
0.002·10�3
Mol
arFr
acti
onG
radi
ent,
[-]C6H6 rC6H6C7H8 rC7H8C8H10 rC8H10C9H12 rC9H12
Figure C.1: Aromatics conversion as function of the reactor length and conversion gradient.
145
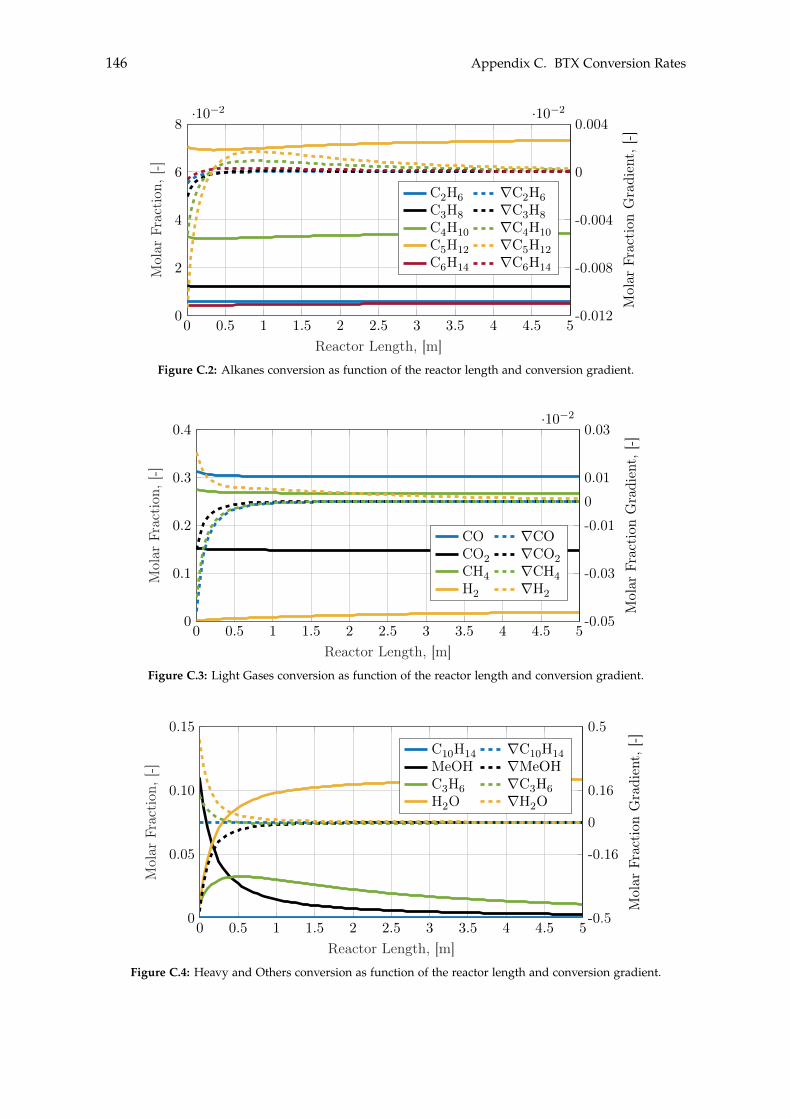
146 Appendix C. BTX Conversion Rates
0 0.5 1 1.5 2 2.5 3 3.5 4 4.5 50
2
4
6
8·10�2
Reactor Length, [m]
Mol
arFr
acti
on,[
-]
-0.012
-0.008
-0.004
0
0.004·10�2
Mol
arFr
acti
onG
radi
ent,
[-]
C2H6 rC2H6C3H8 rC3H8C4H10 rC4H10C5H12 rC5H12C6H14 rC6H14
Figure C.2: Alkanes conversion as function of the reactor length and conversion gradient.
0 0.5 1 1.5 2 2.5 3 3.5 4 4.5 50
0.1
0.2
0.3
0.4
Reactor Length, [m]
Mol
arFr
acti
on,[
-]
-0.05
-0.03
-0.0100.01
0.03·10�2
Mol
arFr
acti
onG
radi
ent,
[-]
CO rCOCO2 rCO2CH4 rCH4H2 rH2
Figure C.3: Light Gases conversion as function of the reactor length and conversion gradient.
0 0.5 1 1.5 2 2.5 3 3.5 4 4.5 50
0.05
0.10
0.15
Reactor Length, [m]
Mol
arFr
acti
on,[
-]
-0.5
-0.16
0
0.16
0.5
Mol
arFr
acti
onG
radi
ent,
[-]C10H14 rC10H14MeOH rMeOHC3H6 rC3H6H2O rH2O
Figure C.4: Heavy and Others conversion as function of the reactor length and conversion gradient.


