Embed Size (px)
Citation preview

1 IntroductionRepetitive practice of tasks on primitive visual features including orientation (Fiorentiniand Berardi 1980), motion direction (Ball and Sekuler 1987; Liu 1999; Vaina et al 1995),spatial frequency (Fiorentini and Berardi 1980), and location (Crist et al 1997; Fahleet al 1995; Fiorentini and Berardi 1980; Mednick et al 2002), and tasks on low-levelvisual functions such as Vernier acuity (Beard et al 1995; Herzog and Fahle 1997;McKee and Westheimer 1978) enhance task performance (for a review see Fahle andPoggio 2002). This is regarded as a manifestation of underlying neural plasticity in low-level visual processing areas including V1öthe cortical area onto which afferent visualsignals are first projected (Crist et al 2001; Schoups et al 2001; Schwartz et al 2002).
Perceptual learning can be task-specific. First, practice of a task on a relevantfeature does not necessarily improve the performance for tasks on features that areirrelevant to the task in the training phase (Ahissar and Hochstein 1993; Schoups et al2001), although some studies show that training can occur for features which areirrelevant to the training task (Seitz and Watanabe 2003; Watanabe et al 2001, 2002).This suggests that in some cases attention selects the sensory population relevant to agiven task. Second, studies have shown that learning does not transfer from one taskto another (Crist et al 2001; Matthews et al 1999; Poggio et al 1992). Although, again,this is not always the case (cf Beard et al 1995), overall evidence suggests that perceptuallearning can be highly task-specific.
No transfer between tasks found in some cases of perceptual learning suggests thatdifferent tasks may modify underlying visual processing in different ways. However, it hasnot yet been clarified how this occurs. One effective way to understand the underlyingvisual processing change due to perceptual learning is to measure change in psychophys-ical tuning functions to a visual feature (Ball and Sekuler 1987; Saarinen and Levi 1995;Seitz and Watanabe 2003; Watanabe et al 2001, 2002). In the present study, we measuredchanges in psychophysical motion-tuning functions to different motion directions dueto training on two different tasks (motion coherence detection and motion directiondiscrimination) with the same set of stimuli presented with the same frequency in eachblock of the training. The detection training most highly improved performance on the
Task-dependent changes of the psychophysical motion-tuningfunctions in the course of perceptual learning
Perception, 2004, volume 33, pages 1139 ^ 1147
Shinichi Koyama, Alexander Harner, Takeo WatanabeôDepartment of Psychology, Boston University, 64 Cummington Street, Boston, MA 02215, USA;e-mail: [email protected] 20 November 2003, in revised form 16 March 2004
Abstract. In some cases, perceptual learning is task-specific. However, task-dependent effects ofperceptual learning on psychophysical motion-tuning functions have yet to be clarified. In thepresent study, subjects performed motion detection or discrimination of the same stimulus overthe course of four sessions held on separate days. Subjects who performed motion detectionshowed the most highly improved performance on the trained motion directions. However, afterdiscrimination training, the highest improvement was not observed at the trained directions butshifted away from them. These results can be explained by lateral inhibition. Task demands maydifferentially modulate excitatory and inhibitory signals to directions in the vicinity of the traineddirections.
DOI:10.1068/p5195
ôAuthor to whom all correspondence should be addressed.

trained motion directions. On the other hand, after the discrimination training, thehighest improvement shifted away from the trained directions. This effect is well explainedby lateral inhibition (Levine and Grossberg 1976; Marshak and Sekuler 1979; Matherand Moulden 1980). The results suggest that specific inhibitory signals to the directionsin the immediate vicinity of a relevant direction are modulated by task demands.
2 Methods2.1 SubjectsTwenty-five undergraduate and graduate students from Boston University participatedin the study. The subjects ranged in age from 19 to 26 years. All subjects had normal orcorrected-to-normal vision and were na|« ve with respect to the purpose of the experiment.Written informed consent was obtained from all subjects.
2.2 StimulusEach subject viewed displays from a distance of 2.28 m in a dark room with her/hishead fixed in a chin-rest. Each stimulus consisted of 200 spatially random dots movingwithin a stationary circular aperture 6 deg in diameter. The size of a moving dot was2 pixels (� 1 min of arc) in diameter, and its traveling speed was 8.6 deg sÿ1. The dotsappeared white (59.8 cd mÿ2) against a black background (51 cd mÿ2). A bull's-eyefixation dot was presented at the center of the display during both the stimuluspresentation and inter-stimulus interval. Each dot traveled from one edge to anotherwithin an invisible aperture. A certain proportion of the dots moved in the samedirection in coherence, whereas the other dots moved in random directions. The displaywas similar to that developed by Newsome (Newsome and Pare 1988). However, whiledifferent groups of dots moving coherently were randomly chosen from one frameto another in that display, the same group of dots moved coherently with unlimiteddot lifetimes in our display. The stimuli were generated by a Macintosh G4 computerand presented on a Hitachi SuperScan 801 monitor (21 inch, 128061024 pixels, 75 Hz).
2.3 General procedureA complete experiment consisted of a training stage (detection task or discriminationtask) of four sessions which was preceded and followed by test stages in which thedetection tasks were performed (figure 1a). In the training stage, one group of subjects(nine, four females and five males) participated in a detection training condition whereasthe other group (sixteen, nine females and seven males) participated in a discrimina-tion training condition. In summary, the subjects were tested on the detection task inthe first session, trained on either detection or discrimination task in the following twosessions, and tested again on the detection task in the last session.
2.4 Detection trainingSubjects viewed two successive signal/noise (S/N) displays (one with 100% randomlymoving dots and the other with 18% of the dots exhibiting coherent motion) each for150 ms with a blank interval of 300 ms between displays (figure 1b). Immediately afterthe second display disappeared, the subjects were instructed to judge whether the firstor second display contained coherent motion and to respond by pressing either thekey labeled ` First'' or the key labeled ` Second''. The number of trials in which coherentmotion was presented in the first display was the same as that in which coherent motionwas presented in the second display. The order of presentation of these two types oftrials was randomized. Subjects did not receive feedback for their responses. The train-ing consisted of four sessions each of which had 800 trials and lasted about 30 min.Coherent motion occurred in an upward direction at 108 rotated counterclockwise orclockwise. Each coherent motion direction was presented 400 times in one trainingsession. Sessions were conducted on different days.
1140 S Koyama, A Harner, T Watanabe

2.5 Discrimination trainingA different group of subjects participated in the discrimination training condition. Ineach trial two displays were presented successively as in detection training. The sametwo motion directions as in the detection training, 108 clockwise or counterclockwise
Pre-test
Training
Post-test
Improvem
ent
Coheren
t
150 ms
300 ms
150 ms
``First''
Random
Random
150 ms
``Coherent''
``Random''
Coherent Random
Coheren
t
``Different'' ``Different''``Different''
Random
(a)
(b) Detection task
(c) Discrimination task
(d) Test task
Coheren
t
Coheren
t
Random
150 ms
300 ms
150 ms
Figure 1. Procedures of the experiment. (a) A complete experiment consisted of a training stage(four sessions) preceded and followed by test stages. (b) The procedure of each trial of detectiontraining: two modified Newsome type signal/noise (S/N) displays were successively presented for150 ms with a blank interval of 300 ms. White and gray arrows represent coherent and randommotion directions, respectively. (c) The procedure of each trial of discrimination training: the twosuccessively presented displays were both 18% S/N displays (left), one 18% S/N display and onerandom display (center), or both random displays (right). (d) The procedure of each trial of thetest stages: the judgment for the staircase method consisted of stating whether coherent motionwas present or not (ie random motion).
Task-dependent changes 1141

from upward motion, were used for the coherent motion in the discrimination training.However, unlike detection training, there were now three different types of combina-tions of displays. In the first type (figure 1c, left), a pair of S/N displays were presentedsuccessively, and the coherence level in each S/N display was set at a constant 18%,as in the detection task. The motion directions in the two displays were either thesame or differed by 208. In the second type (figure 1c, middle), one was an S/N displaywhile the other was a random display in which all dots moved in random directions.In the third type (figure 1c, right), both were random displays. The first and thirdtype of displays were presented in 320 trials and the second type in 160 trials in eachtraining session, so that the total numbers of the presentation of S/N displays andrandom displays in one session were both 800 in order to make them equal to thosein the detection training condition. The order of presentation of the three displayswas randomized for each subject. The subjects were instructed to judge whether thedirections of the global motion flow in the S/N displays were the same or differentby pressing the key labeled ` Same'' or ``Different''. They were told to make their bestguess when the dots appeared to be random. The random ^ random and coherent ^random trials were not used to compute subjects' percentage of correct responses.No feedback as to correct or incorrect choices was provided. Sessions were conductedon different days.
2.6 Pre- and post-training testsIn order to examine the effects of the two different types of training on subjects'sensitivity to nine motion directions, including the two trained directions, the thresh-olds for coherent motion detection (ie the minimum percentage of the coherent motiondetected) were measured for the nine directions both before and after the training.The motion directions were the upward motion, and �58, �108, �158, and �458 fromupward motion. The thresholds were determined at 50% correct, by means of a2-down ^ 2-up staircase method. On each trial, the subjects were presented with an S/Ndisplay for 150 ms and instructed to judge whether the dots moved in random direc-tions or whether a subgroup of dots moved in the same direction, ie whether thestimulus contained coherent motion (figure 1d). Eighteen staircases (the upstream anddownstream for the nine directions) were used in a random order determined for eachsubject. The thresholds were compared between the pre- and post-training tests.
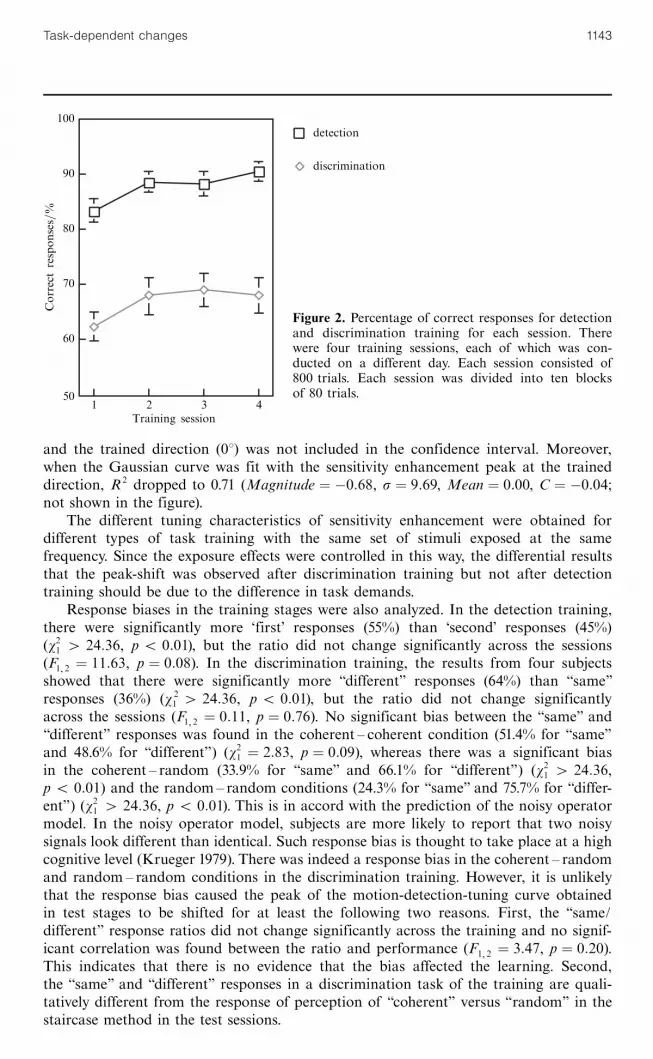
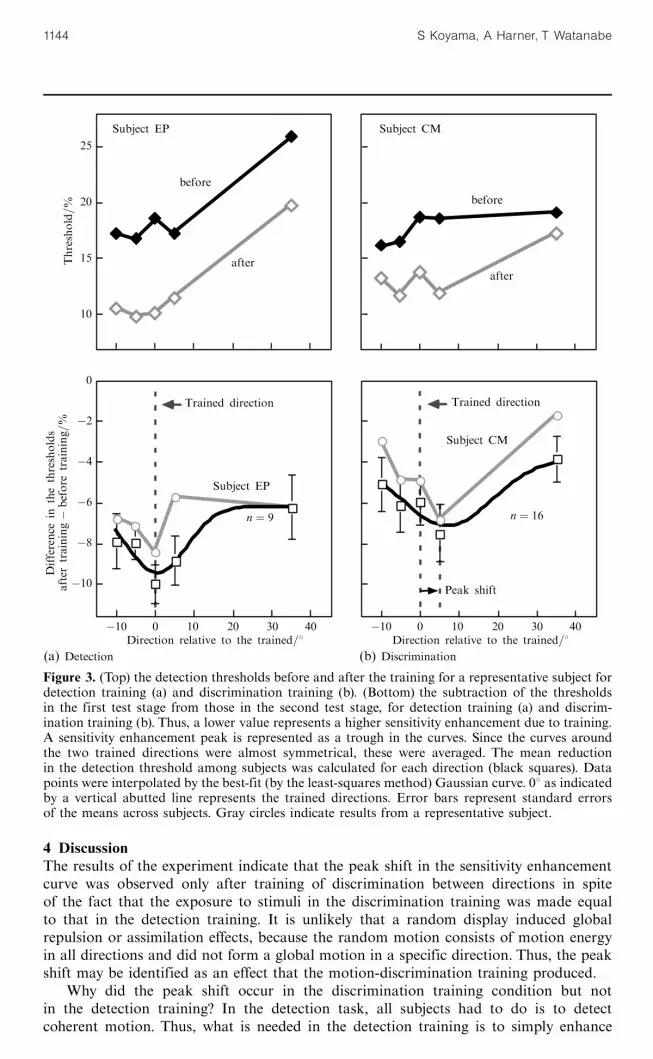
3 ResultsFigure 2 shows improvement in the subjects' performance over the time course ofdetection and discrimination training. Performance tended to improve in both detectionand discrimination training conditions. Figures 3a and 3b show the actual detectionthresholds before and after the training for a representative subject (top), and the differ-ence of the thresholds between the first and second test stages (bottom). As expected,sensitivity increase (threshold decrease) was highest for the direction trained in the motiondetection task (figure 3a, bottom). However, after discrimination training, the sensitivityenhancement peaks (represented as troughs in the thresholds in figures 3a and 3b) shiftedto the neighboring direction away from the trained direction (figure 3b, bottom).
The best-fit Gaussian curve also indicated a sensitivity enhancement peak shiftin the discrimination training. In the detection training, the peak of the best-fitGaussian curve [G(x)� C ] to the psychophysical data was near the trained direction(Magnitude � ÿ0:62, s � 7:58, Mean � 0:82, C � ÿ0:06, and R 2 � 0:87). On the otherhand, the sensitivity enhancement peak of the best-fit Gaussian curve in the discrim-ination training was at 7.168 off the trained direction (Magnitude � ÿ0:99, s � 11:80,Mean � 7:16, C � ÿ0:04, and R 2 � 0:89). The 95% confidence interval of the meanfor the best-fit curve for the discrimination training was between 2:728 and 11:618,
1142 S Koyama, A Harner, T Watanabe
and the trained direction (08) was not included in the confidence interval. Moreover,when the Gaussian curve was fit with the sensitivity enhancement peak at the traineddirection, R 2 dropped to 0.71 (Magnitude � ÿ0:68, s � 9:69, Mean � 0:00, C � ÿ0:04;not shown in the figure).
The different tuning characteristics of sensitivity enhancement were obtained fordifferent types of task training with the same set of stimuli exposed at the samefrequency. Since the exposure effects were controlled in this way, the differential resultsthat the peak-shift was observed after discrimination training but not after detectiontraining should be due to the difference in task demands.
Response biases in the training stages were also analyzed. In the detection training,there were significantly more `first' responses (55%) than `second' responses (45%)(w21 4 24:36, p 5 0:01), but the ratio did not change significantly across the sessions(F1 2 � 11:63, p � 0:08). In the discrimination training, the results from four subjectsshowed that there were significantly more ` different'' responses (64%) than ` same''responses (36%) (w 2
1 4 24:36, p 5 0:01), but the ratio did not change significantlyacross the sessions (F1 2 � 0:11, p � 0:76). No significant bias between the ` same'' and` different'' responses was found in the coherent ^ coherent condition (51.4% for ` same''and 48.6% for ` different'') (w21 � 2:83, p � 0:09), whereas there was a significant biasin the coherent ^ random (33.9% for ` same'' and 66.1% for ` different'') (w21 4 24:36,p 5 0:01) and the random^ random conditions (24.3% for ` same'' and 75.7% for ` differ-ent'') (w21 4 24:36, p 5 0:01). This is in accord with the prediction of the noisy operatormodel. In the noisy operator model, subjects are more likely to report that two noisysignals look different than identical. Such response bias is thought to take place at a highcognitive level (Krueger 1979). There was indeed a response bias in the coherent ^ randomand random ^ random conditions in the discrimination training. However, it is unlikelythat the response bias caused the peak of the motion-detection-tuning curve obtainedin test stages to be shifted for at least the following two reasons. First, the ` same/different'' response ratios did not change significantly across the training and no signif-icant correlation was found between the ratio and performance (F1 2 � 3:47, p � 0:20).This indicates that there is no evidence that the bias affected the learning. Second,the ``same'' and ` different'' responses in a discrimination task of the training are quali-tatively different from the response of perception of ` coherent'' versus ` random'' in thestaircase method in the test sessions.
,
,
,
100
90
80
70
60
50
Correctresponses=%
detection
discrimination
1 2 3 4Training session
Figure 2. Percentage of correct responses for detectionand discrimination training for each session. Therewere four training sessions, each of which was con-ducted on a different day. Each session consisted of800 trials. Each session was divided into ten blocksof 80 trials.
Task-dependent changes 1143
4 DiscussionThe results of the experiment indicate that the peak shift in the sensitivity enhancementcurve was observed only after training of discrimination between directions in spiteof the fact that the exposure to stimuli in the discrimination training was made equalto that in the detection training. It is unlikely that a random display induced globalrepulsion or assimilation effects, because the random motion consists of motion energyin all directions and did not form a global motion in a specific direction. Thus, the peakshift may be identified as an effect that the motion-discrimination training produced.
Why did the peak shift occur in the discrimination training condition but notin the detection training? In the detection task, all subjects had to do is to detectcoherent motion. Thus, what is needed in the detection training is to simply enhance
Subject EP Subject CM
before
before
afterafter
25
20
15
10
Threshold=%
0
ÿ2
ÿ4
ÿ6
ÿ8
ÿ10
Difference
inthethresholds
after
trainingÿ
before
training=%
Trained direction Trained direction
Subject EP
Subject CM
n � 9 n � 16
Peak shift
ÿ10 0 10 20 30 40 ÿ10 0 10 20 30 40Direction relative to the trained=8 Direction relative to the trained=8
(a) Detection (b) Discrimination
Figure 3. (Top) the detection thresholds before and after the training for a representative subject fordetection training (a) and discrimination training (b). (Bottom) the subtraction of the thresholdsin the first test stage from those in the second test stage, for detection training (a) and discrim-ination training (b). Thus, a lower value represents a higher sensitivity enhancement due to training.A sensitivity enhancement peak is represented as a trough in the curves. Since the curves aroundthe two trained directions were almost symmetrical, these were averaged. The mean reductionin the detection threshold among subjects was calculated for each direction (black squares). Datapoints were interpolated by the best-fit (by the least-squares method) Gaussian curve. 08 as indicatedby a vertical abutted line represents the trained directions. Error bars represent standard errorsof the means across subjects. Gray circles indicate results from a representative subject.
1144 S Koyama, A Harner, T Watanabe
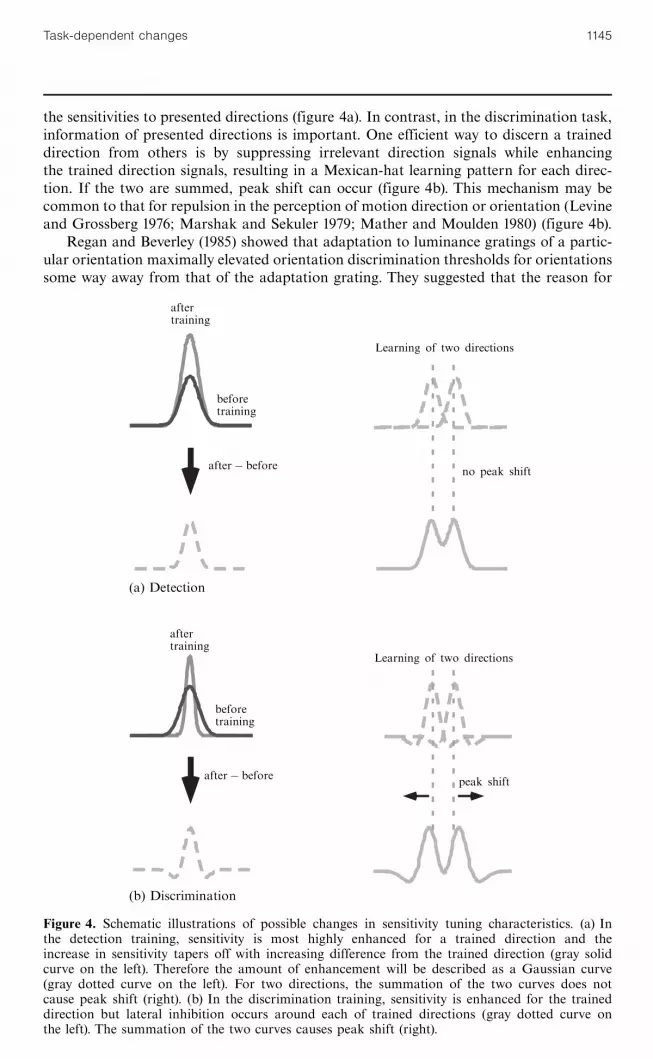
the sensitivities to presented directions (figure 4a). In contrast, in the discrimination task,information of presented directions is important. One efficient way to discern a traineddirection from others is by suppressing irrelevant direction signals while enhancingthe trained direction signals, resulting in a Mexican-hat learning pattern for each direc-tion. If the two are summed, peak shift can occur (figure 4b). This mechanism may becommon to that for repulsion in the perception of motion direction or orientation (Levineand Grossberg 1976; Marshak and Sekuler 1979; Mather and Moulden 1980) (figure 4b).
Regan and Beverley (1985) showed that adaptation to luminance gratings of a partic-ular orientation maximally elevated orientation discrimination thresholds for orientationssome way away from that of the adaptation grating. They suggested that the reason for
aftertraining
Learning of two directions
afterÿ beforeno peak shift
(a) Detection
(b) Discrimination
beforetraining
aftertraining
Learning of two directions
beforetraining
peak shiftafterÿ before
Figure 4. Schematic illustrations of possible changes in sensitivity tuning characteristics. (a) Inthe detection training, sensitivity is most highly enhanced for a trained direction and theincrease in sensitivity tapers off with increasing difference from the trained direction (gray solidcurve on the left). Therefore the amount of enhancement will be described as a Gaussian curve(gray dotted curve on the left). For two directions, the summation of the two curves does notcause peak shift (right). (b) In the discrimination training, sensitivity is enhanced for the traineddirection but lateral inhibition occurs around each of trained directions (gray dotted curve onthe left). The summation of the two curves causes peak shift (right).
Task-dependent changes 1145

this is that filters with Gaussian-shaped tuning functions give the biggest differentialresponse to pairs of orientations which fall on the limbs, rather than around themaximum of the tuning function, as it is on the limbs that sensitivity is changing mostrapidly. Thus, discrimination is favored if locally high slopes to each side of the peakof a tuning curve is attained (see also Hol and Treue 2001). Prins and Kingdom(2002) obtained an analogous result for texture modulation detection. Their hypothesisis in accord with our model in that higher slopes of a tuning curve are utilized fordiscrimination tasks. At the same time, these adaptation effects are different from theresult of the discrimination condition of our experiment in that (a) adaptation effectsimpute stimuli rather than tasks, and (b) the present study obtained the best ratherthan the worst performance at motion directions away from the learning directions.This may be because the mechanism for long-term task-driven perceptual learning andthe mechanism for adaptation are not entirely the same (Matthews et al 2001).
Where does the mechanism for the peak shift in the discrimination training occur?It has been pointed out that task-driven perceptual learning involves a broad range ofvisual processing, from low-level stages (Ball and Sekuler 1987; Crist et al 1997, 2001;Fiorentini and Berardi 1980; Poggio et al 1992; Schoups et al 2001; Vaina et al 1995),to higher-level stages of weighing visual input for making visual processing decisions(Dosher and Lu 1998, 1999) and memory processing (Chun 2000).(1) Since lateral inhibi-tion is known to occur in various stages, it is premature to conclude where the mechanismfor the peak shift occurs. Further series of experiments are necessary to clarify this.
In summary, we conducted experiments in which motion-detection tasks and motion-direction discrimination tasks of identical stimuli were performed across multiple sessionsby different groups of subjects with the same frequency. While the highest improvementwas found for the trained directions in the detection task, in motion-discriminationtraining the peak performance improvement was shifted away from the trained direc-tions. These results suggest that inhibitory signals to the directions in the vicinity of arelevant direction are modulated by task demands.
Acknowledgments. We thank Jose E Nan¬ ez Sr, David Somers, and Robert Sekuler for commentson the present study. The research was supported by NIH R01 EY015980-01, HFSP RGP0018/2004to TW and by Felicia Sorembe Lambros Scholarship to SK.
ReferencesAhissar M, Hochstein S, 1993 `Attentional control of early perceptual learning'' Proceedings of
the National Academy of Sciences of the USA 90 5718 ^ 5722Ball K, Sekuler R, 1987 ` Direction-specific improvement in motion discrimination'' Vision Research
27 953 ^ 965Beard B L, Levi D M, Reich L N, 1995 ` Perceptual learning in parafoveal vision'' Vision Research
35 1679 ^ 1690Chun M M, 2000 ` Contextual cueing of visual attention'' Trends in Cognitive Sciences 4 170 ^ 178Crist R E, Kapadia M K, Westheimer G, Gilbert C D, 1997 ` Perceptual learning of spatial
localization: specificity for orientation, position, and context'' Journal of Neurophysiology 782889 ^ 2894
Crist R E, Li W, Gilbert C D, 2001 ` Learning to see: experience and attention in primary visualcortex'' Nature Neuroscience 4 519 ^ 525
Dosher B A, Lu Z L, 1998 ` Perceptual learning reflects external noise filtering and internal noisereduction through channel reweighting'' Proceedings of the National Academy of Sciences ofthe USA 95 13988 ^ 13993
Dosher B A, Lu Z L, 1999 ` Mechanisms of perceptual learning'' Vision Research 39 3197 ^ 3221Fahle M, Edelman S, Poggio T, 1995 ` Fast perceptual learning in hyperacuity'' Vision Research
35 3003 ^ 3013Fahle M, Poggio T, 2002 Perceptual Learning (Cambridge, MA: MIT Press)
(1) However, task-irrelevant learning seems to occur in low-level sensory and cortical stages (Watanabeet al 2001).
1146 S Koyama, A Harner, T Watanabe
Fiorentini A, Berardi N, 1980 ` Perceptual learning specific for orientation and spatial frequency''Nature 287 43 ^ 44
Herzog M H, Fahle M, 1997 ``The role of feedback in learning a vernier discrimination task''Vision Research 37 2133 ^ 2141
Hol K, Treue S, 2001 ` Different populations of neurons contribute to the detection and discrim-ination of visual motion'' Vision Research 41 685 ^ 689
Krueger L E, 1979 `A model of unidimensional perceptual matching'' Journal of ExperimentalPsychology: Human Perception and Performance 5 277 ^ 288
Levine D S, Grossberg S, 1976 ` Visual illusions in neural networks: line neutralization, tilt aftereffect, and angle expansion'' Journal of Theoretical Biology 61 477 ^ 504
Liu Z, 1999 ` Perceptual learning in motion discrimination that generalizes across motion direc-tions'' Proceedings of the National Academy of Sciences of the United States of America 9614085 ^ 14087
McKee S P, Westheimer G, 1978 ` Improvement in vernier acuity with practice'' Perception andPsychophysics 24 258 ^ 262
Marshak W, Sekuler R, 1979 ` Mutual repulsion between moving visual targets'' Science 2051399 ^ 1401
Mather G, Moulden B, 1980 `A simultaneous shift in apparent direction: further evidence for a` distribution-shift'' model of direction coding'' Quarterly Journal of Experimental Psychology32 325 ^ 333
Matthews N, Liu Z, Geesaman B J, Qian N, 1999 ` Perceptual learning on orientation anddirection discrimination'' Vision Research 39 3692 ^ 3701
Matthews N, Liu Z, Qian N, 2001 ` The effect of orientation learning on contrast sensitivity''Vision Research 41 463 ^ 471
Mednick S C, Nakayama K, Cantero J L, Atienza M, Levin A A, Pathak N, Stickgold R, 2002` The restorative effect of naps on perceptual deterioration'' Nature Neuroscience 5 677 ^ 681
Newsome W T, Pare E B, 1988 `A selective impairment of motion perception following lesionsof the middle temporal visual area (MT)'' Journal of Neuroscience 8 2201 ^ 2211
Poggio T, Fahle M, Edelman S, 1992 ` Fast perceptual learning in visual hyperacuity'' Science256 1018 ^ 1021
Prins N, Kingdom F A, 2002 ` Orientation- and frequency-modulated textures at low depths ofmodulation are processed by off-orientation and off-frequency texture mechanisms'' VisionResearch 42 705 ^ 713
Regan D, Beverley K I, 1985 ` Postadaptation orientation discrimination'' Journal of the OpticalSociety of America A 2 147 ^ 155
Saarinen J, Levi D M, 1995 ` Perceptual learning in vernier acuity: what is learned?'' Vision Research35 519 ^ 527
Schoups A, Vogels R, Qian N, Orban G, 2001 ``Practising orientation identification improvesorientation coding in V1 neurons'' Nature 412 549 ^ 553
Schwartz S, Maquet P, Frith C, 2002 ` Neural correlates of perceptual learning: a functionalMRI study of visual texture discrimination'' Proceedings of the National Academy of Sciencesof the USA 99 17137 ^ 17142
Seitz A R,Watanabe T, 2003 ` Is subliminal learning really passive?'' Nature 422 36Vaina L M, Sundareswaran V, Harris J G, 1995 ` Learning to ignore: psychophysics and computa-
tional modeling of fast learning of direction in noisy motion stimuli'' Brain Research: CognitiveBrain Research 2 155 ^ 163
Watanabe T, Nan¬ ez J E, Sasaki Y, 2001 ` Perceptual learning without perception'' Nature 413844 ^ 848
Watanabe T, Nan¬ ez J E Sr, Koyama S, Mukai I, Liederman J, Sasaki Y, 2002 ` Greater plasticityin lower-level than higher-level visual motion processing in a passive perceptual learning task''Nature Neuroscience 5 1003 ^ 1009
Task-dependent changes 1147

ß 2004 a Pion publication

ISSN 0301-0066 (print)
Conditions of use. This article may be downloaded from the Perception website for personal researchby members of subscribing organisations. Authors are entitled to distribute their own article (in printedform or by e-mail) to up to 50 people. This PDF may not be placed on any website (or other onlinedistribution system) without permission of the publisher.
www.perceptionweb.com
ISSN 1468-4233 (electronic)


