Embed Size (px)
Citation preview

Citation: Jawaharlalnehru, A.;
Sambandham, T.; Sekar, V.;
Ravikumar, D.; Loganathan, V.;
Kannadasan, R.; Khan, A.A.;
Wechtaisong, C.; Haq, M.A.;
Alhussen, A.; et al. Target Object
Detection from Unmanned Aerial
Vehicle (UAV) Images Based on
Improved YOLO Algorithm.
Electronics 2022, 11, 2343.
https://doi.org/10.3390/
electronics11152343
Academic Editor: Manohar Das
Received: 4 June 2022
Accepted: 20 June 2022
Published: 27 July 2022
Publisher’s Note: MDPI stays neutral
with regard to jurisdictional claims in
published maps and institutional affil-
iations.
Copyright: © 2022 by the authors.
Licensee MDPI, Basel, Switzerland.
This article is an open access article
distributed under the terms and
conditions of the Creative Commons
Attribution (CC BY) license (https://
creativecommons.org/licenses/by/
4.0/).
electronics
Article
Target Object Detection from Unmanned Aerial Vehicle (UAV)Images Based on Improved YOLO AlgorithmArunnehru Jawaharlalnehru 1,* , Thalapathiraj Sambandham 2, Vaijayanthi Sekar 1, Dhanasekar Ravikumar 3 ,Vijayaraja Loganathan 3, Raju Kannadasan 4 , Arfat Ahmad Khan 5,*, Chitapong Wechtaisong 6,*,Mohd Anul Haq 7,* , Ahmed Alhussen 8,* and Zamil S. Alzamil 7
1 Department of Computer Science and Engineering, SRM Institute of Science and Technology,Vadapalani, Chennai 600026, India; [email protected]
2 Department of Mathematics, SRM Institute of Science and Technology, Vadapalani, Chennai 600026, India;[email protected]
3 Department of Electrical and Electronics Engineering, Sri Sairam Institute of Technology,Chennai 600044, India; [email protected] (D.R.); [email protected] (V.L.)
4 Department of Electrical and Electronics Engineering, Sri Venkateswara College of Engineering,Sriperumbudur 602117, India; [email protected]
5 College of Computing, Khon Kaen University, Khon Kaen 40000, Thailand6 School of Telecommunication Engineering, Suranaree University of Technology,
Nakhon Ratchasima 30000, Thailand7 Department of Computer Science, College of Computer and Information Sciences, Majmaah University,
Al-Majmaah 11952, Saudi Arabia; [email protected] Department of Computer Engineering, College of Computer and Information Sciences, Majmaah University,
Al-Majmaah 11952, Saudi Arabia* Correspondence: [email protected] (A.J.); [email protected] (A.A.K.);
[email protected] (C.W.); [email protected] (M.A.H.); [email protected] (A.A.)
Abstract: Aerial image-based target object detection has several glitches such as low accuracy inmulti-scale target detection locations, slow detection, missed targets, and misprediction of targets.To solve this problem, this paper proposes an improved You Only Look Once (YOLO) algorithmfrom the viewpoint of model efficiency using target box dimension clustering, classification of thepre-trained network, multi-scale detection training, and changing the screening rules of the candidatebox. This modified approach has the potential to be better adapted to the positioning task. The aerialimage of the unmanned aerial vehicle (UAV) can be positioned to the target area in real-time, and theprojection relation can convert the latitude and longitude of the UAV. The results proved to be moreeffective; notably, the average accuracy of the detection network in the aerial image of the target areadetection tasks increased to 79.5%. The aerial images containing the target area are considered toexperiment with the flight simulation to verify its network positioning accuracy rate and were foundto be greater than 84%. This proposed model can be effectively used for real-time target detection formulti-scale targets with reduced misprediction rate due to its superior accuracy.
Keywords: image processing; convolutional neural network (CNN); YOLO; target detection;Darknet 19
1. Introduction1.1. Background
The researchers have remarkable achievements in Computer vision due to its devel-opments in deep learning algorithms, hardware requirements, and the obtainability ofdatasets. Notably, object detection is one of the most important research directions in com-puter vision and large numbers of target detection techniques have recently been developed.Because, the targets in a scene vary in size, it’s more critical to detect and recognize them atvaried scales. Small object detection and localization error are a hard and exciting challenge
Electronics 2022, 11, 2343. https://doi.org/10.3390/electronics11152343 https://www.mdpi.com/journal/electronics
Electronics 2022, 11, 2343 2 of 16
in the task of object identification that has attracted the interest of researchers, motivatingthem to enhance task performance in aerial object recognition and tracking to minimizehuman effort with increased efficiency. Although deep detection models were designed tohandle challenges connected to broad object detection, they nonetheless contribute to thesuccess of small object detection on a specific level. To improve the detection performanceof targets with different sizes, a multi-scale target detection algorithm is essential usingmulti-scale detection training, with changing the screening rules of the candidate box.
1.2. Literature Review
Specifically, object detection is the most cited research task due to its broad appli-cation in several domains [1]. The unmanned aerial vehicles (UAV) have exposed theirextraordinary impending for commercial, military, and civil-government applications in abroad range, notably infrastructure inspection, aerial photography, logistics, etc. [2]. Theengagement of a UAV integrated with computer vision practices is absolutely beneficialfor errands that necessitate distinctive conception and robust insight [2,3]. Deep learningwith a convolutional neural network (CNN) in the extraction of high-level image featureshas several advantages [4]. Additionally, some of the researchers proposed a regionalconvolutional neural network (RCNN) with the VOC2012 data set [5], and the averageaccuracy of target detection mean Average Precision (mAP) increased notably. Also, theauthors demonstrate that Fast RCNN and ultra-fast Faster RCNN [6,7] offer superior ac-curacy with relatively faster, and the frame rate can reach five frames/s. Redmonet al. [8]proposed YOLO that reaches the speed to detect video at 45 Frame/s. While increasingdetection speed, YOLO sacrificed accuracy and found a new way to combine classificationand localization for future research purposes.
Further, Liu et al. [9] and Redmon et al. [10] suggested YOLO and Single Shot Multi-Box Detector (SSD) map that the detection speed increased significantly and achievedsatisfactory results for overall systems. For the target detection process in the VOC 2007dataset, when the detection speed is 67 frame/s, the mAP reaches 76.8% in the field oftarget detection and achieves the best detection results. Target detection and aerial imagepositioning task have many similarities, and all need to target areas with fast and accuratepositioning. From the perspective of human cognition and judgment position, the eye cansee the scene; a human can quickly find and locate the target object, which is the targetdetection process that requires the computer to complete the task.
Similarly, during the flight, the pilot can roughly determine the aircraft’s locationaccording to the familiar target area on the ground, but aerial image positioning also needsto teach the computer to complete the task. In recent years, the target detection technologyhas matured, and the accuracy rate and detection speed have been significantly improved.Some of the recent works carried out by the researchers are illustrated in Table 1.
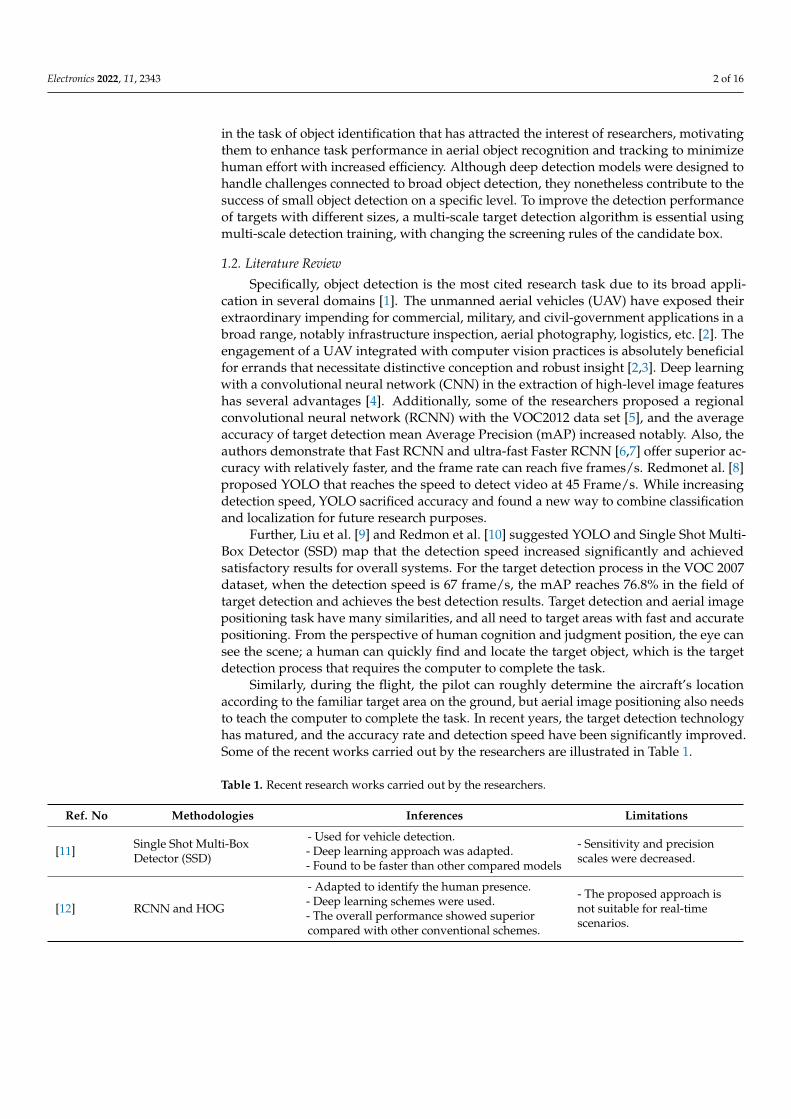
Table 1. Recent research works carried out by the researchers.
Ref. No Methodologies Inferences Limitations
[11] Single Shot Multi-BoxDetector (SSD)
- Used for vehicle detection.- Deep learning approach was adapted.- Found to be faster than other compared models
- Sensitivity and precisionscales were decreased.
[12] RCNN and HOG
- Adapted to identify the human presence.- Deep learning schemes were used.- The overall performance showed superiorcompared with other conventional schemes.
- The proposed approach isnot suitable for real-timescenarios.

Electronics 2022, 11, 2343 3 of 16
Table 1. Cont.
Ref. No Methodologies Inferences Limitations
[13] GANet- Used to detect the human and pose estimation.- Deep learning model was adapted.- It offered ideal accuracy in detection.
- Training descriptions areclutter-free, contextual, andinappropriate for real-timescenarios.
[14] MobileNet and SSD
- Object detection was carried out using theproposed method.- Deep learning approach was considered.- It offered best better accuracy with theforeground and background attention model.
- This work failed todemonstrate multi-objects.
[15] CNN
- Human action detection was carried out usingthe considered model.- Deep learning approach was adopted.- It detected the multiple actions of humans withgood accuracy.
- Waving hand action wasconcentrated more than theother movements.
[16] YOLO, SSD and RCNN
- Human detection and their counts wereperformed effectively.- Deep learning approach was used to studythe performance.- It offered good accuracy in countingthe humans.
- This work failed to focus onmore crowd patterns withimproved accuracy.
[17] CNN
- This work demonstrated the recognition ofhuman activity.- Deep learning approach was used.- This pipeline scheme improved the accuracyand speed of the detection.
- It failed to recognize thehuman action from differentcamera angles.
[18] Human shape validation filter
- This work identified the birds using theproposed method.- Deep learning approach was considered.- The detection shows better accuracy thanother methods.
- It showed some difficultiesin detecting the smaller birds.
[19] YOLOv4
- This model was adapted to detect the appleflower bud.- Deep learning approach was considered.- It helped to determine the heat requirementbased on feasible detection.
- The classificationperformance showedaverage results.
[20] Tiny YOLO
- This work provided optimized performance inboth terms FPS and mAP.- Used the own dataset for training the data.- Applied to detect the pest using theproposed approach.
- This scheme offered lessaccuracy for low-resolutionimages.
Considering all the inferences and limitations, this work attempted to improve thedetection accuracy using the YOLO network and helped to study the aerial image posi-tioning. Using the YOLO network as the main body, the improvement measures are putforward through the target frame dimension clustering, classification network pre-training,multi-scale detection training, and changing the screening rules of the candidate frameto make it better adapt to the positioning task. The core problem of image localization istransformed into the target detection problem, and the target detection data set is made byselecting the flight test area and using the feature with apparent characteristics in the area asthe target area. It is possible to locate the target area in the aerial image acquired in real-time.At the same time, two or more target areas of the judgment are adapted so that the relativepositional relationship between the targets can greatly improve the positioning accuracy.However, the introduction of oblique projection to form an oblique image increases the

Electronics 2022, 11, 2343 4 of 16
difficulty of detection. Still, it can expand the range of aerial image storage so that a singleaerial image appears as much as possible in the target area to improve positioning accuracy.
2. Methodology2.1. Principle Feature Extraction Network Darknet 19
YOLO plus SSD network structure with a new design classification network, namelyDarknet 19, acts as the basic model of the network. Before the YOLO model, most of thetarget detection framework was carried out using VGG 16 [21] to extract features, but it ismore complex and offers computationally more intensive. The YOLO framework is similarto GoogleNet [22] in the network structure, but the calculation is lower than VGG 16, witha reduced accuracy rate compared with VGG 16. As a result, Redmon designed CNN withboth complexity and accuracy to improve the detection performance of the network [8].The final base model adapted is Darknet 19, containing 19 convolution layers and fivetop pooling layers. Like VGG 16, the network uses a large number of 3 × 3 convolutionkernels; after each pool operation (Size 2 × 2, Step 2) and the number of channels alsodoubled. Based on the idea of Network In-network [23], the 1 × 1 convolution kernel isplaced between the 3 × 3 convolution kernel to compress features and increase networkdepth. After each convolution layer, the bulk normalization operation is improved, and theDropout operation is removed. The performance of the Darknet 19, AlexNet [24], and VGG16 is shown in Table 2. Darknet 19 is in the Top 1% and Top 5% in the accuracy of 72.9%and 91.2%, respectively, which are higher than AlexNet and VGG 16. The time parameters(Central Processing Unit (CPU) and graphics processor (GPU) are slightly longer than thatof AlexNet and VGG 16. The overall comparison shows that the performance of Darknet19 is superior to others.
Table 2. Performance comparison of Darknet-19.
Model Top—1/% Top—5/% GPU/ms CPU/s
Alexnet 57 80.3 1.5 0.3
VGG-16 70.5 90 10.7 4.9
DarkNet-19 72.9 91.2 6.0 0.66
2.2. YOLO
YOLO structure and its improvement in the detection network use Darknet 19 asthe primary model for feature extraction. The modification is done by replacing the finalconvolutional layer Darknet 19 network by adding three dimensions of 3 × 3. The numberof channels with 1024 convolution layer; each convolution layer, after adding a size of1 × 1 convolution layer, the output dimension that is required to detect the number. Com-pared with conventional YOLO, this modified structure removes the complete connectionlayer. The whole network is a convolution operation that retains the spatial information,i.e., each feature point and the resulting original map of each correspondence. And theyare drawing on the ideas of anchors in the Faster RCNN [25] method for the target boxdimension and clustering data set to determine the size and number of anchors. Thecategory predictions in YOLO are no longer tied together with each cell but rather by usinganchors to predict categories and coordinates simultaneously. Due to removing the fullyconnected layer, the model contains only Convolution and pooling layers, so the input sizeis flexible. When training, every few rounds can change the model input size, and thereforethe model for different size image become robust. Every ten cycles, the model randomizesto obtain a new image dimension as input to proceed with the training. This rule forcedthe model to consider different input resolutions. The model is faster for small input sizes;YOLO can adjust the speed and accuracy when required. In the case of low resolution(288 Pixel × 288 Pixel) as illustrated in Table 3, YOLO’s processing speed can reach up to90 Frames/s in the case of accuracy and Fast RCNN flat results are obtained from [10]. In

Electronics 2022, 11, 2343 5 of 16
the case of high resolution, the mAP of YOLOv2 in the data set of VOC 2007 can achievethe best results.
Table 3. Performance comparison of object detection box with state-of-the-art results.
DetectionNetwork
FastR-CNN
FasterR-CNNVGG-16
FasterR-CNNResnet
YOLO SSD 300 SSD 500 YOLO288 × 288
YOLO544 × 544
mAP 70 73.2 76.4 63.4 74.3 76.8 69.0 78.6
FPS 0.5 7 5 45 46 19 91 40
2.3. Coordinate Transformation
The camera coordinate system (xc, yc, zc) to the camera optical lens center ‘S’ as theorigin, the z-axis is perpendicular to the imaging plane up to the positive direction, andx-axis and y-axis are parallel to the two sides of the imaging plane (Figure 1). The globalcoordinate system (Xg, Yg, Zg) uses the internationally adopted geocentric coordinatesystem to the Earth centroid as the coordinate origin of the WGS 84g coordinate system.
Figure 1. Imaging Model Diagram.
The external orientation elements of the imaging model comprise of 3 corner elements(α, ω, and κ) and 3 line elements (Xs, Ys, Zs), which are used to describe the spatialposition coordinates of the camera’s spatial posture and the Optical Center Point S. Globalcoordinates (Xg, Yg, Zg) and the camera coordinates (xc, yc, zc) of the conversion is derivedusing the below formula [26]:Xs
YsZs
cos α cos k − sin α sin ω sin k − cos α sin k − sin α sin ω sin k − sin α cos ωcos ω sin k cos ω cos k − sin ω
sin α cos k + cos α sin ω sin k − sin α sin k + cos α sin ω cos k cos α cos ω
xcyczc
+
XsYsZs
(1)
where Xs and Ys are the items to be solved and Zs is the known item representing the flightaltitude of the aircraft. Point A coordinates in the camera coordinate system are expressedas (XA, YB, −f ), where XA, YA represents a point A location in aerial imagery; f representsa focal length which is a known term of the coordinates in the global coordinate system(XA, YB, 0); wherein XA and YB represent the coordinates of the target area as a known itemand B states the midpoint of the plane.

Electronics 2022, 11, 2343 6 of 16
The coordinates in the global coordinate system are XS, YS, 0, according to the pointsS, A, B. The coordinate conversion relationship X can be derived between the positional asillustrated below:
[XAYAZA] = M[xAyA − f ] + [XsYsZs] (2)
In Equation (2), where the coordinates of the rotation matrix of 3 × 3 consist of threecorner elements and M terms the aerial map. Further, the synthesis of both the equationscan be calculated by XS and YS, i.e., by calculating the projection relationship and thecoordinate conversion. The coordinates of the onboard camera can obtain the coordinatesof the center of the target area to obtain the coordinates of the centroid of the UAV.
3. Improved Method
Although YOLO has achieved the best detection results, it is not entirely suitable forimage localization tasks. As shown in Figure 2, the basis of the YOLO network mainlyimproved by combining two different approaches as follows:
(1) The target frame of the self-made data set dimension clustering determines the anchorparameters of YOLOv2 are determined by clustering of VOC2007 and VOC2012datasets.The determined parameters of YOLOv2 are universal but not suitable for specificdetection tasks; therefore, it is necessary to re-clustering operation in the self-madeaerial image detection data set.
(2) Fine-tune the network using a different set of self-made data in classification networktraining. Like the YOLO, the first use of ImageNet dataset for pre-training, and thedifference is the use of homemade resolution different image classification data set,can get a better fine-tuning effect.
(3) During the training process, every ten rounds change the input size of the model, andtherefore, the model of different scales of the image becomes robust. The input data isself-made aerial image detection data set.
(4) Modify the filter rules of the candidate box to change the non-Maxima suppression(NMS) operation to the maximum value. The screening rule of the candidate framein YOLO is NMS operation, but the maximum value operation can be carried outdirectly on the image positioning problem in this work to improve the detection effect.
Figure 2. Schematic of the improved method.
3.1. Target Box Dimension Clustering
The target box dimension clustering YOLO works on the idea of the Faster RCNNand introduces the anchors in a set of constant size and aspect ratio of the initial candidatebox anchor. The accuracy of the target’s detection concerning speed and the position ofthe target box, but the anchor dimensions are set manually. Redmon et al. [8] proposed amethod of dimensionally clustering by k-Means for the data set manually labeled targetbox clustering and finds the statistical laws of the target box. YOLO has five anchors, and
Electronics 2022, 11, 2343 7 of 16
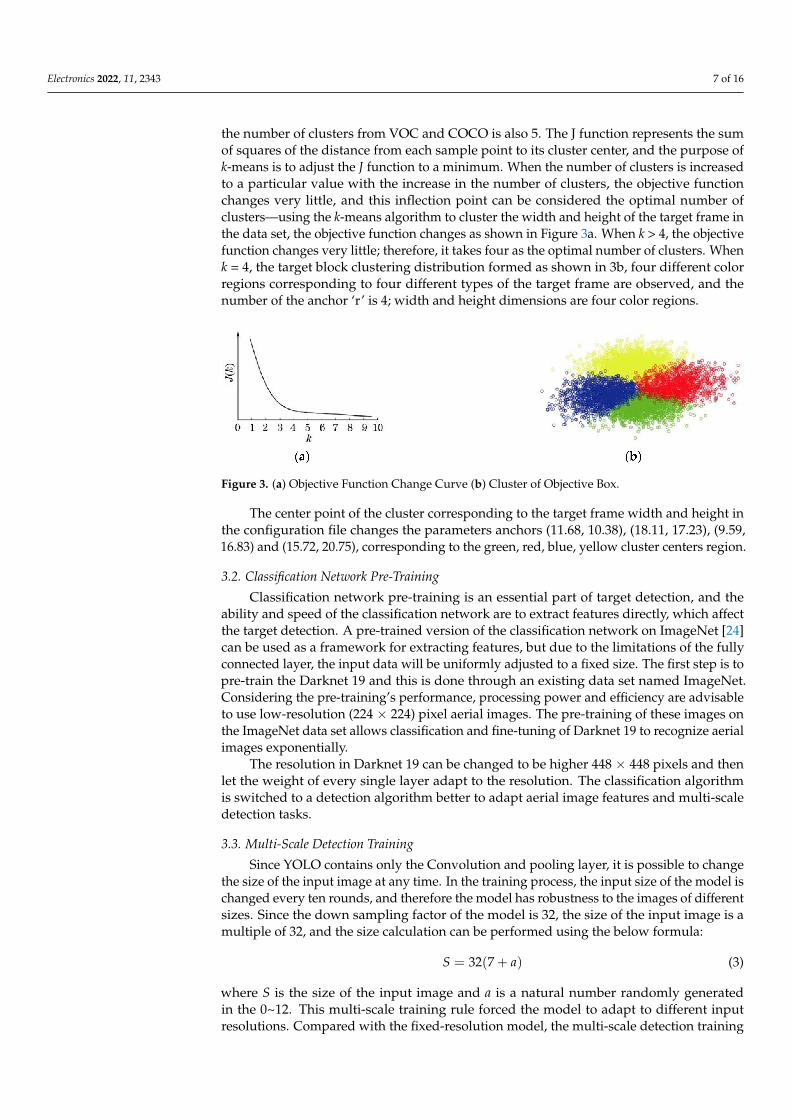
the number of clusters from VOC and COCO is also 5. The J function represents the sumof squares of the distance from each sample point to its cluster center, and the purpose ofk-means is to adjust the J function to a minimum. When the number of clusters is increasedto a particular value with the increase in the number of clusters, the objective functionchanges very little, and this inflection point can be considered the optimal number ofclusters—using the k-means algorithm to cluster the width and height of the target frame inthe data set, the objective function changes as shown in Figure 3a. When k > 4, the objectivefunction changes very little; therefore, it takes four as the optimal number of clusters. Whenk = 4, the target block clustering distribution formed as shown in 3b, four different colorregions corresponding to four different types of the target frame are observed, and thenumber of the anchor ‘r’ is 4; width and height dimensions are four color regions.
Figure 3. (a) Objective Function Change Curve (b) Cluster of Objective Box.
The center point of the cluster corresponding to the target frame width and height inthe configuration file changes the parameters anchors (11.68, 10.38), (18.11, 17.23), (9.59,16.83) and (15.72, 20.75), corresponding to the green, red, blue, yellow cluster centers region.
3.2. Classification Network Pre-Training
Classification network pre-training is an essential part of target detection, and theability and speed of the classification network are to extract features directly, which affectthe target detection. A pre-trained version of the classification network on ImageNet [24]can be used as a framework for extracting features, but due to the limitations of the fullyconnected layer, the input data will be uniformly adjusted to a fixed size. The first step is topre-train the Darknet 19 and this is done through an existing data set named ImageNet.Considering the pre-training’s performance, processing power and efficiency are advisableto use low-resolution (224 × 224) pixel aerial images. The pre-training of these images onthe ImageNet data set allows classification and fine-tuning of Darknet 19 to recognize aerialimages exponentially.
The resolution in Darknet 19 can be changed to be higher 448 × 448 pixels and thenlet the weight of every single layer adapt to the resolution. The classification algorithmis switched to a detection algorithm better to adapt aerial image features and multi-scaledetection tasks.
3.3. Multi-Scale Detection Training
Since YOLO contains only the Convolution and pooling layer, it is possible to changethe size of the input image at any time. In the training process, the input size of the model ischanged every ten rounds, and therefore the model has robustness to the images of differentsizes. Since the down sampling factor of the model is 32, the size of the input image is amultiple of 32, and the size calculation can be performed using the below formula:
S = 32(7 + a) (3)
where S is the size of the input image and a is a natural number randomly generatedin the 0~12. This multi-scale training rule forced the model to adapt to different inputresolutions. Compared with the fixed-resolution model, the multi-scale detection training

Electronics 2022, 11, 2343 8 of 16
is faster for low-resolution input image detection and more accurate for high-resolutioninput image detection.
3.4. Change the Candidate Box
Initially, the input Aerial image is divided into S × S grid blocks, and each blockpredicts the object present at the center of the block, where bounding boxes and theirconfidence scores are estimated. During the training process, each candidate box of YOLOwill calculate their confidence as follows:
CScon f = Pr(Object)× Rtruthpred × Pr
(ClassiObject
)(4)
The class specific confidence score, CScon f , is defined as Pr(
Oobject
)∗ grid Rtruth
pred ,
where Pr(
Oobject
)represents the probability that the block contains an object in the pre-
dicted bounding box and the target grid Rtruthpred helps to predict the rate of overlap between
the bounding box and the ground truth. The block i the bounding box is also predictsthe uncertain class probabilities, Pr
(ClassiObject
), for class objects to determine which class the
object in the bounding box belongs to. If the bounding box is appeared in the area wherethe object exists, then Pr
(Oobject
)takes 1; otherwise, takes 0.
Pr(
Oobject
)∗ Rtruth
pred = Pr(Classi) ∗ Rtruthpred (5)
where Pr(
Oobject
)and Pr(Classi) represents each grid prediction category probability score.
After the composite score of each candidate box is obtained, the threshold value of Tthresholdis set, and the candidate box with a low score is filtered out. Thus, the Non-maximumSuppression (NMS) operation is changed to the maximum value of the operation, i.e.,taking the maximum value in several groups. It is more significant than the threshold valueof the composite score uniquely by determining the position of the candidate frame andits prediction category. The maximum value of the operation in the aerial image of a classof target area can only detect a target box that can effectively avoid the target area andcalculated as:
Pr(Classi) = Pr(
Oobjecti
)∗ Rtruth
pred ≥ Tthreshold, (6)
The false identification of a similar area caused by network detection improves targetdetection accuracy.
4. Results and Discussions4.1. Experimental Data
The experimental data is based on the rectangular area centered in Changchun city,Jilin province. The source image was derived from Google Earth for April 2013, October2015 and November 2016 in the city of Changchun in Jilin province Satellite Remote Sensingwhich lies in the middle portion of the Northeast China Plain. The orbital aerial imagetile is captured from the altitude of 15 km above the sea level with an elevation of 200 mwith different aerial angles. This data set is divided into two categories: (1) pre-trainingprocess that requires the use of classification data according to the resolution level whichis divided into two groups, namely 224 pixel × 224 pixel and 448 pixel × 448 pixel;(2) detection network training that needs detection data according to the resolution and thestudy area was divided into 256 square areas of the same size with classification data setconsists of 25 classes namely Agricultural land, Airport, Art gallery, Bus station, Church,Colleges, Film studio, Football, court, Highway, Hotel, Industry, Lake, Library, Mountains,Museum, Oil Mill, Open Mines, Park, Pond, Shopping mall, Tennis court, Theme park,Town hall, Train station and Zoo, which marked evenly distributed areas with obviouscharacteristics [27]. By rotating, adding noise, adjusting the tone, and other methods expand
Electronics 2022, 11, 2343 9 of 16
the number of samples [28]. Finally, the total number of samples of the classification dataset is 530,440, with the ratio of the high and low resolution of about 3:1. The total numberof samples of the test data is 38,200, with the number of samples of different resolutionsbeing almost the same. Also, the ratio of the ortho image to the tilted image is 1:1 in order.
4.2. Configuration and Training Results
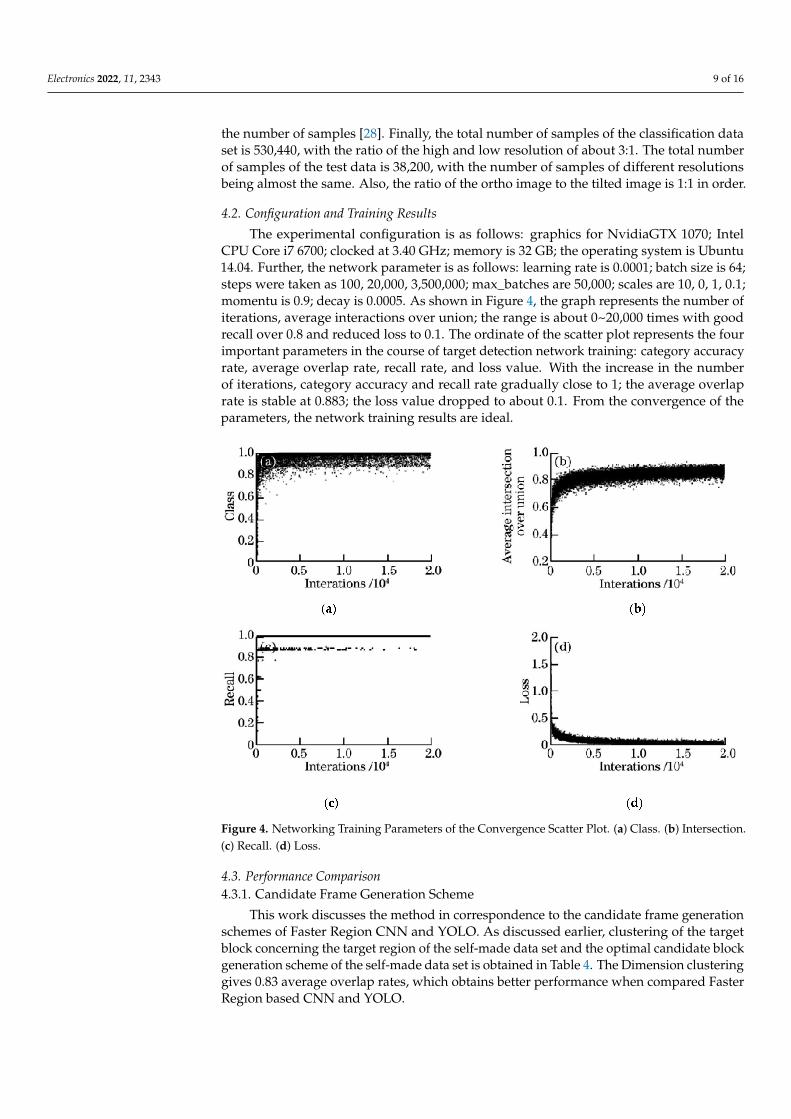
The experimental configuration is as follows: graphics for NvidiaGTX 1070; IntelCPU Core i7 6700; clocked at 3.40 GHz; memory is 32 GB; the operating system is Ubuntu14.04. Further, the network parameter is as follows: learning rate is 0.0001; batch size is 64;steps were taken as 100, 20,000, 3,500,000; max_batches are 50,000; scales are 10, 0, 1, 0.1;momentu is 0.9; decay is 0.0005. As shown in Figure 4, the graph represents the number ofiterations, average interactions over union; the range is about 0~20,000 times with goodrecall over 0.8 and reduced loss to 0.1. The ordinate of the scatter plot represents the fourimportant parameters in the course of target detection network training: category accuracyrate, average overlap rate, recall rate, and loss value. With the increase in the numberof iterations, category accuracy and recall rate gradually close to 1; the average overlaprate is stable at 0.883; the loss value dropped to about 0.1. From the convergence of theparameters, the network training results are ideal.
Figure 4. Networking Training Parameters of the Convergence Scatter Plot. (a) Class. (b) Intersection.(c) Recall. (d) Loss.
4.3. Performance Comparison4.3.1. Candidate Frame Generation Scheme
This work discusses the method in correspondence to the candidate frame generationschemes of Faster Region CNN and YOLO. As discussed earlier, clustering of the targetblock concerning the target region of the self-made data set and the optimal candidate blockgeneration scheme of the self-made data set is obtained in Table 4. The Dimension clusteringgives 0.83 average overlap rates, which obtains better performance when compared FasterRegion based CNN and YOLO.

Electronics 2022, 11, 2343 10 of 16
Table 4. Anchors and Overlap rate.
Candidate Box Anchors Generated Average Overlap Rate
Faster Region based-CNN 7 0.77
YOLO 5 0.79
Dimension Clustering 4 0.83
4.3.2. Classification Network Pre-Training Method Comparison
The classification network pre-training method is divided into three steps that compareeach phase’s impact on the network classification extraction feature capabilities. Threedifferent stages of the pre-training network used to control other variables unchangedas a feature extractor and uses the same method to detect network training. Also, thecomparison is carried out for the performance of three networks namely ImageNet with448 × 448 pixels (blue line), ImageNet fine-tuned with low resolution of 288 × 288 pixels(red line) and ImageNet fine-tuned with low resolution of 224 × 224 pixels (yellow line).Fine to determine the effectiveness of the pre-training method. The effect of differentpre-training methods is illustrated in Figure 5 through the multi-resolution fine-tuning.After the classification of the network in the detection task and found to be better forImageNet fine-tuned with low resolution of 224 × 224 pixels (yellow line) because mAPvalue reached to 79.5 when compared to ImageNet with 448 × 448 pixels and ImageNetfine-tuned with low resolution of 288 × 288 pixels. The results show that the pre-trainingmethod of multi-resolution fine-tuning can significantly improve the feature extractioncapability of classification networks.
Figure 5. Comparison of different Pre-Training Methods.
4.3.3. Performance Measure between Different Networks
Performance measure of a multi-scale network is carried out by comparing a single-scale network through multi-scale network training that can show the detection of differentscales of data sets. It offered strong adaptability through the detection of different scales ofdata sets and tested to obtain multi-scale network and single-scale network performance,as shown in Table 5. The input size of a single-scale network in Table 5 shows that theincrease of the detection data set scale improved the detection effect of the two networks.Compared to a single-scale network with a multi-scale network, it is found that the smallerthe scale of the detection data set, the faster the detection speeds. Also, the larger the scaleof the detection data set, the higher the mAP value.
Electronics 2022, 11, 2343 11 of 16
Table 5. Comparison of multi-scale and single-scale network performance.
Detection ofDataset/(Pixel × Pixel)
Multi-Scale Network Single-Scale Network
Detection Time/s mAP Detection Time/s mAP
224 × 224 0.01 71.1 0.013 70.3
320 × 320 0.012 74.8 0.014 74.2
416 × 416 0.015 77.5 0.015 77.8
512 × 512 0.018 79.4 0.016 78.4
608 × 608 0.029 80.9 0.018 78.9
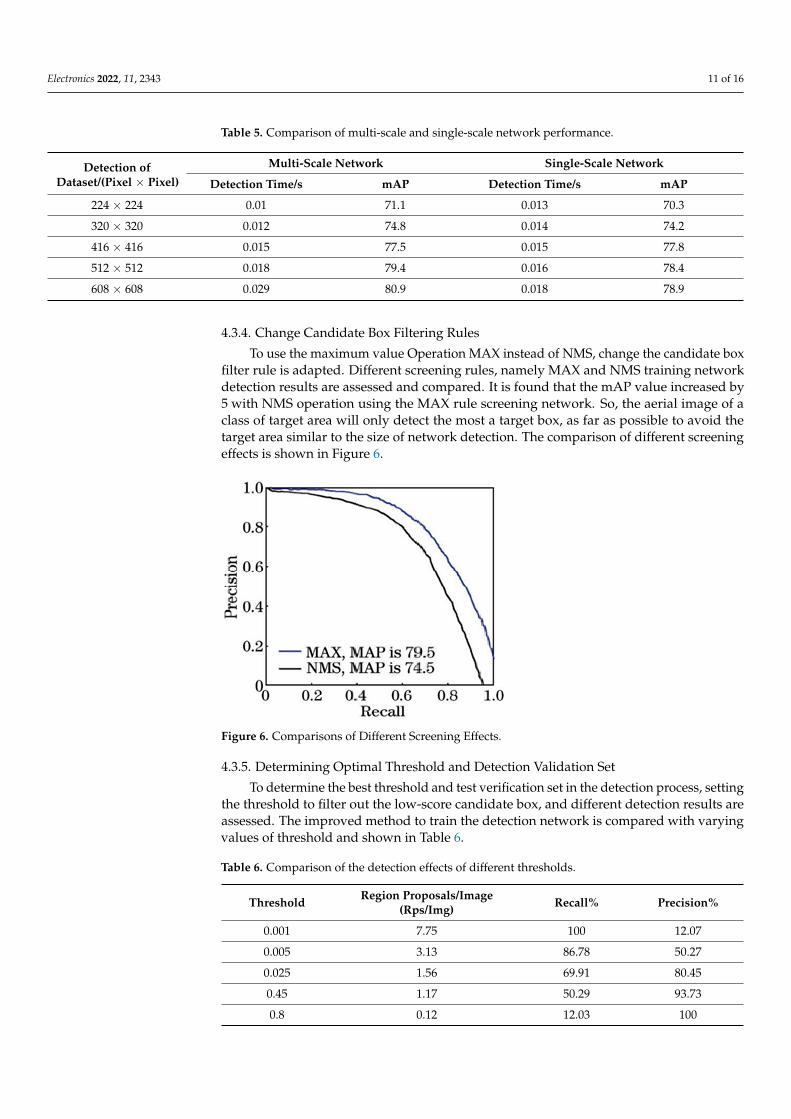
4.3.4. Change Candidate Box Filtering Rules
To use the maximum value Operation MAX instead of NMS, change the candidate boxfilter rule is adapted. Different screening rules, namely MAX and NMS training networkdetection results are assessed and compared. It is found that the mAP value increased by5 with NMS operation using the MAX rule screening network. So, the aerial image of aclass of target area will only detect the most a target box, as far as possible to avoid thetarget area similar to the size of network detection. The comparison of different screeningeffects is shown in Figure 6.
Figure 6. Comparisons of Different Screening Effects.
4.3.5. Determining Optimal Threshold and Detection Validation Set
To determine the best threshold and test verification set in the detection process, settingthe threshold to filter out the low-score candidate box, and different detection results areassessed. The improved method to train the detection network is compared with varyingvalues of threshold and shown in Table 6.
Table 6. Comparison of the detection effects of different thresholds.
Threshold Region Proposals/Image(Rps/Img) Recall% Precision%
0.001 7.75 100 12.07
0.005 3.13 86.78 50.27
0.025 1.56 69.91 80.45
0.45 1.17 50.29 93.73
0.8 0.12 12.03 100

Electronics 2022, 11, 2343 12 of 16
When using an improved method to complete the network training, the threshold isset to 0.025 with the validation set of samples to verify the effect of training and obtainsresults of precision as 80.45% and recall as 69.91%, which performs better when comparedwith other threshold values. Further, a part of the ortho results is shown in Figure 7a; orthoaerial image can accurately locate the position of the target area. Also, a part of the tiltimage detection is shown in Figure 7b; and the results in Figure 7 correspond to this. Forthe same target area in aerial images, the different aerial angles will have a more significantdeformation, and the network can be a good deformation of the target detected.
Furthermore, a part of the multi-target image detection results are shown in Figure 8;when there are two or more target areas in an aerial image, they can simultaneouslydetect multiple target areas [29–33]. As discussed earlier, the coordinate conversion andprojection relationship can determine the latitude and longitude of the aircraft through thetarget frame mark aerial image position. When an aerial image contains multiple targetframes, the need for comprehensive judgment takes place during multiple target frames aredetermined, the aircraft’s latitude and longitude at the same time within the error range,and the output is positioned.
Figure 7. Cont.

Electronics 2022, 11, 2343 13 of 16
Figure 7. (a) Detection Results of Orthographic Image (b) Detection Results of Sloping Image.
Figure 8. Detection Results of Multi-Target Image.
4.4. Simulation Verification
A simulation experiment was carried out under the Skyline environment of a high-resolution landscape to improve the method of training a good YOLO network; to de-termine whether the aerial image contains the target area and its location and category,Using projection and coordinate conversion relationship, real-time latitude and longitude

Electronics 2022, 11, 2343 14 of 16
of the UAV is assessed and then compared with the actual position of the UAV in Skyline.Select four different routes over the study area as the flight path of the UAV in the range ofChangchun, on the four routes obtained.
Figure 9 represents a schematic diagram of Route 1. The camera takes four differenttilt angles as a cycle for continuous aerial photography and takes four corresponding aerialimages as a set sequence of camera pictures. Other routes in the image positioning effect aredescribed in Table 7 within the scope of the study. The proportion of the target area imagesequence contains an average of more than 40% in aerial images containing the target areaand the positioning accuracy rate of more than 84%. The positioning accuracy rate can beincreased when the aerial image includes a plurality of target areas.
Figure 9. Diagram of Number 1 Route.
Table 7. Comparison of image positioning effects of different routes.
TrackNumber
Number ofSequences
Proportion ofObject Area (%)
Number of a CorrectObject Area
Number of a WrongObject Area
Accuracy Rate ofLocation (%)
1 276 45 136 25 84.5
2 355 38 144 31 82.3
3 210 54 130 17 88.4
4 395 46 202 34 85.6
5. Conclusions
This work considered the YOLO network and improved the detection results utilizingthe clustering of target frame dimensions, classification network pre-training, multi-scaledetection training, and changing the screening rules of candidate frames. The proportionof the target area in the image sequence is about 40% on average. Further, the aerialimages containing the target area offer a more than 84% positioning accuracy rate. Thisidea is to verify the feasibility of the image localization problem in target detection. But,there is also a small range of research data available from the existing study and the datasample production workload is insufficient for demonstration. Further, this research will beextended to adapt advanced methods to simplify data related to the hybrid network-basedUAV image localization search.
Electronics 2022, 11, 2343 15 of 16
Author Contributions: A.J., T.S., V.S., D.R. and A.A.K. proposed the idea under the supervision ofthe V.L., R.K., C.W., M.A.H., A.A. and Z.S.A. Moreover, V.L., R.K., C.W., M.A.H., A.A. and Z.S.A.contributed in the experimental simulations and designing, while A.J., T.S., V.S., D.R. and A.A.K.worked on the mathematical modeling. Also, A.J., T.S., V.S., D.R. and A.A.K. wrote the manuscriptunder the fruitful suggestions of V.L., R.K., C.W., M.A.H., A.A. and Z.S.A. All authors have read andagreed to the published version of the manuscript.
Funding: Zamil S Alzamil would like to thank Deanship of Scientific Research at Majmaah Universityfor supporting this work under Project No. R-2022-227.
Informed Consent Statement: Not applicable.
Data Availability Statement: Not applicable.
Conflicts of Interest: The authors declare no conflict of interest.
References1. Ramachandran, R.; Sangaiah, A.K. A review on object detection in unmanned aerial vehicle surveillance. Int. J. Cogn. Comput.
Eng. 2021, 2, 215–228. [CrossRef]2. Liu, M.; Wang, X.; Zhou, A.; Fu, X.; Ma, Y.; Piao, C. UAV-YOLO: Small Object Detection on Unmanned Aerial Vehicle Perspective.
Sensors 2020, 20, 2238. [CrossRef] [PubMed]3. Lo, L.-Y.; Yiu, C.H.; Tang, Y.; Yang, A.-S.; Li, B.; Wen, C.-Y. Dynamic Object Tracking on Autonomous UAV System for Surveillance
Applications. Sensors 2021, 21, 7888. [CrossRef] [PubMed]4. LeCun, Y.; Bengio, Y.; Hinton, G. Deep learning. Nature 2015, 521, 436–444. [CrossRef] [PubMed]5. Girshick, R.; Donahue, J.; Darrel, T.; Malik, J. Rich feature hierarchies for accurate object detection and semantic segmentation C.
In Proceedings of the IEEE Conference on Computer Vision and Pattern Recognition, Columbus, OH, USA, 23–28 June 2014;pp. 580–587.
6. Girshick, R. Fast R-CNN. In Proceedings of the 2015 IEEE International Conference on Computer Vision (ICCV), Santiago, Chile,7–13 December 2015; pp. 1440–1448. [CrossRef]
7. Ren, S.; He, K.; Girshick, R.; Sun, J. Faster RCNN towards real time object detection with region proposal networks. Adv. NeuralInf. Process. Syst. 2015, 28, 91–99.
8. Redmon, J.; Divvala, S.; Girshick, R.; Farhadi, A. You only look once: Unified real time object detection. In Proceedings of theIEEE Conference on Computer Vision and Pattern Recognition, Las Vegas, NV, USA, 27–30 June 2016.
9. Liu, W.; Anguelov, D.; Erhan, D.; Szegedy, C.; Reed, S.; Fu, C.Y.; Berg, A.C. SSD single shot multibox detector. In Proceedings ofthe European Conference on Computer Vision, Amsterdam, The Netherlands, 8–16 October 2016.
10. Redmon, J.; Farhadi, A. YOLO9000: Better, Faster, Stronger. In Proceedings of the 30th IEEE Conference on Computer Vision andPattern Recognition, Honolulu, HI, USA, 21–26 July 2017; pp. 6517–6525. [CrossRef]
11. Kyrkou, C.; Plastiras, G.; Theocharides, T.; Venieris, S.I.; Bouganis, C.-S. DroNet: Efficient convolutional neural network detectorfor real-time UAV applications. In Proceedings of the 2018 Design, Automation & Test in Europe Conference & Exhibition (DATE),Dresden, Germany, 19–23 March 2018. [CrossRef]
12. Yong, S.P.; Yeong, Y.C. Human object detection in forest with deep learning based on drone’s vision. In Proceedings of the 20184th International Conference on Computer and Information Sciences (ICCOINS), Kuala Lumpur, Malaysia, 13–14 June 2018;pp. 1–5.
13. Perera, A.G.; Al-Naji, A.; Law, Y.W.; Chahl, J. Human Detection and Motion Analysis from a Quadrotor UAV. In IOP ConferenceSeries: Materials Science and Engineering; IOP Publishing: Bristol, UK, 2018; Volume 405, p. 012003. [CrossRef]
14. Cai, Y.; Du, D.; Zhang, L.; Wen, L.; Wang, W.; Wu, Y.; Lyu, S. Guided attention network for object detection and counting ondrones. arXiv 2019, arXiv:1909.11307.
15. Mishra, B.; Garg, D.; Narang, P.; Mishra, V. Drone-surveillance for search and rescue in natural disaster. Comput. Commun. 2020,156, 1–10. [CrossRef]
16. Gonzalez-Trejo, J.; Mercado-Ravell, D. Dense Crowds Detection and Surveillance with Drones using Density Maps. In Proceedingsof the 2020 International Conference on Unmanned Aircraft Systems (ICUAS), Athens, Greece, 1–4 September 2020. [CrossRef]
17. Sien, J.P.T.; Lim, K.H.; Au, P.-I. Deep Learning in Gait Recognition for Drone Surveillance System. In IOP Conference Series:Materials Science and Engineering; IOP Publishing: Bristol, UK, 2019; Volume 495, p. 012031. [CrossRef]
18. Hong, S.-J.; Han, Y.; Kim, S.-Y.; Lee, A.-Y.; Kim, G. Application of Deep-Learning Methods to Bird Detection Using UnmannedAerial Vehicle Imagery. Sensors 2019, 19, 1651. [CrossRef] [PubMed]
19. Yuan, W.; Choi, D. UAV-Based Heating Requirement Determination for Frost Management in Apple Orchard. Remote Sens. 2021,13, 273. [CrossRef]
20. Chen, C.-J.; Huang, Y.-Y.; Li, Y.-S.; Chen, Y.-C.; Chang, C.-Y.; Huang, Y.-M. Identification of Fruit Tree Pests with Deep Learningon Embedded Drone to Achieve Accurate Pesticide Spraying. IEEE Access 2021, 9, 21986–21997. [CrossRef]
21. Simonyan, K.; Zisserman, A. Very deep convolutional networks for large scale image recognition. In Proceedings of theInternational Conference on Learning Representations, San Diego, CA, USA, 7–9 May 2015; pp. 1–14.

Electronics 2022, 11, 2343 16 of 16
22. Szegedy, C.; Liu, W.; Jia, Y.; Sermanet, P.; Reed, S.; Anguelov, D.; Erhan, D.; Vanhoucke, V.; Rabinovich, A. Going deeperwith convolutions. In Proceedings of the IEEE Conference on Computer Vision and Pattern Recognition, Boston, MA, USA,7–12 June 2015.
23. Lin, M.; Chen, Q.; Yan, S.C. Network in network. arXiv 2013, arXiv:1312.4400. [CrossRef]24. Krizhevsky, A.; Sutskever, I.; Hinton, G.E. Imagenet classification with deep convolutional neural networks. Adv. Neural Inf.
Process. Syst. 2012, 25, 1–9. [CrossRef]25. Zhang, S.; Zhao, H. Algorithm research of optimal cluster number and initial cluster center. J. Appl. Res. Comput. 2017, 34,
1617–1620.26. Li, L. Terrain Reconstruction Based on Unmanned Aerial Vehicle Sequence Imaging and Its Application in Navigation. Ph.D
Thesis, Changsha National University of Defense Technology, Changsha, China, 2009.27. Zhang, L.; Chen, J.; Qiu, B. Region-of-Interest Coding Based on Saliency Detection and Directional Wavelet for Remote Sensing
Images. IEEE Geosci. Remote Sens. Lett. 2016, 14, 23–27. [CrossRef]28. Liu, D.; Han, L.; Han, X. High spatial resolution remote sensing image classification base do depth learning Act. Acta Opt. Sin.
2016, 36, 0428001. [CrossRef]29. Shu, C.; He, Y.; Sun, Q. Point Cloud Registration Based on Convolutional Neural Network. Laser Optoelectron. Prog. 2017,
54, 31001.30. Arunnehru, J.; Geetha, M.K. A Quantitative Real-Time Analysis of Object Tracking Algorithm for Surveillance Applications. Int. J.
Emerg. Technol. Adv. Eng. 2013, 3, 234–240.31. Arunnehru, J.; Geetha, M.K. Motion Intensity Code for Action Recognition in Video Using PCA and SVM. In Mining Intelligence
and Knowledge Exploration; Springer: Cham, Switzerland, 2013; Volume 8284, pp. 70–81.32. Arunnehru, J.; Geetha, M.K. Vision-Based Human Action Recognition in Surveillance Videos Using Motion Projection Profile Features;
Springer: Cham, Switzerland, 2015; Volume 9468, pp. 307–316.33. Arunnehru, J.; Geetha, M.K. An efficient multi-view based activity recognition system for video surveillance using random forest.
In Smart Innovation, Systems and Technologies; Springer: Cham, Switzerland, 2014; Volume 32, pp. 111–122.


