Embed Size (px)
Citation preview

Tapered GRIN fiber microsensor
Felipe Beltran-Mejıa,1,2 Claudecir R. Biazoli1 andCristiano M. B. Cordeiro 1,∗
1 All authors are with the Instituto de Fısica “Gleb Wataghin”, Universidade Estadual deCampinas – UNICAMP, Campinas, SP, Brazil
2 Presently at National Institute of Telecommunications (INATEL), Santa Rita do Sapucaı,MG, Brazil
Abstract: The sensitivity of an optical fiber microsensor based oninter-modal interference can be considerably improved by tapering a shortextension of the multimode fiber. In the case of Graded Index fibers witha parabolic refractive index profile, a meridional ray exhibits a sinusoidalpath. When these fibers are tapered, the period of the propagated beamdecrease down-taper and increase up-taper. We take advantage of thismodulation –along with the enhanced overlap between the evanescent fieldand the external medium– to substantially increase the sensitivity of thesedevices by tuning the sensor’s maximum sensitivity wavelength. Moreover,the extension of this device is reduced by one order of magnitude, making itmore propitious for reduced space applications. Numerical and experimen-tal results demonstrate the success and feasibility of this approach.
© 2014 Optical Society of America
OCIS codes:(230.0230) Optical devices; (060.2370) Fiber optics sensors.
References and links1. H. Y. Tam, S. Y. Liu, B. O. Guan, W. H. Chung, T. H. Chan, and L. K. Cheng, “Fiber bragg grating sensors for
structural and railway applications,” in “Advanced Sensor Systems and Applications II,” 5634, 85–97 (2005).2. J. Villatoro, D. Monzon-Hernandez, and E. Mejıa, “Fabrication and modeling of uniform-waist single-mode
tapered optical fiber sensors,” Appl. Opt.42, 2278–2283 (2003).3. A. Kumar, R. K. Varshney, S. A. C, and P. Sharma, “Transmission characteristics of SMS fiber optic sensor
structures,” Optics Communications219, 215 – 219 (2003).4. S. M. Tripathi, A. Kumar, R. K. Varshney, Y. P. Kumar, E. Marin, and J.-P. Meunier, “Strain and temperature
sensing characteristics of single-mode–multimode–single-mode structures,” J. Lightwave Technol.27, 2348–2356 (2009).
5. C. R. Biazoli, S. Silva, M. A. R. Franco, O. Frazao, and C. M. B. Cordeiro, “Multimode interference taperedfiber refractive index sensors,” Appl. Opt.51, 5941–5945 (2012).
6. F. Beltran-Mejıa, J. H. Osorio, C. R. Biazoli, and C. M. B. Cordeiro, “D-microfibers,” J. Lightwave Technol.31,2756–2761 (2013).
7. P. Wang, G. Brambilla, M. Ding, Y. Semenova, Q. Wu, and G. Farrell, “Investigation of single-mode–multimode–single-mode and single-mode–tapered-multimode–single-mode fiber structures and their application for refrac-tive index sensing,” J. Opt. Soc. Am. B28, 1180–1186 (2011).
8. R. S. Pillai, D. Lorenser, and D. D. Sampson, “Deep-tissue access with confocal fluorescence microendoscopythrough hypodermic needles,” Opt. Express19, 7213–7221 (2011).
9. Y. Liu and L. Wei, “Low-cost high-sensitivity strain and temperature sensing using graded-index multimodefibers,” Appl. Opt.46, 2516–2519 (2007).
10. Comsol Multiphysics, Burlington, MA, USA (2014). Version 4.4.11. A. Ghatak and K. Thyagarajan,An Introduction to Fiber Optics(Cambridge University Press, 1998), chap. 9.12. K. Shiraishi and S.-I. Kuroo, “A new lensed-fiber configuration employing cascaded GI-fiber chips,” J. Lightwave
Technol.18, 787 (2000).13. R. D. Guenther,Modern Optics(Wiley, 1990), chap. 5.
#221963 - $15.00 USD Received 29 Aug 2014; revised 10 Nov 2014; accepted 10 Nov 2014; published 1 Dec 2014(C) 2014 OSA 15 December 2014 | Vol. 22, No. 25 | DOI:10.1364/OE.22.030432 | OPTICS EXPRESS 30432

14. H. Kogelnik, “On the propagation of gaussian beams of light through lenslike media including those with a lossor gain variation,” Appl. Opt4, 1562–1569 (1965).
15. T. Birks and Y. Li, “The shape of fiber tapers,” J. Lightwave Technol.10, 432–438 (1992).
1. Introduction
In the last decade, optical fiber sensors have been a subject of intense research and developmentdue to their well-know advantages such as high resolution, low-cost, ease of construction andimmunity to electromagnetic radiation. A growing trend towards new designs that improves theaccuracy and versatility of these sensors is revealed by the myriad of applications now usedin industry, civil engineering [1], and as support to other research fields such as medicine andbiology. As stated by [2], most of the optical fiber sensors can be classified into two categories:grating-based fiber devices [1] and evanescent field fiber sensors [2–6]. The former are deviceswith periodic disturbances recorded at the core’s refractive index – Bragg or Long Period Grat-ings – that reflect or transmit part of the input spectrum depending on the periodicity of thecore’s refractive index. The latter category expose the guided field to the environment – bytapering the fiber or removing the clad– serving as a transducer useful as a sensing instrument.
SMF SMFGRIN
(a) (b)
L Lw
Dw
Fig. 1. (a) Scheme of a conventional SMS sensor of lengthL and (b) a tapered SMS sensoras proposed here, with a waist of lengthLw and diameterDw.
A simplistic and accurate evanescent field fiber sensor can be constructed by splicing a mul-timode fiber (MMF) in-between two single-mode fibers (SMF) as shown in Fig. 1(a). Such op-tical devices, known as SMS sensors, are well known for their robustness and ease of use [3–5].The multiple modes excited at the MMF will interfere creating an output pattern that dependsmainly on the phase differenceφ between the different modes, that is, the difference betweenthe propagation constantsβ j −βk times the length of the multimode fiberL. When light couplesfrom the input SMF to the MMF, several modes are excited with an associated modal amplitudedetermined by the overlap integral,
ai =∫
ψSψ∗i dA ,
whereψS is the field inside the input single-mode fiber andψ∗i is the complex conjugate of the
field associated to theith mode inside the multimode fiber with a cross-section areaA. In thesame way as in [3, 7], assuming a perfect alignment between the fibers it is only necessary toinclude axially symmetric linear polarization LP0i modes in our analysis herein.
As shown in [3], when light is coupled at the output SMF fiber, the transmission spectrumwill depend basically on the modal amplitudesai and the phase difference,
P(λ ) =∣
∣
∣a21+a2
2ej(β1−β2)L + · · ·+a2
i ej(β1−βi)L + · · ·
∣
∣
∣
2. (1)
As a result, the transmission spectrum shows several peaks that are sensitive to any parameterthat affects the phase difference between the fundamental mode and the higher order modes,such as strain and temperature.
Usually, SMS sensors are fabricated with a step-index multimode waveguide [5,7]. Here we
#221963 - $15.00 USD Received 29 Aug 2014; revised 10 Nov 2014; accepted 10 Nov 2014; published 1 Dec 2014(C) 2014 OSA 15 December 2014 | Vol. 22, No. 25 | DOI:10.1364/OE.22.030432 | OPTICS EXPRESS 30433

used Graded-Index (GRIN) fibers for the multimode waveguide of the SMS sensor. This typeof fibers are well known for reducing modal dispersion and are used in metro telecom networksand high-resolution microendoscopes [8] between other several applications. The reason forchoosing GRIN fibers is due to the few modes excitation which simplifies the analysis and –asa consequence of the latter– the output spectrum of the SMS sensor is a well resolved series ofpeaks compared with those made of step-index multimode fibers [5,9].
In the following, we develop an analytical approach in order to study the effects of the multi-mode fiber length at the output spectrum. We study the effects of tapering a GRIN fiber as partof an SMS sensor. This will increase the overlap between the evanescent field and the externalmaterial, resulting in an enhanced sensitivity for the external refractive index. Also, as it willbe shown below, the spectral region with maximum sensitivity can also be controlled by adjust-ing the taper waist. At the same time, a better resolved output spectrum was obtained. Below,a brief explanation of the theory behind the tapered SMS sensor is presented followed by thenumerical and experimental results. Finally, results and discussion lead towards the concludingremarks.
0.8 1.0 1.2 1.4 1.60.0
0.2
0.4
0.6
0.8
1.0
Wavelength [µm]
Fra
ctio
nal
Mo
dal
Pow
er(a2 i)
0.02.55.0a1+a2
Misalignment [µm]
Fig. 2. Numerical results for the fractional modal power of the first two lower order modesusing different misalignment values at the splice between the singlemode fiber and theGRIN fiber. As shown in the legend box, bluish and reddish solid lines represent the modalamplitude for LP01 and LP02 respectively. All results obtained using a Finite Element soft-ware [10].
2. Analytic approach
After disregarding all terms other than the first two at the right of Eq. (1), the difference be-tween the propagation constants for the LP01 and LP02 will determine the intensity output. Thisassumption is reinforced by the fact that more than 80% of the fractional modal power residesbetween these two modes as stated by [4] and as shown by the dotted curve at the top of Fig. 2.As it will be shown later,β1−β2 as a function ofλ can be approximated as a parabolic functionof the typep+q(λ −λ0)
2, where (p,q) are fitting parameters andλ0 is the critical wavelength(maximum or minimum of the parabola). After simple algebra, one obtains an expression thatrelates the Free Spectral Range – the distance between two consecutive peaks,kth and (k+1)th,from the output intensity spectrum– with the mean wavelengthλ = (λk+λk+1)/2,
FSR≈π
qL(λ −λ0). (2)
#221963 - $15.00 USD Received 29 Aug 2014; revised 10 Nov 2014; accepted 10 Nov 2014; published 1 Dec 2014(C) 2014 OSA 15 December 2014 | Vol. 22, No. 25 | DOI:10.1364/OE.22.030432 | OPTICS EXPRESS 30434

Values forp,q and λ0 are obtained after fitting the previous parabolic function with analyticexpressions found for the propagation constants in an infinite parabolic index medium [11].
Colored marks in Fig. 3(a) represent experimental measurements for the FSR as a func-tion of wavelength when broadband light was sent through the single-mode fiber and collect-ed in an optical spectrum analyzer using an 82 cm long GRIN fiber GIF625 from Thorlabswith core/cladding diameter of 62.5/125µm, parabolic profile and maximum refractive index of1.4858 RIU atλ = 656.2nm. To ensure single-modeness inside the SMF fibers, Newport FS-Vfibers were used for wavelengths under 0.98 µm and Corning SMF-28 fibers were used over1.2 µm. All measurements where done at room temperatureT = 20◦C, fixing the fiber straightwhile being careful not to stretch the fiber in order to avoid curvature and/or strain effects.
The solid lines in Fig. 3 represent Eq. (2) plotted with the parameters next to each curve.Although the discrepancy is significant, the general trend can be observed by using a simpleexpression. Once validated, this approach can be used in order to predict the effect ofL in thetransmission output as shown in Fig. 3(b). This illustrate one of the main motivations behindthis work: a conventional SMS sensor requires a multimode fiber with an extensionL > 3m inorder to have an FSR under 10nm. Here we explore the effects of tapering the multimode fiberof an SMS sensor in order to enhance the sensitivity and reduce the extension of these devices.
0.6 0.8 1.0 1.2 1.4 1.6
20
40
60
80
1 2 3 4 5
10
20
30
40
50
FS
R[n
m]
FS
R[n
m]
Mean wavelengthλ [µm] GRIN Fiber LengthL [m](a) (b)
L = 0.82m
λ = 1.55 µmq= 1.7×10⁻⁴ µm−3
λ0 = 0.883µm
q= 1×10⁻³ µm−3
λ0 = 0.943µm
Fig. 3. (a) Free Spectral Range (FSR) as a function ofλ for a constant length. Marksrepresent experimental values when using Newport FS-V (green dots) and Corning SMF-28 (red crosses) as input single-mode fibers. Further experimental details as explained inSec. 5. (b) FSR as a function of the multimode fiber’s lengthL for a fixed wavelength. Bothgraphs are for a conventional SMS sensor while the solid blue line represent an analyticalapproximation as explained for Eq. (2).
3. The effect of tapering a GRIN fiber
The core of a conventional GRIN fiber has a parabolic refractive index distribution given by thefollowing expression,
n(r) = n0(
1−A2gr
2) , r < a
wheren0 is the refractive index at the symmetry axisz of the fiber,r is the radial distance fora cylindrical coordinate system,Ag ≡ a/
√2∆ is defined as the specific core radius as in [12],a
and∆ are the core radius and the profile height parameter of the fiber, respectively.By using the parabolic-shaped profilen(r) defined above, the paraxial ray equation can be
transformed into an ordinary second order differential equation [13],
d2rdz2 +
2r∆a2 = 0,
#221963 - $15.00 USD Received 29 Aug 2014; revised 10 Nov 2014; accepted 10 Nov 2014; published 1 Dec 2014(C) 2014 OSA 15 December 2014 | Vol. 22, No. 25 | DOI:10.1364/OE.22.030432 | OPTICS EXPRESS 30435

valid only for meridional rays. The solution of this equation is given by,
r(z) =C1 cos(z/Ag)+C2sin(z/Ag), (3)
showing howr(z) is a sinusoidal equation with period,
T = 2πAg . (4)
Here it is worth to notice that in Eq. (4), the period is proportional with the core radius.The constantsC1 andC2 at Eq. (3) are obtained by taking into account the initial conditions
r(0) = r0 anddr/dz= γ0, whereγ0 is the input ray angle. In this way the ABCD matrix for aGRIN fiber is obtained [12–14], making possible to predict the position for an input ray(r0,γ0)after propagating a distancez,
(
rγ
)
=
sin(z/Ag) Agcos(z/Ag)
−1Ag
cos(z/Ag) sin(z/Ag)
(
r0
γ0
)
. (5)
As shown by the dashed lines in Fig. 4(a), a GRIN fiber withAg = 200µm exhibits sinusoidalray trajectories for different input anglesγ0 in the same way as in [12].
0
1.5
Pro
pag
atio
nd
ista
ncez
[mm
]
10
11.5
Radial positionr [µm]
(a)
Rad
ialp
osi
tion
,r[µ
m]
Propagation distancez [mm]0 0.2 0.4 0.6 0.8 1.0 1.2 1.4 1.6-40
-20
0
20
4020°
15°
10°
TGRIN taper
TGRIN
-40 0 40
(b)
(c)
Fig. 4. (a) Ray trajectories for a GRIN fiber using different input angles. Dashed linesrepresent an homogeneous GRIN fiber with core radiusa0 = 40µm andAg = 200µm, asin [12]. Solid lines represent the same GRIN fiber but with an exponentially decaying taperprofile. The black arrows show the different periods for rays propagating on the taperedand untapered versions of the GRIN fiber. (b and c) Color-coded electric field amplitudefor 1.5 mm long slices of a tapered GRIN fiber simulated using RSoft’s Beamprop software.Plot (b) is for the homogeneous region, while (c) is for the tapered region of the taper asillustrated by the scheme at right. By choosing the appropriate fiber parameters and thesame taper profile, similar results were obtained in comparison with the ray trajectories atleft.
#221963 - $15.00 USD Received 29 Aug 2014; revised 10 Nov 2014; accepted 10 Nov 2014; published 1 Dec 2014(C) 2014 OSA 15 December 2014 | Vol. 22, No. 25 | DOI:10.1364/OE.22.030432 | OPTICS EXPRESS 30436

While this is considerably accurate for a standard GRIN fiber, it is not for a tapered GRINfiber where the beam is affected by the proximity of the cladding. However, for a slowly-varying taper profile the effect of varying the fiber diameter can be visualized by defining thecore radius as a function of the axial coordinate in such a way thata(z) represents a taper profilefunction [15]. As shown by the solid lines in Fig. 4(a), the period of the rays trajectories willdecrease with the propagation distance for a GRIN fiber with an exponentially decaying taperprofile a(z) = a0e−iαz, with α ≈ 5×10⁻⁵m−1. As shown, black arrows exhibit the differencebetween the periods for the GRIN fiber (tapered and untapered) after propagating more than1 mm. Being this one noticeably shorter than the homogeneous fiber, as it is the expected resultpredicted by Eq. (4).
As a further demonstration, similar numerical results were obtained by modeling a taperedGRIN fiber using a commercially available Beam Propagation Method: RSoft’s BeamProp ver-sion 2013-12-2. In Fig. 4(b and c), the color scale of the contour maps represent the fieldamplitude for two different slices of a tapered GRIN fiber witha0 = 40 µm and∆ = 2%. Asexpected, down-taper the period of the sinusoidal beam waist decreases in the same fashion asthe ray optics analysis results. Note also that the inverse effect also occurs up-taper: the periodstretches as the diameter increases in the same fashion as in Eq. (4).
4. Sensing characteristics of an SMS sensor with a tapered GRIN fiber
In order to evaluate the sensitivity of this device to external refractive index (∆λ/∆n), it be-comes necessary to understand the nature of the output intensity peaks in an SMS sensor. Thephase difference (∆φ ) of the two lower order modes can be related to a perturbation parameter,here the external refractive index (∆n), and written as,
∆φ =∂φ∂λ
∆λ +∂φ∂n
∆n. (6)
By equating∆λ/∆n,∆λ∆n
=
(
∆φ∆n
−∂φ∂n
)(
∂φ∂λ
)−1
(7)
it can be seen that the external refractive index sensitivity∆λ/∆n will be maximum when thephase difference approaches a critical point,∂φ/∂λ → 0 at a critical wavelengthλ0.
Unfortunately, as shown by the blue rhombuses in Fig. 5, the critical wavelength for a GRINfiber at its nominal size is found atλ0 ≈ 0.925µm. That is, away from the telecom window (λ ∼1.55µm) where one can take advantage of the multiple light sources, equipment and low-lossfibers commercially available at these wavelengths. While observing the difference between thepropagation constantsβ1 andβ2 for the two lower order modes LP01 and LP02 as a functionof λ , we saw the critical wavelength (minimum) decreasing as the fiber was tapered downto waists ranging from 125 to 62.5 µm. The latter made the previous situation worse, sincethe maximum sensitivity point was more distant of the telecom window as the taper waistdecreased. Fortunately, by further reducing the outer diameter, a maximum appeared when thetaper waist was around 20 µm as shown by the red dots in Fig. 5. Therefore, the critical pointfor maximum sensitivity can be tuned by selecting the appropriate taper waistDw = 15µm asshown by black crosses for a critical wavelength close toλ ≈ 1.6µm.
After varying the taper waist, we studied the effect of varying the outer refractive index.The numerical results showed that this type of sensors are sensitive to external refractive indexvariations only when the taper waist is under 20µm. Figure 6(a) shows curves representingβ1 −β2 for different outer refractive indexes as shown in the legend box. A minimum phasedifference can be observed whenDw = 20µm andλ > 2.0µm, while a considerable influence
#221963 - $15.00 USD Received 29 Aug 2014; revised 10 Nov 2014; accepted 10 Nov 2014; published 1 Dec 2014(C) 2014 OSA 15 December 2014 | Vol. 22, No. 25 | DOI:10.1364/OE.22.030432 | OPTICS EXPRESS 30437

125112.587.562.52015
0 50 100 1500.5 1 1.5 2 2.50.4
0.6
0.8
Wavelength [µm]
β 1−
β 2[a
.u.]
External Diameter (Dw [µm])
Cri
tical
Wav
elen
gth
,λ 0[µ
m]
0.6
1.4
1.8
2.2
Minima
Maxima
OuterDiameter [µm]
1.0
0.8
1.0
Fig. 5. (a) Dependence ofβ1 − β2 as a function of wavelength for a tapered GRIN fiber(normalized data). (b) Critical wavelength for different outer diameters. For both figures,different colors represent different cladding diameters for the tapered fiber as shown in thelegend box. All the results are for an outer refractive indexn= 1.39 RIU obtained using aFinite Element software [10].
of the external refractive index was observed forDw = 15µm andλ > 1.6µm. A zoom overthe critical point is shown on Fig. 6(b) forDw = 15µm. On Fig. 6(c), critical wavelengths areplotted as function of the outer refractive index exhibiting an almost linear behavior. Up to ourknowledge, previous SMS sensors using GRIN fibers were not sensitive to external refractiveindex variations nor had their maximum sensitivity spectral region tuned.
(a) (c)
1 1.4 1.8 2.2 2.65
6
7
8
9
Wavelength [µm]
Dw=20µm
Dw=15 µm
0.6
×10−2
Cri
tical
Wav
elen
gth,λ
0[µ
m]
Outer Refractive Index1.39 1.4 1.41
1.64
1.65
1.66
1.67
Dw=15 µm
(b)
Outer
Refractive
Index
1.391.3951.41.41
β 1−
β 2[1/µ
m]
Dw=15 µm
8.4
8.5
8.6
1.4 1.6 1.8
β 1−
β 2[1/µ
m]
×10−2
Wavelength [µm]
Fig. 6. (a) Propagation constant difference for the two lower-order modes LP01 and LP02at the tapered GRIN fiber as a function of wavelength. It can be seen that an SMS sensorwill only be sensitive to external refractive index variations (different colored disks) whenusing tapers thinner thanDw 6 20µm. (b) Zoom of the previous plot around the criticalwavelength forDw = 15µm. A small shift of the maximum toward lower wavelengths canbe observed when the external refractive index increases. (c) An almost linear behavioris observed for the critical wavelengths as the outer refractive index varies. All resultsobtained using a Finite Element software [10].
#221963 - $15.00 USD Received 29 Aug 2014; revised 10 Nov 2014; accepted 10 Nov 2014; published 1 Dec 2014(C) 2014 OSA 15 December 2014 | Vol. 22, No. 25 | DOI:10.1364/OE.22.030432 | OPTICS EXPRESS 30438

5. Sensing results
To construct the proposed SMS tapered sensor, a traveling burner tapering system [15] wasused for the fabrication of the GRIN fiber tapers. Each transition region was approximately30 mm long tapered with an exponentially decaying profile. The same GRIN fiber as in Sec. 2,a GIF625 from Thorlabs, was used as the multimode fiber for the following experimental re-sults. The assumption of a perfect alignment exposed in Sec. 1, is not an impediment for theimplementation of the proposed experiment. That is because the fractional modal power ofmodes LP01 and LP02 will represent more than the 60% of the total power for misalignmentsunder 5 µm andλ > 1.3µm as shown in Fig. 2. An splicer machine automatically adjustedthe splicing parameters –such as the electrodes position, relative fiber alignment and splicingpower– reducing the fiber misalignments below this limit.
In order to evaluate the performance of a tapered SMS sensor as an external refractive indexsensor, the sample was immersed in a refractive index matching liquid initially atT = 20◦C andfixed straight while being careful not to stretch the taper. Later, the liquid was heated by a hotplate and temperature was controlled by a thermocouple. Temperature change∆T determinedthe external refractive index change∆n by the expression,
∆n= (dn0/dT)∆T , (8)
wheren0 = 1.39 is the external refractive index atT = 25◦C anddn0/dT=−3.44×10−4 is thethermo-optic coefficient for the AAA series of the Cargille refractive index liquids used duringall the experiments. In this way it was possible to control the variation of the external refractiveindex by controlling the change in temperature. This allowed us to use the same liquid for allmeasures. Since the measurements were done in a temperature range 0< ∆T < 6◦C, the effectof the temperature over the fiber may be negligible as shown in [4] for a GRIN SMS used as atemperature sensor.
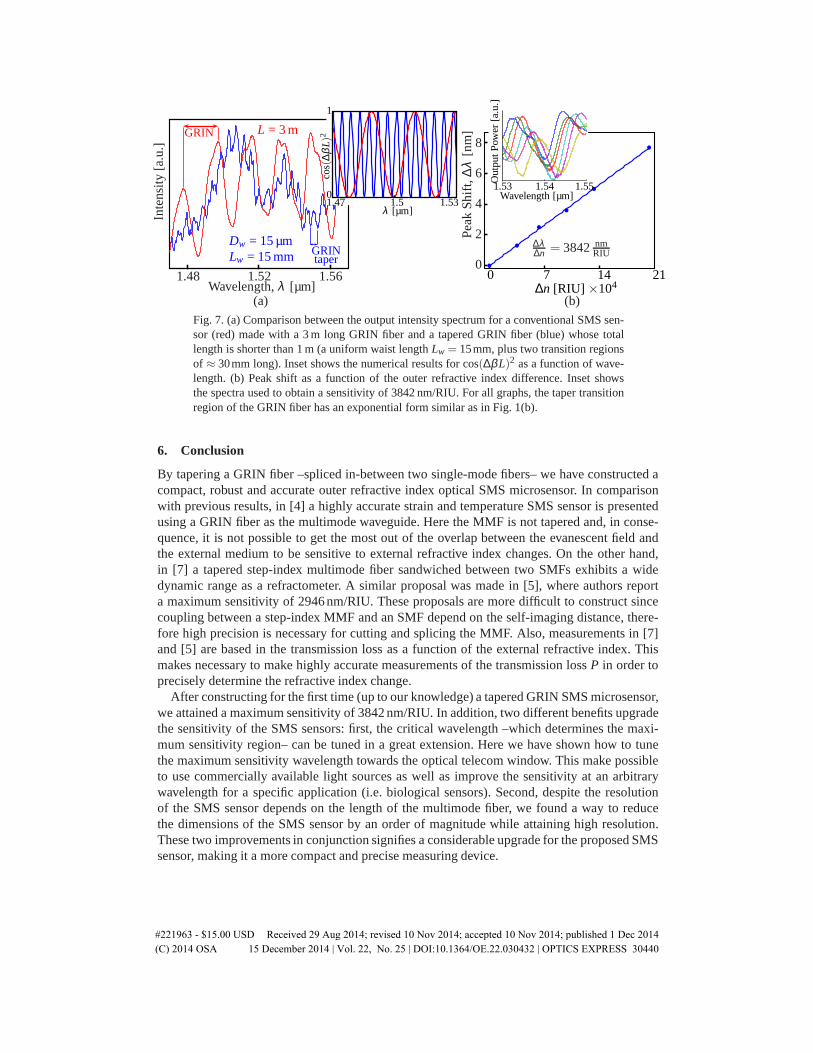
As stated before, the output spectrum for a non-tapered SMS sensors is a mode interferencepattern composed of several peaks as shown by the red curve in Fig. 7(a). By choosing a peakand measuring the shift∆λ caused by the change of temperature or external refractive index,it is possible to determine the sensitivity of this device (∆λ/∆n or ∆λ/∆T) as in Eq. (7). Sincethe spectral resolution of the SMS sensor depends inversely on the FSR, it is critical to designan SMS sensor with a FSR as low as possible. On the other hand, it is important to note thatthis also reduces the dynamic range of the measurement. Also, as shown in Fig. 3(b), a GRINfiber longer than 5 m is necessary to obtain a FSR under 5 nm. Nevertheless, by tapering theGRIN fiber of the SMS sensor as in Fig. 1(b), the period of the modulated beam is spatiallycompressed as explained above. For that reason, the taper acts as a substitute of a much longermultimode fiber. As an example, as shown in Fig. 7(a), the output spectrum of a 3 m longSMS sensor exhibit a large FSR whereas a tapered SMS sensor whose total length –taperedand untapered sections– is shorter than 1 m exhibits a considerable lower FSR in the sameoptical window. That is, an untapered SMS is more than three times longer than the taperedSMS sensor here proposed. Inset shows numerical results for the phase difference as a functionof wavelength, a similar behavior as in the experimental results can be observed. The shiftof the peak∆λ as a function of the change in the external refractive index∆n is shown for theexperimental results in Fig. 7(b). A linear behavior is observed through all the studied range andits slope represents a sensitivity of∆λ/∆n= 3842nm/RIU, which is equivalent to a temperatureresponse∆λ/∆T = 1.32nm◦C−1. Inset shows the spectra used to make the measurements inFig. 7(b), where the chosen set of peaks were those closer toλ = 1.54µm.
#221963 - $15.00 USD Received 29 Aug 2014; revised 10 Nov 2014; accepted 10 Nov 2014; published 1 Dec 2014(C) 2014 OSA 15 December 2014 | Vol. 22, No. 25 | DOI:10.1364/OE.22.030432 | OPTICS EXPRESS 30439
Pea
kS
hift
,∆λ
[nm
]
∆λ∆n = 3842 nm
RIU0
2
4
6
8
210 7 14
(b)
GRINtaper
Wavelength,λ [µm]
L = 3 m
Inte
nsi
ty[a
.u.]
(a)
GRIN
1.48 1.52 1.56
Dw = 15 µmLw = 15 mm
∆n [RIU] ×104
Out
putP
ower
[a.u
.]
Wavelength [µm]1.53 1.54 1.55
λ [µm]
cos(
∆βL)2
1.47 1.5 1.530
1
Fig. 7. (a) Comparison between the output intensity spectrumfor a conventional SMS sen-sor (red) made with a 3 m long GRIN fiber and a tapered GRIN fiber (blue) whose totallength is shorter than 1 m (a uniform waist lengthLw = 15mm, plus two transition regionsof ≈ 30mm long). Inset shows the numerical results for cos(∆βL)2 as a function of wave-length. (b) Peak shift as a function of the outer refractive index difference. Inset showsthe spectra used to obtain a sensitivity of 3842 nm/RIU. For all graphs, the taper transitionregion of the GRIN fiber has an exponential form similar as in Fig. 1(b).
6. Conclusion
By tapering a GRIN fiber –spliced in-between two single-mode fibers– we have constructed acompact, robust and accurate outer refractive index optical SMS microsensor. In comparisonwith previous results, in [4] a highly accurate strain and temperature SMS sensor is presentedusing a GRIN fiber as the multimode waveguide. Here the MMF is not tapered and, in conse-quence, it is not possible to get the most out of the overlap between the evanescent field andthe external medium to be sensitive to external refractive index changes. On the other hand,in [7] a tapered step-index multimode fiber sandwiched between two SMFs exhibits a widedynamic range as a refractometer. A similar proposal was made in [5], where authors reporta maximum sensitivity of 2946nm/RIU. These proposals are more difficult to construct sincecoupling between a step-index MMF and an SMF depend on the self-imaging distance, there-fore high precision is necessary for cutting and splicing the MMF. Also, measurements in [7]and [5] are based in the transmission loss as a function of the external refractive index. Thismakes necessary to make highly accurate measurements of the transmission lossP in order toprecisely determine the refractive index change.
After constructing for the first time (up to our knowledge) a tapered GRIN SMS microsensor,we attained a maximum sensitivity of 3842 nm/RIU. In addition, two different benefits upgradethe sensitivity of the SMS sensors: first, the critical wavelength –which determines the maxi-mum sensitivity region– can be tuned in a great extension. Here we have shown how to tunethe maximum sensitivity wavelength towards the optical telecom window. This make possibleto use commercially available light sources as well as improve the sensitivity at an arbitrarywavelength for a specific application (i.e. biological sensors). Second, despite the resolutionof the SMS sensor depends on the length of the multimode fiber, we found a way to reducethe dimensions of the SMS sensor by an order of magnitude while attaining high resolution.These two improvements in conjunction signifies a considerable upgrade for the proposed SMSsensor, making it a more compact and precise measuring device.
#221963 - $15.00 USD Received 29 Aug 2014; revised 10 Nov 2014; accepted 10 Nov 2014; published 1 Dec 2014(C) 2014 OSA 15 December 2014 | Vol. 22, No. 25 | DOI:10.1364/OE.22.030432 | OPTICS EXPRESS 30440

Acknowledgments
F. Beltran-Mejıa gratefully acknowledges financial support from Sao Paulo Research Founda-tion, FAPESP (grant 2011/01524-8).
#221963 - $15.00 USD Received 29 Aug 2014; revised 10 Nov 2014; accepted 10 Nov 2014; published 1 Dec 2014(C) 2014 OSA 15 December 2014 | Vol. 22, No. 25 | DOI:10.1364/OE.22.030432 | OPTICS EXPRESS 30441


