Embed Size (px)
Citation preview
Research Project: Systematic Racial Discrimination—A Comparative Assessment of the
First Triennial Review Titled ‘How Fair is Britain’ and Substantive
Equality in Western Australia
Prepared by: Bablu Chakma
Masters Student
Curtin University
Prepared for: Equal Opportunity Commission of WA
Substantive Equality Unit
Date of Submission: 7 February 2013
Bablu Chakma is an intern at the Equal Opportunity Commission (SEU) within
Equal Opportunity Commission, WA. His responsibility at SEU is to conduct a
comparative study of the First Triennial Review Titled ‘How Fair is Britain’ and
Substantive Equality in Western Australia. Besides, he is studying Master of
Human Rights at Curtin University.
He is keen on human rights and social justice, particularly on the rights of
Indigenous peoples and other minority groups in Bangladesh. He worked for
Kapaeeng Foundation, a human rights organization for the Indigenous
peoples in Bangladesh. He was also a part of central leadership of Chittagong
Hill Tracts Hill Students’ Council, the largest Indigenous student organization
working for the rights of the Indigenous peoples in Bangladesh. He attended
different workshops, seminars, and conferences relevant to his area of
interest.
Introduction The Equal Opportunity Commission administers the Policy Framework for
substantive equality which addresses systemic discrimination within the public
sector. It is designed to assist major public sector departments eliminate and
prevent systemic indirect forms of discrimination in their service delivery to
Aboriginal and minority ethnic groups. In doing so, Substantive Equality
promotes differentiated service delivery in order to achieve equal outcomes.
The Substantive Equality Unit (SEU) within the EOC is the first of its kind in
Australia.
This research paper was commissioned by the SEU within the Equal
Opportunity Commission of Western Australia. With a view to improve service
outcomes for Aboriginal peoples and minority ethnic groups, this paper
identifies the British Equality and Human Rights Commission (EHRC)
monitoring indicators and compares it with the types of data necessary to
undertake similar monitoring for Substantive Equality in WA. This paper
attempts to identify whether equality data captured for Britain can be easily
readily identified and sourced by relevant government departments of WA.
However, due to some constraints, this paper has selected a sample sized
number of indicators in Britain to answer the research question.
Overall, this paper partially addresses the comparison between the monitoring
indicators in Britain and WA, and has not had the capacity to answer whether
the substantive equality data required in WA can easily be sourced from
participating government departments.
Scope, Methodology, and Limitation of the Study Scope Every three (3) years the EHRC is required to report to the UK Parliament on
progress related to human rights and equality. This paper relies heavily on
the first review undertaken by the EHRC and details the evidence from a
range of British sources including census data, surveys as well as research, in
order to identify and help answer the question ‘How Fair is Britain?’ The
British measures and the first review therefore presents an early opportunity
to examine how best Substantive Equality in WA (in particular its
measurement and monitoring) can adopt the kinds of indicators and evidence
in operation in the British. Britain and its monitoring of equality were selected
because Substantive Equality in WA closely follows the experience of Britain.
Britain imposes a total of forty (40) monitoring indicators across various
spheres of public life including services provided by the Government or its
agencies.
Methodology This paper adhered to the Substantive Equality Policy Framework and
examined whether WA equality measures could be identified so as to match
those in operation in Britain. Noting that this research is the first stage of an
anticipated broader study and is expected to evolve as more information is
known; the following research questions were therefore posed to help guide
the study:
1. Identify possible Australian equality indicators (including the sources)
to match Britain’s;
2. Compare how useful the indicators would be for the purpose of
Substantive Equality (including what is similar and different)
3. Describe the issues the research raises and suggest potential next
steps.
The primary source of information examined was the Equality and Human
Rights Commission (EHRC) Triennial Review 2010, ‘How Fair is Britain’.
Information for this study was obtained by accessing the website of the EHRC
where the review is published in full, according to equality criteria. The data
for the required substantive equality data in WA or Australia as a whole have
mostly been collected from different government and non-government
websites. The website of the Australian Bureau of Statistics (ABS) have been
widely used in this regard. Notably, when going through this paper, it should
be kept in mind that the British indicators are based on whole country, even
though sometimes there are breakdowns when the data between states
contrast with each other. Similarly, even though this study set out to compare
equality data in Britain with WA, many of the data sources obtained could only
be found for Australia as a whole.
A desk top study of the information was therefore undertaken to find out which
of the forty (40) indicators in use across Britain were relevant to Substantive
Equality. Notably, of the forty (40) indicators, the following nine (9) indicators
were selected. The indicators are:
1. Life expectancy;
2. Equal treatment by the criminal justice system;
3. Crime against person;
4. Poor mental health;
5. Participation in higher education;
6. Pay gaps;
7. Housing and neighbourhood quality;
8. Access to care; and
9. Formal political participation.
Consultation with internal staff provided feedback as to the relevancy of the
indicators. However, this information was provided at the mid – point of the
study and would have benefited with a separate research question to discern
the relevancy of a sample set of indicators. The indicators have been chosen
both based on the importance and on a random basis. The indicators that are
chosen on the basis of importance are life expectancy, equal treatment by the
criminal justice system, participation in higher education, pay gap, and formal
political participation. Each of these indicators is important because they
range from the things that are necessary for survival to flourish in life. For
example, data regarding life expectancy demonstrates the existence of a
person whereas the higher education data reflects the flourish of life. Rest
four indicators have been selected randomly.
Limitations The study suffers from the limitation of having as low as nine (9) indicators,
out of forty indicators used across Britain. The main reason for choosing nine
(9) indicators is due to the limited time and availability of the author as well as
relevant staff of the EOC to work within the time allocated to this study. The
study occurred over seven weeks at just under one day per week. This paper,
therefore, determined select number of nine indicators with one indicator from
each of nine areas of capabilities and freedoms imposed which could be used
for the monitoring purposes of Substantive Equality. A further limitation is the
extent to which the nine (9) indicators can be sourced in WA from participating
Government departments. Rather in many cases it shows where the equality
data can be sourced nationally (for Australia as a whole). This is due to
management of data for the country as a whole which result in the
unavailability of state-specific data.
Findings and Analysis
The UK's first triennial review How Fair is Britain shows that the EHRC, Britain
uses its 40 monitoring indicators under the equality characteristics of age,
disability, gender, race and ethnicity, religion or belief, sexual orientation, and
transgender status.1 According to Britain, these indicators fall under nine
broad areas of capabilities and freedoms that are needed for the happiness
and productivity of the people. The nine broad areas are life, legal security,
health, education, employment, standard of living, care and support, and
power and voice.2
On the other hand, WA (and Australia as a whole) does not have any such
monitoring indicators and relies heavily on the indicators arising from census
data. Even though this paper was commissioned to locate all the monitoring
indicators used in Britain, due to the limitations mentioned in the last chapter,
this paper tries to have a close look at one indicator of nine aforesaid areas
used in Britain. After having a close look at each indicator used in Britain, this
section will attempt to locate those indicators in the relevant sources of
information in WA and Australia in order to make a comparison with the
former. The comparison between the monitoring indicators used in Britain and
1 Equality and Human Rights Commission, How Fair is Britain (2010) 14 < http://www.equalityhumanrights.com/key-projects/how-fair-is-britain/>. 2 Ibid.
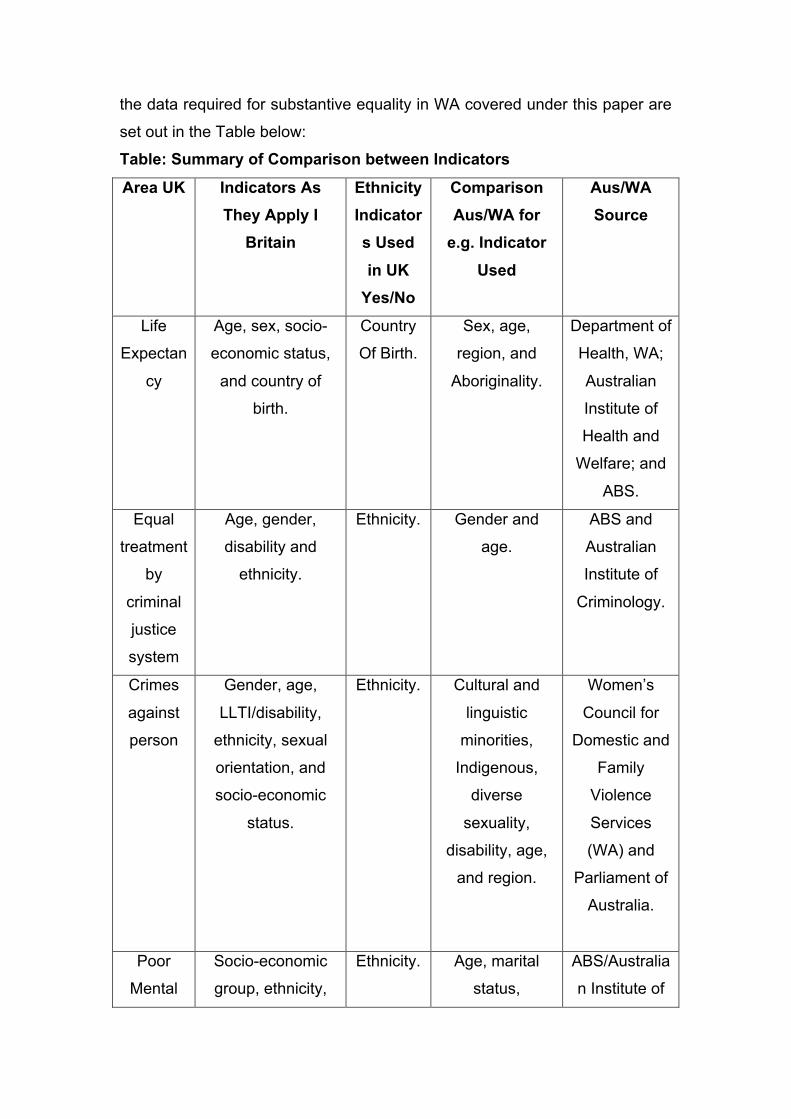
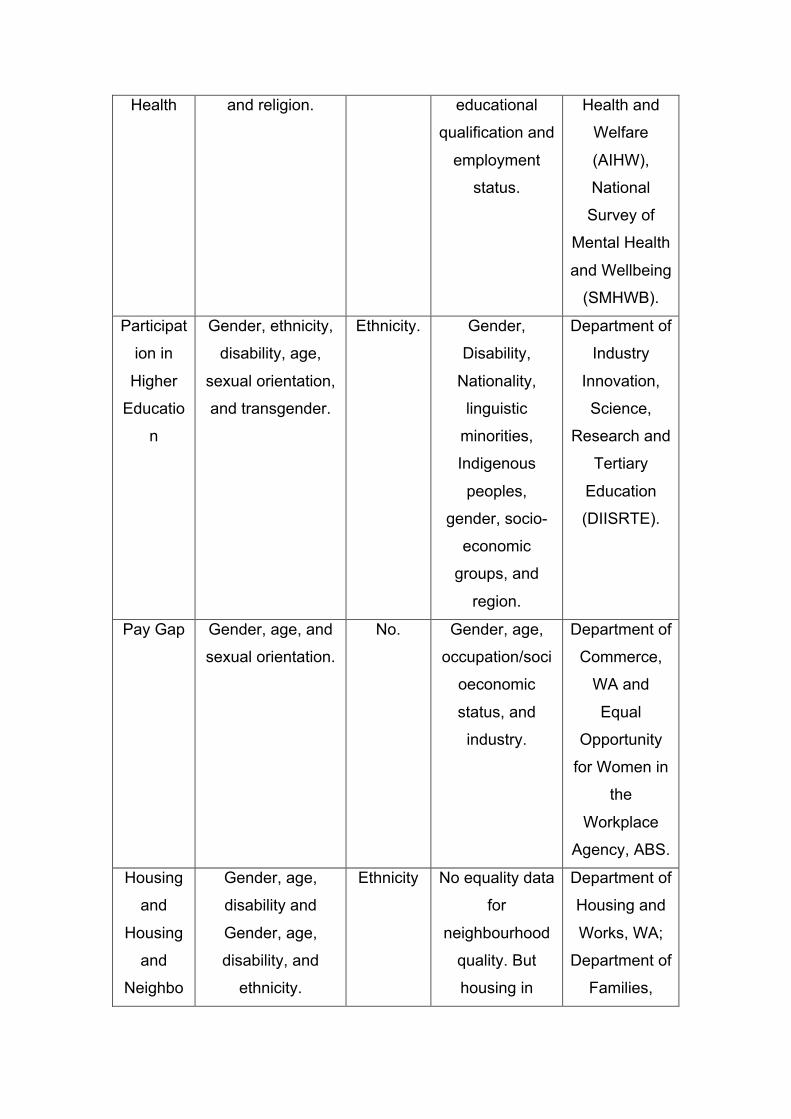
the data required for substantive equality in WA covered under this paper are
set out in the Table below:
Table: Summary of Comparison between Indicators
Area UK Indicators As They Apply I
Britain
Ethnicity Indicators Used in UK
Yes/No
Comparison Aus/WA for
e.g. Indicator Used
Aus/WA Source
Life
Expectan
cy
Age, sex, socio-
economic status,
and country of
birth.
Country
Of Birth.
Sex, age,
region, and
Aboriginality.
Department of
Health, WA;
Australian
Institute of
Health and
Welfare; and
ABS.
Equal
treatment
by
criminal
justice
system
Age, gender,
disability and
ethnicity.
Ethnicity. Gender and
age.
ABS and
Australian
Institute of
Criminology.
Crimes
against
person
Gender, age,
LLTI/disability,
ethnicity, sexual
orientation, and
socio-economic
status.
Ethnicity. Cultural and
linguistic
minorities,
Indigenous,
diverse
sexuality,
disability, age,
and region.
Women’s
Council for
Domestic and
Family
Violence
Services
(WA) and
Parliament of
Australia.
Poor
Mental
Socio-economic
group, ethnicity,
Ethnicity. Age, marital
status,
ABS/Australia
n Institute of
Health and religion. educational
qualification and
employment
status.
Health and
Welfare
(AIHW),
National
Survey of
Mental Health
and Wellbeing
(SMHWB).
Participat
ion in
Higher
Educatio
n
Gender, ethnicity,
disability, age,
sexual orientation,
and transgender.
Ethnicity. Gender,
Disability,
Nationality,
linguistic
minorities,
Indigenous
peoples,
gender, socio-
economic
groups, and
region.
Department of
Industry
Innovation,
Science,
Research and
Tertiary
Education
(DIISRTE).
Pay Gap Gender, age, and
sexual orientation.
No. Gender, age,
occupation/soci
oeconomic
status, and
industry.
Department of
Commerce,
WA and
Equal
Opportunity
for Women in
the
Workplace
Agency, ABS.
Housing
and
Housing
and
Neighbo
Gender, age,
disability and
Gender, age,
disability, and
ethnicity.
Ethnicity No equality data
for
neighbourhood
quality. But
housing in
Department of
Housing and
Works, WA;
Department of
Families,
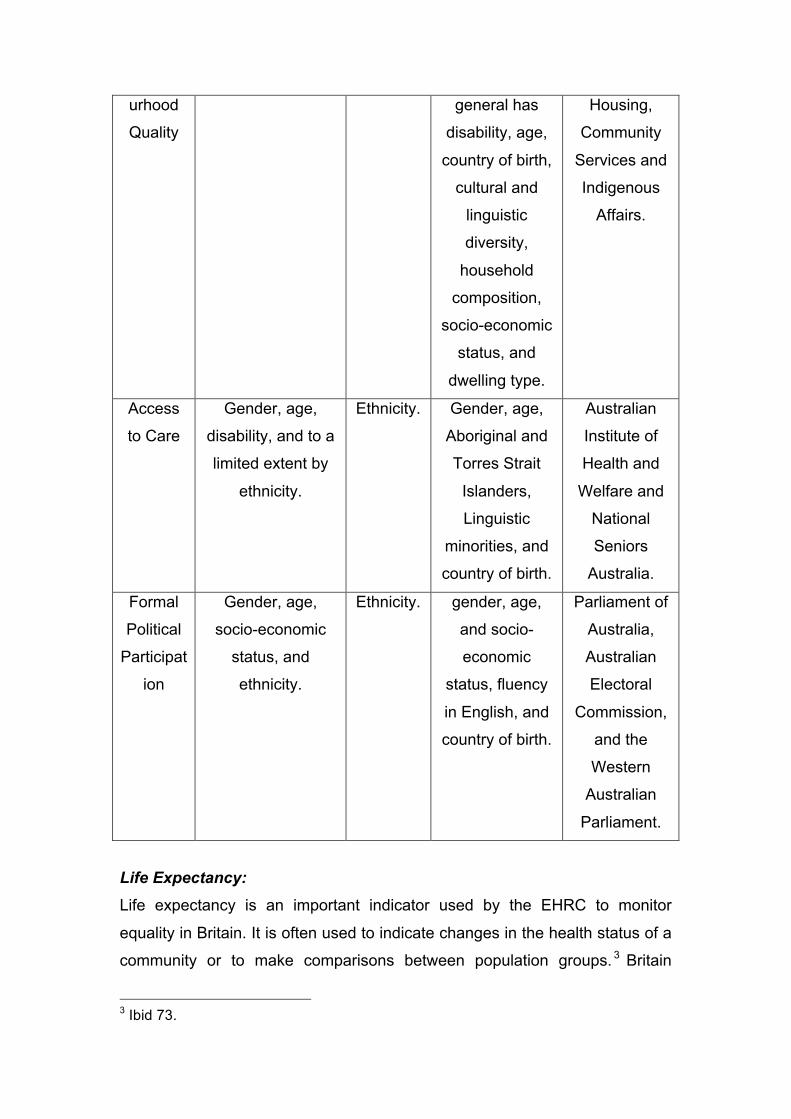
urhood
Quality
general has
disability, age,
country of birth,
cultural and
linguistic
diversity,
household
composition,
socio-economic
status, and
dwelling type.
Housing,
Community
Services and
Indigenous
Affairs.
Access
to Care
Gender, age,
disability, and to a
limited extent by
ethnicity.
Ethnicity. Gender, age,
Aboriginal and
Torres Strait
Islanders,
Linguistic
minorities, and
country of birth.
Australian
Institute of
Health and
Welfare and
National
Seniors
Australia.
Formal
Political
Participat
ion
Gender, age,
socio-economic
status, and
ethnicity.
Ethnicity. gender, age,
and socio-
economic
status, fluency
in English, and
country of birth.
Parliament of
Australia,
Australian
Electoral
Commission,
and the
Western
Australian
Parliament.
Life Expectancy: Life expectancy is an important indicator used by the EHRC to monitor
equality in Britain. It is often used to indicate changes in the health status of a
community or to make comparisons between population groups. 3 Britain
3 Ibid 73.
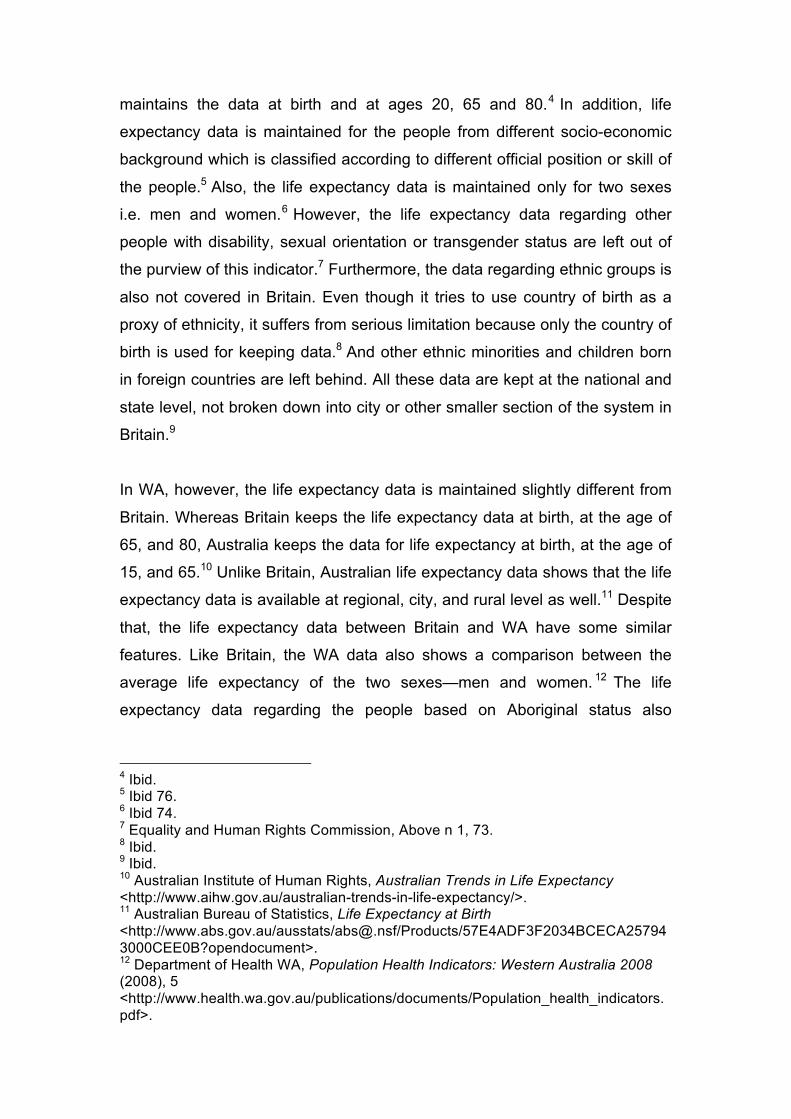
maintains the data at birth and at ages 20, 65 and 80.4 In addition, life
expectancy data is maintained for the people from different socio-economic
background which is classified according to different official position or skill of
the people.5 Also, the life expectancy data is maintained only for two sexes
i.e. men and women.6 However, the life expectancy data regarding other
people with disability, sexual orientation or transgender status are left out of
the purview of this indicator.7 Furthermore, the data regarding ethnic groups is
also not covered in Britain. Even though it tries to use country of birth as a
proxy of ethnicity, it suffers from serious limitation because only the country of
birth is used for keeping data.8 And other ethnic minorities and children born
in foreign countries are left behind. All these data are kept at the national and
state level, not broken down into city or other smaller section of the system in
Britain.9
In WA, however, the life expectancy data is maintained slightly different from
Britain. Whereas Britain keeps the life expectancy data at birth, at the age of
65, and 80, Australia keeps the data for life expectancy at birth, at the age of
15, and 65.10 Unlike Britain, Australian life expectancy data shows that the life
expectancy data is available at regional, city, and rural level as well.11 Despite
that, the life expectancy data between Britain and WA have some similar
features. Like Britain, the WA data also shows a comparison between the
average life expectancy of the two sexes—men and women. 12 The life
expectancy data regarding the people based on Aboriginal status also
4 Ibid. 5 Ibid 76. 6 Ibid 74. 7 Equality and Human Rights Commission, Above n 1, 73. 8 Ibid. 9 Ibid. 10 Australian Institute of Human Rights, Australian Trends in Life Expectancy <http://www.aihw.gov.au/australian-trends-in-life-expectancy/>. 11 Australian Bureau of Statistics, Life Expectancy at Birth <http://www.abs.gov.au/ausstats/[email protected]/Products/57E4ADF3F2034BCECA257943000CEE0B?opendocument>. 12 Department of Health WA, Population Health Indicators: Western Australia 2008 (2008), 5 <http://www.health.wa.gov.au/publications/documents/Population_health_indicators.pdf>.
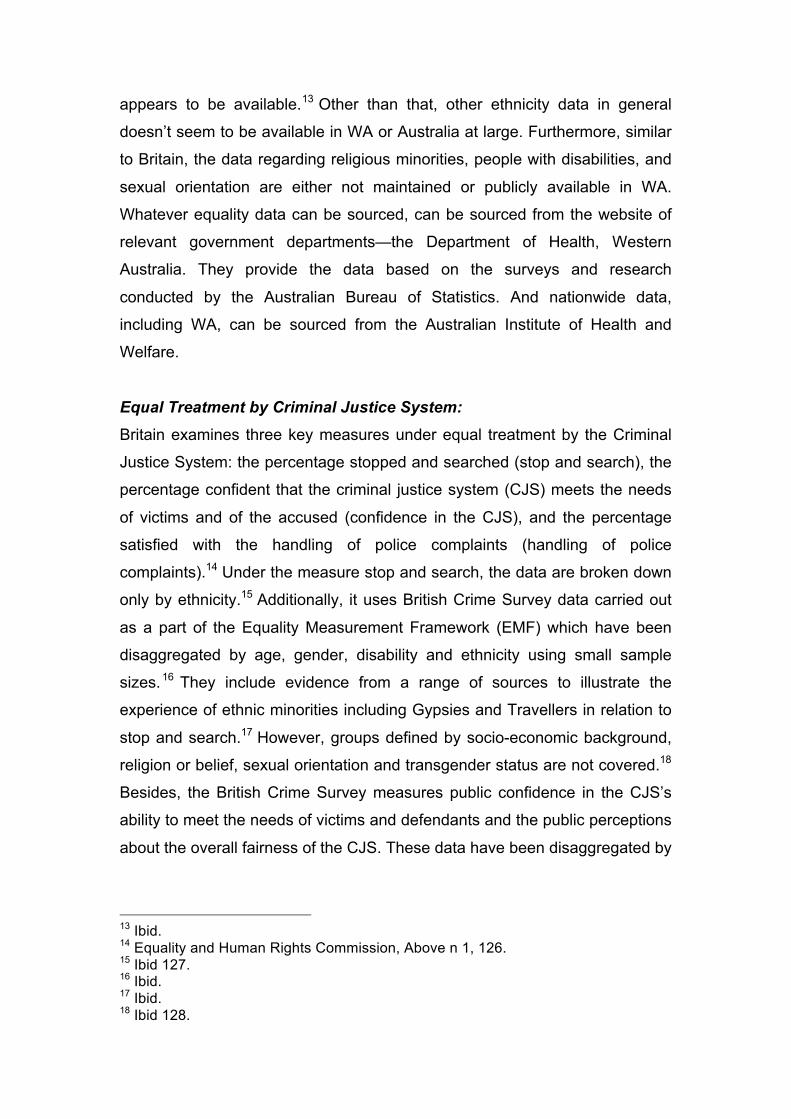
appears to be available.13 Other than that, other ethnicity data in general
doesn’t seem to be available in WA or Australia at large. Furthermore, similar
to Britain, the data regarding religious minorities, people with disabilities, and
sexual orientation are either not maintained or publicly available in WA.
Whatever equality data can be sourced, can be sourced from the website of
relevant government departments—the Department of Health, Western
Australia. They provide the data based on the surveys and research
conducted by the Australian Bureau of Statistics. And nationwide data,
including WA, can be sourced from the Australian Institute of Health and
Welfare.
Equal Treatment by Criminal Justice System: Britain examines three key measures under equal treatment by the Criminal
Justice System: the percentage stopped and searched (stop and search), the
percentage confident that the criminal justice system (CJS) meets the needs
of victims and of the accused (confidence in the CJS), and the percentage
satisfied with the handling of police complaints (handling of police
complaints).14 Under the measure stop and search, the data are broken down
only by ethnicity.15 Additionally, it uses British Crime Survey data carried out
as a part of the Equality Measurement Framework (EMF) which have been
disaggregated by age, gender, disability and ethnicity using small sample
sizes.16 They include evidence from a range of sources to illustrate the
experience of ethnic minorities including Gypsies and Travellers in relation to
stop and search.17 However, groups defined by socio-economic background,
religion or belief, sexual orientation and transgender status are not covered.18
Besides, the British Crime Survey measures public confidence in the CJS’s
ability to meet the needs of victims and defendants and the public perceptions
about the overall fairness of the CJS. These data have been disaggregated by
13 Ibid. 14 Equality and Human Rights Commission, Above n 1, 126. 15 Ibid 127. 16 Ibid. 17 Ibid. 18 Ibid 128.
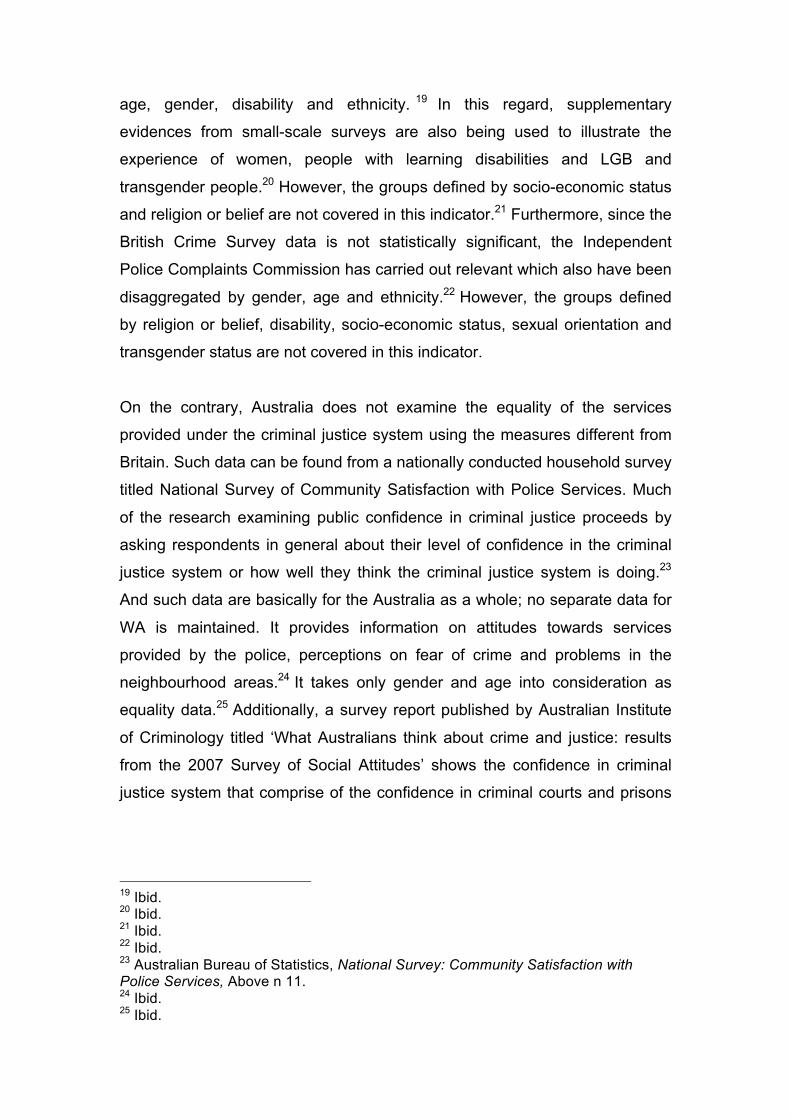
age, gender, disability and ethnicity. 19 In this regard, supplementary
evidences from small-scale surveys are also being used to illustrate the
experience of women, people with learning disabilities and LGB and
transgender people.20 However, the groups defined by socio-economic status
and religion or belief are not covered in this indicator.21 Furthermore, since the
British Crime Survey data is not statistically significant, the Independent
Police Complaints Commission has carried out relevant which also have been
disaggregated by gender, age and ethnicity.22 However, the groups defined
by religion or belief, disability, socio-economic status, sexual orientation and
transgender status are not covered in this indicator.
On the contrary, Australia does not examine the equality of the services
provided under the criminal justice system using the measures different from
Britain. Such data can be found from a nationally conducted household survey
titled National Survey of Community Satisfaction with Police Services. Much
of the research examining public confidence in criminal justice proceeds by
asking respondents in general about their level of confidence in the criminal
justice system or how well they think the criminal justice system is doing.23
And such data are basically for the Australia as a whole; no separate data for
WA is maintained. It provides information on attitudes towards services
provided by the police, perceptions on fear of crime and problems in the
neighbourhood areas.24 It takes only gender and age into consideration as
equality data.25 Additionally, a survey report published by Australian Institute
of Criminology titled ‘What Australians think about crime and justice: results
from the 2007 Survey of Social Attitudes’ shows the confidence in criminal
justice system that comprise of the confidence in criminal courts and prisons
19 Ibid. 20 Ibid. 21 Ibid. 22 Ibid. 23 Australian Bureau of Statistics, National Survey: Community Satisfaction with Police Services, Above n 11. 24 Ibid. 25 Ibid.
along with police services.26 But this survey also lacks equality data other
than age and sex which is different from the equality data in Britain.27
Furthermore, the data regarding stop and search seems unavailable in WA.
The data available regarding the confidence in the criminal justice system can
be sourced from the websites of Australian Bureau of Statistics and Australian
Institute of Criminology.
Crimes against the person
Britain examines three key measures under crimes against the person: the
percentage of people reporting that they have been victims of violent crime,
the percentage of people reporting that they have been victims of sexual
assault, including attempts (focusing on rape), and the percentage of people
reporting that they have been victims of domestic violence and abuse or
partner abuse.28 Violent crime data collected through British Crime Survey
can be disaggregated by gender, age (16+), socio-economic factors and
limiting long-term illness (LLTI) or disability.29 Such disaggregation is possible
by ethnicity and by religion or belief – often only by pooling data as the
numbers are generally too small to yield statistically significant results.30 Data
from the British Crime Survey relating to this measure cannot be covered the
experiences of LGB, or transgender people. Additionally, the other source
Scottish Crime and Justice Survey can be disaggregated by gender, age
(16+), and socio-economic status.31 Under sexual violence, Britain focuses on
rape since that is the most persistent form of violence against women and
girls.32 There are two surveys conducted by British Crime Survey and Scottish
Crime and Justice Survey in this regard which provide a more accurate
reflection of the fact because these two surveys use self-completion modules.
26 Lynne Roberts and David Indermaur, What Australians Think About Crime and Justice: Results from the 2007 Survey of Social Attitudes (2007) Australian Institute of Criminology <http://www.aic.gov.au/documents/4/8/A/%7b48A3B38B-376E-4A7A-A457-AA5CC37AE090%7drpp101.pdf>. 27 Ibid. 28 Equality and Human Rights Commission, Above n 1, 192. 29 Ibid 193. 30 Ibid. 31 Ibid. 32 Ibid 194.
Both self-completion modules are administered only to those aged 16 to 59.33
This means that Britain miss out the information about elder and child abuse,
although they use supplementary sources of information where possible. The
British Crime Survey disaggregates by gender, and contains information
about the experiences of lesbian, gay and bisexual (LGB) people even though
the number is low due to the non-disclosure of their identity.34 Finally, both of
these Survey self-completion modules ask about partner and family abuse
(including emotional, financial and sexual abuse, and the use of threats or
force as well).35 Besides, they draw on the face-to-face British Crime Survey
for information about domestic violence. 36 Such data have been
disaggregated by gender, age, socio-economic status, LLTI/disability,
ethnicity, sexual orientation, and socio-economic status.37 Along with the
surveys, they also consulted with various relevant literatures.38
Like Britain, WA keeps data on the crime reported to police on different sexual
assault and domestic violence. WA maintains a fairly broad range of equality
data that are covered under four broad categories-multicultural communities,
diverse sexuality, people with disabilities, and seniors and elder abuse.39 It
also maintains data about Indigenous communities and juvenile justice in
separate categories.40 However, unlike Britain, the data regarding rape and
domestic violence are not separately maintained in WA. Rather, the domestic
violence and sexual violence seem overlapping. Additionally, The Parliament
of Australia also maintains the equality data for the people across the country
from different groups who are under the threat of sexual violence or domestic
violence. The equality data in this regard comprises of different age groups,
Indigenous women, women living in rural and remote areas, women with
33 Ibid. 34 Ibid. 35 Ibid 195. 36 Ibid. 37 Ibid. 38 Ibid. 39 Nicole Lagett, Violence Against Women in Western Australia (2007) Women’s Council for Domestic and Family Violence Services (WA), 5 <http://www.womenscouncil.com.au/uploads/6/1/1/9/6119703/____violence_against_women_in_western_australia_report.pdf>. 40 Ibid 10.
disability, and women from culturally and linguistically diverse backgrounds.41
Even though Australia attempts to keep the disability data, the full extent of it
is not available.42 The data about the women from culturally and linguistically
diverse backgrounds cover the ethnicity in WA. The maintenance of some of
such data, however, different in WA (or Australia as a whole) is different from
those of Britain. For example, unlike Britain, the age is not confined into
particular age groups in WA. WA clearly mentions about the abuse of the
children at the domestic sphere. 43 The maintenance of data regarding
Indigenous men and women in WA or Australia as a whole is also different
from Britain. Furthermore, the data about women living in rural and remote
areas is also different from Britain since it doesn’t keep any such data. On the
other hand, whereas WA has some diversity data in with regards to sexual
assault and domestic violence, it appears that despite having a statistic for
different types of crime including violent crime, there is no equality data in this
regard.44 The crime statistics available for violent crime and other data can be
sourced from WA police department. The rape and domestic violence data for
WA in particular can be sourced from both the Parliament of WA and the
survey of Women’s Council for Domestic and Family Violence Services (WA).
Similar the data for the country as a whole can be sourced from the website of
the Parliament of Australia.
Poor Mental Health
Under poor mental health, Britain gives the percentage of people who attain a
score in psychological questionnaires that indicate possible mental health
conditions, such as depression or anxiety.45 The data about socio-economic
groups are used but they are not comparable since they vary in different parts
41 Liesl Mitchell, Domestic Violence in Australia—An Overview of the Issues (22 November 2011) Parliament of Australia <http://www.aph.gov.au/About_Parliament/Parliamentary_Departments/Parliamentary_Library/pubs/BN/2011-2012/DVAustralia#_Toc309798373>. 42 Above n 39, 13. 43 Ibid 24. 44 Western Australia Police <http://www.police.wa.gov.au/ABOUTUS/Statistics/CrimeStatistcalNotes/tabid/1212/Default.aspx>. 45 Equality and Human Rights Commission, Above n 1, 270.
of the country.46 There is a lack of disaggregated data for disabled people
which implies a general association between poor mental health and disability
but no more detailed information of the particular impairments that may be
associated with poor mental health.47 Britain maintains data on ethnicity and
religion or belief in some parts of the country.48 There is limited evidence for
sexual orientation and transgender groups and therefore, they are reliant on
varied literature which limits the extent to which they can make any
generalizations to the wider population.49 However, there are issues with
under-reporting and diagnosis that apply across all groups, (particularly men
and people who have a different cultural background, or English is not first
language) which limit the reliability of the indicator.50
While developing a National Mental Health Strategy (NMHS), the finding of
lack of mental health data resulted in a national survey of mental health.51
Therefore, there is a nation-wide mental health data for Australia; there is no
separate study for WA per se. The Western Australian part of the survey was
conducted in 1997 to 1998.52 The equality data regarding mental health
basically covers about gender as well as different age groups—both children
and adults.53 Besides, the mental health survey in Australia maintains equality
data relating to gender, marital status, educational qualification, and
employment status.54 However, there is no equality data relating to religion,
sexual orientation, transgender, ethnicity etc. maintained in WA or Australia at
large. In fact, the focus of the survey was more on the type and severity of the
mental illness, rather than equality data. Another survey named National
Survey of Mental Health and Wellbeing (SMHWB) conducted in 2007 only
covers only those disorders that can be identified using an interview-based
46 Ibid. 47 Ibid. 48 Ibid. 49 Ibid 271. 50 Ibid. 51 Australian Bureau of statistics, Mental Health and Wellbeing: Profile of Adults, Western Australia, 1997-98, Above n 11. 52 Ibid. 53 Ibid. 54 Ibid.
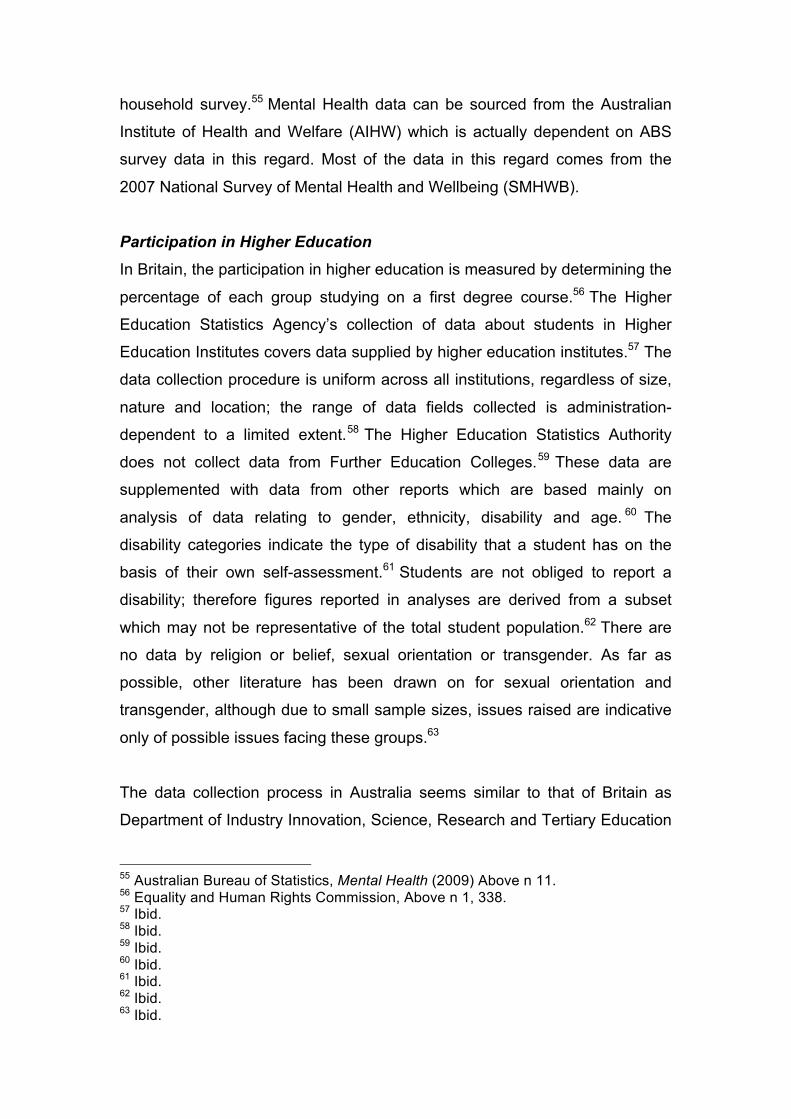
household survey.55 Mental Health data can be sourced from the Australian
Institute of Health and Welfare (AIHW) which is actually dependent on ABS
survey data in this regard. Most of the data in this regard comes from the
2007 National Survey of Mental Health and Wellbeing (SMHWB).
Participation in Higher Education
In Britain, the participation in higher education is measured by determining the
percentage of each group studying on a first degree course.56 The Higher
Education Statistics Agency’s collection of data about students in Higher
Education Institutes covers data supplied by higher education institutes.57 The
data collection procedure is uniform across all institutions, regardless of size,
nature and location; the range of data fields collected is administration-
dependent to a limited extent.58 The Higher Education Statistics Authority
does not collect data from Further Education Colleges.59 These data are
supplemented with data from other reports which are based mainly on
analysis of data relating to gender, ethnicity, disability and age. 60 The
disability categories indicate the type of disability that a student has on the
basis of their own self-assessment.61 Students are not obliged to report a
disability; therefore figures reported in analyses are derived from a subset
which may not be representative of the total student population.62 There are
no data by religion or belief, sexual orientation or transgender. As far as
possible, other literature has been drawn on for sexual orientation and
transgender, although due to small sample sizes, issues raised are indicative
only of possible issues facing these groups.63
The data collection process in Australia seems similar to that of Britain as
Department of Industry Innovation, Science, Research and Tertiary Education
55 Australian Bureau of Statistics, Mental Health (2009) Above n 11. 56 Equality and Human Rights Commission, Above n 1, 338. 57 Ibid. 58 Ibid. 59 Ibid. 60 Ibid. 61 Ibid. 62 Ibid. 63 Ibid.
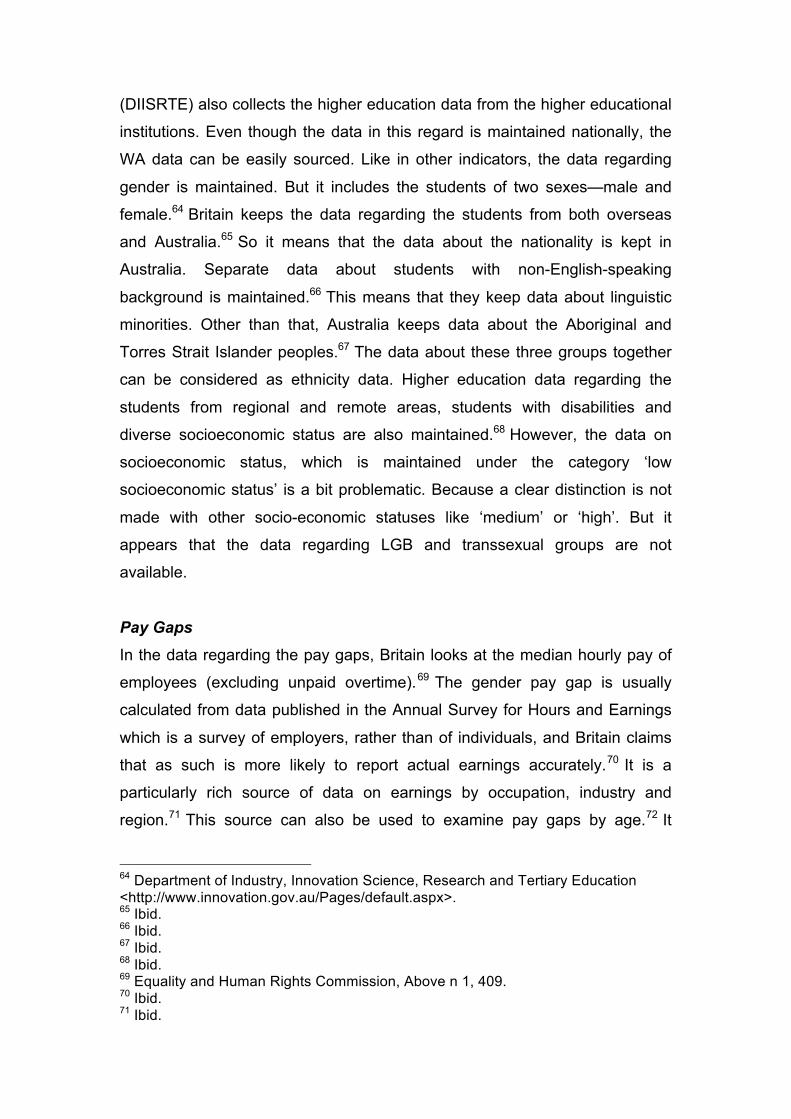
(DIISRTE) also collects the higher education data from the higher educational
institutions. Even though the data in this regard is maintained nationally, the
WA data can be easily sourced. Like in other indicators, the data regarding
gender is maintained. But it includes the students of two sexes—male and
female.64 Britain keeps the data regarding the students from both overseas
and Australia.65 So it means that the data about the nationality is kept in
Australia. Separate data about students with non-English-speaking
background is maintained.66 This means that they keep data about linguistic
minorities. Other than that, Australia keeps data about the Aboriginal and
Torres Strait Islander peoples.67 The data about these three groups together
can be considered as ethnicity data. Higher education data regarding the
students from regional and remote areas, students with disabilities and
diverse socioeconomic status are also maintained.68 However, the data on
socioeconomic status, which is maintained under the category ‘low
socioeconomic status’ is a bit problematic. Because a clear distinction is not
made with other socio-economic statuses like ‘medium’ or ‘high’. But it
appears that the data regarding LGB and transsexual groups are not
available.
Pay Gaps In the data regarding the pay gaps, Britain looks at the median hourly pay of
employees (excluding unpaid overtime).69 The gender pay gap is usually
calculated from data published in the Annual Survey for Hours and Earnings
which is a survey of employers, rather than of individuals, and Britain claims
that as such is more likely to report actual earnings accurately.70 It is a
particularly rich source of data on earnings by occupation, industry and
region.71 This source can also be used to examine pay gaps by age.72 It
64 Department of Industry, Innovation Science, Research and Tertiary Education <http://www.innovation.gov.au/Pages/default.aspx>. 65 Ibid. 66 Ibid. 67 Ibid. 68 Ibid. 69 Equality and Human Rights Commission, Above n 1, 409. 70 Ibid. 71 Ibid.
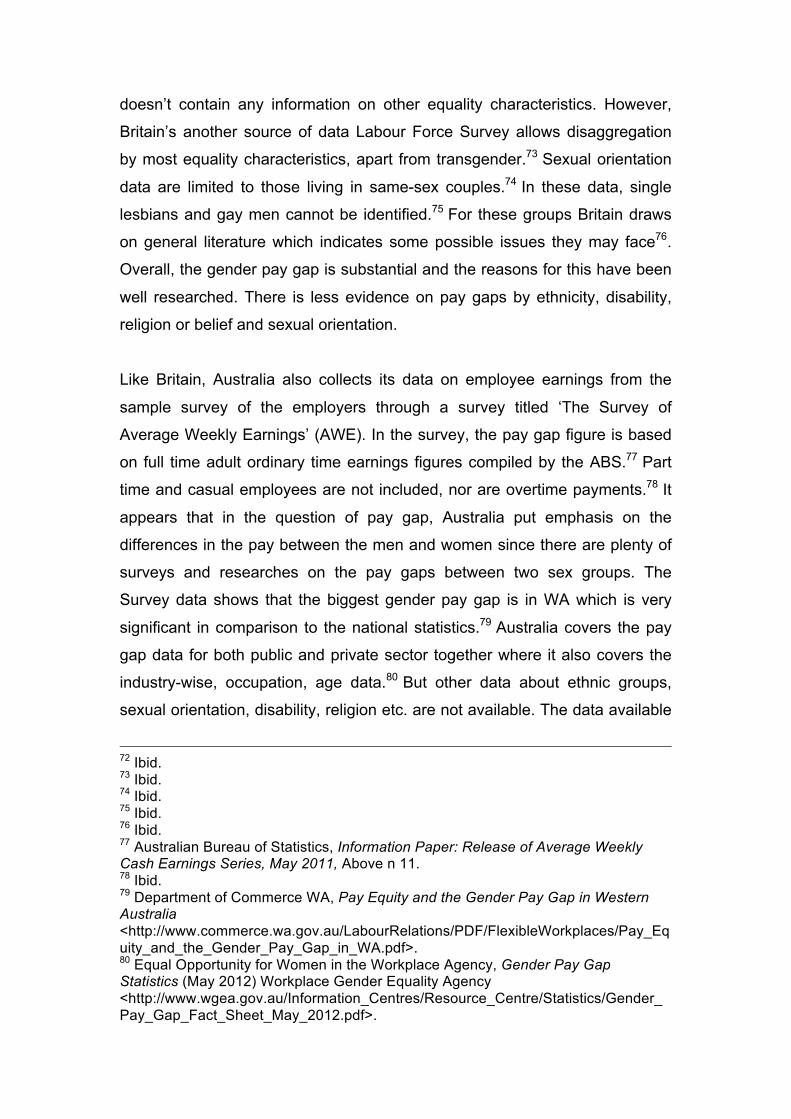
doesn’t contain any information on other equality characteristics. However,
Britain’s another source of data Labour Force Survey allows disaggregation
by most equality characteristics, apart from transgender.73 Sexual orientation
data are limited to those living in same-sex couples.74 In these data, single
lesbians and gay men cannot be identified.75 For these groups Britain draws
on general literature which indicates some possible issues they may face76.
Overall, the gender pay gap is substantial and the reasons for this have been
well researched. There is less evidence on pay gaps by ethnicity, disability,
religion or belief and sexual orientation.
Like Britain, Australia also collects its data on employee earnings from the
sample survey of the employers through a survey titled ‘The Survey of
Average Weekly Earnings’ (AWE). In the survey, the pay gap figure is based
on full time adult ordinary time earnings figures compiled by the ABS.77 Part
time and casual employees are not included, nor are overtime payments.78 It
appears that in the question of pay gap, Australia put emphasis on the
differences in the pay between the men and women since there are plenty of
surveys and researches on the pay gaps between two sex groups. The
Survey data shows that the biggest gender pay gap is in WA which is very
significant in comparison to the national statistics.79 Australia covers the pay
gap data for both public and private sector together where it also covers the
industry-wise, occupation, age data.80 But other data about ethnic groups,
sexual orientation, disability, religion etc. are not available. The data available
72 Ibid. 73 Ibid. 74 Ibid. 75 Ibid. 76 Ibid. 77 Australian Bureau of Statistics, Information Paper: Release of Average Weekly Cash Earnings Series, May 2011, Above n 11. 78 Ibid. 79 Department of Commerce WA, Pay Equity and the Gender Pay Gap in Western Australia <http://www.commerce.wa.gov.au/LabourRelations/PDF/FlexibleWorkplaces/Pay_Equity_and_the_Gender_Pay_Gap_in_WA.pdf>. 80 Equal Opportunity for Women in the Workplace Agency, Gender Pay Gap Statistics (May 2012) Workplace Gender Equality Agency <http://www.wgea.gov.au/Information_Centres/Resource_Centre/Statistics/Gender_Pay_Gap_Fact_Sheet_May_2012.pdf>.

for Australia as a whole in this regard can be sourced from website of Equal
Opportunity for Women in the Workplace Agency, ABS. In particular, the WA
pay gap data can be sourced from the website of the Department of
Commerce, WA.
Housing and Neighbourhood Quality
In Britain, there are several measures examined under Housing and
neighbourhood quality: overcrowded accommodation, substandard
accommodation and the numbers of households reporting problems with
pollution and crime.81 Under overcrowded accommodation, percentage living
in accommodation one or two bedrooms below the ‘bedroom standard’ level is
considered.82 And under substandard accommodation – percentage reporting
‘leaking roof, damp walls, floors or foundations, or rotten floorboards or
window frames (or ‘leaks, damp etc.’) is considered.83 In neighbourhood
quality, percentage reporting ‘pollution, grime, or other environmental
problems in the area caused by traffic or industry’ (‘pollution etc.’), and
percentage reporting ‘crime, violence or vandalism’ in the area (‘crime etc.’) is
considered. 84 For these measures, Britain uses the General Household
Survey at some parts of it which allows disaggregation of gender, age,
disability and ethnicity.85 But in other parts, it is slightly different where the
residents are asked to rate dwelling quality rather than to describe it, reducing
the possibility for direct comparisons to those for Britain as a whole.86 Data on
disability are limited.87 There are no data on transgender or sexual orientation
in terms of housing quality, but there is some limited alternative literature that
refers to related housing issues, such as homelessness.88 Overall, there is
very limited related literature for this measure for religion and belief; therefore
they are not covered.
81 Equality and Human Rights Commission, Above n 1, 488. 82 Ibid. 83 Ibid. 84 Ibid. 85 Ibid. 86 Ibid. 87 Ibid 489. 88 Ibid.
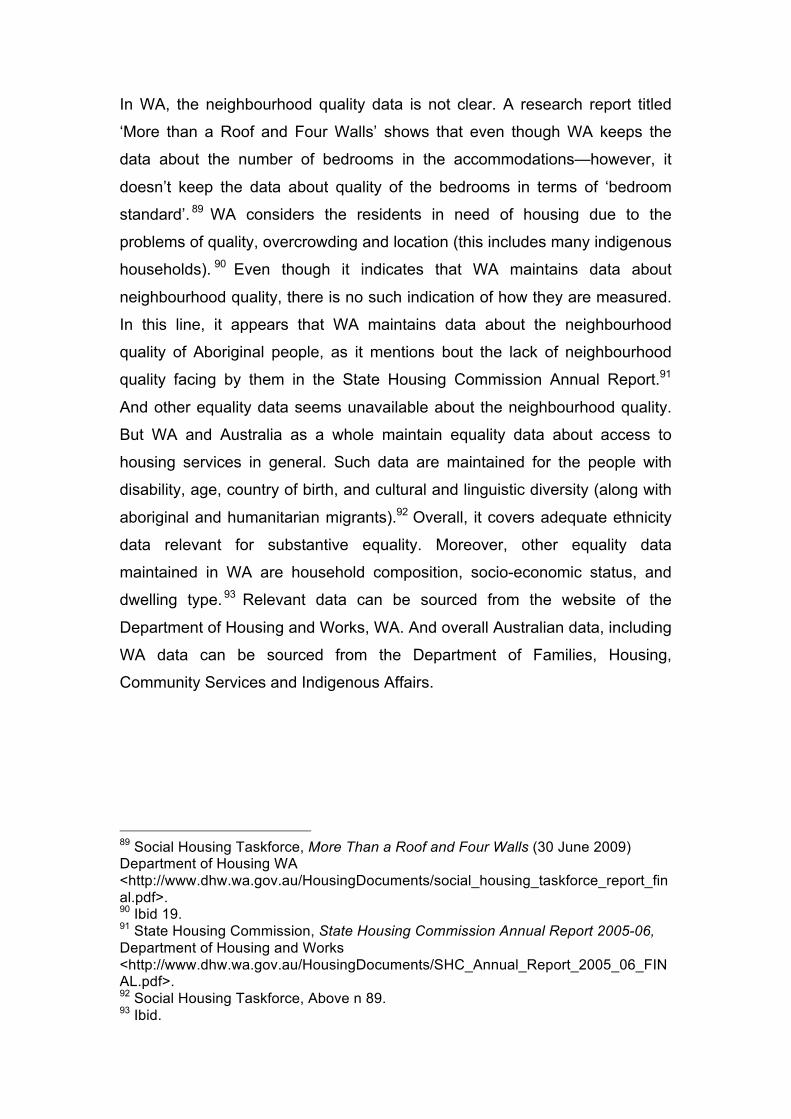
In WA, the neighbourhood quality data is not clear. A research report titled
‘More than a Roof and Four Walls’ shows that even though WA keeps the
data about the number of bedrooms in the accommodations—however, it
doesn’t keep the data about quality of the bedrooms in terms of ‘bedroom
standard’. 89 WA considers the residents in need of housing due to the
problems of quality, overcrowding and location (this includes many indigenous
households). 90 Even though it indicates that WA maintains data about
neighbourhood quality, there is no such indication of how they are measured.
In this line, it appears that WA maintains data about the neighbourhood
quality of Aboriginal people, as it mentions bout the lack of neighbourhood
quality facing by them in the State Housing Commission Annual Report.91
And other equality data seems unavailable about the neighbourhood quality.
But WA and Australia as a whole maintain equality data about access to
housing services in general. Such data are maintained for the people with
disability, age, country of birth, and cultural and linguistic diversity (along with
aboriginal and humanitarian migrants).92 Overall, it covers adequate ethnicity
data relevant for substantive equality. Moreover, other equality data
maintained in WA are household composition, socio-economic status, and
dwelling type. 93 Relevant data can be sourced from the website of the
Department of Housing and Works, WA. And overall Australian data, including
WA data can be sourced from the Department of Families, Housing,
Community Services and Indigenous Affairs.
89 Social Housing Taskforce, More Than a Roof and Four Walls (30 June 2009) Department of Housing WA <http://www.dhw.wa.gov.au/HousingDocuments/social_housing_taskforce_report_final.pdf>. 90 Ibid 19. 91 State Housing Commission, State Housing Commission Annual Report 2005-06, Department of Housing and Works <http://www.dhw.wa.gov.au/HousingDocuments/SHC_Annual_Report_2005_06_FINAL.pdf>. 92 Social Housing Taskforce, Above n 89. 93 Ibid.
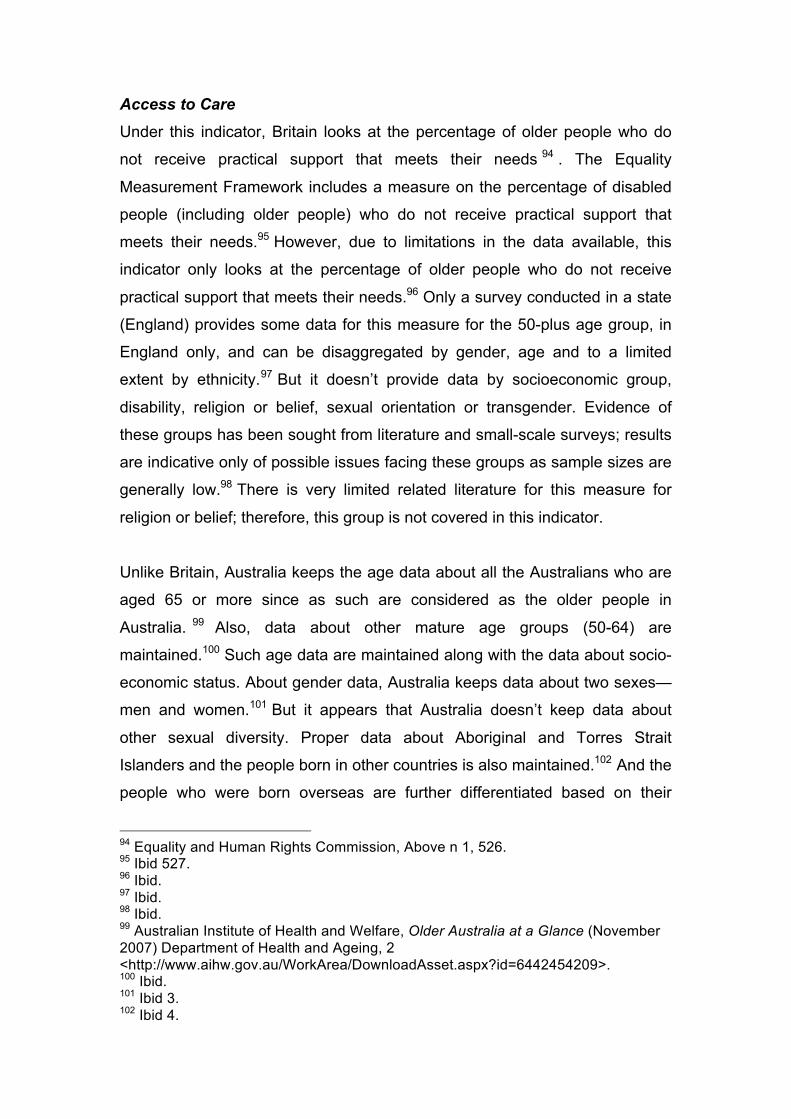
Access to Care
Under this indicator, Britain looks at the percentage of older people who do
not receive practical support that meets their needs 94 . The Equality
Measurement Framework includes a measure on the percentage of disabled
people (including older people) who do not receive practical support that
meets their needs.95 However, due to limitations in the data available, this
indicator only looks at the percentage of older people who do not receive
practical support that meets their needs.96 Only a survey conducted in a state
(England) provides some data for this measure for the 50-plus age group, in
England only, and can be disaggregated by gender, age and to a limited
extent by ethnicity.97 But it doesn’t provide data by socioeconomic group,
disability, religion or belief, sexual orientation or transgender. Evidence of
these groups has been sought from literature and small-scale surveys; results
are indicative only of possible issues facing these groups as sample sizes are
generally low.98 There is very limited related literature for this measure for
religion or belief; therefore, this group is not covered in this indicator.
Unlike Britain, Australia keeps the age data about all the Australians who are
aged 65 or more since as such are considered as the older people in
Australia. 99 Also, data about other mature age groups (50-64) are
maintained.100 Such age data are maintained along with the data about socio-
economic status. About gender data, Australia keeps data about two sexes—
men and women.101 But it appears that Australia doesn’t keep data about
other sexual diversity. Proper data about Aboriginal and Torres Strait
Islanders and the people born in other countries is also maintained.102 And the
people who were born overseas are further differentiated based on their
94 Equality and Human Rights Commission, Above n 1, 526. 95 Ibid 527. 96 Ibid. 97 Ibid. 98 Ibid. 99 Australian Institute of Health and Welfare, Older Australia at a Glance (November 2007) Department of Health and Ageing, 2 <http://www.aihw.gov.au/WorkArea/DownloadAsset.aspx?id=6442454209>. 100 Ibid. 101 Ibid 3. 102 Ibid 4.
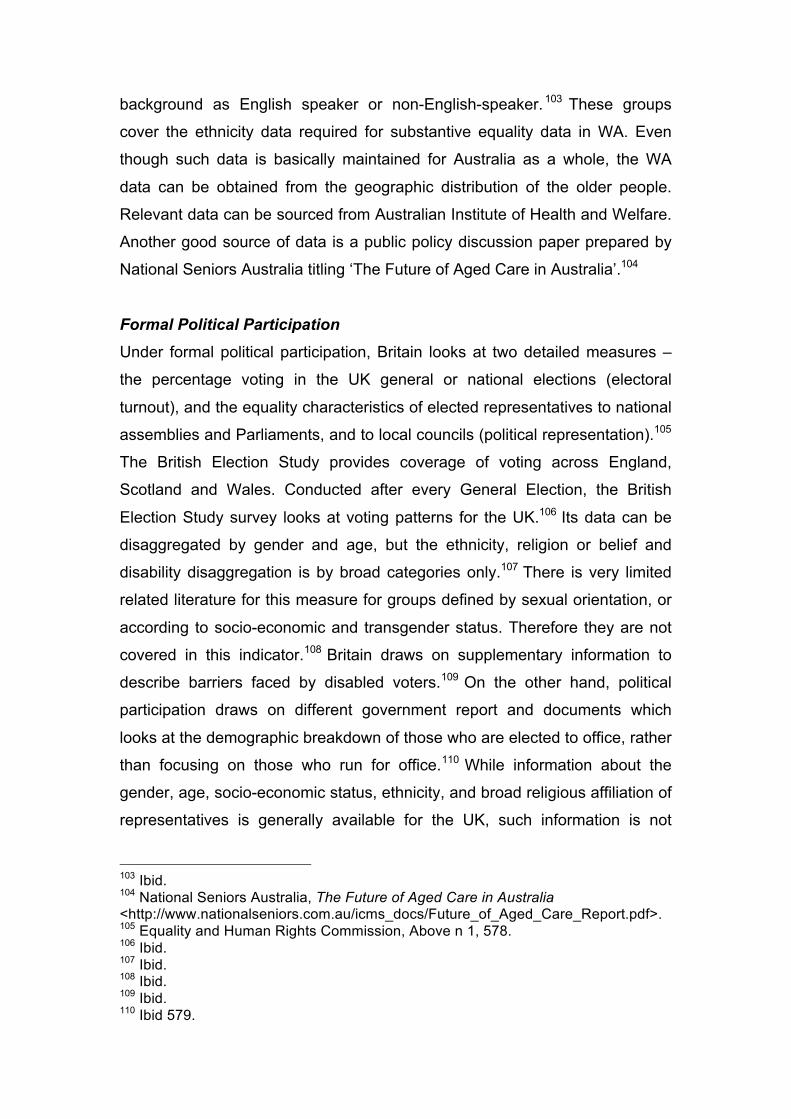
background as English speaker or non-English-speaker. 103 These groups
cover the ethnicity data required for substantive equality data in WA. Even
though such data is basically maintained for Australia as a whole, the WA
data can be obtained from the geographic distribution of the older people.
Relevant data can be sourced from Australian Institute of Health and Welfare.
Another good source of data is a public policy discussion paper prepared by
National Seniors Australia titling ‘The Future of Aged Care in Australia’.104
Formal Political Participation Under formal political participation, Britain looks at two detailed measures –
the percentage voting in the UK general or national elections (electoral
turnout), and the equality characteristics of elected representatives to national
assemblies and Parliaments, and to local councils (political representation).105
The British Election Study provides coverage of voting across England,
Scotland and Wales. Conducted after every General Election, the British
Election Study survey looks at voting patterns for the UK.106 Its data can be
disaggregated by gender and age, but the ethnicity, religion or belief and
disability disaggregation is by broad categories only.107 There is very limited
related literature for this measure for groups defined by sexual orientation, or
according to socio-economic and transgender status. Therefore they are not
covered in this indicator.108 Britain draws on supplementary information to
describe barriers faced by disabled voters.109 On the other hand, political
participation draws on different government report and documents which
looks at the demographic breakdown of those who are elected to office, rather
than focusing on those who run for office.110 While information about the
gender, age, socio-economic status, ethnicity, and broad religious affiliation of
representatives is generally available for the UK, such information is not
103 Ibid. 104 National Seniors Australia, The Future of Aged Care in Australia <http://www.nationalseniors.com.au/icms_docs/Future_of_Aged_Care_Report.pdf>. 105 Equality and Human Rights Commission, Above n 1, 578. 106 Ibid. 107 Ibid. 108 Ibid. 109 Ibid. 110 Ibid 579.
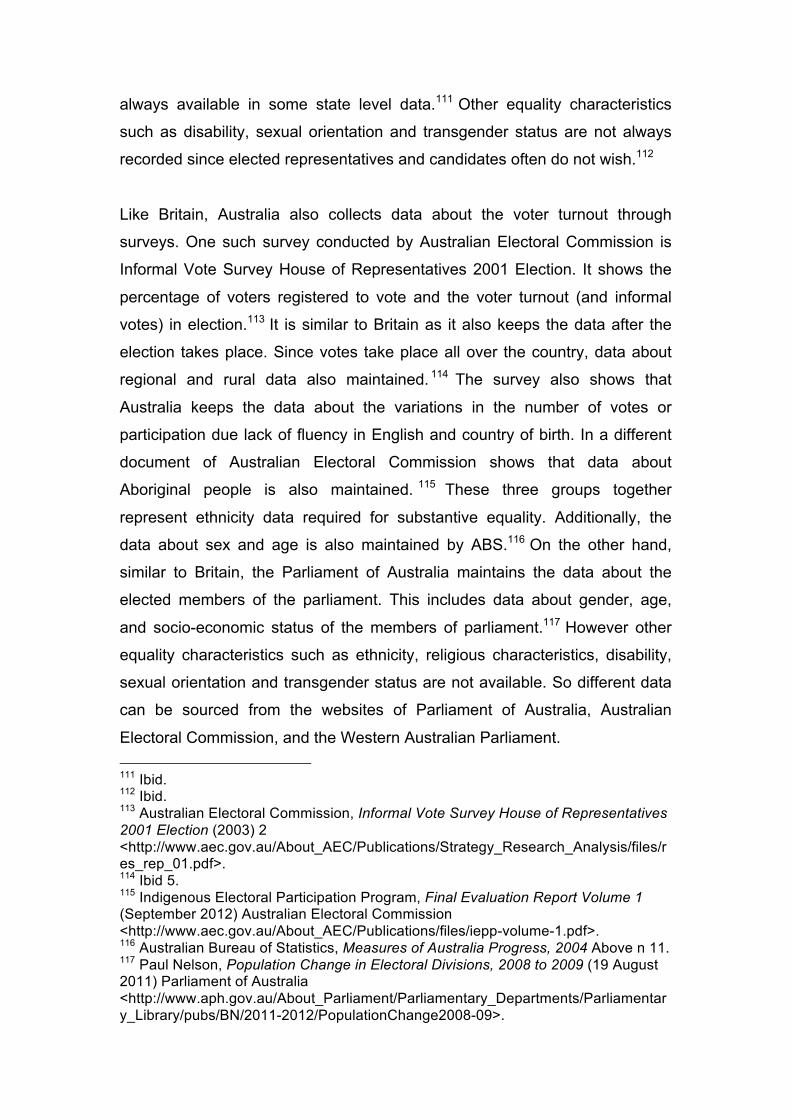
always available in some state level data.111 Other equality characteristics
such as disability, sexual orientation and transgender status are not always
recorded since elected representatives and candidates often do not wish.112
Like Britain, Australia also collects data about the voter turnout through
surveys. One such survey conducted by Australian Electoral Commission is
Informal Vote Survey House of Representatives 2001 Election. It shows the
percentage of voters registered to vote and the voter turnout (and informal
votes) in election.113 It is similar to Britain as it also keeps the data after the
election takes place. Since votes take place all over the country, data about
regional and rural data also maintained. 114 The survey also shows that
Australia keeps the data about the variations in the number of votes or
participation due lack of fluency in English and country of birth. In a different
document of Australian Electoral Commission shows that data about
Aboriginal people is also maintained. 115 These three groups together
represent ethnicity data required for substantive equality. Additionally, the
data about sex and age is also maintained by ABS.116 On the other hand,
similar to Britain, the Parliament of Australia maintains the data about the
elected members of the parliament. This includes data about gender, age,
and socio-economic status of the members of parliament.117 However other
equality characteristics such as ethnicity, religious characteristics, disability,
sexual orientation and transgender status are not available. So different data
can be sourced from the websites of Parliament of Australia, Australian
Electoral Commission, and the Western Australian Parliament. 111 Ibid. 112 Ibid. 113 Australian Electoral Commission, Informal Vote Survey House of Representatives 2001 Election (2003) 2 <http://www.aec.gov.au/About_AEC/Publications/Strategy_Research_Analysis/files/res_rep_01.pdf>. 114 Ibid 5. 115 Indigenous Electoral Participation Program, Final Evaluation Report Volume 1 (September 2012) Australian Electoral Commission <http://www.aec.gov.au/About_AEC/Publications/files/iepp-volume-1.pdf>. 116 Australian Bureau of Statistics, Measures of Australia Progress, 2004 Above n 11. 117 Paul Nelson, Population Change in Electoral Divisions, 2008 to 2009 (19 August 2011) Parliament of Australia <http://www.aph.gov.au/About_Parliament/Parliamentary_Departments/Parliamentary_Library/pubs/BN/2011-2012/PopulationChange2008-09>.
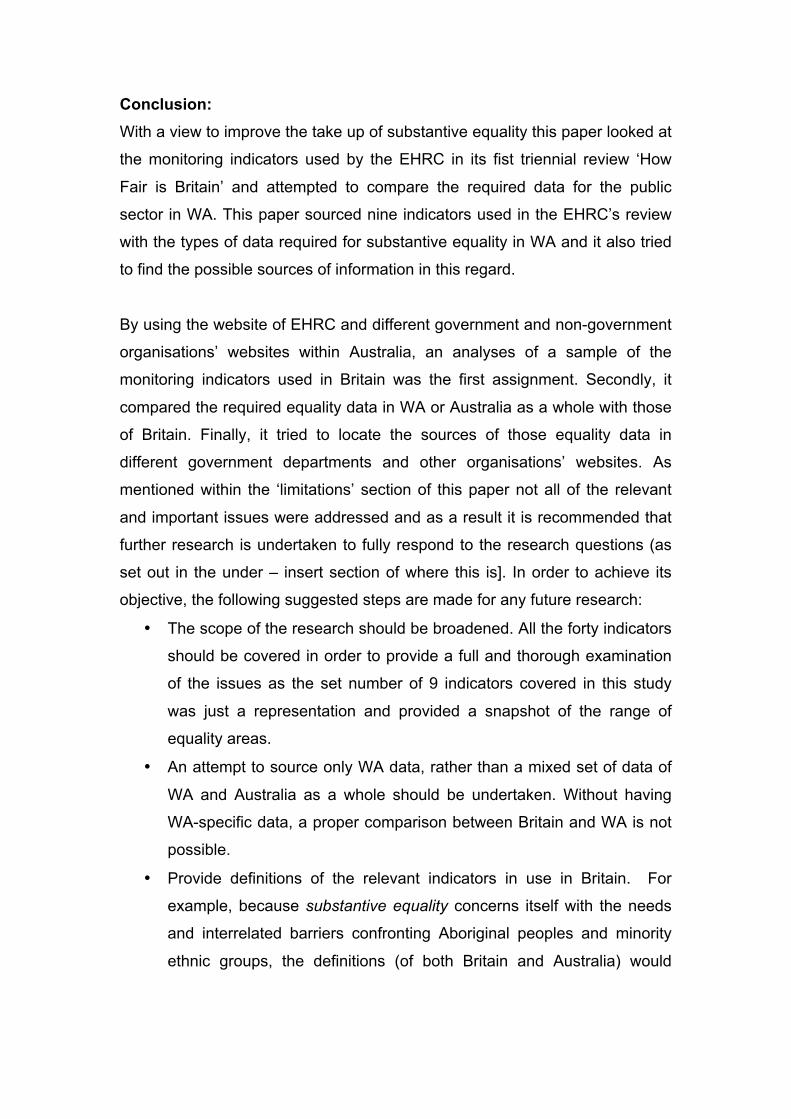
Conclusion: With a view to improve the take up of substantive equality this paper looked at
the monitoring indicators used by the EHRC in its fist triennial review ‘How
Fair is Britain’ and attempted to compare the required data for the public
sector in WA. This paper sourced nine indicators used in the EHRC’s review
with the types of data required for substantive equality in WA and it also tried
to find the possible sources of information in this regard.
By using the website of EHRC and different government and non-government
organisations’ websites within Australia, an analyses of a sample of the
monitoring indicators used in Britain was the first assignment. Secondly, it
compared the required equality data in WA or Australia as a whole with those
of Britain. Finally, it tried to locate the sources of those equality data in
different government departments and other organisations’ websites. As
mentioned within the ‘limitations’ section of this paper not all of the relevant
and important issues were addressed and as a result it is recommended that
further research is undertaken to fully respond to the research questions (as
set out in the under – insert section of where this is]. In order to achieve its
objective, the following suggested steps are made for any future research:
• The scope of the research should be broadened. All the forty indicators
should be covered in order to provide a full and thorough examination
of the issues as the set number of 9 indicators covered in this study
was just a representation and provided a snapshot of the range of
equality areas.
• An attempt to source only WA data, rather than a mixed set of data of
WA and Australia as a whole should be undertaken. Without having
WA-specific data, a proper comparison between Britain and WA is not
possible.
• Provide definitions of the relevant indicators in use in Britain. For
example, because substantive equality concerns itself with the needs
and interrelated barriers confronting Aboriginal peoples and minority
ethnic groups, the definitions (of both Britain and Australia) would
provide further insight and remove any confusion with regard to its
meanings.
• Sufficient amount of time should be given to complete the research.
Since finding proper data and analysing and comparing them requires
a significant amount of time, adequate time should be given while
doing a further broader research.
• The researcher should be clear about is asked and all relevant facts
and matters relating to the research before actually starting the
research. Regular contact with the responsible SEU staff(s) may help
in this regard.
If these recommendations can be implemented properly, presumably, the
quality of further research will be better. This eventually will help SEU in
ensuring substantive equality in government services for the Indigenous
peoples and ethnic minorities.
References: Australian Bureau of Statistics, Life Expectancy at Birth
<http://www.abs.gov.au/ausstats/[email protected]/Products/57E4ADF3F2034BCEC
A257943000CEE0B?opendocument>.
Australian Electoral Commission, Informal Vote Survey House of
Representatives 2001 Election (2003) 2
<http://www.aec.gov.au/About_AEC/Publications/Strategy_Research_Analysi
s/files/res_rep_01.pdf>.
Australian Institute of Health and Welfare, Older Australia at a Glance
(November 2007) Department of Health and Ageing, 2
<http://www.aihw.gov.au/WorkArea/DownloadAsset.aspx?id=6442454209>.
Australian Institute of Human Rights, Australian Trends in Life Expectancy
<http://www.aihw.gov.au/australian-trends-in-life-expectancy/>.
Department of Commerce WA, Pay Equity and the Gender Pay Gap in
Western Australia
<http://www.commerce.wa.gov.au/LabourRelations/PDF/FlexibleWorkplaces/
Pay_Equity_and_the_Gender_Pay_Gap_in_WA.pdf>.
Department of Health WA, Population Health Indicators: Western Australia
2008 (2008), 5
<http://www.health.wa.gov.au/publications/documents/Population_health_indi
cators.pdf>.
Department of Industry, Innovation Science, Research and Tertiary Education
<http://www.innovation.gov.au/Pages/default.aspx>.
Equality and Human Rights Commission, How Fair is Britain, (2010), 14 <
http://www.equalityhumanrights.com/key-projects/how-fair-is-britain/>.
Equal Opportunity for Women in the Workplace Agency, Gender Pay Gap
Statistics (May 2012) Workplace Gender Equality Agency
<http://www.wgea.gov.au/Information_Centres/Resource_Centre/Statistics/Ge
nder_Pay_Gap_Fact_Sheet_May_2012.pdf>.
Indigenous Electoral Participation Program, Final Evaluation Report Volume 1
(September 2012) Australian Electoral Commission
<http://www.aec.gov.au/About_AEC/Publications/files/iepp-volume-1.pdf>.
Liesl Mitchell, Domestic Violence in Australia—An Overview of the Issues (22
November 2011) Parliament of Australia
<http://www.aph.gov.au/About_Parliament/Parliamentary_Departments/Parlia
mentary_Library/pubs/BN/2011-2012/DVAustralia#_Toc309798373>.
Lynne Roberts and David Indermaur, What Australians Think About Crime
and Justice: Results from the 2007 Survey of Social Attitudes (2007)
Australian Institute of Criminology
<http://www.aic.gov.au/documents/4/8/A/%7b48A3B38B-376E-4A7A-A457-
AA5CC37AE090%7drpp101.pdf>.
National Seniors Australia, The Future of Aged Care in Australia
<http://www.nationalseniors.com.au/icms_docs/Future_of_Aged_Care_Report
.pdf>.
Nicole Lagett, Violence Against Women in Western Australia (2007) Women’s
Council for Domestic and Family Violence Services (WA), 5
<http://www.womenscouncil.com.au/uploads/6/1/1/9/6119703/____violence_a
gainst_women_in_western_australia_report.pdf>.
Paul Nelson, Population Change in Electoral Divisions, 2008 to 2009 (19
August 2011) Parliament of Australia
<http://www.aph.gov.au/About_Parliament/Parliamentary_Departments/Parlia
mentary_Library/pubs/BN/2011-2012/PopulationChange2008-09>.
Social Housing Taskforce, More Than a Roof and Four Walls (30 June 2009)
Department of Housing WA
<http://www.dhw.wa.gov.au/HousingDocuments/social_housing_taskforce_re
port_final.pdf>.
State Housing Commission, State Housing Commission Annual Report 2005-
06, Department of Housing and Works
<http://www.dhw.wa.gov.au/HousingDocuments/SHC_Annual_Report_2005_
06_FINAL.pdf>.
Western Australia Police
<http://www.police.wa.gov.au/ABOUTUS/Statistics/CrimeStatistcalNotes/tabid
/1212/Default.aspx>.


