Embed Size (px)
Citation preview
Synthesis and Processing of Amorphous Si(Al)OCBulk Ceramics: High Temperature Properties and
Applications
A dissertation submitted to the
Department of Materials Science
Darmstadt University of Technology
in partial fulfillment of the requirements for the degree
of
Doktor−Ingenieur
by
Rahul Ramesh HarsheMaster of Technology (M. Tech)
from
Kirloskarwadi, India
Referee: Prof. Dr. R. Riedel
Co-referee: Prof. Dr. H. Ortner
Date of submission: 19 August 2004
Date of oral examination: 07 September 2004
Darmstadt 2004
D 17
Acknowledgments
Hardly-if-ever PhD is the sole achievement of one person. It rather is a journeywhere the traveller is dependent on many aid on the path, has to ask for direc-tions, and often needs a helping hand. It is only just to name my debts andthank the people who helped me on my way −here is the right place for it as Isincerely think that seldom is anything accomplished without the assistance orencouragement of others.
First I would like to pay my sincere thanks to Prof. Dr. R. Riedel. He hasalways been extremely generous with his time, knowledge and ideas and allowedme great freedom in this research.
Likewise, I owe much to the advice and intellectual support of Prof. Dr. C. Balan.His deep understanding in research helped me in understanding basic concepts. Iwant to thank Prof. R. Raj for giving me the opportunity to work together withhis group in Boulder, USA.
My special thanks goes to Prof. Dr. H. M. Ortner, Chemical Analytic group inTU-Darmstadt for his acceptance as a co-referee.
Further thanks to:
Dr. C. Konetschny for introduction to this project and kind helpC. Fasel for TGMS and discussionDr. I. Kinski for MAS-NMR characterizationDr. Sandeep Shah for compression creep experiments and useful discussionDr. Stephan Flege for SIMS characterization
I appreciate the help from collogues and all those who have provided kind sup-port, without which a great deal of this work would have been impossible.
I express my gratitude for the chance and financial support provided by the Stateof Hessen, Germany to realize this research.
Much appreciation goes to my mother and father, and the rest of my family fortheir support and belief in me which have always inspired me in my endeavors.
This list is far from exhaustive; I pray for forgiveness from those I did not mentionby name and include them in my heart-felt gratitude.
Contents
1 Abstract 1
2 Introduction & Motivation 3
3 Literature Review 7
3.1 Ceramics from Pyrolysis of Preceramic Polymers . . . . . . . . . . 7
3.2 Advantages over Conventional Fabrication Methods . . . . . . . . 10
3.3 Synthesis and Chemistry of Preceramic Polymers . . . . . . . . . 11
3.4 Silicon Oxycarbide: General . . . . . . . . . . . . . . . . . . . . . 18
3.4.1 Processing of Silicon Oxycarbide Glasses . . . . . . . . . . 21
3.4.1.1 Processing of Silicon Oxycarbide Glasses: Sol-Gel
Method . . . . . . . . . . . . . . . . . . . . . . . 21
3.4.1.2 Processing of Silicon Oxycarbide Glasses: Sili-
cone Resins . . . . . . . . . . . . . . . . . . . . . 27
3.4.2 SiOC Ceramic and Post Treatment Characterization: MAS-
NMR, TEM, EELS, Mechanical. . . . . . . . . . . . . . . . 34
3.5 Formation of Si(M)OC Ceramics; M = Modifiers (Elements or
Compounds) . . . . . . . . . . . . . . . . . . . . . . . . . . . . . . 39
3.5.1 Modifications with Fillers . . . . . . . . . . . . . . . . . . 39
3.5.1.1 Inactive Filler Controlled Pyrolysis of Preceramic
Polymers . . . . . . . . . . . . . . . . . . . . . . 39
3.5.1.2 Active Filler Controlled Pyrolysis of Preceramic
Polymers . . . . . . . . . . . . . . . . . . . . . . 43
3.5.2 Modification of Preceramic Polymers without Fillers . . . 45
3.5.2.1 Structural Characterization of Si-Al-O-C Polymers 46
i
Contents
3.5.2.2 Pyrolysis Process to Si(Al)OC Ceramics and Post
Treatment Characterization . . . . . . . . . . . . 46
3.6 Kinetics of the Process . . . . . . . . . . . . . . . . . . . . . . . . 47
3.6.1 Basic Theories . . . . . . . . . . . . . . . . . . . . . . . . . 48
3.6.2 Rate of a Single Thermally Activated Process . . . . . . . 49
3.6.3 Rate Equations for Heterogeneous Reactions . . . . . . . . 51
3.7 Thermo-Mechanical Behavior . . . . . . . . . . . . . . . . . . . . 53
3.7.1 Developments in Thermo-Mechanical Behavior for Si(C)O
Systems . . . . . . . . . . . . . . . . . . . . . . . . . . . . 53
3.8 Oxidation Resistance . . . . . . . . . . . . . . . . . . . . . . . . . 55
3.8.1 Oxidation Review on Silicon Based Ceramics . . . . . . . . 55
3.8.1.1 Oxidation of Silicon . . . . . . . . . . . . . . . . 55
3.8.1.2 Oxidation of Silicon Carbide (SiC) . . . . . . . . 56
3.8.1.3 Additive Containing Materials . . . . . . . . . . . 60
3.8.2 Oxidation of SiOC Ceramics (Fibers and Powder) . . . . . 61
3.9 Applications . . . . . . . . . . . . . . . . . . . . . . . . . . . . . . 65
3.9.1 Polymer Derived Ceramic Fibers . . . . . . . . . . . . . . 65
3.9.2 Other Applications . . . . . . . . . . . . . . . . . . . . . . 66
4 Experimental Procedure 71
4.1 Unmodified Preceramic Polymer . . . . . . . . . . . . . . . . . . . 71
4.1.1 Basic Materials . . . . . . . . . . . . . . . . . . . . . . . . 71
4.1.2 Mixing Procedure, Cross-linking and Shaping . . . . . . . 72
4.1.3 Pyrolysis . . . . . . . . . . . . . . . . . . . . . . . . . . . . 74
4.2 Modified Preceramic Polymer . . . . . . . . . . . . . . . . . . . . 75
4.2.1 Basic Materials for Aluminum Modification . . . . . . . . 75
4.2.2 Modification Procedure: Sol-Gel Method . . . . . . . . . . 75
4.2.3 Shaping and Pyrolysis . . . . . . . . . . . . . . . . . . . . 75
4.3 Sample Designation . . . . . . . . . . . . . . . . . . . . . . . . . . 76
4.4 Post Pyrolysis Heat-treatments: Procedures . . . . . . . . . . . . 77
4.4.1 Inert Atmosphere (Crystallization Behavior): Powder and
Bulks . . . . . . . . . . . . . . . . . . . . . . . . . . . . . 77
4.4.2 Air Atmosphere (Oxidation): Bulks . . . . . . . . . . . . . 77
4.5 Mechanical Characterization of SiOC ceramic . . . . . . . . . . . 79
ii
Contents
4.5.1 Acoustic Method . . . . . . . . . . . . . . . . . . . . . . . 79
4.5.2 Indentation Method . . . . . . . . . . . . . . . . . . . . . 80
4.6 Thermo-Mechanical Behavior: Creep Test . . . . . . . . . . . . . 81
4.7 Methods for Material Characterization . . . . . . . . . . . . . . . 82
4.7.1 Rheology . . . . . . . . . . . . . . . . . . . . . . . . . . . 82
4.7.2 Fourier Transform Infrared Spectroscopy (FTIR) . . . . . 83
4.7.3 Thermal Gravimetry and Mass Spectroscopy (TG/MS) . . 84
4.7.4 Thermo Mechanical Analysis (TMA) . . . . . . . . . . . . 84
4.7.5 Dimensional Changes (Dilatometry) . . . . . . . . . . . . . 85
4.7.6 Elemental Analysis . . . . . . . . . . . . . . . . . . . . . . 85
4.7.7 MAS-NMR Spectroscopy . . . . . . . . . . . . . . . . . . . 86
4.7.8 X-ray Diffraction . . . . . . . . . . . . . . . . . . . . . . . 86
4.7.9 Scanning Electron Microscopy . . . . . . . . . . . . . . . . 87
4.7.10 Secondary Ion Mass Spectroscopy (SIMS) . . . . . . . . . 87
5 Results and Discussion 89
5.1 Material Selection: Identifying Ideal Polymer . . . . . . . . . . . . 89
5.2 Unmodified Siloxane System . . . . . . . . . . . . . . . . . . . . . 93
5.2.1 Investigating MK polymer: Chemical and Thermal Cross-
linking Behavior . . . . . . . . . . . . . . . . . . . . . . . . 94
5.2.2 Cross-linking Investigation by Rheology: Optimizing Cross-
Linking-Agent Content . . . . . . . . . . . . . . . . . . . . 99
5.2.2.1 Rheology: Introduction . . . . . . . . . . . . . . 99
5.2.2.2 Theoretical Background and Definitions . . . . . 100
5.2.3 Rheology and its Advantage in Processing . . . . . . . . . 106
5.2.3.1 Rheology for Fiber Formation . . . . . . . . . . . 106
5.2.3.2 Rheology for Green-Bulk Formation . . . . . . . 112
5.2.4 Pyrolysis of Unmodified Polymer: Polymer-SiOC Ceramic
Conversion Process . . . . . . . . . . . . . . . . . . . . . . 112
5.3 Aluminum Modified Siloxane System . . . . . . . . . . . . . . . . 115
5.3.1 Gelation Process . . . . . . . . . . . . . . . . . . . . . . . 115
5.3.2 SiAlOC Polymer-Ceramic Transformation Process . . . . . 116
5.4 Chemical Analysis . . . . . . . . . . . . . . . . . . . . . . . . . . 120
5.5 Presence of Residual Carbon in Si(Al)OC Pyrolyzed Products . . 121
iii
Contents
5.6 MAS-NMR Investigation of Si(Al)OC System . . . . . . . . . . . 123
5.7 Bulk Formation: Physical Changes During Si(Al)OC Pyrolysis . . 128
5.7.1 Bulk SiOC Ceramics . . . . . . . . . . . . . . . . . . . . . 128
5.7.2 Bulk SiAlOC Ceramics . . . . . . . . . . . . . . . . . . . . 130
5.8 Mechanical Characterization of SiOC Ceramics . . . . . . . . . . 132
5.8.1 Acoustic Method . . . . . . . . . . . . . . . . . . . . . . . 132
5.8.2 Indentation Method . . . . . . . . . . . . . . . . . . . . . 134
5.9 High Temperature Behavior . . . . . . . . . . . . . . . . . . . . . 137
5.9.1 Crystallization, Phase Separation and High Temperature
Stability in Si(Al)OC Ceramics . . . . . . . . . . . . . . . 137
5.9.1.1 SiOC Ceramic . . . . . . . . . . . . . . . . . . . 137
5.9.1.2 SiAlOC Ceramic . . . . . . . . . . . . . . . . . . 140
5.10 Softening/Crystallization Kinetics of SiAlOC Ceramics . . . . . . 144
5.11 Creep in Bulk SiAlOC Ceramics . . . . . . . . . . . . . . . . . . . 154
5.12 Oxidation Behavior . . . . . . . . . . . . . . . . . . . . . . . . . . 166
5.12.1 Oxidation of As-Pyrolyzed Bulk Si(Al)OC Ceramics . . . . 167
5.12.1.1 As-Pyrolyzed SiOC Bulks . . . . . . . . . . . . . 167
5.12.1.2 Oxidation of As-Pyrolyzed SiAlOC Bulks . . . . 172
5.12.2 Oxidation of Heat-Treated Bulk Si(Al)OC Ceramics . . . . 180
5.13 Applications . . . . . . . . . . . . . . . . . . . . . . . . . . . . . . 191
5.13.1 MEMS: General . . . . . . . . . . . . . . . . . . . . . . . . 191
5.13.1.1 SiOC Ceramic Micro-Component Feasibility Study193
5.13.2 Ceramic Matrix Composites (CMC’s) . . . . . . . . . . . . 195
6 Conclusions 199
7 Outlook 203
Bibliography 205
8 Vita, Conferences/Publications and Awards 221
iv
List of Figures
4.1 Possible structure of MK-polymer with linear and branched com-
ponents. . . . . . . . . . . . . . . . . . . . . . . . . . . . . . . . . 72
4.2 The oligomers and functional groups present in MK-polymer . . . 72
4.3 Schematic of the creep test setup. . . . . . . . . . . . . . . . . . 82
4.4 View of the creep furnace and sample: (Left) actual furnace (Right)
SiAlOC ceramic bulk held between two SiC plates along with two
LVDT for radial displacement measurement. Experiments were
performed in the lab at Boulder, USA from Prof. Rishi Raj. . . . 83
5.1 Development of viscosity for DC6-2230 polymer with temperature
when heated at 10°C/min. . . . . . . . . . . . . . . . . . . . . . 91
5.2 Development of viscosity for NH-2100 polymer with temperature
when heated at 10°C/min. . . . . . . . . . . . . . . . . . . . . . 91
5.3 Development of viscosity for LR-3003 polymer with temperature
when heated at 10°C/min. . . . . . . . . . . . . . . . . . . . . . 92
5.4 Isothermal development of G’ for LR-3003 polymer with time at
different temperatures. . . . . . . . . . . . . . . . . . . . . . . . 93
5.5 FTIR spectrum of MK polymer in as-received condition. Indica-
tion of the bands is given in Table: 5.2. . . . . . . . . . . . . . . 95
5.6 Thermo gravimetric and differential thermo gravimetric analysis
of commercial MK polymer (5°C/min, Argon) . . . . . . . . . . . 96
5.7 Thermal decomposition comparison of MK polymer (5°C/min, Ar-
gon), after mixing the CLA with different methods (a) polymer
without CLA (as received condition), (b) mixing 1 wt.% CLA by
dry route and (c) mixing 1 wt.% CLA by solution route. . . . . . 97
v
List of Figures
5.8 Mechanical analogs reflecting deformation processes in polymeric
solids: (a) elastic; (b) pure viscous; (c) Maxwell model for vis-
coelastic fluid; (d) Voigt model for viscoelastic solid. . . . . . . . 101
5.9 Definition for phase angle δ. . . . . . . . . . . . . . . . . . . . . 103
5.10 Evolution of elastic modulus with temperature, as function of CLA
concentration within the MK based polymer. . . . . . . . . . . . 105
5.11 Evolution of loss tangent with temperature, at constant heating
rate (5 °C/min) for various CLA concentrations. . . . . . . . . . 107
5.12 Evolution of elastic modulus and loss tangent with temperature,
for constant CLA concentration (1 wt.%), as a function of heating
rate. . . . . . . . . . . . . . . . . . . . . . . . . . . . . . . . . . . 108
5.13 Different time-temperature schemes used to study the effect of
heating rate on elastic modulus. . . . . . . . . . . . . . . . . . . 109
5.14 Effect of various heating cycles from Fig. 5.13 for maintaining
constant elastic modulus with temperature. . . . . . . . . . . . . 110
5.15 Effect of constant temperature on elastic modulus (G’). . . . . . 111
5.16 View of the specimens at various processing steps: (a) SiOC thin
green body and (b) SiOC ceramic after pyrolysis at 1100°C. . . . 111
5.17 TG/MS of MK polymer + 1 wt.%CLA heated with 10°C/min in
helium atmosphere. . . . . . . . . . . . . . . . . . . . . . . . . . 113
5.18 FTIR-spectra of catalyzed MK polymer heated to different tem-
peratures. . . . . . . . . . . . . . . . . . . . . . . . . . . . . . . . 115
5.19 Possible hydrolysis and condensation reaction of alumatrane with
MK polymer in isopropanol. . . . . . . . . . . . . . . . . . . . . . 117
5.20 View of the reaction system at various processing steps: (a) SiAlOC1
sol and (b) SiAlOC1 gel after gelation at room temperature. . . . 117
5.21 TG/MS of aluminum modified (SiAlOC) MK polymer heated with
10°C/min in helium atmosphere. . . . . . . . . . . . . . . . . . . 118
5.22 FTIR of aluminum modified (SiAlOC3) MK polymer heated to
different temperatures. . . . . . . . . . . . . . . . . . . . . . . . 119
5.23 Raman spectra of the Si(Al)OC ceramics, pyrolyzed in Ar at
1300°C. . . . . . . . . . . . . . . . . . . . . . . . . . . . . . . . . 122
5.24 29Si MAS NMR spectrum for SiAlOC1 ceramic pyrolyzed at 1100°Cin argon atmosphere. . . . . . . . . . . . . . . . . . . . . . . . . 124
vi
List of Figures
5.25 27Al MAS NMR spectrum for SiAlOC2 ceramic pyrolyzed at 1100°Cin argon atmosphere. . . . . . . . . . . . . . . . . . . . . . . . . 125
5.26 27Al MAS NMR spectrum for SiAlOC3 ceramic pyrolyzed at 1100°Cin argon atmosphere. . . . . . . . . . . . . . . . . . . . . . . . . 125
5.27 SEM micrograph of the surface of (a) SiOC and (b) SiAlOC2 ce-
ramic after pyrolysis at 1100°C in argon. . . . . . . . . . . . . . . 129
5.28 Thermal mechanical analysis (TMA) of non-modified SiOC and
Al-modified SiAlOC ceramics measured with a heating rate of
5°C/min in argon atmosphere. . . . . . . . . . . . . . . . . . . . 130
5.29 View of SiAlOC green and ceramic bodies obtained at different
temperatures. . . . . . . . . . . . . . . . . . . . . . . . . . . . . 131
5.30 Elastic modulus of thin SiOC ceramic sample measured from the
surface to the interior by acoustic method. . . . . . . . . . . . . 133
5.31 Vickers indentation: a) SiOC glass, 20 kg, 20 s; b) window glass,
1 kg, 20 s. . . . . . . . . . . . . . . . . . . . . . . . . . . . . . . . 135
5.32 Indentation profiles with various displacement components from
AFM: (a) 10 g; (b) 300 g. . . . . . . . . . . . . . . . . . . . . . . 135
5.33 Young’s modulus as calculated by means of Eq. (4.5) (page 81) as
a function of the indentation load. . . . . . . . . . . . . . . . . . . 136
5.34 Evolution of the X-ray powder diffractogram recorded on the SiOC
ceramic after annealing at various pyrolysis temperature in argon
atmosphere. . . . . . . . . . . . . . . . . . . . . . . . . . . . . . 138
5.35 SEM micrograph of the surface morphology (surface without frac-
ture) of SiOC ceramic after heat treatment in argon at 1500°C.
. . . . . . . . . . . . . . . . . . . . . . . . . . . . . . . . . . . . . 139
5.36 Dilatometrical evolution of dimensional changes with temperature
in argon at 5 and 10°C/min for SiOC bulk samples. . . . . . . . 139
5.37 Evolution of the X-ray diffractogram recorded on the SiAlOC ce-
ramics after annealing at various pyrolysis temperatures in argon
atmosphere. . . . . . . . . . . . . . . . . . . . . . . . . . . . . . 141
5.38 SEM micrograph of the surface morphology (direct surface) of
SiAlOC2 after heat treatment in argon at 1500°C. . . . . . . . . 142
5.39 Dilatometrical evolution of dimensional changes with temperature
in argon at 10°C/min for SiAlOC bulk samples. . . . . . . . . . . 142
vii
List of Figures
5.40 Thermal Dilatometry (TD) curves of as-pyrolyzed SiAlOC bulk
ceramic at different heating rates. . . . . . . . . . . . . . . . . . 145
5.41 Thermal Dilatometry Derivative (TDD) curves of as-pyrolyzed
SiAlOC bulk ceramic at different heating rates for SiAlOC1 com-
position. . . . . . . . . . . . . . . . . . . . . . . . . . . . . . . . 146
5.42 Thermal Dilatometry Derivative (TDD) curves of as-pyrolyzed
SiAlOC bulk ceramic at different heating rates for SiAlOC3 com-
position. . . . . . . . . . . . . . . . . . . . . . . . . . . . . . . . 147
5.43 Plot of ln β vs 1/Ts with linear regression line for SiAlOC ceramics.
The activation energies for softening are calculated from the slopes
and using Moynihan theory discussed by Eq. (3.35) [from page 52]. 148
5.44 Plot of ln(β/Tp2) vs 1/Tp with linear regression line for SiAlOC
ceramics. Note that Tp = Tcry as marked by second peak temper-
ature in Fig. 5.41. The activation energies for crystallization are
calculated from the slopes and using Kissinger theory discussed
by Eq. (3.36) [from page 52]. . . . . . . . . . . . . . . . . . . . . 151
5.45 TD curves for SiAlOC1 ceramic for first and second heating at the
heating rate of 10°C/min. . . . . . . . . . . . . . . . . . . . . . . 153
5.46 The axial and transverse strains, measured as a function of time
at five different stress levels for SiAlOC3 bulk ceramic at 1150°C.
The transverse strains were measured by two radial LVDT’s. . . 156
5.47 The sintering and creep strains, calculated as a function of time
at five different stress levels for SiAlOC3 bulk ceramic at 1150°C.
The transverse strains were measured by two radial LVDT’s. . . 157
5.48 Temperature dependence of the viscosity η of SiAlOC glass. Data
concerning vitreous silica, SiOC glasses from various authors are
superimposed. . . . . . . . . . . . . . . . . . . . . . . . . . . . . 159
5.49 Oxidation weight change of SiOC bulk ceramic at various temper-
atures for long isothermal times. . . . . . . . . . . . . . . . . . . 168
5.50 Temperature dependence of parabolic rate constant for oxidation
of SiOC bulk ceramic. . . . . . . . . . . . . . . . . . . . . . . . . 169
5.51 SIMS depth profile of SiOC bulk ceramic after oxidation in air at
1300°C for 26 h. . . . . . . . . . . . . . . . . . . . . . . . . . . . 170
viii
List of Figures
5.52 Cross-sectional view of SiOC bulk ceramic after oxidation in air
at 1300°C for 26 h. . . . . . . . . . . . . . . . . . . . . . . . . . . 170
5.53 Silica scale formed after oxidation of SiOC bulk ceramic: (a)
1200°C with 50 h holding time and (b) 1300°C with 26 h hold-
ing time (etched sample). . . . . . . . . . . . . . . . . . . . . . . . 171
5.54 Thermo-gravimetric investigation of SiAlOC bulk ceramic in air at
1400°C: (a) weight gain versus time and (b) (weight gain)2 versus
time. . . . . . . . . . . . . . . . . . . . . . . . . . . . . . . . . . 173
5.55 Thermo-gravimetric investigation of SiAlOC bulk ceramic in air at
1400°C: (a) weight gain versus time and (b) (weight gain)2 versus
time. . . . . . . . . . . . . . . . . . . . . . . . . . . . . . . . . . 175
5.56 Surface morphology of oxidized SiAlOC bulk ceramics at 1200°Cand 75 h holding time viewed at different magnifications: (a)
SiAlOC1, 2000X; (b) SiAlOC1, 500X; (c) SiAlOC2, 2000X; (d)
SiAlOC2, 500X; (e) SiAlOC3, 2000X; (f) SiAlOC3, 500X. . . . . . 177
5.57 Surface morphology of oxidized SiAlOC bulks ceramics at 1400°Cand 24 h holding time viewed at different magnifications: (a)
SiAlOC1, 2000X; (b) SiAlOC1, 500X; (c) SiAlOC2, 2000X; (d)
SiAlOC2, 500X; (e) SiAlOC3, 2000X; (f) SiAlOC3, 500X. . . . . . 178
5.58 Oxidation behavior of heat-treated SiAlOC bulk ceramic in air
at different temperatures: (a) SiAlOC1, (b) SiAlOC2 and (c)
SiAlOC3 ceramic. . . . . . . . . . . . . . . . . . . . . . . . . . . 182
5.59 Arrhenius relation between parabolic rate constant and tempera-
ture for oxidation of densified SiAlOC bulk ceramic. . . . . . . . 183
5.60 SIMS depth profile of SiAlOC1 (top) and SiAlOC3 (bottom) bulk
ceramic after oxidation in air at 1200°C for 24h. . . . . . . . . . 184
5.61 SIMS depth profile of bulk ceramic after oxidation in air at 1300°Cfor 24h (a) SiAlOC1, (b) SiAlOC2 and (c) SiAlOC3. . . . . . . . 187
5.62 Surface morphology of oxidized (pre-densified) bulks of SiAlOC
bulk ceramic at 1200°C and 50 h holding time viewed at differ-
ent magnifications: (a) SiAlOC1, 2000X; (b) SiAlOC1, 250X; (c)
SiAlOC2, 2000X; (d) SiAlOC2, 250X; (e) SiAlOC3, 2000X; (f)
SiAlOC3, 100X. . . . . . . . . . . . . . . . . . . . . . . . . . . . . 188
ix
List of Figures
5.63 Surface morphology of oxidized (pre-densified) bulks of SiAlOC
bulk ceramic at 1300°C and 50 h holding time viewed at differ-
ent magnifications: (a) SiAlOC1, 2000X; (b) SiAlOC1, 250X; (c)
SiAlOC2, 2000X; (d) SiAlOC2, 250X; (e) SiAlOC3, 2000X; (f)
SiAlOC3, 100X. . . . . . . . . . . . . . . . . . . . . . . . . . . . . 189
5.64 Surface morphology of oxidized (pre-densified) SiAlOC3 bulk ce-
ramic at 1300°C and 50 h holding time after etching. . . . . . . . 190
5.65 Surface morphology of (pre-densified) SiAlOC3 bulk ceramic after
oxidation in air at 1400°C for 100 h . . . . . . . . . . . . . . . . 191
5.66 Schematic of SiOC ceramic micro-gear fabrication process by mi-
cro casting from commercial polysiloxane. . . . . . . . . . . . . . 194
5.67 Microstructure of fractured Si-Ti-O-C CMC containing Ti (active
filler), and TiC (passive filler) embedded in SiOC matrix after
pyrolysis in argon at 1100°C.(116) . . . . . . . . . . . . . . . . . . 196
5.68 Mechanically stable ceramic matrix composite formation with com-
plex structure: (a) euro coin as a mold (b) euro green form after
warm pressing MK-polymer + 1 wt.%CLA mixture + 30 vol.% SiC
filler and (c) euro coin with detailed surface topograph in ceramic
state after pyrolysis in argon at 1100°C. . . . . . . . . . . . . . . 196
5.69 Formation of crack-free SiC filled SiOC ceramic matrix composite:
retention of euro coin topographic details in pyrolyzed state. . . 197
x
List of Tables
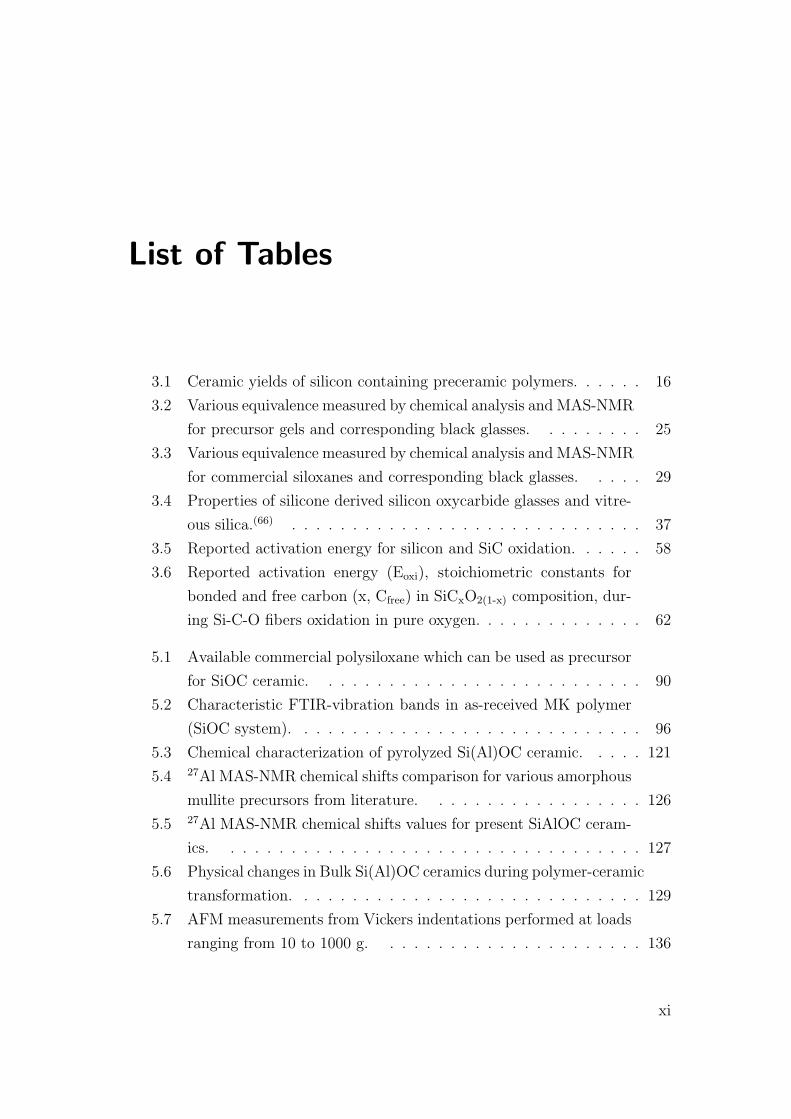
3.1 Ceramic yields of silicon containing preceramic polymers. . . . . . 16
3.2 Various equivalence measured by chemical analysis and MAS-NMR
for precursor gels and corresponding black glasses. . . . . . . . . 25
3.3 Various equivalence measured by chemical analysis and MAS-NMR
for commercial siloxanes and corresponding black glasses. . . . . 29
3.4 Properties of silicone derived silicon oxycarbide glasses and vitre-
ous silica.(66) . . . . . . . . . . . . . . . . . . . . . . . . . . . . . 37
3.5 Reported activation energy for silicon and SiC oxidation. . . . . . 58
3.6 Reported activation energy (Eoxi), stoichiometric constants for
bonded and free carbon (x, Cfree) in SiCxO2(1-x) composition, dur-
ing Si-C-O fibers oxidation in pure oxygen. . . . . . . . . . . . . . 62
5.1 Available commercial polysiloxane which can be used as precursor
for SiOC ceramic. . . . . . . . . . . . . . . . . . . . . . . . . . . 90
5.2 Characteristic FTIR-vibration bands in as-received MK polymer
(SiOC system). . . . . . . . . . . . . . . . . . . . . . . . . . . . . 96
5.3 Chemical characterization of pyrolyzed Si(Al)OC ceramic. . . . . 121
5.4 27Al MAS-NMR chemical shifts comparison for various amorphous
mullite precursors from literature. . . . . . . . . . . . . . . . . . 126
5.5 27Al MAS-NMR chemical shifts values for present SiAlOC ceram-
ics. . . . . . . . . . . . . . . . . . . . . . . . . . . . . . . . . . . 127
5.6 Physical changes in Bulk Si(Al)OC ceramics during polymer-ceramic
transformation. . . . . . . . . . . . . . . . . . . . . . . . . . . . . 129
5.7 AFM measurements from Vickers indentations performed at loads
ranging from 10 to 1000 g. . . . . . . . . . . . . . . . . . . . . . 136
xi
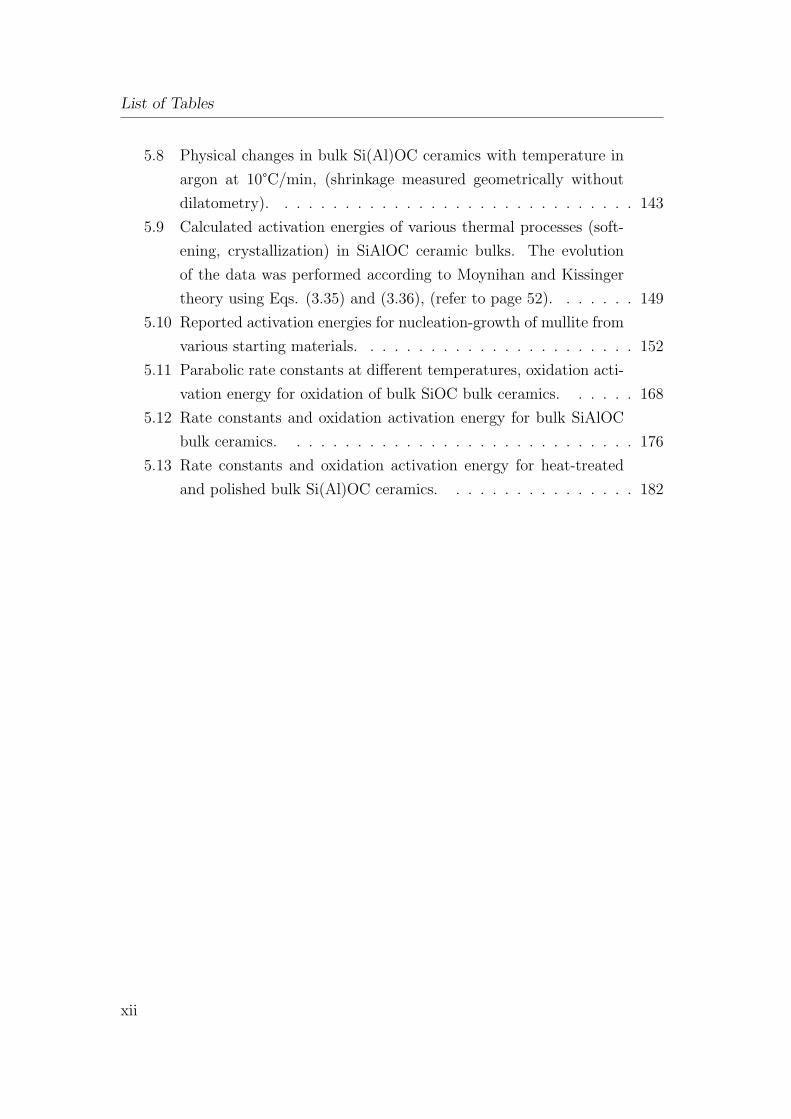
List of Tables
5.8 Physical changes in bulk Si(Al)OC ceramics with temperature in
argon at 10°C/min, (shrinkage measured geometrically without
dilatometry). . . . . . . . . . . . . . . . . . . . . . . . . . . . . . 143
5.9 Calculated activation energies of various thermal processes (soft-
ening, crystallization) in SiAlOC ceramic bulks. The evolution
of the data was performed according to Moynihan and Kissinger
theory using Eqs. (3.35) and (3.36), (refer to page 52). . . . . . . 149
5.10 Reported activation energies for nucleation-growth of mullite from
various starting materials. . . . . . . . . . . . . . . . . . . . . . . 152
5.11 Parabolic rate constants at different temperatures, oxidation acti-
vation energy for oxidation of bulk SiOC bulk ceramics. . . . . . 168
5.12 Rate constants and oxidation activation energy for bulk SiAlOC
bulk ceramics. . . . . . . . . . . . . . . . . . . . . . . . . . . . . 176
5.13 Rate constants and oxidation activation energy for heat-treated
and polished bulk Si(Al)OC ceramics. . . . . . . . . . . . . . . . 182
xii
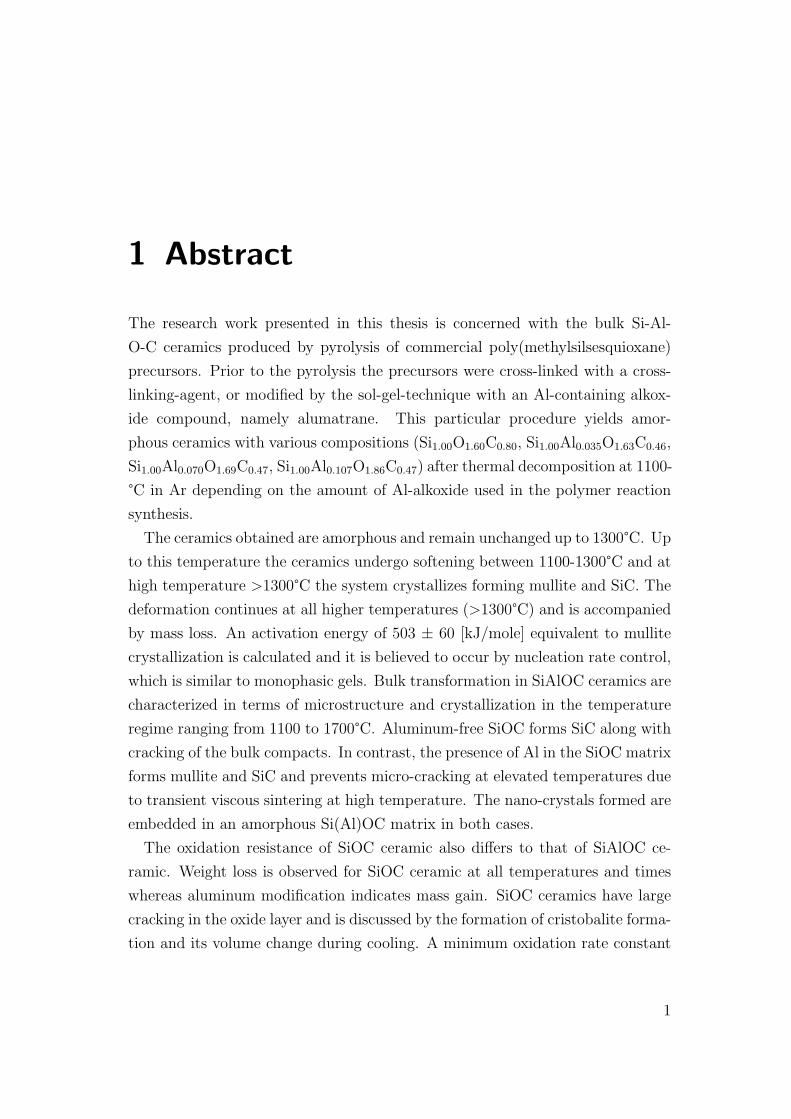
1 Abstract
The research work presented in this thesis is concerned with the bulk Si-Al-
O-C ceramics produced by pyrolysis of commercial poly(methylsilsesquioxane)
precursors. Prior to the pyrolysis the precursors were cross-linked with a cross-
linking-agent, or modified by the sol-gel-technique with an Al-containing alkox-
ide compound, namely alumatrane. This particular procedure yields amor-
phous ceramics with various compositions (Si1.00O1.60C0.80, Si1.00Al0.035O1.63C0.46,
Si1.00Al0.070O1.69C0.47, Si1.00Al0.107O1.86C0.47) after thermal decomposition at 1100-
°C in Ar depending on the amount of Al-alkoxide used in the polymer reaction
synthesis.
The ceramics obtained are amorphous and remain unchanged up to 1300°C. Up
to this temperature the ceramics undergo softening between 1100-1300°C and at
high temperature >1300°C the system crystallizes forming mullite and SiC. The
deformation continues at all higher temperatures (>1300°C) and is accompanied
by mass loss. An activation energy of 503 ± 60 [kJ/mole] equivalent to mullite
crystallization is calculated and it is believed to occur by nucleation rate control,
which is similar to monophasic gels. Bulk transformation in SiAlOC ceramics are
characterized in terms of microstructure and crystallization in the temperature
regime ranging from 1100 to 1700°C. Aluminum-free SiOC forms SiC along with
cracking of the bulk compacts. In contrast, the presence of Al in the SiOC matrix
forms mullite and SiC and prevents micro-cracking at elevated temperatures due
to transient viscous sintering at high temperature. The nano-crystals formed are
embedded in an amorphous Si(Al)OC matrix in both cases.
The oxidation resistance of SiOC ceramic also differs to that of SiAlOC ce-
ramic. Weight loss is observed for SiOC ceramic at all temperatures and times
whereas aluminum modification indicates mass gain. SiOC ceramics have large
cracking in the oxide layer and is discussed by the formation of cristobalite forma-
tion and its volume change during cooling. A minimum oxidation rate constant
1
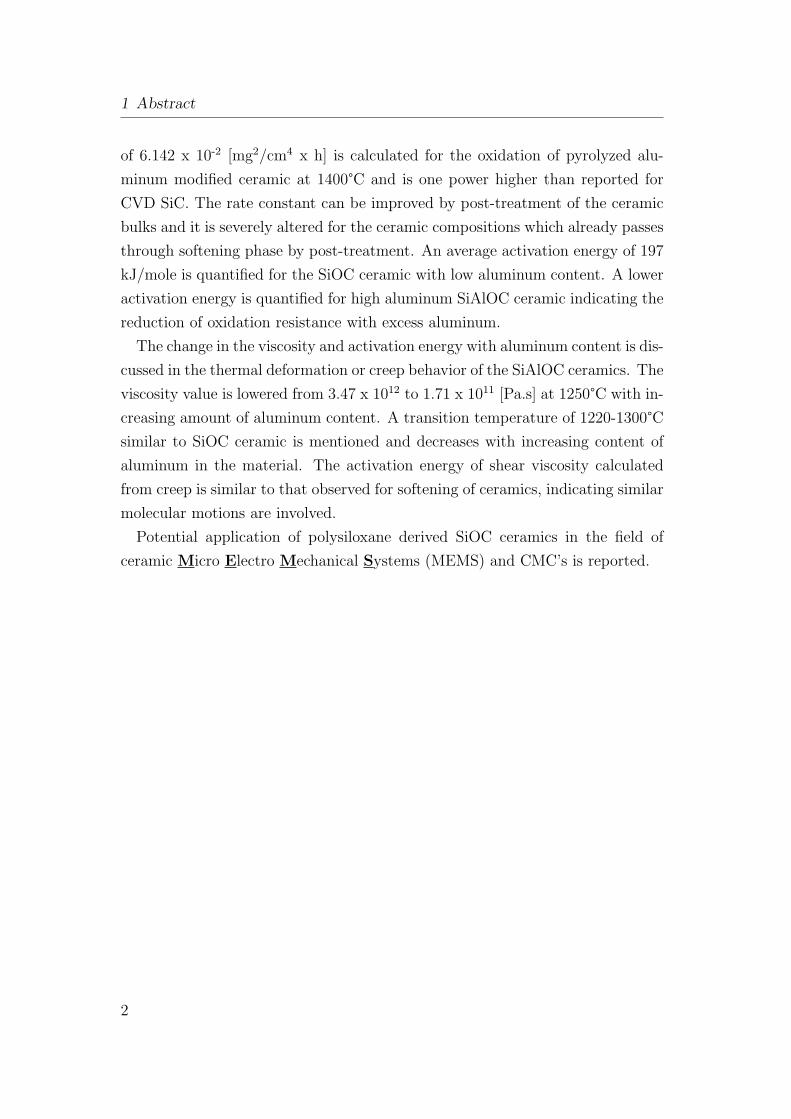
1 Abstract
of 6.142 x 10⁻² [mg2/cm4 x h] is calculated for the oxidation of pyrolyzed alu-
minum modified ceramic at 1400°C and is one power higher than reported for
CVD SiC. The rate constant can be improved by post-treatment of the ceramic
bulks and it is severely altered for the ceramic compositions which already passes
through softening phase by post-treatment. An average activation energy of 197
kJ/mole is quantified for the SiOC ceramic with low aluminum content. A lower
activation energy is quantified for high aluminum SiAlOC ceramic indicating the
reduction of oxidation resistance with excess aluminum.
The change in the viscosity and activation energy with aluminum content is dis-
cussed in the thermal deformation or creep behavior of the SiAlOC ceramics. The
viscosity value is lowered from 3.47 x 10¹² to 1.71 x 10¹¹ [Pa.s] at 1250°C with in-
creasing amount of aluminum content. A transition temperature of 1220-1300°Csimilar to SiOC ceramic is mentioned and decreases with increasing content of
aluminum in the material. The activation energy of shear viscosity calculated
from creep is similar to that observed for softening of ceramics, indicating similar
molecular motions are involved.
Potential application of polysiloxane derived SiOC ceramics in the field of
ceramic Micro Electro Mechanical Systems (MEMS) and CMC’s is reported.
2
2 Introduction & Motivation
In the modern world where things are changing at a incredible rate a good support
from the development of new materials with easy processing to replace existing
materials is of prime importance. For example in the automobile industry (for
high temperature engine component applications) more emphasis in the present
time is on searching new materials, mainly advanced ceramics to replace the
metals. In the last decades ceramics did replace metals in some high temperature
application areas but its high processing costs made the industry difficult to
accept them. Indeed, it opens an area of research and development of these
ceramic materials from cheap raw materials and making them suitable for mass
production and reduce the processing costs by near-net-shape formation.
In recent years, material scientists have made significant efforts to develop
alternative techniques for the fabrication of ceramics. Of these techniques, the
use of preceramic polymer is one of the most promising methods in terms of
net-shape forming of high temperature ceramics and ceramic composites. Gen-
erally, preceramic polymers can be defined as organometallic polymers which py-
rolyze to ceramics upon thermal treatment. Suitable precursor polymers for high
performance ceramics are based on cross-linked poly(silanes), -(carbosilanes), -
(silazanes), -(siloxanes) and molecular mixtures thereof. Some components from
the automobile engine or thermal-elements from furnaces or thermocouples can
be prepared from polymer derived ceramic route and required properties can be
obtained/optimized from proper filler mixtures. The filler material can modify
the composite properties like: electrical conductivity, oxidation resistance, high-
temperature deformation resistance. The polymeric material in this case initially
acts as a binder material (but in large volume fraction) to fillers and generate
a stable shape, which can withstand handling. After thermal treatment due
to decomposition process the polymeric material is converted to the inorganic
ceramics with the final composition dependent on the initial chemistry of the
3
2 Introduction & Motivation
polymer. Although techniques for polymer preparation can be complex, through
careful control of synthesis parameters, polymer compositions and structures can
be tailored to yield the desired ceramic upon pyrolysis.
In the last decade many polymers are available commercially but many poly-
mers mentioned above have problem in handling as they are very sensitive to
atmosphere. Among all the above mentioned polymers poly(siloxanes) are avail-
able easily and are cheap in cost and can be converted to silicon oxycarbide
(SiOC) ceramic by thermal pyrolysis treatment. Poly(siloxane) polymer can be
handled in air and are available in both liquid, semi-solid (viscous) as well as
solid (powder) form. Among all available polymers a proper selection should be
done which satisfies the require processing properties. For example, if the poly-
mer is in the liquid state at room temperature it can be easily injected in the
mold cavity to form a component but as soon as it reaches the cavity it should
possess property to cross-link and retain the mold shape. This cross linking can
be done thermally (vinyl, phenyl end groups containing polymers) or with hy-
drolysis and condensation reaction in presence of cross-linking-agent. But if the
polymer itself is in the powder or solid state it must be initially meltable and
should have cross-linking behavior.
Synthesis and characterization of SiOC ceramic material from polymer py-
rolysis route is a main focus in the past decade. Researchers modified these
materials by aluminum, boron, zirconium to yield Si-Al-O-C, Si-B-O-C, Si-Zr-
O-C ceramics and much of the research was aimed for the synthesis, structural
characterization and crystallization behavior for these materials. As such, no
paper directly reports further properties at high temperature namely, oxidation
resistance, time dependent thermal deformation or creep, crystallization kinetics
etc. The present research is hence focused on the following points:
1. Search for different available poly(siloxane) polymer in market and initial
characterization of these polymers for process feasibility. This character-
ization was done by keeping in mind that the polymer or polymer-filler
mixture will be used in an injection molding device for component prepa-
ration. Accordingly, rheology was the best tool to investigate the physical
changes in the material with temperature and will be reported.
2. Modify the polymer with aluminum using cheap commercial chemicals to
4
form Si-Al-O-C ceramic system. Aluminum can be incorporated in two
different ways: First, in metal form to obtain a composite material; here
aluminum reacts with the polymer decomposition product or its compo-
nents to form stable inorganic compound or remain unreacted in molten
metal form after thermal treatment. The second is in molecular level using
a chemical reaction route.
3. Optimize the green and ceramic body formation without generating cracks
during any stage of processing. In this the parameters like temperature,
pressure, heating rates, holding times, identifying mass loss regions plays
key role.
4. Investigating the polymer-to-ceramic transformation process.
5. Characterization of transformed ceramic: chemical, physical or dimensional
changes during transformation, phase development of the material after
pyrolysis, effect of high temperature on the phase generation.
6. Investigate the bulk material properties by softening/crystallization kinet-
ics, oxidation kinetics and by creep test at high temperature.
7. Examine the material for new applications namely MEMS, CMC’s. More
emphasis will be given on formation of very small scale components. For-
mation of various CMC’s are not investigated by the author himself but
will be briefed from the reports investigated by other members involved on
the above system as a part of the whole project.
Researchers report that modification of SiOC ceramic system with elements
like Al, B etc., upgrades the properties. The present research hence look into
this system in more depth and only concern with the modification by aluminum
and investigate its positive or negative effects on certain high temperature prop-
erties. The main advantage of this research is to provide materials for all those
industries who produce/develop components for high temperature applications,
against corrosive/oxidative environments as well as where electrical properties is
also a concern (contuctivity/resistance) at temperatures as high as 1300°C.
It is a well known fact that not all modifications produce positive results and
their controlled used are sometimes beneficial for optimize material properties.
5

2 Introduction & Motivation
Improving one property may or may not damage the other. Inspite, researchers
should always look forward to use the advantages and reduce the drawbacks by
proper optimization.
6
3 Literature Review
3.1 Ceramics from Pyrolysis of Preceramic
Polymers
The importance of high performance, oxide and non-oxide ceramic material such
as SiC, Si3N4, B4C, BN, AlN, TiC and TiN, coupled with limitations associated
with conventional processing techniques have focused increased attention on man-
ufacturing ceramics and ceramic matrix composites (CMC’s) via the pyrolysis of
preceramic polymers.(1),(2) Additional investigations show that a variety of other
compounds such as AlB12, CaB6, TiC, BP, TiB2, SiB6, TiN, and TiSi12 can be
produced from polymers.(3) The typical processing scheme involves adjustment
of the molecular weight of the polymer (synthesis and purification), shaping of
the product (e.g., fiber spinning, warm pressing), cross linking of the product
(annealing in oxidative atmosphere; chemical catalyst, chlorosilane cross linking;
micro-wave, electron, or γ-ray radiation curing; etc.), and finally, pyrolysis in an
inert- or reactive - (e.g., NH3) gas atmosphere at temperatures typically between
1000°C and 1400°C.
The pyrolysis mechanism generally involves several distinct steps:
1. An organometallic-to-inorganic transition between 500°C and 800°C, lead-
ing to an amorphous hydrogenated solid built on tetrahedral structures of
the type Si(CaObNcBd), depending on the polymer composition.
2. Nucleation of crystalline precipitations - such as SiC, Si3N4, or SiO2 - and
an additional carbon phase at temperatures between 1200°C and 1600°C.
3. Grain coarsening that results in consumption of the residual amorphous
phase and reduction of oxygen content due to the probable evaporation of
SiO and CO.
7
3 Literature Review
Active research in preceramic polymer technology was promoted by the pressing
need for new materials that could serve as replacements for metals and metal-
lic alloys in demanding structural applications, particularly in the defence and
aerospace industry, where metals and metallic alloys were no longer suitable.
Advanced ceramic and ceramic matrix composite materials have potential in
applications such as advanced heat engines, high efficiency turbine and diesel
engines, and high-specific impulse engines, where the need exists for lightweight
structural materials with high temperature performance and environmental sta-
bility better than metals. A variety of other applications for ceramics prepared
by polymer pyrolysis also exists. Precisely, foams as heater-heat exchangers, in-
sulation, and filters should be of interest. Use of polymer pyrolysis to produce
coatings may also have a variety of applications for wear oxidizing and corro-
sive chemical environments. Polymer pyrolysis may also provide a method of
ceramic-ceramic or ceramic-metal joining, provided shrinkage problems can be
overcome.(1)
To replace existing materials, the new generation of materials need to possess
exceptional properties which include: thermal stability at elevated temperature
(>1200°C), higher fracture strength, higher fracture toughness, better oxidation
resistance, and better thermal shock resistance, to name the few. Initially, the
outstanding properties of carbon-carbon composites, such as superior strength
and thermal stability, made them a viable substitute for metals and metallic al-
loys; however, their poor oxidation resistance limited their use at higher temper-
ature. Improvement in oxidation resistance was achieved by infiltrating carbon
preforms with preceramic polymer and subsequent transformation to ceramic
yielding improvement in properties particularly, oxidation resistance. Simulta-
neously, work was launched for producing inorganic fibers by new processing
techniques from the preceramic polymers which possess high temperature stabil-
ity, oxidation resistance and strength retention. As a result, researchers focused
their efforts on the synthesis and pyrolysis of inorganic polymers to produce ce-
ramic materials which exhibits superior high temperature properties relative to
carbon-carbon composite materials. Due to their potential for excellent high
temperature properties, silicon based materials namely, silicon carbide and sili-
con nitride and combination of phases from Si, C, N, B, O were of immediate
interest and as a result, the initial focus was on the synthesis and pyrolysis of
8
3.1 Ceramics from Pyrolysis of Preceramic Polymers
organosilicon and inorganic silicon polymers.
The formation of ceramics from polymer pyrolysis can be traced back to the
early work of Ainger and Herbert in 1960 and Chantrell and Popper(4) in 1967.
They were the first to suggest that inorganic polymers might serve as precursors
to ceramics; however, the first practical conversion of organo-silicon compounds
to non-oxide materials was developed by Verbeek, Winter, and Mausmann(5),(6)
in the early 1970’s. In the laboratories of Bayer AG, Verbeek manufactured
β-SiC fibers containing minor amounts of α-SiC and β-Si3N4 by pyrolysis of a
carbosilazane polymer at 1800°C in an inert atmosphere. The carbosilazane resin
was produced from condensation of CH3Si(NHCH3) in the presence of H2SO4.
The resin was melt spun at 220°C and heated in air at 100°C for 20 h to produce
infusible fibers which would be pyrolyzed. In a variation of their process, Ver-
beek and co-workers synthesized poly(methylsilsesquiazanes), which were dry-
spun (with poly(ethylene) oxide as a spinning aid) to produce poly(silazane)
fibers. These fibers were subsequently pyrolyzed in nitrogen at 1200°C to pro-
duce silicon carbonitride fibers.
Although Verbeek and Winter also developed a preceramic polymer process for
production of SiC fibers, much of the credit for development of the production
of SiC fiber is attributed to Yajima et al.(7),(8),(9) in the late 1970’s. Yajima et
al. intensively investigated the pyrolysis of poly(carbosilanes) to form SiC fibers.
The subsequent production of SiC fibers by Nippon Carbon Co. was a major
factor in generating interest in the field.
Since the early work of Verbeek and Yajima, significant improvements in pre-
ceramic polymer synthesis techniques have resulted in the development of a great
variety of organosilicon polymers that have been used to produce ceramic prod-
ucts in the Si-C-N-B-O system. Polymer pyrolysis synthesis was successfully
implemented for production of SiC, Si3N4, BN, B4C. More recently, mixtures of
Si-C-N, Si-B-C, Si-B-C-N suggest wide possibility of forming mixed products for
various combined properties.(10), (11), (12), (13)
One of the early application of polymer pyrolysis to noncarbon ceramics was
the formation of SiO2-based materials using silicone polymers. However, the
diverse array of other methods of processing SiO2 materials has restricted the
use of SiO2 preceramic polymers. Other emerging processes for making SiO2-
based materials include sol-gel technique, which are related to polymer pyrolysis
9
3 Literature Review
and are also of increasing interest for other oxide ceramics. Another particular
oxide based ceramic of technological interest is mullite which comes under alu-
minosilicate group. Sol-gel methods have been employed widely in the synthesis
of mullite either through boehmite (AlOOH) and TEOS (tetraethylorthosilicate)
or through Al(NO3)3 and TEOS mixtures.(14) Researchers also tried to synthe-
size aluminosiloxanes by polymerization reaction between silicon and aluminum
monomers.(15) Polymer pyrolysis route used provide atomic scale mixing of differ-
ent species which favor mullitization at lower temperatures. Small-scale mulliti-
zation is driven by diffusion of the aluminum moiety into a siliceous matrix until
the critical concentration required for mullite nucleation is achieved. The discus-
sion focused above indicate the usefulness of polymer pyrolysis in synthesizing
oxide and nonoxide ceramic materials with higher homogeneity.
The usefulness of preceramic polymers as precursors to low dimensional prod-
ucts such as fibers and thin films, has been well recognized.(1) However, the
applications of preceramic polymers to fabricate dense ceramic matrices and
monolithic bodies are still limited. Loss of volatiles during polymer pyrolysis
leads either to high amounts of residual porosity or to large shrinkages due to
substantial differences in density between the starting polymer precursor and
the final ceramic product. Typical polymer densities are ∼1 g/cm3, while densi-
ties of the pyrolyzed product can range from ∼2 to ∼6 g/cm3.(16) This density
difference often results in linear shrinkages in excess of 30% during pyrolysis.
Furthermore, if structural changes in the polymer derived phase cannot be re-
laxed by either viscous flow or diffusional processes, extensive cracking and pore
formation generally destroy the integrity of the component.
3.2 Advantages over Conventional Fabrication
Methods
The preceramic polymer route numerous advantages over conventional processing
methods. These include the following:
• processing versatility, e.g., plastic forming ability
• lower temperature processing
10
3.3 Synthesis and Chemistry of Preceramic Polymers
• high purity
• preparation of metastable phases typically un-achievable by conventional
methods
• Near-Net shape processing capability
3.3 Synthesis and Chemistry of Preceramic
Polymers
Since the focus of this thesis is not on the synthesis of the preceramic polymers,
but rather on utilizing preceramic polymer technology to develop new ceramic
system, only a brief and basic review of synthesis techniques will be presented.
Furthermore, the focus of the literature review will be on synthesis of silicon
based preceramic polymers with further emphasis on poly(siloxanes).
The actual chemical structure, molecular size, and molecular size distribution
of an organosilicon polymer are determined by the nature of the starting reagents
and their processing parameters; however, in general, chloro-organosilicon com-
pounds, e.g., dichlorodimethylsilanes and trichloromethylsilanes, are employed as
precursors to manufacture silicon containing preceramic polymer. Chlorosilanes
are commonly formed as by-products in the silicone industry; hence, they are
relatively inexpensive and readily available. Most silicones are produced from
a process utilizing the Rochow reaction which allows for the direct reaction of
organic halides with silicon metal in the presence of an electron-transfer catalyst
(usually copper). Although dimethyldichlorosilane is the predominant reaction
product, methyltrishlorosilane and trimethylchlorosilane are also produced in
smaller quantities.
The basic reaction employed to produce preceramic polymers is similar to the
Wurtz synthesis reaction which essentially involves dechlorination of mixtures of
various chlorinated silane monomers in the presence of catalyst.(17) A variety of
preceramic polymers can be synthesized utilizing the reaction (1), (3) which include
poly-(silanes), -(carbosilanes), -(silazanes), -(borosilazanes), -(silsesquioxanes)
11
3 Literature Review
and -(carbosiloxanes).
xMe2SiCl2 + 2xNa −→ (Me2Si)x + 2xNaCl (3.1)
(Me2Si)x + heat (350°C) −→ (MeHSiCH2)x (3.2)
(MeHSiCH2)x + air −→ (MeO1/2SiCH2)x (3.3)
(MeO1/2SiCH2)x + heat (1200°C) −→ SiC (3.4)
Metallorganic compounds in monomeric, oligomeric, or polymeric forms have
been employed for production of non-oxide ceramic materials since 1960; how-
ever, it was only after the work of Yajima et al. that the preceramic polymer
field was extensively studied and further developed. Yajima et al.(8) in 1975 was
the first to prepare SiC containing ceramic fibers from a polymeric precursor.
Their process, shown as Eq. (3.1-3.4), is based on permethylpoly(silanes), pro-
duced from dimethyldichlorosilanes by a Wurtz coupling reaction with sodium
[reaction (3.1)]. Thermal decomposition of the permethylpoly(silanes) at 350°C,
catalyzed by 3 to 5% poly(borodiphenylsiloxane), yield a poly(carbosilane) [re-
action (3.2)]. The poly(carbosilane) is fabricated to remove both higher and
lower molecular weight fractions. The mid-range fraction, with a number aver-
age molecular weight of 1000 to 2000, is considered to possess properties suitable
for melt spinning into 10 to 20 µm diameter fibers. The fibers are cross-linked
by oxidation of Si-H bonds by heating in air at ∼110 to 190°C [reaction (3.3)]
and finally pyrolyzed at ∼1200°C in an inert atmosphere to produce SiC fibers
[reaction (3.4)].
According to Whitmarsh and Interrante, Yajima’s original polymer contained
twice the stoiciometric amount of carbon and was treated with various cross-
linking agents that introduce contaminants. This resulted in a final pyrolysis
product that contained significant amount of excess carbon and silica which
greatly degraded the high temperature performance of the fibers. Consequently,
since the early work of Yajima, a variety of polymers have been synthesized and
pyrolyzed with the intend of obtaining high yield precursors to pure SiC fibers.
12
3.3 Synthesis and Chemistry of Preceramic Polymers
Examples of such includehe following: poly(silanes),(1), (3), (18), (19) poly(carbosilan-
es),(1), (3), (18), (19), (20) poly(silastyrenes)(1), (3) and copolymers derived from disi-
laryls, vinylsilanes, allylsilanes. A description of the synthesis processes for these
precursors will not be given; however, it is important to recognize that the bulk
of the starting reagents for a majority of the precursors mentioned above were
chlorosilanes or derivatives thereof.
Most polymeric precursors for SiC, possess either a Si-Si poly(silane) or Si-
C poly(carbosilane) backbone. Basic differences in the precursors arises from
differences in chemical structure, e.g., linear, branched, or cyclic, and the nature
of functional side groups attached to the polymeric backbone, e.g., phenyl, vinyl,
methyl, or hydrogen. The structure and the nature of the functional side groups
have been shown to significantly affect the polymer’s ceramic yield as well as
the free carbon content in resulting pyrolysis product. For example, Carlsson
et al.(18) discovered that by substituting methyl groups for phenyl groups on a
poly(silane), the ceramic yield of the polymer decreased from ∼75 wt.% to 30
wt.%, while the SiC yield (percent of ceramic yield constituted by SiC) increased
from ∼0.8% to ∼13.7% (extremely low yields).
Simple variation in synthesis parameters are often employed to manufacture
precursors to other important ceramic material which includes silicon nitride and
boron nitride; however, the starting reactants are again almost always organo-
chlorosilanes. For example, reacting dichlorosilanes or organotrichlorosilanes
with ammonia, shown as reactions (Eqs.3.5−3.6) below, result in silazane or
organosilsesquiazanes (Si-N-Si backbone) polymers, which after pyrolysis at 1200°Cled to form silicon nitride or a mixture of silicon carbide and silicon nitride.(21)
H2SiCl2 + xNH3 −→ (H2SiNH)x + NH4Cl (3.5)
RSiCl3 + xNH3 −→ [RSi(NH)3/2]x + NH4Cl (3.6)
Examples of precursors to ceramic products other than SiC, which have achieved
significance, include the following: vinlylitic poly(silane),(22) poly(silazanes) from
[H2SiNCH3],(23) poly(silazanes) from [SiHCl3],
(24) and hydridopoly(silazanes),(25)
for Si3N4; poly(silazanes) from [CH3SiHCl2] for Si3N4/SiC, poly(iminoalanes) for
13
3 Literature Review
AlN, and borosilazanes for BN.(26)
Employing chlorosilane with variable molar functionalities (f), such as triethyl-
chlorosilane where f = 1 or dimethyldichlorosilane where f = 2, allows for modi-
fication of polymer structures to form linear to highly branched polymers. Such
synthesis versatility can be used to tailor certain important precursor properties,
such as viscosity and solubility. Furthermore, through careful control of synthe-
sis parameters, ceramic yields of the polymer can be improved, where polymers
with yields in excess of 70 wt.% are considered to be of particular interest for
the manufacture of monolithic ceramics. Most polymers that possess an in-
organic backbone contain substituents on some or all of the backbone atoms.
The substituents are usually hydrogen or organic groups, but can be of other
types. During pyrolysis, these substituents are either incorporated into the ce-
ramic product or evolved as volatiles. Obviously, the higher the ceramic yield,
the smaller the quantity of evolved volatiles during pyrolysis. If a large quan-
tity of volatiles are evolved over a narrow temperature range during pyrolysis,
cracking or rupture of the ceramic product may occur. Thus high ceramic yields
are important not only economically, but also in compensating for significant
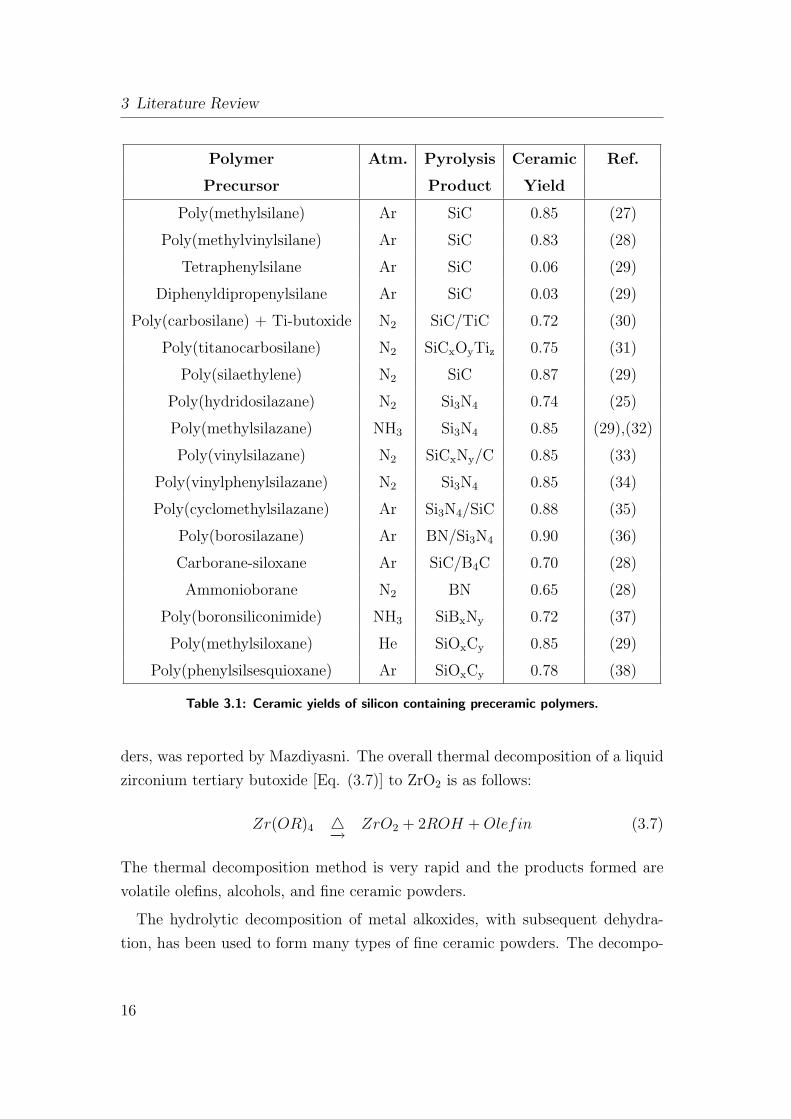
density changes in going from polymer to ceramic. Table: 3.1 lists the ceramic
yields of several important organosilicon polymers currently being employed to
manufacture silicon-containing ceramics.
Little is known of the chemical processes by which polymers are converted to
ceramics. IR, thermal gravimetric analysis (TGA), and x-ray data have been
used to study the gross features of the conversion process. Considering the com-
plex polymer structures that serve as precursors, and the even more complex,
amorphous, intractable structures that are intermediates in the pyrolysis pro-
cess, it is clear that mechanistic studies pose a formidable challenge. Despite a
lack of detailed chemical knowledge, some trends with respect to structure/yield
relationship on unconfined pyrolysis are summarized by Wynne and Rice.(1)
1. Linear polymers give negligible ceramic yield because of reversion reactions,
i.e. the generation of large, volatile molecules and cyclics. This feature is
particular clear for polymers with Si-Si, Si-C, and Si-C-N backbone struc-
tures.
2. Polymer structures containing rings (or cages) give good ceramic yields.
14
3.3 Synthesis and Chemistry of Preceramic Polymers
Ring or cage structures slow the kinetic of reversion reactions, as the liber-
ation of relatively large, volatile molecular fragments (e.g. cyclics), which
are responsible for rapid weight loss, is sterically hindered and requires mul-
tiple chemical bonds rupture. However, solid state cross-linking necessary
for preceramic structure buildup, which involves localized reactions and
the evolution of smaller molecules H2, HCl, CH4), proceeds continuously.
Carborane siloxane polymer give high ceramic yields (Table: 3.1) because
of the presence of the 12-atoms C2B10 cage in the polymer microstructure.
3. Branched-ring polymer structures give high ceramic yields. The combina-
tion of branched and ring structures markedly slows the kinetics of reversion
reactions, and most successful preceramic polymers developed thus fall into
this category.
Apart from nonoxide ceramics, oxide ceramics represents a separate class in
engineering ceramics. A brief overview will be given of the past utilization of
metal-organics in producing fine-powder derived monolithic ceramics and sol-gel
derived ceramics.
Several classes of metal-organic compounds can be converted into oxide ceramic
materials: metal alkoxides, M(OR)n, M(HCOO)n, M(CH3COCHCOCH3)n, M(Cx-
H2x+1)n, M(OCOCxH2x+1)n. Of these metal-organic compounds, the metal alkox-
ides and the metal acetates are more frequently utilized in forming ceramic ma-
terials.
Roy et al. recognized the usefulness and flexibility provided by the hydro-
thermal decomposition of metal-organic precursors for forming ceramics. Mazdi-
yasni et al. utilized several metal alkoxides for synthesizing various types of
submicron particle size ceramic powders and monolithic ceramics. Most metal-
organic compounds are very sensitive to moisture, heat, and light. These con-
ditions necessitate the need for controlled atmospheres and very clean reaction
equipment for the synthesis of metal alkoxides. Exposure of most alkoxides to
moisture and/or heat causes a decomposition of the alkoxide, and thus provides a
method for forming fine ceramic materials. A few examples for decomposing the
metal-organic compounds are thermal decomposition, hydrolytic decomposition,
and flame spray decomposition.
The direct pyrolysis of the metal alkoxides, which form very fine ceramic pow-
15
3 Literature Review
Polymer Atm. Pyrolysis Ceramic Ref.
Precursor Product Yield
Poly(methylsilane) Ar SiC 0.85 (27)
Poly(methylvinylsilane) Ar SiC 0.83 (28)
Tetraphenylsilane Ar SiC 0.06 (29)
Diphenyldipropenylsilane Ar SiC 0.03 (29)
Poly(carbosilane) + Ti-butoxide N2 SiC/TiC 0.72 (30)
Poly(titanocarbosilane) N2 SiCxOyTiz 0.75 (31)
Poly(silaethylene) N2 SiC 0.87 (29)
Poly(hydridosilazane) N2 Si3N4 0.74 (25)
Poly(methylsilazane) NH3 Si3N4 0.85 (29),(32)
Poly(vinylsilazane) N2 SiCxNy/C 0.85 (33)
Poly(vinylphenylsilazane) N2 Si3N4 0.85 (34)
Poly(cyclomethylsilazane) Ar Si3N4/SiC 0.88 (35)
Poly(borosilazane) Ar BN/Si3N4 0.90 (36)
Carborane-siloxane Ar SiC/B4C 0.70 (28)
Ammonioborane N2 BN 0.65 (28)
Poly(boronsiliconimide) NH3 SiBxNy 0.72 (37)
Poly(methylsiloxane) He SiOxCy 0.85 (29)
Poly(phenylsilsesquioxane) Ar SiOxCy 0.78 (38)
Table 3.1: Ceramic yields of silicon containing preceramic polymers.
ders, was reported by Mazdiyasni. The overall thermal decomposition of a liquid
zirconium tertiary butoxide [Eq. (3.7)] to ZrO2 is as follows:
Zr(OR)4 4−→ ZrO2 + 2ROH +Olefin (3.7)
The thermal decomposition method is very rapid and the products formed are
volatile olefins, alcohols, and fine ceramic powders.
The hydrolytic decomposition of metal alkoxides, with subsequent dehydra-
tion, has been used to form many types of fine ceramic powders. The decompo-
16
3.3 Synthesis and Chemistry of Preceramic Polymers
sition of the metal-organic is initiated via the hydrolytic reaction of the water
with subsequent thermal dehydration of the resulting precipitates. The general
decomposition is described as a two-step process:
Hydrolysis
M(OR)n + nH2O −→M(OH)n + nR(OH) (3.8)
Dehydration
M(OH)n −→MOn/2 +n
2H2O (3.9)
These reactions usually occur below 600°C and results in the formation of
very fine ceramic particulates, i.e., 2−5 nm. This method has been used to
make high-purity submicron sized oxides from several metal alkoxides. Flame
hydrolysis of metal-organic precursors, used for the formation of many oxides
from metal halides, involves the direct oxidation of a metal-organic compound in
gas oxygen flame. For example:
Si(CH3)4 + 8O2 −→ SiO2 + CO2 +H2O (3.10)
Metal-organics are also used in the field of sol-gel processing of ceramics. There
are two general ceramic processing methods.
Method one: The colloidal process method is based on the use of surface chem-
istry for suspending ultrafine particles in a solution to form a colloidal sol. The
subsequent formation of a cross-linked particulate network induces the gellation
of the sol suspension. The gel material can then be dried to form a porous
ceramic body which may then be densified by sintering.
Method two: The metal-organic polymerization method utilizes the reactivity
of metal-organic precursors. The metal-organic precursors are polymerized by
controlled hydrolysis which results in the formation of a cross-linked amorphous
gel. These gelled materials can also be dried and sintered into ceramic bodies.
17
3 Literature Review
3.4 Silicon Oxycarbide: General
Silicon oxycarbide is a term used to denote the chemical structure in which silicon
is simultaneously bonded with carbon and oxygen. These tetrahedral network
species can be generally described as [SiCxO4-x] where x = 1, 2, or 3. The
incorporation of carbon in silicate glasses presents the possibility of replacing
some oxygen, which is only two-coordinated, with carbon which can be four-
coordinated. This increased bonding per anion is expected to strengthen the
molecular structure of the glass network, and thereby, to improve the thermal
and mechanical properties.
Attempts to manufacture silicon oxycarbide glasses can be traced back to the
1950’s when Ellis was one of the first to attempt incorporation of carbon into
glass.(39) Ellis infiltrated porous VycorTM glass with aqueous solutions of carbo-
hydrates and subsequently heated the body in an inert atmosphere at 1200°Cto decompose the carbohydrate to carbon. The presence of carbon in the inter-
connected porosity of the glass made the body electrically conductive. The low-
temperature resistivity of the glass was found to depend on the amount, size and
shape of the carbon particles. Smith and Crandall,(40) hot-pressed a mixture of
fine colloidal silica and carbowax at 1000-1150°C and 2000 psi to obtain a dense
mass of glass containing 1.2 wt.% carbon. This glass, wherein the carbon was
“physically inseparable and microscopically indistinguishable from silica”, was
found to exhibit a greater resistance to devitrification and a higher viscosity than
pure vitreous silica. This result was significant because the usefulness of fused
silica is limited at temperatures over 1000°C due to the formation of cristobalite.
Elmer and Meissner(41) incorporated carbon into porous (high-silica) glasses by
impregnation with furfuryl alcohol and heat treatment in nitrogen at 1250°C. A
marked increase in the annealing point was observed as a result of carbon incor-
poration. This increase was attributed to the removal of hydroxyl group from
the porous glass by carbon.
Homeny et al.(42) used SiC as the carbon source and synthesized glasses con-
taining up to 2.5% carbon in the Mg-Al-Si-O-C system by melting at 1750-1800°Cunder nitrogen. Due to the high temperature melting and consequent loss of CO,
CO2, and SiO gases, the final compositions were difficult to control. The synthe-
sized glasses were shown to be homogeneous (except for a few metallic inclusions)
18
3.4 Silicon Oxycarbide: General
and free of crystallites by X-ray diffraction and electron microscopy examina-
tion. The Mg-Al-Si-O-C glasses showed an increase in density, Young’s modulus,
Shear modulus, Vicker’s hardness and fracture toughness with increasing carbon
content. Coon(43) studied the effect of silicon carbide additions on the crystal-
lization behavior of a Mg-Li-Al-Si-O glass. SiC was mixed into a Mg-Li-Al-Si-O
glass melt and then the black glass was heat treated to study its crystallization
behavior. The carbon containing glass was found to be much more refractory
than the parent glass.
In all these studies of carbon-containing glasses, separate sources for silica and
carbon were mixed and pyrolyzed at high temperature to allow them to react
to yield intimate mixture of the two phases. There was no verification of car-
bon substitution in the glass network in any of these studies. In fact, the early
products can be best described as “black glasses”, which contains second phase
dispersions of elemental carbon. In these studies, the property changes supported
the idea of a silicon oxycarbide structure, but it is also possible that reduction
or dehydroxylation of the glass (by the carbon additions) caused the property
variations. By comparison, according to Zhang and Pantano,(44) true silicon oxy-
carbide glasses should be homogeneous glasses where carbon and oxygen atoms
share bonds with silicon in an amorphous, continuous network structure.
It is also important to point out that there are no known thermodynamically
stable phases of silicon oxycarbide. This is in contrast to the situation with silicon
oxynitride glasses where there exists the equilibrium crystalline phase Si2N2O.
This probably accounts for the greater ease of melt synthesis of silicon oxynitride
glasses. Nevertheless, the existence of amorphous, metastable silicon oxycarbide
phases has been confirmed in a number of studies.
In a study of the oxidation product of SiC, Pampuch et al.(45) obtained evi-
dence for the existence of a ternary SiOC phase situated between the silica layer
and the SiC. The SiC powder was cleaned with HF solution, and was then sub-
jected to varying degrees of oxidation conditions in the temperature range of 675
to 1775 K. The solid oxidation products were analyzed using SEM, X-ray pho-
toelectron spectroscopy (XPS), infrared spectroscopy and X-ray microanalysis.
The presence of a considerable amount of SiOC phase was indicated by all the
analytical methods. An extra Si-2p peak, with binding energy higher than that
of the Si-2p peak of SiC but lower than that of the Si-2p peak in SiO2, was found
19
3 Literature Review
in samples heat treated below 1575 K. The additional peak was claimed to be due
to the formation of SiOC phase. The infrared spectra showed some unique peaks,
and suggested that this ternary phase was present at intermediate stages of ox-
idation of SiC, and was not stable above oxidation temperatures of 1400- 1500
K. More recently Yurkov and Polyak (46) re-examined the oxide/silicon-carbide
interface and confirmed the formation of silicon oxycarbide phase.
Lipowitz et al.(47),(48) studied the synthesis, composition, structure and prop-
erties of polymer-derived ceramic fibers (NICALON). They performed extensive
structural characterization by X-ray diffraction, 29Si NMR, IR, Raman, XPS,
and Auger depth-profile analysis. They found that the microstructure contained
a continuous, amorphous SiOC phase with nano-crystalline β-SiC. TEM micro-
graph revealed that the β-SiC crystals, in the size range of 4.0−2.6 nm, were
embedded in this amorphous matrix. 29Si NMR proved to be the most useful
method for characterizing the oxycarbide phase. It showed a broad peak covering
the range of SiC (-15 to -25 ppm), CSiO3 (-70 ppm), C2Si2O2 (-30 ppm), and
C3SiO (10 ppm). XPS analysis showed a Si-2p peak which did not correspond
to SiO2 or SiC. The binding energy value was between that of SiO2 and SiC and
was considered to be the binding energy of Si-2p photoelectron in the oxycarbide
amorphous phase.
The formation of SiOC intermediate phase has also been found by White et
al.(49),(50) in the synthesis of high surface area SiC powder. Gels were synthe-
sized from organosilicon precursors having various organic groups using sol-gel
processing. A black “glassy, carbon containing silica phase” was observed upon
pyrolysis of the gels at temperatures close to 1000°C under inert atmospheres.
Pyrolysis at 1500°C typically yielded large, shiny black particles containing a
partially crystalline and partially amorphous mixture of SiC, carbon and silica.
Since the focus of their work was to synthesize SiC, the nature of the black glassy
was not studied in any detail.
It is now widely recognized that the chemical/polymer-processing of silicon
carbide and especially fibers such as Nicalon, can create a silicon oxycarbide
phase. The thermal stability of this phase is fundamental to the high temper-
ature behavior of these important engineering materials. Thus the widespread
interest in chemical/polymer-processing of silicon carbide ceramics has provided
an additional driving force for synthesis and study of the phase−pure silicon
20
3.4 Silicon Oxycarbide: General
oxycarbide.
3.4.1 Processing of Silicon Oxycarbide Glasses
Currently two methods are in use for synthesis of SiOC glasses namely, sol gel
processing of organosilicon compounds and direct pyrolysis of silicone resins. The
following parts covers an brief review, which will focus mainly on the preceramic
polymer processing, polymer to ceramic transformation characterization.
3.4.1.1 Processing of Silicon Oxycarbide Glasses: Sol-Gel Method
The sol-gel process has enabled the low-temperature synthesis of silicon oxycar-
bide glasses without the problem of decomposition and oxidation during melting.
This is achieved through the use of polymeric precursors containing Si-C bonds;
viz, organically-modified alkoxysilanes of the general formula−[RxSi(OR´)4-x].
These precursors provide a direct Si-C bonds in the starting solution which is
preserved in the gel and glass structures. In this way, carbon could be retained,
and most importantly, some of the carbon is covalently bonded to the central
silicon cation. This is in contrast to the alkoxysilanes [Si(OR)4] which was com-
monly used for sol/gel synthesis of silica glass. In the case of these modified
alkoxysilanes, one or more of the alkoxy groups are replaced by saturated (e.g.,
CH3, C2H5, C3H7) or unsaturated (e.g., C2H3, C6H5) ‘R’ group(s). The carbon
chain length, and the number and nature of ‘R’ group modifications, allow a
control of the amount of carbon introduced. An additional degree of compo-
sitional control is afforded by mixing the organically-modified alkoxysilanes, in
desired molar ratios, with other alkoxysilanes. The gels, obtained after hydroly-
sis and condensation of the precursors, contains Si atoms bonded simultaneously
to oxygen and carbon atoms.
Chi(49) reported on the sol/gel processing of monolithic glasses from mixtures of
tetraethylorthosilicate (TEOS) [Si(OC2H5)4] and methyltrimethoxysilane (MT-
MS) [CH3Si(OCH3)3], cohydrolyzed and mixed with colloidal alumina monohy-
drate and colloidal silica fillers. Upon pyrolysis in argon at 1200°C, the gels
turned black. The maximum carbon content was 12.5%. Only limited struc-
tural characterization was reported on these gels and glasses, but the black glass
showed very high thermal stability and resistance to crystallization.
21
3 Literature Review
A systematic series of silane precursors were used to prepare oxycarbide glasses
by Zhang and Pantano.(44),(51) Methyl-, ethyl-, propyl- and phenyl-trimethoxysila-
nes with chemical formulae CH3Si(OCH3)3, C2H5Si(OCH3)3, C3H7Si(OCH3)3,
C6H5-Si(OCH3)3, respectively, were hydrolyzed in H2O (1:6 molar) and ethanol
(1:1 volume) using HCl as the catalyst. 1H NMR indicated that the majority
of Si-OR groups had been hydrolyzed to Si-OH, while the methyl, ethyl, propyl
and phenyl groups bonded directly to Si, were retained. Ammoniated solutions
were added to initiate the gelation which occurred within a few days to several
weeks. 13C and 29Si MAS NMR of these gels showed that the alkyl groups were
still present in the gels, while the Si-OH terminal bonds had been largely re-
placed by Si-O-Si through condensation. The dried gels were translucent, but
turned black upon heat treatment in argon at 800-1000°C. X-ray and electron
diffraction confirmed the amorphous state of these materials. Detailed investi-
gation of the structural evolution during all stages of transformation is reported.29Si NMR of liquid precursor [methyltriethoxysilane (MTES)] exhibit one type
of Si-species. Sharp signal is observed due to the rotational degrees of freedom
provided in the liquid state. The amorphous, solid-state of the gel and glass
causes the broadening of the lines. The dried gel shows two types of Si-species.
One is a Si tetrahedra with two non-bridging sites (Si-CH3 and Si-OH) and two
bridging oxygen sites. The other is a Si tetrahedra with one non-bridging site
(Si-CH3) and three bridging oxygen sites.(51) Obviously, these species confirm to
the chemical structure that defines a silicon oxycarbide. The final black glass
has a wider distribution of Si-species, and clearly, two of these have been cre-
ated during the pyrolysis step. One of the new line is due to a silicon-oxygen
tertahedra−[SiO4]. This is the usual building block of silicate glasses, and its
presence here indicates that some decomposition of the oxycarbide species oc-
curred in the gel during pyrolysis. The other new species that forms during the
pyrolysis is a Si tetrahedra with two bridging oxygens and two carbon bonds,
i.e., [C2SiO2]. Clearly, these species were created through condensation and/or
exchange reaction during pyrolysis of the gel. It has to be emphasized that these29Si NMR spectra cannot characterize the functionality of the carbon bonded
to silicon; i.e., they can be non-bridging methyl groups (≡Si-CH3), or bridging
groups such as ≡Si-CH2-Si or even [CSi4].
A number of studies have focused on the effects of precursor chemistry on the
22
3.4 Silicon Oxycarbide: General
carbon-content of the gels and glasses. Zhang and Pantano also studied the ef-
fect of increasing carbon chain length on the amount of carbon retained in gels
and glasses. Precursors having saturated hydrocarbon groups modifications, e.g.,
methyl, ethyl, propyl groups attached directly to the Si atom were subjected to
hydrolysis and condensation. The carbon content of the gels was found to in-
crease proportionally with increasing carbon chain length of the alkyl group. Yet
the carbon content of the oxycarbide glasses obtained after pyrolysis at 900°Cdid not show a proportional increase with carbon content of the precursor/gel.
Oxycarbide glasses obtained from metyltrimethoxysilane (MTMS) and propy-
ltrimethoxysilane (PTMS) precursor displayed nearly equal carbon contents. A
clear trend towards increasing oxycarbide fraction with a decreasing content of
carbon in the alkyl group is observed in 29Si NMR. But in general, about 45% of
the silicon is bonded with one carbon and 3 oxygens [CSiO3], about 45% of the
silicon is bonded with 4 oxygens [SiO4], and about 10% of the silicon atoms are
bonded with 2 carbons and 2 oxygens [C2SiO2]. Thus it is proposed that only the
carbon atom bonded directly to Si atom can be retained in the glass structure.
The cleavage of the Si-C bonds in the PTMS gels before the high temperature
thermal decomposition is attributed to the kinetics of β-elimination reactions,
which are known to occur at temperatures <450°C in silicon compounds.
Gels and glasses synthesized from precursors having unsaturated hydrocarbon
modifications (e.g., vinyl, allyl and phenyl groups) behave differently. Compar-
isons were made between the carbon contents of glasses obtained at 900°C from
gels modified by saturated and unsaturated organic groups containing the same
number of carbon atoms. Comparison of the results of the ethyl (C2H5) gels
vs. vinyl (H2C=CH) gels, and propyl (C3H7) gels vs. allyl (H2C=CHCH2) gels
showed much higher carbon-contents in the glasses made from gels containing
unsaturated organic groups.
One of the key issues in synthesis is the ability to maximize retention of Si-C
bonds (and thereby to minimize formation of free carbon). This problem has
been successfully addressed through the introduction of reactive Si-H groups in
the precursors; i.e., one or more of the Si-O bonds of the precursor are replaced by
Si-H bonds. The Si-H bonds initiate early cross-linking of the network through
reactions with the Si-CxHy bonds, and therefore polymerize the network through
23
3 Literature Review
Si-C-Si bridges. This is represented by the following reaction:
≡ Si−H + CH3 − Si ≡−→≡ Si− CH2 − Si ≡ + H2 (3.11)
Singh and Pantano compared oxycarbide gels and glasses made from methyltrime-
thoxysilane {(MTMS) -[CH3Si(OCH3)3]} with those made from methyldimethoxy-
silane {(MDMS) -[CH3HSi(OCH3)2]}. The MDMS precursor possesses a Si-H
functionality in addition to the Si-CH3 ligand. MDMS and MTMS were mixed
in various ratios with TEOS on order to vary the carbon content of the gels. The
effect of the Si-H functionally upon the condensation of the oxycarbide network
were investigated. It was found that the Si-H bonds survived the acidic hydrol-
ysis and remained intact in the gel structures. Clear appearance of Si-CH2-Si
linkages (FTIR spectra: wave number 1360 cm-1) through the reaction of the
Si-H bonds with the methyl groups at temperatures below 500°C. A significantly
higher oxycarbide fraction in the MDMS glasses is obtained after pyrolysis.
Further enhancement in the network cross-linking, and hence enhancement in
oxycarbide content, were achieved by using Si-H bonds in both precursors: i.e.,
by mixing MDMS with triethoxysilane {(TES)-[HSi(OCH3)3]}.Similar results on the effect of Si-H bonds have been obtained by Babonneau
et al. and Soraru et al.(50),(52),(53) 29Si NMR spectra of the gels were obtained
to characterize the presence of Si-H in the gels, and also to measure the relative
intensity of the oxycarbide phases in the various systems. The systems with the
greatest amount of Si-H in the precursor gel exhibited the highest concentration
of Si-C bonds, and at 1000°C, [SiC4] species had already formed. Thus, it seems
certain that the use of reactive groups such as Si-H can enhance the formation of
stable oxycarbide species, and thereby, limit the creation of free carbon species.
A different approach was proposed by Belot et al.(54),(55) The idea, in this case,
was to use methyl-substituted silica gel having Si-Si bonds in order to reduce
the total oxygen content of the system and favor the incorporation of tetravalent
carbon in the oxide structure.
In order to compare the effectiveness of the different synthetic methods in the
formation of oxycarbide phases, the amount of carbidic and free carbon should be
estimated. This was done on the basis of chemical analysis (Si, O, C) considering
the ideal stoichiometry, SiO2-xCx/2, and neglecting, as a first approximation, the
24
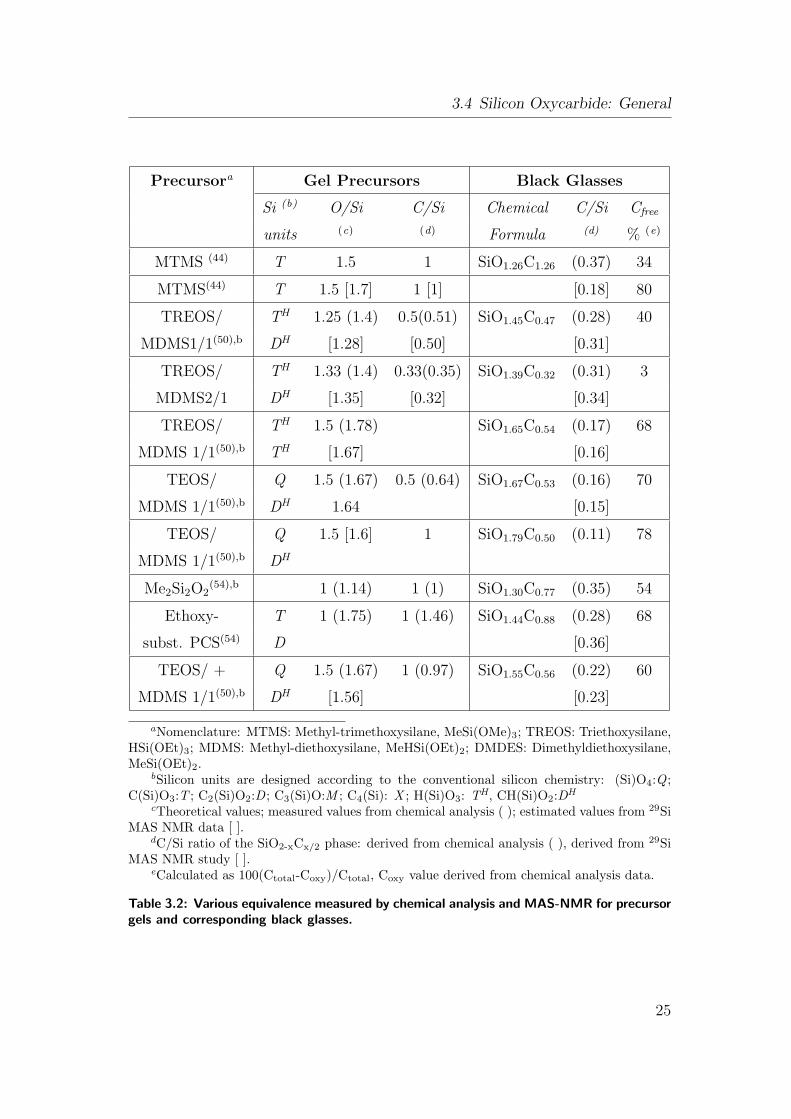
3.4 Silicon Oxycarbide: General
Precursora Gel Precursors Black Glasses
Si (b) O/Si C/Si Chemical C/Si Cfree
units (c) (d) Formula (d) % (e)
MTMS (44) T 1.5 1 SiO1.26C1.26 (0.37) 34
MTMS(44) T 1.5 [1.7] 1 [1] [0.18] 80
TREOS/ TH 1.25 (1.4) 0.5(0.51) SiO1.45C0.47 (0.28) 40
MDMS1/1(50),b DH [1.28] [0.50] [0.31]
TREOS/ TH 1.33 (1.4) 0.33(0.35) SiO1.39C0.32 (0.31) 3
MDMS2/1 DH [1.35] [0.32] [0.34]
TREOS/ TH 1.5 (1.78) SiO1.65C0.54 (0.17) 68
MDMS 1/1(50),b TH [1.67] [0.16]
TEOS/ Q 1.5 (1.67) 0.5 (0.64) SiO1.67C0.53 (0.16) 70
MDMS 1/1(50),b DH 1.64 [0.15]
TEOS/ Q 1.5 [1.6] 1 SiO1.79C0.50 (0.11) 78
MDMS 1/1(50),b DH
Me2Si2O2(54),b 1 (1.14) 1 (1) SiO1.30C0.77 (0.35) 54
Ethoxy- T 1 (1.75) 1 (1.46) SiO1.44C0.88 (0.28) 68
subst. PCS(54) D [0.36]
TEOS/ + Q 1.5 (1.67) 1 (0.97) SiO1.55C0.56 (0.22) 60
MDMS 1/1(50),b DH [1.56] [0.23]
aNomenclature: MTMS: Methyl-trimethoxysilane, MeSi(OMe)3; TREOS: Triethoxysilane,HSi(OEt)3; MDMS: Methyl-diethoxysilane, MeHSi(OEt)2; DMDES: Dimethyldiethoxysilane,MeSi(OEt)2.
bSilicon units are designed according to the conventional silicon chemistry: (Si)O4:Q ;C(Si)O3:T ; C2(Si)O2:D ; C3(Si)O:M ; C4(Si): X ; H(Si)O3: TH, CH(Si)O2:DH
cTheoretical values; measured values from chemical analysis ( ); estimated values from 29SiMAS NMR data [ ].
dC/Si ratio of the SiO2-xCx/2 phase: derived from chemical analysis ( ), derived from 29SiMAS NMR study [ ].
eCalculated as 100(Ctotal-Coxy)/Ctotal, Coxy value derived from chemical analysis data.
Table 3.2: Various equivalence measured by chemical analysis and MAS-NMR for precursorgels and corresponding black glasses.
25
3 Literature Review
presence of residual hydrogen; indeed less than 1 wt.% of H is usually measured
on materials fired at temperature ≥1000°C. Thus, from the experimental O/Si
ratio, it is possible to estimated the C/Si ratio in the stoichiometric oxycarbide
phase, as well as the amount of Cfree.
A different approach to the quantitative evaluation of the oxycarbide phase is
based on 29Si MAS NMR analysis. This technique allows a quantitative evalu-
ation of the various silicon units, SiO2-xCx/2 in the oxycarbide network. By as-
suming that each carbon atom, in the mixed oxycarbide units, is shared between
four silicon atoms, it is possible to derived the (C/Si)oxy ratio. The comparison
of this value with the chemical analysis leads to the estimation of the amount of
free carbon.
Table: 3.2 shows literature data on various oxycarbide glasses obtained from
different precursors. The amount of carbidic and free carbon have been extracted
from the reported chemical composition and from NMR results. The main sili-
con units in the starting gels as well as the theoretical and experimental values
of (O/Si)gel and (C/Si)gel have also been reported. All the oxycarbide phases
synthesized so far have a (C/Si)oxy ratio in the range 0.10−0.38 and a Cfree con-
tent between 24 and 90%. The amount of (C/Si)oxy seems closely related to the
(O/Si)gel ratio in the precursor gels. The general trend of an increase of (C/Si)oxy
when (O/Si)gel decreases is evident. This fact implies that the nature of Si-O
bonds in the system does not change during the pyrolysis process. In fact the
pyrolytic transformation from the gel to the black body is a very complicated
process far from being fully understood. It has been shown for many alkyl sub-
stituted silica gels that the redistribution reactions between Si-O, Si-C and Si-H
groups can occur in the early stage of the pyrolysis with the evolution of vari-
ous silane compounds and thus, can lead to a variation of O/Si and C/Si ratio.
Moreover, as seen in Table: 3.2, for the systems, namely MTMS-derived gels
and the ethoxy-substituted PCS, chemical processes leading to a decrease of the
O/Si ratio must be active at some stage of the pyrolysis process. Actually, the
later system shows quite different behavior compared to the others, inspite of a
high (O/Si)gel ratio (1.75), the corresponding oxycarbide phase is rich in carbide
carbon, (C/Si)oxy = 0.28.
To obtain a black glass with no or low Cfree content, all the carbon atoms which
are not incorporated in the silicon oxycarbide network should be removed from
26
3.4 Silicon Oxycarbide: General
the system as volatile species. As already pointed out, the maximum amount
of carbon that can be incorporated into the black glass can be estimated from
the oxygen content of the gel (O/Si)gel through the stoichiometric relationship,
i.e., (C/Si)stoich. = [2 - (O/Si)gel]/2. Thus by comparing the experimental value
(C/Si)gel with the stoichiometric one, it is possible to estimate the amount of
carbon that has to be removed from the system if a Cfree oxycarbide phase is
desired. The data indicated in Table: 3.2 show that generally (C/Si)gel is much
larger than (C/Si)stoich. and this partially explains the high amount of Cfree in
the corresponding black glasses.
3.4.1.2 Processing of Silicon Oxycarbide Glasses: Silicone Resins
Although the sol-gel process can be versatile because of the advantage of low-
temperature processing, drawbacks such as shrinkage and cracking, caused by
solvent or byproducts evolution during drying and pyrolysis steps have moti-
vated research to search for new synthetic methods for this class of materials.
For example, the volume changes associated with the sol-gel processes and with
the pyrolytic conversion of the precursor to the ceramic materials, must be min-
imized, to maximized the ceramic yield and the densification during the ceramic
conversion step. Consequently the selection of suitable polymers which have low
shrinkage, larger ceramic yield as well as easy processing properties, is funda-
mental to the development of useful ceramic composites. It would therefore be
desirable to select a precursor with the ability to effectively cross-link before
pyrolysis.
Recently, poly(siloxanes) have been used as precursors for ceramics and glasses
such as silicon oxycarbide.(56),(57),(58) These polymers are generally known as
silicones and can generate a broad range of products because there is a large
number of different building blocks commercially available. Poly(siloxanes) or
poly(organosiloxanes) are polymeric compounds comprise of Si-O-Si units as the
polymeric backbone. The general formulae for poly(siloxanes) are [R2SiO]n for
linear or cyclic poly(siloxanes) and [RSiO1.5]n for poly(silsesquioxanes). In gen-
eral, polymers are synthesized via the hydrolysis and condensation of difunc-
tional silanes and/or trifunctional silanes, RSiX3, where the R can be a variety
of alkyl or aryl groups and X is a hydrolyzable functional attachment such as an
27
3 Literature Review
alkoxy group or a chlorine atom. A majority of poly(siloxanes) contains units
of general structure [R3SiO0.5], [R2SiO], [RSiO1.5], [SiO2] where each R inde-
pendently stands for hydrogen atoms, alkyl radicals containing 1 to 20 carbon
atoms, phenyl radicals, and vinyl radicals. In general, poly(siloxane) containing
phenyl groups posses lower ceramic yield and higher free carbon contents rel-
ative to poly(siloxanes) where R is exclusively methyl groups. Poly(siloxanes)
which contain vinyl groups and hydrogen are often preferred since these groups
attached to silicon provide a mechanism for curing by hydrosilyation reaction
prior to pyrolysis, which lead to higher ceramic yields.
In 1989, Renlund et al.(56) reported on the production of a silicon oxycarbide
glass by pyrolysis of a methylsilsesquioxane polymer. This silicone resin was from
General Electric Silicon Products Div., Waterford, NY under trade name SR350.
The resin was synthesized by a hydrolysis-condensation polymerization reaction
of dimethyldichlorosilane (2-8%) and methyltrichlorosilane (92-98%). The struc-
ture of the resulting polymer was described as a partially branched silicon-oxygen
chain with methyl and hydroxyl substituents, terminated by methyl groups. En-
suring pyrolysis of the resin in He at 1100°C resulted in a silicon oxycarbide glass.
Rendlund proposed that it was the intimate mixture and bonding arrangement
of Si, O, and C on the atomic scale in the polymeric precursor that allowed the
formation of a metastable SiOxCy glass.
Siloxane polymers differ in the number of oxygen atoms per silicon and in
the chemical composition of the ligands. Initially, it was not obvious how the
stoichiometry and properties of the pyrolysis products should be related to that
of the initial polymer. Therefore, chemical analysis was used to determine the
stoichiometries of the ceramic products and other techniques to determine their
properties. Wilson et al and co-author(58) showed that the stoichiometry of py-
rolyzed siloxanes is easily estimated based on the initial polymer composition
and the char yield, provided that the initial polymer is highly cross-linked or
branched such that the parent backbone does not unzip and evaporate during
heating. Assumption was made that the entire weight loss is due to carbon and
hydrogen and that all the hydrogen leaves the materials. Chars of the same final
stoichiometry can be prepared from polymers of different initial composition. For
example, phenyl-containing polymers might be expected to give chars of different
properties than those of vinyl or methyl-containing polymers, even if the final
28
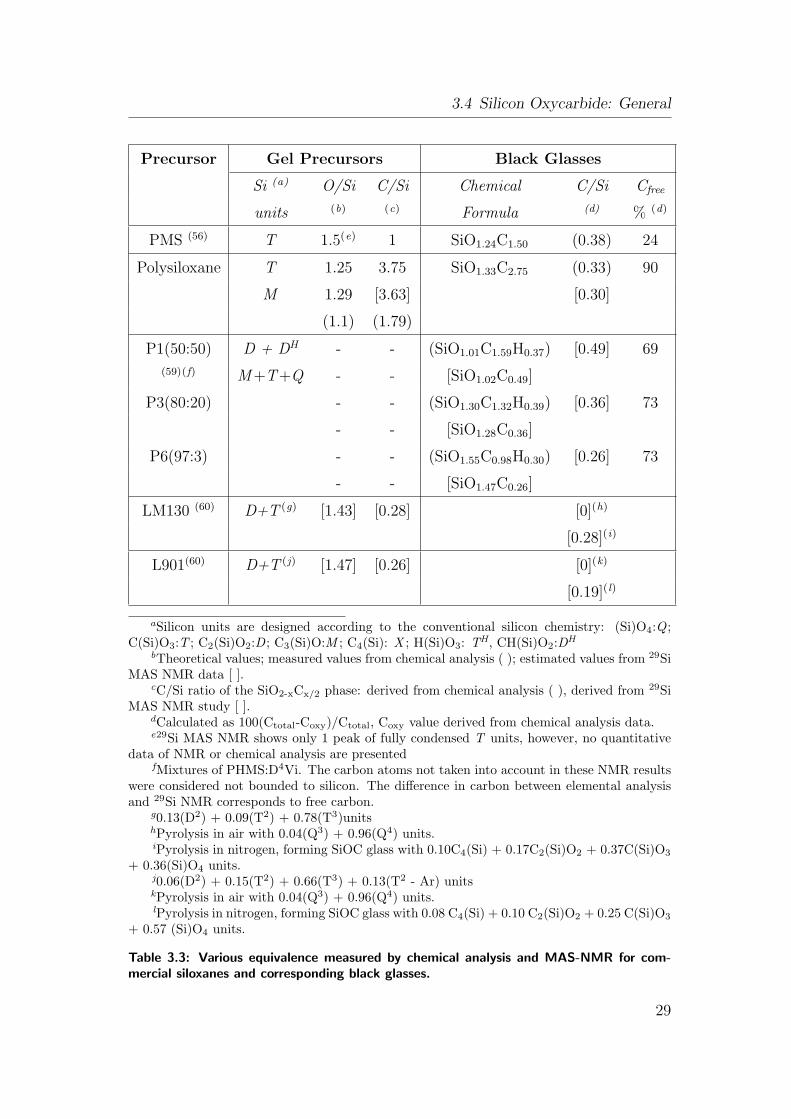
3.4 Silicon Oxycarbide: General
Precursor Gel Precursors Black Glasses
Si (a) O/Si C/Si Chemical C/Si Cfree
units (b) (c) Formula (d) % (d)
PMS (56) T 1.5(e) 1 SiO1.24C1.50 (0.38) 24
Polysiloxane T 1.25 3.75 SiO1.33C2.75 (0.33) 90
M 1.29 [3.63] [0.30]
(1.1) (1.79)
P1(50:50) D + DH - - (SiO1.01C1.59H0.37) [0.49] 69
(59)(f) M+T+Q - - [SiO1.02C0.49]
P3(80:20) - - (SiO1.30C1.32H0.39) [0.36] 73
- - [SiO1.28C0.36]
P6(97:3) - - (SiO1.55C0.98H0.30) [0.26] 73
- - [SiO1.47C0.26]
LM130 (60) D+T (g) [1.43] [0.28] [0](h)
[0.28](i)
L901(60) D+T (j) [1.47] [0.26] [0](k)
[0.19](l)
aSilicon units are designed according to the conventional silicon chemistry: (Si)O4:Q ;C(Si)O3:T ; C2(Si)O2:D ; C3(Si)O:M ; C4(Si): X ; H(Si)O3: TH, CH(Si)O2:DH
bTheoretical values; measured values from chemical analysis ( ); estimated values from 29SiMAS NMR data [ ].
cC/Si ratio of the SiO2-xCx/2 phase: derived from chemical analysis ( ), derived from 29SiMAS NMR study [ ].
dCalculated as 100(Ctotal-Coxy)/Ctotal, Coxy value derived from chemical analysis data.e29Si MAS NMR shows only 1 peak of fully condensed T units, however, no quantitative
data of NMR or chemical analysis are presentedfMixtures of PHMS:D4Vi. The carbon atoms not taken into account in these NMR results
were considered not bounded to silicon. The difference in carbon between elemental analysisand 29Si NMR corresponds to free carbon.
g0.13(D2) + 0.09(T2) + 0.78(T3)unitshPyrolysis in air with 0.04(Q3) + 0.96(Q4) units.iPyrolysis in nitrogen, forming SiOC glass with 0.10C4(Si) + 0.17C2(Si)O2 + 0.37C(Si)O3
+ 0.36(Si)O4 units.j0.06(D2) + 0.15(T2) + 0.66(T3) + 0.13(T2 - Ar) unitskPyrolysis in air with 0.04(Q3) + 0.96(Q4) units.lPyrolysis in nitrogen, forming SiOC glass with 0.08 C4(Si) + 0.10 C2(Si)O2 + 0.25 C(Si)O3
+ 0.57 (Si)O4 units.
Table 3.3: Various equivalence measured by chemical analysis and MAS-NMR for com-mercial siloxanes and corresponding black glasses.
29
3 Literature Review
stoichiometries of the chars are identical. These authors address this question by
examining three highly cross-linked poly(siloxane), so that they would produce
roughly the same stoichiometry after pyrolysis to a sufficiently high temperature.
Other resent work has shown that the initial chemical environment around sili-
con in a siloxane polymer is only maintained up to about 500°C. These authors
state: “Further heating results in a scrambling of the silicon environment”. On
the basis of this, one expects these three materials pyrolyzed at 1000°C to show
similar properties. The behavior of these materials upon electrochemical inser-
tion of lithium was studied using lithium cell was reported. The electrochemical
behavior upon the insertion and deinsertion of lithium into these materials is
the same. Thus, authors concluded that it is the final char stoichiometry, not
the precise nature of the starting polymer, which controls the bulk properties of
the Si-O-C glasses. In resent work Soraru et al.(53) had indicated that the local
environment of the Si is determined by the Si-O ratio in the char, which is related
to the initial precursor. Wilson et al. argued that this, however does not mean
that the overall structure of the char only depends on the Si-O ratio. Series of
materials with the same Si-O ratio but with different amounts of carbon have
been reported. These materials have different diffraction patterns and have dif-
ferent electrochemical behavior, which is controlled by the overall stoichiometry
of the char and not by the local environment around Si, which is probably the
same.
Synthesis of silicon oxycarbide is reported by Radovanovic et al.(59) from com-
mercially available siloxanes. Polymer resulting from the hydrosilylation reaction
between poly(methylsiloxane)(PMHS)[from Huls], and 1,3,5,7-tetravinylcycletet-
rasiloxane (D4Vi) [from Dow Corning] in the presence of platinum divinylcomplex
as a catalyst, have been pyrolyzed to silicon oxycarbide ceramics, with ceramic
yield varying as a function of the mixture composition. PMHS, as the majority
of linear poly(organosiloxanes) gives negligible pyrolysis yields, due to the abun-
dant extrusion of volatile cyclic oligomers during the firing process. However,
when combined with compounds containing vinyl groups, this polymer can be
cross-linked leading to elastomeric materials. The gelation time, which occurs
between PMHS:D4Vi mixture, after the catalyst addition, was directly propor-
tional to the D4Vi amount added. Also the amount of oxycarbide phase formed
is related to on the amount of D4Vi, i.e., decrease in the amount of D4Vi as
30
3.4 Silicon Oxycarbide: General
indicated by (P6 precursor 97:3); refer in Table: 3.3, reduced the amount of
oxycarbide phase along with increase in the Cfree content. PMHS contains an
excess of reactive Si-H groups, in relation to vinyl groups of the D4Vi cyclic silox-
ane. These excess Si-H groups provide cross-linking sites. The exothermic peak
reported between 100-200°C, associated with the decrease in the relative inten-
sity of the υ (Si-H) absorption were indicated as evidences of these additional
cross-linking reactions. The authors observed no detectable structural and den-
sity change between 200-400°C. 13C MAS NMR investigation between 400-600°Creveal no variation, which may indicate that carbon atoms present in the mate-
rial continues to occupy practically the same sites. Above 600°C the beginning
of reorganization reactions of Si-O and Si-C bonds were reported according to
following reactions:(59),(54),(55)
2D −→M + T (3.12)
D + T −→M +Q (3.13)
D +M −→ C + T (3.14)
D +Q −→ 2T (3.15)
where:
M = C3SiO; D = C2SiO2; T = CSiO3; Q = SiO4 and C = SiC4.
The formation of M, T, Q and C units from starting precursors containing
D and DH units has to be considered according to the redistribution reactions.
Above 600°C the methyl groups are active, with the formation of a large distri-
bution of aliphatic C sites and graphite carbon. The evolution of methane and
hydrogen, concurrent with the formation of graphite carbon have been described
in the pyrolysis of methyl derived siloxane precursors, by the following reactions:
≡ Si− CH3 −→≡ Si •+ • CH3 (3.16)
31
3 Literature Review
≡ C −H −→≡ C •+ •H (3.17)
≡ C −H + •CH3 −→≡ C •+CH4 (3.18)
≡ C −H +H• −→≡ C •+H2 (3.19)
Combination of different ≡ Si• and ≡ C• radicals in the formation of the Si-C-Si
bridges and free carbon in the ceramic products was discussed.
Brus et al.(60) in his contribution, used commercially available poly(siloxane)
resins namely; poly(methylsiloxane) with a trade name Lukosil M130 and poly[m-
ethyl(phenyl)siloxane] containing reactive groups with the trade name Lukosil
901∗ to produce silicon oxycarbide glasses and study the chemical changes dur-
ing heat-treatments in oxidative and nitrogen atmosphere. In air atmosphere,
predominantly oxidation processes occur, due to the absence of linear bifunc-
tional D2 [-O-Si(C6H5)2-O-] structural units and the presence of siloxane units
with aromatic substituents, the resistance of the precursor to oxidation reactions
increases strongly. Also small amount of redistribution reactions leading to the
formation of silicon oxycarbide glasses were reported.
In contrast to the oxidation atmosphere the authors reported, formation of a
large extent of the silicon oxycarbide glasses during the pyrolysis of both pre-
cursors in N2. He reported a different behavior under pyrolysis in N2 for both
precursors. Accordingly, for LM130 precursor, the siloxane network structure
have very slight modification up to 600°C, But, more dramatic changes in the
siloxane networks structure for L901 precursor was detected. The condensation
reactions and the redistribution reactions are more intensive. The C2(Si)O2 and
C3(Si)O units formed up to 800°C decreases and the extent of condensation re-
actions leading to the mineralization of product increases. He concluded that,
due to this mineralization, the C/Si ratio significantly decreases at high pyrolysis
temperatures. Also as the weight loss of these polymer is relatively small (ca. 5
wt.%), lower molecular weight and volatile products do not form, rather forming
free highly condensed aromatic phase.
∗These are commercial products of Lucebnı zavody Kolın, Czech Republic.
32
3.4 Silicon Oxycarbide: General
More recently Mutin et al.(61) reported the role of redistribution reactions in
the formation of SiOC ceramics by polymer route. He discussed many redis-
tribution reactions namely; Si-O/Si-O, Si-O/Si-H, Si-O/Si-Si and Si-O/Si-C. He
first observed the unambiguous occurrence of Si-C/Si-O redistribution during the
pyrolysis, under argon, of polymethylsilsesquioxane. The continuous evolution
of the 29Si MAS NMR spectra of the residue with the pyrolysis temperature in-
dicates that Si-C/Si-O redistributions takes place in the 500°C to 1400°C range,
involving not only Si-Me bonds, but also any Si-C bonds in the residue. Apart
from cross-linked polymethylsiloxane which was first reported by above author,
this reaction was identified in the pyrolysis of all organosilicon polymer precursors
containing Si-C and Si-O bonds, regardless of their structure:
1. in polysiloxanes containing methyl, phenyl, or vinyl substituents in mono-,
di-, tri-, or tetrafunctional building units,
2. in polysiloxanes cross-linked Si-Si or SiCH2CH2Si bridges,
3. in polycarbosilanes cross-linked by Si-O-Si bridges.
He added that, the occurrence of Si-O/Si-C redistributions accounts for the dis-
tribution of [SiCxO4-x] sites found in all the SiOC glasses at ∼ 1000°C. Moreover,
SiOC glasses with similar O/Si ratios display similar 29Si MAS NMR spectra, re-
gardless of the structure of the precursor. Thus, at the end of the mineralization
stage, the environment of the Si atoms in an oxycarbide glass is dependent only
on the amount of Si-O and Si-C bonds in the glass (O/Si ratio) and is not de-
pendent on the environment of Si atoms in the precursor. This finding suggested
that the redistribution of Si-O and Si-C bonds attained an equilibrium state.
Some conclusions can be tentatively drawn from the above analysis. For the
synthesis of free-carbon free oxycarbide glasses with high carbidic carbon con-
centrations, the following points should be considered:
1. The (O/Si)gel should be kept as low as possible and thus the number of
terminal groups in the gel should be minimized by forcing the condensation
process as far as possible.
2. The (C/Si)gel should be kept as close as possible to the stoichiometric value.
33
3 Literature Review
3.4.2 SiOC Ceramic and Post Treatment Characterization:
MAS-NMR, TEM, EELS, Mechanical.
After discussing the processing of oxycarbide glass by different routes, it is im-
portant to investigate further these glass with different techniques for structural
evolution and some physical and mechanical properties.
Soraru et al.(62) and co-authors in their post-pyrolysis study on sol-gel derived
silicon oxycarbide glasses used thermal annealing to further investigate the effect
of high temperature on thermal stability and structural evolution. He suggested
that, by increasing the firing temperature, a structural evolution occurs, leading
to the crystallization of very fine β-SiC crystals. Indeed, starting from 1200°C,
the typical diffraction peaks of the cubic silicon carbide crystals are clearly seen.
Along with XRD study the structural evolution is even more evident from the29Si MAS-NMR analysis. By increasing the temperature from 1000-1200°C, the
oxycarbide network becomes richer in SiC4 and (Si)O4 units with a concurrent
decrease of the amount of C(Si)O3 and C2(Si)O2 units. It should be noted that
this structural evolution occurs without any variation in the chemical composi-
tion of the oxycarbide phase as well as without any appreciable weight loss. From
1200 to 1400°C, the relative amount of various silicon units in the oxycarbide net-
work is stable. Conversely from 1400 to 1500°C, NMR analysis show a dramatic
decrease of a mixed species and simultaneously strong increase of the SiC4 units.
The NMR analysis clearly indicates that the starting homogeneous oxycarbide
network undergoes structural rearrangements that lead to a phase separation.
The formation of [SiC4] species is significant. Pantano et al.(51) reported that, in
the case of oxycarbide glasses made with MTMS only, the [SiC4] does not appear
until ∼ 1200°C, whereas the glasses synthesized with MDMS or TES precursors
containing Si-H show [SiC4] formation at lower temperatures. The formation of
SiC through carbothermal reduction of SiO2 (by C) occurs only at much higher
temperature (≥1500°C). Thus, it is likely that these [SiC4] species are created
through exchange reactions and decomposition of [SiOxCy] species. This is anal-
ogous to the formation of SiC through pyrolysis of carbosilanes which starts at
1000°C. Since all of these glasses are X-ray amorphous, the [SiC4] species must
be quite dispersed. Nevertheless, they can be considered nuclei for subsequent
crystallization at higher temperatures.
34
3.4 Silicon Oxycarbide: General
Additionally, Soraru(62) observed that, the number of Si-C bonds is constant
from 1000 to 1400°C, ≈ 1.2 ± 0.1, confirming the compositional stability of the
oxycarbide phase. At 1500°C, the increase of the number of Si-C bonds indi-
cate that some free carbon has reacted with the oxycarbide network to form
new Si-C bonds. Indeed, the chemical analysis and the 29Si MAS NMR results
in this study explicitly suggested the presence, in the pyrolyzed product, of an
extra Cfree phase. The paper reports the structure of the free carbon phase us-
ing Raman spectroscopy, which is the most suitable tool to characterize various
forms of crystalline as well as disordered graphitic carbon. Soraru explained two
main distinct features: (i) The pair of Raman bands are superimposed upon the
luminescence background whose spectral intensity is strongly dependent on the
processing temperature. For temperatures below 1300°C, the luminescence back-
ground whose maximum is around 2750 cm-1 is particularly broad and intense. In
contrast, a nearly flat and relatively weak luminescence background is reported
after annealing at 1500°C, (ii) The Raman band itself, observed in the 1300−1600
cm-1 region are the diagnostic features of all known disordered graphitic forms
of carbon, which are referred to as the D and G bands, respectively.
Authors observed the presence of both D and G bands in the Raman spectrum
for glasses prepared after pyrolysis at 1000°C, which clearly indicates the pres-
ence of disordered graphitic-like component even at this temperature. They also
reported that, the band position and broadening change with the firing tempera-
ture. At high temperature i.e., 1500°C, the Raman spectra indicated formation of
turbostratic microcrystalline graphite and glassy carbon in which typical domain
sizes are around 2 to 3 nm.
More recently, researchers used HRTEM and EELS (particularly ELNES) to
investigate phase separation in silicon oxycarbide glasses.(63),(64) Kleebe et al.
report the effect of firing temperature on phase separation in his study on sol-
gel derived glasses from TREOS/MDMS 2:1 mixture, (refer in Table:3.2). This
particular composition was used because, according to literature,(53) it leads to
the formation of a pure silicon oxycarbide glass on pyrolysis. At 1000°C, author
observed in some refined regions, the local arrangement of silicon and carbon
atoms is close to that found in crystalline SiC. Also the CK peak reveal a small
π* prepeak at 283 eV, characteristic of the s −→ p transition and representing
the sp2 hybridization of carbon in EELS spectrum of glasses treated at 1000°C.
35
3 Literature Review
At 1200°C significant reduction in porosity and decrease of the Cfree content was
reported. The small lamellar features observed were thought to represent the
so-called basic structural units (BSU) of carbon. In addition, HRTEM images
show, in some regions, weak fringes, with spacings close to those of SiC. Along
with diffused halos of SiC, the separation of the (220) and (311) β-SiC reflections
in the EDP at this temperature imply an evolution towards the formation of bet-
ter ordered SiC crystallites. The authors argued that, compared with material
pyrolyzed at 1000°C, the supplementary peak at ∼ 125 eV, characteristic of an
Si-O environment in the SiL2,3 edge of EELS spectra indicate local formation of
SiO2, which is seen as a clear evidence for the phase separation process in sto-
ichiometric SiOC, starting at a temperature slightly < 1200°C. At still higher
temperature (1400°C) spherical crystallites of β-SiC are formed, with an average
size of 5−10 nm. Similar somewhat pronounced supplementary peak, represent-
ing Si-O bonding, enabled Kleebe to conclude that, at 1400°C, the nanosized SiC
crystallites are embedded in amorphous SiO2 and the phase separation process
is close to complete.
Kaneko et al.(64) used oxygen-controlled polycarbosilane (PCS) for his post
study of Si-O-C bulk ceramics by HRTEM and ELNES. Oxygen controlling was
performed by the thermal oxidation treatment at elevated temperature (180°C)
in air and with different heating schedules. Subsequent pyrolysis to 1200°C un-
der Ar atmosphere produces SiOC ceramics with different chemical composi-
tions. Kaneko observed that, the β-SiC grain size, namely the total crystallinity
of the material, substantially depend on the oxygen content controlled by the
thermal oxidation treatment before the pyrolysis step. Introduction of oxygen
constituent delays structural rearrangement of amorphous-to-crystalline transi-
tion in the overall microstructure. The fine structures of the Si-L2,3, C-K and
O-K edges ELNES were influenced by each chemical environment of the SiOC
ceramics. There are some minor changes among the ELNES spectra, e.g., the
chemical shift of major peak of the Si-L edge, the height of the π* peak of C-K
edge and the chemical shift of the major peak of the O-K edge. Changes in the
shapes of the peaks were also observed. In particular with a increase of the oxy-
gen content in the ceramic, a shift of the edge onset to the higher energy and the
energy onset of the major peak becomes sharper and the shape becomes similar
to the O-K edge of SiO2.
36
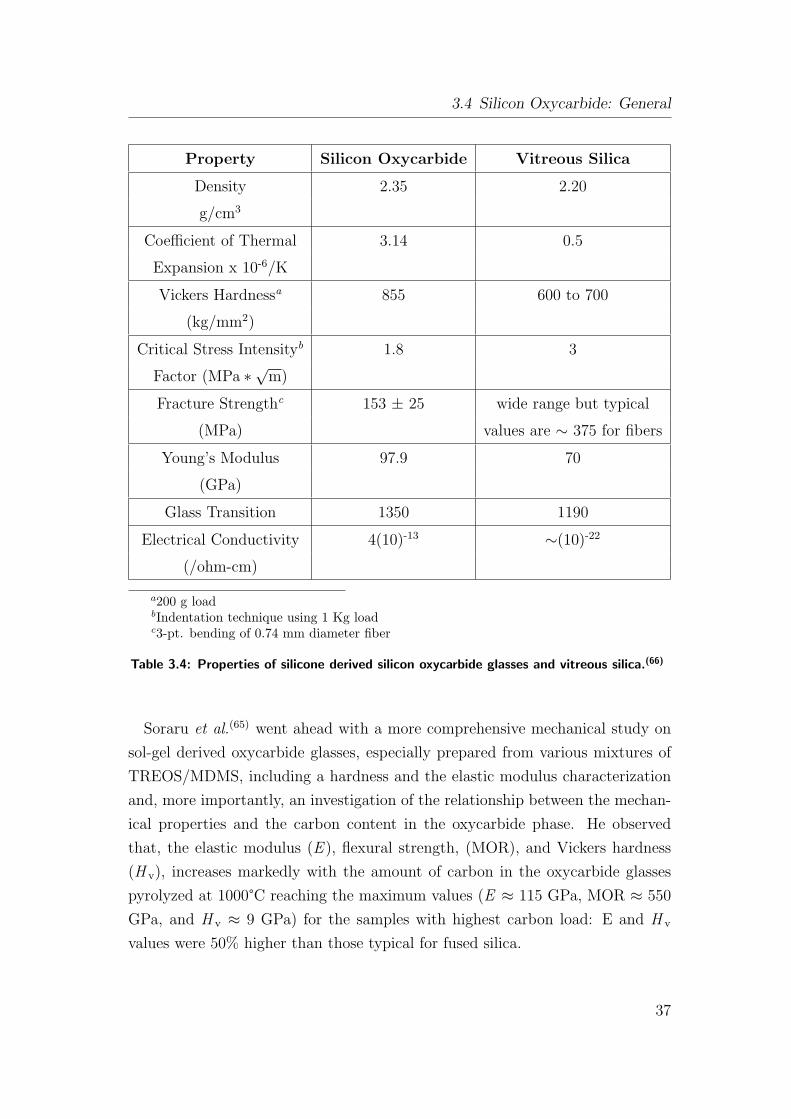
3.4 Silicon Oxycarbide: General
Property Silicon Oxycarbide Vitreous Silica
Density 2.35 2.20
g/cm3
Coefficient of Thermal 3.14 0.5
Expansion x 10-6/K
Vickers Hardnessa 855 600 to 700
(kg/mm2)
Critical Stress Intensityb 1.8 3
Factor (MPa ∗√
m)
Fracture Strengthc 153 ± 25 wide range but typical
(MPa) values are ∼ 375 for fibers
Young’s Modulus 97.9 70
(GPa)
Glass Transition 1350 1190
Electrical Conductivity 4(10)-13 ∼(10)-22
(/ohm-cm)
a200 g loadbIndentation technique using 1 Kg loadc3-pt. bending of 0.74 mm diameter fiber
Table 3.4: Properties of silicone derived silicon oxycarbide glasses and vitreous silica.(66)
Soraru et al.(65) went ahead with a more comprehensive mechanical study on
sol-gel derived oxycarbide glasses, especially prepared from various mixtures of
TREOS/MDMS, including a hardness and the elastic modulus characterization
and, more importantly, an investigation of the relationship between the mechan-
ical properties and the carbon content in the oxycarbide phase. He observed
that, the elastic modulus (E ), flexural strength, (MOR), and Vickers hardness
(H v), increases markedly with the amount of carbon in the oxycarbide glasses
pyrolyzed at 1000°C reaching the maximum values (E ≈ 115 GPa, MOR ≈ 550
GPa, and H v ≈ 9 GPa) for the samples with highest carbon load: E and H v
values were 50% higher than those typical for fused silica.
37
3 Literature Review
Among the various mechanical properties measured in his study, Soraru fo-
cused on the discussion about Young’s modulus, which being an intrinsic material
property, as a function of the composition of the dense silicon oxycarbide glasses
obtained at 1200°C, and then related the amount of substituted carbon in the
amorphous oxycarbide network, i.e., the x value in SiO2(1-x)Cx. He observed that,
DHTH0.5 gel lead to a pure oxycarbide glass, with the elastic modulus (102± 8
GPa). For the glasses with excess carbon, i.e, DHTHy with y = 0.75 and y = 1,
elastic modulus of Cfree phase, assumed to be isolated basic structural units, can
be neglected. Moreover, he argued that, when the volumetric percentage of Cfree
is very low, ≤ ≈ 3% (observed for these compositions), than its contribution to
the elastic modulus of the pyrolyzed ceramics should not be important. Accord-
ingly he found the E values of 102 ± 6 GPa for DHTH0.75 and 113 ± 6 GPa for
DHTH1, respectively, and can be assumed to be a direct measure of the elastic
constant of the oxycarbide glasses. He compared these experimental elastic mod-
ulus values with the calculated values on these glasses, which were obtained from
Voigt (Ev) and Reuss (ER) models (using chemical composition, elastic modulus
and volume fraction of different phases), and found them in good comparison.
His work suggest that, the elastic modulus of the amorphous silicon oxycarbide
materials can be estimated from the chemical composition. Accordingly, the pa-
per report (Ev) and (ER) values calculated for all compositions together with
the experimental results. All the measured data, except for the E values from
glasses prepared from gels with 0 ≤ y ≤ 0.3 after pyrolysis at 1000°C, fell well
between the theoretical limits and approaching the Voigt model. This deviation
from the theoretical values was tentatively explained due to the presence of fine
residual porosity. He concluded, the Voigt model shows a strong dependence on
the composition for DHTHy with 0 ≤ y ≤ 0.5 and exhibits a plateau for DHTHy
with 0.5 ≤ y ≤ 1, and exactly the same trend was experimentally observed for
the investigated temperatures.
Renlund compared the properties of a silicone derived silicon oxycarbide glass,
to those of a typical vitreous silica.(66) He observed that the increased average
coordination state of silicon in the oxycarbide glass lead to improved values as
mentioned in Table:3.4.
38
3.5 Formation of Si(M)OC Ceramics; M = Modifiers (Elements or Compounds)
3.5 Formation of Si(M)OC Ceramics; M =
Modifiers (Elements or Compounds)
Inspite of enhancement in the properties, explained in the previous section, two
distinct drawbacks are observed in the processing and properties of silicon oxy-
carbide ceramics. The combination of volatile loss during polymer pyrolysis
and large density difference between the starting polymer and the final ceramic
resulting in large shrinkages, produce difficulty for the monolithic ceramic prepa-
rations. Along with the difficulties in the processing, silicon oxycarbide ceramics
are only stable up to ∼ 1200°C. Hence, researchers worked on different ways and
conditions for facilitating the crack-free processing and improve the high tem-
perature performance of these class of ceramics. Accordingly, modification of the
ceramics by different elements and compounds to produce Si(M)OC ceramics is
reported by many researchers. Modifications can be achieved on different scales
namely, macro (fillers) and molecular (sol-gel method), and will be explained in
the following sections.
3.5.1 Modifications with Fillers
If during pyrolysis, there is unconstraint microstructural relaxation, transient
porosity created by evolving volatiles can be completely eliminated by material
transport and a fully dense body which exhibits maximum shrinkage was ob-
served. However, if microstructural relaxation is completely constrained, a body
which exhibits no shrinkage but possesses a significant porosity is reported. Usu-
ally, a volume reduction as well as residual porosity are observed in real systems.
As a consequence, it is impossible to produce near net-shape, high density mono-
lithic ceramic components from the pyrolysis of preceramic polymers alone. This
made researchers to investigate further the effect of active and passive fillers on
the bulk body processing of ceramics by pyrolysis of preceramic polymers.
3.5.1.1 Inactive Filler Controlled Pyrolysis of Preceramic Polymers
The intrinsic problems of low density and extensive shrinkage associated with
pyrolysis of preceramic polymers can be partially overcome by incorporating
39
3 Literature Review
chemically passive fillers, such as SiC, or Si3N4, into the preceramic polymer.
Schwartz and Roweliffe,(67) derived a model to describe the effect of mixing ce-
ramic powders with preceramic polymers on the pyrolyzed density. Accordingly,
he evaluated a relation for the pyrolyzed density, (ρ’) of the final body as:
ρ′ = ρp(V fp)α+ ρF(V fF) (3.20)
Where ρp, ρF, Vfp, VfF and α, are density of polymer, density of filler, vol-
ume fraction of polymer, volume fraction of filler and polymer’s ceramic yield,
respectively.
In general, Eq. (3.20) holds true for all cases where VfP + VfF < 1 (Vv >
0), where Vv is volume of pores or voids between the filler particles unoccupied
by the polymer. However for the specific case Vv = 0, the sum of Vfp + VfF is
equal to unity and increasing the volume fraction of one component comes at the
expense of the other. As a consequence, when (Vv = 0), Eq. (3.20) reduces to:
ρ′(Vv = 0) = αρp(V fp) + ρF(1− V fp) (3.21)
= ρF − V fp(ρF − ρpα) (3.22)
Together with Eq. (3.20) and Eq. (3.22), the authors described the effect
of filler addition on the pyrolyzed density for any polymer-filler system which
exhibits no volume change during pyrolysis. Eq. (3.20) is valid at low polymer
concentration when the volume of polymer is insufficient to completely fill all void
space between the filler particles (Vv > 0). Eq. (3.22) describes the behavior at
higher polymer concentration where sufficient polymer is present to completely
fill the voids (Vv = 0).
For a given polymer-filler system, the physical properties of the two compo-
nents fix many of the variables in Eq. (3.20) and Eq. (3.22). For example, the
densities of the filler and polymer are fixed and the polymer-to-ceramic yield
is a constant if pyrolysis progresses to completion (fixed T and atmosphere).
Hence, fixing the volume fraction of the filler phase Eq. (3.20) and Eq. (3.22)
reduces to first order linear equations with ρ’ = f (Vfp) only. This model was
explained by plotting the variation in pyrolyzed density (ρ’) as a function of
40
3.5 Formation of Si(M)OC Ceramics; M = Modifiers (Elements or Compounds)
initial polymer volume fraction for a variety of poly(silazanes) filled with Si3N4
powder. A maximum in (ρ’) represents the intersection of the curves for Vfp +
VfF < 1 [Eq. (3.20)] were Vv > 0, and Vfp + VfF = 1 [Eq. (3.22)] were Vv =
0. The corresponding Vfp is the critical volume fraction, Vfc, which represents
the instance when all the voids between the filler particles are filled with the
polymer. The authors observed that when Vfp < Vfc, increasing the polymer
volume fraction actually increases the overall product density. When Vfp < Vfc,
the volume fraction of the filler is essentially a constant and any increase in Vfp
comes at the expense of Vv. As a consequence, the pyrolyzed density increases
linearly as a function of Vfp and Vv decreases proportionally until a maximum ρ’
is reached where Vv = 0. In contrast, when Vfp > Vfc, where Vv = 0, increasing
the Vfp must come at the expense of VfF since the sum Vfp + VfF is now equal
to unity. In addition, since the employed model is restricted to no change in vol-
ume, the reduction in mass of the pyrolyzing polymer must be accommodated by
the creation of porosity. Hence, when Vfp > Vfc, increasing the polymer content
proportionally reduces the filler content which act to reduce product density.
Schwartz and Roweliffe model demonstrated the benefits of adding ceramic
fillers to improve the final density of preceramic polymers; however the model
neglects to address the issue of shrinkage during polymer pyrolysis. Shrinkage
often causes micro-cracking of the resulting product which further reduces prod-
uct density and results in reduced properties. In 1989, Greil et al.(16) developed
models which addressed the effects of inactive fillers on the shrinkage and density
of preceramic polymers. Accordingly, the reduction in total linear shrinkage, εpf,
and residual porosity, Vpfv , of inert filler-polymer systems during pyrolysis, can
be expressed as:
εpf =
{V max
F − V F
V maxF
}εp (3.23)
and
V pfV = (1− V F)V p
V (3.24)
for VF < V∗V and
41
3 Literature Review
V pfV = (1− V F)V p
V + (V F − V ∗F ) (3.25)
for VF > V∗V
Where VpV , V∗
F , VmaxF , VF, and εp are the residual porosity of the unfilled
polymer after pyrolysis, the critical filler loading , the maximum packing fraction
of the filler powder, volume fraction filler, and linear shrinkage of the unfilled
polymer during pyrolysis, respectively. The critical filler loading was defined as
the filler content at which the filler particles form a rigid network on shrinkage
of the polymer matrix phase. Greil reported that, the critical filler loading will
always be smaller than the maximum packing fraction and is related to VmaxF by
V ∗F = V max
F − (1− αβ)(1− V maxF ) (3.26)
Where, β is density ratio i.e., ρp/ρc
Greil predicted influence of filler addition on the expected linear shrinkage
and residual porosity of polymer-inactive filler systems based on Eq. (3.23) and
Eq. (3.25) during pyrolysis. According to the authors, three major regions
can be distinguishes: (1) filler fractions below the critical filler fraction, (2)
filler fractions intermediate between the critical filler fraction and the maximum
packing fraction, and (3) filler fractions above the maximum packing fraction.
When VF is less than V∗V , the mass loss associated with polymer pyrolysis can
be completely compensated for by shrinkage without creating porosity and a fully
dense body which exhibits maximum shrinkage can result. In contrast, when VF
is greater than VmaxF , shrinkage is not possible since the filler particles are already
packed to their densest configuration and the mass loss associated with polymer
pyrolysis is fully accommodated by the creation of porosity. In an intermediate
region, the mass loss of the pyrolyzing polymer can be accommodated by both
shrinkage and porosity. The weight loss associated with the pyrolyzing polymer
can be initially accommodated by shrinkage without creating porosity; however,
when the body shrinks to the point where the particles start to form a rigid
structure, the remaining weight loss of the polymer is accommodated by the
creation of porosity.
Greil demonstrate the usefulness of adding inactive fillers in increasing density
and reducing shrinkage; however, he concluded from his model predictions, a
42
3.5 Formation of Si(M)OC Ceramics; M = Modifiers (Elements or Compounds)
high density material which exhibits no shrinkage cannot be manufactured from
pyrolysis of inactive filler-polymer systems. Accordingly, processing and pyrolysis
conditions can be tailored to produce either a zero shrinkage body which has a low
density or a fully dense body which exhibits significant shrinkage, but cannot be
tailored to produce a fully dense body which exhibits no shrinkage. The authors
claim that in most inactive filler-polymer systems, both shrinkages and porosity
will always result. In fact, research to date by a number of researchers serve as
experimental support for their conclusions.
3.5.1.2 Active Filler Controlled Pyrolysis of Preceramic Polymers
The limitations cited for inactive filler controlled pyrolysis of preceramic polymers
in forming zero shrinkage, high density materials can be overcome by employing
chemically active fillers instead of, or in addition to, inactive fillers. The con-
cept of active filler controlled pyrolysis (AFCOP) of preceramic polymers was
originally proposed by Greil (17) as a potential solution to the inherent problems
of shrinkage and low density associated with pyrolysis of preceramic polymers.
According to the AFCOP concept, in the presence of an active filler, the polymer
pyrolysis reactions can be significantly changed due to the chemical and physical
interactions of the incorporated filler with constituents of the pyrolyzing polymer.
The concept itself is relatively simple in that a chemically active filler, which can
react with pyrolysis products of the polymer or with a reactive atmosphere to
form carbides or nitrides, is incorporated into the preceramic polymer prior to
pyrolysis. For example, an active transition metal filler can react with solid car-
bon pyrolysis product or gaseous hydrocarbon pyrolysis product of the polymer
to form a carbide.
With active filler controlled pyrolysis of the polymers, it is also possible to
use a reactive pyrolysis atmosphere to transform the active filler to a carbide or
a nitride. For example, for carburizing of active fillers, CH4 can be employed,
while for nitridation of active fillers, N2 or NH3 can be employed.
If the specific volume of the resulting filler reaction product is higher than the
sum of the corresponding volumes of the starting active filler phase and the solid
carbon pyrolysis product, a volume expansion is observed during the transfor-
mation. The volume expansion which occurs during active filler transformation
43
3 Literature Review
may then be used to compensate for the shrinkage which occurs during pyrolysis
of the preceramic polymers. Furthermore, in contrast to the shape invariant be-
havior of inactive filler particles which do not change their morphology but only
their inter-particle distances during polymer pyrolysis, active fillers may change
their morphology during reactive transformation. As a result, porosity created
by the pyrolyzing polymer may be occupied by the active filler reaction product,
thereby increasing the final product density. These are the fundamental bases
for the AFCOP concept which allows for the manufacture of zero shrinkage,
high-density composite materials.
Thus dispersion of Ti, Cr, V, Mo, Si, B, CrSi2, MoSi2, etc., in polymers re-
sults in shape-invariant precursor-ceramic conversions in argon or nitrogen at-
mospheres, making formation of components with complex geometries possible.
Typical particle sizes of the active filler powders are 1 to 10 µm, which partly
can be replaced by additional inert filler powders, such as SiC, Si3N4, Al2O3.
The inert filler particles are used to stabilize a homogeneous distribution of
the active filler phase particles by reducing sedimentation effects during pro-
cessing. Based on the AFCOP concept, a variety of novel ceramic composite
materials − such as Si-O-C/TiC, Si-O-C-N/TiN, Si-O-C-N/BN, and Si-O-C-
N/(Cr3C2 + Si3N4) − have been fabricated as bulk components. Greil focused on
poly(silsesquioxane) preceramic polymer, and the resulting composite materials
are characterized by three-dimensional interconnected network of the carbide (py-
rolysis in argon) or nitride (pyrolysis in nitrogen) filler reaction products embed-
ded in the nano-structured polymer-derived Si-O-C matrix.(17),(68) More recently,
authors investigated the development of mullite-SiC nano-composite using the
concept of AFCOP, from commercial polysiloxanes filled with Al2O3, aluminum
and Al/Al2O3.(69),(70) Additionally, poly(silazanes) and poly(carbosilazanes) have
been demonstrated to be suitable reactants for the AFCOP process.(71)
Inspite of the claims from the model explained by Greil, the composite materi-
als produced by the active-filler-controlled reaction pyrolysis process still contain
various amounts of residual porosity. The open porosity can be reduced by well
dispersion of very fine filler particles. The temperature at which the open pores
form and close can be shifted to higher temperatures with increasing external
gas pressure. Improvement in the modulus of rupture, with controlled porosity
(which need improved processing), is demonstrated by many researchers. Along
44
3.5 Formation of Si(M)OC Ceramics; M = Modifiers (Elements or Compounds)
with the room temperature properties, the authors demonstrate enhancement in
the secondary creep property. Because of the high hardness and chemical stabil-
ity of the carbidic or nitridic filler reactant phases, the composite materials offer
a high potential for good wear resistance.
3.5.2 Modification of Preceramic Polymers without Fillers
As mentioned before, the most attractive and challenging features of polymer
pyrolysis process is the possibility of controlling the microstructure and the prop-
erties of the final ceramic material by chemically modifying the polymer compo-
sition and/or its structure. This modification differ from filler-modified system
by the scale of modification, i.e., filler-modified system is on macro/micro scale,
whereas chemical modification is at the atomic scale.
By reacting, in solution, a polycarbosilane (PCS) with a titanium alkoxide, Ya-
jima et al.(30) demonstrated a new polymer called polytitanocarbosilane (PTC)
that gives, after pyrolysis, ceramic material of the Si-Ti-O-C system. He indi-
cate that, fibers produced from this precursor display superior tensile strength
compared with SiC (Nicalon) fibers.
The same reaction motivated Babonneau et al. to modify the polycarbosilane
with different elements just by changing the nature of metal alkoxide. There-
fore, by using this strategy, it was possible to prepare a large variety of new
metal−organic polymers, precursors for Si-M-O-C systems. Babonneau’s at-
tention was first focused on Si-Ti-O-C system, and then on two new systems,
Si-Al-O-C and Si-Zr-O-C(72),(73) and more recently along with Soraru et al. on
Si-B-O-C(74),(75) and Si-Al-O-N(76) system. The main goals for these studies were
the following:
1. A structural characterization of the polycarbosilane-modified precursor to
understand how the metallic alkoxide react with the polycarbosilane, and
2. A study of the structural evolution of the material during the pyrolysis to
see the influence of the extra metallic atoms on crystallization process
45
3 Literature Review
3.5.2.1 Structural Characterization of Si-Al-O-C Polymers
From the above mentioned systems, we will only focus our interest on Si-Al-O-
C and Si-Al-O-N systems, as they provide basic background for present work.
Accordingly, polyaluminocarbosilane (PALC) was synthesized from (PCS)∗ and
aluminum sec-butoxide with xylene as a solvent. This polymer, after distilla-
tion of solvent, is cross-linked by heating to around 300°C. 29Si, 13C and 27Al
MAS-NMR was used for structural investigation of PALC. The author observed
that the structure of the (PCS) is not greatly modified during the reaction with
the aluminum alkoxide, from 29Si NMR data.(73) Also, for the aluminum envi-
ronment, both 13C and 27Al show an extensive hydrolysis of the butoxy groups,
certainly due to a high reactivity of the aluminum alkoxide towards moisture.
She concludes saying, this precursor could be described as a mixture of (PCS)
chains and Al(OH)3-based particles. Chemical bonding between the two compo-
nents could exist via Si-O-Al bonds that should give rise to a 29Si NMR peak
around 10 ppm [C3(Si)O] sites. Authors did not observe any such component in
the 29Si spectra,(77),(73) however, the presence of these bonds cannot be rejected
but should involve only a small number. Additionally, Wootton et al.(77) with27Al spectra reported, tetrahedral [Al(4)] and octahedral [Al(6)] coordination,
where [Al(6)] being the preferred coordination.
3.5.2.2 Pyrolysis Process to Si(Al)OC Ceramics and Post Treatment
Characterization
Babonneau et al.(73) compared the pyrolysis process, and subsequent heat-treat-
ment up to 1700°C, for PALC to that with PCS, the summary for this research is
presented in the following paragraphs. As already mentioned, a pure PCS starts
to crystallize around 1200°C, and, up to 1700°C, show the presence of SiC-3C
polytype. Also, 29Si MAS-NMR indicated the presence of 3C polytype (main
peak centered at -16 ppm) and α polytypes (with two minor peaks at -20 ppm
and -25 ppm).
In contrast, PALC system, reveal presence of SiC-3C polytype at 1100°C.
Above 1300°C, the evolution of the system differs from the pure PCS system. At
and above this temperature, a noticeable amount of SiC-2H which increases with
∗Dow Corning Corp., Midland, MI
46
3.6 Kinetics of the Process
temperature was reported. At the same time, the 29Si NMR spectrum presents
an increase of the -16 ppm peak to -19.9 ppm (3C polytype is known to give a
main peak around -16 to -18 ppm). This difference seems to be related to some
disorder inside the polytype. As for the 2H polytype, only one type of silicon sites
are present. No NMR spectrum has been reported yet, but the corresponding
chemical shift has been predicted to be at -31 ppm. Author, tentatively assigned
this peak at -19.9 ppm to silicon sites in the 2H polytype and indicated that
the difference in chemical shifts from the calculated value could be due to the
presence of aluminum atoms in the silicon environment.
Babonneau concluded that, the formation of 2H polytype seems the be related
with the presence of aluminum atoms. This is because the aluminum oxycarbide
Al2OC with the wurstite structure is isostructural to the SiC-2H and can favor the
formation of this polytype. It assume the formation of an aluminum oxycarbide
phase inspite to explain the SiC-2H phase found by XRD in the pyrolyzed sample.
However, unavailability of the 27Al NMR data on the crystalline phase Al2OC
unable author for precise description of the aluminum environment.
Babonneau et al.(73) and Wotton et al.(77) in their 27Al MAS NMR investiga-
tion, observed disordering of the material up to 850−900°C with only a broad
peak centered around 30 ppm. This peak covers the chemical shift range of
Al−O bonds. The peak position of ∼ 28 ppm indicate penta-coordinated alu-
minum Al(5). Also, the transformation of Al(5) to Al(4) [55 ppm] and mainly
Al(6) [1 ppm] with temperature, indicate a unique phase formation; namely
mullite. However, the possibility of Al-C bond (in very small amount) cannot be
ignore, and a extra peak at 140 ppm at high temperature was referred to be the
signature of these bonds.
3.6 Kinetics of the Process
The dependence of high temperature on the crystallization, oxidation and flow
(deformation) with time; i.e. kinetics, is investigated in this research. The ther-
modynamics of the various structural states of materials governs the transfor-
mation from one state to another, as well as the reaction. However, although a
negative free energy change is a necessary prerequisite for a material transfor-
47
3 Literature Review
mation to occur, it is not guarantee that it will do so at any measurable rate.
The rate depends on the mechanism of the reactions involved and may bear no
relation to the magnitude of the free energy reduction which drives the transfor-
mation. This is illustrated by the effect of catalyst on chemical reactions − they
do not change the free energy of the phases but do provide a faster mechanism.
If kinetics are determined by factors other than ∆G, it is necessary to consider
the states through which a system passes during the transformation. Equilibrium
thermodynamics does not describe these states and so need some additional con-
cepts to be able to deal with the transformation rates. In this section some basic
ideas of kinetic theory, and methods for extracting information from laboratory
experiments with transformation rates will be explained.
At equilibrium, when ∆G = 0, no transformation can take place. Some over-
stepping is always required to provide the free energy reduction. Laboratory
experiments are carried out at higher temperatures, far from equilibrium, where
reactions proceed at a measurable rate, and the data are extrapolated to lower
temperature, near equilibrium, where reaction rates are much slower.
3.6.1 Basic Theories
The problem of the pathways through which a material system passes during
a transformation from the initial to final state is done by defining an activated
state which has some intermediate configuration. This is a ‘quasi-equilibrium’
approach an unique values of the thermodynamic functions to this activated state
is assigned. The shape of the free energy curve is a consequence of the fact that
if the initial and the final stages are in equilibrium (either stable or metastable),
their free energies must be at minima, and any pathway from one to another
must pass through a maximum.
The free energy of activation ∆Ga depends on the reaction pathway, and in
heterogeneous reactions is independent of the thermodynamics of the initial and
the final states. The pathway with the lowest ∆Ga will be the one taken. A
necessary condition for a transformation to takes place at a measurable rate is
that sufficient atoms have enough energy to achieve the transition state. This
energy is supplied by thermal fluctuations. At all temperatures above 0 K atoms
are in motion, collisions between them producing wide variations in the energy
48
3.6 Kinetics of the Process
of individual atoms, with some having energies greatly in excess of the mean.
This concept of an activation energy barrier qualitatively explains a number
of following features of material reactions:
1. the persistence of metastable states, due to ∆Ga being very large compared
to the mean free energy,
2. the effect of catalysts which change ∆Ga, i.e., provide a reaction path with
lower free energy of activation, and
3. the slow rate of many transformations, due to the fact that, at any one
time, only a small number of the available atoms have sufficient energy to
overcome the activation energy barrier.
3.6.2 Rate of a Single Thermally Activated Process
For a process which involves only one basic atomic step, characterized by the
unique activation energy ∆Ha, the rate equation can be formulated as follow:
Rate ∝ p · ν · exp
{−∆Ha
RT
}=
dy
dt(3.27)
1. the frequency with which atoms attempt to jump from one site to the next,
i.e. the vibrational frequency ν.
2. the fraction of atoms with enough energy to surmount the activation energy
barrier, i.e,
f = exp
{−∆Ha
RT
}
3. the probability p that the atom which has required energy satisfies some
geometrical conditions i.e jumping in the right way.
Here it is necessary to discuss little between the free energy Ga and Ha. The
assignment of the thermodynamic functions to the activated state includes values
49
3 Literature Review
of internal energy U a, volume V a, enthalpy H a and entropy S a. The Gibbs free
energy Ga for the activated state is:
Ga = Ha − TSa (3.28)
where the subscript refer to the activated state.
For most solid state reactions at low pressures, the volume changes is small
and hence the changes in enthalpy ∆H a is approximated to the internal energy of
the activated state. The term activation energy is commonly used, although it is
very important to note that this is not the same as the free energy of activation.
The activation energy is the difference between the internal energy (or en-
thalpy) of the transition state and the initial state. The curve is similar to the
one for free energy except that the overall enthalpy change ∆H for the transfor-
mation may be positive or negative. If ∆H is positive the reaction is endothermic,
while if ∆H is negative the reaction is exothermic.
Form Eq. (3.27) with the dependence on the free energy of activation ∆Ga the
probability p is related to the entropy of activation ∆S a in the following way:
p =ωa
ωI
(3.29)
i.e the number of complexions associated with the transition state to that asso-
ciated with the initial state. The probability of a correct atomic jump is related
to the number of possible pathways for the transformation.
Since
∆Sa = Rlnωa
ωI
p = exp
{∆Sa
R
}
Therefore;dy
dt= ν · exp
{∆Sa
R
}exp
{−∆Ha
RT
}Since; Ga = Ha − TSa
dy
dt= νexp
{−∆Ga
RT
}(3.30)
50
3.6 Kinetics of the Process
More commonly we write
dy
dt= A · exp
{−∆Ha
RT
}(3.31)
where the pre-exponential factor A is known as the frequency factor. Eq. (3.31)
is known as the Arrhenius equation.
A plot of lndydt
against 1/T is termed as Arrhenius plot :
lndy
dt= lnA− −∆Ha
RT(3.32)
and if both A and ∆H a are independent of temperature, this is linear with a
gradient -∆Ha/R and an intercept on the rate axis of lnA. The magnitude of
∆Ha describes the temperature dependence of the reaction rate while the pre-
exponential A, which contains the entropy of activation term, determine the
absolute reaction rate.
3.6.3 Rate Equations for Heterogeneous Reactions
Reactions which involve nucleation and growth of the product phase(s) within
the parent phase are termed heterogeneous. Empirically it is found that the
isothermal kinetics of a wide range of materials can be described by an equation
of the general formdy
dt= kn · tn-1(1− y) (3.33)
where k is a rate constant, t is the time, y is the fraction transformed and n is
a constant which depends on the mechanism.
Separating the variables and integrating gives∫dy
1− y=
∫kn · tn-1dt
lndy
1− y= (kt)n
where the term 1/n has been incorporated into the constant. This can also be
51
3 Literature Review
written
y = 1− exp(−kt)n (3.34)
Where rate constant k has dimension time-1 and is defined as the effective overall
reaction rate, which is usually assigned an Arrhenian temperature dependence
like that in Eq. (3.31).
Eqs. (3.34) and (3.31) have served as the basis of nearly all treatments of
crystallization in DTA or DSC experiments. It should be noted, however, that
Eq. (3.34) strictly applies only to isothermal experiments. Nevertheless, Eq.
(3.34) has been extensively used to derive expressions describing non-isothermal
crystallization.
Various authors summarized different treatments of non-isothermal crystalliza-
tion based on Eq. (3.34) and Eq. (3.31) and assuming a constant heating rate
in the DTA and DSC experiments and is reviewed by Yinnon and Uhlmann et
al.(78). The goal of all the methods is to identify two parameters, which, when
plotted one against the other, will result in a straight line. From the slope of
such line, the overall effective activation energy, E, or the order of reaction can
be calculated. It is shown by Moynihan et al.(79) that under certain conditions
the dependence of the transition on the heating or cooling rate β is given by:
d(lnβ)
d(1/T s)=−Es
R(3.35)
where β, Es, T s are the heating rate, activation enthalpy and the softening
temperature respectively. His theory is used to calculate the softening/relaxation
kinetics of many glasses.
The activation energy for crystallization and the Avrami constant or a shape
factor is estimated from non-isothermal analysis using Kissinger theory:
lnβ
(T p)2=−Ecry
RT p
+ C (3.36)
where β is the heating rate, T p is the peak temperature, E cry is the activation
energy for crystallization, R is the gas constant and C is a constant. The crystal-
lization mechanism can be determined from the factor (n), which is determined
52
3.7 Thermo-Mechanical Behavior
as:
n =2.5R(T p)
2
∆TEcry
(3.37)
Where, ∆T is full-width-half-maximum (FWHM). Accordingly, various phe-
nomenon can be quantified by estimating the rate of the reaction and the ac-
tivation energies, namely, glass structural relaxation and crystallization. In the
present work this kinetic data will be compared with viscous flow of SiAlOC
ceramics.
3.7 Thermo-Mechanical Behavior
3.7.1 Developments in Thermo-Mechanical Behavior for
Si(C)O Systems
All the research for incorporating carbon in the silica network was aimed to im-
prove the room temperature mechanical properties. Indeed, in doing so the high
temperature properties can also show improvement in the thermo-mechanical
properties and inspite of early development of SiOC glasses it took last decade
for creep investigation of this class.
The creep viscosity and its temperature dependence is recently reported by
Rouxel et al.(80) The viscosity coefficient (η), hereafter referred as viscosity, was
reported and calculated from the strain-rate (ε) versus stress (σ) data, recorded
during a three-point bending creep test (span length = 15 mm) in nitrogen at-
mosphere (tight chamber), on the rod-shaped specimens, using silicon carbide
pistons and device. The specimen deflection (u) was measured in situ by means
of a differential device using a linear variable displacement transducer. The com-
position used for this method was denoted as DHTH0.5 or TREOS/MDMD2/1
and DHTH1 or TREOS/MDMD1/1 the details are given in Table: 3.2. The creep
deformation is studied for two different temperature ranges: 1000−1200°C and
1200−1400°C and the obtained flow properties are discussed below.
Although between 1000−1200°C contains the transition region for vitreous
silica, the oxycarbide viscosity is very high, above 1014 Pa.s, up to 1200°C. Fur-
thermore, the difference between the data of the SiOC glass and of fused silica
increases with rising temperature, and the apparent activation energy for flow is
53
3 Literature Review
much smaller for the oxycarbide glass (∆Ga 296 kJ/mol) than for silica (∆Ga
≈ 500−700 kJ/mol). A transition temperature of 1350°C, identical to that re-
ported by Renlund et al.,(66) is reported by extrapolation of the viscosity curve
of the oxycarbide glass to the conventional viscosity range of 1012−1012.6. This
transition temperature of 1200 to 1300°C has already been reported for the grain
boundary glassy phase of a Si3N4/SiC nano-composite, suggesting that some
carbon was present in the glass network. This difference in viscosity values are
coming from the introduction of covalently bonded carbon to silicon. Also in this
temperature range the authors observed 3% rise in the elastic modulus though
there is no crystallization detected by XRD. This increase is due to a structural
relaxation phenomenon and to the concurrent densification.
In the higher temperature range (1300-1400°C) the flow kinetics are influenced
by crystallization. Before this region between 1150°C to 1215°C, the SiOC system
follow a creep-hardening. At and above this temperature crystallization process
starts and leads to the formation of β-SiC nano-crystals. The average size of
crystallites, as estimated from the XRD spectra, was 2.5 nm. The crystalliza-
tion process resulted in a composite microstructure where β-SiC crystals were
dispersed almost homogeneously, although some relatively large crystals (5−8
nm in diameter) are also formed. It is reported that the hardening behavior is
dependent on the composition (or free carbon) and is pronounced in the case of
DHTH1 grade. Rouxel suggested that because of the strain hardening mentioned
above in the intermediate temperature range, the values of viscosity increases
sharply. This viscosity value is dependent on the volume fraction of SiC, size of
the particles and are fitted on model derived from analogy between pure Hookean
elasticity and Newtonian flow. However, no time hardening effect was observed
by the authors for the DHTH0.5 glass on the strain rate vs. time curve. This is
probably because the SiC volume fraction is not large enough to affect noticeably
the viscous flow. Therefore, the only incidence of the presence of SiC would lie
in the tendency for the activation energy for flow to be higher above 1200°C,
getting closer to the value for a pure silica glass, as is expected from the decrease
of the carbon content in the residual glass that follows crystallization.
Here we report the effect of aluminum modification on the thermo-mechanical
property development in SiOC ceramic system and compare it with the above
research.
54
3.8 Oxidation Resistance
3.8 Oxidation Resistance
Silicon based ceramics and composites are prime candidate for heat engines and
heat exchanger structural components. In such applications these materials are
exposed to combustion gases at high temperature. The following discussion is
aimed to review the current state of knowledge of the interacting oxidizing at-
mospheres, mainly air or oxygen on Si-based ceramics, for e.g. SiC and Si3N4.
3.8.1 Oxidation Review on Silicon Based Ceramics
The focus of this section is on the fundamental studies of SiC and Si3N4 oxi-
dation. These studies provide an atomistic understanding of the mechanism of
SiO2 scale growth. These include determining the slow reaction step (or steps)
and understanding the diffusion mechanism.
SiO2 has some unique properties that influence its performance as a protective
oxide. In most oxidation experiments SiO2 forms as an amorphous film and then
crystallizes to either cristobalite or tridymite. It is generally accepted that the
mobile species is oxygen, not silicon. For this reason the chemical reaction occurs
at the SiO2/Si or SiO2/ceramic interface.(81) Transport through SiO2 can occur
by diffusion of molecular oxygen as interstitials or by network exchange of ionic
oxygen. The latter is referred to as either “network exchange diffusion” or “ionic
diffusion”. It is noteworthy to say that the molecular oxygen diffusion coefficient
is roughly 106 times greater than the ionic oxygen diffusion coefficient.
3.8.1.1 Oxidation of Silicon
Before discussing the oxidation of ceramics, namely SiC and Si3N4, it is appro-
priate to discuss the oxidation of pure silicon. The classic paper in this area is
by Deal and Grove.(82) They view oxidation as consisting of three distinct steps.
The three steps are: transfer of the gaseous oxidant to the outer surface of the
oxide film, diffusion through the oxide film, and reaction of the oxide/silicon in-
terface. From this steps they derived the following linear-parabolic relationship:
x2 + Ax = B(t+ τ) (3.38)
55
3 Literature Review
where
x = scale thickness
B = Parabolic constant
t = time
τ = time shift corresponding to the presence of initial oxide layer
The quantity B/A is the linear rate constant and the parabolic rate constant is
given by
B =2DeffC
*(O2)
No
(3.39)
where
Deff = Diffusion coefficient through the film
C*(O2) = Equilibrium concentration of oxidant in the scale
No = Number of oxygen molecules incorporated in the SiO2 scale per unit volume.
For short oxidation times, oxidation follows a linear rate law. The physical
interpretation of the linear region is still controversial; it has been attributed to
interface control or to diffusion control which is non-parabolic due to strain effects
in the oxide. For longer times, oxidation follows parabolic law, and diffusion
through the thicker oxide is rate controlling.
An activation energy can be determined from a plot of lnB vs 1/T. The mag-
nitude of the activation energy can reveal useful information about the diffusion
process. Calculation of the parabolic rate constant that are based on the molec-
ular oxygen diffusion coefficient show good agreement with the measured values,
and the activation energy for parabolic oxidation is close to that for molecu-
lar oxygen diffusion through SiO2. Thus it is generally accepted that molecular
oxygen diffusion through the SiO2 layer is rate controlling.
3.8.1.2 Oxidation of Silicon Carbide (SiC)
The oxidation of SiC is more complex. Here, we have a countercurrent of gas.
Note that, No from Eq:3.39 must be modified for SiC oxidation due to the for-
mation of CO. The following reaction is generally accepted:
SiC(s) + 1.5O2(g) = SiO2(s) + CO(g) (3.40)
56
3.8 Oxidation Resistance
However the actual process may involve other reactions. The production of
CO in the oxidation of SiC has been reported in the literature, although the
possibility of further oxidation to CO2 must be considered. There has been no
clear observation of the production of elemental carbon. Note that, even though
the reaction leads to a net weight gain, there is also some weight loss due to gas
evolution. These reactions may be monitored by following net weight gain, scale
thickness as a function of time, or even gas evolution. Mainly the first method,
i.e., change in weight with time during oxidation is used and the parabolic growth
law of type indicated in Eq. (3.41) is used.(∆m
A
)2
= Kp(T ) ∗ t+ constant (3.41)
where, ∆m being the mass gain, A the sample surface, t the oxidation time, T
the temperature, and K p(T ) is the parabolic constant.
The oxidation process of SiC involves five steps:
1. Transport of molecular oxygen gas to the oxide surface.
2. Diffusion of oxygen through the oxide film.
3. Reaction at the oxide/ceramic interface.
4. Transport of product gases through the oxide film.
5. Transport of product gases away from the surface.
The key question concerns the rate-controlling steps. Another question deals
with the transport mechanism through the SiO2 scale. Is it permeation through
the network by oxygen molecule or a network exchange mechanism of O2-? Even
less is known about the transport mechanism of the product gasses outward
through the SiO2 scale.
The key observations for the oxidation of SiC ceramics have been summarized
by several investigators.(83), (84) Many investigators have observed a brief (<<
1h) linear region followed by a parabolic region. The focus of most investigators
has been on the parabolic region. We now discuss three rate-controlling steps:
57
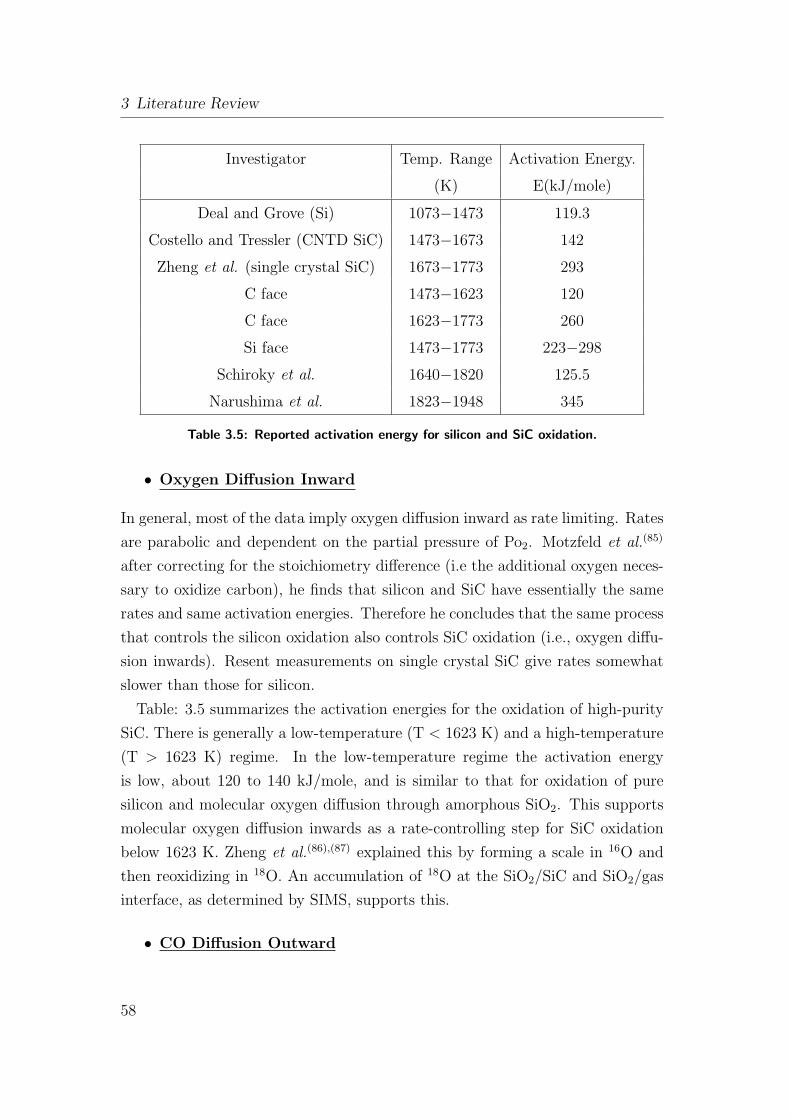
3 Literature Review
Investigator Temp. Range Activation Energy.
(K) E(kJ/mole)
Deal and Grove (Si) 1073−1473 119.3
Costello and Tressler (CNTD SiC) 1473−1673 142
Zheng et al. (single crystal SiC) 1673−1773 293
C face 1473−1623 120
C face 1623−1773 260
Si face 1473−1773 223−298
Schiroky et al. 1640−1820 125.5
Narushima et al. 1823−1948 345
Table 3.5: Reported activation energy for silicon and SiC oxidation.
• Oxygen Diffusion Inward
In general, most of the data imply oxygen diffusion inward as rate limiting. Rates
are parabolic and dependent on the partial pressure of Po2. Motzfeld et al.(85)
after correcting for the stoichiometry difference (i.e the additional oxygen neces-
sary to oxidize carbon), he finds that silicon and SiC have essentially the same
rates and same activation energies. Therefore he concludes that the same process
that controls the silicon oxidation also controls SiC oxidation (i.e., oxygen diffu-
sion inwards). Resent measurements on single crystal SiC give rates somewhat
slower than those for silicon.
Table: 3.5 summarizes the activation energies for the oxidation of high-purity
SiC. There is generally a low-temperature (T < 1623 K) and a high-temperature
(T > 1623 K) regime. In the low-temperature regime the activation energy
is low, about 120 to 140 kJ/mole, and is similar to that for oxidation of pure
silicon and molecular oxygen diffusion through amorphous SiO2. This supports
molecular oxygen diffusion inwards as a rate-controlling step for SiC oxidation
below 1623 K. Zheng et al.(86),(87) explained this by forming a scale in 16O and
then reoxidizing in 18O. An accumulation of 18O at the SiO2/SiC and SiO2/gas
interface, as determined by SIMS, supports this.
• CO Diffusion Outward
58
3.8 Oxidation Resistance
Some investigators have attributed the higher activation energies at higher tem-
peratures to a transition to CO-diffusion-outwards rate control. Two factors
tend to discount this. Zheng et al. have oxidized SiC and examined the resul-
tant scale by using SIMS. They found no carbon gradient, as one would expect if
CO diffuses outwards slowly. Thermodynamic arguments also support the rapid
transport of CO outward. Suppose the reverse is true and CO diffuses outwards
slowly. Then Po2, at the SiC/SiO2 interface must be close to 1, and, as required
by diffusion control, Eq. (3.40) equilibrium is maintained; the Pco has a value of
about 1027 bar at 1600 K. Extremely high pressure would be expected to blow
the scale off, but this is not observed.
• Interfacial Reaction
The other possibility for rate control is interfacial reaction. Some investigators
have reported linear reaction rates for the silicon face of the single crystal SiC,
which is attributed to interfacial reaction control.(88) However most of the data
for pure SiC indicate parabolic kinetics for the majority of the reaction period.
However, most of the data for pure SiC indicate parabolic kinetics for the ma-
jority of the reaction period.
However, the situation is not so clear. The most resent data indicate that single
crystal SiC has rates slower than that of pure silicon, even with the stoichiometry
correction. Furthermore, the assumption of oxygen diffusion inward and CO
diffusion outward assumes that one is fast and the other is slow. Although CO
is polar and molecular oxygen is not, it is difficulty to imagine that they would
have dramatically different permeation properties. These three facts make it
difficult to accept that oxygen diffusion inwards as completely rate controlling.
Physical phenomenon do not always fall into distinct categories. As Luthra
reports,(83) it may be that a mixed control mechanism is operative and both
diffusion and the interface reaction are rate controlling. Because of the different
rates of single-crystal SiC and silicon, Luthra advocates mixed interface and CO
diffusion outward control. However, the limited evidence for high CO pressure at
the SiO2/SiC interface and lack of a carbon gradient tend to oppose CO diffusion
outwards.
59
3 Literature Review
3.8.1.3 Additive Containing Materials
The discussion thus far has centered on highly pure materials oxidizing in pure
oxygen for short times and forming amorphous SiO2. The situation in actual
is more complex. First, consider isothermal oxidation of less pure materials.
In the actual situation the amorphous scale may often crystallize because of
impurities in the substrate or water in the environment. Generally it crystalizes
to cristobalite. In general, transport in cristobalite is slower than transport in
amorphous SiO2. Costello and Tressler(84) have correlated a slowing of reaction
rates with crystallization of the oxide scale. The exact nature of crystallization is
highly dependent on impurities in the specimen and/or the atmosphere. However,
for sintered α-SiC with boron and carbon additives, crystallization begins at the
SiO2/SiC interface and spreads to the surface.(81),(89)
Densification aids in SiC have an even more complex effect. The refractory
oxide additives, such as magnesium oxide (MgO), alumina (Al2O3) and yttria
(Y2O3), tend to migrate out to the SiO2 scale and form the corresponding
silicate.(90),(91),(92) The additives are initially present as a grain-boundary sili-
cate glasses. The initially pure SiO2 layer creates a gradient and a driving force
for the cations to diffuse into this glass. The free energy of silicate formation
in the surface SiO2 is a second driving force. Enough aluminum diffuses into
the scale to form an aluminosilicate. Generally this phase appears to accelerate
rates. In the case of SiC sintered with boron and carbon sintering aids, boron
diffuses into the scale. It creates a lower viscosity scale, which leads to somewhat
higher oxidation rates over pure SiC.(91),(93)
More recently, the oxidation behavior of SiC ceramics with aluminum nitride
(AlN) and rare-earth oxides (Y2O3, Er2O3, Yb2O3) as sintering additives has
been characterized.(94) It is postulated that the amount of aluminum in the sin-
tering additives, the cationic radius of rare-earth oxides, densification, and an-
nealed atmosphere, and the formation of compatible oxidation product to SiO2
contributes to the superior oxidation resistance of the SiC ceramics.
Luthra et al.(88), reported oxidation studies on Al2O3−SiC and mullite−SiC
composites at 1375°C to 1575°C in O2. The reaction product contained alumina,
mullite, an aluminosilicate liquid, and gas bubble. The parabolic rate constant
were about 3 orders of magnitude higher than those expected for the oxidation
60
3.8 Oxidation Resistance
of SiC. Higher rates are caused by higher oxygen permeabilities through the
reaction product than through pure silica.
3.8.2 Oxidation of SiOC Ceramics (Fibers and Powder)
Till date, oxidation of silicon oxycarbide phase is explained with the help of
Nicalon fibers. Polycarbosilane−(PCS) derived SiC fibers (Nicalon and Hi−Nica-
lon, Nippon Carbon Co., Tokyo, Japan) used for these investigation have a mi-
crostructure composed of β-SiC crystallites, free carbon, and an amorphous sil-
icon oxycarbide phase SiCxOy phase.(95) In particular, Nicalon fibers have large
amount of SiCxOy phase, which generates both SiO and CO gases to crystal-
lize into β-SiC at 1500°C. Although both oxidation of free carbon and thermal
decomposition of the SiCxOy phase yield mass loss, passive oxidation of β-SiC
crystallites causes mass gain. Finally, passive oxidation of the Nicalon fibers is
thought to yield mass gain and will be explained below.
Recently Chollon(96) investigate various fibers in Si-C-N-O system. In this
study he discussed oxidation of Si-C-O, Si-C-(O), Si-C fibers. These fibers are
processed by spinning polycarbosilane and is referred by famous name, namely
Nicalon. Changing the processing condition changes the oxygen and free carbon
level of the final ceramic fiber. For example, curing the fiber in air increases
the oxygen content and is referred as Si-C-O fiber, whereas curing the fiber with
electron beam result in lower oxygen level but contain excess free carbon. It
has been proven that the first two systems, i.e., Si-C-O and Si-C-(O) contain
amorphous silicon oxycarbide phase on the surface but is absent for the third
system, namely Si-C.
As mentioned earlier, the oxidation of pure SiC is controlled by Eq. (3.40).
The rate controlling step imposing the oxidation rate for SiC below 1400°C, is
generally admitted to be the permeation of O2 through the silica scale inward.
The Si (0001) face of a SiC single crystal exhibits significant lower parabolic
oxidation rates and a higher activation energy than the C (000-1) face.(84) More
recently, the same conclusion were reported and extended to highly textured
CVD-SiC.(97),(98) This behavior was suggested to arise from the presence of a
Si-C-O sublayer appearing only for the slow oxidation rate faces of the SiC single
crystal and the CVD-SiC film. This sublayer, more resistant to oxygen diffusion,
61
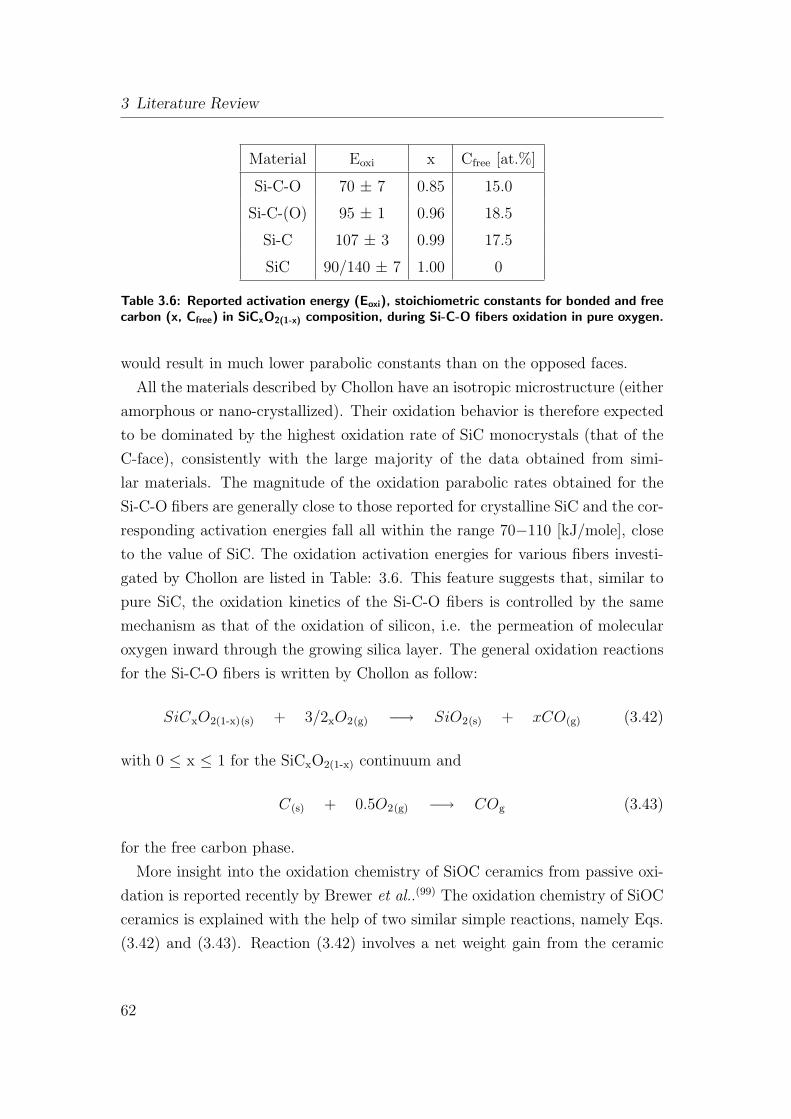
3 Literature Review
Material Eoxi x Cfree [at.%]
Si-C-O 70 ± 7 0.85 15.0
Si-C-(O) 95 ± 1 0.96 18.5
Si-C 107 ± 3 0.99 17.5
SiC 90/140 ± 7 1.00 0
Table 3.6: Reported activation energy (Eoxi), stoichiometric constants for bonded and freecarbon (x, Cfree) in SiCxO2(1-x) composition, during Si-C-O fibers oxidation in pure oxygen.
would result in much lower parabolic constants than on the opposed faces.
All the materials described by Chollon have an isotropic microstructure (either
amorphous or nano-crystallized). Their oxidation behavior is therefore expected
to be dominated by the highest oxidation rate of SiC monocrystals (that of the
C-face), consistently with the large majority of the data obtained from simi-
lar materials. The magnitude of the oxidation parabolic rates obtained for the
Si-C-O fibers are generally close to those reported for crystalline SiC and the cor-
responding activation energies fall all within the range 70−110 [kJ/mole], close
to the value of SiC. The oxidation activation energies for various fibers investi-
gated by Chollon are listed in Table: 3.6. This feature suggests that, similar to
pure SiC, the oxidation kinetics of the Si-C-O fibers is controlled by the same
mechanism as that of the oxidation of silicon, i.e. the permeation of molecular
oxygen inward through the growing silica layer. The general oxidation reactions
for the Si-C-O fibers is written by Chollon as follow:
SiCxO2(1-x)(s) + 3/2xO2(g) −→ SiO2(s) + xCO(g) (3.42)
with 0 ≤ x ≤ 1 for the SiCxO2(1-x) continuum and
C(s) + 0.5O2(g) −→ COg (3.43)
for the free carbon phase.
More insight into the oxidation chemistry of SiOC ceramics from passive oxi-
dation is reported recently by Brewer et al..(99) The oxidation chemistry of SiOC
ceramics is explained with the help of two similar simple reactions, namely Eqs.
(3.42) and (3.43). Reaction (3.42) involves a net weight gain from the ceramic
62
3.8 Oxidation Resistance
however, reaction (3.43) produce a net weight loss. Inspite of these simple re-
actions, discerning between the two of them or the extent to which each takes
place is not a trivial matter.
Brewer et al. approached the oxidation insight with four different materials
derived form silsesquioxane-based precursors over the temperature range of 600
to 1200°C. The four different materials have following compositions: SiO1.24C4.08,
SiO1.30C2.41, SiO1.28C1.39, SiO1.35C1.14. These compositions produce Si-C ratios
of 0.38, 0.35, 0.36, 0.325 and free carbon (Cfree) of 90.6, 85.4, 74.1 and 71.5%,
respectively. The authors found that, a combination of techniques both qualita-
tive: visual experience and optical microscopy and quantitative: weight and the
compositional change combine to yield a reasonable picture of the changes that
takes place upon oxidation of SiOC’s.
For all compositions, Brewer reported weight loss at all oxidation temperatures
studied. The weight loss is highest for the ceramic whose composition contains
the maximum excess carbon. Even those most oxidatively stable compositions,
with the lowest amount of excess carbon, show continued weight change at all
the temperatures. Interestingly he observed that, the highest weight loss and
appearance of the powder after oxidation (changing it to white) are not associated
with the highest oxidation temperatures. There is an retention of the black color
even after long times (100 h) at 1200°C while at 800 the same material appears
gray in less than 30 min of exposure. He argued that, these differences at different
temperatures likely lies in the relatively rates of the two reactions shown in Eqs.
(3.42) and (3.43). At lower temperatures (600 to 800°C) Eq. (3.43) dominates
the initial oxidation chemistry causing porosity. This increase in the porosity
gives oxygen access to essentially all the samples allowing the higher oxidation of
the Si−C bonds Eq. (3.42) to proceed through the entire material. Additionally,
at higher temperatures (1000 and especially 1200°C) the rates of two reactions
are more comparable. The reaction product of Eq. (3.42) form an expanded
silica barrier at the surface of the material, which slow the diffusion of oxygen
and, therefore, inhibits oxidation from proceeding rapidly throughout the entire
material.
Brewer et al. extracted more information about the chemistry that takes place
in oxidation, by analyzing the changes in equivalents of Si−C bonds, Si−O bonds
and equivalents of excess carbon after oxidation. He observed that, there is a
63
3 Literature Review
very rapid initial chemistry that takes place, loss of excess carbon and oxidation
of Si−C bonds to form Si−O bonds in the first hours of oxidation. In general, this
research illustrate how dramatic the composition change is for the high carbon
material upon oxidation and the relative ‘stability’ of the low carbon material.
He elaborate the oxidation chemical change of two composition: one with high
free carbon and the other with low.
For high free carbon containing material, a quantitative analysis show that the
excess carbon disappear quickly and the silicon species is completely converted
to SiO2 within 5 hours of exposure at 600 and 800°C. But at higher temperature
this material behave differently i.e., between the time domain of 100 and 200 h
of oxidation, all of the Si−C bonding is oxidized but excess carbon persists even
after 500 h of oxidation. In contrast, the low free carbon containing material
undergoes a very rapid initial oxidation (within the first 15 min) followed by a
rather slow continuous change even after 500 h regardless of the temperature
examined. The free carbon and Si−C bond equivalents are still presents even
after this long oxidation time. This indicate that the free carbon content controls
the oxidation process.
Brewer attempt to quantify these differences in oxidation by calculating the
slope of both excess carbon and the Si−C bonds equivalence for low and high
excess carbon containing material. This analysis demonstrated that those mate-
rials with significant amounts of carbon continue changing at a faster rate than
those with small amount of excess carbon after this initial oxidation. These high
carbon materials will continue to change until they are completely oxidized to
SiO2. This oxidation of the high carbon material is significantly faster at 600
or 800°C compared to 1000 or 1200°C. The low carbon materials continue to
change after this initial oxidation but at the slow rate.
No real oxidation investigation of bulk SiOC ceramics is reported. This re-
search hence focus on the oxidation resistance study of SiOC bulks and ahead
look into the effect of modifying the ceramic chemistry by aluminum on oxidation
and change in surface morphology.
64
3.9 Applications
3.9 Applications
Although a large variety of silicon containing polymers with high ceramic yields
have been developed, only low-dimension products, such as fibers and thin films,
have found wide application. To date, most preceramic polymers have been
employed as precursors to ceramic fibers, matrices, and as binders for ceramic
powders. The applications will be briefly reviewed in the following section.
3.9.1 Polymer Derived Ceramic Fibers
The most notable application of preceramic polymer technology to date is in
the manufacture of non-oxide ceramic fibers. Preceramic polymer technology
has been utilized almost exclusively to prepare silicon carbide, silicon nitride,
or amorphous silicon carbonitride fibers. Synthesis of hybrid continuous sili-
con carbide-titanium carbide fibers through sol-gel processing is reported.(100)
These gels were prepared from novolac-type phenolic resins, TEOS and titanium
tetrakis(2,4-pentanedionate)at 65°C. Just before gelation the viscosity of the so-
lution increases with time and at some particular range ∼ 30 cm long fibers are
drawn. These gelled fibers are transformed into ceramic to form SiO2-TiO2 in-
organic fibers which via heat-treatment in argon at high temperature transforms
to SiC-TiC hybrid fibers. Such fibers provide many desirable properties for ap-
plication in continuous fiber-ceramic composites intended for high temperature
use in oxidative and non-oxidative atmospheres. For example, SiC fibers have
advantages over carbon fibers in certain applications where greater resistance to
oxidation, superior compressive strength, and greater electrical resistance, are
desired. Along with SiC fibers other ceramic fibers like Si-Ti-C-O, SiC-C fibers
exhibit better strength retention at high temperature than the carbon fiber.(101)
The tensile strength of the ceramic fibers do not show a marked decrease until
∼ 1000°C. In contrast, the strength of the carbon fiber starts to decrease at a
significantly lower temperature (∼ 400°C).
In line with the present thesis i.e development of Si-Al-O-C ceramic, Ishikawa
et al.(102) developed new sintered SiC fibers by sintering of an amorphous Si-Al-
O-C fiber precursor at high temperature. Si-Al-O-C fiber was synthesized by the
use of polyaluminocarbosilane prepared by the reaction of polycarbosilane with
65
3 Literature Review
aluminum acetylacetonate. The transformed fibers possess high strength (>2.9
GPa) and high modulus (>300 GPa), high heat resistance (up to 2000°C). The
other counterparts namely Nicalon[NL201], Tyranno[LoxM] (Si-Ti-C-O fiber),
Hi-Nicalon and Tyranno[ZM] (Si-Zr-C-O fiber) looses strength at around 1600°Cand at very high rate. The fiber showed better high-temperature creep resistance
even at 1300°C and 1 GPa, in air, compared with other commercial counterparts.
Advantages of the polymeric route in the formation of ceramic fibers include:
the ability to control fiber purity, the ability to control fiber crystallinity and
crystallite size, and the ability to produce continuous, fine diameter (<30 µm)
suitable for weaving and knitting of the fiber preforms for resin transfer molding.
One of the most unique advantages is the ability to prepare fibers with new and
metastable compositions unobtainable by other methods.
3.9.2 Other Applications
Preceramic polymers are frequently employed as precursors to matrices in ceramic
matrix composites (CMCs).(103),(104),(105),(106),(107) The development of low viscos-
ity preceramic polymers offers the use of well developed tools and techniques,
that are commonly employed for polymer composite fabrication, to the manu-
facturing of ceramic composites. One of the most promising technique for manu-
facturing high temperature, ceramic composite structures is impregnation/resin
transfer molding (I/RTM). In (I/TRM), preceramic polymers are infiltrated into
2-D and 3-D fiber preforms and pyrolyzed to convert the polymer to a ceramic
matrix phase. For example, Allied Signal, Inc. currently manufactures ceramic
fiber reinforced composite materials employing a poly(siloxane) preceramic poly-
mer. Using resin transfer molding, 2-dimensional or 3-dimensional high density
ceramic fiber reinforced composites are manufactured by infiltration and pyroly-
sis of a poly(siloxane) to an amorphous silicon oxycarbide matrix phase. For the
formation of a 2-D composite, fiber tows or woven fabric are impregnated with
the poly(siloxane) resin to produce a prepreg that can be handled like an epoxy
material. After a lay-up and autoclaving step to form, consolidate, and cure the
polymer infiltrated composite, the body is pyrolyzed in an inert atmosphere at
temperatures less than 1100°C to convert the polymer to the silicon oxycarbide.
For the formation of a 3-D composite, a 3-D fiber preform is infiltrated with
66
3.9 Applications
the poly(siloxane) and subsequently cured to produce a rigid specimen. The
cured specimen is then pyrolyzed in an inert atmosphere at T < 1100°C to con-
vert the polymer to the silicon oxycarbide. Due to the loss of volatiles during
pyrolysis of the preceramic polymer, the porous bodies are re-infiltrated with
polymer and pyrolyzed to increase the final density of the composite. Accord-
ing to some literature, 5 to 7 reinfiltration/pyrolysis cycles are often necessary
to achieve porosities less than 12%. Employing this process, complex shaped
components, such as gas mixing tubes, turbine engine blades, engine tail cones,
and vanes have been successfully manufactured by companies such as Auto-Air,
Rohr, Northrop-Grumman, and Loral-Vought.
Polymeric precursors are actively being investigated as precursors to interface
coatings in ceramic matrix composites. Using polymeric precursors for interface
coatings offers the potential for reduced cost compared with conventional chem-
ical vapor deposition techniques. The coatings could be applied to fibers by dip
coating from a polymer solution and cured to serve as sizing to protect the fibers
during further handling and/or weaving and pyrolyze to form ceramic interfaces
between the fiber and the matrix. Furthermore, by tailoring the composition of
the starting precursor, the chemistry and properties of the interface between the
fiber and the matrix could be engineered, to improve overall composite properties.
Heimann(108) dip coated SiC fibers with poly(silsequioxane), poly(borosilazanes),
and poly(carbosilanes) and pyrolyzed them in an inert atmosphere to produce
Si-O-C, Si-B-N, and Si-C coatings, respectively. SiC fibers coated with Si-C-O
were then incorporated into a reaction-bonded silicon nitride matrix. The au-
thor claimed that the coated fibers provided a weaker interface than the uncoated
fibers. The author suggest that the weaker interface promoted fiber debonding
which ultimately improved toughness of their composite material. Ueno et al.(109)
studied the effects of poly(carbosilane) coatings on SiC whiskers, on the tough-
ness of Si3N4 matrix composites. Twenty percent by weight SiC whiskers were
dip coated with poly(carbosilane) and blended with Si3N4 powder. The mixture
was compacted to form a green body and hot-pressed at 1850°C under pressure
of 30 MPa. During sintering, pyrolysis of the poly(carbosilane) resulted in a
SiC/graphite interface between the SiC whisker and the Si3N4 matrix. Accord-
ing to the fracture toughness measurements author claim that the composite
containing the coated whisker had a higher fracture toughness, 7.9 MPa.√m.
67
3 Literature Review
It was proposed that the slight increase in fracture toughness resulted from a
weaker whisker-matrix interface due to the presence of graphite at the interface.
Preceramic polymers have found significant use as binders for ceramic powders
for the fabrication of parts by compression or injection molding. A preceramic
polymer can play the role of traditional organic binders during the consolidation
steps; however, preceramic binders pyrolyze into ceramic materials which remains
in the void spaces that would normally be left by removal of traditional organic
binders.
Another area of polymer derived ceramics exist in the formation of coated layer
on high strength but low oxidation property materials. Bill et al.(110) used com-
mercial polysilazane NCP 200 to form an amorphous SiCN ceramic dip-coating
on C/C−SiC composites. This composite material possess carbon fibers as a
reinforced material and is one of the most promising materials with which to
realize light weight structures at high temperatures, and find application in ar-
eas such as the aircraft and space industry as well as in automotive and energy
technologies. The crucial drawback for C fibers is their low stability in an oxygen-
containing atmosphere at elevated temperature. Similar work is perform by us
on carbon fiber reinforced composite also using commercial polysilazane namely
Ceraset.(111) All polymer-to-ceramic transformations involve volume shrinkage,
added with different coefficient of thermal expansion, which lead to crack for-
mation in the coated layer. To compensate this shrinkage it is suggested in this
research to use fillers which also posses inherent high oxidation resistance. It has
been shown that coating quality can be improved by optimizing polymer con-
centration, speed of drawing, filler particle size, multiple coating and pyrolysis
cycle.
Present promising are of polymer derived ceramic in applied research is the
development of ceramic matrix composites. Active research is in development
and reported by Greil et al..(17) Manufacturing of bulk ceramic components
from materials in the system Si-Me-C-N-O (Me = Ti, Cr, V, Mo, Si, B, CrSi2,
MoSi2, etc.) from preceramic organosilicon polymers such as poly(carbosilane),
poly(silazanes), or poly(siloxanes) has become possible by incorporating filler into
the liquid or solid precursors. During pyrolytic decomposition of the polymer ma-
trix, the filler particles react with carbon from the polymer precursor or nitrogen
from the reaction gas atmosphere to form new (oxy)carbide or (oxy)nitride phases
68
3.9 Applications
embedded in the nanocrystalline Si-O-C-(-N) matrix. With this development the
Near-Net-Shape forming of bulk ceramic components, even with complex geom-
etry is possible and are of particular interest for wear-resistance machinery com-
ponents, fiber-reinforced, light weight components for aircraft structures; surface
sealing of porous structures; and biomedical dental restorations.
Most recent application of small scale ceramics is seen in the development of
Micro Elecro Mechanical Systems (MEMS). This is reported in the present papers
on SiCN ceramics using the techniques like microforging and photolithography
and will be discussed in the final section of the thesis in more detail. We used the
commercial polysiloxane to demonstrate the feasibility of MEMS processing and
also its use as a ideal material for injection molding of components in complex
shapes with fillers.
69

3 Literature Review
70
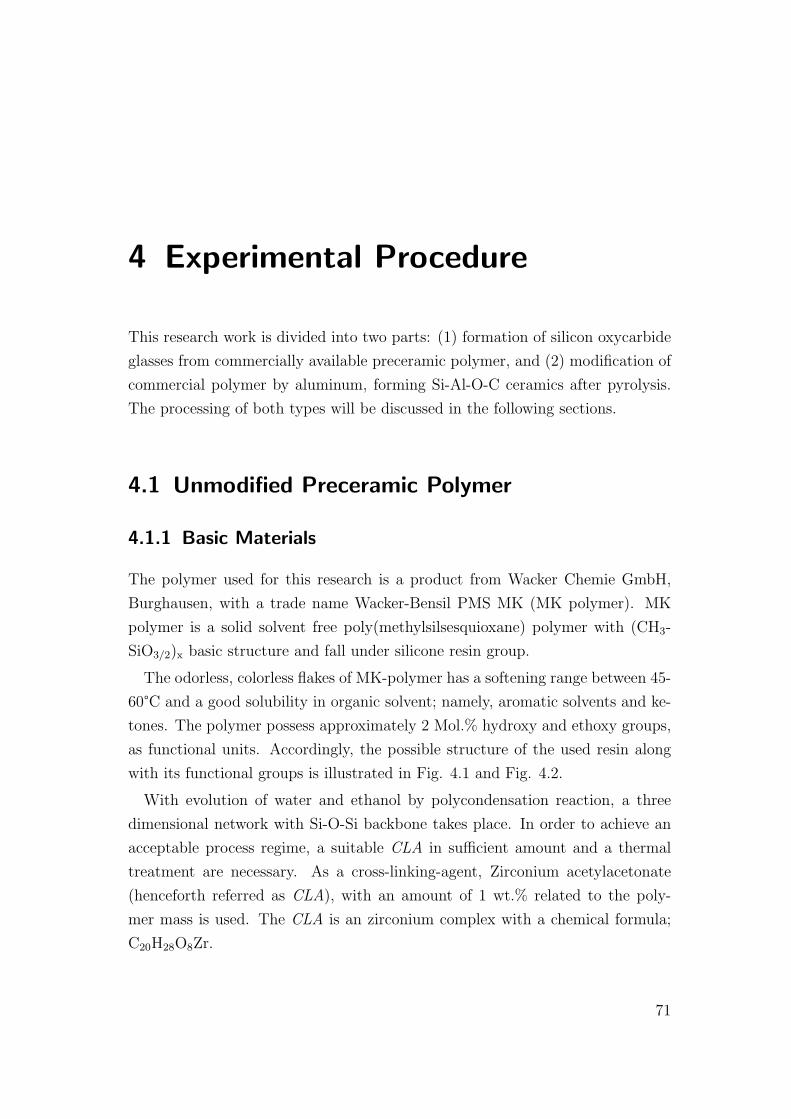
4 Experimental Procedure
This research work is divided into two parts: (1) formation of silicon oxycarbide
glasses from commercially available preceramic polymer, and (2) modification of
commercial polymer by aluminum, forming Si-Al-O-C ceramics after pyrolysis.
The processing of both types will be discussed in the following sections.
4.1 Unmodified Preceramic Polymer
4.1.1 Basic Materials
The polymer used for this research is a product from Wacker Chemie GmbH,
Burghausen, with a trade name Wacker-Bensil PMS MK (MK polymer). MK
polymer is a solid solvent free poly(methylsilsesquioxane) polymer with (CH3-
SiO3/2)x basic structure and fall under silicone resin group.
The odorless, colorless flakes of MK-polymer has a softening range between 45-
60°C and a good solubility in organic solvent; namely, aromatic solvents and ke-
tones. The polymer possess approximately 2 Mol.% hydroxy and ethoxy groups,
as functional units. Accordingly, the possible structure of the used resin along
with its functional groups is illustrated in Fig. 4.1 and Fig. 4.2.
With evolution of water and ethanol by polycondensation reaction, a three
dimensional network with Si-O-Si backbone takes place. In order to achieve an
acceptable process regime, a suitable CLA in sufficient amount and a thermal
treatment are necessary. As a cross-linking-agent, Zirconium acetylacetonate
(henceforth referred as CLA), with an amount of 1 wt.% related to the poly-
mer mass is used. The CLA is an zirconium complex with a chemical formula;
C20H28O8Zr.
71
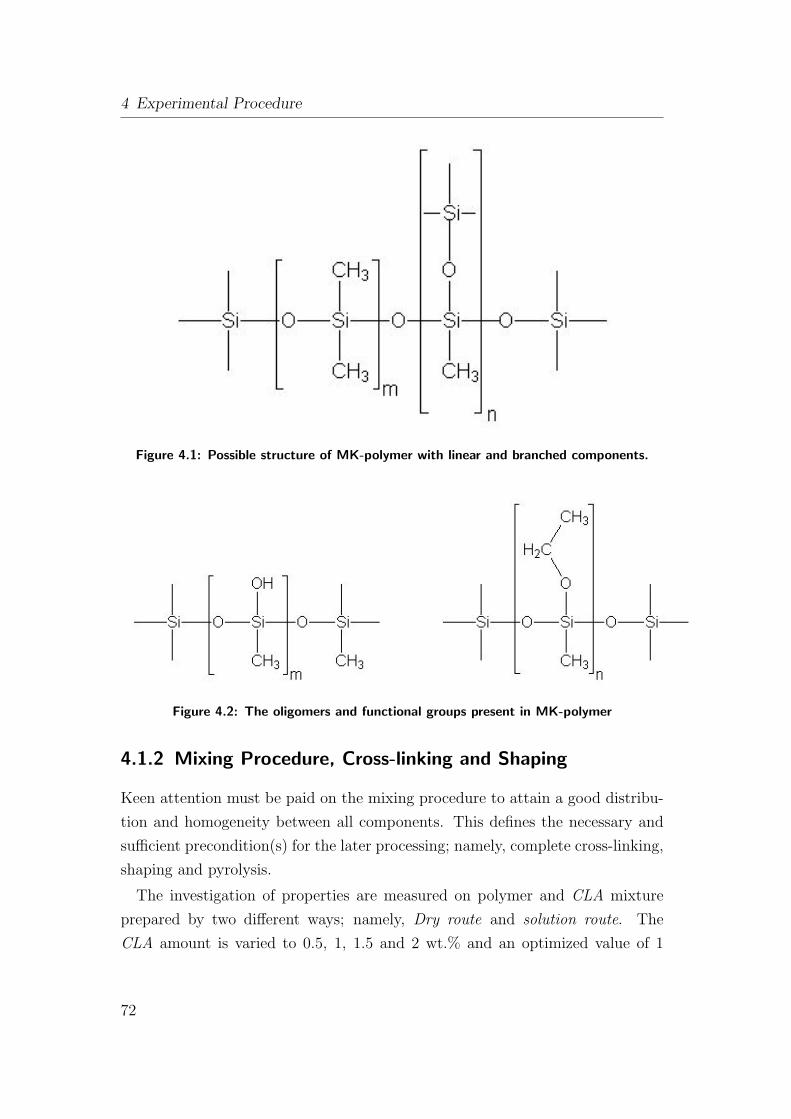
4 Experimental Procedure
Figure 4.1: Possible structure of MK-polymer with linear and branched components.
Figure 4.2: The oligomers and functional groups present in MK-polymer
4.1.2 Mixing Procedure, Cross-linking and Shaping
Keen attention must be paid on the mixing procedure to attain a good distribu-
tion and homogeneity between all components. This defines the necessary and
sufficient precondition(s) for the later processing; namely, complete cross-linking,
shaping and pyrolysis.
The investigation of properties are measured on polymer and CLA mixture
prepared by two different ways; namely, Dry route and solution route. The
CLA amount is varied to 0.5, 1, 1.5 and 2 wt.% and an optimized value of 1
72
4.1 Unmodified Preceramic Polymer
wt.% (explained later in results) is used for further study. In dry route method
mixture, polymer and CLA powders are milled in a planetary mill for long time.
Whereas, in the solution route the polymer was dissolved in isopropanol along
with 1 wt.% CLA and the solution is stirred by a magnetic stirrer for 30 min. The
CLA added polymer solution was dried under vacuum at moderate temperature
(40−50°C). The resulting powder is in a semi-dried condition, containing some
big particles with entrapped solvent. Therefore, the mixture is milled using a
ball mill followed by redrying in vacuum for long time (3−5 h), and subsequently
sieved from 100 µm mesh producing free flowing powder. This method results
in homogeneous distribution of the CLA in the polymer as compared to the
mechanical mixing.
The shaping of the powder mixture together with cross-linking of the poly(met-
hyl-silsesquioxane) to an un-meltable polymer mass with a three dimensional
network of polymer chains is achieved by warm pressing under pressure and high
temperature in an metallic form. For warm pressing, a cylindrical steel die with
10 mm internal diameter is used. Around this die, a heating element is attached,
which can operate between ambient temperature to 500°C. The temperature
control is made by a thermocouple, which by an appropriate drilling on half the
height of the cylinder is directly positioned beside the pressed powder. Pressure
is applied with an oil hydraulic press (Model from Fa. Paul-Otto-Weber GmbH)
with a maximum load of 100 kN. Before every pressing process, the inner side
of the warm press form and the used side of the stamps is coated with silicone
oil as a lubricant. This treatment is necessary, to reduce friction between the
green body and the press form, which if not done could cause demolding diffi-
culty and may result in cracking of the green body. The initial weight of the
polymer powder mixture filled in the mold cavity varies from 0.5 and 1 g. The
filled press form is inserted in the press and heated up with constant load (4.8 kN
for 10 mm diameter form, ≈ 50 MPa) to the selected warm pressing temperature
(150−170°C) in this case. In addition, for all attempts a constant heating rate of
10°C/min is selected. During the heating cycle, continuous sinking of the applied
load is observed between 60-110°C and the load rises with further heating, but is
constantly corrected by manual readjustment to the desired value. The compres-
sion pressure is maintained for 10−15 min after reaching the final temperature.
The pressure is gradually reduced to zero during the cooling cycle and when the
73
4 Experimental Procedure
temperature is reached to 100°C the green body is ejected. This gradual reduc-
tion in the applied pressure in the cooling cycle and the ejection of the sample at
relatively high temperature than room temperature avoid damage of the sample.
Ejecting sample at room temperature could lead to crack formation, because of
the brittle nature of the cross-linked green body. The thick green body is sliced
by diamond wire saw for maximum thickness of 0.6−0.8 mm, before pyrolysis.
4.1.3 Pyrolysis
In all attempts pyrolysis is accomplished in quartz tube (h = 50 cm, di = 3 cm).
Here, simultaneous pyrolysis of up to five green bodies is possible without any
practical problems. No sticking together or deformation is observed because of
neighboring or stacked green bodies. For pyrolysis, the green bodies are heated
to 1100°C at a rate of 25 °C/h, held at this temperature for 2 h, and then cooled
to room temperature at a rate of 100°C/h. Due to such long duration of pyrolysis
cycle, and in order to avoid the oxygen contamination, the top lid of the quartz
tube is closed using a high temperature grease (Apiezon H, Fa. Roth). The
quartz tube is inserted perpendicular in an electrically heated vertical Al2O3
tube furnace. It is made certain that the samples are positioned always in the
correct height of the furnace where planned temperature could be reached. This
position is frequently calibrated by an external temperature controller. Lower
end of the furnace is closed, in order to prevent variations in temperature by
radiation. Pyrolysis takes place under a constant argon stream via plastic/rubber
tubing, which are connected to a flow controller. Argon stream succeeds easy
and continuous exhaust of the decomposition gases from the quartz tube. The
decomposition products along with used argon leaves the system through two
exhaust bottles partially filled with Glycerin. This prevents any entrance of air
in the reverse direction inside the quartz tube. All samples are removed from the
quartz after ensuring complete cooling of the tube down to room temperature.
At most care is taken during removal of samples, to prevent any contamination
of the applied grease, which was applied initially to the opening of the tube.
74
4.2 Modified Preceramic Polymer
4.2 Modified Preceramic Polymer
4.2.1 Basic Materials for Aluminum Modification
As mentioned earlier, modification of the polymer or a system on atomic scale
can be easily achieved by sol-gel method. The modification work is continued
on the commercially available poly(methylsilsesquioxane) (MK-polymer), and its
availability and properties are already explained in the previous section. Out of
various possible modifications; namely Ti, Zr, Al, and B reported in the literature
part of this thesis, this work will be concentrated on aluminum modification,
producing polymer and resulting ceramic therefrom after pyrolysis in Si-Al-O-C
system.
Accordingly, Alumatrane (commercial Al-alkoxide from ABCR, with general
formula: C6H12NO3Al) was used as an aluminum modifier. This yellowish colored
powder with a density of 1.05 g/cm3 is sensitive to moisture and must be stored
in dry place.
4.2.2 Modification Procedure: Sol-Gel Method
Alumatrane was dissolved in isopropanol in different mass ratios, namely 2.5,
9.1, 16.6, and 23.6 wt.% followed by dissolution of the polymer in isopropanol.
Dissolution of both components are done in an ultrasonic mixture at room tem-
perature. A polymer:isopropanol ratio of 4g:25mL was kept constant for all the
mixtures. A sol-gel transition takes place at room temperature forming a yellow-
ish milky white residue. Very low amount of alumatrane, namely 2.5 wt.% do not
transform to a gel state at room temperature and instead requires temperature
of 50°C for 5h. All gels were dried at 85°C in air for 24 h, ball milled and finally
sieved to particle size < 63 µm.
4.2.3 Shaping and Pyrolysis
Same warm pressing die, with internal diameter of 10 mm (as mentioned in
Section 4.1.2), is used for green body formation. Unlike unmodified system, a
different procedure is used. Indeed, before filling the mold cavity with modi-
fied polymer powder weighing between 0.2 to 0.8 g (input material quantity is
75
4 Experimental Procedure
related to the sample size required for post-pyrolysis characterization with dif-
ferent thicknesses), the inner parts of the mold along with pressing stamps are
lubricated with a silicone spray. The filled press form is inserted in the press,
and cold pressing at a constant load (8 kN for 10 mm diameter form, ≈ 80 MPa)
for 5 min. is applied. Load is reduced to 4.8 kN (for 10 mm diameter form),
which is equivalent to 50 MPa. Simultaneously, temperature is raised between
80−100°C with a heating rate of 10°C/min. Unlike sinking of the applied load
with temperature; which is observed for unmodified system, a slight rise in load
is observed for modified system, and this fluctuation is manually controlled to
acheive constant pressure for the complete warm pressing heatng cycle. Samples
are held at this temperature for 10−15 min. before cooling them to 50−60°Cfollowed by ejection and subsequent pyrolysis. The ejection temperature is not
as sensitive as that observed for unmodified system, but ejection at high tem-
perature or at warm pressing temperature revealed surface cracking for some
samples.
Pyrolysis was performed in the same system using quartz tube and under
inert flowing argon stream; as explained earlier for unmodified system, with
some variation in the pyrolysis cycle. The pyrolysis cycle offers flexibility for
this system and the heating rate can be increased to reduce the processing time.
All samples are heated to 1100°C with a heating rate of 30°C/h, held at this
temperature for 2 h, and then cooled to room temperature at a rate of 10°C/min.
4.3 Sample Designation
The designation for the different samples in this study is also distinguished into
two categories, namely unmodified and aluminum-modified. Accordingly, the un-
modified silicon oxycarbide material, derived from MK polymer is designated as
SiOC ceramic. Various compositions for aluminum modified silicon oxycarbide
ceramics are designated as SiAlOC2.5, SiAlOC1, SiAlOC2 and SiAlOC3,
for gels prepared from MK polymer with 2.5, 9.1, 16.6 and 23.1 wt.% alumatrane;
related to the polymer mass, respectively.
76
4.4 Post Pyrolysis Heat-treatments: Procedures
4.4 Post Pyrolysis Heat-treatments: Procedures
Further information about the properties of bulk Si(Al)OC ceramics from com-
mercial polysiloxanes, are extracted by heat treating the samples in two different
atmospheres, namely inert and air, and subsequently characterizing the mate-
rial for its high temperature resistance and oxidation resistance. The procedures
involved for these heat treatments will be explained in the following subsections.
4.4.1 Inert Atmosphere (Crystallization Behavior): Powder
and Bulks
Thermal treatments were performed on bulks and powders in closed h-BN cru-
cible to analyze the crystallization behavior. Before heat treatment the crucibles
were boiled for 1 h in methanol and dried using vacuum and heat. The complete
heating cycle is performed in two steps. Initial the samples were heated in vac-
uum up to 500°C in an ASTRO Oven. Later the temperature is raised between
1300−1600°C with a heating rate of 10°C/min in flowing argon atmosphere at
a constant flow rate. The furnace is held at the maximum temperature for 5
h followed by cooling by 10°C/min to room temperature. The dimensions and
masses for the samples were measured before and after heat treatment.
4.4.2 Air Atmosphere (Oxidation): Bulks
Oxidation of Si(Al)OC ceramics was performed by two different methods and on
samples which had undergone different conditions, namely pyrolysis at 1100°Cand heat treatment in argon at 1300°C.
Oxidation of pyrolyzed samples:
The as pyrolyzed cylindrical samples were sliced in the shape of bars and
oxidation was performed using thermal gravimetry. The initial dimensions and
masses of the bars were accurately measured before placing them in an Al2O3
sample holder. The samples were heated at 10°C/min to various temperatures,
namely 1200, 1300 and 1400°C, under flowing argon with a flow rate of 100
L/h. After reaching the desired temperature, the weight change is recorded,
77
4 Experimental Procedure
while temperature remaining constant, i.e., (isothermal treatment). The major
drawback of using TGA for oxidation study is the sample size, which is very small.
Here, errors could be generated in measurements of such sample dimensions.
As-pyrolyzed cylindrical samples were used in order to investigate the oxida-
tion resistance for large samples. Samples were cleaned with acetone for 10 min
and dried in drying oven between 80−100°C for 15−30 min. before measuring the
weight and dimensions (diameter and height). Samples are placed on alumina
plate and slowly inserted in oven, which is pre-heated to the desired temperature.
The samples are withdrawn from oxidizing furnace after holding the samples for
pre-decided time at constant temperature and reweighed. Repeating this proce-
dure for different times on different samples is used to generates the kinetics of
oxidation.
Oxidation of heat treated samples:
The pyrolyzed cylindrical samples are placed in closed h-BN crucible and in-
serted in ASTRO oven. The samples are heated at 10°C/min from room tem-
perature to 500°C under vacuum and above this temperature to 1300°C under
flowing argon followed by cooling. Treated samples are polished using different
grade SiC polishing papers (similar to metallographic technique). Final polish-
ing with 4000 grade paper approximately generate roughness of about 5 µm.
Polishing is performed until a glassy mirror like appearance is achieved. Pol-
ished samples are washed by alcohol and carefully dried. Measuring the sample
dimensions and weighing it completes the prerequisite conditions for oxidation.
Porous alumina boats specially designed to reduce the contact between the
samples are used. These boats are prepared by carving soft porous alumina
plates such that, only side edges of the samples (when inserted vertically) are in
contact and the top and bottom surfaces of the cylindrical sample are exposed
to air. The oxidizing furnace is heated to the predefined temperature and the
boats along with samples are slowly drawn in the hot zone of the furnace. After
holding the samples for a defined period (10, 15, 24, 36, 50, 75 and 100 h for this
study) at isothermal temperatures (1200, 1300 and 1400°C) are withdrawn from
the furnace and reweighed. All furnaces are cross-checked for the temperature
accuracy and correct heating region with sintering rings and found to be in ±
78
4.5 Mechanical Characterization of SiOC ceramic
20°C of the programmed temperature.
4.5 Mechanical Characterization of SiOC ceramic
The bulk processing of SiOC ceramic is demonstrated and in further discussion it
will be shown that it results in dense ceramic. Mechanical properties like hardness
and elastic modulus can be easily evaluated by indentation method. The elastic
modulus can also be evaluated non-destructively by an acoustic method and both
procedures will be explained in the following section.
4.5.1 Acoustic Method
The linear elasticity theory allows to give analytical expressions for the propaga-
tion velocity of acoustic waves in infinite media (continuum). For instance, the
elastic modulus (E) and Poisson’s ratio (ν) are expressed as follows:
E = ρ3V 2
l − 4V 2t
(V l/V t)2 − 1(4.1)
ν = ρ3V 2
l − 4V 2t
2(V 2l − V 2
t )− 1 (4.2)
where ρ is the density of the material, V2l and V2
t are the longitudinal and
transversal wave velocities respectively.
When the specimen thickness is small, as in this case for SiOC ceramic (0.5
mm) the piezoelectric transverse transducers are often unable to efficiently pro-
mote the propagation of shear waves through the specimen. In this latter case,
surface-type waves, also called Rayleigh waves, can be used. These waves are
characterized by a velocity, VR, proportional to Vt : VR = ζVt, where ζ is a
function of Poisson’s ratio, or of the Vl/Vt ratio. VR and Vl were measured in
(LAIN, Montpellier)∗ and Vt was optimized to satisfy the following equation:
V R =V t {0.715− (V t/V l)
2}0.750− (V t/V l)2
(4.3)
∗Experiments performed by Prof. T. Rouxel, University of Rennes, France
79
4 Experimental Procedure
The elastic modulus and the poisson ratio for thin SiOC ceramics are investigated
by acoustic measurement. The poisson ratio investigated from this measurement
is used for investigating elastic modulus by indentation method, which are dis-
cussed ahead.
4.5.2 Indentation Method
The indentation behavior was investigated using a Vickers diamond indenter with
the load ranging between 0.098 and 9.81 N and a loading time of 20 s. Most ex-
periments were conducted with a load of 0.098 N to avoid any micro-cracking
with the aim to get rheological parameters from the analysis of the indentation
profiles by atomic force microscopy (AFM Nanoscope III, Digital Instruments).
All the characteristics were averaged over measurements on 3 indentations per
load value. Error bars on the experimental points mainly derived from the scat-
tering of the AFM measurements. Specimen surfaces were mirror-polished with
diamond suspension down to 0.25 µm particle size prior to indentation. Note
also that all measurements were performed in a thermally regulated room, at
20°C. Meyer’s hardness (H) is defined by:
H = 2P
(d)2(4.4)
Where P [N] is the load applied on the Vickers indenter and d [m] is the
mean size of the two diagonals. When the elastic recovery is assumed to have
little effects on the projected dimension of the indent, Meyer’s hardness can be
identified to the true hardness, defined as the mean normal stress over the contact
region, and is thus a more fundamental measure of hardness than the Vickers
one.
The permanent displacement is directly measured on the AFM (or confocal
microscope) profile, whereas the total displacement is evaluated by extrapolation,
by considering the ideal indentation shape at maximum load from the Vickers
diamond shape. Then the reversible component, ue, is deduced: ue = u - up.
It is in principle possible to evaluate Young’s modulus, E, from the indenta-
tion topometry analysis and is proposed by Lawn et al.(112) In this approach, a
permanent Vickers indentation being loaded elastically from its actual state so
80
4.6 Thermo-Mechanical Behavior: Creep Test
that the total penetration depth (u) comes into play in the equation for E to
account for the pre-stress acting along the elastic recovery path:
E(L.H) = γ2 (1− ν2) P
tanψ (2u− ue)ue
(4.5)
where, subscript (L.H) refers to the authors of reference,(112) and ψ is half the
value of the apical angle of the indenter which is assumed to be perfectly rigid.
This value for Vickers indenter is 74.05◦. A major difficulty with the use of
Eq. (4.5) raises from the determination of parameter γ, the relative penetration
depth, which is introduced to account for the fact that the penetration depth
(u) may greatly differ from the contact depth (uc). This parameter is evaluated
by a ratio γ=u/uc. In the case of a perfectly linear elastic material γ should be
close to π/2. Nevertheless this may be regarded as an overestimation in the real
cases where the behavior is obviously not purely elastic. It is noteworthy that
to the knowledge of the present author, all previous studies assumed a constant
value for γ although it depends much on the mechanical behavior of the material,
being as high as 1.3 when elasticity predominates and as low as 0.8 when the
material behaves essentially “plastic”. For instance a value of 0.91 was proposed
by Lawn et al. to get a good correlation between experiments and theory in the
case of indentation experiments conducted with different materials, including a
standard soda-lime-silica glass.
4.6 Thermo-Mechanical Behavior: Creep Test
The thermo-mechanical investigation (creep) was carried out in simple uniaxial
compression using silicon carbide plates and graphite push rods. The schematic
of this setup is shown in Fig. 4.3 and the actual setup is pictured in Fig. 4.4.
The furnace element is made from tungsten mesh and tests were done in pure
flowing argon. A constant load was applied to the specimen by means of hy-
draulic actuator, which was capable of maintaining the applied load within 1%
of the set point over the duration of the test. The specimen is in the shape of
a solid cylinder having height of 7 mm and diameter of 7 ±0.3 mm. The com-
pressive displacement was measured with an LVTD (linear variable displacement
81
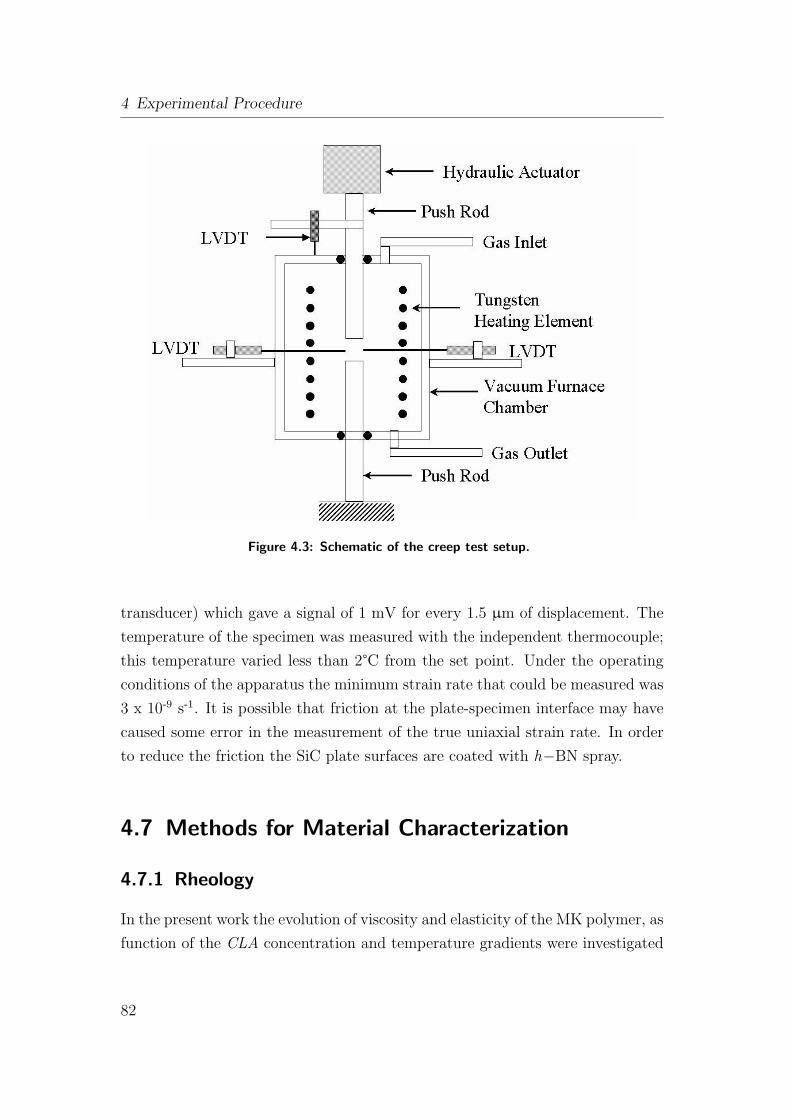
4 Experimental Procedure
Figure 4.3: Schematic of the creep test setup.
transducer) which gave a signal of 1 mV for every 1.5 µm of displacement. The
temperature of the specimen was measured with the independent thermocouple;
this temperature varied less than 2°C from the set point. Under the operating
conditions of the apparatus the minimum strain rate that could be measured was
3 x 10⁻⁹ s-1. It is possible that friction at the plate-specimen interface may have
caused some error in the measurement of the true uniaxial strain rate. In order
to reduce the friction the SiC plate surfaces are coated with h−BN spray.
4.7 Methods for Material Characterization
4.7.1 Rheology
In the present work the evolution of viscosity and elasticity of the MK polymer, as
function of the CLA concentration and temperature gradients were investigated
82
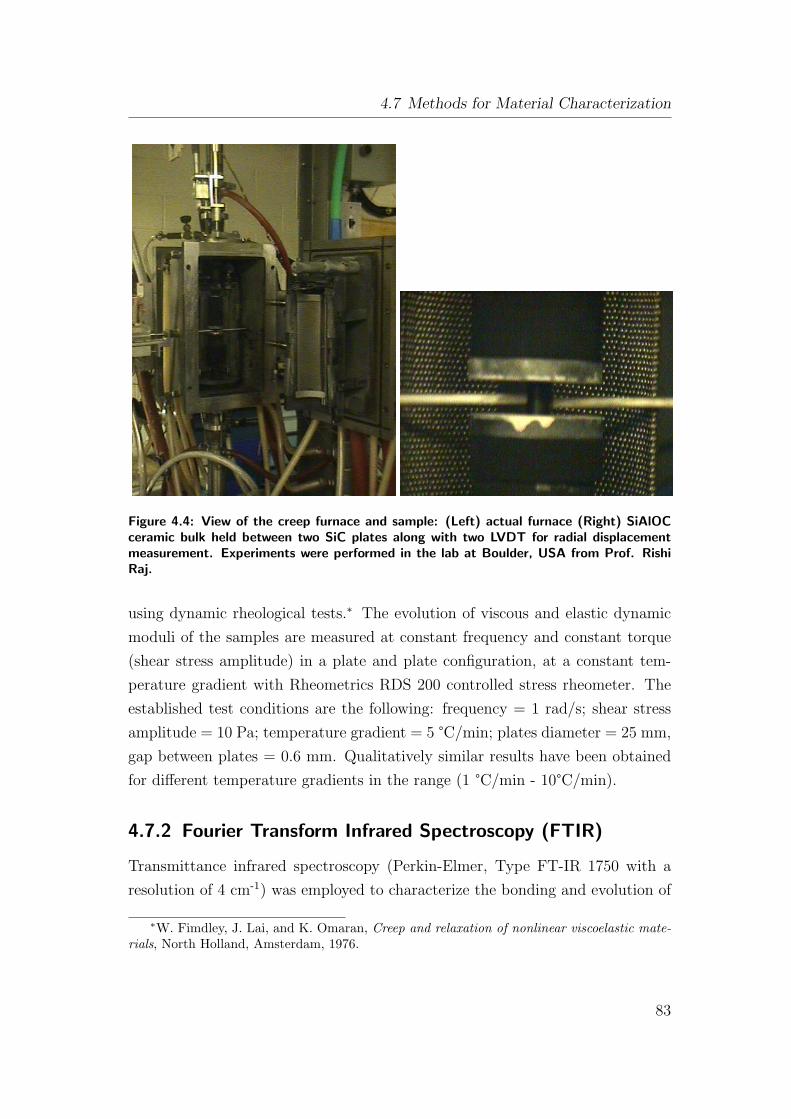
4.7 Methods for Material Characterization
Figure 4.4: View of the creep furnace and sample: (Left) actual furnace (Right) SiAlOCceramic bulk held between two SiC plates along with two LVDT for radial displacementmeasurement. Experiments were performed in the lab at Boulder, USA from Prof. RishiRaj.
using dynamic rheological tests.∗ The evolution of viscous and elastic dynamic
moduli of the samples are measured at constant frequency and constant torque
(shear stress amplitude) in a plate and plate configuration, at a constant tem-
perature gradient with Rheometrics RDS 200 controlled stress rheometer. The
established test conditions are the following: frequency = 1 rad/s; shear stress
amplitude = 10 Pa; temperature gradient = 5 °C/min; plates diameter = 25 mm,
gap between plates = 0.6 mm. Qualitatively similar results have been obtained
for different temperature gradients in the range (1 °C/min - 10°C/min).
4.7.2 Fourier Transform Infrared Spectroscopy (FTIR)
Transmittance infrared spectroscopy (Perkin-Elmer, Type FT-IR 1750 with a
resolution of 4 cm-1) was employed to characterize the bonding and evolution of
∗W. Fimdley, J. Lai, and K. Omaran, Creep and relaxation of nonlinear viscoelastic mate-rials, North Holland, Amsterdam, 1976.
83
4 Experimental Procedure
these bonds with temperature during pyrolysis. Transmittance infrared spectra
were collected using KBr pellets with small amount of grounded samples, from
400 to 4000 cm-1 at a resolution of 4 cm-1. KBr powder was dried at 150°Cand stored in glove box to prevent contamination from humidity. The polymer
materials namely, MK + CLA and aluminum modified polymer at different tem-
peratures are prepared according to the pyrolysis process explained earlier, i.e.,
with a heating rate of 25°C/h in flowing argon atmosphere.
4.7.3 Thermal Gravimetry and Mass Spectroscopy (TG/MS)
The decomposition reactions, generating during pyrolysis of the green bodies,
continuously changes the chemical composition of the samples as a function of
temperature. For optimization of the pyrolysis cycle from green stage to the
ceramic stage without damaging the molded article, it is important to know
the information about the temperature range and the quantity of decomposition
products escaping the system. This information was extracted from simultaneous
thermoanalyser (STA 429, Netzsch) technique. The thermo-gravimetric analysis
(TGA) was performed in argon flow (5 l/h) with a heating rate of 10°C/min up to
the maximum temperature of 1100°C. About 150 mg of the investigated material
in Al2O3-crucible was used for this analysis. Also, standard Al2O3 powder was
used as a reference material.
Sensing the type of decomposition gas, which are realized during pyrolysis help
in identifying various possible decomposition reactions, namely polycondensation
and radical reaction(s). Analysis of the pyrolysis gases was obtained in situ using
a quadrapole mass spectrometer (QMA 400, Balzers). Thermo-gravimetry and
mass spectroscopy together provide good physical and chemical information of
the pyrolysis process.
4.7.4 Thermo Mechanical Analysis (TMA)
The contraction behavior of the green bodies during pyrolysis was performed with
a vertical dilatometer (TMA 402, Netzsch). The displacement gauge is separated
from the sample by quartz glass plate in order to prevent deformation of molded
article or sinking of the gauge rods into the sample material. Contractions during
84
4.7 Methods for Material Characterization
pyrolysis cycle was measured in only one direction, indeed in the direction parallel
to the applied force during the green body preparation. The investigation was
performed in flowing argon atmosphere with a heating rate of 5°C/min in a
temperature range between 25 to 1000°C.
4.7.5 Dimensional Changes (Dilatometry)
The kinetic study of the dense and crack-free samples for structural relaxation or
crystallization could be investigated by thermal dilatometry. Thermal dilatom-
etry of the pyrolyzed ceramic cylindrical bulks was recorded with a horizontal
dilatometric system (Model Netzsch 420 S). Alumina plate was used as reference.
An argon atmosphere and different heating rate like 5, 10, 20 and 30°C/min were
used and the corresponding change in dimension with respect to temperature is
recorded.
4.7.6 Elemental Analysis
The chemical analysis for the investigated ceramic for the elements like silicon
and aluminum is performed at a standard laboratory (Pascher, Germany). The
determination of carbon in the pyrolyzed mass was done in an carbon analyzer
(CS 800, Eltra GmbH, Neuss). The powdered material is weighed in Al2O3
crucible together with a mixture from tungsten and iron. The crucible with
mixture is placed in high frequency electric field, and burned up in oxygen stream,
which serves at the same time as a reference gas. Whereby, carbon contained in
the sample is completely oxidized to carbon dioxide and possible remainders of
carbon monoxide at CuO catalyst before passing it through an infrared measuring
cell. Quantification of the carbon content is done according to Lambert Beer’s
law, where the absorption of the CO2 is proportional to the carbon content.
The oxygen content, likewise on powdered ceramic sample, is analyzed with
N/O analyzer (Leco, Type TC-436), by burning the sample in a graphite crucible
at around 2700°C under helium atmosphere. The powdered sample is packed
in an tin capsule before placing it in a heating zone, where the oxygen reacts
completely to carbon monoxide and during downstream through CuO catalyst is
oxidized to carbon dioxide and subsequently measured quantitatively.
85
4 Experimental Procedure
Calibration was performed with certified standard substances like silicon car-
bide (NIST) for carbon and WO3 (Leco) for oxygen. Measurements was repeated
on same sample in order to get a reproducible results with good statistics.
4.7.7 MAS-NMR Spectroscopy
The SiALOC gels derived ceramic product is insoluble in any solvents used for
NMR studies. Hence, solid state NMR is used for SiAlOC ceramics pyrolyzed at
1100°C in argon atmosphere. The mass thus formed is milled to powder state
and used directly for the structural study. 29Si, 27Al magic angle spinning nuclear
magnetic resonance (MAS-NMR) experiments were carried out on a spectrome-
ter (Bruker ASX 400) operating at 9.40 T. Qualitative 29Si and 27Al MAS-NMR
spectra were obtained employing following experimental conditions:
1. Nuclear probe: 29Si; Frequency: 79.49 MHz; Pulse length: 2 µs; Repeta-
tions: 60 s; MAS rotation: 8 kHz; Chemical shift reference: TMS(aq).
2. Nuclear probe: 27Al; Frequency: 104.26 MHz; Pulse length: 0.6 µs; Repeta-
tions: 0.5 s; MAS rotation: 6 kHz; Chemical shift reference: AlCl3(aq).
Line broadening of 120 Hz for the ceramic was applied for 29Si spectra and 400Hz
line broadening was applied to the 27Al spectra to obtain adequate signal to noise
ratio. The number of scans are 1000 and 6000-9000 for 29Si and 27Al MAS-NMR;
respectively. The spectra thus observed are deconvoluted/fitted with a Gaussian
fit using (dmfit) software.
4.7.8 X-ray Diffraction
X-ray diffraction (Model D500, Siemens AG), using a Ni-filtered Cu-Kα radiation
source was employed to characterize crystalline pyrolysis product in heat treated
and oxidized bulk samples. This instrument work in reflection mode and scans
were taken between 2θ values of 10o and 90o with a step width of 0.02o and a
measuring time of 0.1 sec/step. Different phases are identified using a database,
which is based on JFPD cards.
86
4.7 Methods for Material Characterization
4.7.9 Scanning Electron Microscopy
Microstructural investigation on the heat treated samples was performed with
an scanning electron microscope (SEM) (Philips, Modell XL 30 FEG). Because
of very low electrical conductivity of the produced samples, sputtering of the
samples with a gold-palladium nano-layer is necessary. Samples is mounted on
aluminum sample holder with the help of carbon tape and placed under vacuum
of about 10-4 mbar and sputtered with Au-Pd by applying high voltage in argon
atmosphere. The thickness of the sputtered layer is controlled between 5 to 20
nm.
The oxidized samples are sectioned and mounted in warm setting resin before
measuring them for oxidation layer thickness by SEM. To study the surface
morphology the same procedure as mentioned above is used. The samples are
pre-etched, using a dilute solution of hydro fluoric acid in order to create a phase
contrast between the amorphous phase and crystalline phase, for investigation
of crystalline morphology. All samples are investigated with the accelerating
voltage of 10 to 20 kV.
Investigation of the elements present in the material is confirmed with energy
dispersive x-ray analysis (EDX).
4.7.10 Secondary Ion Mass Spectroscopy (SIMS)
Secondary Ion Mass Spectrometry (SIMS) is based upon the sputtering of a
surface of a sample, induced by a “primary ion” bombardment. A primary ion
triggers a cascade of atomic collisions. Atoms and atomic clusters are ejected.
During the ejection process, some of them are spontaneously ionized. These
“secondary ions” are the characteristic of the composition of the analyzed area.
They are separated according to their mass. Continuous etching if the sample
surface by the primary ion beam gives progressive access to deeper areas in the
specimen and thus chemical depth profiles can be estimated.
The Si(Al)OC ceramic materials in pyrolyzed and oxidized condition are in-
vestigated for chemical depth profiles using secondary ion mass spectrometry
(Cameca, France: ims5f type). The secondary ion masses is analyzed by a dou-
ble focussing sector field mass spectrometer. All samples were covered with a
thin gold layer for better charge compensation. The crater size was 150 x 150
87
4 Experimental Procedure
µm and the beam diameter was about 20 µm. The measurements were done
with O- primary ions, detecting positive secondary ions. The mass resolution
was low (m/dm=300), so interferences of molecules and atoms are possible (e.g.
H2O, 18O). However, a considerably higher mass resolution usually means a lower
transmission (by 2 or 3 orders of magnitude). Interferences were circumvented
with the suppression of molecular ions, i.e. an offset voltage of several ten volts
and an energy filter with a width of several eV. This works because there are a
lot more atomic ions with higher energy than molecular ions. The energy was
12.5 kV (ion source - ground) plus 4.5 kV (sample - ground), effectively 17 kV.
This value is somewhat high but results from the addition of the voltages given
above, which cannot be avoided when choosing the polarities like it was done in
this case. The depth resolution with a 17 kV beam and a relatively steep angle
of incidence will not be smaller than, say 20 nm - but the limitation here is given
by the roughness of the surface.
Being a sector field instrument only one ion can be detected at a certain time
(more accurate: an ion with a certain m/q ratio). So when doing a depth profile
mass1 is detected for a second, then the magnetic field is switched to mass2,
detection of mass2, switching to mass3, etc., and after the last mass in the list
switching to mass1 again and so on.
The total depth of the sputtered carter is measured by profilometer and the
sputtering time is converted to the depth value in micro meter, assuming that
the sputtering rate and the secondary ion yield is same for all samples.
88
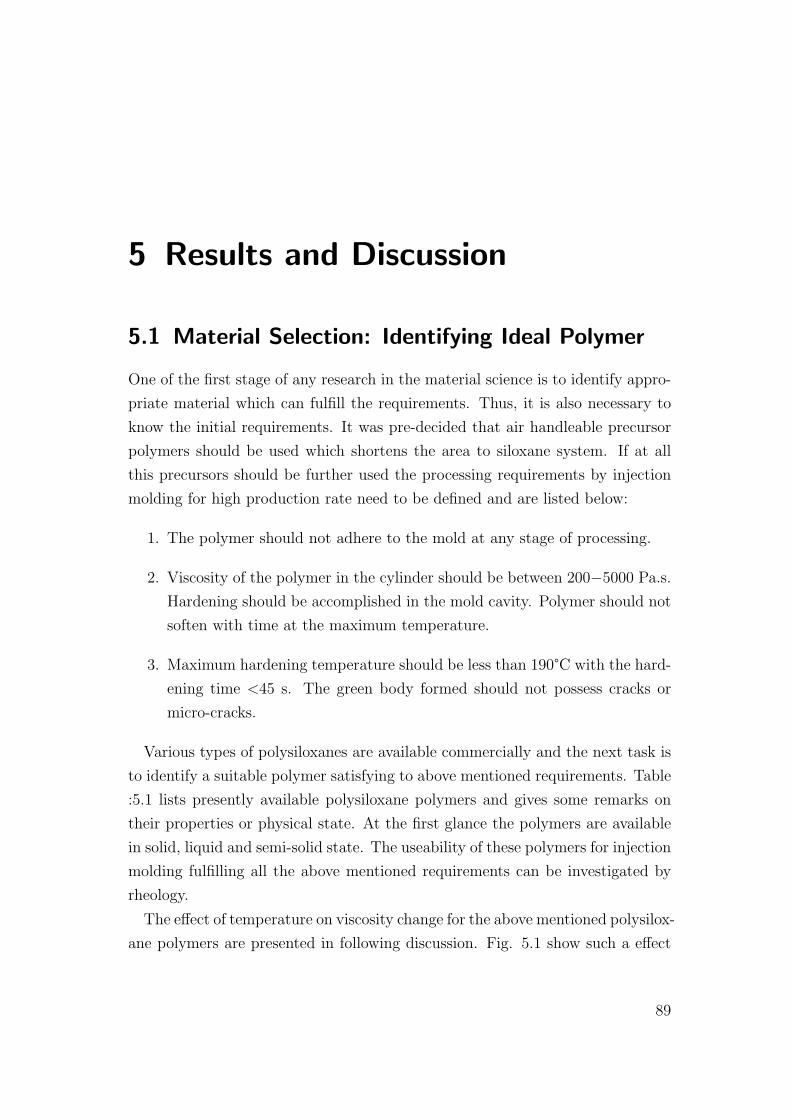
5 Results and Discussion
5.1 Material Selection: Identifying Ideal Polymer
One of the first stage of any research in the material science is to identify appro-
priate material which can fulfill the requirements. Thus, it is also necessary to
know the initial requirements. It was pre-decided that air handleable precursor
polymers should be used which shortens the area to siloxane system. If at all
this precursors should be further used the processing requirements by injection
molding for high production rate need to be defined and are listed below:
1. The polymer should not adhere to the mold at any stage of processing.
2. Viscosity of the polymer in the cylinder should be between 200−5000 Pa.s.
Hardening should be accomplished in the mold cavity. Polymer should not
soften with time at the maximum temperature.
3. Maximum hardening temperature should be less than 190°C with the hard-
ening time <45 s. The green body formed should not possess cracks or
micro-cracks.
Various types of polysiloxanes are available commercially and the next task is
to identify a suitable polymer satisfying to above mentioned requirements. Table
:5.1 lists presently available polysiloxane polymers and gives some remarks on
their properties or physical state. At the first glance the polymers are available
in solid, liquid and semi-solid state. The useability of these polymers for injection
molding fulfilling all the above mentioned requirements can be investigated by
rheology.
The effect of temperature on viscosity change for the above mentioned polysilox-
ane polymers are presented in following discussion. Fig. 5.1 show such a effect
89
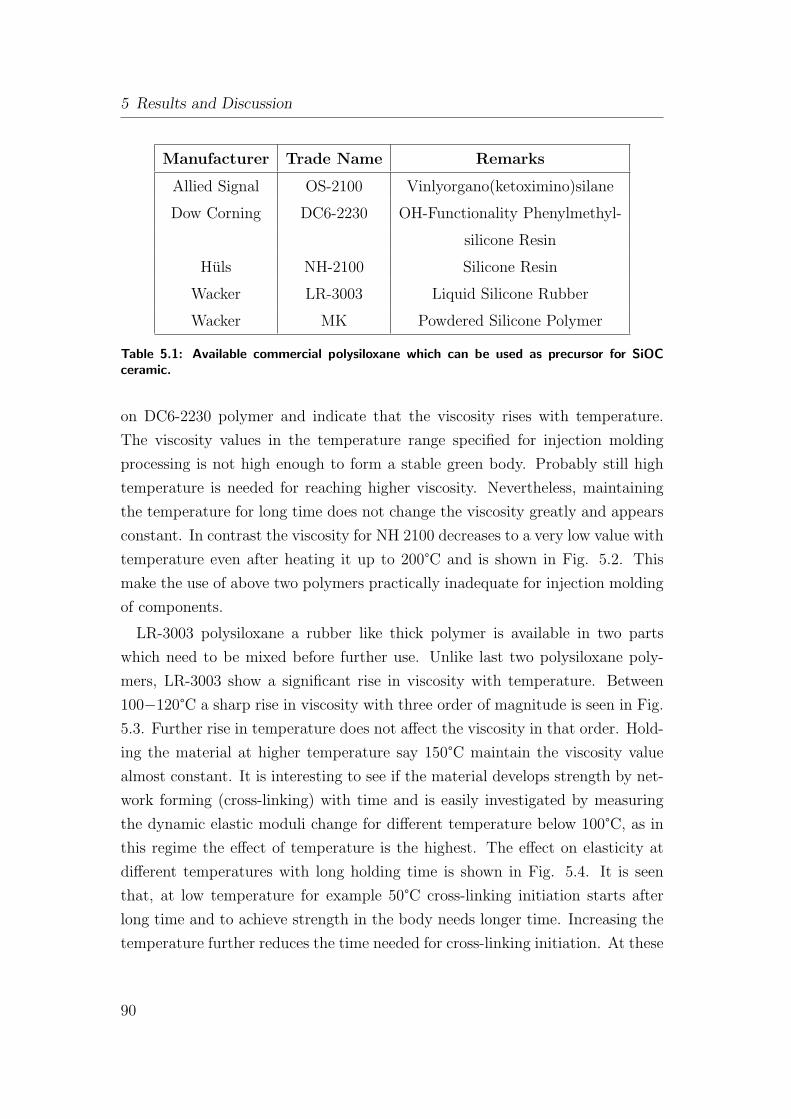
5 Results and Discussion
Manufacturer Trade Name Remarks
Allied Signal OS-2100 Vinlyorgano(ketoximino)silane
Dow Corning DC6-2230 OH-Functionality Phenylmethyl-
silicone Resin
Huls NH-2100 Silicone Resin
Wacker LR-3003 Liquid Silicone Rubber
Wacker MK Powdered Silicone Polymer
Table 5.1: Available commercial polysiloxane which can be used as precursor for SiOCceramic.
on DC6-2230 polymer and indicate that the viscosity rises with temperature.
The viscosity values in the temperature range specified for injection molding
processing is not high enough to form a stable green body. Probably still high
temperature is needed for reaching higher viscosity. Nevertheless, maintaining
the temperature for long time does not change the viscosity greatly and appears
constant. In contrast the viscosity for NH 2100 decreases to a very low value with
temperature even after heating it up to 200°C and is shown in Fig. 5.2. This
make the use of above two polymers practically inadequate for injection molding
of components.
LR-3003 polysiloxane a rubber like thick polymer is available in two parts
which need to be mixed before further use. Unlike last two polysiloxane poly-
mers, LR-3003 show a significant rise in viscosity with temperature. Between
100−120°C a sharp rise in viscosity with three order of magnitude is seen in Fig.
5.3. Further rise in temperature does not affect the viscosity in that order. Hold-
ing the material at higher temperature say 150°C maintain the viscosity value
almost constant. It is interesting to see if the material develops strength by net-
work forming (cross-linking) with time and is easily investigated by measuring
the dynamic elastic moduli change for different temperature below 100°C, as in
this regime the effect of temperature is the highest. The effect on elasticity at
different temperatures with long holding time is shown in Fig. 5.4. It is seen
that, at low temperature for example 50°C cross-linking initiation starts after
long time and to achieve strength in the body needs longer time. Increasing the
temperature further reduces the time needed for cross-linking initiation. At these
90
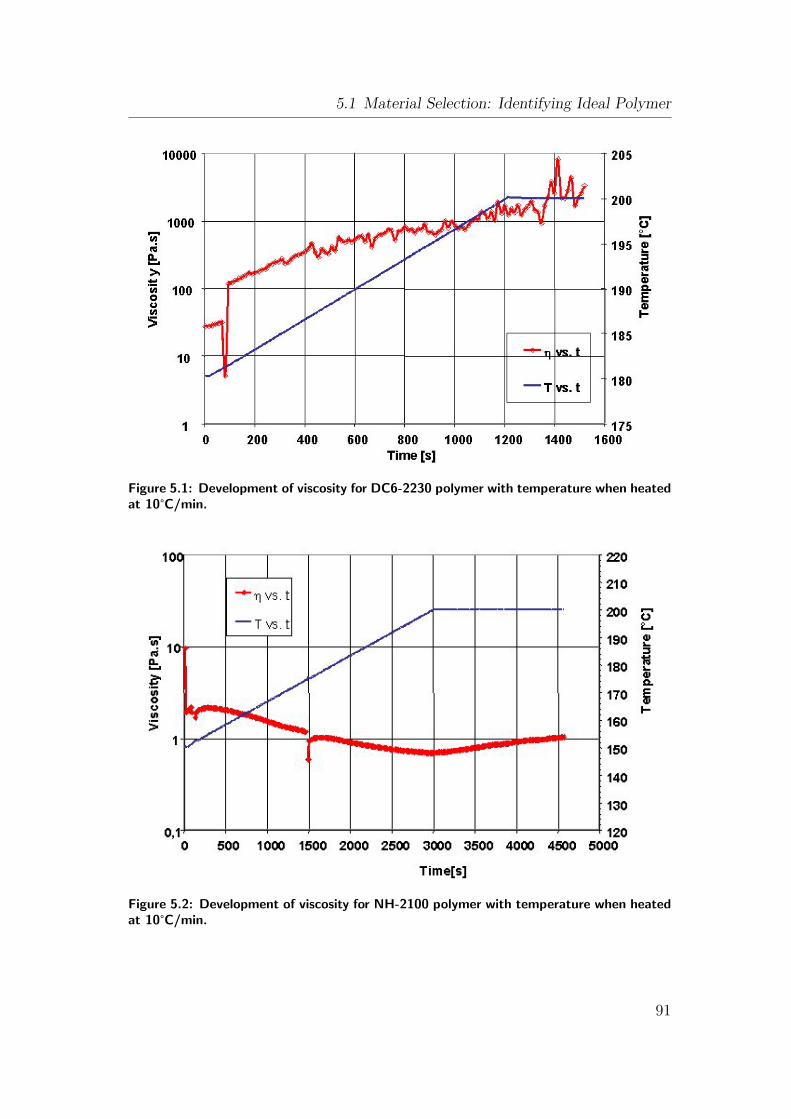
5.1 Material Selection: Identifying Ideal Polymer
Figure 5.1: Development of viscosity for DC6-2230 polymer with temperature when heatedat 10°C/min.
Figure 5.2: Development of viscosity for NH-2100 polymer with temperature when heatedat 10°C/min.
91
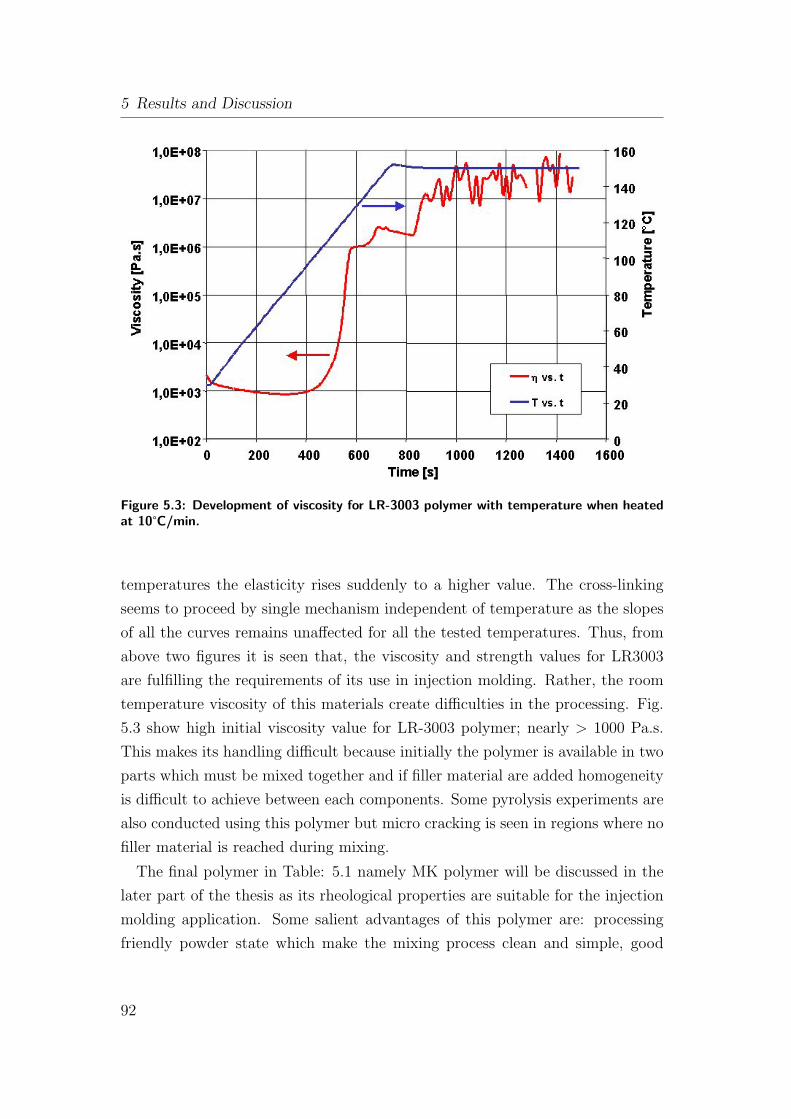
5 Results and Discussion
Figure 5.3: Development of viscosity for LR-3003 polymer with temperature when heatedat 10°C/min.
temperatures the elasticity rises suddenly to a higher value. The cross-linking
seems to proceed by single mechanism independent of temperature as the slopes
of all the curves remains unaffected for all the tested temperatures. Thus, from
above two figures it is seen that, the viscosity and strength values for LR3003
are fulfilling the requirements of its use in injection molding. Rather, the room
temperature viscosity of this materials create difficulties in the processing. Fig.
5.3 show high initial viscosity value for LR-3003 polymer; nearly > 1000 Pa.s.
This makes its handling difficult because initially the polymer is available in two
parts which must be mixed together and if filler material are added homogeneity
is difficult to achieve between each components. Some pyrolysis experiments are
also conducted using this polymer but micro cracking is seen in regions where no
filler material is reached during mixing.
The final polymer in Table: 5.1 namely MK polymer will be discussed in the
later part of the thesis as its rheological properties are suitable for the injection
molding application. Some salient advantages of this polymer are: processing
friendly powder state which make the mixing process clean and simple, good
92
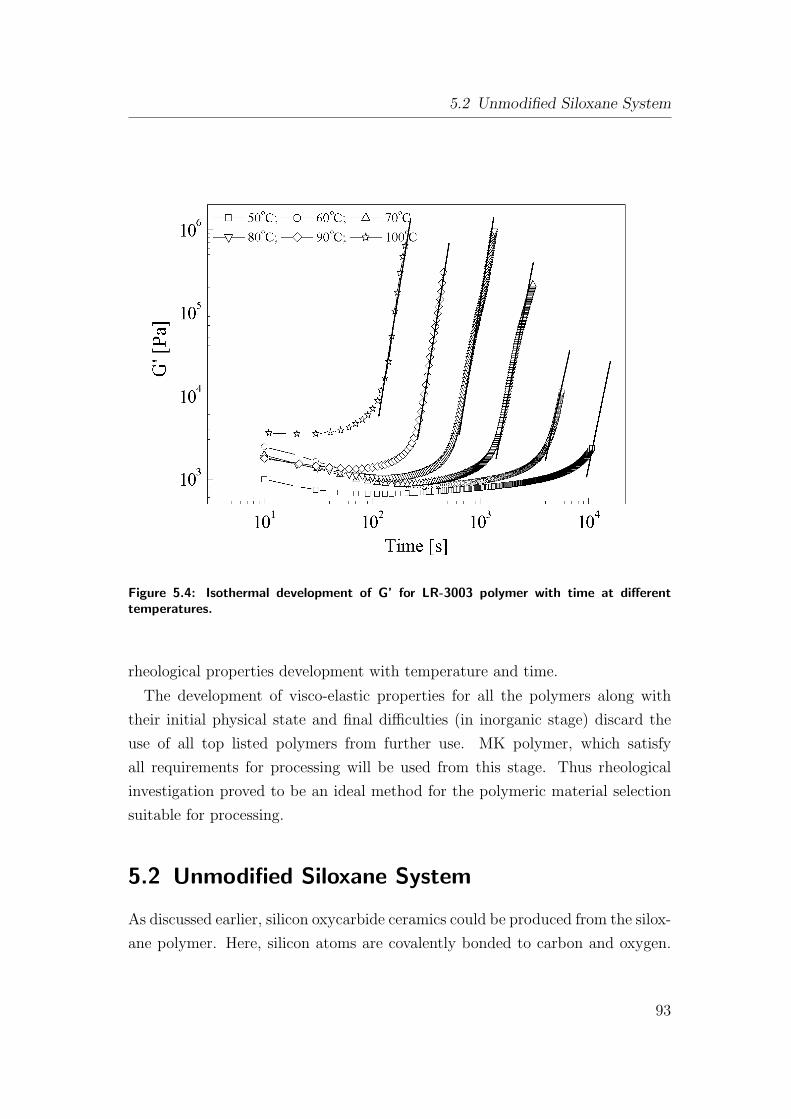
5.2 Unmodified Siloxane System
Figure 5.4: Isothermal development of G’ for LR-3003 polymer with time at differenttemperatures.
rheological properties development with temperature and time.
The development of visco-elastic properties for all the polymers along with
their initial physical state and final difficulties (in inorganic stage) discard the
use of all top listed polymers from further use. MK polymer, which satisfy
all requirements for processing will be used from this stage. Thus rheological
investigation proved to be an ideal method for the polymeric material selection
suitable for processing.
5.2 Unmodified Siloxane System
As discussed earlier, silicon oxycarbide ceramics could be produced from the silox-
ane polymer. Here, silicon atoms are covalently bonded to carbon and oxygen.
93
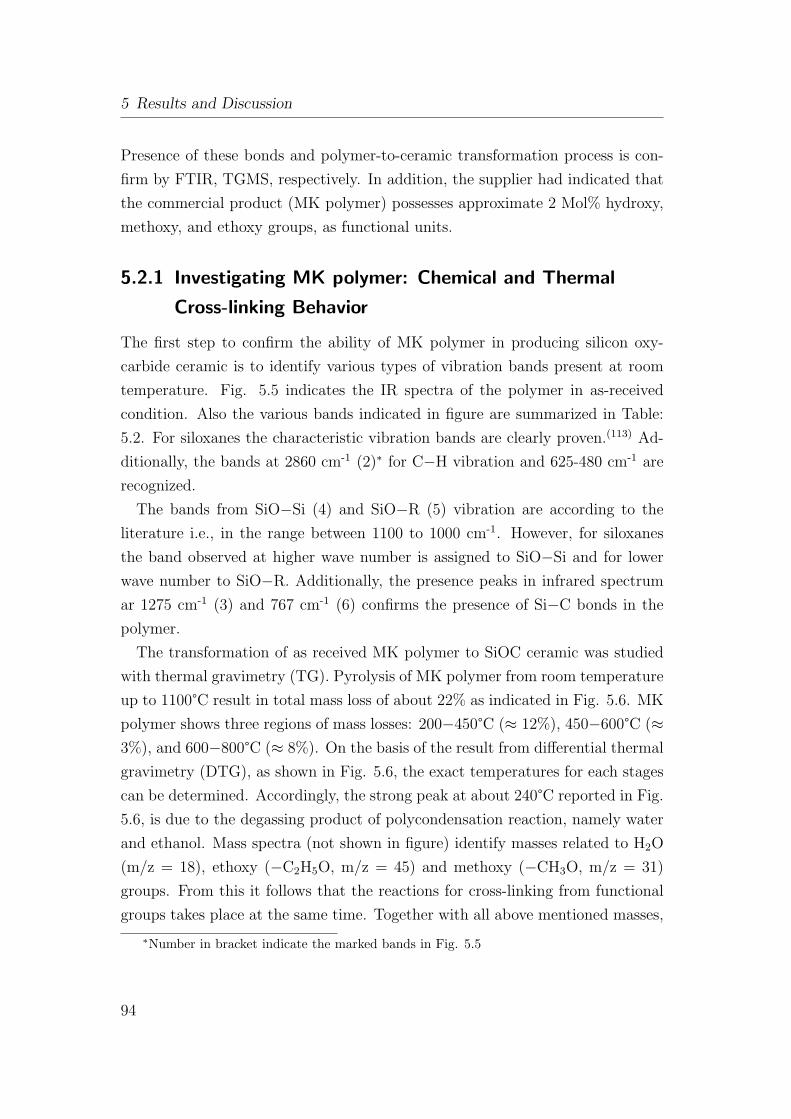
5 Results and Discussion
Presence of these bonds and polymer-to-ceramic transformation process is con-
firm by FTIR, TGMS, respectively. In addition, the supplier had indicated that
the commercial product (MK polymer) possesses approximate 2 Mol% hydroxy,
methoxy, and ethoxy groups, as functional units.
5.2.1 Investigating MK polymer: Chemical and Thermal
Cross-linking Behavior
The first step to confirm the ability of MK polymer in producing silicon oxy-
carbide ceramic is to identify various types of vibration bands present at room
temperature. Fig. 5.5 indicates the IR spectra of the polymer in as-received
condition. Also the various bands indicated in figure are summarized in Table:
5.2. For siloxanes the characteristic vibration bands are clearly proven.(113) Ad-
ditionally, the bands at 2860 cm-1 (2)∗ for C−H vibration and 625-480 cm-1 are
recognized.
The bands from SiO−Si (4) and SiO−R (5) vibration are according to the
literature i.e., in the range between 1100 to 1000 cm-1. However, for siloxanes
the band observed at higher wave number is assigned to SiO−Si and for lower
wave number to SiO−R. Additionally, the presence peaks in infrared spectrum
ar 1275 cm-1 (3) and 767 cm-1 (6) confirms the presence of Si−C bonds in the
polymer.
The transformation of as received MK polymer to SiOC ceramic was studied
with thermal gravimetry (TG). Pyrolysis of MK polymer from room temperature
up to 1100°C result in total mass loss of about 22% as indicated in Fig. 5.6. MK
polymer shows three regions of mass losses: 200−450°C (≈ 12%), 450−600°C (≈3%), and 600−800°C (≈ 8%). On the basis of the result from differential thermal
gravimetry (DTG), as shown in Fig. 5.6, the exact temperatures for each stages
can be determined. Accordingly, the strong peak at about 240°C reported in Fig.
5.6, is due to the degassing product of polycondensation reaction, namely water
and ethanol. Mass spectra (not shown in figure) identify masses related to H2O
(m/z = 18), ethoxy (−C2H5O, m/z = 45) and methoxy (−CH3O, m/z = 31)
groups. From this it follows that the reactions for cross-linking from functional
groups takes place at the same time. Together with all above mentioned masses,
∗Number in bracket indicate the marked bands in Fig. 5.5
94
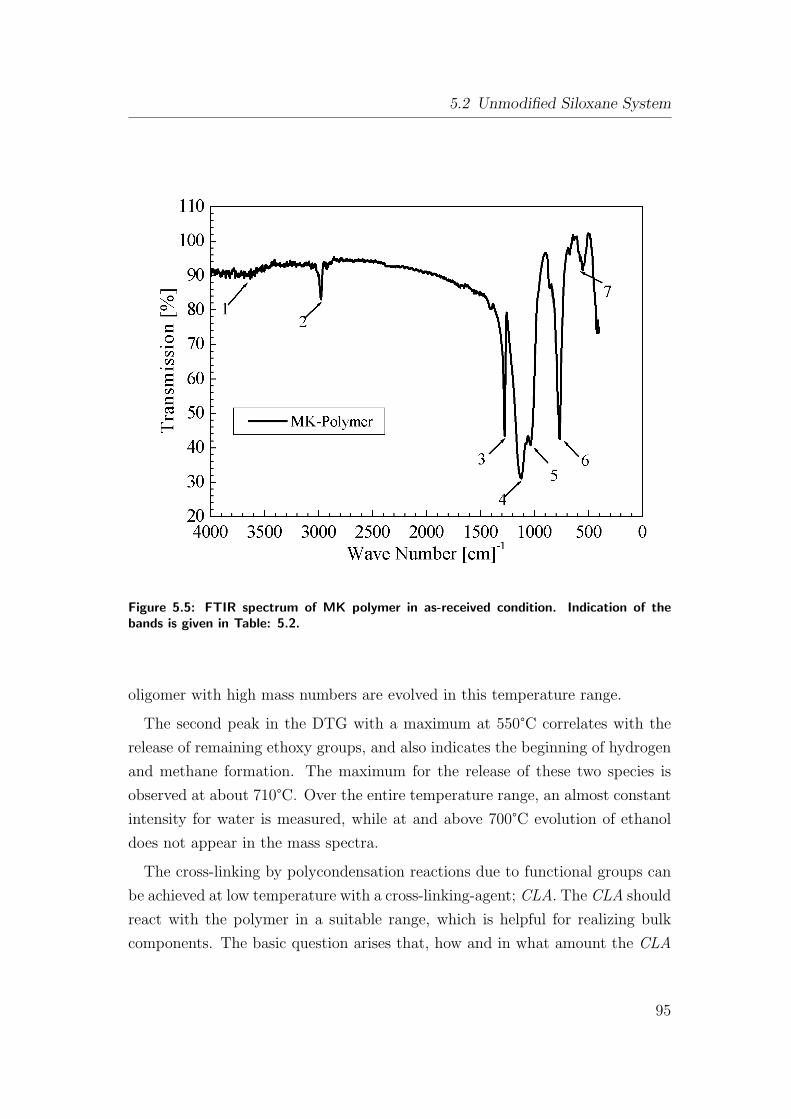
5.2 Unmodified Siloxane System
Figure 5.5: FTIR spectrum of MK polymer in as-received condition. Indication of thebands is given in Table: 5.2.
oligomer with high mass numbers are evolved in this temperature range.
The second peak in the DTG with a maximum at 550°C correlates with the
release of remaining ethoxy groups, and also indicates the beginning of hydrogen
and methane formation. The maximum for the release of these two species is
observed at about 710°C. Over the entire temperature range, an almost constant
intensity for water is measured, while at and above 700°C evolution of ethanol
does not appear in the mass spectra.
The cross-linking by polycondensation reactions due to functional groups can
be achieved at low temperature with a cross-linking-agent; CLA. The CLA should
react with the polymer in a suitable range, which is helpful for realizing bulk
components. The basic question arises that, how and in what amount the CLA
95
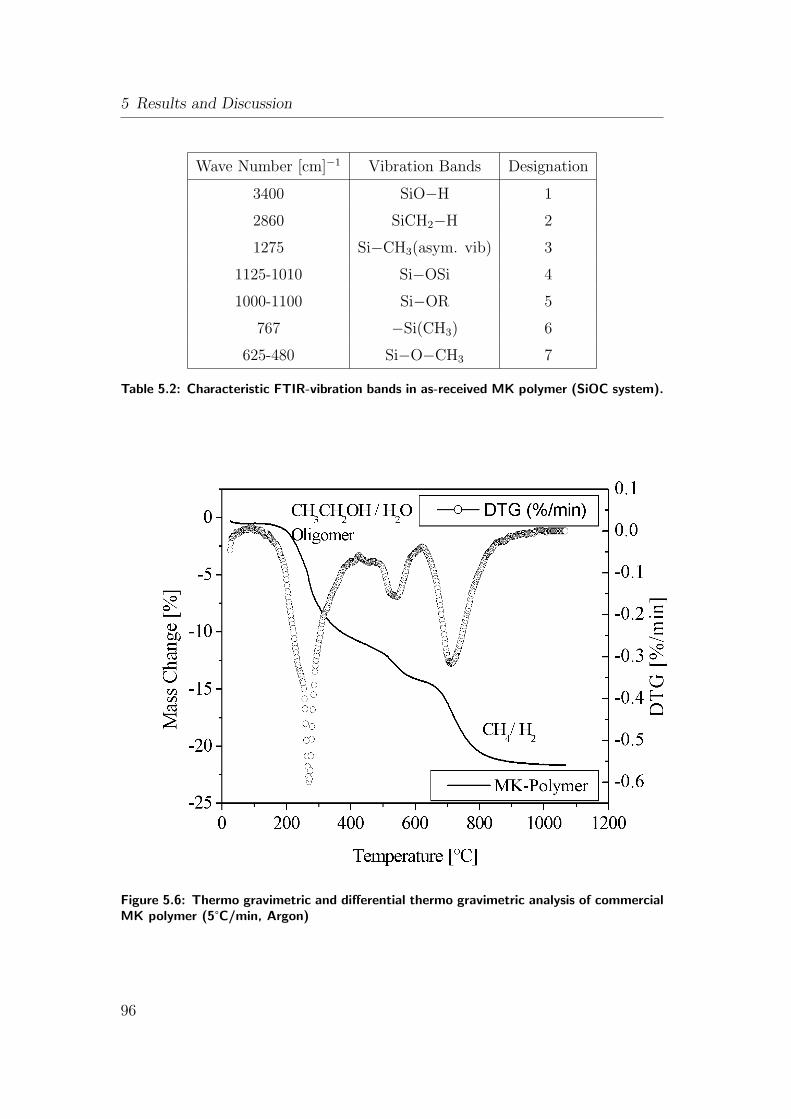
5 Results and Discussion
Wave Number [cm]−1 Vibration Bands Designation
3400 SiO−H 1
2860 SiCH2−H 2
1275 Si−CH3(asym. vib) 3
1125-1010 Si−OSi 4
1000-1100 Si−OR 5
767 −Si(CH3) 6
625-480 Si−O−CH3 7
Table 5.2: Characteristic FTIR-vibration bands in as-received MK polymer (SiOC system).
Figure 5.6: Thermo gravimetric and differential thermo gravimetric analysis of commercialMK polymer (5°C/min, Argon)
96
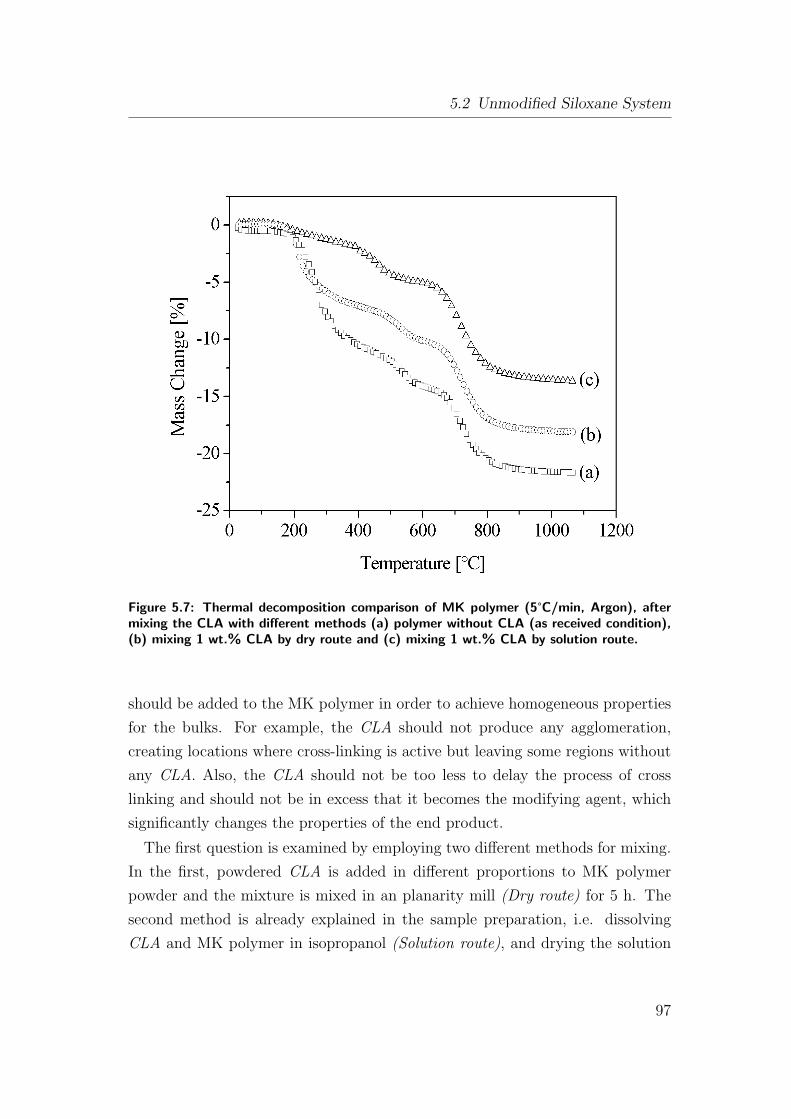
5.2 Unmodified Siloxane System
Figure 5.7: Thermal decomposition comparison of MK polymer (5°C/min, Argon), aftermixing the CLA with different methods (a) polymer without CLA (as received condition),(b) mixing 1 wt.% CLA by dry route and (c) mixing 1 wt.% CLA by solution route.
should be added to the MK polymer in order to achieve homogeneous properties
for the bulks. For example, the CLA should not produce any agglomeration,
creating locations where cross-linking is active but leaving some regions without
any CLA. Also, the CLA should not be too less to delay the process of cross
linking and should not be in excess that it becomes the modifying agent, which
significantly changes the properties of the end product.
The first question is examined by employing two different methods for mixing.
In the first, powdered CLA is added in different proportions to MK polymer
powder and the mixture is mixed in an planarity mill (Dry route) for 5 h. The
second method is already explained in the sample preparation, i.e. dissolving
CLA and MK polymer in isopropanol (Solution route), and drying the solution
97
5 Results and Discussion
mixture under vacuum. The effect of CLA reaction on the pyrolysis process
can be easily evaluated by TG. Fig. 5.7, which clearly indicates the comparison
of the thermal decomposition behavior on different pre-treated polymers, and
mainly pointed out an influence of the CLA in the initial stage region, which is
critical for bulk processing. It also indicates the importance of the processing
method employed for incorporating the CLA. Mainly, the sharp mass loss (≈12%) observed for as received MK polymer [curve (a)] at 200°C is reduced to
about 5 mass% [curve (b)]. Above 400°C, both curves travel parallel to each
other, up to the end of the pyrolysis process. This confirms that, the CLA is only
influencing the cross-linking process and is not changing the final transformation
process. A total mass loss of about 17.8% is measured, which is about 4% lower
than CLA-free system.
Adding CLA to the polymer by solution route, significantly changes the py-
rolysis process, [curve (c)]. Up to 400°C, mass loss of only 2−3% is observed;
compared to 11% and 7% for as-received MK polymer [curve (a)] and dry route
mixing [curve (b)], respectively. Curve (c) is almost horizontal and first signifi-
cant mass loss is observed after 400°C, which could be assign to the second mass
loss step in [curve (a)] and [curve (b)]. The major difference is the temperature
shift in the second major weight loss step, by almost 100°C. Again it confirms
that, for all the materials mentioned, the strong decomposition step above 700°Cremains the same. Changes are also observed in the DTA curve (not shown in
the figure), with broadening of the first peak along with reduced intensity, and
shifting the second peak positions towards low temperature. The third peak
remain unchange in its intensity and peak position, which may indicate simi-
lar types of decomposition and transformation mechanism for the polymer to
ceramic conversion.
Indeed, it is clear that the method used to introduce the CLA in the polymer
alter the degree of cross-linking. Mixing the CLA homogeneously as done by
the solution route improves consistency in achieving reliable results. Efficient
use of CLA creates possibilities for low temperature processing. It is difficult to
form bulk bodies from MK polymer itself; as it shows great mass loss, starting
from 200°C. Such a mass loss in the form of degassing species when happen in
the warm pressing stage result in cracking of the green bodies. Adding CLA by
solution route reduces this mass loss by promoting early cross-linking reactions,
98
5.2 Unmodified Siloxane System
and increases the processing temperature window, possibly up to 350°C.
Now, the second question comes into picture, to investigate the effect of CLA
content on the cross-linking and optimizing the process. This problem was at-
tacked with the help of rheology, and will be discussed in the following subsec-
tion.
5.2.2 Cross-linking Investigation by Rheology: Optimizing
Cross-Linking-Agent Content
After optimizing the mixing procedure of the CLA in the polymer it becomes
necessary to extract more details from different mixture prepared by solution
route, i.e., optimizing the content of CLA, which are important for the processing.
Generally, two different forms could be generated from processing, namely bulks
(monoliths) and fibers. Before discussing rheology for investigated polymer it
will be advantageous to look into some basic concepts of rheology.
5.2.2.1 Rheology: Introduction
Heraklit von Ephesos (540−480 BC) stated: “panta rei − everything flows” or in
other words the whole universe is in constant motion. Flow means an irreversible
deformation of a material under externally applied force. Actually every mate-
rial flows. This behavior is not always sensed on the macroscopic scale as the
observation time may be small in reference to the relaxation time of the material.
For example, the motion of mountains is visible with respect to the history of
the earth but it remains unchanged if seen in the time span of a human life.
Since seventeenth century, scientists are intensively studying the characteristics
process for flow and its related phenomenons. Inspite the early basic rheological
fundamentals reported by Robert Hooke in his book “Micrographia” in 1665 and
by Isaac Newton in his work “Philosophiae Naturalis Principia Mathematica” in
1686 it took another 250 years till Eugene Bingham and Markus Reiner developed
rheology as a science as its own. Today rheology itself not only serves the area
of scientific research but also used in detecting and controlling the production
processes and quality.
99
5 Results and Discussion
5.2.2.2 Theoretical Background and Definitions
Rheological properties can be investigated using various Rheometers, namely
rotational rheometer, oscillatory rheometer, capillary viscosimeter and falling
ball rheometer. In the course of this work mainly the first two rheometers found
compatibility with the material state. For the measurements with rotational and
oscillatory rheometer either the angular velocity or the torque is given. The
geometrical arrangement differs depending on the initial viscosity of the tested
material from coaxial system to plate-plate-system till cone-plate-system.
In contrast to rotational rheometer where constant shear force is applied to
the substance, the oscillatory rheometer allows a vibratory motion of small am-
plitude to the measuring unit. The oscillatory rheometer method is suitable for
analyzing the influence of internal structural forces in the material. Hence, dis-
tinct measurement of complex rheological properties of a material is possible only
with oscillatory rheometer.
The Rheological Base:
Newton‘s liquid model and Hooks solid body model are defined as rheological
base.
The Newton’s liquid model is an ideal viscous material which deforms irre-
versibly and linearly with time and shows the proportionality between stress and
the shear strain rate.
γ =τ
ηand ε =
σ
ηe
(5.1)
where
η, ηe = shear and extensional viscosity [Pa.s],
γ, ε = shear and tensile strain rate,
τ , σ = shear and tensile stress [Pa]
The Hook’s solid body model is an ideal elastic material which undergoes
reversible deformation with stress and shows the proportionality between stress
and the strain.
γ =τ
Gand ε =
σ
E(5.2)
100
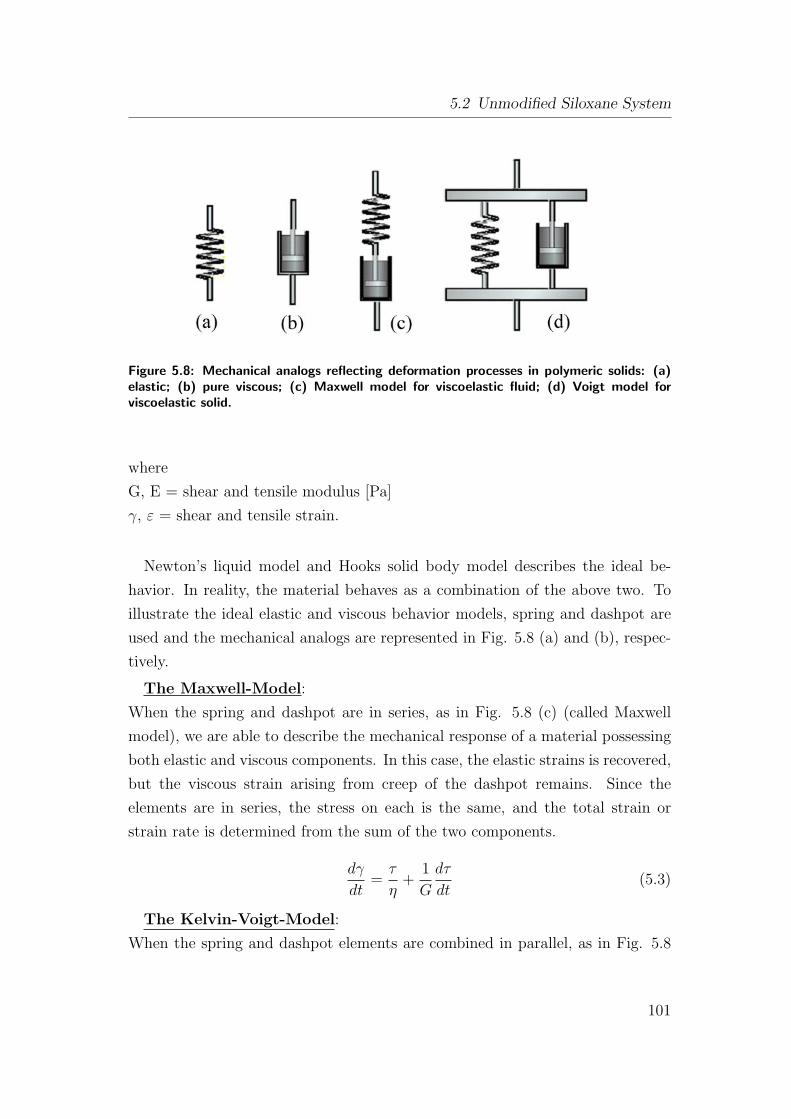
5.2 Unmodified Siloxane System
Figure 5.8: Mechanical analogs reflecting deformation processes in polymeric solids: (a)elastic; (b) pure viscous; (c) Maxwell model for viscoelastic fluid; (d) Voigt model forviscoelastic solid.
where
G, E = shear and tensile modulus [Pa]
γ, ε = shear and tensile strain.
Newton’s liquid model and Hooks solid body model describes the ideal be-
havior. In reality, the material behaves as a combination of the above two. To
illustrate the ideal elastic and viscous behavior models, spring and dashpot are
used and the mechanical analogs are represented in Fig. 5.8 (a) and (b), respec-
tively.
The Maxwell-Model:
When the spring and dashpot are in series, as in Fig. 5.8 (c) (called Maxwell
model), we are able to describe the mechanical response of a material possessing
both elastic and viscous components. In this case, the elastic strains is recovered,
but the viscous strain arising from creep of the dashpot remains. Since the
elements are in series, the stress on each is the same, and the total strain or
strain rate is determined from the sum of the two components.
dγ
dt=τ
η+
1
G
dτ
dt(5.3)
The Kelvin-Voigt-Model:
When the spring and dashpot elements are combined in parallel, as in Fig. 5.8
101
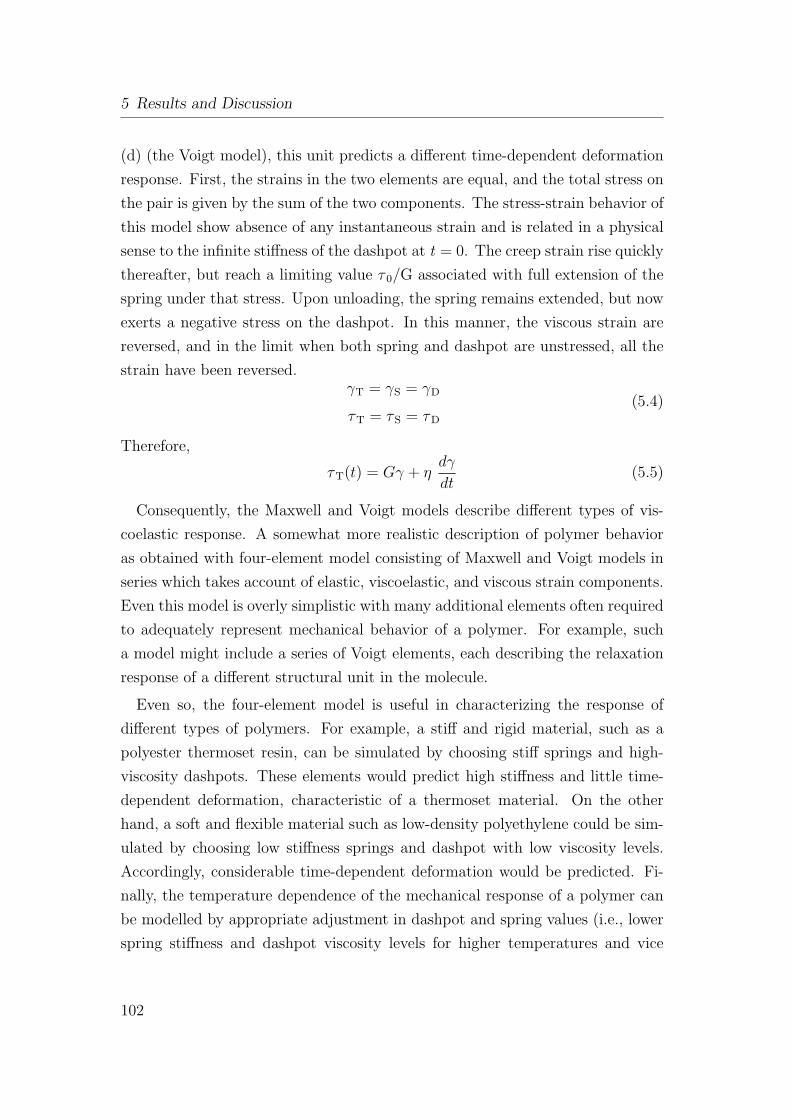
5 Results and Discussion
(d) (the Voigt model), this unit predicts a different time-dependent deformation
response. First, the strains in the two elements are equal, and the total stress on
the pair is given by the sum of the two components. The stress-strain behavior of
this model show absence of any instantaneous strain and is related in a physical
sense to the infinite stiffness of the dashpot at t = 0. The creep strain rise quickly
thereafter, but reach a limiting value τ 0/G associated with full extension of the
spring under that stress. Upon unloading, the spring remains extended, but now
exerts a negative stress on the dashpot. In this manner, the viscous strain are
reversed, and in the limit when both spring and dashpot are unstressed, all the
strain have been reversed.γT = γS = γD
τT = τS = τD
(5.4)
Therefore,
τT(t) = Gγ + ηdγ
dt(5.5)
Consequently, the Maxwell and Voigt models describe different types of vis-
coelastic response. A somewhat more realistic description of polymer behavior
as obtained with four-element model consisting of Maxwell and Voigt models in
series which takes account of elastic, viscoelastic, and viscous strain components.
Even this model is overly simplistic with many additional elements often required
to adequately represent mechanical behavior of a polymer. For example, such
a model might include a series of Voigt elements, each describing the relaxation
response of a different structural unit in the molecule.
Even so, the four-element model is useful in characterizing the response of
different types of polymers. For example, a stiff and rigid material, such as a
polyester thermoset resin, can be simulated by choosing stiff springs and high-
viscosity dashpots. These elements would predict high stiffness and little time-
dependent deformation, characteristic of a thermoset material. On the other
hand, a soft and flexible material such as low-density polyethylene could be sim-
ulated by choosing low stiffness springs and dashpot with low viscosity levels.
Accordingly, considerable time-dependent deformation would be predicted. Fi-
nally, the temperature dependence of the mechanical response of a polymer can
be modelled by appropriate adjustment in dashpot and spring values (i.e., lower
spring stiffness and dashpot viscosity levels for higher temperatures and vice
102
5.2 Unmodified Siloxane System
Figure 5.9: Definition for phase angle δ.
versa for lower temperature conditions).
The Phase Angle δ:
The time-dependent moduli and energy-dissipative mechanisms are examined
through the use of dynamic test methods. In one such method, the instrument
introduce to the sample a forced vibration at different frequencies. The amount
of damping is found by noting the extent to which the cyclic strain lag behind
the applied stress wave. The relation between the instantaneous stress and strain
values is shown in Fig. ref{Fig:phase-angle-delta. Note that the strain vector
γ0 lags the stress vector τ 0 by the phase angle δ. It is instructive to resolve
the stress vector into components both in phase and 90°C out of phase with γ0.
These are given by
τ ′ = τ 0cosδ (in− phase− component)
τ ′′ = τ 0sinδ (out− of − phase− component)(5.6)
The corresponding in-phase and out-of-phase moduli are determined directly
103
5 Results and Discussion
from Eq. (5.6) when the two stress components are divided by γ0 Hence
G′ =τ ′
γ0
=τ 0
γ0
cosδ = G*cosδ
G′′ =τ ′′
γ0
=τ 0
γ0
sinδ = G*sinδ
(5.7)
where G* = absolute modulus =√
(G ′)2 + (G ′′)2.
As per the definition:
when
δ = 0°(material is purely elastic)
δ = 90°(material is purely viscous)
0°< δ < 90°(material is viscoelastic)
The Complex Modulus:
G′ reflects the elastic response of the material, since the stress and strain com-
ponents are in phase. This part of the strain energy, introduced to the system
by the application of stress τ 0, is stored but then completely released when τ 0 is
removed. Consequently, G′ is often referred to as the storage modulus. G′′ on the
other hand, describes the strain energy that is completely dissipated (mostly in
the form of heat) and for this reason it is called the loss modulus. The relatively
amount of damping or energy loss in the material is given by the loss tangent,
tanδ.G′′
G′ =G*sinδ
G*cosδ= tanδ (5.8)
OrG′′
G′ = tanδ (5.9)
Processing of the ceramic precursors for particular applications requires the rhe-
ological characterization of the sample during the fluid-to-solid transition. The
control and prediction of rheological properties at different stages of ceramics
processing is of great importance in establishing the final quality of products.
Each technological process has to be designed for an optimum interval of the
magnitude and temperature - time evolution of rheological properties, respec-
tively viscosity and elasticity. In the present work the evolution of viscosity
and elasticity of the MK polymer, as function of the CLA concentration and
104
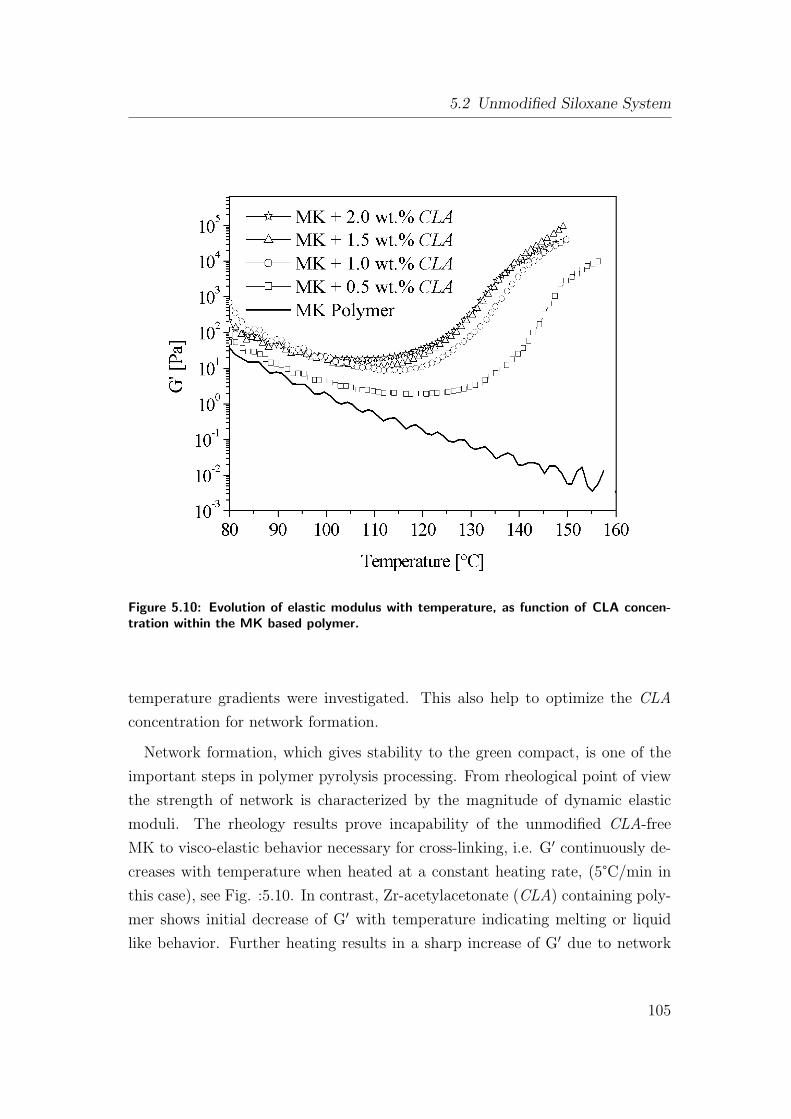
5.2 Unmodified Siloxane System
Figure 5.10: Evolution of elastic modulus with temperature, as function of CLA concen-tration within the MK based polymer.
temperature gradients were investigated. This also help to optimize the CLA
concentration for network formation.
Network formation, which gives stability to the green compact, is one of the
important steps in polymer pyrolysis processing. From rheological point of view
the strength of network is characterized by the magnitude of dynamic elastic
moduli. The rheology results prove incapability of the unmodified CLA-free
MK to visco-elastic behavior necessary for cross-linking, i.e. G′ continuously de-
creases with temperature when heated at a constant heating rate, (5°C/min in
this case), see Fig. :5.10. In contrast, Zr-acetylacetonate (CLA) containing poly-
mer shows initial decrease of G′ with temperature indicating melting or liquid
like behavior. Further heating results in a sharp increase of G′ due to network
105
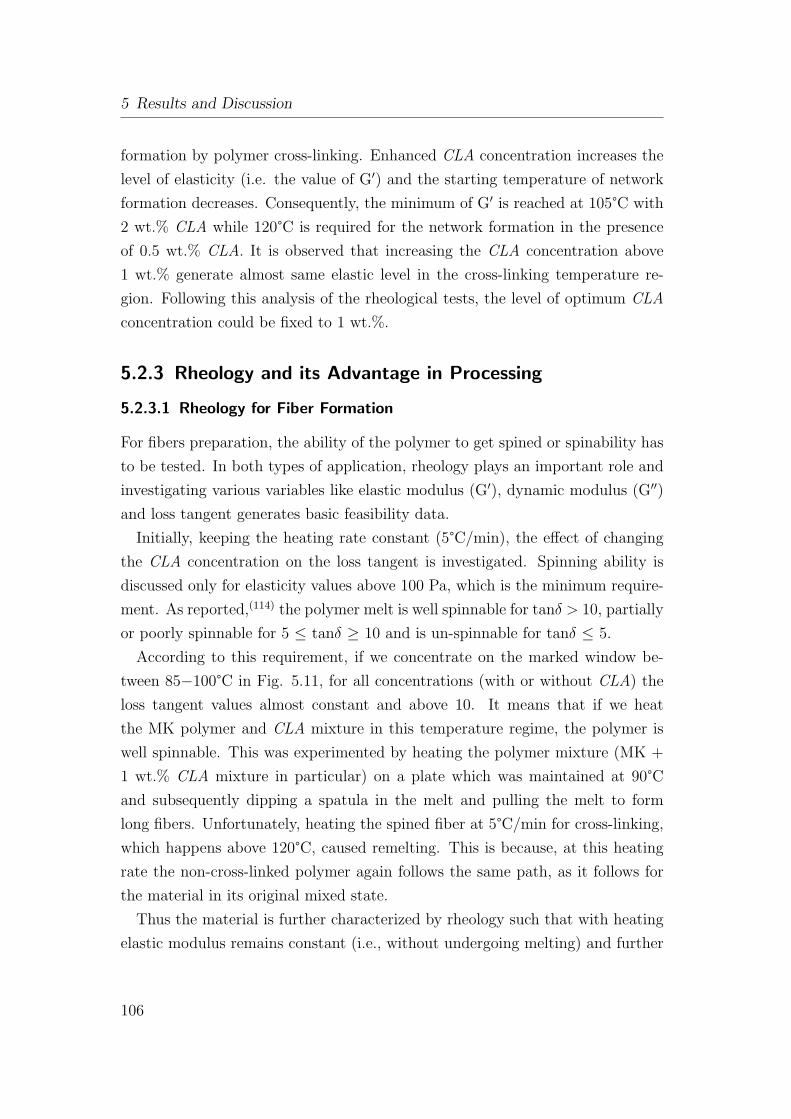
5 Results and Discussion
formation by polymer cross-linking. Enhanced CLA concentration increases the
level of elasticity (i.e. the value of G′) and the starting temperature of network
formation decreases. Consequently, the minimum of G′ is reached at 105°C with
2 wt.% CLA while 120°C is required for the network formation in the presence
of 0.5 wt.% CLA. It is observed that increasing the CLA concentration above
1 wt.% generate almost same elastic level in the cross-linking temperature re-
gion. Following this analysis of the rheological tests, the level of optimum CLA
concentration could be fixed to 1 wt.%.
5.2.3 Rheology and its Advantage in Processing
5.2.3.1 Rheology for Fiber Formation
For fibers preparation, the ability of the polymer to get spined or spinability has
to be tested. In both types of application, rheology plays an important role and
investigating various variables like elastic modulus (G′), dynamic modulus (G′′)
and loss tangent generates basic feasibility data.
Initially, keeping the heating rate constant (5°C/min), the effect of changing
the CLA concentration on the loss tangent is investigated. Spinning ability is
discussed only for elasticity values above 100 Pa, which is the minimum require-
ment. As reported,(114) the polymer melt is well spinnable for tanδ > 10, partially
or poorly spinnable for 5 ≤ tanδ ≥ 10 and is un-spinnable for tanδ ≤ 5.
According to this requirement, if we concentrate on the marked window be-
tween 85−100°C in Fig. 5.11, for all concentrations (with or without CLA) the
loss tangent values almost constant and above 10. It means that if we heat
the MK polymer and CLA mixture in this temperature regime, the polymer is
well spinnable. This was experimented by heating the polymer mixture (MK +
1 wt.% CLA mixture in particular) on a plate which was maintained at 90°Cand subsequently dipping a spatula in the melt and pulling the melt to form
long fibers. Unfortunately, heating the spined fiber at 5°C/min for cross-linking,
which happens above 120°C, caused remelting. This is because, at this heating
rate the non-cross-linked polymer again follows the same path, as it follows for
the material in its original mixed state.
Thus the material is further characterized by rheology such that with heating
elastic modulus remains constant (i.e., without undergoing melting) and further
106
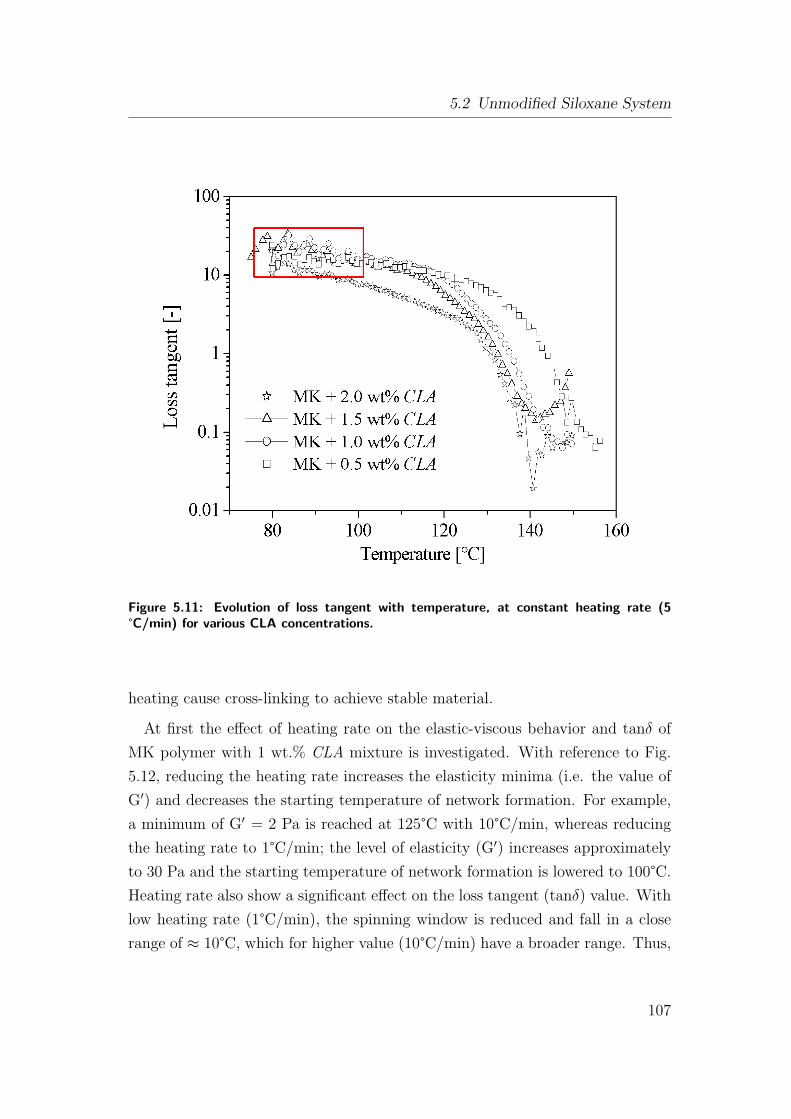
5.2 Unmodified Siloxane System
Figure 5.11: Evolution of loss tangent with temperature, at constant heating rate (5°C/min) for various CLA concentrations.
heating cause cross-linking to achieve stable material.
At first the effect of heating rate on the elastic-viscous behavior and tanδ of
MK polymer with 1 wt.% CLA mixture is investigated. With reference to Fig.
5.12, reducing the heating rate increases the elasticity minima (i.e. the value of
G′) and decreases the starting temperature of network formation. For example,
a minimum of G′ = 2 Pa is reached at 125°C with 10°C/min, whereas reducing
the heating rate to 1°C/min; the level of elasticity (G′) increases approximately
to 30 Pa and the starting temperature of network formation is lowered to 100°C.
Heating rate also show a significant effect on the loss tangent (tanδ) value. With
low heating rate (1°C/min), the spinning window is reduced and fall in a close
range of ≈ 10°C, which for higher value (10°C/min) have a broader range. Thus,
107
5 Results and Discussion
Figure 5.12: Evolution of elastic modulus and loss tangent with temperature, for constantCLA concentration (1 wt.%), as a function of heating rate.
the elastic modulus can possibly be maintain constant with temperature (to a
value higher than say 100 Pa) by designing various heating rate stages in the
elastic region, and further increasing the elasticity to very high value (fast cross-
linking) with temperature.
Accordingly, different heating schemes are designed along with the normal
constant heating rate and isothermal holding, with an ideal scheme mentioned
in Fig. 5.13 and its effect on the evolution of G′ is shown in Fig. 5.14. Dotted
lines from Fig. 5.14 represents minimum requirements for G′ i.e. 100 Pa. The
effect of single step heating [scheme (a)] is already discussed, which shows a
continuous decrease in the G′ with temperature up to a certain temperature and
sharp increase in the G′ with further rise in the temperature. In contrast, the
multiple heating rate scheme, namely scheme (b), which show different steps for
the heating rate (between 85-87, 87-100 and 100-130°C), show a constant value
108
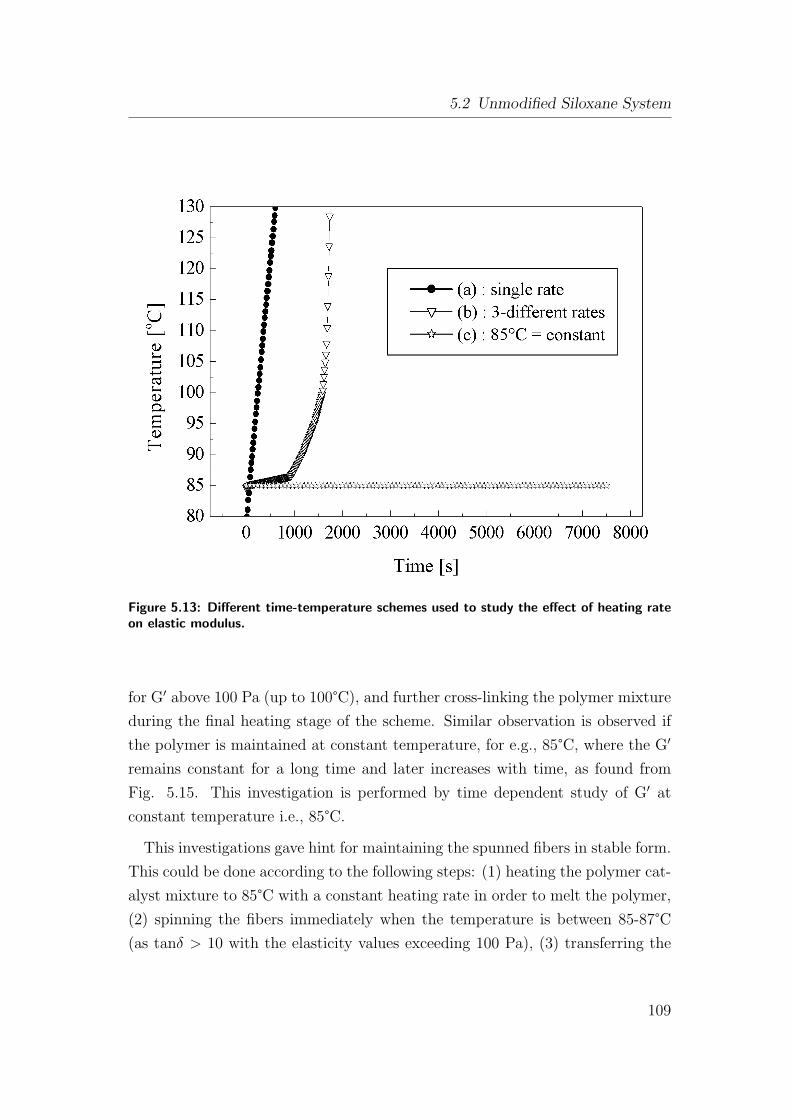
5.2 Unmodified Siloxane System
Figure 5.13: Different time-temperature schemes used to study the effect of heating rateon elastic modulus.
for G′ above 100 Pa (up to 100°C), and further cross-linking the polymer mixture
during the final heating stage of the scheme. Similar observation is observed if
the polymer is maintained at constant temperature, for e.g., 85°C, where the G′
remains constant for a long time and later increases with time, as found from
Fig. 5.15. This investigation is performed by time dependent study of G′ at
constant temperature i.e., 85°C.
This investigations gave hint for maintaining the spunned fibers in stable form.
This could be done according to the following steps: (1) heating the polymer cat-
alyst mixture to 85°C with a constant heating rate in order to melt the polymer,
(2) spinning the fibers immediately when the temperature is between 85-87°C(as tanδ > 10 with the elasticity values exceeding 100 Pa), (3) transferring the
109
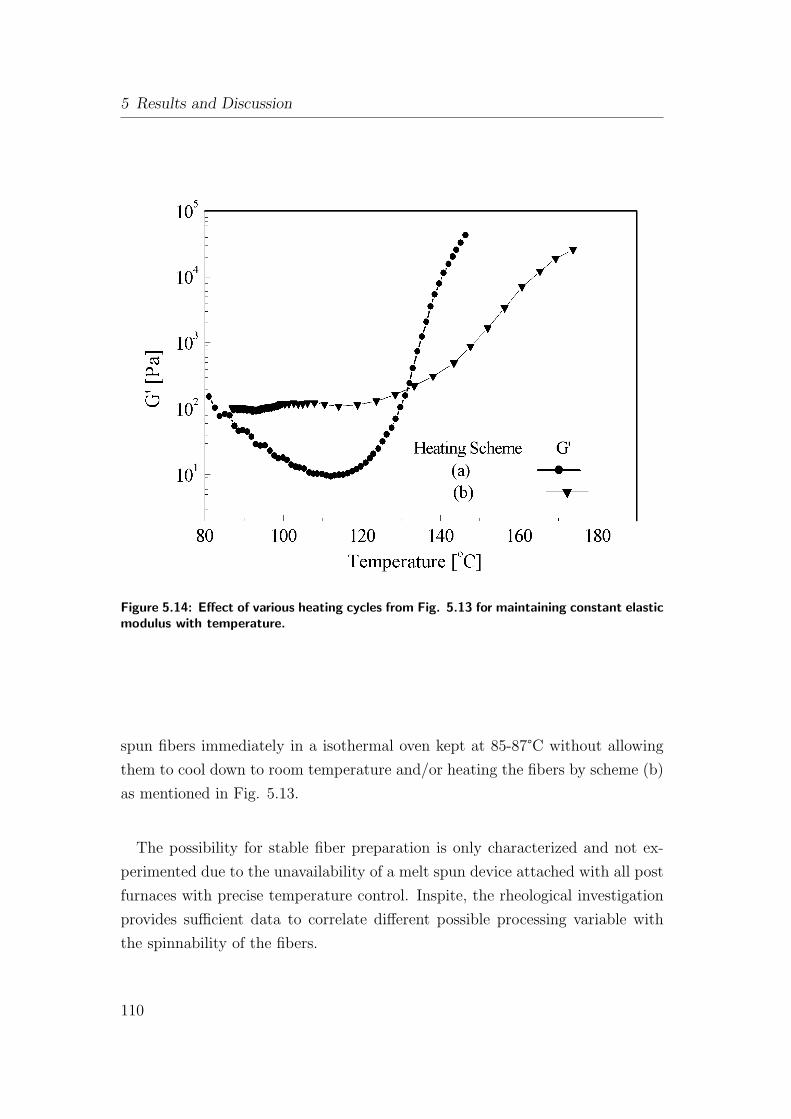
5 Results and Discussion
Figure 5.14: Effect of various heating cycles from Fig. 5.13 for maintaining constant elasticmodulus with temperature.
spun fibers immediately in a isothermal oven kept at 85-87°C without allowing
them to cool down to room temperature and/or heating the fibers by scheme (b)
as mentioned in Fig. 5.13.
The possibility for stable fiber preparation is only characterized and not ex-
perimented due to the unavailability of a melt spun device attached with all post
furnaces with precise temperature control. Inspite, the rheological investigation
provides sufficient data to correlate different possible processing variable with
the spinnability of the fibers.
110
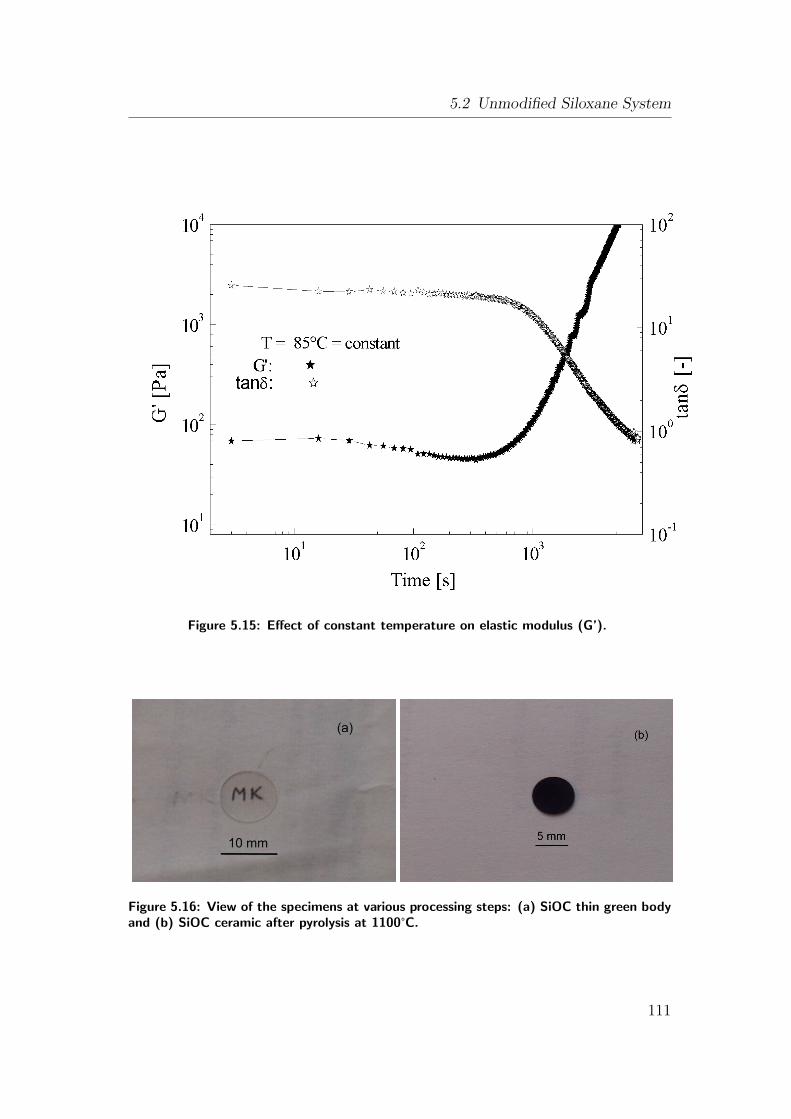
5.2 Unmodified Siloxane System
Figure 5.15: Effect of constant temperature on elastic modulus (G’).
Figure 5.16: View of the specimens at various processing steps: (a) SiOC thin green bodyand (b) SiOC ceramic after pyrolysis at 1100°C.
111
5 Results and Discussion
5.2.3.2 Rheology for Green-Bulk Formation
In industry, monoliths (or production of direct complex forms) from preceramic
polymer are generated with the help of injection molding technique. This tech-
nique, being a state of the art on its own, helps to produce components in huge
volumes, if optimized properly. For injection molding, the injecting mass should
develop low elastic modulus with temperature during the injection stage. This
creates a possibility to inject the mass in the cavity in short time and fill the
cavity completely. After injection, the injected mass should generate viscosity
with temperature. With higher viscosity at high temperature, the formed shape
retains its shape intact after ejection from the cavity.
Fig. 5.10 (page 105) clearly proves the capability of the MK polymer with CLA
to undergo above mentioned requirements with temperature. This investigation
will also be used for the later section for preparation of ceramic MEMS. At this
stage, preparation of green bodies from MK polymer with 1 wt.% CLA and
converting them to crack free SiOC ceramics will be mentioned. The polymer
CLA mixture gets cross-linked in the warm pressing mold forming transparent
green body. The sliced green body with a maximum thickness of 0.6 mm is shown
in Fig. 5.16(a), and the crack-free SiOC ceramic after pyrolysis is shown in Fig.
5.16(b).
5.2.4 Pyrolysis of Unmodified Polymer: Polymer-SiOC
Ceramic Conversion Process
As discussed earlier, addition of 1 wt.% of CLA shift the polycondensation re-
actions to the lower temperature and simultaneously increase the ceramic yield.
This is reflected in very low mass loss between 100−400°C. Together there are
three mass losses identified for the complete pyrolysis cycle, as shown in Fig. 5.17.
The first weight loss between 100−400°C indicate enhanced cross-linking in this
temperature regime. This results the release of water, ethanol and methanol
identified by the masses related to water (H2O; m/z = 18), ethoxy (−C2H5O;
m/z = 45) and methoxy (−CH3O; m/z = 31) groups. In this temperature regime
mainly polycondensation reactions are active and the presence of CLA increases
the extend of cross-linking of the polymer.
112
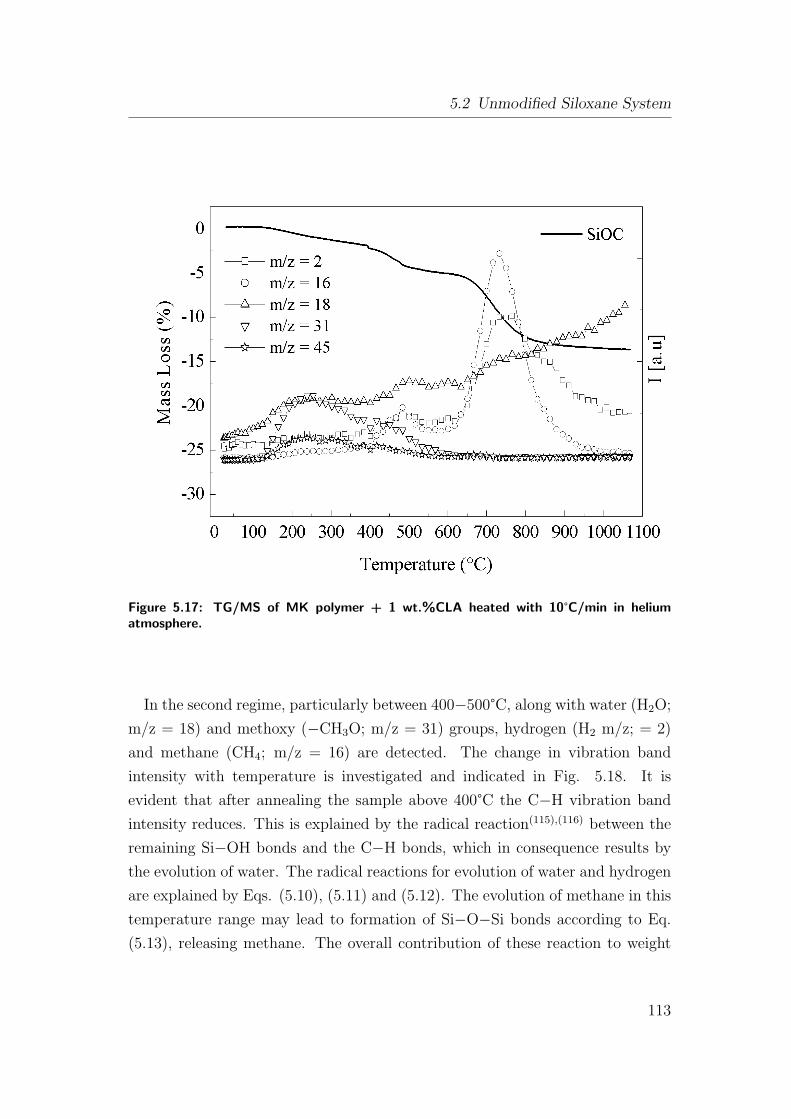
5.2 Unmodified Siloxane System
Figure 5.17: TG/MS of MK polymer + 1 wt.%CLA heated with 10°C/min in heliumatmosphere.
In the second regime, particularly between 400−500°C, along with water (H2O;
m/z = 18) and methoxy (−CH3O; m/z = 31) groups, hydrogen (H2 m/z; = 2)
and methane (CH4; m/z = 16) are detected. The change in vibration band
intensity with temperature is investigated and indicated in Fig. 5.18. It is
evident that after annealing the sample above 400°C the C−H vibration band
intensity reduces. This is explained by the radical reaction(115),(116) between the
remaining Si−OH bonds and the C−H bonds, which in consequence results by
the evolution of water. The radical reactions for evolution of water and hydrogen
are explained by Eqs. (5.10), (5.11) and (5.12). The evolution of methane in this
temperature range may lead to formation of Si−O−Si bonds according to Eq.
(5.13), releasing methane. The overall contribution of these reaction to weight
113
5 Results and Discussion
loss amounts about 2−3%.
≡ Si−OH −→ ≡ Si • + •OH (5.10)
•OH + ≡ C −H −→ ≡ C + H2O ↑ (5.11)
•OH + H2 −→ •H + H2O ↑ (5.12)
≡ Si−OH + Si ≡ CH3 −→ ≡ Si−O − Si ≡ + CH4 ↑ (5.13)
The third mass loss, which is very significant begins at 630°C with a mass loss
of 10%. In this temperature regime, evolution of methane, hydrogen and water
are detected. As reported,(59) at 615°C the methyl groups are active, with the
formation of a large distribution of aliphatic C sites and graphitic carbon. The
evolution of methane and hydrogen, concurrent with the formation of graphite
carbon have been described in the pyrolysis of methyl derived siloxane precursors,
by the following reactions:
≡ Si− CH3 −→ ≡ Si • + • CH3 (5.14)
≡ C −H −→ ≡ C • + •H (5.15)
≡ C −H + •CH3 −→ ≡ C • + CH4 ↑ (5.16)
≡ C −H + H• −→ ≡ C • + H2 ↑ (5.17)
The formation of the Si−C−Si bridges and free carbon in the ceramic products
probably results from these combination of the different≡ Si• and≡ C• radicals.
114
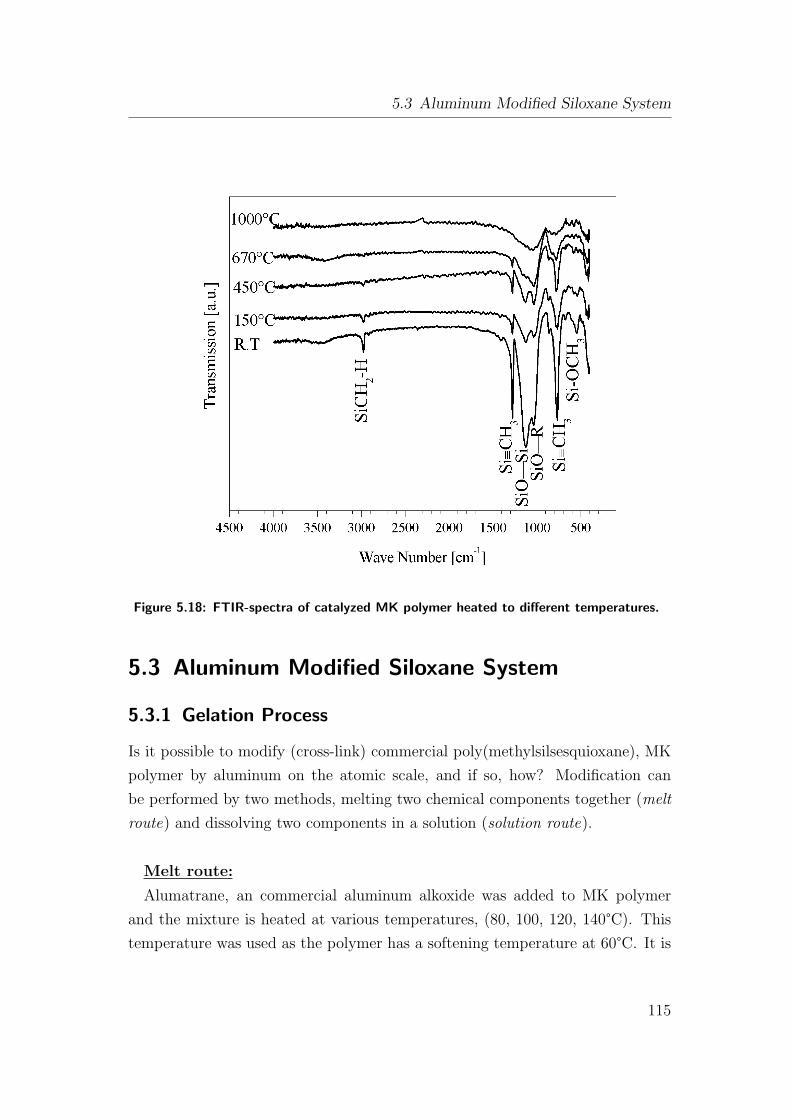
5.3 Aluminum Modified Siloxane System
Figure 5.18: FTIR-spectra of catalyzed MK polymer heated to different temperatures.
5.3 Aluminum Modified Siloxane System
5.3.1 Gelation Process
Is it possible to modify (cross-link) commercial poly(methylsilsesquioxane), MK
polymer by aluminum on the atomic scale, and if so, how? Modification can
be performed by two methods, melting two chemical components together (melt
route) and dissolving two components in a solution (solution route).
Melt route:
Alumatrane, an commercial aluminum alkoxide was added to MK polymer
and the mixture is heated at various temperatures, (80, 100, 120, 140°C). This
temperature was used as the polymer has a softening temperature at 60°C. It is
115
5 Results and Discussion
found that, at all temperatures, alumatrane swims on the top of the melt and do
not possess any solubility with the melt. No marked changes in the viscosity is
observed, even if the melts are isothermally held for long time at above mentioned
temperatures. After solidification by cooling to room temperature and reheating
the mass causes remelting. This indicates that, it is not possible to modify the
MK polymer by aluminum alkoxide by melting, as the polymer is not cross-linked
(normally cross-linked polymers are difficult to remelt).
Solution route:
MK polymer contains hydroxy, ethoxy and methoxy groups as functional
groups, and these groups can react with alkoxide for cross-linking. Cross-linking
reaction of MK polymer with aluminum alkoxide compounds like alumatrane
used in this work proceeds via a sol-gel process at room temperature. The sol-
gel transition is found here with isopropanol as the solvent. Sols prepared in
acetone, methanol, ethanol, diethyl ether or n-hexane do not transform to gel
at room temperature. Alumatrane reacts to a gel like state with MK polymer
in the presence of non-dried isopropanol by alcoholysis or hydrolysis and sub-
sequent polycondensation. Alumatrane is hydrolyzed by water which is present
in non-dried isopropanol. This results in the formation of aluminum hydroxide
as shown by first reaction in Fig. 5.19. Further aluminum hydroxide [Al(OH)3]
reacts with the polymer according to condensation reaction as shown by bottom
reactions in Fig. 5.19. Increasing the alumatrane content changes the color of
the polymeric gel from white to faint yellow. The gel time is dependent on the
amount of alkoxide present. Gel time of 2, 5, and 11 h was observed for the
9.1 (SiAlOC1), 16.6 (SiAlOC2) and 23.6 wt.% (SiAlOC3) alumatrane mixture,
respectively. Very low amount of alumatrane, namely 2.5 wt.% do not transform
to a gel state at room temperature and instead requires temperature of 50°Cfor 5h. A physical view of one such sol like SiAlOC1 and corresponding gel, is
represented in Fig. 5.20.
5.3.2 SiAlOC Polymer-Ceramic Transformation Process
The thermal gravimetric analysis between room temperature and 1100°C under
argon flow show a total weight loss of 21−29%. As analyzed by in situ mass
spectrometry (refer in Fig. 5.21), between 100 and 400°C water, methanol and
116
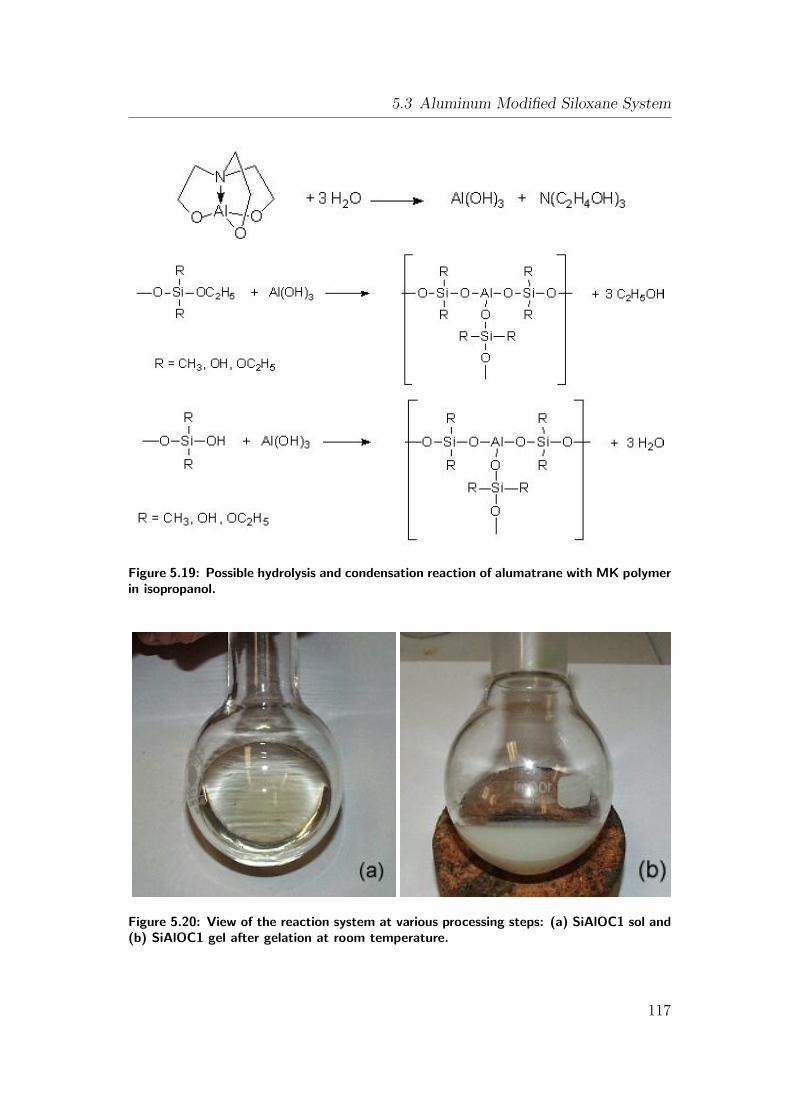
5.3 Aluminum Modified Siloxane System
Figure 5.19: Possible hydrolysis and condensation reaction of alumatrane with MK polymerin isopropanol.
Figure 5.20: View of the reaction system at various processing steps: (a) SiAlOC1 sol and(b) SiAlOC1 gel after gelation at room temperature.
117
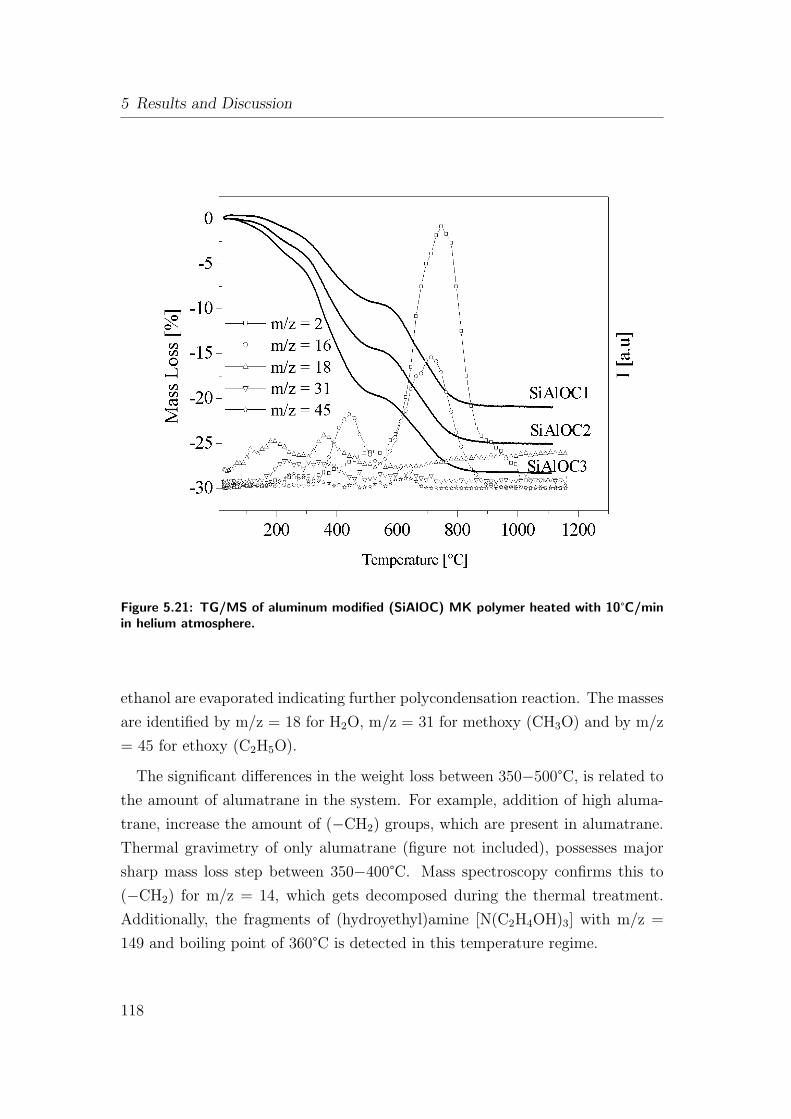
5 Results and Discussion
Figure 5.21: TG/MS of aluminum modified (SiAlOC) MK polymer heated with 10°C/minin helium atmosphere.
ethanol are evaporated indicating further polycondensation reaction. The masses
are identified by m/z = 18 for H2O, m/z = 31 for methoxy (CH3O) and by m/z
= 45 for ethoxy (C2H5O).
The significant differences in the weight loss between 350−500°C, is related to
the amount of alumatrane in the system. For example, addition of high aluma-
trane, increase the amount of (−CH2) groups, which are present in alumatrane.
Thermal gravimetry of only alumatrane (figure not included), possesses major
sharp mass loss step between 350−400°C. Mass spectroscopy confirms this to
(−CH2) for m/z = 14, which gets decomposed during the thermal treatment.
Additionally, the fragments of (hydroyethyl)amine [N(C2H4OH)3] with m/z =
149 and boiling point of 360°C is detected in this temperature regime.
118
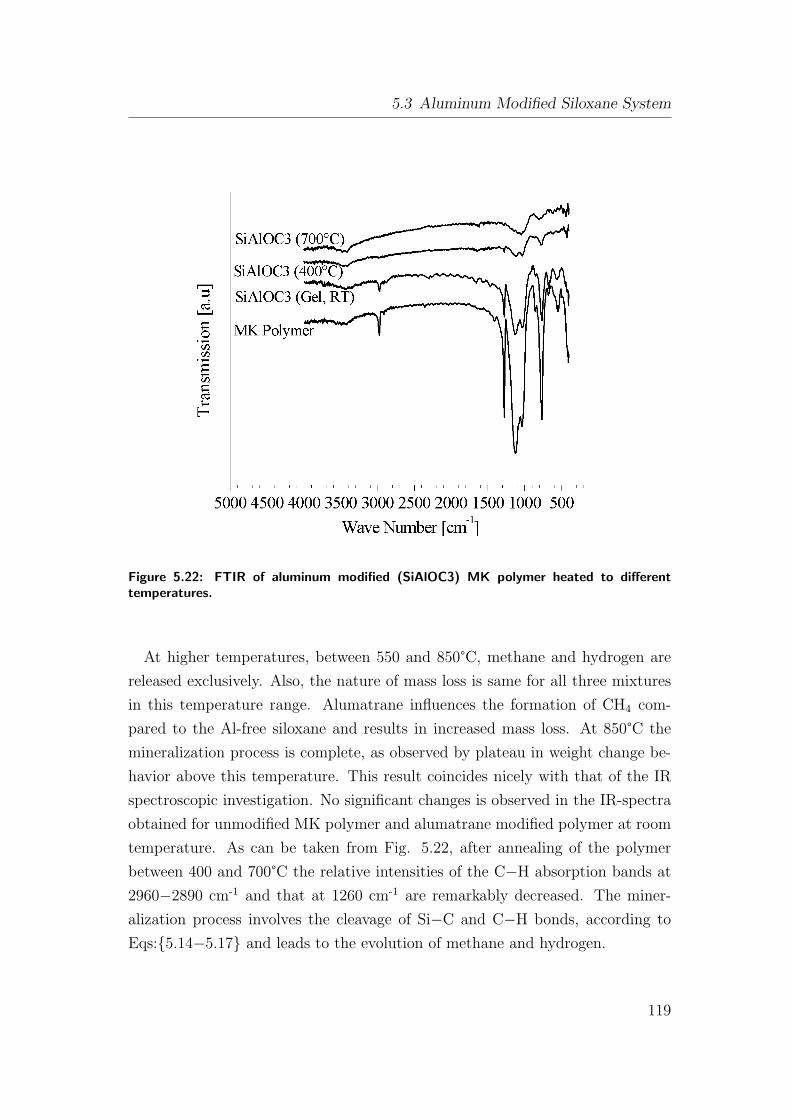
5.3 Aluminum Modified Siloxane System
Figure 5.22: FTIR of aluminum modified (SiAlOC3) MK polymer heated to differenttemperatures.
At higher temperatures, between 550 and 850°C, methane and hydrogen are
released exclusively. Also, the nature of mass loss is same for all three mixtures
in this temperature range. Alumatrane influences the formation of CH4 com-
pared to the Al-free siloxane and results in increased mass loss. At 850°C the
mineralization process is complete, as observed by plateau in weight change be-
havior above this temperature. This result coincides nicely with that of the IR
spectroscopic investigation. No significant changes is observed in the IR-spectra
obtained for unmodified MK polymer and alumatrane modified polymer at room
temperature. As can be taken from Fig. 5.22, after annealing of the polymer
between 400 and 700°C the relative intensities of the C−H absorption bands at
2960−2890 cm-1 and that at 1260 cm-1 are remarkably decreased. The miner-
alization process involves the cleavage of Si−C and C−H bonds, according to
Eqs:{5.14−5.17} and leads to the evolution of methane and hydrogen.
119

5 Results and Discussion
5.4 Chemical Analysis
In order to quantify the elements present in the pyrolyzed mixture and to confirm
the modification process, elemental analysis of the pyrolyzed ceramic polymer is
investigated and listed in Table: 5.3. It is found that, aluminum modification in
SiAlOC ceramic reduces the total carbon content compared to that observed in
SiOC ceramic.
According to the scheme reported by Soraru et al.(53), the quantitative amount
of Si-C equivalence and the Cfree content in the oxycarbide glass is determined.
The sample calculations for SiOC and SiAlOC ceramic are as follow:
SiOC Cermaic
This calculation is done on the basis of chemical analysis (Si, C, O) and ne-
glecting, the presence of residual hydrogen as a first approximation. It is assumed
that only Si−C, Si−O, C−C chemical bonds are present in the silicon oxycarbide
glass.
From Table: 5.3, the experimental glass composition of Si1.00O1.60C0.80 is equated
to SiOxCy.
Then we argue that all the oxygen is bonded to Si and is forming (formally)
SiO2. So, in this case we will have (x/2) SiO2.
Hence,
Si−O equivalence is x/2 = 1.60/2 = 0.8
The remaining silicon, which is not involved in forming silica will form (1-x/2)
SiC.
Thus,
Si−C equivalence is (1-x/2) = (1-0.8) = 0.2
The free C is then equal to: y-(1-x/2)
Cfree = y-(1-x/2) = 0.80 - (0.20) = 0.60, ≈75%
SiAlOC Ceramic
A different approach will be used to calculate the Si−O, Si−C equivalence
and the Cfree in aluminum modified ceramics. In SiAlOC ceramic network, 27Al
MAS NMR (discussed later) confirmed that, aluminum is mainly coordinated
octahedrally Al(6) with oxygen and no Al-C bonds are present. If we calculate
the oxygen content bonded to Al forming (formally) Al2O3, the remaining ce-
120
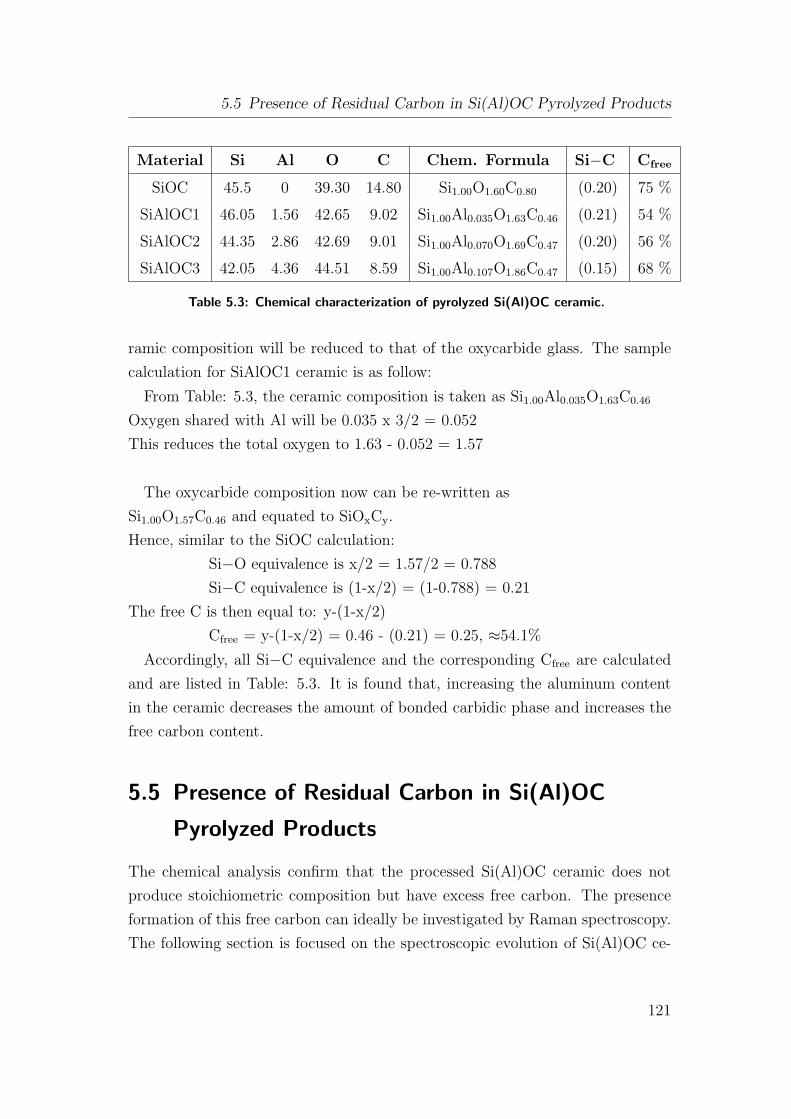
5.5 Presence of Residual Carbon in Si(Al)OC Pyrolyzed Products
Material Si Al O C Chem. Formula Si−C Cfree
SiOC 45.5 0 39.30 14.80 Si1.00O1.60C0.80 (0.20) 75 %
SiAlOC1 46.05 1.56 42.65 9.02 Si1.00Al0.035O1.63C0.46 (0.21) 54 %
SiAlOC2 44.35 2.86 42.69 9.01 Si1.00Al0.070O1.69C0.47 (0.20) 56 %
SiAlOC3 42.05 4.36 44.51 8.59 Si1.00Al0.107O1.86C0.47 (0.15) 68 %
Table 5.3: Chemical characterization of pyrolyzed Si(Al)OC ceramic.
ramic composition will be reduced to that of the oxycarbide glass. The sample
calculation for SiAlOC1 ceramic is as follow:
From Table: 5.3, the ceramic composition is taken as Si1.00Al0.035O1.63C0.46
Oxygen shared with Al will be 0.035 x 3/2 = 0.052
This reduces the total oxygen to 1.63 - 0.052 = 1.57
The oxycarbide composition now can be re-written as
Si1.00O1.57C0.46 and equated to SiOxCy.
Hence, similar to the SiOC calculation:
Si−O equivalence is x/2 = 1.57/2 = 0.788
Si−C equivalence is (1-x/2) = (1-0.788) = 0.21
The free C is then equal to: y-(1-x/2)
Cfree = y-(1-x/2) = 0.46 - (0.21) = 0.25, ≈54.1%
Accordingly, all Si−C equivalence and the corresponding Cfree are calculated
and are listed in Table: 5.3. It is found that, increasing the aluminum content
in the ceramic decreases the amount of bonded carbidic phase and increases the
free carbon content.
5.5 Presence of Residual Carbon in Si(Al)OC
Pyrolyzed Products
The chemical analysis confirm that the processed Si(Al)OC ceramic does not
produce stoichiometric composition but have excess free carbon. The presence
formation of this free carbon can ideally be investigated by Raman spectroscopy.
The following section is focused on the spectroscopic evolution of Si(Al)OC ce-
121
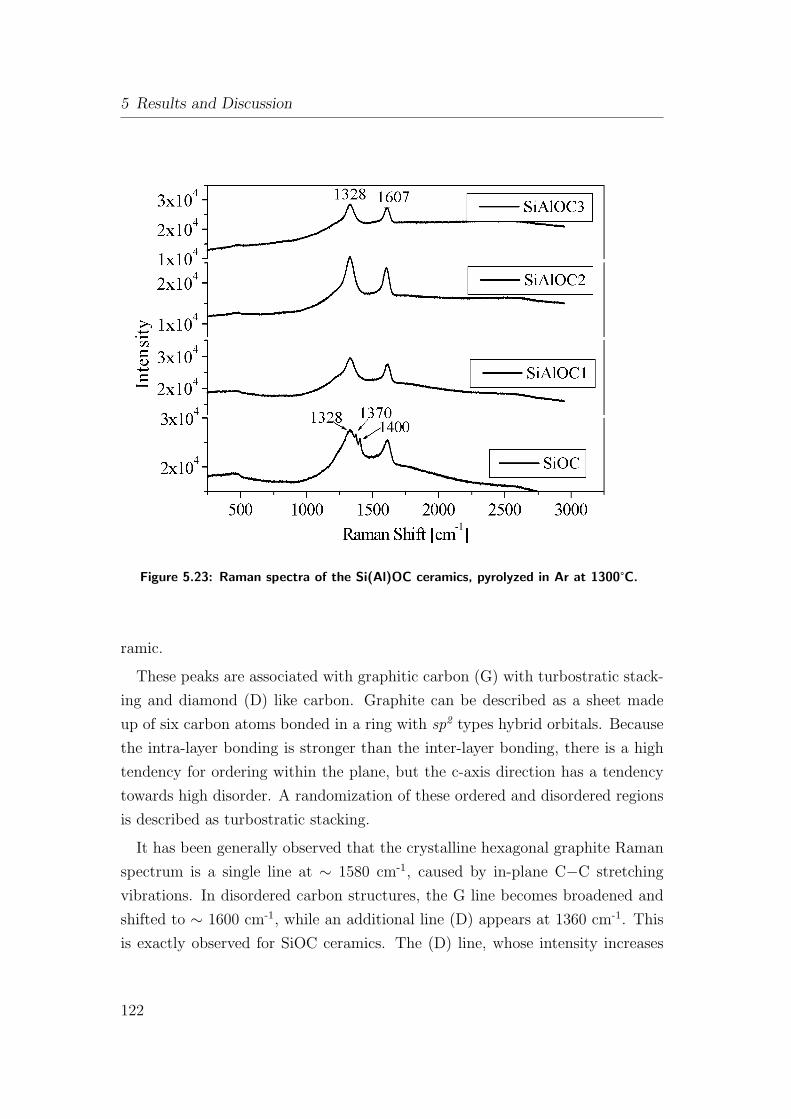
5 Results and Discussion
Figure 5.23: Raman spectra of the Si(Al)OC ceramics, pyrolyzed in Ar at 1300°C.
ramic.
These peaks are associated with graphitic carbon (G) with turbostratic stack-
ing and diamond (D) like carbon. Graphite can be described as a sheet made
up of six carbon atoms bonded in a ring with sp2 types hybrid orbitals. Because
the intra-layer bonding is stronger than the inter-layer bonding, there is a high
tendency for ordering within the plane, but the c-axis direction has a tendency
towards high disorder. A randomization of these ordered and disordered regions
is described as turbostratic stacking.
It has been generally observed that the crystalline hexagonal graphite Raman
spectrum is a single line at ∼ 1580 cm-1, caused by in-plane C−C stretching
vibrations. In disordered carbon structures, the G line becomes broadened and
shifted to ∼ 1600 cm-1, while an additional line (D) appears at 1360 cm-1. This
is exactly observed for SiOC ceramics. The (D) line, whose intensity increases
122
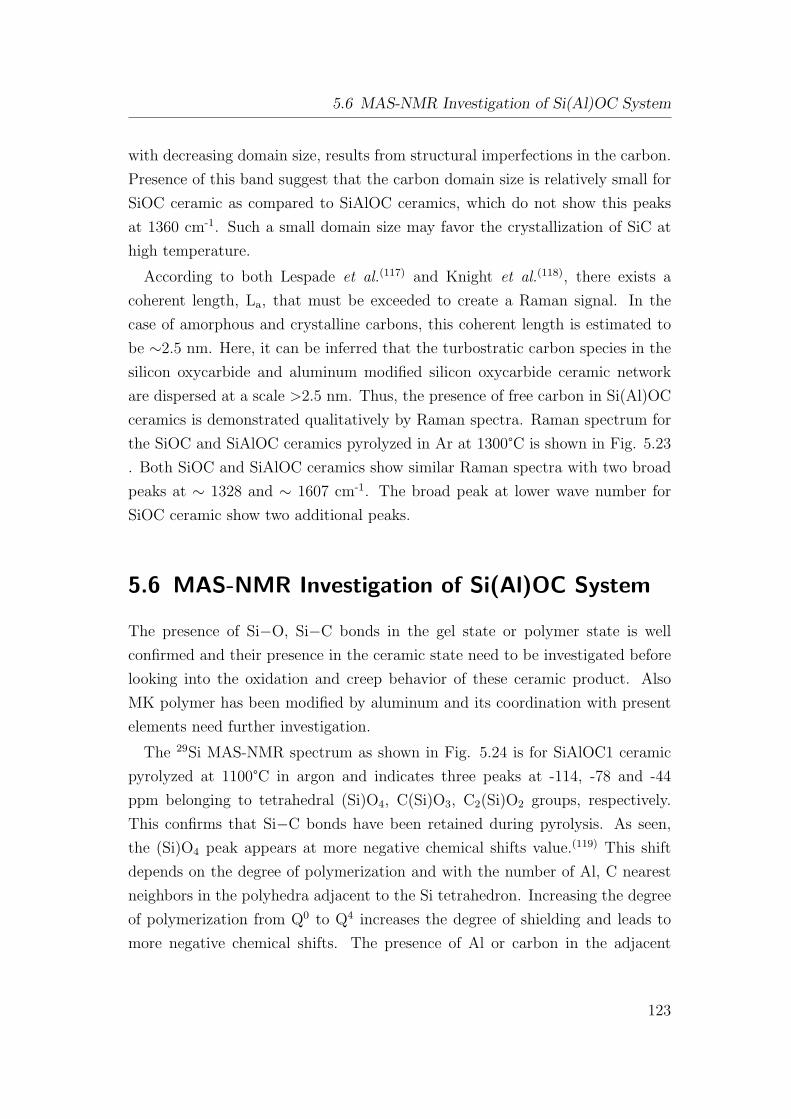
5.6 MAS-NMR Investigation of Si(Al)OC System
with decreasing domain size, results from structural imperfections in the carbon.
Presence of this band suggest that the carbon domain size is relatively small for
SiOC ceramic as compared to SiAlOC ceramics, which do not show this peaks
at 1360 cm-1. Such a small domain size may favor the crystallization of SiC at
high temperature.
According to both Lespade et al.(117) and Knight et al.(118), there exists a
coherent length, La, that must be exceeded to create a Raman signal. In the
case of amorphous and crystalline carbons, this coherent length is estimated to
be ∼2.5 nm. Here, it can be inferred that the turbostratic carbon species in the
silicon oxycarbide and aluminum modified silicon oxycarbide ceramic network
are dispersed at a scale >2.5 nm. Thus, the presence of free carbon in Si(Al)OC
ceramics is demonstrated qualitatively by Raman spectra. Raman spectrum for
the SiOC and SiAlOC ceramics pyrolyzed in Ar at 1300°C is shown in Fig. 5.23
. Both SiOC and SiAlOC ceramics show similar Raman spectra with two broad
peaks at ∼ 1328 and ∼ 1607 cm-1. The broad peak at lower wave number for
SiOC ceramic show two additional peaks.
5.6 MAS-NMR Investigation of Si(Al)OC System
The presence of Si−O, Si−C bonds in the gel state or polymer state is well
confirmed and their presence in the ceramic state need to be investigated before
looking into the oxidation and creep behavior of these ceramic product. Also
MK polymer has been modified by aluminum and its coordination with present
elements need further investigation.
The 29Si MAS-NMR spectrum as shown in Fig. 5.24 is for SiAlOC1 ceramic
pyrolyzed at 1100°C in argon and indicates three peaks at -114, -78 and -44
ppm belonging to tetrahedral (Si)O4, C(Si)O3, C2(Si)O2 groups, respectively.
This confirms that Si−C bonds have been retained during pyrolysis. As seen,
the (Si)O4 peak appears at more negative chemical shifts value.(119) This shift
depends on the degree of polymerization and with the number of Al, C nearest
neighbors in the polyhedra adjacent to the Si tetrahedron. Increasing the degree
of polymerization from Q0 to Q4 increases the degree of shielding and leads to
more negative chemical shifts. The presence of Al or carbon in the adjacent
123
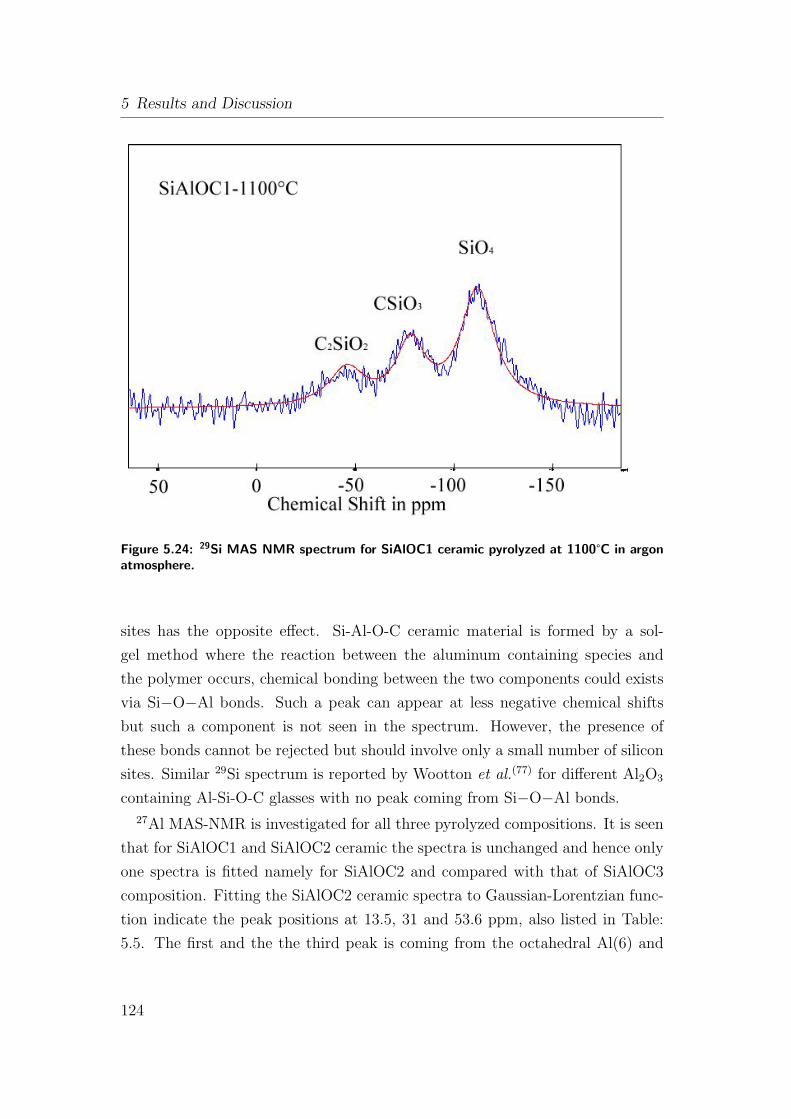
5 Results and Discussion
Figure 5.24: 29Si MAS NMR spectrum for SiAlOC1 ceramic pyrolyzed at 1100°C in argonatmosphere.
sites has the opposite effect. Si-Al-O-C ceramic material is formed by a sol-
gel method where the reaction between the aluminum containing species and
the polymer occurs, chemical bonding between the two components could exists
via Si−O−Al bonds. Such a peak can appear at less negative chemical shifts
but such a component is not seen in the spectrum. However, the presence of
these bonds cannot be rejected but should involve only a small number of silicon
sites. Similar 29Si spectrum is reported by Wootton et al.(77) for different Al2O3
containing Al-Si-O-C glasses with no peak coming from Si−O−Al bonds.
27Al MAS-NMR is investigated for all three pyrolyzed compositions. It is seen
that for SiAlOC1 and SiAlOC2 ceramic the spectra is unchanged and hence only
one spectra is fitted namely for SiAlOC2 and compared with that of SiAlOC3
composition. Fitting the SiAlOC2 ceramic spectra to Gaussian-Lorentzian func-
tion indicate the peak positions at 13.5, 31 and 53.6 ppm, also listed in Table:
5.5. The first and the the third peak is coming from the octahedral Al(6) and
124
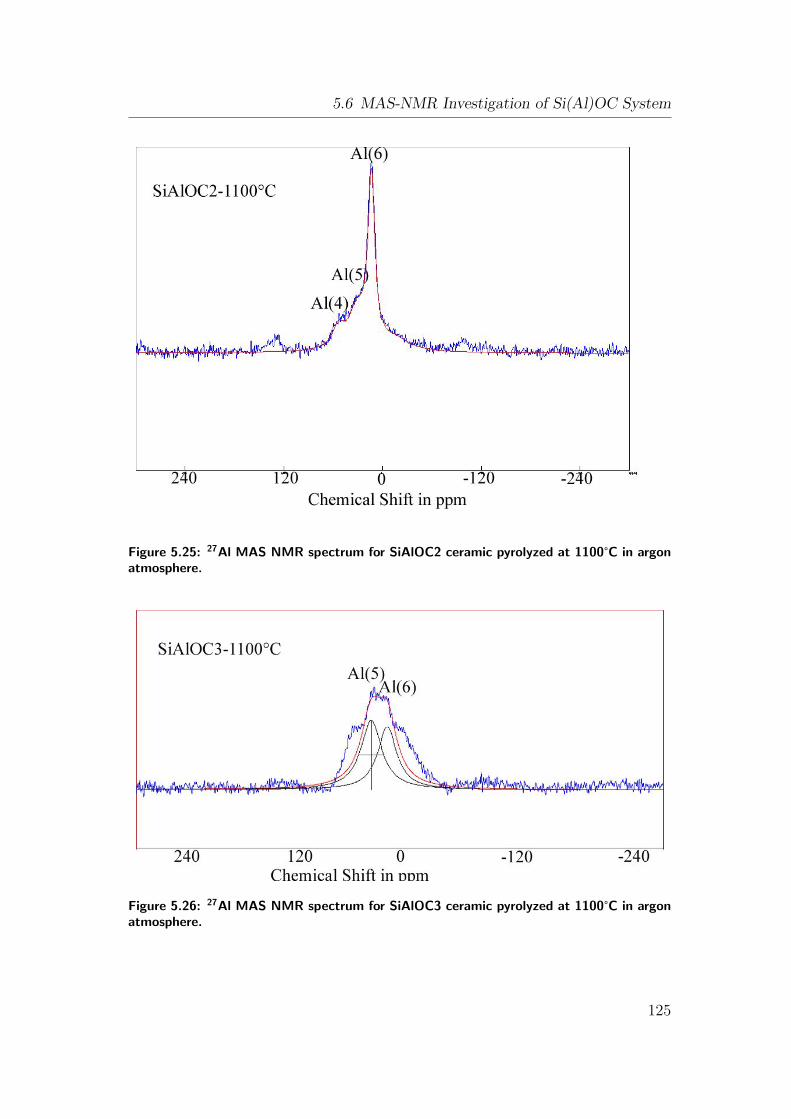
5.6 MAS-NMR Investigation of Si(Al)OC System
Figure 5.25: 27Al MAS NMR spectrum for SiAlOC2 ceramic pyrolyzed at 1100°C in argonatmosphere.
Figure 5.26: 27Al MAS NMR spectrum for SiAlOC3 ceramic pyrolyzed at 1100°C in argonatmosphere.
125
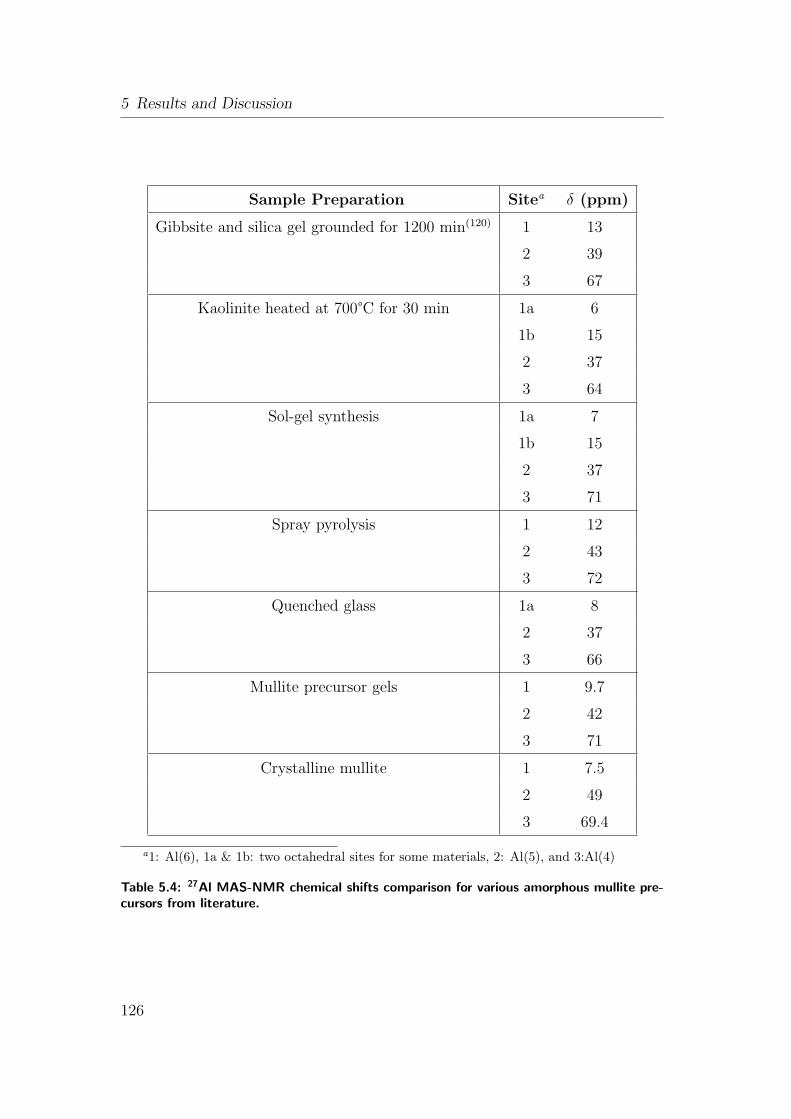
5 Results and Discussion
Sample Preparation Sitea δ (ppm)
Gibbsite and silica gel grounded for 1200 min(120) 1 13
2 39
3 67
Kaolinite heated at 700°C for 30 min 1a 6
1b 15
2 37
3 64
Sol-gel synthesis 1a 7
1b 15
2 37
3 71
Spray pyrolysis 1 12
2 43
3 72
Quenched glass 1a 8
2 37
3 66
Mullite precursor gels 1 9.7
2 42
3 71
Crystalline mullite 1 7.5
2 49
3 69.4
a1: Al(6), 1a & 1b: two octahedral sites for some materials, 2: Al(5), and 3:Al(4)
Table 5.4: 27Al MAS-NMR chemical shifts comparison for various amorphous mullite pre-cursors from literature.
126
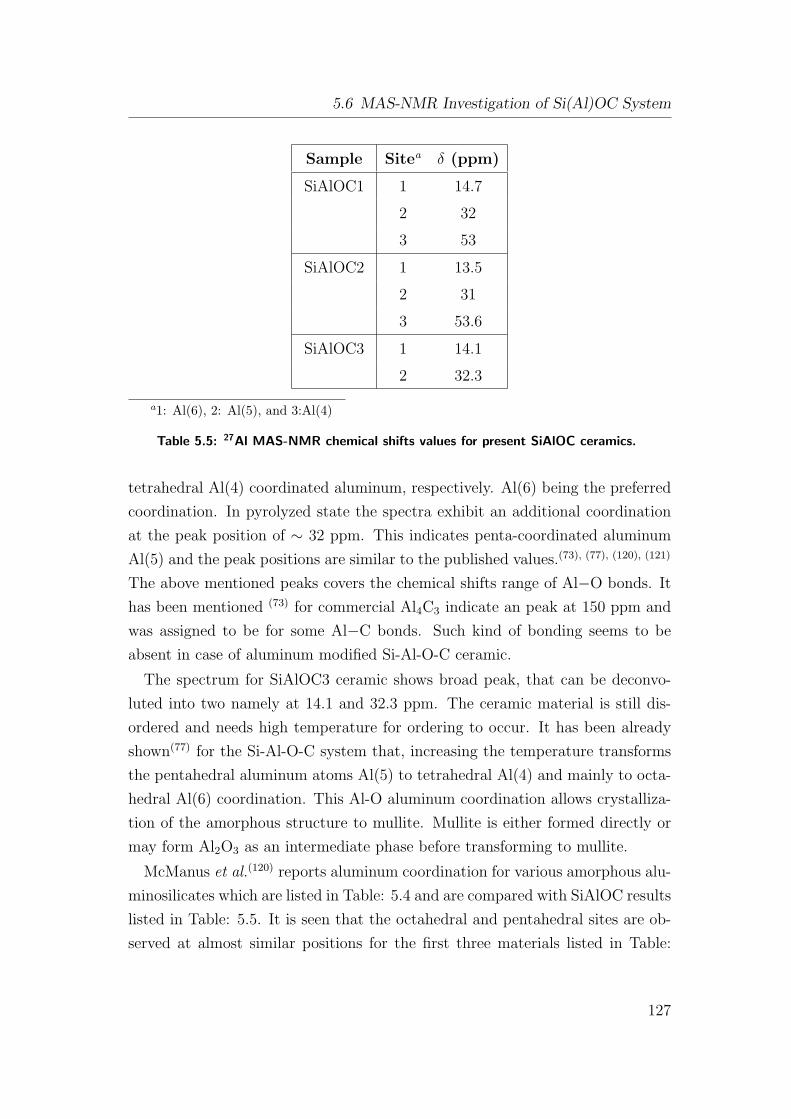
5.6 MAS-NMR Investigation of Si(Al)OC System
Sample Sitea δ (ppm)
SiAlOC1 1 14.7
2 32
3 53
SiAlOC2 1 13.5
2 31
3 53.6
SiAlOC3 1 14.1
2 32.3
a1: Al(6), 2: Al(5), and 3:Al(4)
Table 5.5: 27Al MAS-NMR chemical shifts values for present SiAlOC ceramics.
tetrahedral Al(4) coordinated aluminum, respectively. Al(6) being the preferred
coordination. In pyrolyzed state the spectra exhibit an additional coordination
at the peak position of ∼ 32 ppm. This indicates penta-coordinated aluminum
Al(5) and the peak positions are similar to the published values.(73), (77), (120), (121)
The above mentioned peaks covers the chemical shifts range of Al−O bonds. It
has been mentioned (73) for commercial Al4C3 indicate an peak at 150 ppm and
was assigned to be for some Al−C bonds. Such kind of bonding seems to be
absent in case of aluminum modified Si-Al-O-C ceramic.
The spectrum for SiAlOC3 ceramic shows broad peak, that can be deconvo-
luted into two namely at 14.1 and 32.3 ppm. The ceramic material is still dis-
ordered and needs high temperature for ordering to occur. It has been already
shown(77) for the Si-Al-O-C system that, increasing the temperature transforms
the pentahedral aluminum atoms Al(5) to tetrahedral Al(4) and mainly to octa-
hedral Al(6) coordination. This Al-O aluminum coordination allows crystalliza-
tion of the amorphous structure to mullite. Mullite is either formed directly or
may form Al2O3 as an intermediate phase before transforming to mullite.
McManus et al.(120) reports aluminum coordination for various amorphous alu-
minosilicates which are listed in Table: 5.4 and are compared with SiAlOC results
listed in Table: 5.5. It is seen that the octahedral and pentahedral sites are ob-
served at almost similar positions for the first three materials listed in Table:
127
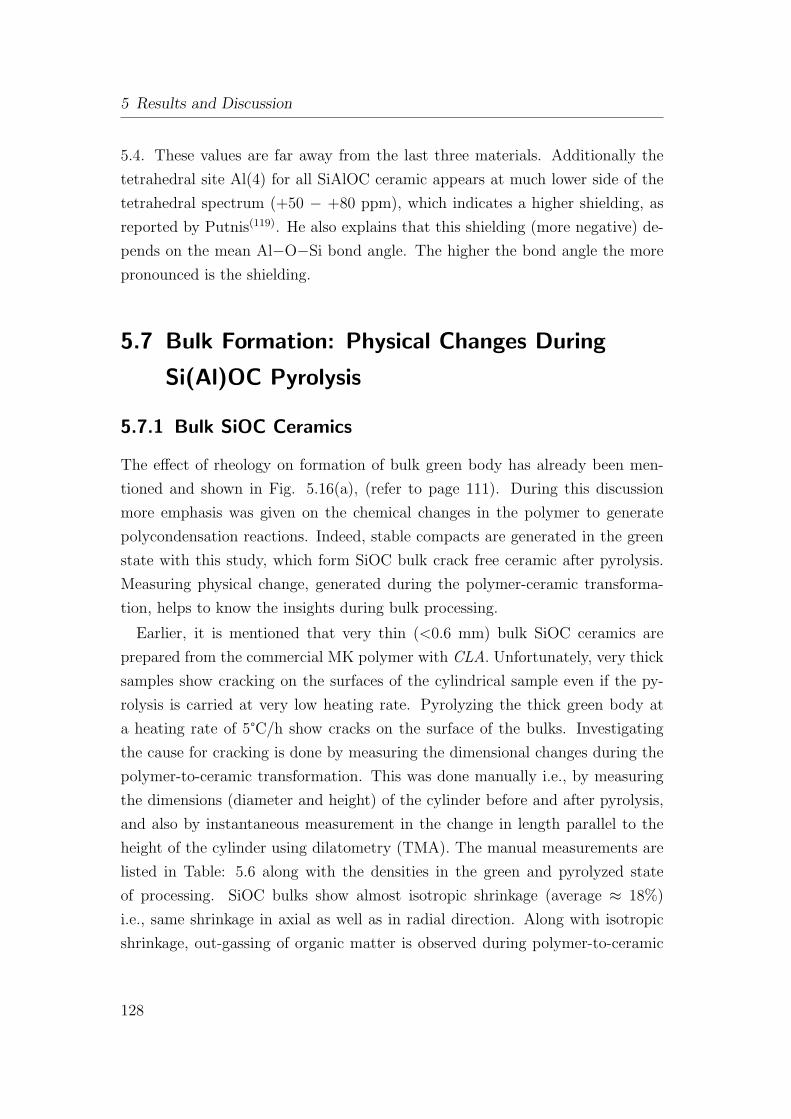
5 Results and Discussion
5.4. These values are far away from the last three materials. Additionally the
tetrahedral site Al(4) for all SiAlOC ceramic appears at much lower side of the
tetrahedral spectrum (+50 − +80 ppm), which indicates a higher shielding, as
reported by Putnis(119). He also explains that this shielding (more negative) de-
pends on the mean Al−O−Si bond angle. The higher the bond angle the more
pronounced is the shielding.
5.7 Bulk Formation: Physical Changes During
Si(Al)OC Pyrolysis
5.7.1 Bulk SiOC Ceramics
The effect of rheology on formation of bulk green body has already been men-
tioned and shown in Fig. 5.16(a), (refer to page 111). During this discussion
more emphasis was given on the chemical changes in the polymer to generate
polycondensation reactions. Indeed, stable compacts are generated in the green
state with this study, which form SiOC bulk crack free ceramic after pyrolysis.
Measuring physical change, generated during the polymer-ceramic transforma-
tion, helps to know the insights during bulk processing.
Earlier, it is mentioned that very thin (<0.6 mm) bulk SiOC ceramics are
prepared from the commercial MK polymer with CLA. Unfortunately, very thick
samples show cracking on the surfaces of the cylindrical sample even if the py-
rolysis is carried at very low heating rate. Pyrolyzing the thick green body at
a heating rate of 5°C/h show cracks on the surface of the bulks. Investigating
the cause for cracking is done by measuring the dimensional changes during the
polymer-to-ceramic transformation. This was done manually i.e., by measuring
the dimensions (diameter and height) of the cylinder before and after pyrolysis,
and also by instantaneous measurement in the change in length parallel to the
height of the cylinder using dilatometry (TMA). The manual measurements are
listed in Table: 5.6 along with the densities in the green and pyrolyzed state
of processing. SiOC bulks show almost isotropic shrinkage (average ≈ 18%)
i.e., same shrinkage in axial as well as in radial direction. Along with isotropic
shrinkage, out-gassing of organic matter is observed during polymer-to-ceramic
128
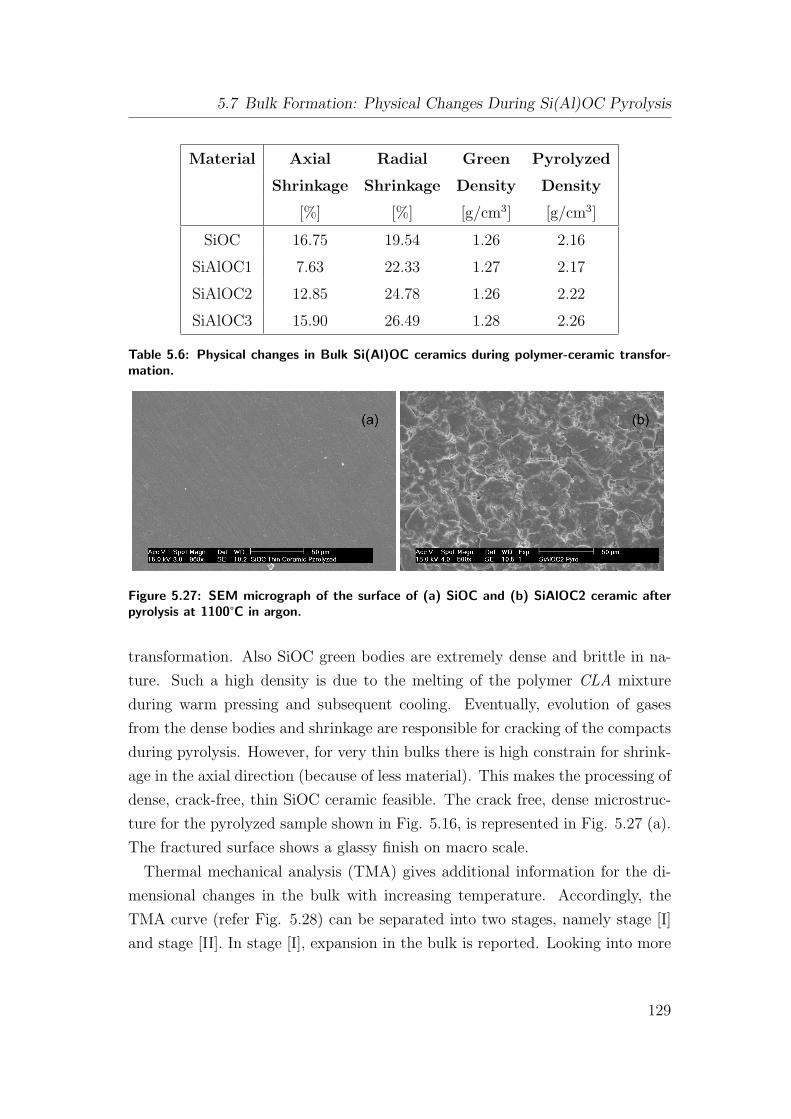
5.7 Bulk Formation: Physical Changes During Si(Al)OC Pyrolysis
Material Axial Radial Green Pyrolyzed
Shrinkage Shrinkage Density Density
[%] [%] [g/cm3] [g/cm3]
SiOC 16.75 19.54 1.26 2.16
SiAlOC1 7.63 22.33 1.27 2.17
SiAlOC2 12.85 24.78 1.26 2.22
SiAlOC3 15.90 26.49 1.28 2.26
Table 5.6: Physical changes in Bulk Si(Al)OC ceramics during polymer-ceramic transfor-mation.
Figure 5.27: SEM micrograph of the surface of (a) SiOC and (b) SiAlOC2 ceramic afterpyrolysis at 1100°C in argon.
transformation. Also SiOC green bodies are extremely dense and brittle in na-
ture. Such a high density is due to the melting of the polymer CLA mixture
during warm pressing and subsequent cooling. Eventually, evolution of gases
from the dense bodies and shrinkage are responsible for cracking of the compacts
during pyrolysis. However, for very thin bulks there is high constrain for shrink-
age in the axial direction (because of less material). This makes the processing of
dense, crack-free, thin SiOC ceramic feasible. The crack free, dense microstruc-
ture for the pyrolyzed sample shown in Fig. 5.16, is represented in Fig. 5.27 (a).
The fractured surface shows a glassy finish on macro scale.
Thermal mechanical analysis (TMA) gives additional information for the di-
mensional changes in the bulk with increasing temperature. Accordingly, the
TMA curve (refer Fig. 5.28) can be separated into two stages, namely stage [I]
and stage [II]. In stage [I], expansion in the bulk is reported. Looking into more
129
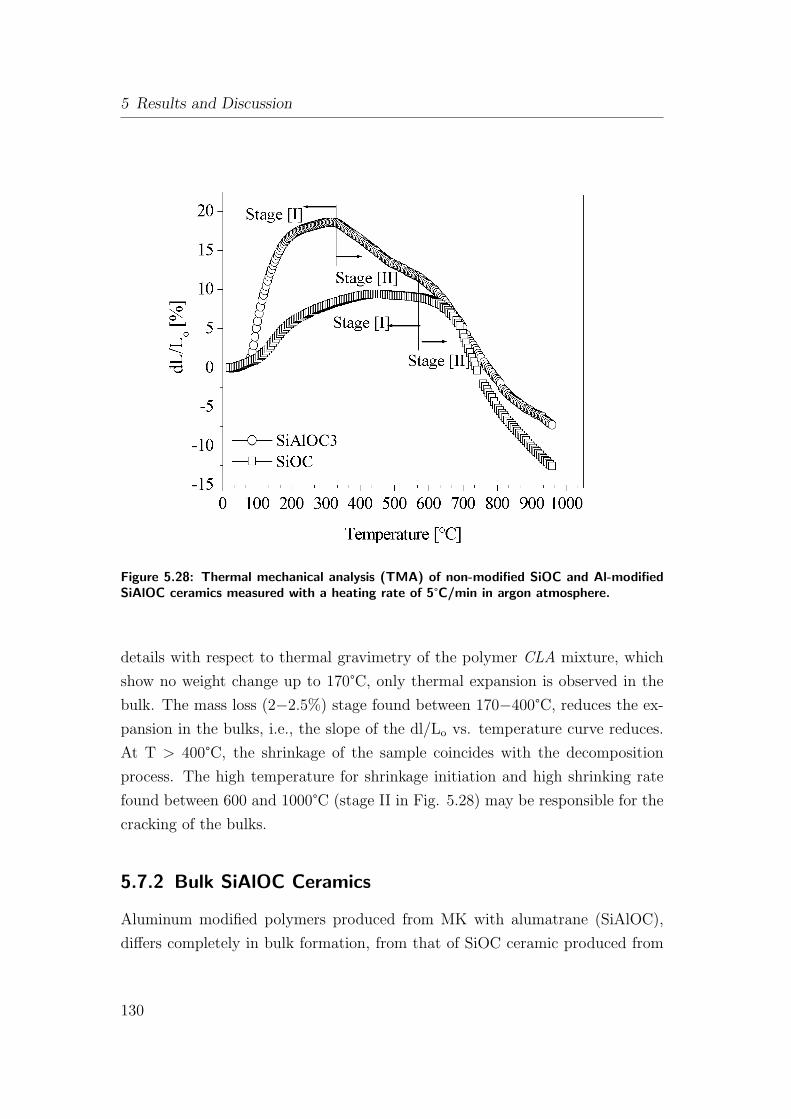
5 Results and Discussion
Figure 5.28: Thermal mechanical analysis (TMA) of non-modified SiOC and Al-modifiedSiAlOC ceramics measured with a heating rate of 5°C/min in argon atmosphere.
details with respect to thermal gravimetry of the polymer CLA mixture, which
show no weight change up to 170°C, only thermal expansion is observed in the
bulk. The mass loss (2−2.5%) stage found between 170−400°C, reduces the ex-
pansion in the bulks, i.e., the slope of the dl/Lo vs. temperature curve reduces.
At T > 400°C, the shrinkage of the sample coincides with the decomposition
process. The high temperature for shrinkage initiation and high shrinking rate
found between 600 and 1000°C (stage II in Fig. 5.28) may be responsible for the
cracking of the bulks.
5.7.2 Bulk SiAlOC Ceramics
Aluminum modified polymers produced from MK with alumatrane (SiAlOC),
differs completely in bulk formation, from that of SiOC ceramic produced from
130
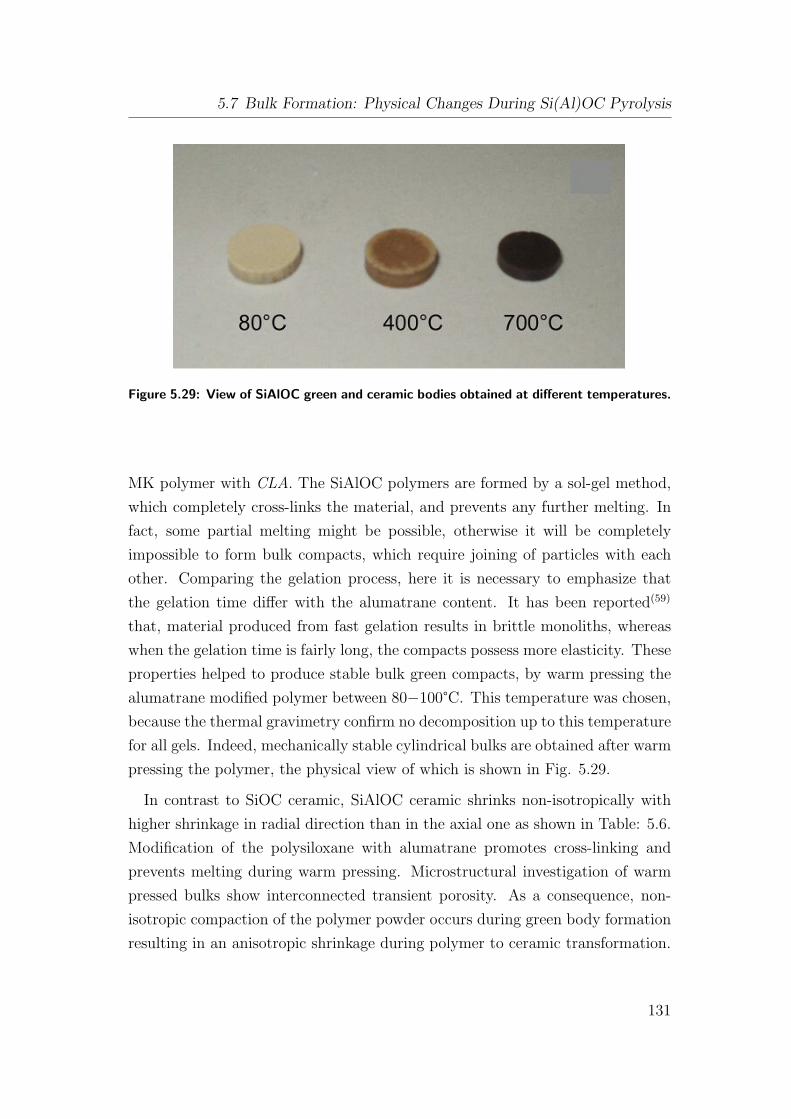
5.7 Bulk Formation: Physical Changes During Si(Al)OC Pyrolysis
Figure 5.29: View of SiAlOC green and ceramic bodies obtained at different temperatures.
MK polymer with CLA. The SiAlOC polymers are formed by a sol-gel method,
which completely cross-links the material, and prevents any further melting. In
fact, some partial melting might be possible, otherwise it will be completely
impossible to form bulk compacts, which require joining of particles with each
other. Comparing the gelation process, here it is necessary to emphasize that
the gelation time differ with the alumatrane content. It has been reported(59)
that, material produced from fast gelation results in brittle monoliths, whereas
when the gelation time is fairly long, the compacts possess more elasticity. These
properties helped to produce stable bulk green compacts, by warm pressing the
alumatrane modified polymer between 80−100°C. This temperature was chosen,
because the thermal gravimetry confirm no decomposition up to this temperature
for all gels. Indeed, mechanically stable cylindrical bulks are obtained after warm
pressing the polymer, the physical view of which is shown in Fig. 5.29.
In contrast to SiOC ceramic, SiAlOC ceramic shrinks non-isotropically with
higher shrinkage in radial direction than in the axial one as shown in Table: 5.6.
Modification of the polysiloxane with alumatrane promotes cross-linking and
prevents melting during warm pressing. Microstructural investigation of warm
pressed bulks show interconnected transient porosity. As a consequence, non-
isotropic compaction of the polymer powder occurs during green body formation
resulting in an anisotropic shrinkage during polymer to ceramic transformation.
131
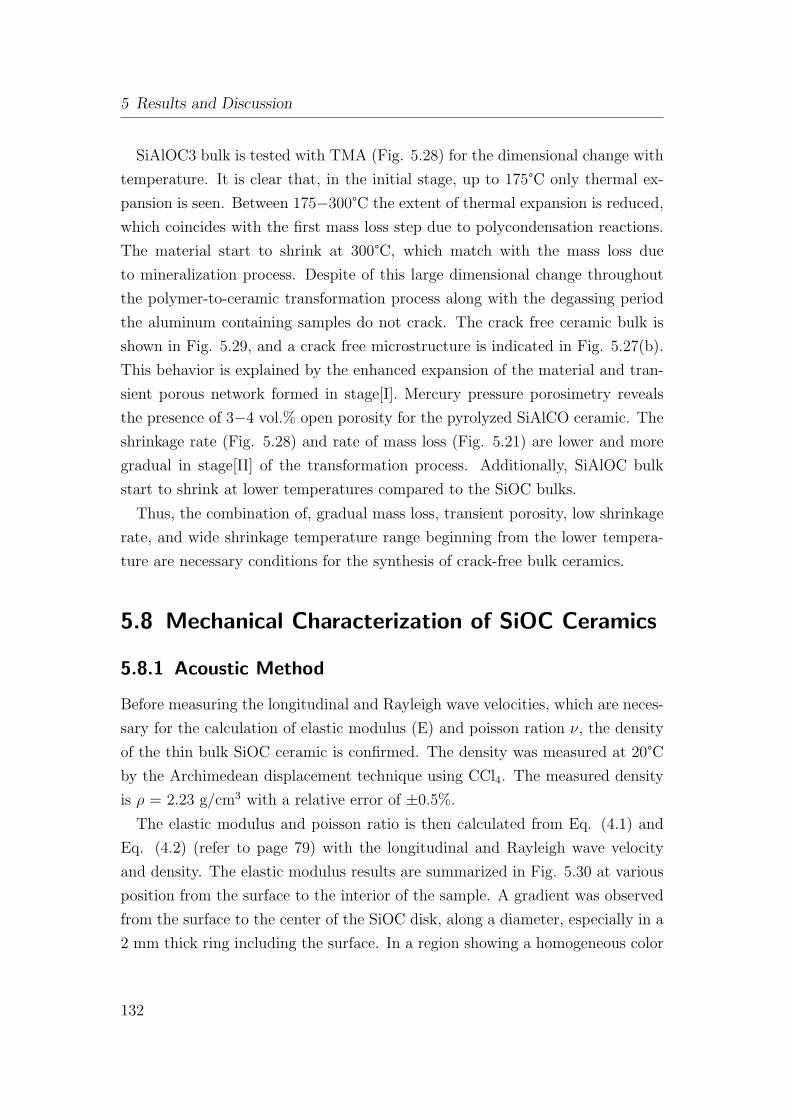
5 Results and Discussion
SiAlOC3 bulk is tested with TMA (Fig. 5.28) for the dimensional change with
temperature. It is clear that, in the initial stage, up to 175°C only thermal ex-
pansion is seen. Between 175−300°C the extent of thermal expansion is reduced,
which coincides with the first mass loss step due to polycondensation reactions.
The material start to shrink at 300°C, which match with the mass loss due
to mineralization process. Despite of this large dimensional change throughout
the polymer-to-ceramic transformation process along with the degassing period
the aluminum containing samples do not crack. The crack free ceramic bulk is
shown in Fig. 5.29, and a crack free microstructure is indicated in Fig. 5.27(b).
This behavior is explained by the enhanced expansion of the material and tran-
sient porous network formed in stage[I]. Mercury pressure porosimetry reveals
the presence of 3−4 vol.% open porosity for the pyrolyzed SiAlCO ceramic. The
shrinkage rate (Fig. 5.28) and rate of mass loss (Fig. 5.21) are lower and more
gradual in stage[II] of the transformation process. Additionally, SiAlOC bulk
start to shrink at lower temperatures compared to the SiOC bulks.
Thus, the combination of, gradual mass loss, transient porosity, low shrinkage
rate, and wide shrinkage temperature range beginning from the lower tempera-
ture are necessary conditions for the synthesis of crack-free bulk ceramics.
5.8 Mechanical Characterization of SiOC Ceramics
5.8.1 Acoustic Method
Before measuring the longitudinal and Rayleigh wave velocities, which are neces-
sary for the calculation of elastic modulus (E) and poisson ration ν, the density
of the thin bulk SiOC ceramic is confirmed. The density was measured at 20°Cby the Archimedean displacement technique using CCl4. The measured density
is ρ = 2.23 g/cm3 with a relative error of ±0.5%.
The elastic modulus and poisson ratio is then calculated from Eq. (4.1) and
Eq. (4.2) (refer to page 79) with the longitudinal and Rayleigh wave velocity
and density. The elastic modulus results are summarized in Fig. 5.30 at various
position from the surface to the interior of the sample. A gradient was observed
from the surface to the center of the SiOC disk, along a diameter, especially in a
2 mm thick ring including the surface. In a region showing a homogeneous color
132
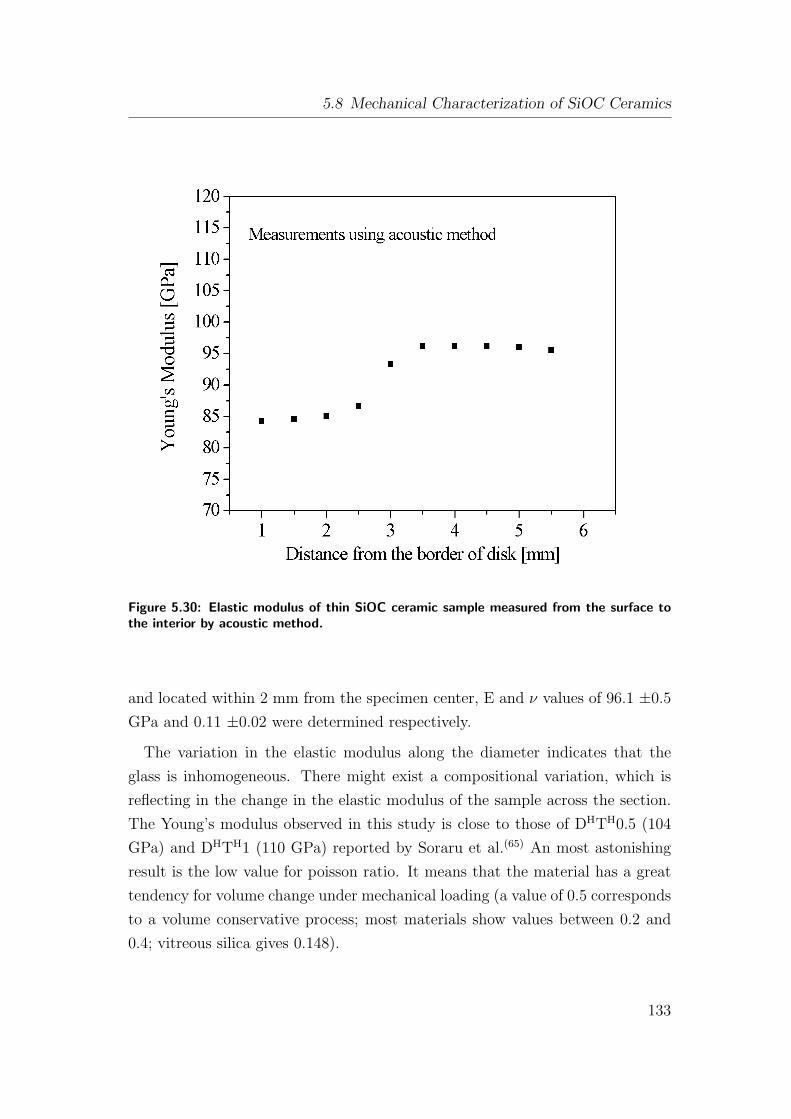
5.8 Mechanical Characterization of SiOC Ceramics
Figure 5.30: Elastic modulus of thin SiOC ceramic sample measured from the surface tothe interior by acoustic method.
and located within 2 mm from the specimen center, E and ν values of 96.1 ±0.5
GPa and 0.11 ±0.02 were determined respectively.
The variation in the elastic modulus along the diameter indicates that the
glass is inhomogeneous. There might exist a compositional variation, which is
reflecting in the change in the elastic modulus of the sample across the section.
The Young’s modulus observed in this study is close to those of DHTH0.5 (104
GPa) and DHTH1 (110 GPa) reported by Soraru et al.(65) An most astonishing
result is the low value for poisson ratio. It means that the material has a great
tendency for volume change under mechanical loading (a value of 0.5 corresponds
to a volume conservative process; most materials show values between 0.2 and
0.4; vitreous silica gives 0.148).
133
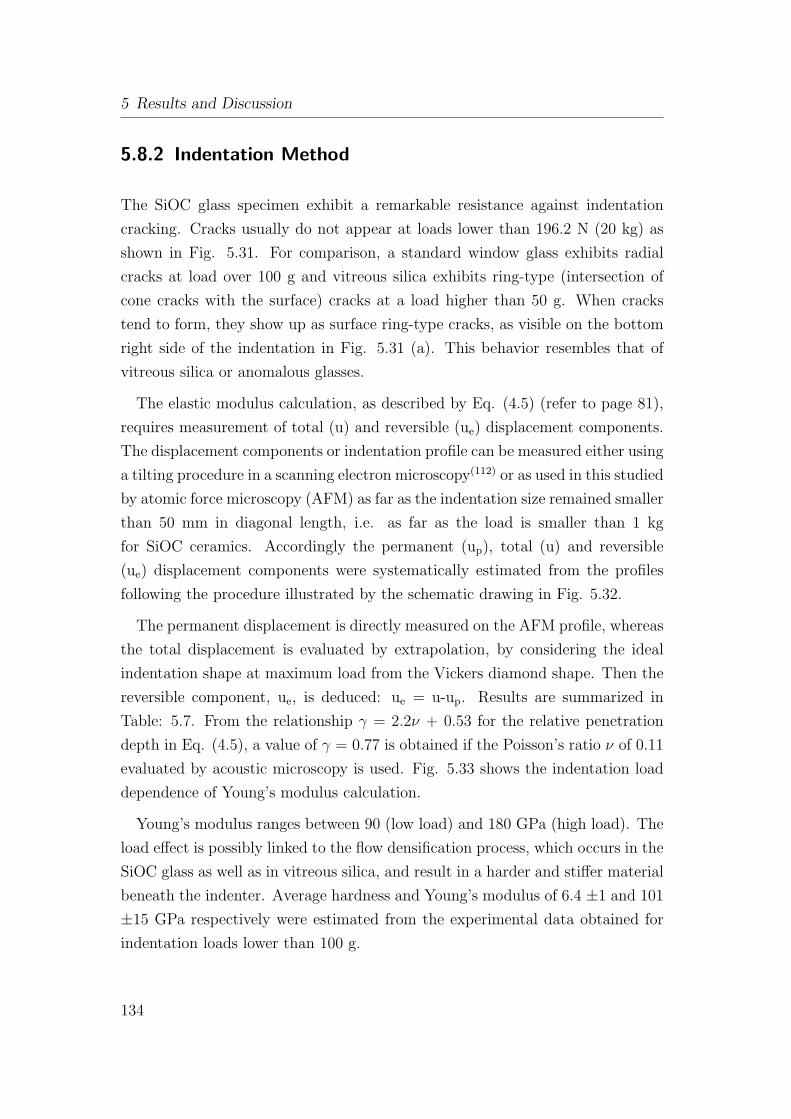
5 Results and Discussion
5.8.2 Indentation Method
The SiOC glass specimen exhibit a remarkable resistance against indentation
cracking. Cracks usually do not appear at loads lower than 196.2 N (20 kg) as
shown in Fig. 5.31. For comparison, a standard window glass exhibits radial
cracks at load over 100 g and vitreous silica exhibits ring-type (intersection of
cone cracks with the surface) cracks at a load higher than 50 g. When cracks
tend to form, they show up as surface ring-type cracks, as visible on the bottom
right side of the indentation in Fig. 5.31 (a). This behavior resembles that of
vitreous silica or anomalous glasses.
The elastic modulus calculation, as described by Eq. (4.5) (refer to page 81),
requires measurement of total (u) and reversible (ue) displacement components.
The displacement components or indentation profile can be measured either using
a tilting procedure in a scanning electron microscopy(112) or as used in this studied
by atomic force microscopy (AFM) as far as the indentation size remained smaller
than 50 mm in diagonal length, i.e. as far as the load is smaller than 1 kg
for SiOC ceramics. Accordingly the permanent (up), total (u) and reversible
(ue) displacement components were systematically estimated from the profiles
following the procedure illustrated by the schematic drawing in Fig. 5.32.
The permanent displacement is directly measured on the AFM profile, whereas
the total displacement is evaluated by extrapolation, by considering the ideal
indentation shape at maximum load from the Vickers diamond shape. Then the
reversible component, ue, is deduced: ue = u-up. Results are summarized in
Table: 5.7. From the relationship γ = 2.2ν + 0.53 for the relative penetration
depth in Eq. (4.5), a value of γ = 0.77 is obtained if the Poisson’s ratio ν of 0.11
evaluated by acoustic microscopy is used. Fig. 5.33 shows the indentation load
dependence of Young’s modulus calculation.
Young’s modulus ranges between 90 (low load) and 180 GPa (high load). The
load effect is possibly linked to the flow densification process, which occurs in the
SiOC glass as well as in vitreous silica, and result in a harder and stiffer material
beneath the indenter. Average hardness and Young’s modulus of 6.4 ±1 and 101
±15 GPa respectively were estimated from the experimental data obtained for
indentation loads lower than 100 g.
134
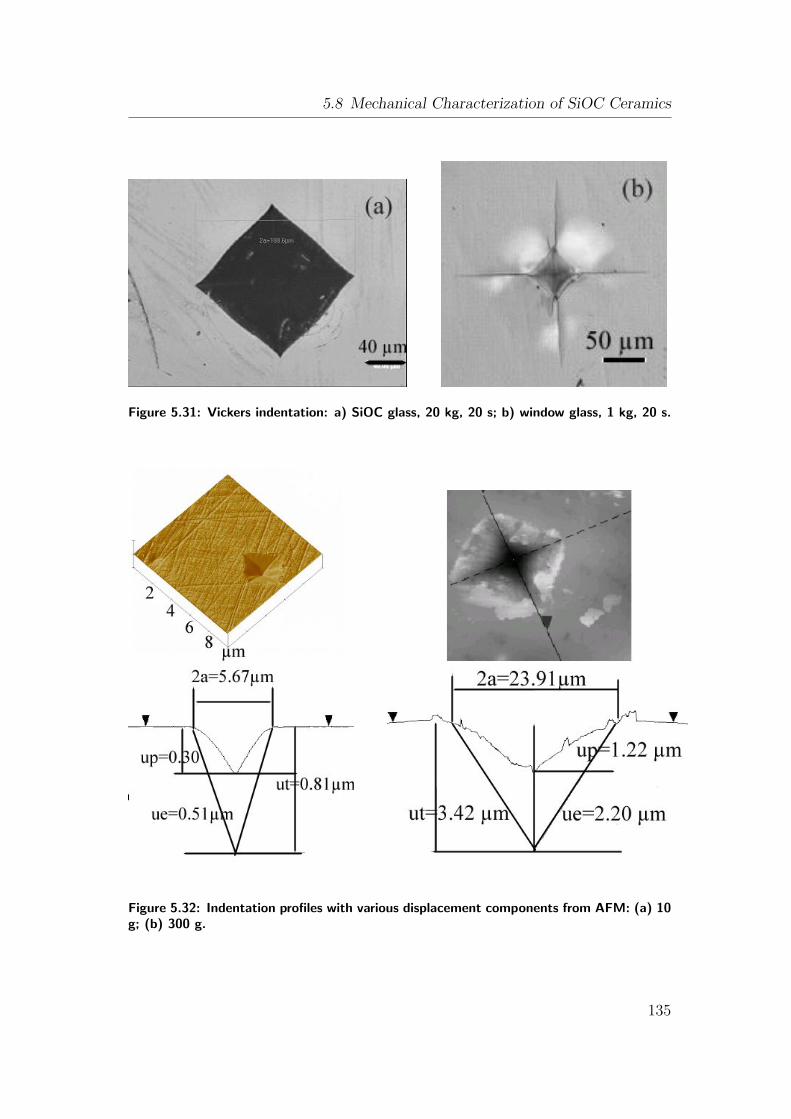
5.8 Mechanical Characterization of SiOC Ceramics
Figure 5.31: Vickers indentation: a) SiOC glass, 20 kg, 20 s; b) window glass, 1 kg, 20 s.
Figure 5.32: Indentation profiles with various displacement components from AFM: (a) 10g; (b) 300 g.
135
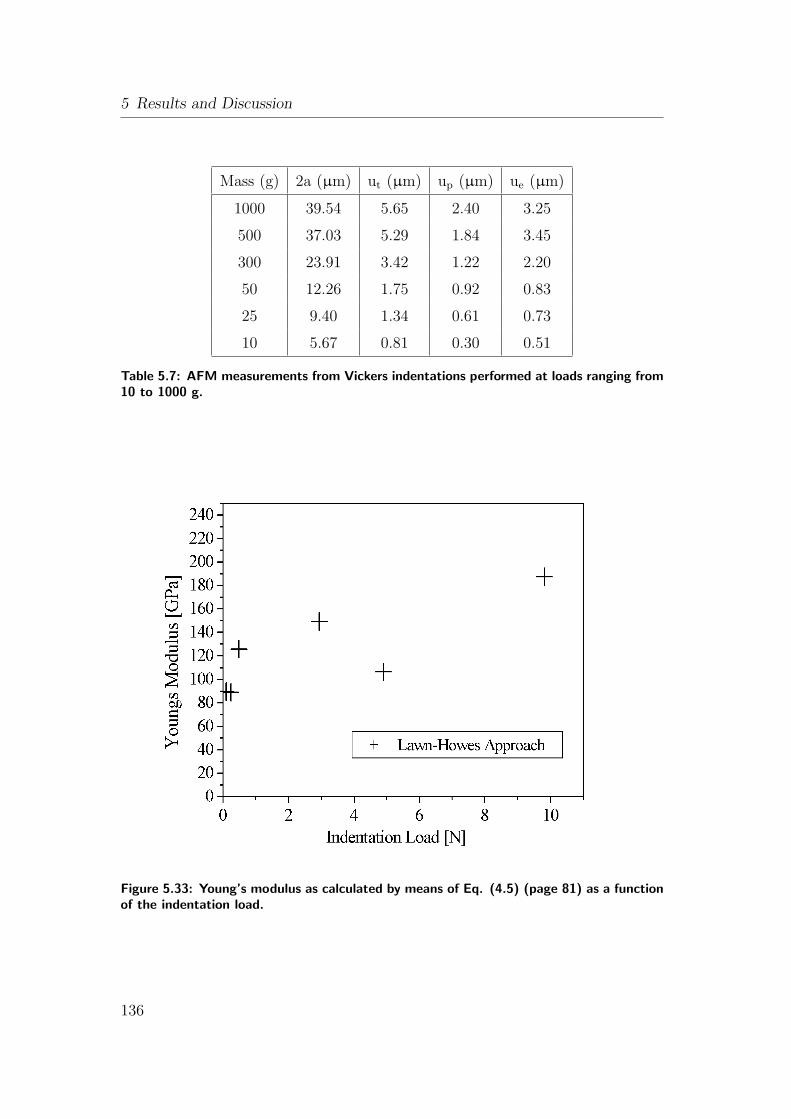
5 Results and Discussion
Mass (g) 2a (µm) ut (µm) up (µm) ue (µm)
1000 39.54 5.65 2.40 3.25
500 37.03 5.29 1.84 3.45
300 23.91 3.42 1.22 2.20
50 12.26 1.75 0.92 0.83
25 9.40 1.34 0.61 0.73
10 5.67 0.81 0.30 0.51
Table 5.7: AFM measurements from Vickers indentations performed at loads ranging from10 to 1000 g.
Figure 5.33: Young’s modulus as calculated by means of Eq. (4.5) (page 81) as a functionof the indentation load.
136
5.9 High Temperature Behavior
5.9 High Temperature Behavior
5.9.1 Crystallization, Phase Separation and High
Temperature Stability in Si(Al)OC Ceramics
In the earlier discussion, Si(Al)OC ceramics are synthesized from commercial
siloxane precursor. The products synthesized at 1100°C are covalent ceram-
ics built up by a random array of silicon oxycarbide, [SiCxO4-x] (0 ≤ x ≤ 4)
units. Additionally, the effect of increasing aluminum content on the decrease of
(C/Si)oxy ratio and relative rise in free carbon Cfree is discussed. The stability
of this silicon oxycarbide phase at high temperature, and the effect of aluminum
content in SiAlOC ceramic on the phase separation/transformation process along
with dimensional changes in the bulks will be discussed in the following sections.
5.9.1.1 SiOC Ceramic
SiOC ceramics are X-ray amorphous up to the pyrolysis temperature. SiOC ce-
ramic bulks (produced from MK-polymer + 1 wt.%CLA) crystallize to β-SiC
and free carbon at temperatures beyond 1300°C, refer in Fig. 5.34. At 1400°C,
the XRD results indicate the formation of β-SiC (3C and 2H polytypes), zirconia
and graphitic carbon, along with amorphous phase. Cristobalite, which usually
forms at temperature ≥1200°C, was not seen at high temperature in SiOC sys-
tems. This behavior is related to the presence of carbon (either as free C or
residual carbon bonded in form of SiC) in the amorphous SiO2 network. Ac-
cording to the calculation reported in the earlier section; as seen in Table: 5.3,
the as pyrolyzed SiOC ceramic contain about 75% (of the total carbon content)
of free carbon. Excess free C is assumed to prevent nucleation of cristobalite,
because short-range diffusion is strongly impeded by the incorporation of carbon
into the SiO2 network. The density increases from 2.20 to 2.38 g/cm3 for the
pyrolyzed (1100°C) and heat-treated (1500°C) material, respectively. Weight loss
of ∼ 2.15% is observed for the sample heated at 1500°C.
The crystallization behavior and the phase separation of SiOC ceramics are
reported in the literature.(63; 122; 123) Researchers noticed that the distribution of
silicon, oxygen, and carbon atoms might not be as random as commonly expected
for such materials. Based on Rietveld refinement studies, those researchers pro-
137
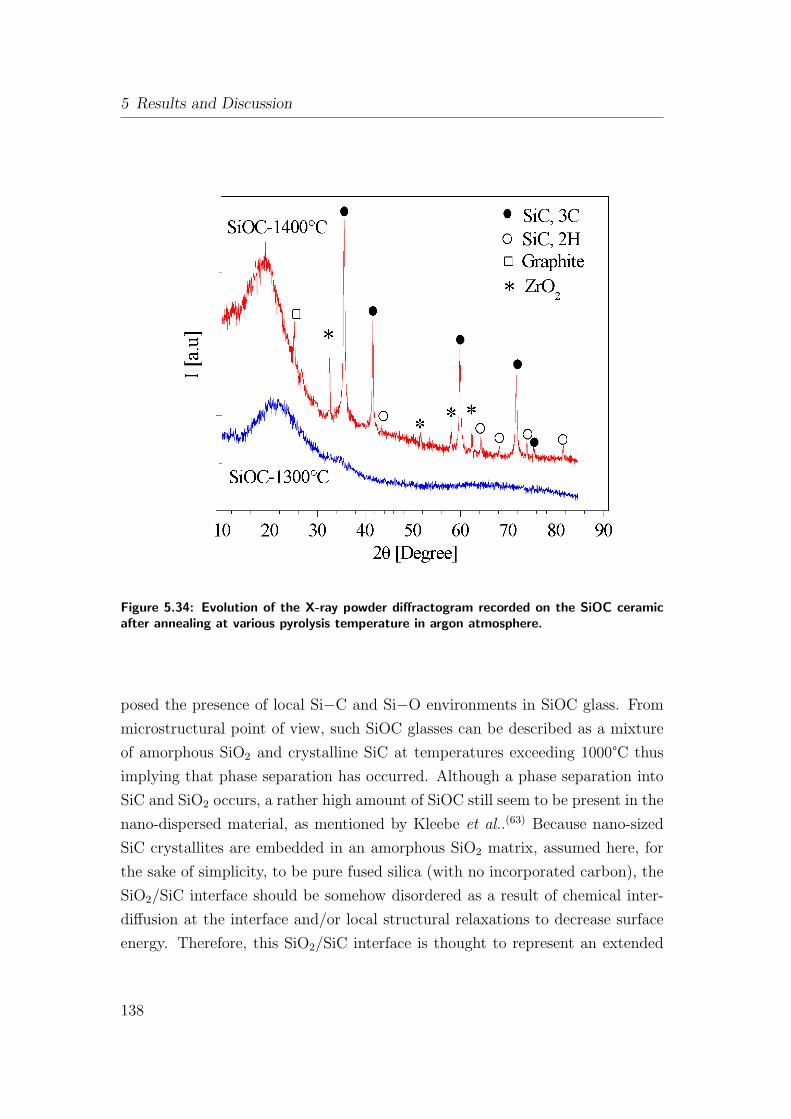
5 Results and Discussion
Figure 5.34: Evolution of the X-ray powder diffractogram recorded on the SiOC ceramicafter annealing at various pyrolysis temperature in argon atmosphere.
posed the presence of local Si−C and Si−O environments in SiOC glass. From
microstructural point of view, such SiOC glasses can be described as a mixture
of amorphous SiO2 and crystalline SiC at temperatures exceeding 1000°C thus
implying that phase separation has occurred. Although a phase separation into
SiC and SiO2 occurs, a rather high amount of SiOC still seem to be present in the
nano-dispersed material, as mentioned by Kleebe et al..(63) Because nano-sized
SiC crystallites are embedded in an amorphous SiO2 matrix, assumed here, for
the sake of simplicity, to be pure fused silica (with no incorporated carbon), the
SiO2/SiC interface should be somehow disordered as a result of chemical inter-
diffusion at the interface and/or local structural relaxations to decrease surface
energy. Therefore, this SiO2/SiC interface is thought to represent an extended
138
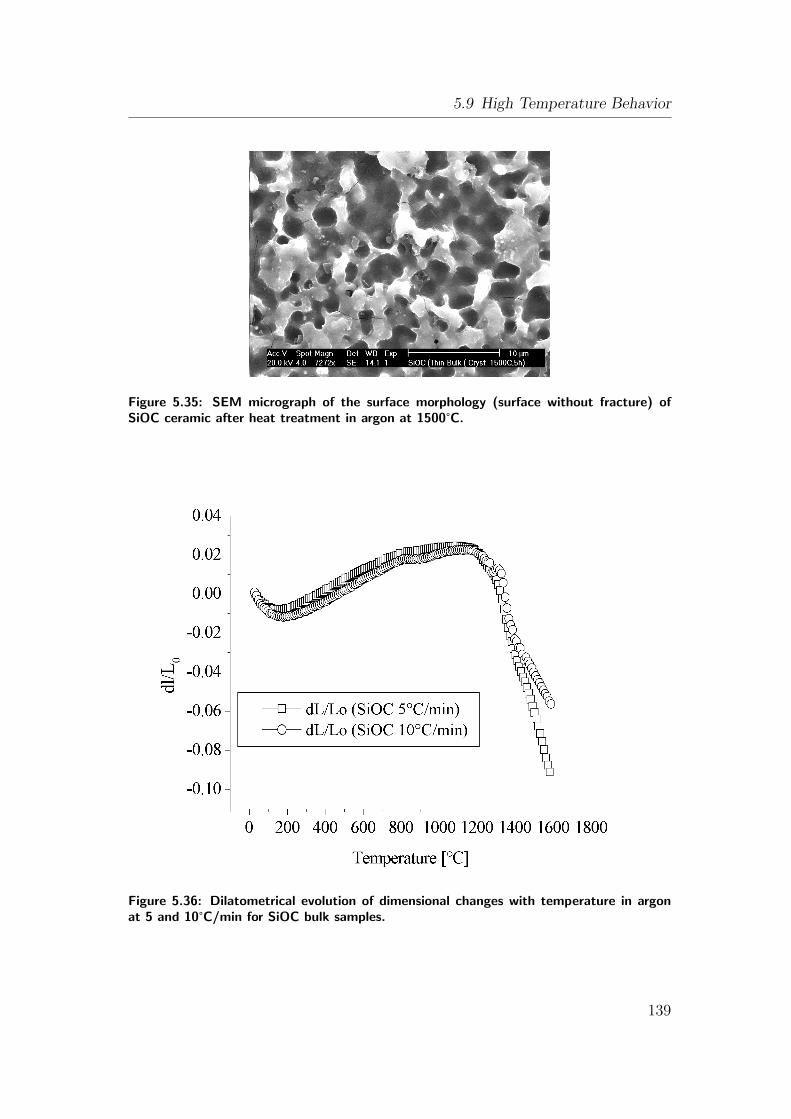
5.9 High Temperature Behavior
Figure 5.35: SEM micrograph of the surface morphology (surface without fracture) ofSiOC ceramic after heat treatment in argon at 1500°C.
Figure 5.36: Dilatometrical evolution of dimensional changes with temperature in argonat 5 and 10°C/min for SiOC bulk samples.
139
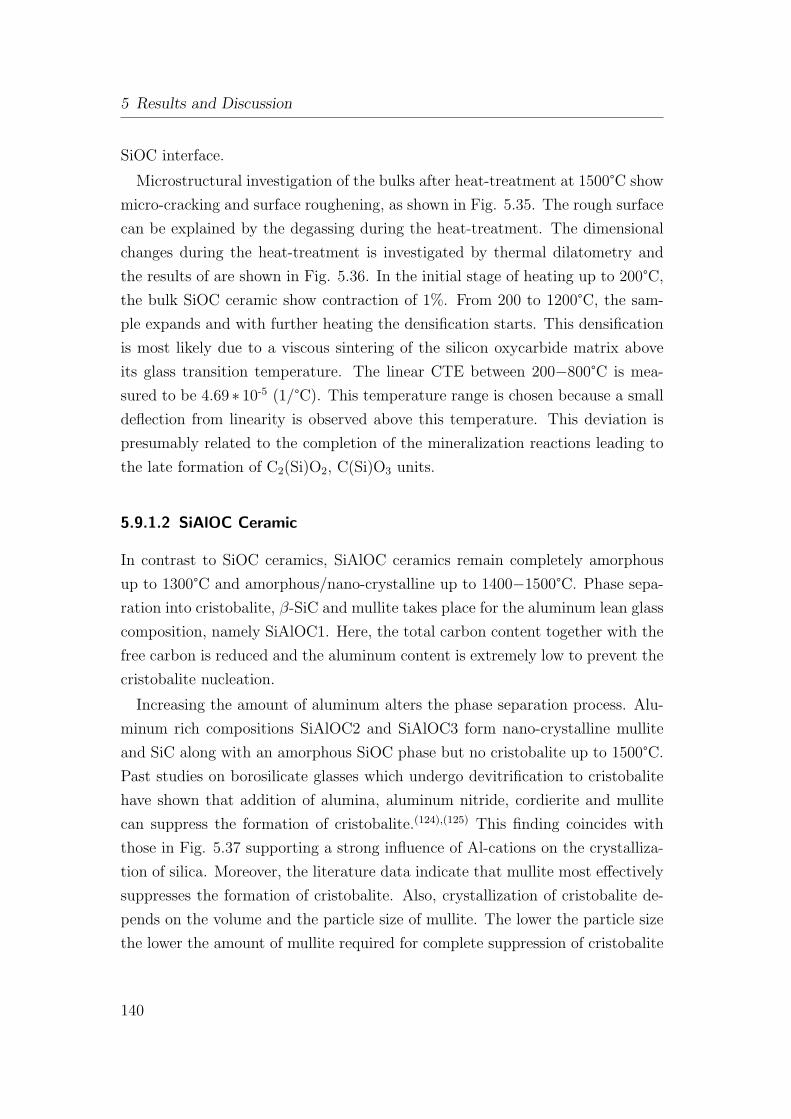
5 Results and Discussion
SiOC interface.
Microstructural investigation of the bulks after heat-treatment at 1500°C show
micro-cracking and surface roughening, as shown in Fig. 5.35. The rough surface
can be explained by the degassing during the heat-treatment. The dimensional
changes during the heat-treatment is investigated by thermal dilatometry and
the results of are shown in Fig. 5.36. In the initial stage of heating up to 200°C,
the bulk SiOC ceramic show contraction of 1%. From 200 to 1200°C, the sam-
ple expands and with further heating the densification starts. This densification
is most likely due to a viscous sintering of the silicon oxycarbide matrix above
its glass transition temperature. The linear CTE between 200−800°C is mea-
sured to be 4.69 ∗ 10-5 (1/°C). This temperature range is chosen because a small
deflection from linearity is observed above this temperature. This deviation is
presumably related to the completion of the mineralization reactions leading to
the late formation of C2(Si)O2, C(Si)O3 units.
5.9.1.2 SiAlOC Ceramic
In contrast to SiOC ceramics, SiAlOC ceramics remain completely amorphous
up to 1300°C and amorphous/nano-crystalline up to 1400−1500°C. Phase sepa-
ration into cristobalite, β-SiC and mullite takes place for the aluminum lean glass
composition, namely SiAlOC1. Here, the total carbon content together with the
free carbon is reduced and the aluminum content is extremely low to prevent the
cristobalite nucleation.
Increasing the amount of aluminum alters the phase separation process. Alu-
minum rich compositions SiAlOC2 and SiAlOC3 form nano-crystalline mullite
and SiC along with an amorphous SiOC phase but no cristobalite up to 1500°C.
Past studies on borosilicate glasses which undergo devitrification to cristobalite
have shown that addition of alumina, aluminum nitride, cordierite and mullite
can suppress the formation of cristobalite.(124),(125) This finding coincides with
those in Fig. 5.37 supporting a strong influence of Al-cations on the crystalliza-
tion of silica. Moreover, the literature data indicate that mullite most effectively
suppresses the formation of cristobalite. Also, crystallization of cristobalite de-
pends on the volume and the particle size of mullite. The lower the particle size
the lower the amount of mullite required for complete suppression of cristobalite
140
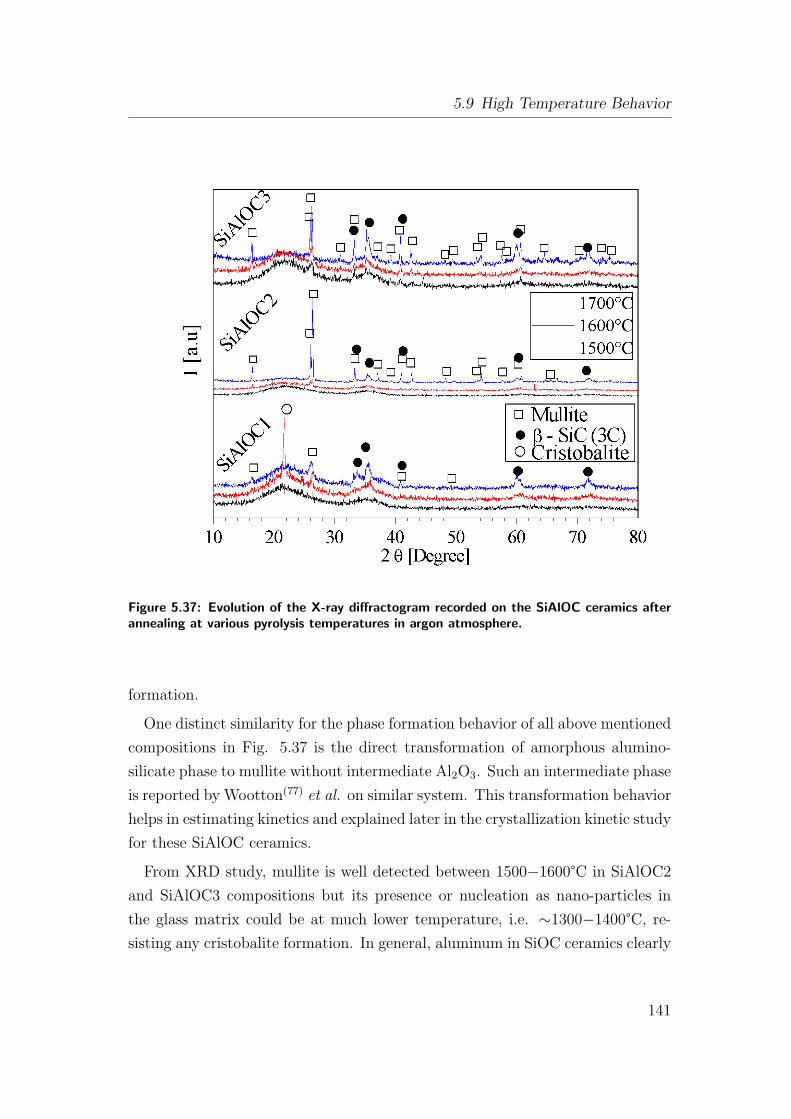
5.9 High Temperature Behavior
Figure 5.37: Evolution of the X-ray diffractogram recorded on the SiAlOC ceramics afterannealing at various pyrolysis temperatures in argon atmosphere.
formation.
One distinct similarity for the phase formation behavior of all above mentioned
compositions in Fig. 5.37 is the direct transformation of amorphous alumino-
silicate phase to mullite without intermediate Al2O3. Such an intermediate phase
is reported by Wootton(77) et al. on similar system. This transformation behavior
helps in estimating kinetics and explained later in the crystallization kinetic study
for these SiAlOC ceramics.
From XRD study, mullite is well detected between 1500−1600°C in SiAlOC2
and SiAlOC3 compositions but its presence or nucleation as nano-particles in
the glass matrix could be at much lower temperature, i.e. ∼1300−1400°C, re-
sisting any cristobalite formation. In general, aluminum in SiOC ceramics clearly
141
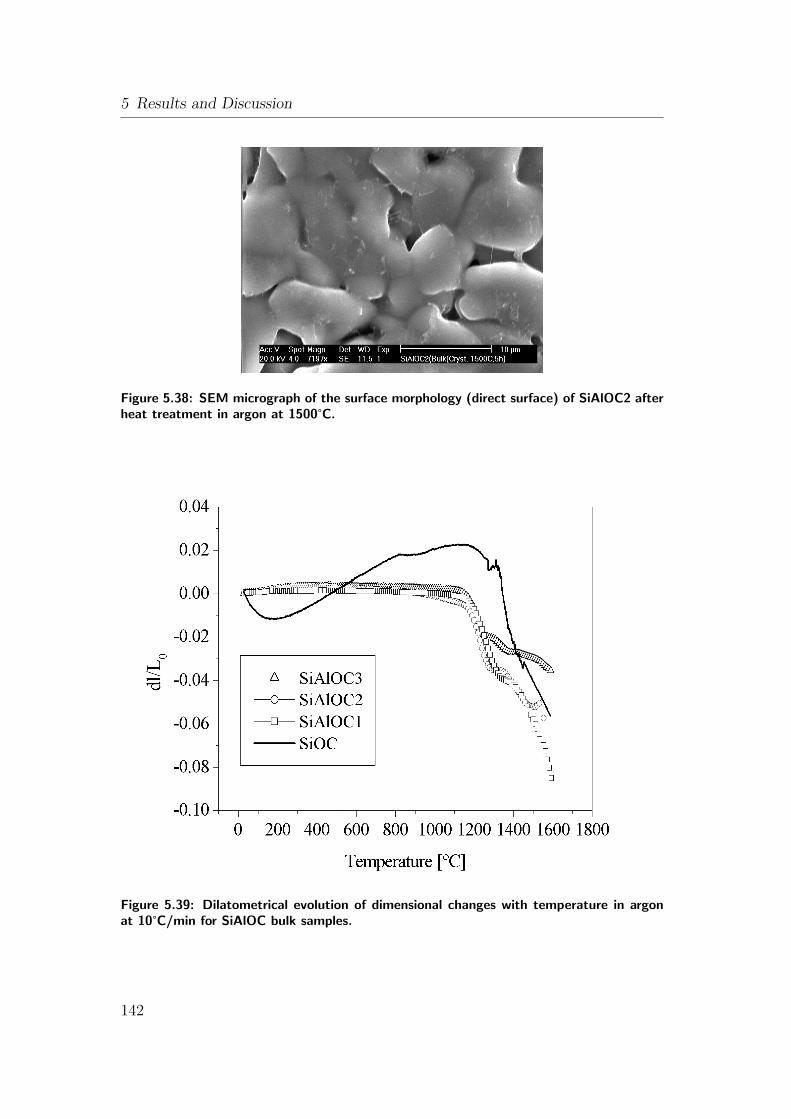
5 Results and Discussion
Figure 5.38: SEM micrograph of the surface morphology (direct surface) of SiAlOC2 afterheat treatment in argon at 1500°C.
Figure 5.39: Dilatometrical evolution of dimensional changes with temperature in argonat 10°C/min for SiAlOC bulk samples.
142
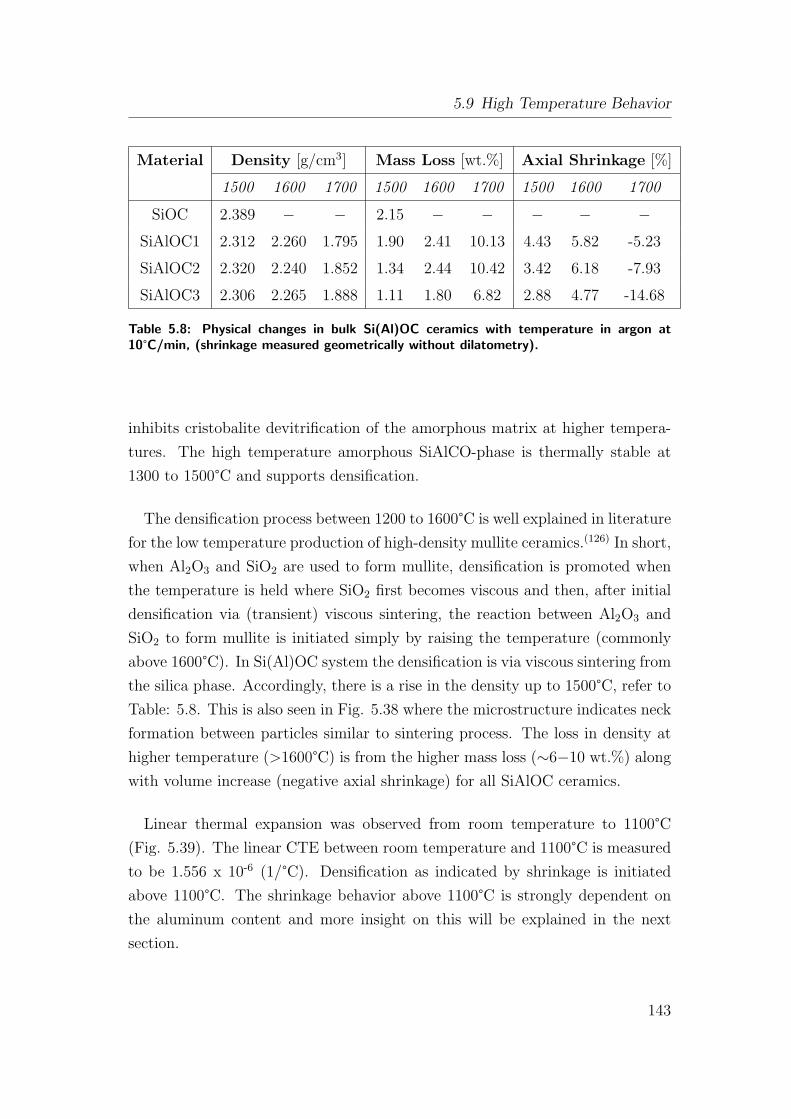
5.9 High Temperature Behavior
Material Density [g/cm3] Mass Loss [wt.%] Axial Shrinkage [%]
1500 1600 1700 1500 1600 1700 1500 1600 1700
SiOC 2.389 − − 2.15 − − − − −SiAlOC1 2.312 2.260 1.795 1.90 2.41 10.13 4.43 5.82 -5.23
SiAlOC2 2.320 2.240 1.852 1.34 2.44 10.42 3.42 6.18 -7.93
SiAlOC3 2.306 2.265 1.888 1.11 1.80 6.82 2.88 4.77 -14.68
Table 5.8: Physical changes in bulk Si(Al)OC ceramics with temperature in argon at10°C/min, (shrinkage measured geometrically without dilatometry).
inhibits cristobalite devitrification of the amorphous matrix at higher tempera-
tures. The high temperature amorphous SiAlCO-phase is thermally stable at
1300 to 1500°C and supports densification.
The densification process between 1200 to 1600°C is well explained in literature
for the low temperature production of high-density mullite ceramics.(126) In short,
when Al2O3 and SiO2 are used to form mullite, densification is promoted when
the temperature is held where SiO2 first becomes viscous and then, after initial
densification via (transient) viscous sintering, the reaction between Al2O3 and
SiO2 to form mullite is initiated simply by raising the temperature (commonly
above 1600°C). In Si(Al)OC system the densification is via viscous sintering from
the silica phase. Accordingly, there is a rise in the density up to 1500°C, refer to
Table: 5.8. This is also seen in Fig. 5.38 where the microstructure indicates neck
formation between particles similar to sintering process. The loss in density at
higher temperature (>1600°C) is from the higher mass loss (∼6−10 wt.%) along
with volume increase (negative axial shrinkage) for all SiAlOC ceramics.
Linear thermal expansion was observed from room temperature to 1100°C(Fig. 5.39). The linear CTE between room temperature and 1100°C is measured
to be 1.556 x 10⁻⁶ (1/°C). Densification as indicated by shrinkage is initiated
above 1100°C. The shrinkage behavior above 1100°C is strongly dependent on
the aluminum content and more insight on this will be explained in the next
section.
143
5 Results and Discussion
5.10 Softening/Crystallization Kinetics of SiAlOC
Ceramics
Transformations in glasses is usually followed by thermometric (differential ther-
mal analysis, DTA) and/or calorimetric (differential scanning calorimetry, DSC)
measurements. DTA and DSC monitor the temperature increase or decrease
and heat evolved or observed, respectively, by the material as a function of time,
most commonly during a constant heating rate. The thermodilatometric (TD)
technique, on the other hand, monitors changes in the length as a function of
time. The objective of this section is to characterize the transformation pro-
cesses involved in the SiAlOC material by TD plots and their derivative (TDD)
thermograms and estimate the activation energy for these transformations.
Glasses when nonisothermally heated, passes through a sequence of individual
thermal effects, namely, structural relaxation, softening and crystallization over a
temperature range. The change in enthalpy due to these thermal effects are usu-
ally reflected as (i) characteristic points, such as onsets, inflections, and apexes,
and (ii) areas under the individual effect peak. Changes in these characteristics
in the thermograms with heating rate can be used to determine reaction kinetics
and mechanism for the thermal effects.
Fig. 5.40 presents the effect of heating rate on the dimensional change of
the bulk samples. As the heating rate increases, the general nature of the ther-
mograms remained unchanged, but shifted towards higher temperatures. Some
authors use the temperature of deflection point in the dilatometry curve as glass
transition temperature. The deflection point is the temperature where the TD
curve looses linearity. But this deflection point is changing with the heating rate
as explained in literature.(79) The linear part also deviates slightly at much lower
temperatures for all heating rates in SiAlOC2 and SiAlOC3 ceramic. This de-
flections could be from the change in the material property like residual stress.
It has been shown that viscosity controls the rate of these changes. Thus it will
be more accurate to evaluate the glass transition temperature by calculating the
shear viscosities (using time dependent deformation), and is done in the later
section using compression creep.
After the linear part, ∆l increases gradually with temperature at a constant
144
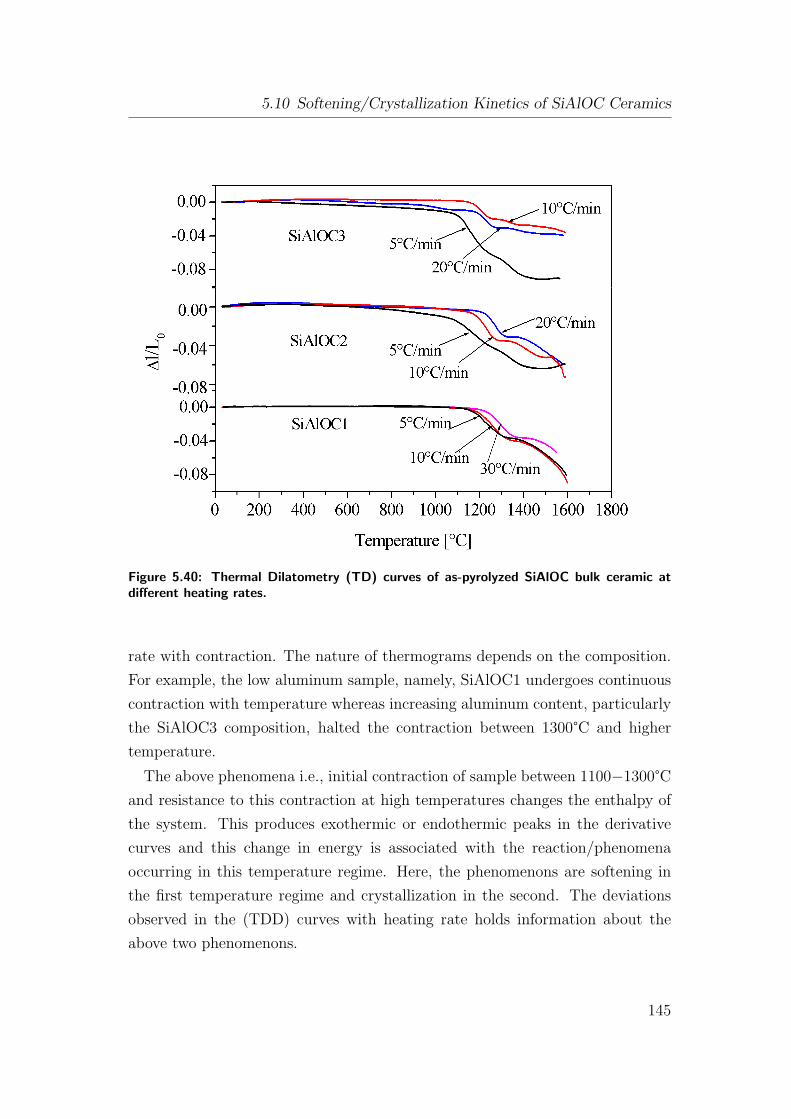
5.10 Softening/Crystallization Kinetics of SiAlOC Ceramics
Figure 5.40: Thermal Dilatometry (TD) curves of as-pyrolyzed SiAlOC bulk ceramic atdifferent heating rates.
rate with contraction. The nature of thermograms depends on the composition.
For example, the low aluminum sample, namely, SiAlOC1 undergoes continuous
contraction with temperature whereas increasing aluminum content, particularly
the SiAlOC3 composition, halted the contraction between 1300°C and higher
temperature.
The above phenomena i.e., initial contraction of sample between 1100−1300°Cand resistance to this contraction at high temperatures changes the enthalpy of
the system. This produces exothermic or endothermic peaks in the derivative
curves and this change in energy is associated with the reaction/phenomena
occurring in this temperature regime. Here, the phenomenons are softening in
the first temperature regime and crystallization in the second. The deviations
observed in the (TDD) curves with heating rate holds information about the
above two phenomenons.
145
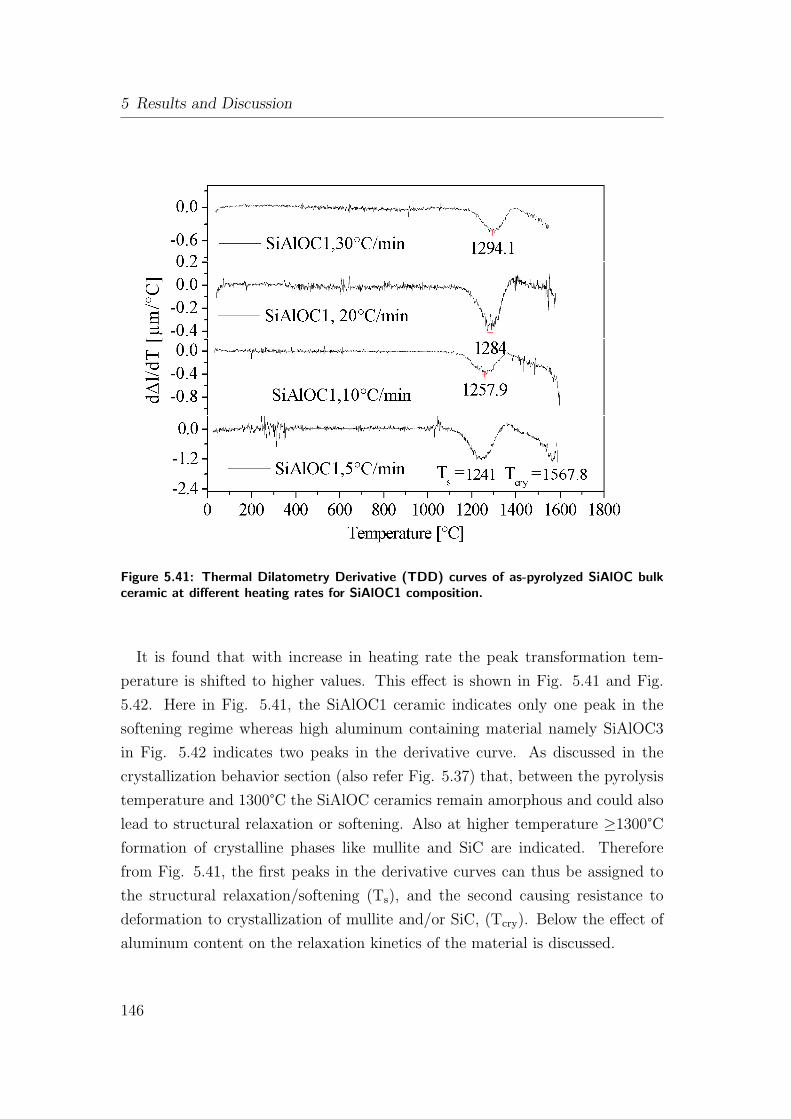
5 Results and Discussion
Figure 5.41: Thermal Dilatometry Derivative (TDD) curves of as-pyrolyzed SiAlOC bulkceramic at different heating rates for SiAlOC1 composition.
It is found that with increase in heating rate the peak transformation tem-
perature is shifted to higher values. This effect is shown in Fig. 5.41 and Fig.
5.42. Here in Fig. 5.41, the SiAlOC1 ceramic indicates only one peak in the
softening regime whereas high aluminum containing material namely SiAlOC3
in Fig. 5.42 indicates two peaks in the derivative curve. As discussed in the
crystallization behavior section (also refer Fig. 5.37) that, between the pyrolysis
temperature and 1300°C the SiAlOC ceramics remain amorphous and could also
lead to structural relaxation or softening. Also at higher temperature ≥1300°Cformation of crystalline phases like mullite and SiC are indicated. Therefore
from Fig. 5.41, the first peaks in the derivative curves can thus be assigned to
the structural relaxation/softening (Ts), and the second causing resistance to
deformation to crystallization of mullite and/or SiC, (Tcry). Below the effect of
aluminum content on the relaxation kinetics of the material is discussed.
146
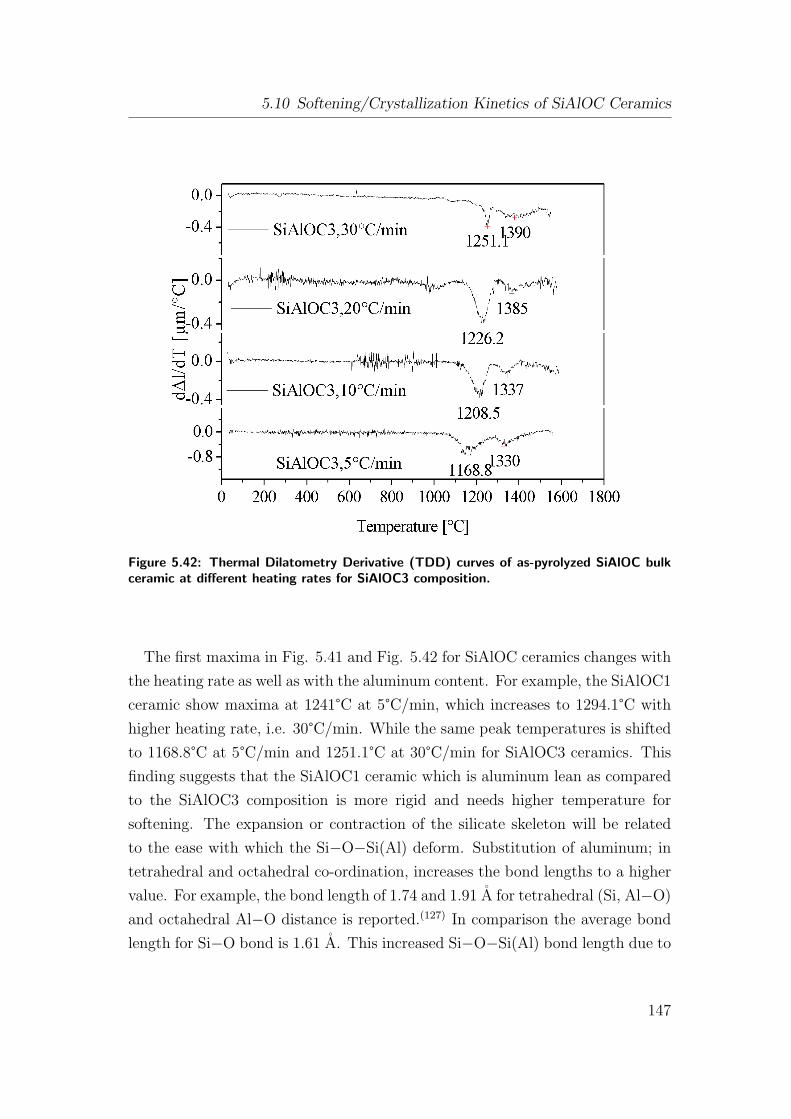
5.10 Softening/Crystallization Kinetics of SiAlOC Ceramics
Figure 5.42: Thermal Dilatometry Derivative (TDD) curves of as-pyrolyzed SiAlOC bulkceramic at different heating rates for SiAlOC3 composition.
The first maxima in Fig. 5.41 and Fig. 5.42 for SiAlOC ceramics changes with
the heating rate as well as with the aluminum content. For example, the SiAlOC1
ceramic show maxima at 1241°C at 5°C/min, which increases to 1294.1°C with
higher heating rate, i.e. 30°C/min. While the same peak temperatures is shifted
to 1168.8°C at 5°C/min and 1251.1°C at 30°C/min for SiAlOC3 ceramics. This
finding suggests that the SiAlOC1 ceramic which is aluminum lean as compared
to the SiAlOC3 composition is more rigid and needs higher temperature for
softening. The expansion or contraction of the silicate skeleton will be related
to the ease with which the Si−O−Si(Al) deform. Substitution of aluminum; in
tetrahedral and octahedral co-ordination, increases the bond lengths to a higher
value. For example, the bond length of 1.74 and 1.91 A for tetrahedral (Si, Al−O)
and octahedral Al−O distance is reported.(127) In comparison the average bond
length for Si−O bond is 1.61 A. This increased Si−O−Si(Al) bond length due to
147
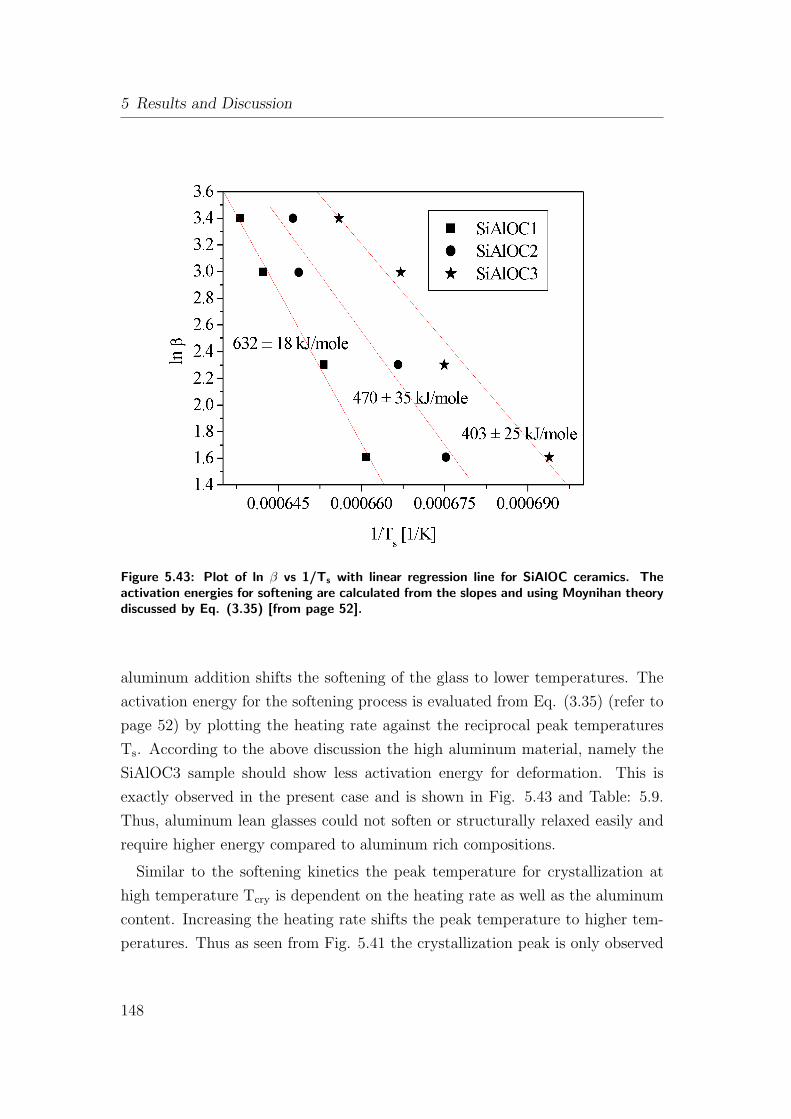
5 Results and Discussion
Figure 5.43: Plot of ln β vs 1/Ts with linear regression line for SiAlOC ceramics. Theactivation energies for softening are calculated from the slopes and using Moynihan theorydiscussed by Eq. (3.35) [from page 52].
aluminum addition shifts the softening of the glass to lower temperatures. The
activation energy for the softening process is evaluated from Eq. (3.35) (refer to
page 52) by plotting the heating rate against the reciprocal peak temperatures
Ts. According to the above discussion the high aluminum material, namely the
SiAlOC3 sample should show less activation energy for deformation. This is
exactly observed in the present case and is shown in Fig. 5.43 and Table: 5.9.
Thus, aluminum lean glasses could not soften or structurally relaxed easily and
require higher energy compared to aluminum rich compositions.
Similar to the softening kinetics the peak temperature for crystallization at
high temperature Tcry is dependent on the heating rate as well as the aluminum
content. Increasing the heating rate shifts the peak temperature to higher tem-
peratures. Thus as seen from Fig. 5.41 the crystallization peak is only observed
148
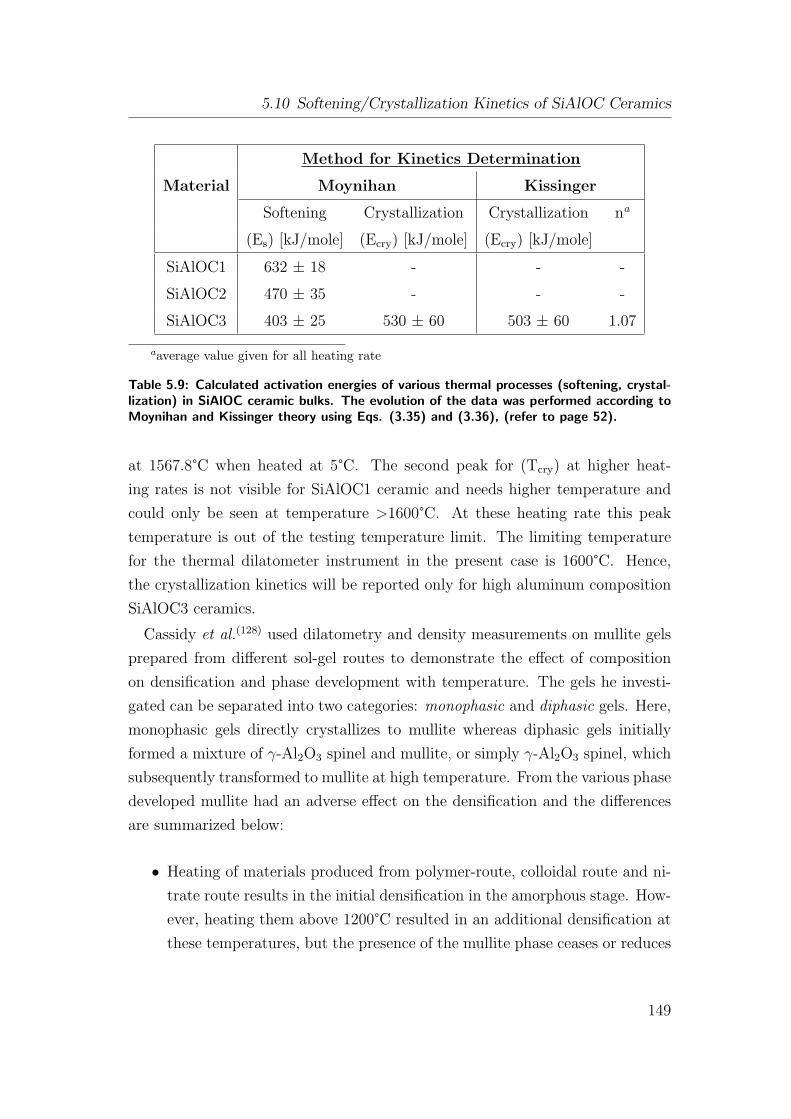
5.10 Softening/Crystallization Kinetics of SiAlOC Ceramics
Method for Kinetics Determination
Material Moynihan Kissinger
Softening Crystallization Crystallization na
(Es) [kJ/mole] (Ecry) [kJ/mole] (Ecry) [kJ/mole]
SiAlOC1 632 ± 18 - - -
SiAlOC2 470 ± 35 - - -
SiAlOC3 403 ± 25 530 ± 60 503 ± 60 1.07
aaverage value given for all heating rate
Table 5.9: Calculated activation energies of various thermal processes (softening, crystal-lization) in SiAlOC ceramic bulks. The evolution of the data was performed according toMoynihan and Kissinger theory using Eqs. (3.35) and (3.36), (refer to page 52).
at 1567.8°C when heated at 5°C. The second peak for (Tcry) at higher heat-
ing rates is not visible for SiAlOC1 ceramic and needs higher temperature and
could only be seen at temperature >1600°C. At these heating rate this peak
temperature is out of the testing temperature limit. The limiting temperature
for the thermal dilatometer instrument in the present case is 1600°C. Hence,
the crystallization kinetics will be reported only for high aluminum composition
SiAlOC3 ceramics.
Cassidy et al.(128) used dilatometry and density measurements on mullite gels
prepared from different sol-gel routes to demonstrate the effect of composition
on densification and phase development with temperature. The gels he investi-
gated can be separated into two categories: monophasic and diphasic gels. Here,
monophasic gels directly crystallizes to mullite whereas diphasic gels initially
formed a mixture of γ-Al2O3 spinel and mullite, or simply γ-Al2O3 spinel, which
subsequently transformed to mullite at high temperature. From the various phase
developed mullite had an adverse effect on the densification and the differences
are summarized below:
• Heating of materials produced from polymer-route, colloidal route and ni-
trate route results in the initial densification in the amorphous stage. How-
ever, heating them above 1200°C resulted in an additional densification at
these temperatures, but the presence of the mullite phase ceases or reduces
149
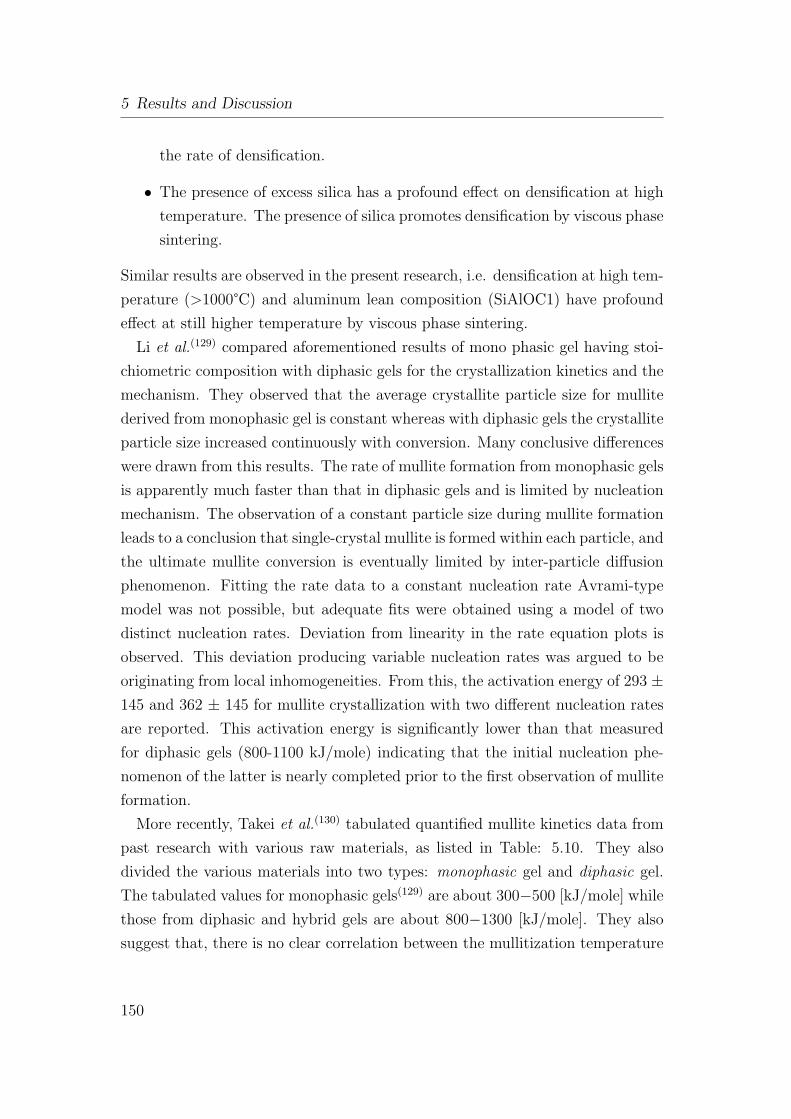
5 Results and Discussion
the rate of densification.
• The presence of excess silica has a profound effect on densification at high
temperature. The presence of silica promotes densification by viscous phase
sintering.
Similar results are observed in the present research, i.e. densification at high tem-
perature (>1000°C) and aluminum lean composition (SiAlOC1) have profound
effect at still higher temperature by viscous phase sintering.
Li et al.(129) compared aforementioned results of mono phasic gel having stoi-
chiometric composition with diphasic gels for the crystallization kinetics and the
mechanism. They observed that the average crystallite particle size for mullite
derived from monophasic gel is constant whereas with diphasic gels the crystallite
particle size increased continuously with conversion. Many conclusive differences
were drawn from this results. The rate of mullite formation from monophasic gels
is apparently much faster than that in diphasic gels and is limited by nucleation
mechanism. The observation of a constant particle size during mullite formation
leads to a conclusion that single-crystal mullite is formed within each particle, and
the ultimate mullite conversion is eventually limited by inter-particle diffusion
phenomenon. Fitting the rate data to a constant nucleation rate Avrami-type
model was not possible, but adequate fits were obtained using a model of two
distinct nucleation rates. Deviation from linearity in the rate equation plots is
observed. This deviation producing variable nucleation rates was argued to be
originating from local inhomogeneities. From this, the activation energy of 293 ±145 and 362 ± 145 for mullite crystallization with two different nucleation rates
are reported. This activation energy is significantly lower than that measured
for diphasic gels (800-1100 kJ/mole) indicating that the initial nucleation phe-
nomenon of the latter is nearly completed prior to the first observation of mullite
formation.
More recently, Takei et al.(130) tabulated quantified mullite kinetics data from
past research with various raw materials, as listed in Table: 5.10. They also
divided the various materials into two types: monophasic gel and diphasic gel.
The tabulated values for monophasic gels(129) are about 300−500 [kJ/mole] while
those from diphasic and hybrid gels are about 800−1300 [kJ/mole]. They also
suggest that, there is no clear correlation between the mullitization temperature
150
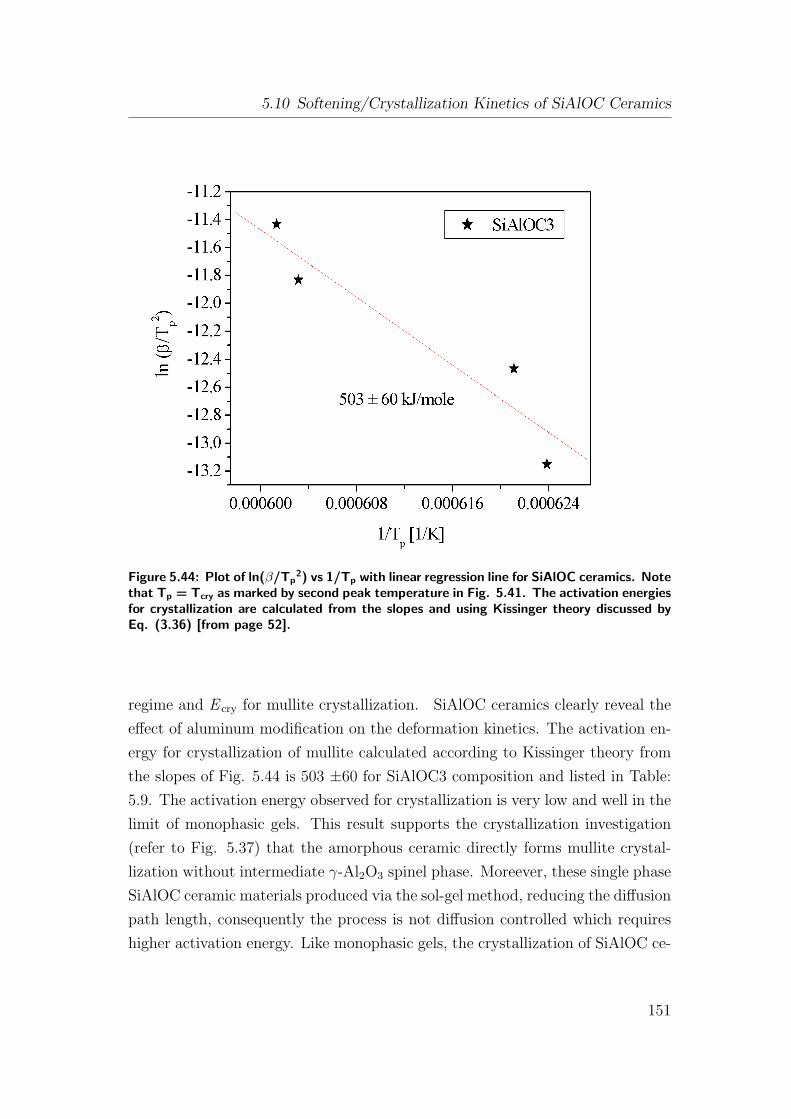
5.10 Softening/Crystallization Kinetics of SiAlOC Ceramics
Figure 5.44: Plot of ln(β/Tp2) vs 1/Tp with linear regression line for SiAlOC ceramics. Note
that Tp = Tcry as marked by second peak temperature in Fig. 5.41. The activation energiesfor crystallization are calculated from the slopes and using Kissinger theory discussed byEq. (3.36) [from page 52].
regime and E cry for mullite crystallization. SiAlOC ceramics clearly reveal the
effect of aluminum modification on the deformation kinetics. The activation en-
ergy for crystallization of mullite calculated according to Kissinger theory from
the slopes of Fig. 5.44 is 503 ±60 for SiAlOC3 composition and listed in Table:
5.9. The activation energy observed for crystallization is very low and well in the
limit of monophasic gels. This result supports the crystallization investigation
(refer to Fig. 5.37) that the amorphous ceramic directly forms mullite crystal-
lization without intermediate γ-Al2O3 spinel phase. Moreever, these single phase
SiAlOC ceramic materials produced via the sol-gel method, reducing the diffusion
path length, consequently the process is not diffusion controlled which requires
higher activation energy. Like monophasic gels, the crystallization of SiAlOC ce-
151
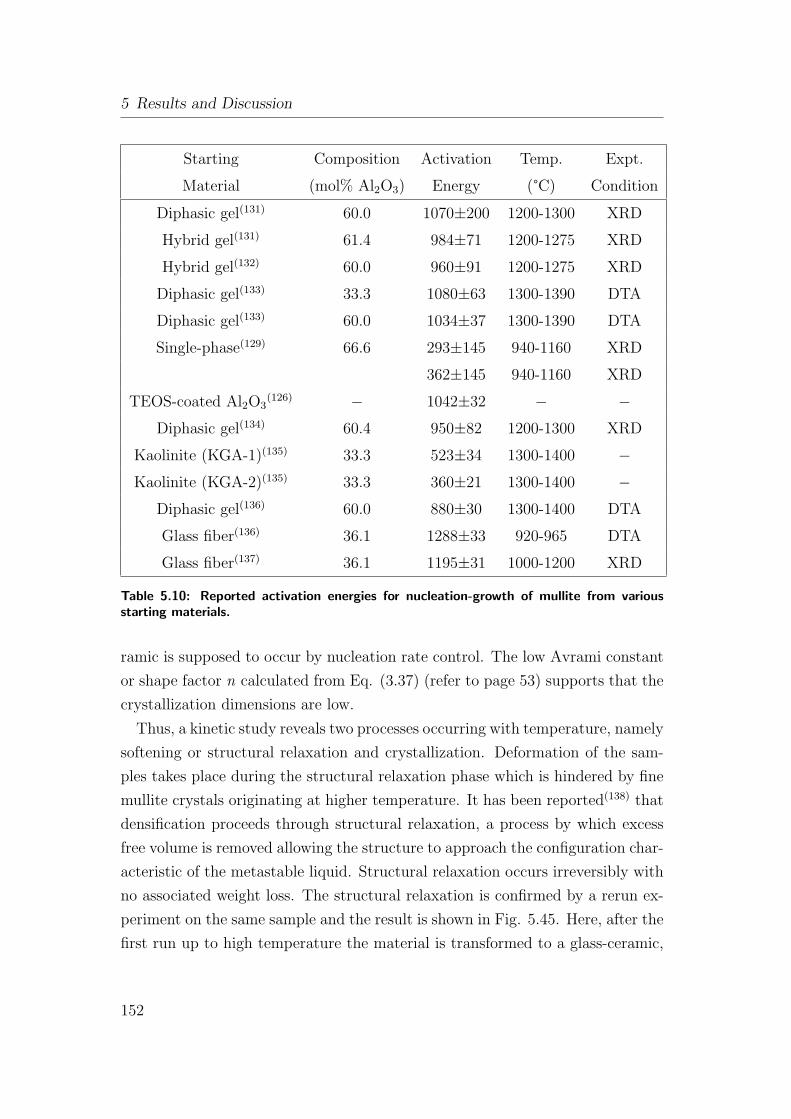
5 Results and Discussion
Starting Composition Activation Temp. Expt.
Material (mol% Al2O3) Energy (°C) Condition
Diphasic gel(131) 60.0 1070±200 1200-1300 XRD
Hybrid gel(131) 61.4 984±71 1200-1275 XRD
Hybrid gel(132) 60.0 960±91 1200-1275 XRD
Diphasic gel(133) 33.3 1080±63 1300-1390 DTA
Diphasic gel(133) 60.0 1034±37 1300-1390 DTA
Single-phase(129) 66.6 293±145 940-1160 XRD
362±145 940-1160 XRD
TEOS-coated Al2O3(126) − 1042±32 − −
Diphasic gel(134) 60.4 950±82 1200-1300 XRD
Kaolinite (KGA-1)(135) 33.3 523±34 1300-1400 −Kaolinite (KGA-2)(135) 33.3 360±21 1300-1400 −
Diphasic gel(136) 60.0 880±30 1300-1400 DTA
Glass fiber(136) 36.1 1288±33 920-965 DTA
Glass fiber(137) 36.1 1195±31 1000-1200 XRD
Table 5.10: Reported activation energies for nucleation-growth of mullite from variousstarting materials.
ramic is supposed to occur by nucleation rate control. The low Avrami constant
or shape factor n calculated from Eq. (3.37) (refer to page 53) supports that the
crystallization dimensions are low.
Thus, a kinetic study reveals two processes occurring with temperature, namely
softening or structural relaxation and crystallization. Deformation of the sam-
ples takes place during the structural relaxation phase which is hindered by fine
mullite crystals originating at higher temperature. It has been reported(138) that
densification proceeds through structural relaxation, a process by which excess
free volume is removed allowing the structure to approach the configuration char-
acteristic of the metastable liquid. Structural relaxation occurs irreversibly with
no associated weight loss. The structural relaxation is confirmed by a rerun ex-
periment on the same sample and the result is shown in Fig. 5.45. Here, after the
first run up to high temperature the material is transformed to a glass-ceramic,
152
5.10 Softening/Crystallization Kinetics of SiAlOC Ceramics
Figure 5.45: TD curves for SiAlOC1 ceramic for first and second heating at the heatingrate of 10°C/min.
and therefore, the TD plot of such a material does not show the first large con-
traction due to softening and the associated weight loss in this regime is < 1
wt.%. At high temperature contraction again sets in because of the softening of
the glass-ceramic matrix, which has changed composition due to crystallization
during the first run.
In the later part of this study the effect of post heat-treatment on the oxidation
resistance will be discussed. This is because if the samples are reheated in the
softening regime at T < 1300°C the already transformed material shows no re-
densification (dimensional change) in this temperature range. Therefore this
treatment could change the properties of the material which may be reflected in
the oxidation kinetics.
153
5 Results and Discussion
5.11 Creep in Bulk SiAlOC Ceramics
Substitution in traditional oxide glasses of some of the divalent oxygen atoms by
different elements namely C and N results in the improvement of both mechanical
properties and refractoriness.(139) The effect of addition of trivalent element like
aluminum through sol-gel technique and polymer pyrolysis on high temperature
deformation behavior is the focus of this section.
The experiments were performed at different temperatures (950, 1000, 1050,
1100, 1150 and 1250°C) and different stresses (25, 50, 75, 100 and 125 MPa) in
order to cover the whole temperature-stress regime used to study the creep for
glasses and ceramics. Creep and sintering or cavitation can occur at the same
time during high-temperature deformation of ceramic materials. It is now recog-
nized that the measured strain must be separated into densification or cavitation
damage and true creep before analyzing the data further for shear viscosities
and activation energies. True creep implies change in the shape of the specimen
without any change in volume. On the other hand densification or cavitation
changes the volume. This volume change will appear as time-dependent strain,
and may be measured along with the creep strain.
The separation of creep and the densification or cavitation strain components
are reported by different groups: Rahman, DeJonghe(140),(141) and Raj.(142),(143)
The first two groups have attempted to measure shear and volume components
of strain from the measurements of the axial strain, and the measurement of the
change in density in the powder compacts obtained from series of interrupted
tests. A comprehensive method developed by Raj et al.(143) will be used to
separate the two components of the strain from measurements of the axial and
the radial displacements in specimens of a cylindrical shape and his method is
discussed below.
If a cylinder is compressed in axial direction, where σz is the axial applied
stress, it generates strain in all the three directions. Thus, εz is the axial strain
and εx and εy are the transverse strains in the other two direction of the Cartesian
system. In the present condition εx and εy are same.
In the simple uniaxial test the loading axis and the two axes perpendicular to
the loading axis will be the principal axes and hence εz=ε1, εx=ε2 and εy=ε3
(since suffix (1,2,3) is used for principal stress or strains). For simplicity we
154
5.11 Creep in Bulk SiAlOC Ceramics
will use εz, εx, εy for the further discussion and derivation keeping in mind that
they are the principal components. The three components of strain contain
information about the volume change:
εa =∆V
V= − ∆ρ
ρ= εz + εx + εy (5.18)
where εa is the damage/densification strain which is equal to the fraction change
in the volume ∆V/V, or the fractional change in density -∆ρ/ρ.
The creep strain, that is the strain which occurs without any change in volume,
can be written in terms of differentials between the principal components of the
strain. Thus the creep strain, εe, is written as:
εe =2
3
√1
2{(εz − εx)2 + (εx − εy)2 + (εy − εz)2} (5.19)
For uniaxial strain without any change in volume, εx = εy = - εz/2, and Eq.
(5.19) reduces to εe = εz. In the case of uniaxial deformation Eq. (5.18) and Eq.
(5.19) simplify considerably because there are only two independent components
of strain: the axial component εz, and the transverse component εt. Making the
substitutions in the previous equations the densification/cavitational strain and
shear strain is obtained:
εa = −∆ρ
ρ= εz + 2εt (5.20)
and
εe =2
3
∣∣∣∣εz − εt
∣∣∣∣or
εe =1
3
∣∣∣∣3εz + ∆ρρ
∣∣∣∣(5.21)
Thus the creep strain εe, and the densification/cavitation strain εa, can be sep-
arated by measuring either εz and εt, or εz and ∆ρ/ρ.
The sign conventions for the above parameters are as follow: εz and εt are neg-
ative if the specimen grows smaller. εa is negative if the volume of the specimen
155
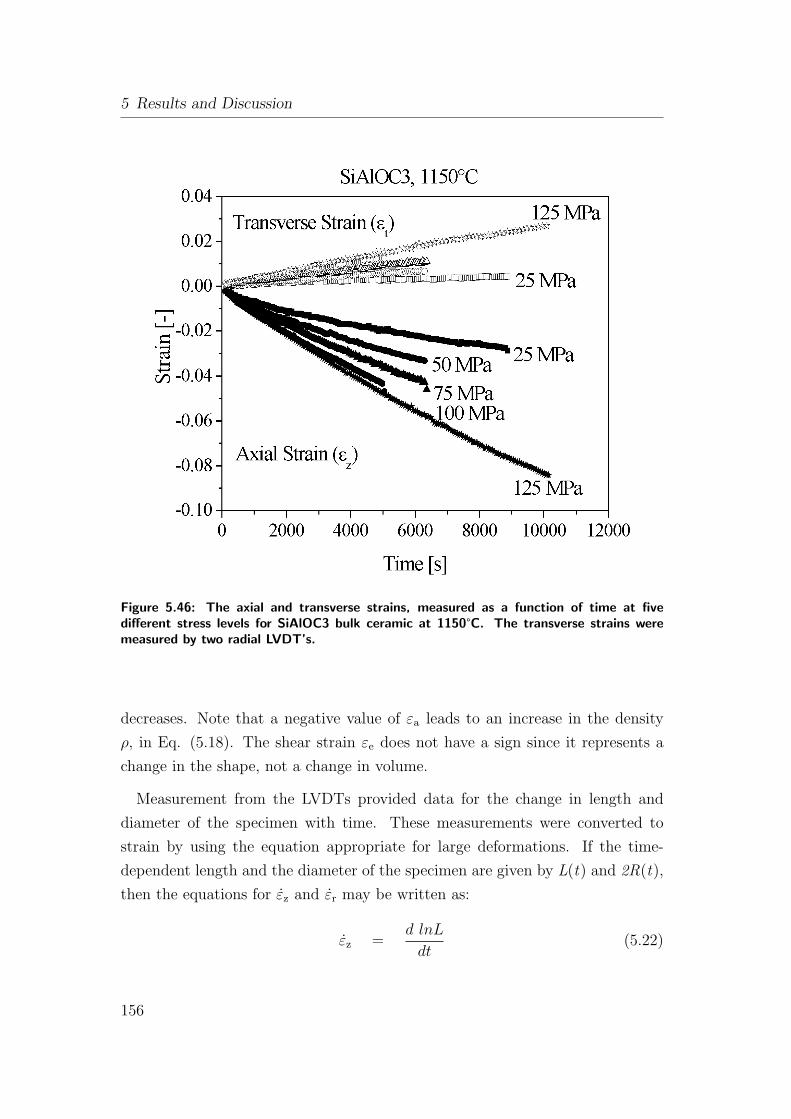
5 Results and Discussion
Figure 5.46: The axial and transverse strains, measured as a function of time at fivedifferent stress levels for SiAlOC3 bulk ceramic at 1150°C. The transverse strains weremeasured by two radial LVDT’s.
decreases. Note that a negative value of εa leads to an increase in the density
ρ, in Eq. (5.18). The shear strain εe does not have a sign since it represents a
change in the shape, not a change in volume.
Measurement from the LVDTs provided data for the change in length and
diameter of the specimen with time. These measurements were converted to
strain by using the equation appropriate for large deformations. If the time-
dependent length and the diameter of the specimen are given by L(t) and 2R(t),
then the equations for εz and εr may be written as:
εz =d lnL
dt(5.22)
156
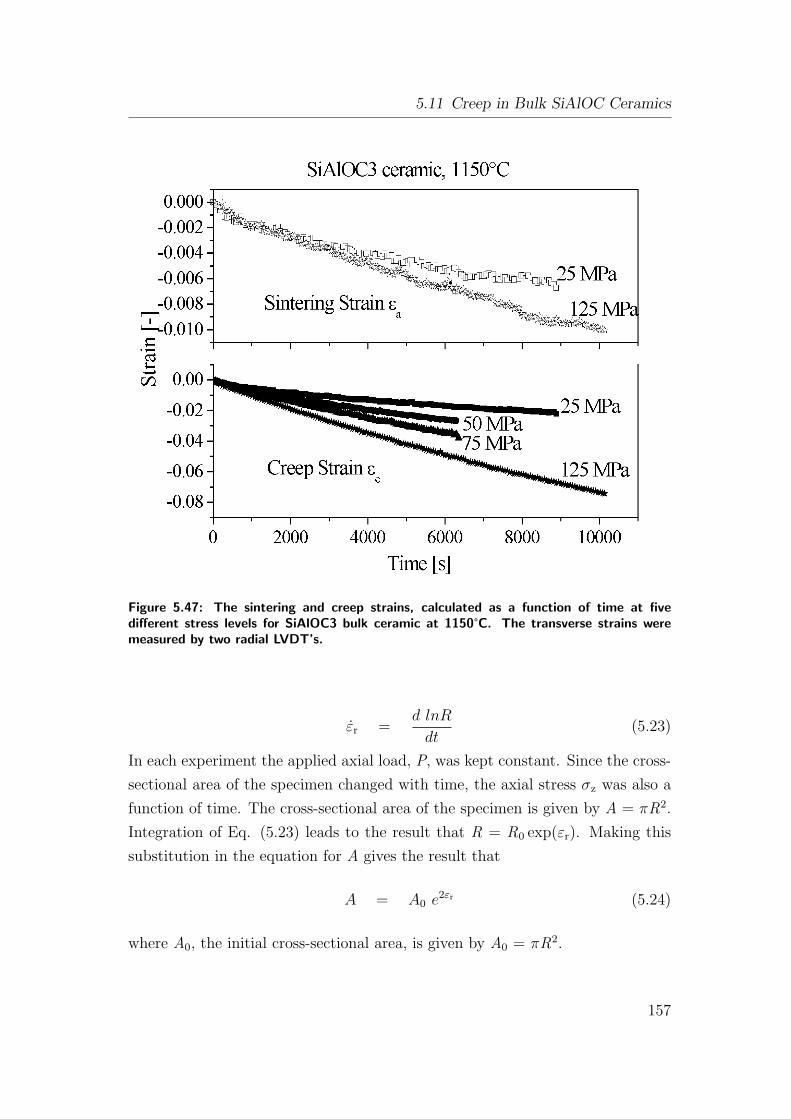
5.11 Creep in Bulk SiAlOC Ceramics
Figure 5.47: The sintering and creep strains, calculated as a function of time at fivedifferent stress levels for SiAlOC3 bulk ceramic at 1150°C. The transverse strains weremeasured by two radial LVDT’s.
εr =d lnR
dt(5.23)
In each experiment the applied axial load, P, was kept constant. Since the cross-
sectional area of the specimen changed with time, the axial stress σz was also a
function of time. The cross-sectional area of the specimen is given by A = πR2.
Integration of Eq. (5.23) leads to the result that R = R0 exp(εr). Making this
substitution in the equation for A gives the result that
A = A0 e2εr (5.24)
where A0, the initial cross-sectional area, is given by A0 = πR2.
157
5 Results and Discussion
Now using the equation that σz = P/A and substituting from Eq. (5.24) we
have the result that
σz =P
A0
e-2εr (5.25)
Looking at the deformation kinetics of SiAlOC ceramics, the time dependent
measurements of the axial and transverse strains for SiAlOC3 ceramic (as an
example) is given in Fig. 5.46. It can be seen that the axial strain is negative
(compressive strain) and the transverse strain is positive (tensile strain). For
creep deformation, when the volume is conserved, the transverse strain is half
of the axial strain and in reverse direction. The transverse strain is in opposite
direction but the magnitude of transverse strain is not exactly half that of axial
strain i.e. (εt/εa = 0.5) and is ≈ 0.3-0.35. This result indicates that there must
be a small change in volume which either leads to cavitation or densification. The
substitution of strain data into Eqs. (5.20) and (5.21) separates densification and
shear strains and are plotted in Fig. 5.47. Here εa is negative, indicating that
the specimens are deforming by a sintering like process [from equation (5.20)]
increasing the density but its overall effect is very small. In other words, it
can be seen that almost all deformation of the specimen is due to creep strain
and that the sintering strain is almost negligible. This separated creep strains
can be used for further studies namely: calculation of steady state creep rate
[SSCR] alternately used as strain rate ε (it is the slope of the linear part in
strain-vs-time curve), stress exponent and the shear viscosity of the glass. To
explain the viscosity and its temperature dependence it is worth at this moment
to look into the insight of the concept of viscosity of silica and other silicate
glasses, the mechanisms for viscous flow and factors affecting the viscosity and
flow characteristics.
The shear viscosity ηs can be defined in terms of a engineering shear strain
rate γ corresponding to the applied stress σs. For example, a cylindrical sample
is compressed as it is done for this study by a stress σz, and it deforms at a rate
γ = dL/dt, where L is a length of the cylinder and t is the time, then
ηs =σs
γ=
1
3
(σs
εe
)(5.26)
where σs = σz, Lo is the initial length of the cylinder, and γ is the engineering
158
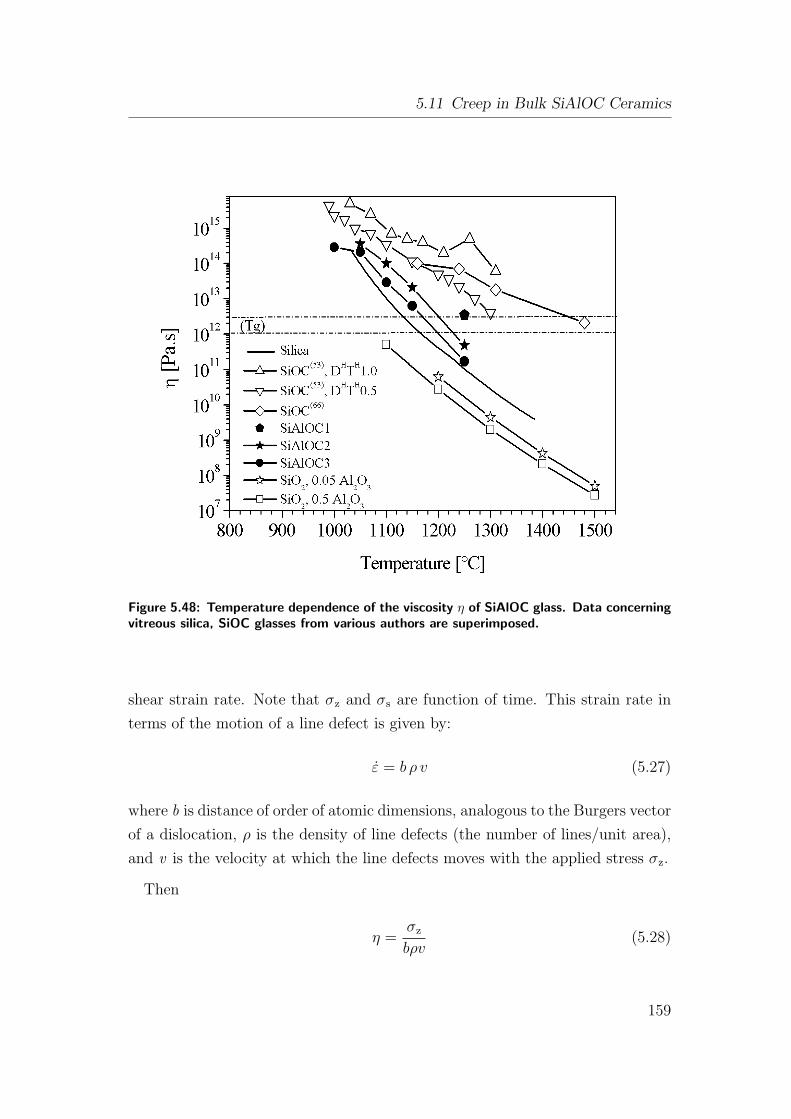
5.11 Creep in Bulk SiAlOC Ceramics
Figure 5.48: Temperature dependence of the viscosity η of SiAlOC glass. Data concerningvitreous silica, SiOC glasses from various authors are superimposed.
shear strain rate. Note that σz and σs are function of time. This strain rate in
terms of the motion of a line defect is given by:
ε = b ρ v (5.27)
where b is distance of order of atomic dimensions, analogous to the Burgers vector
of a dislocation, ρ is the density of line defects (the number of lines/unit area),
and v is the velocity at which the line defects moves with the applied stress σz.
Then
η =σz
bρv(5.28)
159
5 Results and Discussion
Upon application of stress the line defect rapidly accelerates to a steady-state
velocity v. The velocity is a complicated function of the properties of the liquid,
and can depend on the applied stress. The density ρ of line defects should be
related to the volume density N of point defects that make up the line defect.
An approximation is that ρ is proportional to N, or
ρ = fNa (5.29)
where a is the distance between point defects along the line defect. It is probable
that a is about the same as b in the above Eq. (5.27). The parameter f is
the function of point defects that are incorporated into line defects. These line
defects can nucleate by fluctuations in the bulk of the liquid or, more likely, with
impurity particles in the liquid.
The following equation has enjoyed wide use for fitting the temperature de-
pendence of viscosity data:
η = ηoexp
{B
RT
}(5.30)
in which ηo, B, are temperature-independent constants, R is the gas constant
and T the temperature. Doremus et al.(144) concluded that Eq. (5.30) does not
fit accurate viscosity data at high and low temperatures, bringing into question
theories that results in it. Eq. (5.30) may be useful for fitting experimental
measurements over limited temperature ranges or that are rather scattered, but
it cannot justify accurately theories of the temperature dependence of viscosities.
Many different ideas to explain the viscosity of glasses have been proposed.
Douglas in his work on viscosity of silicate glasses assumed that the flow for
silicate glasses was limited by breaking silicon−oxygen−silicon (Si−O−Si) bonds.
He considered that the oxygen atom between two silicon atoms could occupy two
different positions, separated by the energy barrier. The distribution of oxygen
atoms between these two positions is then calculated from an entropy of mixing.
Thus, Douglas anticipated the emphasis on configurational entropy and modified
Eq. (5.30), which fits viscosities for wide range of liquids.
Mott suggested that the concentration of broken Si−O bonds in vitreous silica
increases as the temperature increases, and provides easier flow. Mott showed
160
5.11 Creep in Bulk SiAlOC Ceramics
that motion of the broken bonds around an Si−O ring would lead to flow. Brawer
has proposed a change in the coordination number of a glass constituent as the
defect likely to result in flow. The distribution of coordination number is a
function of temperature, pressure, and glass composition. The changes in the
coordination number result in density fluctuation in the melt. Flow under the
stress takes place by changing the distribution of low density region, although
the total density is not changed. He claims that, the theory is in good quantita-
tive agreement with structural relaxation in glasses. Additionally, Urbain(145) in
his study on various silicate glasses indicated that the variation of viscosity with
temperature for SiO2 and SiO2−Al2O3 is according to the Arrhenius relation.
He reported that there is a substantial reduction in the viscosity in silica with
addition of alumina. It has been assumed that a change in aluminum coordina-
tion from four to six fold, causes a decrease in viscosity as a result of an increase
in the concentration of non-bridging oxygens in the melt.
More insights in the diffusion of silicon and oxygen in silicates of different
melt compositions at different temperatures and pressures suggest that, the dif-
fusion coefficients of oxygen and silicon were the same. The simplest explanation
proposed for this result is that the silicon and oxygen atoms diffuse in the same
molecules. The simplest molecule containing these two atoms is silicon monoxide,
SiO. Silicon monoxide is the gaseous molecule that results from the vaporization
of silica. The vaporization can be written:
SiO2(l) = SiO(g) + 1/2O2(g) (5.31)
Doremus suggests that the diffusion of silicon and oxygen melts takes place by
transport of SiO molecules formed in the melt. In this case Eq. (5.31) is modified
to
SiO2(l) = SiO(d) +O(d) (5.32)
in which d is dissolved in melt.
The extra oxygen atom leads to five coordination of oxygen atoms around
silicon. Breaking out a SiO molecule from the silica network leaves behind three
oxygen ions and one silicon ion with unpaired electron. One of these oxygen ions
can bond to the silicon ion. The two other dangling bonds result in two silicon
161
5 Results and Discussion
ions being five coordinated to oxygen ions. One of the five oxygen ions around
the central silicon ion has an unpaired electron, and is not bonded strongly to
the silicon ion. This electron “hole” should move between the other oxygen ions.
It is proposed that viscous flow in silica occurs by the transport of defects in
the silica melts (silicon monoxide molecules). Mott and Brewer treated viscous
flow in terms of the motions of point defects. However, flow from point defects,
although possible, is much less efficient than flow resulting from the motion of
line defects. In crystals it is well established that the plastic flow takes place
by motion of line defects, called dislocations. Dislocations of this kind in glasses
were proposed by Gilman.(146) Liquid defects can align themselves to form a line
defect (not necessarily a straight line) and motion of this line defects leads to
viscous flow. Line defects in liquids are of course not the same as dislocations in
crystals. In silica the defects involved in flow are silicon monoxide molecules. In
a sense these molecules result from broken silicon−oxygen bonds, as shown by
Eq. (5.32). So the SiO molecules are five-coordinated silicon atoms involved in
viscous flow derived from broken bonds.
The individual silicon monoxide molecules dissolve in interstices or silicon−oxy-
gen “cages” in the silica structure, presumably with a five-coordinated silicon
nearby. These structures reduce the silicon−oxygen bond strengths in their vicin-
ity. To form a line they must have some sort of attractive interaction. This line
can then move through the silica structure under stress because of the lower
silicon−oxygen bond strength in its vicinity. Studies of the viscosity of other
silicate melts report that the activation energy for flow is decreased by the low-
ered silicon−oxygen bond strengths near defects such as non bridging oxygen
atoms and other ions in the structure, not by the broken silicon−oxygen bonds
themselves.
The concentration of silicon monoxide formed in silica can be calculated in
principle from Eq. (5.32). An equilibrium coefficient K can be defined for this
equation:
K =[SiO][O]
[SiO2](5.33)
The brackets represents thermodynamic activities, or concentrations if the system
behaves ideally. Stebbins et al. suggested that the concentration of SiO can be
estimated from measurements of the concentration of five-coordinated silicons.
162
5.11 Creep in Bulk SiAlOC Ceramics
Accordingly, for K2O.4SiO2 glass he reported the fraction of five-coordinated
silicon at ambient temperature and pressure to be about 10% after rapid cooling
and 6% after slow cooling from 1300°C.
The heat of reaction of Eq. (5.31) is 722 kJ/mole; that of Eq. (5.32) should
be smaller, because the oxygen atom is bound in the melt. The temperature
dependence of the concentration N 1 of SiO molecule dissolved in the silica should
be given by an equation of the form:
N1 = C1 exp{−H1
RT
}(5.34)
where C 1 is a constant and H 1 is the heat of reaction to form the dissolved SiO
molecules.
The diffusion coefficient D can be written:
D = D0 exp{−QRT
}(5.35)
Where D0 and Q are constants independent of temperature. If diffusion re-
sults from motion of a defect, then the preexponent factor (D0) should include
the defect concentration, in the case of silicates, the concentration N 1 of SiO
molecules. Then the activation energy Q is the sum of the enthalpy to form
the SiO molecules (H 1) and the enthalpy of motion (H m) of the defects. This
shows that, there is a close relationship between viscosity and diffusion of silicon
and oxygen in silica. These two transport properties are linked by the defects
(SiO molecules) that control both. Nevertheless the detailed mechanism for the
viscosity and diffusion are quite different. The viscosity is controlled by the mo-
tion of lines of SiO molecules, whereas the diffusion results from the motion of
individual SiO molecules through the silica network.
At temperatures above 1400°C the fraction f, if SiO molecules form line de-
fects, is not a function of temperature. However, below this temperature the
viscous flow has a higher activation energy for silica than above this tempera-
ture. Nevertheless, the activation energy of diffusion of silicon in silica is the
same above and below 1400°C. Thus the concentration of SiO molecules is still
governed by Eq. (5.34) at all temperatures. The change in activation energy
as explained by Doremus result from time and temperature dependencies of the
163
5 Results and Discussion
factor f in Eq. (5.29). Thus below 1400°C the fraction of SiO molecules in the
line defects decreases as the temperature decreases, increasing the equilibrium
viscosity from the values observed at higher temperature. This decrease of f
depends on time, that is, the breakup of line defects is not instantaneous, but
becomes slower as the temperature decreases. The reduction in the fraction f at
a particular temperature leads to a smaller density ρ of line defects and thus to
a higher viscosity.
We now come back to the viscosity and its temperature dependence for SiAlOC
ceramics and its comparison with SiOC ceramic and silica glass. Shear viscosity
curves are plotted in Fig. 5.48. This figure is superimposed with the data on
vitreous silica, alumina containing silica and recent data on SiOC ceramics from
various authors. It is seen that, for all tested temperatures the viscosities of all
SiAlOC compositions are lower than that for SiOC ceramics (from literature)
and higher than the silica glass with or without alumina. Additionally, if the
SiAlOC ceramic viscosity values are compared among themselves, the viscosity
values are lower for higher aluminum composition at all temperatures.
The higher viscosity observed as compared to the silica glass needs to be ex-
plained. As mentioned in the chemical analysis of Si(Al)OC ceramics, part of
the silicon is covalently bonded to carbon atoms and the remaining silicon shares
bonds with oxygen. It is also demonstrated that the amount of Si−C bonds de-
creases with the addition of aluminum. Introduction of carbon that is covalently
bonded to silicon provides a significant increase in the viscosity η. Most viscosity
data that have been reported so far on glasses that contain 10−20 at.% carbon
are consistent with a ∼2-order-of-magnitude shift to higher values in comparison
with vitreous silica. Such a high difference in viscosity is only observed in case
of SiAlOC1 even at 1250°C and the difference reduces for SiAlOC2 and SiAlOC3
ceramic.
The reduction in the viscosity difference has different origins. The first origin
lies in the presence of few Si−C bonds and the second in the amount of impurities
(aluminum in the present case) and its coordinaiton. This is exactly seen for the
SiAlOC2 and SiAlOC3 compositions, which show reduction in the Si−C bonds
and corresponding increase in the impurity aluminum. Contradictory results
to the assumption mentioned earlier is observed concerning the coordination
number. It is seen that for SiAlOC1 and SiAlOC2 compositions the aluminum has
164
5.11 Creep in Bulk SiAlOC Ceramics
octahedral coordination and posses higher viscosity. Thus, the assumption that
change in aluminum coordination from tetra to octahedral reduces the viscosity
may not be correct. Moreover, the SiAlOC3 composition posses pentahedral
and octahedral coordination with higher contribution from pentahedral. This
may deform the sample easily and reduce the viscosity at high temperature. A
glass transition temperature of these glasses can be estimated as the temperature
where the viscosity reaches the value of 1012−1012.6 [Pa.s] range, and this regime
is marked as a bar along with a dotted line in Fig. 5.48. Accordingly, a glass
transition temperature of 1220, 1250 and >1300°C (measured at 1012 Pa.s) is
observed for SiAlOC3, SiAlOC2 and SiAlOC1 ceramics, respectively. The value
for SiAlOC1 is estimated by extrapolation of the data above 1250°C.
The apparent activation energy for flow between 1000−1150 °C is estimated
by plotting ln(η) against reciprocal temperature and found to be about 375 ±20 kJ/mole 445 ± 20 for SiAlOC3 and SiAlCO2 ceramic, respectively. This
indeed is lower than that of vitreous silica having value of 700 kJ/mole in the
same temperature range. In comparison the reported activation energy for SiOC
ceramic (296 kJ/mole).(80),(139) Additionally, the activation energy for viscous
flow values for SiAlOC ceramics are of the same magnitude as Es mentioned in
Table: 5.9 during softening kinetics study. It is a reasonable assumption that
the molecular motions involved in structural relaxation are of the same type as
those involved in viscous flow. Studies(147),(148) for the structural relaxation in the
glass transition region has shown that the activation energy for relaxation is of the
same order as for shear viscosity. Unfortunately, we could only measure the creep
data (shear viscosity) for SiAlOC2 and SiAlOC3 ceramics completely (i.e. for
all predefined stresses and temperature) but could not complete it for SiAlOC1
ceramic. But assuming the above equivalence between the activation energies
for softening and viscous flow to be true, the activation energy for flow could
be assumed to be about 632 kJ/mole for the SiAlOC1 ceramic. This discussion
rises the following questions: Why is the activation energy for SiAlOC1 ceramic
smaller as compared to pure silica and higher than reported for SiOC ceramics?
This is explained as follows.
As proposed the viscous flow in silica occurs by the transport of defects in the
silica melt (silicon monoxide molecules) formed according to Eq. (5.32). The indi-
vidual silicon monoxide molecules dissolve in interstices or silicon−oxygen ”cages”
165
5 Results and Discussion
in the silica structure, presumably with the five-coordinated silicon nearby. These
structures reduces the silicon−oxygen bond strengths in their vicinity. These de-
fects form a line like dislocation form in crystals which move through the silica
structure under stress because of the low silicon−oxygen bond strength in its
vicinity. In the SiAlOC1 ceramic the regions where aluminum atoms are present
either in tetrahedral coordination as Si−O−Al or octahedral coordination as
Al−O−Al can act as origins for line defects and can reduce the bond strength
in its vicinity. This argument supports the reduction in activation energy for
flow mainly by the lowered silicon-oxygen bond strength. The activation energy
is further reduced and lowest for higher aluminum content, which can be be-
cause of the excess pentahedral coordination which additionally act as defects
and facilitates flow.
In case of the SiOC ceramic it has been reported that the activation energy
for flow increases above 1200°C and approaches to that for pure silica. This was
argued due to the crystallization of extremely small SiC nanocrystals at these
temperatures and in large volume which decreases the carbon content in the
residual glass. In other words crystallization increases the SiO2 equivalence of
the matrix. The SiO2 equivalence for the mentioned SiOC ceramics is between
1.25 to 1.33 as compared to 1.57 for SiAlOC1 ceramic. In other words the silica
equivalence is higher for the SiAlOC1 composition and this is reflected in the
higher activation energy. Thus, the higher SiC and SiO2 equivalence induce a
dynamic increase in the viscosity and higher activation energy for the SiAlOC1
composition. Indeed, other aluminum modified compositions should also have
similar Si−O equivalences which should show higher activation energy. The
lower values observed for SiAlOC2 and SiAlOC3 compositions as compared to
SiAlOC1 indicate that the amount of impurity atoms with different coordination
sites has a pronounced effect on the flow of defects yielding a low activation
energy.
5.12 Oxidation Behavior
This section will concentrate on the effect of oxidizing atmosphere i.e. air on the
synthesized bulk Si(Al)OC ceramics at high temperature. The quantitative anal-
166
5.12 Oxidation Behavior
ysis of the oxidation reaction kinetic, effect of aluminum on the reaction kinetics
and the activation energies of oxidation is investigated. Following discussion is
based on two types of bulk samples; one which has been pyrolyzed at 1100°C and
one after relaxation or softening by heat treatment at 1300°C. The differences
in the oxidation kinetics is co-related with chemical depth profile measurements
by SIMS and the oxide morphology by SEM.
5.12.1 Oxidation of As-Pyrolyzed Bulk Si(Al)OC Ceramics
5.12.1.1 As-Pyrolyzed SiOC Bulks
As mentioned earlier, the synthesized SiOC ceramic bulks are extremely dense
in as-pyrolyzed condition (refer to Fig. 5.16(b). These thin polished samples
are oxidized at different temperatures namely 1200, 1300, 1400°C and the corre-
sponding mass change is noted. Mass loss is observed during oxidation of SiOC
ceramics for all tested times and temperatures. Here, it is assumed that the
mass change obeys a parabolic law. The square of mass loss per unit geometric
area is calculated and plotted against isothermal time. The plot of (∆W/ A)2
[mg2/cm4] against isothermal oxidation time t [h] is shown in Fig. 5.49. The
parabolic law of type (∆W/A)2 = Kp(T) · t, with ∆W being the mass change,
A the sample surface area, t the oxidation time, and K p(T) the parabolic rate
constant at tested temperature is used in many oxidation studies. The linear
relationship between (∆W/A)2 vs. t in Fig. 5.49 confirms the parabolic nature
of oxidation and the slope of which gives the parabolic rate constant. Fig. 5.50 is
an Arrhenius plot of ln(Kp) vs. 1/T for the parabolic oxidation regime. From the
slope of this figure the activation energy of 190 ±5 [kJ/mole] is found to be asso-
ciated with the SiOC oxidation. The parabolic rate constant and the activation
energy are listed in Table: 5.11. The found activation energy is higher than that
reported for silicon, silicon carbide(82),(84), and nitride bonded SiC ceramics(149).
Also the activation energy of 190 [kJ/mole] is higher than for oxygen diffusion in
silica, which is 112 [kJ/mole].
If the oxidation is believed to be occurring by Eqs. (3.42) and (3.43) (refer
to page 62), where oxygen is diffusing inside, the carbonaceous reaction product
CO(g) or in some cases CO2(g) is removed through the silica scale. In order to
investigate the chemical profile of the bulk after oxidation SIMS was performed on
167
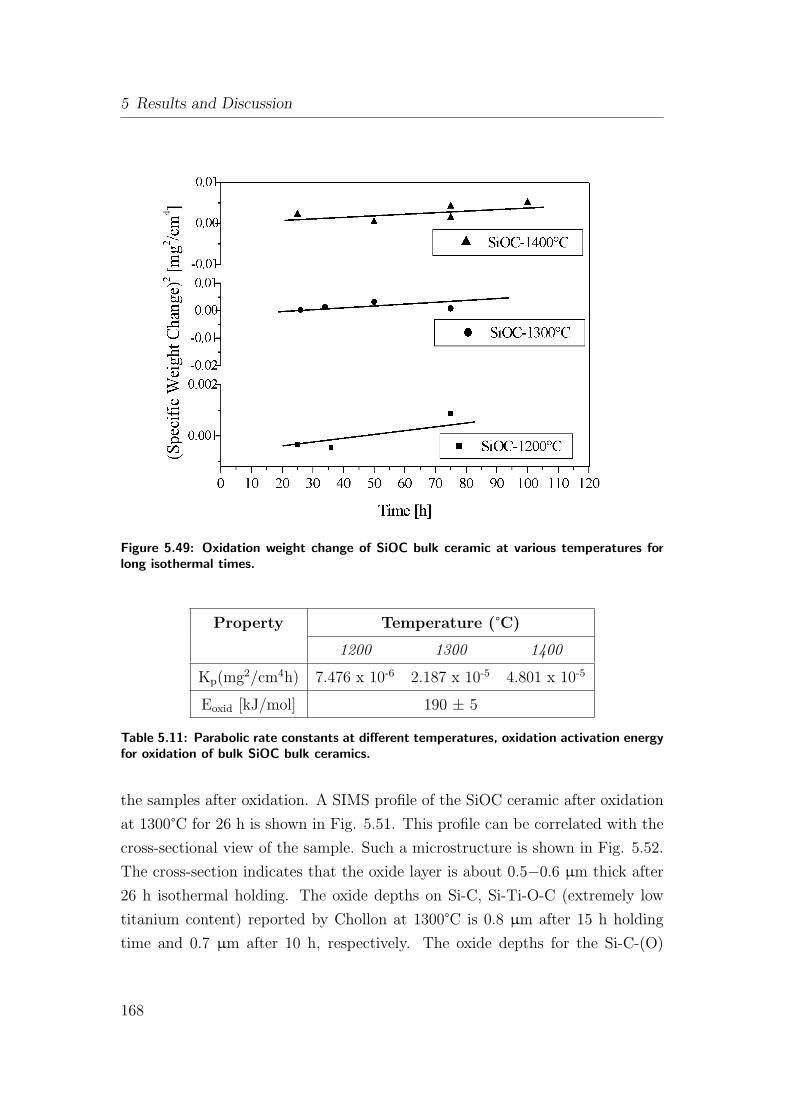
5 Results and Discussion
Figure 5.49: Oxidation weight change of SiOC bulk ceramic at various temperatures forlong isothermal times.
Property Temperature (°C)
1200 1300 1400
Kp(mg2/cm4h) 7.476 x 10⁻⁶ 2.187 x 10⁻⁵ 4.801 x 10⁻⁵
Eoxid [kJ/mol] 190 ± 5
Table 5.11: Parabolic rate constants at different temperatures, oxidation activation energyfor oxidation of bulk SiOC bulk ceramics.
the samples after oxidation. A SIMS profile of the SiOC ceramic after oxidation
at 1300°C for 26 h is shown in Fig. 5.51. This profile can be correlated with the
cross-sectional view of the sample. Such a microstructure is shown in Fig. 5.52.
The cross-section indicates that the oxide layer is about 0.5−0.6 µm thick after
26 h isothermal holding. The oxide depths on Si-C, Si-Ti-O-C (extremely low
titanium content) reported by Chollon at 1300°C is 0.8 µm after 15 h holding
time and 0.7 µm after 10 h, respectively. The oxide depths for the Si-C-(O)
168
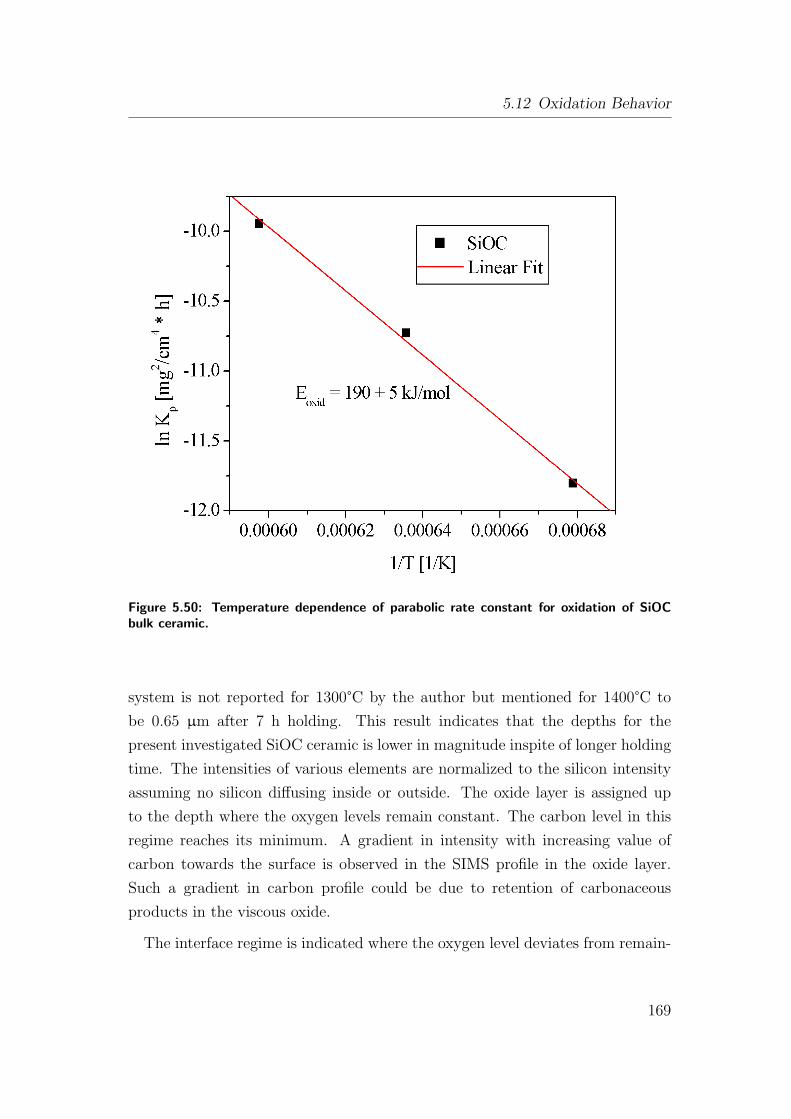
5.12 Oxidation Behavior
Figure 5.50: Temperature dependence of parabolic rate constant for oxidation of SiOCbulk ceramic.
system is not reported for 1300°C by the author but mentioned for 1400°C to
be 0.65 µm after 7 h holding. This result indicates that the depths for the
present investigated SiOC ceramic is lower in magnitude inspite of longer holding
time. The intensities of various elements are normalized to the silicon intensity
assuming no silicon diffusing inside or outside. The oxide layer is assigned up
to the depth where the oxygen levels remain constant. The carbon level in this
regime reaches its minimum. A gradient in intensity with increasing value of
carbon towards the surface is observed in the SIMS profile in the oxide layer.
Such a gradient in carbon profile could be due to retention of carbonaceous
products in the viscous oxide.
The interface regime is indicated where the oxygen level deviates from remain-
169
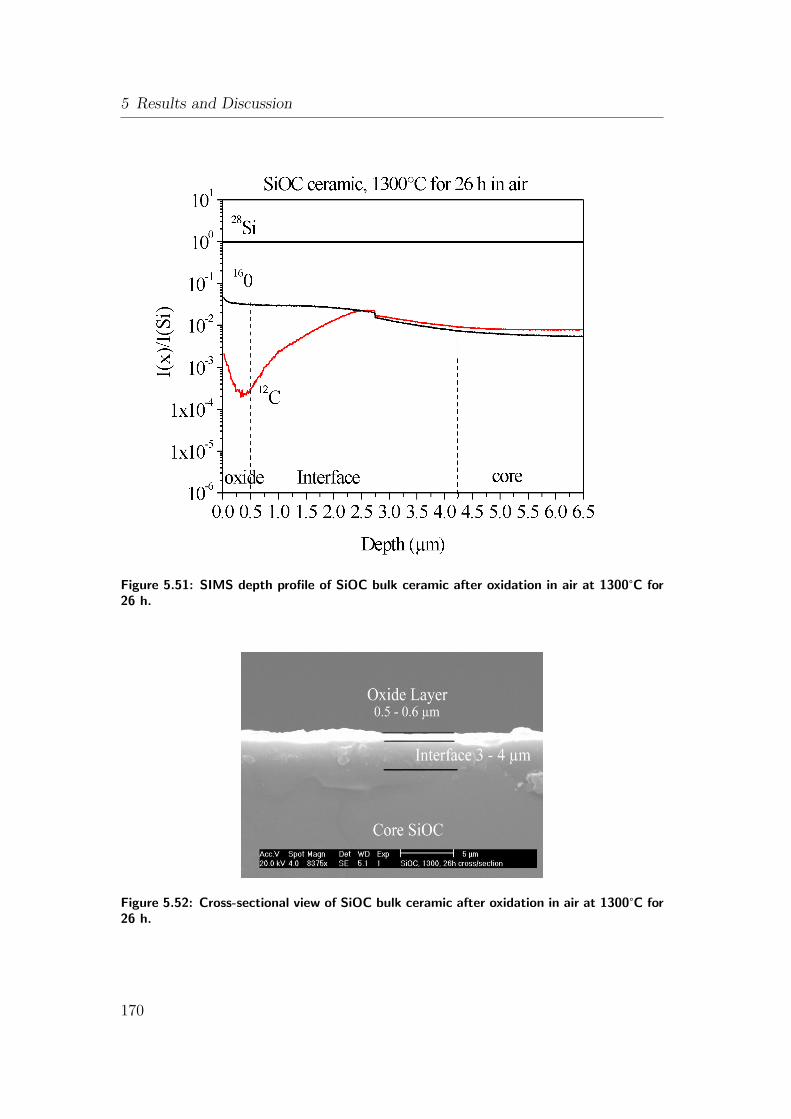
5 Results and Discussion
Figure 5.51: SIMS depth profile of SiOC bulk ceramic after oxidation in air at 1300°C for26 h.
Figure 5.52: Cross-sectional view of SiOC bulk ceramic after oxidation in air at 1300°C for26 h.
170
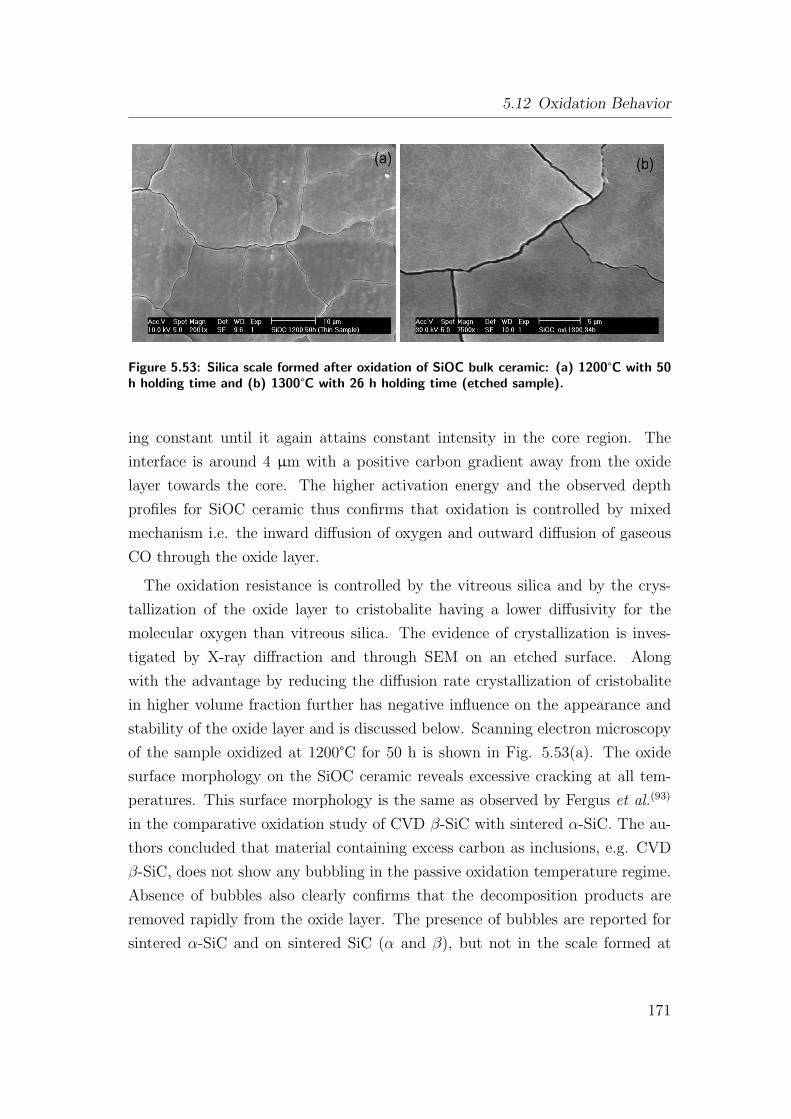
5.12 Oxidation Behavior
Figure 5.53: Silica scale formed after oxidation of SiOC bulk ceramic: (a) 1200°C with 50h holding time and (b) 1300°C with 26 h holding time (etched sample).
ing constant until it again attains constant intensity in the core region. The
interface is around 4 µm with a positive carbon gradient away from the oxide
layer towards the core. The higher activation energy and the observed depth
profiles for SiOC ceramic thus confirms that oxidation is controlled by mixed
mechanism i.e. the inward diffusion of oxygen and outward diffusion of gaseous
CO through the oxide layer.
The oxidation resistance is controlled by the vitreous silica and by the crys-
tallization of the oxide layer to cristobalite having a lower diffusivity for the
molecular oxygen than vitreous silica. The evidence of crystallization is inves-
tigated by X-ray diffraction and through SEM on an etched surface. Along
with the advantage by reducing the diffusion rate crystallization of cristobalite
in higher volume fraction further has negative influence on the appearance and
stability of the oxide layer and is discussed below. Scanning electron microscopy
of the sample oxidized at 1200°C for 50 h is shown in Fig. 5.53(a). The oxide
surface morphology on the SiOC ceramic reveals excessive cracking at all tem-
peratures. This surface morphology is the same as observed by Fergus et al.(93)
in the comparative oxidation study of CVD β-SiC with sintered α-SiC. The au-
thors concluded that material containing excess carbon as inclusions, e.g. CVD
β-SiC, does not show any bubbling in the passive oxidation temperature regime.
Absence of bubbles also clearly confirms that the decomposition products are
removed rapidly from the oxide layer. The presence of bubbles are reported for
sintered α-SiC and on sintered SiC (α and β), but not in the scale formed at
171
5 Results and Discussion
1300°C and 1400°C on single crystal SiC.(150) They attributed the bubbling to the
oxidation of observed carbon inclusions in the sintered materials. The scanning
electron micrograph presented in this SiOC research along with that by Fergus
contradict the explanation that carbon is only responsible for the bubbling. How-
ever other inclusions namely boron and aluminum have to be considered to be
responsible for bubble formation. The effect of boron is discussed by Fergus, and
the same can be seen for high temperature oxidation study for aluminum rich
ceramic SiAlOC composition, which will be explained below.
Cracking is believed to be generated during fast cooling of the ceramics. This
is because of the thermal coefficient mismatch between the surface oxide and
the core material. Additionally, cracking of these oxides can be attributed to
the presence of cristobalite embedded in the amorphous glass matrix, which
undergoes β to α transformation during cooling, accompanied by a 3−4% volume
change. Fig. 5.53(b) shows the surface morphology of the oxidized sample after
etching with cracks in the near vicinity of cristobalite and glass boundary.
5.12.1.2 Oxidation of As-Pyrolyzed SiAlOC Bulks
The focus of the present work is mainly on the study of the oxidation kinet-
ics of the aluminum modified silicon oxycarbide glass. In order to confirm if
the oxidation is having linear, parabolic or exponential dependence with time,
thermo-gravimetry was performed on SiAlOC ceramic bars. SiAlOC ceramics
when held in air at the oxidizing temperature indicate mass gain with time. A
sample curve of SiAlOC1 ceramic at 1400°C is shown in Fig. 5.54(a). It is obvi-
ous from this figure that the data follow parabolic behavior. Hence, the data is
replotted in Fig. 5.54(b) with the square of weight gain as a function of time. If
the behavior is parabolic then the plot should be a straight line, which is exactly
found in this case. The data is fitted to a linear function in order to calculate the
rate constants. Slope of the straight line gives the parabolic rate constant value
Kp, which for this particular case is 6.1 x 10⁻² [mg2/cm4h]. This value is one
order of magnitude higher than reported for CVD SiC (1.3 x 10⁻³ [mg2/cm4h])
analyzed in dry oxygen at 1400°C.(92) Thermal gravimetry has a limitation for
sample size as only small samples could be tested. Hence direct oxidation of thick
cylindrical samples are tested by inserting the samples in pre-heated furnace and
172
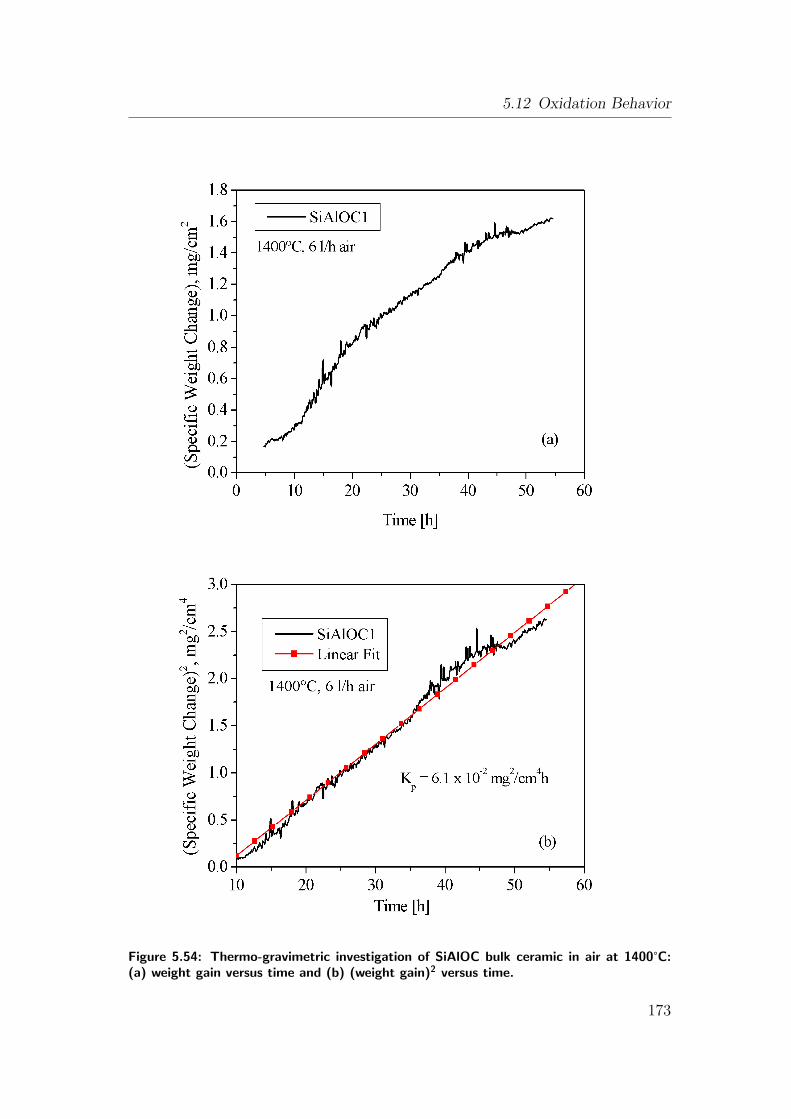
5.12 Oxidation Behavior
Figure 5.54: Thermo-gravimetric investigation of SiAlOC bulk ceramic in air at 1400°C:(a) weight gain versus time and (b) (weight gain)2 versus time.
173
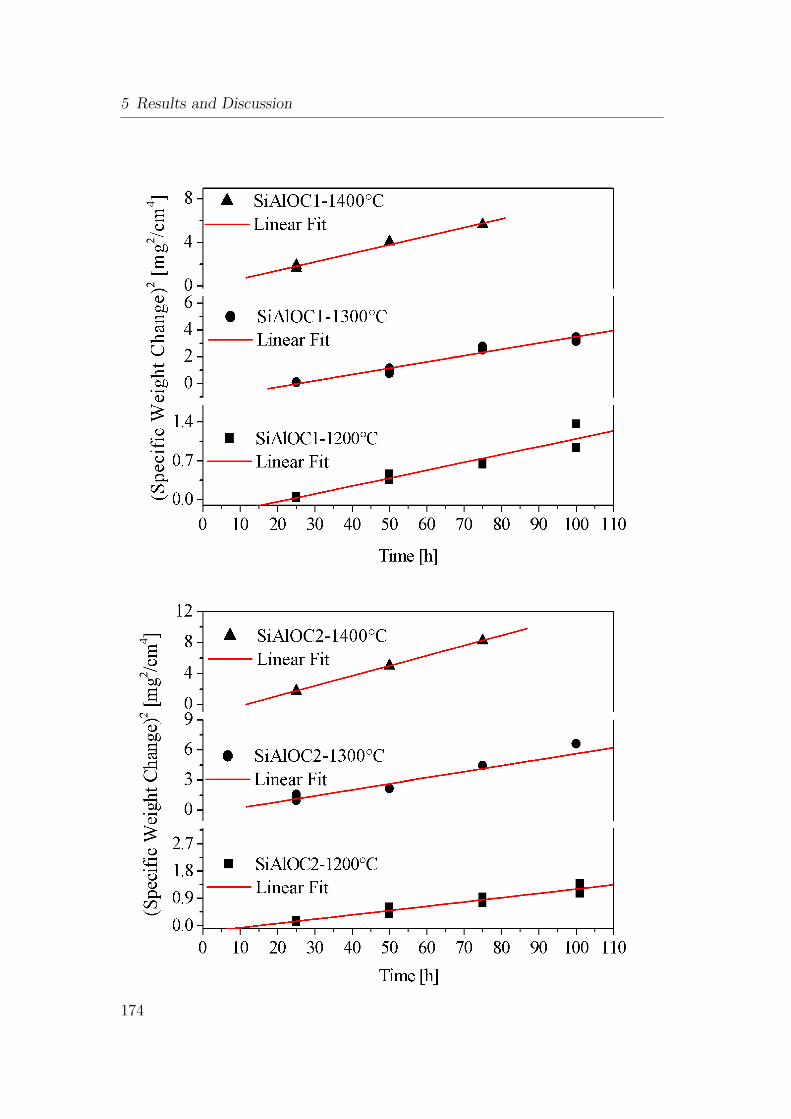
5 Results and Discussion
174
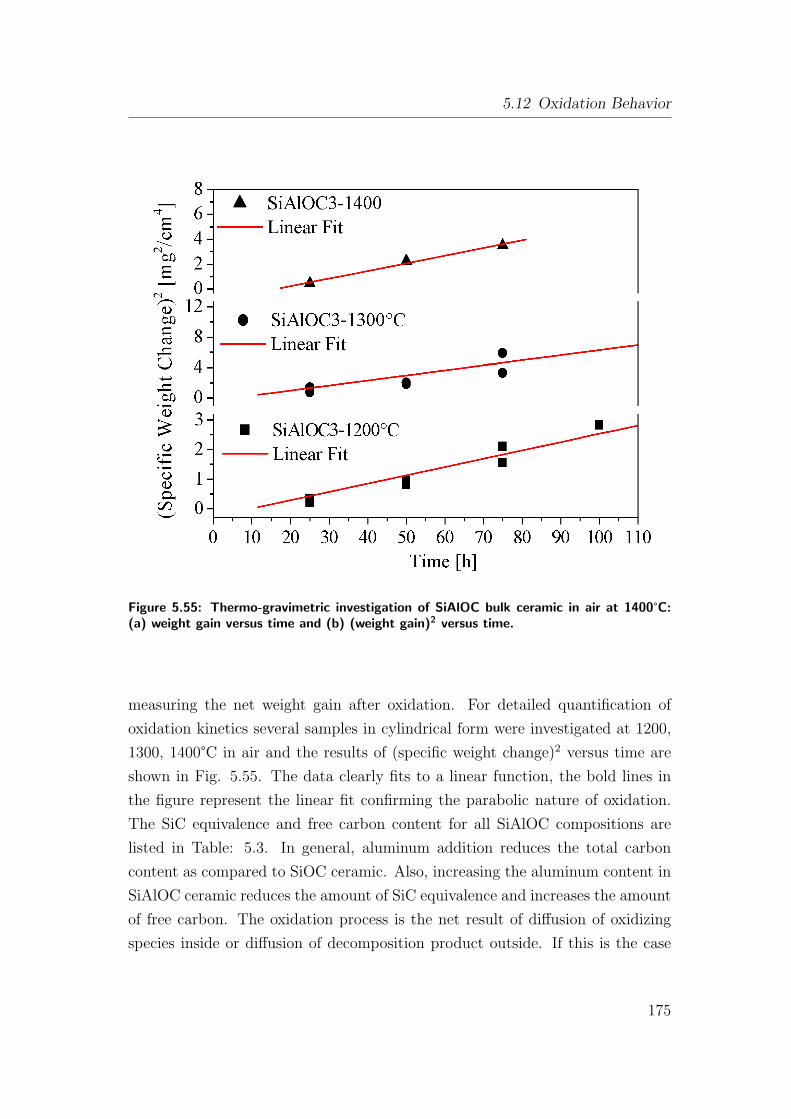
5.12 Oxidation Behavior
Figure 5.55: Thermo-gravimetric investigation of SiAlOC bulk ceramic in air at 1400°C:(a) weight gain versus time and (b) (weight gain)2 versus time.
measuring the net weight gain after oxidation. For detailed quantification of
oxidation kinetics several samples in cylindrical form were investigated at 1200,
1300, 1400°C in air and the results of (specific weight change)2 versus time are
shown in Fig. 5.55. The data clearly fits to a linear function, the bold lines in
the figure represent the linear fit confirming the parabolic nature of oxidation.
The SiC equivalence and free carbon content for all SiAlOC compositions are
listed in Table: 5.3. In general, aluminum addition reduces the total carbon
content as compared to SiOC ceramic. Also, increasing the aluminum content in
SiAlOC ceramic reduces the amount of SiC equivalence and increases the amount
of free carbon. The oxidation process is the net result of diffusion of oxidizing
species inside or diffusion of decomposition product outside. If this is the case
175
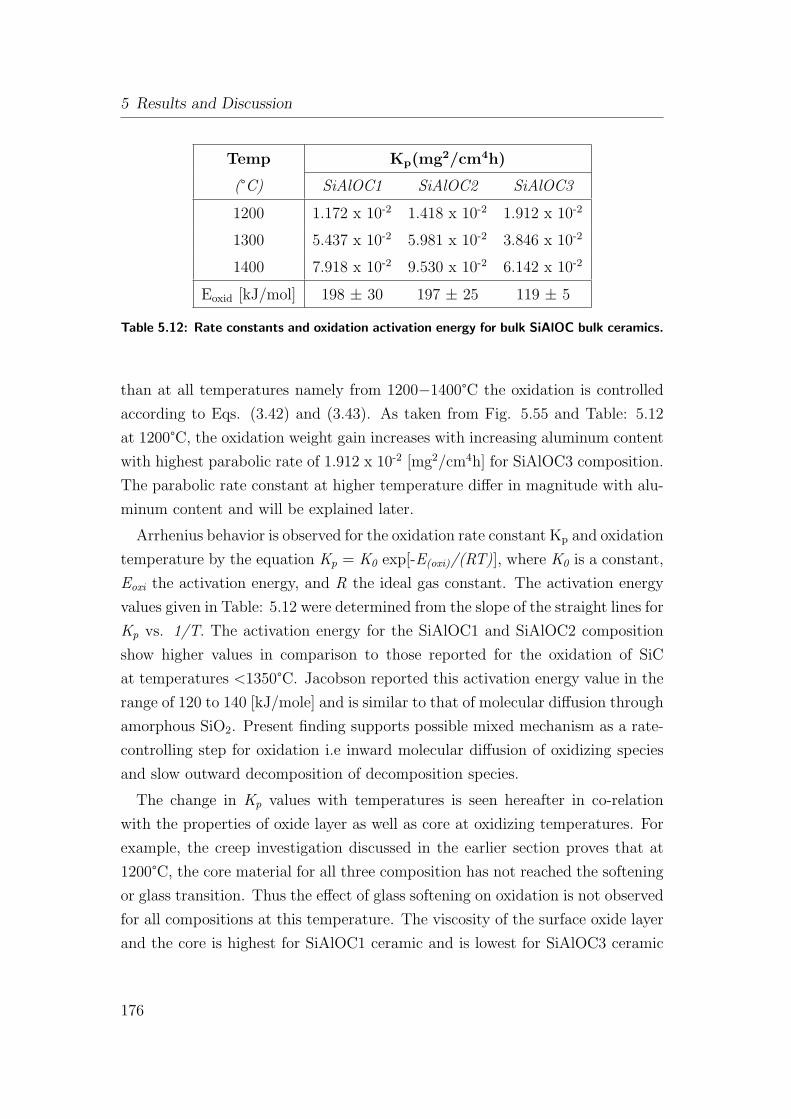
5 Results and Discussion
Temp Kp(mg2/cm4h)
(°C) SiAlOC1 SiAlOC2 SiAlOC3
1200 1.172 x 10⁻² 1.418 x 10⁻² 1.912 x 10⁻²
1300 5.437 x 10⁻² 5.981 x 10⁻² 3.846 x 10⁻²
1400 7.918 x 10⁻² 9.530 x 10⁻² 6.142 x 10⁻²
Eoxid [kJ/mol] 198 ± 30 197 ± 25 119 ± 5
Table 5.12: Rate constants and oxidation activation energy for bulk SiAlOC bulk ceramics.
than at all temperatures namely from 1200−1400°C the oxidation is controlled
according to Eqs. (3.42) and (3.43). As taken from Fig. 5.55 and Table: 5.12
at 1200°C, the oxidation weight gain increases with increasing aluminum content
with highest parabolic rate of 1.912 x 10⁻² [mg2/cm4h] for SiAlOC3 composition.
The parabolic rate constant at higher temperature differ in magnitude with alu-
minum content and will be explained later.
Arrhenius behavior is observed for the oxidation rate constant Kp and oxidation
temperature by the equation Kp = K0 exp[-E(oxi)/(RT)], where K0 is a constant,
Eoxi the activation energy, and R the ideal gas constant. The activation energy
values given in Table: 5.12 were determined from the slope of the straight lines for
Kp vs. 1/T. The activation energy for the SiAlOC1 and SiAlOC2 composition
show higher values in comparison to those reported for the oxidation of SiC
at temperatures <1350°C. Jacobson reported this activation energy value in the
range of 120 to 140 [kJ/mole] and is similar to that of molecular diffusion through
amorphous SiO2. Present finding supports possible mixed mechanism as a rate-
controlling step for oxidation i.e inward molecular diffusion of oxidizing species
and slow outward decomposition of decomposition species.
The change in Kp values with temperatures is seen hereafter in co-relation
with the properties of oxide layer as well as core at oxidizing temperatures. For
example, the creep investigation discussed in the earlier section proves that at
1200°C, the core material for all three composition has not reached the softening
or glass transition. Thus the effect of glass softening on oxidation is not observed
for all compositions at this temperature. The viscosity of the surface oxide layer
and the core is highest for SiAlOC1 ceramic and is lowest for SiAlOC3 ceramic
176
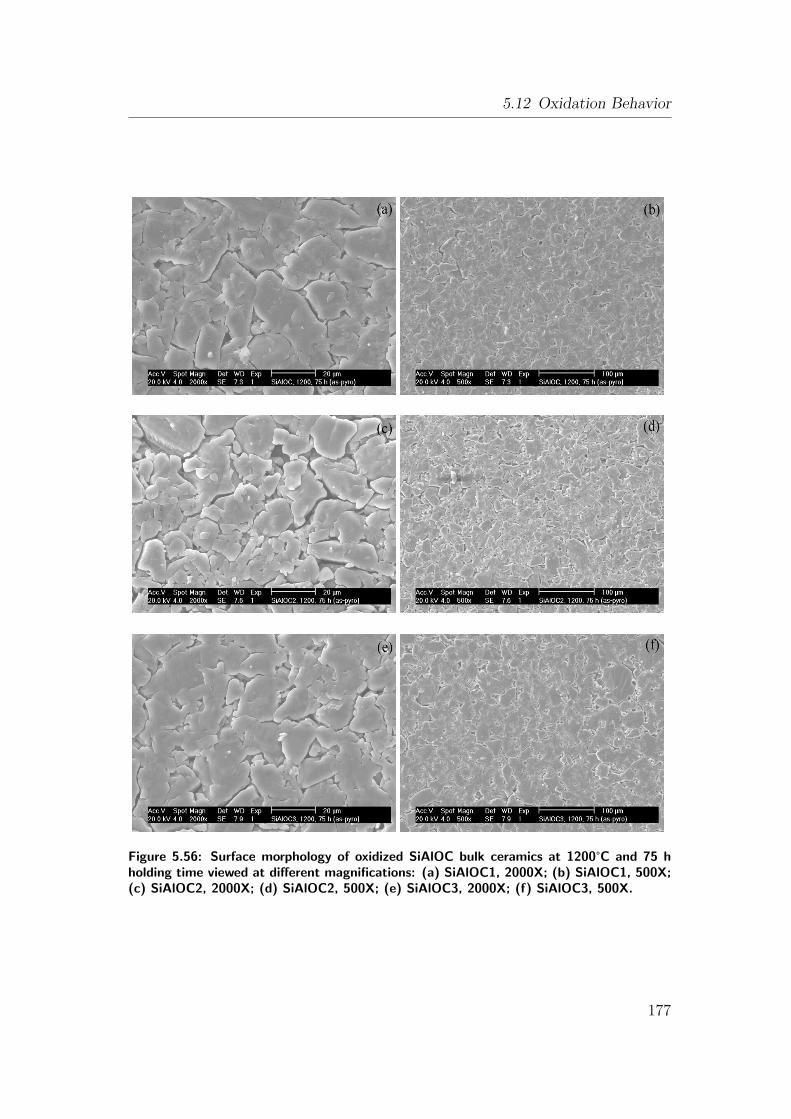
5.12 Oxidation Behavior
Figure 5.56: Surface morphology of oxidized SiAlOC bulk ceramics at 1200°C and 75 hholding time viewed at different magnifications: (a) SiAlOC1, 2000X; (b) SiAlOC1, 500X;(c) SiAlOC2, 2000X; (d) SiAlOC2, 500X; (e) SiAlOC3, 2000X; (f) SiAlOC3, 500X.
177
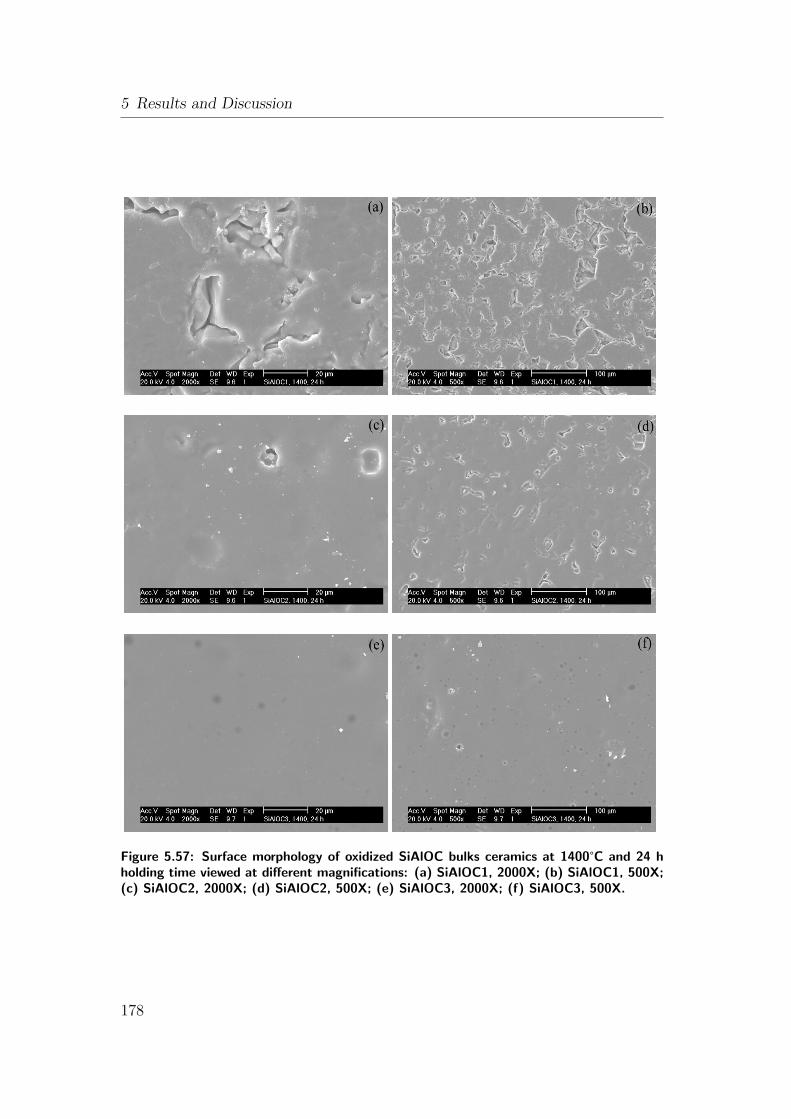
5 Results and Discussion
Figure 5.57: Surface morphology of oxidized SiAlOC bulks ceramics at 1400°C and 24 hholding time viewed at different magnifications: (a) SiAlOC1, 2000X; (b) SiAlOC1, 500X;(c) SiAlOC2, 2000X; (d) SiAlOC2, 500X; (e) SiAlOC3, 2000X; (f) SiAlOC3, 500X.
178
5.12 Oxidation Behavior
at all temperatures and the difference increases with temperature. This reduced
viscosity has a positive as well as a negative effect on the oxide morphology.
Positively lower viscosity possess high flowability for the glass which can fill the
pores but negatively there is enhanced diffusion of the gaseous species. The oxide
layer on aluminum modified samples exhibit a striking morphological change and
is dependent on the temperature. Pores are still present on the surface of all
compositions after oxidation for 75 h at 1200°C, and are shown in Fig. 5.56. But
raising the temperature to 1400°C covers the surface pores producing smooth
oxide surface and it is more prominent for SiAlOC3 ceramic even at low holding
time like 25 h, as shown in Fig. 5.57. Thus the oxide layer morphology is more
sensitive to temperature than to oxidizing holding time. At this temperature
the oxide layer viscosity difference with composition is significant and also the
core materials has reached or crossed the softening temperature. It is most
likely that this lowered viscosity for high aluminum SiAlOC3 materials increases
the transport mechanisms resulting in less hindered outgassing of decomposition
species. The excess carbon for SiAlOC3 composition thus increases the weight
loss at high temperature. Also the rate values or Kp is seen to be lower for
SiAlOC3 composition after 1300°C in comparison to the values for low aluminum
compositions at the same temperature.
Concluding the above discussion it is seen that the oxidation rate of SiOC ce-
ramics is three to four order of magnitude less than SiAlOC ceramic (see Table:
5.11 and Table: 5.12. This result indicates that the oxidation resistance of SiOC
ceramic is better than that of the SiAlOC ceramic. However the production of
dense SiOC bulk forms is difficult due to cracking. Moreover, the SiOC ceramic
cannot be effectively used for cyclic oxidation as during the first cycle (heat-
ing and cooling) the oxide layer produces cracks. Applications in form of thin
coatings or intermediate layers, however should be possible.
The past discussion indicates that the viscosity of the solid material plays a
key role in the transport phenomenon. If the material is reheated to its glass
transition temperature regime may show a reduction in specific weight change
and oxidation rate as compared to the pyrolyzed material. Hence, oxidation of
the SiAlOC ceramics is further investigated with respect to the effect of pre-
annealing of the bulks at high temperature.
179
5 Results and Discussion
5.12.2 Oxidation of Heat-Treated Bulk Si(Al)OC Ceramics
Structural relaxation and the glass transition of SiAlOC ceramics has been al-
ready discussed in the kinetic and compressive creep study. Accordingly, the
SiAlOC2 and SiAlOC3 ceramics have already reached the glass transition if
heated up to 1300°C while the SiAlOC1 ceramic has not. The temperature of
1300°C was selected for all bulk samples to investigate the effect of heat-treatment
on the oxidation behavior.
The structurally relaxed and thermally modified bulk samples are polished and
subsequently oxidized. The corresponding oxidation results are presented in Fig.
5.58 (a)−(c). Continuous weight gain is observed for all tested temperatures and
holding time. The observations are again in contrast to SiOC ceramics. This is
because even the SiC equivalence for both compositions is almost the same there
is a significant reduction in the free carbon content for SiAlOC compositions.
Hence, the weight loss by decomposition reaction is higher for SiOC than the
weight gain and results in net weight loss after oxidation.
As can be taken from Fig. 5.58, the absolute weight gain for pre-treated sam-
ples at all oxidation temperatures decreases with the aluminum content. Here,
the absolute net weight change values (with weight gain) are similar for SiAlOC1
and SiAlOC2 composition but the values are significantly reduced for SiAlOC3
composition for all investigated temperatures. This could easily make us con-
clude that SiAlOC3 has a superior oxidation resistance producing a passive oxide
layer, which resists further oxygen diffusion. However, this is not the case and
will be explained in the following section with help of SIMS and SEM. Neverthe-
less, our studies indicate that the thermal history of the sample plays a key role
in the oxidation kinetics of investigated SiAlOC ceramics.
The rate constant for all tested temperatures are calculated from the slopes of
Fig. 5.58 (a)−(c) and are plotted in Fig. 5.59. The oxidation activation energies
are estimated from the parabolic rates for aluminum modified ceramics and the
values are listed in Table: 5.13. The activation energy values seem sensitive to
the impurity concentration.
Again the oxidation phenomenon can be explained with reference to the com-
position and the pre-treatment before oxidation. For example if we compare
between as-pyrolyzed and pre-treated samples (Table: 5.12 and Table: 5.13),
180
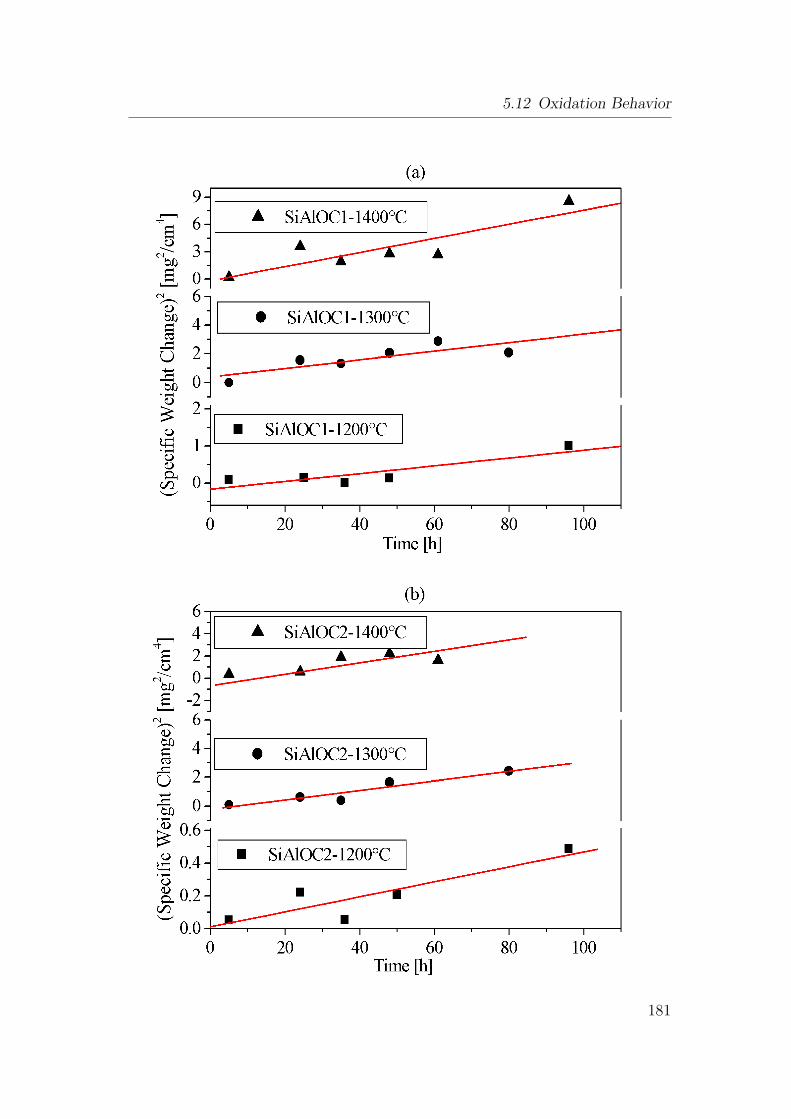
5.12 Oxidation Behavior
181
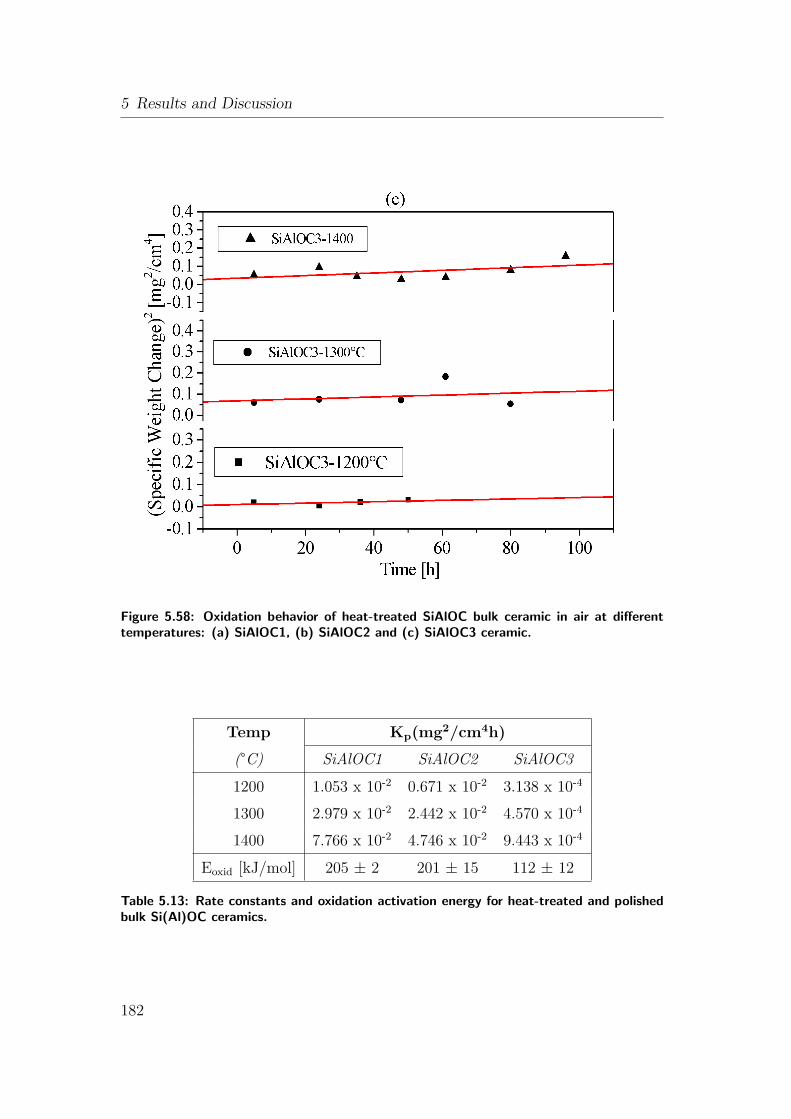
5 Results and Discussion
Figure 5.58: Oxidation behavior of heat-treated SiAlOC bulk ceramic in air at differenttemperatures: (a) SiAlOC1, (b) SiAlOC2 and (c) SiAlOC3 ceramic.
Temp Kp(mg2/cm4h)
(°C) SiAlOC1 SiAlOC2 SiAlOC3
1200 1.053 x 10⁻² 0.671 x 10⁻² 3.138 x 10⁻⁴
1300 2.979 x 10⁻² 2.442 x 10⁻² 4.570 x 10⁻⁴
1400 7.766 x 10⁻² 4.746 x 10⁻² 9.443 x 10⁻⁴
Eoxid [kJ/mol] 205 ± 2 201 ± 15 112 ± 12
Table 5.13: Rate constants and oxidation activation energy for heat-treated and polishedbulk Si(Al)OC ceramics.
182
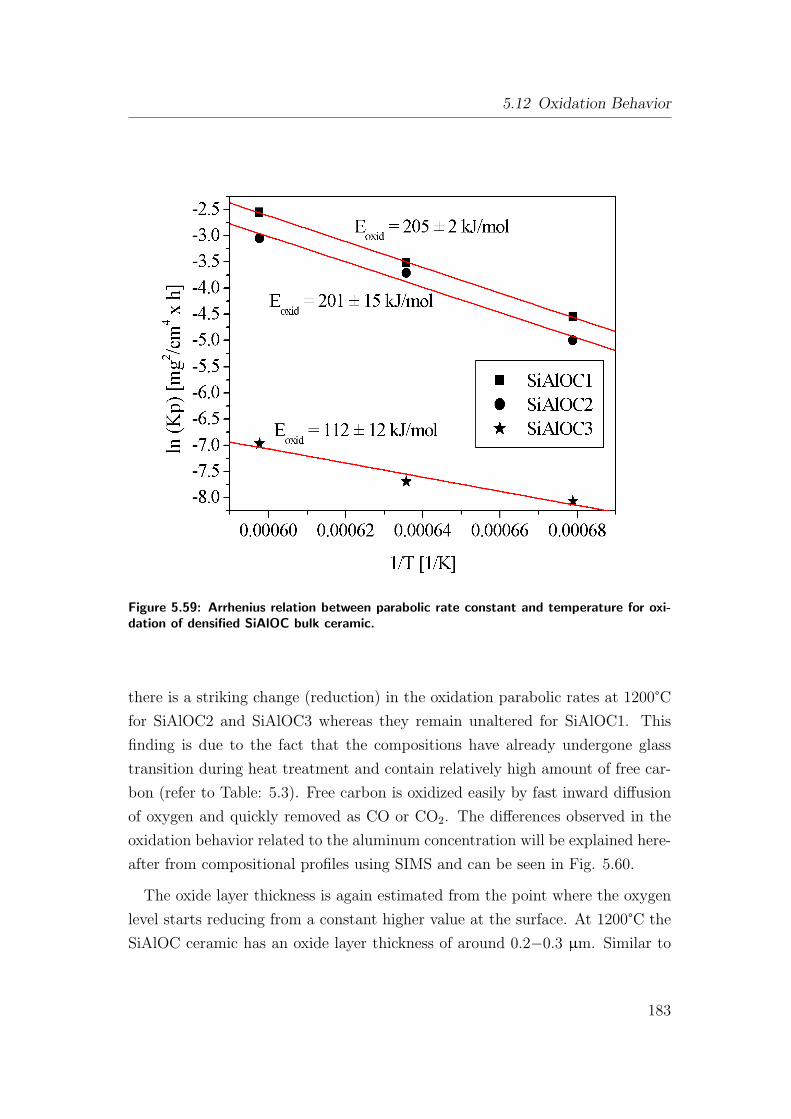
5.12 Oxidation Behavior
Figure 5.59: Arrhenius relation between parabolic rate constant and temperature for oxi-dation of densified SiAlOC bulk ceramic.
there is a striking change (reduction) in the oxidation parabolic rates at 1200°Cfor SiAlOC2 and SiAlOC3 whereas they remain unaltered for SiAlOC1. This
finding is due to the fact that the compositions have already undergone glass
transition during heat treatment and contain relatively high amount of free car-
bon (refer to Table: 5.3). Free carbon is oxidized easily by fast inward diffusion
of oxygen and quickly removed as CO or CO2. The differences observed in the
oxidation behavior related to the aluminum concentration will be explained here-
after from compositional profiles using SIMS and can be seen in Fig. 5.60.
The oxide layer thickness is again estimated from the point where the oxygen
level starts reducing from a constant higher value at the surface. At 1200°C the
SiAlOC ceramic has an oxide layer thickness of around 0.2−0.3 µm. Similar to
183
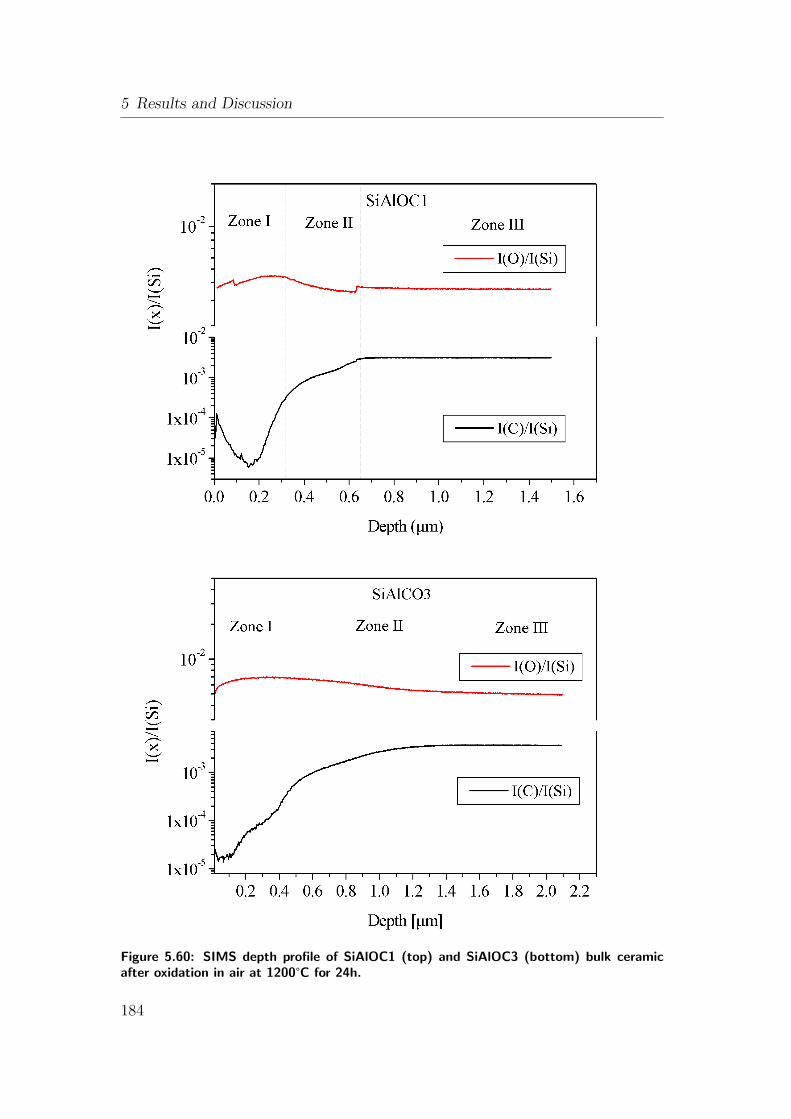
5 Results and Discussion
Figure 5.60: SIMS depth profile of SiAlOC1 (top) and SiAlOC3 (bottom) bulk ceramicafter oxidation in air at 1200°C for 24h.
184
5.12 Oxidation Behavior
SIMS profile seen in the earlier section for SiOC ceramic, there is an upward
carbon gradient in the oxide surface (Zone I in Fig. 5.60) for SiAlOC1 ceramic
but not for SiAlOC3. This result indicates that the viscosity of the oxide layer
for SiAlOC3 composition is extremely low, which suddenly removes the carbona-
ceous species.
Higher oxidation depths are observed for the samples oxidized at high temper-
ature namely 1300°C and this effect is extreme in case of SiAlOC3 ceramic as can
be seen in Fig. 5.61. For example, the depth of oxide layer for the SiAlOC1 and
SiAlOC2 sample held at 1300°C for 24 h is approximately 0.4−0.5 µm (Zone I),
which is slightly higher than that observed for these material at 1200°C. In con-
trast the oxide depth observed for SiAlOC3 at 1300°C for 24 h holding is around
1.0−1.1 µm, which is almost double than that seen at 1200°C. Additionally, un-
like SiAlOC1, SiAlOC2 compositions no gradient in the carbon SIMS is detected
in the case of SiAlOC3 ceramic. The carbon SIMS results for 1200°C and 1300°Care similar. It is assumed that there is no significant diffusion of aluminum in the
oxide layer controlling the oxidation kinetic process. However the concentration
of aluminum in the material as such changes the diffusion properties of the oxide
by forming low viscosity alumino-silicate glass and increases the depth of oxide
layer (or in general oxidized volume). The relatively low SiC equivalence with
free carbon content and accompanied by low viscosity oxide layer may probably
creates a balance between weight change reactions, which justifies the reduced
oxidation rates for SiAlOC3 ceramic (as quantified in Table: 5.13).
A comparison between oxide surface morphology of the oxidized samples in
as-pyrolyzed condition with that of the heat-treated samples shows consider-
able differences. Comparing Fig. 5.56 and Fig. 5.62 the surface morphology
for SiAlOC1 ceramic after heat-treatment (densification) is much smoother and
contains less open pores than that observed for the as-pyrolyzed sample. The
surface of SiAlOC2 and SiAlOC3 ceramic is enveloped by a smooth oxide layer
and the open porosity minimizes with the aluminum content. As explained ear-
lier that the surface oxide morphology is more sensitive to temperature than
time is exactly seen in the Fig. 5.63. Here, for SiAlOC2 and SiAlOC3 compo-
sition the surface pores are completely filled but are still present for SiAlOC1
ceramic. This supports that the oxide viscosity is lowered with aluminum and
can flow in the pores easily. At low oxidation temperature i.e. 1200°C oxide
185
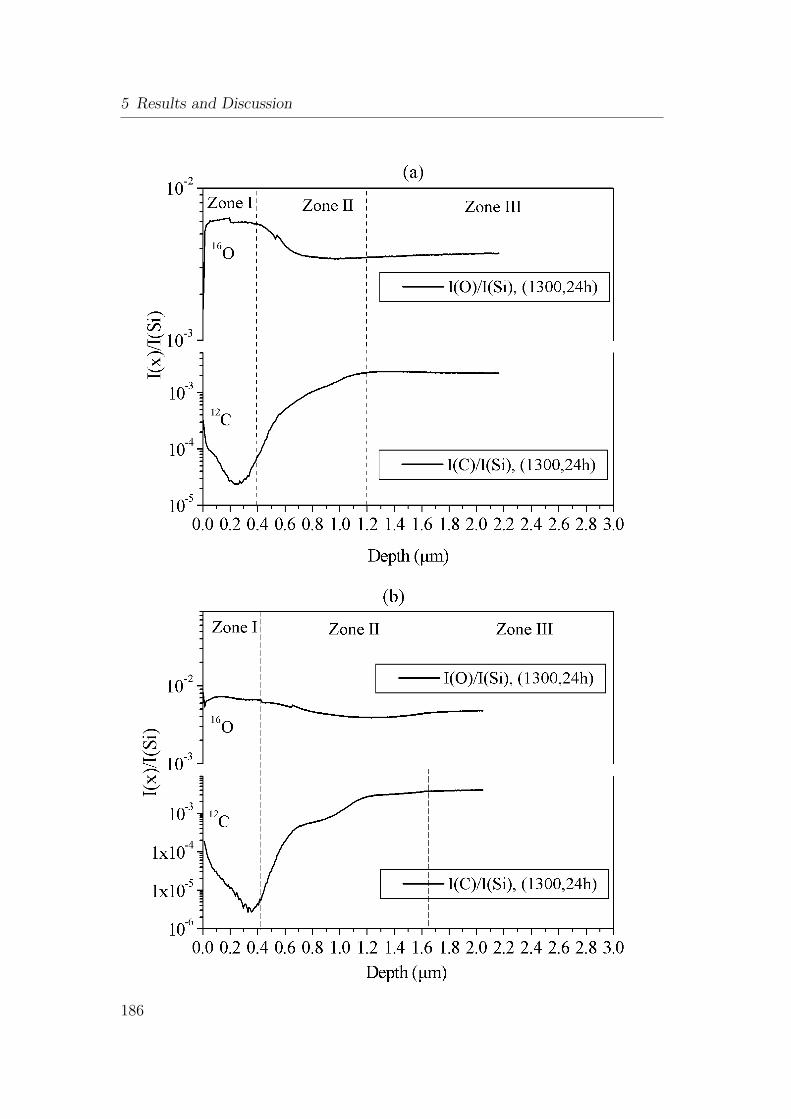
5 Results and Discussion
186
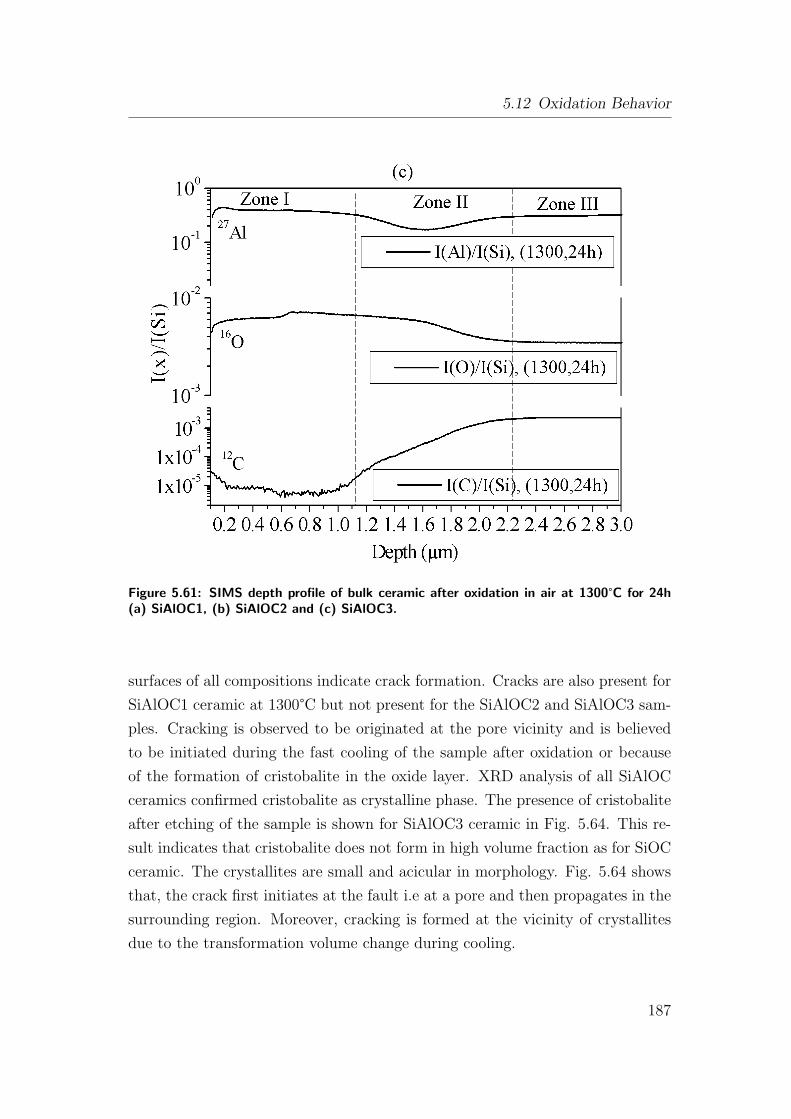
5.12 Oxidation Behavior
Figure 5.61: SIMS depth profile of bulk ceramic after oxidation in air at 1300°C for 24h(a) SiAlOC1, (b) SiAlOC2 and (c) SiAlOC3.
surfaces of all compositions indicate crack formation. Cracks are also present for
SiAlOC1 ceramic at 1300°C but not present for the SiAlOC2 and SiAlOC3 sam-
ples. Cracking is observed to be originated at the pore vicinity and is believed
to be initiated during the fast cooling of the sample after oxidation or because
of the formation of cristobalite in the oxide layer. XRD analysis of all SiAlOC
ceramics confirmed cristobalite as crystalline phase. The presence of cristobalite
after etching of the sample is shown for SiAlOC3 ceramic in Fig. 5.64. This re-
sult indicates that cristobalite does not form in high volume fraction as for SiOC
ceramic. The crystallites are small and acicular in morphology. Fig. 5.64 shows
that, the crack first initiates at the fault i.e at a pore and then propagates in the
surrounding region. Moreover, cracking is formed at the vicinity of crystallites
due to the transformation volume change during cooling.
187
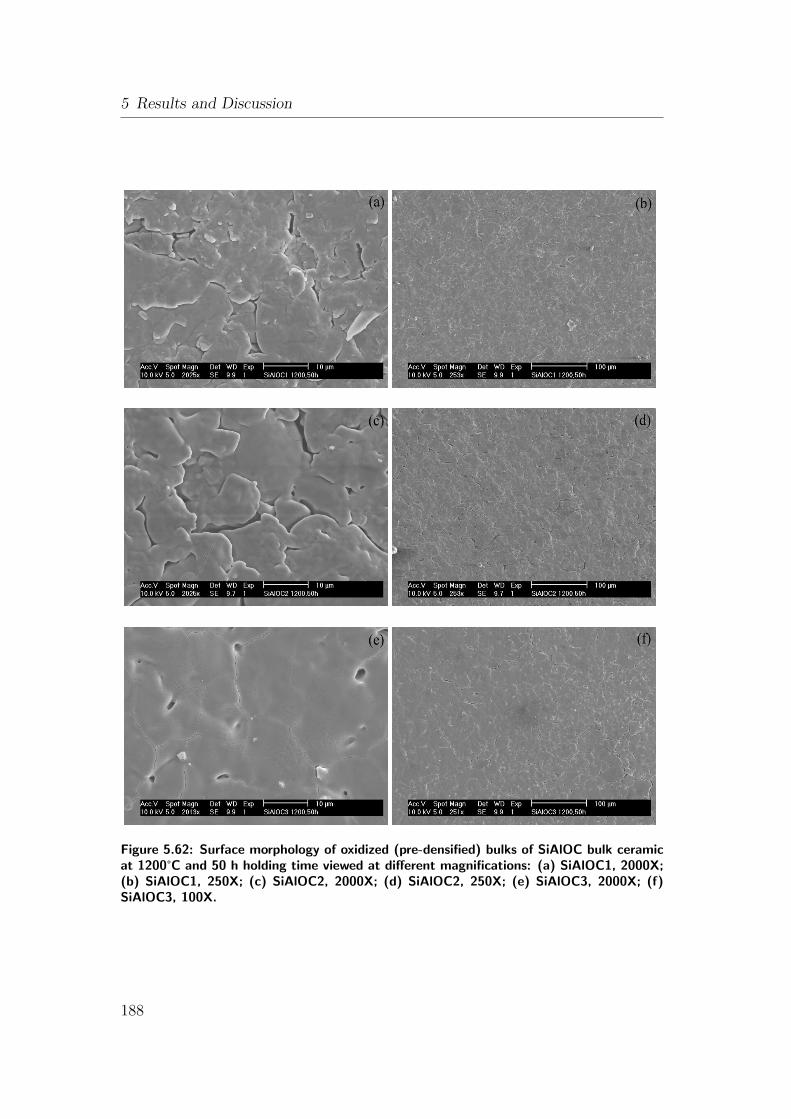
5 Results and Discussion
Figure 5.62: Surface morphology of oxidized (pre-densified) bulks of SiAlOC bulk ceramicat 1200°C and 50 h holding time viewed at different magnifications: (a) SiAlOC1, 2000X;(b) SiAlOC1, 250X; (c) SiAlOC2, 2000X; (d) SiAlOC2, 250X; (e) SiAlOC3, 2000X; (f)SiAlOC3, 100X.
188
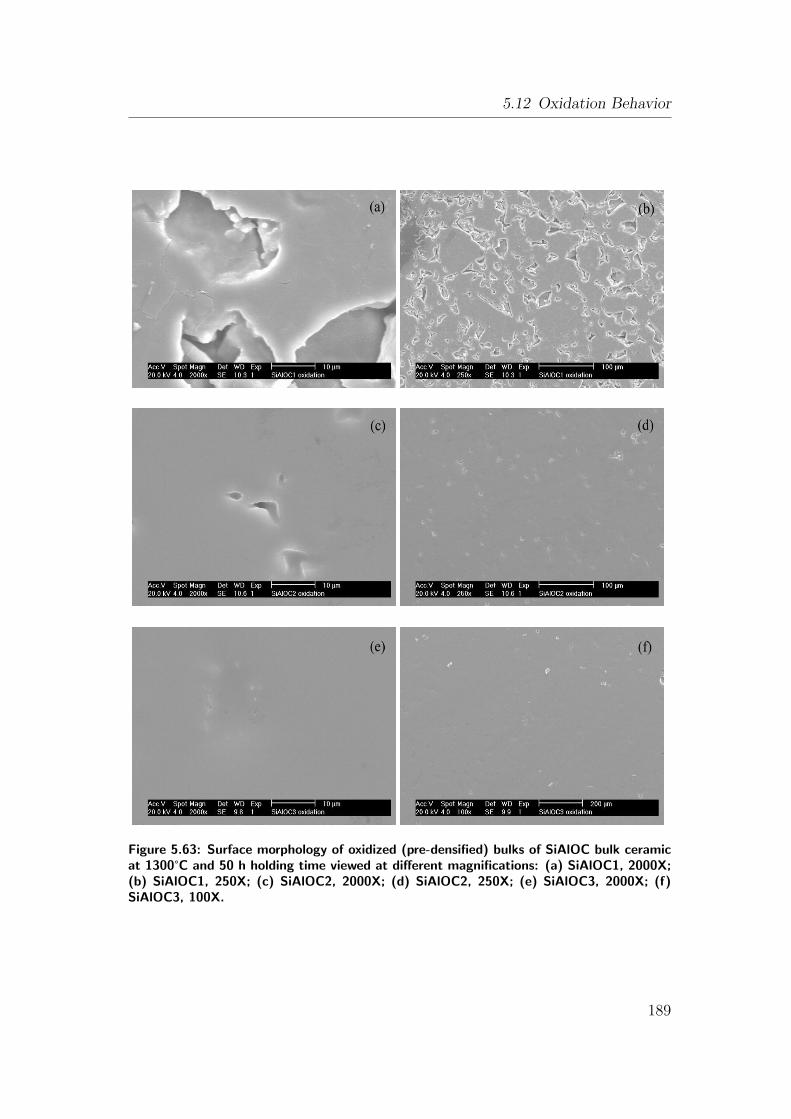
5.12 Oxidation Behavior
Figure 5.63: Surface morphology of oxidized (pre-densified) bulks of SiAlOC bulk ceramicat 1300°C and 50 h holding time viewed at different magnifications: (a) SiAlOC1, 2000X;(b) SiAlOC1, 250X; (c) SiAlOC2, 2000X; (d) SiAlOC2, 250X; (e) SiAlOC3, 2000X; (f)SiAlOC3, 100X.
189
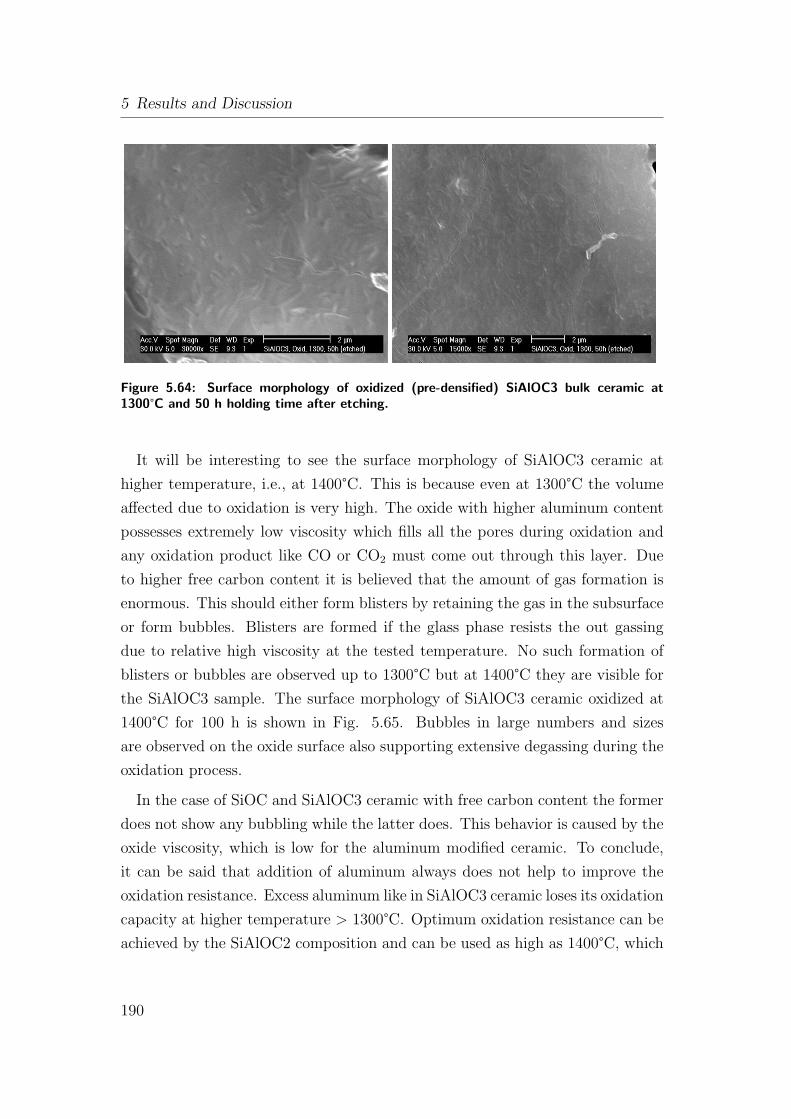
5 Results and Discussion
Figure 5.64: Surface morphology of oxidized (pre-densified) SiAlOC3 bulk ceramic at1300°C and 50 h holding time after etching.
It will be interesting to see the surface morphology of SiAlOC3 ceramic at
higher temperature, i.e., at 1400°C. This is because even at 1300°C the volume
affected due to oxidation is very high. The oxide with higher aluminum content
possesses extremely low viscosity which fills all the pores during oxidation and
any oxidation product like CO or CO2 must come out through this layer. Due
to higher free carbon content it is believed that the amount of gas formation is
enormous. This should either form blisters by retaining the gas in the subsurface
or form bubbles. Blisters are formed if the glass phase resists the out gassing
due to relative high viscosity at the tested temperature. No such formation of
blisters or bubbles are observed up to 1300°C but at 1400°C they are visible for
the SiAlOC3 sample. The surface morphology of SiAlOC3 ceramic oxidized at
1400°C for 100 h is shown in Fig. 5.65. Bubbles in large numbers and sizes
are observed on the oxide surface also supporting extensive degassing during the
oxidation process.
In the case of SiOC and SiAlOC3 ceramic with free carbon content the former
does not show any bubbling while the latter does. This behavior is caused by the
oxide viscosity, which is low for the aluminum modified ceramic. To conclude,
it can be said that addition of aluminum always does not help to improve the
oxidation resistance. Excess aluminum like in SiAlOC3 ceramic loses its oxidation
capacity at higher temperature > 1300°C. Optimum oxidation resistance can be
achieved by the SiAlOC2 composition and can be used as high as 1400°C, which
190
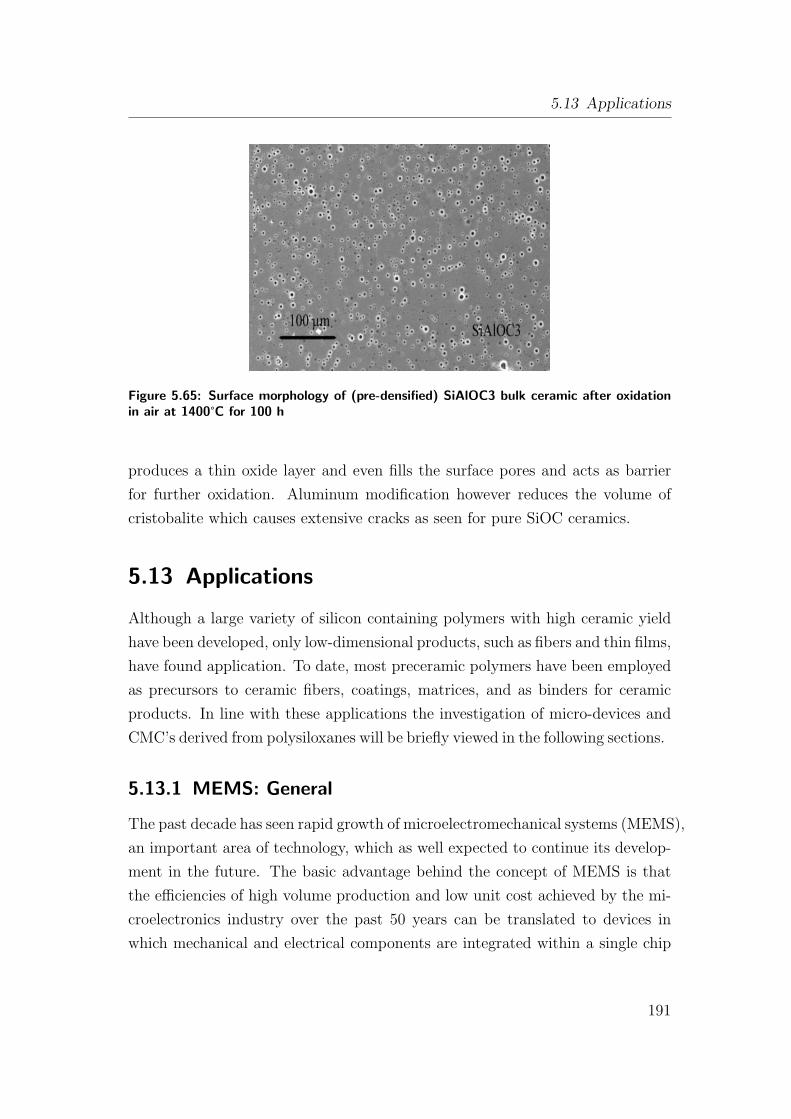
5.13 Applications
Figure 5.65: Surface morphology of (pre-densified) SiAlOC3 bulk ceramic after oxidationin air at 1400°C for 100 h
produces a thin oxide layer and even fills the surface pores and acts as barrier
for further oxidation. Aluminum modification however reduces the volume of
cristobalite which causes extensive cracks as seen for pure SiOC ceramics.
5.13 Applications
Although a large variety of silicon containing polymers with high ceramic yield
have been developed, only low-dimensional products, such as fibers and thin films,
have found application. To date, most preceramic polymers have been employed
as precursors to ceramic fibers, coatings, matrices, and as binders for ceramic
products. In line with these applications the investigation of micro-devices and
CMC’s derived from polysiloxanes will be briefly viewed in the following sections.
5.13.1 MEMS: General
The past decade has seen rapid growth of microelectromechanical systems (MEMS),
an important area of technology, which as well expected to continue its develop-
ment in the future. The basic advantage behind the concept of MEMS is that
the efficiencies of high volume production and low unit cost achieved by the mi-
croelectronics industry over the past 50 years can be translated to devices in
which mechanical and electrical components are integrated within a single chip
191
5 Results and Discussion
or equivalent structure. In addition to the potential economic benefit, unique
capabilities can be achieved by such integration to realize devices at very small
scales such as sensors, actuators, power producing devices, chemical reactors and
biomedical devices.(151)
For these purposes, traditional MEMS are limited by their materials because
silicon and polysilicon is not a structural material. It has a fracture toughness
of ∼ 0.7 MPa√
m, a softening temperature of 600°C and a high degree of reac-
tivity to oxygen and water. The same is true for metals and polymers used in
fabrication techniques derived from LIGA (the acronym stems from the German
expressions for the major process steps: Lithography, Galvanoformung (electro-
forming) and Abformung (molding).(151) Thus, the creation of many new, revolu-
tionary MEMS systems requires that they be constructed from various materials,
including ceramics.
Several attributes of ceramics are highly suitable for MEMS applications. The
chemical inertness of ceramics make them useful in biological application. Ce-
ramics resist corrosion at high temperatures, making them suitable for chemical
engineering and micro-sensor application in severe environments. The same at-
tributes are vital in overcoming problems of friction in micro-motorized systems.
The low density and high-temperature mechanical properties of ceramics make
them materials of choice for high-speed device such as nano-turbines. Because
ceramics are flaw-size sensitive, their strength and reliability can be expected to
increase in small-scale applications.
Although various methods like CVD or micro-machining have already been
developed for fabrication of ceramic MEMS, this techniques can be time con-
suming, expensive, and technically challenging. Moreover, these processes are
used for the development of SiC MEMS. In addition, the planar nature of CVD
SiC makes it difficult to construct complex shaped structures. Therefore, the
development of new materials and low-cost micro fabrication techniques for high
temperature MEMS is of great interest to MEMS community.
Recently SiCN ceramic MEMS have been reported using low cost techniques
like photo-polymerization and micro-forging. Photo polymerization is a low cost
approach to fabricating polymer structures. By adding a photo-initiator to the
liquid precursor, solidification can be accomplished by exposure to UV radiation
rather than by heat addition. Thus by performing photolithography directly
192
5.13 Applications
on the precursor, solid polymer shapes may be obtained without the need of a
mold.(152)
Green form of net shape can also be prepared by micro-forging liquid ceramic
precursor into a mold that has been prepared by conventional methods.(153),(154)
The precursor can be a chemical − for example, a metal organic − or it can be
a slip. In the latter case, the micro-forging process can be considered as a micro
version of the conventional slip-casting process. The present discussion, however,
is limited to the fabrication of a new class of ceramics, namely silicon oxycarbide
(Si-O-C).
5.13.1.1 SiOC Ceramic Micro-Component Feasibility Study
For this particular application, the silicon polymer should have the following
requirements:
1. Sufficient wetting of the micro mold by polymer used to produce a compo-
nent like the micro gear investigated in this study.
2. Solidification of the polymer, e.g., by chemical or thermal cross-linking after
complete filling of the mold to retain the shape of the mold cavity.
3. Easy demolding of the green micro component.
A rheological investigation confirms the aforementioned requirements as shown
by the visco-elastic behavior of the MK polymer with a cross-linking-agent, which
is represented in Fig. 5.10 (refer to page 105). In the present study a steel mold
with micro gear cavities was used. Silicone oil spray was applied as a lubricating
agent for easy release of the green compact. The mold is inserted in a press
cavity and the polymer powder (MK + 1%CLA) is added. The press cavity
is heated at 10°C/min up to 150°C, held at this temperature for 15 min, and
subsequently cooled to room temperature. Mechanically stable green compacts
with micro gears are formed. Green compact thickness is controlled to 0.6−0.7
mm by optimizing the initial polymer mass feed. Bulk SiOC ceramic gears were
obtained after pyrolysis of the green compact in argon atmosphere with 25°C/h
up to 1100°C as can be seen in Fig. 5.66 (bottom). Higher magnification reveals
crack-free and dense ceramic micro-gears.
193
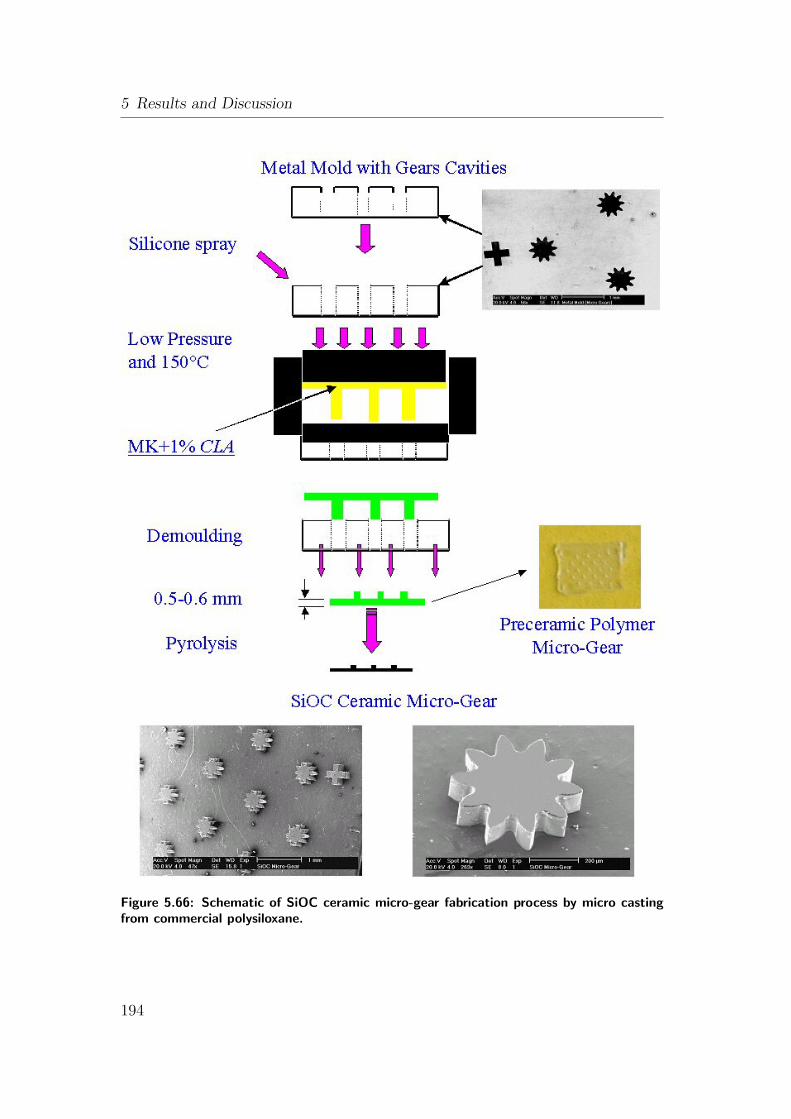
5 Results and Discussion
Figure 5.66: Schematic of SiOC ceramic micro-gear fabrication process by micro castingfrom commercial polysiloxane.
194
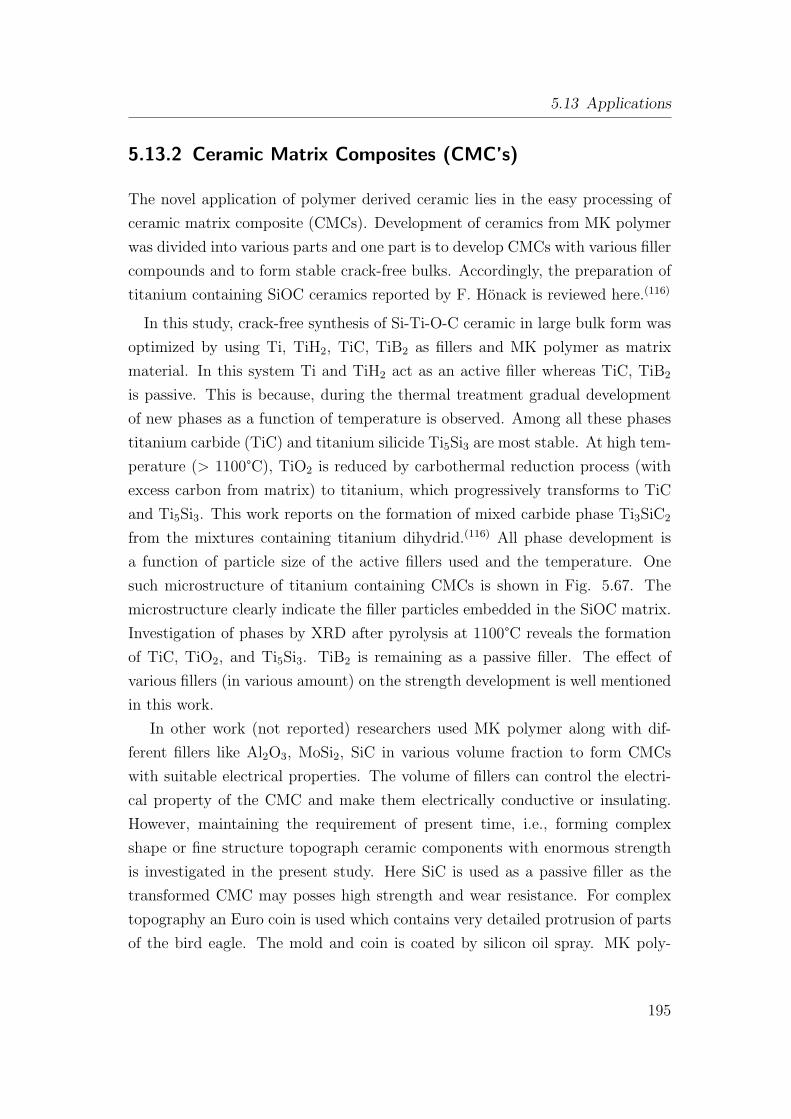
5.13 Applications
5.13.2 Ceramic Matrix Composites (CMC’s)
The novel application of polymer derived ceramic lies in the easy processing of
ceramic matrix composite (CMCs). Development of ceramics from MK polymer
was divided into various parts and one part is to develop CMCs with various filler
compounds and to form stable crack-free bulks. Accordingly, the preparation of
titanium containing SiOC ceramics reported by F. Honack is reviewed here.(116)
In this study, crack-free synthesis of Si-Ti-O-C ceramic in large bulk form was
optimized by using Ti, TiH2, TiC, TiB2 as fillers and MK polymer as matrix
material. In this system Ti and TiH2 act as an active filler whereas TiC, TiB2
is passive. This is because, during the thermal treatment gradual development
of new phases as a function of temperature is observed. Among all these phases
titanium carbide (TiC) and titanium silicide Ti5Si3 are most stable. At high tem-
perature (> 1100°C), TiO2 is reduced by carbothermal reduction process (with
excess carbon from matrix) to titanium, which progressively transforms to TiC
and Ti5Si3. This work reports on the formation of mixed carbide phase Ti3SiC2
from the mixtures containing titanium dihydrid.(116) All phase development is
a function of particle size of the active fillers used and the temperature. One
such microstructure of titanium containing CMCs is shown in Fig. 5.67. The
microstructure clearly indicate the filler particles embedded in the SiOC matrix.
Investigation of phases by XRD after pyrolysis at 1100°C reveals the formation
of TiC, TiO2, and Ti5Si3. TiB2 is remaining as a passive filler. The effect of
various fillers (in various amount) on the strength development is well mentioned
in this work.
In other work (not reported) researchers used MK polymer along with dif-
ferent fillers like Al2O3, MoSi2, SiC in various volume fraction to form CMCs
with suitable electrical properties. The volume of fillers can control the electri-
cal property of the CMC and make them electrically conductive or insulating.
However, maintaining the requirement of present time, i.e., forming complex
shape or fine structure topograph ceramic components with enormous strength
is investigated in the present study. Here SiC is used as a passive filler as the
transformed CMC may posses high strength and wear resistance. For complex
topography an Euro coin is used which contains very detailed protrusion of parts
of the bird eagle. The mold and coin is coated by silicon oil spray. MK poly-
195
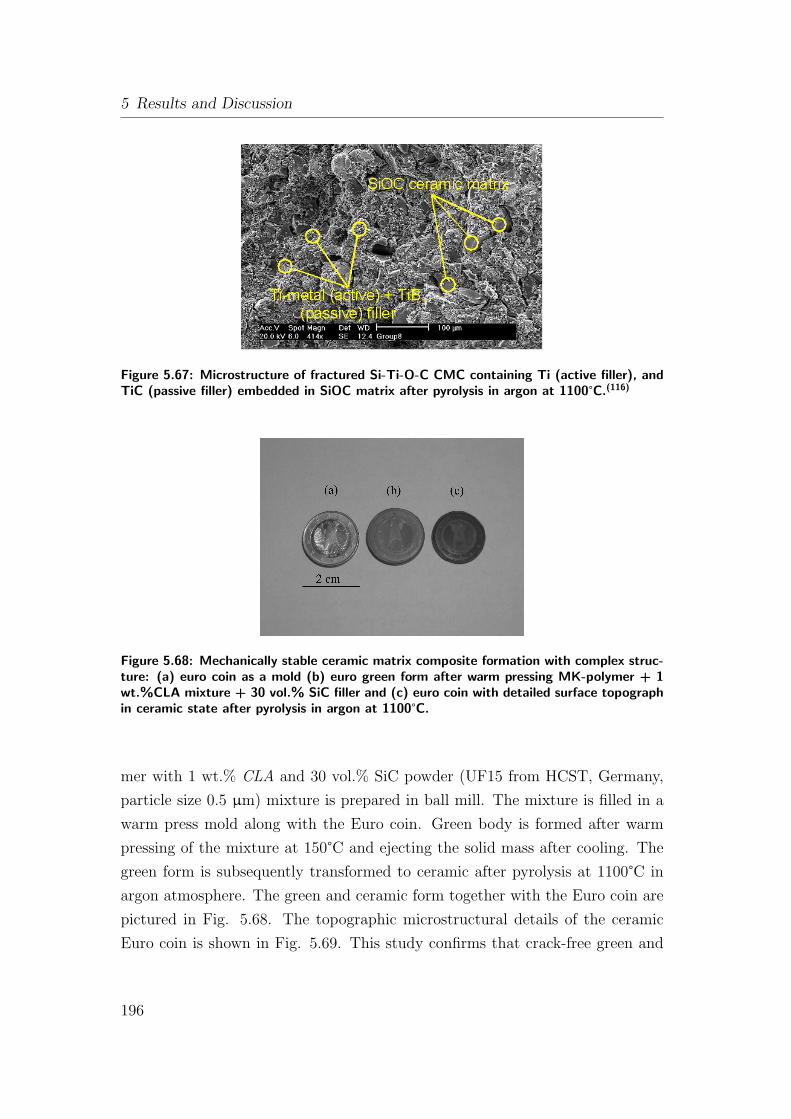
5 Results and Discussion
Figure 5.67: Microstructure of fractured Si-Ti-O-C CMC containing Ti (active filler), andTiC (passive filler) embedded in SiOC matrix after pyrolysis in argon at 1100°C.(116)
Figure 5.68: Mechanically stable ceramic matrix composite formation with complex struc-ture: (a) euro coin as a mold (b) euro green form after warm pressing MK-polymer + 1wt.%CLA mixture + 30 vol.% SiC filler and (c) euro coin with detailed surface topographin ceramic state after pyrolysis in argon at 1100°C.
mer with 1 wt.% CLA and 30 vol.% SiC powder (UF15 from HCST, Germany,
particle size 0.5 µm) mixture is prepared in ball mill. The mixture is filled in a
warm press mold along with the Euro coin. Green body is formed after warm
pressing of the mixture at 150°C and ejecting the solid mass after cooling. The
green form is subsequently transformed to ceramic after pyrolysis at 1100°C in
argon atmosphere. The green and ceramic form together with the Euro coin are
pictured in Fig. 5.68. The topographic microstructural details of the ceramic
Euro coin is shown in Fig. 5.69. This study confirms that crack-free green and
196
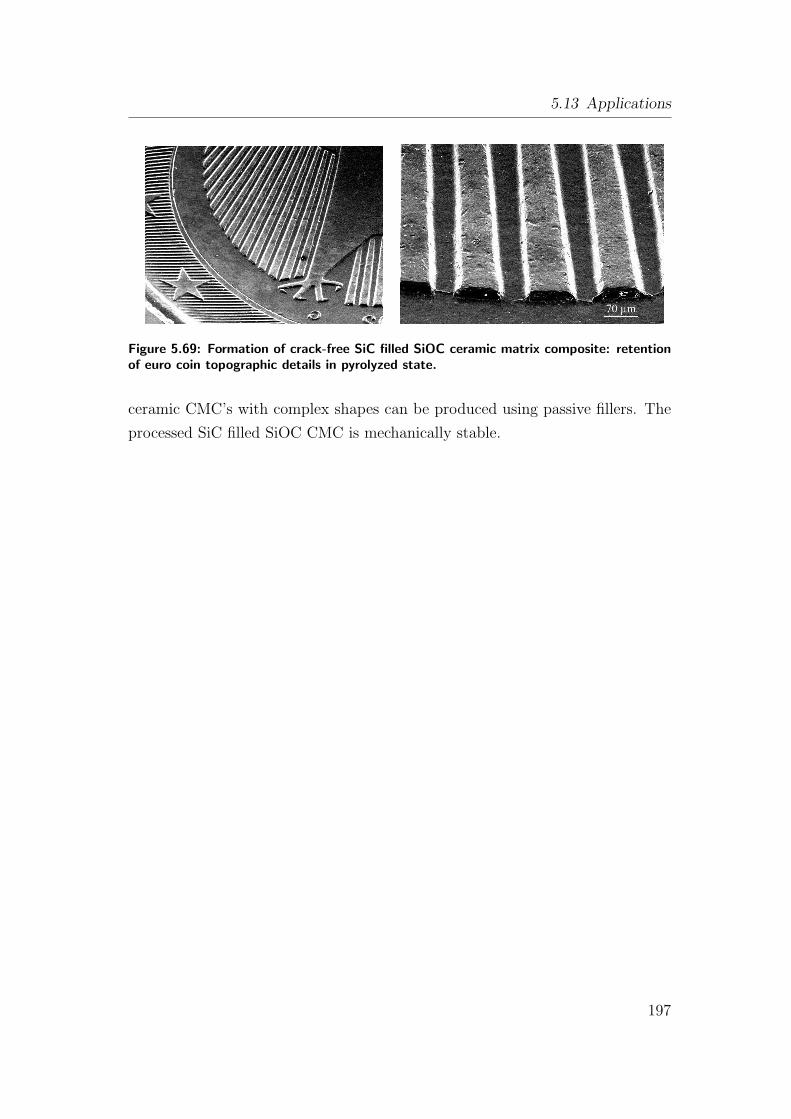
5.13 Applications
Figure 5.69: Formation of crack-free SiC filled SiOC ceramic matrix composite: retentionof euro coin topographic details in pyrolyzed state.
ceramic CMC’s with complex shapes can be produced using passive fillers. The
processed SiC filled SiOC CMC is mechanically stable.
197

5 Results and Discussion
198
6 Conclusions
Preparation of novel ceramic materials through thermal decomposition of pre-
ceramic polymers in controlled atmosphere has been continuously investigated
since the last two decades. In this regard, the oxide systems have potential in-
terest in the high temperature application area for components working under
harsh atmospheric conditions.
The present research is focused on the pyrolysis of unfilled commercial poly(met-
hylsilsesquioxane) and its aluminum modification to form a novel ceramic sys-
tem Si(Al)OC. Among all available commercial polysiloxanes, the investigated
polymer is selected as it gives clean, easy processing advantage and properties
versatile for use in injection molding. Cross-linking of this polymer is shown
to occur thermally and the kinetics of this reaction is accelerated by using a
CLA. Detailed rheological investigation allows optimizing the polymer and CLA
mixture procedure as well as the CLA content. Further, thermal decomposition
process of mixtures with and without CLA is discussed and the presence of CLA
reveals significant rise in the ceramic yield. The weight loss is observed in three
stages of the complete thermal cycle and is due to evaporation of oligomers and
polycondensation products in low temperature region and due to methane and
hydrogen at higher temperature. After polycondensation further transforma-
tion of polymeric mass to an inorganic product is discussed with help of radical
reactions. The commercial polysiloxane CLA mixture can be processed forming
transparent green bodies, which can further convert to an inorganic bulk without
cracks.
As mentioned above one of the aim of this research is to produce SiAlOC ce-
ramic and is fulfilled by a solution route related to the sol-gel technique. The com-
mercial polysiloxane investigated here could be modified into polyaluminosilox-
ane via chemical reaction with aluminum alkoxide. The gelation process is found
to be sensitive with the amount of alkoxide and solvent used. Gelation is shown
199
6 Conclusions
to take place at room temperature if minimum 9 wt.% aluminum alkoxide is used
together with isopropanol as solvent. The ceramic yield is observed to be reduce
with increasing alkoxide content. Also the ceramic composition after polymer-
to-ceramic transformation process reveals a high total carbon content for SiOC.
The amount of carbon decreases with increasing aluminium content. Increasing
the aluminum also reduces the amount of SiC in the ceramic. It is shown that all
Si(Al)OC compositions contain considerable amount of free carbon as quantified
by chemical analysis. Solid state NMR studies confirmed the presence of Si−O
and Si−C bonds in the SiAlOC ceramic. Aluminum is found to be present in all
possible Al-O coordination sites i.e., Al(4), Al(5), and Al(6) with significant oc-
tahedral contribution. The distribution of the coordination sites in the pyrolyzed
samples strongly depends on the aluminum content.
The formation of SiAlOC bulk ceramics without generation of cracks are pos-
sible. In contrast SiOC can only be produced as thin samples from unmodified
polysiloxanes. The reason for cracking in the case of SiOC is related to the
isotropic shrinkage during the polymer-to-ceramic transformation which is not
found for SiAlOC ceramics. The SiAlOC ceramic is not as dense as the SiOC
counterpart and possesses around 3-4% residual porosity.
At high temperature SiOC, ceramics are not stable and crystallize to form
β−SiC at T >1300°C. Crystallization is accompanied by weight loss and cracking
of the samples. In contrast, the SiAlOC ceramic remains amorphous or nano-
crystalline even at 1500°C. It crystallizes to nano mullite and SiC between 1350
to 1600°C and is dependent on the amount of aluminum. Mullite formation
temperature is lowest for high aluminum samples. Crystallization of intermediate
alumina phase is not observed. The SiAlOC ceramics densify between 1200-
1600°C. Densification occurs via transient viscous sintering along with low weight
loss compared to SiOC ceramics. The SiAlOC ceramic does not decompose up
to 1600°C. At higher temperature weight loss occurs due to decomposition of
the network structure.
Bulk SiAlOC ceramics undergo two distinct processes with temperature when
reheated after pyrolysis. These two processes are observed in different non-
overlapping regions as found by kinetic studies. The first process is softening
and structural relaxation and is reflected in continuous deformation of the sam-
ples. At high temperature the deformation is hindered by crystallization. The
200
resistance to deformation increases with the aluminum content. Thus crystalliza-
tion of mullite, which is higher for high aluminum ceramic is discussed to resist
densification. The deformation behavior changes with heating rate and shown
to contain information about activation energy for softening and crystallization.
The activation energy for softening is estimated by Moynihan theory and the
crystallization activation energy is calculated by Kissinger and Moynihan theory.
Accordingly, the activation energy for softening of 403−632 [kJ/mole] is calcu-
lated and is mentioned to be minimum for higher aluminum content. The average
activation energy for crystallization thus estimated is about 503 [kJ/mole]. This
low value along with the crystallization behavior indicates that the material be-
haves like a monophasic system rather than a diphasic or hybrid material.
The softening kinetics discussed above could not confirm the glass transition
temperature for any SiAlOC ceramics as glass transition temperature depends
on the heating rate. Another suitable method to identify glass transition temper-
ature is the calculation of the shear viscosity. Shear viscosity data were derived
from compression creep experiments. The total strain measured in axial and
radial direction is converted to creep strain and sintering/cavitation strain. It
is shown that, the deformation below the glass transition temperature region is
mainly related to creep with small sintering part. The shear viscosities calcu-
lated from this study indicate that the glass transition temperature is highest
(1300°C) for low aluminum ceramic and is lowest (1220°C) for highest aluminum
samples. The shear viscosity for SiAlOC is two order of magnitude higher at
all temperatures compared to silica glass. This is due to the presence of strong
covalent Si−C bonds in the ceramic. Increasing the aluminum content reduces
the viscosity values at all temperatures. The increased defect concentration al-
lows easy flow for high aluminum glass composition. Accordingly, the activation
energy for flow for high aluminum materials is 375 [kJ/mole]. The activation
value for flow is compared to be similar to that calculated for softening of the
matrix. This indicates that same molecular motions are involved in above two
processes.
Oxidation of SiOC ceramics show weight loss at T > 1200°C and times. The
weight loss indicates that free carbon content is contributing more compared to
weight gain from Si−C bonds. Surface morphology of oxide layer shows heavy
cracking and is formed during the cooling cycle by volume change due to cristo-
201
6 Conclusions
balite transformation. In contrast, SiAlOC ceramic always show weight gain at
all oxidation temperatures and times. The oxidation behavior is proved to obey a
parabolic law. Accordingly, the parabolic rate constant of 6.1 x 10⁻² [mg2/cm4h]
is calculated for low aluminum sample which is one order of magnitude higher
than CVD-SiC ceramic. The parabolic rate constants reduce with aluminum con-
tent but it is very sensitive to the thermal history of the sample. Heat-treatment
of the samples indicate that high aluminum samples, which undergo glass tran-
sition during heat-treatment, reduce the specific net weight to low values. Low
aluminum ceramics show carbon gradient in the oxide layer away from the growth
interface and is in agreement with the behavior of SiOC ceramic. The carbon
gradient is not observed for high aluminum material because of low viscosity
oxide layer.
The commercial polysiloxane investigated in this study has find its suitability
in formation of micro-components, namely MEMS. Finally, the polymer can be
ideally used for mass production of ceramic matrix composites with distinguished
electrical, mechanical or high temperature properties.
202
7 Outlook
The main focus of this project is fulfilled by producing bulk Si(Al)OC ceram-
ics and investigating the effect of aluminum modification on the properties like
crystallization, bulk deformation at high temperature and oxidation resistance.
Although this research has set a foundation for the manufacturing of Si(Al)OC
ceramics utilizing polymer technology, future research is needed to built up this
foundation. As such, the following suggestions for future research are given:
1. Si(Al)OC ceramics behave like black glass and can be used as a sintering
additive. Thus, the effect of aluminum concentration on the mechanical
properties of structural bulk material like SiC can be investigated.
2. More focus should be given on producing SiOC ceramic fibers from such low
cost polysiloxanes and should be compared with the properties of Si-C-(O)
Nicalon fibers.
3. The effect of aluminum modification on the mechanical properties like hard-
ness, elastic modulus and electrical properties need to be investigated and
compared with SiOC ceramic in as-pyrolyzed and heat-treated condition.
4. It has been investigated that substitution of oxygen by nitrogen improves
the stability of the material. For example the oxidation resistance of Si-
C-O-N is superior to that of Si-C-O.(96) Thus, the Si-Al-O-C system can
be converted to Si-Al-O-C-N by pyrolyzing the gel system in ammonia or
nitrogen.
5. The above mentioned Si-Al-O-C-N can be further characterized for the
following:
• High temperature stability and crystallization kinetics and phase de-
velopment.
203
7 Outlook
• High temperature compression creep.
• Oxidation kinetics of bulks.
Among all above mentioned suggestions the use of Si(Al)OC ceramic powder as
a glass phase binder is currently under investigation. For this research, the SiOC
ceramic powder from poly(methylsilsesquioxane) and the aluminum modified
SiAlOC ceramic powder will be mixed with SiC and will be hot-pressed/sintered
for bulk processing.
204
Bibliography
[1] K. Wynne and R. Rice. “Ceramics via Polymer Pyrolysis”. Annual Review
Materials, 14, pp. 297–334, 1984.
[2] R. Rice. “Ceramics from Polymer Pyrolysis, Opportunities and Needs - A
Materials Perspective”. Ceramic Bulletin, 62[8], pp. 889–892, 1983.
[3] G Pouskouleli. “Metalorganic Compounds as Preceramic Materials. I. Non-
Oxide Ceramics”. Ceramic International, 15, pp. 213, 1989.
[4] P. Chantrell and P. Popper. “Inorganic Polymers and Ceramics”. Special
Ceramics 1964, edited by P. Popper, New York: Academic, 1964, pp. 87–
104, 1964.
[5] W. Verbeek and G. Winter. “Formkorper aus Siliciumcarbide und Ver-
fahren zu ihrer Herstellung”. German Patent No. 2236078, (Bayer AG), 21
March 1974.
[6] G. Winter, W. Verbeek and M. Mansmann. “Formkorper aus homogenen
Mischungen von Siliciumcarbide und Siliciumnitrid und Verfahren zu ihrer
Herstellung”. German Patent No. 2243527, (Bayer AG), 18 April 1974.
[7] S. Yajima, J. Hayashi and M. Omori. “Continuous Silicon Carbide Fiber
of High Tensile Strength”. Chemistry Letters, 9, pp. 931–934, 1977.
[8] S. Yajima, Y. Hasegawa, K. Okamura and T. Matsuzawa. “Development of
High-Tensile Strength Silicon Carbide Fiber Using an Organosilicon Poly-
mer Precursor”. Nature, 273, pp. 525–527, 1978.
205
Bibliography
[9] S. Yajima, J. Hayashi, M. Omori and K. Okamura. “Development of Silicon
Carbide Fiber with High Tensile Strength”. Nature, 261, pp. 683–685, 1976.
[10] R. Riedel, A. Kienzle, W. Dressler, L. Ruwisch, J. Bill and F. Aldinger.
“A Siliconboron Carbonitride Ceramic Stable to 2000”. Nature, 382, pp.
796–798, 1996.
[11] R. Riedel, H-J. Kleebe, V. Schonfelder and F. Aldinger. “A Covalent
Micro/Nano-Composites Resistant to High Temperature Oxidation”. Na-
ture, 374, pp. 526–528, 1995.
[12] Y. Li, E. Kroke, R. Riedel, C. Fasel, C. Gervais and F. Babon-
neau. “Thermal Cross-Linking and Pyrolytic Conversion of
Poly(ureamethylvinyl)silazanes to Silicon-Based Ceramics”. Applied
Organometallic Chemistry, 15, pp. 820–832, 2001.
[13] E. Kroke, Y. Li, C. Konetschny, E. Lecomte, C. Fasel and R. Riedel.
“Silazane Derived Ceramics and Related Materials”. Mater. Sci. Eng., 26,
pp. 97–199, 2000.
[14] P. Padmaja, G. Anilkumar and K. Warrier. “Formation of Mullite Phase
in Diphasic Gels Consisting of TEOS and Boehmite With and Without
Dehydroxylation”. J. of European Ceramic Soc., 18, pp. 1765–1769, 1998.
[15] D. Treadwell, D. Dabbs and I. Aksay. “Mullite (3Al2O3−2SiO2) Synthesis
with Aluminosiloxanes”. Chemistry of Materials, 8, pp. 2056–2060, 1996.
[16] P. Greil and M. Seibold. “Modelling of Dimensional Changes During
Polymer-Ceramic Conversions”. J.of Material Science, 27, pp. 1053–1059,
1991.
[17] P. Greil. “Active- Filler - Controlled Pyrolysis of Preceramic Polymers”. J.
of American Ceramic Soc., 78[4], pp. 835–848, 1995.
[18] D Carlsson, J. Cooney, S. Gauthier and D. Worsford. “Pyrolysis of Silicon-
Backbone Polymers to Silicon Carbide”. J. of American Ceramic Soc.,
73[2], pp. 237–241, 1990.
206
Bibliography
[19] J. Lipowitz, G. Legrow, T. Lim, and N. Langley. “Silicon Carbide Fibers
From Methylpolysilane (MPS) Polymers”. Ceramic Eng. Sci. Proc., 9[7-8],
pp. 943–948, 1988.
[20] C. Schilling Jr., J. Wesson, and T. Williams. “Polycarbosilane Precursors
for Silicon Carbide”. American Ceramic Society Bulletin, 62[8], pp. 912–
915, 1983.
[21] N. Langley, G. LeGrow and J. Lipowitz. “Properties of Ceramic Fibers
From Orgaosilicon Polymers”. in; Fiber Reinforced Ceramics Composities,
edited by K. Mazdiyasni, New Jersey: Noyes Publications, pp. 63, 1990.
[22] S. Yajima. “Special Heat Resistant Materials From Organometallic Poly-
mers”. American Ceramic Society Bulletin, 62[8], pp. 889–892, 1983.
[23] E. Fitzer and R. Gadow. “Fiber Reinforced Silicon”. American Ceramic
Society Bulletin, 65[2], pp. 326–335, 1986.
[24] W. Schmidt, V. Sukumar, W. Hurley Jr., R. Garcia, R. Doremus, L. In-
terrante and G. Rendlund. “Silicon Nitride Derived From Organometallic
Polymer Precursor: Preparation and Characterization”. J. of American
Ceramic Soc., 73[8], pp. 2412–2418, 1990.
[25] G. LeGrow, T. Lim, J. Lipowitz and R. Reaoch. “Ceramics From Hydri-
dopolysilazanes”. American Ceramic Society Bulletin, 66[2], pp. 363–367,
1987.
[26] D. Seyferth, G. Wiseman and C. Prud’Homme.“A liquid Silazane Precursor
to Silicon Nitride”. J. of American Ceramic Soc., 66, pp. C–13–4, 1983.
[27] D. Seyferth, T. Wood, H. Tracy and J. Robinson. “Near−Stoichiometric
Silicon Carbide from an Economical Polysilane Precursor”. J. of American
Ceramic Soc., 75, pp. 1300–1302, 1992.
[28] B. Walker Jr., R. Rice, P. Becher, B. Bender and W. Coblenz. “Prepa-
ration and Properties of Monolithic and Composite Ceramics Produced
by Polymer Pyrolysis”. American Ceramic Soc. Bulletin, 62, pp. 916–923,
1983.
207
Bibliography
[29] S. Yu. “Net-Shape Formation of Bulk Composite Materials via the Poroly-
sis of Poly(siloxanes) Filled with Chemically Active Titanium and Inactive
Silicon Carbide Fillers”. PhD Thesis, State University of New Jersey, 1996.
[30] S Yajima, T. Iwai, T. Yamamura, K Okamura, and Y. Hasegawa.“Synthesis
of Polytitanocarbosilane and its conversion into Inorganic Compounds”.
J.of Material Science, 16, pp. 1349–1355, 1981.
[31] T. Ishikawa, T. Yamamura and K. Okamura. “Production of Polytitanocar-
bosilane and Its Conversion into Inporanic Materials”. J.of Material Sci-
ence, 27, pp. 6627, 1992.
[32] K. Schwarz, D. Rowcliffe, Y. Blum and R. Laine. “Thermal Conversion
of Preceramic Polysilazanes to Si3N4: Characterization of Pyrolysis Prod-
ucts”. Mat. Res. Soc. Symp. Proc., 73, pp. 407, 1986.
[33] A. Lavedrine, D. Bahloul, P. Goursat, N. Yive, R. Corriu, D. Leclerq,
H. Mutin and A. Vioux. “Pyrolysis of Polyvinylsilazane Precursor to Silicon
Carbonitride”. J. of European Ceramic Soc., 8, pp. 221, 1991.
[34] M. Peuckert, T. Vaahs and M. Bruck. “Ceramics from Organometallic
Polymers”. Adv. Materials, 2, pp. 398, 1990.
[35] D. Seyferth, G. Wiseman, J. Schwark, Y. Yu and C. Poutasse. “Organosil-
icon Polymers as Precursors for Silicon-Containing Ceramics”. American
Ceramic Soc. Symp. Ser., 360, pp. 143, 1987.
[36] D. Seyferth and H. Plenio. “Borosilazane Polymeric Precursors for Borosil-
icon Nitride”. J. of American Ceramic Soc., 73, pp. 2131–2133, 1990.
[37] H. Baldus, O. Wagenr and M. Jansen. “Synthesis of Advance Ceramics in
the System Si-B-N and Si-B-N-C Employing Novel Precursor Compounds”.
Mater. Res. Soc. Sym. Proc., 271, pp. 821, 1992.
[38] F. Hurwitz, P. Heimann, S. Farmer and D. Hembree. “Characterization
of the Pyrolytic Conversion of Polysilsequioxanes to Silicon Oxycarbides”.
J.of Material Science, 28, pp. 6622, 1993.
208
Bibliography
[39] R. Ellis. “Method of Making Electrically Conducting Glass and Articles
Made Thereform”. U.S Patent. 2,556,616, June 1951.
[40] C. Smith and W. Crandall. “Method of Making Carbon Containing
Glasses”. U.S Patent. 3,378,431, 1968.
[41] R. Elmer and H. Meissner. “Increase of annealing point of 96% SiO2 glass
on incorporation of carbon”. J. of American Ceramic Soc., 59[5], pp. 206–
209, 1976.
[42] J. Homeny, G. Nelson and S. Risbud. “Oxycarbide Glasses in the Mg-
Al-Si-O-C System”. J. of American Ceramic Soc., 71[5], pp. 386 – 390,
1988.
[43] D. Coon. “Effect of silicon carbide additions on the crystallization behavior
of a magnesia-lithium-alumina-silica system”. J. of American Ceramic Soc.,
72[7], pp. 1270–1273, 1989.
[44] H. Zhang and C. Pantano. “Synthesis and Characterization of Silocon
Oxycarbide Glasses”. J. of American Ceramic Soc., 73[4], pp. 958–963,
1990.
[45] V. Lavrenko, S. Jones and R. Pampuch. “Petrographic and X-ray Iden-
tification of Phases Formed by Oxidation of Silicon Carbide”. Ceramic
International, 2, pp. 75–76, 1981.
[46] A. Yurkov and B. Polyak. “Contact Phenomenon and Interactions in the
system SiC-SiO2-RxOy in Condensed Matter”. Adv. Ceramic Materials,
31[10], pp. 2729–2733, 1996.
[47] J. Lipowitz, H. Freeman, R. Chen and E. Prack. “Composition and Struc-
ture of Ceramic Fibers Prepared from Polymer Precursors”. Adv. Ceramic
Materials, 2[2], pp. 121–128, 1987.
[48] J. Lipowitz. “Polymer Derived Ceramic Fibers”. Ceramic Bulletin, 70[12],
pp. 1888–1894, 1991.
[49] F. Chi. “Carbon-Containing Monolitic Glasses via the Sol-Gel Process”.
Ceramic Eng. Sci. Proc., 4, pp. 704–717, 1983.
209
Bibliography
[50] F. Babonneau, G. Soraru, G. D’Andrea and S. L. Bois Dire. “Silicon Oxy-
carbide Glasses from Sol-Gel Precursors”. Mat. Res. Soc. Symp. Proc., 271,
pp. 789–794, 1992.
[51] C. Pantano, A. Singh and H. Zhang. “Silicon Oxycarbide Glasses”. J. of
Sol-Gel Science and Technology, 14, pp. 7–25, 1999.
[52] F. Babonneau, L. Bois and J. Livage. “Silicon Oxycarbide via Sol-Gel
Route: Characterization of the Pyrolysis Process”. Journal of Non-
Crystalline Solids, 147/148, pp. 947, 1992.
[53] G. D. Soraru. “Silicon Oxycarbide Glasses from Gels”. J. of Sol-Gel Science
and Technology, 2, pp. 843–848, 1994.
[54] V. Belot, R. Corriu, D. Leclercq, P. Mutin and A. Vioux. “Organosilicon
Gels Containing Silicon-Silicon Bonds, Precursors to Novel Silicon Oxycar-
bide Glasses”. J. of Non-Crystalline Solids, 144, pp. 287–297, 1992.
[55] V. Belot, R. Corriu, D. Leclercq, P. Mutin and A. Vioux. “Thermal Reac-
tion Occuring During Pyrolysis of Cross-Linked Polysilazane Gels, Precur-
sors to Silicon Oxycarbide Glasses”. J. of Non-Crystalline Solids, 147/148,
pp. 52–55, 1992.
[56] G. M. Renlund and S. Prochazka. “Silicon Oxycarbide Glasses: Part I.
Preparation and Chemistry”. J. of Material Research, 6[12], pp. 2716–
2722, 1991.
[57] R. Wills, R. Markle and S. Mukherjee. “Siloxanes, Silanes , and Silazanes
in the Preparation of Ceramics and Glasses”. Ceramic Bulletin, 62[8], pp.
904–915, 1983.
[58] A. Wilson, G. Zank, K. Eguchi, W. Xing, B. Yates and J. Dahn. “Polysilox-
ane Pyrolysis”. Chemistry of Materials, 9, pp. 1601–1606, 1997.
[59] E. Radovanovic, M. Gozzi, M. Goncalves and I. Yoshida. “Silicon Oxycar-
bide Glasses from Silicone Networks”. J. of Non-Crystalline Solids, 248,
pp. 37–48, 1999.
210
Bibliography
[60] J. Brus, F. Kolar, V. Machovic and J. Svıtilova. “Structure of
Silicon Oxycarbide Glasses Derived From Poly(methlysiloxane) and
Poly[methly(phenyl)siloxane] Precursor”. J. of Non-Crystalline Solids, 289,
pp. 62–74, 2001.
[61] P. Mutin. “Role of Redistribution Reaction in the Polymer Route to Silicon-
Carbon-Oxygen Ceramics”. J. of American Ceramic Soc., 85[5], pp. 1185–
1189, 2002.
[62] G Soraru, D’Andrea, G, R Campostrini, F Babonneau, and G. Mariotto.
“Structural Characterization and High- Temperature Behavior of Silicon
Oxycarbide Glasses Prepared from Sol-Gel Precursors Containing Si-H
Bonds”. J. of American Ceramic Soc., 78[2], pp. 379–387, 1995.
[63] H. Kleebe, C. Turquat and G. Soraru. “Phase Seperation in an SiCO
Studied by Transmission Electron Microscopy and Electron Energy Loss
Spectroscopy”. J. of American Ceramic Soc., 84[5], pp. 1073–1080, 2001.
[64] K. Kaneko and K. Kakimoto. “HRTEM and ELNES analysis of
Polycarbsilane-Derived Si-C-O Bulk Ceramics”. J. of Non-Crystalline
Solids, 270, pp. 181–190, 2000.
[65] G. Soraru, E. Dallapiccola and G. D’Andrea. “Mechanical Characterization
of Sol-Gel Derived Silicon Oxycarbide Glasses”. J. of American Ceramic
Soc., 79[8], pp. 2074–2080, 1996.
[66] G. M. Renlund and S. Prochazka. “Silicon Oxycarbide Glasses: Part II.
Structure and Properties”. J. of Material Research, 6[12], pp. 2723–2734,
1991.
[67] K Schwartz, and D. Roweliffe. “Modelling Density Contribution in Pre-
ceramic Polymer/Ceramic Powder Composites”. J. of American Ceramic
Soc., 69[5], pp. C–106–108, 1986.
[68] T Erny, M Seibold, O Jarchow and P. Greil. “Microstructure Develop-
ment of Oxycarbide Composites During Active-Filler-Controlled Polymer
Pyrolysis”. J. of American Ceramic Soc., 76, pp. 207, 1993.
211
Bibliography
[69] G. Soraru, H. Kleebe, R. Ceccato and L. Pederiva and. “Development of
mullite-SiC nanocomposites by pyrolysis of filled polymethylsiloxane gels”.
J. of the European Ceramic Society, 20, pp. 2509–2517, 2000.
[70] T. Michalet, M. Parlier, F. Beclin, R. Duclos and J. Crampon. “Elabo-
ration of Low Shrinkage Mullite by Active Filler Controlled Pyrolysis of
Siloxanes”. J. of European Ceramic Soc., 22, pp. 143–152, 2002.
[71] D Seyferth, N Brysob, D Workman, and C. Sobon. “Preceramic Polymers
as Reagents in the Preparation of Ceramics”. J. of American Ceramic Soc.,
74, pp. 2687, 1991.
[72] F. Babonneau and G. Soraru. “Synthesis and Characterization of Si-Zr-C-
O Ceramics from Polymer Precursors”. J. of European Ceramic Soc., 8,
pp. 29–34, 1991.
[73] F. Babonneau, G. Soraru, K. Thorne and J. Mackenzie. “Chemical Char-
acterization of Si-Al-C-O Precursor and Its Pyrolysis”. J. of American
Ceramic Soc., 74[7], pp. 1725–1728, 1991.
[74] G. Soraru, N. Dallabona, C. Gervais and F. Babonneau. “Organically
Modified SiO2 -B2O3 Gels Displaying a High Content of Borosiloxane (≡B-O-Si ≡) Bonds”. Chemistry of Materials, 11, pp. 910–919, 1999.
[75] G. Soraru, F. Babonneau, S. Maurina and J. Vicens. “Sol- Gel Synthesis
of SiBOC Glasses”. Journal of Non-Crystalline Solids, 224, pp. 173–183,
1998.
[76] G. Soraru, M. Mercadini, R. Maschio, F. Taulelle, and F. Babonneau.
“Si-Al-O-N Fibers from Polymeric Precursor: Synthesis, Structural, and
Mechanical Characterization”. J. of American Ceramic Soc., 76[10], pp.
2595 – 2600, 1993.
[77] A. Wootton, M. Rappensberger, M. Lewis, S. Kitchin, A. Howes and
R. Dupree. “Structural Properties of Multi-Component Silicon- Oxycarbide
Glasses Derived from Metal Alkoxide Precursors”. J. of Non-Crystalline
Solids, 204, pp. 217–227, 1996.
212
Bibliography
[78] H. Yinnon and D. Uhlmann. “Applications of Thermoanalytical Techniques
to the Study of Crystallizaiton Kinetics in Glass-Forming Liquids, Part
I:Theory”. J. of Non-Crystalline Solids, 54, pp. 253–262, 1983.
[79] C. Moynihan, A. Easteal, J. Wilder and J. Tucker. “Dependence of the
Glass Transition Temperature on Heating and Cooling Rate”. J. of Physical
Chemistry, 78, pp. 2673–2677, 1974.
[80] T. Rouxel, G. Soraru and J. Vicens. “Creep Viscosity and Stress Relaxation
of Gel-Derived Silicon Oxycarbide Glasses”. J. of American Ceramic Soc.,
84[5], pp. 1052–1058, 2001.
[81] J Costello and R. Tressler. “Oxidation Kinetics of Hot-Pressed Sintered
α-SiC”. J. of American Ceramic Soc., 64[6], pp. 327–331, 1981.
[82] E. Deal and S. Grove. “General Relationship for the Thermal Oxidation of
Silicon”. Journal of Applied Physics, 36[12], pp. 3770–3778, 1965.
[83] K. Luthra. “Some New Perspectives on Oxidation of Silicon Carbide and
Silicon Nitride”. J. of American Ceramic Soc., 74[5], pp. 1095– 1103, 1991.
[84] J. Costello and R. Tressler. “Oxidation of Silicon Carbide Crystals and
Ceramics: I, In Dry Oxygen”. J. of American Ceramic Soc., 69[9], pp.
674–681, 1986.
[85] K. Motzfeld. “On the Rates of Oxidation of Silicon and Silicon Carbide in
Oxygen and Correlateion with Permeability od Silica Glass”. Acta Chem.
Scand., 18[7], pp. 1596–1606, 1964.
[86] Z. Zheng, R. Tressler and K. Spear. “Oxidation of Single-Crystal Silicon
Carbide, Part I. Experimental Studies”. J. Electrochem. Soc., 137[3], pp.
854–858, 1990.
[87] Z. Zheng, R. Tressler and K. Spear. “Oxidation of Single-Crystal Silicon
Carbide”. J. Electrochem. Soc., 137[9], pp. 2812–2816, 1990.
[88] K. Luthra and H. Park. “Oxidation of Silicon Carbide−Reinforced
Oxide−Matrix Composites at 1375°C to 1575°C”. J. of American Ceramic
Soc., 73[4], pp. 1014–1023, 1990.
213
Bibliography
[89] A. Heurer, L. Ogbuji and T. Mitchell. “The Microstructure of Oxide Scale
on Oxidized Si and SiC Single Crystals”. J. of American Ceramic Soc.,
63[5-6], pp. 354–355, 1980.
[90] S. Singhal and F. Lange. “Effect of Alumina Content on the Oxidation of
Hot-Pressed Silicon Carbide”. J. of American Ceramic Soc., 58[9-10], pp.
433–435, 1975.
[91] J. Costello, R. Tressler and I. Tsong. “Boron Redistribution in Sintered
α-SiC During Thermal Oxidation”. J. of American Ceramic Soc., 64[6],
pp. 332–335, 1981.
[92] N. Jacobson. “Corrosion of Silicon Based Ceramics in Combustion Envi-
ronments”. J. of American Ceramic Soc., 76[1], pp. 13–28, 1993.
[93] J. Fergus and W. Worrell. “Effect of Carbon and Boron on the
High−Temperature Oxidation of Silicon Carbide”. J. of American Ceramic
Soc., 78[7], pp. 1961–1964, 1995.
[94] H. Choi, J. Lee and Y. Kim. “Oxidation Behavior of Liquid-Phase Sintered
Silicon Carbide with Aluminum Nitride and Rare-Earth Oxides (Re2O3),
where Re = Y, Er, Yb)”. J. of American Ceramic Soc., 85[9], pp. 2281–
2286, 2002.
[95] E. Bouillon, F. Langlais, R. Pailler, R. Naslain, F. Cruege, P. Huong,
J. Sarthou, A. Deppuech, C. Laffon, P. Lagarde, M. Monthioux and
A. Oberlin. “Conversion Mechanism of a Polycarbosilane Precursor into
an SiC−Based Ceramic Material”. J.of Material Science, 26, pp. 1333–
1345, 1991.
[96] G. Chollon. “Oxidation Behavior of Ceramic Fibers from the Si−C−N−O
System and Related Sub−System”. J. of European Ceramic Soc., 20, pp.
1959–1974, 2000.
[97] C. Ramberg, K. Spear, R. Tressler and Y. Chinone. “Oxidation Behavior of
CVD and Single Crystal SiC”. Journal of Electrochem. Soc., 1100, 142[11],
pp. L214–L216, 1995.
214
Bibliography
[98] C. Ramberg, G. Crutiani and R. Tressler. “Passive Oxidation Kinetics
of High Purity Silicon Carbide from 800°C to 1100°C”. J. of American
Ceramic Soc., 79[11], pp. 2897–2911, 1996.
[99] C. Brewer, D. Bujalski and V. Parent. “Insights into the Oxidation Chem-
istry of SiOC Ceramics Derived from Silsesquioxanes”. J.of Sol-Gel Science
and Technology, [14], pp. 49–68, 1999.
[100] I. Hasegawa, T. Nakamura and M. Kajiwara. “Synthesis of Continuous
Silicon Carbide−Titanium Carbide Hybrid Fibers Through Sol-Gel Pro-
cessing”. Mater. Res. Bull., 31[7], pp. 869–875, 1996.
[101] T. Yamamura. “Development of New Continuous Si-Ti-C-O Fiber Using an
Organometallic Polymer Precursor”. J.of Material Science, 23, pp. 2589–
2594, 1988.
[102] T. Ishikawa. “SiC Polycrystalline Fiber and its Fiber-Bonded Ceramic”.
Ann. Chim. Sci. Mat., 25, pp. 517–522, 2000.
[103] K. Sato, T. Suzuki, O. Funayama and T. Isoda. “Preparation of Carbon
Fiber Reinforced Composite by Impregnation with Perhydropolysilazane
Followed by Pressureless Firing”. Ceram. Eng. Sci. Proc., 13[9-10], pp.
614–621, 1992.
[104] Allied Signal Inc. “Promotional Literature on BlackglassTM”.
[105] F. Hurwitz, J. Gyekenyesi and P. Conroy. “Polymer Derived Nicalon/Si-
C-O Composites Processing and Mechanical Behavior”. Ceram. Eng. Sci.
Proc., 10[7-8], pp. 750–763, 1989.
[106] J. Haggerty and Y. Chiang. “Reaction-Based Processing Methods for Ce-
ramics and Composites”. Ceram. Eng. Sci. Proc., 11[7-8], pp. 757–781,
1990.
[107] F. Hurwitz, P. Heimann, , J. Gyekenyesi, J. Manovi and X. Bu. “Polymeric
Routes to Silicon Carbide and Silicon Oxycarbide CMC”. Ceram. Eng. Sci.
Proc., 12[7-8], pp. 1293–1303, 1991.
215
Bibliography
[108] P. Heimann, F. Hurwitz, D. Wheeler and J. Eldridge. “Preceramic Poly-
mers for Use as Fiber Coatings”. Ceram. Eng. Sci. Proc., 16[4], pp. 417–423,
1995.
[109] K. Ueno, S. Kose and M. Kinoshita. “Toughness Enhancement by Polycar-
bosilane Coating on SiC Whiskers Incorporated in Si3N4 Matrix Compos-
ites”. J.of Material Science, 28, pp. 5770–5774, 1993.
[110] J. Bill and D. Heimann. “Polymer-Derived Ceramic Coatings on C/C-SiC
Composites”. J. of European Ceramic Soc., 16, pp. 1115–1120, 1996.
[111] R. Harshe. “Preparation of Si(B)CN Coating on Carbon-Carbon Composite
Material By Dip-Coating and Polymer Pyrolysis.”. Master Project Thesis,
[Unpublished], 2000.
[112] B. Lawn and V. Howes. “Elastic Recovery at Hardness Indentations”. Jour-
nal of Material Science, 16, pp. 2745–2752, 1981.
[113] G. Socrates. “Infrared characteristic group frequencies tables and charts”.
II Edition, J. Wiley & Sons, 1994.
[114] R. Beyreuther and R. Vogel. “Spinnability of Polymer Melts”. International
Polymer Processing, XI[2], pp. 154–156, 1996.
[115] T. Erny. “Herstellung, Aufbau und Eigenschaften polymer abgeleiteter Ver-
bundkeramik des Ausgangssystems MeSi2/Polysiloxane”. Diss. Universitat
Erlangen Nurnberg, VDI Verlag, 1996.
[116] F. Honack. “SiOC − Keramiken mit titanhaltigen Fullstoffen”. Diss. Uni-
versitat Darmstadt, WP Verlag, 2003.
[117] P. Lespade, A. Marchand, M. Couzi and F. Cruege. “Characterization of
Carbonaceous Materials by Raman Microspectroscopy”. Carbon, 23[[4-5]],
pp. 375–385, 1984.
[118] D. Knight and W. White. “Characterization of Carbon Films by Raman
Spectroscopy”. Journal of Material Research, 4[[2]], pp. 385–393, 1989.
216
Bibliography
[119] A. Putnis. “Introduction to Mineral Sciences”. Cambridge University Press,
[ISBN 0 521 41922 0], pp. 86, 1992.
[120] J. Mcmanus, S. Ashbrook, K. Mackenzie and S. Wimperis. “27Al Multiple-
Quantum MAS and 27Al(1H) CPMAS NMR Study of Amorphous Alumi-
nosilicates”. J. of Non-Crystalline Solids, 282, pp. 278–290, 2001.
[121] S. Komarneni, R. Roy, C. Fyfe, G. Kennedy and H. Strobl. “Solid-State27Al and 29Si Magic-Angle Spinning NMR of Aluminosilicate Gels”. J. of
American Ceramic Soc., 69[3], pp. C–42–C–44, 1986.
[122] K. Kakimoto, F. Wakai, J. Bill and F. Aldinger. “Synthesis of Si-C-O Bulk
Ceramics with Various Chemical Compositions from Polycarbosilane”. J.
of American Ceramic Soc., 82[9], pp. 2337–2341, 1999.
[123] C. Turquat, H. Kleebe, G. Gregori, S. Walter and G. Soraru. “Transmis-
sion Electron Microscopy and EELS Study of Nonstoichiometric Silicon-
Carbon-Oxygen Glasses”. J. of American Ceramic Soc., 84[10], pp. 2189–
2196, 2001.
[124] J. Jean and T. Gupta. “Alumina as Divitrification Inhibitor during Sinte-
riang of Borosilicate Glass Powders”. J. of American Ceramic Soc., 76[8],
pp. 2010–1016, 1993.
[125] Y. Imanaka, S. Aoki, N. Kamehara and K. Niwa. “Cristobalite Phase
Formation in Glass/Ceramic Composites”. J. of American Ceramic Soc.,
78[5], pp. 1265–1271, 1993.
[126] M. Sacks, N. Bozkurt and G. Scheiffele. “Fabrication of Mullite and Mullite-
Matrix Composites by Transient Viscous Sintering of Composites Powders”.
J. of American Ceramic Soc., 74[10], pp. 2428–2437, 1991.
[127] H. Morikawa, S. Miwa, M. Miyake, F. Marumo and S. Toshiyuki. “Struc-
tural Analysis of SiO2−Al2O3 Glasses”. J. of American Ceramic Soc., 65[2],
pp. 78–81, 1982.
[128] D. Cassidy, J. Woolfrey, J. Bartlett and B. Ben-Nissan. “The Effect of
Precorsor Chemistry on the Crystallization and Densification of Sol−Gel
217
Bibliography
Derived Mullite Gels and Powders”. J. of Sol-Gel Science and Technology,
10, pp. 19–30, 1997.
[129] D. Li and W. Thomson. “Mullite Formation Kinetics of a Single−Phase
Gel”. J. of American Ceramic Soc., 73, pp. 964–969, 1990.
[130] T. Takei, Y. Kameshima, A. Yasumori and K. Okada. “Crystallization
Kinetics of Mullite from Al2O3−SiO2 Glasses under Non-Isothermal Con-
ditions”. J. of European Ceramic Soc., 21, pp. 2487–2493, 2001.
[131] W. Wei and W. Halloran. “Transformaiton Kinetics of Diphasic Alumi-
nosilicate Gels”. J. of American Ceramic Soc., 71, pp. 581–587, 1988.
[132] J. Huling and G. Messing. “Epitactic Nucleation of Spinel in Aluminosili-
cate Gels and its Effect on Mullite Crystallization”. J. of American Ceramic
Soc., 74, pp. 2374–2381, 1991.
[133] D. Li and W. Thomson. “Mullite Formation from Non-stoichiometric
Diphasic Precursors”. J. of American Ceramic Soc., 74, pp. 2383–2387,
1991.
[134] J. S. Lee and S. C. Yu. “Mullite Formation Kinetics of Coprecipitated
Al2O3−SiO2 Gels”. Mater. Res. Bull., 27, pp. 405–416, 1992.
[135] A. Gualtieri, M. Bellotto, G. Artioli and S. Clark. “Kinetic Study of the
Kaolinite-Mullite Reaction Sequence. Part II: Mullite Formation”. Phys.
Chem. Miner, 22, pp. 215–222, 1995.
[136] A. Boccaccini, T. Khalil and M. Bruker. “Activation Energy for the Mulli-
tization of a Diphasic Gel Obtained from Fumed Silica and Boehmite Sol”.
Mater. Letter, 38, pp. 116–120, 1999.
[137] T. Takei, Y. Kameshima, A. Yasumori and K. Okada. “Crystallization Ki-
netics of Mullite in Alumina - Silica Glass Fiber”. J. of American Ceramic
Soc., 82, pp. 2876–2880, 1999.
[138] C. Brinker and G. Scherer. “Sol−Gel Science”. Academic Press, Inc., [ISBN
0-12-134970-5], pp. 557–562, 1990.
218
Bibliography
[139] T. Rouxel, G. Massouras and G Soraru. “High Temperature Behavior of a
Gel-Derived SiOC Glass: Elasticity and Viscosity”. J. of Sol-Gel Science
and Technology, [14], pp. 87–94, 1999.
[140] M. Rahman, L. DeJonghe and R. Brook. “The Effect of Shear Stress on
Sintering”. Lawrence Berkeley Laboratory, University of California; Berke-
ley[Rept. No. 18706], Nov.1984.
[141] M. Rahman and L. DeJonghe. “Sintering Under Low Applied Stress:CdO”.
Lawrence Berkeley Laboratory, University of California; Berkeley[Rept. No.
18049], July,1984.
[142] K. Venkatachari and R. Raj. “Shear Deformation and Densification of
Powder Compacts”. J. of American Ceramic Soc., 69[6], pp. 499–506,
1986.
[143] R. Raj. “Separation of Cavitational−Strain and Creep−Strain during De-
formation”. Communication of the American Ceramic Society, C−46, 1982.
[144] R. Doremus. “Viscosity of Silica”. Journal of Applied Physics, 92[[12]], pp.
7619–7629, 2002.
[145] G. Urbain, Y. Bottinga and P. Richet. “Viscosity of Liquid Silica, Silicates
and Alumino−Silicates”. Geochimica et Cosmochimica Acta, 46, pp. 1061–
1072, 1982.
[146] J. Gilman. “Flow via Dislocation in Ideal Glasses”. J. of Applied Physics,
44[[2]], pp. 675–679, 1973.
[147] O. Narayanaswamy and. “A Model of Structural Relaxation in Glass”. J.
of American Ceramic Soc., 54, pp. 491–98, 1971.
[148] C. Moynihan, S. Lee, M. Tatsumisagoo and T. Ninami. “Estimation of
Activation Energies for Structural Relaxation and Viscous Flow from DTA
and DSC Experiments”. Thermochim. Acta, 280/281, pp. 153–62, 1996.
[149] H. Lopez and W. Phoomiphakdephan. “High Temperature Oxidation of
Nitride Bonded SiC-Ceramic”. Materials Letters, [36], pp. 65–69, 1998.
219
Bibliography
[150] D. Mieskowski, T. Mitchell and A. Heuer. “Bubble Formation in Oxide
Scales of SiC”. J. of American Ceramic Soc., 67[1], pp. C17–C18, 1984.
[151] S. Spearing. “Materials Issues in Microelectromechanical Systems
(MEMS)”. Acta Mater., 48, pp. 179–196, 2000.
[152] L. Liew, R. Luo, Y Liu, W. Zhang, L. An, V. Bright, M. Dunn, J. Daily
and Rishi Raj. “Fabrication of Multi-Layered SiCN Ceramic MEMS Using
Photo-Polymerization of Precursor”.
[153] L. Liew, R. Luo, Y Liu, W. Zhang, L. An, V. Bright, M. Dunn, J. Daily
and Rishi Raj. “Fabrication of SiCN MEMS Structures Using Microforged
Molds”.
[154] L. Liew, W. Zhang, L. An, S. Shah, R. Luo, Y. Liu, T. Cross, M. Dunn,
V. Bright, J. Daily and Rishi Raj. “Ceramic MEMS”. American Ceramic
Society Bulletin, [80], pp. 25–30, 2000.
220
8 Vita, Conferences/Publications
and Awards
Educational Background
Master of Technology (M.Tech) (1998-2000): Master’s In Metallurgical
Engineering (Materials Technology) from Indian Institute of Technology (IIT),
Madras, India.
CGPA for Master’s: 9.69/10 (First in Materials Technology)
Bachelor (B.E) (1990-1995): Metallurgical Engineering with first class and
Distinction (76%) from College of Engineering Pune, India.
Awards and Achievements
• Stood first in Master’s course at Indian Institute of Technology (IIT),
Madras and received a Gold Medal for best academic record.
• Recipient of Deutscher Akademischer Austauschdienst (DAAD) scholarship
for research in Germany at TU-Darmstadt as part of an exchange program
between IIT Madras, India and German institutes.
• Rank holder in Bachelor of Engineering (Pune University) program for
Metallurgical Engineering.
• Best Poster Award (2nd Place) at CONCIM 2003 “Conference on non-
crystalline inorganic materials synthesis structure modelling”, University
of Bonn, Germany.
221
8 Vita, Conferences/Publications and Awards
Publication
“Amorphous Si(Al)OC Ceramic from Polysiloxanes: Bulk Ceramic Processing,
Crystallization Behavior and Applications”, Journal of European Ceramic Soc.,
24, [12], 3465-3470, 2004.
International Conferences
• 26th Annual Cocoa Beach Conference and Exposition on Advance Ceramics
and Composites, Held in Feb 2002, Cocoa Beach, Florida, USA.
Presentation Title: Synthesis and Characterization of Novel Si-(Al)-C-O
Bulk Ceramics with Various Chemical Compositions.
• Annual Meeting and Exposition of the American Ceramic Society, Saint
Louis, USA, Held in April 2002.
Presentation Title: Processing and Oxidation Behavior of Polysiloxane-
Derived Si(M)CO (M = Al, Mo, MoSi2) Ceramics.
• Advanced Research Workshop: Engineering Ceramics 2003, Held in May
2003, at Smolenice Castle, Slovakia. Presentation Title: Si(Al)CO
Amorphous Bulk Ceramics from Commercial Polysiloxanes by Polymer Py-
rolysis: Oxidation, Crystallization Behavior and Applications.
• CONCIM 2003: Poster Presentation: “Conference on non-crystalline in-
organic materials synthesis structure modelling”, University of Bonn, Ger-
many.
222


