Embed Size (px)
Citation preview
Synthesis and characterization of extended rod thermotropic polyesters with polyoxyethylene pendant substituents
Robert W. Lenz*, Akira Furukawa% Pradip Bhowmik$, Raul O. Garay and Jerczy Majnusz§ Polymer Science and Engineering Department, University of Massachusetts. Amherst, MA 01003, USA (Received 9 May 1990; revised 18 June 1990; accepted 19 June 1990)
The liquid crystalline properties of a series of aromatic polyesters prepared from alkoxy 'and alkoxyethyleneoxy-substituted hydroquinone monomers and either terephthaloyl chloride or diphenyl terephthalate were studied by optical and thermal methods. The melting temperatures of these polymers were considerably less than the corresponding polymers with n-alkyl substituents with the same number of atoms in the pendant substituent group on the hydroquinone ring. The melting temperature decreased in an exponential manner with the increase in the number of atoms in the alkoxy substituents, and at some temperature above their melting transition, a transition from a highly threaded liquid crystalline texture to a highly birefringent schlieren liquid crystalline texture was observed to occur for all polymers. All polymers except one were also observed to become homeotropic at elevated temperatures. When cooled from the homeotropic melts, a nematic glass was observed to form for the majority of polymers. Two polymers, on cooling from homeotropic melts to room temperature, showed optical textures representative of Williams domains which formed without the application of any electrical field.
(Keywords: synthesis; characterization; extended rod polymers; thermotropic polymers; polyester)
I N T R O D U C T I O N
Considerable attention has been given in this and other laboratories to the effects of the type and length of flex- ible spacer units placed along the polymer chain backbone on the liquid crystalline (LC) properties of thermotropic polyesters 1'2. In earlier studies, we com- pared the LC properties of two series of main chain polyesters of the following general structure in which R is the flexible spacer consisting of either polymethylene or polyethyleneoxy units 3'4.
t O 0 0 0 t II ,~. II ,.~ 11 ,~. I c o-@--oc o-0'- co--o,-co-R
Series h R = -('CH2~-n
Series I1: R = ~ ; H 2 CH20~ 'n
All of the series I polymers formed only a single LC phase. Those with spacers having up to seven methylene groups formed a phase which alternated between either a smectic or a nematic phase on melting, while all of those with 8-12 methylene groups formed only smectic
* To whom correspondence should be addressed t Present address: Mitsubishi Paper Mills Ltd, Tsukuba, Japan :~ Present address: Department of Chemistry, University of Detroit, MI, USA § Present address: Institute of Physical Chemistry and Technology of Polymers, Silesian Institute of Technology, Gliwice, Poland
pha.ses 3. The isotropization temperatures, Ti, of these polymers showed a decreasing trend with an odd-even effect in the decrease of T~ with increasing length of the flexible spacer up to n = 9 in R, as is often observed for such polymers 5-7. Above this value of n, however, Ti increased for the n = 10 and 12 polymers.
The LC properties of the polymers of series II, with the ethyleneoxy flexible units, also showed a very strong dependence on the length of the spacer, n, but for this series, the polymers with shorter spacer units, n = 2-4, formed smectic as well as nematic phases, while the polymer with the longest spacer in the series, in which n had an average value of about nine, formed only a nematic phase 7. When the length of the ethyleneoxy spacer was further increased to n = 13.2 (which was obtained from the next longest glycol available at the time), the polymer did not form a liquid crystal phase.
More recently, we have also prepared the intermediate members of this series with n = 5, 6 and 7 (ref. 8) and in contrast to the lower members, all three of these polymers formed only the smectic phase between melting and isotropization. The reason for this unexpected change in phase behaviour is unknown, but the odd-even variation of melting temperature, Tin, and Ti was maintained for all members of series II (up to n = 7).
Long chain polymethylene or polyethyleneoxy groups have also been placed in polymers as lateral pendant substituents on the mesogenic group. For the former type of spacer, we observed that similar results were obtained when the polymethylene groups were laterally attached as compared to when they were placed along the main chain in terms of the effect of both spacer length and
0032-3861/91/091703-10 © 1991 Butterworth-Heinemann Ltd. POLYMER, 1991, Volume 32, Number 9 1703
Synthesis and characterization of polyesters: R. W. Lenz et a l.
odd-even structures on the thermal properties and the type of LC phase formed. In those investigations the two different series of polymers which were prepared and characterized for these effects, were the following9'1°:
f 0 0 - - II u ] oo_Q_c 1- R a
Series V: R - (CH2) n CHz
Series Vh R - ( OCH2CH2 ) n OR' R' = CH3 or C2Hs
Series IIh
Series IV:
.•O O O O ]_ II ~ II ~ I ~ II n = 0-5,7,9
co oc O-LQ)-co (c.2),o o
( CH2~ CH3
o O II | n - 0,1,2
- - ~ . - C O - - ~ O C - - ~ ' - O (CH2),oO-- ; R'=CH3orC2Hs O(CH~H20). R
The parent, unsubstituted polymer of these two series of thermotropic polyesters would be poly(hydroquinone terephthalate), which has a Tm above 600°C. For series V, a substantial decrease in T m was achieved only when the pendant alkyl group was higher than the butyl group, n = 4 (refs 11, 12). The thermal transition and LC properties of this series of polymers are discussed in a later section. The present report is concerned with the preparation and properties of the series VI polymers.
For the series III polymers containing a flexible decamethylene pendant group and an aromatic triad ester mesogenic group there was an unusually large effect of the size of the R alkyl group on both Tm and Ti for the methyl, ethyl and propyl groups, but little change in these properties occurred for larger R groups 9. That is, the additional increase in the length of the alkyl group beyond four carbon atoms did not seem to produce any additional effect that could cause an interference of the molecular packing in the solid state, and indeed a more or less constant melting point was observed for the polymers with the longer alkyl groups. Such an effect is possibly attributable to crystallization of the side-chain alkyl groups themselves in addition to that of the polymer main chains.
Similar effects were observed for the T~ of the series III polymers which decreased steadily with increasing length of the substituent, but the contribution of each additional methylene unit to the depression of this transition temperature became much smaller for the butyl, pentyl and hexyl substituents. These reduced effects may be the result of the gradually decreasing contribution of each additional methylene unit to the molecular diameter of the mesogenic units. When the alkyl group was lengthened to more than six carbon atoms no thermotropic behaviour was observed, possibly because the clearing temperatures of these polymers were depressed below the melting points (monotropic behaviour). All of the LC polymers in this series were nematic.
For the series IV polymers, we reported that those with n = 1 or 2 and R' as either CH 3 or C2H 5 appeared to form two LC phases 1°. The d.s.c, thermograms of those polymers contained three endothermic peaks, with the first and the third representing the Tm and T~ transi- tions. The intermediate endothermic peaks occurred, in all cases, in a temperature range in which a change in texture was observed for the polymer samples placed on the hot stage of a polarizing microscope. Hence this endotherm appeared to represent an LC to LC transition. In all cases, the higher temperature LC phases were observed to have textures expected for a nematic phase, but the nature of the lower temperature LC phases was in doubt and characterization studies are still in progress.
More recently a similar study was carried out in our laboratory on thermotropic polyesters which did not contain a flexible spacer in the main chain (that is, on extended rod polyesters), but which contained the same series of pendant flexible spacers attached to the polymer as substituent groups, R, in the structure shown below:
RESULTS AND DISCUSSION
Six different types of polymers in series VI have been prepared and characterized for the LC properties with the results shown in Table 1. Included among the polyesters prepared are polymers with n = 0, 1 and 2 and for each of these R' is either CH 3 or C2H 5. The properties of several of these polymers were described in a preliminary report 1°, but the earlier samples, polymers 3, 6 and 9 of Table 1, were of very low molecular weight, so for the present study new samples of these polyesters were prepared with much higher molecular weights and newer members of the series were also synthesized, with the results collected together in Table 1.
Crystalline to liquid crystalline transitions As expected, the crystalline to LC transitions, which
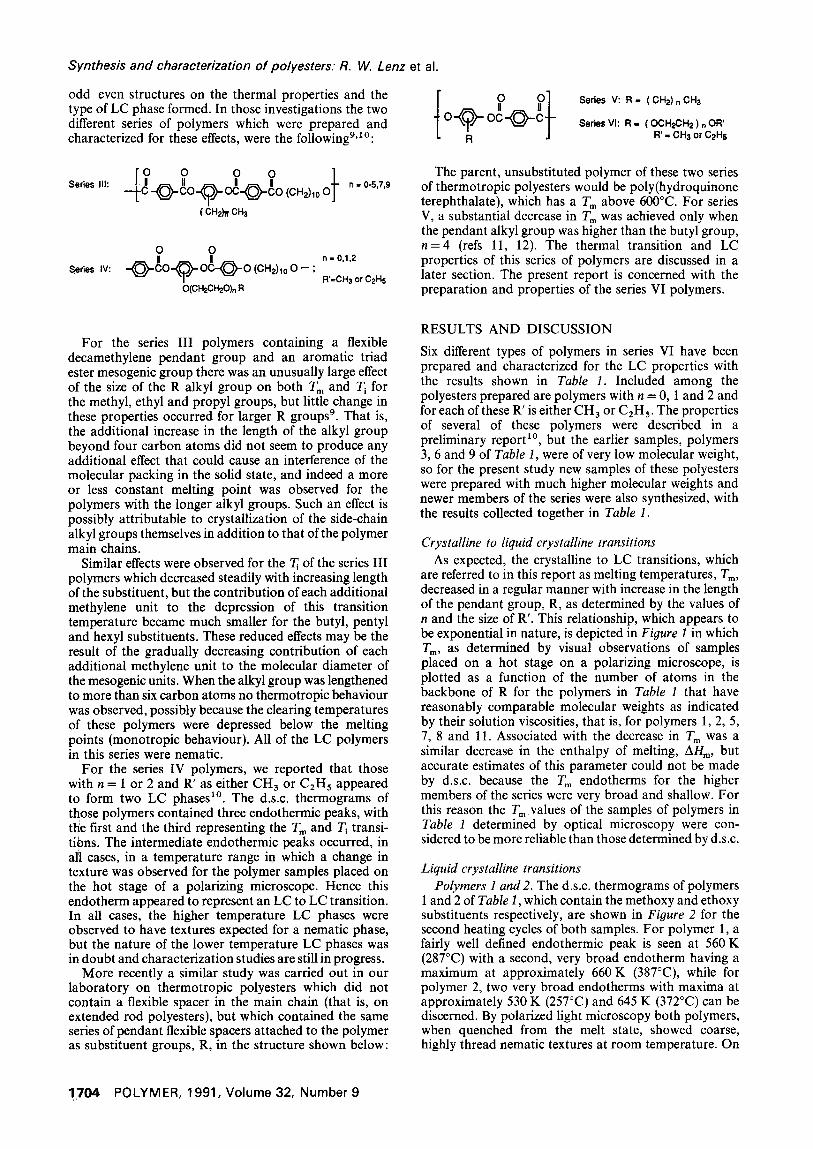
are referred to in this report as melting temperatures, T m, decreased in a regular manner with increase in the length of the pendant group, R, as determined by the values of n and the size of R'. This relationship, which appears to be exponential in nature, is depicted in Figure 1 in which Tin, as determined by visual observations of samples placed on a hot stage on a polarizing microscope, is plotted as a function of the number of atoms in the backbone of R for the polymers in Table 1 that have reasonably comparable molecular weights as indicated by their solution viscosities, that is, for polymers 1, 2, 5, 7, 8 and 11. Associated with the decrease in Tm was a similar decrease in the enthalpy of melting, AHm, but accurate estimates of this parameter could not be made by d.s.c, because the Tm endotherms for the higher members of the series were very broad and shallow. For this reason the Tm values of the samples of polymers in Table 1 determined by optical microscopy were con- sidered to be more reliable than those determined by d.s.c.
Liquid crystalline transitions Polymers 1 and 2. The d.s.c, thermograms of polymers
1 and 2 of Table 1, which contain the methoxy and ethoxy substituents respectively, are shown in Figure 2 for the second heating cycles of both samples. For polymer 1, a fairly well defined endothermic peak is seen at 560 K (287°C) with a second, very broad endotherm having a maximum at approximately 660 K (387°C), while for polymer 2, two very broad endotherms with maxima at approximately 530 K (257°C) and 645 K (372°C) can be discerned. By polarized light microscopy both polymers, when quenched from the melt state, showed coarse, highly thread nematic textures at room temperature. On
1704 POLYMER, 1991, Volume 32, Number 9
Table 1 Thermal transitions of LC polyesters of series VI
Synthesis and characterization of polyesters." R. W. Lenz et al.
tlinh a Polymer n R' (dl g- 1)
Visual observations by microscopy (°C) b D.s.c. results (°C)
Heating cycle Cooling cycle b Tm TLC/LC 'c TH Tm TLC/LC' TLC/LC' Ti
1 0 C H 3 1.13 275 - 312 287 - 200 387 2 0 CaHs 1.57 250 - 310 257 174 372 3 1 C H 3 0.205 180 230 - 177 237 211 292 4 1 CH 3 0.580 200 258 273 - 257 243 - 5 1 C H 3 1.27 210 - 278 213 - 231 - 6 1 CaH5 0.198 160 220 265 157 227 204 - 7 1 C2H 5 1.46 207 272 280 230 270 250 - 8 2 C H 3 1.26 190 225 240 167 222 - 352 d 9 2 C2H5 0.590 140 257 268 192 257 228 -
10 2 C2H 5 0.850 189 265 325 217 267 237 - 11 2 C:H 5 1.25 194 250 300 194 - 222 -
"Inherent viscosity in p-chlorophenol at 50°C and a concentration of 0.2 g dl-1 "Tin =Crystalline to LC transition; TLC/L c, = transition from one LC state to another; T H = homeotropization temperature; T~ = isotropization temperature CChange in texture observed d T~ observed by microscopy
o 2 8 0
h i E 2 6 0 I--
E ILl 2 4 0 n
W I-- 2 2 0
£9 Z
2 0 0
W
180
I I t I I t I 1 /
Qx x . _
\
x % x x
~ O
I I I I I I I 2 3 4 5 6 7 8
N U M B E R O F A T O M S IN R
Figure 1 Melting transition visually observed by polarized light microscopy as a function of the number of atoms in the backbone of the alkoxy substituents, R, for polymers having similar solution viscosities in Table 1
¢D
310
Figure 2
P o l y m e r 2
P o l y m e r t
5 9 0 4 7 0 5 5 0 6 3 0
TEMPERATURE ( K)
D.s.c. thermograms of polymers 1 and 2 in the second heating cycle
rehea t ing after quenching p o l y m e r 1 showed first indica- t ions of flow at a b o u t 275°C and large scale flow at 287°C, which is the t empe ra tu r e of the endo the rmic peak for that p o l y m e r in Figure I, and at 287°C the texture changed to a highly birefr ingent , schl ieren pa t te rn . At 312°C, as observed on the hot s tage of the po la r i z ing microscope , this po lymer deve loped an a p p a r e n t homeo- t rop ic tex ture which r ema ined up to the m a x i m u m t empera tu r e for obse rva t ion of 320°C for the ho t s tage used. W h e n the po lymer was sheared l ight ly in this high t empe ra tu r e range, the h o m e o t r o p i c tex ture changed to a n o r m a l nemat i c texture and stir opalescence could be observed using n o r m a l opt ics . Conoscop i c mic roscopy will be used for fur ther cha rac te r i za t ion of this state.
F o r po lymer 2, an a p p a r e n t mel t ing was observed for the sample on the po la r i z ing mic roscope s tage at 250°C and large scale flow with fo rma t ion of a h ighly bire- fr ingent schl ieren texture was seen at a b o u t 253°C. F o r this sample , h o m e o t r o p i z a t i o n occur red at 310°C. N o ind ica t ion of i so t rop iza t ion was observed for ei ther po lymer 1 or 2 bu t values of Ti are given in Table 1
because it is bel ieved tha t the h igher t empera tu re endo therms seen in Figure 2 represent clearing t ransi t ions, a l t hough this sugges t ion could no t be verified by po la r i zed l ight mic roscopy because of the t empera tu re l imit of the ho t stage.
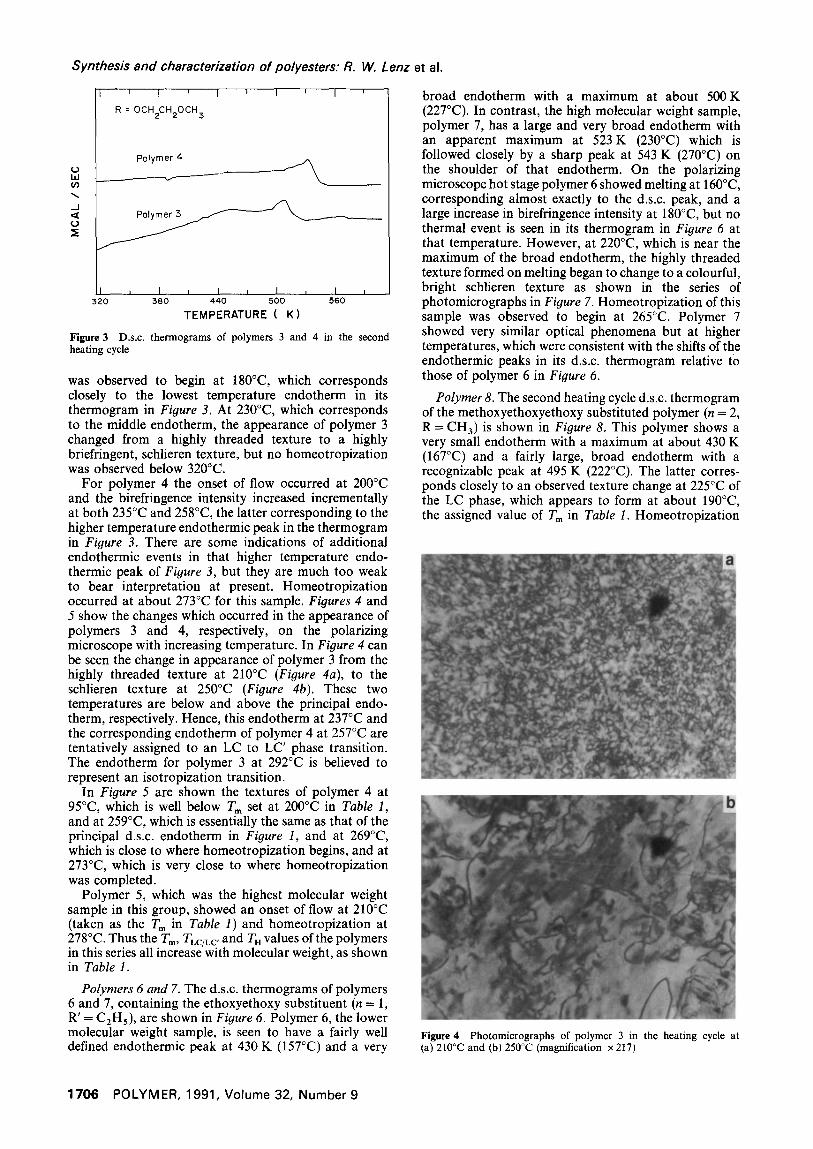
Polymers 3, 4 and 5. Polymers 3, 4 and 5 of Table I, which con ta in the me thoxye thoxy subs t i tuent ( n = 1, R ' = CH3), are the low, m e d i u m and high molecu la r weight samples respect ively of this L C polymer . Second hea t ing cycle, d.s.c, t h e r m o g r a m s for po lymers 3 and 4 are shown in Figure 3. In the t h e r m o g r a m of po lymer 3 is seen a well defined e n d o t h e r m with a peak t empera tu re at 510 K (237°C), which is fol lowed by a very b r o a d and shal low e n d o t h e r m with a peak at a b o u t 565 K (292°C) and preceded by an ex t remely b r o a d e n d o t h e r m at a b o u t 450 K (177°C). In po lyme r 4, the higher molecu la r weight sample in Figure 3, the middle e n d o t h e r m has appa ren t l y shifted to 5 3 0 K (257°C), bu t no higher or lower t empe ra tu r e endo the rms are appa ren t . O n the po la r iz ing mic roscope hot stage, an a p p a r e n t mel t ing of po lymer 3
POLYMER, 1991, Volume 32, Number 9 1705
Synthesis and characterization of polyesters." R. W. Lenz et al.
0 LU
.J
¢J
' I ' I
R = OCH2CH2OCH 3
Polymer 4
Polymer 5 ~ .
I , I , I , I , I , 320 3 8 0 4 4 0 500 560
TEMPERATURE ( K)
Figure 3 D.s.c. thermograms of polymers 3 and 4 in the second heating cycle
was observed to begin at 180°C, which corresponds closely to the lowest temperature endotherm in its thermogram in Figure 3. At 230°C, which corresponds to the middle endotherm, the appearance of polymer 3 changed from a highly threaded texture to a highly briefringent, schlieren texture, but no homeotropization was observed below 320°C.
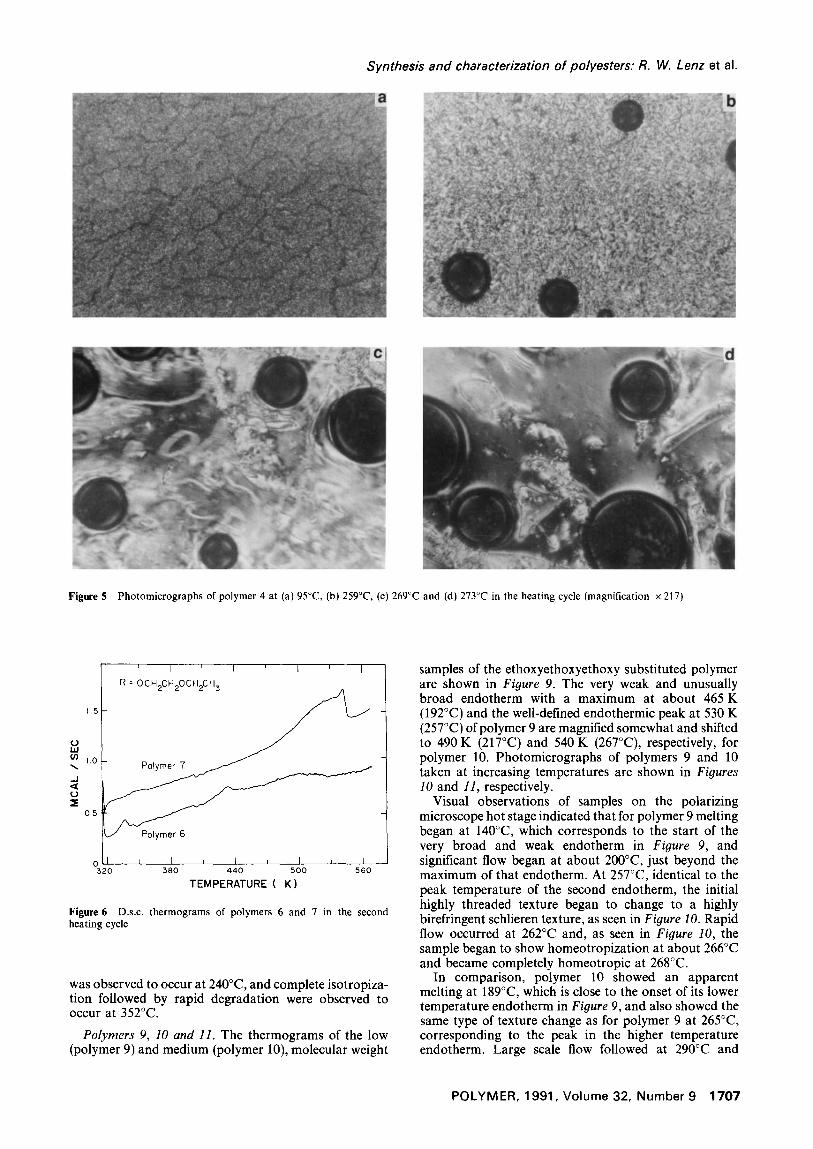
For polymer 4 the onset of flow occurred at 200°C and the birefringence intensity increased incrementally at both 235°C and 258°C, the latter corresponding to the higher temperature endothermic peak in the thermogram in Figure 3. There are some indications of additional endothermic events in that higher temperature endo- thermic peak of Figure 3, but they are much too weak to bear interpretation at present. Homeotropization occurred at about 273°C for this sample. Figures 4 and 5 show the changes which occurred in the appearance of polymers 3 and 4, respectively, on the polarizing microscope with increasing temperature. In Figure 4 can be seen the change in appearance of polymer 3 from the highly threaded texture at 210°C (Figure 4a), to the schlieren texture at 250°C (Figure 4b). These two temperatures are below and above the principal endo- therm, respectively. Hence, this endotherm at 237°C and the corresponding endotherm of polymer 4 at 257°C are tentatively assigned to an LC to LC' phase transition. The endotherm for polymer 3 at 292°C is believed to represent an isotropization transition.
In Figure 5 are shown the textures of polymer 4 at 95°C, which is well below T m set at 200°C in Table I, and at 259°C, which is essentially the same as that of the principal d.s.c, endotherm in Figure I, and at 269°C, which is close to where homeotropization begins, and at 273°C, which is very close to where homeotropization was completed.
Polymer 5, which was the highest molecular weight sample in this group, showed an onset of flow at 210°C (taken as the Tm in Table 1) and homeotropization at 278°C. Thus the Tin, TLC/LC, and T n values of the polymers in this series all increase with molecular weight, as shown in Table 1.
Polymers 6 and 7. The d.s.c, thermograms of polymers 6 and 7, containing the ethoxyethoxy substituent (n = l, R' = C2H5), are shown in Figure 6. Polymer 6, the lower molecular weight sample, is seen to have a fairly well defined endothermic peak at 430 K (157°C) and a very
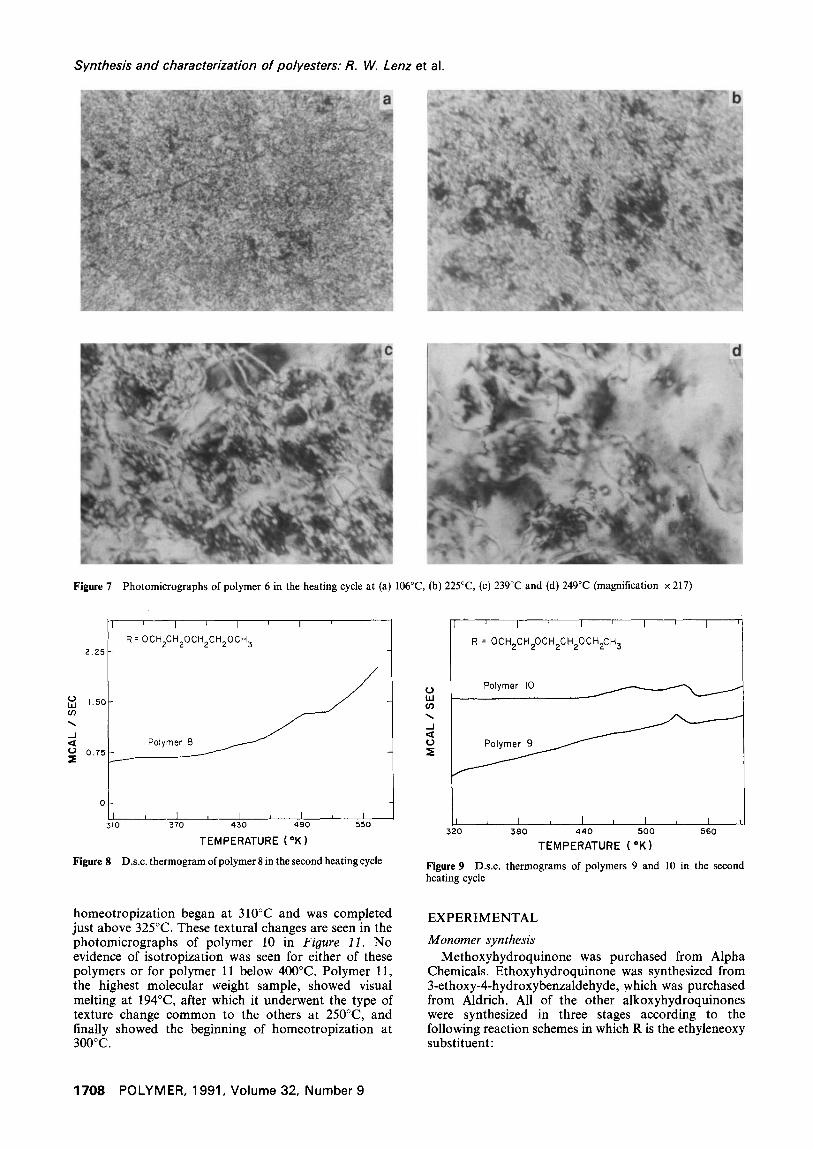
broad endotherm with a maximum at about 500 K (227°C). In contrast, the high molecular weight sample, polymer 7, has a large and very broad endotherm with an apparent maximum at 523 K (230°C) which is followed closely by a sharp peak at 543 K (270°C) on the shoulder of that endotherm. On the polarizing microscope hot stage polymer 6 showed melting at 160°C, corresponding almost exactly to the d.s.c, peak, and a large increase in birefringence intensity at 180°C, but no thermal event is seen in its thermogram in Figure 6 at that temperature. However, at 220°C, which is near the maximum of the broad endotherm, the highly threaded texture formed on melting began to change to a colourful, bright schlieren texture as shown in the series of photomicrographs in Figure 7. Homeotropization of this sample was observed to begin at 265°C. Polymer 7 showed very similar optical phenomena but at higher temperatures, which were consistent with the shifts of the endothermic peaks in its d.s.c, thermogram relative to those of polymer 6 in Figure 6.
Polymer 8. The second heating cycle d.s.c, thermogram of the methoxyethoxyethoxy substituted polymer (n = 2, R---cn3) is shown in Figure 8. This polymer shows a very small endotherm with a maximum at about 430 K (167°C) and a fairly large, broad endotherm with a recognizable peak at 495 K (222°C). The latter corres- ponds closely to an observed texture change at 225°C of the LC phase, which appears to form at about 190°C, the assigned value of Tm in Table I. Homeotropization
L
Figure 4 Photomicrographs of polymer 3 in the heating cycle at (a) 210°C and (b) 250°C (magnification x 217)
1706 POLYMER, 1991, Volume 32, Number 9
Synthesis and characterization of polyesters." R. W. Lenz et al.
Figure 5 Photomicrographs of polymer 4 at (a) 95°C, (b) 259°C, (c) 269°C and (d) 273°C in the heating cycle (magnification x 217)
1.5
t...) 1,.0
1.0
- I
0.5
' I ' I ' I ' I
R = O C H 2 C H 2 O C H 2 C H 3
J P o l y m e r 6
] I I L I L I i I 520 380 440 500 560
TEMPERATURE ( K )
Figure 6 D.s.c. thermograms of polymers 6 and 7 in the second heating cycle
was observed to occur at 240°C, and complete isotropiza- tion followed by rapid degradation were observed to occur at 352°C.
Polymers 9, 10 and 11. The thermograms of the low (polymer 9) and medium (polymer 10), molecular weight
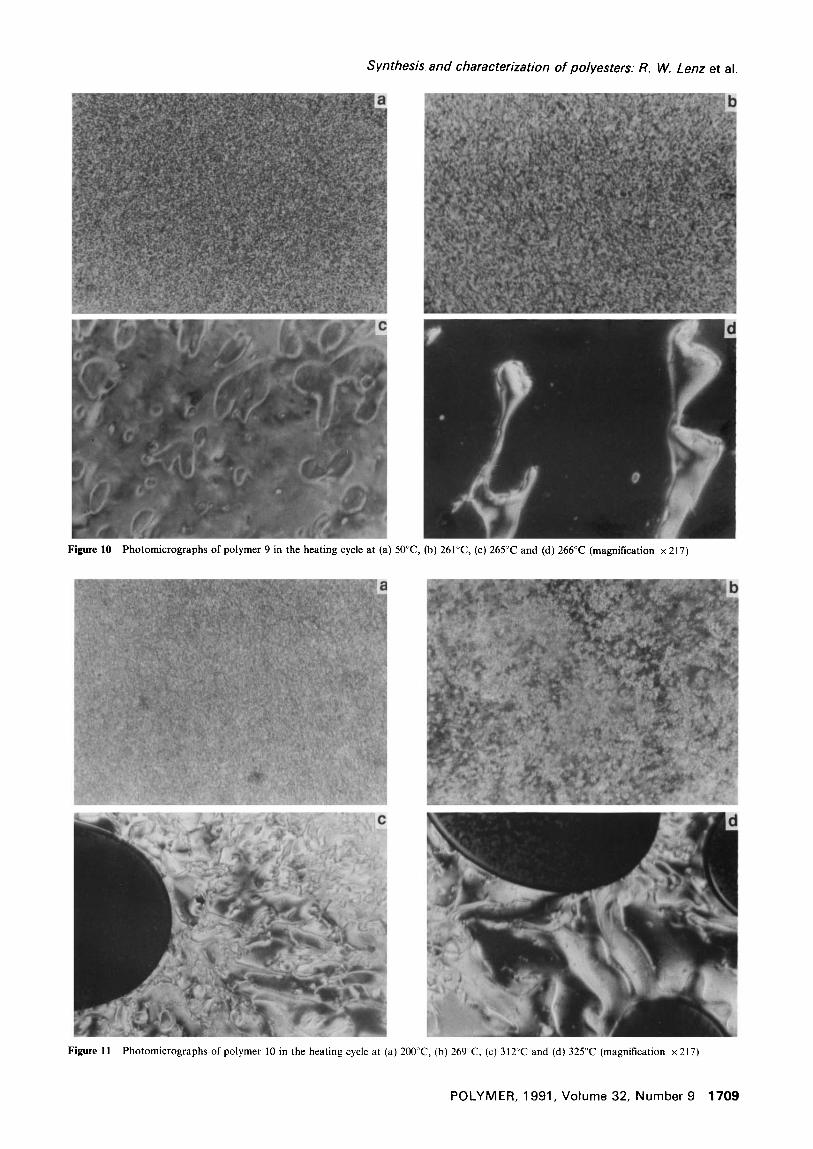
samples of the ethoxyethoxyethoxy substituted polymer are shown in Figure 9. The very weak and unusually broad endotherm with a maximum at about 465 K (192°C) and the well-defined endothermic peak at 530 K (257°C) of polymer 9 are magnified somewhat and shifted to 490 K (217°C) and 540 K (267°C), respectively, for polymer 10. Photomicrographs of polymers 9 and 10 taken at increasing temperatures are shown in Figures I0 and 11, respectively.
Visual observations of samples on the polarizing microscope hot stage indicated that for polymer 9 melting began at 140°C, which corresponds to the start of the very broad and weak endotherm in Figure 9, and significant flow began at about 200°C, just beyond the maximum of that endotherm. At 257°C, identical to the peak temperature of the second endotherm, the initial highly threaded texture began to change to a highly birefringent schlieren texture, as seen in Figure I0. Rapid flow occurred at 262°C and, as seen in Figure I0, the sample began to show homeotropization at about 266°C and became completely homeotropic at 268°C.
In comparison, polymer 10 showed an apparent melting at 189°C, which is close to the onset of its lower temperature endotherm in Figure 9, and also showed the same type of texture change as for polymer 9 at 265°C, corresponding to the peak in the higher temperature endotherm. Large scale flow followed at 290°C and
POLYMER, 1991, Volume 32, Number9 1707
Synthesis and characterization of polyesters." R. W. Lenz et al.
Figure 7 Photomicrographs of polymer 6 in the heating cycle at (a) 106°C, (b) 225°C, (c) 239°C and (d) 249°C (magnification x 217)
2.25
t~ 1.50 LU 03
J
t~ 0.75
' I ~ I
R = OCH2CH2OCH2CH2OCH 3
P o l y m e r 8
o
i I 3 1 0 370
' I ' I
/
I ~ I ~ I 430 490 550
TEMPERATURE ( °K )
Figures D.s.c. thermogram of polymer 8 in the second heating cycle
homeotropization began at 310°C and was completed just above 325°C. These textural changes are seen in the photomicrographs of polymer 10 in Figure 11. No evidence of isotropization was seen for either of these polymers or for polymer 11 below 400°C. Polymer 11, the highest molecular weight sample, showed visual melting at 194°C, after which it underwent the type of texture change common to the others at 250°C, and finally showed the beginning of homeotropization at 300°C.
t~
(f)
_1
I i I '
R = OCHzCH2OCH2CHzOCHzCH 3
I L I
P o l y m e r I0 f ~
P o l y m e r
L I ~ I I I i 1 i 520 380 440 500 560
TEMPERATURE ( ° K )
Figure 9 D.s.c. thermograms of polymers 9 and 10 in the second heating cycle
EXPERIMENTAL
Monomer synthesis Methoxyhydroquinone was purchased from Alpha
Chemicals. Ethoxyhydroquinone was synthesized from 3-ethoxy-4-hydroxybenzaldehyde, which was purchased from Aldrich. All of the other alkoxyhydroquinones were synthesized in three stages according to the following reaction schemes in which R is the ethyleneoxy substituent:
1 7 0 8 P O L Y M E R , 1 9 9 1 , V o l u m e 32 , N u m b e r 9
Synthesis and characterization of polyesters: R. W. Lenz et al.
Figure 10 Photomicrographs of polymer 9 in the heating cycle at (a) 50°C, (b) 261°C, (c) 265°C and (d) 266°C (magnification x 217)
Figure 11 Photomicrographs of polymer I0 in the heating cycle at (a) 200°C, (b) 269°C, (c) 312°C and (d) 325°C (magnification × 217)
POLYMER, 1991, Volume 32, Number9 1709
Synthesis and characterization of polyesters: R. W. Lenz et al.
O O
n = 1,2.; R' = CH a, C2H s O O
0
_0_ i 2. Ha(; --R + HO HO
H ~ + R ' ~ C H O + RR"~-CHO
vii (major) viii ix
3. VII + VIII HO-~,(~)--OH + VIII
R
The synthesis of 2-methoxyethoxyhydroquinone is des- cribed below in detail; all of the other substituted hydroquinones were prepared in the same manner.
In the first step, 2-methoxyethyl tosylate was synthe- sized by slowly adding 0.5 mol powdered tosyl chloride to an aqueous sodium hydroxide solution (which was prepared by dissolving 1 mol sodium hydroxide in 150 ml of water) containing 0.5 mol 2-methoxyethanol under vigorous stirring at 20°C. The product, which was separated from the aqueous layer as an oil, was extracted with dichloromethane, washed twice with a 10% sodium hydroxide solution and twice with water, and dried over anhydrous magnesium sulphate. Dichloromethane was evaporated to yield 2-methoxyethyl tosylate as a colour- less oily liquid (yield 97%).
In the second step, 0.3 mol 2-methoxyethyl tosylate and 240 ml of a 10% aqueous sodium hydroxide solution were added to a solution of 0.3 mol 3,4-dihydroxybenz- aldehyde in 500 ml of ethanol. The reaction mixture was stirred under a nitrogen atmosphere for 5 h at 50°C after which the solvent was evaporated and the product was dissolved in water and extracted twice with ethyl ether. The ether layer was washed with water and dried over anhydrous magnesium sulphate. After evaporating the ether solvent, 3,4-bis(2-methoxyethoxy)-benzaldehyde was obtained as an orange coloured, oily liquid. The remaining aqueous solution was acidified with dilute hydrochloric acid and extracted with ether. The ether layer was washed with saturated sodium bicarbonate solution twice and with water once and dried over anhydrous magnesium sulphate. The ether was then distilled off, and an oily product was obtained. This oil was dissolved in chloroform and Skelly-F solvent was added to it until the solution became cloudy. Upon standing overnight, crystals of unreacted 3,4-dihydroxy-
benzaldehyde formed and were filtered out. The solvent was then evaporated from the solution, the resultant oily product was solidified upon cooling, and hydroxy(2- methoxyethoxy)benzaldehyde was obtained as a yellow solid (yield 40%).
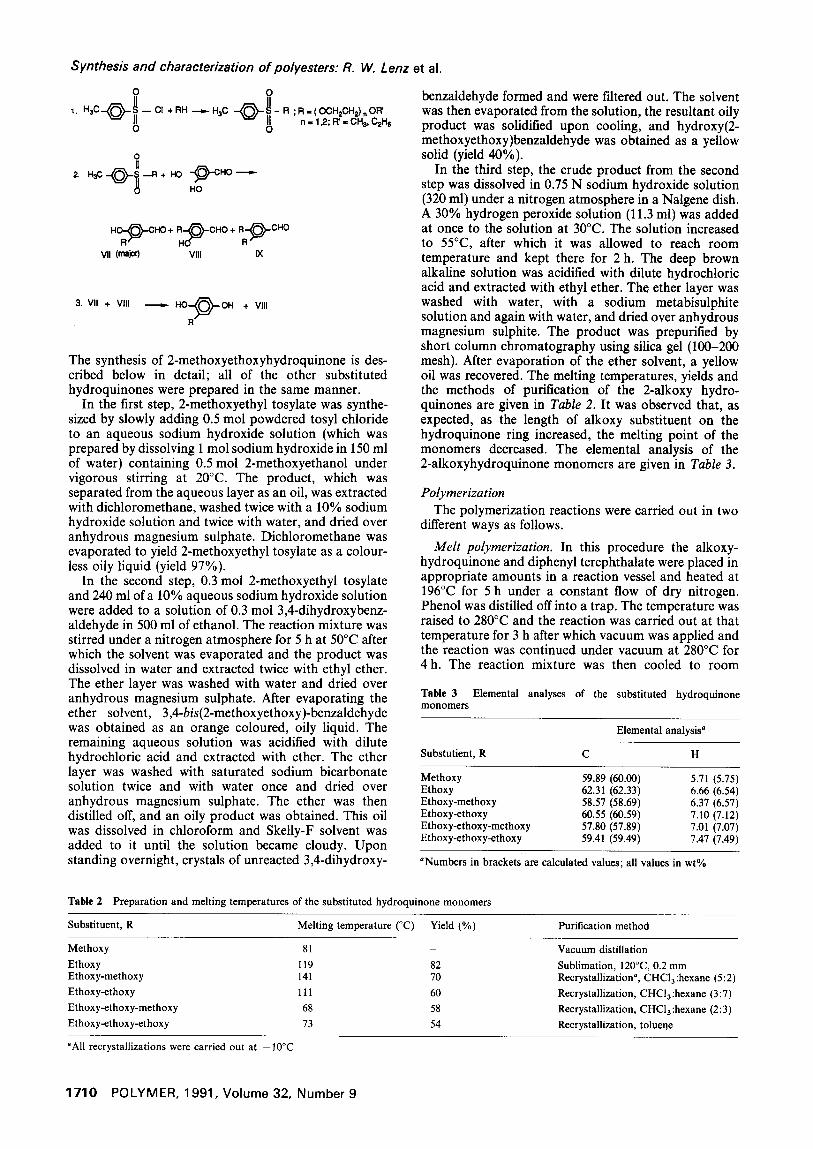
In the third step, the crude product from the second step was dissolved in 0.75 N sodium hydroxide solution (320 ml) under a nitrogen atmosphere in a Nalgene dish. A 30% hydrogen peroxide solution (11.3 ml) was added at once to the solution at 30°C. The solution increased to 55°C, after which it was allowed to reach room temperature and kept there for 2 h. The deep brown alkaline solution was acidified with dilute hydrochloric acid and extracted with ethyl ether. The ether layer was washed with water, with a sodium metabisulphite solution and again with water, and dried over anhydrous magnesium sulphite. The product was prepurified by short column chromatography using silica gel (100-200 mesh). After evaporation of the ether solvent, a yellow oil was recovered. The melting temperatures, yields and the methods of purification of the 2-alkoxy hydro- quinones are given in Table 2. It was observed that, as expected, as the length of alkoxy substituent on the hydroquinone ring increased, the melting point of the monomers decreased. The elemental analysis of the 2-alkoxyhydroquinone monomers are given in Table 3.
Polymerization The polymerization reactions were carried out in two
different ways as follows.
Melt polymerization. In this procedure the alkoxy- hydroquinone and diphenyl terepl~thalate were placed in appropriate amounts in a reaction vessel and heated at 196°C for 5 h under a constant flow of dry nitrogen. Phenol was distilled off into a trap. The temperature was raised to 280°C and the reaction was carried out at that temperature for 3 h after which vacuum was applied and the reaction was continued under vacuum at 280°C for 4 h. The reaction mixture was then cooled to room
Table 3 Elemental analyses of the substituted hydroquinone monomers
Elemental analysis a
Substutient, R C H
Methoxy 59.89 (60.00) 5.71 (5.75) Ethoxy 62.31 (62.33) 6.66 (6.54) Ethoxy-methoxy 58.57 (58.69) 6.37 (6.57) Ethoxy-ethoxy 60.55 (60.59) 7.10 (7.12) Ethoxy-ethoxy-methoxy 57.80 (57.89) 7.01 (7.07) Ethoxy-ethoxy-ethoxy 59.41 (59.49) 7.47 (7.49)
aNumbers in brackets are calculated values; all values in wt%
Table 2 Preparation and melting temperatures of the substituted hydroquinone monomers
Substituent, R Melting temperature (°C) Yield (%) Purification method
Methoxy 81 -
Ethoxy 119 82 Ethoxy-methoxy 141 70
Ethoxy-ethoxy 111 60
Ethoxy-ethoxy-methoxy 68 58
Ethoxy-ethoxy-ethoxy 73 54
Vacuum distillation
Sublimation, 120°C, 0.2 mm Recrystallization =, CHCI3 :hexane (5:2)
Recrystallization, CHC13:hexane (3: 7)
Recrystallization, CHC13:hexane (2: 3)
Recrystallization, toluene
"All recrystallizations were carried out at -10°C
1710 POLYMER, 1991, Volume 32, Number 9
Synthesis and characterization of polyesters: R. W. Lenz et al.
temperature and the polymer was washed with acetone and dried under vacuum at 100°C.
Solution polymerization. In this procedure the required amount of the alkoxyhydroquinone was dissolved in methylene chloride and a two-fold molar excess of triethylamine was added to it in a reaction vessel. To this solution an equimolar solution of terephthaloyl chloride in methylene chloride was added and the reaction was carried out at room temperature for 24 h under nitrogen atmosphere with vigorous stirring, after which the reaction mixture was refluxed, cooled and poured into a three- to four-fold excess of ethanol. The precipitated polymer was filtered, dried, washed with acetone and dried at 50°C under vacuum.
Polymers 1, 3 and 5 of Table I were prepared by melt polymerization and were of comparatively lower molec- ular weights, as was evident from their low solution viscosity values. All other polymers in Table I were prepared by solution polymerization and had consider- ably higher solution viscosity values. D.s.c. experiments were carried out with a Perkin-Elmer DSC-2 under nitrogen atmosphere. For polymers 2, 4 and 6 the d.s.c, thermogram was obtained using a heating rate of 10°C min-1, but for all other polymers a heating rate of 20°C min- 1 was employed. The melting transitions were also determined as the temperatures of onset of significant flow as observed by optical microscopy with a Carl Zeiss polarizing microscope equipped with a Mettler FP-2 hot stage. A typical film thickness was 15-25 #m. Solution viscosities were measured in a p-chlorophenol solution at a concentration of 0.2 g per 100 ml at 50°C using a Ubbelhode 150 capillary viscometer.
CONCLUSIONS
In all cases in which n was 1 or 2 in R, essentially identical types of texture changes were observed for all of the polymers studied at all molecular weights, differing only in the temperatures at which the changes began. That is, at some temperature above Tm all of the polymers in Table I with n > 0 showed a change from a highly threaded texture of relatively low birefringence intensity to a highly birefringent schlieren texture, and the onset of this change generally corresponded to an observable endothermic peak in their d.s.c, thermograms.
All of the polymers of Table I, except polymer 3, also showed a loss of birefringence at some elevated tempera- ture. This observed extinction is attributed to homeo- tropization, not isotropization, because in all cases an immediate brightening of the field occurred when the sample was subjected to a very slow and gentle shearing action, but conoscopic measurements have not been carried out as yet to verify this phenomenon.
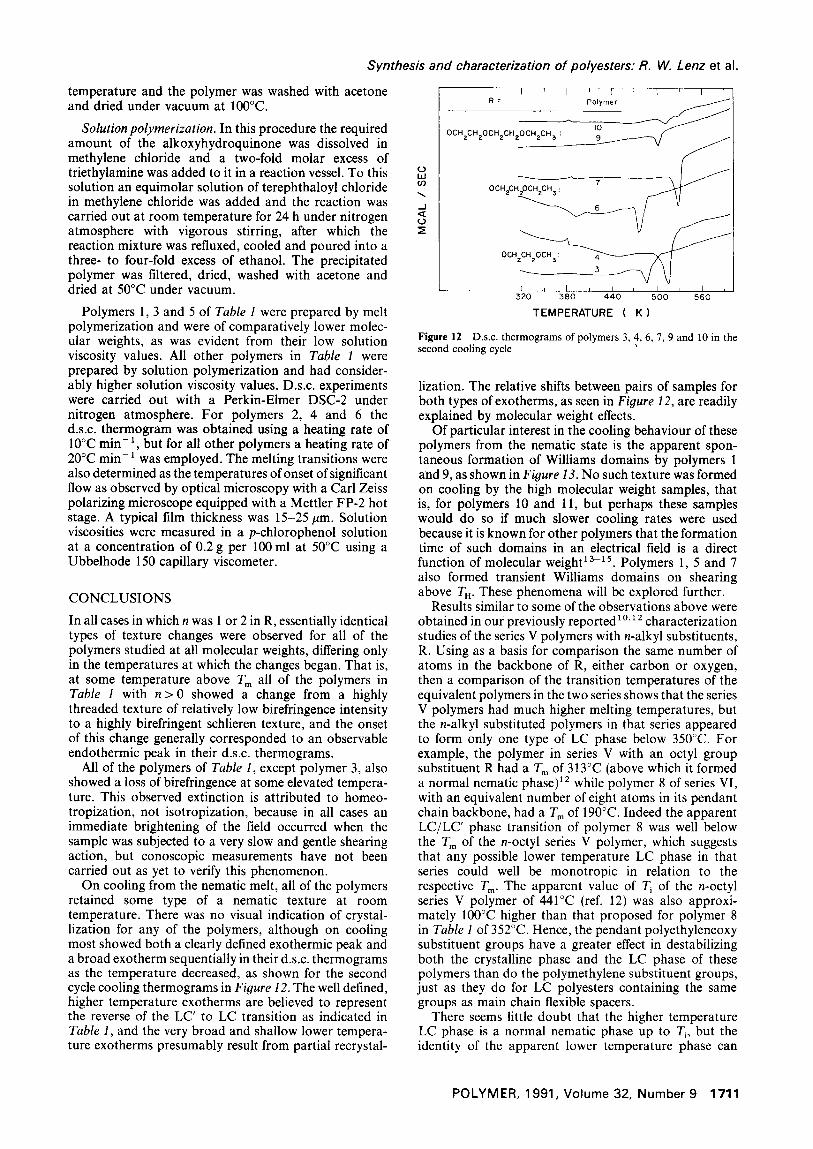
On cooling from the nematic melt, all of the polymers retained some type of a nematic texture at room temperature. There was no visual indication of crystal- lization for any of the polymers, although on cooling most showed both a clearly defined exothermic peak and a broad exotherm sequentially in their d.s.c, thermograms as the temperature decreased, as shown for the second cycle cooling thermograms in Figure 12. The well defined, higher temperature exotherms are believed to represent the reverse of the LC' to LC transition as indicated in Table I, and the very broad and shallow lower tempera- ture exotherms presumably result from partial recrystal-
,o, t/)
._1
~ E
I ' I ' I ' I ' I ' [
OCHzCH2OCH2CH2OCH2CH ~ -- I ~ ~
OCH2CHzOCH2C 3" O C H
] I [ L I I l I l , 320 380 440 500 560
TEMPERATURE ( K )
Figure 12 D.s.c. thermograms of polymers 3, 4, 6, 7, 9 and 10 in the second cooling cycle
lization. The relative shifts between pairs of samples for both types of exotherms, as seen in Figure 12, are readily explained by molecular weight effects.
Of particular interest in the cooling behaviour of these polymers from the nematic state is the apparent spon- taneous formation of Williams domains by polymers 1 and 9, as shown in Figure 13. No such texture was formed on cooling by the high molecular weight samples, that is, for polymers 10 and 11, but perhaps these samples would do so if much slower cooling rates were used because it is known for other polymers that the formation time of such domains in an electrical field is a direct function of molecular weight 13-15. Polymers 1, 5 and 7 also formed transient Williams domains on shearing above TH. These phenomena will be explored further.
Results similar to some of the observations above were obtained in our previously reported1°'12 characterization studies of the series V polymers with n-alkyl substituents, R. Using as a basis for comparison the same number of atoms in the backbone of R, either carbon or oxygen, then a comparison of the transition temperatures of the equivalent polymers in the two series shows that the series V polymers had much higher melting temperatures, but the n-alkyl substituted polymers in that series appeared to form only one type of LC phase below 350°C. For example, the polymer in series V with an octyl group substituent R had a T m of 313°C (above which it formed a normal nematic phase) 12 while polymer 8 of series VI, with an equivalent number of eight atoms in its pendant chain backbone, had a T m of 190°C. Indeed the apparent LC/LC' phase transition of polymer 8 was well below the Tm of the n-octyl series V polymer, which suggests that any possible lower temperature LC phase in that series could well be monotropic in relation to the respective T m. The apparent value of T i of the n-octyl series V polymer of 441°C (ref. 12) was also approxi- mately 100°C higher than that proposed for polymer 8 in Table I of 352°C. Hence, the pendant polyethyleneoxy substituent groups have a greater effect in destabilizing both the crystalline phase and the LC phase of these polymers than do the polymethylene substituent groups, just as they do for LC polyesters containing the same groups as main chain flexible spacers.
There seems little doubt that the higher temperature LC phase is a normal nematic phase up to T i, but the identity of the apparent lower temperature phase can
POLYMER, 1991, Volume 32, Number9 1711
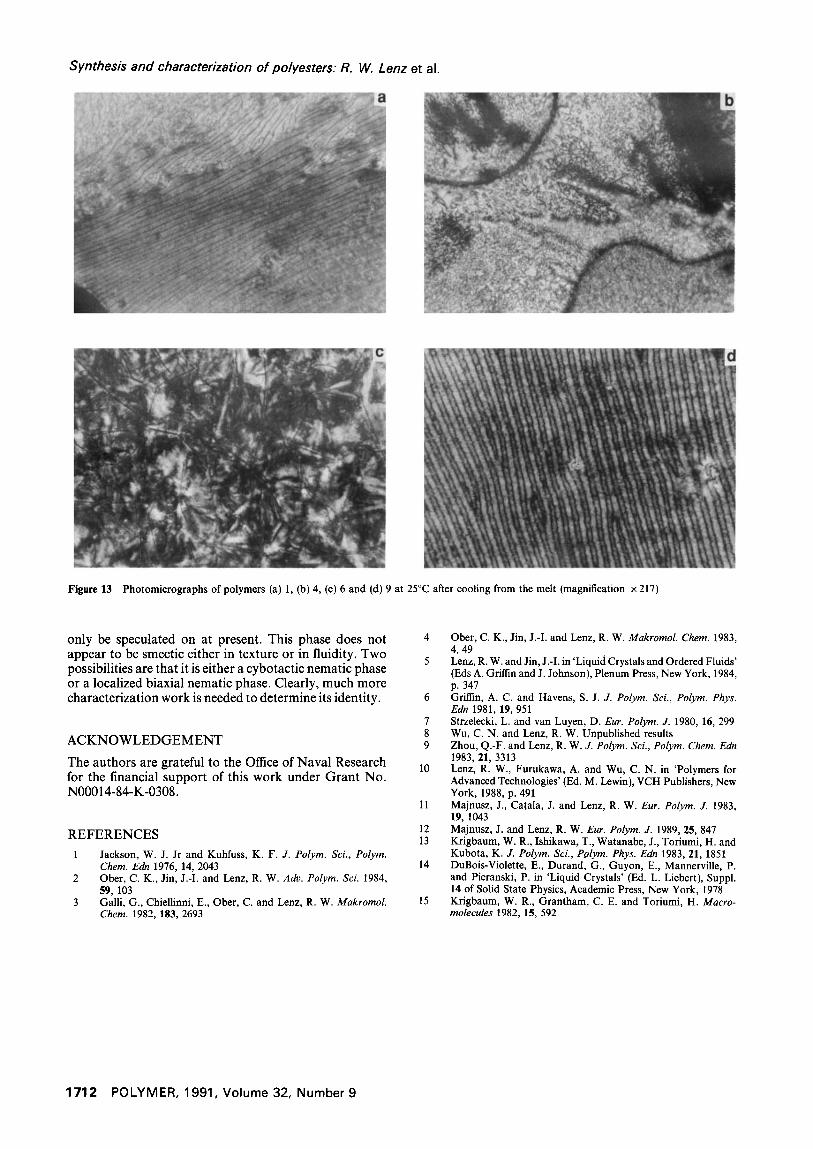
Synthesis and characterization of polyesters." R. W. Lenz et al.
Figure 13 Photomicrographs of polymers (a) 1, (b) 4, (c) 6 and (d) 9 at 25°C after cooling from the melt (magnification x 217)
only be speculated on at present. This phase does no t appear to be smectic either in texture or in fluidity. Two possibilities are that it is either a cybotactic nemat ic phase or a localized biaxial nemat ic phase. Clearly, much more character izat ion work is needed to determine its identity.
A C K N O W L E D G E M E N T
The authors are grateful to the Office of Naval Research for the financial suppor t of this work under G r a n t No. N00014-84-K-0308.
R E F E R E N C E S
1 Jackson, W. J. Jr and Kuhfuss, K. F. J. Polym. Sci., Polym. Chem. Edn 1976, 14, 2043
2 Ober, C. K., Jin, J.-I. and Lenz, R. W. Adv. Polym. Sci. 1984, $9, 103
3 Galli, G., Chiellinni, E., Ober, C. and Lenz, R. W. Makromol. Chem. 1982, 183, 2693
4 Ober, C. K., Jin, J.-I. and Lenz, R. W. Makromol. Chem. 1983, 4, 49
5 Lenz, R. W. and Jin, J.-I. in 'Liquid Crystals and Ordered Fluids' (Eds A. Griffin and J. Johnson), Plenum Press, New York, 1984, p. 347
6 Griffin, A. C. and Havens, S. J. J. Polym. Sci., Polym. Phys. Edn 1981, 19, 951
7 Strzelecki, L. and van Luyen, D. Eur. Polym. J. 1980, 16, 299 8 Wu, C. N. and Lenz, R. W. Unpublished results 9 Zhou, Q.-F. and Lenz, R. W. J. Polym. Sci., Polym. Chem. Edn
1983, 21, 3313 10 Lenz, R. W., Furukawa, A. and Wu, C. N. in 'Polymers for
Advanced Technologies' (Ed. M. Lewin), VCH Publishers, New York, 1988, p. 491
11 Majnusz, J., Catala, J. and Lenz, R. W. Eur. Polym. J. 1983, 19, 1043
12 Majnusz, J. and Lenz, R. W. Eur. Polym. J. 1989, 25, 847 13 Krigbaum, W. R., Ishikawa, T., Watanabe, J., Toriumi, H. and
Kubota, K. J. Polym. Sci., Polym. Phys. Edn 1983, 21, 1851 14 DuBois-Violette, E., Durand, G., Guyon, E., Mannerville, P.
and Pieranski, P. in 'Liquid Crystals' (Ed. L. Liebert), Suppl. 14 of Solid State Physics, Academic Press, New York, 1978
15 Krigbaum, W. R., Grantham, C. E. and Toriumi, H. Macro- molecules 1982, 15, 592
1712 POLYMER, 1991, Volume 32, Number 9


![An Experimental Study on the Effect of Substituents on Aromatic-Aromatic Interactions in Dithia[3,3]-metaparacyclophanes](https://img.dokumen.tips/doc/110x75/6352299c85f87b9f8602c92f/an-experimental-study-on-the-effect-of-substituents-on-aromatic-aromatic-interactions.jpg)