Embed Size (px)
Citation preview
1 | P a g e
State of the Mobile Nation
Switching Attitudes and Behaviours of Mobile Phone Service Providers in Australia
Final Report
Dr David Gray Dr Steven D’Alessandro
Dr Leanne Carter
Macquarie University Department of Marketing and Management.
March, 2012
2 | P a g e
Table of Contents
Executive Summary ........................................................................................... 6
(i) Introduction .......................................................................................... 6
(ii) Objectives of the research .................................................................... 6
(iii) Methodology ........................................................................................ 6
(iv) Key findings ......................................................................................... 6
(a) The performance of the mobile phone services market .......... 6
(b) Switching behaviour and savings achieved ............................. 7
(c) Consumer satisfaction with mobile carriers ............................. 7
(d) Major reasons for switching carriers ......................................... 7
(e) Switching costs .......................................................................... 8
(f) The role of inertia in limiting switching ...................................... 8
(g) The reasons for not switching ................................................... 8
(h) Bill shock .................................................................................... 9
(v) Conclusions .......................................................................................... 9
1 Introduction ............................................................................................... 10
2 Research Methodology .............................................................................. 11
2.1 Introduction ........................................................................................ 11
2.2 Desk research ..................................................................................... 11
2.3 Exploratory focus groups ................................................................... 12
The sample ..........................................................................................13
2.4 The online survey ............................................................................... 17
3 Literature Review ...................................................................................... 19
3.1 Economic contribution of the mobile services market ....................... 19
3.2 Customer switching ............................................................................ 19
3.3 Customer switching – A new approach required ............................... 20
3.4 Switching attitudes – push factors ...................................................... 21
3.4.1 The expectations-disconfirmation gap (ED) ......................22
3.4.2 The utility maximisation gap (UM) ......................................22
3.4.3 Situational factors gap (SS) ................................................22
3.5 Behavioural intentions (BI) ................................................................ 22
3.5.1 Favourable behavioural intentions (FBI) ............................23
3.5.2 Unfavourable behavioural intentions (UBI) ........................23
3 | P a g e
3.6 Moderating factors ............................................................................. 23
3.6.1 Switching costs (SC) ...........................................................23
3.6.2 Customer inertia (CI)...........................................................24
3.7 Pull factors .......................................................................................... 25
4 Market Performance Indicators ................................................................. 26
4.1 The mobile phone Market Performance Indicator (MPI) ................... 26
4.2 The Mobile Phone Market Performance Indicator (MPI) .................. 26
5 Key Findings – Consumer switching - focus groups ................................. 28
5.1 Introduction ........................................................................................ 28
5.2 Switching Findings- The Push Factors .................................................. 30
5.2.1 Expectation disconfirmation ......................................................30
5.2.2 Utility maximisation ....................................................................31
5.2.3 Stochastic and situational factors ..............................................32
5.2.4 Switching attitudes (the push factors) in summary ..................34
5.3 Switching finding: The behaviours - The pull factors .......................... 34
5.3.1 Loyalty/reputation/image ...........................................................34
5.3.2 Product attributes .......................................................................36
5.3.3 Word-of-mouth influences .........................................................37
5.3.4 Media influence ..........................................................................38
5.3.5 Switching behaviours in summary –Pull factors .......................39
5.4 Switching difficulties-inertia ................................................................. 40
5.4.1 Contractual arrangements .........................................................40
5.4.2 Costs ...........................................................................................40
5.4.3 Knowledge and expertise ..........................................................41
5.4.4 Switching difficulties –Inertia summary .....................................42
5.5 Managerial implications ......................................................................... 42
6 Push Factors – findings of the online survey ............................................. 44
6.1 Rate of mobile phone carrier switching ............................................. 44
6.2 Estimated savings made by mobile switchers .................................... 46
6.3 Satisfaction with current mobile phone carrier .................................. 47
6.4 The major drivers of mobile carrier switching behaviour .................. 48
6.5 Switching intentions during the next 12 months ................................ 50
7 Life-stage generational influences ............................................................. 53
7.1 Age, gender and income differences .................................................. 53
7.2 Life-stage generational influences ..................................................... 53
7.2.1 25-44 age group (Principally Generation X) ......................53
7.2.2 18-24 age group (Principally Generation Y) ......................54
7.2.3 45-64 age group (Baby boomers) ......................................58
4 | P a g e
7.2.4 Seniors (65+ age grouping) ................................................61
8 Switching costs .......................................................................................... 62
9 Customer inertia and difficulty in switching mobile carriers .................... 64
9.1 Ambivalence .......................................................................................... 66
9.2 Confusion and inadequate consumer product knowledge ..................... 66
9.2.1 Contract confusion and inadequate knowledge .......................66
9.2.2 Bill confusion and inadequate knowledge ................................67
9.3 Acceptability of alternative service providers ....................................... 69
9.4 Time constraints ..................................................................................... 69
9.5 Difficulty in switching mobile phone carriers ....................................... 70
9.6 Customer inertia experienced in solving service problems ................... 71
10 Bill spend and bill shock ........................................................................ 72
10.1 Bill spend ............................................................................................. 72
10.2 Unexpected costs ................................................................................. 74
10.3 Causes of bill shock ............................................................................. 75
10.3.1 Gender differences ..................................................................76
10.4 Attitudes towards bill shock ................................................................. 76
10.5 Actions taken as a result of bill shock ................................................. 77
11 Product knowledge and financial literacy .............................................. 78
11.1 Perceptions of product knowledge – Contracts and bills ..................... 78
11.2 General perceptions of knowledge of mobile phone services ............. 78
12 Current mobile phone plans used ........................................................... 82
12.1 Introduction-the current plans used ..................................................... 82
12.2 What is included in the current mobile phone plan ............................. 82
12.3 Under/over spending ......................................................................... 85
12.4 Cost of types of plans used .................................................................. 85
13 Customer satisfaction and value ratings ................................................ 89
13.1 Customer satisfaction ....................................................................... 89
13.2 Customer value ratings ........................................................................ 89
14 The pull factors and switching-in .......................................................... 93
14.1 Introduction ....................................................................................... 93
15 Satisfaction with customer service by mode of contract ....................... 95
16 Sources –importance of information used ............................................. 97
17 Distribution channels ........................................................................... 103
17.1 Consumers purchasing preferences ................................................. 103
17.2 Consumer search preferences by source credibility ........................ 104
Macquarie University Research Staff ............................................................ 114

5 | P a g e
Dr David Gray – Chief Investigator ........................................................... 114
Dr Steven D’Alessandro - Investigator ...................................................... 115
Dr Leanne Carter - Investigator ................................................................. 116

6 | P a g e
Executive Summary Executive Summary
(i) Introduction This study presents the findings of research conducted by Macquarie
University in association with amaysim Australia Pty Ltd into the switching attitudes and behaviours of mobile phone consumers in the Australian telecommunications market.
The research developed a ‘market performance index’ (MPI) of consumer perceptions towards the Australian market to assess how well the market is meeting the needs of the mobile phone service consumer. This MPI can then be directly compared to the performance of the mobile phone industry in the European Union.
The information in this study is designed to further investigate mobile phone user switching practices following issues highlighted by the Australian Communication Media Authority’s (ACMA) in its series of recent reports.
(ii) Objectives of the research The main objectives of the research included an investigation of the determinants of mobile phone choice; attitudes towards service providers, consumer mobile service usage and switching patterns; the barriers to changing service provider including inertia; the ability of consumers to compare different mobile phone products on offer; develop an understanding of the significance of unexpectedly high bills (i.e. bill-shock); develop an understanding of consumer perceptions raised in the ACMA (2011) and European Commission (2010 and 2011) reports around pricing, service, transparency and other important marketing practices.
(iii) Methodology The research used a mixed method approach consisting of desk research, a
search of the relevant marketing literature, an exploratory qualitative phase in which seven focus groups (n=64) were conducted in Sydney. Following this, an online survey was conducted in October and November 2011 with Australians who personally own a mobile phone and had either switched (n=800) or had seriously considered switching mobile carriers (n=800) during the last 12 months.
(iv) Key findings
(a) The performance of the mobile phone services market Consumer perception of the mobile phone services market paints a dismal
picture. The Australian version of the market performance index (MPI) presents a picture of a clearly malfunctioning market. The net result of this is the destruction of brand equity and the reputation of those companies who operate in the market. The European Commission (2011) studies found similar but less severe patterns of behaviour with respect to market malfunctioning. Such malfunctioning could occur because of anti-competitive activities, inadequate consumer protection laws, product
7 | P a g e
complexity and voluminous product information making it difficult to understand or compare product offerings. Many of these aspects apply to the Australian telecommunications market.
The results contained in this report clearly show that the market performance as perceived by Australian mobile phone service consumers is in all areas, significantly worse than the European Union average. That is, consumers in Australia find it harder to compare mobile carrier offers; they have little trust in the industry to respect their rights as a consumer; they experience more problems and complain more than their European counterparts; they find it harder to switch suppliers; mobile carriers don’t live up to consumer expectations and finally consumers don’t think that the mobile carriers behave ethically.
(b) Switching behaviour and savings achieved The survey results indicated that more than half of all mobile phone service
consumers have either switched or seriously considered switching during the last 12 months. This is a high level of churn for this industry. Specifically, 16% of Australia’s mobile phone service consumers switched their carrier in the last 12 months and 41% of consumers had seriously thought about switching but not as yet done so. This indicates a very low level of brand loyalty within the industry. The estimated savings achieved by consumers as a result of the switching process in 2011 were estimated to be $623 million per annum.
(c) Consumer satisfaction with mobile carriers Consumers who have switched have higher levels of happiness and
satisfaction with their current supplier compared to those who have not switched. Mobile phone non-switchers are more likely to be ambivalent towards their current mobile service provider in respect of happiness and satisfaction.
Overall, the majority of all survey respondents are ambivalent towards their current mobile service provider in respect of happiness and satisfaction.
• 33.2% are happy with their current provider – 24.9% are also satisfied • 13% are not happy with current provider – 14.2% are also not satisfied
The majority of respondents who switched mobile phone carrier are happy and satisfied with their current mobile service provider.
• 52.6% are happy with their current provider – 43.3% are also satisfied • 6.7% are not happy with current provider– 7.1% are also not satisfied
Mobile phone non-switchers are more likely to be ambivalent towards their current mobile service provider in respect of happiness and satisfaction as compared to switchers.
• 14.0% are happy with their current provider – 24.9% are also satisfied • 19.2% are not happy with current provider – 8.4% are also not satisfied
(d) Major reasons for switching carriers The top reasons consumers either switched or seriously considered switching
mobile carriers are:
• Poor coverage (39%)
8 | P a g e
• Poor customer service (30%) • They wanted a new handset (30%) • They used their mobile phone more than they anticipated and needed a
new plan (22%) • Friends and family on a different network (17%) • Their mobile was being used less than anticipated (17%).
(e) Switching costs Consumers’ perceptions as to the level of switching costs fall mainly into three
categories: 68% reported that there is a cost of time and effort in making a switch decision; 58% indicated that there was an element of fear that the new provider may indeed end up providing an inferior service and 55% were concerned with not being able to keep their handsets. These concerns all highlight a significant gap in consumer knowledge about the mobile phone switching process.
Demographically, women in general are more concerned about the difficulty of switching than men; women are more concerned about the monetary costs of switching; and younger people are more inclined to spend the time and energy to switch than older people.
(f) The role of inertia in limiting switching A comprehensive understanding of inertia suggests that it is likely to be a
multi-dimensional construct comprised of ambivalence, confusion, acceptability of alternative service suppliers providers and time constraints. The influence of inertia represents a major cause of non-switching which includes:
• 39% reported indecisiveness when evaluating mobile phone carrier products
• 45% reported being conflicted when evaluating mobile phone carrier products
• 45% reported having mixed emotions when evaluating mobile phone carrier products.
There is evidence of confusion and inadequate customer product knowledge particularly in reference to the contract and bills received. In actual fact, it is the switcher who is more confused than the non-switcher. Contracts are too complex, and take far too long to read. Around 30% of respondents indicated that bills are too complex, however, bill understanding generally increased with age.
The third element of inertia is the acceptability of alternative service suppliers as nearly half of all respondents indicated that all service providers offer a similar range of services and challenges.
Time constraints influence the perceived relationship between price, quality and value. Overall around 47% of respondents indicated they required more time to make a decision to switch.
(g) The reasons for not switching Respondents who had seriously considered switching from their mobile phone
during the last 12 months but had not done so the following reasons emerged:

9 | P a g e
• 33% reported contract lock-in effects • 31% reported difficulty in checking comparative prices • 25% reported that the cost and effort required to switch was too large • 22% reported that that the anticipated savings were too small.
(h) Bill shock Bill shock occurs when a consumer’s bill exceeds the expected level. The
incidence of unexpectedly high bills is a continuing problem for mobile consumers. Bill shock drives consumers away from their current carriers. Bill shock was experienced by 45% of consumers on average, once every three months. Consumers on contracts with mobile phone handsets packaged together are much more likely to experience bill shock (47%) than consumers with SIM only deals (37%).
The causes of bill shock are largely the higher costs for national calls and the growing use of data. Women are more likely to experience bill shock from national calls and SMS. Males on the other hand were more likely to suffer bill shock as a result of data usage, data and roaming charges overseas.
(v) Conclusions The mobile phone service market in Australia is beset by poor consumer
perceptions which are reflected in a low market performance indicator (MPI) index relative to its European Union counterparts. This situation is largely self-inflicted and caused by a multitude of contributing factors including product complexity, poor marketing communications, haphazard network delivery, poor product design and customer service practices. All of these factors are likely to have had a significant negative impact on individual firm brand equity. However, they are reversible. All the major players in the industry have the resources to eliminate the kind of problems consumers have identified in this report. The question is whether the industry has the will to tackle these issues. Based on past performance and the increasing concern expressed by the ACMA, it now seems inevitable that the industry will be forced to comply with measures that are designed to improve consumer protection and reduce the level of complaints and product complexity.
10 | P a g e
Introduction 1 Introduction
Since the late 1990s, Australia has witnessed an explosion in telecommunications activity particularly through mobile phone networks. In 2011 according to Euromonitor there were 25.5 million mobile phone subscriptions compared with 18.4 million in 2005 or more than one subscription per person. Unfortunately, until this study there was no current publicly available data on the per centage of mobile phone users that switch service providers. Using survey data generated from this study we estimate that 16% of consumers or about 2.47 million people switched their mobile service provider in 2011.
The extraordinary growth in mobile services has however, been associated with an acceleration in the level of consumer problems and complaints. In a recent series of enquiries the Australian Communication Media Authority (ACMA) cited evidence of excessive levels of consumer complaints and poor customer service in the Australian telecommunications industry. ACMA argues that the industry’s poor performance imposes real and significant costs on both consumers and industry. The ACMA (June 2011) report into the functioning of the mobile phone market identified many systemic marketing related weaknesses including the need for clearer pricing information in advertisements; a better and simpler and standardised approach to providing information about plans; better complaints management; tools to monitor usage and expenditure to help reduce the risk of bill shock and the ability compare service provider customer care procedures and performance.
As a consequence of the issues raised by ACMA, Macquarie University and amaysim Australia Pty Ltd decided to undertake a research program to better understand the switching attitudes, motivations and behaviours which underpin the mobile phone telecommunications market in Australia.
This research examines why mobile phone service markets are not working well for consumers in Australia to assist public policy makers to reduce consumer complaints, switching costs and eliminating the problems of bill-shock. It reviews the existing scholarly literature, government/media reports and conducts a benchmark survey to establish the causes of customer complaints and consumer product confusion. This research is also designed to assist the telecommunications industry to improve its marketing practices and its market orientation and to gain competitive advantage in an increasingly competitive global environment.
This research will also investigate options regarding firm marketing practices and strategy and government policy by disseminating information to reduce the impact of market malfunctioning and providing a base for the mobile phone industry to improve its customer service performance.
The knowledge gained and disseminated will provide the basis for further in-depth research that can improve mobile phone customer care programs, government regulation and facilitate the move towards unit pricing and industry transparency as requested by the Australian Communications and Media Authority (ACMA).

11 | P a g e
Research Methodology
2 Research Methodology
2.1 Introduction This project evaluates the switching attitudes and behaviours of mobile phone
users in Australia. It compares the attitudes and behaviour of switchers against a control group of non-switchers. The criteria selected to compare the two groups is based on an assessment of the ACMA (June 2011) Report; the European Commission (2010 and 2011) MPI Report; a literature review and qualitative focus group study specifically conducted for this research.
Identifying the causal impact of the drivers of switching behaviour and the contribution of the marketing practices identified previously will enable an assessment of the impact of the differences in marketing practices on firm and mobile phone market performance.
The conceptual model of mobile phone carrier switching process is empirically tested in an on-line survey including an examination of the various moderating variables including consumer life-cycle stage, gender, product knowledge, switching costs and customer inertia that might impact on the link between marketing practices, switching and firm performance.
This research investigates consumer perceptions of the functioning of the mobile telecommunications market in Australia. One of its aims is to establish a monitoring system of the market performance of the mobile telephone services industry in Australia. Such a monitoring system can be used as the basis for indicating the health of the mobile telecommunications market as it relates to yielding desired outcomes for consumers. A principal longer term aim of the research is then to assess consumer experiences and the perceived conditions of the mobile telecommunications market as it changes over time.
Mobile phone carriers in Australia are being subjected to a number of strong forces including a significant acceleration in the number of consumer complaints reported by the Telecommunications Industry Ombudsman (2011) and pressure from ACMA for the industry to clean up its customer service and marketing practices. Mobile phone carriers face the prospect of increased government regulation as a result of these external pressures and substantial forced modification to their marketing and customer service practices as a result.
It is in this kind of context that there is cause to wonder whether the whole approach to the traditional measurement of loyalty, customer satisfaction and behavioural intentions is sub-optimal. This study attempts to consider an alternative approach by re-directing our thinking into the customer switching literature and re-evaluating attitudes towards switching mobile carriers and the role of customer inertia.
2.2 Desk research This research began with desk research using academic databases to identify
scholarly research in the field; assess the ACMA Report (June 2011) and the
12 | P a g e
European Commission (2010) MPI Report; published statistical accounts and opinions from industry experts. This phase of the research was used to establish current scholarly thinking in relation to the underlying drivers of mobile switching attitudes and behaviours and the kind of marketing practices used in the industry.
2.3 Exploratory focus groups The first wave of field research involves seven exploratory focus groups
amongst a representative sample of mobile phone users. The focus groups were conducted in Sydney and consisted of 8-10 people each and involved extended discussions up to ninety minutes in duration among mobile phone users who have switched suppliers during the last six months.
The groups are designed to evaluate the switching attitudes, under/over spend and financial implications, mobile phone plan usage patterns and attitudes towards service provider marketing and customer service practices. Informed by the desk research in Stage 1 the focus groups were used to develop a preliminary conceptual model of the customer switching process from initial dissatisfaction, through to the decision to switch and the move into the new mobile phone provider.
The focus group method allowed a multi-perspective view of reasons for certain attitudes and switching behaviours. The recruitment of the focus group respondents was managed by Taylor Research a professional market research field recruiting organisation to ensure the efficient utilisation of researcher resources. The recruitment organisation initially contacted respondents via telephone and email to ascertain the willingness of respondents to participate in the research. The researchers obtained ethical clearance from the Macquarie University ethics committee to conduct such research.
The focus groups were semi-structured with participants discussing the open-ended predetermined questions introduced by the moderator. The questions were designed to guide discussion as well as elicit specific details. A discussion guide was prepared to help ensure that the focus groups covered the topic of interest and were all conducted in a similar manner. The guide consisted of written preparatory remarks for the moderator to inform each group in the same manner about the nature of the focus group and exact questions to be addressed in the session (Zikmund, 1997). At each focus group session, the researcher was identified as being interested in mobile phone service providers and switching.
Data were collected via whiteboard summaries utilised during the group discussions. To facilitate transcription, the focus groups were also audio taped and the whiteboard summaries digitally photographed. A content analysis was then undertaken, in the form of identification of themes and discussions firstly about each of the previously identified relationship strength elements and also the identification of previously unidentified elements. In analysis, the researchers were looking for consistent reference to elements which had been identified in the literature. Literature definitions were also used to categorise discussion points.
The process of data analysis was based on Wolcott (1994) in that it incorporated the three major phases of description (relying heavily on verbatim quotes from respondents), analysis (identifying important factors, themes and relationships) and interpretation (making sense of meanings in context). Miles and Hubermann (1994) also recommend intuitive approaches to analysis of qualitative data. This

13 | P a g e
qualitative focus group study specifically conducted for this research will identify the causal impact of the drivers of switching behaviour and the contribution of the marketing practices identified previously. This will start to allow us to estimate the impact of the differences in marketing practices on firm and mobile phone market performance. The groups are designed to evaluate the switching attitudes, under/over spend and financial implications, mobile phone plan usage patterns and attitudes towards service provider marketing and customer service practices. The focus group method would allow a multi-perspective view of reasons for certain attitudes and switching behaviours.
The recruitment of the focus group respondents was managed by a professional market research field recruiting organisation to ensure the efficient utilisation of researcher and partner resources. Upon identification of potential respondents, the recruiting organisation made initial contact via telephone and email to ascertain the willingness of respondents to participate in the research.
The sample Each group represents a stage in the family lifecycle (i.e. singles; married no
children; married with children < 5yrs; married with children > 5years and < 13years; married with children >13years; married with no children at home). This involves extended discussions among mobile phone users who have switched suppliers during the last six months. The groups are designed to evaluate the switching attitudes, under/over spend and financial implications, and phone usage patterns. The structure of the groups is defined in Table 1.
Table 2.1 Focus Group Composition
Source: Macquarie University sample of respondents in focus groups
Life Cycle Group Marital Status Composition Age Participants
#
Respondents who had switched mobile phone service provider during the last 6 months
Bachelor 1 Single Half Male/Female 20-40 10
Young Couple Married/No children Half Male/Female 20-40 9
Full Nest 1 Married/Children <5 Half Male/Female 20-40 10
Full Nest 2/3 Married/Children 5+ Half Male/Female 40+ 7
Older Couple Married/No children at home
Half Male/Female +55 8
Respondents who were dissatisfied and considered seriously switching their mobile phone service provider but had not done so during the last 6 months,
Full Nest 1 Married/Children <5 Half Male/Female 20-40 10
Full Nest 1 Married/Children <5 Half Male/Female 20-40 10
Total 64
14 | P a g e
The groups were also used to develop a preliminary conceptual model of the customer switching process from initial dissatisfaction, through to the decision to switch and the move into the new mobile phone provider. The rationale behind group selection is to build an overall picture of mobile phone user attitudes and switching. This will lead to further quantitative research.
The participants received a financial benefit for participating to the sum of $80 as this is industry practice and an important means of gaining respondent co-operation (see Zikmund et al., 2011, p. 150). The following figures 2-6 summarise the demographic data of the participants in the focus groups.
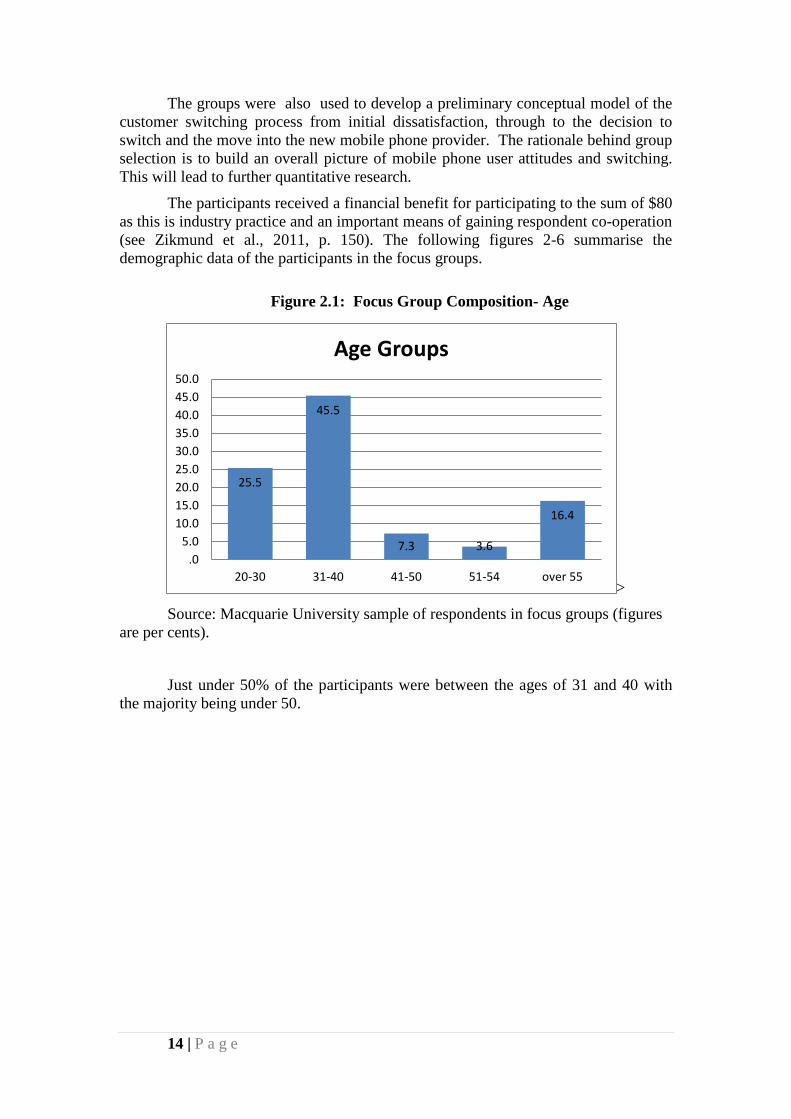
Figure 2.1: Focus Group Composition- Age
> Source: Macquarie University sample of respondents in focus groups (figures
are per cents).
Just under 50% of the participants were between the ages of 31 and 40 with the majority being under 50.
25.5
45.5
7.3 3.6
16.4
.05.0
10.015.020.025.030.035.040.045.050.0
20-30 31-40 41-50 51-54 over 55
Age Groups
15 | P a g e
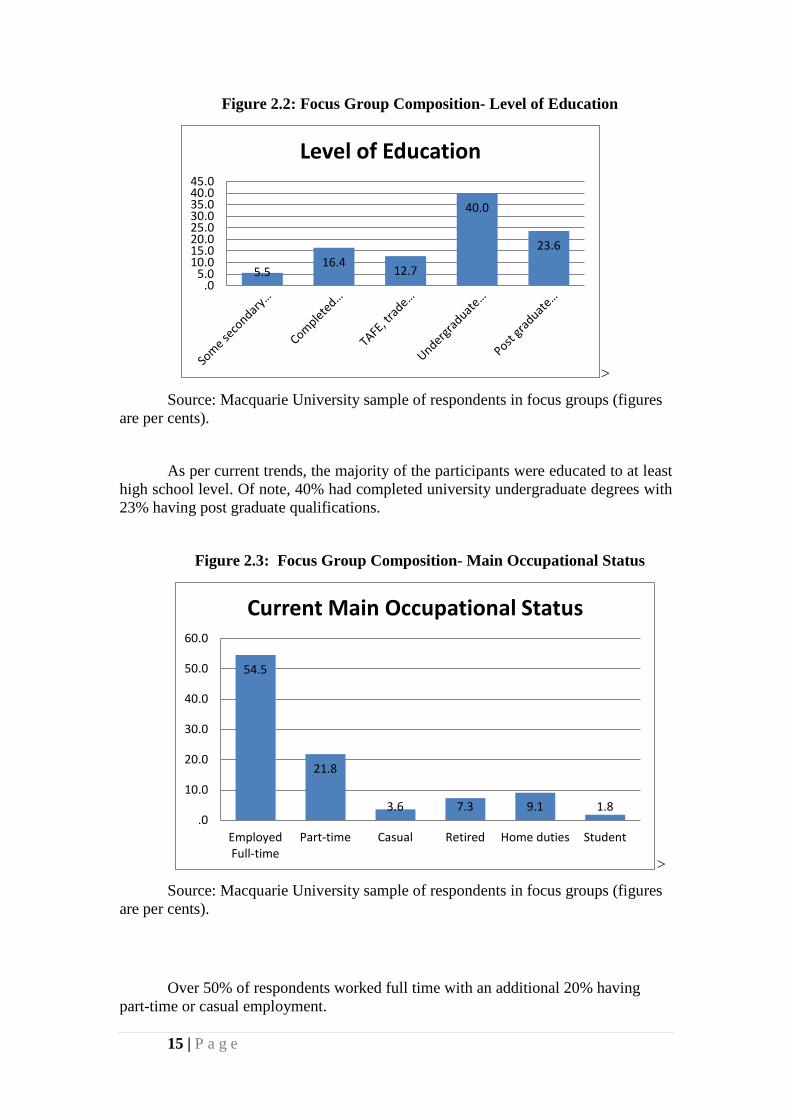
Figure 2.2: Focus Group Composition- Level of Education
> Source: Macquarie University sample of respondents in focus groups (figures
are per cents).
As per current trends, the majority of the participants were educated to at least high school level. Of note, 40% had completed university undergraduate degrees with 23% having post graduate qualifications.
Figure 2.3: Focus Group Composition- Main Occupational Status
> Source: Macquarie University sample of respondents in focus groups (figures
are per cents).
Over 50% of respondents worked full time with an additional 20% having part-time or casual employment.
5.5 16.4
12.7
40.0
23.6
.05.0
10.015.020.025.030.035.040.045.0
Level of Education
54.5
21.8
3.6 7.3 9.1 1.8 .0
10.0
20.0
30.0
40.0
50.0
60.0
EmployedFull-time
Part-time Casual Retired Home duties Student
Current Main Occupational Status
16 | P a g e
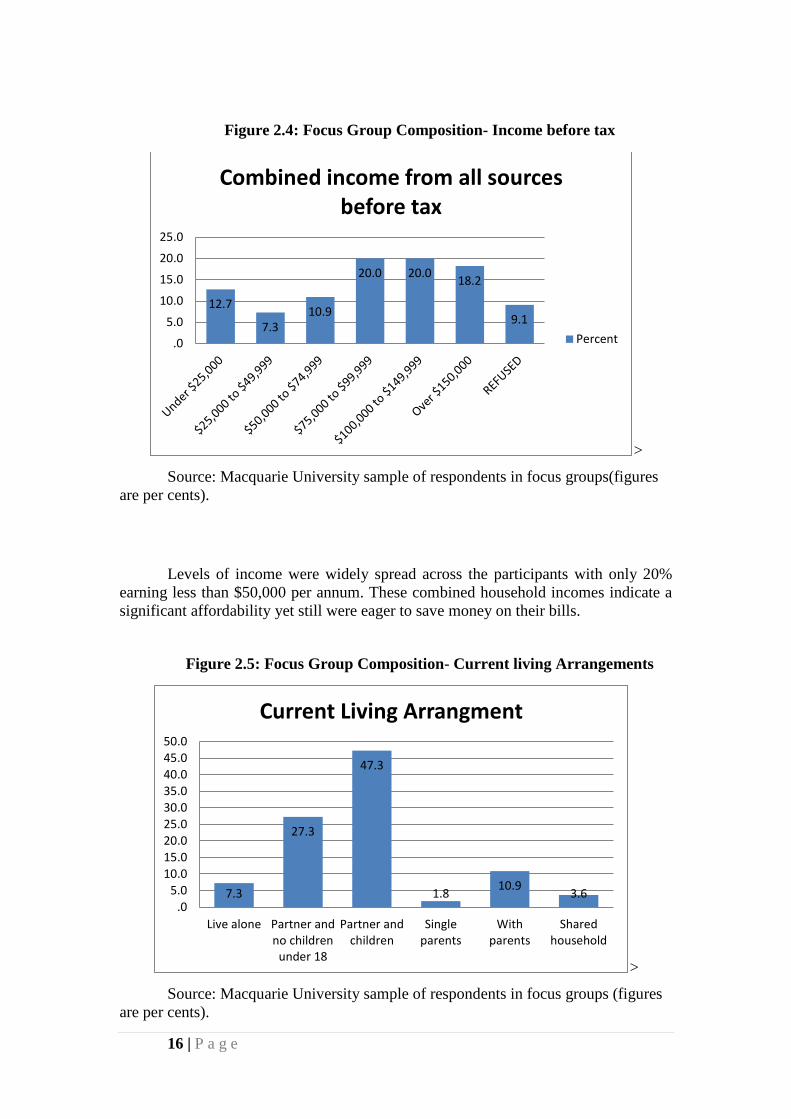
Figure 2.4: Focus Group Composition- Income before tax
>
Source: Macquarie University sample of respondents in focus groups(figures are per cents).
Levels of income were widely spread across the participants with only 20% earning less than $50,000 per annum. These combined household incomes indicate a significant affordability yet still were eager to save money on their bills.
Figure 2.5: Focus Group Composition- Current living Arrangements
>
Source: Macquarie University sample of respondents in focus groups (figures are per cents).
12.7
7.3 10.9
20.0 20.0 18.2
9.1
.0
5.0
10.0
15.0
20.0
25.0
Combined income from all sources before tax
Percent
7.3
27.3
47.3
1.8 10.9 3.6 .0
5.010.015.020.025.030.035.040.045.050.0
Live alone Partner andno children
under 18
Partner andchildren
Singleparents
Withparents
Sharedhousehold
Current Living Arrangment
17 | P a g e
Approximately half of the focus group respondents lived in a household with a partner and children. The other half of the participants either lived alone or with a partner mainly with children. The last significant group of respondents was single parents.
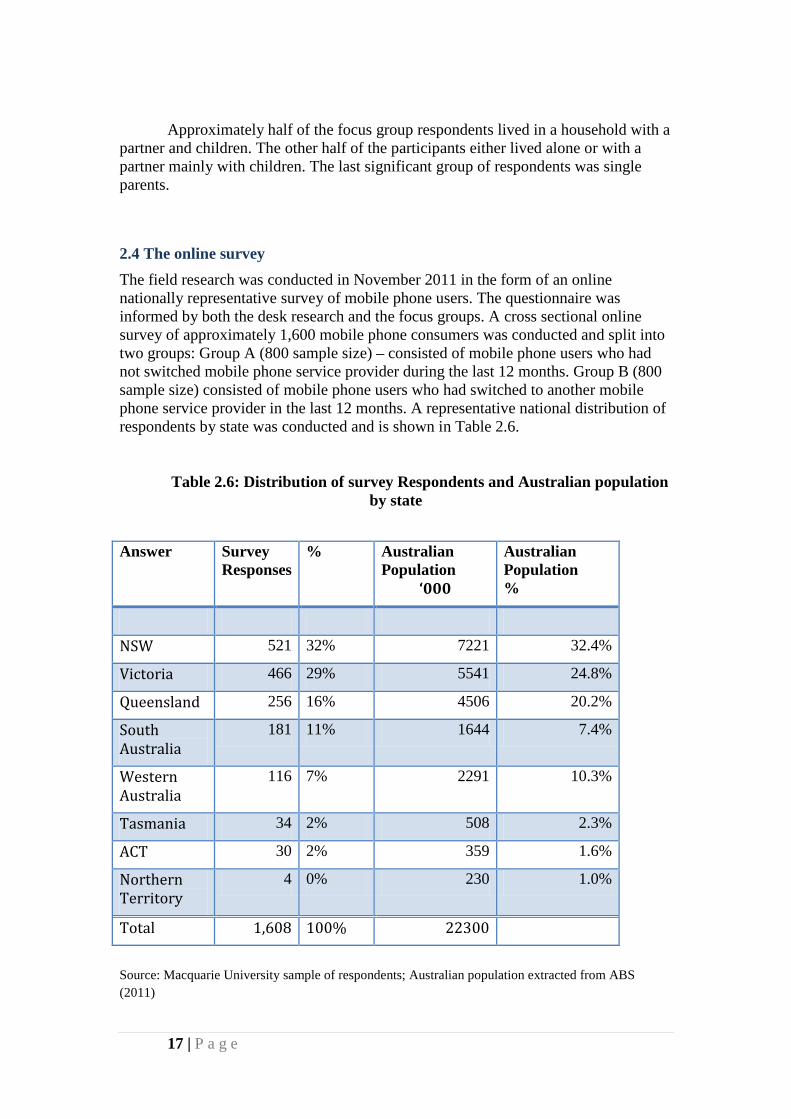
2.4 The online survey The field research was conducted in November 2011 in the form of an online nationally representative survey of mobile phone users. The questionnaire was informed by both the desk research and the focus groups. A cross sectional online survey of approximately 1,600 mobile phone consumers was conducted and split into two groups: Group A (800 sample size) – consisted of mobile phone users who had not switched mobile phone service provider during the last 12 months. Group B (800 sample size) consisted of mobile phone users who had switched to another mobile phone service provider in the last 12 months. A representative national distribution of respondents by state was conducted and is shown in Table 2.6.
Table 2.6: Distribution of survey Respondents and Australian population by state
Answer Survey
Responses % Australian
Population ‘000
Australian Population %
NSW 521 32% 7221 32.4%
Victoria 466 29% 5541 24.8%
Queensland 256 16% 4506 20.2%
South Australia
181 11% 1644 7.4%
Western Australia
116 7% 2291 10.3%
Tasmania 34 2% 508 2.3%
ACT 30 2% 359 1.6%
Northern Territory
4 0% 230 1.0%
Total 1,608 100% 22300
Source: Macquarie University sample of respondents; Australian population extracted from ABS (2011)

18 | P a g e
The respondents were recruited from a commercially available consumer panel Research Now. Research Now e-Rewards, Inc. approached potential respondents randomly selected via an online panel. Research Now, e-Rewards, Inc. is a bonafide panel provider accredited and bound by the ethical practices of the International Code of Marketing and Social Research Practice (ICC/ESOMAR).
The online survey investigated the switching attitudes and behaviours of Australians who use a mobile phone and their usage patterns. In particular it addressed the determinants of mobile phone choice; consumer likes and dislikes with their service provider; the barriers to changing service provider including inertia; the ability of consumers to compare different mobile phone products on offer; an analysis of consumer under and over spend trends including ‘bill-shock’; key points raised in the ACMA (2011) and European Commission (2010) reports around pricing, service, transparency and other important marketing practices.
19 | P a g e
Literature Review 3 Literature Review
3.1 Economic contribution of the mobile services market The Australian mobile telecommunications industry is a very significant
contributor to economic and social activity. Australians are heavy users of mobile phone services. According to Euromonitor International (2011) there is more than one mobile phone subscription per person (i.e. 25.54 million mobile phone subscriptions compared to 18.42 million in 2005); 92.6% of households possessed a mobile phone compared to 83.4% in 2005; consumers averaged 1208 mobile telephone subscriber call minutes per person per annum compared to 945 call minutes in 2005. In terms of spending patterns, average mobile phone spend per household in 2010 was A$16.98 per week (i.e. A$883 per annum).
The 2010 ABS Household Expenditure Survey calculated that $1.66 per week was spent on the phone handset, plus $12.17 per week on their mobile phone account plus another $3.15 per week on mobile phone charges that were not on account (ABS 2010). In 2010 the total size of the mobile telecommunications market in Australia was estimated to be $6,700 million (i.e. extrapolating from the ABS Household Expenditure Survey 2010). Compared to the average total household budget, mobile phone expenditure represents 1.37% of household expenditure and 1.00% of gross household weekly income (i.e. average household spending on goods and services represented A$1236 per week - ABS 2010; as at June 2010 there were 8.4 million households and total average household income in 2010 represented A$1688 per week).
3.2 Customer switching A discussion of mobile phone carrier switching behaviour will inevitably lead
to consideration of its major antecedents: service quality, loyalty, customer satisfaction and behavioural intentions. Whilst there is a vast literature covering all of these areas there is little doubt that a reduction in customer switching can be profitable and research has shown that it is a more profitable strategy than gaining market share or reducing costs (Zeithaml, Berry, and Parasuraman 1996). A number of models have been built to describe the customer switching process including the following: (Keaveney 1995; Levesque & McDougall 1993; Stewart, 1998; Colgate & Hedge, 2001; Colgate & Lang 2001; and Lees, Garland &Wright, 2007).
The Keaveney (1995) model for customer switching is based on an analysis of critical incidents that lead to customer dissatisfaction and then to customer switching. It identified eight major factors behind service provider customer exit including: pricing, inconvenience, core service failure, service encounter failure, response to service failure, competition, ethical problems and involuntary switching. Keaveney (1995, p79) also briefly investigated the switching-in criteria for the new service provider. Whilst applicable to the banking industry approximately half of the switchers found the new service firm through word-of-mouth communications,
20 | P a g e
references, and referrals. Another 20% used active external search to find the new provider: that is, shopping around, calling around, and dropping in, also trialling the new provider. Another 20% were persuaded by marketing communications that included direct sales, promotional offers, or advertising media (e.g.Yellow Pages, newspapers).
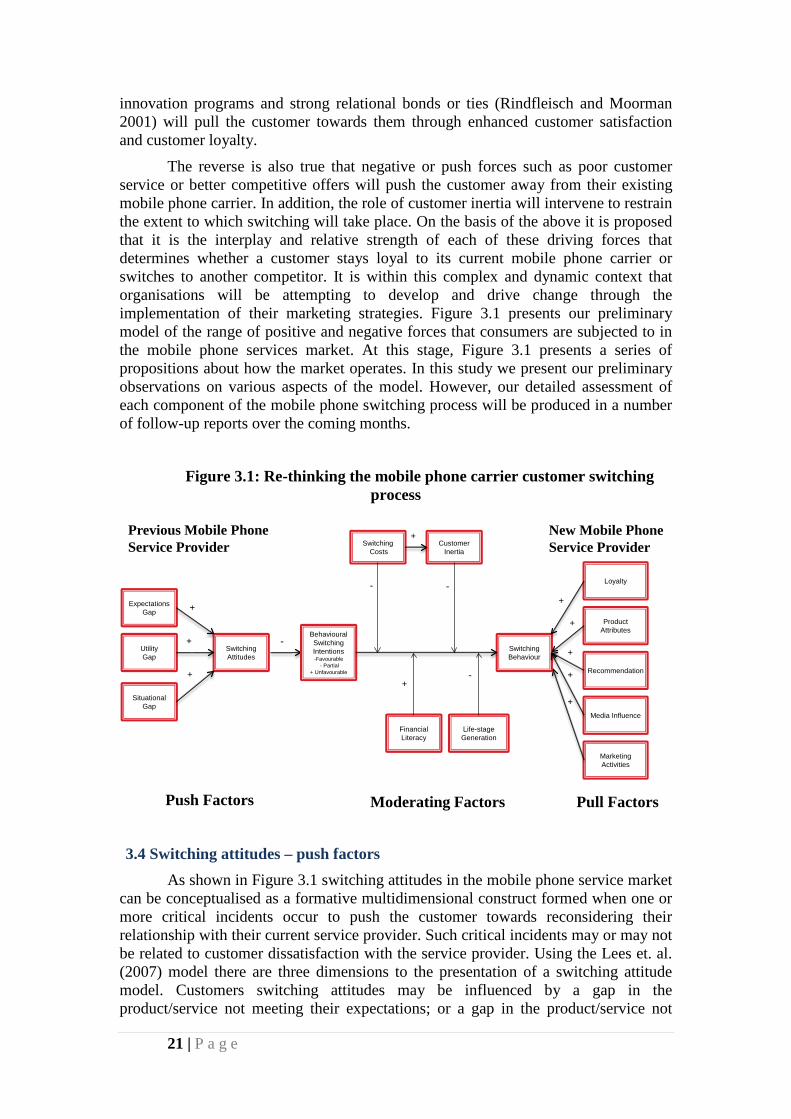
Lees, Garland and Wright (2007) re-classified Keaveney’s (1995) switching causes into three major criteria: switching for utility maximisation, switching for expectation disconfirmation and switching for stochastic reasons beyond the organisation’s control. For example, Keaveney’s (1995) categories of pricing and competition were classified into the area of utility maximisation; inconvenience, ethical problems and involuntary switching were classified into the area of stochastic category; while core service failures, failed service encounters and unsuccessful responses to failed service were classified into the area of expectation disconfirmation category. The Lees et. al. (2007) sample of 732 switchers identified the main reasons for switching: 32 % switched for utility maximisation, 31 per cent for reasons of dissatisfaction expectation disconfirmation, 22% switched for stochastic reasons, and the remaining 15% switched for a combination of any or all of these three types of reasons. Figure3.1presents a re-conceptualisation of the customer switching framework to be examined in this paper which differs substantially from previous models in three ways. First, the push factors identified from the Lees et. al. (2007) model are included in the framework. Second, the framework includes the moderating influence of switching costs on switching behaviour. Third, the framework includes the impact of customer inertia on switching behaviour. All three aspects of the model are proposed as being necessary to provide a more comprehensive picture of the switching process.
3.3 Customer switching – A new approach required One major aspect of the mobile phone industry in Australia is the
predominance of contract lock-in. That is, customers often sign up for contracts up to 24 months in advance and cannot unlock themselves from the contract unless they pay a penalty for early release. It is likely that customer switching rates are adversely affected by such practices and create an overall environment characterised by inertia. This situation raises a number of questions. Does the relatively low switching propensity mean that mobile phone service provider customers are satisfied and loyal? To what extent are they dissuaded from switching through a range of switching barriers, habit or apathy? In this case what does loyalty actually measure? With this notion of inertia in mind, there is cause to re-consider the way we think about customer loyalty and the interaction between customer loyalty and customer switching.
The strength of service quality, customer loyalty, customer satisfaction, behavioural intentions and customer switching are all subject to a range of push, pull and moderating forces with both temporal and situational context factors that will influence customer attitudes and behaviour towards specific mobile service providers. To switch mobile phone carriers a customer will be subjected to a series of often simultaneous competing positive and negative forces. Positive or pull forces will draw the customer towards them. For example, effective mobile phone media, public relations and promotional campaigns will pull the customer towards them. Likewise, effective mobile phone carrier customer service, a market oriented culture, product
21 | P a g e
innovation programs and strong relational bonds or ties (Rindfleisch and Moorman 2001) will pull the customer towards them through enhanced customer satisfaction and customer loyalty.
The reverse is also true that negative or push forces such as poor customer service or better competitive offers will push the customer away from their existing mobile phone carrier. In addition, the role of customer inertia will intervene to restrain the extent to which switching will take place. On the basis of the above it is proposed that it is the interplay and relative strength of each of these driving forces that determines whether a customer stays loyal to its current mobile phone carrier or switches to another competitor. It is within this complex and dynamic context that organisations will be attempting to develop and drive change through the implementation of their marketing strategies. Figure 3.1 presents our preliminary model of the range of positive and negative forces that consumers are subjected to in the mobile phone services market. At this stage, Figure 3.1 presents a series of propositions about how the market operates. In this study we present our preliminary observations on various aspects of the model. However, our detailed assessment of each component of the mobile phone switching process will be produced in a number of follow-up reports over the coming months.
Figure 3.1: Re-thinking the mobile phone carrier customer switching
process
3.4 Switching attitudes – push factors As shown in Figure 3.1 switching attitudes in the mobile phone service market
can be conceptualised as a formative multidimensional construct formed when one or more critical incidents occur to push the customer towards reconsidering their relationship with their current service provider. Such critical incidents may or may not be related to customer dissatisfaction with the service provider. Using the Lees et. al. (2007) model there are three dimensions to the presentation of a switching attitude model. Customers switching attitudes may be influenced by a gap in the product/service not meeting their expectations; or a gap in the product/service not
Switching Attitudes
Switching Behaviour
Utility Gap
ExpectationsGap
Situational Gap
SwitchingCosts
BehaviouralSwitching Intentions-Favourable
- Partial+ Unfavourable
-
-
+
+
+
Push Factors Moderating Factors
Product Attributes
Recommendation
Media Influence
Loyalty
Pull Factors
New Mobile Phone Service Provider
+
+
+
+
Previous Mobile PhoneService Provider
Financial Literacy
CustomerInertia
Life-stageGeneration
+
-
-
+
Marketing Activities
+
22 | P a g e
satisfying their utility needs or finally a gap which occurs because their situational context has changed.
3.4.1 The expectations-disconfirmation gap (ED) The framework depicted in Figure 3.1 defines expectations as the anticipation
of future consequences based on prior experiences (Tryon, 1994) and the beliefs or predictions about a product having desired attributes (Oliver, 1980 and 1997). Satisfaction is often then quantified through comparing a consumer’s perception of an experience (outcome), with their prior expectations of that experience (Buttle, 2009). This measurement method is known as the expectations-disconfirmation paradigm of consumer satisfaction. The Lees et. al. (2007) classification of expectations-disconfirmation includes the push forces of core service failures, failed service encounters and unsuccessful responses to failed service. Thus, the following is proposed. P1: Expectation Gap (ED) incidents during the consumption of a mobile phone service are positively related to subsequent switching attitudes (SA) of mobile phone service customers.
3.4.2 The utility maximisation gap (UM) Utility maximisation (Lees et. al. 2007) theory asserts that consumers are
consistently searching for a better utility either through better pricing and/or competitor attraction, and when they succeed they will switch brands. The pricing category includes all critical switching behaviors that involved prices, rates, fees, charges, surcharges, service charges, penalties, price deals, coupons, or price promotions (Keaveney 1995). Thus, the following is proposed. P2: Utility maximisation (UM) during the consumption of a mobile phone service is positively related to subsequent switching attitudes (SA) of mobile phone service customers.
3.4.3 Situational factors gap (SS) Situational factor incidents occur when consumers switch brands apparently
randomly or for reasons beyond the control of the mobile phone carrier including the push forces of involuntary switching, ethical problems and inconvenience (Lees et. al. 2007) or the intrusion of market factors such as technological change. Thus, the following is proposed. P3: Situational (SS) events during the consumption phase of a mobile phone service are positively related to subsequent switching attitudes (SA) of mobile phone service customers.
3.5 Behavioural intentions (BI) Zeithaml, et. al. (1996) developed a service quality model on the basis of a
dichotomous favourable/unfavourable behavioural intentions approach. They argued that favourable customer behavioural intentions lead to customer retention and that unfavourable behavioural intentions lead to customer defection. However, the inclusion of customer inertia into the equation is likely to change the nature of the loyalty model by suggesting that a summative approach to the measurement of customer loyalty is not all that helpful in predicting future customer behaviour. Rather it is suggested in this paper that a disaggregated model of loyalty including the elements of favourable, inertial and unfavourable and their interplay would be a better predictor of future customer behaviour.
23 | P a g e
3.5.1 Favourable behavioural intentions (FBI) Favourable behavioural intentions are a signal from the customer that there
exists a set of strong ties with their mobile phone service provider. Zeithaml, et. al. (1996) clearly showed that favourable behavioural intentions can be demonstrated through actions such as customer praise, customer recommendation of the firm to others, increased sales activity, or support for a price premium. Such intentions indicate strong customer ties and are a strong indicator of future loyalty and customer retention. Such favourable behavioural intentions reinforce customer loyalty which is a buyer's overall attachment or deep commitment to a product, service, brand, or organisation (Oliver 1999). In such a context it is very likely that switching attitudes will be weak and negatively related to favourable behavioural intentions. Thus, the following are proposed. P4: Customer switching attitudes (SA) will be negatively related to favourable behavioural intentions (FBI). P5: Favourable behavioural intentions (FBI) will be negatively related to switching behaviour (SB).
3.5.2 Unfavourable behavioural intentions (UBI) Customers could be pushed from one brand to another by poor service
performance or the intrusion of switching attitudes derived from the occurrence of a range of critical incidents as discussed previously (i.e. switching for utility maximisation, expectation-disconfirmation and stochastic reasons). Customers experiencing these kinds of push forces are likely to exhibit behaviours signalling that are poised to defect to another brand or reduce their consumption with their current brand. These behaviours include different types of complaining, including voice responses (such as seeking redress from the seller), private responses (such as negative word-of-mouth communication), or third-party responses (such as taking legal action as per Zeithaml, et. al. 1996). Thus, the following are proposed. P6: Customer switching attitudes (SA) will be positively related to unfavourable behavioural intentions (UBI). P7: Unfavourable behavioural intentions (UBI) will be positively related to switching behaviour (SB).
3.6 Moderating factors Moderating factors influence the decision-making process because they affect
the direction and/or strength of the relationship between an independent or predictor variable and a dependent variable (Baron and Kenny 1986). This means for example, that consumer switching behaviour may be different for consumers with high financial literacy as compared to consumers with lower levels of financial literacy. In this study we have identified a number of potential moderator variables including include gender, age, financial literacy, life-stage generation, income and the level of switching costs. In this study we consider customer inertia, switching costs and financial knowledge and literacy as possible moderators of mobile carrier switching behaviour.
3.6.1 Switching costs (SC) Switching costs are "one-time costs facing the buyer of switching from one
supplier's product to another" Porter (1980; 10). A better understanding and management of customer switching costs can help the industry in predicting rates of customer retention (Anderson, 1994; Fornell, 1992) and the development of customer loyalty programs (e.g. Bendapudi and Berry, 1997; Fornell, 1992). Burnham, Frels and Mahajan (2003, p112) identified three categories of switching costs, each with several subcategories: i.e. procedural, relational, and financial. Switching costs can act
24 | P a g e
as barriers that hold customers in service relationships. They can be either financial or psychological in nature (Burnham et. al. 2003; Jones et al. 2002; Sengupta et. al. 1997; Guiltinan, 1989). Switching costs can act as a buffer to fluctuations in service quality (Jones et. al. 2000). Accordingly, organisations can temporarily "get away with" poor service in situations where their clients perceive high costs of changing to an alternative supplier. Switching costs can also lead businesses to falsely assume that all repeat purchase customers are loyal to their organisation when many are less than satisfied but perceive the costs of switching to an alternative supplier to be too high (Dick and Basu 1994), although clearly not all customers with high perceived switching costs feel trapped. Accordingly, some suggest that the creation of switching costs can be used to complement customer retention strategies (Jones, Mothersbaugh, and Beatty 2010). This is so because they cause the customer to think more heavily about the negative consequences of switching and may delay the switching decision-making process altogether. In such a context it is very likely that switching costs will have both a direct negative impact on inertia and moderate the relationship between switching attitudes and switching behaviour. Thus, the following are proposed. P8: Customer switching costs (SC) will have a direct negative impact on customer inertia (CI). P9: Customer switching costs (SC) will moderate the relationship between behavioural switching intentions (BI) and switching behaviour (SB).
3.6.2 Customer inertia (CI) Customer inertia exists when a customer perceives that an organisation’s
service/product delivery does not meet their expectations but still continues to conduct business with the same mobile phone carrier out of habit or passivity (Beatty and Smith 1987; Campbell 1997; Anderson and Swaminathan 2011). However, the inert behaviour of customers in the mobile phone industry is a double-edged sword for the phone service providers. It is advantageous as it keeps dissatisfied customers in relationships with the carrier (Bell et. al. 2005), but on the other hand it makes it difficult to gain customers from other carriers. Ennew and Binks (1996) highlight that inertia is one of the contributing factors to “partial loyalty…[which] exists as a consequence of situational factors-such as switching costs, lack of perceived differentiation, location constraints on choice, habit of inertia” (p.221). As discussed by White & Yanamandram (2004, Colgate (1999) cites the growing need for research “...by organisations to help create strategies that overcome the inert behaviour of their competitors customers” (p.183).
The inclusion of customer inertia and the disaggregation of loyalty into its three component parts represent a more realistic approach to the measurement of customer loyalty. It is an important change because the worth of any key performance indicator such as loyalty is its ability to predict rates of both customer retention and customer defection. In the provision of mobile phone services for example, actual customer switching behaviour has historically represented only a small proportion of actual customer behaviour. Such a conclusion is supported by a recent study into mobile phone service provider switching behaviour in the European Union (2011) which showed that only 53% of customers were very satisfied that their mobile phone service had lived up to past customer expectations; only 50% of customers thought that it was relatively easy to switch mobile carriers and only 11% had actually switched suppliers. In essence, there is a sizable segment of customers who stay with their mobile phone carrier out of habit, contract lock-in or apathy and will resist switching unless the switching costs or benefits derived from switching are
25 | P a g e
exceptional. Thus, the following is proposed. P10: Customer inertia (CI) will moderate the relationship between behavioural switching intentions and switching behaviour.
3.7 Pull factors A consumer who is a customer of a mobile phone service provider will
inevitably be subjected to a series of pull factors which will attempt to attract that consumer to a particular mobile phone carrier. The literature on switching into a service provider is well established and includes such aspects as brand loyalty, product attributes (Iyengar 2008; Wagner 2011), recommendation from others including word-of-mouth (Turnbull, Leek and Ying 2000; Dierkers, Bicher and Krishan 2011), the influence of the media and direct marketing efforts for example through the sales force (Wang and Acar 2006). A major driver for the consumer is the choice of a new handset, especially a “smart-phone” (Wagner 2011), although consumers report a great deal of confusion in understanding the nature of the technology and contracts in the mobile phone service provider market and so will rely on word of mouth and the reputation of the provider (Turnbull et al. 2000). Large scale analysis of mobile phone records, suggest word of mouth effects through network neighbours of social media may explain as much as 19.5% of purchase decisions regarding choice of a mobile phone service provider (Dierkers et al. 2011).
26 | P a g e
Market Performance Indicators 4 Market Performance Indicators
4.1 The mobile phone Market Performance Indicator (MPI) The European Commission (EC 2010 and 2011) reports were the first attempts
to develop a generic market performance indicator (MPI). Such a model measured the extent to which consumer perceptions of a market such as mobile telecommunications was either performing well or was malfunctioning. The EC studies found that market malfunctioning could occur because of anti-competitive activities, inadequate consumer protection laws, product complexity and voluminous product information making it difficult to understand or compare product offerings. It also found that brand switching has a positive role in stimulating competition and that higher switching rates are linked with less frequent price increases (European Commission 2010, p6).
The MPI model developed by the European Commission incorporated the components of comparability, trust, problems & complaints and the meeting of expectations. An additional index (MPIS) also included switching behaviour and the difficulty of switching between suppliers. An assumption built into the EC model was that all components of these two indexes should be weighted equally. Lower MPI(S) scores are an indication of possible malfunctioning of the specific market from a consumer perspective. Based on an analysis of the European Commission (2010 and 2011) MPI studies, mobile phone services were one of the poorest performing industries in the European Union. Other industries with similar MPI performance were banking, fixed telephony, water, gas, electricity and specific aspects of housing including real estate services, legal services and accountancy.
Building on the themes established in the European Commission (2010 and 2011) reports this research builds and tests an MPI(S) Index for the Australian mobile phone service market. This is an important development because it establishes a benchmark from which mobile phone service providers and government regulators will be able to measure the attributes of the effectiveness of service provider customer care programs going forward into the future.
4.2 The Mobile Phone Market Performance Indicator (MPI)
• Difficulty in Comparing offers • Degree of Trust • Experience Problems • Degree of Ethics • Meeting of Expectations • Difficulty of Switching
The components of the Market Performance Indicator (MPI) used in this
research identify the extent to which the mobile telecommunications market brings the desired outcome to consumers. It adapts the MPI developed for the European Union (European Commission 2011) and is directly comparable to it.
27 | P a g e
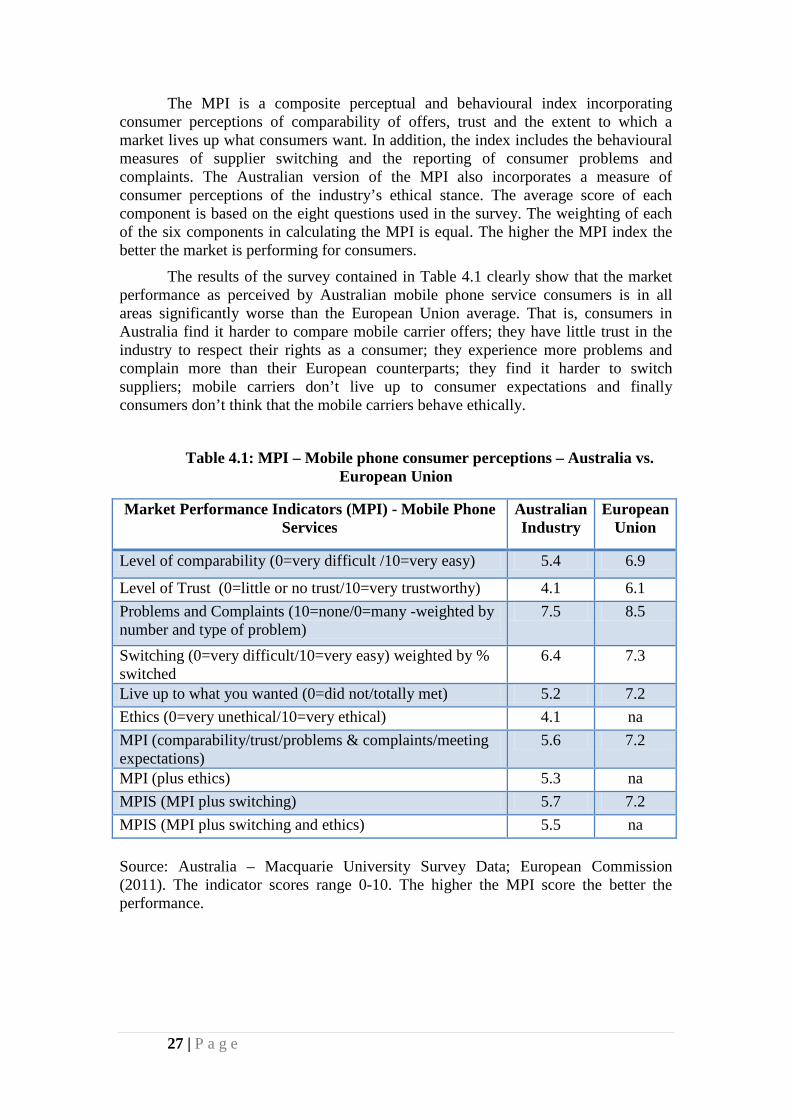
The MPI is a composite perceptual and behavioural index incorporating consumer perceptions of comparability of offers, trust and the extent to which a market lives up what consumers want. In addition, the index includes the behavioural measures of supplier switching and the reporting of consumer problems and complaints. The Australian version of the MPI also incorporates a measure of consumer perceptions of the industry’s ethical stance. The average score of each component is based on the eight questions used in the survey. The weighting of each of the six components in calculating the MPI is equal. The higher the MPI index the better the market is performing for consumers.
The results of the survey contained in Table 4.1 clearly show that the market performance as perceived by Australian mobile phone service consumers is in all areas significantly worse than the European Union average. That is, consumers in Australia find it harder to compare mobile carrier offers; they have little trust in the industry to respect their rights as a consumer; they experience more problems and complain more than their European counterparts; they find it harder to switch suppliers; mobile carriers don’t live up to consumer expectations and finally consumers don’t think that the mobile carriers behave ethically.
Table 4.1: MPI – Mobile phone consumer perceptions – Australia vs. European Union
Market Performance Indicators (MPI) - Mobile Phone Services
Australian Industry
European Union
Level of comparability (0=very difficult /10=very easy) 5.4 6.9
Level of Trust (0=little or no trust/10=very trustworthy) 4.1 6.1 Problems and Complaints (10=none/0=many -weighted by number and type of problem)
7.5 8.5
Switching (0=very difficult/10=very easy) weighted by % switched
6.4 7.3
Live up to what you wanted (0=did not/totally met) 5.2 7.2 Ethics (0=very unethical/10=very ethical) 4.1 na MPI (comparability/trust/problems & complaints/meeting expectations)
5.6 7.2
MPI (plus ethics) 5.3 na MPIS (MPI plus switching) 5.7 7.2 MPIS (MPI plus switching and ethics) 5.5 na Source: Australia – Macquarie University Survey Data; European Commission (2011). The indicator scores range 0-10. The higher the MPI score the better the performance.
28 | P a g e
Key Switching Findings - Focus Groups 5 Key Findings – Consumer switching - focus groups
5.1 Introduction Most consumers are looking for better value at all times from their mobile
phone service providers. Whilst the younger consumers were less concerned with price, most respondents found their bills are often shocking, expensive, and offer no value for money. They feel little loyalty to these firms mainly due to the lack of service and loyalty shown to them as customers by the entire industry perceiving them as just “mean”. Many felt deceived by the providers thus leading to total discontent. The perception was that promises just don’t seem to be met, by many providers. Consumers feel treated as if they are stupid and unworthy of the most basic attention and service.
Despite the fact that many customers entered into a plan, most were dissatisfied for a variety of reasons including over charging, hidden costs, poor coverage and the lack of freedom to look around until the contract had expired. Actually many respondents indicated that they would seek revenge upon the expiration of their contracts.
Many of the non-switchers indicated that they have been looking around for some time but have not made a decision. The decision will be carefully considered with strong comparisons of alternatives. However, this is the major difficulty for all consumers. Comparison of alternatives is not easy as there are many ways in which customers use mobile phone services as well as the quantities of each service. As there is no unit pricing in this industry, consumers are left with a very difficult task in this purchase decision.
As a result, the consumer is quite powerless but is continually seeking better value, wanting a better deal; however, they are under no illusion that they will receive better treatment as customers. Poor service seems to be an accepted standard in this industry.
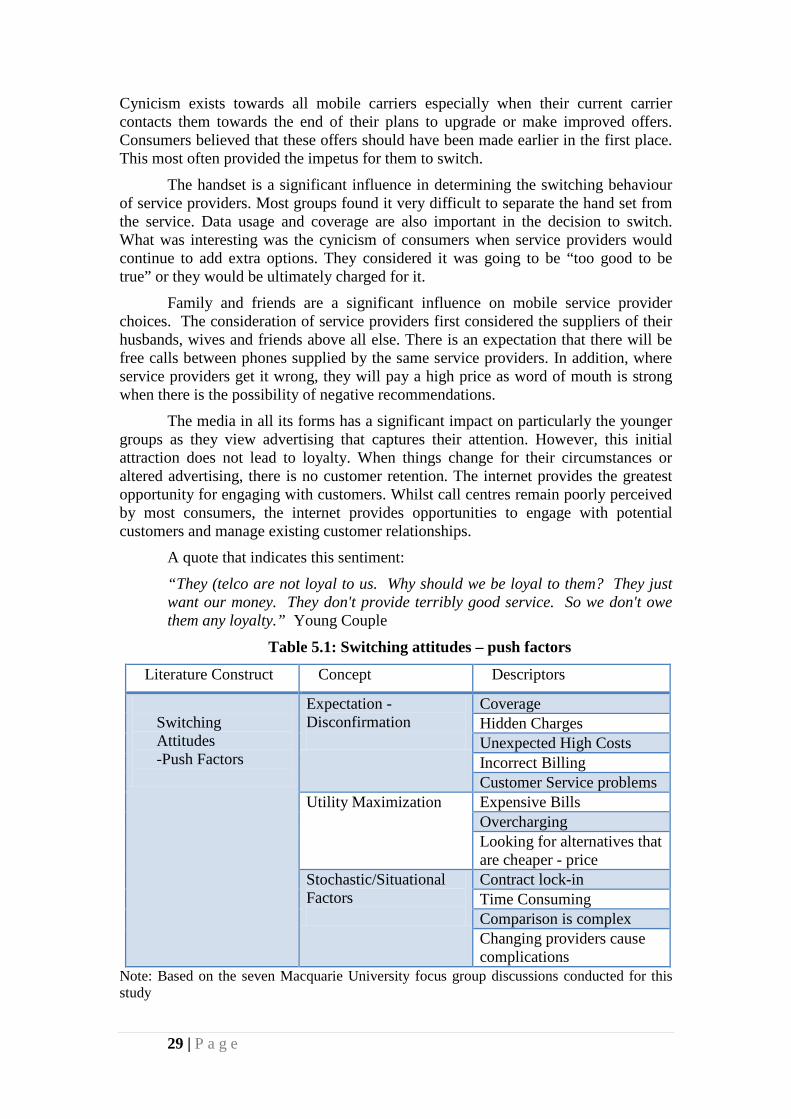
Table 5.1 and Table 5.2 provide a summary of the key elements that received considerable agreement amongst the focus group participants as being important for creating switching attitudes and behaviours as well as the difficulties leading to inertia. “Considerable agreement” is defined here as reference being made to the concept in all focus groups and given more than fleeting attention in group discussions. That is, participants spent some time discussing the concept with agreement amongst group members of its importance to switching between mobile phone service providers. Typical descriptors of each of the identified elements are also included in the table.
There is generally little or no loyalty between consumers and mobile phone service providers. They are value seeking and will usually choose to switch providers whenever a better offer can be sought. There was a high level of distrust expressed for the entire industry. Mobile phone consumers would often be counting the months until the end of the contract so that they could initiate action to move to a new provider. It is extremely easy for customers to switch once their contract had expired.
29 | P a g e
Cynicism exists towards all mobile carriers especially when their current carrier contacts them towards the end of their plans to upgrade or make improved offers. Consumers believed that these offers should have been made earlier in the first place. This most often provided the impetus for them to switch.
The handset is a significant influence in determining the switching behaviour of service providers. Most groups found it very difficult to separate the hand set from the service. Data usage and coverage are also important in the decision to switch. What was interesting was the cynicism of consumers when service providers would continue to add extra options. They considered it was going to be “too good to be true” or they would be ultimately charged for it.
Family and friends are a significant influence on mobile service provider choices. The consideration of service providers first considered the suppliers of their husbands, wives and friends above all else. There is an expectation that there will be free calls between phones supplied by the same service providers. In addition, where service providers get it wrong, they will pay a high price as word of mouth is strong when there is the possibility of negative recommendations.
The media in all its forms has a significant impact on particularly the younger groups as they view advertising that captures their attention. However, this initial attraction does not lead to loyalty. When things change for their circumstances or altered advertising, there is no customer retention. The internet provides the greatest opportunity for engaging with customers. Whilst call centres remain poorly perceived by most consumers, the internet provides opportunities to engage with potential customers and manage existing customer relationships.
A quote that indicates this sentiment:
“They (telco are not loyal to us. Why should we be loyal to them? They just want our money. They don't provide terribly good service. So we don't owe them any loyalty.” Young Couple
Table 5.1: Switching attitudes – push factors
Literature Construct Concept Descriptors
Switching Attitudes -Push Factors
Expectation -Disconfirmation
Coverage Hidden Charges Unexpected High Costs Incorrect Billing Customer Service problems
Utility Maximization
Expensive Bills Overcharging Looking for alternatives that are cheaper - price
Stochastic/Situational Factors
Contract lock-in Time Consuming Comparison is complex Changing providers cause complications
Note: Based on the seven Macquarie University focus group discussions conducted for this study
30 | P a g e
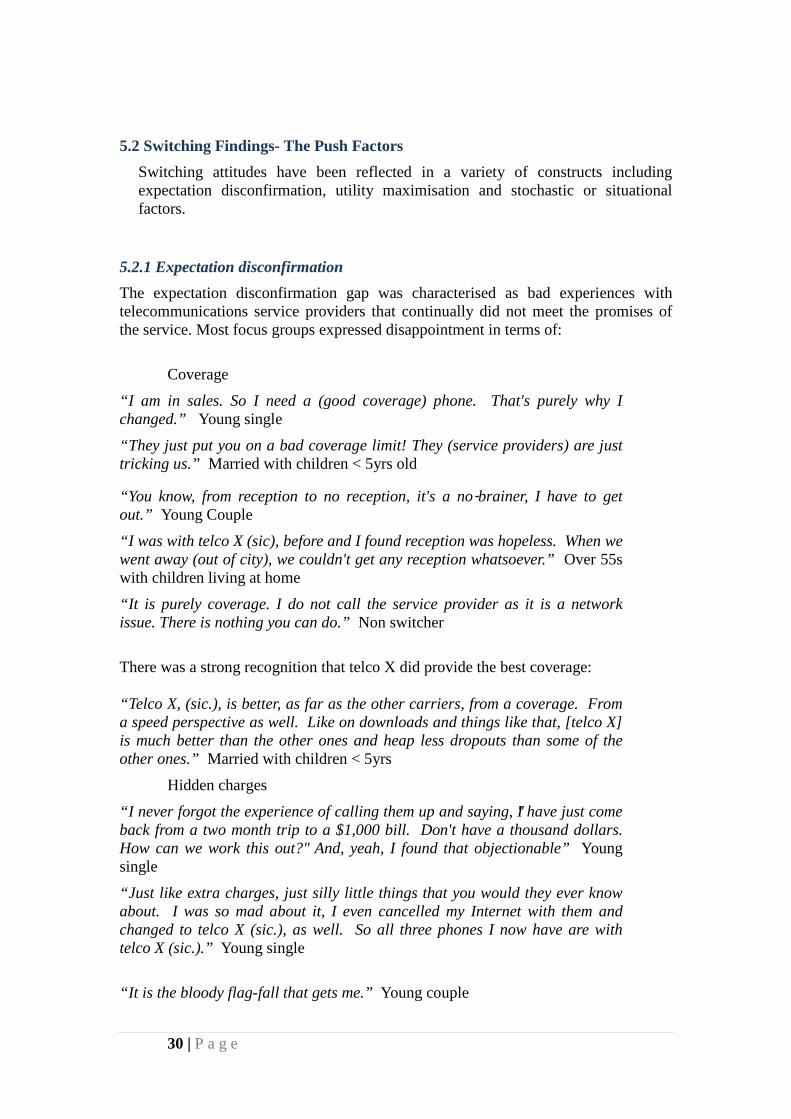
5.2 Switching Findings- The Push Factors Switching attitudes have been reflected in a variety of constructs including expectation disconfirmation, utility maximisation and stochastic or situational factors.
5.2.1 Expectation disconfirmation The expectation disconfirmation gap was characterised as bad experiences with telecommunications service providers that continually did not meet the promises of the service. Most focus groups expressed disappointment in terms of:
Coverage
“I am in sales. So I need a (good coverage) phone. That's purely why I changed.” Young single “They just put you on a bad coverage limit! They (service providers) are just tricking us.” Married with children < 5yrs old
“You know, from reception to no reception, it's a no‑brainer, I have to get out.” Young Couple “I was with telco X (sic), before and I found reception was hopeless. When we went away (out of city), we couldn't get any reception whatsoever.” Over 55s with children living at home
“It is purely coverage. I do not call the service provider as it is a network issue. There is nothing you can do.” Non switcher
There was a strong recognition that telco X did provide the best coverage:
“Telco X, (sic.), is better, as far as the other carriers, from a coverage. From a speed perspective as well. Like on downloads and things like that, [telco X] is much better than the other ones and heap less dropouts than some of the other ones.” Married with children < 5yrs
Hidden charges
“I never forgot the experience of calling them up and saying, "I have just come back from a two month trip to a $1,000 bill. Don't have a thousand dollars. How can we work this out?" And, yeah, I found that objectionable” Young single
“Just like extra charges, just silly little things that you would they ever know about. I was so mad about it, I even cancelled my Internet with them and changed to telco X (sic.), as well. So all three phones I now have are with telco X (sic.).” Young single
“It is the bloody flag-fall that gets me.” Young couple
31 | P a g e
“It was always over and it was very hard to predict how much the bill would be every month. I couldn't really see like, some months I would think, "I've hardly used my phone," and then I would have a shock. I would try and look at the bill and it was so confusing...” Married couple with children < 5years.
Surprisingly high cost
“...and the huge bills. I mean, $700 bills for when I knew I wasn't making that many phone calls. There were just all these other charges stacking up. I got sick of ... I couldn't afford it.” Young single
Incorrect billing
“The Telcos play smoke and mirrors with their bills. I cannot read it. I feel like I am deceived....It is very confusing and I cannot.” Married with children < 5 years
Bad customer service both on-line and at the call centres.
“They were unwilling to provide me something more suitable.” Young single “I did battle their call centre many times until I finally just gave up and went to telco X (sic)..” Young couple
“At telco X (sic), it took 20mins to speak to someone...always palmed me off to someone else...I prefer to spend (my money) with a company that cares about me.” Married with Children < 5 years old
“Always fighting administrative battles.” Married with children >5 years old
“We had a lot of difficulty talking telco X (sic).” Over 55s
5.2.2 Utility maximisation Utility maximisation was evidenced as consumers were unhappy with their
situation and started seeking better value for the service. Many of the groups expressed this as expensive bills, overcharging for the service and looking for alternatives that offer better value.
Expensive Bills
“As far as costs are concerned, all Australian Telcos rip us off because the cost ‑ the cost of a mobile phone call is minuscule.” Married with children >5 yrs.
“I noticed that the call rates to non- telco y (sic,) phones went up considerably to about 75c per minute plus 40c connection fee...then we saw the amaysim deal”. Married with children >5yrs.
Overcharging for the service
“Just like extra charges, just silly little things that you would never know about. I was so mad about it, I even cancelled my Internet with them and changed to Teclo A (sic.)” Young couple.
32 | P a g e
“I recently got stung within my first month with Telco A (sic.) on data usage.” Young couple.
“It is the same sort of deceptive advertising. I have done marketing in the past and you say, "Buy this and you get one free." It is not free. It is part of the price. Nobody gives things away.” Married with children > 5yrs.
Looking for alternatives that are cheaper
“The plan wasn't right and I got really upset about it because it wasn't fair. I got talked into something that really I should have gone to a more expensive plan where I would have controlled the cost.” Married couple with children > 5years.
Humour was not wasted on the group. One respondent indicated “I am about to go back to a pigeon. At least if he didn’t work, you could eat him.” Over 55’s No Dependent Children.
Most groups were price sensitive. It appeared however, that due to the complicated pricing structures within this industry the consumer ended up being a price taker.
Price
“At the end of the day, it comes down to price.” Married with children > 5yrs of age “I know I have a budget and I cannot afford to go over it.” Non switcher. “They can keep me (at the end of my contract) if they do a better price.” Non switcher. “If they had a campaign that brought the prices down, I would stay (and renew my contract). Otherwise I will shop around at the end of my contract.” Non switcher. “If I want better service I am going to have to pay a lot.” Non switcher.
5.2.3 Stochastic and situational factors Situational factors are represented in consumers’ inability to change their
current plans or contracts. Being locked into a contract, usually also having a mobile phone attached to the contract, meant that consumers were locked into their current situation until its expiry. Many consumers considered their situation being affected by their contract lock-ins, they were time poor, comparisons between providers was complex and changing providers caused complications.
Contract lock-ins
“The plan locked me in”. Married with children < 5yrs "”Well, if I am going to buy a new phone, I might as well go on a plan and get my phone for free, and then I have got all the extra benefits of data usage, SMS, free calls my husband was in the same situation and he said; why don't we get a dual sort of
33 | P a g e
thing? Telco y-retailer, (sic.) was the main carrier through that offered it and we got a really good deal.” Married with children < 5yrs “Mainly I am trying to cap my expenditure....so I have gone to a cap (plan).” Married with children > 5yrs “We ended up with a 24month plan with [telco x] and wished that we hadn’t”. Over 55s no dependent children “I was on a plan with telco x, (sic.) for $49 and I never stayed within that amount. It was always over and hard to predict how much the bill would be.” Married with children > 5yrs
Time consuming
“I don’t have time to compare different plans.” Married with children <5years “I get flyers, go to suppliers like telco x, (sic.) and then go home and analyse.” Non-switcher “I will walk to Westfield, there are 3 or 4 shops.” Non switcher “I will consider visiting retail outlets in the first instance and then on-line.” Non- switcher “It is having limited time that has stopped me from calling or switching. It takes time as I want to go to several stores to do my research.” Non switcher Occasionally some respondents made decisions on-line but usually after visiting the retail outlets. But young singles and couples were not prepared to spend as much time. “I want it now.” Young couple
Comparisons between providers was complex
“It was not easy to compare rates. We just compared the benefits of each provider.” Married with children < 5yrs “Let’s say I make 100 phone calls, each lasting ten minutes. How much is that going to cost me? Nobody can tell me.” Married with children >5yrs “You have to read the fine print-looks cheap but it is expensive if you add the international, 1800 and 1300 numbers.” Young couple “It is easier to compare on-line.” Young couple
Changing providers caused complications.
“Because we are on broadband with telco x, (sic.) it makes it complicated changing.” Over 55s no dependent children

34 | P a g e
“I would need to change my email address if I change to another service provider.” Married with children > 5yrs
5.2.4 Switching attitudes (the push factors) in summary Most consumers are looking for better value at all times from their mobile
phone service providers. Whilst the younger consumers were less concerned with price, most respondents found their bills are often shocking, expensive, and offer no value for money. They feel no loyalty to these firms mainly due to the lack of service and loyalty shown to them as customers by the entire industry perceiving them as just “mean”. Many felt deceived by the providers thus leading to total discontent. The perception was that promises just don’t seem to be met, by many providers. Consumers feel treated as if they are stupid and unworthy of the most basic attention and service.
Despite the fact that many customers entered into a plan, most were dissatisfied for a variety of reasons including over charging, hidden costs, poor coverage and the lack of freedom to look around until the contract had expired. Actually many respondents indicated that they would seek revenge upon the expiration of their contracts.
Many of the non-switchers indicated that they have been looking around for some time but have not made a decision. The decision will be carefully considered with strong comparisons of alternatives. However, this is the major difficulty for all consumers. Comparison of alternatives is not easy as there are many ways in which customers use mobile phone services as well as the quantities of each service. As there is no unit pricing in this industry, consumers are left with a very difficult task in this purchase decision.
As a result, the consumer is quite powerless but is continually seeking better value, wanting a better deal; however, they are under no illusion that they will receive better treatment as customers. Poor service seems to be an accepted standard in this industry.
5.3 Switching finding: The behaviours - The pull factors Switching behaviours are reflected in a variety of constructs including
loyalty/reputation/image, product attributes, word of mouth influence and media influences.
5.3.1 Loyalty/reputation/image Loyalty, reputation and image are present when consumers develop a loyalty
to certain brands and products over time. The loyalty also can be measured by the reputation of the brand as well as the image they perceive. Focus group respondents were most definite in the behaviours that would attract them to switch to another brand. However, there appears to be very little trust towards all service providers, therefore little or no loyalty exists for any particular brand. All groups were generally distrustful of the entire industry.
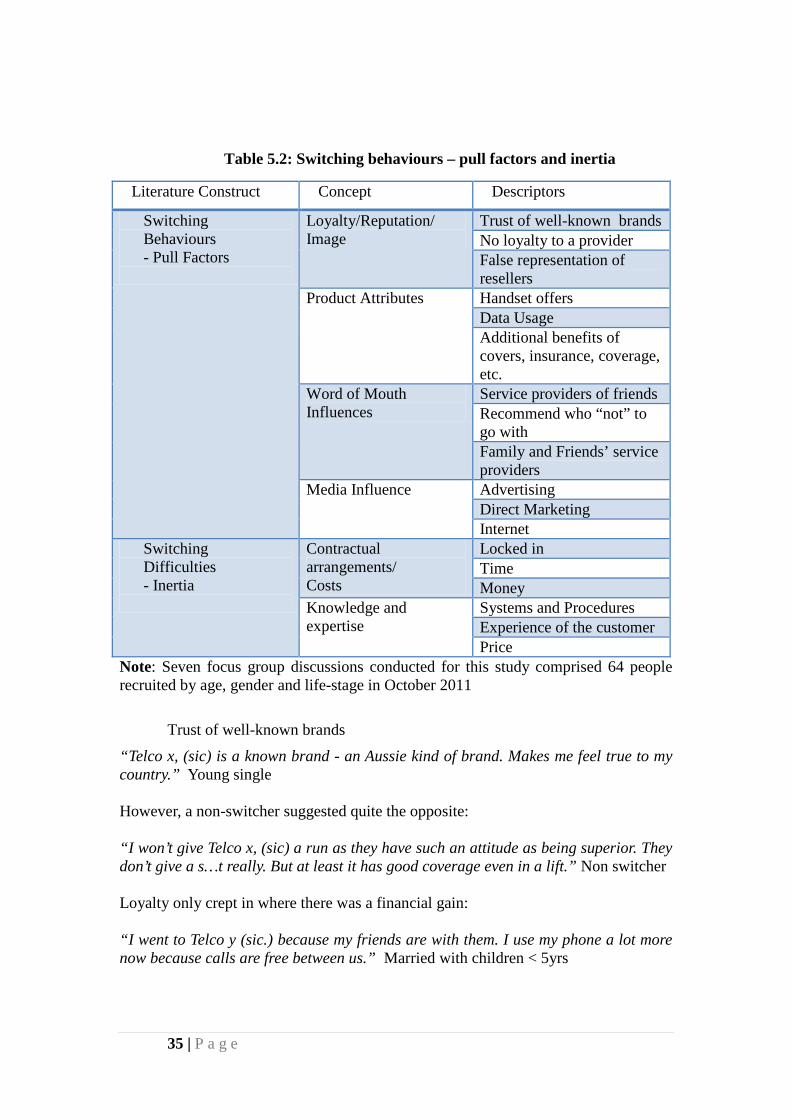
35 | P a g e
Table 5.2: Switching behaviours – pull factors and inertia
Literature Construct Concept Descriptors
Switching Behaviours - Pull Factors
Loyalty/Reputation/ Image
Trust of well-known brands No loyalty to a provider False representation of resellers
Product Attributes Handset offers Data Usage Additional benefits of covers, insurance, coverage, etc.
Word of Mouth Influences
Service providers of friends Recommend who “not” to go with Family and Friends’ service providers
Media Influence Advertising Direct Marketing Internet
Switching Difficulties - Inertia
Contractual arrangements/ Costs
Locked in Time Money
Knowledge and expertise
Systems and Procedures Experience of the customer
Price Note: Seven focus group discussions conducted for this study comprised 64 people recruited by age, gender and life-stage in October 2011
Trust of well-known brands
“Telco x, (sic) is a known brand - an Aussie kind of brand. Makes me feel true to my country.” Young single However, a non-switcher suggested quite the opposite: “I won’t give Telco x, (sic) a run as they have such an attitude as being superior. They don’t give a s…t really. But at least it has good coverage even in a lift.” Non switcher Loyalty only crept in where there was a financial gain: “I went to Telco y (sic.) because my friends are with them. I use my phone a lot more now because calls are free between us.” Married with children < 5yrs
36 | P a g e
No loyalty to a provider
“They know that we need them. It (mobile phones) is an essential service.” Young couple “I just pick the lesser of two evils.” Young couple “I had no loyalty to Telco z, (sic). So I just worked out which one (service provider) had the best offer.” Married with children > 5yrs “I got a call towards the end of my plan with an extra offer that would then lock me in for another 24 months. So I decided to look around (for other providers).” Married with Children > 5yrs “I couldn’t wait to be free of them”. Married with children > 5yrs “It is easy to explore and set up a new service on-line. I just did it from home.” Over 55’s “No love lost in leaving (my current provider).” Non-switcher “I am happy to stay with my current provider even though I was actually screwed over. They are all the same.” Non Switcher
False Representation of Resellers
There was concern that the smaller resellers can be a little ‘dodgy’. There was little explanation of the fine print and the offers seemed rather generous.
“I was forced to go to Telco y, (sic) as it was merged. A lot of hidden costs were there like insurance.” Married with children < 5yrs old “They (the reseller) did not explain the fine print and tried to undersell the data limit”. Married with children >5yrs of age “The sales people are either dumb or acting intentionally dumb as they don’t tell you the whole story.” Married with children >5yrs of age “Sales people at the retail outlets pressure (me) to buy.” Young single “I did not like the offers from the new service provider asking me to switch to them. They say they are from Telco x (sic.), but actually they are not. Send me something in writing and I will have a look at it.” Over 55s
5.3.2 Product attributes Product attributes include the features and benefits attached to the entire
product offering. This gets rather complicated in a mobile phone setting as it is often difficult to separate the phone form the service provider. Product attributes are reflected in the following:
37 | P a g e
Handset Offers
“The phone is a tool of trade.” Young couple
“We picked the phone first and then went back to compare contracts”. Married with Children < 5yrs old “I am looking to upgrade my phone and I need data so that will be the base of my decision.” Married with children < 5yrs of age
“As long as the phone works, it does not matter”. Married with children > 5yrs of age
Data usage offers
“The deals are much better than 3 to 4 years ago. More generous with the data.” Young couple
Additional benefits of covers, insurance, coverage etc.
“I thought it was too good to be true because they were throwing too many things in.” Married with children < 5 yrs old. “I received an unsolicited call with a good deal and an iPhone 4 with apps plus more!” Married with children < 5yrs old
“I got free calls from mobile to home.” Over 55s
“I will look at Telco x (sic.) plans because my husband is on it and the coverage is great.” Non Switcher
Also it is important to note that some of the consumers often required more
detailed explanations of additional benefits and options.
“You have to read the fine print looks cheap but it is expensive if you add the international, 1300 and 1800 numbers.” Young couple
“The guy on the phone was too fast in explaining things. They should just tell us the important things first.” Over 55s
5.3.3 Word-of-mouth influences Recommendations and word-of-mouth influences include family, friends and
other stakeholders who are influential in the consumer decision making process at a personal level. This communication tends to be more believable as it is assumed that the communicator is speaking honestly and is unlikely to have an ulterior motive. Word of mouth for mobile phone services includes service providers of family and friends, and to be sure to recommend who “not” to go with.
38 | P a g e
Service providers of family and friends
“I went to Telco z (sic.), because my friends are with them. I use the phone a lot more now because calls are free between us”. Married with children < 5yrs of age. “My husband has Telco y (sic.), and he is happy with them so I will consider them first.” Non- switcher “It would be great to spread the cost across the entire year, to account for ups and downs, and bundled across all users in the family”. Over 55s “It is important to be on the same network as my friends”. Non switcher
Recommend who “not” to go with
This was of particular importance when customers were considering the coverage of their service.
“I would not recommend my current plan but I would go out of my way to tell people to avoid telco z (sic).” Young single
For others who use prepaid, there is no consideration of the legitimacy of word
of mouth as:
“If it is prepaid it does not matter who you are with as long as you are happy with the price and service levels.” Young single.
5.3.4 Media influence Media influence appears to have had an impact on consumer choice for mobile
phone service providers. The ability and willingness to actually engage in switching behaviour has shown to be amongst all focus groups and well supported by all media channels including advertising in mass media, direct marketing and the internet.
Advertising
“I was not aware of the new providers until I saw an ad for the plan and phone. It attracted me.” Young singles “I went to Telco a, (sic), because of the sports promotion.” Young singles On the other hand older consumers indicated that: “I (just) wanted a good phone at a good price.” Married with children >5yrs
Direct marketing
“I got a random call offer at a time I needed a phone...so I took it.” Young single “I went into the store to sign up. They were busy and ignored me. So I signed up over the phone.” Young couple

39 | P a g e
Internet
“The retail outlets made it difficult- it was easier to do (switch) on-line.” Young couple
“On-line services make switching very easy.” Married with children < 5yrs of age
Most groups suggested they were happy to deal with the service providers on-
line but they would normally do so only after visiting a retail outlet first.
5.3.5 Switching behaviours in summary –Pull factors
It appears that there is generally little or no loyalty between consumers and mobile phone service providers. They are value seeking and will usually choose to switch providers whenever a better offer can be sought. There was a high level of distrust expressed for the entire industry. Mobile phone consumers would often be counting the months until the end of the contract so that they could initiate action to move to a new provider. It is extremely easy for customers to switch once their contract had expired. Cynicism exists towards all mobile carriers especially when their current carrier contacts them towards the end of their plans to upgrade or make improved offers. Consumers believed that these offers should have been made earlier in the first place. This most often provided the impetus for them to switch.
The handset is a significant influence in determining the switching behaviour of service providers. Most groups found it very difficult to separate the hand set from the service. Data usage and coverage are also important in the decision to switch. What was interesting was the cynicism of consumers when service providers would continue to add extra options. They considered it was going to be “too good to be true” or they would be ultimately charged for it.
Family and friends are a significant influence on mobile service provider choices. The consideration of service providers first considered the suppliers of their husbands, wives and friends above all else. There is an expectation that there will be free calls between phones supplied by the same service providers. In addition, where service providers get it wrong, they will pay a high price as word of mouth is strong when there is the possibility of negative recommendations.
The media in all its forms has a significant impact on particularly the younger groups as they view advertising that captures their attention. However, this initial attraction does not lead to loyalty. When things change for their circumstances or altered advertising, there is no customer retention. The internet provides the greatest opportunity for engaging with customers. Whilst call centres remain poorly perceived by most consumers, the internet provides opportunities to engage with potential customers and manage existing customer relationships.
40 | P a g e
5.4 Switching difficulties-inertia Switching mobile phone service providers can be quite simple and easy to
undertake but there are no guarantees that there will be any improvements. There are a range of moderating factors that affect the consumers’ choice to switch despite their attitudes towards their mobile phone service providers. These moderators include contractual arrangements, costs, knowledge and expertise.
5.4.1 Contractual arrangements Contractual arrangements make switching more difficult. Until the contract
has expired most groups were not necessarily motivated to switch providers despite their level of dissatisfaction. Generally, most groups indicated there is much less difficulty in switching when contracts are expired and many suggested that it was perceived as relatively simple. It is the contract that is the hardest barrier to overcome.
“The plan locked me in.” Young couple “As long as your plan as run out, it is easy to change mobile phone suppliers.” Young single “I switched the day after my plan finished.” Young couple. versus “Anything is easier than switching mobile phones.” Young single.
Once again the negative perception of the telecommunications industry is
highlighted in these discussions.
5.4.2 Costs Costs include both time and money for these groups. Time was most often
mentioned as a cost to switching. It is so complicated that they require a great deal of time to attend to all the alternatives to make an informed decision.
Time
“It is having limited time that has stopped me from calling or switching. It takes time as I want to go to several stores to do my research.” Non switchers “You get sucked in (and just stay) because it is easier.” Non switchers “It is just getting (time to) get around to it.” Married with children >5yrs of age “At the call centre, they don’t care about my problems. At Telco x (sic), it took 20 minutes to wait and speak to someone. And then was palmed off to someone else. By the time I got to the right person the kids needed me and I just had to hang up.” Married with children >5yrs of age
41 | P a g e
Money
“I tried to break my contract but it is too expensive. You might as well do your time.” Married with children < 5yrs of age
5.4.3 Knowledge and expertise Knowledge and expertise is required when switching mobile phone providers
as most groups suggested that comparison of offers is extremely difficult.
Systems and Structures
“There seems to be no streamlined facility.” Young couple
“I have gone to the shops and looked on-line. I think the phones they offer are a big thing. They are restrictive on what phone you can have with what plan.” Non- switcher
“After complaining, you can get a better deal but it takes a lot of effort and energy to fix it”. Non-Switcher
“Frustrating, you hope you get someone (at the call centre) who will help you. They are anonymous- they won’t give you their name or ID.” Non switcher
“I think they are hopeless in call centres. You never know what country they are in and only give basic scripted answers. They don’t help you.” Non switcher
“Australian call centres are golden”. Young Single
Experience of customer
“I booked a new plan on-line. It was easy.” Married with children < 5yrs of age. “I change phones every two years. It is easy.” Married with children >5yrs of age. “If it is prepaid, it does not matter who you are with as long as you are happy with the price and service levels.” Young single
“It is such a hassle to switch. I have young children so I rang the call centre while Playschool was on TV. By the time they got me to the right person to help, Playschool was over and the kids were screaming so I just had to hang up.” Married with children < 5yrs of age
In the end many consumers indicated that switching does not matter. “As long as the phone works, it does not matter.” Married with children >5yrs of age
42 | P a g e
5.4.4 Switching difficulties –Inertia summary Switching mobile phone service providers can be quite simple and easy to
undertake but there are no guarantees that there will be any improvements. There are a number of moderating factors that affect the consumers’ choice to switch despite their attitudes towards their mobile phone service providers. These moderators include contractual arrangements, costs, knowledge and expertise.
Plans create the largest barrier to switching. Whilst many groups suggested it was relatively easy to switch providers, provided you had reached the end of your contract, there were still some serious considerations that needed to be given to the switching decision. Young Singles found less difficulty in switching when plans are expired. They also commented that their current plan providers provide temptations to stay, making improved offers just before plans end. Prepaid providers do not make it easy to negotiate as it requires the consumer to initiate a call. Loyalty and relationship building is difficult for prepaid service providers. Price and service levels are significant motivators.
It appears that many consumers consider the decision to switch for many months before the expiration of their contract and/or they take action. It was suggested that it was easier to switch on-line rather than at a retail outlet or via a call centre. Service providers need to show some basic customer care; especially at their call centres and their customer retention may improve. Varied responses came from the older age groups. Some found it easy, others difficult. What remained consistent throughout the discussions was that there is an expectation that is difficult to deal with mobile phone providers. These older groups were also more resistant to change and fear of all service providers indicating a lack of trust with the telecommunications industry. Thorough analysis of the alternative is made before the decision, thus making the switching process easier. Time and effort that is required to switch was a major barrier to switching. In addition, whilst loyalty was low, there is still fear of the unknown providers. Price/value is a major consideration for the groups with children as well as the over 55s. They were generally cynical and suspicious of the telecommunications industry.
5.5 Managerial implications The focus groups identified a number of opportunities for improving customer
service and communication based on the switching attitudes and behaviours of the consumers of mobile phone services. Push factors that encourage consumers to consider switching mobile phone service providers include poor coverage, poor customer service, dissatisfaction with current providers, and the desire for a new handset. While competitors in the industry continually provide poor service, those providers that lift their game and offer a better customer orientation, will gain a competitive advantage. Indeed, coverage is a big deal for all consumers. This needs to be top of mind in all strategic marketing decisions.
Pull factors are varied however, it cannot be ignored that many consumers are looking for a new handset at the same time as they review their service provider. To ensure no lost opportunities, the provision of handsets needs to be explored. Difficulties and inertia are largely due to contract lock-in, inability to compare offers, ambivalence, as well as the time and energy required to change. Simplification of pricing and comparisons is the key to delighting your potential customers. The power of advertising was evident as a driver of switching behaviour. A stronger focus on

43 | P a g e
advertising, focusing on ease of switching, Australian-based call centres, with well trained staff that have empathy for the frustration and feeling of abandonment felt by consumers and also focusing on simplicity and better coverage.
Consumers want respect, and they feel downtrodden. They often want revenge by switching when the contract expires – they want to get even so they bide their time until they can switch. Contracts are complicated so the secret if they are to be retained is to introduce a summary schedule of items included in the service upfront and in plain English at the signing of the contract. There is a strong need for better customer communication; better upfront communication before contracts are signed and the need for better internal marketing to educate staff on how to avoid the typical kinds of complaint problems experienced by consumers. In addition, respondents expressed strong interest in the introduction of call/SMS credit rollovers from month to month. The idea of allowing consumers to build their own package that suits their needs from a range of options, choosing only the services that suit their needs would be appealing. The establishment of a comparison website, comparing all mobile phone suppliers is an obvious future innovation that will simplify the consumers’ decisions. To complement this, the establishment of an on-line chat system could be used to resolve any queries and/or problems.
44 | P a g e
Push Factors – Findings of the Online Survey
6 Push Factors – findings of the online survey
Push factors are those which drive the consumer away from a particular brand of mobile phone carrier. The major push factors identified in a review of the scholarly literature were: failure to meet consumer expectations; failure to meet the utility requirements of consumers and finally situational factors which intervene to induce a change in consumer behaviour. In this section, we consider the preliminary findings with respect to switching behaviour and the push factors which contribute to such behaviour.
6.1 Rate of mobile phone carrier switching More than half of all mobile phone service consumers have either switched or
seriously considered switching during the last 12 months. This is a high level of churn for this industry.
Approximately 16% of Australia’s mobile phone service consumers switched their carrier in the last 12 months (Table 6.1). This switching rate is 45% higher than the European Union (European Commission 2011) experience where the switching rate to alternative suppliers in 2011 is 11% per annum. In the EU this rate varies from a high of 32% per annum in Denmark to a low of 5% per annum in France (European Commission 2011). In addition, 41% of consumers have seriously thought about switching but not as yet done so.
Industry implications are the extraordinary additional costs and inefficiencies imposed on the economy as a result of this degree of switching behaviour. Initial impressions indicate a low level of loyalty and a serious threat to customer retention strategies by the major industry players.
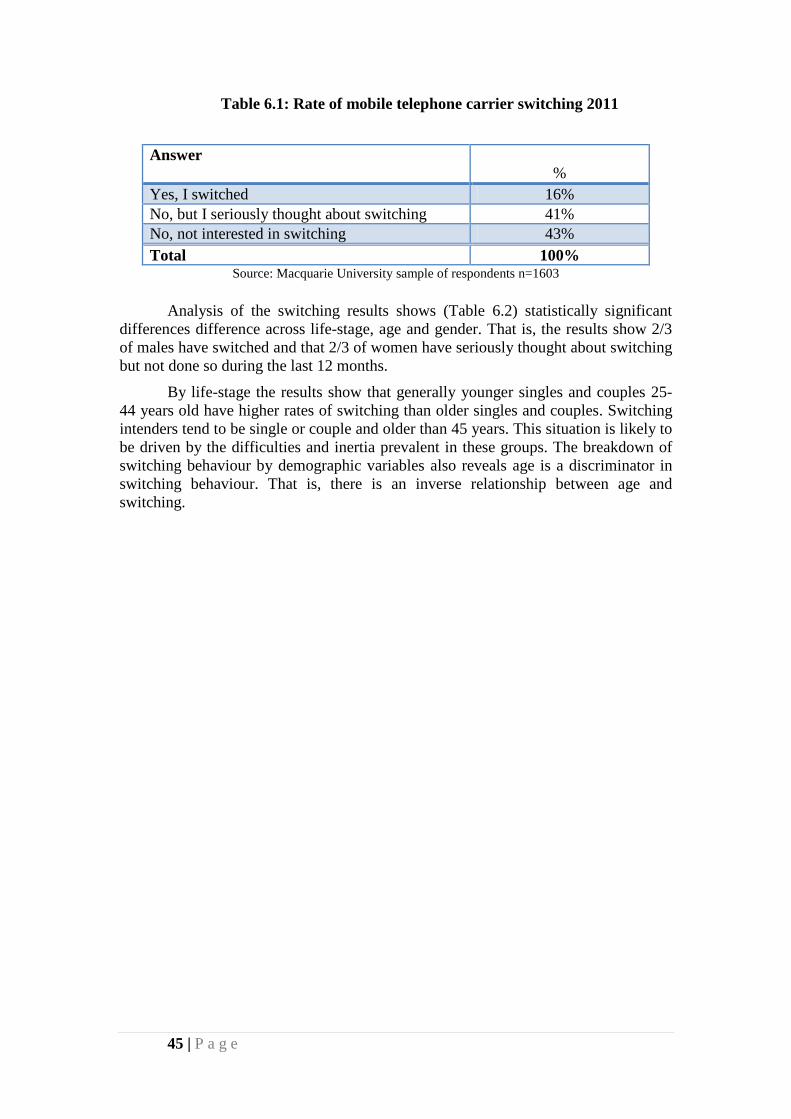
45 | P a g e
Table 6.1: Rate of mobile telephone carrier switching 2011
Answer
% Yes, I switched 16% No, but I seriously thought about switching 41% No, not interested in switching 43% Total 100%
Source: Macquarie University sample of respondents n=1603
Analysis of the switching results shows (Table 6.2) statistically significant differences difference across life-stage, age and gender. That is, the results show 2/3 of males have switched and that 2/3 of women have seriously thought about switching but not done so during the last 12 months.
By life-stage the results show that generally younger singles and couples 25-44 years old have higher rates of switching than older singles and couples. Switching intenders tend to be single or couple and older than 45 years. This situation is likely to be driven by the difficulties and inertia prevalent in these groups. The breakdown of switching behaviour by demographic variables also reveals age is a discriminator in switching behaviour. That is, there is an inverse relationship between age and switching.
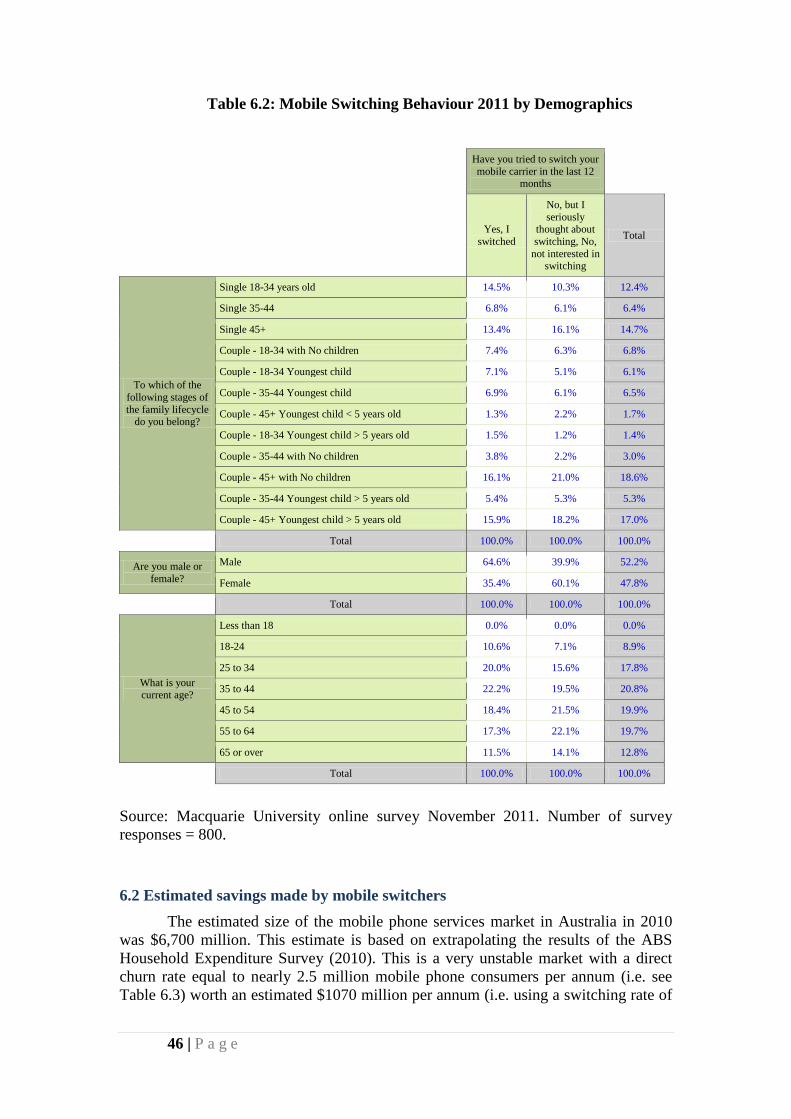
46 | P a g e
Table 6.2: Mobile Switching Behaviour 2011 by Demographics
Have you tried to switch your mobile carrier in the last 12
months
Yes, I switched
No, but I seriously
thought about switching, No,
not interested in switching
Total
To which of the following stages of the family lifecycle
do you belong?
Single 18-34 years old 14.5% 10.3% 12.4%
Single 35-44 6.8% 6.1% 6.4%
Single 45+ 13.4% 16.1% 14.7%
Couple - 18-34 with No children 7.4% 6.3% 6.8%
Couple - 18-34 Youngest child 7.1% 5.1% 6.1%
Couple - 35-44 Youngest child 6.9% 6.1% 6.5%
Couple - 45+ Youngest child < 5 years old 1.3% 2.2% 1.7%
Couple - 18-34 Youngest child > 5 years old 1.5% 1.2% 1.4%
Couple - 35-44 with No children 3.8% 2.2% 3.0%
Couple - 45+ with No children 16.1% 21.0% 18.6%
Couple - 35-44 Youngest child > 5 years old 5.4% 5.3% 5.3%
Couple - 45+ Youngest child > 5 years old 15.9% 18.2% 17.0%
Total 100.0% 100.0% 100.0%
Are you male or female?
Male 64.6% 39.9% 52.2%
Female 35.4% 60.1% 47.8%
Total 100.0% 100.0% 100.0%
What is your current age?
Less than 18 0.0% 0.0% 0.0%
18-24 10.6% 7.1% 8.9%
25 to 34 20.0% 15.6% 17.8%
35 to 44 22.2% 19.5% 20.8%
45 to 54 18.4% 21.5% 19.9%
55 to 64 17.3% 22.1% 19.7%
65 or over 11.5% 14.1% 12.8%
Total 100.0% 100.0% 100.0%
Source: Macquarie University online survey November 2011. Number of survey responses = 800.
6.2 Estimated savings made by mobile switchers The estimated size of the mobile phone services market in Australia in 2010
was $6,700 million. This estimate is based on extrapolating the results of the ABS Household Expenditure Survey (2010). This is a very unstable market with a direct churn rate equal to nearly 2.5 million mobile phone consumers per annum (i.e. see Table 6.3) worth an estimated $1070 million per annum (i.e. using a switching rate of

47 | P a g e
16% per annum). The estimated savings that could be achieved by consumers, as a result of their switching brands, is $623 million per annum.
However, these savings would be bolstered if we also included those consumers who seriously considering switching but as yet had not done so. Extrapolation of the 41% of the population that considered switching represents a market value of $2.75 billion and potential additional switching savings. This situation strongly suggests a very low level of brand loyalty when you consider that more than half the market has either switched or is at risk of switching supplier.
Table 6.3: Potential consumer savings from switching mobile carriers
Source Unit Assumptions Estimate Population 18+ March 2011 ABS Million 17.2 17.2 Population 18+ with Phone Survey Million 90% 15.5
Population Switched Survey Million 16% 2.5
Switched that saved money Survey Million 79% 2.0
Savings per month Survey $ $26.52 Savings Value $million Estimate $ Million $ 623
Note: Australian Bureau of Statistics (ABS) 31010DO002_201103 Australian Demographic Statistics, Mar 2011. Other estimates based on the Macquarie University Survey data.
It was very obvious through this study that consumers were concerned with the costs of mobile phone services that often got out of their control, despite the fact that they were on plans:
“I never forgot the experience of calling them up and saying, "I have just come back from a two-month trip to a $1,000 bill. Don't have a thousand dollars. How can we work this out?" And, yeah, I found that objectionable.” Young single
6.3 Satisfaction with current mobile phone carrier Consumers who have switched have higher levels of happiness and
satisfaction with their current supplier compared to those who have not switched but seriously thought about it. Overall, the majority of survey respondents are ambivalent towards their current mobile service provider in respect of happiness and satisfaction (Table 6.4).
• 33.2% are happy with their current provider – 24.9% are also satisfied • 13% are not happy with their current provider – 14.2% are also satisfied
The majority of mobile phone carrier switchers are happy and satisfied with their current mobile service provider (Table 6.5).
• 52.6% are happy with their current provider – 43.3% are also satisfied • 6.7% are not happy with their current provider – 7.1% are also satisfied
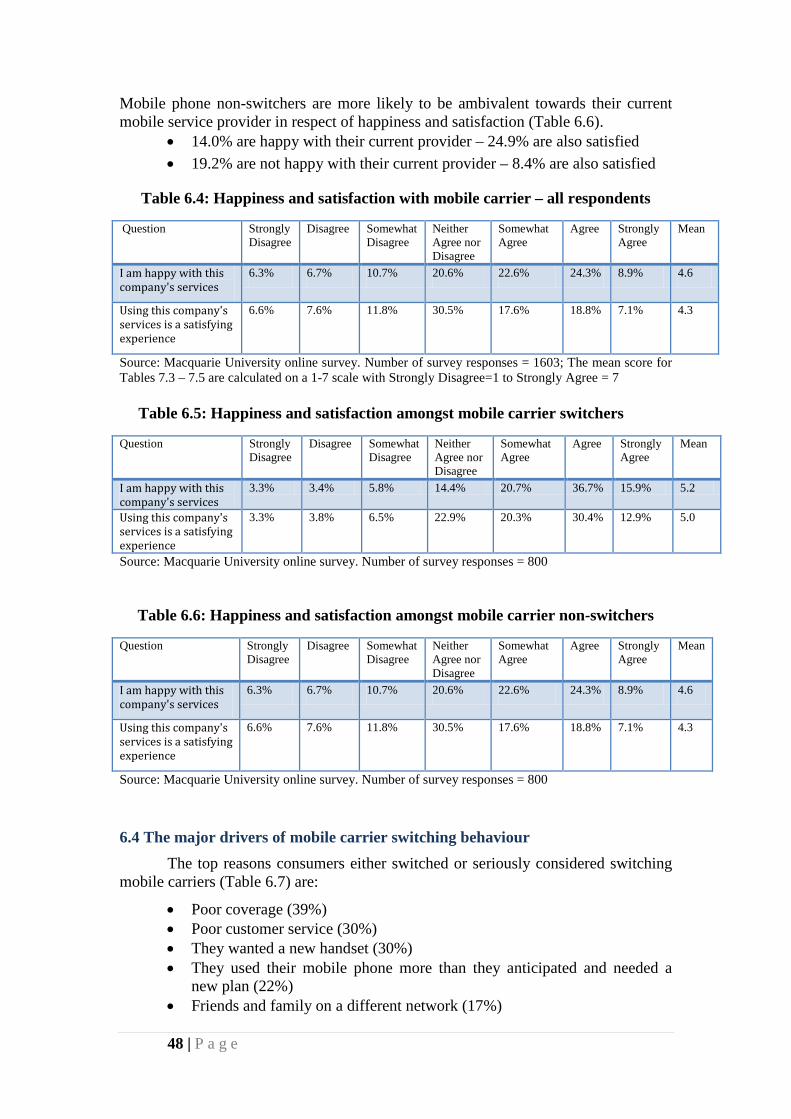
48 | P a g e
Mobile phone non-switchers are more likely to be ambivalent towards their current mobile service provider in respect of happiness and satisfaction (Table 6.6).
• 14.0% are happy with their current provider – 24.9% are also satisfied • 19.2% are not happy with their current provider – 8.4% are also satisfied
Table 6.4: Happiness and satisfaction with mobile carrier – all respondents
Question Strongly Disagree
Disagree Somewhat Disagree
Neither Agree nor Disagree
Somewhat Agree
Agree Strongly Agree
Mean
I am happy with this company's services
6.3% 6.7% 10.7% 20.6% 22.6% 24.3% 8.9% 4.6
Using this company's services is a satisfying experience
6.6% 7.6% 11.8% 30.5% 17.6% 18.8% 7.1% 4.3
Source: Macquarie University online survey. Number of survey responses = 1603; The mean score for Tables 7.3 – 7.5 are calculated on a 1-7 scale with Strongly Disagree=1 to Strongly Agree = 7
Table 6.5: Happiness and satisfaction amongst mobile carrier switchers
Question Strongly Disagree
Disagree Somewhat Disagree
Neither Agree nor Disagree
Somewhat Agree
Agree Strongly Agree
Mean
I am happy with this company's services
3.3% 3.4% 5.8% 14.4% 20.7% 36.7% 15.9% 5.2
Using this company's services is a satisfying experience
3.3% 3.8% 6.5% 22.9% 20.3% 30.4% 12.9% 5.0
Source: Macquarie University online survey. Number of survey responses = 800
Table 6.6: Happiness and satisfaction amongst mobile carrier non-switchers
Question Strongly Disagree
Disagree Somewhat Disagree
Neither Agree nor Disagree
Somewhat Agree
Agree Strongly Agree
Mean
I am happy with this company's services
6.3% 6.7% 10.7% 20.6% 22.6% 24.3% 8.9% 4.6
Using this company's services is a satisfying experience
6.6% 7.6% 11.8% 30.5% 17.6% 18.8% 7.1% 4.3
Source: Macquarie University online survey. Number of survey responses = 800
6.4 The major drivers of mobile carrier switching behaviour The top reasons consumers either switched or seriously considered switching
mobile carriers (Table 6.7) are:
• Poor coverage (39%) • Poor customer service (30%) • They wanted a new handset (30%) • They used their mobile phone more than they anticipated and needed a
new plan (22%) • Friends and family on a different network (17%)
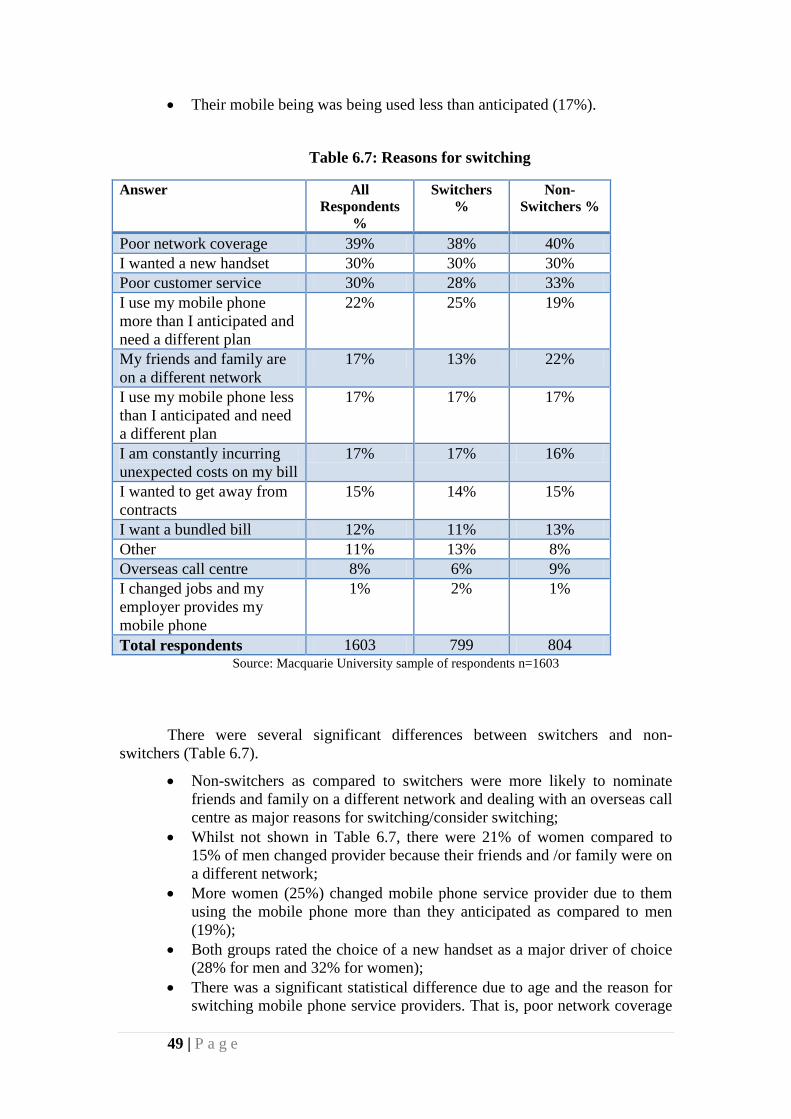
49 | P a g e
• Their mobile being was being used less than anticipated (17%).
Table 6.7: Reasons for switching
Answer All Respondents
%
Switchers %
Non- Switchers %
Poor network coverage 39% 38% 40% I wanted a new handset 30% 30% 30% Poor customer service 30% 28% 33% I use my mobile phone more than I anticipated and need a different plan
22% 25% 19%
My friends and family are on a different network
17% 13% 22%
I use my mobile phone less than I anticipated and need a different plan
17% 17% 17%
I am constantly incurring unexpected costs on my bill
17% 17% 16%
I wanted to get away from contracts
15% 14% 15%
I want a bundled bill 12% 11% 13% Other 11% 13% 8% Overseas call centre 8% 6% 9% I changed jobs and my employer provides my mobile phone
1% 2% 1%
Total respondents 1603 799 804 Source: Macquarie University sample of respondents n=1603
There were several significant differences between switchers and non-switchers (Table 6.7).
• Non-switchers as compared to switchers were more likely to nominate friends and family on a different network and dealing with an overseas call centre as major reasons for switching/consider switching;
• Whilst not shown in Table 6.7, there were 21% of women compared to 15% of men changed provider because their friends and /or family were on a different network;
• More women (25%) changed mobile phone service provider due to them using the mobile phone more than they anticipated as compared to men (19%);
• Both groups rated the choice of a new handset as a major driver of choice (28% for men and 32% for women);
• There was a significant statistical difference due to age and the reason for switching mobile phone service providers. That is, poor network coverage
50 | P a g e
was a major reason for switching for Gen X consumers aged 25-34 (48%) and for Gen Y aged 18-24 (43%);
• Poor customer service was a major reason for changing mobile phone service providers for older consumers, especially Baby Boomers or those aged 55-64, (35%) and 65+ (33%);
• Wanting a new handset was a reason for changing mobile phone service providers also for Gen Y consumers aged 18-24 (35%) followed closely by Gen X, those aged 25-34 (34%);
• Young consumers, Gen Y, aged 18-24 were also likely to change mobile phone service providers due to reasons of using the mobile more than they anticipated and needing a new plan (34% of mentions);
• There was a significant statistical difference due to family life-stage and reason for switching mobile phone service providers. For example, a new handset is important for young singles, and in the later stages of the family life-stage poor customer service emerges as a reason for changing providers. In short, push rather than pull factors become more important later in life;
• Aspects related to life-stage include young-single, consumers, 18-24 years old who changed mobile due to poor network coverage (48%) and desire for a new handset (32%). These were the same reasons for young couples, 18-34 without children, who changed mobile phone service provider due to poor network coverage, (51%) and desire for a new handset (43%).
• Poor customer service was mentioned by 59% of young couples (18-34) as a reason for changing providers. Baby boomer couples +45 with children over 5 years old rate poor network coverage (31%) and poor customer service (34%) as major reasons for changing mobile phone service providers.
Indicative quotes to support these findings from the qualitative study include:
“I was on a prepaid, where I was just topping as I needed and my phone was out of date and then I looked around and I thought, "Well, if I am going to buy a new phone, I might as well go on a plan and get my phone for free," and then I have got all the extra benefits of data usage, SMS, free calls.” Married with children
and
“We ended up with a 24-month plan with Telco Z (sic.), and wished to tell we hadn't. It's hopeless. As somebody else said, the range is disastrous.” Over 55s
6.5 Switching intentions during the next 12 months The overall majority of mobile phone consumers who switched carriers during
the last 12 months said that they are unlikely to switch in the next 12 months (Table 6.8). However, major reasons indicate that only 40.8% of those that switched during the last 12 months are happy with their current carrier and that another 27.5% are locked-in to their contract thus preventing them from switching (Table 6.8). Non-switchers on the other hand are more likely to switch carrier during the next 12 months.
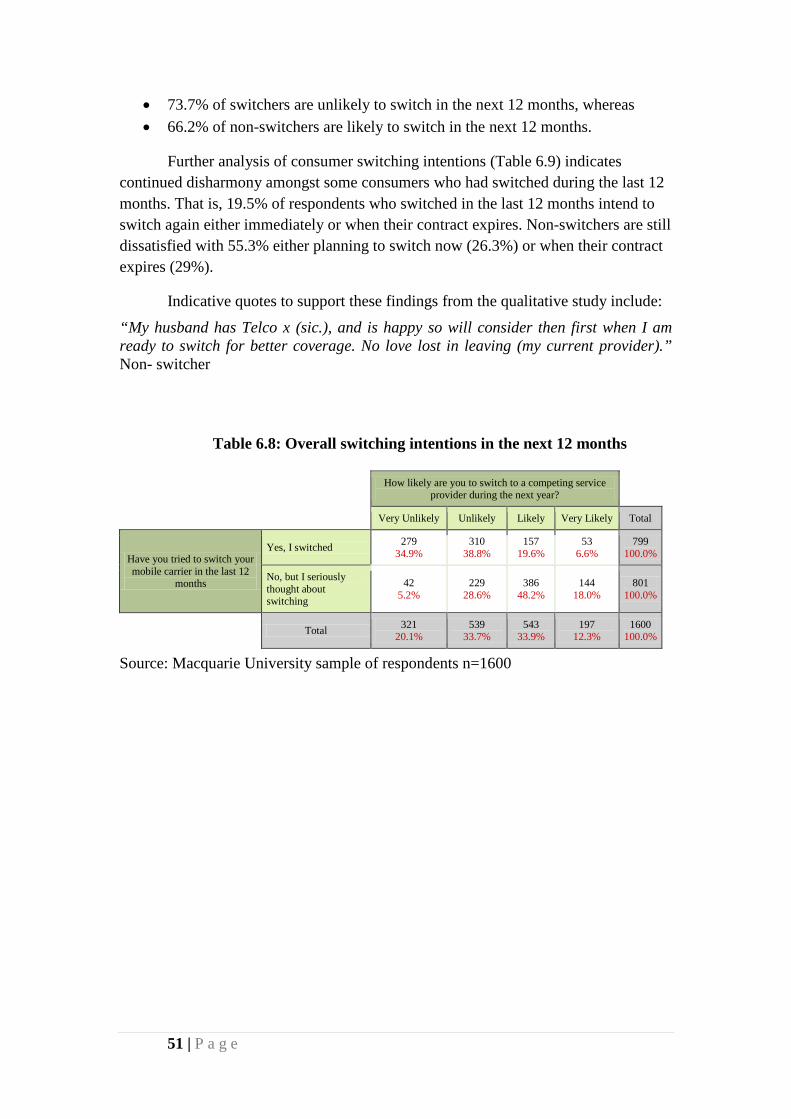
51 | P a g e
• 73.7% of switchers are unlikely to switch in the next 12 months, whereas • 66.2% of non-switchers are likely to switch in the next 12 months.
Further analysis of consumer switching intentions (Table 6.9) indicates continued disharmony amongst some consumers who had switched during the last 12 months. That is, 19.5% of respondents who switched in the last 12 months intend to switch again either immediately or when their contract expires. Non-switchers are still dissatisfied with 55.3% either planning to switch now (26.3%) or when their contract expires (29%).
Indicative quotes to support these findings from the qualitative study include:
“My husband has Telco x (sic.), and is happy so will consider then first when I am ready to switch for better coverage. No love lost in leaving (my current provider).” Non- switcher
Table 6.8: Overall switching intentions in the next 12 months
How likely are you to switch to a competing service provider during the next year?
Very Unlikely Unlikely Likely Very Likely Total
Have you tried to switch your mobile carrier in the last 12
months
Yes, I switched 279 34.9%
310 38.8%
157 19.6%
53 6.6%
799 100.0%
No, but I seriously thought about switching
42 5.2%
229 28.6%
386 48.2%
144 18.0%
801 100.0%
Total 321 20.1%
539 33.7%
543 33.9%
197 12.3%
1600 100.0%
Source: Macquarie University sample of respondents n=1600
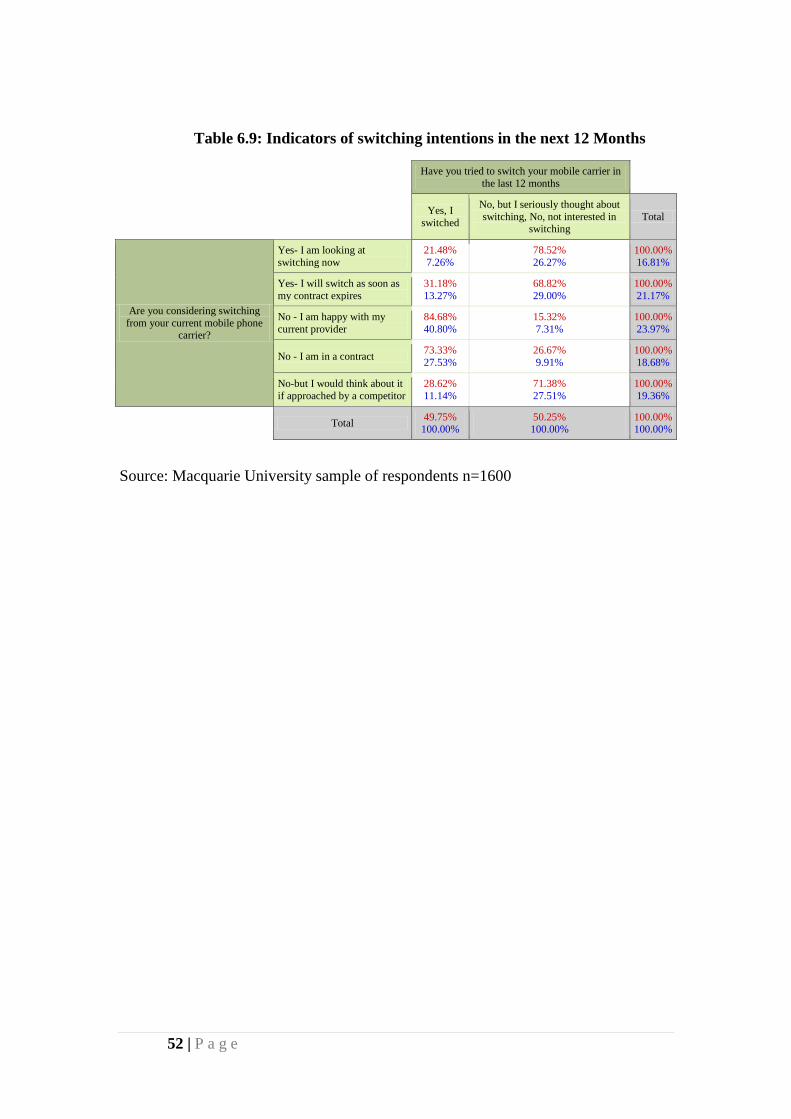
52 | P a g e
Table 6.9: Indicators of switching intentions in the next 12 Months
Have you tried to switch your mobile carrier in the last 12 months
Yes, I switched
No, but I seriously thought about switching, No, not interested in
switching Total
Are you considering switching from your current mobile phone
carrier?
Yes- I am looking at switching now
21.48% 7.26%
78.52% 26.27%
100.00% 16.81%
Yes- I will switch as soon as my contract expires
31.18% 13.27%
68.82% 29.00%
100.00% 21.17%
No - I am happy with my current provider
84.68% 40.80%
15.32% 7.31%
100.00% 23.97%
No - I am in a contract 73.33% 27.53%
26.67% 9.91%
100.00% 18.68%
No-but I would think about it if approached by a competitor
28.62% 11.14%
71.38% 27.51%
100.00% 19.36%
Total 49.75% 100.00%
50.25% 100.00%
100.00% 100.00%
Source: Macquarie University sample of respondents n=1600
53 | P a g e
Moderating Factor Influences 7 Life-stage generational influences
Moderating factors affect the direction and/or the strength of the relationship between two or more variables. This means for example, that consumer switching behaviour may be different for consumers with high financial literacy as compared to consumers with lower levels of financial literacy. In this study we have identified a number of potential moderator variables including gender, age, financial literacy, income, life-stage generation and the level of switching costs. In this study we consider customer inertia, switching costs and financial knowledge and literacy as possible moderators of mobile carrier switching behaviour.
7.1 Age, gender and income differences Switching behaviour differed significantly between mobile service provider
switchers and non-switchers by gender and age.
• 65% of mobile phone service switchers were men, whereas 60% of women seriously thought about switching but did not do so (Table 7.1);
• 53% of mobile switchers were aged 18-44 compared to 42% of non-switchers. Switchers tended to be younger than non-switchers. The rate of switching and non-switching takes an inverse V shape. The rate of switching peaks in the 35-44 age category and then declines with age. Non-switchers peak in the 55-64 age bracket (Table 7.1 and Figure 7.1);
• 43% of mobile switchers earned less than $50,000. The rate of switching and non-switching generally declines with income, apart from a spike in the $40,000-$50,000 income bracket (Figure 7.2).
7.2 Life-stage generational influences
7.2.1 25-44 age group (Principally Generation X) The 25-45 age cohort represents the majority of Generation X (i.e. born 1965-
1982). This group represents 6.4 million (i.e. 28.7% of the total population of 22.3 million or 36.9% of the 18+ aged population) people (ABS 2011). This cohort has the second highest rate of mobile phone carrier switching. Significant observations include:
• Had the highest percentage of mobile carrier switchers with an average of 42.2% of all switchers during the last 12 months. This compares to 35.1% who had seriously thought about it but had not done so (Table 7.1). The rate of switching was marginally higher than their share of the 18+ Australian population (i.e. at 36.6%);
• An average of 50% said that they were likely or very likely to switch providers in the next twelve months (Figure 7.3) and 20% said that they actually intended to switch during the next 12 months (Table 7.2 and Figure 7.4);
• An average 39% who did not switch during the last 12 months said that their contract made switching difficult; 27% said that the cost and effort
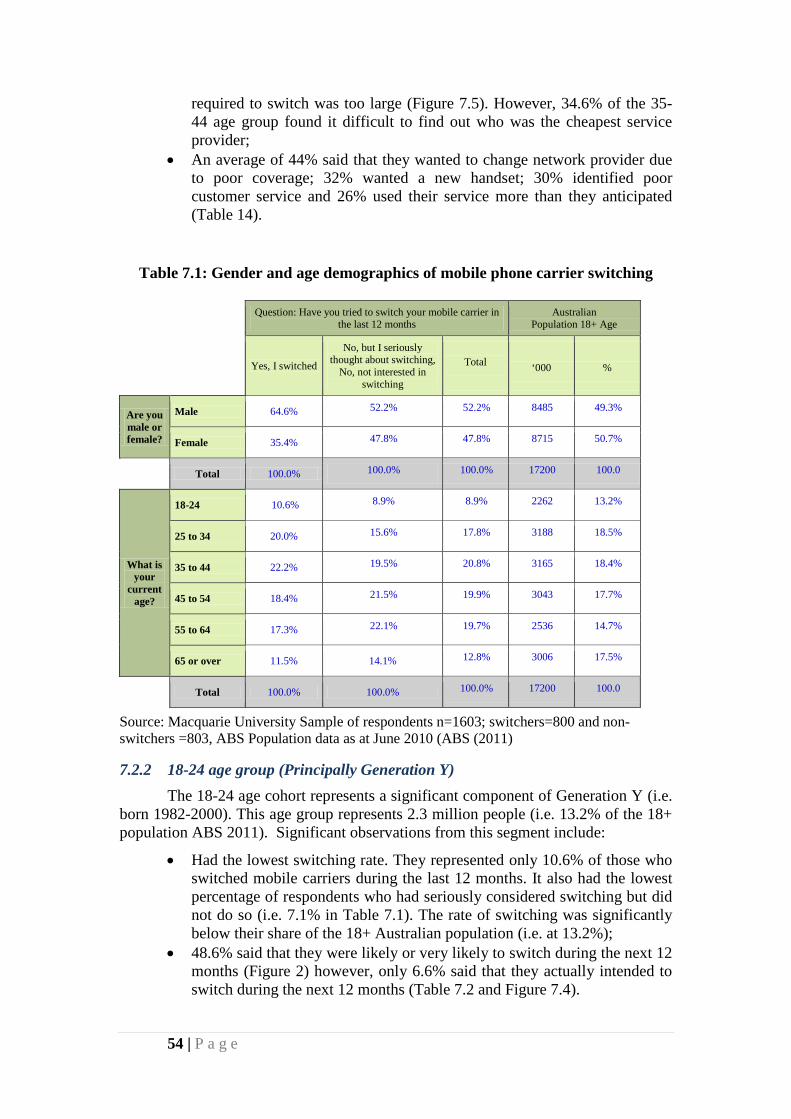
54 | P a g e
required to switch was too large (Figure 7.5). However, 34.6% of the 35-44 age group found it difficult to find out who was the cheapest service provider;
• An average of 44% said that they wanted to change network provider due to poor coverage; 32% wanted a new handset; 30% identified poor customer service and 26% used their service more than they anticipated (Table 14).
Table 7.1: Gender and age demographics of mobile phone carrier switching
Question: Have you tried to switch your mobile carrier in the last 12 months
Australian Population 18+ Age
Yes, I switched
No, but I seriously thought about switching,
No, not interested in switching
Total
‘000
%
Are you male or female?
Male 64.6% 52.2% 52.2% 8485 49.3%
Female 35.4% 47.8% 47.8% 8715 50.7%
Total 100.0% 100.0% 100.0% 17200 100.0
What is your
current age?
18-24 10.6% 8.9% 8.9% 2262 13.2%
25 to 34 20.0% 15.6% 17.8% 3188 18.5%
35 to 44 22.2% 19.5% 20.8% 3165 18.4%
45 to 54 18.4% 21.5% 19.9% 3043 17.7%
55 to 64 17.3% 22.1% 19.7% 2536 14.7%
65 or over 11.5% 14.1% 12.8% 3006 17.5%
Total 100.0% 100.0% 100.0% 17200 100.0
Source: Macquarie University Sample of respondents n=1603; switchers=800 and non-switchers =803, ABS Population data as at June 2010 (ABS (2011)
7.2.2 18-24 age group (Principally Generation Y) The 18-24 age cohort represents a significant component of Generation Y (i.e.
born 1982-2000). This age group represents 2.3 million people (i.e. 13.2% of the 18+ population ABS 2011). Significant observations from this segment include:
• Had the lowest switching rate. They represented only 10.6% of those who switched mobile carriers during the last 12 months. It also had the lowest percentage of respondents who had seriously considered switching but did not do so (i.e. 7.1% in Table 7.1). The rate of switching was significantly below their share of the 18+ Australian population (i.e. at 13.2%);
• 48.6% said that they were likely or very likely to switch during the next 12 months (Figure 2) however, only 6.6% said that they actually intended to switch during the next 12 months (Table 7.2 and Figure 7.4).

55 | P a g e
• Major reasons for not switching during the last 12 months were the cost and effort required to switch was too large (37% - Figure 3) and 30% who said that their contract made switching difficult;
• Major reasons for switching carriers during the last 12 months included poor coverage (43%), wanting a new handset (28%), and using their mobile phone service more than anticipated (34%), and poor customer service (24% - Figure 7.6).
Figure7.1: Age demographics of mobile phone carrier switching behaviour
Source: Macquarie University sample of respondents n=1603; switchers=800 and non-switchers =803
Table 7.2: Indicators of switching – age and reason for intention to switch
Question: Thinking about your repurchase intentions for your mobile phone service during the next 12 months
I intend to continue
doing business with this
company in the future
As long as the present service continues, I doubt that I would switch companies
I will choose the company again when the contract
period/prepaid plan/billing period expires
I intend to change to
another mobile service provider
Total
What is your
current age?
18-24 10.4% 8.3% 14.1% 6.6% 8.9%
25 to 34 19.0% 16.9% 18.9% 17.9% 17.8%
35 to 44 24.1% 19.8% 17.3% 21.4% 20.8%
45 to 54 16.1% 20.1% 19.5% 22.4% 19.9%
55 to 64 18.7% 19.3% 21.6% 20.1% 19.7%
65 or over 11.7% 15.5% 8.6% 11.7% 12.8%
Total 100.0% 100.0% 100.0% 100.0% 100.0%
Source: Macquarie University sample of respondents n=1603; switchers=800 and non-switchers =803
18-24 25 to 34 35 to 44 45 to 54 55 to 64 65 or overYes, I switched 10.6% 20.0% 22.2% 18.4% 17.3% 11.5%No, but I seriously thought about
switching 7.1% 15.6% 19.5% 21.5% 22.1% 14.1%
0.0%
5.0%
10.0%
15.0%
20.0%
25.0%
Perc
enta
ge
Age demographics of switching behaviour
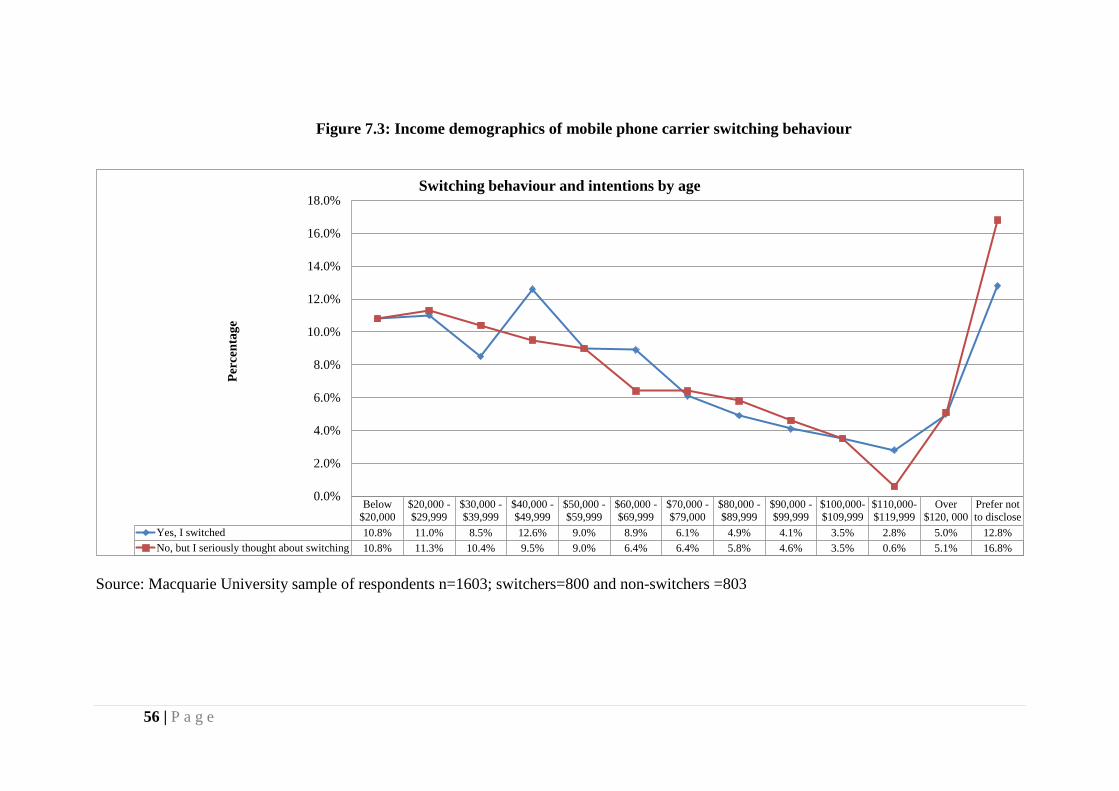
56 | P a g e
Figure 7.3: Income demographics of mobile phone carrier switching behaviour
Source: Macquarie University sample of respondents n=1603; switchers=800 and non-switchers =803
Below$20,000
$20,000 -$29,999
$30,000 -$39,999
$40,000 -$49,999
$50,000 -$59,999
$60,000 -$69,999
$70,000 -$79,000
$80,000 -$89,999
$90,000 -$99,999
$100,000-$109,999
$110,000-$119,999
Over$120, 000
Prefer notto disclose
Yes, I switched 10.8% 11.0% 8.5% 12.6% 9.0% 8.9% 6.1% 4.9% 4.1% 3.5% 2.8% 5.0% 12.8%No, but I seriously thought about switching 10.8% 11.3% 10.4% 9.5% 9.0% 6.4% 6.4% 5.8% 4.6% 3.5% 0.6% 5.1% 16.8%
0.0%
2.0%
4.0%
6.0%
8.0%
10.0%
12.0%
14.0%
16.0%
18.0%
Perc
enta
ge
Switching behaviour and intentions by age
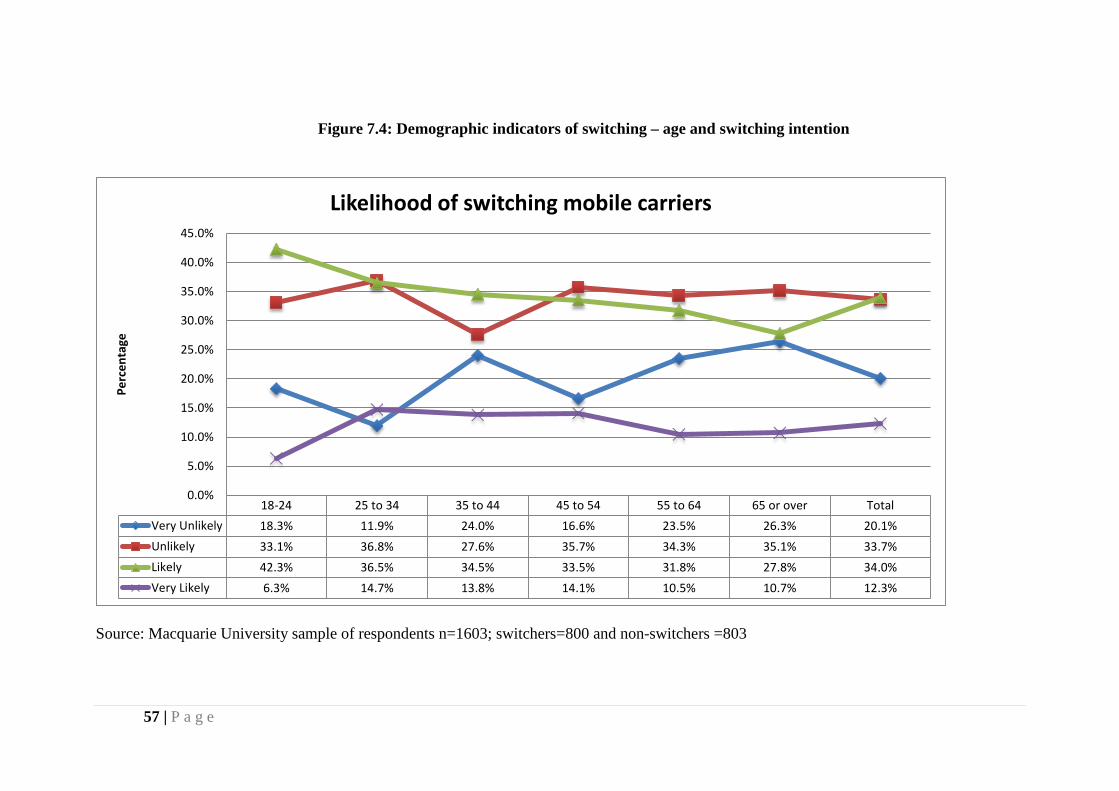
57 | P a g e
Figure 7.4: Demographic indicators of switching – age and switching intention
Source: Macquarie University sample of respondents n=1603; switchers=800 and non-switchers =803
18-24 25 to 34 35 to 44 45 to 54 55 to 64 65 or over TotalVery Unlikely 18.3% 11.9% 24.0% 16.6% 23.5% 26.3% 20.1%Unlikely 33.1% 36.8% 27.6% 35.7% 34.3% 35.1% 33.7%Likely 42.3% 36.5% 34.5% 33.5% 31.8% 27.8% 34.0%Very Likely 6.3% 14.7% 13.8% 14.1% 10.5% 10.7% 12.3%
0.0%
5.0%
10.0%
15.0%
20.0%
25.0%
30.0%
35.0%
40.0%
45.0%
Perc
enta
ge
Likelihood of switching mobile carriers
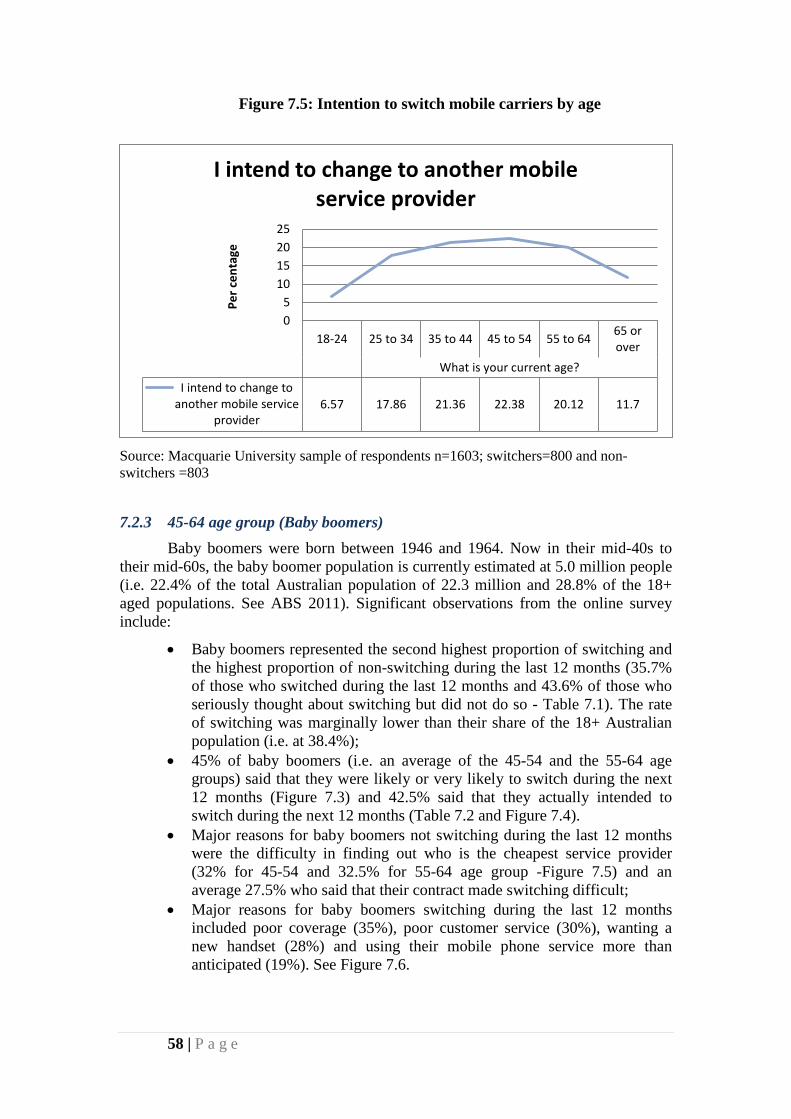
58 | P a g e
Figure 7.5: Intention to switch mobile carriers by age
Source: Macquarie University sample of respondents n=1603; switchers=800 and non-switchers =803
7.2.3 45-64 age group (Baby boomers) Baby boomers were born between 1946 and 1964. Now in their mid-40s to
their mid-60s, the baby boomer population is currently estimated at 5.0 million people (i.e. 22.4% of the total Australian population of 22.3 million and 28.8% of the 18+ aged populations. See ABS 2011). Significant observations from the online survey include:
• Baby boomers represented the second highest proportion of switching and the highest proportion of non-switching during the last 12 months (35.7% of those who switched during the last 12 months and 43.6% of those who seriously thought about switching but did not do so - Table 7.1). The rate of switching was marginally lower than their share of the 18+ Australian population (i.e. at 38.4%);
• 45% of baby boomers (i.e. an average of the 45-54 and the 55-64 age groups) said that they were likely or very likely to switch during the next 12 months (Figure 7.3) and 42.5% said that they actually intended to switch during the next 12 months (Table 7.2 and Figure 7.4).
• Major reasons for baby boomers not switching during the last 12 months were the difficulty in finding out who is the cheapest service provider (32% for 45-54 and 32.5% for 55-64 age group -Figure 7.5) and an average 27.5% who said that their contract made switching difficult;
• Major reasons for baby boomers switching during the last 12 months included poor coverage (35%), poor customer service (30%), wanting a new handset (28%) and using their mobile phone service more than anticipated (19%). See Figure 7.6.
18-24 25 to 34 35 to 44 45 to 54 55 to 64 65 orover
What is your current age?I intend to change to
another mobile serviceprovider
6.57 17.86 21.36 22.38 20.12 11.7
05
10152025
Per c
enta
ge
I intend to change to another mobile service provider

59 | P a g e
Figure 7.6: Barrier to mobile carrier switching – contract lock-in and other issues
Source: Macquarie University sample of respondents n=1603; switchers=800 and non-switchers =803
18-24 25 to 34 35 to 44 45 to 54 55 to 64 65 or over TotalWhat is your current age?
My contract makes switching difficult 29.8% 44.8% 33.3% 28.5% 26.6% 35.4% 32.6%My current provider offers the best value for money 17.5% 15.2% 18.0% 15.1% 19.2% 13.3% 16.5%The amount I could save by switching is too small 24.6% 10.4% 20.5% 19.2% 24.3% 32.7% 21.5%The cost and effort required in switching is too large 36.8% 27.2% 26.3% 19.2% 22.0% 25.7% 24.6%It is difficult to find out which provider is the
cheapest 28.1% 18.4% 34.6% 32.0% 32.8% 38.9% 31.3%
Other 10.5% 9.6% 13.5% 18.0% 21.5% 15.9% 15.8%
0.0%
5.0%
10.0%
15.0%
20.0%
25.0%
30.0%
35.0%
40.0%
45.0%
50.0%
Perc
enta
ge
Barriers to switching mobile carrier
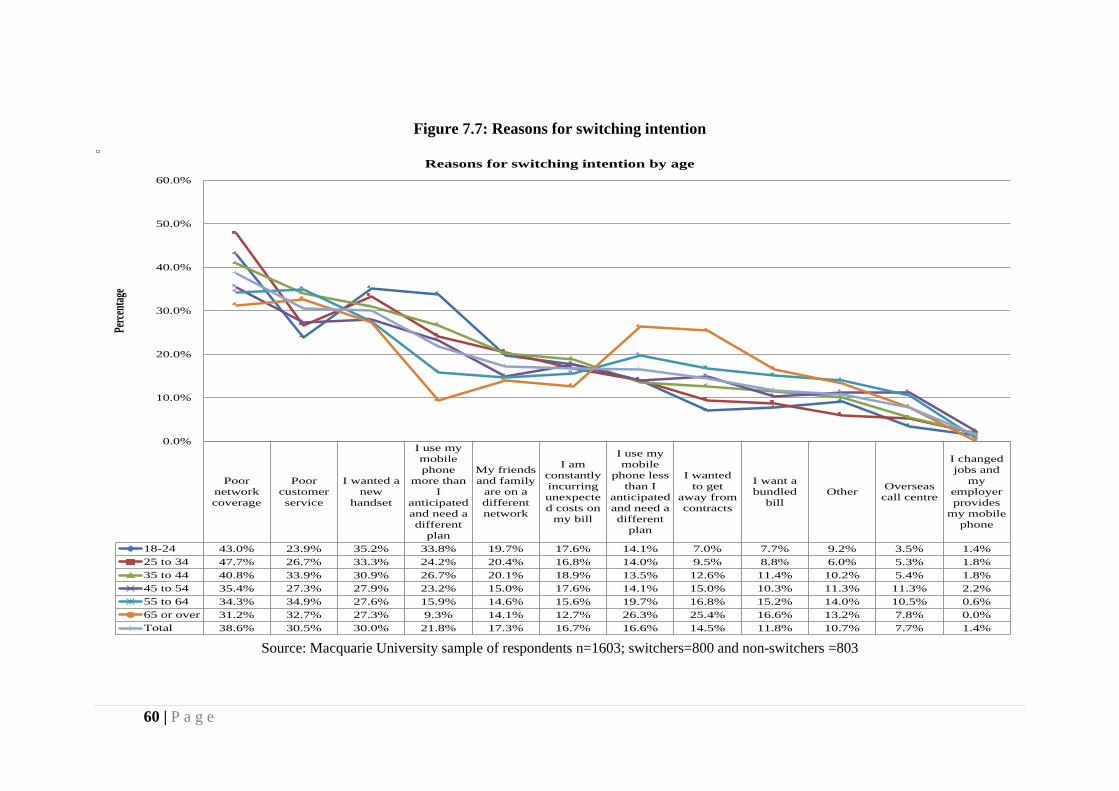
60 | P a g e
Figure 7.7: Reasons for switching intention
Source: Macquarie University sample of respondents n=1603; switchers=800 and non-switchers =803
Poornetworkcoverage
Poorcustomerservice
I wanted anew
handset
I use mymobilephone
more thanI
anticipatedand need adifferent
plan
My friendsand family
are on adifferentnetwork
I amconstantlyincurringunexpected costs on
my bill
I use mymobile
phone lessthan I
anticipatedand need adifferent
plan
I wantedto get
away fromcontracts
I want abundled
billOther Overseas
call centre
I changedjobs and
myemployerprovides
my mobilephone
18-24 43.0% 23.9% 35.2% 33.8% 19.7% 17.6% 14.1% 7.0% 7.7% 9.2% 3.5% 1.4%25 to 34 47.7% 26.7% 33.3% 24.2% 20.4% 16.8% 14.0% 9.5% 8.8% 6.0% 5.3% 1.8%35 to 44 40.8% 33.9% 30.9% 26.7% 20.1% 18.9% 13.5% 12.6% 11.4% 10.2% 5.4% 1.8%45 to 54 35.4% 27.3% 27.9% 23.2% 15.0% 17.6% 14.1% 15.0% 10.3% 11.3% 11.3% 2.2%55 to 64 34.3% 34.9% 27.6% 15.9% 14.6% 15.6% 19.7% 16.8% 15.2% 14.0% 10.5% 0.6%65 or over 31.2% 32.7% 27.3% 9.3% 14.1% 12.7% 26.3% 25.4% 16.6% 13.2% 7.8% 0.0%Total 38.6% 30.5% 30.0% 21.8% 17.3% 16.7% 16.6% 14.5% 11.8% 10.7% 7.7% 1.4%
0.0%
10.0%
20.0%
30.0%
40.0%
50.0%
60.0%
Perce
ntage
Reasons for switching intention by age
61 | P a g e
7.2.4 Seniors (65+ age grouping) Seniors represent adults 65 years old and over. The senior population is
currently estimated at 3.0 million people (13.5% of the Australian population and 17.5% of the 18+ population. See ABS 2011). Significant observations from the online survey include:
• Seniors have the second lowest proportion of switching and non-switching (11.5% of survey respondents switched during the last 12 months were seniors and 14.1% seriously thought about switching but did not do so - Table 7.1). The rate of switching for seniors was significantly lower than their share of the 18+ Australian population (i.e. at 17.5%);
• 38.5% of seniors said that they were likely or very likely to switch during the next 12 months (Figure 7.3) and 11.7% said that they actually intended to switch during the next 12 months (Table 7.2 and Figure 7.4);
• Major reasons for seniors not switching during the last 12 months were the difficulty in finding out who is the cheapest service provider (38.9%) and those who said that their contract made switching difficult (35.4%) closely followed by those who said that the expected saving from switching was too small (32.7%). See Figure 7.5 for details;
• Major reasons for seniors switching during the last 12 months included poor customer service (32.7%), poor coverage (31.2%), wanting a new handset (27.3%) and using their mobile phone service less than anticipated (26.3%) and wanting to get away from contracts (25.4%). See Figure 7.6 for details.
62 | P a g e
Switching Costs and Inertia 8 Switching costs
Switching costs are the perception of "one-time costs facing the buyer of switching from one supplier's product to another" (Porter, 1980, p10). Using a scale developed by Aydin and Ozer (2005) a significant proportion of all respondents agreed with the following switching cost concerns (Table 8.1):
• Time, energy and effort required to switch (68%); • New operator service levels that might not work as well as their existing
provider (58%); • Concerns about being able to keep their existing mobile phone (55%); • Concerns about new operator pricing (50%); • Concerns about not being able to use all of the new operators services
(44%); • Concerns about the monetary costs of switching (42%). Consumer perceptions as to the level of switching costs may be a possible
explanation for customer inertia. The number one switching cost concern of consumers was the time, energy and effort required to switch (68%). This question also highlighted the significant gap in consumer knowledge about the mobile phone switching process. For example, mobile phone portability has been operating in Australia since 2001, yet 55% of consumers had concerns about being able to keep their existing mobile phone number. Non-switchers exhibited similar attitudinal patterns to those who had switched however, in all cases they showed less concern about the difficulty of switching than those who had actually switched.
Indicative quotes to support these findings from the qualitative study include:
“After complaining, you can get a better deal but it takes a lot of effort and energy to fix it.” Non switcher
Demographic differences were highlighted by the following:
• Women in general are more concerned about the difficulty of switching than men;
• More women (48%) agree that they are concerned about the monetary cost of switching than men (38%); respondents aged 35-54 agree that they are more concerned about the monetary cost of switching (46%);
• There is a positive correlation between age and time, energy and effort required to switch. i.e. 72% for 55+ and 61% for 18-34 year old.
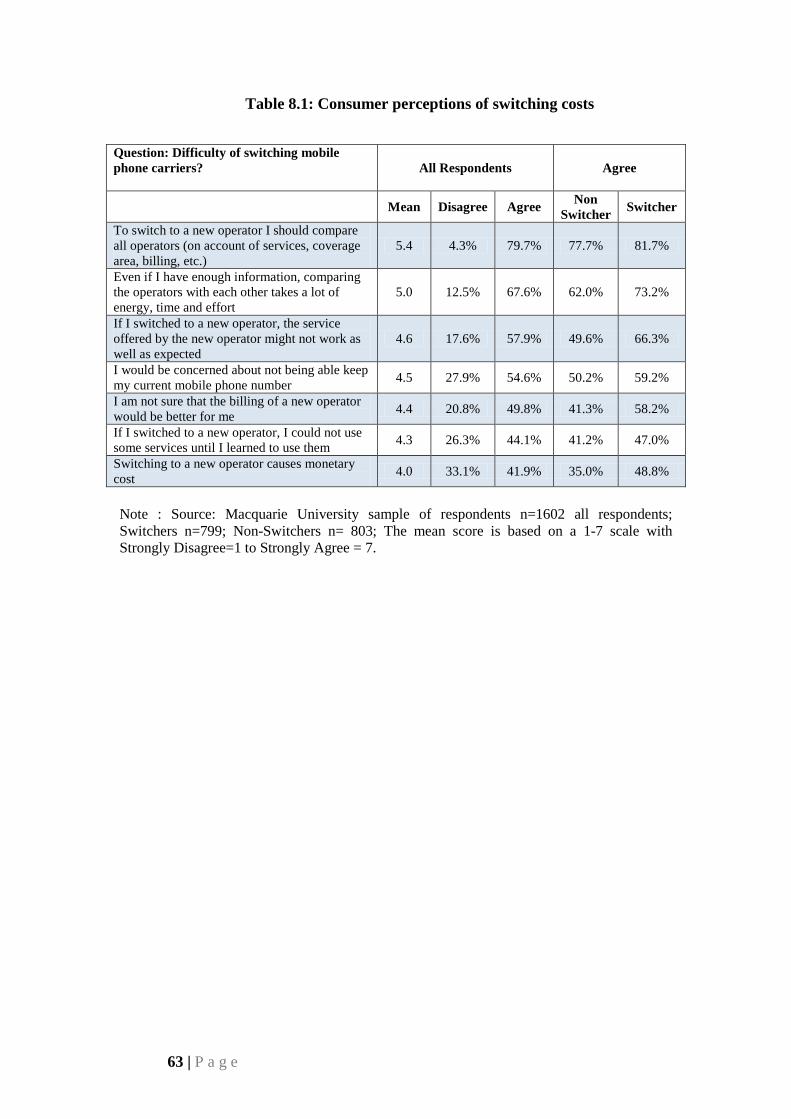
63 | P a g e
Table 8.1: Consumer perceptions of switching costs
Question: Difficulty of switching mobile phone carriers?
All Respondents Agree
Mean Disagree Agree Non Switcher Switcher
To switch to a new operator I should compare all operators (on account of services, coverage area, billing, etc.)
5.4 4.3% 79.7% 77.7% 81.7%
Even if I have enough information, comparing the operators with each other takes a lot of energy, time and effort
5.0 12.5% 67.6% 62.0% 73.2%
If I switched to a new operator, the service offered by the new operator might not work as well as expected
4.6 17.6% 57.9% 49.6% 66.3%
I would be concerned about not being able keep my current mobile phone number 4.5 27.9% 54.6% 50.2% 59.2%
I am not sure that the billing of a new operator would be better for me 4.4 20.8% 49.8% 41.3% 58.2%
If I switched to a new operator, I could not use some services until I learned to use them 4.3 26.3% 44.1% 41.2% 47.0%
Switching to a new operator causes monetary cost 4.0 33.1% 41.9% 35.0% 48.8%
Note : Source: Macquarie University sample of respondents n=1602 all respondents; Switchers n=799; Non-Switchers n= 803; The mean score is based on a 1-7 scale with Strongly Disagree=1 to Strongly Agree = 7.
64 | P a g e
Customer inertia and difficulty in switching mobile carriers 9 Customer inertia and difficulty in switching mobile carriers
Customer inertia exists when a customer perceives that an organisation’s service/ product delivery does not meet their expectations but still continues to conduct business with the same mobile phone carrier (Beatty and Smith 1987; Campbell 1997; Anderson and Swaminathan 2011).
Such behaviour has also been described as spurious loyalty (Dick and Basu 1994) or partial loyalty (Ennew and Binks 1996). Explanations for such behaviour focus on the influence of situational factors such as switching costs, lack of perceived differentiation, locational constraints on choice or habit irrespective of consumer attitudes.
Using an existing measurement scale to measure the importance of inertia (Han, Kim and Kim 2011) a significant proportion of all survey respondents displayed inertial tendencies (Table 9.1):
• 37.9% agreed that the effort required to switch is high; • 49.4% agreed that switching was inconvenient and a hassle; • 49.6% agreed that switching would be a bother; • 42.4% agreed that they would find it difficult to compare offers.
Ultimately, the following quote sums up these attitudes:
“I am happy to stay with my current provider even though I was actually screwed over. They are all the same.” Non switcher
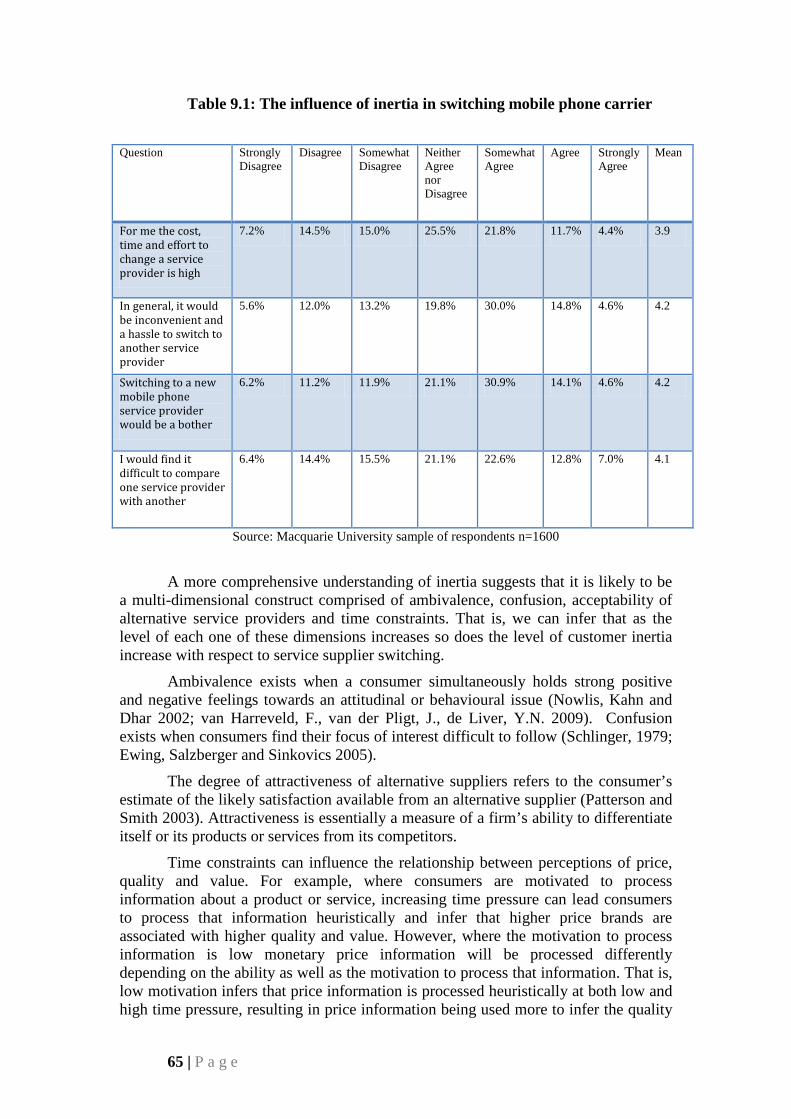
65 | P a g e
Table 9.1: The influence of inertia in switching mobile phone carrier
Question Strongly
Disagree Disagree Somewhat
Disagree Neither Agree nor Disagree
Somewhat Agree
Agree Strongly Agree
Mean
For me the cost, time and effort to change a service provider is high
7.2% 14.5% 15.0% 25.5% 21.8% 11.7% 4.4% 3.9
In general, it would be inconvenient and a hassle to switch to another service provider
5.6% 12.0% 13.2% 19.8% 30.0% 14.8% 4.6% 4.2
Switching to a new mobile phone service provider would be a bother
6.2% 11.2% 11.9% 21.1% 30.9% 14.1% 4.6% 4.2
I would find it difficult to compare one service provider with another
6.4% 14.4% 15.5% 21.1% 22.6% 12.8% 7.0% 4.1
Source: Macquarie University sample of respondents n=1600
A more comprehensive understanding of inertia suggests that it is likely to be a multi-dimensional construct comprised of ambivalence, confusion, acceptability of alternative service providers and time constraints. That is, we can infer that as the level of each one of these dimensions increases so does the level of customer inertia increase with respect to service supplier switching.
Ambivalence exists when a consumer simultaneously holds strong positive and negative feelings towards an attitudinal or behavioural issue (Nowlis, Kahn and Dhar 2002; van Harreveld, F., van der Pligt, J., de Liver, Y.N. 2009). Confusion exists when consumers find their focus of interest difficult to follow (Schlinger, 1979; Ewing, Salzberger and Sinkovics 2005).
The degree of attractiveness of alternative suppliers refers to the consumer’s estimate of the likely satisfaction available from an alternative supplier (Patterson and Smith 2003). Attractiveness is essentially a measure of a firm’s ability to differentiate itself or its products or services from its competitors.
Time constraints can influence the relationship between perceptions of price, quality and value. For example, where consumers are motivated to process information about a product or service, increasing time pressure can lead consumers to process that information heuristically and infer that higher price brands are associated with higher quality and value. However, where the motivation to process information is low monetary price information will be processed differently depending on the ability as well as the motivation to process that information. That is, low motivation infers that price information is processed heuristically at both low and high time pressure, resulting in price information being used more to infer the quality
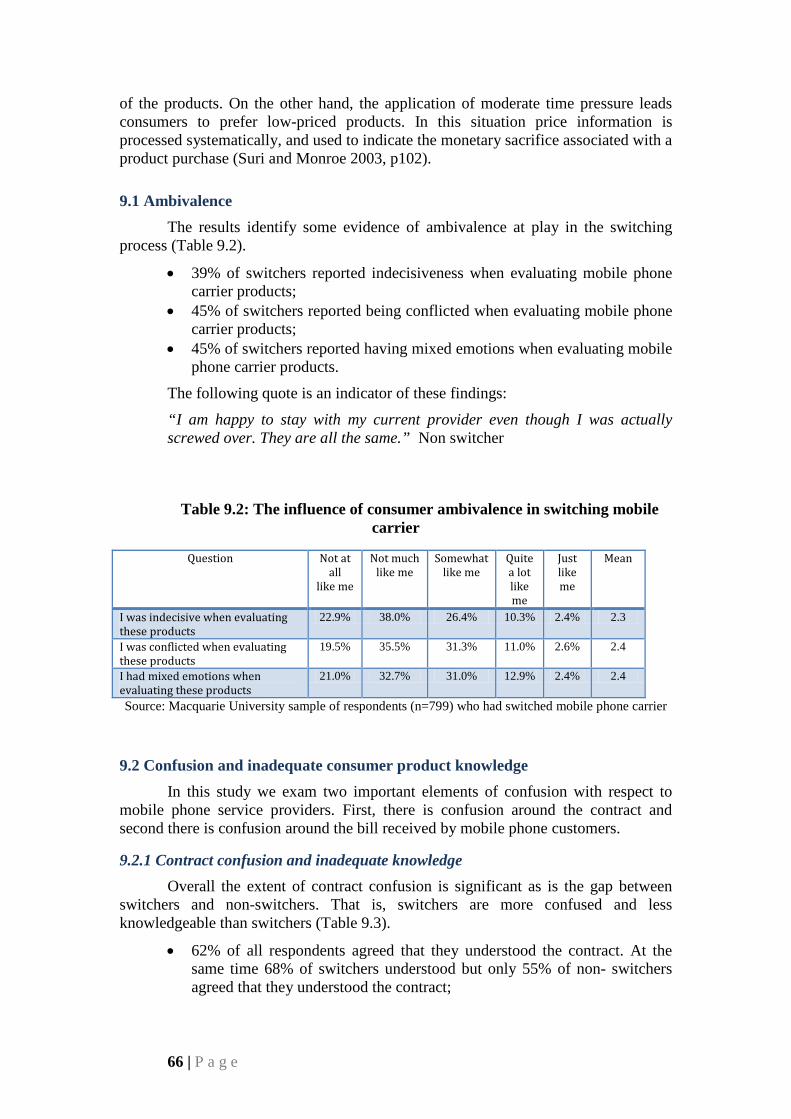
66 | P a g e
of the products. On the other hand, the application of moderate time pressure leads consumers to prefer low-priced products. In this situation price information is processed systematically, and used to indicate the monetary sacrifice associated with a product purchase (Suri and Monroe 2003, p102).
9.1 Ambivalence The results identify some evidence of ambivalence at play in the switching
process (Table 9.2).
• 39% of switchers reported indecisiveness when evaluating mobile phone carrier products;
• 45% of switchers reported being conflicted when evaluating mobile phone carrier products;
• 45% of switchers reported having mixed emotions when evaluating mobile phone carrier products.
The following quote is an indicator of these findings:
“I am happy to stay with my current provider even though I was actually screwed over. They are all the same.” Non switcher
Table 9.2: The influence of consumer ambivalence in switching mobile
carrier
Question Not at all
like me
Not much like me
Somewhat like me
Quite a lot like me
Just like me
Mean
I was indecisive when evaluating these products
22.9% 38.0% 26.4% 10.3% 2.4% 2.3
I was conflicted when evaluating these products
19.5% 35.5% 31.3% 11.0% 2.6% 2.4
I had mixed emotions when evaluating these products
21.0% 32.7% 31.0% 12.9% 2.4% 2.4
Source: Macquarie University sample of respondents (n=799) who had switched mobile phone carrier
9.2 Confusion and inadequate consumer product knowledge In this study we exam two important elements of confusion with respect to
mobile phone service providers. First, there is confusion around the contract and second there is confusion around the bill received by mobile phone customers.
9.2.1 Contract confusion and inadequate knowledge Overall the extent of contract confusion is significant as is the gap between
switchers and non-switchers. That is, switchers are more confused and less knowledgeable than switchers (Table 9.3).
• 62% of all respondents agreed that they understood the contract. At the same time 68% of switchers understood but only 55% of non- switchers agreed that they understood the contract;
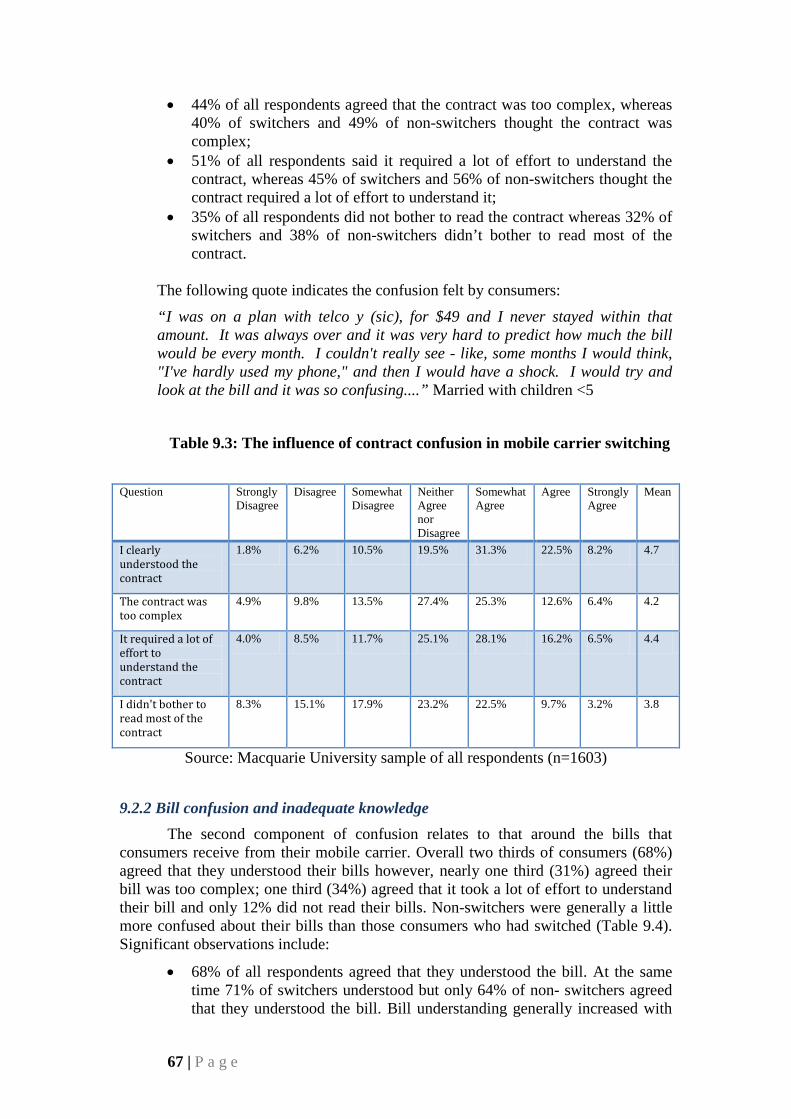
67 | P a g e
• 44% of all respondents agreed that the contract was too complex, whereas 40% of switchers and 49% of non-switchers thought the contract was complex;
• 51% of all respondents said it required a lot of effort to understand the contract, whereas 45% of switchers and 56% of non-switchers thought the contract required a lot of effort to understand it;
• 35% of all respondents did not bother to read the contract whereas 32% of switchers and 38% of non-switchers didn’t bother to read most of the contract.
The following quote indicates the confusion felt by consumers:
“I was on a plan with telco y (sic), for $49 and I never stayed within that amount. It was always over and it was very hard to predict how much the bill would be every month. I couldn't really see - like, some months I would think, "I've hardly used my phone," and then I would have a shock. I would try and look at the bill and it was so confusing....” Married with children <5
Table 9.3: The influence of contract confusion in mobile carrier switching
Question Strongly
Disagree Disagree Somewhat
Disagree Neither Agree nor Disagree
Somewhat Agree
Agree Strongly Agree
Mean
I clearly understood the contract
1.8% 6.2% 10.5% 19.5% 31.3% 22.5% 8.2% 4.7
The contract was too complex
4.9% 9.8% 13.5% 27.4% 25.3% 12.6% 6.4% 4.2
It required a lot of effort to understand the contract
4.0% 8.5% 11.7% 25.1% 28.1% 16.2% 6.5% 4.4
I didn't bother to read most of the contract
8.3% 15.1% 17.9% 23.2% 22.5% 9.7% 3.2% 3.8
Source: Macquarie University sample of all respondents (n=1603)
9.2.2 Bill confusion and inadequate knowledge The second component of confusion relates to that around the bills that
consumers receive from their mobile carrier. Overall two thirds of consumers (68%) agreed that they understood their bills however, nearly one third (31%) agreed their bill was too complex; one third (34%) agreed that it took a lot of effort to understand their bill and only 12% did not read their bills. Non-switchers were generally a little more confused about their bills than those consumers who had switched (Table 9.4). Significant observations include:
• 68% of all respondents agreed that they understood the bill. At the same time 71% of switchers understood but only 64% of non- switchers agreed that they understood the bill. Bill understanding generally increased with
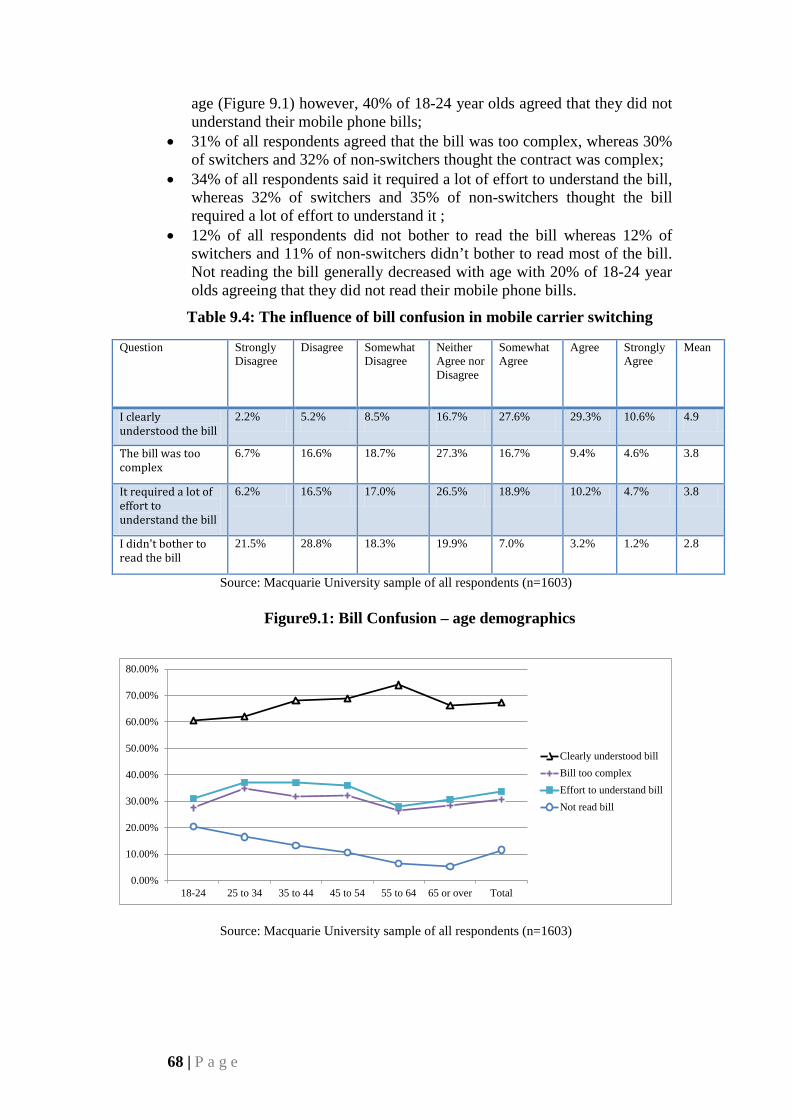
68 | P a g e
age (Figure 9.1) however, 40% of 18-24 year olds agreed that they did not understand their mobile phone bills;
• 31% of all respondents agreed that the bill was too complex, whereas 30% of switchers and 32% of non-switchers thought the contract was complex;
• 34% of all respondents said it required a lot of effort to understand the bill, whereas 32% of switchers and 35% of non-switchers thought the bill required a lot of effort to understand it ;
• 12% of all respondents did not bother to read the bill whereas 12% of switchers and 11% of non-switchers didn’t bother to read most of the bill. Not reading the bill generally decreased with age with 20% of 18-24 year olds agreeing that they did not read their mobile phone bills.
Table 9.4: The influence of bill confusion in mobile carrier switching
Question Strongly Disagree
Disagree Somewhat Disagree
Neither Agree nor Disagree
Somewhat Agree
Agree Strongly Agree
Mean
I clearly understood the bill
2.2% 5.2% 8.5% 16.7% 27.6% 29.3% 10.6% 4.9
The bill was too complex
6.7% 16.6% 18.7% 27.3% 16.7% 9.4% 4.6% 3.8
It required a lot of effort to understand the bill
6.2% 16.5% 17.0% 26.5% 18.9% 10.2% 4.7% 3.8
I didn't bother to read the bill
21.5% 28.8% 18.3% 19.9% 7.0% 3.2% 1.2% 2.8
Source: Macquarie University sample of all respondents (n=1603)
Figure9.1: Bill Confusion – age demographics
Source: Macquarie University sample of all respondents (n=1603)
0.00%
10.00%
20.00%
30.00%
40.00%
50.00%
60.00%
70.00%
80.00%
18-24 25 to 34 35 to 44 45 to 54 55 to 64 65 or over Total
Clearly understood billBill too complexEffort to understand billNot read bill
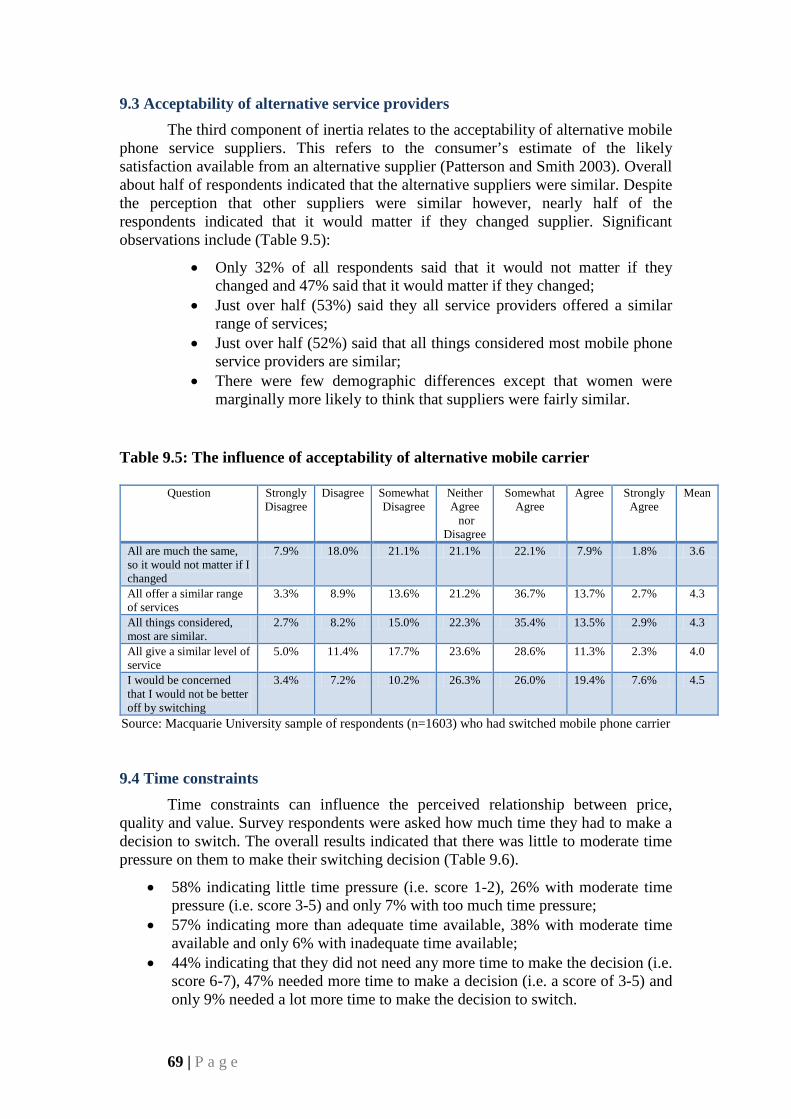
69 | P a g e
9.3 Acceptability of alternative service providers The third component of inertia relates to the acceptability of alternative mobile
phone service suppliers. This refers to the consumer’s estimate of the likely satisfaction available from an alternative supplier (Patterson and Smith 2003). Overall about half of respondents indicated that the alternative suppliers were similar. Despite the perception that other suppliers were similar however, nearly half of the respondents indicated that it would matter if they changed supplier. Significant observations include (Table 9.5):
• Only 32% of all respondents said that it would not matter if they changed and 47% said that it would matter if they changed;
• Just over half (53%) said they all service providers offered a similar range of services;
• Just over half (52%) said that all things considered most mobile phone service providers are similar;
• There were few demographic differences except that women were marginally more likely to think that suppliers were fairly similar.
Table 9.5: The influence of acceptability of alternative mobile carrier
Question Strongly Disagree
Disagree Somewhat Disagree
Neither Agree nor
Disagree
Somewhat Agree
Agree Strongly Agree
Mean
All are much the same, so it would not matter if I changed
7.9% 18.0% 21.1% 21.1% 22.1% 7.9% 1.8% 3.6
All offer a similar range of services
3.3% 8.9% 13.6% 21.2% 36.7% 13.7% 2.7% 4.3
All things considered, most are similar.
2.7% 8.2% 15.0% 22.3% 35.4% 13.5% 2.9% 4.3
All give a similar level of service
5.0% 11.4% 17.7% 23.6% 28.6% 11.3% 2.3% 4.0
I would be concerned that I would not be better off by switching
3.4% 7.2% 10.2% 26.3% 26.0% 19.4% 7.6% 4.5
Source: Macquarie University sample of respondents (n=1603) who had switched mobile phone carrier
9.4 Time constraints Time constraints can influence the perceived relationship between price,
quality and value. Survey respondents were asked how much time they had to make a decision to switch. The overall results indicated that there was little to moderate time pressure on them to make their switching decision (Table 9.6).
• 58% indicating little time pressure (i.e. score 1-2), 26% with moderate time pressure (i.e. score 3-5) and only 7% with too much time pressure;
• 57% indicating more than adequate time available, 38% with moderate time available and only 6% with inadequate time available;
• 44% indicating that they did not need any more time to make the decision (i.e. score 6-7), 47% needed more time to make a decision (i.e. a score of 3-5) and only 9% needed a lot more time to make the decision to switch.
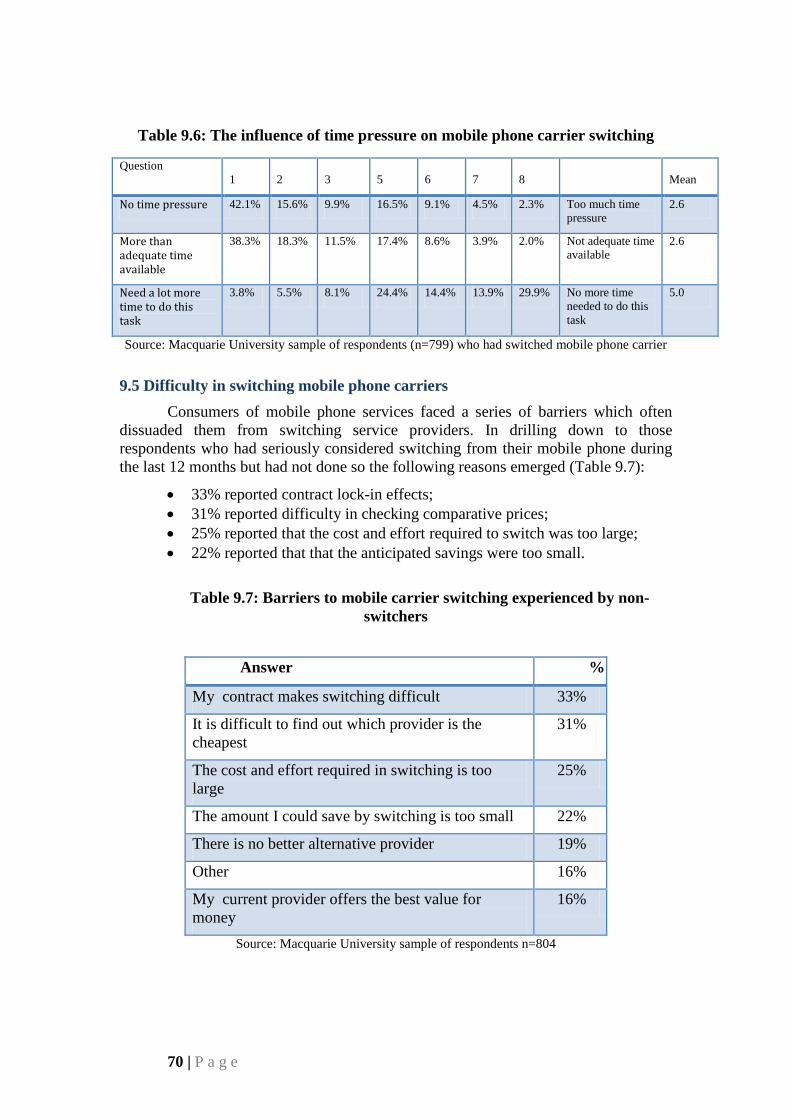
70 | P a g e
Table 9.6: The influence of time pressure on mobile phone carrier switching
Question 1 2 3 5 6 7 8
Mean
No time pressure 42.1% 15.6% 9.9% 16.5% 9.1% 4.5% 2.3% Too much time pressure
2.6
More than adequate time available
38.3% 18.3% 11.5% 17.4% 8.6% 3.9% 2.0% Not adequate time available
2.6
Need a lot more time to do this task
3.8% 5.5% 8.1% 24.4% 14.4% 13.9% 29.9% No more time needed to do this task
5.0
Source: Macquarie University sample of respondents (n=799) who had switched mobile phone carrier
9.5 Difficulty in switching mobile phone carriers Consumers of mobile phone services faced a series of barriers which often
dissuaded them from switching service providers. In drilling down to those respondents who had seriously considered switching from their mobile phone during the last 12 months but had not done so the following reasons emerged (Table 9.7):
• 33% reported contract lock-in effects; • 31% reported difficulty in checking comparative prices; • 25% reported that the cost and effort required to switch was too large; • 22% reported that that the anticipated savings were too small.
Table 9.7: Barriers to mobile carrier switching experienced by non-
switchers
Answer %
My contract makes switching difficult 33%
It is difficult to find out which provider is the cheapest
31%
The cost and effort required in switching is too large
25%
The amount I could save by switching is too small 22%
There is no better alternative provider 19%
Other 16%
My current provider offers the best value for money
16%
Source: Macquarie University sample of respondents n=804
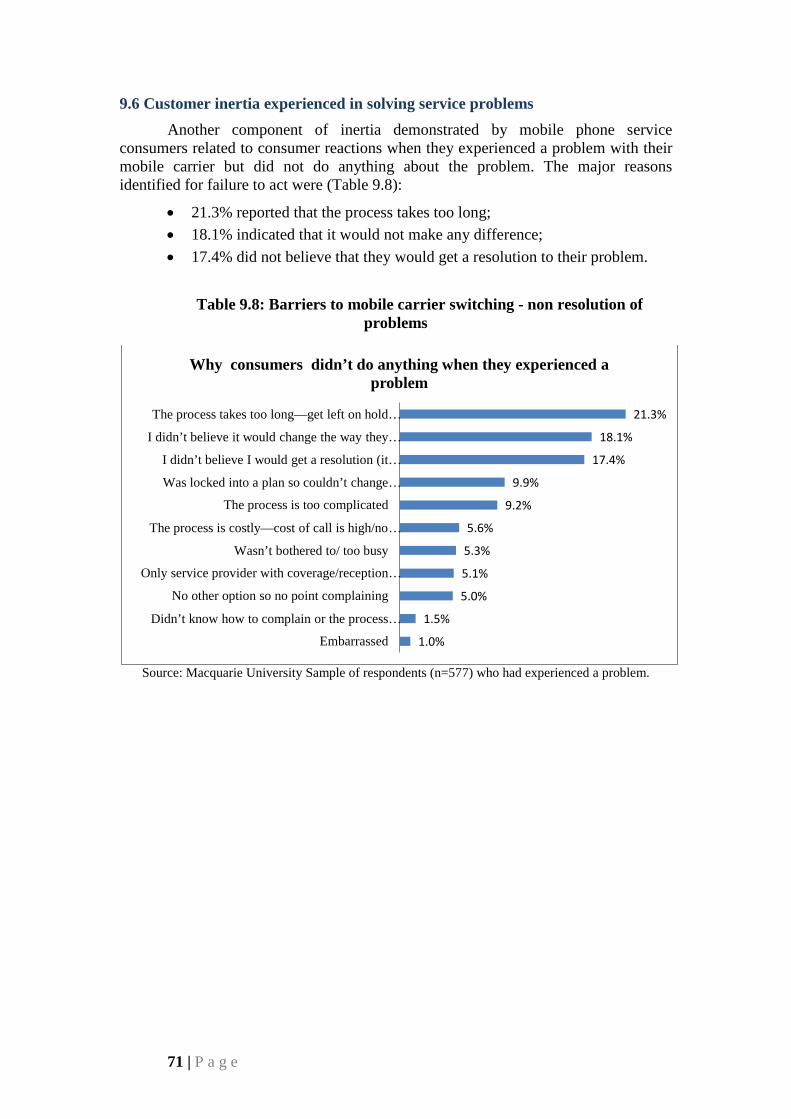
71 | P a g e
9.6 Customer inertia experienced in solving service problems Another component of inertia demonstrated by mobile phone service
consumers related to consumer reactions when they experienced a problem with their mobile carrier but did not do anything about the problem. The major reasons identified for failure to act were (Table 9.8):
• 21.3% reported that the process takes too long; • 18.1% indicated that it would not make any difference; • 17.4% did not believe that they would get a resolution to their problem.
Table 9.8: Barriers to mobile carrier switching - non resolution of problems
Source: Macquarie University Sample of respondents (n=577) who had experienced a problem.
1.0%
1.5%
5.0%
5.1%
5.3%
5.6%
9.2%
9.9%
17.4%
18.1%
21.3%
Embarrassed
Didn’t know how to complain or the process …
No other option so no point complaining
Only service provider with coverage/reception…
Wasn’t bothered to/ too busy
The process is costly—cost of call is high/no …
The process is too complicated
Was locked into a plan so couldn’t change …
I didn’t believe I would get a resolution (it …
I didn’t believe it would change the way they …
The process takes too long—get left on hold …
Why consumers didn’t do anything when they experienced a problem
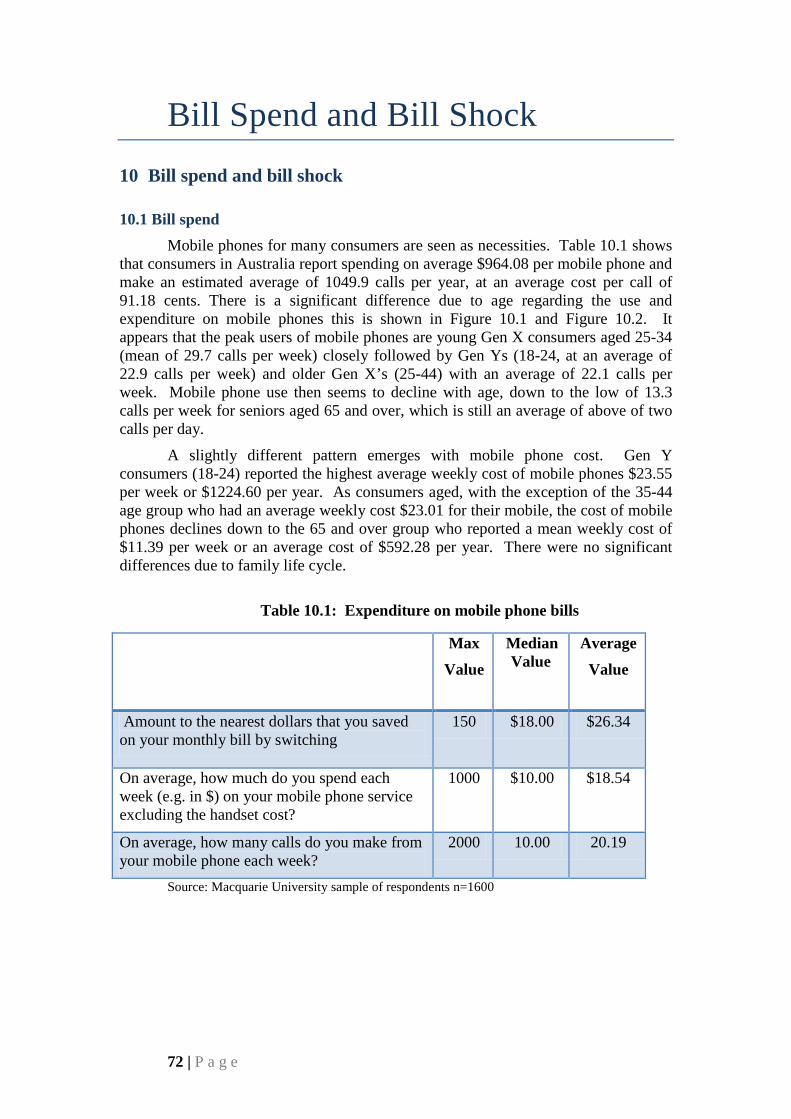
72 | P a g e
Bill Spend and Bill Shock 10 Bill spend and bill shock
10.1 Bill spend Mobile phones for many consumers are seen as necessities. Table 10.1 shows
that consumers in Australia report spending on average $964.08 per mobile phone and make an estimated average of 1049.9 calls per year, at an average cost per call of 91.18 cents. There is a significant difference due to age regarding the use and expenditure on mobile phones this is shown in Figure 10.1 and Figure 10.2. It appears that the peak users of mobile phones are young Gen X consumers aged 25-34 (mean of 29.7 calls per week) closely followed by Gen Ys (18-24, at an average of 22.9 calls per week) and older Gen X’s (25-44) with an average of 22.1 calls per week. Mobile phone use then seems to decline with age, down to the low of 13.3 calls per week for seniors aged 65 and over, which is still an average of above of two calls per day.
A slightly different pattern emerges with mobile phone cost. Gen Y consumers (18-24) reported the highest average weekly cost of mobile phones $23.55 per week or $1224.60 per year. As consumers aged, with the exception of the 35-44 age group who had an average weekly cost $23.01 for their mobile, the cost of mobile phones declines down to the 65 and over group who reported a mean weekly cost of $11.39 per week or an average cost of $592.28 per year. There were no significant differences due to family life cycle.
Table 10.1: Expenditure on mobile phone bills
Max Value
Median Value
Average Value
Amount to the nearest dollars that you saved on your monthly bill by switching
150 $18.00 $26.34
On average, how much do you spend each week (e.g. in $) on your mobile phone service excluding the handset cost?
1000 $10.00 $18.54
On average, how many calls do you make from your mobile phone each week?
2000 10.00 20.19
Source: Macquarie University sample of respondents n=1600
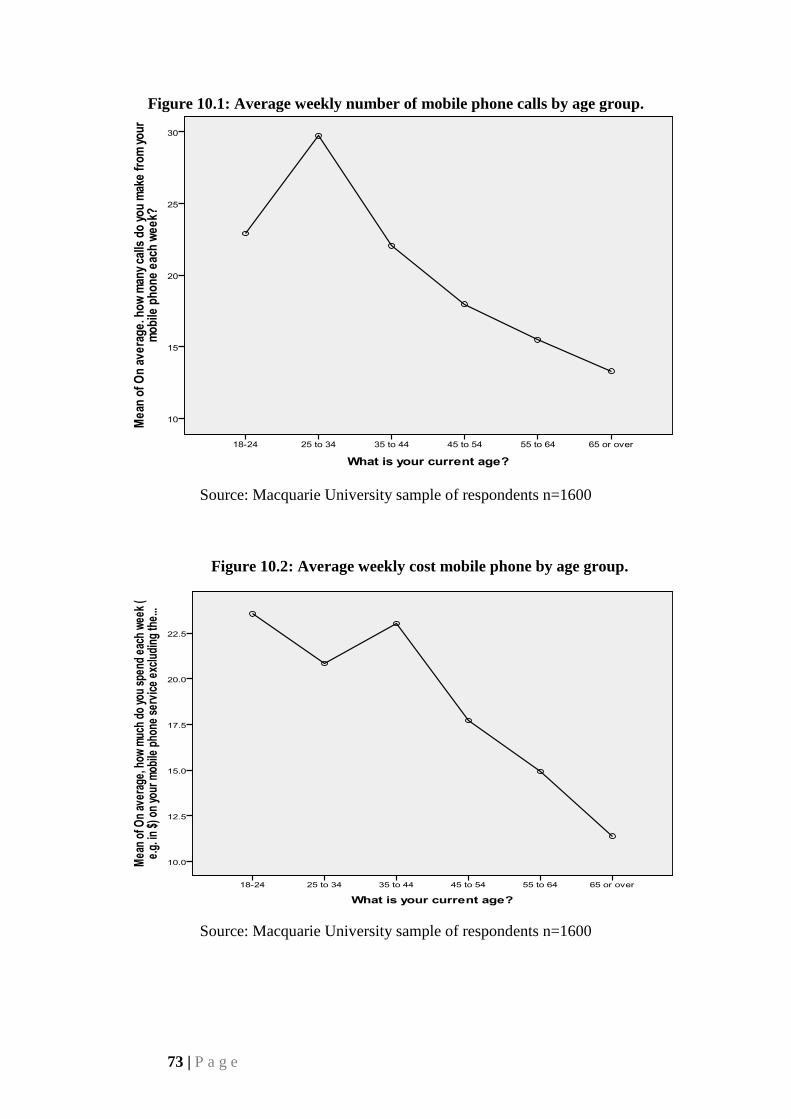
73 | P a g e
Figure 10.1: Average weekly number of mobile phone calls by age group.
Source: Macquarie University sample of respondents n=1600
Figure 10.2: Average weekly cost mobile phone by age group.
Source: Macquarie University sample of respondents n=1600
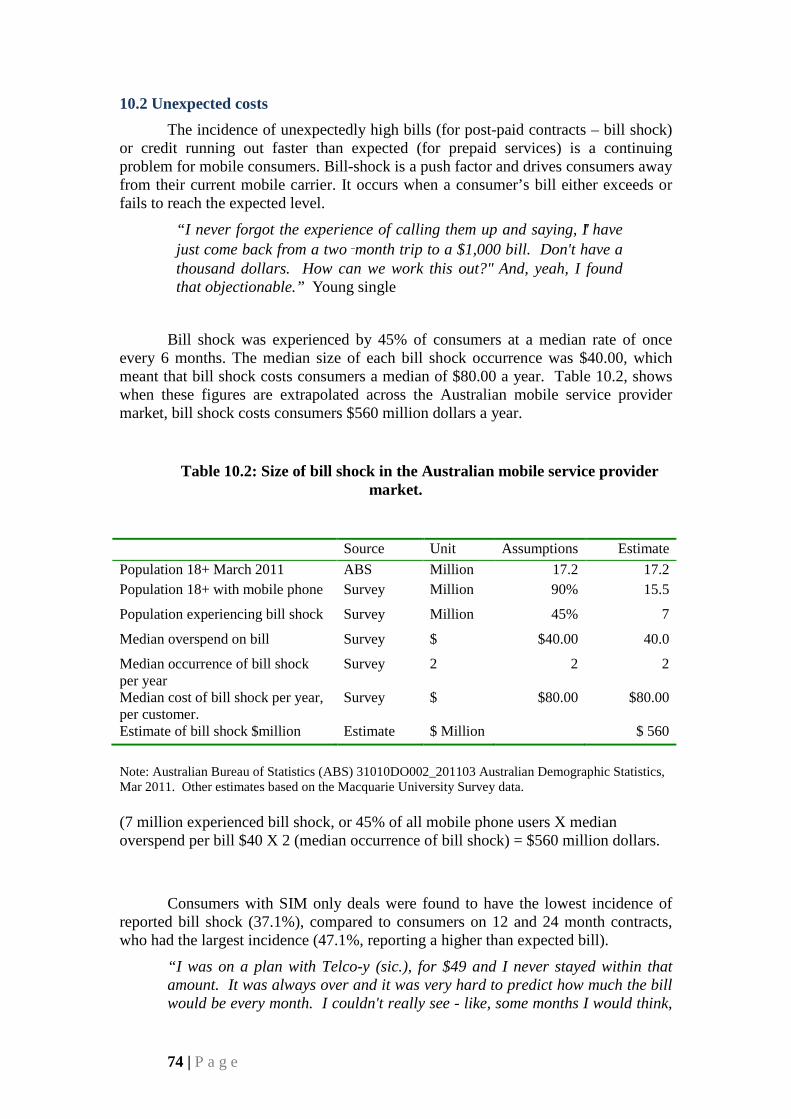
74 | P a g e
10.2 Unexpected costs The incidence of unexpectedly high bills (for post-paid contracts – bill shock)
or credit running out faster than expected (for prepaid services) is a continuing problem for mobile consumers. Bill-shock is a push factor and drives consumers away from their current mobile carrier. It occurs when a consumer’s bill either exceeds or fails to reach the expected level.
“I never forgot the experience of calling them up and saying, "I have just come back from a two‑month trip to a $1,000 bill. Don't have a thousand dollars. How can we work this out?" And, yeah, I found that objectionable.” Young single
Bill shock was experienced by 45% of consumers at a median rate of once every 6 months. The median size of each bill shock occurrence was $40.00, which meant that bill shock costs consumers a median of $80.00 a year. Table 10.2, shows when these figures are extrapolated across the Australian mobile service provider market, bill shock costs consumers $560 million dollars a year.
Table 10.2: Size of bill shock in the Australian mobile service provider market.
Source Unit Assumptions Estimate Population 18+ March 2011 ABS Million 17.2 17.2 Population 18+ with mobile phone Survey Million 90% 15.5
Population experiencing bill shock Survey Million 45% 7
Median overspend on bill Survey $ $40.00 40.0
Median occurrence of bill shock per year
Survey 2 2 2
Median cost of bill shock per year, per customer.
Survey $ $80.00 $80.00
Estimate of bill shock $million Estimate $ Million $ 560 Note: Australian Bureau of Statistics (ABS) 31010DO002_201103 Australian Demographic Statistics, Mar 2011. Other estimates based on the Macquarie University Survey data. (7 million experienced bill shock, or 45% of all mobile phone users X median overspend per bill $40 X 2 (median occurrence of bill shock) = $560 million dollars.
Consumers with SIM only deals were found to have the lowest incidence of reported bill shock (37.1%), compared to consumers on 12 and 24 month contracts, who had the largest incidence (47.1%, reporting a higher than expected bill).
“I was on a plan with Telco-y (sic.), for $49 and I never stayed within that amount. It was always over and it was very hard to predict how much the bill would be every month. I couldn't really see - like, some months I would think,

75 | P a g e
"I've hardly used my phone," and then I would have a shock. I would try and look at the bill and it was so confusing....” Married with children <5
10.3 Causes of bill shock Table 10.3 shows the contributing factors. As can be seen the main cause of
bill shock is higher costs for national calls (54%) and a growing issue of data usage (20%). This was noted by one focus group respondent.
“I recently got stung within my first month with Telco y (sic.), on data usage.” Young couple
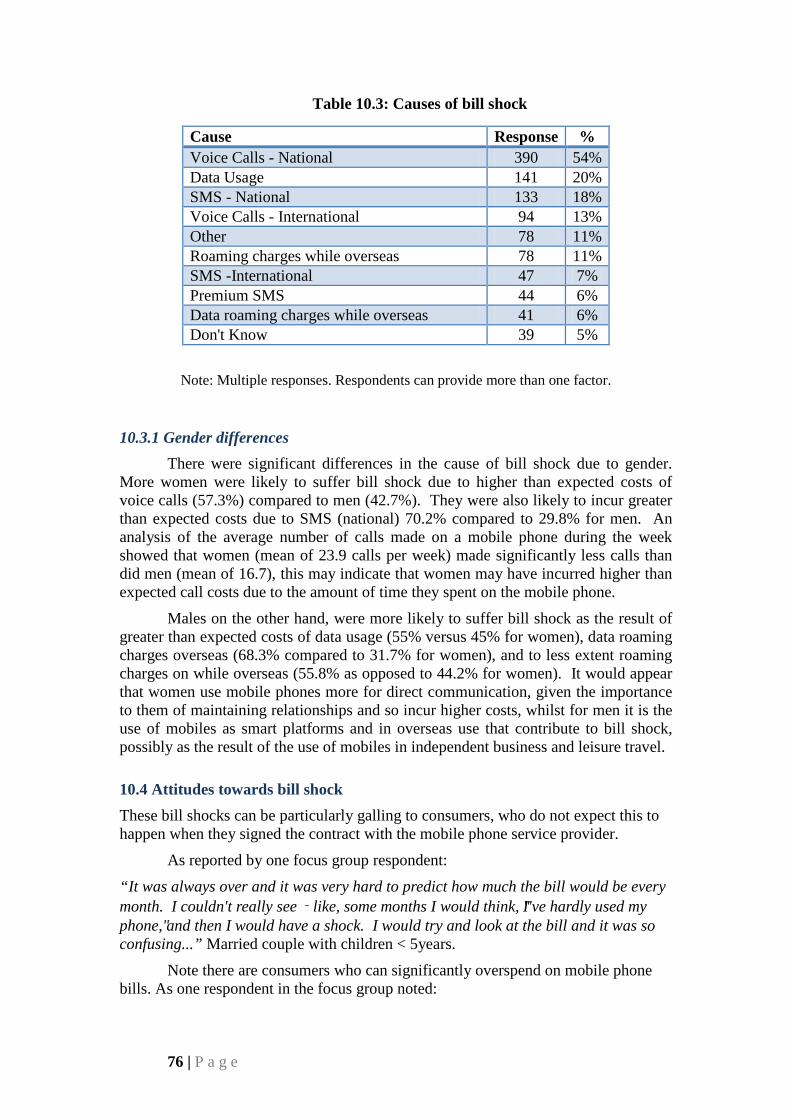
76 | P a g e
Table 10.3: Causes of bill shock
Cause Response % Voice Calls - National 390 54% Data Usage 141 20% SMS - National 133 18% Voice Calls - International 94 13% Other 78 11% Roaming charges while overseas 78 11% SMS -International 47 7% Premium SMS 44 6% Data roaming charges while overseas 41 6% Don't Know 39 5%
Note: Multiple responses. Respondents can provide more than one factor.
10.3.1 Gender differences There were significant differences in the cause of bill shock due to gender.
More women were likely to suffer bill shock due to higher than expected costs of voice calls (57.3%) compared to men (42.7%). They were also likely to incur greater than expected costs due to SMS (national) 70.2% compared to 29.8% for men. An analysis of the average number of calls made on a mobile phone during the week showed that women (mean of 23.9 calls per week) made significantly less calls than did men (mean of 16.7), this may indicate that women may have incurred higher than expected call costs due to the amount of time they spent on the mobile phone.
Males on the other hand, were more likely to suffer bill shock as the result of greater than expected costs of data usage (55% versus 45% for women), data roaming charges overseas (68.3% compared to 31.7% for women), and to less extent roaming charges on while overseas (55.8% as opposed to 44.2% for women). It would appear that women use mobile phones more for direct communication, given the importance to them of maintaining relationships and so incur higher costs, whilst for men it is the use of mobiles as smart platforms and in overseas use that contribute to bill shock, possibly as the result of the use of mobiles in independent business and leisure travel.
10.4 Attitudes towards bill shock These bill shocks can be particularly galling to consumers, who do not expect this to happen when they signed the contract with the mobile phone service provider.
As reported by one focus group respondent:
“It was always over and it was very hard to predict how much the bill would be every month. I couldn't really see ‑ like, some months I would think, "I've hardly used my phone," and then I would have a shock. I would try and look at the bill and it was so confusing...” Married couple with children < 5years.
Note there are consumers who can significantly overspend on mobile phone bills. As one respondent in the focus group noted:
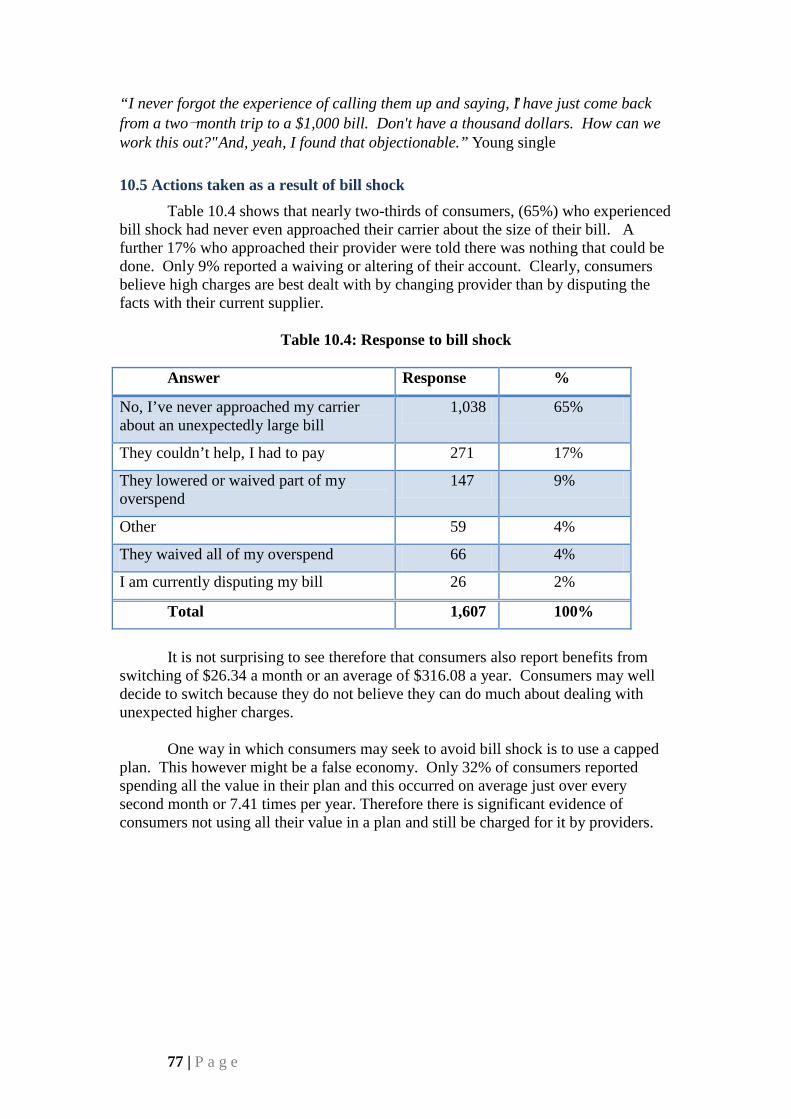
77 | P a g e
“I never forgot the experience of calling them up and saying, "I have just come back from a two-month trip to a $1,000 bill. Don't have a thousand dollars. How can we work this out?" And, yeah, I found that objectionable.” Young single
10.5 Actions taken as a result of bill shock Table 10.4 shows that nearly two-thirds of consumers, (65%) who experienced
bill shock had never even approached their carrier about the size of their bill. A further 17% who approached their provider were told there was nothing that could be done. Only 9% reported a waiving or altering of their account. Clearly, consumers believe high charges are best dealt with by changing provider than by disputing the facts with their current supplier.
Table 10.4: Response to bill shock
Answer Response %
No, I’ve never approached my carrier about an unexpectedly large bill
1,038 65%
They couldn’t help, I had to pay 271 17%
They lowered or waived part of my overspend
147 9%
Other 59 4%
They waived all of my overspend 66 4%
I am currently disputing my bill 26 2%
Total 1,607 100%
It is not surprising to see therefore that consumers also report benefits from
switching of $26.34 a month or an average of $316.08 a year. Consumers may well decide to switch because they do not believe they can do much about dealing with unexpected higher charges.
One way in which consumers may seek to avoid bill shock is to use a capped
plan. This however might be a false economy. Only 32% of consumers reported spending all the value in their plan and this occurred on average just over every second month or 7.41 times per year. Therefore there is significant evidence of consumers not using all their value in a plan and still be charged for it by providers.
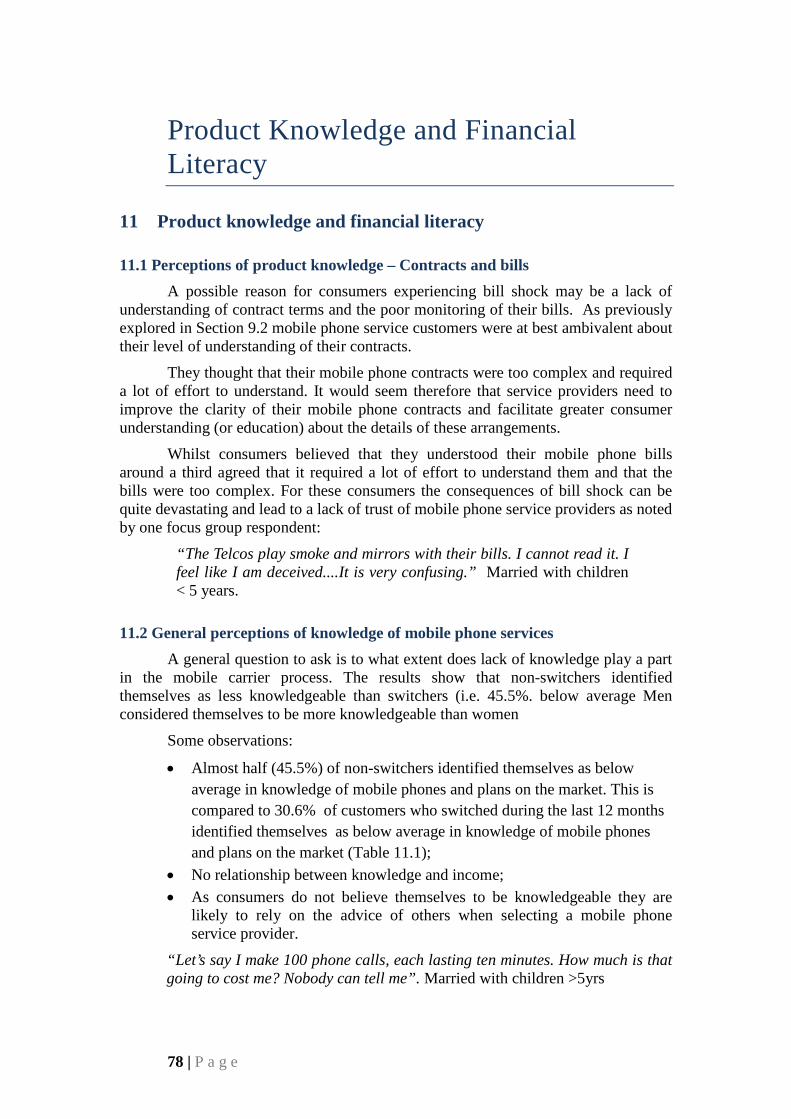
78 | P a g e
Product Knowledge and Financial Literacy
11 Product knowledge and financial literacy
11.1 Perceptions of product knowledge – Contracts and bills A possible reason for consumers experiencing bill shock may be a lack of
understanding of contract terms and the poor monitoring of their bills. As previously explored in Section 9.2 mobile phone service customers were at best ambivalent about their level of understanding of their contracts.
They thought that their mobile phone contracts were too complex and required a lot of effort to understand. It would seem therefore that service providers need to improve the clarity of their mobile phone contracts and facilitate greater consumer understanding (or education) about the details of these arrangements.
Whilst consumers believed that they understood their mobile phone bills around a third agreed that it required a lot of effort to understand them and that the bills were too complex. For these consumers the consequences of bill shock can be quite devastating and lead to a lack of trust of mobile phone service providers as noted by one focus group respondent:
“The Telcos play smoke and mirrors with their bills. I cannot read it. I feel like I am deceived....It is very confusing.” Married with children < 5 years.
11.2 General perceptions of knowledge of mobile phone services A general question to ask is to what extent does lack of knowledge play a part
in the mobile carrier process. The results show that non-switchers identified themselves as less knowledgeable than switchers (i.e. 45.5%. below average Men considered themselves to be more knowledgeable than women
Some observations:
• Almost half (45.5%) of non-switchers identified themselves as below average in knowledge of mobile phones and plans on the market. This is compared to 30.6% of customers who switched during the last 12 months identified themselves as below average in knowledge of mobile phones and plans on the market (Table 11.1);
• No relationship between knowledge and income; • As consumers do not believe themselves to be knowledgeable they are
likely to rely on the advice of others when selecting a mobile phone service provider.
“Let’s say I make 100 phone calls, each lasting ten minutes. How much is that going to cost me? Nobody can tell me”. Married with children >5yrs
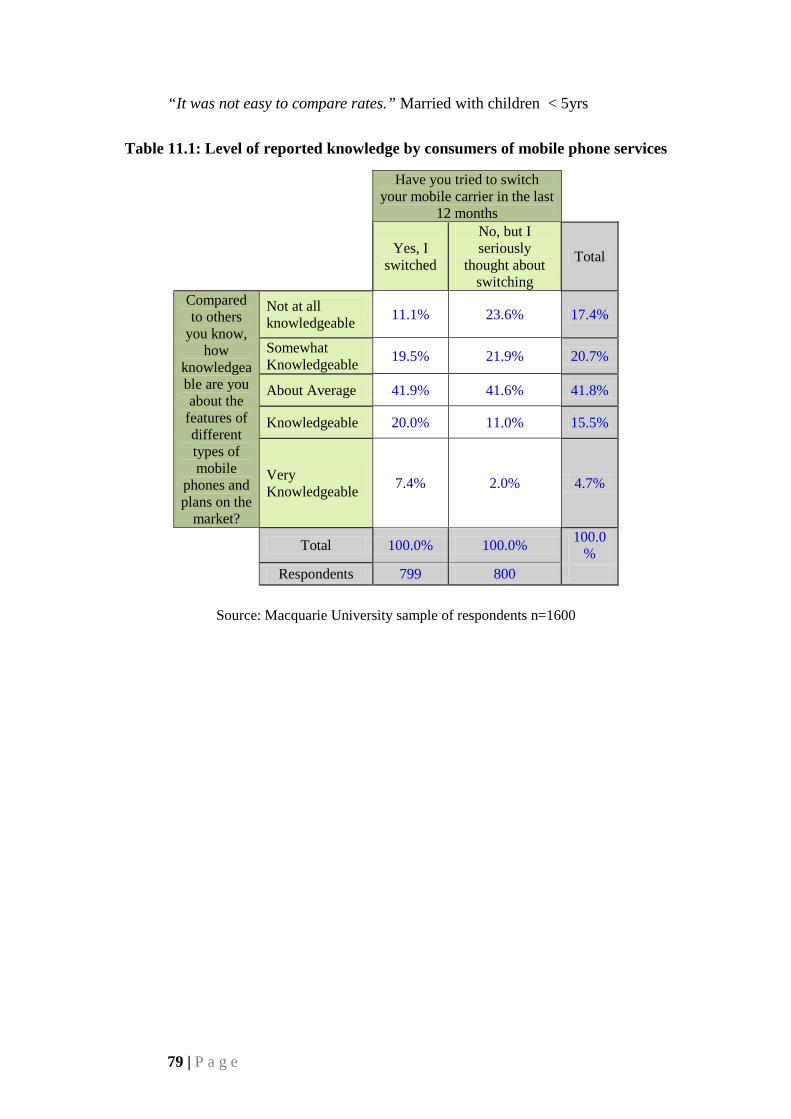
79 | P a g e
“It was not easy to compare rates.” Married with children < 5yrs
Table 11.1: Level of reported knowledge by consumers of mobile phone services
Have you tried to switch your mobile carrier in the last
12 months
Yes, I switched
No, but I seriously
thought about switching
Total
Compared to others
you know, how
knowledgeable are you about the
features of different types of mobile
phones and plans on the
market?
Not at all knowledgeable 11.1% 23.6% 17.4%
Somewhat Knowledgeable 19.5% 21.9% 20.7%
About Average 41.9% 41.6% 41.8%
Knowledgeable 20.0% 11.0% 15.5%
Very Knowledgeable 7.4% 2.0% 4.7%
Total 100.0% 100.0% 100.0%
Respondents 799 800
Source: Macquarie University sample of respondents n=1600

80 | P a g e
Table 11.2: Level of reported knowledge of mobile phones and contracts by demographics (gender, age and gross income).
Male Female 18-24 25-34 35-44 45-54 55-64 65 or over <$29,999 $30,000 -
$49,999 $50,000 - $69,999
$70,000 - $89,999 >$90,000
Prefer not to
disclose Total
Not at all knowledgeable 12.5% 22.8% 4.9% 9.1% 13.5% 19.4% 26.0% 27.3% 23.7% 16.5% 13.9% 11.9% 14.1% 20.8% 17.4%
Somewhat knowledgeable 19.5% 21.9% 15.5% 16.1% 15.9% 27.3% 21.0% 27.3% 22.3% 22.0% 16.5% 20.0% 19.2% 22.9% 20.6%
About Average 40.8% 42.8% 44.4% 46.3% 46.0% 37.3% 40.3% 36.1% 40.6% 39.9% 49.3% 42.7% 35.0% 43.6% 41.8%
Knowledgeable 19.8% 10.9% 28.2% 20.7% 17.7% 12.9% 9.8% 8.8% 10.9% 16.8% 15.0% 20.0% 22.7% 10.6% 15.5%
Very knowledgeable 7.4% 1.7% 7.0% 7.7% 6.9% 3.1% 2.9% 0.5% 2.6% 4.9% 5.3% 5.4% 9.0% 2.1% 4.7%
Total 100.0%
100.0%
100.0%
100.0%
100.0%
100.0%
100.0%
100.0%
100.0%
100.0%
100.0%
100.0%
100.0%
100.0%
100.0%
Respondents 835 764 142 285 333 319 315 205 350 328 266 185 234 236 1599
Source: Macquarie University Sample of respondents n=1600
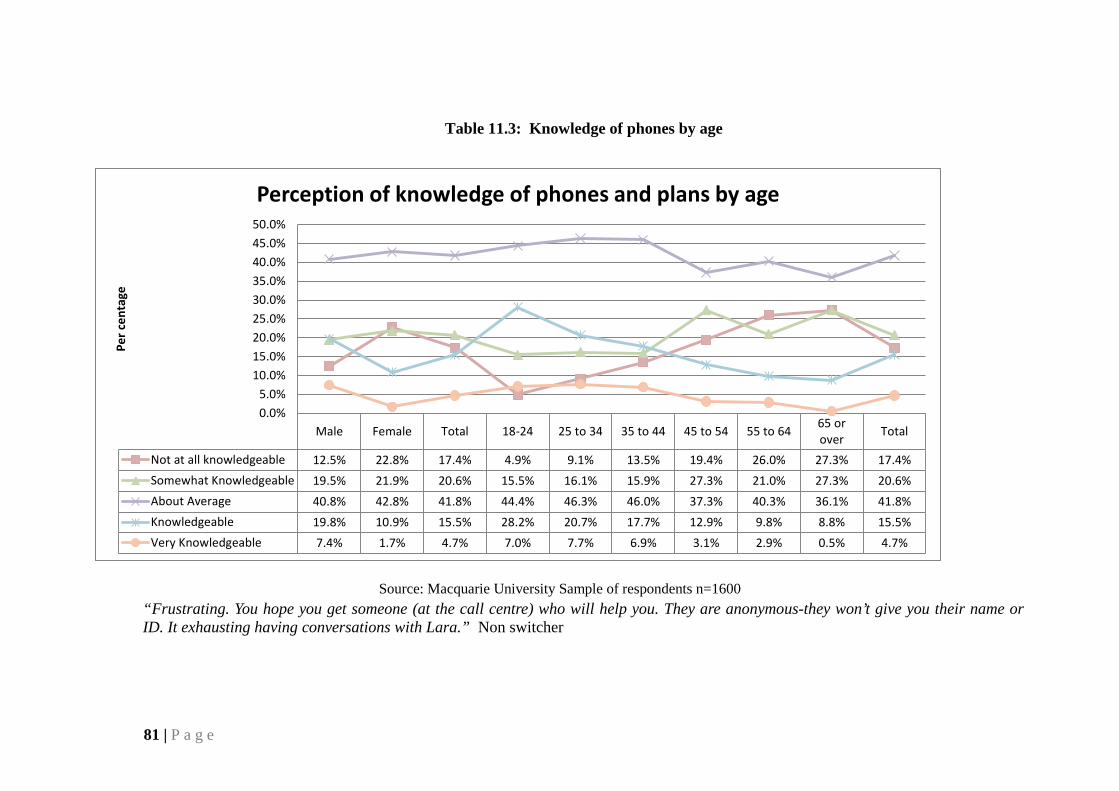
81 | P a g e
Table 11.3: Knowledge of phones by age
Source: Macquarie University Sample of respondents n=1600 “Frustrating. You hope you get someone (at the call centre) who will help you. They are anonymous-they won’t give you their name or ID. It exhausting having conversations with Lara.” Non switcher
Male Female Total 18-24 25 to 34 35 to 44 45 to 54 55 to 64 65 orover Total
Not at all knowledgeable 12.5% 22.8% 17.4% 4.9% 9.1% 13.5% 19.4% 26.0% 27.3% 17.4%Somewhat Knowledgeable 19.5% 21.9% 20.6% 15.5% 16.1% 15.9% 27.3% 21.0% 27.3% 20.6%About Average 40.8% 42.8% 41.8% 44.4% 46.3% 46.0% 37.3% 40.3% 36.1% 41.8%Knowledgeable 19.8% 10.9% 15.5% 28.2% 20.7% 17.7% 12.9% 9.8% 8.8% 15.5%Very Knowledgeable 7.4% 1.7% 4.7% 7.0% 7.7% 6.9% 3.1% 2.9% 0.5% 4.7%
0.0%5.0%
10.0%15.0%20.0%25.0%30.0%35.0%40.0%45.0%50.0%
Per c
enta
ge
Perception of knowledge of phones and plans by age

82 | P a g e
Current Mobile Phone Plans Used 12 Current mobile phone plans used
12.1 Introduction-the current plans used The most popular service used was the 24 month cap plan (40%); followed by
a prepaid SIM card only (19%), then by month to month post-paid (14%); then followed by those who purchased a prepaid SIM card but had their own phone (Table 12.1).
Table 12.1: Type of Mobile Phone Service Currently Used
Answer Response %
24 month cap plan with phone 651 40%
12 month cap with phone 83 5%
Bundled with broadband package 89 6%
Month to Month post-paid 229 14%
12 months post-paid plan with bring Your Own Phone (i.e. SIM only plan)
63
4%
Prepaid SIM with Phone 157 10%
Prepaid SIM only 313 19%
Other (Please identify) 23 1%
Total 1,608 100%
Source: Macquarie University sample of respondents n=1608
12.2 What is included in the current mobile phone plan As shown in Figure 12.1, unlimited national calls (64.5% of responses) and
SMS texts (63.9% of responses) are prominent features of mobile phone plans in Australia. The next set of popular options are free access to social media (48.4% of responses) followed an included value of internet /data access (47.1% of mentions). This shows the evolution of mobile phones now to a device that engages users more in their daily lives and connects them with peers, family, social and professional networks.
The results show that the inclusion of a “smartphone” is not part of a majority of mobile plans as part of the current plan as it was mentioned by only 13.2% of responses. This low figure should, however be viewed with caution, as acquiring a new handset is seen as important factor in the choice of a new mobile phone provider.
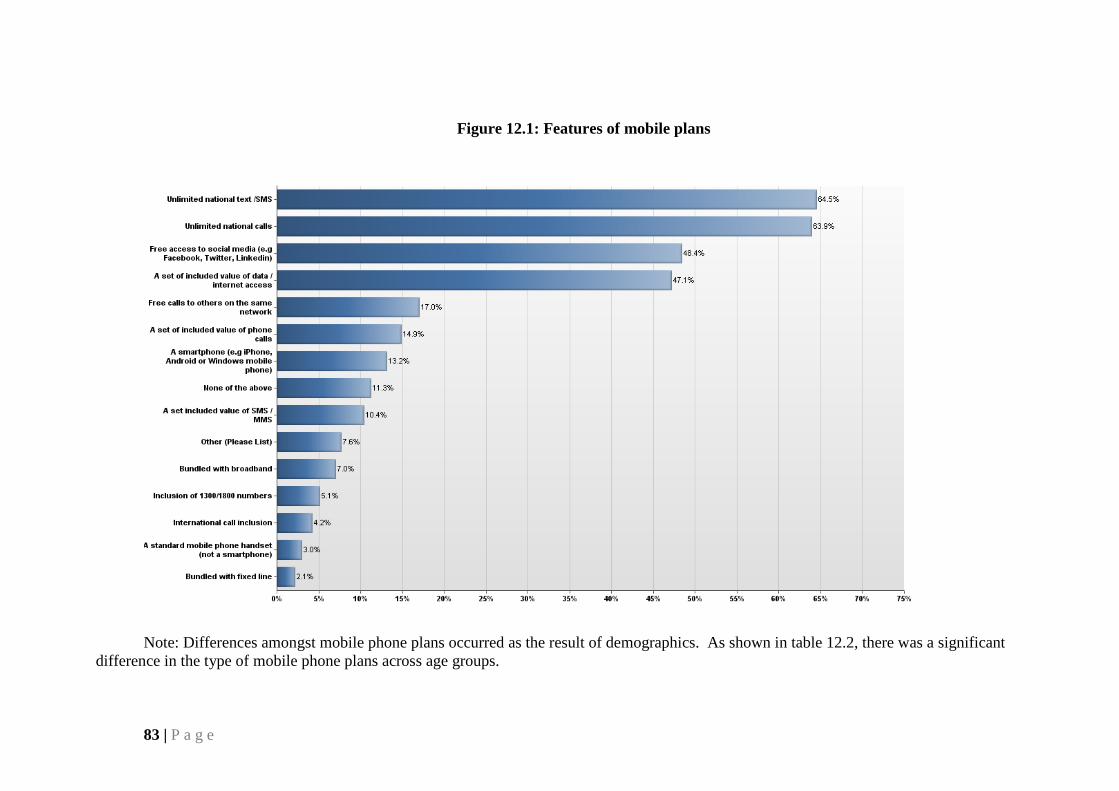
83 | P a g e
Figure 12.1: Features of mobile plans
Note: Differences amongst mobile phone plans occurred as the result of demographics. As shown in table 12.2, there was a significant
difference in the type of mobile phone plans across age groups.
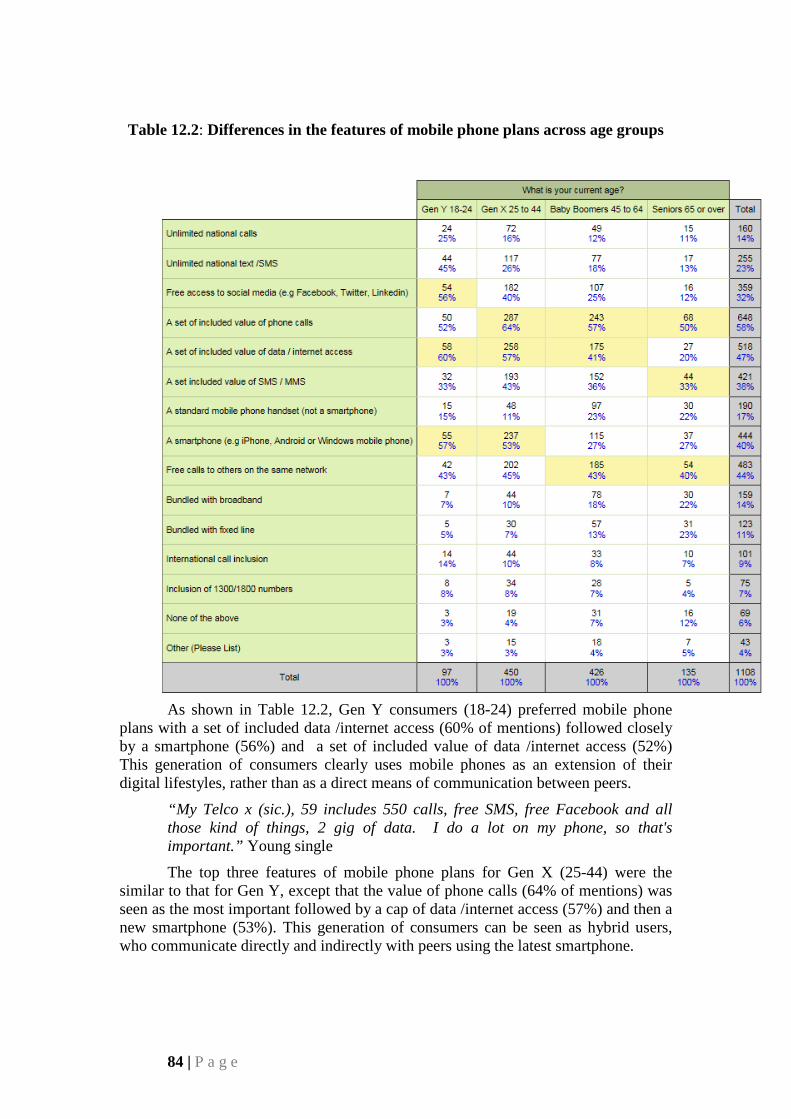
84 | P a g e
Table 12.2: Differences in the features of mobile phone plans across age groups
As shown in Table 12.2, Gen Y consumers (18-24) preferred mobile phone plans with a set of included data /internet access (60% of mentions) followed closely by a smartphone (56%) and a set of included value of data /internet access (52%) This generation of consumers clearly uses mobile phones as an extension of their digital lifestyles, rather than as a direct means of communication between peers.
“My Telco x (sic.), 59 includes 550 calls, free SMS, free Facebook and all those kind of things, 2 gig of data. I do a lot on my phone, so that's important.” Young single
The top three features of mobile phone plans for Gen X (25-44) were the similar to that for Gen Y, except that the value of phone calls (64% of mentions) was seen as the most important followed by a cap of data /internet access (57%) and then a new smartphone (53%). This generation of consumers can be seen as hybrid users, who communicate directly and indirectly with peers using the latest smartphone.
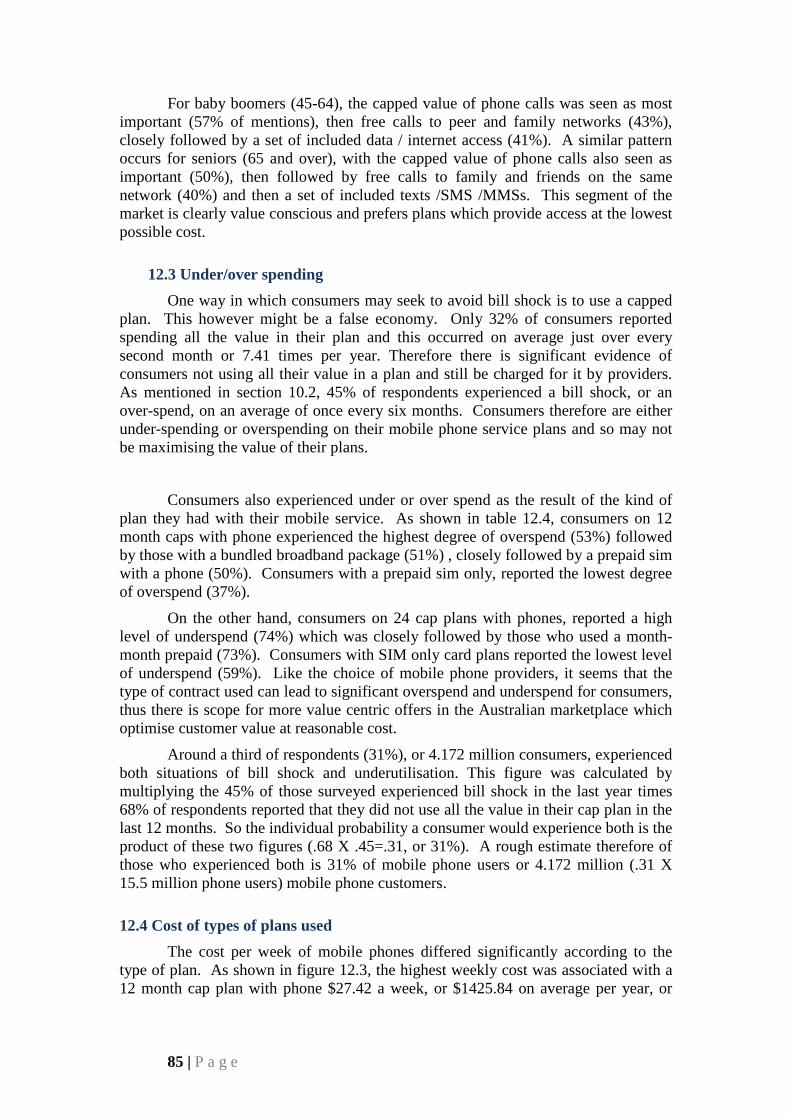
85 | P a g e
For baby boomers (45-64), the capped value of phone calls was seen as most important (57% of mentions), then free calls to peer and family networks (43%), closely followed by a set of included data / internet access (41%). A similar pattern occurs for seniors (65 and over), with the capped value of phone calls also seen as important (50%), then followed by free calls to family and friends on the same network (40%) and then a set of included texts /SMS /MMSs. This segment of the market is clearly value conscious and prefers plans which provide access at the lowest possible cost.
12.3 Under/over spending One way in which consumers may seek to avoid bill shock is to use a capped
plan. This however might be a false economy. Only 32% of consumers reported spending all the value in their plan and this occurred on average just over every second month or 7.41 times per year. Therefore there is significant evidence of consumers not using all their value in a plan and still be charged for it by providers. As mentioned in section 10.2, 45% of respondents experienced a bill shock, or an over-spend, on an average of once every six months. Consumers therefore are either under-spending or overspending on their mobile phone service plans and so may not be maximising the value of their plans.
Consumers also experienced under or over spend as the result of the kind of plan they had with their mobile service. As shown in table 12.4, consumers on 12 month caps with phone experienced the highest degree of overspend (53%) followed by those with a bundled broadband package (51%) , closely followed by a prepaid sim with a phone (50%). Consumers with a prepaid sim only, reported the lowest degree of overspend (37%).
On the other hand, consumers on 24 cap plans with phones, reported a high level of underspend (74%) which was closely followed by those who used a month-month prepaid (73%). Consumers with SIM only card plans reported the lowest level of underspend (59%). Like the choice of mobile phone providers, it seems that the type of contract used can lead to significant overspend and underspend for consumers, thus there is scope for more value centric offers in the Australian marketplace which optimise customer value at reasonable cost.
Around a third of respondents (31%), or 4.172 million consumers, experienced both situations of bill shock and underutilisation. This figure was calculated by multiplying the 45% of those surveyed experienced bill shock in the last year times 68% of respondents reported that they did not use all the value in their cap plan in the last 12 months. So the individual probability a consumer would experience both is the product of these two figures (.68 X .45=.31, or 31%). A rough estimate therefore of those who experienced both is 31% of mobile phone users or 4.172 million (.31 X 15.5 million phone users) mobile phone customers.
12.4 Cost of types of plans used The cost per week of mobile phones differed significantly according to the
type of plan. As shown in figure 12.3, the highest weekly cost was associated with a 12 month cap plan with phone $27.42 a week, or $1425.84 on average per year, or
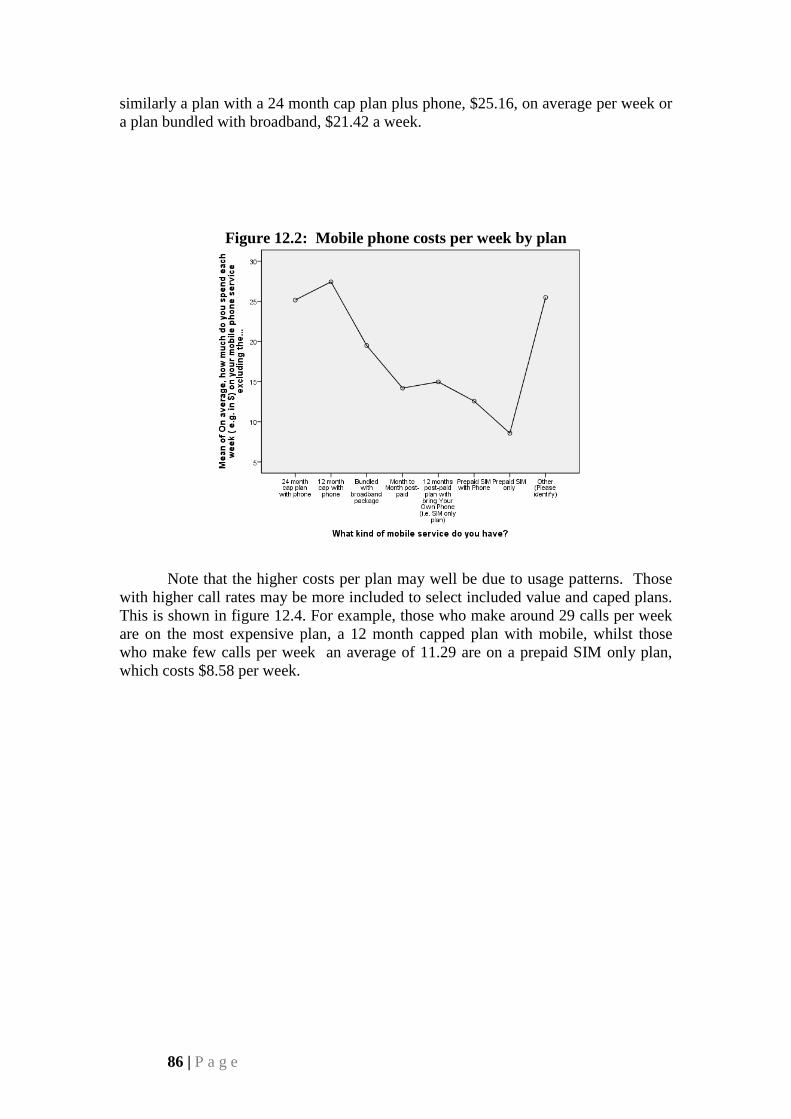
86 | P a g e
similarly a plan with a 24 month cap plan plus phone, $25.16, on average per week or a plan bundled with broadband, $21.42 a week.
Figure 12.2: Mobile phone costs per week by plan
Note that the higher costs per plan may well be due to usage patterns. Those
with higher call rates may be more included to select included value and caped plans. This is shown in figure 12.4. For example, those who make around 29 calls per week are on the most expensive plan, a 12 month capped plan with mobile, whilst those who make few calls per week an average of 11.29 are on a prepaid SIM only plan, which costs $8.58 per week.
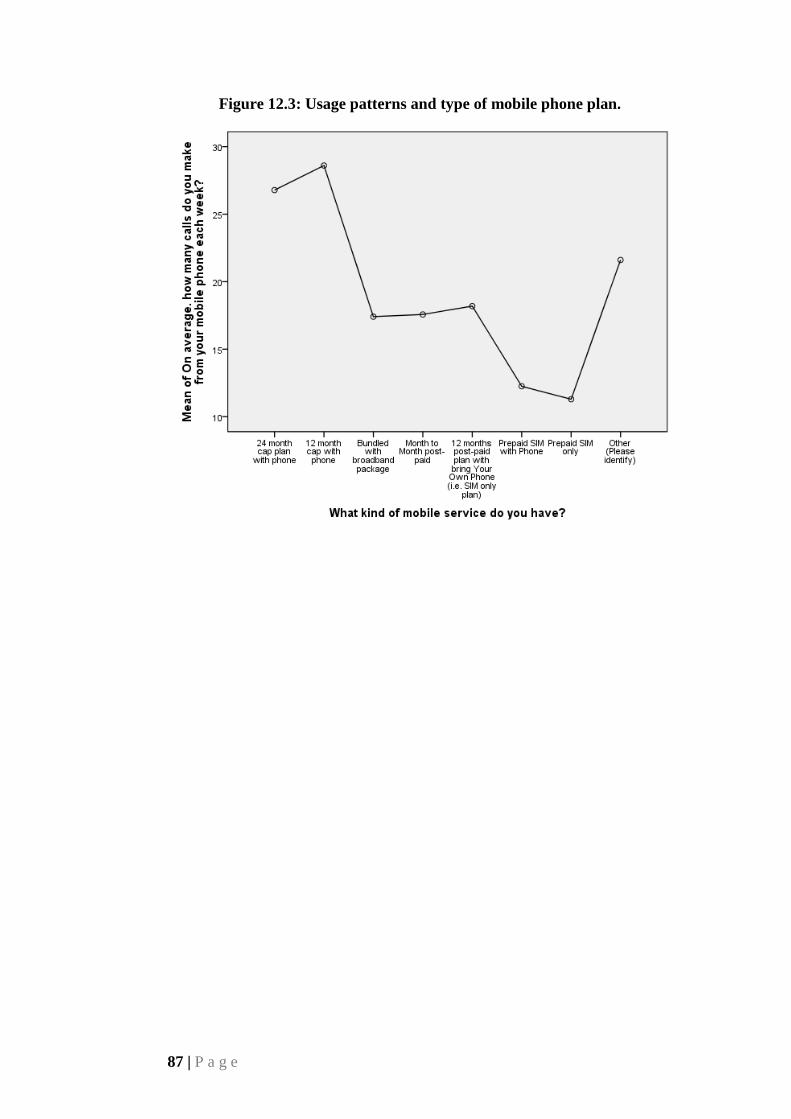
87 | P a g e
Figure 12.3: Usage patterns and type of mobile phone plan.
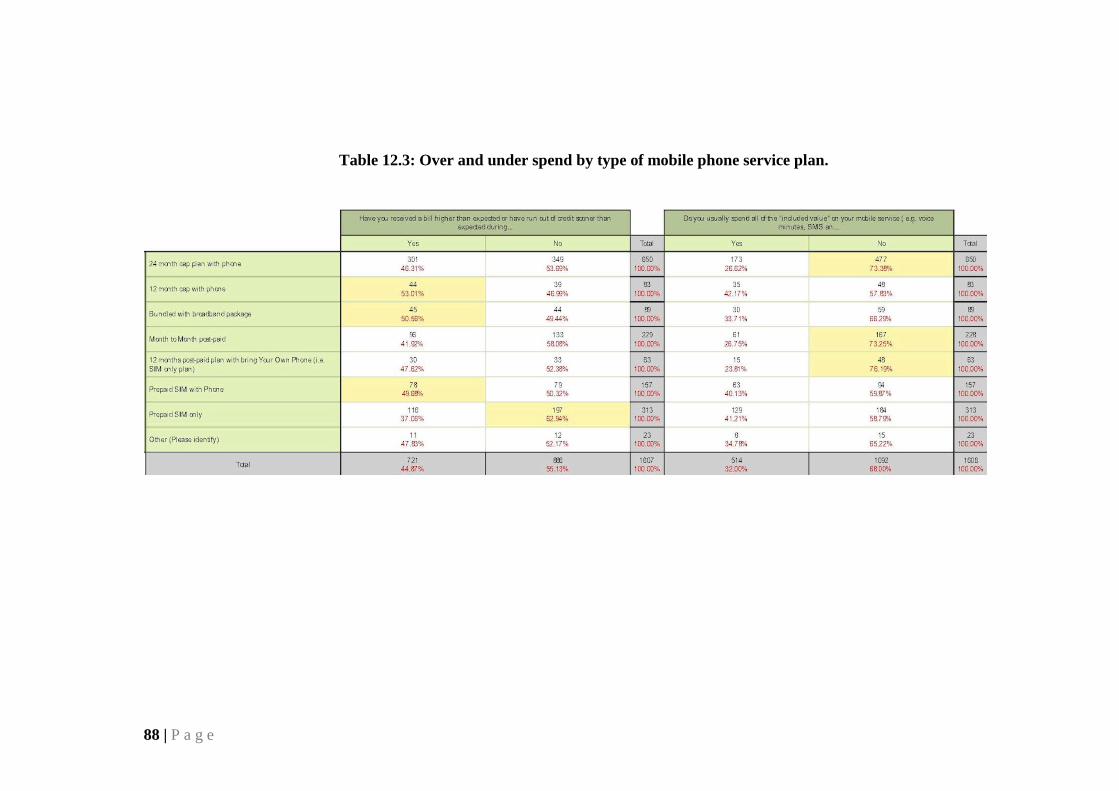
88 | P a g e
Table 12.3: Over and under spend by type of mobile phone service plan.
89 | P a g e
Customer Satisfaction/Value Ratings
13 Customer satisfaction and value ratings
13.1 Customer satisfaction Research has indicated that customer satisfaction is an antecedent of increased
market share, profitability, positive word of mouth, and customer retention (e.g., Anderson, Fornell & Lehman 1994). In relation to this study customer satisfaction ratings are based on how satisfied survey respondents were in relation to a range of ten mobile phone service and product attributes (see Figure 13.1). The attributes were selected by industry experts and a review of previous literature. This attribute-based approach (Busacca & Padula, 2005; Mittal & Kamakura, 2001) is well established and recognises that consumers ascribe different levels of importance to product/service attributes and therefore, result in a non-linear measure of customer satisfaction.
Observations suggest a widespread level of dissatisfaction amongst consumers who had seriously considered switching mobile phone service suppliers but had not done so. Satisfaction levels in most attribute areas increased after they had switched suppliers. Major observations include:
• Consumers who switched supplier during the last 12 were generally more
satisfied than those who had not switched except in in relation to overall contract terms;
• Consumers who switched suppliers were generally satisfied with their monthly cost, coverage, sms and call rates, the quality of their mobile, and customer service. They were less satisfied however, with their internet rates and the length of contract and very dissatisfied with their roaming costs and overall contract terms.;
• Even after switching suppliers only 12.5% of consumers were satisfied with their overall contract terms and only 35.7% were satisfied with their roaming costs.;
• Consumers who had not as yet switched suppliers were particularly dissatisfied about their sms rates, call rates, customer service, overall contract terms, internet rates, length of contract and roaming costs.
13.2 Customer value ratings A strategy to increase customer value by increasing customer loyalty and
reducing defection rates (Parasuraman and Grewal 2000) can improve shareholder value. Holbrook (1994) views customer value as a fundamental component of marketing activity. The widely held view is that “buyers’ perceptions of value represent a trade-off between the quality or benefits they perceive in the product relative to the sacrifice they perceive by paying the price” (Monroe 1990, p. 46; Zeithaml 1988). The seven items used to measure customer value were taken from Grewal et al. (1998) and Sweeny and Soutar (2001) and validated by Ruiz, et al. 2010.
90 | P a g e
Major observations of the survey data show a significant difference between switchers and non-switchers in value perceptions (Figure 13.2):
• 59%-67% of consumers who switched providers during the last twelve
months were satisfied with a range of value attributes: i.e. time, effort and money; reasonable pricing; good services for the price; happy with the price; feelings of getting their money’s worth; value comparison with other service providers and overall value of the price paid;
• Only 20%-30% of consumers who had seriously thought about it but had not switched service providers were satisfied with the value they received from their mobile service providers.
Overall, it appears that those who made the effort to switch, are overall more satisfied with most product/service attributes and value they are receiving, except for the contract terms they have negotiated. Contracts appear to be causing the consumer a great deal of confusion in that even after the switch, there is increased dissatisfaction within the new plan/provider.
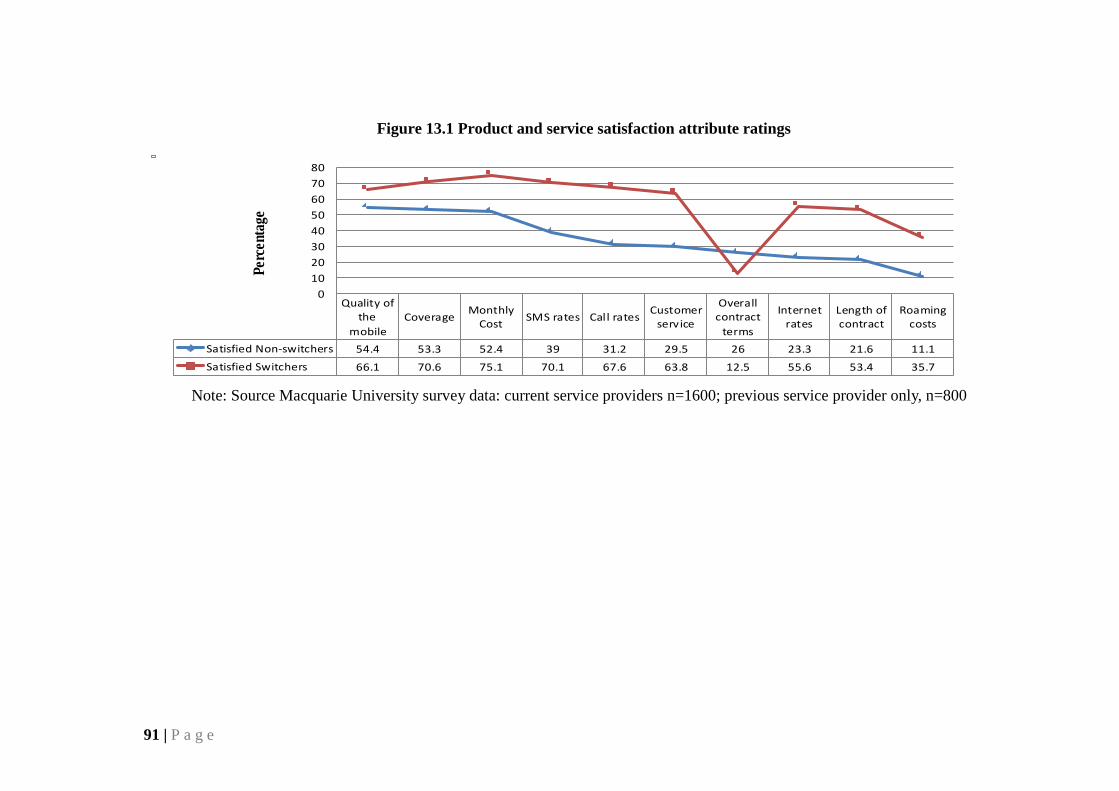
91 | P a g e
Figure 13.1 Product and service satisfaction attribute ratings
Quality ofthe
mobileCoverage Monthly
Cost SMS rates Call rates Customerservice
Overallcontract
terms
Internetrates
Length ofcontract
Roamingcosts
Satisfied Non-switchers 54.4 53.3 52.4 39 31.2 29.5 26 23.3 21.6 11.1Satisfied Switchers 66.1 70.6 75.1 70.1 67.6 63.8 12.5 55.6 53.4 35.7
01020304050607080
Perc
enta
ge
Note: Source Macquarie University survey data: current service providers n=1600; previous service provider only, n=800
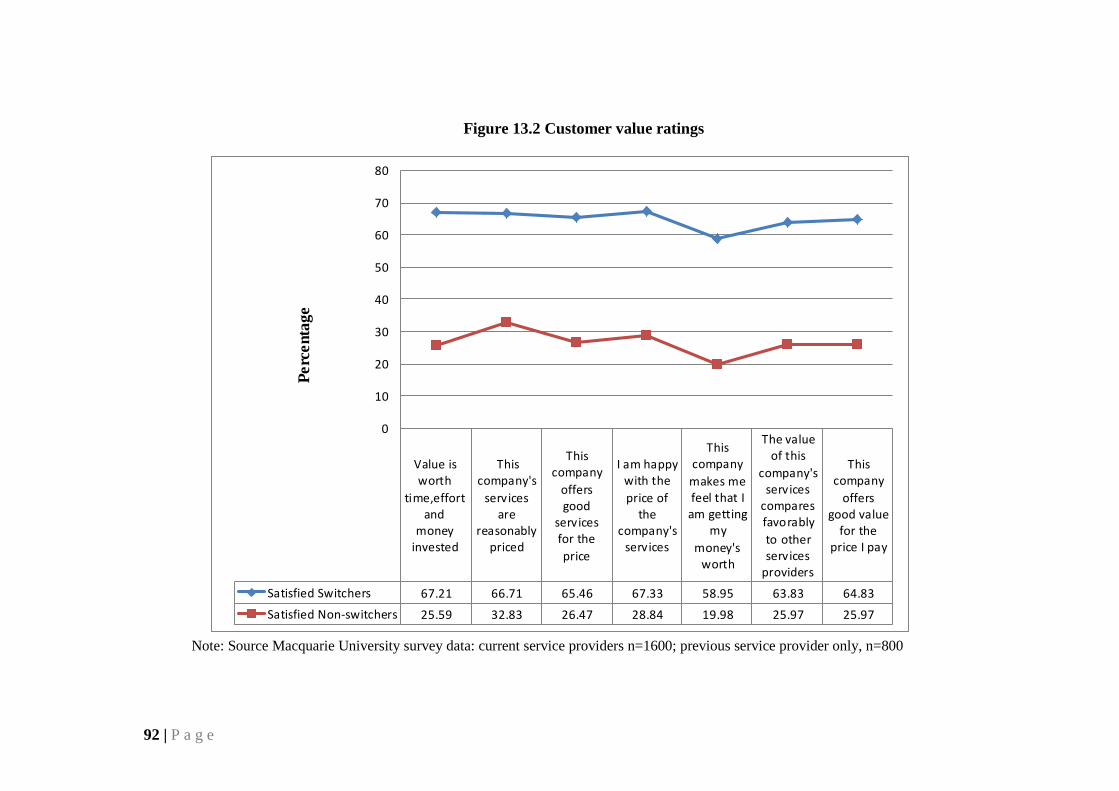
92 | P a g e
Figure 13.2 Customer value ratings
Value isworth
time,effortand
moneyinvested
Thiscompany's
servicesare
reasonablypriced
Thiscompany
offersgood
servicesfor theprice
I am happywith theprice of
thecompany's
services
Thiscompany
makes mefeel that I
am gettingmy
money'sworth
The valueof this
company'sservices
comparesfavorablyto otherservices
providers
Thiscompany
offersgood value
for theprice I pay
Satisfied Switchers 67.21 66.71 65.46 67.33 58.95 63.83 64.83Satisfied Non-switchers 25.59 32.83 26.47 28.84 19.98 25.97 25.97
0
10
20
30
40
50
60
70
80
Perc
enta
ge
Note: Source Macquarie University survey data: current service providers n=1600; previous service provider only, n=800
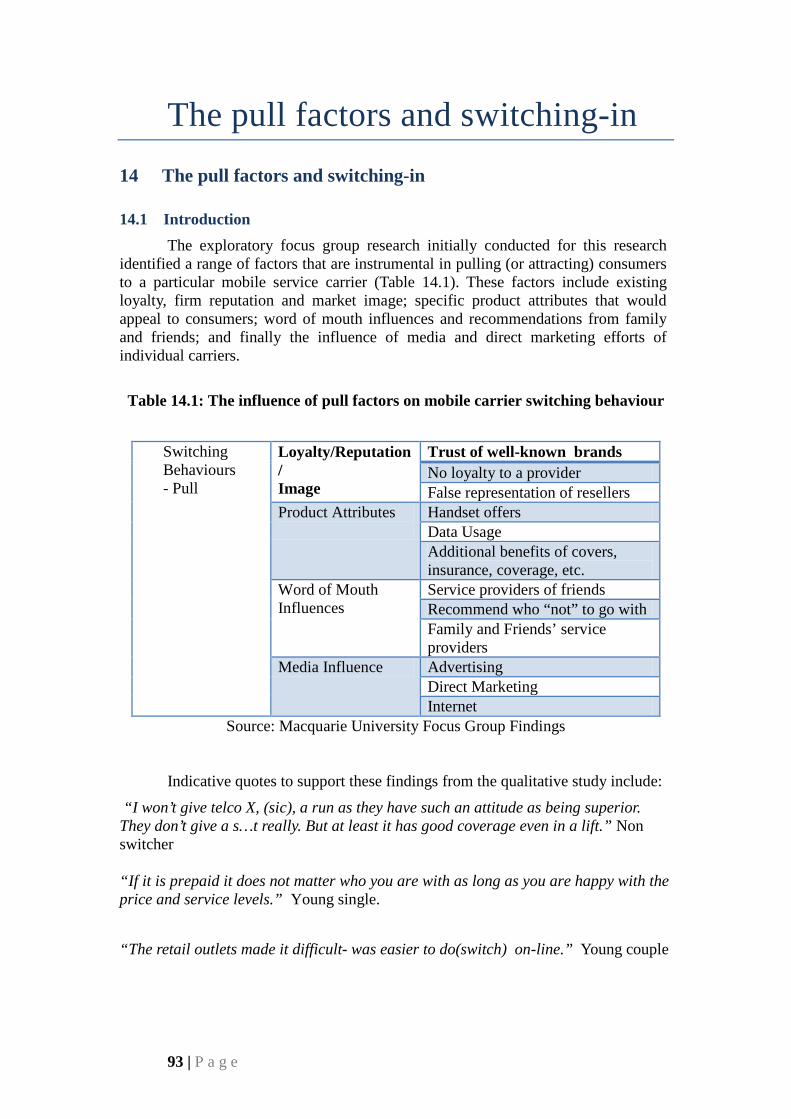
93 | P a g e
The pull factors and switching-in 14 The pull factors and switching-in
14.1 Introduction The exploratory focus group research initially conducted for this research
identified a range of factors that are instrumental in pulling (or attracting) consumers to a particular mobile service carrier (Table 14.1). These factors include existing loyalty, firm reputation and market image; specific product attributes that would appeal to consumers; word of mouth influences and recommendations from family and friends; and finally the influence of media and direct marketing efforts of individual carriers.
Table 14.1: The influence of pull factors on mobile carrier switching behaviour
Switching Behaviours - Pull
Loyalty/Reputation/ Image
Trust of well-known brands No loyalty to a provider False representation of resellers
Product Attributes
Handset offers Data Usage Additional benefits of covers, insurance, coverage, etc.
Word of Mouth Influences
Service providers of friends Recommend who “not” to go with Family and Friends’ service providers
Media Influence Advertising Direct Marketing Internet
Source: Macquarie University Focus Group Findings
Indicative quotes to support these findings from the qualitative study include:
“I won’t give telco X, (sic), a run as they have such an attitude as being superior. They don’t give a s…t really. But at least it has good coverage even in a lift.” Non switcher “If it is prepaid it does not matter who you are with as long as you are happy with the price and service levels.” Young single.
“The retail outlets made it difficult- was easier to do(switch) on-line.” Young couple
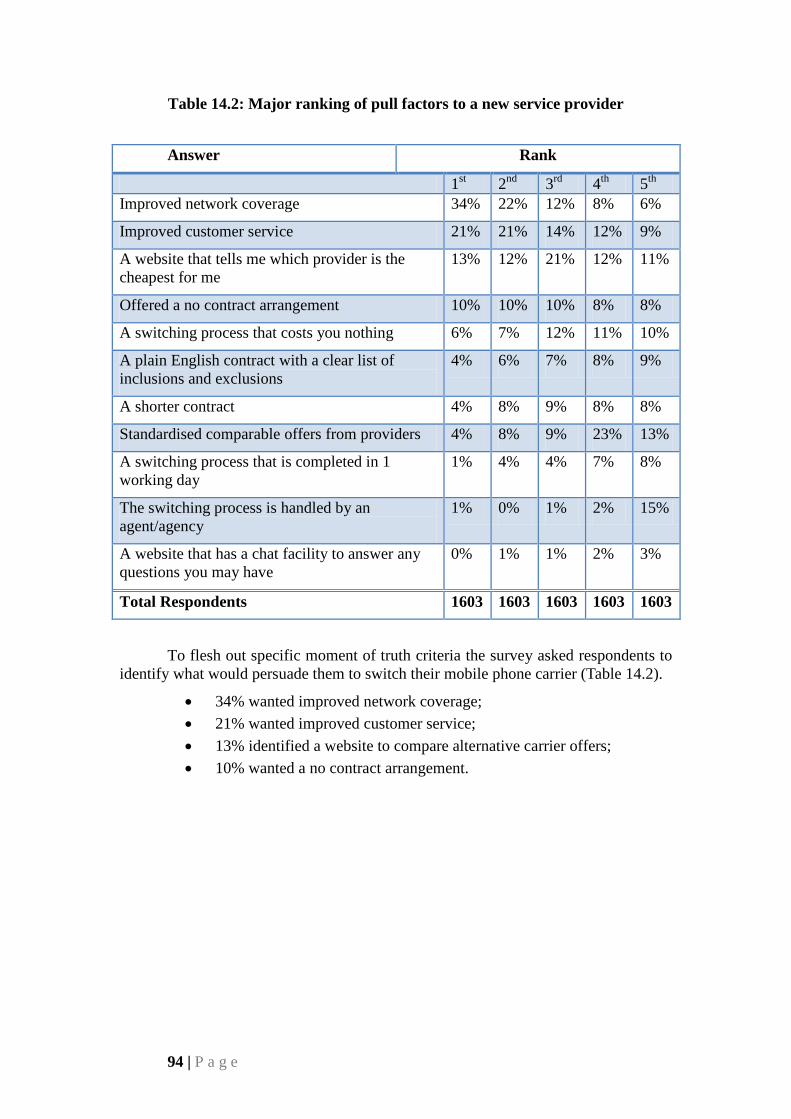
94 | P a g e
Table 14.2: Major ranking of pull factors to a new service provider
Answer Rank
1st 2nd 3rd 4th 5th Improved network coverage 34% 22% 12% 8% 6%
Improved customer service 21% 21% 14% 12% 9%
A website that tells me which provider is the cheapest for me
13% 12% 21% 12% 11%
Offered a no contract arrangement 10% 10% 10% 8% 8%
A switching process that costs you nothing 6% 7% 12% 11% 10%
A plain English contract with a clear list of inclusions and exclusions
4% 6% 7% 8% 9%
A shorter contract 4% 8% 9% 8% 8%
Standardised comparable offers from providers 4% 8% 9% 23% 13%
A switching process that is completed in 1 working day
1% 4% 4% 7% 8%
The switching process is handled by an agent/agency
1% 0% 1% 2% 15%
A website that has a chat facility to answer any questions you may have
0% 1% 1% 2% 3%
Total Respondents 1603 1603 1603 1603 1603
To flesh out specific moment of truth criteria the survey asked respondents to identify what would persuade them to switch their mobile phone carrier (Table 14.2).
• 34% wanted improved network coverage; • 21% wanted improved customer service; • 13% identified a website to compare alternative carrier offers; • 10% wanted a no contract arrangement.

95 | P a g e
Satisfaction with customer service by mode of contract
15 Satisfaction with customer service by mode of contract An analysis of mean scores of satisfaction with the previous mobile phone
provider across the types of mobile phone contracts revealed significant differences in terms of satisfaction with coverage, monthly cost and call rates. As shown in figure 15.1, those consumers on a 12 month cap plan (mean of 3.50/7) with a post-paid plan when you bring your own phone (mean of 3.45/7) were the least satisfied with network coverage of their previous supplier. The most satisfied consumers with coverage from the previous supplier were those on a prepaid SIM only plan (mean of 4.72 out 7).
Figure 15.1: Differences in satisfaction of coverage as result of mobile phone contracts.
Overall, the patterns of means also suggests that those consumers who were on
cap plans with phones were the least likely to have been satisfied with network coverage, compared to those on SIM only type plans. This difference may be due to the ease of switching for consumers on SIM only plans to network providers who provide the coverage they require.
Figure 15.2, shows the differences in satisfaction with monthly cost as the result of type of mobile phone contract.
Indicative quotes to support these findings from the qualitative study include:
“If it is prepaid it does not matter who you are with as long as you are happy with the price and service levels.” Young single
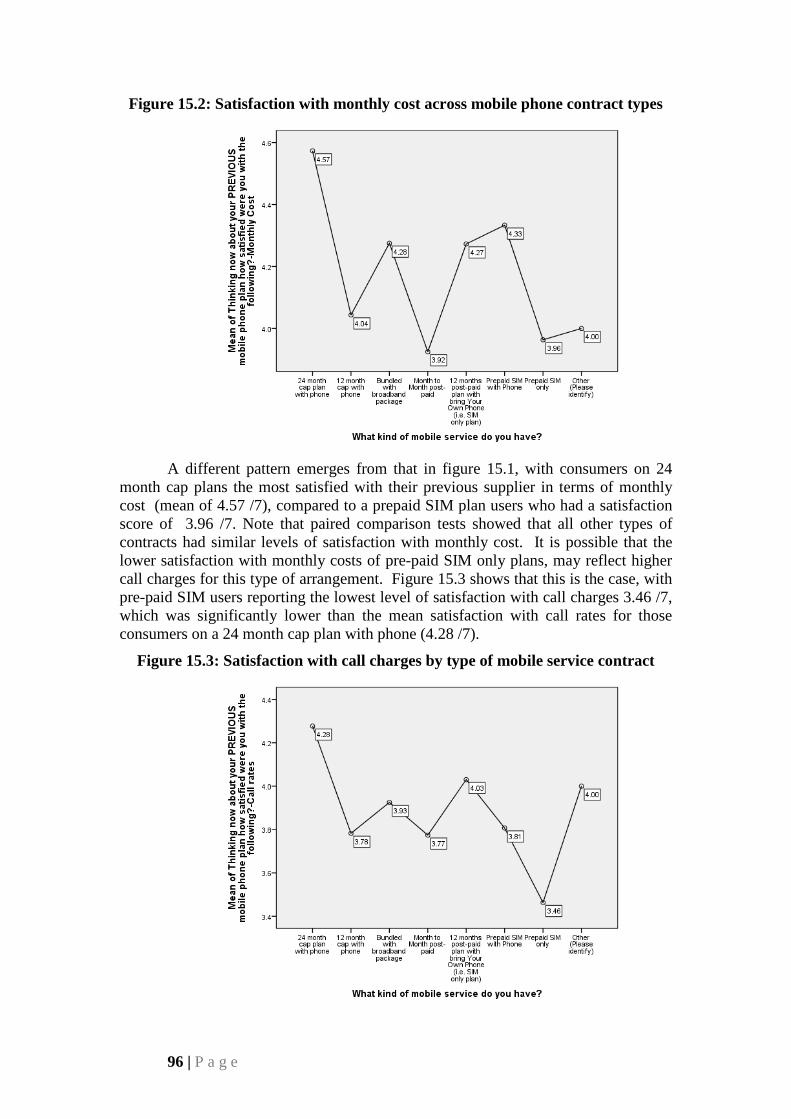
96 | P a g e
Figure 15.2: Satisfaction with monthly cost across mobile phone contract types
A different pattern emerges from that in figure 15.1, with consumers on 24
month cap plans the most satisfied with their previous supplier in terms of monthly cost (mean of 4.57 /7), compared to a prepaid SIM plan users who had a satisfaction score of 3.96 /7. Note that paired comparison tests showed that all other types of contracts had similar levels of satisfaction with monthly cost. It is possible that the lower satisfaction with monthly costs of pre-paid SIM only plans, may reflect higher call charges for this type of arrangement. Figure 15.3 shows that this is the case, with pre-paid SIM users reporting the lowest level of satisfaction with call charges 3.46 /7, which was significantly lower than the mean satisfaction with call rates for those consumers on a 24 month cap plan with phone (4.28 /7).
Figure 15.3: Satisfaction with call charges by type of mobile service contract
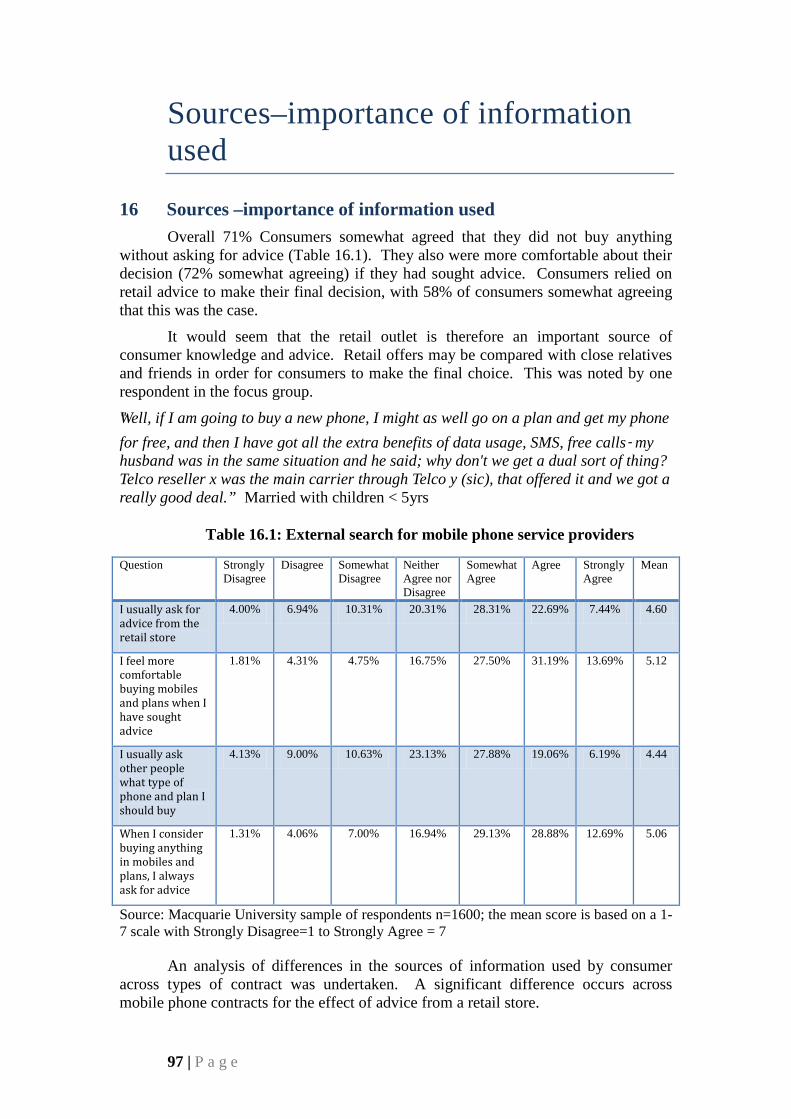
97 | P a g e
Sources–importance of information used
16 Sources –importance of information used Overall 71% Consumers somewhat agreed that they did not buy anything
without asking for advice (Table 16.1). They also were more comfortable about their decision (72% somewhat agreeing) if they had sought advice. Consumers relied on retail advice to make their final decision, with 58% of consumers somewhat agreeing that this was the case.
It would seem that the retail outlet is therefore an important source of consumer knowledge and advice. Retail offers may be compared with close relatives and friends in order for consumers to make the final choice. This was noted by one respondent in the focus group.
"Well, if I am going to buy a new phone, I might as well go on a plan and get my phone for free, and then I have got all the extra benefits of data usage, SMS, free calls‑ my husband was in the same situation and he said; why don't we get a dual sort of thing? Telco reseller x was the main carrier through Telco y (sic), that offered it and we got a really good deal.” Married with children < 5yrs
Table 16.1: External search for mobile phone service providers
Question Strongly Disagree
Disagree Somewhat Disagree
Neither Agree nor Disagree
Somewhat Agree
Agree Strongly Agree
Mean
I usually ask for advice from the retail store
4.00% 6.94% 10.31% 20.31% 28.31% 22.69% 7.44% 4.60
I feel more comfortable buying mobiles and plans when I have sought advice
1.81% 4.31% 4.75% 16.75% 27.50% 31.19% 13.69% 5.12
I usually ask other people what type of phone and plan I should buy
4.13% 9.00% 10.63% 23.13% 27.88% 19.06% 6.19% 4.44
When I consider buying anything in mobiles and plans, I always ask for advice
1.31% 4.06% 7.00% 16.94% 29.13% 28.88% 12.69% 5.06
Source: Macquarie University sample of respondents n=1600; the mean score is based on a 1-7 scale with Strongly Disagree=1 to Strongly Agree = 7
An analysis of differences in the sources of information used by consumer across types of contract was undertaken. A significant difference occurs across mobile phone contracts for the effect of advice from a retail store.
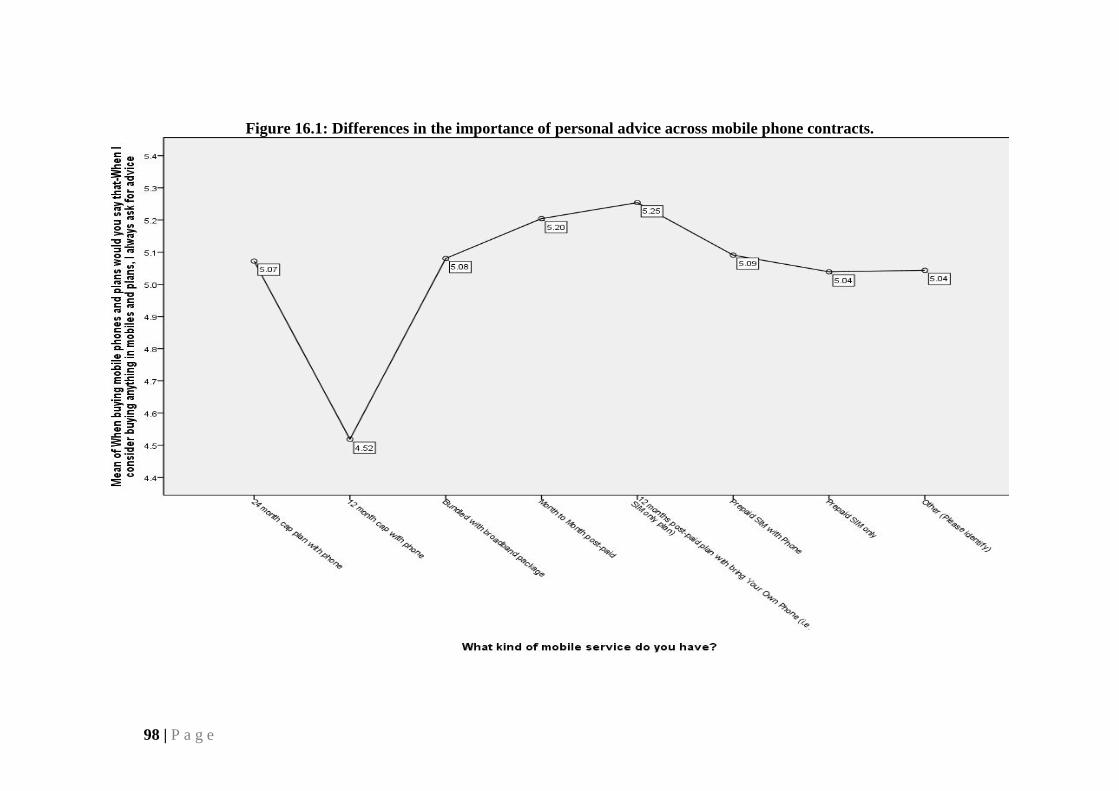
98 | P a g e
Figure 16.1: Differences in the importance of personal advice across mobile phone contracts.
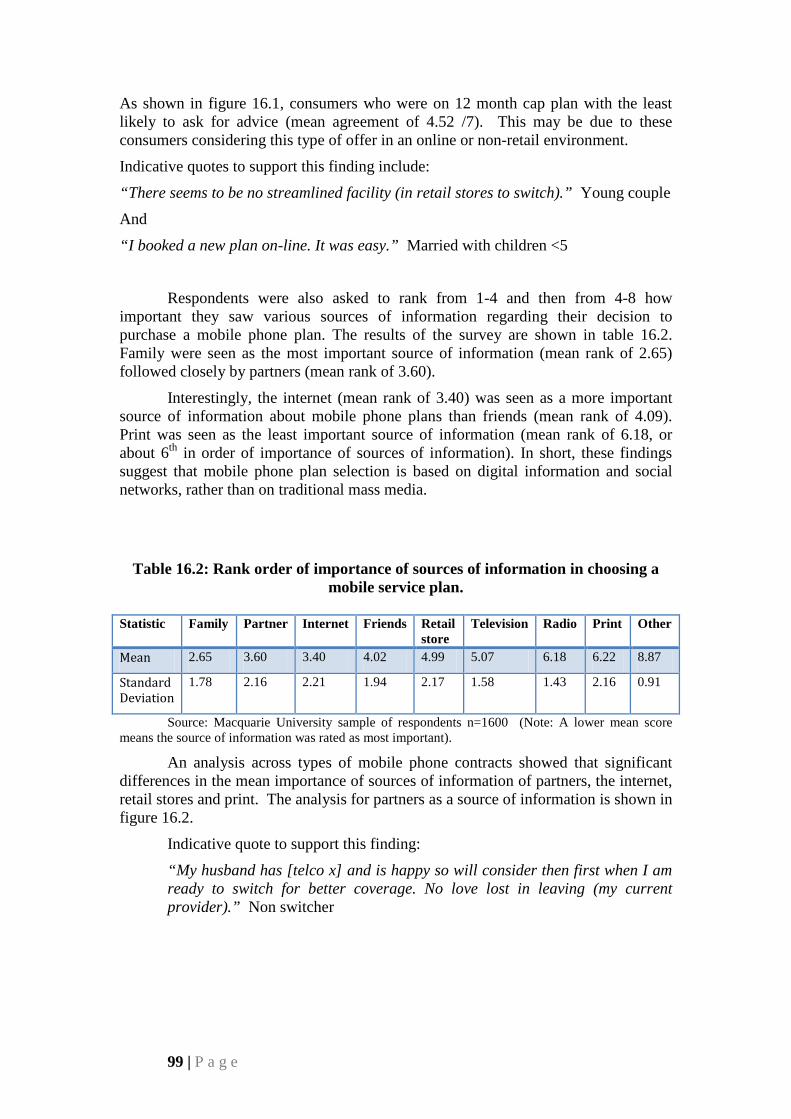
99 | P a g e
As shown in figure 16.1, consumers who were on 12 month cap plan with the least likely to ask for advice (mean agreement of 4.52 /7). This may be due to these consumers considering this type of offer in an online or non-retail environment.
Indicative quotes to support this finding include:
“There seems to be no streamlined facility (in retail stores to switch).” Young couple
And
“I booked a new plan on-line. It was easy.” Married with children <5
Respondents were also asked to rank from 1-4 and then from 4-8 how important they saw various sources of information regarding their decision to purchase a mobile phone plan. The results of the survey are shown in table 16.2. Family were seen as the most important source of information (mean rank of 2.65) followed closely by partners (mean rank of 3.60).
Interestingly, the internet (mean rank of 3.40) was seen as a more important source of information about mobile phone plans than friends (mean rank of 4.09). Print was seen as the least important source of information (mean rank of 6.18, or about 6th in order of importance of sources of information). In short, these findings suggest that mobile phone plan selection is based on digital information and social networks, rather than on traditional mass media.
Table 16.2: Rank order of importance of sources of information in choosing a mobile service plan.
Statistic Family Partner Internet Friends Retail
store Television Radio Print Other
Mean 2.65 3.60 3.40 4.02 4.99 5.07 6.18 6.22 8.87
Standard Deviation
1.78 2.16 2.21 1.94 2.17 1.58 1.43 2.16 0.91
Source: Macquarie University sample of respondents n=1600 (Note: A lower mean score means the source of information was rated as most important).
An analysis across types of mobile phone contracts showed that significant differences in the mean importance of sources of information of partners, the internet, retail stores and print. The analysis for partners as a source of information is shown in figure 16.2.
Indicative quote to support this finding:
“My husband has [telco x] and is happy so will consider then first when I am ready to switch for better coverage. No love lost in leaving (my current provider).” Non switcher
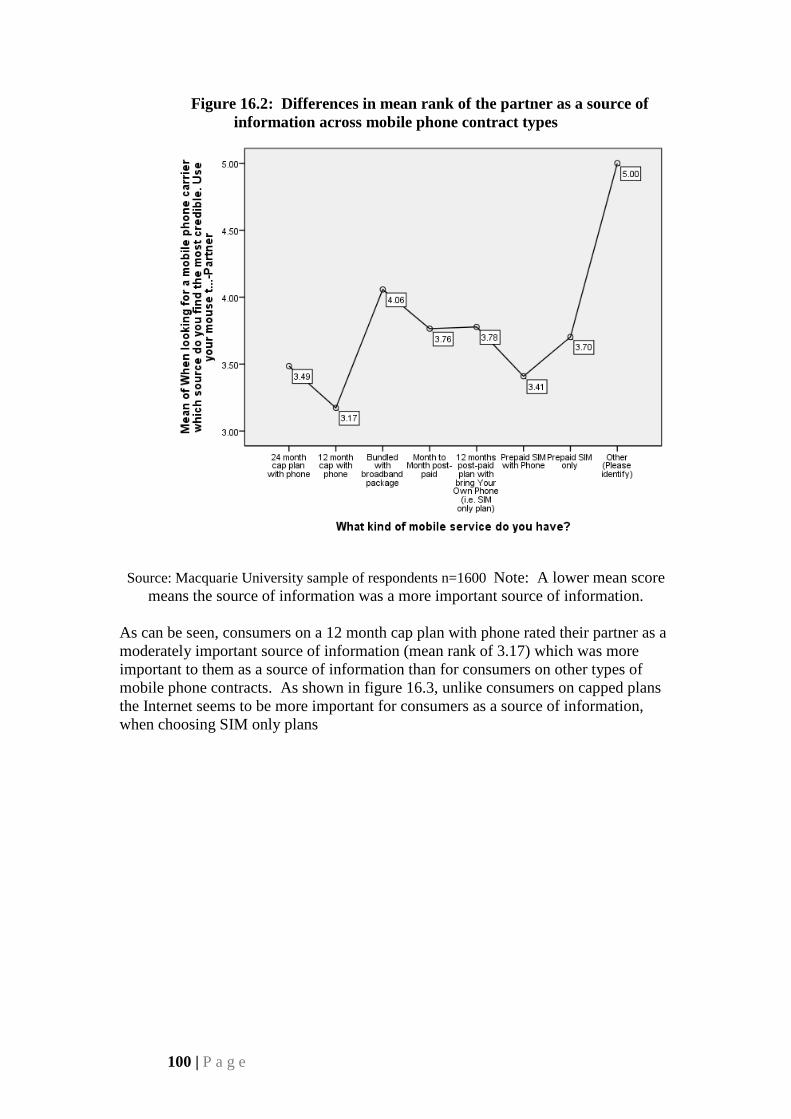
100 | P a g e
Figure 16.2: Differences in mean rank of the partner as a source of information across mobile phone contract types
Source: Macquarie University sample of respondents n=1600 Note: A lower mean score means the source of information was a more important source of information.
As can be seen, consumers on a 12 month cap plan with phone rated their partner as a moderately important source of information (mean rank of 3.17) which was more important to them as a source of information than for consumers on other types of mobile phone contracts. As shown in figure 16.3, unlike consumers on capped plans the Internet seems to be more important for consumers as a source of information, when choosing SIM only plans
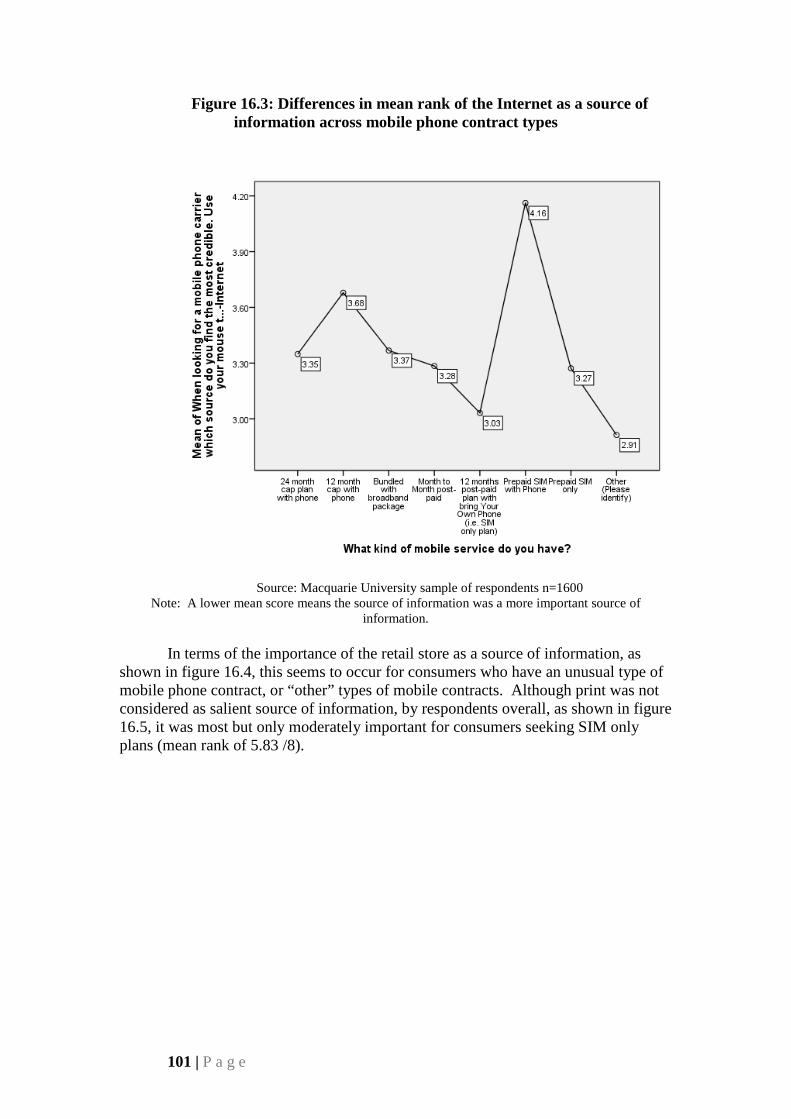
101 | P a g e
Figure 16.3: Differences in mean rank of the Internet as a source of information across mobile phone contract types
Source: Macquarie University sample of respondents n=1600
Note: A lower mean score means the source of information was a more important source of information.
In terms of the importance of the retail store as a source of information, as
shown in figure 16.4, this seems to occur for consumers who have an unusual type of mobile phone contract, or “other” types of mobile contracts. Although print was not considered as salient source of information, by respondents overall, as shown in figure 16.5, it was most but only moderately important for consumers seeking SIM only plans (mean rank of 5.83 /8).
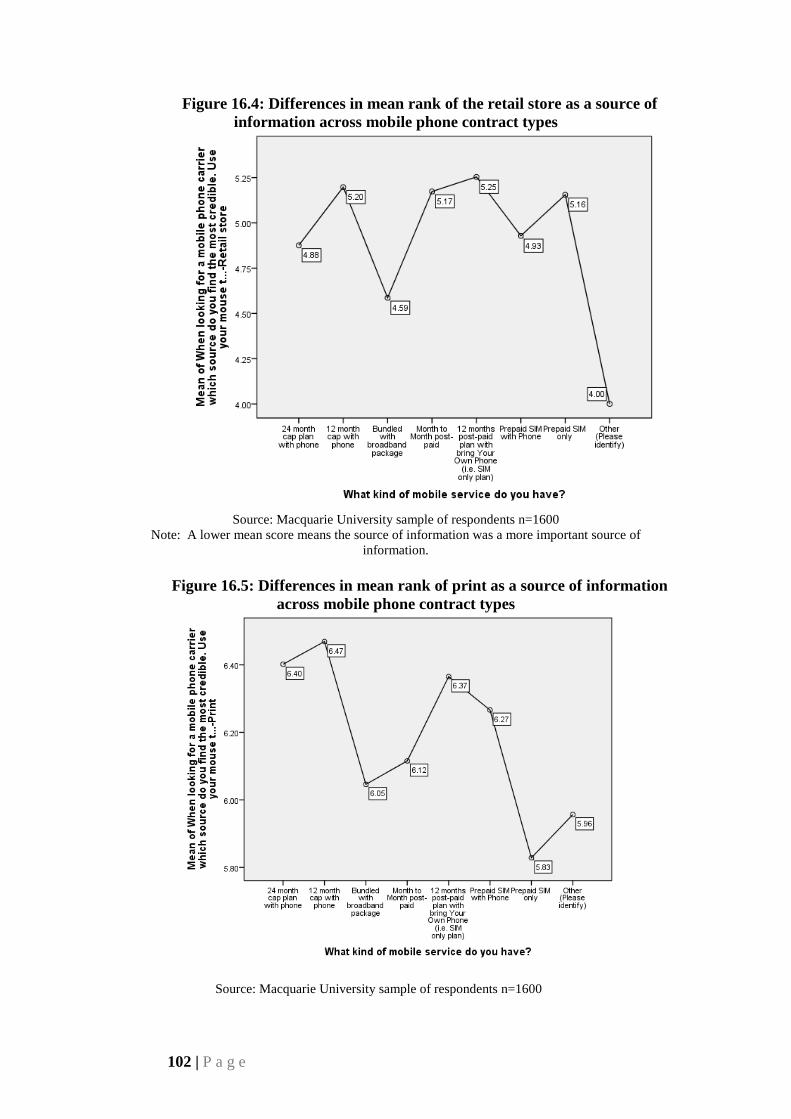
102 | P a g e
Figure 16.4: Differences in mean rank of the retail store as a source of information across mobile phone contract types
Source: Macquarie University sample of respondents n=1600 Note: A lower mean score means the source of information was a more important source of
information.
Figure 16.5: Differences in mean rank of print as a source of information across mobile phone contract types
Source: Macquarie University sample of respondents n=1600
103 | P a g e
Distribution channels 17 Distribution channels
17.1 Consumers purchasing preferences The focus on distribution channels is important because it shows consumer
preferences of where they like to buy. Observations from the survey data show that the telecoms store occupies the dominant preference for buying a mobile phone and plan (Figure 17.1).
“It (switching) takes time as I want to go to several stores to do my research.” Non switcher
“I was looking for better value so (I) shopped around to compare deals.” Married with children <5
An analysis of the results provides the following:
• Nearly half (i.e. 48.8%) prefer to buy their phone and plan from their local telecommunications carrier store;
• 15% prefer to buy their mobile phone and plan over the phone; • 14.75% prefer to buy their mobile phone and plan online; • 10% prefer to buy their phone and plan through a reseller
The major distribution channel preferences with respect to the purchase of SIM cards are telecoms stores, online and supermarkets (Figure 17.2). An analysis of the results provides the following:
• 33% prefer to buy their SIM card from their local telecommunications carrier store;
• 21.5% prefer to buy their SIM card online; • 19.9% prefer to buy their SIM card from a supermarket. “I will consider visiting retail outlets in the first instance and then buy on-line.” Married with children <5
104 | P a g e
17.2 Consumer search preferences by source credibility When consumers are searching for a mobile phone and service provider they
make a judgement as to where the most credible source of information regarding their purchase intentions comes from. Observations (Figure 17.3) from the survey data show that family is the number one source of credible information when looking for a mobile phone and plan. Family is closely followed by the internet as the second most important source of credibility. An analysis of the results provides the following:
• 33% prefer family; • 32.8% prefer the internet; • 14.1% prefer their partner; • 8.6% prefer friends; • 7.0% prefer the retail store.
So consumers rely on their family and the internet for advice, then go to the telecoms stores to purchase.
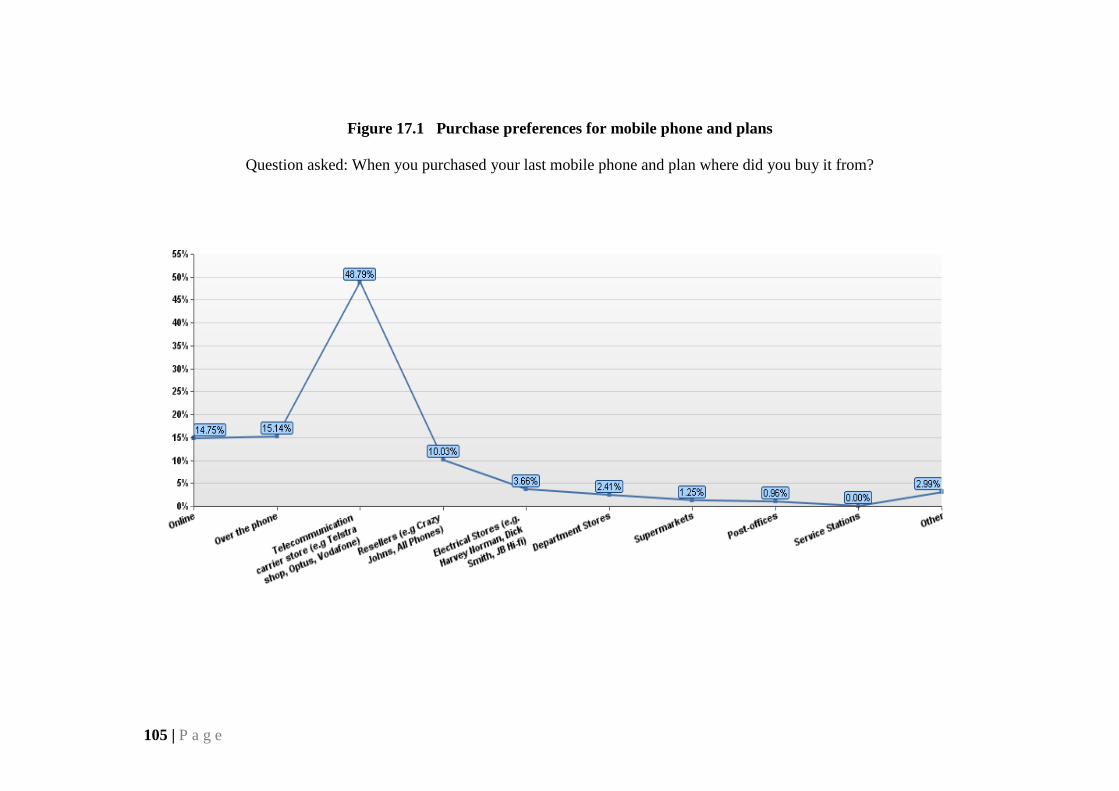
105 | P a g e
Figure 17.1 Purchase preferences for mobile phone and plans
Question asked: When you purchased your last mobile phone and plan where did you buy it from?
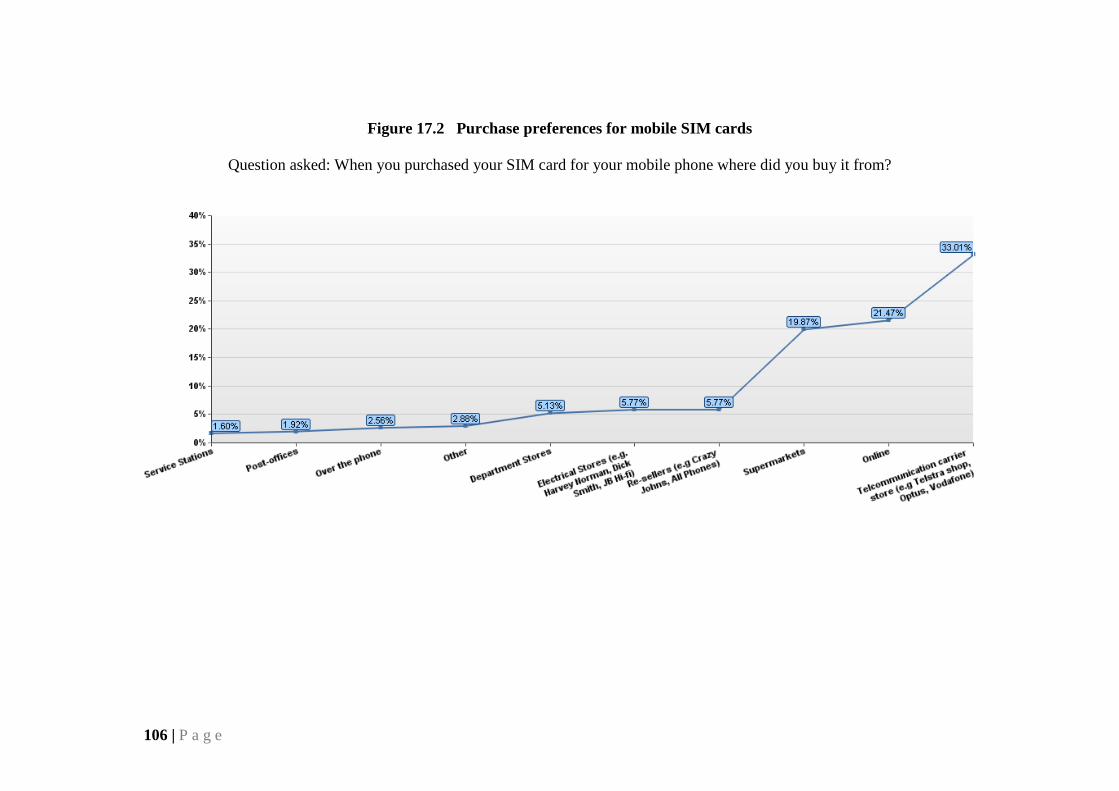
106 | P a g e
Figure 17.2 Purchase preferences for mobile SIM cards
Question asked: When you purchased your SIM card for your mobile phone where did you buy it from?
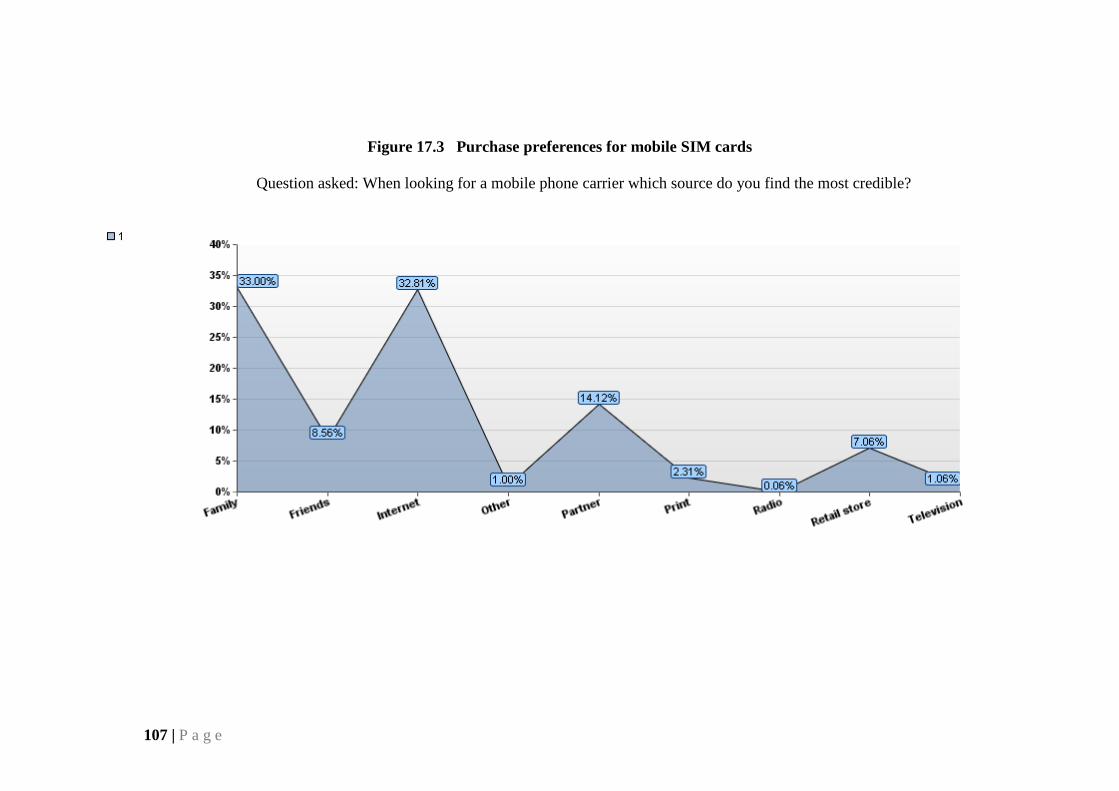
107 | P a g e
Figure 17.3 Purchase preferences for mobile SIM cards
Question asked: When looking for a mobile phone carrier which source do you find the most credible?
108 | P a g e
References Anderson E.W. 1994. Cross-category variation in customer satisfaction and retention.
Marketing Letters 5(1),19–30. Anderson, E. W., C. Fornell and D.R. Lehman. (1994). Customer satisfaction, market
share, and profitability: Findings from Sweden. Journal of Marketing 58: 53-66.
Anderson, R.E., and Swaminathan. S. 2011. Customer satisfaction and loyalty in e-markets: A PLS path modelling approach. Journal of Marketing Theory and Practice, 19(2), 221–234.
Anderson, W.T. (1994), "Deciphering dyads: concepts, methods, and controversies in relational research", Psychology and Marketing, Vol. 11 No.5, pp.447-66.
Australian Bureau of Statistics (ABS) (2010) “Household Expenditure, Australia - Detailed expenditure items, 2009-10 ABS No 6530.0, Canberra.
Australian Communications Media Authority (ACMA) (2008) Mobile number portability FAQs accessed http:// acma. gov. au /WEB /STANDARD /pc=PC_1787
Australian Communications Media Authority (ACMA) (2011) “Reconnecting the customer draft public inquiry report”, Melbourne (June 2011)
Aydin, S., Ozer, G. 2005. The analysis of antecedents of customer loyalty in the
Turkish mobile telecommunication market. European Journal of Marketing, 39 (7/8), 910-925.
Baron, R. M., & Kenny, D. A. (1986). The moderator-mediator variable distinction in social psychological research: Conceptual, strategic, and statistical considerations. Journal of Personality and Social Psychology, 51, 1173-1182.
Baumann, C., Burton, S. & Elliott, G. 2007. Predicting consumer behaviour in retail banking. Journal of Business and Management, 13(1), 79-96.
Beatty, S.E., Smith, S.M. 1987. External search effort: An investigation across several product categories. Journal of Consumer Research, 14(1), 83–95.
Bell, S., Auh, S. & Smalley, K. 2005. Customer relationship dynamics: Service quality and customer loyalty in the context of varying levels of customer expertise and switching costs. Journal of the Academy of Marketing Science 33(2), 169-183.
Bendapudi N., Berry L., 1997. Customers’ motivations for maintaining relationships with service providers. Journal of Retailing 73(Spring):15–37.
Bloemer, J., de Ruyter, K. & Peeters, P. 1998. Investigating drivers of bank loyalty: the complex relationship between image, service quality and satisfaction. International Journal of Bank Marketing 16(7), 276-286.
Burnham, Thomas A,. Judy K, Frels, and Vijay Mahajan, 2003. Consumer switching costs: A typology, antecedents, and consequences. Journal of the Academy of Marketing Science 31(Spring), 109-26.
Busacca, B. and Padula, G. 2005. Understanding the relationship between attribute performance and overall satisfaction. Marketing Intelligence & Planning 23(6): 543-61.
Calder, B.J. 1977, "Focus group and the nature of qualitative marketing research", Journal of Marketing Research, Vol. 14 No.3, pp.353-64.
109 | P a g e
Campbell, A. J. 1997. What affects expectations of mutuality in business
relationships? Journal of Marketing Theory and Practice 5(4), 1–11. Churchill, G.A. Jr, and Iacobucci, D. 2002, Marketing Research – Methodological
Foundations, Harcourt, Fort Worth, TX Colgate, M. & Hedge, R. 2001. An investigation into the switching process in retail
banking services. International Journal of Bank Marketing 19(5), 201-212. Colgate, M. & Lang, B. 2001. Switching barriers in consumer markets: an
investigation of the financial services industry. Journal of Consumer Marketing 18(4), 332-47.
Dagger, T.S. and Sweeney, J.C. 2007. Service quality attribute weights: How do novice and longer-term customers construct service quality perceptions? Journal of Service Research 10(1), 22-42.
Dick, A. S. and K. Basu, 1994. Customer Loyalty: Toward an Integrated Conceptual Framework. Journal of the Academy of Marketing Science 22(2), 99-113.
Dierkes, T., Bichler, M., & Krishnan, R. (2011). Estimating the effect of word of mouth on churn and cross-buying in the mobile phone market with Markov logic networks. Decision Support Systems, 51(3), 361-371.
Ennew, C. and Binks, M. 1996. The impact of service quality and service characteristics on customer retention: Small businesses and their banks in the UK. British Journal of Management 7(3), 219-230.
Euromonitor International (2011) “Mobile Phone Statistics” accessed at http://www.portal.euromonitor.com/Portal/Pages/Statistics/Statistics.aspx
European Commission 2010. Consumer Markets Scoreboard – Making markets work for consumers, 4th Edition –October 2010 Director General for Health & Consumers, Luxembourg: Office for Official Publications of the European Union, ISBN 978-92-79-14249-9 Accessed at http: //ec.europa. eu/ consumers /strategy /facts _en.htm.
European Commission (2011 and 2010) “Monitoring consumer markets in the European Union”, Director General for Health & Consumers, Luxembourg: Office for Official Publications of the European Union, Accessed at http: //ec.europa. eu/ consumers /strategy /facts _en.htm.
European Commission (2009) “Flash Eurobarometer - Consumers’ views on switching service providers: Analytical Report” Director General for Health & Consumer Protection, Luxembourg: Office for Official Publications of the European Union.
European Commission (2010) “Consumer Markets Scoreboard – Making Markets Work for Consumers”, 4th Edition” –October 2010 Director General for Health & Consumers, Luxembourg: Office for Official Publications of the European Union, ISBN 978-92-79-14249-9
European Commission (2009) “Flash Eurobarometer - Consumers’ views on switching service providers: Analytical Report” Director General for Health & Consumer Protection, Luxembourg: Office for Official Publications of the European Union.
European Union (2009) “Consumers’ views on switching service providers: Analytical Report”, Accessed at http://ec.europa.eu/ consumers/ strategy/ facts_ eurobar_en.htm
110 | P a g e
European Union (2010) “The Consumer Markets Scoreboard: Making Markets Work For Consumers, 4th edition”. Accessed at http://ec.europa.eu/consumers/ strategy/facts_en.htm
Ewing, M., Salzberger, Thomas, Sinkovics, Rudolf 2005. An Alternative Approach to Assessing Cross-Cultural Measurement Equivalence in Advertising Research. Journal of Advertising 34(1), 17-36.
Fornell C. 1992. A national customer satisfaction barometer: the Swedish experience. Journal of Marketing 56 (January), 6–21.
Fox, J., and Bartholomae, S. 2010. Financial education and program evaluation , in Ed Jing Jian Xiao, Handbook of Consumer Finance Research, pp. 47-68. Springer Science plus Business Media.
Ganesh, J., Arnold, M.J. and Reynolds, K.E. 2000, Understanding the customer base of service provider: an examination of the differences between switchers and stayers. Journal of Marketing 64(3), 65-87.
Garee, M.L. and Schori, T.R. (1996), “Focus groups illuminate quantitative research”, Marketing News, 30 (20), p. 41.
Gronroos, C. 1988. Service quality: the six criteria of good perceived service quality. Review of Business 9(3), 10-13
Granovetter, Mark 1973. The strength of weak ties. American Journal of Sociology 78(6), 1360-80.
Grewal, D., Monroe, K. B., & Krishnan, R. 1998. The effects of price-comparison advertising on buyers’ perceptions of acquisition value, transaction value, and behavioral intentions. Journal of Marketing, 62(April), 46–59.
Guiltinan, J.P.1989. A classification of switching costs with implications for relationship marketing, in Childers, T.L., Bagozzi, R.P., Peter, J.P. Ed. AMA Winter Educators’ Conference: Marketing Theory and Practice, American Marketing Association, Chicago, IL, pp. 216-20.
Gronroos, C. 1990. Service Management and Marketing: Managing the Moments of Truth in Service Competition, Free Press/Lexington Books, New York, NY.
Gulati, Ranjay 1998. Alliances and Networks. Strategic Management Journal 19(April) , 293-317.
Hallowell, R. 1996. The relationships of customer satisfaction, customer loyalty, and profitability: an empirical study. International Journal of Service Industry Management 7(4), 27-42.
Han, H., Kim, Y., Kim, E-K 2011. Cognitive, affective, conative, and action loyalty: Testing the impact of inertia." International Journal of Hospitality Management 30(4): 1008-1019.
Hart, C.W.L., Heskett, J.L. and Sasser, E.W. Jr 1990 , The profitable art of service recovery. Harvard Business Review 68(4), 148-56.
Hirschman, A. 1970. Exit, Voice and Loyalty, Harvard University Press: Cambridge, MA.
Harvir, S. Bansal and Shirley F. Taylor 1999. The Service provider switching model SPSM: A model of consumer switching behavior in the services industry. Journal of Service Research, 2(2, 200-218.
Herington, C., Scott, D and Johnson, L. (2005). “Focus group exploration of firm-employee relationship strength”, Qualitative Market Research: An International Journal, 8 (3): 256-276.
111 | P a g e
Hogarth. J. M. 2002. Financial literacy and family and consumer sciences. Journal of Family and Consumer Sciences 94, 15-28.
Holbrook, M. B. 1994. The nature of customer value: an axiology of services in the consumption experience. In R. T. Rust, & R. L. Oliver (Eds.), Service quality: new directions in theory and practice (pp. 21–71). Sage: Thousand Oaks.
Iyengar, R., Jedidi, Kamel and Kohli, Rajeev. 2008. A conjoint approach to multipart pricing. Journal of Marketing Research, 45(2), 195-210.
Jain, A. K., Pinson, C. and Malhotra, N. K. 1987. Customer loyalty as a construct in the marketing of banking services. International Journal of Bank Marketing, 5(3), 49-73.
Jones, Michael A., David L. Mothersbaugh, and Sharon E. Beatty. 2000. Switching barriers and repurchase intentions in services. Journal of Retailing 76(Summer), 259-74,
Jones, Michael A., David L. Mothersbaugh, and Beatty S.,E. 2002. Why customers stay: Measuring the underlying dimensions of services switching costs and managing their differential strategic outcomes. Journal of Business Research 55(June), 441-50.
Jones M.A, Reynolds K.E, Mothersbaugh D.L, and Beatty S.E. 2007. The positive and negative effects of switching costs on relational outcomes. Journal of Service Research 9(4), 335–55.
Keaveney, S. M. 1995. Customer switching behaviour in service industries: an exploratory study. Journal of Marketing 59(2), 71-82.
Krueger, R.A. (1994), Focus Groups: A Practical Guide for Applied Research, Sage, Thousand Oaks, CA.
Krueger, R.A. and Casey, M.A. (2000), Focus Groups: A Practical Guide for Applied Research, Sage, Thousand Oaks, CA.
Lariviere, B. and Van den Poel, D. 2007. Banking behaviour after the lifecycle event of ‘moving in together’: An exploratory study of the role of marketing investments. European Journal of Operational Research 183(1), 345-369.
Lawrence, J. and Berger, P. (1999), “Let’s hold a focus group”, Direct Marketing, 61( 12): 40-3.
Lees, G., Garland, R. and Wright, M. 2007. Switching banks: Old bank gone but not forgotten. Journal of Financial Services Marketing 12(2), 146-156.
Levesque, T. J. and McDougall, G. 1996, Determinants of customer satisfaction in retail banking. International Journal of Bank Marketing, 14(7), 12-20.
Levesque, T.J. and McDougall, G.H.G. 1993. Managing customer satisfaction: the nature of service problems and customer exit, voice and loyalty. Asia Pacific Journal of Quality Management 2(2), 40-58.
Levitt, T. 1965. Exploit the product life cycle. Harvard Business Review, Nov-Dec, 81-94.
Matthews, C. and Murray, D. 2007. Helping bank customers switch: A case study. Journal of Financial Services Marketing. 11(4), 360-369.
McDonald, W.J. (1993), “Focus group research dynamics and reporting: an examination of research objectives and moderator influences”, Journal of the Academy of Marketing Science, 21 (2): 161-8.
Miles, M.M. and Hubermann, A.M. (1994), Qualitative Data Analysis: An Expanded Sourcebook, Sage, Newbury Park, CA.
112 | P a g e
Mittal, V. and W. A. Kamakura. 2001. Satisfaction, repurchase intent, and repurchase behavior: Investigating the moderating effect of customer characteristics. Journal of Marketing Research 38(1): 131-142.
Menon, K. and Aidan O'Connor, A. 2007. Building customers' affective commitment towards retail banks: The role of CRM in each 'moment of truth. Journal of Financial Services Marketing 12(2), 157–168.
Monroe, K. 1990. Pricing: making profitable decisions. New York: McGraw Hill. Morgan, D.L. and Krueger, R.A. (Eds) (1993), When to Use Focus Groups and
Why, Sage, London.
Nowlis, S., Kahn, Barbara, Dhar, Ravi. 2002. Coping with Ambivalence: The Effect of Removing a Neutral Option on Consumer Attitude and Preference Judgments. Journal of Consumer Research 29(3), 319-334.
Oliver, Richard, L. 1993. Cognitive, affective, and attribute bases of the Satisfaction. Journal of Consumer Research 20(3), 451-466.
Oliver, Richard, L. 1996. Satisfaction: A Behavioral Perspective on the Consumer. New York: McGraw Hill.
Oliver, Richard, L.1999. Whence consumer loyalty? Journal of Marketing 63(4), 33-44.
Oliver, Richard, L., Rust, R. and Varki, S. 1997. Customer delight: Foundations, findings and managerial insight. Journal of Retailing 73(3), 311-36.
Oliver, Richard L. and Swan, J.E. 1989. Consumer perceptions of interpersonal equity and satisfaction in transactions: A field survey approach. Journal of Marketing 53(April), 21-35.
Orton, L. 2007. Financial Literacy: Lessons from International Experience. Toronto, Canadian Policy Research Networks Inc. CPRN
Parasuraman, A.,& Grewal, D. 2000. Serving customers and consumers effectively in the twenty first century: a conceptual framework and overview. Journal of the Academy of Marketing Science, 28(Winter), 9–16.
Patterson, P. G. and T. Smith. 2003. A cross-cultural study of switching barriers and propensity to stay with service providers. Journal of Retailing. 79(2), 107-120.
Porter, Michael E. 1980. Competitive Strategy: Technologies for Analyzing Industries and Competitors. New York: Free Press.
Rao, S. and Perry, C. (2003), "Convergent interviewing to build a theory in under-researched areas: principles and an example investigation of internet usage in inter-firm relationships", Qualitative Market Research, 6 (4):.236-47.
Rindfleisch, A., Moorman, C. 2001. The Acquisition and utilization of information in new product alliances: A Strength-of-Ties Perspective. Journal of Marketing 65(April), 1-18.
Roos, I., and Gustafsson, A. 2007. Understanding frequent switching patterns. Journal of Service Research 10(1), 93-108,
Ruiz, D.M., Gremler, D.D., Washburn, J.H., and Carrion, G.C. 2010. Reframing Customer Value in a Service-Based Paradigm: An Evaluation of a Formative Measure in a Multi-industry, Cross-cultural Context, in V. Esposito Vinzi et al. (eds.), Handbook of Partial Least Squares, Springer Handbooks of Computational Statistics, Springer-Verlag Berlin Heidelberg.
Sengupta, S., Krapfel, R.E. and Pusateri, M.A. 1997. Switching costs in key account relationships. Journal of Personal Selling and Sales Management 17(4), 9-16.
Schlinger, M. J. 1979, A Profile of Responses to Commercials," Journal of Advertising Research. 19(2), 37-46.
113 | P a g e
Stewart, D.W. and Shamdasani, P.N. (1990), Focus Groups: Theory and Practice, Sage, Thousand Oaks, CA, .
Stewart, K. 1998. Exploration of customer exit in retail banking. International Journal of Bank Marketing 16(1), 6-14.
Suri, R., Monroe, K.B. 2003. The Effects of Time Constraints on Consumers’ Judgments of Prices and Products. Journal of Consumer Research 30(1), 92-104.
Sweeney, J. C., & Soutar, G. N. 2001. Consumer perceived value: the development of a multiple item scale. Journal of Retailing, 77(Summer), 203–220.
Telecommunications Industry Ombudsman (2011) “Mobile phone issues drive record number of consumer complaints to the TIO”, accessed at http://www.tio.com.au/publications/media/mobile-phone-issues-drive-record-number-of-consumer-complaints-to-the-tio
Turnbull, P., Leek, Sheena and Ying, Grace. (2000). Customer confusion: The mobile phone market. Journal of Marketing Management, 16(1-3), 143-163.
van Harreveld, F., van der Pligt, J., de Liver, Y.N. 2009. The Agony of Ambivalence and Ways to Resolve It: Introducing the MAID Model Personality and Social Psychology Review February 2009 13(1), 45-61.
Wang, Alex and Selcuk Adam Acar (2006), "Information search and mobile promotions," International Journal of Mobile Marketing, 1 (2), 80-87.
Wagner, J. (2011). Anytime/Anywhere--Playing Catch Up with the Mind of the Smartphone Consumer. International Journal of Mobile Marketing, 6(1), 28-5
White, L. and Yanamandram, V. 2004. Why Customers stay: reasons and consequences of inertia in financial services. Managing Service Quality 14( No.2/3), 183-194.
Woisetschläger, D.M., Lentz, P., and Evanschitzky, H. 2011. How habits, social ties, and economic switching barriers affect customer loyalty in contractual service settings. Journal of Business Research 64(8), 800-808. Worthington, A.C.2006. Predicting financial literacy in Australia. Financial Services Review 15(1), 59-79.
Wolcott, H.E. (1994), Transforming Qualitative Data: Description, Analysis and Interpretations, Sage, Thousand Oaks, CA.
Zeithaml, V. A. 1988. Consumer perceptions of price, quality, and value: a means-end model and synthesis of evidence. Journal of Marketing, 52(July), 2–22.
Zeithaml, V.A., Berry, L.L., and Parasuraman, A. 1996. The behavioral consequences of service quality. Journal of Marketing 60(2), 31-46.
Zikmund, W.G. (1997), Business Research Methods, Dryden, Fort Worth, TX.
Zikmund, W.G., Ward, S., Lowe, B., , Winzar, H. (2011) Marketing Research, 2nd Asia Pacific Edition.

114 | P a g e
Macquarie University Research Staff
Dr David Gray – Chief Investigator
Formal Name: Dr David Gray
Position: Senior Lecturer
Organisational Unit: Department of Marketing & Management
Contact Details: Email: [email protected]
Qualifications: PhD (UNSW), M.Commerce Hons (UNSW), B. Commerce Hons (UNSW), Cert Workplace Training & Assessment
Professional Memberships: CPA, Australian Marketing Institute
Areas of Expertise • Relationship marketing • Strategic Alliances • Business-to-Business Marketing • Marketing Strategy • Corporate Strategy • Internal Marketing • Interpersonal skills (emotional intelligence, influence strategies) • Energy Efficiency Marketing and Social Marketing • University Student Engagement and Satisfaction
Profile Dr Gray is a Senior Lecturer in Marketing in the Department Marketing
and Management at Macquarie University. He has published in international journals and conferences. Prior to his academic career, David worked extensively in business in the marketing and management consulting industries. He was the General Manager Marketing at Touche Ross & Co and the National Marketing Manager at MGICA Ltd (a subsidiary of AMP), and held various marketing research roles in Citicorp Australia, BIS Shrapnel, CSR Ltd and KPMG (previously known as Peat Marwick Mitchell). David has conducted a range of studies into the telecommunications industry.
115 | P a g e
Dr Steven D’Alessandro - Investigator Position: Senior Lecturer,
Organisational Unit: Department of Marketing and Management
Qualifications: PhD (UWA), M.Commerce (Curtin),
B.Commerce, Hons. (UWA), Cert. Tertiary Teaching (Murdoch).
Contact Details: Email : [email protected]
Areas of Expertise • The effect of country of origin information on consumer judgments &
choice • Body Image • Use of Credit and Consumptive consumption • Self Service Technology • Marketing strategy and the environment • Diffusion of Innovations • Marketing of pharmaceuticals • Culture and Consumer Behaviour
Profile Steve is a Senior Lecturer in marketing at Macquarie University. He has published 58 refereed papers in leading international journals (including the European Journal of Marketing, International Marketing Review, Psychology and Marketing, Journal of Marketing Theory and Practice and Applied Economics) books, and conferences.
Steve has also worked as a market research consultant for blue-chip companies such as Pacific-Dunlop, ANZ, Challenge Bank, BHP, Telstra, and Ford. Dr. D’Alessandro, previously Dr. Ward is the lead-author of Zikmund, a co-author on Lowe, Winzar and Ward, (2007 & 2010) Essentials of SPSS: A Business Approach, and Schiffman, Bednall, O ’ Cass, Palidino, Ward and Kanuk, Consumer Behaviour 4th and 5th Edition (2007 & 2010) . These texts are used by around 20 universities in Australia and New Zealand by an estimated 8000 students a year.

116 | P a g e
Dr Leanne Carter - Investigator Position: Senior Lecturer,
Organisational Unit: Department of Marketing and Management
Qualifications: PhD (Macquarie), B.Commerce, Hons. (UWS), Diploma in Teaching (STC).
Contact Details: Email [email protected]
Areas of Expertise • Internal Marketing in public sector and for-profit and not-for-profit
organisations • Social marketing • Peer Assessment in higher education. • Simulations in higher education. • Internships and Community Engagement
Profile
Leanne M. Carter is a Senior Lecturer of Marketing at Macquarie University, Sydney, Australia. She has 15 years experience in industry before entering the world of academia where she teaches in the Australasian region. She has worked for organisations such as McDonald's, Woolworths Ltd., Australian Direct Marketing Association and Yellow Pages in both line management and senior management roles. These roles involved the development and implementation of strategies for new systems, technologies, marketing and human resources. She commenced her university teaching career at the University of Western Sydney in 1998 before joining Macquarie University in 2001. Leanne Carter has a PhD in Marketing. Leanne’s research interests include internal market orientation, social marketing and community engagement. She has published in both local and internal journals.
Leanne Carter has a Commerce Degree in Marketing with First Class honours obtained from the University of Western Sydney under the supervision of Professor Ian Wilkinson. The research investigated the sponsors of the Sydney 2000 Olympic Games. She also has a Diploma in Teaching from Sydney Teachers College, awarded with Distinction. Leanne has recently completed her PhD in Marketing which investigated interpersonal relational competence, internal market orientation and employee performance. Her supervisors were Dr David Gray and Associate Professor Peter Murray.


