Embed Size (px)
Citation preview
Nutrition & Food ScienceSweet and sour: music and taste associationsMaija Kontukoski Harri Luomala Bruno Mesz Mariano Sigman Marcos Trevisan Minna Rotola-Pukkila Anu Inkeri Hopia
Article information:To cite this document:Maija Kontukoski Harri Luomala Bruno Mesz Mariano Sigman Marcos Trevisan Minna Rotola-Pukkila Anu Inkeri Hopia ,(2015),"Sweet and sour: music and taste associations", Nutrition & Food Science , Vol. 45 Iss 3 pp. -Permanent link to this document:http://dx.doi.org/10.1108/NFS-01-2015-0005
Downloaded on: 27 March 2015, At: 03:21 (PT)References: this document contains references to 0 other documents.To copy this document: [email protected] fulltext of this document has been downloaded 3 times since 2015*
Access to this document was granted through an Emerald subscription provided by 226901 []
For AuthorsIf you would like to write for this, or any other Emerald publication, then please use our Emerald for Authors serviceinformation about how to choose which publication to write for and submission guidelines are available for all. Pleasevisit www.emeraldinsight.com/authors for more information.
About Emerald www.emeraldinsight.comEmerald is a global publisher linking research and practice to the benefit of society. The company manages a portfolio ofmore than 290 journals and over 2,350 books and book series volumes, as well as providing an extensive range of onlineproducts and additional customer resources and services.
Emerald is both COUNTER 4 and TRANSFER compliant. The organization is a partner of the Committee on PublicationEthics (COPE) and also works with Portico and the LOCKSS initiative for digital archive preservation.
*Related content and download information correct at time of download.
Dow
nloa
ded
by T
UR
KU
UN
IVE
RSI
TY
At 0
3:21
27
Mar
ch 2
015
(PT
)
1
Sweet and sour: music and taste associations
Introduction
Our enjoyment of food is multisensory in nature. All five senses have their specific role: the visual
appearance and the odor of the dish create expectations about its taste and, during eating, a
combination of taste, smell, touch, and hearing stimuli integrate into an overall multisensory
perception of food. Senses do not operate in isolation, but synergize with one another. Interaction
between odor and taste (King et al., 2006), sight and taste (Koch and Koch, 2003; Spence et al.,
2010) and many other interactions among different senses are thoroughly reviewed for example by
Ernst and Bülthoff (2004). Since the 1960s, the interaction between auditory and taste perception
has attracted academic attention (Holt-Hansen, 1968). This has driven a diverse field of related
research (e.g., Beeli et al., 2005; Hänggi et al., 2008; Crisinal and Spence, 2009; 2010a; 2010b;
Simner et al., 2010; Mesz et al., 2011).
There is a relationship between auditory cues and the perception of taste and the flavor of foods
(Knöferle and Spence 2012). When people discuss about food or music, they often have a tendency
to use the same adjectives to describe them. Adjectives, such as sweet, dry, light, soft, crisp are used
to describe the qualities of both food and music. People make cross-modal associations between the
tastes and sounds (e.g., Crisinel and Spence, 2009; 2010a; 2010b; Simner et al., 2010; Mesz et al.,
2011; Bronner, 2012). For example, in the study of Crisinel and Spence (2010a), participants
associated sweet and sour taste solutions’ tastes to high-pitched sounds, bitter taste to the low-
pitched sounds, and salty tastes to medium-pitched sounds.
Taste words can elicit consistent musical patterns (Mesz et al. 2011). Musicians were asked to
improvise about the theme of basic taste words (e.g., “sweet,” “salty,” “bitter,” and “sour”). The
results showed that, for example, the taste word “sweet” elicited musical patterns that were
consonant, slow and soft, while “sour” elicited musical patterns that were high-pitched and
dissonant. “Bitter” improvisations were low-pitched and legato. However, as Knöferle and Spence
(2012) point out, the informative value of the findings might be limited because of the use of taste
words rather than actual taste solutions. In turn, Crisinel et al., (2012) were first to demonstrate that
Dow
nloa
ded
by T
UR
KU
UN
IVE
RSI
TY
At 0
3:21
27
Mar
ch 2
015
(PT
)
2
a “bitter” background soundtrack caused food samples (such as bittersweet toffee) to be rated as
more bitter than during a “sweet” background soundtrack.
Here, we investigated whether the “sweet” and “sour” musical patterns of four different musical
pieces have an effect on participants’ taste associations. This study builds on Mesz et al’s (2011)
findings on consistent taste–musical patterns. In addition to verbal and descriptive associations, this
experiment is extended to study how music, which contains sweet or sour musical patterns, may
influence how we prepare and cook food. This was done by measuring, quantitatively, sugar and
acid contents of drinks, which were prepared based on musical associations.
Methods and materials
Selection of tastes and food items: a pre-test
A pre-test was conducted to identify food items for the field study that represents primarily one of
the taste dimensions (i.e., sweet, sour, bitter, or salty) for typical consumers in South Ostrobothnia,
Finland. Eight participants, recruited from a local food club, were asked to taste and mark 28 foods
into a map having four boxes each representing one of the four tastes: sweet, sour, bitter, and salty.
The participants tended to mix, especially the tastes sour and bitter, in test foods. This confusion
between bitter versus sour is rather common and exists in other studies, as well (e.g. Laaksonen et
al., 2013). For example, for the tastes of raspberry, bilberry, orange, grapefruit, red currant, and
tomato, half of the participants mapped them primarily as sour and the other half as bitter. Thus
sweet and sour tastes, being easy to identify and distinguish, were chosen for the actual experiment.
The pre-test results were used when selecting foods for the actual experiment. The aim was to select
the same amount of sweet and sour ingredients with similar color (yellow) and structure (clear).
Selected ingredients for the experiment were: mango juice (100% of pre-test participants classified
this juice as sweet), orange juice (50% of pre-test participants, sour; 38%, bitter; and 13%, sweet),
grapefruit juice (50%, sour, 50% bitter), lemon juice (100%, sour), pineapple juice (100%, sweet)
and liquid honey (100%, sweet).
Selection of “sweet” and “sour” musical pieces: a pre-test
A pre-test was conducted to identify the musical pieces that most strongly associated with sweet or
sour. Eleven students, from Sibelius Academy’s Doctoral Programme for Music and Performance
Arts, listened to 16 musical pieces (each lasting 30 seconds), which were selected based on Mesz et
Dow
nloa
ded
by T
UR
KU
UN
IVE
RSI
TY
At 0
3:21
27
Mar
ch 2
015
(PT
)
3
al.’s (2011) research. These represented either “sweet” (musical elements of long duration, low
dissonance, low articulation, and low loudness) or “sour” (musical elements of high pitch, long
duration and high dissonance) music. After hearing each of the musical samples, the pre-testers
were asked to make associations between music and taste. By using a 7-point Likert-scale, they
mapped the sweetness, sourness, saltiness, and bitterness of the musical pieces. As a result, the
following four musical pieces were chosen for the experiment:
1) Trois Gymnopédies, No.2 Lent et triste by Erik Satie, composed in 1888, piano music
(http://www.youtube.com/watch?v=1loSL7CjE_w);
2) Davidsbündlertänze, Op. 6 No. 18, Nicht schnell, C major, Eusebius by Robert Schumann
composed in 1837, piano music (http://www.youtube.com/watch?v=jIHsNlwD6jQ);
3) Superscriptio by Brian Ferneyhough, composed in 1981, flute music
(http://www.youtube.com/watch?v=dYnYimo8z2Q);
4) Musical sample by Bruno Mesz, produced in 2012, fragments of transformed Argentinian tangos
(http://youtu.be/lfxdpNMYmlo).
Satie’s and Schmann’s samples represented “sweet” and Ferneyhough’s and Mesz’s samples for
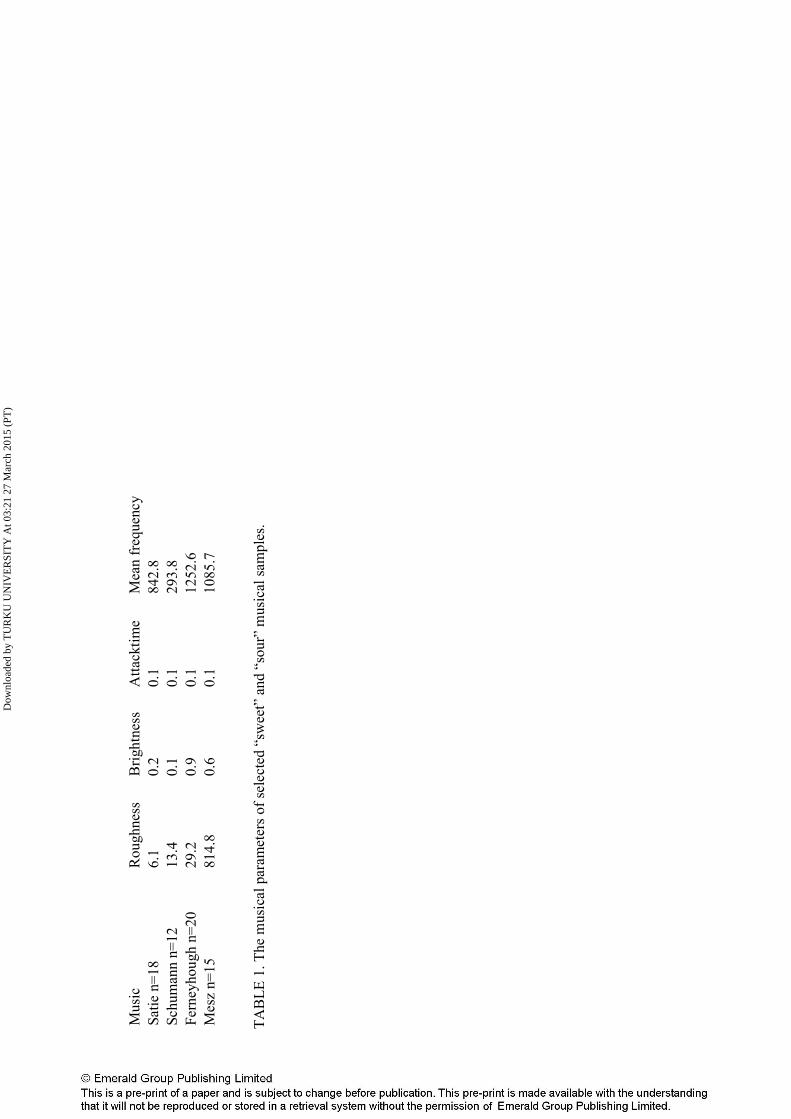
“sour” music. The following musical parameters of these samples were analyzed: 1) Roughness,
also called sensory dissonance, which quantified the beating frequencies; 2) Brightness was the
proportion of high-frequency spectral energy of the sound; 3) Attack time was the time to reach
maximum sound intensity of the note; and 4) Mean frequency in Hz. The results of this analysis can
be seen in Table 1. The profiles of “sweet” and “sour” samples had distinctively different roughness
and brightness, being higher in Ferneyhough’s and Mesz’s samples than in Schumann’s and Satie’s
musical pieces.
Mesz et al. (2011) describe taste words “sweet” and “sour” with a list of qualitative values for
musical parameters: “sweet” musical elements have long duration, low dissonance, low articulation,
and loudness (soft), and “sour” musical elements have high pitch, long duration, and high
dissonance. “Sweet” musical parameters are found from the Satie’s and Schumann’s samples.
“Sour” musical parameters are found from Ferneyhough’s and Mesz’s samples.
Satie’s and Schumann’s pieces were performed by a pianist, but Ferneyhough’s music was
performed by a piccoloist. Mesz’s piece was algorithmically generated using short fragments of
tangos, which were transformed in pitch in order to be in the high piccolo and clarinet register,
Dow
nloa
ded
by T
UR
KU
UN
IVE
RSI
TY
At 0
3:21
27
Mar
ch 2
015
(PT
)
4
speeded up in order to achieve a medium duration equal to that measured in the Mesz et al. (2012)
experiments for the sour taste, and contrapuntally disposed in order to have high chordal
dissonance.
TABLE 1.
Description of the field experiment: experimental design, data collection procedures, and preparing
the drink sample
Science fair visitors, aged 16 or older, were recruited to participate in the field experiment. Four
independent groups of consumers, without extensive musical or culinary training, were recruited for
the experiment that took place in connection with a public science fair in Western Finland,
September, 2012. The fair visitors were approached and asked whether they wanted to participate in
a study involving music and food. Those consenting were led in small groups to a pre-arranged
experimental room. The rooms contained a table with four to five seats that were secluded from
each other by light obstructions. Study participants sat down at a table, which had a questionnaire
(text-side down), a pencil, plastic mugs, spoons, wipers, and six, unlabeled containers containing
the ingredients for mixing the drink. No rewards were given to the study participants.
The experiment started by playing the pre-tested music to the study participants. Each of the four
groups listened to only one of the four, 30-second musical pieces: group A, listened to Satie; group
B, Schumann; group C, Ferneyhough; and group D, Mesz. For every group, the musical piece was
replayed throughout the total time (circa 20 minutes) of the experiment. The music loudness was
not played too loud or quietly, but at an ambient level.
The questionnaire had four sections. First, the gender and age were queried. Second, the food-
related associations triggered by the music was captured. Third, the study participants were asked to
indicate their taste associations congruent with the music on a 7-point scale, which included six pre-
selected food pairs in the following order: wheat-oat, chocolate-lingonberry, lemon-banana,
chicken-beef, meringue-sourdough crisp rye-bread, and red currant-pineapple. Fourth, the study
participants were requested to mix a drink congruent with the music by using ingredients available
on the table. They were asked to write down the ingredients they used for it. The details of these
measurements are disclosed below.
Dow
nloa
ded
by T
UR
KU
UN
IVE
RSI
TY
At 0
3:21
27
Mar
ch 2
015
(PT
)
5
Sixty-six participants agreed to take part in the study. These participants were divided into four
groups. Group A, Satie (n=18), consisted of nine female and nine male participants, and the mean
age was 33 years. The demographics, in order, for group B; Schumann (n=12); C, Ferneyhough
(n=20); and D, Mesz (n=15) were the following: five females and seven males with a mean age of
49; 14 females and five males, mean age 23; 11 females and four males, mean age 42, respectively.
There was no difference in gender distribution among the groups, however age was unevenly
distributed and there was a significant difference between the groups: Satie and Schumann
(p=0.008), Schumann and Ferneyhough (p<0.001), and Ferneyhough and Mesz (p<0.001).
Measurement and analysis of dependent variables
Food-related associations. Study respondents were asked to listen to music and think about what
kind of food-related ideas and associations it brings to their minds. An empty box was provided for
submitting their answers, anonymously. The Latent Semantic Analysis, with word groups referring
to either food names or to the composition, texture, temperature, and quality of food (Deerwester et
al., 1990; Diuk et al., 2012) was conducted. The reference document corpus was the TASA corpus,
with 300 dimensions. The word-by-word semantic similarity of each of the word group with
“sweet” and “sour” was computed. This gave two series of similarity values (one series for “sweet”
and another for “sour”). Values vary between -1 (semantically dissimilar to “sweet” or “sour”) and
1 (semantically similar to “sweet” or “sour”). The customary one-way ANOVA and post hoc
Tukey´s t-tests were conducted to detect differences between the two similarity values in different
groups.
Taste associations. Associations were determined by four, food word-pairs: 1) Banana–lemon, 2)
Chocolate–lingonberry, 3) Meringue–crisp rye-bread, and 4) Pineapple–redcurrant. On the basis of
the pre-test for tasting, banana, chocolate, meringue, and pineapple represented sweetness, and
lemon, lingonberry, crisp rye-bread, and redcurrant represented sourness. Two filler/control food
word pairs were also included: 1) wheat–oats and 2) chicken meat–beef meat. These items are
generally considered to neutral. The food word pairs were shown to the study respondents and they
were asked to indicate, on a 7-point scale, which one of the food-word-pairs describes precisely the
taste of the music they were hearing. For example, in the food-word-pair, banana–lemon, extreme
lemon had value one and extreme banana had value seven. From the given values a one-way
ANOVA and post hoc Tukey HSD-tests were conducted to detect the effects of “sweet” and “sour”
music on consumers’ taste associations.
Dow
nloa
ded
by T
UR
KU
UN
IVE
RSI
TY
At 0
3:21
27
Mar
ch 2
015
(PT
)

6
Preparing the drink congruent with the music. The study participants were asked to listen to the
music and prepare a drink congruent with it. Each participant listened to only one musical piece.
First, they were asked to list the ingredients (selecting from mango juice, orange juice, grapefruit
juice, lemon juice, pineapple juice, and liquid honey) they used for mixing their drink, and then they
were asked to prepare a sample drink. Samples of 20 milliliters were collected for chemical
analysis.
Chemical analysis. The sugar and acid concentrations were chemically analyzed from the drink
samples. A sample of 50 ml was collected from each participant and samples were stored at -20°C
until analyzed for their sugar and organic acid contents. Sugar and acid contents of the juices were
analyzed by a high performance liquid chromatographic (HPLC) method based on Phenomenex
applications ID 5504 and 5505 and the analysis method for acids was based on Phenomenex
application ID 14270. The HPLC system, Waters, consisted of a Waters in-line degasser AF, 515
HPLC pump, 717plus autosampler, column oven, 2410 refractive index detector (for sugars) and
2487 dual λ absorbance detector (for organic acids). The Empower 3 software was used for data
acquisition and analysis.
The eluent used for organic acid analyses was 20 mM phosphate buffer, pH 2.9. Potassium
phosphate (monobasic ≥99%) was purchased from Sigma-Aldrich (Chemie GmbH, Steinheim) and
ortho-phosphoric acid (85%) used for adjustment of pH from Merck (Darmstadt, Germany). The
eluent used for sugar analysis was deionized water, filtered through Phenex Nylon 0.45 µm filter
membrane (Phenomenex). Sucrose was purchased from Merck (Darmstadt, Germany), D(-)-
fructose and citric acid were obtained from Sigma-Aldrich (Steinheim, Germany), D(+)-glucose
was purchased from J.T.Baker (Denventer, Holland) and L(-)-malic acid from Acros Organics
(Geel, Belgium). Each juice sample was analyzed in triplicate. Quantification was carried out with
an external standard method. The concentrations of sugars and acids were expressed as g/l.
A one-way ANOVA and post hoc Tukey HSD-tests were conducted to detect the effects of “sweet”
and “sour” music’s impact on sugar and acid contents of the drinks.
Results
Food-related associations
Dow
nloa
ded
by T
UR
KU
UN
IVE
RSI
TY
At 0
3:21
27
Mar
ch 2
015
(PT
)
7
Food-related word associations, generated in the four experimental groups, revealed a consistent
trend (Figure 1). The higher ranked words, in response to the sweet melodies, were chocolate, tasty
and for the sour melodies fruits, sour. To quantify this observation, we measured the projection of
this distribution of words to the sweet and the sour dimensions of semantic space using Latent
Semantic Analysis (Table 2). In the groups, which had the “sweet” music (Satie and Schumann)
was played, the connotations of food-related associations were significantly closer to the taste word
“sweet” than to the taste word “sour.” In contrast, in the groups that had “sour” music (Ferneyhough
and Mesz) played, such significant differences were not detected. Secondly, the key connotations of
food-related associations produced in the “sour” music groups were significantly closer to the taste
word “sour” than those produced in the “sweet” music groups, except in the case of the Schumann
versus Ferneyhough groups. However, the key connotations of food-related associations produced
in the “sweet” music groups were not significantly closer to the taste word “sweet” than those
produced in the “sour” music groups. This experiment can be viewed as a mirror reflection of Mesz
et al (2011). In their original work, Mesz et al showed that taste words elicit consistent musical
formations. Our analysis demonstrated that specific musical formations formed by the musical
dimensions of different tastes evoked a broad set of words, which consistently projected to semantic
taste dimensions.
FIGURE 1A-D.
TABLE 2.
Taste associations
The results shown above indicate that "sweet and sour melodies" produce structured projections of
free word associations. In the next experiment, we investigated whether they produce a consistent
set of associations within a controlled and limited set of words, which correspond to sweet, sour, or
neutral associations.
As described earlier, six food-word-pairs (of which, two were filler/control items) were chosen to
measure the taste associations triggered by the music. The sweet food words included chocolate,
banana, meringue, and pineapple, and the sour food words were lingonberry, lemon, crisp rye-bread
(the literal translation from Finnish is sour rusk), and red currant. The filler/control food word pairs
encompassed wheat versus oats and chicken versus beef. The presumption was that the “sweet” and
Dow
nloa
ded
by T
UR
KU
UN
IVE
RSI
TY
At 0
3:21
27
Mar
ch 2
015
(PT
)
8
“sour” music would have an effect on study participants’ taste associations, as reflected by the
variation in the food word selections.
In the cases of food word pairs, chocolate–lingonberry and lemon–banana, the results (Table 3)
suggest that the “sweet” music (Satie and Schumann) elicited sweeter taste associations (stronger
choice preference for chocolate and banana), while the “sour” music (Ferneyhough and Mesz)
yielded greater sour taste associations (stronger choice preferences for lingonberry and lemon). In
effect, the same pattern of results was obtained for the food word pair meringue–crisp rye bread
(with the exception that Schumann’s sweet music did not produce different results as
Ferneyhough’s and Mesz’s sour music).
Only in the case of the red currant–pineapple food-word-pair, the results were not in accordance
with our expectations – no significant differences in the taste associations between the “sweet” and
“sour” music groups emerged. The null results were also received in the analysis of the filler/control
food word pair, wheat–oats. A surprising difference surfaced when the responses to the second
filler/control food word pair-items (chicken–beef) were compared between the groups when
listening to Schumann’s “sweet” and Ferneyhough’s “sour” music. The former seemed to have taste
associations related to beef whereas the latter did the same in relation to chicken. This finding is
discussed later in the concluding section of the article. Overall, the findings concerning the taste
associations convey additional evidence for this study’s key hypothesis.
TABLE 3.
Ingredients chosen for a drink
Participants were asked to prepare a drink congruent with the music they heard and write down
what ingredients they used for it. They could freely select the ingredients from the choice set of five
juices and liquid honey (refer to the description of the pre-test in the Methods and Materials-
section). This procedure had a resemblance to the color-matching experiments by Helmholtz, where
participants had to adjust the mix of three different wavelengths of light to match a given color (see
Trichromatic Theory of Color Vision, 2013).
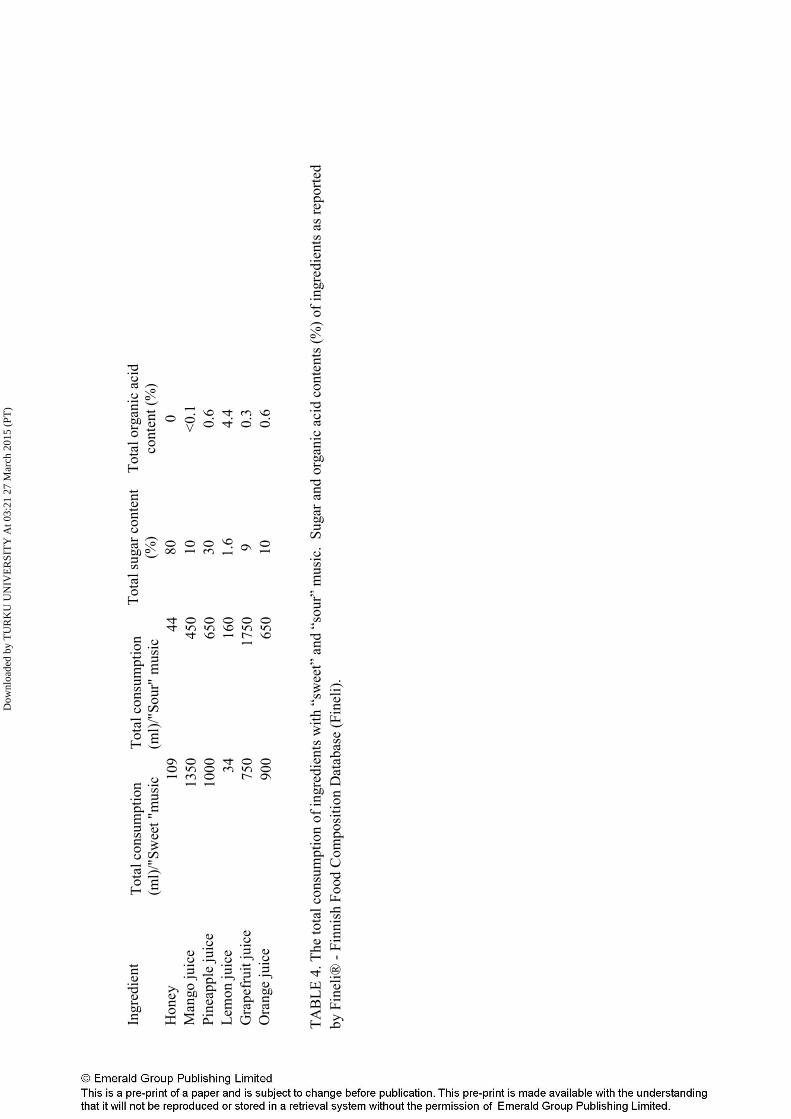
As summarized in Table 4, the total use of ingredients with the higher sugar content (honey, mango
juice, and pineapple juice) dominated when listening to “sweet” music but more sour ingredients
(lemon and grapefruit juice) were used when listening to “sour” music. For example the total use of
Dow
nloa
ded
by T
UR
KU
UN
IVE
RSI
TY
At 0
3:21
27
Mar
ch 2
015
(PT
)

9
liquid honey in the “sweet” and “sour” music experiment was 109 and 44 ml while the use of lemon
juice was 34 and 160 ml, respectively.
TABLE 4.
Samples were taken from each of the drink for the chemical analysis. Based on total consumption
and reported sugar and acid concentrations of the ingredients (Table 4) the sugar and acid
concentrations were predicted to differ between the drinks mixed when study participants were
exposed to “sweet” (Satie and Schumann) versus “sour” (Ferneyhough and Mesz) music. The
results are shown in Table 5.
TABLE 5.
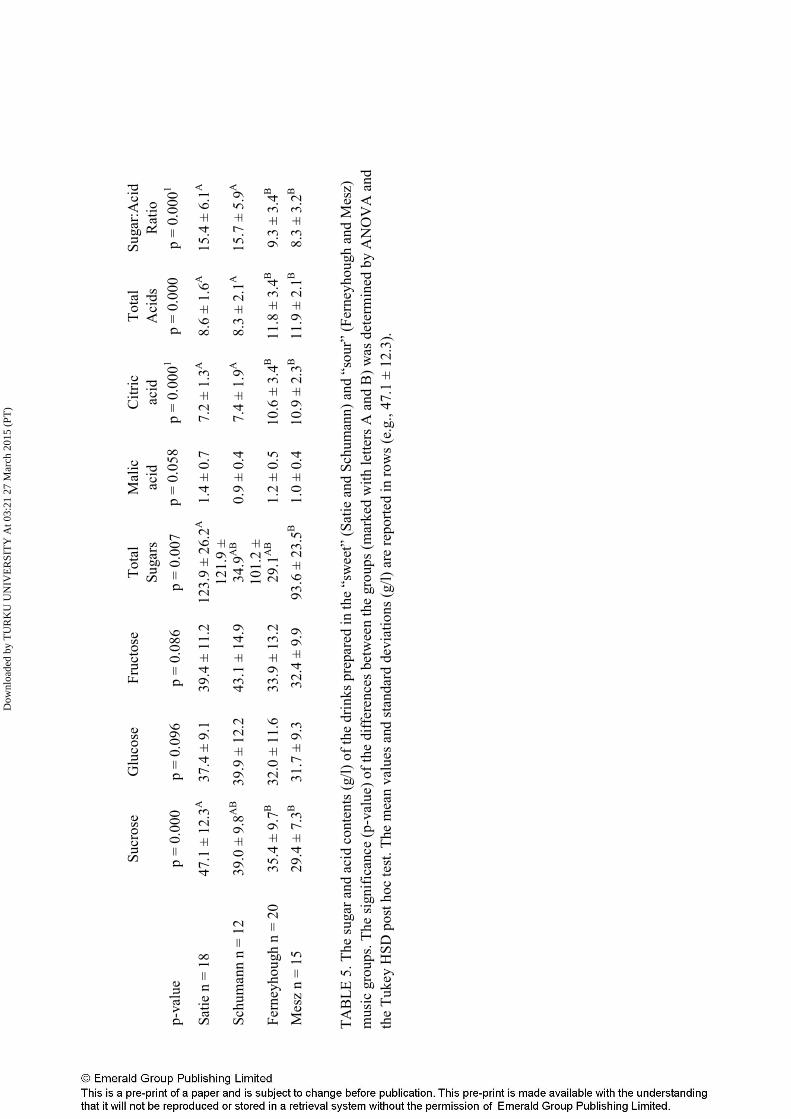
The average total sugar content of the drinks prepared in the room with the “sweet” music (Satie
and Schumann) were higher (125.2 g/l and 121.2 g/l, respectively) than in the drinks mixed while
hearing the “sour” music of Ferneyhough and Mesz (101.2 g/l and 93.6 g/l, respectively). There was
a significant difference between the total sugar contents of the drinks mixed while listening to the
music of Satie versus Mesz (p=0.011), but the difference between the total sugar contents of the
drinks prepared while listening to the music of Satie versus Ferneyghough (p=0.051) was not
significant.
The total acid contents were higher in the drinks prepared in the rooms with Ferneyhough’s and
Mesz’s “sour” music being played (11.8 and 11.9 g/l, respectively) than in the drinks mixed in the
rooms filled with Satie’s and Schumann’s “sweet” music (8.8 and 8.4 g/l, respectively). A
significant difference in the total acid contents of the drinks prepared in the rooms with the music of
Satie versus Ferneyhough (p=0.002) was found. A similar significant difference was observed
between the “sweet” music of Satie and the “sour” music of Mesz (p=0.003), between the “sweet”
music of Schumann and the “sour” music of Ferneyhough (p=0.004) and between the “sweet”
music of Schumann and the “sour” music of Mesz (p=0.005). In turn, the differences between the
“sweet” musical pieces of Satie and Schumann and between the “sour” musical pieces of
Ferneyhough and Mesz were non-significant.
The results concerning the sugar:acid ratios mirrored those of total acid contents (see above). To
conclude, the results from the chemical analysis are supportive of the notion that the exposure to the
Dow
nloa
ded
by T
UR
KU
UN
IVE
RSI
TY
At 0
3:21
27
Mar
ch 2
015
(PT
)
10
“sweet” and “sour” music indeed affected study participants’ choices of ingredients for a drink they
were requested to mix. “Sweet” music led to more sugary drinks and “sour” music to drinks with
higher acidity.
Discussion and conclusions
The results indicate that exposure to the “sweet” musical piece and to the “sour” musical piece
influences food-related thinking processes and even choice behaviors. This study provides further
evidence concerning the quality of associations made between music and food of similar taste
parameters. We found that the participants, when listening to music, which contained “sweet” and
“sour” taste elements, made word associations connected to these elements. These associations
influenced their selection of ingredients for a drink preparation. It also impacted the sweetness and
sourness of the drink that they prepared.
The food-related word association analysis clearly indicated that individuals make consistent
associations between the music and food that can be characterized as possessing either sweet or
sour taste parameters. The same, freely associated words were chosen repeatedly by different
people for a given music (Figure 1). The most often repeated words were chocolate (for Satie) and
tasty (for Schumann), and other highly repeated words for the “sweet” music files revealed
connections with pleasant tastes, softness, and warm temperatures. These words were: dessert, soft,
velvety, creamy, enjoyable, wine, fine, warm, and sweet. In contrast, the most often repeated words
associated to “sour” music files were fruits (for Ferneyhough) and sour (for Mesz), and other
frequent words related to relatively more unpleasant taste sensations: hardness and coldness,
pungent, hard, icy, cold, strong, sharp, spicy, burning, spicy, and bitter. The terms, berries and
lemon appear often both for sweet and sour music selections.
The qualitative analysis of the word pairs showed that, when listening to Satie’s piece, rich in
“sweet” musical elements, the participants preferred sweet food terms such as chocolate, banana
and meringue over the less sweet options. However, this effect was not as pronounced in the case of
Schumann’s music, which is similarly rich in “sweet” elements. Ferneyhough’s piece, carrying
several “sour” musical elements, encouraged the participants to gravitate towards sour food terms,
such as lingonberry and lemon. In the case of Mesz’s “sour” music, this effect was even stronger.
Dow
nloa
ded
by T
UR
KU
UN
IVE
RSI
TY
At 0
3:21
27
Mar
ch 2
015
(PT
)
11
We showed that sweet or sour elements in the music may even contribute to the actual degree of
sweetness (as measured by the sugar content) and sourness (as measured by the organic acid
content) of drinks. The participants created and prepared drinks with similar characteristics while
being exposed to this kind of music. Drinks prepared, while listening to “sweet” music, had higher
sugar content as compared to when prepared under the influence of “sour” music. The drinks
prepared under the influence of “sour” music resulted in their higher organic acid content. The
effect of specific musical patterns on consumers’ food-related associations and behavioral choices
are not documented. Consequently, presenting the first empirical evidence for it contributes to an
emerging research that addresses cross-modal interactions, in the realm of consumption and
cooking of food. Moreover, the incorporation of them as dependent variables instead of taste
perception extends the current academic knowledge.
These novel findings, produced by qualitative and quantitative methods, are consistent with three
recent discoveries. First, certain phonetic features (e.g., brand names) map to specific tastes
(Spence, 2012). Second, changing the sonic properties of a non-musical background soundtrack can
modulate consumers taste perceptions of food products (Crisinel et al., 2012). Third, musical pieces
such as Carl Orff”s Carmina Burana and Michael Brook’s Slow Breakdown can lead consumers to
rate the taste of the same wine in the former case, as more “powerful and heavy” whereas in the
latter case, as more “mellow and soft” (North, 2012).
In the search of the conceptual explanation for the effects observed in this study, North’s (2012)
elaboration on the cognitive priming theory and symbolic meanings of music is a viable candidate.
These attributes make the basic assumption that the same terms or concepts are used to characterize
both musical and taste sensations (Knöferle and Spence, 2012). In effect, symbolic priming occurs
when the presentation of musical stimulus triggers interpretation or symbolic associations, which, in
turn, primes a characteristic that happens to be perceived at the same time (Spence and Deroy,
2013, p. 138). Applying these ideas here suggests that the “sweet” symbolic connotations of Satie’s
and Schumann’s music and the “sour” symbolic connotations of Ferneyhough’s and Mesz’s music
prime mental content that is connected with the concepts of “sweetness” and “sourness.” This
activation results in the increased likelihood of corresponding food-related thoughts and behaviors
due to unconscious expectations (Spence, 2012). Thus, after being asked to produce food-related
associations while hearing “sweet/sour” music, predominantly sweet/sour ones will come to
people’s minds. This favored sweet/sour ingredient addition when asked to mix a drink.
Dow
nloa
ded
by T
UR
KU
UN
IVE
RSI
TY
At 0
3:21
27
Mar
ch 2
015
(PT
)
12
The research conducted concerning the priming effects of brands, in the field of consumer behavior,
offers direct evidence for this account. The symbolic meaning of creativity is associated with
companies such as the Apple©
brand, while the symbolic meaning of smartness is associated with
the IBM©
brand, among American consumers (Fitzsimons et al., 2008). This study reveals that the
Apple©
-primed consumers behave more creatively than the IBM©
-primed consumers or controls.
Thus, this theoretical rationale should be tested in the future in the research context that combines
various “taste music” and food-related dependent variables (e.g., associations, expectations, sensory
perception, emotion, food choices, and even cooking). For example, the food-related expectations
and emotions generated after hearing “sweet,” “sour,” “bitter,” and “salty” music could be
compared (cf. Sester et al., 2013) and their role in modifying taste perceptions and other food-
related processes should be analyzed.
It must be acknowledged, though, that in addition to symbolic priming, there are other alternative
accounts for understanding cross-modal associations between music and taste: the amodality,
mediation, and transitivity hypotheses. According to the amodality hypothesis, the coding of certain
dimensions of sensory experiences (e.g., magnitude or space) is common across modalities. The
mediation hypothesis asserts that some other indirect commonality (e.g., pleasantness or fastness)
explains why all sensory experiences that share this dimension correspond. Finally, the transitivity
hypothesis can be illustrated as follows. If a sensory feature A corresponds to a feature B in another
modality, and B, in turn, corresponds to a feature C in a third modality, our brains will generate a
cross-modal correspondence between A and C. (Deroy et al., 2013). The validity of these
explanatory formulations should be rigorously tested in future studies.
The study also demonstrates the complexity of experiments where the connection between music
and taste is under examination. For example, the results concerning the food-word-pair red currant –
pineapple were inconsistent with the expectations. Although pineapple has high sugar content
(30%) and is often considered as sweet, its relatively high organic acid content (0.6%) may make
tasters judge it as a sour rather than as a sweet food. Second, an interesting theoretical implication
springs from the unexpected finding that Satie’s and Schumann’s “sweet” music evoked stronger
beef-related taste associations, while Ferneyhough’s and Mesz’s “sour” music did the same with
regard to chicken-related taste associations. Five participants of twelve associated Schumann’s
piano music with “fine dining” and a restaurant milieu. Here, the question is not necessarily about
the cross-modal associations between the auditory and gustatory stimuli, but about the activation
(by the music) of inter-connected mental constructs (the linkage between fine dining and beef-
Dow
nloa
ded
by T
UR
KU
UN
IVE
RSI
TY
At 0
3:21
27
Mar
ch 2
015
(PT
)
13
eating is postulated to be stronger than that of between fine dining and chicken-meat eating) (see
also Areni and Kim, 1993). Still, this interpretation is speculative and needs to be verified by further
studies.
This points to the importance of understanding the symbolic meanings of cultural objects, practices,
and places (Allen et al., 2008), especially when they are used as experimental stimuli (this was
controlled in the present study via a pre-test). The fact that piano music is often played in fine
restaurants is a plausible explanation for the surprising effect referred to above. More generally, this
implies that the symbolic meanings of certain musical pieces (e.g., Beethoven’s fifth symphony) are
likely to be differently understood in different socio-cultural contexts (e.g., in a German city vs. in a
Tanzanian rural village) (cf. Reyes, 2009). Thus, the cross-cultural perspective on the cross-modal
effects between music and taste perception provides another avenue for future research.
Limitations of the study
The “sweet” and “sour” music were produced using different instruments. Since different
instruments may exert distinct timbre effects on how consumers map sounds onto tastes (Crisinel
and Spence, 2010a), using piano versus flute music is a potential confounder. Piano music is
consistently associated with “sweetness” (Spence, 2012), and flute music is associated with acidity
(Spence et al., 2013). “Sweet” and “sour” music were selected for the experiment, because sweet
and sour dimensions are easy to distinguish (see e.g. Mesz et al., 2011). Individual factors, such as
the pre-existing musical and the culinary expertise, coupled with the usage of and attitude towards
the juices and honey (the ingredients that were available for mixing the drink), were not explicitly
measured. These factors could have moderated the effects detected, although the random
assignment of participants to the experimental groups should decrease the risk of such a bias, here.
Due to a lengthy experimental session (ca. 20 min), commencing in a real life setting, a between-
subjects study design was, in practice, the only alternative. This design, however, is suboptimal
because it cannot produce conclusive evidence that it was the musical elements (sweet vs. sour) that
affected the ingredients chosen for the drink and not some other factors (e.g., certain idiosyncrasies
in the sweet vs. sour experimental conditions). Thus, replication attempts employing within-subjects
designs are more apt. Finally, there were no filler tasks in which the participants were asked to
engage in before they started to prepare the drinks. Moreover, no control questions hinting at the
presumed purpose of the study were posed to them. The questionnaire did not contain any terms or
words that were directly related to sweetness or sourness and while the participants were being
Dow
nloa
ded
by T
UR
KU
UN
IVE
RSI
TY
At 0
3:21
27
Mar
ch 2
015
(PT
)

14
recruited, they were given only a general idea of the study (e.g., that is dealt with musical
associations). Various sources of potential confounds must be systematically controlled in future
studies.
Practical implications
The key finding of this study also propels a few managerial implications. First, by carefully
considering the symbolic meanings of the music used in different social situations, creating
multimodal experiences and even subconscious expectations in people’s minds is possible (Krishna,
2012). These subconscious expectations can, through the assimilation processes (Sester et al.,
2013), come to augment consumers’ actual taste experience, which occur later. Second, ambient
“taste music” that is congruent with the basic flavors of the dishes can be played in restaurants to
highlight guests’ sensory experiences. For instance, sweet desserts may be appreciated more when
“sweet taste music” is aired (cf. Crisinel et al., 2012). Third, food marketers can combine music or
sounds with visual, haptic, and olfactory stimuli to produce an optimal mixture of taste emotions
that increasingly fascinates sensory researchers at the moment (e.g., Ng et al., 2013).
These findings suggesting that specific musical elements have an influence on how a dish is
prepared may have compelling practical implications. Indeed, they encourage chefs and restaurant-
keepers to develop new multimodal culinary experiences. As a matter of fact, such culinary
innovations already exist. One of the landmark example of these are the “Sounds of the sea” dish
served by Heston Blumenthal in the Fat Duck restaurant in Bray, UK. There, this dish is served
while playing a soundtrack specifically designed for it to highlight the multimodal eating
experience. Multimodal cookbooks, such as those including music recommendations for each dish,
are a novel type of food literacy (e.g., Pelaccio, 2012). The significance of this study lies in the
notion that a soundscape may influence the design and creation of culinary dishes. This represents a
possibility to raise the culinary art to a new level.
References
Allen, M.W.; Gupta, R. and Monnier, A. (2008), “The interactive effect of cultural symbols and
human values on taste evalution”, Journal of Consumer Research, Vol. 35 (August), pp. 294–307.
Dow
nloa
ded
by T
UR
KU
UN
IVE
RSI
TY
At 0
3:21
27
Mar
ch 2
015
(PT
)
15
Areni, C. S. and Kim, D. (1993), “The influence of background music on shopping behavior:
Classical versus top-forty music in a wine store”. Advances in Consumer Research, Vol. 20, pp.
336–340.
Beeli, G.; Esslen, M. and Jänke, L. (2005), “Synaesthesia: when coloured sounds taste sweet”,
Nature, No. 434, pp. 38.
Bronner, K.; Frieler, K.; Bruhn, H.; Hirt, R. and Piper, D. (2012), “What is the sound of citrus?
Research on the correspondences between the perception of sound and flavor.” http://audity-
docs.s3.amazonaws.com/citrus_paper_icmpc12_201200514-5066ab939400d.pdf (assessed 19
november 2013).
Crisinel, A.-S.; Cosser, S.; King, S.; Jones, R.; Petrie, J. and Spence, C. (2012), “A bittersweet
symphony: Systematically modulating the taste of food by changing the sonic properties of the
soundtrack playing in the background”, Food Quality and Preference, Vol 24 No. 1, pp. 201–204.
Crisinel, A.-S. and Spence, C. (2010a), “As bitter as a trombone: Synesthetic correspondences in
non-synesthetes between tastes/flavors and musical notes”, Attention, Perception & Psychophysics,
Vol. 72, pp. 1994–2002.
Crisinel, A.-S. and Spence, C. (2010b), “A sweet sound? Food names reveal implicit associations
between taste and pitch”, Perception, Vol. 39, pp. 417–425.
Crisinel, A.-S. and Spence, C. (2009), “Implicit associations between basic tastes and pitch”,
Neuroscience Letters, Vol. 464, pp. 39–42.
Deerwester, S.; Dumais, S. T.; Furnas, G. W.; Landauer, T. K. and Harshman, R. (1990), “Indexing
by latent semantic analysis”, Journal of the American Society for Information Science, Vol. 41 No.
6, pp. 391–407.
Deroy, O.; Crisinel, A.-S. and Spence, C. (2013), “Crossmodal correspondences between odors and
contingent features: Odors, musical notes, and geometrical shapes”, Psychonomic Bulletin &
Review, Vol. 20, Issue 5, pp. 878–896.
Dow
nloa
ded
by T
UR
KU
UN
IVE
RSI
TY
At 0
3:21
27
Mar
ch 2
015
(PT
)
16
Diuk, C.; Fernandez Slezak, D.; Raskovsky, I.; Sigman, M and Cecchi, G.A. (2012), “A
quantitative philology of introspection”, Frontiers in Integrative Neuroscience, Vol. 6 No. 80, pp.
1–12.
Ernst, M.O. and Bülthoff, H.H. (2004), “Merging the senses into a robust percept”, Trends in
Cognitive Sciences, Vol. 8 No. 4, pp. 162–169.
Fineli® – Finnish Food Composition database, National Institute for Health and Welfare, release 14
(5 December 2011), available at: www.fineli.fi (accessed 20 November 2013)
Fitzsimons, G.M.; Chartrand, T. and Fitzsimons, G.J. (2008), “Automatic effects of brand exposure
on motivated behavior: How Apple makes you “think different”, Journal of Consumer Research
Vol. 35 (June), pp. 21–35.
Holt-Hansen, K. (1968), “Taste and pitch”, Perceptual and Motor Skills, Vol. 27 No. 1, pp. 59–68.
Hänggi, J.; Beeli, G.; Oechslin, M. S. and Jaencke, L. (2008), “The multiple synaesthete E.S.:
Neuroanatomical basis of interval-taste and tone-colour synaesthesia”, NeuroImage, Vol. 43 No. 2,
pp. 192–203.
King, B. M.; Arents, P.; Bouter, N.; Duineveld, C. A.; Meyners, M.; Schroff, S. I. and Soekhai, S.
T. (2006), ”Sweetener/sweetness-induced changes in flavor perception and flavor release of fruity
and green character in beverages”, Journal of Agricultural and Food Chemistry, Vol. 54 No. 7, pp.
2671–7.
Knöferle, K. and Spence, C. (2012), “Crossmodal correspondences between sounds and tastes”,
Psychon. Bull. Rev. Vol 19, pp. 992-1006. DOI 10.3758/s13423-012-0321-z.
Koch, C. and Koch, E.C. (2003), “Preconceptions of taste based on color”, The Journal of
Psychology, Vol 137, No. 3, pp. 233-242.
Krishna, A. (2012), “An integrative review of sensory marketing: Engaging the senses to affect
perception, judgment and behavior”, Journal of Consumer Psychology, Vol. 22 No. 3, pp. 332–351.
Dow
nloa
ded
by T
UR
KU
UN
IVE
RSI
TY
At 0
3:21
27
Mar
ch 2
015
(PT
)
17
Laaksonen, O.; Ahola, J. and Sandell, M. (2013), ”Explaining and predicting individually
experienced liking of berry fractions by the hTAS2R38 taste receptor genotype”, Appetite, No. 61,
pp. 85–96.
Mesz B.; Sigman M. and Trevisan M. A. (2012), “A composition algorithm based on crossmodal
taste-music correspondences”, Frontiers in Human Neuroscience Vol. 6 No. 71. DOI:
10.3389/fnhum.2012.00071.
Mesz, B., Trevisan, M. A. and Sigman, M. (2011), “Taste of Music,” Perception, Vol. 40, pp. 209–
219.
Ng, M.; Chaya, C. and Hort, J. (2013), “Beyond liking: Comparing the measurement of emotional
response using EsSense profile and consumer defined check-all-that-apply methodologies”, Food
Quality and Preference, Vol. 28 No. 1, pp. 193–205.
North, A.C. (2012), “The effect of background music on the taste of wine”, British Journal of
Psychology, Vol. 103 No. 3, pp. 293–301.
Pelaccio, Z. (2012), Eat with your hands, Ecco, New York, NY.
Reyes, A. (2009), “What Do Ethnomusicologists Do? An Old Question for a New Century”,
Ethnomusicology, Vol. 53 No. 1, pp. 1–17.
Sester, C.; Dacremont, C.; Deroy, O. and Valentin, D. (2013), “Investigating consumers”
representations of beers through a free association task: A comparison between packaging and blind
conditions”, Food Quality and Preference, Vol. 28 No. 2, pp. 475–483.
Simner, J., Cuskley, C. and Kirby, S. (2010), “What sound does that taste? Cross-modal mappings
across gustation and audition”, Perception, Vol. 39 No. 4, pp. 553–569.
Spence, C.; Levitan, C. A.; Shankar, M. U. and Zampini, M. (2010), “Does food color influence
taste and flavor perception in humans?”. Chemosensory Perception, No. 3, pp. 68–84.
Dow
nloa
ded
by T
UR
KU
UN
IVE
RSI
TY
At 0
3:21
27
Mar
ch 2
015
(PT
)
18
Spence, C. (2012), “Managing sensory expectations concerning products and brands: Capitalizing
on the potential of sound and shape symbolism”, Journal of Consumer Psychology, Vol. 22 No. 1,
pp. 37–54.
Spence, C. and Deroy, O. (2013), “On why music changes what (we think) we taste”, i-Perception
Vol. 4, pp. 137–140. dx.doi.org/10.1068/i0577ic.
Spence, C.; Richards, L.; Kjellin, E.; Huhnt, A.-M.; Daskal, V.; Scheybeler, A.; Velasco, C. and
Deroy, O. (2013), “Looking for crossmodal correspondences between classical music and fine
wine”, Flavour, Vol 2, No. 29.
Trichromatic Theory of Color Vision (2013), Available at:
http://psychology.about.com/od/sensationandperception/f/trichrom.htm (accessed 18 November
2013).
Music samples:
• Schumann: http://www.youtube.com/watch?v=jIHsNlwD6jQ
• Ferneyhough: http://www.youtube.com/watch?v=dYnYimo8z2Q
• Satie: http://www.youtube.com/watch?v=1loSL7CjE_w
• Mesz: http://youtu.be/lfxdpNMYmlo
Dow
nloa
ded
by T
UR
KU
UN
IVE
RSI
TY
At 0
3:21
27
Mar
ch 2
015
(PT
)
Music
Roughness
Brightness
Attacktime
Mean frequency
Satie n=18
6.1
0.2
0.1
842.8
Schumann n=12
13.4
0.1
0.1
293.8
Ferneyhough n=20
29.2
0.9
0.1
1252.6
Mesz n=15
814.8
0.6
0.1
1085.7
TABLE 1. The musical param
eters of selected “sw
eet” and “sour” m
usical samples.
Dow
nloa
ded
by T
UR
KU
UN
IVE
RSI
TY
At 0
3:21
27
Mar
ch 2
015
(PT
)

Music/W
ord sim
ilarities
"sweet" (mean)
"sweet" (std)
"sour" (mean)
"sour" (std)
t-test "sw
eet" vs.
"sour"
Satie n=18
0.3
0.15
0.21
0.13
p=0.00001
Schumann n=12
0.32
0.16
0.23
0.15
p=0.01
Ferneyhough n=20
0.34
0.13
0.30
0.20
p=0.2
Mesz n=15
0.35
0.19
0.33
0.27
p=0.6
Comparative sim
ilarity to "sw
eet" (t-test)
Satie n=18
Schumann n=12
Ferneyhough n=20
Mesz n=15
Satie n=18
p= 0.5397
p= 0.1424
p= 0.0990
Schumann n=12
p= 0.5352
p= 0.4324
Ferneyhough n=20
p= 0.7569
Mesz n=15
Comparative sim
ilarity to "sour" (t-test)
Satie n=18
Schumann n=12
Ferneyhough n=20
Mesz n=15
Satie n=18
p= 0.3025
p= 0.0007
p= 0.0002
Schumann n=12
p= 0.06
p= 0.03
Ferneyhough n=20
p= 0.49
Mesz n=15
TABLE 2. The semantic similarity values (mean and standard deviation std) of food-related word associations with the taste names “sw
eet” and
“sour” Values of Latent Sem
antic Analysis vary between -1 (semantically dissimilar to “sw
eet” or “sour”) and 1 (semantically sim
ilar to “sw
eet”
or “sour”). The significance (p-value) of the differences between the groups (statistically significant differences marked bolded) was determined
by ANOVA and the Tukey’s t post hoc tests.
Dow
nloa
ded
by T
UR
KU
UN
IVE
RSI
TY
At 0
3:21
27
Mar
ch 2
015
(PT
)

Chocolate 1
Lingonberry 7
Lem
on 1
Banana 7
Chicken 1
Beef 7
Meringue 1
Crisp rye
bread 7
Redcurrant 1
Pineapple 7
Wheat 1 Oats 7
p-value
p = 0.000
p = 0.0001
p = 0.0091
p = 0.003
p = 0.159
p = 0.732
Satie n = 18
2.22 ± 1.48A
4.72 ± 1.56A
4.06 ± 2.04AB
2.61 ± 1.42A
3.56 ± 1.34
4.22 ± 1.48
Schumann n = 12
3.00 ± 1.71A
3.75 ± 1.96A
5.33 ± 1.23A
3.25 ± 1.82AB
3.75 ± 1.66
3.83 ± 1.53
Ferneyhough n =
20
5.55 ± 1.43B
2.00 ± 1.45B
2.95 ± 1.23B
4.45 ± 1.61B
3.80 ± 1.91
3.90 ± 1.21
Mesz n = 15
6.29 ± 0.73B
1.67 ± 0.82B
3.53 ± 1.51AB
4.47 ± 2.00B
2.60 ± 1.59
3.37 ± 1.63
TABLE 3. Taste associations evoked by the “sweet” (Satie and Schumann) and “sour” (Ferneyhough and M
esz) m
usic. The significance (p-
value) of the differences between the music groups (m
arked with letters A and B) was determined by ANOVA and the Tukey HSD post hoc
tests. The mean values and standard deviations are reported in rows (e.g., 2.22 ± 1.48).
Dow
nloa
ded
by T
UR
KU
UN
IVE
RSI
TY
At 0
3:21
27
Mar
ch 2
015
(PT
)
Ingredient
Total consumption
(ml)/"Sweet "m
usic
Total consumption
(ml)/"Sour" m
usic
Total sugar content
(%)
Total organic acid
content (%
)
Honey
109
44
80
0
Mango juice
1350
450
10
<0.1
Pineapple juice
1000
650
30
0.6
Lem
on juice
34
160
1.6
4.4
Grapefruit juice
750
1750
9
0.3
Orange juice
900
650
10
0.6
TABLE 4. The total consumption of ingredients with “sw
eet” and “sour” m
usic. Sugar and organic acid contents (%) of ingredients as reported
by Fineli®
- Finnish Food Composition Database (Fineli).
Dow
nloa
ded
by T
UR
KU
UN
IVE
RSI
TY
At 0
3:21
27
Mar
ch 2
015
(PT
)
Sucrose
Glucose
Fructose
Total
Malic
Citric
Total
Sugar:Acid
Sugars
acid
acid
Acids
Ratio
p-value
p = 0.000
p = 0.096
p = 0.086
p = 0.007
p = 0.058
p = 0.0001
p = 0.000
p = 0.0001
Satie n = 18
47.1 ± 12.3
A
37.4 ± 9.1
39.4 ± 11.2
123.9 ± 26.2
A
1.4 ± 0.7
7.2 ± 1.3
A
8.6 ± 1.6
A
15.4 ± 6.1
A
Schumann n = 12
39.0 ± 9.8
AB
39.9 ± 12.2
43.1 ± 14.9
121.9 ±
34.9
AB
0.9 ± 0.4
7.4 ± 1.9
A
8.3 ± 2.1
A
15.7 ± 5.9
A
Ferneyhough n = 20
35.4 ± 9.7
B
32.0 ± 11.6
33.9 ± 13.2
101.2 ±
29.1
AB
1.2 ± 0.5
10.6 ± 3.4
B
11.8 ± 3.4
B
9.3 ± 3.4
B
Mesz n = 15
29.4 ± 7.3
B
31.7 ± 9.3
32.4 ± 9.9
93.6 ± 23.5
B
1.0 ± 0.4
10.9 ± 2.3
B
11.9 ± 2.1
B
8.3 ± 3.2
B
TABLE 5. The sugar and acid contents (g/l) of the drinks prepared in the “sweet” (Satie and Schumann) and “sour” (Ferneyhough and M
esz)
music groups. The significance (p-value) of the differences between the groups (m
arked with letters A and B) was determined by ANOVA and
the Tukey HSD post hoc test. The mean values and standard deviations (g/l) are reported in rows (e.g., 47.1 ± 12.3).
Dow
nloa
ded
by T
UR
KU
UN
IVE
RSI
TY
At 0
3:21
27
Mar
ch 2
015
(PT
)
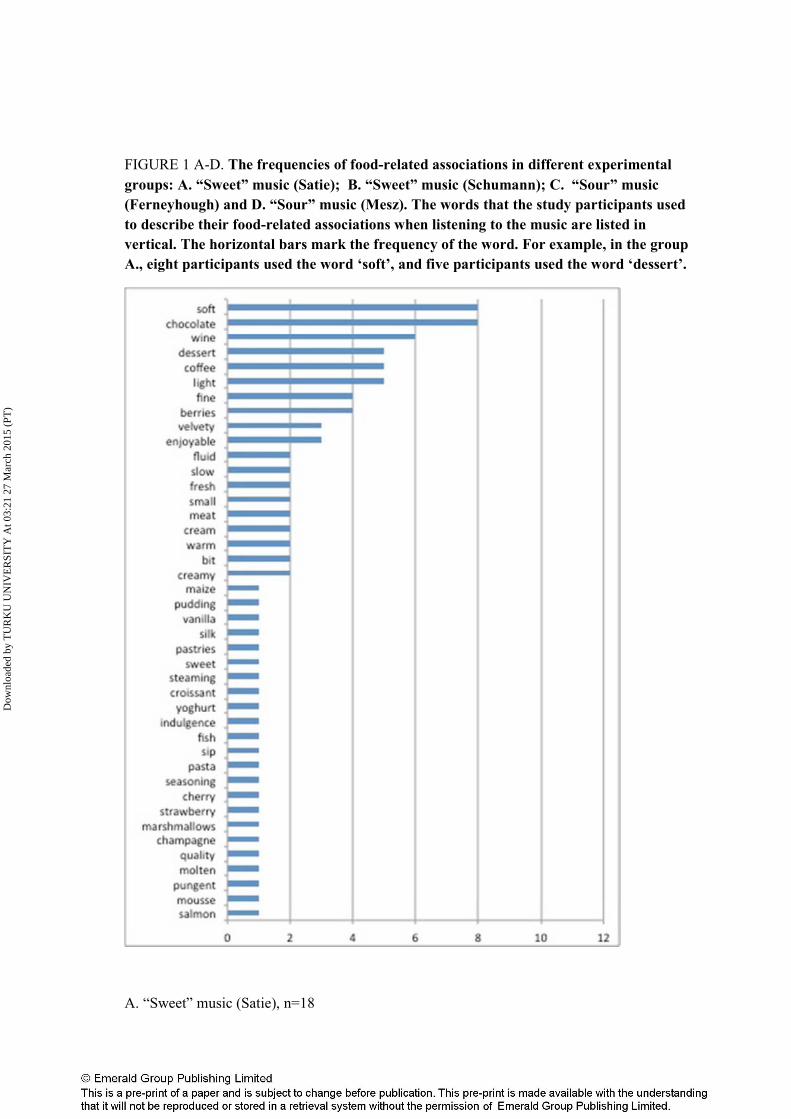
FIGURE 1 A-D. The frequencies of food-related associations in different experimental
groups: A. “Sweet” music (Satie); B. “Sweet” music (Schumann); C. “Sour” music
(Ferneyhough) and D. “Sour” music (Mesz). The words that the study participants used
to describe their food-related associations when listening to the music are listed in
vertical. The horizontal bars mark the frequency of the word. For example, in the group
A., eight participants used the word ‘soft’, and five participants used the word ‘dessert’.
A. “Sweet” music (Satie), n=18
Dow
nloa
ded
by T
UR
KU
UN
IVE
RSI
TY
At 0
3:21
27
Mar
ch 2
015
(PT
)
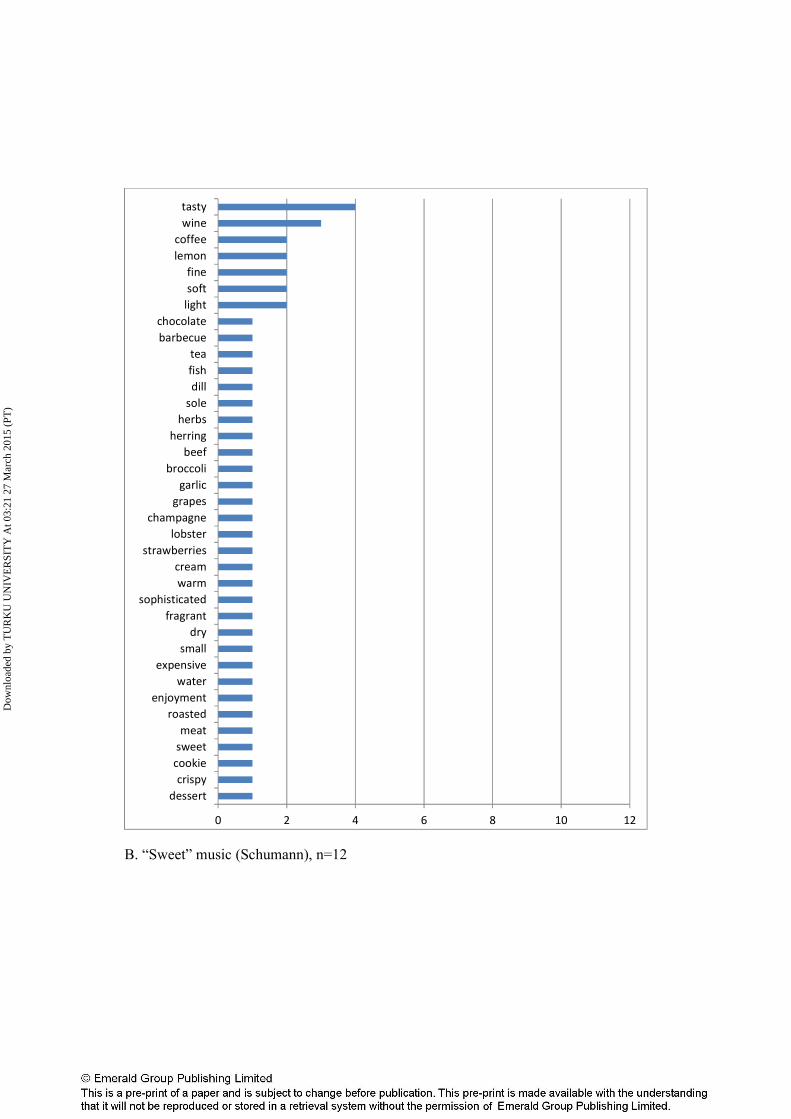
B. “Sweet” music (Schumann), n=12
0 2 4 6 8 10 12
dessert
crispy
cookie
sweet
meat
roasted
enjoyment
water
expensive
small
dry
fragrant
sophisticated
warm
cream
strawberries
lobster
champagne
grapes
garlic
broccoli
beef
herring
herbs
sole
dill
fish
tea
barbecue
chocolate
light
soft
fine
lemon
coffee
wine
tasty
Dow
nloa
ded
by T
UR
KU
UN
IVE
RSI
TY
At 0
3:21
27
Mar
ch 2
015
(PT
)

C. “Sour” music (Ferneyhough), n=20
0 2 4 6 8 10 12
cool
rough
hard
solid
spicy
organic
warm
sharp
honey
chicken
candies
strawberry
spicy
puree
cold
seasoned
pineapple
lemon
berries
soup
sour
strong
light
fresh
pungent
fruits
Dow
nloa
ded
by T
UR
KU
UN
IVE
RSI
TY
At 0
3:21
27
Mar
ch 2
015
(PT
)
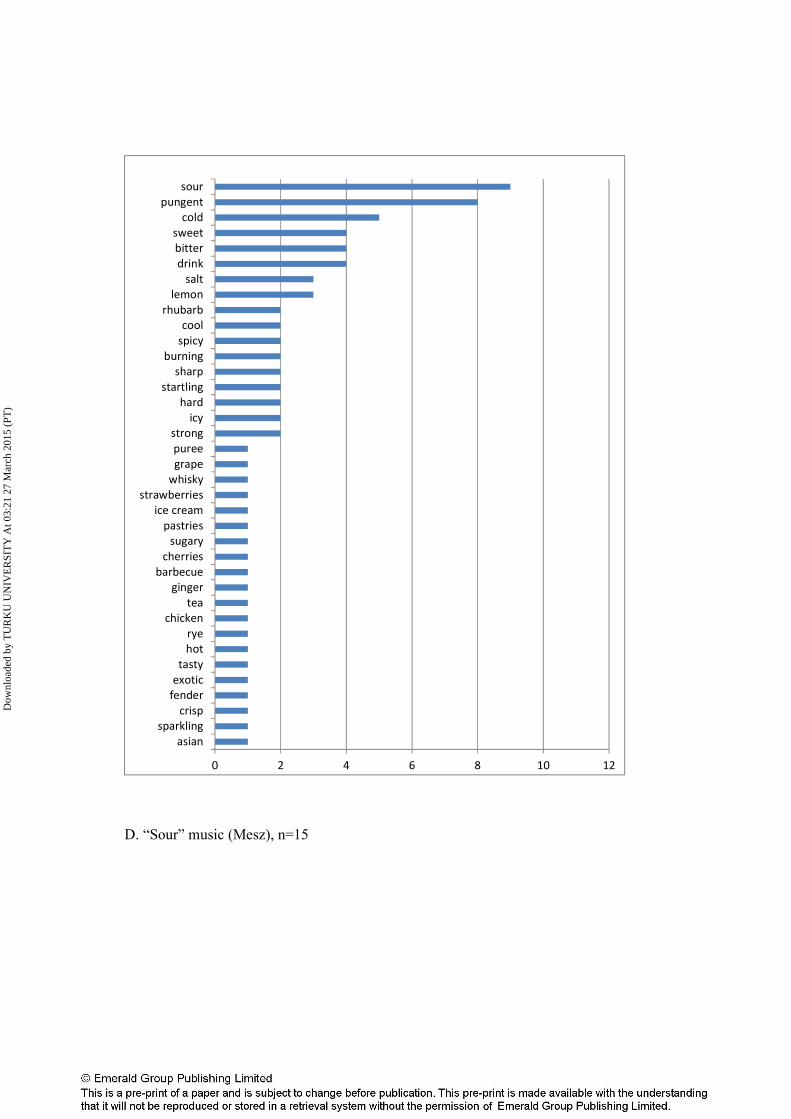
D. “Sour” music (Mesz), n=15
0 2 4 6 8 10 12
asian
sparkling
crisp
fender
exotic
tasty
hot
rye
chicken
tea
ginger
barbecue
cherries
sugary
pastries
ice cream
strawberries
whisky
grape
puree
strong
icy
hard
startling
sharp
burning
spicy
cool
rhubarb
lemon
salt
drink
bitter
sweet
cold
pungent
sour
Dow
nloa
ded
by T
UR
KU
UN
IVE
RSI
TY
At 0
3:21
27
Mar
ch 2
015
(PT
)


