Embed Size (px)
Citation preview
Surface Science 192 (1987) 131-162North-Holland, Amsterdam
131
SURFACE VIBRATIONS ON Ni(110): THE ROLE OF SURFACE STRESS
S. LEHWALD, F. WOLF, H. IBACHInstitut fur Grenzfliichenforschung und Vakuumphysik, Kernjorschungsanlage Julich, Postfach 1913,D-5170 Jidich, Fed. Rep. of Germany
Burl M. HALL and D.L. MILLSUniversity of California, Department oj Physics, Irvine, CA 92717, USA
Received 6 April 1987; accepted for publication 22 July 1987
Using inelastic electron scattering we have determined the dispersion of surface phonons onthe clean Ni(llO) surface along the [001] (ry), the [110] (I'X), and the [Ill] (rS) direction. Alattice dynamical calculation which takes surface relaxation into account shows good agreementwith the experimental results for the resonance mode near r and for a longitudinal resonancealong the [110] direction when the interlayer surface force constants are scaled in relation to theexperimentally determined lattice relaxation. Substantial deviations from the experimental datafor the vertically polarized surfaces modes near X and Y remain however. They are attributed tothe presence of (an anisotropic) surface stress on the Ni(llO) surface and good overall agreementwith the experimental results is found when a force field taking surface stress into account is used.With the help of the eigenvectors from the lattice dynamical model and using a fully dynamicaltheory for the inelastic electron scattering we have also calculated the spectra for the Y and Xpoint and find good agreement with the experimental results at different impact energies. It isshown that bulk modes can contribute significantly to tbe spectrum even when one has noparticular enhancement of the amplitude near the surface.
1. Introduction
The dispersion of surface phonons of clean and adsorbate covered surfacesprovides a rich source of information on structural and dynamical aspects ofsurfaces. Experimental results and their comparison to theory has shown thatthe dispersion of surface phonons is frequently quite different from what is tobe expected from a simple termination of the bulk structure.
The term" surface phonon anomaly" may be used to describe such deviations. Despite considerable experimental and theoretical research in the lastyears, the physical nature of these surface phonon anomalies is not completelyunderstood and may depend on the material and surface involved. A systematic study of the (Ill) faces of noble metals, e.g., refs. [1-3] suggests thatthe redistribution of charge near the surface reduces the effective force
0039-6028/87/$03.50 © Elsevier Science Publishers B.V.(North-Holland Physics Publishing Division)

132 S. Lehwald et al. / Surface vibrations on Ni( 110)
constant between the surface atoms within the first layer. This causes asignificant reduction in the frequency of longitudinal surface modes near thezone boundary. For c(2 X 2) overlayers of oxygen on Ni(100), it was suggestedthat the observed anomalously low frequency of the Rayleigh wave resultsfrom an adsorbate induced expansive surface stress [4,5]. The presence of sucha surface stress could also explain the p4g reconstruction observed withc(2 X 2) overlayers of carbon and nitrogen on the same surface [6,7]. Thismodel recently gained support from total energy calculations on small Niclusters [8], although a first principle calculation of the adsorbate inducedsurface stress on extended surfaces is not yet available [9].
Another phonon anomaly was observed on the clean (100) surfaces ofcopper and nickel. There, one finds the frequency of the (vertically polarized)Rayleigh wave near the zone boundary to be higher than expected from bulkproperties. In earlier work [10] this was attributed to an increased forceconstant between the first and second layer. More recently it was shown thatthe presence of a tensile surface stress would also shift the frequency of theRayleigh wave upwards near the zone boundary. A surface stress of 1.9 X 10³
and 1.56 X 10³ dynycm would explain the observed shifts on Ni and Cu,respectively [11]. Thus, one cannot distinguish between the two alternativemodels on the basis of phonon dispersion data for this surface.
In this regard, studies of the (110) face offer unique opportunities: Asknown for many years [12] the (110) face of fcc materials supports a richspectrum of surface phonons which, at the high symmetry points of the surfaceBrillouin zone, are strictly perpendicular or parallel polarized with respect tothe surface. This permits a clear distinction between the effect of surface stressand force constants changes near the surface, as we shall see. Moreover the(1l0) surface is an interesting object to study because of its inherent instabilityto various types of reconstruction [13-17] and its multilayer relaxation involving a contraction of the first interlayer spacing, and expansion of the second,and possibly further, though smaller changes in layers below. The interlayerrelaxations are also substantial, in contrast to the clean (100) and (111)surfaces discussed earlier.
In our study of the surface phonon spectrum we employ electron energyloss spectroscopy. Because of the multiple elastic scattering processes involved,even in the one phonon scattering matrix elements, the cross section for aparticular mode varies rapidly with scattering parameters such as the impactenergy [18-21]. Thus different parts of the phonon spectrum are emphasizedat different energies or geometrical scattering conditions. This permits one toseparate modes even when they differ by less than 2 meV in energy, despitethe resolution actually realized in the experiments being limited to 4-5 meV.In addition, the assignment of modes is supported by calculating the spectrausing a lattice dynamical model for eigenvectors, and the multiple scatteringtheory of Li et al. [19]. The comparison of experimental and theoretical spectra
S. Lehwald et al. / Surface vibrations on Nit110) 133
is useful for dinstinguishing between peaks arising from genuine surfacemodes and clear surface resonances or features arising from a bunching ofbulk modes in a particular frequency regime. As we shall see, bulk phononsmake substantial contributions to the loss spectra, and the theory thus mustincorporate both bulk and surface phonon contributions to the cross section.Also, the calculations allow one to make clear identifications of the origin ofthe structures in the loss spectra, since theoretical energy loss spectra may becompared directly with the various lattice dynamical spectral densities, bothcalculated from the same picture of the surface lattice dynamics.
The paper is organized as follows. In the following section we brieflydescribe features of a recently developed, improved electron spectrometer, theexperimental procedures, and we present several experimental spectra. Thethird section describes the lattice dynamical model and the effect of surfacestress on the phonon spectra in particular. The results of the lattice dynamicalmodel are compared with the experimental results in section 4. Finally wecompare theoretically generated spectra with experimental spectra; these willpermit further distinction between surface and bulk contributions to thespectra, as remarked earlier and will also allow further refinement of the forceconstant model. In section 6, we present a brief summary of our principalconclusions.
2. Experimental
Phonon dispersion measurements require electron energy loss spectrometersof high performance. They should allow for impact energies to vary between afew eV and several hundred eV, with no loss of transmission. It is alsodesirable to keep the momentum resolution nearly constant regardless ofimpact energy. The q-space accepted by the analyzer should not be too smallin order to have acceptable count rates. This task requires lens systemstransporting the electron beam from the monochromator to the sample andfrom the sample to the analyzer without a major loss in transmission. Usingtrajectory calculations a three element lens was adapted to the specificrequirements of the cylindrical energy dispersive elements of our spectrometer.The lens was corrected for angular aberrations by having the angular aberration coefficients in the expansion
A.X(a) = /;2)a 2+ /a(4)a4+ /;6)a 6... (1)
of alternating sign. Here A.X is the deviation of the electron trajectory at thefirst order image position and a the starting angle with respect to the opticalaxis. Similarly the essential astigmatism pertinent to the slit geometry wascorrected. The overall transmission of the lens defined as the percentage ofelectrons starting from the exit slit of the monochromator which enter the
134 S. Lehwald et al. / Surface vibrations on Ni( 110)
entrance slit of the analyzer (after acceleration and deceleration by a factor upto - 500) is 70%. This high transmission is illustrated by the magnitude of themonochromatic current as measured at the detector with the beam directedtowards the analyzer, without scattering from the sample, which is - 3 X 10- 10
A for 5 meV resolution. A disadvantage of the highly corrected lenses used inthe spectrometer is a large chromatic error, which however is not relevant aslong as multichannel detection is not attempted. The momentum space samI?led by the spectrometer is approximately ~qll = =t:0.016 A-1, I1q1. = ±0.Oo68A-I at 100 eV impact energy and I1qll = ±0.01l A -1 and ~q 1. = ±O.036 A+
at 20 eV where the symbols II and .1 refer to the orientation with respect tothe scattering plane. The above values are calculated using our trajectoryprograms and the transmission properties of the electron analyzers. Within afactor of two they are consistent with theoretical calculations of the absolutecross sections for phonon scattering [21] and experimentally observed countrates [22].
The experiments were performed on Ni(llO) crystals surfaces which werecut and polished to within 0.5 0 of the desired orientation. The crystal wasmounted on a manipulator which allowed for rotation of the polar andazimuthal angle. The principle impurities, oxygen in the beginning, carbon,and sulfur were removed by repeated cycles (50-100) of neon bombardmentand annealing to 1000-1300 K. The residual level of impurities was.:::;; 0.1%,.:::;; 0.5% and .:::;; 0.5% for sulfur, carbon, and oxygen, respectively. Trace contaminants adsorbed from the gas phase (H and CO) were flashed off beforeeach series of measurements. The pressure inside the vacuum chamber was- 10-9 Pa, Samples prepared in this way displayed a sharp (1 x I) LEEDpattern and a small elastic diffuse intensity in the electron energy loss spectra.
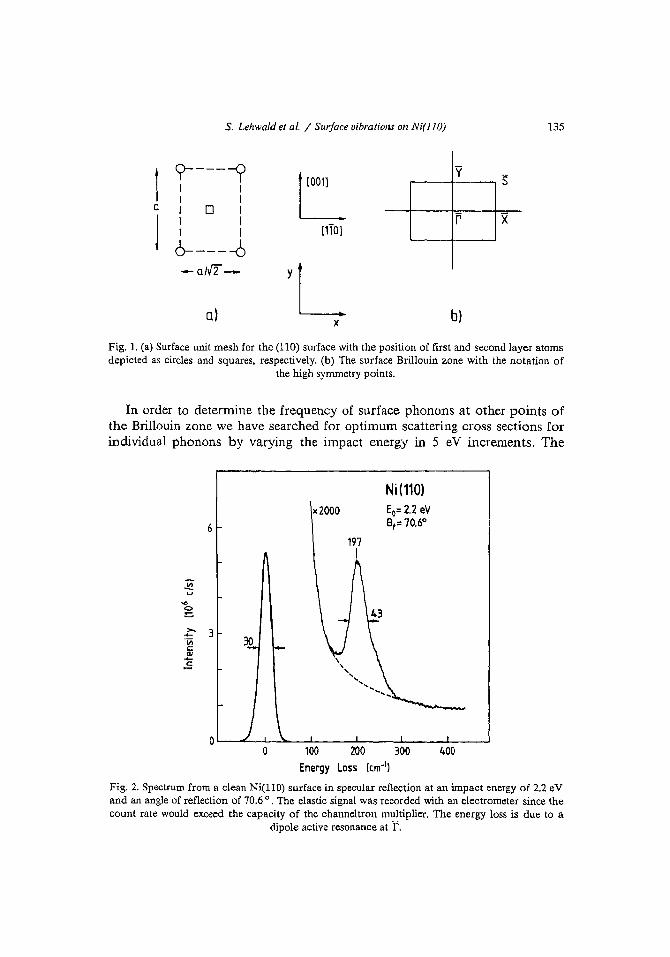
Phonon spectra were measured along the [110], [001], and [111] directionwhich correspond to the rx, ry, and rs direction of the surface Brillouinzone, respectively (fig. 1). We begin our presentation of the experimentalresults with the spectrum observed in specular direction at low impact energies(fig. 2). The characteristic loss at 197 cm- 1 is due to a dipole active surfaceresonance at the r point of the surface Brillouin zone. This particular modehas been observed before on the Ni(llO) and also the Cu(llO) surface [23,24]and has been discussed at some length with the help of a lattice dynamicalmodel [24]. We will see this feature to appear also in our lattice dynamicalcalculation and we will discuss further details such as frequency and linewidththere. Here, we merely note the count rate of 2.5 X 10³ cis in the loss peak.This count rate is more than two orders of magnitude higher than in the workof Stroscio et al. [25] which shows the performance of the present spectrometerand its lens system in particular. The elastically reflected beam was too intenseto be processed by the channeltron multiplier. The elastic signal of 8.5 X 10⁻¹³
A (equivalent to - 5 X 10⁶ cis) in fig 2 is therefore the recorder trace of anelectrometer.
S. Lehwald et al. I Surface oibrations on Ni( 110) 135
tC(----y
LI II Ia I 0 I
1
I II I ["0]
0------6--alf[- yL
a) x
y s
r x
b)
Fig. 1. (a) Surface unit mesh for the (110) surface with the position of first and second layer atomsdepicted as circles and squares. respectively. (b) The surface Brillouin zone with the notation of
the high symmetry points.
In order to determine the frequency of surface phonons at other points ofthe Brillouin zone we have searched for optimum scattering cross sections forindividual phonons by varying the impact energy in 5 eV increments. The
6
)(2000
Ni (110)Eo=2.2 eV8,=70.6°
197I
400o
~ 3'iIic:QI.....
.5
100 200 300Energy Loss (em-')
Fig. 2. Spectrum from a clean Ni(llO) surface in specular reflection at an impact energy of 2.2 eVand an angle of reflection of 70.6 0
• The elastic signal was recorded with an electrometer since thecount rate would exceed the capacity of the channeltron multiplier. The energy loss is due to a
dipole active resonance at r.
136 S. Lehwald et al. / Surface vibrations on N i(110)
Eo=140oV
Eo=145~
Eo=130tV
Eo= 135 tV
Eo=160 eV
£o=155.V
Eo=150eV
Eo= 170 eV
Eo=165 tV
Ni(1101 Y-pointSf::56.30
~~.......•...•..••..•••.• •.•.•...•... .~~ .~~~,: . .~~~
. . " ', "
~2Jl2:
o
5
?c::::Jcu
g
-200 0 200 400Energy Loss (cm'')
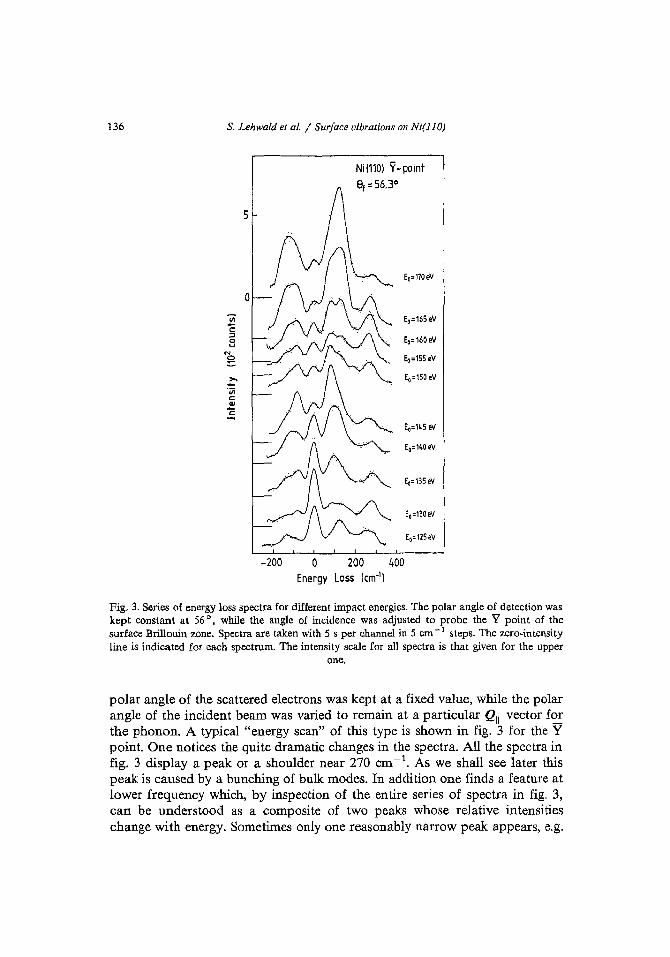
Fig. 3. Series of energy loss spectra for different impact energies. The polar angle of detection waskept constant at 560
• while the angle of incidence was adjusted to probe the Y point of thesurface Brillouin zone. Spectra are taken with 5 s per channel in 5 ern -1 steps. The zero-intensityline is indicated for each spectrum. The intensity scale for all spectra is that given for the upper
one.
polar angle of the scattered electrons was kept at a fixed value, while the polarangle of the incident beam was varied to remain at a particular Qu vector f~the phonon. A typical " energy scan" of this type is shown in fig. 3 for the Ypoint. One notices the quite dramatic changes in the spectra. All the spectra infig. 3 display a peak or a shoulder near 270 em -1. As we shall see later thispeak is caused by a bunching of bulk modes. In addition One finds a feature atlower frequency which, by inspection of the entire series of spectra in fig. 3,can be understood as a composite of two peaks whose relative intensitieschange with energy. Sometimes only one reasonably narrow peak appears, e.g.
S. Lehwald et at. / Stirface vibrations on Ni(1J0) 137
:Ec:5u
N<:)
:c
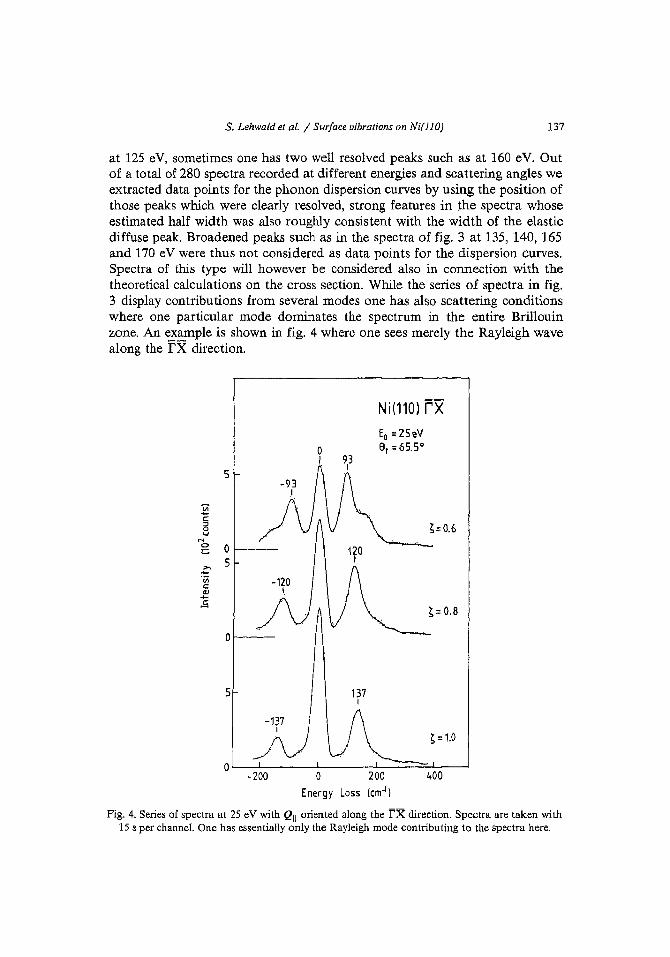
at 125 eV, sometimes one has two well resolved peaks such as at 160 eV. Outof a total of 280 spectra recorded at different energies and scattering angles weextracted data points for the phonon dispersion curves by using the position ofthose peaks which were clearly resolved, strong features in the spectra whoseestimated half width was also roughly consistent with the width of the elasticdiffuse peak. Broadened peaks such as in the spectra of fig. 3 at 135, 140, 165and 170 eV were thus not considered as data points for the dispersion curves.Spectra of this type will however be considered also in connection with thetheoretical calculations on the cross section. While the series of spectra in fig.3 display contributions from several modes one has also scattering conditionswhere one particular mode dominates the spectrum in the entire Brillouinzone. An example is shown in fig. 4 where one sees merely the Rayleigh wavealong the rx direction.
Nil110l FxEo=25eV
o 8, =65.5°I
5
01--->. 5....'jjjcCIJ....
.E
Of----
5 137I
S=1.0
0-200 0 200 400
Energy Loss Icnr')
Fig. 4. Series of spectra at 25 eV with QII oriented along the rx direction. Spectra are taken with15 s per channel. One has essentially only the Rayleigh mode contributing to the spectra here.
138 S. Lehwald et af. / Surface vibrations on Ni(llO)
3. Surface stress and lattice dynamics
When a surface is created the electron charge near the surface rearranges.Simple arguments based on a nearly free electron model or a model involvinglocalized orbitals suggests that charge is transferred from above the surfaceplane to add to the charge density between the first and second layer, and alsobetween the surface atoms within the first layer . The first part leads to acontraction of the first interlayer spacing pertinent to many materials. Theincreased charge density between the surface atoms on the other hand produces a tensile surface stress. Such surface stress would be revealed, forexample, when the crystal has the shape of a thin bar with two differentsurfaces via a bending of the bar [26]. Strong enough surface stress can alsocause a reconstruction of the surface, as was remarked already by Herring [27]many years ago, and recently its role has been demonstrated in the analysis ofthe p4g reconstruction of Ni(lOO) [28]. Furthermore, one may see easily thatsurface stress affects the frequency of the surface phonons which possesseigenvectors with components transverse to the direction of the surface stress.Since surface stress is a macroscopic quantity there is no unique way ofintroducing microscopic force constants which take the surface stress intoaccount. As we shall see however, a rather simple model with nearest neighborcentral forces in the bulk. and up to next nearest neighbor central forces withinthe surface layer suffices for an adequate description of the dispersion curves,including the influence of surface stress.
The lattice dynamics of the Ni(llO) surface is treated here in the harmonicapproximation, using phenomenological pair potentials and central forces. Thecoupling constants iP",p(ij) are given by [29]:
iP",p(ij) = 13ij L Ka /3 (ij / ) - (l-13 jJKa/3 (ij ),j' ,pi
with the effective force constants K"'/3(ij)
(2)
(3)
Here et>; j and tP;~ are the first and second derivatives of the nearest neighborcentral potential connecting atom i and i. r j is the vector pointing towardsatom i, and n",(ij) is the ath Cartesian component of the unit vector pointingfrom atom i to atom j .
The manner in which surface stress enters such a model is perhaps visualized best by considering a simpler structure discussed earlier [10], the fcccrystal with (100) surface, and nearest neighbor central potentials coupling theatoms. The separation between nearest neighbor atoms in the bulk thencoincides with the minimum in the pair potential, so cf>;j vanishes for all bulk
S. Lehwald et al. / Surface vibrations on Ni(110) 139
atom pairs. If the pair potential in the surface is identical to that in the bulk,then c/>;j vanishes for all atom pairs, including those in or near the surface.
The charge transfer effects discussed earlier necessarily modify the pairpotential between atoms within the surface layer, and between those in thesurface and first interior layer. Thus, <t>;j is nonzero, for a pair of nearestneighbors within the surface layer; epitaxy between the outermost and interiorlayers forces the surface nearest neighbor separation to equal that in the bulk,but the surface pair separation no longer coincides with the minimum in thepair potential.
Since <t>;j is nonzero for the surface atom pair (if), atom i feels a force fromatom j, directed along the bond from i to j. If «,> 0, the force wishes toshorten the bond, and it wishes to expand the bond if <t>;j < O. There is no netforce on atom i, of course, because of the symmetric arrangement of itsnearest neighbours. Consider a large square which is macroscopic in size, andcontains a large number of surface atoms. Let the sides of the square bealigned with the [all] and [011] directions, with sides that pass through themidpoints of bonds between nearest neighbor surface atoms. Now cut allbonds which intersect the sides of the square. If <t>;j < 0, the square will expandif no forces are applied to its edges, and it will shrink if <t>;j> o. A force perunit length Iic/>;/ao must be applied to the edges of the square, with theappropriate sign, to maintain the equilibrium separation between the atoms,after the bonds are cut. Here a a is the lattice parameter of the fcc crystal.
Thus, charge rearrangement induces surfaces stress by modifying he pairpotential so that for pairs of surface atoms c/>;j is nonzero. Similar stressesbetween atoms in the first and second layer are relieved by surface relaxation,but this is not possible within the surface layer itself, for the unreconstructedsurface. The simple nearest neighbor model allows a particularly simplerelationship between the surface stress and the model parameters to beestablished; the relationship is more complex in more sophisticated latticedynamical models. Of course, in metals volume dependent contributions to theenergy, not contained in pair potential models, also enter the discussionimportantly. In the present paper, an appropriate modification of the simplenearest neighbor pair potential picture will be applied to the (110) surface. Thecondition that the crystal be stress free in the bulk then requires <t>'b to be zero.N ear the surface the force constants may change and, because of the presenceof surface stress, the first derivative of the potential may be nonzero. As wehave mentioned, one has different possibilities to introduce first derivatives ofthe potential between surface atoms. We choose one which is particularlysimple, yet probably also the most reasonable way of modelling the chargedistribution near the surface by taking <t>;lx, the first derivative of the pairpotential between nearest neighbor atoms within the surface layer, to benonzero (fig. 1). The symmetry of the surface is such that this model automatically fulfills the equilibrium condition that the net force on each atom must be
140 S. Lehwald et al. / Surface uibrations on Ni(lfO)
zero. This cj>~IX gives rise to a surface stress along the [lIoJ direction
"I"(lIO] = ep~lxja, (4)
with a the lattice constant (fig. 1), while the surface stress along [001] wouldremain zero. Intuitive arguments, as well as first principle calculations [30],indicate that the surface stress is not as anisotropic as this. Also the tendencyof electronic charge to smooth at the surface will accumulate charge densitybetween the [110] rows of surface atoms. It is therefore not unreasonable totake a pair potential between the second nearest neighbor surface atoms intoaccount while still neglecting second nearest neighbor coupling in the bulk. Wetherefore have allowed also for a nonzero ep~IY between the second nearestsurface atoms along the y direction which represents a surface stress of
'7'(001] = ep;lyV2 ja (5)
along the [001] direction. Once a second nearest neighbor coupling in thesurface layer is introduced with the first derivative one might also allow for asecond derivative there. We shall discuss this possibility and the physicsconnected with that in section 4.
It is well known that (110) surfaces display a particular large surfacerelaxation. For Ni(110) various measurements using different techniques seemto have converged to a - 9% contraction and a - 3.5% expansion of the firstand second interlayer spacing, respectively [31]. We have used these distancesin our model. Further relaxation in deeper layers is small and not importantfor the lattice dynamics. In order to be consistent with the distances betweenatoms near the surface being different from the bulk one also should allow theforce constants to be different. For a wide class of molecules force constantsscale with the distance [32-34]. We use the scaling
(6)
with rij being the distance between atom i and atom j and rb the nearestneighbor distance in the bulle The bulk force constant <jJ'b = 3.79 X 10⁴ dynjcmis matched to the maximum bulk frequency v = 295 em- 1. The parameter 0:
should be typically between 5 and 10. We tried also other forms of the scaling.The differences are however marginal.
Before turning to a comparison of experimental results to the results of thislattice dynamical model it is instructive to consider the eigenvectors of modesat the high symmetry points T, X, Y, S. For all four points, the modes belongto a representation of the point group C;y, This point group has one-dimensional representations only, and one therefore has non-degenerate modes only.We choose the two fold axis to pass through the position of the one surfaceatom per unit cell. The eigenmodes then belong to the AI ' BI or B2 representation and the displacement vectors are thus either polarized parallel to the C2
axis (AI representation), perpendicular to the C2 axis and the ax mirror plane
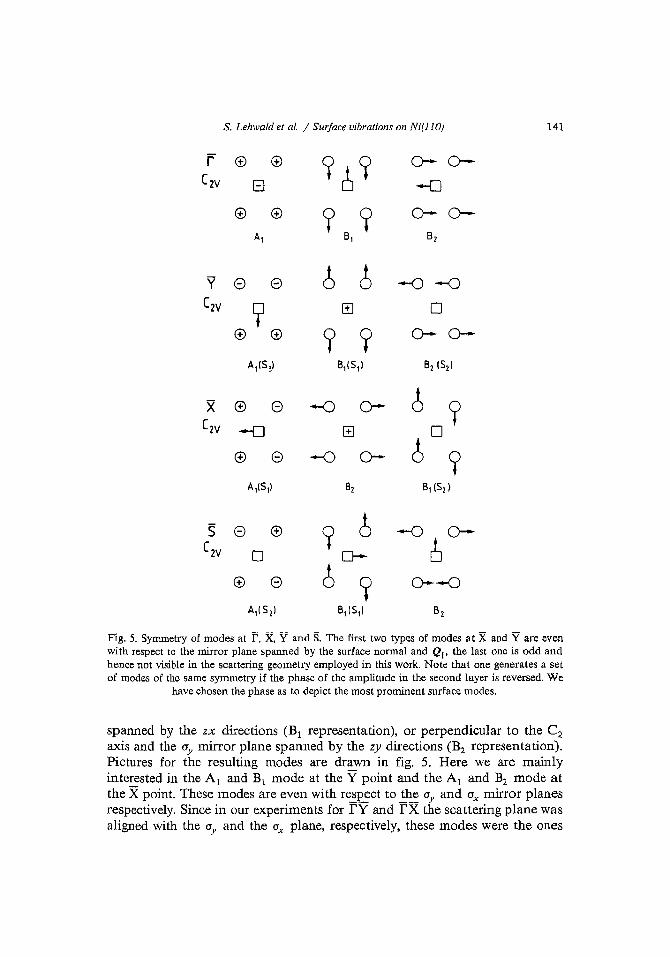
S. Lehwald et al. / Surface vibrations on Nil 110) 141
F ® @
C2V EJ
8 8
A,(S,)
6 6
9 76,(S,)
-0 0-
-0 0-
0- 0
-0
0- 0-
-0 -0
o0- 0-
8 eo
® 8
96
0-
Fig. 5. Syrrunetry of modes at r, X, Y and S. The first two types of modes at X and Yare evenwith respect to the mirror plane spanned by the surface normal and Qu' the last one is odd andhence not visible in the scattering geometry employed in this work. Note that one generates a setof modes of the same symmetry if the phase of the amplitude in the second layer is reversed. We
have chosen the phase as to depict the most prominent surface modes.
spanned by the zx directions (B1 representation), or perpendicular to the C2axis and the <1y mirror plane spanned by the zy directions (B2 representation).Pictures for the resulting modes are drawn in fig. 5. Here we are mainlyinterested in the Al and BI mode at the Ypoint and the Al and B2 mode atthe X point. These modes are even with re~~ct to .Q~ ay and <1x mirror planesrespectively. Since in our experiments for I'Y and rx the scattering plane wasaligned with the <1y and the ax plane, respectively, these modes were the ones
142 S. Lehwald et al. / Surface vibrations on Ni( 110)
observable, while the remaining two odd modes cannot be detected (unless thescattering plane is canted) [29]. With the wavevector along rs the scatteringplane is no longer mirror plane of the crystal and all three modes could beobserved in principle.
It is instructive to consider the effect of </>; Lx and </>; 1y representing thesurface stress in the [1'10] and (001) direction, respectively, on the frequency ofthe modes. Eqs. (2) and (3) then tell us that only those modes are affected bycj>;lx or by </>;1)' in which the motion changes the bond length in second orderwith the displacements. Thus the Aj-type modes at Yare affected by </>;1 v' notby cj>'nx. The Aj-type modes at X are affected by </>;Ix' not by CP;ly' The "81 andB2 modes at Y and X respectively are not affected by either stress parameter.At S, on the other hand, the Al mode is affected by both </>;1 v and </>;lx, the BI
mode by cp'Ux' not by </>;lY' and the B2 mode by CP;ly, not by'</>;Ix' None of themodes at r are affected by the surface stress. This pattern is due to theparticular symmetry properties of the (110) surface. In combination with theexistence of a dipole active surface mode at r it makes the (110) surfaceunique for studies of the effect of surface stress on the phonon spectrum whichwas our prime motivation to study the phonon dynamics of this surface.
4. Comparison of the experimental results and the lattice dynamical modelinvolving surface stress
We begin our comparison with the dipole spectrum in r as displayed in fig.2. Group theory instructs us that only the AI-type modes can contribute to thedipole spectrum. Thus the motion of atoms at r is such that the lattice layersremain rigid planes (see fig. 5) and the problem essentially reduces to aone-dimensional one, as remarked earlier [23,24]. The frequencies of modes atr therefore are exclusively affected by the interlayer force constants. Thus, ain eq. (6) is matched to the dipole spectrum at r. We have calculated thedipole spectrum by assuming that the dipole moment is proportional to thedifference between the amplitude of the first two layers. We disregard possiblecontributions from deeper layers. In view of the short screening length tbisseems to be a reasonable approach for a metal surface. From the experimentalspectrum of fig. 2 we have subtracted an estimated background (dashed line infig. 2) wbich is partly instrumental, partly due to the excitation of electronhole pairs [35,36]. The resulting peak (fig. 6a) is noticeably broader than theelastic peak which has a FWHM of 30 cm- I (3.7 meV). The spectrum alsodisplays a tail on the high energy side. In fig. 6b we present the calculatedspectrum when the exponent IX is set to zero, i.e. when all force constantsremain at the bulk value. The geometric relaxation was taken as determinedexperimentally. The calculated spectrum was convoluted with a Gaussian of aFWHM of 30 em -1 in order to simulate the resolution of the experiment. In
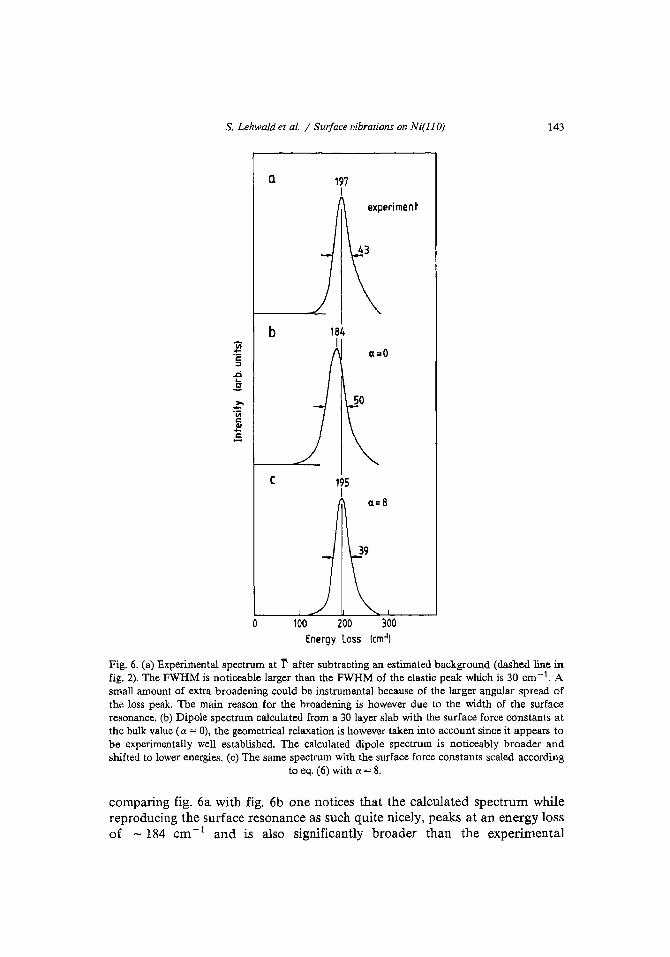
S. Lehwald et al. I Surface vibrations on Ni(llO) 143
a 197I
experiment
b:E'c;:l
.0
.E>.-'iiic:
.2!
.5
C 195I
a=8
o 100 200 300Energy loss (cm~)
Fig. 6. (a) Experimental spectrum at r after subtracting an estimated background (dashed line infig. 2). The FWHM is noticeable larger than the FWHM of the elastic peak which is 30 em-I. Asmall amount of extra broadening could be instrumental because of the larger angular spread ofthe loss peak. The main reason for the broadening is however due to the width of the surfaceresonance. (b) Dipole spectrum calculated from a 30 layer slab with the surface force constants atthe bulk value (IX= 0), the geometrical relaxation is however taken into account since it appears tobe experimentally well established. The calculated dipole spectrum is noticeably broader andshifted to lower energies. (c) The same spectrum with the surface force constants scaled according
to eq. (6) with IX = 8.
comparing fig. 6a with fig. 6b one notices that the calculated spectrum whilereproducing the surface resonance as such quite nicely, peaks at an energy lossof -184 cm- 1 and is also significantly broader than the experimental
144 S. Lehwald et al. / Surface vibrations on Ni(lID)
Table 1Interlayer force constants between surface atoms resulting from scaling of the force constantsaccording to <t>:j = <t>J~(rb/ri)a with a=8 and a surface relaxation of tld12 = -9%, tld2J = +3.5%
~M ~M ~M ~M
1.192 1.249 0.931 0.870
spectrum. We have then modified the exponent a and find the position of thecalculated spectrum to shift upwards with increasing a while the widthreduces. Good agreement with the experiment is obtained with a = 8 (fig. 6c).Note that also the high energy tail of the curve is reproduced. The remainingdifferences are rather subtle and cannot necessarily be attributed to thetheoretical model. Because of the angular aberrations in the energy dispersingelements the instrumental response for a loss peak having a different angularspread than the elastic peak may be slightly different. For the calculations ofthe dispersion curves to follow we have therefore used (l' = 8 for the exponentin eq. (6), a number which is in keeping with the experience [32] frommolecular vibrations, as remarked before. The individual force constants arelisted in table 1. In concluding this part of the discussion we find the dipolespectrum to be quite sensitive to the force constants near the surface, a resultwhich differs from the conclusion of Stroscio et al. [23,24].
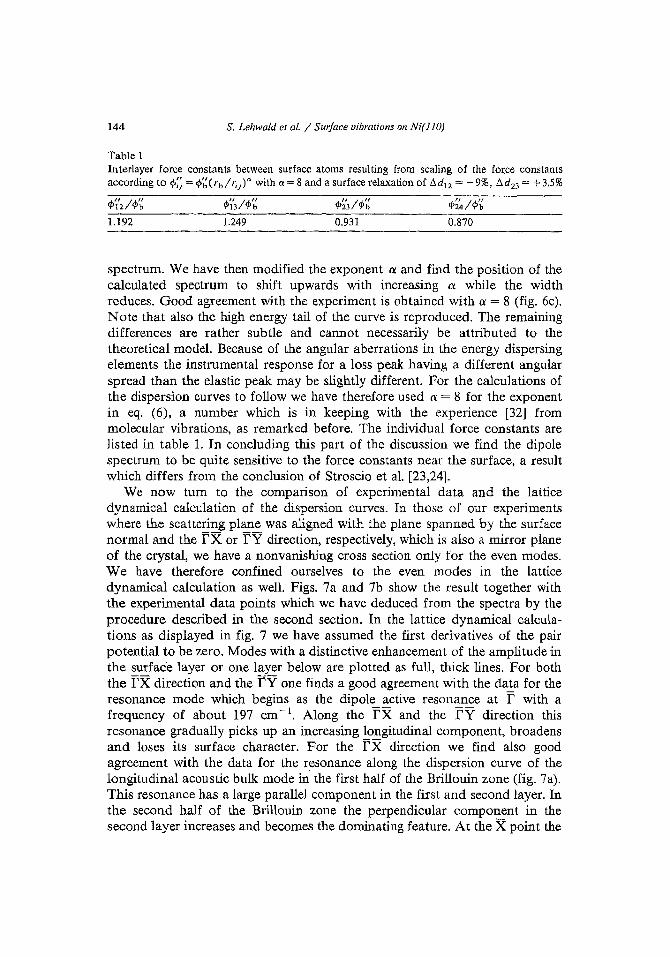
We now turn to the comparison of experimental data and the latticedynamical calculation of the dispersion curves. In those of our experimentswhere the scattering plane was aligned with the plane spanned by the surfacenormal and the rx or ry direction, respectively, which is also a mirror planeof the crystal, we have a nonvanishing cross section only for the even modes.We have therefore confined ourselves to the even modes in the latticedynamical calculation as well. Figs. 7a and 7b show the result together withthe experimental data points which we have deduced from the spectra by theprocedure described in the second section. In the lattice dynamical calculations as displayed in fig. 7 we have assumed the first derivatives of the pairpotential to be zero. Modes with a distinctive enhancement of the amplitude inthe surface layer or one layer below are plotted as full, thick lines. For boththe rxdirection and the ry one finds a good agreement with the data for theresonance mode which begins as the dipole active resonance at r with afrequency of about 197 em-I. Along the rx and the ry direction thisresonance gradually picks up an increasing longitudinal component, broadensand loses its surface character. For the rx direction we find also goodagreement with the data for the resonance along the dispersion curve of thelongitudinal acoustic bulk mode in the first half of the Brillouin zone (fig. 7a).This resonance has a large parallel component in the first and second layer. Inthe second half of the Brillouin zone the perpendicular component in thesecond layer increases and becomes the dominating feature. At the X point the
~
t-<s~i:t~l:l:-<,V,l:::s;.,l:l:;;!::.
[~.
s~-..8
THz
6>.0cIII::lITIDLu,
3
.9
o1Y
ZETR [1211211]121r
oZETR [110]
wr I I J J J J I I I '0
1
Xor
o
a Ib300 9 300
cm- 1 THz cm- 1
20 6L LIII >. III
-0 (J -0E c E:J III :JC :J t;:III 0- ID> III >1II L. It13: u, 3:
3
Fig. 7. (a) Dispersion curves of the even modes along fx calculated for a 30 layer slab with a = 8. The thin, dashed lines are bulk modes. Thick fulllines are modes with a significant enhancement of the amplitude near the surface in the first or second layer. They are genuine surface modes whenthey are outside the band of bulk modes. The figure also shows the Rayleigh wave in the acoustic limit as calculated from the elastic constants [37]
(dash-dotted line). The squares are the experimental data points. (b) Dispersion curves along ry with 0: = 8. I-'.l>V>
146 S. Lehwald et al. / Surface vibrations on Ni(110)
mode is parallel in the first layer with a moderate amplitude and perpendicularin the second with a large amplitude. According to our classification in fig. 5this mode is of the B2-type. In the classical work of Allen et al. [12] this modewas not described.
The lowest (acoustic) surface mode in fig. 7a is the Rayleigh wave labelledSl in ref. [12]. The data points are quite close to the calculated curve forsmaller QII yet deviate_signif~antly as the mode acquires more and moresurface character near X. At X the mode is perpendicularly polarized in thefirst layer, has a rather small parallel amplitude in the second and then amoderate perpendicular amplitude in the third layer and thus is of Alcharacter. Finally we have a surface mode in the gap (87 ) , again of the B2 typeat X, which has a large parallel amplitude in the first layer, a moderate verticalamplitude in the second, and again a larger parallel amplitude in the thirdlayer. Also for this mode the data points near X deviate from the calculatedcurve. The data points around 250 cm- 1 along the rx direction (fig. 7a)belong to surface resonances well apparent in the spectral densities. Theiramplitudes are largest in the second layer and predominantly parallel polarizedthere, however, the enhancement of the amplitude is less than for the modesmarked as full lines.
For the ry direction (fig. 7b) the lowest surface branch is the Rayleighwave which here is, however, polarized essentially parallel to the surface as oneapproaches the Y point. At Y the Rayleigh mode is of the B1 type (81 mode).Its frequency is low since nearest neighbor forces within the surface layer arenot strained in the motion. The next higher surface branch is of the Al type atY (S3 mode). It merges into the bulk band for f < 0.7. Some surface enhancement of the amplitude however remains even inside the bulk band also in thisdirection. The data points in fig. 7b for f = 0.5 and f = 0.6 in between thismode and the Rayleigh mode are caused by the fact, that both modes and theedge of the bulk. band contribute with different strength to the cross section atdifferent scattering parameters. The data points do not mark the frequency ofadditional surface modes. This will be demonstrated in the next section withfig. 17. Further on we have two gap modes. The one higher in frequency is ofthe BI type (85 mode). The amplitudes differ from the Rayleigh wave at Yby a180 0 phase shift in the amplitude of the second layer. The lower gap mode isof the Al type with the maximum amplitude in the second layer. In figs. 7aand 7b we have also plotted the Rayleigh mode in the acoustic limit ascalculated from the elastic constants [37]. One sees that the experimental datatrack this slope quite closely in both cases. The deviation from the latticedynamical curve in the acoustic limit is thus due to the inadequate descriptionof the acoustic branches in our nearest neighbor model. The discrepancy isparticularly large along the [001] direction. As one moves to the Y point theexperimental data lie below the calculated Rayleigh branch and above theperpendicularly polarized surface mode, respectively. Finally we note that the
S. Lehwald et al. / Surface vibrations on Ni( 110) 147
data points in the second half of the Brillouin zone near 270 em -1 seem to fallright within a band of bulk states with no significant surface character. As weshall see in the next section the bunching of bulk modes there indeed gives riseto a peak in the spectra when the cross section is taken into account.
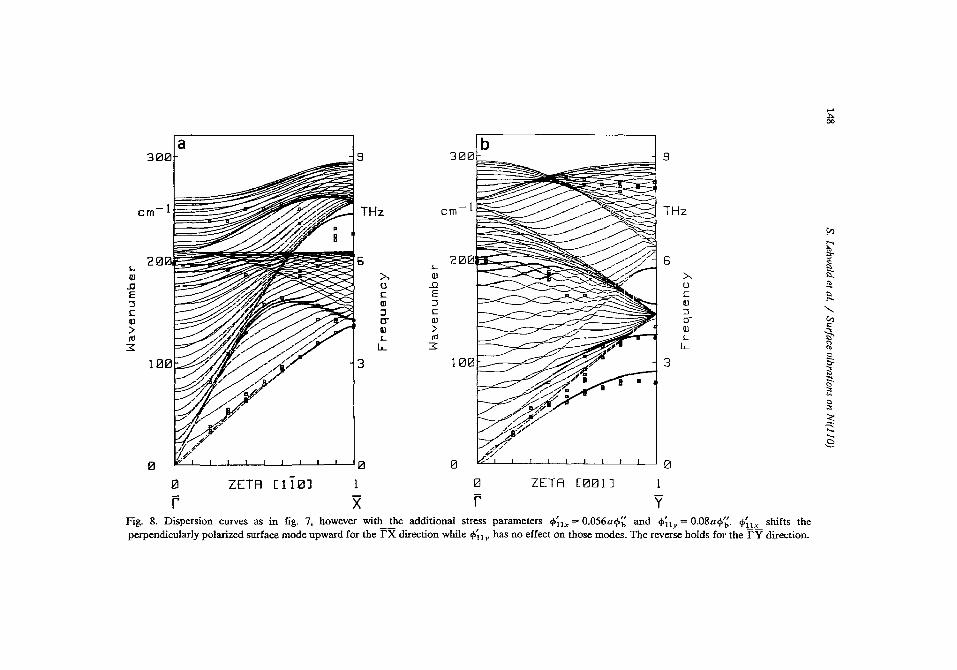
If we reconsider the observed deviations between the lattice dynamicalmodel and the data points for the surface modes at Xand yo in the context ofour discussion on the surface stress, one sees that one has the largestdeviations for the Aj-type surface modes, which are the ones affected by thepresence of surface stress. Fig. 5 shows that the Al modes, which areperpendicularly polarized in the first layer, could also be affected by changingthe interlayer force constants, as has been proposed earlier for the fcc (100)surface [10,11]. Enhancing the interlayer force constants would however adversely affect the match obtained for the dipole active mode observed at r asdescribed before. On the other hand surface stress in the first layer does notaffect the modes at r. Therefore the (110) surface unambiguously allows todemonstrate the existence and the influence of surface stress. This was notpossible on the (100) surface, because there exist no observable surface modesat r. Introducing a tensile surface stress along the [110] and the [001] directionshould bring experiment and theory closer. Fig. 8 shows the lattice dynamicalresult with CP'llx = 0.056dcp/~ and CP;ly = 0.08acp/~, respectively. These parameters correspond to tensile stress of
T[110J = 2.14 X 10³ dyn y cm, and T[OOl] = 4.2 X 10 3 dyn z'cm.
We see that now the theoretical curves track the data points quite closely,except for the 87 mode near X and for the Rayleigh wave along rv near Ywhich will be considered shortly. The magnitude of the surface stress requiredto achieve the match to the data appears to be reasonable. Needs [30] hasrecently calculated the surface stress for the (111) and (110) aluminumsurfaces using pseudo potentials. He finds surface stresses of T[110] = 2 X 10 3
dynycm and 'TlOOl) = 1.85 X 10³ dynycm, the first being in rather good agreement with our value, the latter being a factor of two lower. Surely, however,the values which emerge from our analysis are quite close to the results ofNeeds. The larger anisotropy suggested by our analysis for the Ni surfacecould be an artifact of our model analysis, may however also relate to the factthat the Ni(llO) surface may be indeed more anisotropic than the Al(llO)surface.
Now let us go back to the deviations between the data points and thecalculations still apparent in figs. 8a and b. Along rx (fig. 8a) there is still amismatch with the gap mode $7 near X. When we compare our cross sectioncalculations with the data, later in the paper, we shall see that there is strongevidence for the presence of 87, but additional refinement of the latticedynamical model beyond the picture explored so far is required to provide itwith the observed frequency. The 87 mode at X is of B2 type with its largest
,.....l>00
9b
300
cm- 1 THz cm - 1 THzy,t--s
I:) I:) ;;s, s, '"fIl >. III >- is::
..0 0 ..0 0 ~E C E c '",...:J OJ :J IIIC :J C :J <,fIl U" fIl 0- V1
'"> GJ > lU 9,ttl /... rll ~ '"3: I.J.... 3: I.J.... "'"c:
3 3 sl:l~.:::c.,
c:::
~'-'--8
I::) 0 I::)
0 ZETR [ 110] 1 0 ZETR [00 1 ]
F X r yFig. 8. Dispersion curves as in fig. 7, however with the additional stress parameters </>;lx ~ O.056a</>~ and </>;l y = O_08a</>~. </>; l x shifts theperpendicularly polarized surface mode upward for the rxdirection while </>;ly has no effect on those modes. The reverse holds for the rvdirection.
9 300~9cm- 1 THz cm- 1'%~:;::: TH2
f'l5 t-<s... L '":>-
QJ >, QJ >,"".Q 0 ..D 0 I::l
E c E r:: i5::J QJ :J QJ ~
C :l C :l I::l,...QJ rr' ill CJ
"-> QJ > OJIII L irJ L t.'>
:::x L... ~ L... S\I:l3 100 3 '"'"<::
5:-~c"'"'"'g~...
0 1((/ I I ( I I ! I I I 10 0Lt.-.....- J I J I J I - 2
0 ZETA [110] 1 0 ZETA [001 ]
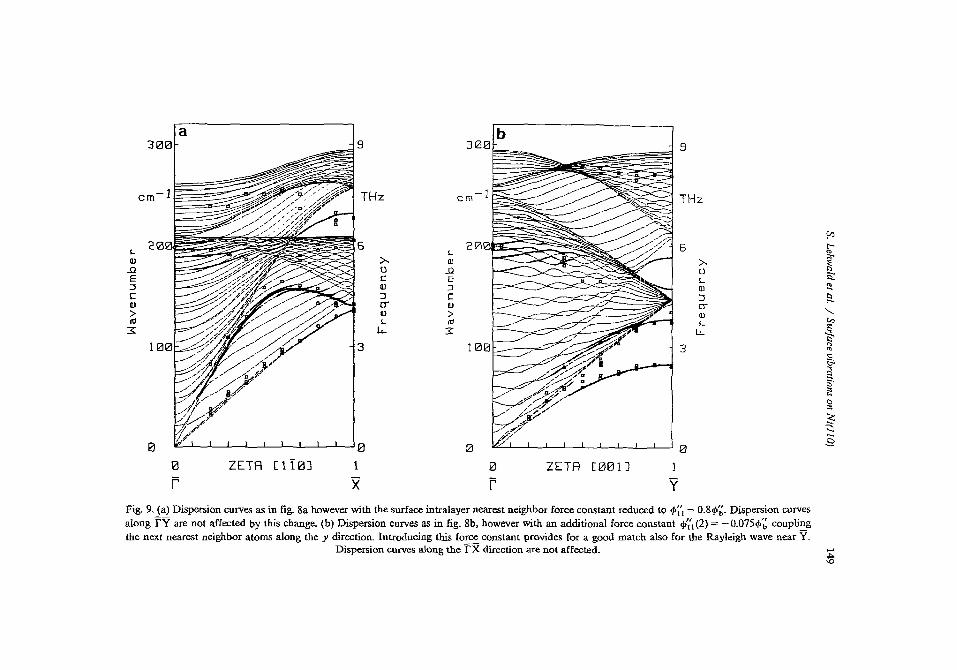
F X F YFig. 9. (a) Dispersion curves as in fig. 8a however with the surface intralayer nearest neighbor force constant reduced to 4>;'1 = O.8cj>~. Dispersion curvesalong fV are not affected by this change. (b) Dispersion CUIVes as in fig. 8b, however with an additional force constant <14') (2) = -O.075q,'~ couplingthe next nearest neighbor atoms along the y direction. Introducing this force constant provides for a good match also for the Rayleigh wave near Y.
Dispersion curves along the fx direction are not affected. .......j>.'0
150 S. Lehwald et al. / Surface vibrations on Ni(110)
amplitude parallel in the first layer. Inspection of fig. 5 tells us, that it isaffected most by ep~'l and that only the B2 modes along rx and rs are alsoaffected by ep;'l' while the modes at r and along ry are not affected.
In our lattice dynamical model the charge transfer between the atoms in[110] direction with unchanged distance leads to a tensile surface stress alongthe [110] direction. Thus in the picture of pair potentials the atoms are nowsitting on the right-hand side of the minimum position of the pair potentialcurve where ep;l > 0 and, for the typical shape of a potential curve, ep~l issmaller than in the minimum position. Taking ep;'l to be smaller than in thebulk is thus quite consistent with the sign of the surface stress. As shown laterin the paper, the cross section calculations at X suggest a reduction of ep~l by- 30%. Fig. 9a shows the dispersion curves for rx as in fig. 8a, but with ep~lchanged from ep~ to 0.8ep'~. The match for the gap mode S7 is now rathersatisfying. The lower lying B2 node at X at 142 cm- 1 is only slightly affectedat X; the fit becomes slightly worse than before at t = 0.5 and 0.6. The bestoverall fit is therefore with a 20% reduction of ep~l rather than 30%.
9
ZETR [111J,",--'--...L.-...l..---L.--'---'---l..-...L--l---J0
1
SeF
e
THz
L 6III >.
-0 oE C:J IIIC :JIII 0-> IIIttl L
3: u...3
Fig. 10. Dispersion curves for the modes along rs calculated for a 20 layer slab with a = 8. Thestress parameters, ep~'l' and ep~l (2) are the same as in fig. 9.
S. Lehwald et al. / Surface vibrations on Ni( 110) 151
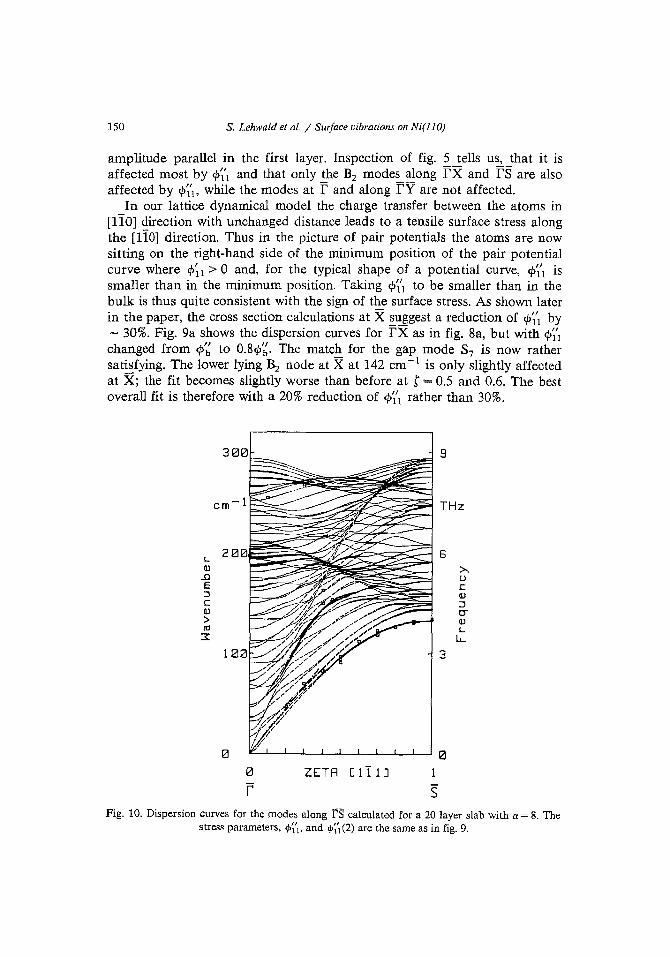
The remaining mismatch with the data along rV in fig. 8b is with theRayleigh wave near Y, which is of B1 type. As we have remarked earlier withthe presentation of the lattice dynamical model, the introduction of a stressalong the [001] direction via the first derivative of a potential between thesurface atoms along [001] is equivalent to a second nearest neighbor coupling.It would thus be in keeping with the model to assume a nonzero secondderivative of the pair potential. Inspection of fig. 5 tells us that only Br-typemodes at Y and S are affected by a second nearest neighbor coupling 4>;'1 (2).Better agreement with the data thus can be achieved by introducing a ep~l (2) ofabout - 0.075q>,~. A negative value of this derivative indicates a certainpropensity of the surface towards a pairing of the surface atoms along the[001] direction which is in keeping with the pairing row reconstruction modelwhich has been suggested for the surface with adsorbed hydrogen on it[15-17]. With this additional parameter the match between the lattice dynamical model and the experimental data is as perfect as can be expected (fig. 9b).As a final test to our lattice dynamical model we compare with the experimentalso for the rs direction (fig. 10). Since the direction of propagation of themodes no longer coincides with the direction of any bond all force constantsenter and the three modes at S (fig. 5) are affected by different combinationsof the stress parameters, 4>~1' and ep~1(2). The Rayleigh wave e.g. is affected byep'nx and ep~1(2) at S. Fig. 10 shows that one has indeed a perfect matchbetween experiment and theory for the Rayleigh wave along the rs direction.
With this we conclude our discussion of the role of surface stress in thelattice dynamics of the (110) nickel surface, and turn to the issue of inelasticcross sections for the various modes of the (110) surface. Analysis of the crosssection data will confirm our interpretation of the features discussed in thissection.
5. Energy variation of the energy loss cross section; theory and experiment
Recent experimental studies have demonstrated [21] that as the incidentbeam energy is varied, with final angle than altered so that the wave vectortransfer QII remains fixed in magnitude and direction, the excitation crosssection of various surface phonons can vary dramatically in magnitude. Thephysical origin of this very nonmonotonic energy variation is multiple scatteringof the electron off the substrate atoms; at the energies used here, which are inthe same range as employed in low energy electron diffraction studies ofsurface structure, the electron samples the outermost few atomic layers beforeit backscatters off the crystal. Comparison between calculated and measuredloss cross sections [21] has also shown that a multiple scattering description ofthe loss event [18-20] describes the data well.
152 S. Lehwald et al. / Surface vibrations on Ni( 110)
In this section, we compare the results of such multiple scattering descriptions of the loss spectrum, for the data reported in the present paper. Weconcentrate on the X and Y points of the two-dimensional Brillouin zone. Weuse the approach employed in a recent study of the energy variation of thevibrational excitation cross sections, for scattering from the Ni(100) surface[38]. We incorporate surface phonon contributions to the loss cross section,and in addition we include also the bulk phonons, since these modes excitevibrational motions not only in subsurface layers, but in the outermost atomiclayer as well. As a general rule, calculations of the mean-square displacementof surface atoms show that bulk phonons contribute as much as fifty percentto the mean-square vibrational amplitude. Our earlier theoretical study ofphonon losses on Ni(100) showed that distinct structure can be introducedinto the loss spectra by bulk phonons. Also, because of the finite resolutionemployed in the experiments, "surface phonon" loss features can be distortedin shape, with a consequent shift in peak position, by bulk phonons nearby infrequency necessarily sampled in the experiment.
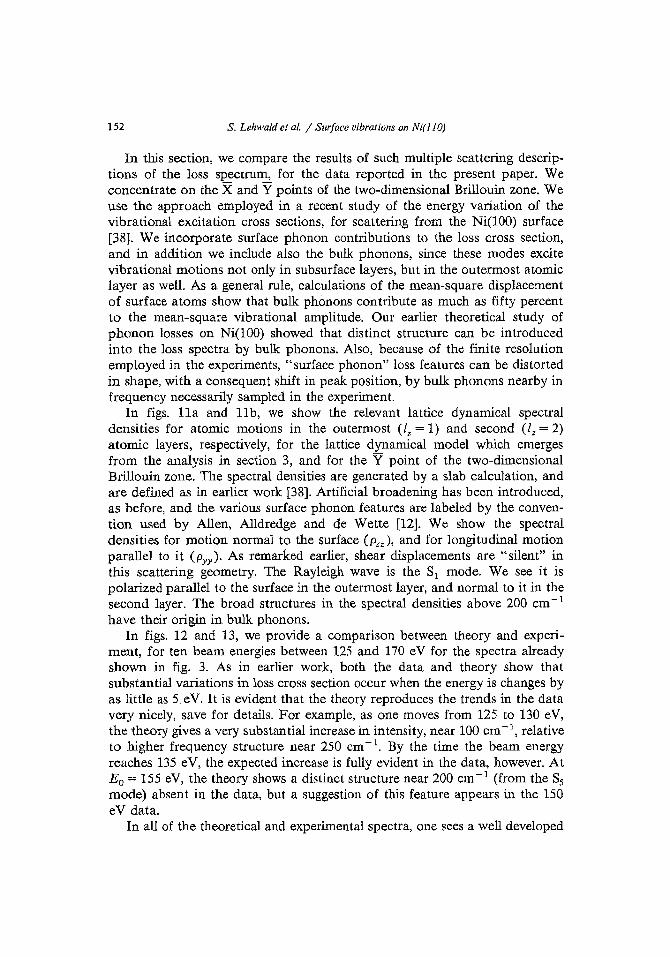
In figs. lIa and LIb, we show the relevant lattice dynamical spectraldensities for atomic motions in the outermost (lz = 1) and second (lz = 2)atomic layers, respectively, for the lattice dynamical model which emergesfrom the analysis in section 3, and for the Y point of the two-dimensionalBrillouin zone. The spectral densities are generated by a slab calculation, andare defined as in earlier work [38]. Artificial broadening has been introduced,as before, and the various surface phonon features are labeled by the convention used by Allen, Alldredge and de Wette [12]. We show the spectraldensities for motion normal to the surface CPzz), and for longitudinal motionparallel to it (Pyy)' As remarked earlier, shear displacements are "silent" inthis scattering geometry. The Rayleigh wave is the Sl mode. We see it ispolarized parallel to the surface in the outermost layer, and normal to it in thesecond layer. The broad structures in the spectral densities above 200 cm- 1
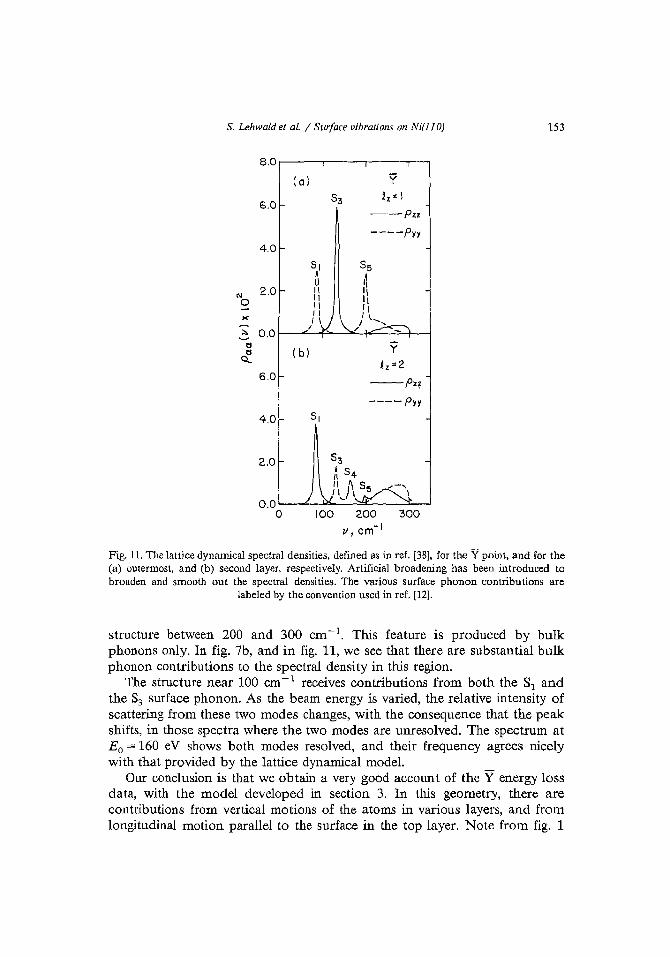
have their origin in bulk phonons.In figs. 12 and 13, we provide a comparison between theory and experi
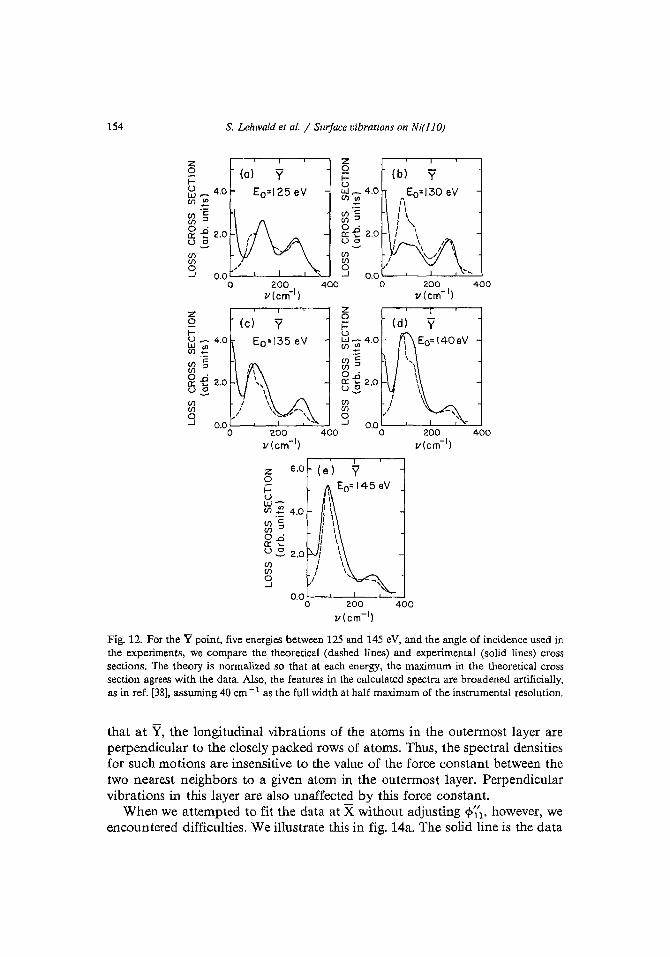
ment, for ten beam energies between 125 and 170 eV for the spectra alreadyshown in fig. 3. As in earlier work, both the data and theory show thatsubstantial variations in loss cross section occur when the energy is changes byas little as 5 eV. It is evident that the theory reproduces the trends in the datavery nicely, save for details. For example, as one moves from 125 to 130 eV,the theory gives a very substantial increase in intensity, near 100 em - \ relativeto higher frequency structure near 250 em-I. By the time the beam energyreaches 135 eV, the expected increase is fully evident in the data, however. AtEo = 155 eV, the theory shows a distinct structure near 200 cm- 1 (from the 85mode) absent in the data, but a suggestion of this feature appears in the 150eV data.
In all of the theoretical and experimental spectra, one sees a well developed
S. Lehwald et at. / Surface vibrations on Ni(110) 153
8.0
(0) Y
6.0 53 i z= \
---pzz----pyy
4.0
51A1.1
C\J 2.0 II110 II
>< II1\
0.0/;:,
~
( b) Y~Q...
lz=26.0
--pz~
---- pyy
4.0 51
2.0
0.00 100 200 300
v, em-I
Fig. 11. The lattice dynamical spectral densities, defined as in ref. [38], for the Y point, and for the(a) outermost, and (b) second layer, respectively. Artificial broadening has been introduced tobroaden and smooth out the spectral densities. The various surface phonon contributions are
labeled by the convention used in ref. [12].
structure between 200 and 300 em -1. This feature is produced by bulkphonons only. In fig. 7b, and in fig. 11, we see that there are substantial bulkphonon contributions to the spectral density in this region.
The structure near 100 em-1 receives contributions from both the S1 andthe 83 surface phonon. As the beam energy is varied, the relative intensity ofscattering from these two modes changes, with the consequence that the peakshifts, in those spectra where the two modes are unresolved. The spectrum atEo = 160 eV shows both modes resolved, and their frequency agrees nicelywith that provided by the lattice dynamical model.
Our conclusion is that we obtain a very good account of the Y energy lossdata, with the model developed in section 3. In this geometry, there arecontributions from vertical motions of the atoms in various layers, and fromlongitudinal motion parallel to the surface in the top layer. Note from fig. 1
154 S. Lehwald et al. / Surface vibrations on Ni(110)
400
400
(d)
0.0 '----'--'---'---"---'o
zoj::::uw~4.0
en~
zoj::::uW-4.0en~
en'e:en :>0.053 2 .0
en(J)
o...J
400
0.0 c---'--_--'-_.J.-.--'o
Z 6.0ot;w-en ~ 4.0(j)'c
en :>O.ria: .....u~ 2.0(j)eno...J
(e) yEo=135 eV
zo (a) yI-(rl ~ 4.0 Eo=125 eV
~i ~ ~'§~ -e 2.0, - ~ -e 2.0
~~ ! ,/ ~"
~ / ~...J 0.0 ...J
o 200 400II (em-I)
Fig. 12. For the Y point, five energies between 125 and 145 eV, and the angle of incidence used inthe experiments, we compare the theoretical (dashed lines) and experimental (solid lines) crosssections. The theory is normalized so that at each energy, the maximum in the theoretical crosssection agrees with the data. Also, the features in the calculated spectra are broadened artificially,as in ref. [38], assuming 40 em-] as the full width at half maximum of the instrumental resolution.
that at Y, the longitudinal vibrations of the atoms in the outermost layer areperpendicular to the closely packed rows of atoms. Thus, the spectral densitiesfor such motions are insensitive to the value of the force constant between thetwo nearest neighbors to a given atom in the outermost layer. Perpendicularvibrations in this layer are also unaffected by this force constant.
When we attempted to fit the data at Xwithout adjusting c/>;/1 , however, weencountered difficulties. We illustrate this in fig. 14a. The solid line is the data
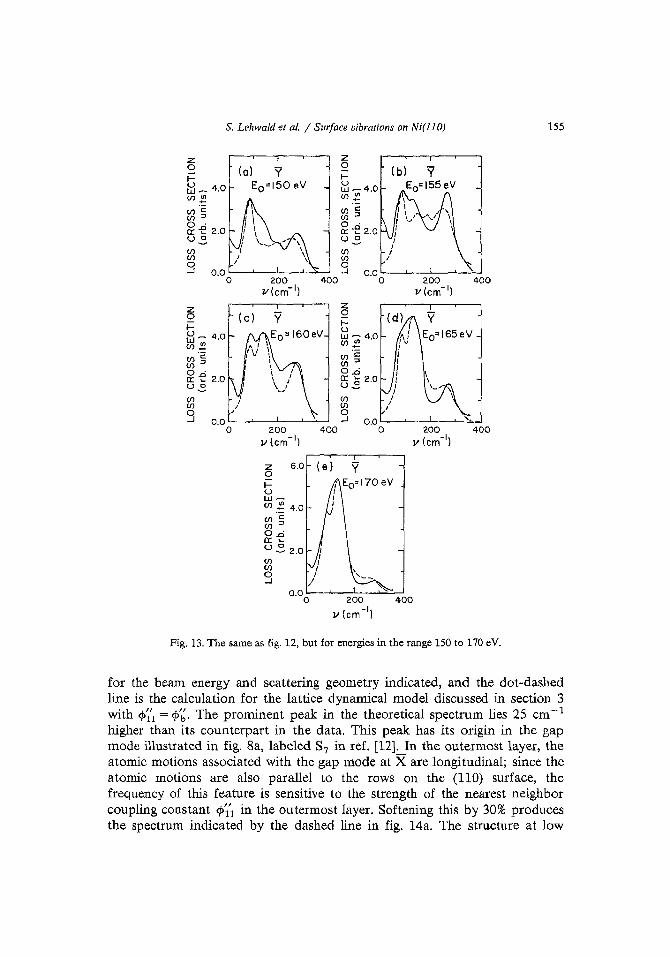
S. Lehwald et at. I Surface vibrations on Ni( /10) 155
z z0 (0) 0
I- Y I-~_ 4.0 EO=150 eV ~-4.0UJ~ (I)~
UJ 'c (1)<=UJ '"
(I) ::J
O·~ of! 2.0a:: -e 2.0
u~ u~
UJ (I)UJ (I)0 0--l 0.0 ....I 0.0
0 200 400 0l/(em- I)
z z0 (C) 0
i= I-U
~- 4.0 ~E4.0UJ~UJ 'c UJ 'cUJ" (I)'"
0.0 0.0a:: ... 2.0 52 2 .0u~
UJ (I)UJ UJ0 0--l 0.0 ....I
0 200 400II (em-I)
z 6.0 (e) y0l- I Eo=170eVu Iw- IUJ ~ 4.0 I
UJ 'c/
UJ ::>O'a::-eu~ 2.0UJUJ0--l
0.00 400
Fig. 13. The same as fig. 12, but for energies in the range 150 to 170 eV.
for the beam energy and scattering geometry indicated, and the dot-dashedline is the calculation for the lattice dynamical model discussed in section 3with </>~l = 1>/~. The prominent peak in the theoretical spectrum lies 25 cm-1higher than its counterpart in the data. This peak has its origin in the gapmode illustrated in fig. 8a, labeled S7 in ref. [12]. In the outermost layer, theatomic motions associated with the gap mode at X are longitudinal; since theatomic motions are also parallel to the rows on the (110) surface, thefrequency of this feature is sensitive to the strength of the nearest neighborcoupling constant </>~l in the outermost layer. Softening this by 30% producesthe spectrum indicated by the dashed line in fig. 14a. The structure at low
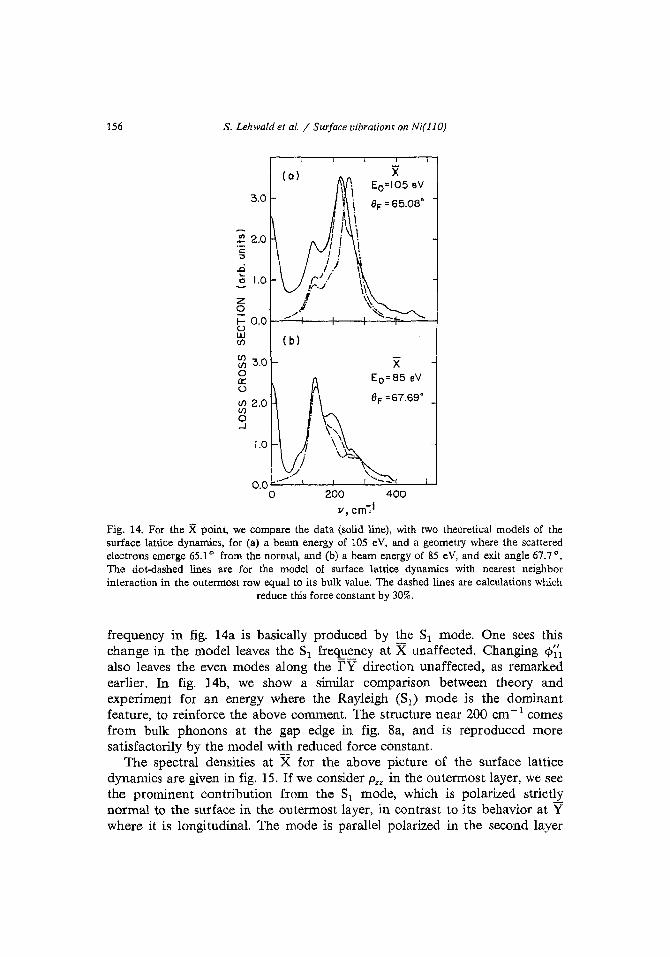
156 S. Lehwald et al. / Surface vibrations on Ni(llO)
XEo=85 eV
8F =67.69°
XEo"105 eV
8F =65.08"
,...._-
(0)
3.0
.e 2.0I::::J
.ci....0
z0i= 0.0uUJ ( b)(f)
~ 3.00a::u(f) 2.0(f)
0....J
r.o
200 400
71, cm~l
Fig. 14. For the X point, we compare the data (solid line), with two theoretical models of thesurface lattice dynamics, for (a) a beam energy of 105 eV, and a geometry where the scatteredelectrons emerge 65.10 from the normal, and (b) a beam energy of 85 eV, and exit angle 67.7 0
•
The dot-dashed lines are for the model of surface lattice dynamics with nearest neighborinteraction in the outermost row equal to its bulk value. The dashed lines are calculations which
reduce this force constant by 30%.
frequency in fig. 14a is basically produced by the Sl mode. One sees thischange in the model leaves the Sl frequency at X unaffected. Changing ep~l
also leaves the even modes along the 1'y direction unaffected, as remarkedearlier. In fig. 14b, we show a similar comparison between theory andexperiment for an energy where the Rayleigh (Sl) mode is the dominantfeature, to reinforce the above comment. The structure near 200 em -1 comesfrom bulk phonons at the gap edge in fig. 8a, and is reproduced moresatisfactorily by the model with reduced force constant.
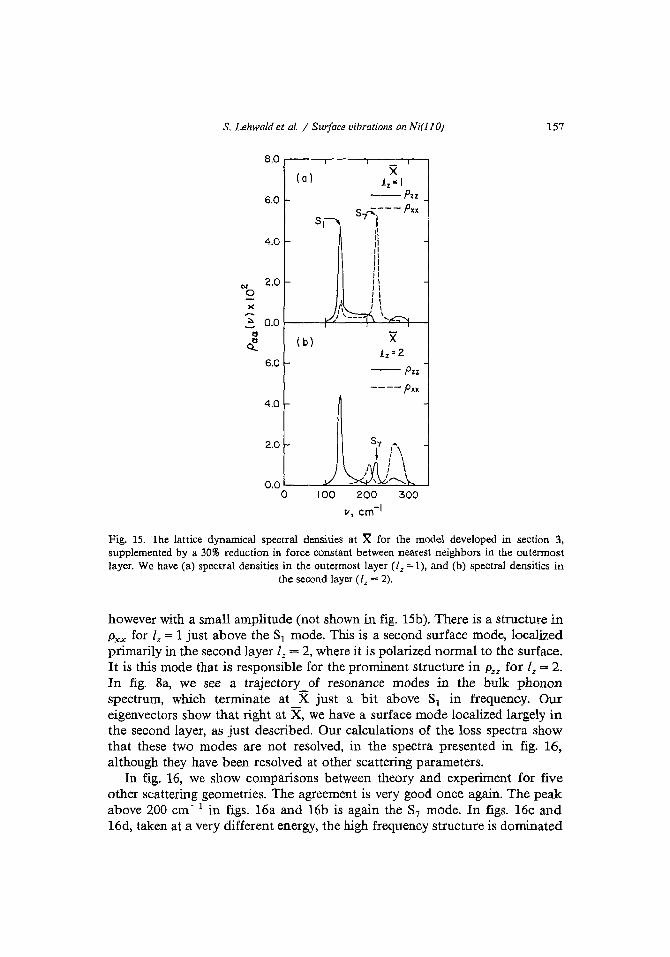
The spectral densities at X for the above picture of the surface latticedynamics are given in fig. 15. If we consider Pzz in the outermost layer, we seethe prominent contribution from the Sl mode, which is polarized strictlynormal to the surface in the outermost layer, in contrast to its behavior at Ywhere it is longitudinal. The mode is parallel polarized in the second layer
S. Lehwald et al. / Surface vibrations on Ni( 110) 157
8.0
(a)X
1z " I
6.0 pzz
5 Pxxs
4.0
'"2.0
0><~
;:,. 0.0Cl
(b) X.{1.z =2.
6.0pzz
pxx4.0
2.0 57
0.00 100 2.00 300
II, em-I
Fig. 15. The lattice dynamical spectral densities at X for the model developed in section 3,supplemented by a 30% reduction in force constant between nearest neighbors in the outermostlayer. We have (a) spectral densities in the outermost layer (/z = 1), and (b) spectral densities in
the second layer (I, = 2).
however with a small amplitude (not shown in fig. 15b). There is a structure inPx x for l, = 1 just above the 81 mode. This is a second surface mode, localizedprimarily in the second layer I, = 2, where it is polarized normal to the surface.It is this mode that is responsible for the prominent structure in Pzz for lz = 2.In fig. 8a, we see a trajectory of resonance modes in the bulk phononspectrum, which terminate at X just a bit above 81 in frequency. Oureigenvectors show that right at X, we have a surface mode localized largely inthe second layer, as just described. Our calculations of the loss spectra showthat these two modes are not resolved, in the spectra presented in fig. 16,although they have been resolved at other scattering parameters.
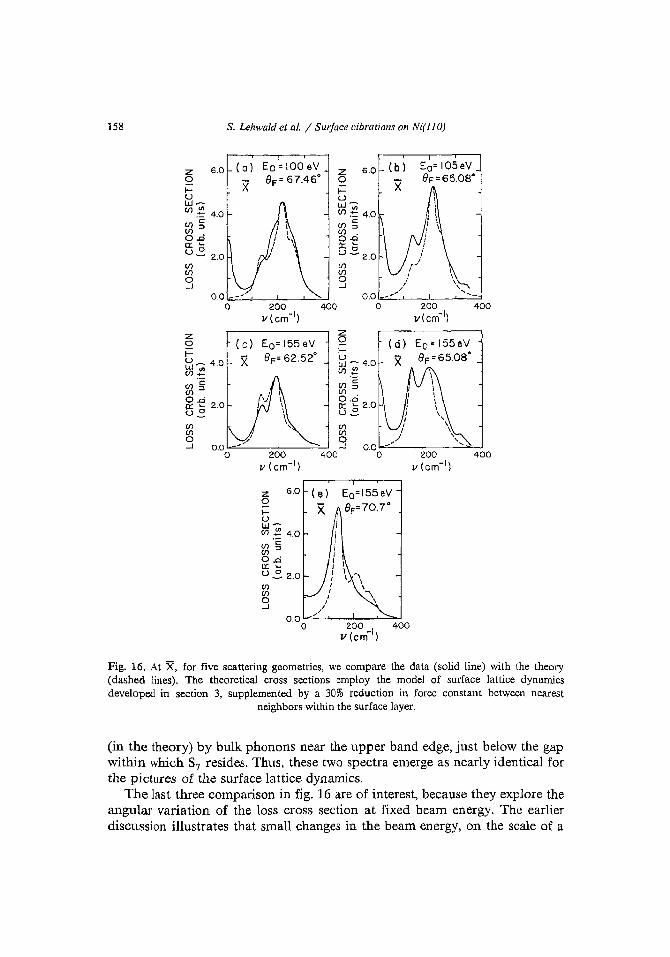
In fig. 16, we show comparisons between theory and experiment for fiveother scattering geometries. The agreement is very good once again. The peakabove 200 em -1 in figs. 16a and 16b is again the 87 mode. In figs. 16c and16d, taken at a very different energy, the high frequency structure is dominated
Z 6 .0o.....Uw~
In ~ 4.0m 'e:m::>0.00:: ...u~ 2 .0mmo....J
S. Lehwald et 01. / Surface vibrations on Ni(1lO)
z 6 .0 (a) Eo =IOOeV z 6 .0 ( b ) Eo= I05eV0
X 8F= 67.46· 0 X 8F=65.0S·..... I-U Uw~ w-Ullll Ul lll.-= 4.0 := 4 .0Ul " Ul5Ul::> Ul0.0 0.0a:: ~ a::~
o s 2.0 u2 2 .0Ul enIn Ul0 0....J ....J
200 400 200 400v (cm- I) v(cm- I)
z z9 (c) Eo= 155 eV 0 ( d ) Eo=155eV..... 8F=62 .52·
.....8F=65.0S"
~~ 4 .0 X Gj - 4 .0 XUl~ Ul~In .;::
~~In::>
~~ 2 .0 0:: ~ 2 .0u~ u2In InIn Ul0 0....J ....J 0 .0
400 0 200 400v(cm- I)
158
0 .0 ""'-'-----'-_-'-_..L...,,;::....Jo 200 -I 400
v(cm )
Fig. 16. At X, for five scattering geometries, we compare the data (solid line) with the theory(dashed lines). The theoretical cross sections employ the model of surface lattice dynamicsdeveloped in section 3, supplemented by a 30% reduction in force constant between nearest
neighbors within the surface layer.
(in the theory) by bulk phonons near the upper band edge, just below the gapwithin which S7 resides. Thus, these two spectra emerge as nearly identical forthe pictures of the surface lattice dynamics.
The last three comparison in fig. 16 are of interest, because they explore theangular variation of the loss cross section at fixed beam energy. The earlierdiscussion illu strates that small changes in the beam energy, on the scale of a
S. Lehwald et al. / Surface vibrations on Ni(llO} 159
300100 200
V (cm-1)o300100 200
V (cm-l)
o
a)Eo=1SSeV Eo=155eVSF;: 68.6C SF= 56.26 c
~ =-2.6 ,ry} ~ =-1.4(ry)
VI....c::::J
..d'- I Ic:l
69 72:z:a............WLLJ c)l.J1l./) Eo=10SeVl./)
SF:: 64.6 Ca0: ~ ;: -0.6 lry}wl./)l.J1a---J
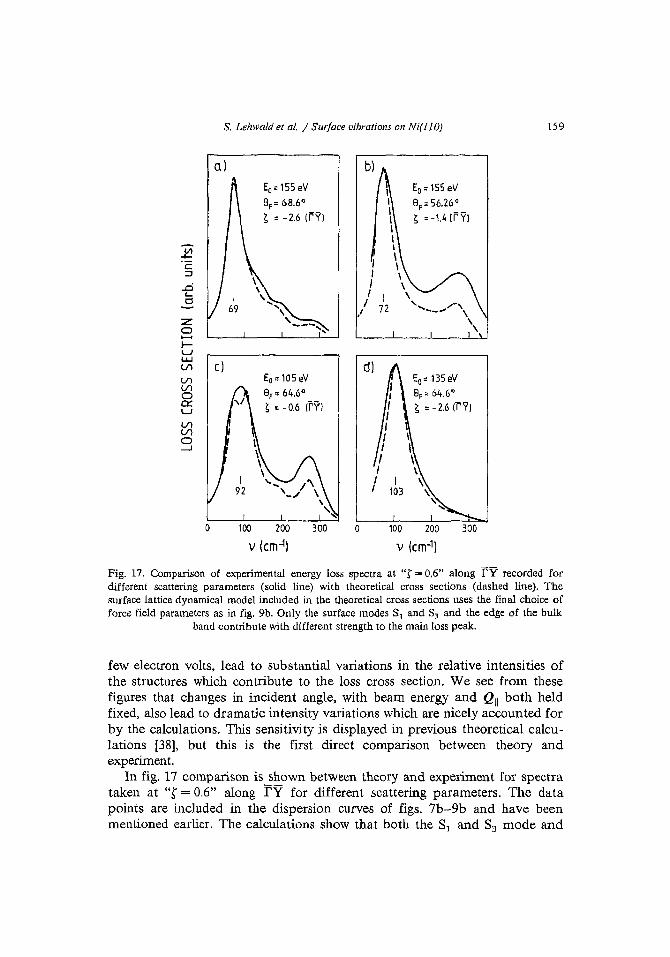
Fig. 17. Comparison of experimental energy loss spectra at "f = 0.6" along [yo recorded fordifferent scattering parameters (solid line) with theoretical cross sections (dashed line). Thesurface lattice dynamical model included in the theoretical cross sections uses the final choice offorce field parameters as in fig. 9b. Only the surface modes Sl and S3 and the edge of the bulk
band contribute with different strength to the main loss peak.
few electron volts, lead to substantial variations in the relative intensities ofthe structures which contribute to the loss cross section. We see from thesefigures that changes in incident angle, with beam energy and Qn both heldfixed, also lead to dramatic intensity variations which are nicely accounted forby the calculations. This sensitivity is displayed in previous theoretical calculations [38], but this is the first direct comparison between theory andexperiment.
In fig. 17 comparison is shown between theory and experiment for spectrataken at "t = 0.6" along TY for different scattering parameters. The datapoints are included in the dispersion curves of figs. 7b-9b and have beenmentioned earlier. The calculations show that both the S, and S3 mode and
160 S. Lehwald et al. / Surface vibrations on Ni(110)
the edge of the bulk band contribute with different strength to the crosssection at different scattering parameters. The resulting peaks shift in frequencywithout significant broadening in excellent agreement with the experimentaldata. The calculations show that these losses are not due to additional surfacemodes.
As a final note, we have varied the relaxation between the first and secondlayers and the second and third layers to test our sensitivity to the variousmodels of the relaxation. This results in tJ.d12 ranging from - 8.4% to - 9.8%and tid23 ranging from +3.0% to +4.0%. We have found that this results inno qualitative change in the loss spectra, and indeed the quantitative differences are very small. This is not terribly surprising since one would expectthat this technique should have a similar accuracy to LEED, i.e. about 1/2 to1%. Comparison of loss spectra calculated for the relaxed surface versus theunre1axed surfaces show large qualitative differences.
6. Concluding remarks
We have presented a detailed analysis of the lattice dynamics of the Ni(llO)surface, based on in- and off-specular electron energy loss studies of surfaceand bulk phonon features in the energy loss spectrum, combined with theoretical studies of the energy and angle variation of the spectra. The picture of thesurface lattice dynamics which emerges from these considerations has thefollowing elements:
(i) The substantial contraction between the first and second layer, combined with the more modest expansion between the second and third layerleads to appreciable changes in the relevant inter-layer coupling constants.Within a nearest neighbor central force model, the influence of these changeson the data is accounted for nicely with the relation given in eq. (6), withu= 8.
(ii) To account for the features analyzed in section 3, it is necessary tointroduce surface stresses into the description of the lattice dynamics of theoutermost surface layer. The stresses required are close in magnitude to thosecalculated by Needs [30] (for a very different surface, note).
(iii) The frequency of S7 gap mode at X suggests a softening of 20-30% inthe force constant between nearest neighbors within the surface layer.
(iv) We also found it necessary to introduce a negative second nearestneighbor force constant within the surface layer in order to describe the rathersoft Rayleigh wave near the Y point. This may relate to the pairing row typereconstruction of this surface with adsorbed hydrogen.
Finally, we obtain a very good description of the energy and angle variationof the relative strength of features in the loss cross section through use of themultiple scattering description put forward earlier [18-20,38].
Acknowledgment
S. Lehwald et al. / Surface vibrations on Ni(1/0) 161
The research of two of the authors, B.M.H. and D.L.M., is supported by theUS Department of Energy, through Grant No. DE-FG03-84ER45083.
References
(1] U. Harten, J.P. Toennies and C. wen, Faraday Disc. Chern. Soc. 80 (1985) 137.[2] U. Harten, C. wen and J.P. Toennies, Phys. Rev. Letters 55 (1985) 2308.(3] K. Kern, R. David, R.L. Palmer, G. Comsa and T.S. Rahman, Phys. Rev. B33 (1986) 4334.(4] S. Lehwald, M. Rocca, H. Ibach and T.S. Rahman, J. Electron Spectrosc. Related Phenom-
ena 38 (1986) 29.[5] T.S. Rahman, M. Rocca, S. Lehwald and H. Ibach, 1. Electron Spectrosc. Related Phenom
ena 38 (1986) 45.[6] M. Rocca, H. Ibach, S. Lehwald and T.S. Rahman, in: Structure and Dynamics of Surfaces,
Vol. 41 of Topics in Current Physics, Eds. P.V. Blankenhagen and W. Schommers (Springer,Heidelberg, 1986) p. 245.
[7] W. Daum, S. Lehwald and H. Ibach, Surface Sci. 178 (1986) 528.[8] J.E. MUller, M. Wuttig and H. Ibach, Phys, Rev. Letters 56 (1986) 1583.[9] The authors acknowledge rather helpful comments of V. Heine regarding the feasibility of
first principle calculations on the surface stress, see also ref. (30].[10] S. Lehwald, J.M. Szeftel, H. Ibach, T.S. Rahman and D.L. Mills, Phys, Rev. Letters 50 (1983)
518;M. Wuttig, R. Franchy and H. Ibach, Solid State Commun. 57 (1986) 445.
[11] M. Wuttig, R. Franchy and H. Ibach, Z. Phys, B, in press.[12] R.E. Allen, G.P. Alldredge and F.W. de Wette, Phys. Rev. B4 (1971) 1648.[13] H. Niehus and G. Comsa, Surface Sci. 151 (1985) L171.[14] K Baberschke, U. Dehler, L. Wenzel, D. Arvanitis, A. Baratoff and K.H. Rieder, Phys, Rev.
B33 (1986) 5910.[15] KH. Rieder and W. Stocker, Surface Sci. 164 (1985) 55.[16] K. Christmann, V. Penka, R.J. Behm, F. Chenhab and G. Ertl, Solid State Cornmun. 51
(1984) 487.[17] V. Penka, K. Christmann and G. Ert!, Surface Sci. 136 (1984) 307.[18] SY. Tong, C.H. Li and D.L. Mills, Phys. Rev. Letters 44 (1980) 407.(19] C.H. Li, SY. Tong and D.L. Mills, Phys. Rev. B21 (1980) 3057.[20] SY. Tong, C.H. Li and D.L. Mills, Phys. Rev. B24 (1981) 806.[21] Mu-Liang Xu, B.M. Hall, SY. Tong, M. Rocca, H. Ibach, S. Lehwald and J.E. Black, Phys.
Rev. Letters 54 (1985) 1171.[22] H. Ibach and S. Lehwald, Surface Sci. 176 (1986) 629.[23] JA. Stroscio, M. Persson, S.R. Bare and W. Ho, Phys. Rev. Letters 54 (1985) 1428.[24] JY. Stroscio, M. Persson and W. Ho, Phys. Rev. B33 (1986) 6758.[25] J.A. Stroscio and W. Ho, Rev. Sci. Instr, 57 (1986) 1492.[26] R. Koch and R. Abermann, Thin Solid Films 129 (1985) 63;
R. Abermann and R. Koch, Thin Solid Films 129 (1985) 7l.[27] For a review see: W.J. Dunning, in: Adhesion, Ed. D.D. Eley (Oxford University Press,
Oxford, 1961).[28] J.E. MUller, M. Wuttig and H. Ibach, Phys. Rev. Letters 56 (1986) 1583.[29] See, e.g., H. Ibach and D.L. Mills, Electron Energy Loss Spectroscopy and Surface Vibra
tions (Academic Press, New York, 1982) p. 136.
162 S. Lehwald et al. / Surface vibrations on Ni(110)
[30] R.J. Needs, Phys. Rev. Letters 58 (1987) 53.[31] M.L. Xu and S.Y. Tong, Phys. Rev. B31 (1985) 6332;
S.M. Yalisove, W.R. Graham, E.D. Adams, M. Copel and T. Gustafsson, Surface Sci. 171(1986) 400;D.L. Adams, L.E. Petersen and c.s, Sorensen, l. Phys, CIS (1985) 1753;Y. Gauthier, R. Baudoing, Y. loly, C. Gaubert and l. Rundgren, J. Phys, C17 (1984) 4547.
[32] Ref. 29, p. 298.[33] R.M. Badger, J. Chern. Phys. 2 (1934) 128; 3 (1935) 710; Phys. Rev. 48 (1935) 284.[34j n.R. Herschbach and V.W. Laurie, J. Chem. Phys. 35 (1961) 458.[35] H. Ibach and S. Lehwald, Solid State Commun. 45 (1983) 633.[36] S. Anderson, B.l. Persson, M. Persson and N.D. Lang, Phys. Rev. Letters 52 (1985) 2073.[37] G.W. Farnell, in: Physical Acoustics, Vol. 6, Ed. W.P. Mason (Academic Press, New York,
1970) p. 109.[38] B.M. Hall and D.L. Mills, Phys. Rev. B34 (1986) 8318.


