Embed Size (px)
Citation preview
ETH Library
Surface modification for opticalbiosensor applications
Doctoral Thesis
Author(s):Hofer, Rolf
Publication date:2000
Permanent link:https://doi.org/10.3929/ethz-a-004040300
Rights / license:In Copyright - Non-Commercial Use Permitted
This page was generated automatically upon download from the ETH Zurich Research Collection.For more information, please consult the Terms of use.

Diss. ETHNo. 13873
Surface Modification for Optical
Biosensor Applications
for the degree of
DOCTOR OF NATURAL SCIENCES
A dissertation submitted to the
SWISS FEDERAL INSTITUTE OF TECHNOLOGY ZURICH
presented by
ROLF HOFER
Dipl. ehem., University of Fribourg, Switzerland
bom February 3, 1961
citizen of Langnau i.E., Bern
accepted on the recommendation of:
Prof. Dr. N.D. Spencer, examiner
Dr. M. Textor, co-examiner
Dr. M. Ehrat, co-examiner
Zürich, 2000

Oui tfc
3 i *•
1 111 ..:
Contents
Abstract 9
Zusammenfassung 12
I Introduction 15
II Theory and Background 18
1 Biosensor Technology 18
1.1 Recognition Elements 19
1.2 Immobilization of Recognition Elements 20
1.2.1 Adsorption 21
1.2.2 Covalent Binding 22
1.2.3 Binding through Biotin-Streptavidin-Link 22
1.3 Transducer Technique 23
1.3.1 Detection Methods 24
1.4 Specific and Non-specific Binding 24
2 Optical Sensors 25
2.1 Principle of Optical Waveguide 26
2.2 The Evanescent Field 28
2.3 Analytical Methods with Optical Waveguide 30
2.3.1 Change of Refraction Index 30
2.3.2 Fluorescence Measurement 31
HI Material and Methods 32
1 Substrate Material and Chemical Products 32
1.1 Substrate 32
1.1.1 Metal Oxides 32
1.1.2 Metals 34
1.1.3 GoldAdlayer 34
1.1.4 Planar Waveguide Chips 35
1.2 Adsorbents 36
1.2.1 Organic Phosphoric and Phosphonic Acids 36
1.2.2 Poly-(L)-Lysine-Poly(Ethylene Glycol) (PLL-PEG) 45
1.2.2.1 Synthesis of PLL-g-PEG Derivatives 46
1.3 Biochemical Substances 53
1.4 Solvents 54
1.5 Further Substances 55
2 Apparatus 56
2.1 Apparatus for the Cleaning and Coating of the Substrates 56
2.2 Surface Characterization 58
2.2.1 X-ray Photoelectron Spectroscopy (XPS) 58
2.2.2 Time-of-Flighi Secondary-Ion Mass
Spectrometry (ToF-SIMS) 59
2.2.3 Contact Angle 60
2.2.4 Microdroplet Density (u.dd) 61
2.2.5 Atomic Force Microscopy (AFM) 64
2.3 Determination of Adsorption 65
2.3.1 Grating Coupler 65
2.3.2 Optical Waveguide Lightmode Spectroscopy (OWLS) 66
2.4 Determination of Bioactivity 68
2.4.1 Determination of Enzyme Activity 68
2.4.2 Fast Optical Biospecific Interaction Analysis (FOBIA) 68
IV Results and Discussion 72
1 Cleaning of the Substrate Surfaces 72
1.1 Cleaning Procedures 72
1.2 Results 73
1.3 Influence on Further Surface-Modification Steps 78
1.4 Influence on the Waveguide Properties 80
2 Coating of the Substrate Surfaces 85
2.1 Self-Assembled Monolayers (SAMs) 85
2.1.1 Octadecyl Phosphate (ODP04) 86
2.1.1.1 Influence of Different Solvents 86
2.1.1.2 Adsorption Kinetics and SAM Stability 88
2.1.1.3 Characterization ofODP04 SAMs on Ta205 97
2.1.1.4 Summary, Conclusions and Suggestions 114
2.1.1.5 Molecular Model of ODP04 SAM on Ta205 122
2.1.2 Mono- and Bifunctional Phosph(on)ates 131
2.1.2.1 Applied Methods 131
2.1.2.2 Influence of Different Solvents 132
2.1.2.3 SAM Orientation and Order 136
2.1.2.4 Chemical Bonding 146
2.1.2.5 Summary 149
2.1.2.6 Toxicology 151
2.1.3 Ammonium Salt of Alkyl Phosphates 153
2.1.3.1 Applied Methods 154
2.1.3.2 Sample Preparation 155
2.1.3.3 Investigation of Surface Properties.... .....156
2.1.3.4 Exposure to Inorganic Phosphate Solution 169
2.1.4 Poly-(L)-Lysine Poly-(Ethylene Glycol) (PLL-PEG) 173
2.2 Adsorption of Thiols onto Gold Interfaces 178
2.2.1 Coating ofTa205 with Gold Chloride 178
2.3 Stability of Modified Surfaces 190
2.3.1 Stability of Hydrophobic Phosph(on)ate SAMs in Water 190
2.3.2 Stability of Phosph(on)ate SAMs and PLL-PEG
Adlayers in Different Buffer Systems 191
3 Immobilisation of Biomolecules and
Quantification of Target Molecules 197
3.1 Enzymatic Activity of Horseradish Peroxidase 198
3.1.1 Peroxidase Activity on PLL-PEG Coated Chips 200
3.1.2 Peroxidase Activity on Phosph(on)ate Coated Chips 204
3.2 Optical Biosensor Application 208
3.2.1 Labeling of Biomolecules 208
3.2.2 Specific and Non-Specific Binding of Target Molecule 210
3.2.3 Specific and Non-Specific Binding of Streptavidin 215
3.2.4 Detection Limit of Target Molecules 218
3.2.5 Optimization of Biotin Concentration in
PLL-PEG Derivatives 224
3.2.6 Immunoassay Design 227
3.2.7 Application of the Sensor for Serum Samples 232
3.2.7.1 PLL-PEG Sensor Interfaces 234
3.2.7.2 Hydrophobic Alkyl PhosphateSensor Interfaces 235
3.2.7.3 Comparison of PLL-PEG and Alkyl
Phosphate Sensor Interfaces 236
3.2.8 Mixed SAMs for Biosensor Applications 237
3.2.9 Summary of the Immunoassay Performance 240
V Conclusions and Outlook 241
VI Literature 245
VII Appendix 252
Curriculum Vitae 298
Acknowledgements 302

il)*19* y il

Seht Ihr den Mond da stehen
Er ist nur halb zu sehen
Und ist doch rund und schön
So gibts noch viele Sachen
Die wir getrost belachen
Weil unsre Augen sie nicht sehn
Aus dem Lied, "Der Mond ist aufgegangen"
von Matthias Claudius (1740-1815)
Meiner Familie

Seite Leer /
Blank leaf
Abstract
Abstract
The thesis covers the development of two novel surface modification
systems based on monomolecular assembly of functionalized molecules on
oxide surfaces and their successful application for optical bioaffmity sensor
chips. One or both of the two techniques developed will be used in the near
future to fabricate optical waveguide chips on a commercial scale by the
industrial project partner, thanks to the combination of technical
performance, ease of application and cost-effectiveness of the developedtechnology.
Bioaffmity sensors typically use the concept of specific, biologicalinteractions between immobilized recognition elements (antibodies,enzymes, nucleic acids, ...) and their corresponding target molecules
(antigen, substrate, complementary nucleic acids, ...) in an analyte solution
for application in medical diagnostics, drug development and highthroughput screening. The analytical requirements, in particular the
sensitivity and selectivity of an particular affinity assay, depend on both the
type of detection technique and the architecture of the transducer/analyteinterface. The latter is particular critical to the sensor performance and
reliable, cost-effective surface functionalization techniques are urgentlyneeded to satisfy the needs of a rapidly growing market.
The thesis focusses on detailed studies of spontaneously formed,organized monolayers of long-chain alkanephosphates and of poly(ethyleneoxide) grafted poly-lysine copolymers on optically transparent, high-refractive-index thin films such as tantalum, niobium and titanium oxides,the study of their mterfacial chemistry and physico-chemical behavior, and
their quantitative performance in model bioaffmity sensor assays. The
requirements and objectives for the biosensor surfaces were: high opticaltransparency, high sensitivity, high specificity and general applicability for
the reproducible immobilization of recognition elements and detection of the
corresponding target molecules.
9
Abstract
a) The high optical transparency was a fundamental condition, since the
biosensor surfaces are to be part of an evanescentfield waveguide opticalsensor system. The apparatus used for testing the performance of the
adlayers consists of a planar waveguide. The optical signal for the analytedetection is measured through the sensor surface and its support. As
waveguiding layers, highly transparent, high refractive index (tantalumpentoxide) coated glass chips were used.
b) The high sensitivity is obtained by selective excitation of fluorescent
chromophores of tracer molecules immobilized at the sensor/analyteinterface and excited by the evanescent field of the planar waveguide.This allows the detection of surface species with almost no contribution
from the bulk solution.
c) The high specificity is reached by minimization of non-specific bindingof the target molecules and tracers at the sensor surface and optimizationof specific binding by the optimized immobilization of recognitionmolecules (e.g. antibodies). As a model bioaffmity assay system, an
antigen/antibody reaction based on immunoglobulin (rabbit-IgG/anti-rabbit-IgG) was selected.
d) Two general sensor interface platforms were developed and tested
according to c): The first consists of the formation of self-assembledmonolayers (SAMs) of alkyl phosphates and phosphonates at the metal
oxide surfaces. Such SAMs form two-dimensionally ordered, highlyhydrophobic surfaces that strongly adsorb albumin, thus reducing non¬
specific adsorption to very low values. The binding of biotin-conjugatedbovine serum albumin (BSA-biotin) proved to be a viable technique to
produce biotin-activated surfaces that can be further functionalized usingstreptavidin. The second development covers the modification of the
oxide surface with poly(ethylene glycol)-grafted copolymers.Polyethylene glycol)-grafted poly-L-lysine (PLL-g-PEG), chargedpositively at physiological pH, adsorbs to negatively charged oxide
surfaces by electrostatic interactions. The polymer architecture was
optimized in terms of the molecular weights of the PLL and PEG
constituents and of the grafting ratio PEG/PLL. Extremely low values of
non-specific adsorption in full serum (generally less than 3 ng-cm"2
10
Abstract
corresponding to typically less than 0.1% of a typical protein monolayer)could be realized. Again, functionalization via biotin conjugation(terminal PEG-chain functionalization) was used to performbiotin/straptavidin-based bioaffmity model assays and to determine the
comparative sensing performance of the two surface modification
technqiues developed.
It was demonstrated that both surface modification routes provideexcellent general platforms on which streptavidin-conjugated recognitionmolecules can be successfully immobilized. In addition it is also possible to
form a streptavidin adlayer on these platforms followed by immobilization
of biotin-conjugated recognition molecules. Within the framework of the
thesis it has been shown that effective target molecule concentrations in the
femtomolar region could be easily detected, even in total serum samples and
without any sample pretreatment such as extraction or purification.
The combination of optimized interfacial chemistry, the opticaltransducer, and the assay architecture resulted in a optimum performancesystem that has a high potential for immunoassay applications in the future.
11
Abstract
Zusammenfassung
Die Doktorarbeit beschreibt die Entwicklung zweier neuartigerOberflächenmodifikations-Systemen, welche auf der Bildung von
selbstorganisierten, monomolekularen Adsorptionsschichten an Metalloxid¬
oberflächen und deren erfolgreichen Anwendung auf dem Gebiete der
optischen Biosensorik basieren. Eine (oder evtl. beide) der entwickelten
Techniken wird in nächster Zukunft Anwendungen zur Herstellung optischerWellenleiter finden, welche in kommerziellem Massstab hergestellt werden
sollen. Diese, durch den industriellen Projektpartner angestrebte Anwendungwird durch die optimale Kombination technischer Leistungsfähigkeit,einfacher Anwendbarkeit und Kostengünstigkeit der entwickelten
Technologie ermöglicht.
Bioaffinitäts-Sensoren basieren typischerweise auf dem Prinzip der
spezifischen, biochemischen Wechselwirkung zwischen immobilisierten
Erkennunkselementen (Antikörper, Enzyme, Nuclemsäuren, ...) und deren
entsprechenden Bindungspartnern (Antigen, Substrat, komplementäreNucleinsäuren, ...). Solche Sensoren finden unter anderem Anwendung in
der medizinischen Diagnostik, der Pharmaforschung sowie zur Bewältigungvon grossem Probendurchsatz in der Analytik. Das Erreichen der
analytischen Anforderungen, insbesondere die hohe Empfindlichkeit und
Selektivität, an die einzelnen Affinitätsassays, hängt von der
Detektionstechnik sowie von der Architektur der Transducer/Analyt-Grenzfläche ab. Letzteres ist insbesondere massgebend für die
Leistungsfähigkeit und Zuverlässigkeit der Sensoren. KostengünstigeOberflächenfunktionalisierungs-Techniken sind dringend gefragt, um der
rasch steigenden Nachfrage und dem wachsenden Markt zu genügen.
Das Hauptgewicht der Doktorarbeit liegt in den detailierten Untersu¬
chungen spontan gebildeter Monoschichten von langkettigenAlkylphosphaten und -phosphonaten sowie Polyethylenglycol-Polylysin -
Copolymeren an optisch transparenten Metalloxidoberflächen. Die
Oberflächenchemie sowie die physikalisch-chemischen Eigenschaftensolcher Adsorbatschichten wurden insbesondere an hochbrechenden
12
Abstract
Metalloxiden wie Tantal-, Niob- und Titanoxid untersucht und deren
Leistungsfähigkeit als Bioaffinitäts-Sensorplatform anhand eines
Modelassays geprüft. Die Anforderung an solche Biosensoroberflächen
waren: hohe optische Transparenz, hohe Empfindlichkeit, hohe Spezifitätund generelle Anwendbarkeit zur reproduzierbaren Immobilisierungverschiedener Erkennungseinheiten und Detektion der entsprechendenZielmoleküle.
a) Die hohe optische Transparenz war eine Grundbedingung, da die
Biosensoroberflächen auf ein optisches Analysensystem anwendbar sein
sollen, welches auf dem Prinzip der optischen Evaneszentfeld-Wellenleiter basiert. Das Gerät mit dem die Leistungsfähigkeit bezüglich
Bioassay untersucht wurden, verwendet planare Wellenleiter-Technik,
wobei die Detektion des Analyten durch die Sensoroberfläche und den
Träger hindurch erfolgt. Die hohe Transparenz wurde durch Verwendungdefinierter Tantalpentoxid-Beschichtungen von Glasträgern erreicht.
b) Die hohe Empfindlichkeit wird durch optische Anregung fluoreszieren¬
der Chromophore der sogenannten Tracer erzielt, was eine sehr starke
Reduktion von nichtspezifischem Grundsignal zur Folge hat. Die
Anregung durch das evaneszente Feld der planaren Wellenleiter, erlaubt
Untersuchungen von Oberflächenphänomenen mit weitgehender
Vermeidung von Bulksignal.
c) Die hohe Spezifität wird durch Minimierung der unspezifischen Bindungder Zielmoleküle und Tracer an die Sensoroberfläche bei gleichzeitigerErhöhung der spezifischen Bindung durch optimierte Immobilisierungvon Erkennungsmolekülen (Antikörper) erzielt. In dieser Arbeit wurde
ein Antigen/Antikörper-Modelsystem (Rabbit-IgG/anti-Rabbit-IgG)verwendet.
d) Zwei verschiedene Sensoroberflächen-Fiatformen wurden entwickelt
und nach den Gesichtspunkten die unter Punkt c) besprochen wurden
untersucht: Einerseits die Erzeugung selbstorganisierter, monomoleku¬
larer Adsorptionsschichten (= SelfAssembled Monolayers, SAMs) von
Alkylphosphaten und -Phosphonaten auf Metalloxidoberflächen. Solche
SAMs bilden zweidimensional geordnete, stark hydrophobeOberflächen, welche sich sehr gut eignen, Albumin stabil zu binden
13
Abstract
(bewirkt starke Reduktion von unspezifischger Proteinbindung). Durch
Verwendung von biotinyliertem Rinderserum-Albumin (= BSA-biotin),können auf diese Weise Biotin-aktivierte Sensoroberflächen hergestelltwerden, welche ihrerseits zur Oberflächenfunktionalisierung mittels
Streptavidin genutzt werden können. Eine zweite Oberflächenbeschich-
tungs-Variante besteht aus Adsorbatschichten von Polylysin - Poly-ethylenglycol-Copolymeren (PLL-g-PEG). Diese Polymere sind im
neutralen pH-Bereich positiv geladen und zeigen starke Adsorption an
negativ geladene Oxidschichten durch elektrostatische Wechsel¬
wirkungen. Die Polymerzusammensetzung wurde durch Anpassung der
Edukt-Molekulargewichte (Polylysin (PLL) bzw. Polyethylenglycol(PEG)) sowie der Bindungsverhältnisse (PEG/PLL) optimiert. Dadurch
konnten extrem tiefe Werte bezüglich nichtspezifischer Protein-
adsorption aus Vollserum (generell weniger als 3 ng/cm", was wenigerals 0.1 % einer Proteinmonolage entspricht), erreicht werden. Biotin-
Funktionalisierung mittels polymergebundener, endständig biotinylierterPEG-Ketten wurde verwendet um Biotin/Streptavidin-basierendeBioaffmitätsassays herzustellen und die Sensorik-Performance der
beiden Systeme zu vergleichen.
Es wurde gezeigt, dass beide Varianten ausgezeichnete Eigenschaftenin der Anwendung als generell verwendbare Oberflächen aufweisen, an
welche Streptavidin-konjugierte Erkennungsmoleküle immobilisiert oder,über eine Streptavidin-Zwischenschicht, Biotin-konjugierte Rezeptorengebunden werden können. Im Rahmen dieser Arbeit konnte gezeigt werden,dass mittels dieser definierten Oberflächen effektive Analyt-Konzentra-tionnen im femtomolaren Bereich nachgwiesen werden können. Auch in
Vollserum werden solche Nachweisgrenzen erreicht, ohne dass zusätzliche
Probenvorbereitungen wie Extraktion oder Fällungsreaktionen notwendigsind.
Die Kombination von optimierter Zwischenphasenchemie, optischemTransducer und der verwendeten Assay-Architektur ergeben ein hoch
leistungsfähiges System, das ein hohes Potential für die zukünftigeAnwendung auf dem Gebiet der Immunoassay-Sensorik hat.
14
I Introduction
I Introduction
Quantitative analytical methods in biomedical diagnosis require highsensitivity, high specificity and high reproducibility. Bioaffmity sensors are
tools which have the potential to fulfil these demands using the highlyspecific interaction of recognition molecules such as oligonucleotides, DNA-
sequences, enzymes or antibodies with their corresponding partners.
The trend in diagnostics is towards the early detection of health or
disease markers such as growth factors (e.g. intcrleukin) resulting in the
need for lower detection limits. The design and introduction of much more
efficient medicine replace drugs of higher dosage (such as the replacementof barbiturates by benzodiazepines in the past). For pre- and neo-natal
diagnostics, only a very small amount of biological material is at one's
disposal for analysis. Very low detection limits are the consequence of the
aforementioned facts of low target-molecule concentration and small
analytical material quantity. Biochemical recognition elements, such as
antibodies, enzymes or oligonucleotides are ideal functions for highlyspecific detection of target molecules. The oriented immobilization of such
recognition elements becomes increasingly important with the need of
miniaturization for the sensitive analysis of sample volumes in the microliter
scale.
We have demonstrate that capture molecules, such as antibodies or
enzymes, can be immobilized via hydrophobic-hydrophobic interactions
onto lipophilic surfaces. Alkyl phosphoric acids form hydrophobic, highlyordered self-assembled monolayers (SAMs) on planar waveguide (PWG)-surfaces. The specific binding of target molecules (e.g. antigen) to capturemolecules (e.g. monoclonal antibodies) and the subsequent specificadsorption of a tracer (e.g. fluorescent-labeled polyclonal antibodies) on
another moiety of the antigen is a widely used immunoassay setup. Within
the framework of this thesis, the immobilization of the recognitionmolecules such as antibodies or enzymes was performed in an oriented way,so as to avoid that a part of the recognition molecules is bound by the
bioactive moiety onto the surface. That would make the recognitionelements inaccessible for target molecules. Poor orientation of recognitionelements is believed to lower the sensitivity of the sensors. The non-specific
15
I Introduction
binding of target and/or tracer molecules onto the sensor surface can be
reduced by passivating the surface that is free of capture molecules bymeans of bovin serum albumin (BSA) [Wert, 1999].
The oriented binding of recognition molecules on the sensor surface is
the aim of many research groups. A straightforward way to oriented
immobilization of recognition molecules is to use the well known binding of
biotin to streptavidin [Anza,1993; Ahlu,1991]
We synthesized different derivatives of poly(L-lysine) grafted poly¬ethylene glycol) (PLL-g-PEG), which adsorb easily on negatively chargedsurfaces by Coulomb interaction due to the inherent positively chargedamino groups of the poly(L-lysine) backbone at neutral pH. BiotinylatedPLL-g-PEG (PLL-PEG/PEG-biotin) was synthesized by grafting of biotin
functionalized PEG. The copolymer has the advantage of imposing proteinresistance to the surface (very low non-specific binding of target molecules
and/or tracer) due to the PEG moiety [Hubb,2000] and allowing for defined
and oriented binding of either streptavidin conjugated recognition molecules
or biotin conjugated recognition molecules via a streptavidin interface. The
defined fraction of PEG-biotin gives us the possibility to find an optimum of
the binding density of recognition molecules at the surface.
The overall goal of this work is the design and development of a
biocompatible platform that fulfils defined performance criteria in a
bioanalytical assay. Specifically, the aim is to overcome existing limits for
ultra-sensitive detection without any loss of specificity. With the
introduction of such bioaffmity sensors, the time to result can be shortened
considerably, which is important for emergency analysis, for example. This
would also result in a much lower cost of routine analysis in human
diagnostics. The possibility of miniaturization of the detection area of such
sensor surfaces is needed for pre- and neo-natal diagnosis, biopsy samplesand in other fields where only small amounts of analytical material are at
one's disposal.
Selective detection of surface-bond fluorophores, specificallyrecognized by e.g. antibodies, can be achieved by evanescent field
detection. Introducing interface chemistries that allow oriented, reproducibleand stable immobilization of biochemical receptor molecules on top of
transducer surfaces increases the sensitivity of the bio-affinity sensor.
16
I Introduction
In terms of detection sensitivity, real-time monitoring and recognitionelements with high affinities are needed to detect analyte concentrations in
the femtomolar (10" ^M) range. The technique of fluorescence detection
using an optical evanescent field is shown to be suitable for detection of
target molecules in this concentration range. The system is not limited to
immunoassays. DNA/RNA detection is also possible when using recognitionunits based on oligonucleotides. This makes it an important generaltechnique for future bioanalytical research and application in genomics and
proteomics .
17
TT Theory
II Theory and Background
1 Biosensor Technology [Spic.1998]
The expression "biosensor" has not been clearly defined until now
[Jana, 1998]. The definition of functionality, components and types of
sensors were proposed by IUPAC (International Union of Pure and AppliedChemistry) in 1991 [Hula, 1991].
Living organisms possess exquisite recognition elements such as
enzymes, antibodies or gene probes, often referred to bioreceptors, which
allow specific interaction and detection of complex chemical or biologicalspecies. The basic setup of a biosensor includes such biological elements, as
well as transducer elements such as an electrode, an optical device or a
piezo-electric crystal. In a biosensor setup, the bioreceptor either converts an
analyte (enzymatic reaction) or recognizes the analyte (antibody-antigenreaction or DNA-probe). The transducer transforms either the primarybiochemical reaction (e.g. consumption of substrate by an enzyme, changeof current or increase in mass) or the secondary chemical reaction (e.g.further reaction of enzymatically decomposed substrate) into a quantifiableoptical or electrical signal. This signal is amplified, processed and displayedin a suitable form. Biosensors combine the specificity and sensitivity of
biological recognition systems with the optimized processing of data.
[Higg,1987]
The choice of recognition element and transducer depends on the
application, the selectivity and the sensitivity demands on the system as well
as on the physico-chemical properties of the samples (gas, liquid, pH, etc.).
18
II Theory
Biosensor applications range from clinical analysis in diagnostics[McNe,1993] through environmental [Roge,1992], agricultural [Desh,1993],and nutrition research [Desh,1994] to process controlling [Sehe, 1987].
1.1 Recognition Elements
Antibodies (Ab) are highly specific recognition biomolecules. From the
chemical point of view, they are proteins, being produced in living species(e.g. animals) by an immuno reaction against a substance that the organismhas been exposed to (e.g. via injection). Typically, antibodies are extracted
from blood, livers or hen eggs and purified by chromatography, for example.Their binding to the corresponding antigens is very complex and takes into
account the shape and the charge of the binding sites of the connectingmoieties. Antibodies can be divided in two groups: monoclonal and
polyclonal. Monoclonal antibodies have a recognition site that binds to one
specific part of the antigen, while the polyclonal consist of a mixture of
antibodies that bind to different parts of one target molecule species. The
antigens are proteins, polysaccharides or organic substances, such as drugsand their metabolites.
Enzymes are also proteins that decrease the reaction energy barrier and
allow (bio)chemical reactions to proceed under mild conditions. In other
words they are biocatalysts. Enzymes are used as recognition elements in
sensors where on-line monitoring or long-term measurements are needed.
The redox reaction is electronically detected. The most well-known exampleis the glucose oxidase (GO) enzyme, immobilized for biosensing [Situ,1998; Kuma, 2000]. Another application of enzymes in bioaffmity assays is
their use as tracers (e.g. in enzyme linked immunosorbent assay, ELISA),where surface-bound target molecules react with enzyme-conjugatedantibodies. The surface containing the specifically bound enzyme is rinsed
and brought in contact with enzyme-substrate. The converted amount of
substrate is then detected by an indicator. The most prominent tracer enzymeis horseradish peroxidase.
19
II Theory
The specificity of the binding of both the antibodies and the enzymes
with their binding partners can be visualized by the key-and-lock analogy.
The sensitivity (detection limit) is proportional to the affinity of a
recognition molecule for its target molecule. The affinity constant is the
product of the association (building of antigen-antibody complex) and
dissociation constants.
1.2 Immobilization of Recognition Elements
The immobilization of antibodies and enzymes [Situ, 1998] is not easy,
since the binding or reacting part of the recognition molecules must not be
negatively affected during the immobilization process and must be available
for the target molecules in a similar manner as in the non-immobilized form
[Naka,1996, Huan,1996; Alar,1990; Vikh,1998] (specific and/or non¬
specific binding of recognition molecules). The substrate, on which the
recognition molecules should be immobilized, must also not adsorb the
target molecule itself [Lin, 1991; Ahlu,1991] (specific and/or non-specificbinding of target molecules). In addition, the immobilization of Abs can
result in a deformation of the recognition molecules due to dense packing or
confining of flexibility (steric hindrance) or may lead to denaturation of the
recognition molecules resulting in a decreased activity [Lu,1996]
(Scheme 1). On the other hand, it is important to form a stable binding of the
biomolecules at the transducer surface, in order to make sure that the
recognition molecules do not desorb during the analytical assays.
20
II Theory
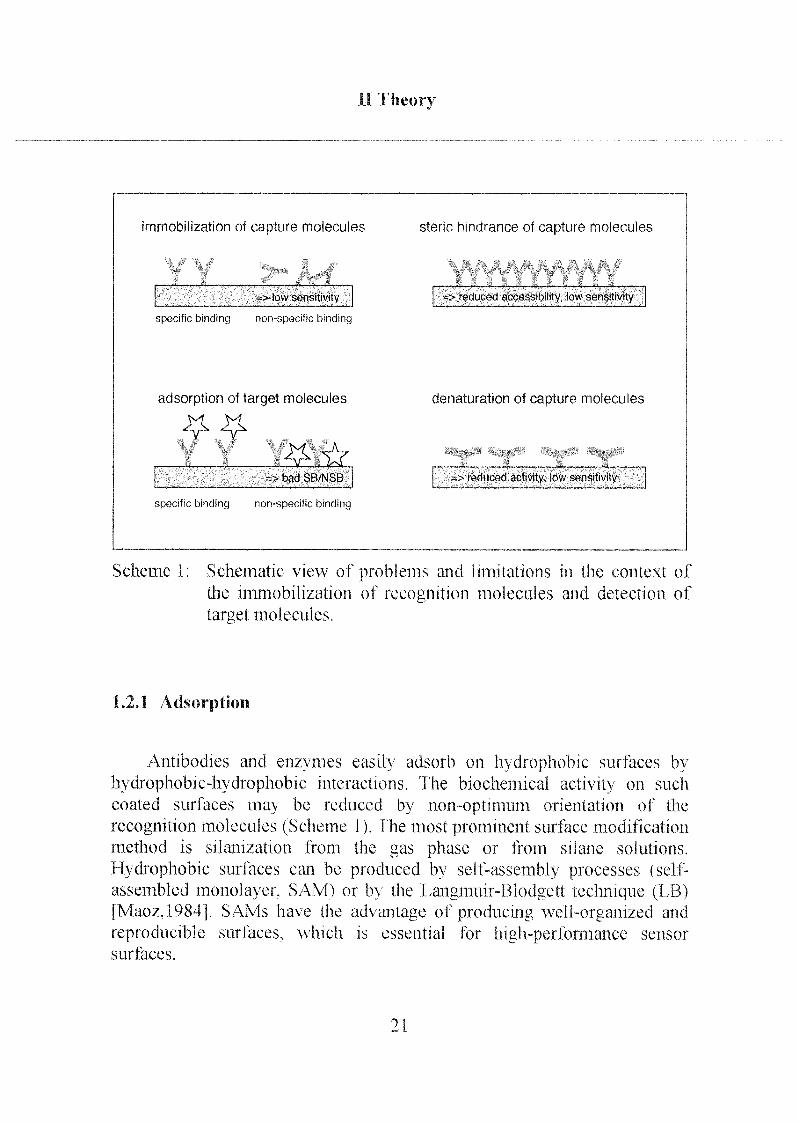
immobilization of capture molecules steric hindrance of capture molecules
v\x
\ V
s> tow sensitivity => reduced accessibility, low sensitivity
specific bmdinq non specific binding
adsorption of target molecules denaturation of capture molecules
\ »
=> bad SB/NSB => reduced activity, low sensitivity
specific binding non-specific bmdinq
Scheme 1 Schematic view of problems and limitations m the context of
the immobilization of recognition molecules and detection of
target molecules
1.2.1 Adsorption
Antibodies and enzymes easily adsorb on hydrophobic surfaces byhydrophobic-hydrophobic interactions Ihe biochemical activity on such
coated surfaces ma) be reduced by non-optimum orientation of the
recognition molecules (Scheme 1) The most prominent surface modification
method is silamzation from the gas phase oi from silane solutions
Hydrophobic surfaces can be produced b\ self-assembly processes (self-assembled monolayer. SAM) or b\ the Langmuir-Blodgett technique (LB)[Maoz, 1984] SAMs have the advantage of producing well-organized and
reproducible surfaces, which is essential foi high-perlormancc sensor
surfaces
21
II Theory
1.2.2 Covalent Binding
Covalent binding to the sensor surface is a technique that offers the
chance to control the orientation and functionality of the recognitionmolecules [Will, 1994; Lösc,1998]. However, functionality and orientation
depend on the recognition element of interest and might show considerable
variation from protein to protein. The reaction of primary amino-groups of
the Ab with succinimidyl-terminated surface adlayers [Pate, 1997] or the
addition reaction of thiol groups to maleimidyl-terminated molecules are the
most successful methods [Shri,1997] to date. Both immobilization methods
are classical chemical reactions.
1.2.3 Binding through Biotin-Streptavidin-Link
Biotin binds to streptavidin with very fast adsorption kinetics and highaffinity (affinity constant Kaff in solution = 10bM"*). The big advantage of
this method is the specificity of the binding and the mild reaction conditions
(in comparison to covalent immobilization) under which the adsorption takes
place [Spin, 1993]. The reaction molecules can simply be dissolved in a
buffer (e.g. phosphate buffer saline, PBS) and brought into contact with the
fiinctionalized transducer surface. For this method one is free to choose an
Ab or an enzyme that is conjugated with streptavidin to link it to a
biotinylated surface or vice versa. Furthermore, the blotin-streptavidinbinding is stable over a wide range of pH-values and even in aqueous
solutions containing organic solvents.
Biotin is a small molecule (Mr = 244 g/mol) that can be found in eggsand in living cells.
Streptavidin is a protein with a molecular weight of 60 - 75 kDa
(kg/mol) and can be isolated from Streptomyces avidinii. One molecule
possesses four binding sites for biotin.
22
II Theory
1.3 Transducer Technique
The transducer transforms the binding of target molecules into a
measurable signal. For this transformation, different physical or chemical
principles can be used [Kric,1993]. Biosensors can be divided into different
classes based on transducing mechanisms such as optical, electronical,thermal or piezoelectrical methods.
Biosensors are prominently based on immobilized antibodies or
enzymes. In the case of immunoassay, analytes (antigens) bind to the
surface-immobilized antibodies (Ab) with high specificity to build antibody-antigen complexes. The stability of such complexes depends on the affinityconstant and varies from Ab to Ab and from antigen to antigen. The
quantification of target molecules is performed by direct measurement of
adsorbed antigens (e.g. detection of mass adsorption), of tracers on them or
by addition of secondary labeled antibodies(e.g. fluorescence detection).
The molecular recognition of enzymes is similar to that of the
immunoassay system. Adsorbed target molecules (substrate) react duringcomplexation with the enzymes (e.g redox reaction). The activity of the
enzymes depends on the adsorption-, reaction- and desorption-kinetics, and
may be considerably influenced by environmental parameters, such as
temperature, pH or immobilization (such as for antibody-antigen systems).The quantification of target molecules is often performed by electronic
determination (amperometry) of the redox reaction or by optical detection of
decomposed substrate or by further reaction thereofwith an indicator.
The combination of both the immunoassay and the enzymatic reaction
is realized in the case of enzyme linked immunosorbed assay (ELISA),where the tracer is chosen in the form of an enzyme-conjugated antibodythat binds to immobilized antibody-antigen complexes. The concentration of
bound enzyme-antibody conjugate is then determined after rinsing (removalof non-bound tracer) and subsequent application of substrate. The amount of
decomposed substrate is proportional to the analyte concentration and is
measured by means of photometry.
23
TT Theory
1.3.1 Detection Methods
Optical methods (absorption, luminescence and index of refraction),surface-plasmon resonance (SPR) [John, 1991; VanG,1991], electrochemical
methods and piezo-electrical methods (frequency of piezo crystals) are the
most prominent techniques for biosensor transducers.
1.4 Specific and Non-Specific Binding
A real problem in the biosensor technique (as well as in other analyticaltechniques) for the detection of proteins or nucleic acids is the non-specificadsorption of target molecules at the surface causing a loss of sensitivity of
the system. The non-specific binding of tracer (= fluorescent-labelled
analyte or marker) increases the background signal and reduces the
sensitivity and the detectability range of the system as well. To increase the
concentration limit and to decrease the detection limit at the same time, it is
necessary to design a densely packed layer of recognition molecules on a
protein-repulsive interface. In the case of hydrophobically adsorbed Abs, the
non-occupied space between the recognition molecules can be passivatedwith albumin (e.g. BSA), which blocks the area for non-specific adsorptionof target and/or tracer molecules.
In the case of covalently bound Abs or binding via biotin-streptavidin,the backbone can be chosen as a suitable polymer structure, which adsorbs a
lot of water (e.g. poly(ethylene glycol) copolymers). These water-like
surfaces have excellent protein repulsion effects and give enough flexibilityto the Abs to allow them to keep their original shape for a maximum
activity.
24
II Theory
2 Optical Sensors
Evanescent field waveguide optical sensors can be divided into two
groups: planar sensors and fibre-optic sensors [Abel, 1995; Duve,1995;
Nath,1997]. Both are based on detection using the evanescent field
technique (details see chapter II 2.2).
The simplest detection method with waveguide optical sensors is to
measure the light absorption by the analyte: Monochromatic light is sent
through the waveguide. The absorption of the light at the same wavelength is
measured at the end of the sensor and is proportional to the quantity of
adsorbed analyte.
If higher sensitivity is desired, the fluorescence technique can be used:
Again, monochromatic light is sent through the waveguiding layer and
fluorophores at the sensor surface are excited. The measured light intensity(fluorescence light wavelength) is proportional to the analyte concentration.
Usually the target molecules are not fluorescent and must be labelled for
detection. The monitoring of fluorescence extinction (quenching) upon
binding of the analyte is a further method that is used e.g. in the case of
oxygen sensors (e.g. oxygen/Ru-complex). The disadvantage of fluorescent
tracers is the bleaching of the fluorophore during the illumination, as well as
the binding characteristics of the tracer molecules, which might change due
to the labeling. This may cause a problem in lenghty investigations.
An already-established method for detecting electro-chemilumines-
cence is the use of ruthenium-bipyridin complexes as tracers for the
detection of nucleic acids.
The change of the refractive index, due to the adsorption of targetmolecules at the sensor surface, is a method for the investigation of small
molecules, macromolecules as well as living cells. The disadvantage when
detecting the change of the refractive index is that the adsorption of anysubstance or small variations in the solvent composition may influence the
result.
Optical sensors have the advantage that they are much less affected byelectromagnetic fields from the environment, e.g. in an emergency room, in
comparison to electrochemical methods. The investigation of living cells and
25
II Theory
the study of the biocompatibility of materials in real time is possible. The
fact that optical sensors are easily miniaturizable allows for the possibility of
on-line quantification of substances in human and veterinary medicine.
Optical sensors are not limited to conductive liquids; investigations in gas or
even in organic solvents are, in principle, possible. Variations in the bulk
solution composition do not influence the signal directly, except in the case
of systems that are based on the measurement of the refractive index.
2.1 Principle of the Optical Waveguide Technique
Snell's law describes the refraction of an incident light beam at the
interface of two transparent materials (equation 1 ). If the beam penetratesthe material interface from the optically denser material into the opticallyless dense material, the beam is refracted along a larger angle with respect to
the surface normal (Scheme 2). If the refraction angle (oci) corresponds to
the surface parallel (90°), the incident beam angle is called the critical angle.Above the critical angle, the light is totally reflected. If a high refractive
material is in between two low refractive materials, a light beam below the
critical angle is repetitively (or internally) totally reflected (Scheme 3). Such
materials are called waveguide layers. Light can be launched into such a
waveguide layer by means of an incoupling grating. If the thickness of such
a waveguide layer is smaller than the wavelength of the incoupled light, the
wave-guide behavior can not be described by the simple internal total
reflection model anymore. Nevertheless the light is still transported throughsuch high refractive interfaces (Scheme 4).
sin a, /?,.
.
1X= —^
(equation 1)sin a, n{
26
II Theory
b)
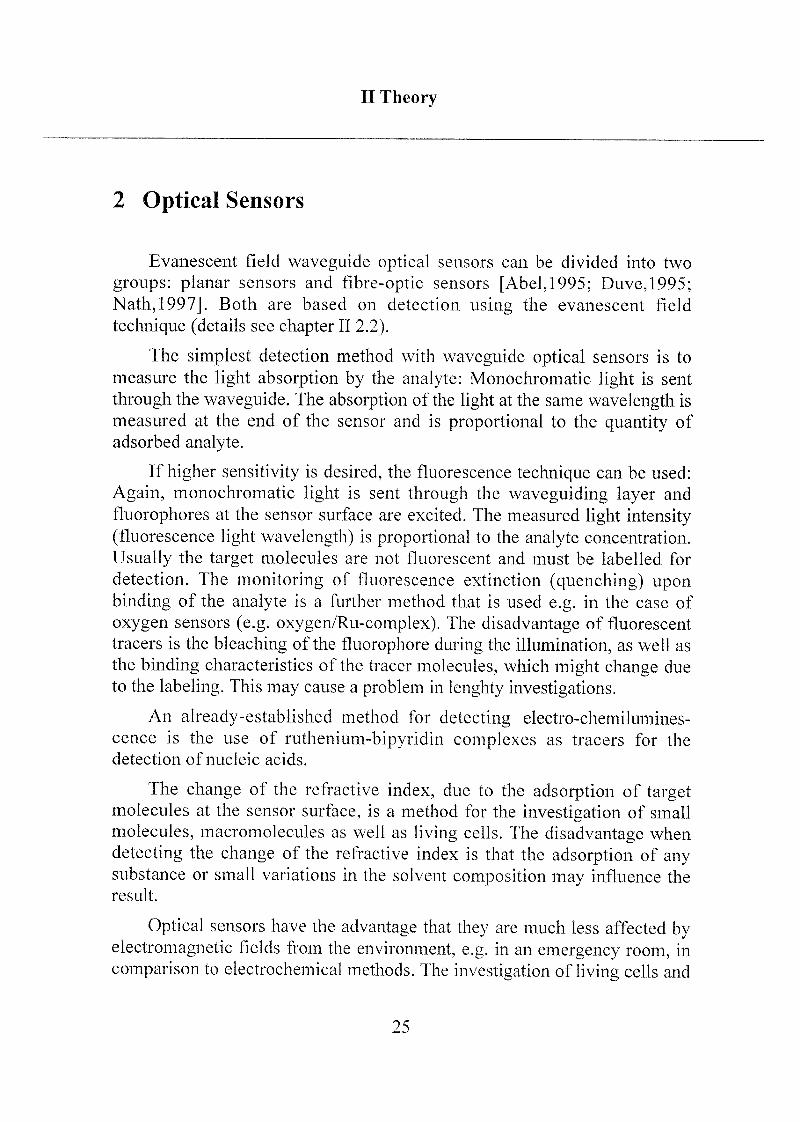
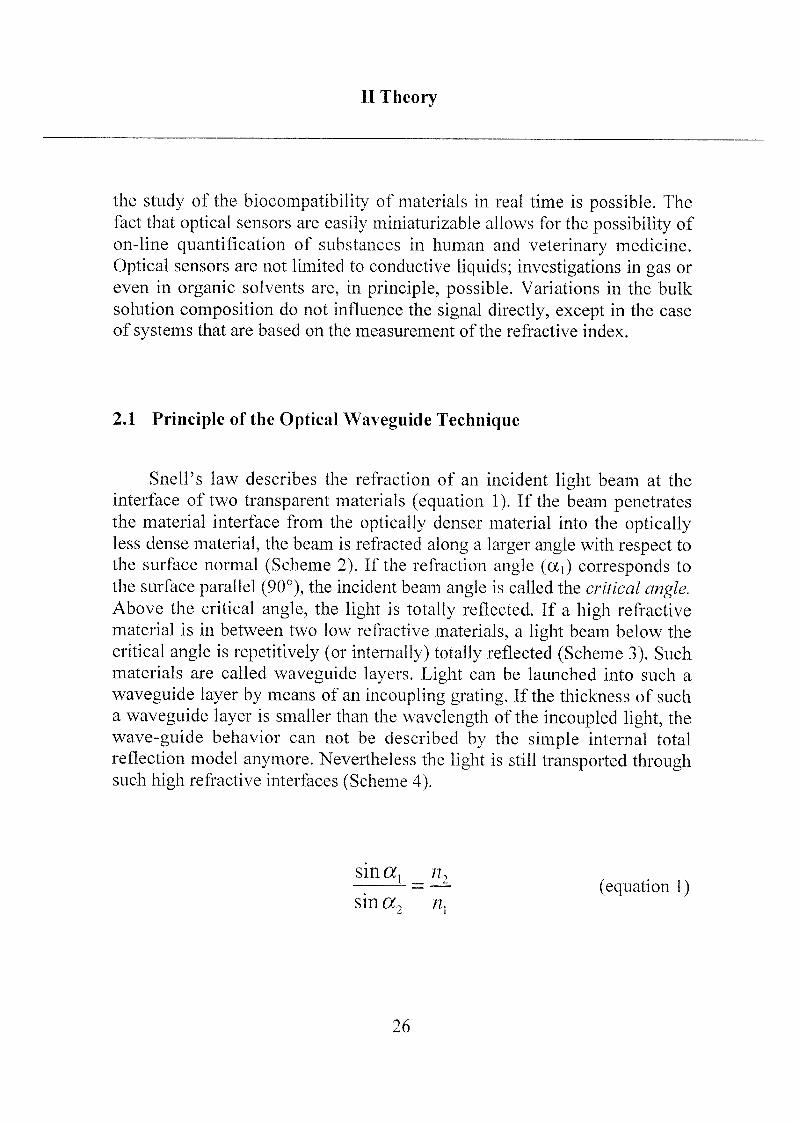
Scheme 2: Possibilities of behavior of a light beam penetrating the
interface of two materials with different optical densities,
a) refraction, b) critical angle and c) reflection.
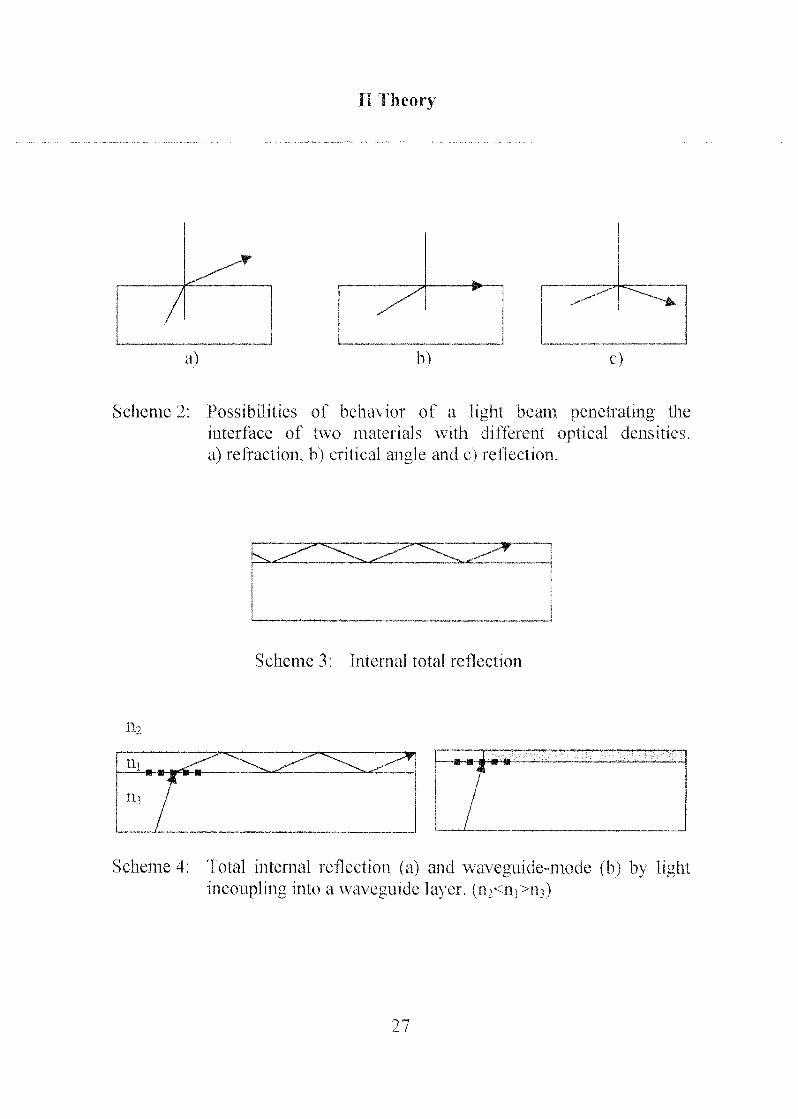
Scheme 3: Internal total reflection
n2
Scheme 4; Total internal reflection (a) and waveguide-mode (b) by lightincoupling into a waveguide layer, (n2<ni>nO
li Theory
2.2 The Evanescent Field
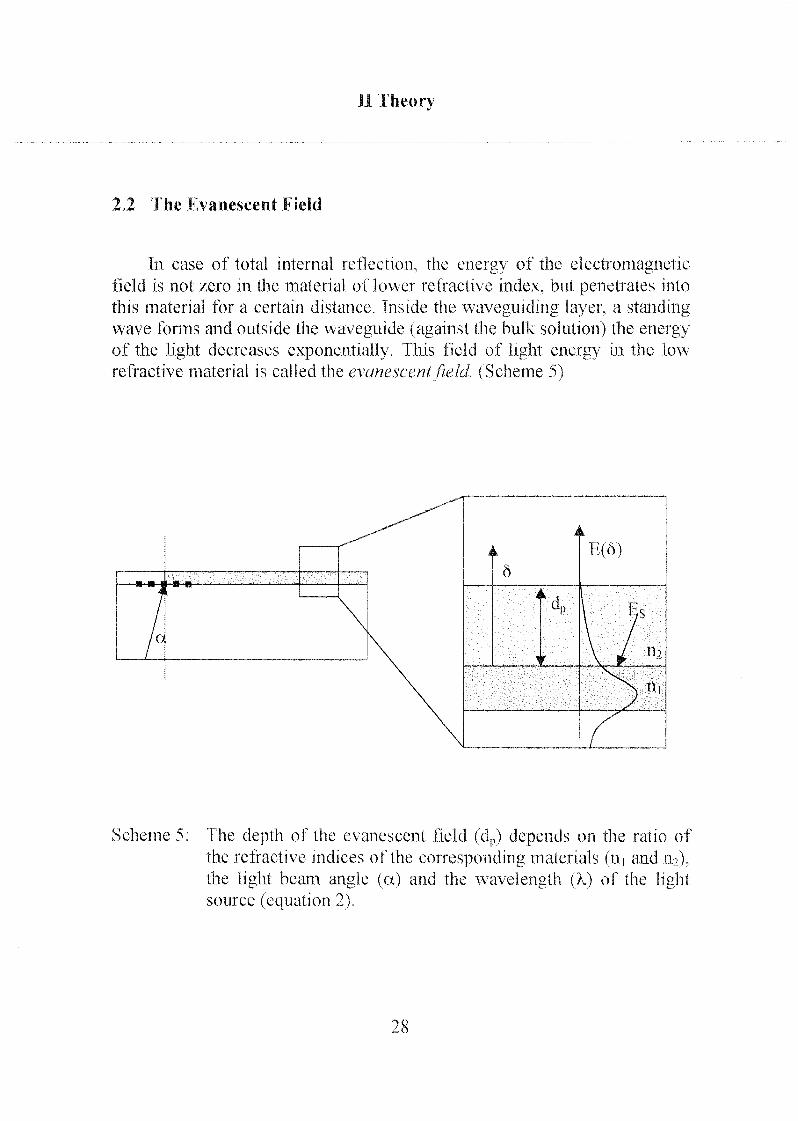
In case of total internal reflection, the energy of the electromagneticfield is not zero in the material of lower refractive index, but penetrates into
this material for a certain distance. Inside the waveguiding layer, a standingwave forms and outside the waveguide (against the hulk solution) the energy
of the light decreases exponentially. This field of light energy in the low
refractive material is called the evanescentfield. (Scheme 5)
i
a
<
ô
I
dp
r
\ /\ 1 n2
^\ til
r
Scheme 5: The depth of the evanescent field (dp) depends on the ratio of
the refractive indices of the corresponding materials (nL and iii).the light beam angle (a) and the wavelength (k) of the lightsource (equation 2).
28

II Theory
d = =, (equation 2)2/r-«2 -a/w^ -snr a-1
with n,-111
rel*
1U
The energy of the evanescent field at a certain distance from the surface
can be calculated using equation 2 (equation 3),
E(8) = Es e" p(equation 3)
where 8 is the distance from the surface, E(8) is the amplitude of the
electromagnetic field at the distance 8 and Es is the amplitude at the surface.
The angle a depends on the grating periodicity and the light wavelengthX (equation 2). The intensity maximum of the evanescent field is reached at
the critical angle.
The evanescent field vector is parallel to the surface and has no
component parallel to the surface normal. For an ideal, flat waveguidesurface (no diffraction) there is no loss of energy and the evanescent field
thickness is finite (dp). Surface-adsorbed substances that are able to absorb
light with the corresponding energy are excited. The excitation leads to a
loss of energy (light attenuation) which is used as an analytical technique(attenuated total reflection, ATR). The relaxation (fluorescence) of such
molecules can be measured as well.
29
11 Theory
2.3 Analytical Methods with Optical Waveguide
2.3.1 Change of Refraction Index [Krög.1998]
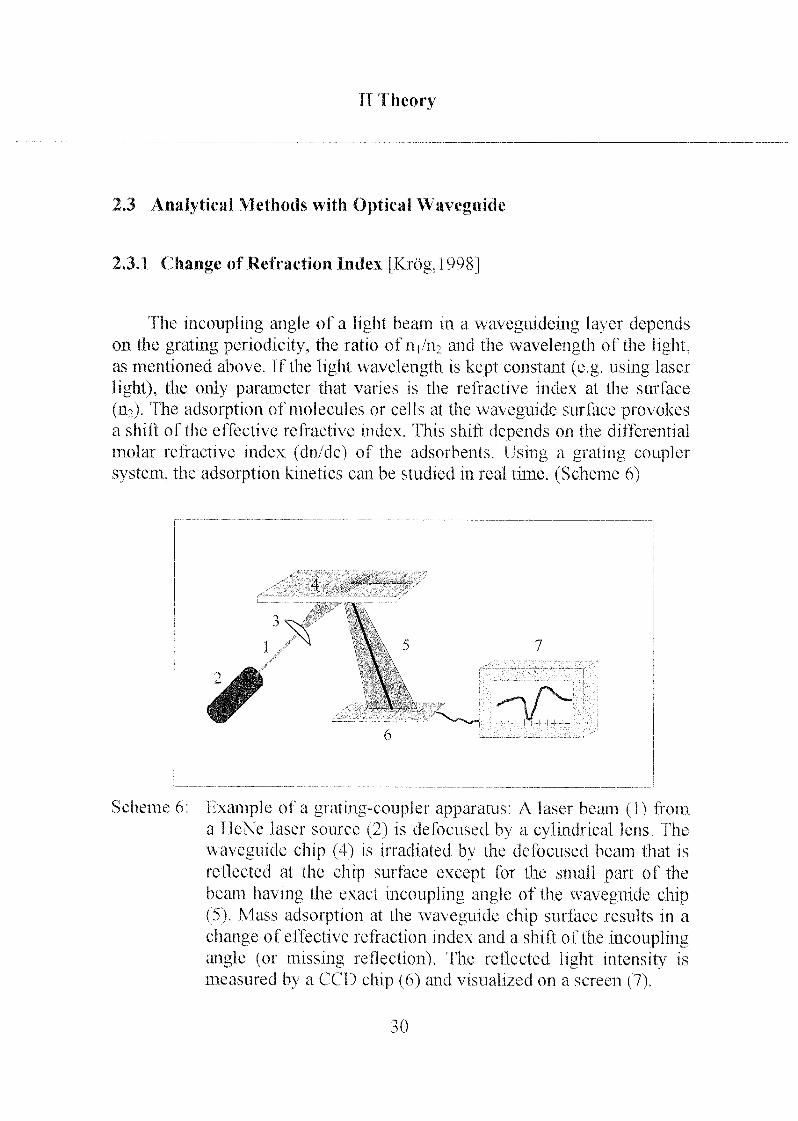
The incoupling angle of a light beam in a vvaveguideing layer dependson the grating periodicity, the ratio of iVm and the wavelength of the light,as mentioned above. If the light wavelength is kept constant (e.g. using laser
light), the only parameter that varies is the refractive index at the surface
(n2). The adsorption of molecules or cells at the waveguide surface provokesa shift of the effective refractive index. This shift depends on the differential
molar refractive index (dn/dc) of the adsorbents. Using a grating coupler
system, the adsorption kinetics can be studied in real time. (Scheme 6)
3\\
•L_L_
*I I 1 L|
Scheme 6: Example of a grating-coupler apparatus; A laser beam (1) from
a TleNe laser source (2) is de focused by a cylindrical lens. The
waveguide chip (4) is irradiated b> the defocused beam that is
reflected at the chip surface except for the small part of the
beam having the exact mcoupling angle of the waveguide chip(5). Mass adsorption at the waveguide chip surface results in a
change of effective refraction index and a shift of the incouplingangle (or missing reflection). The reflected light intensity is
measured by a CCD chip (6) and visualized on a screen (7).
30
II Theory
2.3.2 Fluorescence Measurement
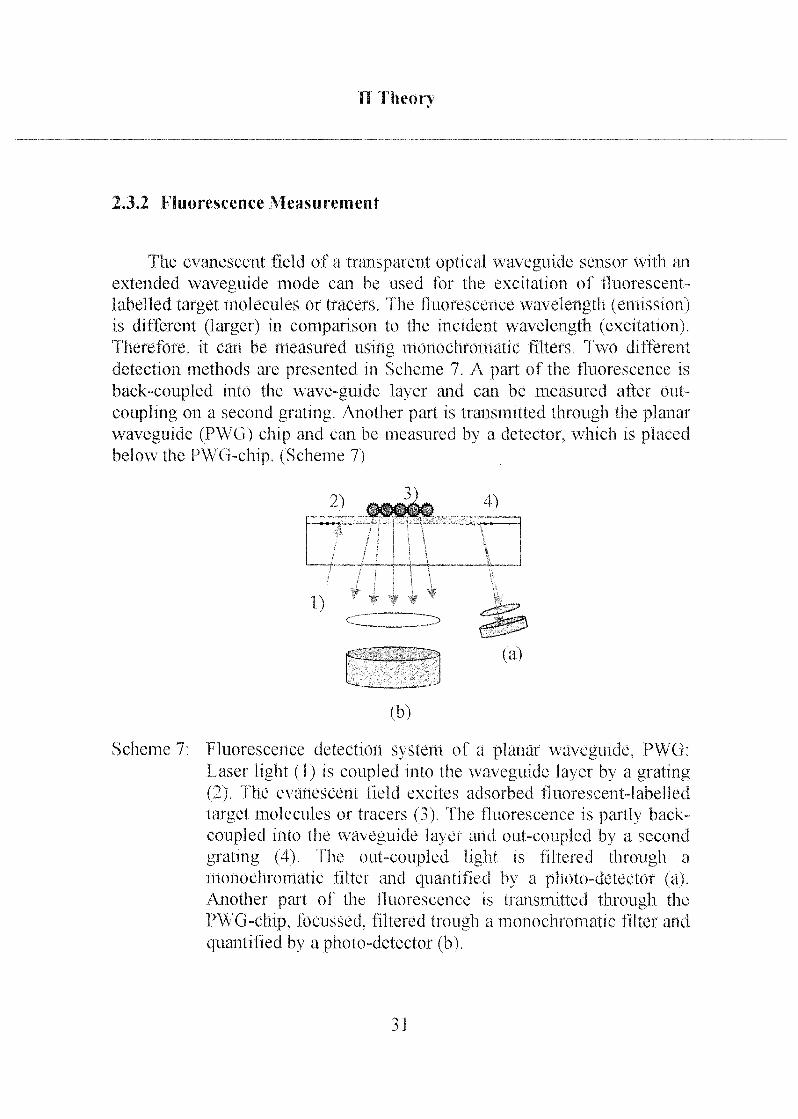
The evanescent field of a transparent optical waveguide sensor with an
extended waveguide mode can be used for the excitation of fluorescent-
labelled target molecules or tracers. The fluorescence wavelength (emission)is different (larger) in comparison to the incident wavelength (excitation).
Therefore, it can be measured using monochromatic filters. Two different
detection methods are presented in Scheme 7. A part of the fluorescence is
back-coupled into the wave-guide layer and can be measured after out-
coupling on a second grating. Another part is transmitted through the planarwaveguide (PWü) chip and can be measured by a detector, which is placedbelow the PWG-chip. (Scheme 7)
Scheme 7;
2)3)
4)
\
** V 1 *
C-~~~___ J^>
pen .:5j (a)
(b)
Fluorescence detection system of a planar waveguide, PWG:
Laser light (1) is coupled into the waveguide layer by a grating(2). The evanescent field excites adsorbed fluorescent-labelled
target molecules or tracers (3). The fluorescence is partly back-
coupled into the waveguide layer and out-coupled by a second
grating (4). The out-coupled light is filtered through a
monochromatic filter and quantified by a photo-detector (a).Another part of the fluorescence is transmitted through the
PWG-chip, focussed, filtered trough a monochromatic filter and
quantified by a photo-detector (b).
31
Ill Materials and Methods
III Materials and Methods
1 Substrate Material and Chemical Products
1.1 Substrate
The substrate for optical biosensor chips has to fulfil special demands:
A high refractive index of the waveguide layer is needed for a total internal
reflection. A high transparency, very low roughness of the surface and
amorphous (to semi-crystalline) state of the material is needed to get a
minimum of light energy loss within the waveguide layer.
Most of the surface modifications were studied on different metal oxide
films (tantalum pentoxide, niobium oxide and titanium oxide) as well as on
metal surfaces (titanium and aluminum). Particular investigations were
performed using additional types of metal oxide substrates.
1.1.1 Metal Oxides
Tantalum pentoxide (Ta2Os), niobium oxide (Nb205) and titanium oxide
(TiC>2), have a semi-crystalline to amorphous structure. The surfaces have a
roughness in the sub-nanometer range (Ta205 and ND2O5) or in the
nanometer range (TiC^), respectively [Xiao, 1999].
The low-temperature form of Ta20s (L- Ta20s, below 1360°C) is
characterized by chains built from octahedral (and partly bipyramidal)coordination groups [Well, 1991; Step, 1971]. These chains are linked to each
other by edge and vertex sharing to form the 3D network and satisfy the
overall stoichiometry Ta02.5. The coordination number in the bulk structure
of Ta205 is 6 and 7. The relative proportion of the different structural
elements, however, varies depending on the synthesis conditions; Ta205 (as
32
Ill Materials and Methods
well as other M205 oxides such as Nb205) shows a pronounced tendency to
polymorphism orpolytypism [Cott,1988].
Niobium oxide shows the formation of blocks of different size and
different coordination between these blocks. In Nb25062 [Roth, 1965] (3 x 4)-blocks are formed with vortex-shared octahedral coordination of the metal
atoms within the blocks and edge-sharing between the blocks. In Nb20s
[Gate, 1964] blocks of (3 x 5) octahedra are joined at one level to form
infinite planar slabs, and these slabs are further linked by (3 x 4)-blocks.Tetrahedral holes, some of which are occupied by metal atoms, are built in
between these blocks. In Nb2Os 27 Nb atoms in the unit cell are in positionsof octahedra coordination and 1 Nb occupies a tetrahedral hole. The relative
proportion of the different structural elements, however, varies depending on
the synthesis conditions.
Ti02 forms monocrystals in an assembly of edge-shared octahedra
[Well, 1984] (Anatase) and in tetragonal structure (Rutile) consisting of
chains of Ti06 octahedra in which each octahedron shares a pair of oppositeedges, which are further linked by shared vertices to form 3D structure of
6:3 coordination [Well, 1984].
150 nm Ta205 or Nb205 coating was deposited on Corning 7059 glassby physical vapor deposition (sub-nanometer average roughness, from
Balzers AG, Liechtenstein). The Ti02 films (20 nm) were deposited by a
sputter-coating process on commercial glass (PSI, Villigen, CH). The
average Ti02 substrate roughness is in the nm range [Kurr,1997].
AF45 glass chips (8 x 12 mm) were coated by a 150-nm-thick mixed
titanium-silicon oxide layer (Tio.4Sio.602). For the studies on iron oxide
(Fe203), zirconium oxide (Zr02) and silicon oxide (Si02), an additional layerof-14 nm of the corresponding metal or semi-metal oxide was applied at the
Tio.4Sio602 layer using a magnetron sputtering unit. The samples were
purchased from Microvacuum, Ltd. (Budapest, Hungry).
33
Ill Materials and Methods
1.1.2 Metals
Titanium metal and aluminum metal surfaces spontaneously form a
natural amorphous oxide film. Therefore, the adsorption mechanism takes
place at the metal oxide in both cases. The thickness of the oxide film, whichacts as protecting layer against corrosion, can be increased by anodizing the
bare metal.
Titanium metal (100 nm) films were deposited by a sputter coatingprocess on silicon wafers (PST, Villigen, CH). Aluminum was received in
electro-polished form (25 V anodization polish) and in high-brilliance-rolledform with a natural oxide layer (Algroup Alusuisse, Neuhausen, CH). The
average metal oxide surface roughness is in the nm range.
1.1.3 GoldAdlayer
Long-chain alkyl thiols, such as octadecyl thiol form highly ordered
self-assembled monolayers (SAMs) on gold. The high stability of these
SAMs is due to the complex binding between the soft ligand and the soft
metal, as well as the Van der Waals interaction between the alkyl chains.
Thiol-SAMs on gold surfaces are well known and reported [Ulma,1990;Poir,1996; Wood, 1996a]. The stable bonding to gold and different available
bifunctional amphiphiles make it an interesting system. Biosensor, based on
gold adlayers can not be applied on the optical waveguide setup, since the
gold layer is opaque. If it were possible to adsorb a transparent gold salt onto
metal oxide surfaces such as Ta205, gold ions could work as an interface
between the thiol group and wave guide layer.
This was the motivation to deposit gold chloride from an aqueoussolution onto the tantalum oxide chips described above. The coating protocoland the SAM-formation tests are described in chapter IV 2.2.1.
34
Ill Materials and Methods
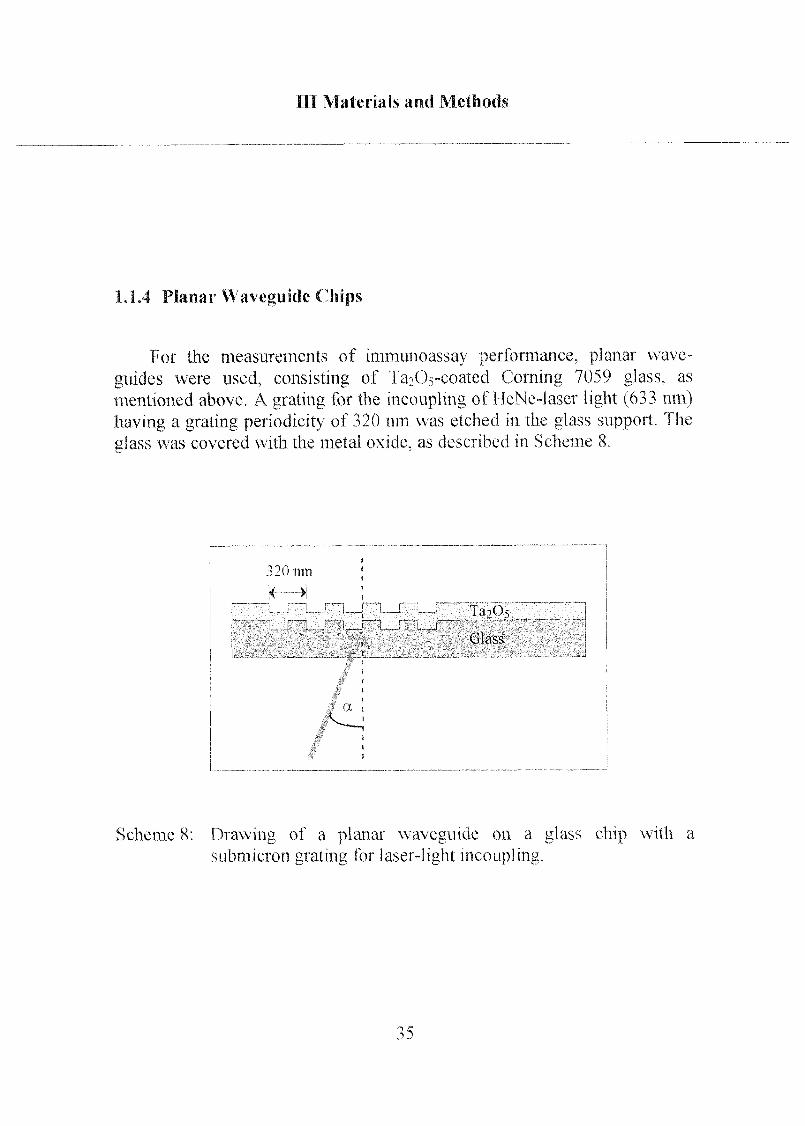
1.1.4 Planar Waveguide Chips
For the measurements of immunoassay performance, planar wave¬
guides were used, consisting of 1 a->(Vcoated Corning 7059 glass, as
mentioned above A grating for the mcouplmg of HeNe-laser light (633 nm)
having a grating periodicity of 320 nm was etched in the glass support The
glass was covered with the metal oxide, as described m Scheme 8
î20 nm
< »
a
SchemeS Drawing of a planar waveguide on a glass chip with a
submicron grating for lasei-light mcouplmg
35
Ill Materials and Methods
1.2 Adsorbents
1.2.1 Organic Phosphoric and Phosphonic Acids
Different organic phosphoric and phosphonic acids were used to studyadsorption onto metal oxide surfaces. The monofunctional amphiphilesdodecyl phosphonate (DDPO3), dodecyl phosphate (DDPO4), tetradecylphosphate (TDPO4), hexadecyl phosphate (HDPO4), octadecyl phosphonate(ODPO3), octadecyl phosphate (ODP04) and biphenyl phosphate (BIPH)were compared to the bifunctional amphiphiles 12-hydroxydodecyl phos¬phate (OH-DDPO4) and 12-(N-ethylamino)dodecyl phosphonate (NEt-DDPO3).
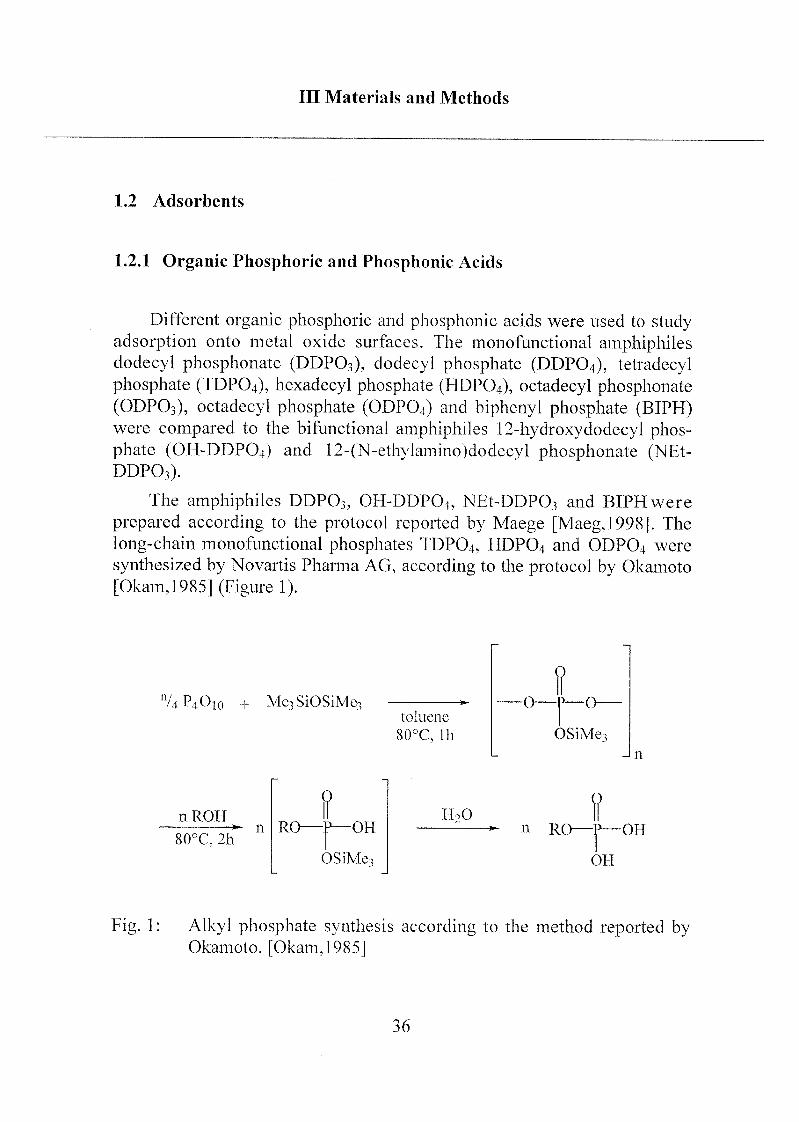
The amphiphiles DDPO3, OH-DDP04, NEt-DDP03 and BIPH were
prepared according to the protocol reported by Maege [Maeg,1998]. The
long-chain monofunctional phosphates TDPO4, HDPO4 and ODPO4 were
synthesized by Novartis Pharma AG, according to the protocol by Okamoto
[Okam,1985] (Figure 1).
% P4010 Me3SiOSiMe3toluene
80°C, Ih
-o-
?-o
OSiMe3
n
n ROH
~80oC, 2h"
0
R(> -OH
OSiMe,
11,011 R( -OH
OH
Fig. 1: Alkyl phosphate synthesis according to the method reported byOkamoto. [Okam,1985]
36
Ill Materials and Methods
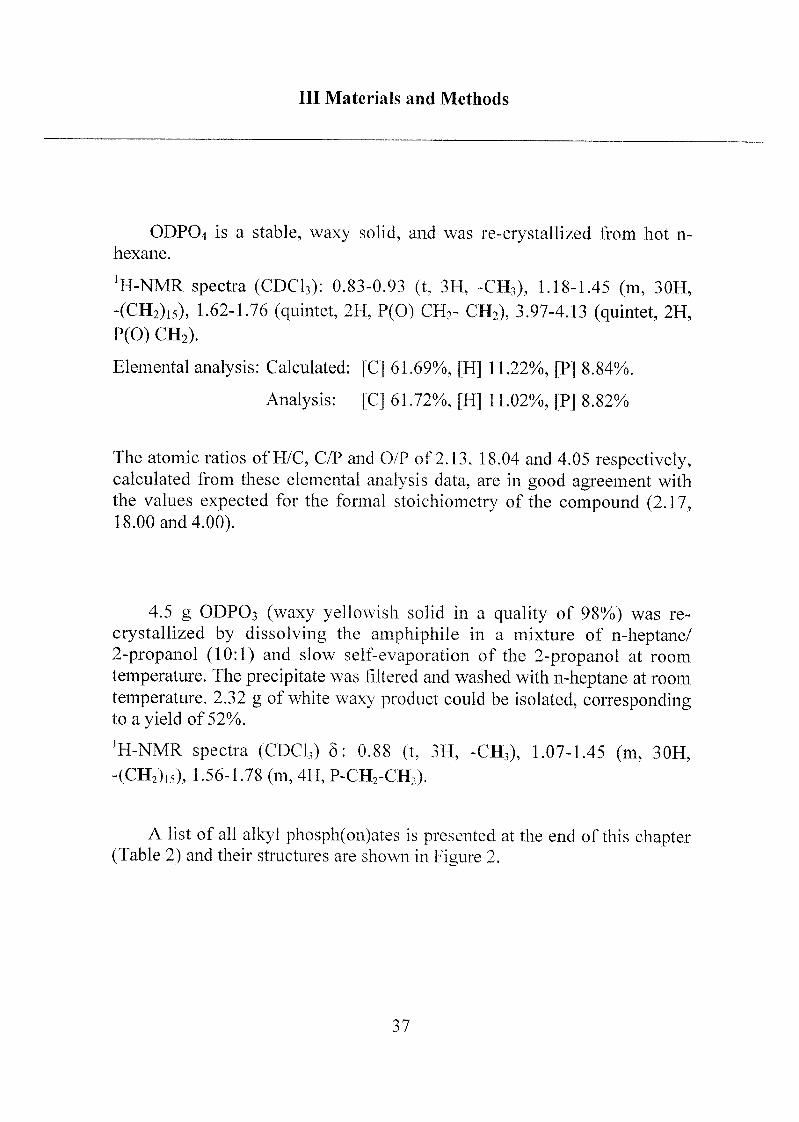
ODPO4 is a stable, waxy solid, and was re-crystallized from hot n-
hexane.
]H-NMR spectra (CDC13): 0.83-0.93 (t, 3H, -CH3), 1.18-1.45 (m, 30H,
-(CH2)l5), 1.62-1.76 (quintet, 2H, P(O) CH2- CH2), 3.97-4.13 (quintet, 2H,
P(O) CH2).
Elemental analysis: Calculated: [C] 61.69%, [H] 11.22%, [P] 8.84%.
Analysis: [C] 61.72%, [H] 11.02%, [P] 8.82%
The atomic ratios of H/C, C/P and O/P of 2.13, 18.04 and 4.05 respectively,calculated from these elemental analysis data, are in good agreement with
the values expected for the formal stoichiometry of the compound (2.17,18.00 and 4.00).
4.5 g ODPO3 (waxy yellowish solid in a quality of 98%) was re-
crystallized by dissolving the amphiphile in a mixture of n-heptane/2-propanol (10:1) and slow self-evaporation of the 2-propanol at room
temperature. The precipitate was filtered and washed with n-heptane at room
temperature. 2.32 g of white waxy product could be isolated, correspondingto a yield of 52%.
'H-NMR spectra (CDC13) 6: 0.88 (t, 3H, -CH3), 1.07-1.45 (m, 30H,
-(CH2)]5), 1.56-1.78 (m, 4H, P-CH2-CH2).
A list of all alkyl phosph(on)ates is presented at the end of this chapter(Table 2) and their structures are shown in Figure 2.
37
Ill Materials and Methods
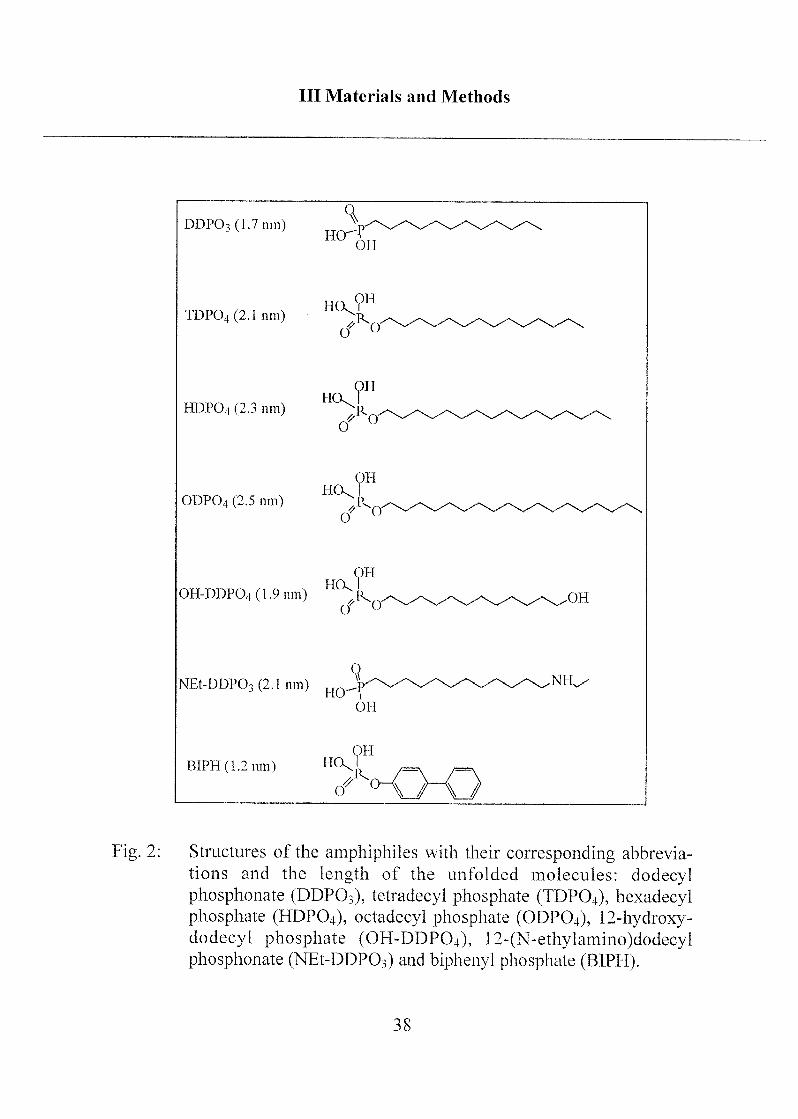
Fig. 2: Structures of the amphiphiles with their corresponding abbrevia¬
tions and the length of the unfolded molecules: dodecylphosphonate (DDP03), tetradecyl phosphate (TDP04), liexadecylphosphate (HDPO4), octadecyl phosphate (ODPO4), 12-hydroxy-dodecyl phosphate (OH-DDPO4), 12-(N-ethylamino)dodecylphosphonate (NEt-DDPCh) and biphenyl phosphate (BIPH).
38
Ill Materials and Methods
Ammonium salts of DDP04 (DDP04(NH4)2) and OH-DDPO4 (OH-DDP04(NH4)2) were produced according the protocol below:
DDP04(NH4)2: 2.00 g of DDPO4 were dissolved in 200 ml of 2-pro¬
panol (UVASOL, Merck), heated up and refluxed. 6 ml of ammonia (25% in
water, p.a., Merck) were added and the precipitated ammonium salt of
DDP04 was filtered after cooling the reaction mixture with ice water. The
product was washed with ice-cooled 2-propanol and dried at 60° and
10 mbar in a vacuum oven for 20 hours. 1.61 g of white powdery product
(mp: 225° C) could be isolated corresponding to a yield of 71%.
'H-NMR (DMSO or CD3OD): 0.88 ppm (t, 3H, -(CH2)nCH3), 1.28 ppm (m,
18H, -CH2CH2(CH2)9CH3), 1.54 ppm (m, 2H, -CH2CH2(CH2)9CH3), 3.72
ppm (q, 2H, -OCH2CH2(CH2)9CH3), 4.88 ppm (s, 8H, NH4).
The " P-NMR showing one single peak suggests that the product consists of
a uniform alkyl phosphate species.
Elemental analysis: Calculated: [CI 50.87%, [H] 10.67%, [N] 4.94%
[O] 22.59%, [P] 10.93%
Analysis: [C] 50.61%, [H] 10.94%, [N] 4.95%
[O] 22.75%, [P] 10.69%
The measured concentrations in the elemental analysis agree with the
calculated stoichiometry of the di-ammonium salt of DDP04.
OH-DDP04(NH4)2: Hydroxy dodecyl phosphate (OH-DDPO4) was
received from Universität Dresden, Germany (Institut für Makromol.
Chemie u. Textilchemie, Prof. H.-J. Adler). 275 mg of OH-DDPO4 were
dissolved in 20 ml of 2-propanol (UVASOL, Merck) and NH3-gas was
bubbled through the solution for 5 minutes. (NH3 was extracted from a hot
25% ammonia solution in water and transferred into the amphiphile solution
via a glass pipette fixed on a plastic tube.) The precipitated ammonium salt
of OH-DDP04 was separated from the solvent by centrifugation and
removal of the solvent. The product was dried in a flow of dry nitrogen at
room temperature using an evaporation system (EVAPOR). 234 mg of white
39
Til Materials and Methods
powdery product (mp: 165° C) could be isolated, corresponding to a yield of
76%.
lH-NMR (DMSO or CD.OD): 1.24 ppm (m, 16H, -CH2CH2(CH2)8CH2-CH2OH), 1.38 ppm (m, 2H, -CH2CH2(CH2)8CH2CH2OH), 1.44 ppm (m, 2H,
-CH2CH2(CH2)]0OH), 3.35 ppm (t, 2H, -(CH2)nCH2OH), 3.57 ppm (q, 2H,
-OCH2CH2(CH2)10OH), 5.2 ppm (s, 8H, NH4).
Elemental analysis: Calculated: [C] 45.6%, [H] 10.5%, [N] 8.9%
Analysis: [C] 44.1%, [H] 9.6%, [N] 5.7%
The 'H-NMR results of the obtained product suggest that the substance
is pure. The somewhat low nitrogen content found experimentally(elemental analysis) is likely to reflect a partial loss of ammonia and partialformation of the mono-ammonium salt. To be consistent with
DDP04(NH4)2, we abbreviate the ammonium salt of hydroxy-dodecylphosphate with OH-DDP04(NH4)2.
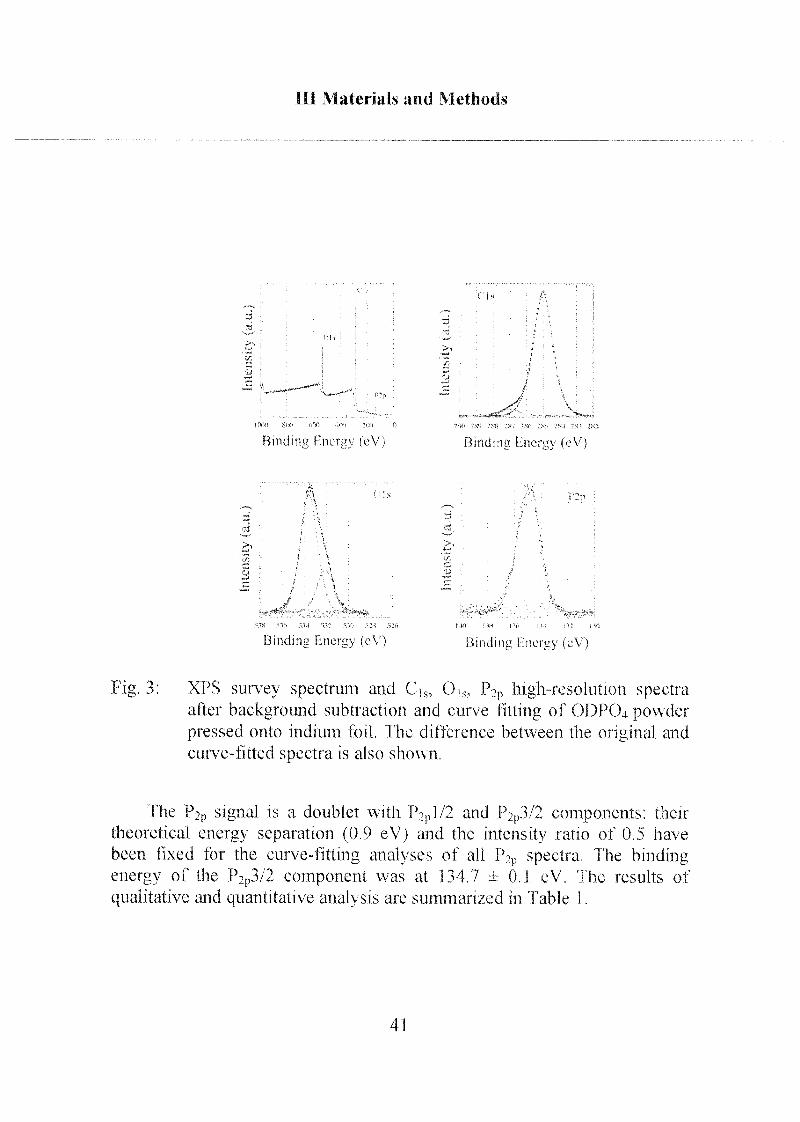
XPS spectra were performed from ODP04 as an example of the
alkylphosph(on)ate amphiphiles:
The detailed spectra of Ci„ Oh and P2p obtained on bulk ODP04powder (free acid) are shown in Figure 3. The Cis signal of the ODP04
powder is asymmetric, containing a large contribution at 285.0 eV and small
one at 286.8 ± 0.2 eV. The first component is assigned to the carbon of the
aliphatic chain, the second to the carbon covalently bound to one oxygen of
the phosphate group (C-O-P). Two Gaussian-Lorentzian curves have been
used in the curve fitting routine applied to the 0]s signal, which also has
been resolved into two signals: one at 532.1 ±0.1 eV and the other at 533.6 ±
0.1 eV. The assignments have been carried out taking only initial chemical
state effects into account and on the basis of literature data on sodium
phosphate glasses [Gres,1979],
40
Ill Materials and \lethods
"3
< t-
_,
Rindm« 1 net<n (e\ )
x.
\ M V
Rinclma l neun (eV)
_j
OK I •'p
C
Bindma \ notuv (o\ )
'j
Binding I nenn (cV)
tig 3 XPS survey spectrum and CV, Ok, P?p high-resolution spectraafter background subtraction and curve fitting of ODPC)4 powderpressed onto indium foil I he difference between the original and
curve-fitted spectra is also shown
The Pip signal is a doublet with P>pl/2 and P2P3/2 components their
theoretical energ> separation (0 9 eV) and the intensity ratio of 0 5 have
been fixed for the curve-fitting anal} ses of all 1% spectra I he bindingenergy of the P>p3/2 component was at 134 7 i 0 1 eV The results of
qualitative and quantitative anal) sis are summarized in Table 1
41
Ill Materials and Methods
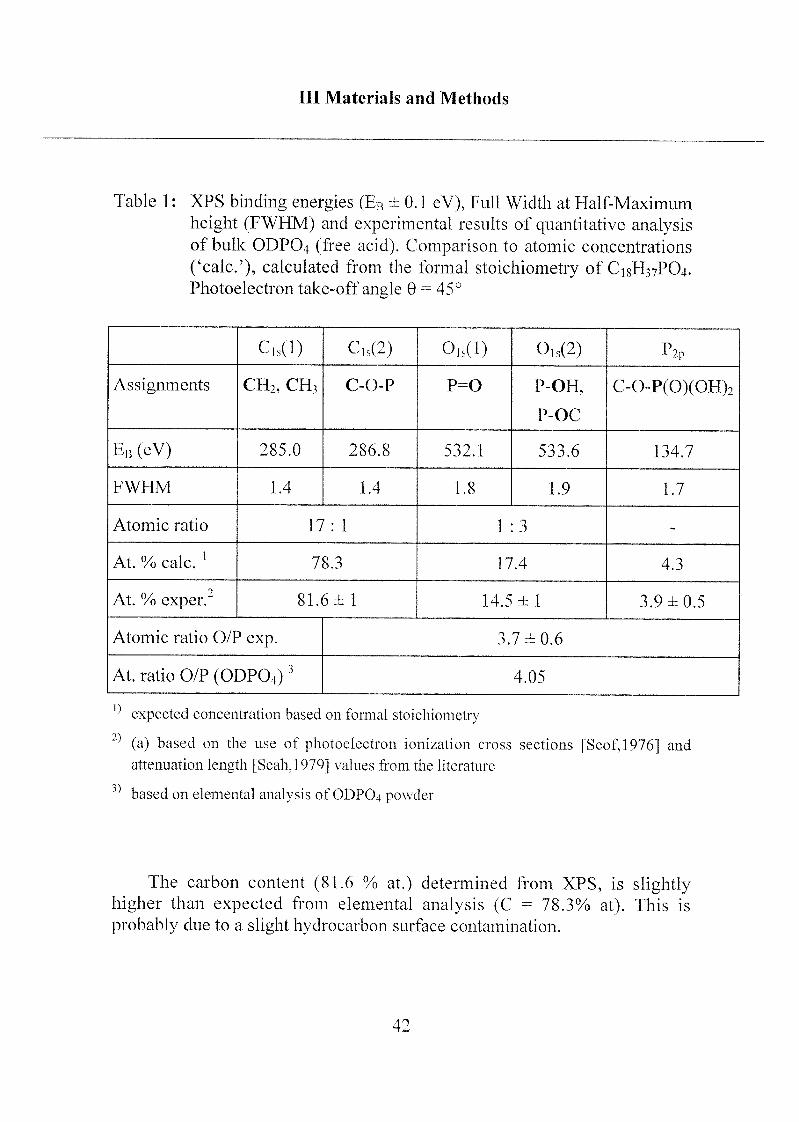
Table 1 : XPS binding energies (Eb ± 0.1 eV), Full Width at Half-Maximum
height (FWHM) and experimental results of quantitative analysisof bulk ODPO4 (free acid). Comparison to atomic concentrations
('calc.'), calculated from the formal stoichiometry of C18H37PO4.Photoelectron take-off angle 9 = 45°
Cls(l) Cis(2) 0,s(l) 0ls(2) P2p
Assignments CH2, CH3 C-O-P p=o P-OH,
P-OC
C-0-P(0)(OFI)2
EB (eV) 285.0 286.8 532.1 533.6 134.7
FWHM 1.4 1.4 1.8 1.9 1.7
Atomic ratio 17: 1 1 :3 -
At. % cale.l
78.3 17.4 4.3
At. % exper." 81.6 ± 1 14.5 ±1 3.9 ±0.5
Atomic ratio O/P exp. 3.7 ±0.6
At. ratio O/P (ODPO4)3 4.05
expected concentration based on formal stoichiometry
(a) based on the use of photoelectron ionization cross sections [Scof, 19761 an(l
attenuation length [Seah,l 979] values from the literature
based on elemental analysis of ODPO4 powder
The carbon content (81.6 % at.) determined from XPS, is slightlyhigher than expected from elemental analysis (C = 78.3% at). This is
probably due to a slight hydrocarbon surface contamination.
42
Ill Materials and Methods
The interpretation and quantitative results of the XPS spectra obtained
from bulk ODPO4 are straightforward. The assignment of the curve-fitted
Cis at binding energies of 285.0 and 286.8 eV to hydrocarbon and C-O-P,respectively, and of Ois at 532.1 and 533.6 eV to P=0 (O type 1) and P-O-R
(O type 2), respectively, are in agreement with expectations based on
published reference data [Gres,1979; Moid, 1992]. The experimentallydetermined O/P atomic ratio of 3.7 is consistent with the stoichiometry of
the phosphate functional group (Table 1 ).
Octadecyl thiol was used for special investigations or tests that were not
relevant for the sensor application. Nevertheless, these studies will be
discussed in the context of a comparative understanding of processes,
material behavior and/or other applications.
43
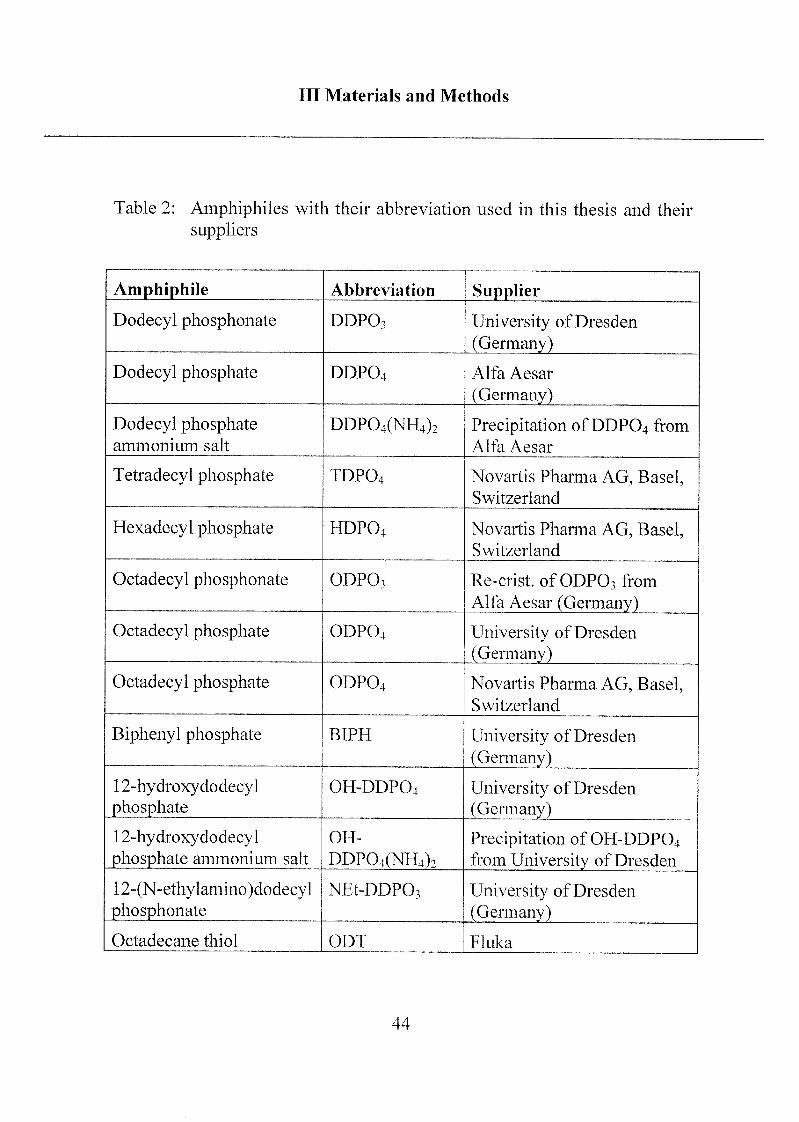
Ill Materials and Methods
Table 2: Amphiphiles with their abbreviation used in this thesis and their
suppliers
Amphiphile Abbreviation Supplier
Dodecyl phosphonate DDPO3 University ofDresden
(Germany)
Dodecyl phosphate DDPO4 Alfa Aesar
(Germany)
Dodecyl phosphateammonium salt
DDP04(NH4)2 Precipitation ofDDPO4 from
Alfa Aesar
Tetradecyl phosphate TDPO4 Novartis Pharma AG, Basel,Switzerland
Hexadecyl phosphate HDPO4 Novartis Pharma AG, Basel,Switzerland
Octadecyl phosphonate ODPO3 Re-crist, of ODPO3 from
Alfa Aesar (Germany)
Octadecyl phosphate ODPO4 University ofDresden
(Germany)
Octadecyl phosphate ODP04 Novartis Pharma AG, Basel,Switzerland
Biphenyl phosphate BIPH University ofDresden
(Germany)
12-hydroxydodecylphosphate
OH-DDP04 University ofDresden
(Germany)
12-hydroxydodecylphosphate ammonium salt
OH-
DDP04(NH4)2Precipitation of OH-DDPO4from University of Dresden
12-(N-ethylamino)dodecy1
phosphonateNEt-DDP03 University ofDresden
(Germany)
Octadecane thiol ODT Fluka
44
Ill Materials and Methods
1.2.2 Poly-(L)-Lysine-Poly(EthyIene Glycol) (PLL-PEG)
Different derivatives of pofy-(L)-lysine-poly(ethylene glycol) (PLL-PEG) were synthesized. Non-functionalized PLL-PEGs were used for
protein-resistance studies (non-specific binding). Biotinylated poly(ethyleneglycol) (PEGbiotin) was used to synthesize functionalized PLL-PEG
derivatives (PLL-PEG/PEGbiotin). The specific binding of streptavidin-conjugated enzymes as well as the specific immobilization of biotin-
conjugated antibodies were studied on PLL-PEG/PEGbiotin coated surfaces.
The abbreviations for the non-functionalized copolymers describe the
ratio of grafted poly(ethylene glycol) chains (PEG) per poly-(L)-lysine(PLL). PLL-g[2]-PEG for example means that the ratio of lysine-units to
grafted PEG-chains is 2:1. In this case every second lysine-unit of the PLL-
backbone is coupled to a PEG-molecule. The molecular weight of each
copolymer component is described in parentheses. If every second lysine-unit of a 20 kilo-Dalton (kD) PLL is grafted with a 2 kD PEG-molecule,then the abbreviation for the derivative would be PLL(20)-g[2]-PEG(2).
For the description of functionalized PLL-PEG derivatives, the
presence of biotinylated PEG (PEGbiotin) is indicated by adding PEGbiotin
to the abbreviation of the corresponding non-functionalized PLL-PEG (e.g.PLL-PEG/PEGbiotin). The ratio of grafted PEG/PEGbiotin is described byadding the relative amount (%) of PEGbiotin (with respect to the total
amount of grafted ethylene glycol chains) at the end of the compoundabbreviation. If 10 % of the PEG-chains in the previously described non-
functionalized derivative are replaced by biotinylated PEG of a 3.4 kD
molecular weight, the abbreviation would be the following: PLL(20)-g[2]~PEG(2)/PEG-biotin(3.4) 10%.
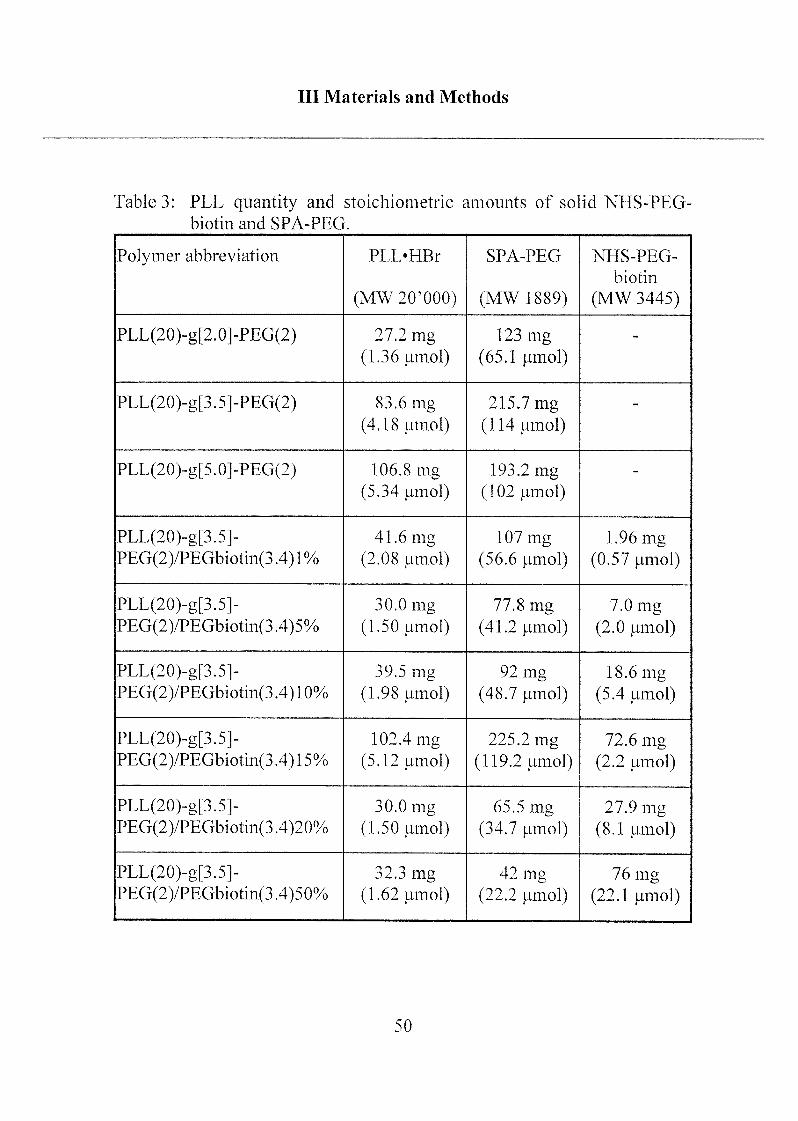
The synthesized PLL-PEG derivatives and the amount of educts that
were used are listed in Table 3.
45
Ill Materials and Methods
1.2.2.1 Synthesis of PLL-g-PEG Derivatives
The structural parameters of the copolymer had to be optimized in order
to yield polymers with efficient protein- [Glas, 1996; Elbe, 1996; Hard, 1998]and DNA- [Thie,1997] repellent characteristics. Among these parameters,the grafting density of the PEG chains to the PLL backbone is of particularimportance. The latter also depends on the molecular weight (i.e. length) of
the PEG chains used. Polymers that exhibit high protein resistance are often
in the so-called "brash regime"; the grafting density is high enough, so that
the PEG chains start to fully overlap and stretch away from the surface, thus
leading to a large repulsive forces and preventing proteins from penetratinginto the brush. Using a simplified approach in a good solvent, such a brush
regime is achieved when the average distance D between the attachment
moieties of the coil (in our case PEG grafted onto poly-L-lysine backbone)on the surface is smaller than the radius of gyration (Rg) of the coil
[Halp,1992]. Furthermore, a recent study by Sofia et al. [Sofi,1998] showed
that protein repulsion was maximized on silicon surfaces with the highestPEG grafting densities, for which the chain spacing was approximately equalto the typical chain dimension, Rg, of the PEG molecule.
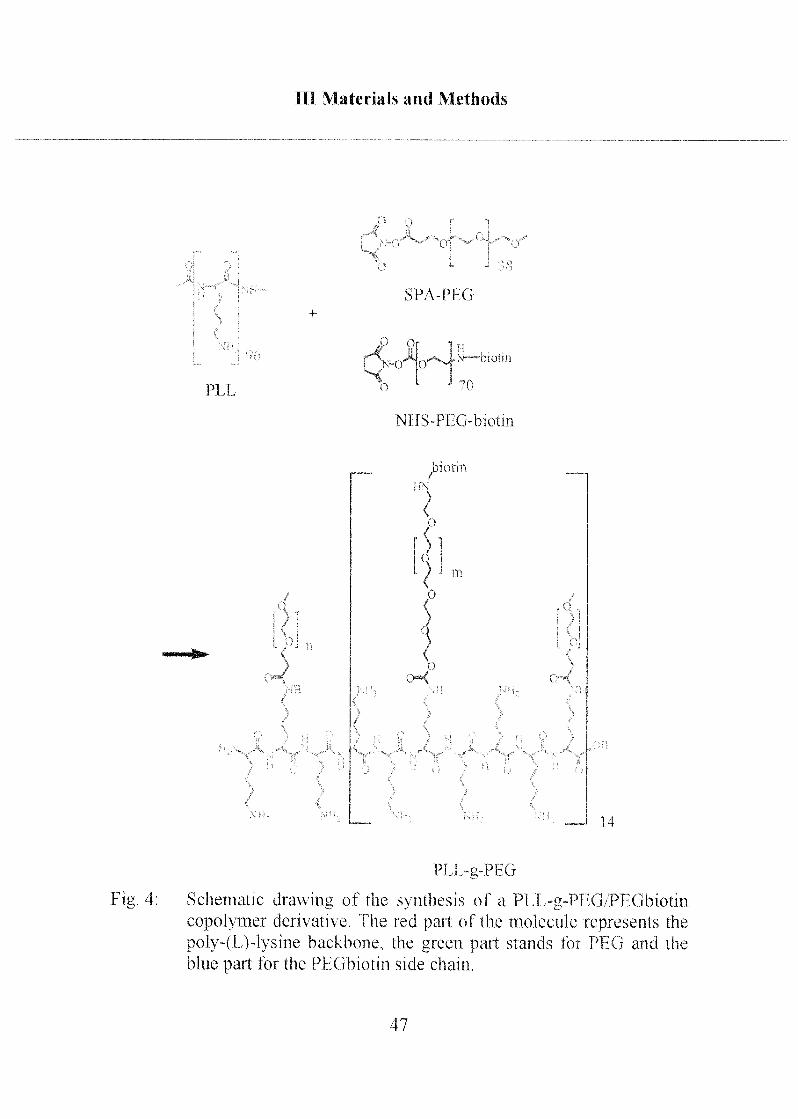
A scheme of the functionahzed copolymer synthesized in this study is
shown in Figure 4. The polymer backbone consists of poly-L-Lysine MW 20
kD, which was chosen rather than the high MW 350 kD [Kena,2000] to
achieve higher packing density of the comb/brush polymer on the flat
sensing surfaces. The protein-repellent matrix is built with methoxyterminated PEG of MW 2000, and the biotin-functionalized PEG tether
consists of a PEG chain of higher molecular weight (MW 3400), to improveaccessibility to the functional sites.
46
1TI Materials and Methods
+
PI I
4
SPA-PI G
IUI'
ifo
N—-btotm
70
NHS-PLG-biotm
\
hi 01 it
1 m
0
\
_J 14
PI F -g-Pf G
Schematic dtawing ot the svnthesis of a PI 1 -g-PFG/Pl Gbiolm
copolymer derivative I he red pan of the molecule tepiesents the
poly-(I )-l\sme backbone, the green pait stands loi PI (j and the
blue part tor the PPGbiotm side chain
47
TTT Materials and Methods
The PEG as well as the PEGbiotin chains (educts) are functionalized
with hydroxy succinimidyl ester for reaction with the primary amine side
chain of the lysine unit. Since this amino side chain also serves as the
anchoring point when the PEE-g-PEG polymer is self-assembled onto a
negatively charged surface, an optimum number of the lysine side chains
must be grafted by PEG to insure both efficient protein resistance and
surface anchorage.
The protein resistance characteristics of the PEL-g-PEG polymeressentially depends on the grafting density of the PEG side chains
[Kena,2000]. It has been shown, that a lysine : PEG grafting ratio of 3.5 (1of 3.5 lysine units is derived by PEG) results in a highly protein-resistantand well-adsorbing copolymer (see chapter IV 2.E4). Three PLL-g-PEGderivatives having different grafting ratios without any biotinylated PEGchains and several derivatives with different PEG-biotin concentrations were
synthesized, keeping the lysine : PEG(total) grafting ratio of 3.5 constant.
Synthesis of PLL(20)-g-PEG(2):
Three non-functionalized PEL(20)-g-PEG(2) derivatives were
synthesized with different lysine unit to PEG chain ratios (Lys:PEG) such as
2.0, 3.5 and 5.0, in order to obtain grafted polymers for which the PEG
interchain spacing D is respectively smaller, equivalent to and greater than
the RMS radius of gyration of the PEG (Mw 2000). Synthesis was based on
the protocol described by Elbert et al. [Elbe, 1998]. Poly(L-lysine) (PLL) was
dissolved in 50 mM sodium tetraborate buffer, pH 8.5 at a concentration of
1 g of PEL per 12.5 ml of buffer and the PLL solution was sterilized byfiltration (0.22 |im Durapore Millex, Sigma-CH). The appropriate stoichio¬
metric amount of solid succinimidyl derivative of PEG propionic acid (SPA-PEG) (see Table 3) required to yield the desired grafting ratio of Lys:PEGwas added to the vigorously stirred PLL solution, and the reaction was
allowed to proceed for 6 hours at room temperature. The reaction productswere then dialyzed (Spectra/Por, MWCO 6-8000, Spectrum, Socochim, CH)against phosphate buffer saline (PBS) for 24 hrs and subsequently againstdeionized water for 24 hrs. The dialyzed solution was lyophilyzed for48 hours and stored under nitrogen at -25°C.
48
Ill Materials and Methods
Synthesis of biotin-functionalized PLL-g-PEG derivatives:
Synthesis was performed as described above. Several biotin-functiona¬
lized PLL-g-PEG copolymers with a Lys:PEG ratio of 3.5 and different
amounts of biotin (i.e. 1%, 10% and 50% of the PEG chains are
biotinylated) were synthesized. The desired stoichiometric amounts of solid
N-hydroxy-succinimidyl PEG-biotin derivative (NHS-PEG-biotin) and
SPA-PEG (see Table 3) were added to the vigorously stirred PLL solution
and reaction was allowed to proceed for 6 hours at room temperature. In the
case of PLL-g-PEG/PEGbiotin 5%, 10%, 15% and 20%, the NHS-PEG-
biotin was added first and allowed to react for 1 hour before addition of the
SPA-PEG.
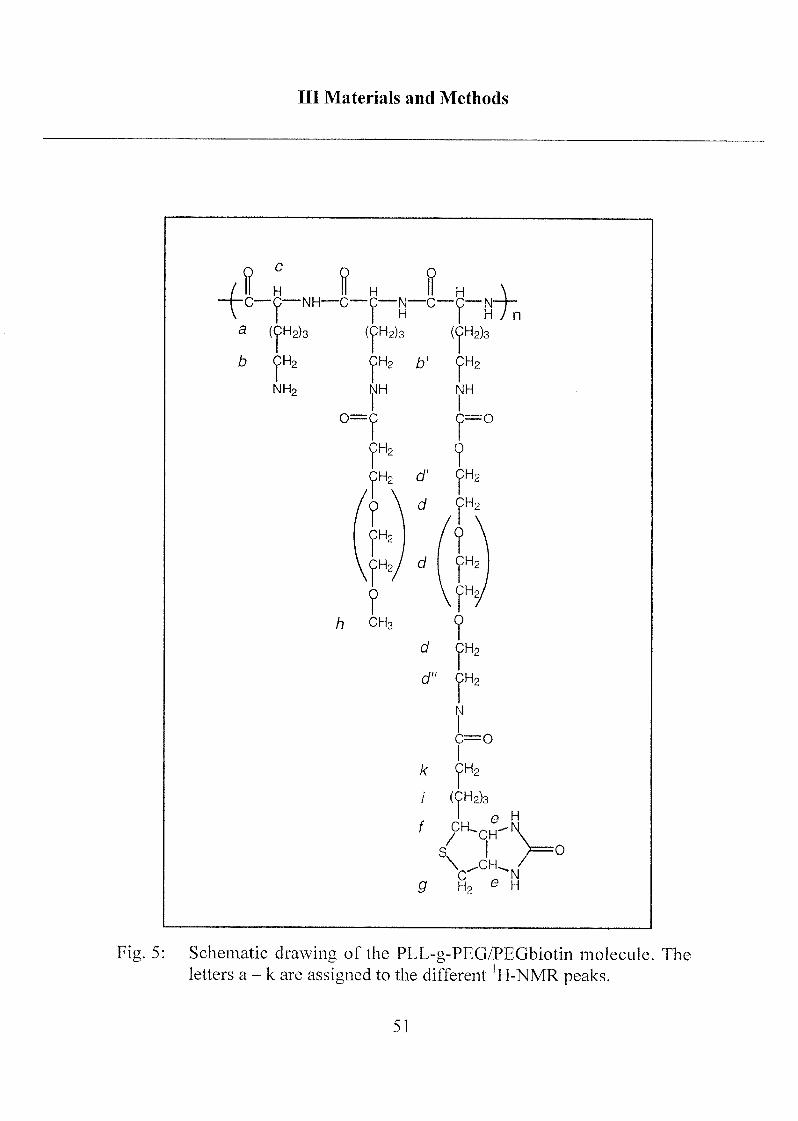
^-NMR spectra were measured from the PLL-g-PEG and PLL-g-PEG/PEGbiotin derivatives. The peaks were assigned to the correspondingprotons according to the drawing of the molecule in Figure 5. The generalinterpretation of the lH-NMR spectra of the PLL(20)-g[3.5]-PEG(2)/PEG-biotin(3.4) derivatives is shown below.
49
Ill Materials and Methods
Table 3: PLL quantity and stoichiometric amounts of solid NHS-PEG-
biotin and SPA-PEG.
Polymer abbreviation PLL'HBr
(MW20'000)
SPA-PEG
(MW 1889)
NHS-PEG-
biotin
(MW 3445)
PLL(20)-g[2.0]-PEG(2) 27.2 mg
(1.36 umol)
123 mg
(65.1 (imol)
-
PLL(20)-g[3.5]-PEG(2) 83.6 mg
(4.18 umol)215.7mg(114 (imol)
-
PLL(20)-g[5.0]-PEG(2) 106.8 mg
(5.34 (imol)
193.2 mg
(102 umol)
-
PLL(20)-g[3.5]-
PEG(2)/PEGbiotin(3.4) 1%
41.6 mg
(2.08 (imol)
107 mg
(56.6 (imol)
1.96 mg
(0.57 umol)
PLL(20)-g[3.5]-
PEG(2)/PEGbiotin(3.4)5%
30.0 mg
(1.50 (imol)
77.8 mg
(41.2 (imol)
7.0 mg
(2.0 (imol)
PLL(20)-g[3.5]-
PEG(2)/PEGbiotin(3.4)10%39.5 mg
(1.98 |imol)
92 mg
(48.7 (imol)
18.6 mg
(5.4 (imol)
PLL(20)-g[3.5]-
PEG(2)/PEGbiotin(3.4) 15%102.4 mg
(5.12 mnol)
225.2 mg
(119.2 mmol)
72.6 mg
(2.2 (.imol)
PLL(20)-g[3.5]-
PEG(2)/PEGbiotin(3.4)20%
30.0 mg
(1.50 (imol)
65.5 mg
(34.7 (imol)
27.9 mg
(8.1 (imol)
PLL(20)-g[3.5]-
PEG(2)/PEGbiotin(3.4)50%
32.3 mg
(1.62 umol)
42 mg
(22.2 mnol)
76 mg
(22.1 (imol)
50
Ill Materials and Methods
_/J H il H II H _\__t_c_(p—NH—c—r—N—c_c—N_i_
(ÇH2)3
b CH2
NH2
(ÇH2)3
h
9
VCH-NH2 e H
Fig. 5: Schematic drawing of the PLL-g-PEG/PEGbiotin molecule. The
letters a - k are assigned to the different 'H-NMR peaks.
51
Ill Materials and Methods
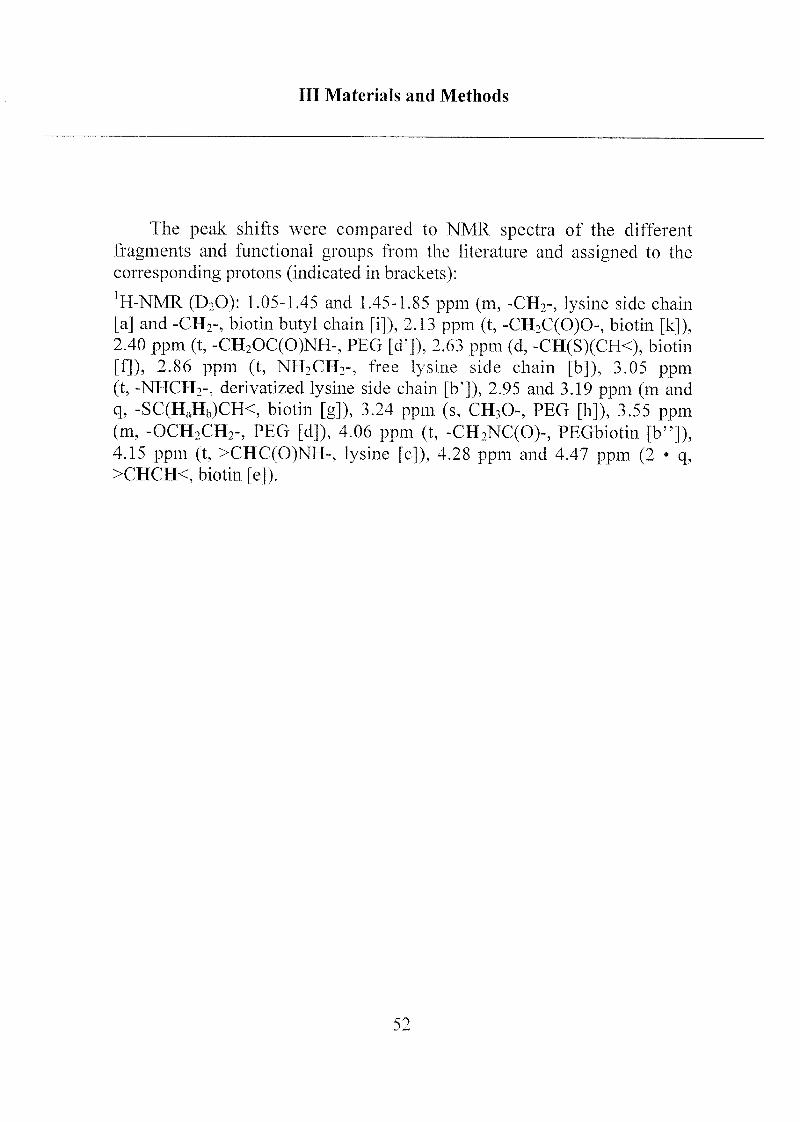
The peak shifts were compared to NMR spectra of the different
fragments and functional groups from the literature and assigned to the
corresponding protons (indicated in brackets):
'H-NMR (D20): 1.05-1.45 and 1.45-1.85 ppm (m, -CH2-, lysine side chain
[a] and -CH2-, biotin butyl chain [i]), 2.13 ppm (t, -CH2C(0)O, biotin [k]),2.40 ppm (t, -CH2OC(0)NH-, PEG [d']), 2.63 ppm (d, -CH(S)(CH<), biotin
[f]), 2.86 ppm (t, NH2CH2-, free lysine side chain [b]), 3.05 ppm
(t, -NHCH2-, derivatized lysine side chain [b']), 2.95 and 3.19 ppm (m and
q, -SC(HaHb)CH<, biotin [g]), 3.24 ppm (s, CH30-, PEG [h]), 3.55 ppm
(m, -OCH2CH2-, PEG [d]), 4.06 ppm (t, -CH2NC(0)-, PEGbiotin [b"])54.15 ppm (t, >CHC(0)NH-, lysine [c]), 4.28 ppm and 4.47 ppm (2 •
q,
>CHCH<, biotin [e]).
52
Ill Materials and Methods
1.3 Biochemical Substances
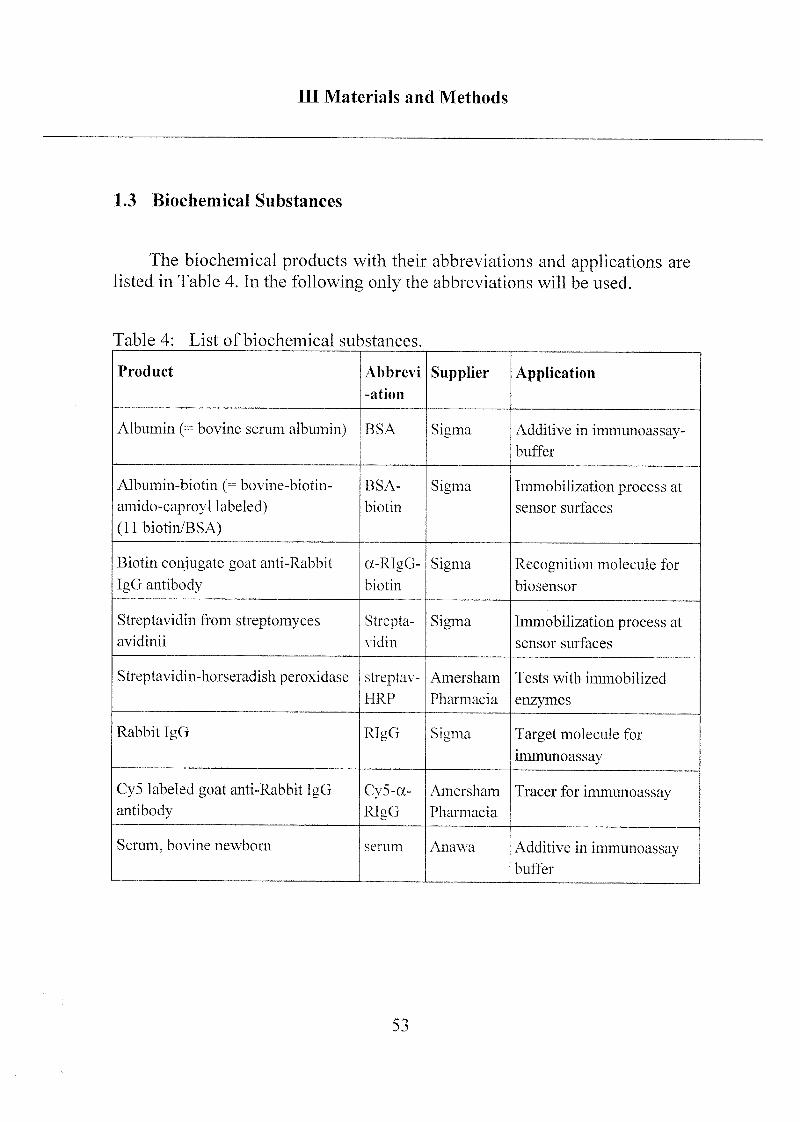
The biochemical products with their abbreviations and applications are
listed in Table 4. In the following only the abbreviations will be used.
Table 4: List of biochemical substances.
Product Abbrevi
-ation
Supplier Application
Albumin (= bovine serum albumin) BSA Sigma Additive in immunoassay-buffer
Albumin-biotin (= bovine-biotin-
amido-caproyl labeled)
(llbiotin/BSA)
BSA-
biotin
Sigma Immobilization process at
sensor surfaces
Biotin conjugate goat anti-Rabbit
IgG antibody
a-RlgG-
biotin
Sigma Recognition molecule for
biosensor
Streptavidin from streptomyces
avidinii
Strepta¬
vidin
Sigma Immobilization process at
sensor surfaces
Streptavidin-horseradish peroxidase streptav-
HRP
Amersham
Pharmacia
Tests with immobilized
enzymes
Rabbit IgG RIgG Sigma Target molecule for
immunoassay
Cy5 labeled goat anti-Rabbit IgG
antibody
Cy5-a-
RlgG
Amersham
Pharmacia
Tracer for immunoassay
Serum, bovine newborn serum Anawa
M , ,
Additive in immunoassaybuffer
53
Ill Materials and Methods
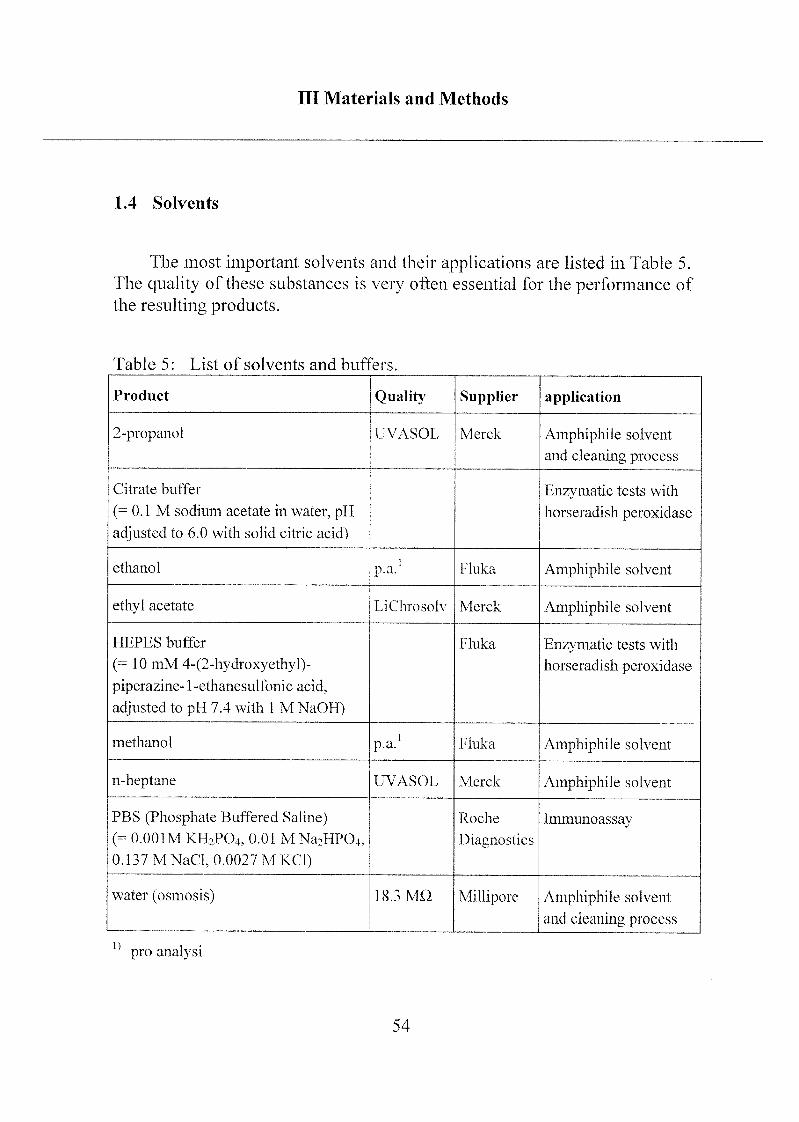
1.4 Solvents
The most important solvents and their applications are listed in Table 5.
The quality of these substances is very often essential for the performance of
the resulting products.
Table 5: List of solvents and buffers.
Product Quality Supplier application
2-propanol UVASOL Merck Amphiphile solvent
and cleaning process
Citrate buffer
(=0.1 M sodium acetate in water, pH
adjusted to 6.0 with solid citric acid)
Enzymatic tests with
horseradish peroxidase
ethanol p.a.' Fluka Amphiphile solvent
ethyl acetate LiChrosolv Merck Amphiphile solvent
HEPES buffer
(= 10 mM 4-(2-hydroxyethyl)-
piperazine-1 -ethanesulfonic acid.
adjusted to pH 7.4 with 1 M NaOII)
Fluka Enzymatic tests with
horseradish peroxidase
methanol p.a.' Fluka Amphiphile solvent
n-heptane UVASOL Merck Amphiphile solvent
PBS (Phosphate Buffered Saline)
(= 0.001M KIÏ2PO4, 0.01 M Na2HP04.
0.137 M NaCL 0.0027 M KCl)
Roche
Diagnostics
Immunoassay
water (osmosis) 18.3 MO Milliporc Amphiphile solvent
and cleaning process
pro analysi
54
Ill Materials and Methods
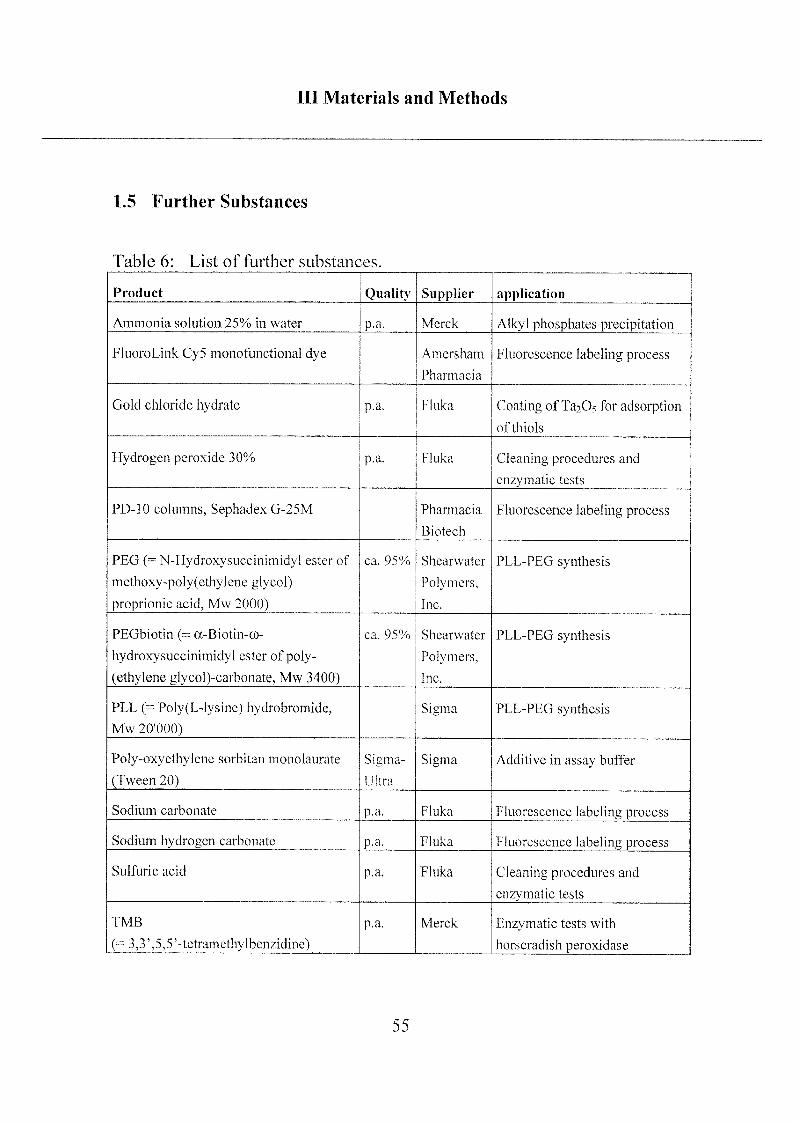
1.5 Further Substances
Table 6: List of further substances.
Product Quality Supplier application
Ammonia solution 25% in water p.a. Merck Alkyl phosphates precipitation
FluoroLink Cy5 monofunctional dye Amersham
Pharmacia
Fluorescence labeling process
Gold chloride hydrate p.a. Fluka Coating of TJbOs for adsorption
of thiols
Hydrogen peroxide 30% p.a. Fluka Cleaning procedures and
enzymatic tests
PD-10 columns, Sephadex G-25M Pharmacia
Biotech
Fluorescence labeling process
PEG (=N-Hydroxysuccinimidyl ester of
methoxy-poly(ethylene glycol)
proprionic acid, Mw 2000)
ca. 95% Shearwater
Polymers,
Inc.
PLL-PEG synthesis
PEGbiotin (= oc-Biotin-co-
hydroxysuccinimidyl ester of poly-
(ethylene glycol)-carbonate, Mw 3400)
ca. 95% Shearwater
Polymers,
Inc.
PLL-PEG synthesis
PLL (= Poly(L-lysine) hydrobromide,
Mw 20'000)
Sigma PLL-PEG synthesis
Poly-oxyethylene sorbitan monolaurate
(Tween 20)
Sigma-
Ultra
Sigma Additive in assay buffer
Sodium carbonate p.a. Fluka Fluorescence labeling process
Sodium hydrogen carbonate p.a. Fluka Fluorescence labeling process
Sulfuric acid p.a. Fluka Cleaning procedures and
enzymatic tests
TMB
(== 3,3',5,5'-tetramethylbenzidine)
p.a. Merck Enzymatic tests with
horseradish peroxidase
55
Ill Materials and Methods
2 Apparatus
^-NMR spectra were recorded for the synthesized PLL-PEG and PLL-
PEG/BEGbiotin derivatives as well as for some phosphonates using a DRX
400 MHz instrument (Bruker).
The following items of apparatus were used for specific parts of the
work and have therefore been separated into different subchapters.
2.1 Apparatus for Cleaning and Coating of Substrates
The cleaning procedure is, depending on the application of the product,a more or less important step. In the case of optical biosensors it is essential
to start with a very clean substrate. Impurities at the surface would result in
inhomogeneous immobilization of recognition molecules and insufficient
reproducibility. Patterning capture molecules on one chip to get multi-
sample sensors or multi-analyte chips would lead to a much lower
quantitative performance if they would be immobilized onto dirty or
otherwise ill-defined surfaces.
Ultrasonic bath: Ultrasonic treatment is a straightforward technique for
removing particles from the substrate surfaces, for supporting amphiphiledissolution and for periodic cleaning of containers and glassware. Sonication
was in general performed in a Ultrasonic bath (BRANSON 3200) for 15
minutes.
UV-cleaner: An easy method for cleaning substrate surfaces is the
treatment in a UV-cleaner [Saka, 1998] (model 135500, Boekel Ind. Inc., PA,
USA) for 30 minutes. The mercury vapor lamp that is placed close to the
substrate surface transforms ambient air oxygen into ozone. Singlet oxygen,
ozone and/or high energy UV-light irradiation oxidize the traces of organic
56
Ill Materials and Methods
impurities. However, we believe that significant higher amounts of
impurities at the surface cannot be burned away with this method.
Oxygen plasma cleaner: A similar method is oxygen plasma cleaning.Typical treatment times are a few minutes, It has been shown that repetitivecleaning cycles or cleaning for a longer time is not useful to remove dirt
particles [Bier, 1991] and we believe that an excessively long irradiation mayresult in surface damaging. The apparatus we used for several investigationsis a Harrick Plasma Cleaner/Sterilizer PDC-32G instrument (Ossining,NY,USA).
Coating chambers: For cleaning and/or coating of large numbers of
metal oxide samples we used PTFE containers and for smaller numbers
15-ml pill glasses (space for one or two chips per glass). Containers and
glasses were pre-cleaned in piranha acid for 2 hours (piranha acid is a 1:3
mixture of 30% H2O2 and 98% H2S04), followed by extensive rinsing in
ultra-pure water prior to first use. Further rinsing with portions of 2-propanolwere carried out to remove the last traces of water. During the followinginvestigations the containers were cleaned with 2-propanol (or the solvent of
the applied adsorbent solution) in the ultrasonic bath for 15 minutes before
and after every step.
The standard cleaning method for the cleaning of metal oxide substrate
chips was, in general, sonication in 2-propanol for 15 minutes, blow-dryingwith nitrogen, followed by UV-cleaning for 30 minutes.
57
Ill Materials and Methods
2.2 Surface Characterization
In this chapter, methods for quantitative surface analysis with an
information depth of a few nanometers are presented. These methods were
used for surface characterization before and after coating with adsorbents
such as phosph(on)ate SAMs.
2.2.1 X-ray Photoelectron Spectroscopy (XPS)
XPS analyses were performed using a PHI 5700 spectrophotometerequipped with a concentric hemispherical analyzer in the standard
configuration (Physical Electronics, Eden Prairie, MN, USA). Spectra were
acquired at a base pressure of 10"9 mbar using a non-monochromatic Al-Kasource operating at 200 W and positioned -13 mm away from the sample.The instrument was run in the minimum-area mode using an aperture of
0.8 mm diameter. The concentric hemispherical analyzer (CHA) was used in
the fixed analyzer transmission mode. Pass energies used for survey scans
and for detailed scans of tantalum Ta4f, carbon Cis, oxygen Oi, and
phosphorus P?p were 187.85 eV and 23.5 eV, respectively. Under these
conditions, the energy resolution (full with at half-maximum height,FWHM) measured on silver Ag]tl5/2 is 2.7 eV and 1.1 eV, respectively.Acquisition times were approximately 5 minutes for survey scans and 9
minutes (total) for high-energy resolution elemental scans. These
experimental conditions were chosen in order to have an adequate signal-to-noise ratio in a minimum time and to limit beam-induced damage. Under
these conditions, sample damage was negligible, even after 90 minutes
X-ray exposure, and reproducible analyzing conditions were obtained on all
samples. In addition, only one sample was introduced into the analyzingchamber at a time.
Angle-resolved XPS (AR-XPS) measurements were conducted at different
take-off angles (detection angles), to obtain depth-dependent information
58
Ill Materials and Methods
and to determine the thickness of the self-assembled monolayer deposited on
the metal oxide substrates.
Spectra were referenced to the aliphatic hydrocarbon C]s signal at 285.0 eV.
Data were analyzed using a least-squares fit routine following Shirleyiterative background subtraction. Atomic concentrations were calculated
using published ionization cross sections [Scof,1976] and calculated
attenuation length values [Seah,1979], Intensities were also corrected for the
energy dependence of the transmission function. Spectra were fitted usingGaussian-Lorentzian functions.
As a reference, octadecyl phosphoric acid bulk powder pressed onto an
indium foil was analyzed. Both as-received and sputter-cleaned bare
tantalum pentoxide substrates were analyzed as reference substrates.
2.2.2 Time-of-FIight, Secondary-Ion Mass Spectrometry (ToF-SIMS)
Secondary-ion mass spectra were recorded on a PHI 7200 time-of-flightsecondary ion mass spectrometer in the mass range 0 - 1000 m/z. The total
ion dose of the 8 kV Cs+ primary ion beam (diameter: 200 pm) was typically9-1011 ions/cm2, corresponding to a value below the static limit. Time perdata point was 1.25 ns. Due to the low conductivity of the metal oxide/glasssubstrates, intermittent, pulsed electron-beam neutralization had to be used
during measurement of both positive and negative SIMS spectra. Mass
resolution M/AM was typically 5500 in the positive and 2000 in the negativemode (masses 43 and 17, respectively). To calibrate the mass scale, the
whole mass range was first calibrated using a single standard set of low ion
masses followed by the assignment of species in the whole mass range usingthe PHI software TOFPAK. To improve the quality of the calibration at
higher masses, different sets of ion species were used due to the large mass
range analyzed and the different natures of the observed secondary-ionspecies (likely to leave the surface with varying velocities):
59
Ill Materials and Methods
a) low mass range (< ca. 200):CnHm species (positive ions) and OH", P02\ P03" (negative ions)
b) medium mass range:
MaOb* and MPaObHc* species (both types of ions)
c) high mass range (> ca. 400):MPaObCcHd+ species (positive ions) and M2OaHb" species (negative ions)
The mean calibration deviations from the exact mass of the assigned specieswere always below 50 ppm, in most cases below 20 ppm.
2.23 Contact Angle [Mitt, 1993]
Surface wettability was investigated by measuring the advancing water-
contact-angle (Contact-Angle Measuring System G2/G40 2.05-D, Krüss
GmbH, Hamburg, Germany). The contact-angle measurement (20 volume
pulses of 0.22 pi each with a pulse frequency of 1 second) was performed on
three-to-five different places on each chip, and the average contact-anglevalue was determined. A systematic drawing of the contact-angle-measure¬ment principle is presented in Scheme 9. Surface wettability has been shown
to be a useful marker for estimating the monolayer quality of methyl-terminated adsorbents [Folk, 1995].
60
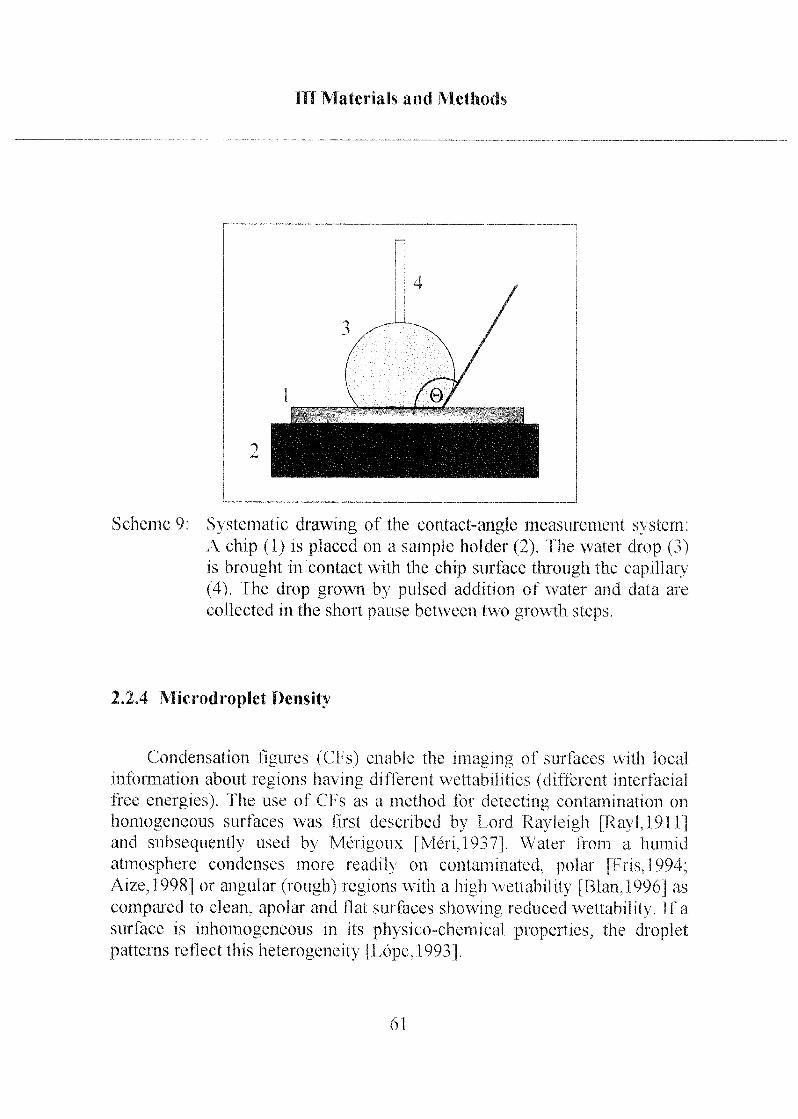
Ill Materials and Methods
Scheme 9; Systematic drawing of the contact-angle measurement system;A chip (1) is placed on a sample holder (2). The water drop (3)is brought in contact with the chip surface through the capillary(4). The drop grown by pulsed addition of water and data are
collected in the short pause between two growth steps.
2.2,4 Microdroplet Density
Condensation figures (CTs) enable the imaging of surfaces with local
information about regions having different wettabilities (different interfacial
free energies). The use of CFs as a method for delecting contamination on
homogeneous surfaces was first described by Lord Rayleigh [RaylJ^llJand subsequently used by Mérigoux [Méri, 1937) Water from a humid
atmosphere condenses more readily on contaminated, polar |Fris,1994;Aize, 1998] or angular (rough) regions with a high wettability [Blan.,19%] as
compared to clean, apolar and flat surfaces showing reduced wettability. If a
surface is inhomogeneous in its physico-chemical properties, the dropletpatterns reflect this heterogeneity J Lope, 1993].
61
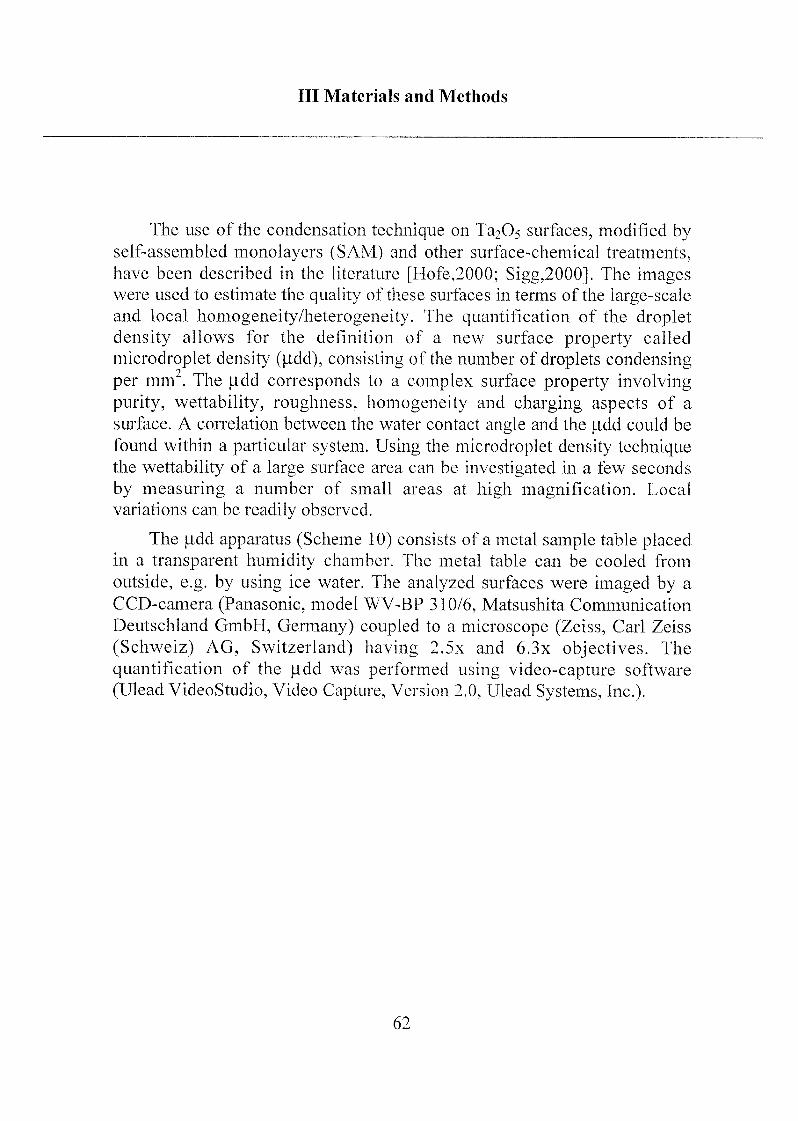
Ill Materials and Methods
The use of the condensation technique on TaaOs surfaces, modified byself-assembled monolayers (SAM) and other surface-chemical treatments,have been described in the literature [Hofe,2000; Sigg,2000]. The imageswere used to estimate the quality of these surfaces in terms of the large-scaleand local homogeneity/heterogeneity. The quantification of the dropletdensity allows for the definition of a new surface property called
microdroplet density (|idd), consisting of the number of droplets condensing
per mm .The (idd corresponds to a complex surface property involving
purity, wettability, roughness, homogeneity and charging aspects of a
surface. A correlation between the water contact angle and the [idd could be
found within a particular system. Using the microdroplet density techniquethe wettability of a large surface area can be investigated in a few seconds
by measuring a number of small areas at high magnification. Local
variations can be readily observed.
The (idd apparatus (Scheme 10) consists of a metal sample table placedin a transparent humidity chamber. The metal table can be cooled from
outside, e.g. by using ice water. The analyzed surfaces were imaged by a
CCD-camera (Panasonic, model WV-BP 310/6, Matsushita Communication
Deutschland GmbH, Germany) coupled to a microscope (Zeiss, Carl Zeiss
(Schweiz) AG, Switzerland) having 2.5x and 6.3x objectives. The
quantification of the (idd was performed using video-capture software
(Ulead VideoStudio, Video Capture, Version 2.0, Ulead Systems, Inc.).
62
Ill Materials and Methods
5
•.y.y.y.y."*]
."./"."".I.Ï'.Ï'.V ".**]
"ï'-ï'-ï'-ï'-'ï'!
2
Scheme 10: Schematic drawing of the microdroplet density apparatus: The
object (1) is placed on a temperature-controlled table (2) within
a transparent box (3). An atmosphere saturated with water vapor
is achieved by the presence of water on the bottom of the box.
Ice water is pumped from outside the box through the sampletable. The growth of condensed water droplets is monitored via
a CCD-camera system (4, 5).
On hydrophobic surfaces it is not essential to take pictures after an
exactly defined time of condensation. Once water begins to condense, the
surface of the formed droplet is of high polarity, and water vapor will readilycondense on the droplets. The condensed droplets continue to grow, but the
number of droplets per unit area remains constant.
The (idd is not only a tool to qualitatively image hydrophobic surfaces;it is also possible to get quantitative or semiquantitative results for a giventype of surface. A large area is measurable in a shorter time, with detailed
information on local (macroscopic to microscopic) properties.
It should be noted that quantification of the surface quality with
contact-angle and u,dd measurements is only possible within a well-defined
system. The techniques cannot be used to compare surfaces with different
roughness and/or different chemistry.
63
Ill Materials and Methods
2.2.5 Atomic Force Microscopy (AFM)
AFM measurements were performed with a commercial scanning probemicroscope (Nanoscope E, Digital Instruments, Santa Barbara, CA).Measurements of surface topography and lateral force were made
simultaneously by operating the instrument in the contact mode while
scanning the cantilever laterally. As AFM probes, we used sharpened Si3N4Microlevers (Park Scientific, Sunnyvale, CA) with a nominal probe tipradius of 20 nm and a force constant of 0.03 N/m. Only those probes that
provided good quality in the high-resolution imaging of freshly cleaved mica
were employed for the imaging of the samples. The applied load duringscanning was in all cases below 0.5 nN and generally a slight 'pulling' of the
tip was necessary, i.e. applying negative loads, in order to get best
resolution. All measurements were performed in ambient air.
64
Ill Materials and Methods
2.3 Determination of Adsorption
The determination of adsorbed material can be performed by different
methods. If the system is well known, such as ODPO4 onto TaaOs, one can
control and estimate the adsorption reaction by a simple measurement of the
contact angle (see chapter III 2.2.3). This is only valid because the reaction
starts with a very hydrophilic clean substrate and ends with a very hydro¬phobic monolayer. Another method is the determination of fluorescence of a
tracer molecule. This method will be discussed in chapter III 2.4.2.
For our investigations of adsorption kinetics we had two methods at our
disposal. Both the grating coupler system and the OWLS system are based
on the waveguide technique and the dependence of the effective refractive
index, which is related to the mass adsorption.
2.3.1 Grating Coupler
A schematic drawing of the grating coupler apparatus (GKR 401,Frauenhofer-Institut für Physikalische Messtechnik, Freiburg, Germany) is
shown in chapter II 2.3.1. The method uses the reflection of a defocused
laser light beam that is directed on the grating of a waveguide chip. All the
light is reflected except the part of the beam having the incoupling angle of
the grating. As the incoupling angle depends on the mass adsorption at the
surface, this missing reflection shifts during the adsorption process. The
important advantage of the system is the real-time determination of
adsorption down to the millisecond scale.
65
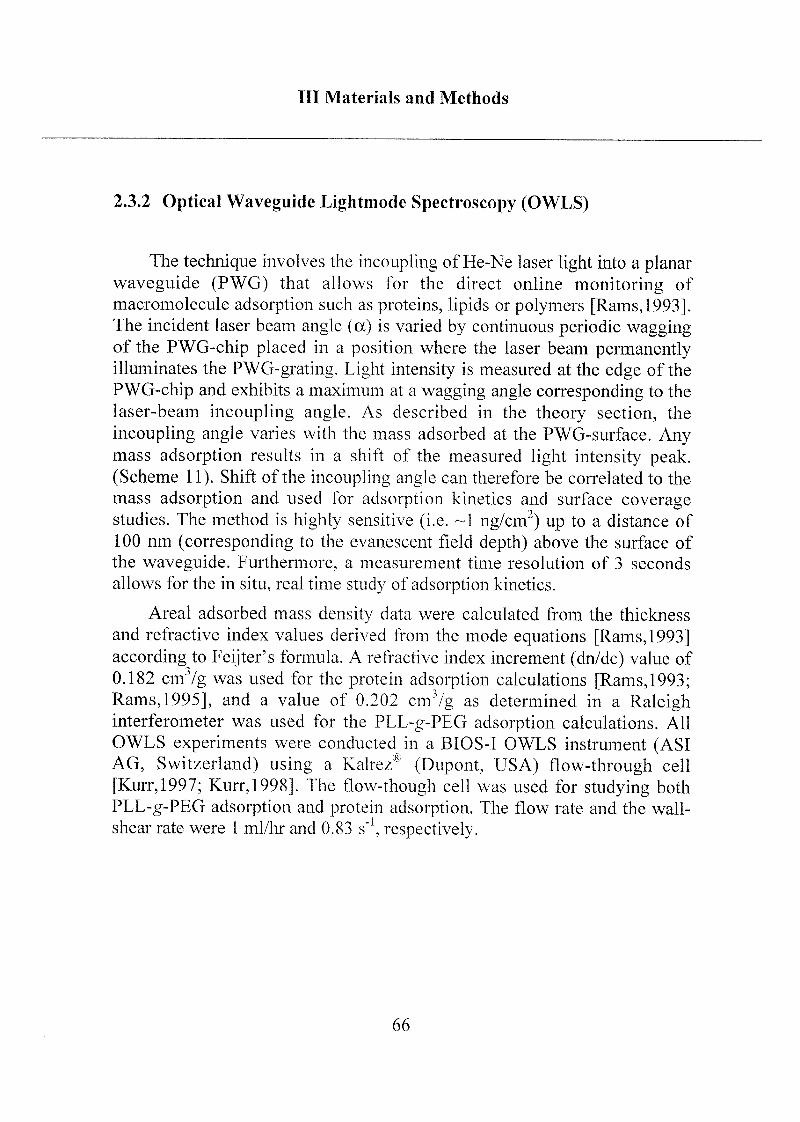
Ill Materials and Methods
2.3.2 Optical Waveguide Lightmode Spectroscopy (OWLS)
The technique involves the incoupling of He-Ne laser light into a planarwaveguide (PWG) that allows for the direct online monitoring of
macromoleculc adsorption such as proteins, lipids or polymers [Rams, 1993].The incident laser beam angle (a) is varied by continuous periodic waggingof the PWG-chip placed in a position where the laser beam permanentlyilluminates the PWG-grating. Light intensity is measured at the edge of the
PWG-chip and exhibits a maximum at a wagging angle corresponding to the
laser-beam incoupling angle. As described in the theory section, the
incoupling angle varies with the mass adsorbed at the PWG-surface. Anymass adsorption results in a shift of the measured light intensity peak.(Scheme 11). Shift of the incoupling angle can therefore be correlated to the
mass adsorption and used for adsorption kinetics and surface coveragestudies. The method is highly sensitive (i.e. ~1 ng/cmf) up to a distance of
100 nm (corresponding to the evanescent field depth) above the surface of
the waveguide. Furthermore, a measurement time resolution of 3 seconds
allows for the in situ, real time study of adsorption kinetics.
Areal adsorbed mass density data were calculated from the thickness
and refractive index values derived from the mode equations [Rams, 1993]according to Feijter's formula. A refractive index increment (dn/dc) value of
0.182 cm /g was used for the protein adsorption calculations [Rams, 1993;Rams, 1995], and a value of 0.202 cm7g as determined in a Raleighinterferometer was used for the PLL-g-PEG adsorption calculations. All
OWLS experiments were conducted in a BlOS-t OWLS instrument (ASIAG, Switzerland) using a KalrezR (Dupont, USA) flow-through cell
[Kurr,1997; Kurr,1998]. The flow-though cell was used for studying both
PLL-g-PEG adsorption and protein adsorption. The flow rate and the wall-
shear rate were 1 ml/hr and 0.83 s"1, respectively.
66
MI Materials and Methods
• ; i i
a
/
Scheme 11: Schematic drawing of the optical waveguide lightmodc spectro-
seopv (OWLS) apparatus: A laser beam (1) is directed onto the
grating (2) of a planar wavegide chip (3). The chip is moved in
periodic wagging mode and the permanently measured lightintensity at the edge (4) exhibits maxima at the mcouplmgangle a ( plain line - to, dashed line = tj, striped line ~= t2) (5),The maxima of the light intensity data 1 = f(a) are converted
into a = f(t) corresponding to mass m = f(t) (6),
67
Ill Materials and Methods
2.4 Determination of Bioactivity
For the performance studies of the different interfaces (phosph(on)atesand PLL-PEG/PEGbiotin derivatives, respectively) between the metal oxide
substrate and the recognition molecule, two different analytical systems were
used: a) determination of enzyme activity and b) fluorescence measurements
of an immunoassay.
2.4.1 Determination of Enzymatic Activity
Streptavidin horseradish peroxidase is a well-known and widely used
model system for determining enzymatic activities.
Quantification of the enzymic activity was performed by measuring the
absorption of the transformed indicator, TMB (3,3'-5,5'-tetramethyl-benzidine), at 450 nm using a photometer (JASCO 7800 UV/Vis Spectro¬photometer).
2.4.2 Fast Optical Biospecific Interaction Analysis (FOB1A)
Fast optical biospecific interaction analysis (FOBIA) is a system that has
been developed at Novartis Pharma AG, Basel, and its performance was
improved at Zeptosens AG, Witterswil (Scheme 12) [Duve,1996].
This combination of evanescent-field excitation and fluorescence quanti¬fication is a very surface-selective (ca. 200 nm information depth towards
bulk solution) method that provide results with low bulk signal and hightracer selectivity.
68
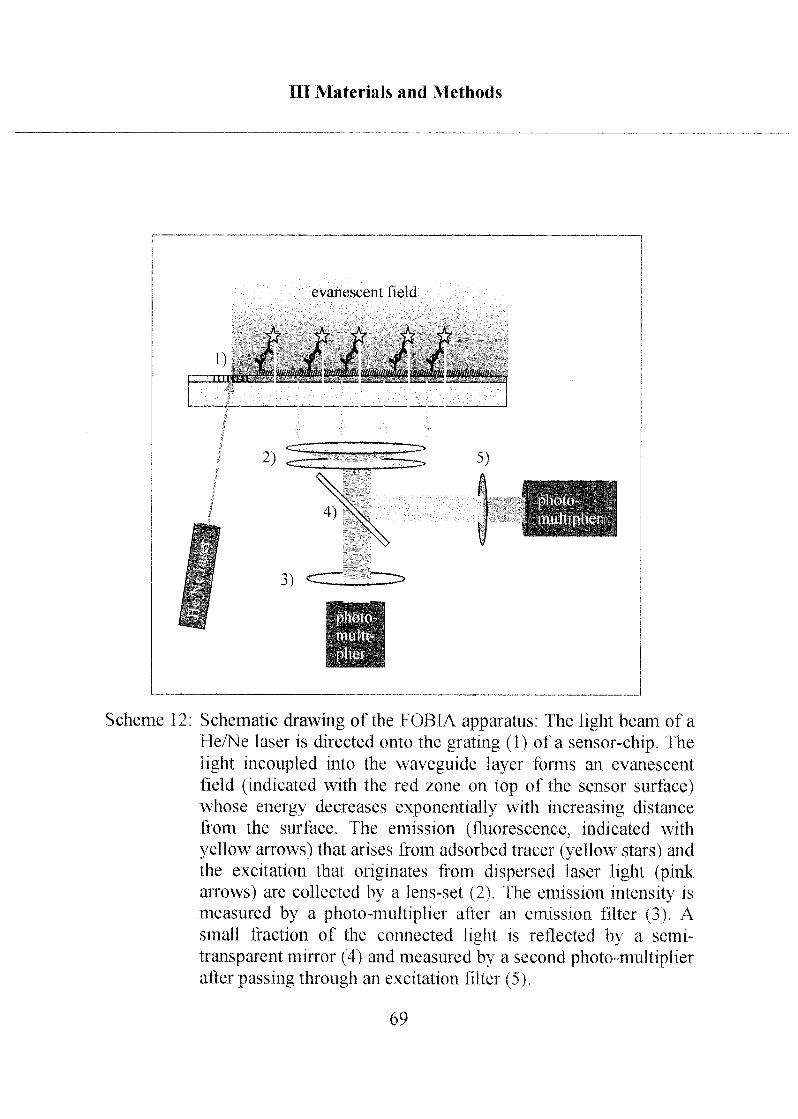
Ill Materials and Methods
Scheme 12: Schematic drawing of the FOBIA apparatus: The light beam of a
He/Ne laser is directed onto the grating (1) of a sensor-chip. The
light incoupled into the waveguide layer forms an evanescent
field (indicated with the red zone on top of the sensor surface)whose energy decreases exponentially with increasing distance
from the surface. The emission (fluorescence, indicated with
yellow arrows) that arises from adsorbed tracer (yellow stars) and
the excitation that originates from dispersed laser light (pinkarrows) are collected by a lens-set (2). The emission intensity is
measured by a photo-multiplier after an emission filter (3). Asmall fraction of the connected light is reflected by a semi-
transparent mirror (4) and measured by a second photo-multiplierafter passing through an excitation filter (5).
69
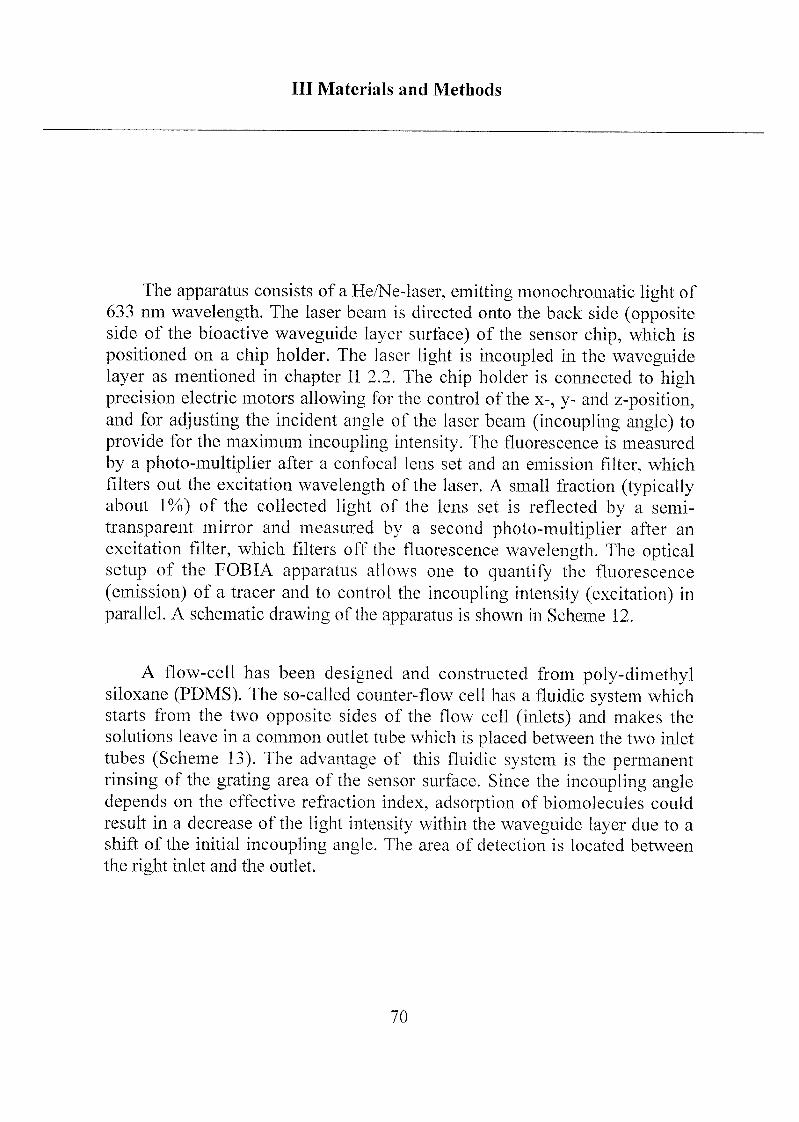
Ill Materials and Methods
The apparatus consists of a He/Ne-laser, emitting monochromatic light of
633 nm wavelength. The laser beam is directed onto the back side (oppositeside of the bioactive waveguide layer surface) of the sensor chip, which is
positioned on a chip holder. The laser light is incoupled in the waveguidelayer as mentioned in chapter II 2.2. The chip holder is connected to highprecision electric motors allowing for the control of the x-, y- and z-position,and for adjusting the incident angle of the laser beam (incoupling angle) to
provide for the maximum incoupling intensity. The fluorescence is measured
by a photo-multiplier after a confocal lens set and an emission filter, which
filters out the excitation wavelength of the laser. A small fraction (typicallyabout 1%) of the collected light of the lens set is reflected by a semi-
transparent mirror and measured by a second photo-multiplier after an
excitation filter, which filters off the fluorescence wavelength. The opticalsetup of the FOBIA apparatus allows one to quantify the fluorescence
(emission) of a tracer and to control the incoupling intensity (excitation) in
parallel. A schematic drawing of the apparatus is shown in Scheme 12.
A flow-cell has been designed and constructed from poly-dimethylsiloxane (PDMS). The so-called counter-flow cell has a fluidic system which
starts from the two opposite sides of the flow cell (inlets) and makes the
solutions leave in a common outlet tube which is placed between the two inlet
tubes (Scheme 13). The advantage of this fluidic system is the permanentrinsing of the grating area of the sensor surface. Since the incoupling angledepends on the effective refraction index, adsorption of biomolecules could
result in a decrease of the light intensity within the waveguide layer due to a
shift of the initial incoupling angle. The area of detection is located between
the right inlet and the outlet.
70
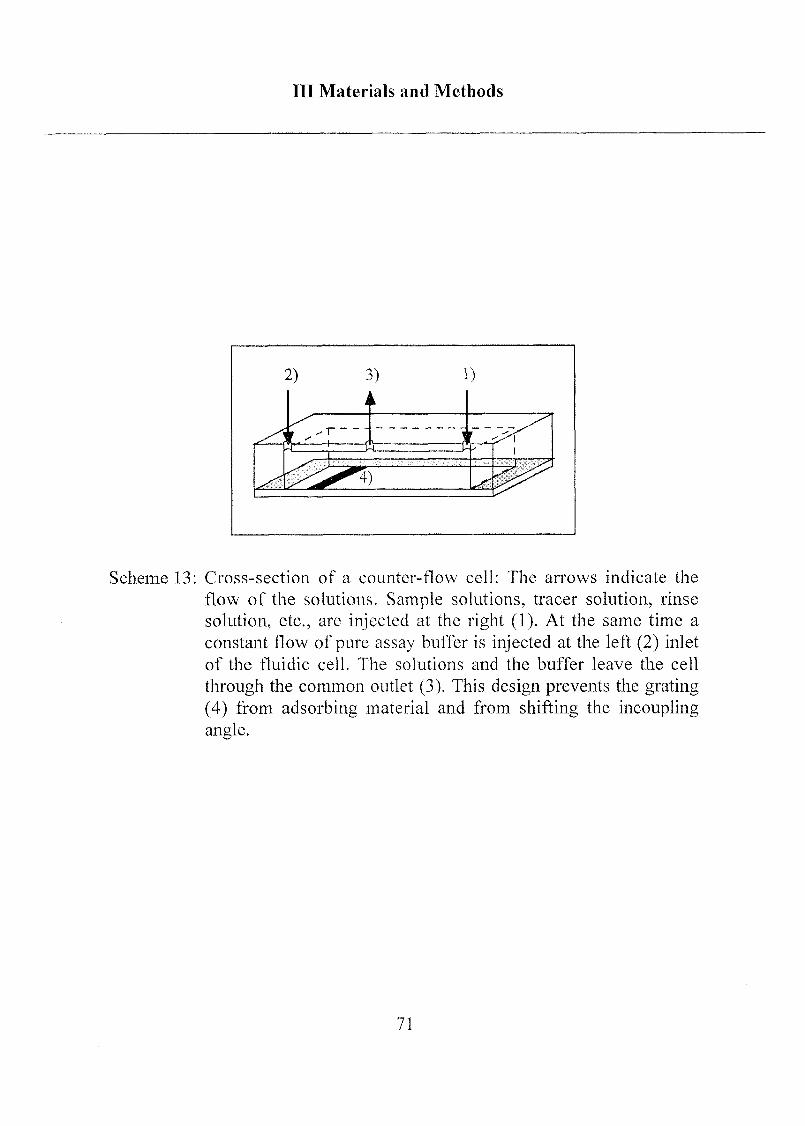
Ill Materials and Methods
Scheme 13: Cross-section of a counter-flow cell: The arrows indicate the
flow of the solutions. Sample solutions, tracer solution, rinse
solution, etc., are injected at the right (1). At the same time a
constant flow of pure assay buffer is injected at the left (2) inlet
of the fluidic cell. The solutions and the buffer leave the cell
through the common outlet (3). This design prevents the grating
(4) from adsorbing material and from shifting the incoupling
angle.
71
IV Results and Discussion
IV Results and Discussion
1 Cleaning of the Substrate Surfaces
The requirements of a waveguide layer for application in optical
sensing are high transparency and high refractive index. The formation of
amorphous (or polycrystalline) films by a physical vapor deposition process
provides highly transparent layers and makes metal oxides such as tantalum
oxide (Ta205) and niobium oxide (Nb2Oi) interesting base materials.
Diffuse diffraction of incoupled laser light leads to the loss of
evanescent field energy, an increase in the noise signal in the sensor
application and a decrease in the reproducibility of the results. The reasons
for diffuse diffraction in such waveguide layers include the formation of
metal oxide crystal, the roughness of the surface and the presence of
impurities within and/or on top of the surfaces. The cleaning procedure of
waveguide devices immediately prior to the functionalization process is
therefore essential. It is important to use an efficient but mild cleaningmethod, which does not increase the surface roughness. We successfullyused ultrasonic treatment in 2-propanol, UV-cleaning or oxygen plasma
cleaning as well as combinations thereof.
1.1 Cleaning Procedures
All glass or PTFE containers were cleaned with piranha acid (cone.H2SO4 : H2O2 - 3:1 mixture) for 1 hour before use, followed by extensivelyrinsing with ultrapure water until the water was pH-neutral. The containers
were then washed several times with 2-propanol. Before and after every
batch of sample cleaning and/or coating process these containers were
treated in an ultrasonic bath with 2-propanol for 15 minutes.
72
IV Results and Discussion
All substrates were placed either in a highly clean glass container or in
a highly clean PTFE container and treated in an ultrasonic bath with
2-propanol for 15 minutes. It is very important to place the samples in a
vertical position to remove microscopically small particles, such as glasspowder, during the somcation. Such small particles cannot be removed bysimply blowing away, not even with a strong gas stream. The samples were
removed from 2-propanol and blow-dried in a nitrogen stream followed byan additional cleaning in a UV-ozone cleaner for 30 minutes or in an
oxygen-plasma cleaner for 2 minutes.
Physical vapor deposited Ta205-chips (ion plated or sputter coated) and
NbiCVchips (sputter coated) were investigated before and after different
cleaning procedures by dynamic water-contact-angle measurements and byXPS at two different take-off angles. The 75° take-off angle (with respect to
the surface plane), with an information depth of about 9 nm, is more
substrate sensitive, providing data for determination of metal oxide
composition. The take-off angle of 15° (depth information of about 2.5 nm)is more surface-sensitive, and contamination is more easily detected. The
combination of data from the two take-off angles provides importantinformation about the contamination (e.g. adsorbed contaminants at the
surface or impurities within the metal oxide layer).
The cleaning procedures were: a) ultrasonic treatment in 2-propanol for
15 minutes, b) oxygen-plasma cleaning for 2 minutes and c) combination of
both.
1.2 Results
As received, the substrates were contaminated with small white
particles that were easily visible by eye. These particles could not
completely be removed by a nitrogen gas stream and were still present after
the direct oxygen plasma cleaning. After sonication in 2-propanol no more
visible contamination could be detected.
5
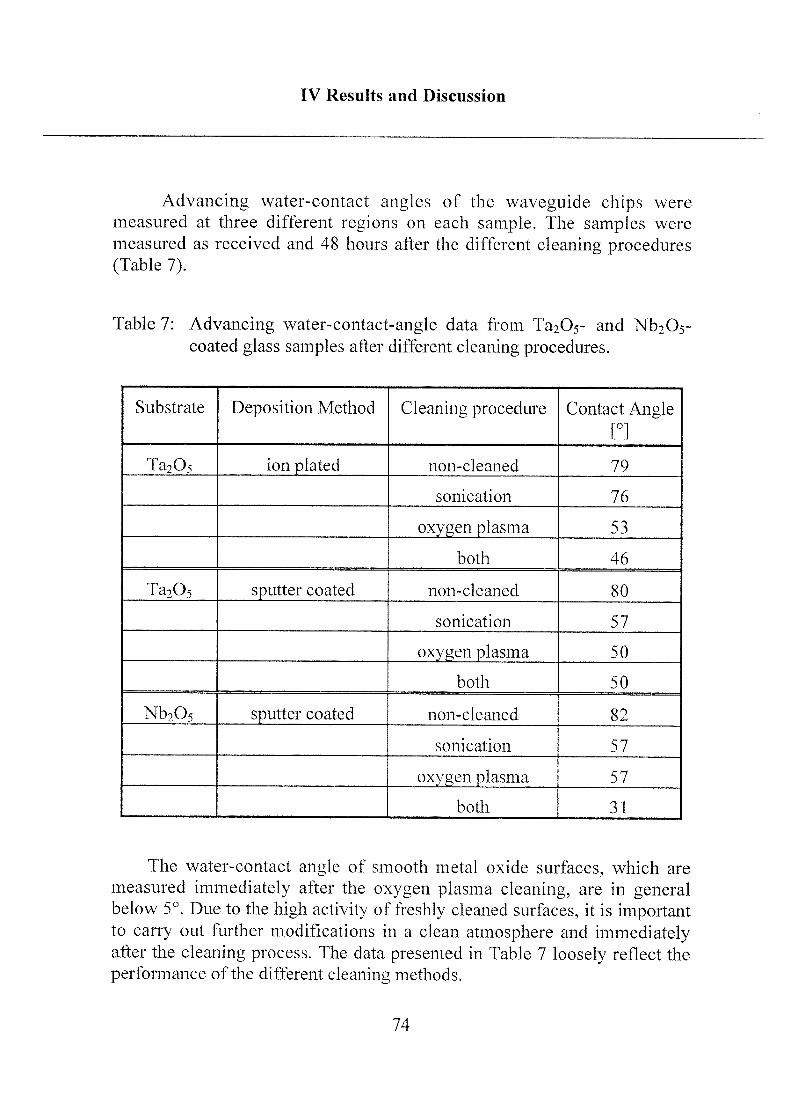
IV Results and Discussion
Advancing water-contact angles of the waveguide chips were
measured at three different regions on each sample. The samples were
measured as received and 48 hours after the different cleaning procedures(Table 7).
Table 7: Advancing water-contact-angle data from Ta205- and Nb2C>5-coated glass samples after different cleaning procedures.
Substrate Deposition Method Cleaning procedure Contact Angle[°]
Ta205 ion plated non-cleaned 79
sonication 76
oxygen plasma 53
both 46
Ta2Os sputter coated non-cleaned 80
sonication 57
oxygen plasma 50
both 50
Nb205 sputter coated non-cleaned 82
sonication 57
oxygen plasma 57
both 31
The water-contact angle of smooth metal oxide surfaces, which are
measured immediately after the oxygen plasma cleaning, are in generalbelow 5°. Due to the high activity of freshly cleaned surfaces, it is importantto carry out further modifications in a clean atmosphere and immediatelyafter the cleaning process. The data presented in Table 7 loosely reflect the
performance of the different cleaning methods.
74
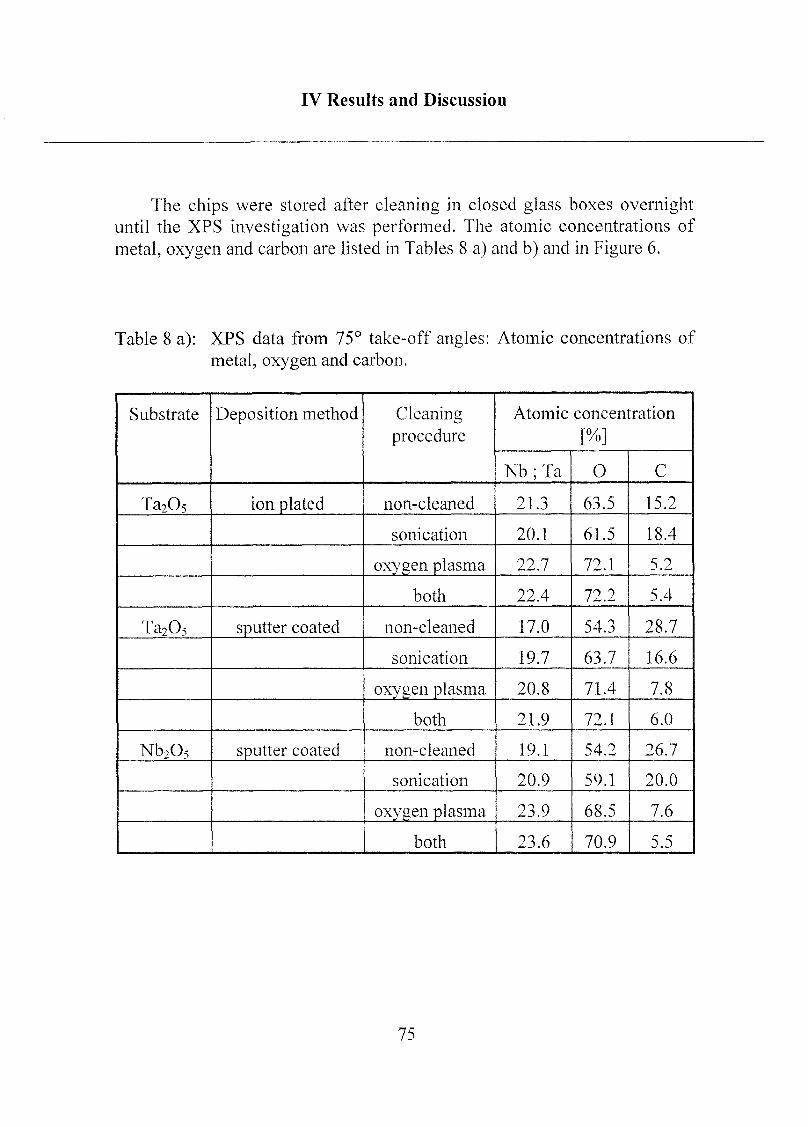
IV Results and Discussion
The chips were stored after cleaning in closed glass boxes overnightuntil the XPS investigation was performed. The atomic concentrations of
metal, oxygen and carbon are listed in Tables 8 a) and b) and in Figure 6.
Table 8 a): XPS data from 75° take-off angles: Atomic concentrations of
metal, oxygen and carbon.
Substrate Deposition method Cleaning
procedure
Atomic concentration
[%]
Nb;Ta 0 C
Ta205 ion plated non-cleaned 21.3 63.5 15.2
sonication 20.1 61.5 18.4
oxygen plasma 22.7 72.1 5.2
both 22.4 72.2 5.4
Ta205 sputter coated non-cleaned 17.0 54.3 28.7
sonication 19.7 63.7 16.6
oxygen plasma 20.8 71.4 7.8
both 21.9 72.1 6.0
Nb2Os sputter coated non-cleaned 19.1 54.2 26.7
sonication 20.9 59.1 20.0
oxygen plasma 23.9 68.5 7.6
both 23.6 70.9 5.5
75
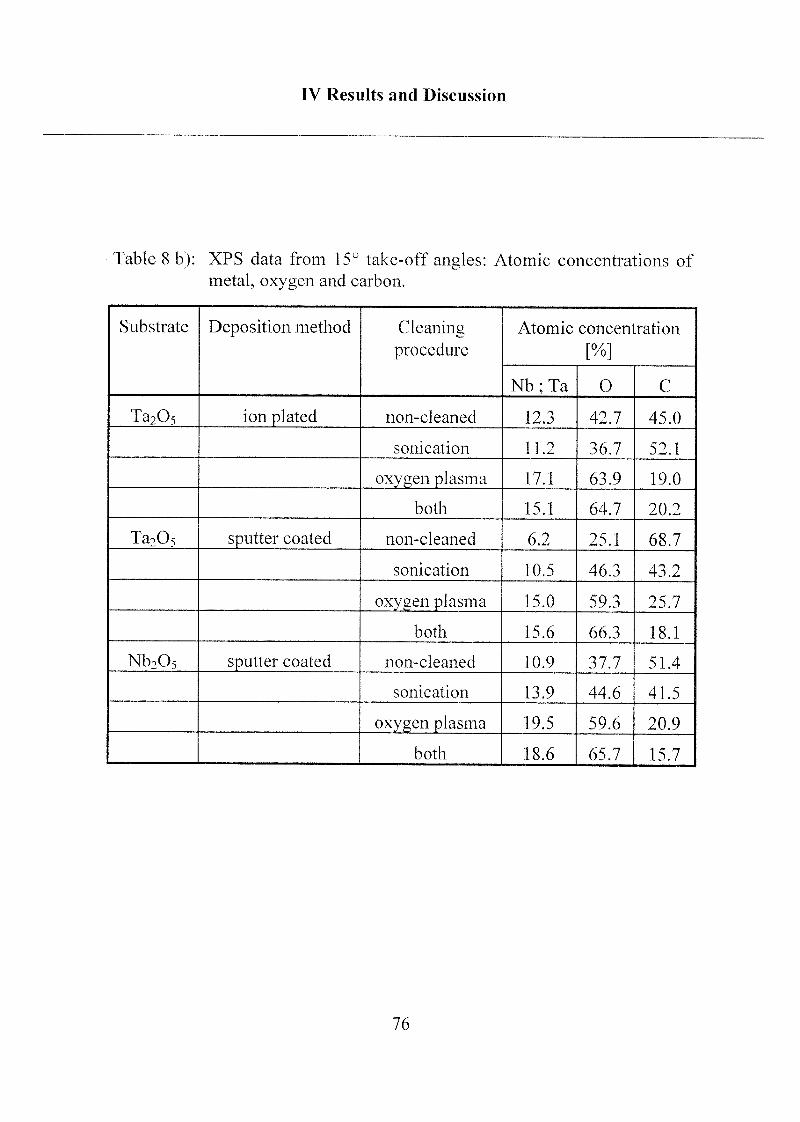
IV Results and Discussion
Table 8 b): XPS data from 15° take-off angles: Atomic concentrations of
metal, oxygen and carbon.
Substrate Deposition method Cleaningprocedure
Atomic concentration
[%]
Nb;Ta 0 C
Ta205 ion plated non-cleaned 12.3 42.7 45.0
sonication 11.2 36.7 52.1
oxygen plasma 17.1 63.9 19.0
both 15.1 64.7 20.2
Ta205 sputter coated non-cleaned 6.2 25.1 68.7
sonication 10.5 46.3 43.2
oxygen plasma 15.0 59.3 25.7
both 15.6 66.3 18.1
Nb2Os sputter coated non-cleaned 10.9 37.7 51.4
sonication 13.9 44.6 41.5
oxygen plasma 19.5 59.6 20.9
both 18.6 65.7 15.7
76
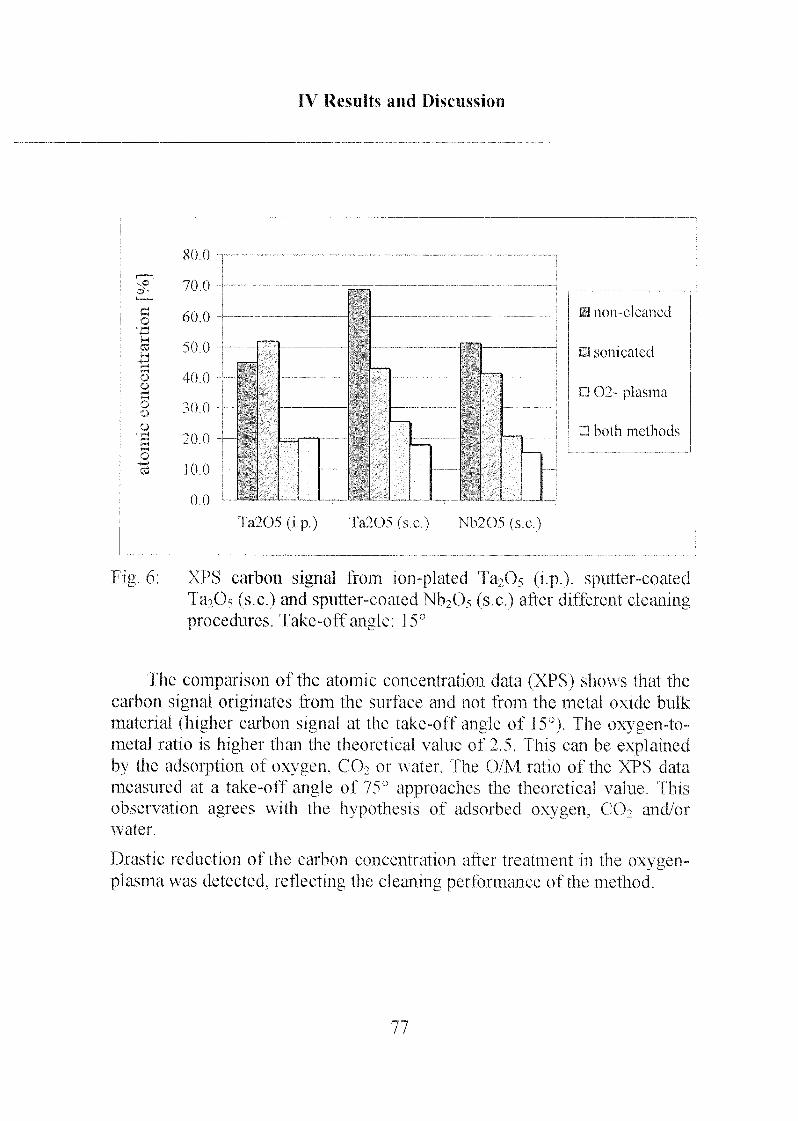
IV Results and Discussion
o
4)oft
oo
o
o
Cd
Fig 6
80 0
70 0
60 0
50 0
40 0
30 0
20 0
10 0
0 0
"^
^\
^—
;
\ \
T1^
\— -
\
__ -
v^\\
\N
r a205 (i p ) Ta205 ( s c ) Nb20S (sc)
E3 non-cleaned
D sonicated
02- plasma
D both methods
XPS carbon signal from ion-plated T'àjO^ (i p ). sputter-coatedTaiOs (s c ) and sputter-coated Nb2Üs (sc) after different cleaningprocedures Take-off angle 15°
The comparison of the atomic concentration data (XPS) shows that the
carbon signal originates from the surface and not from the metal oxide bulk
material (higher carbon signal at the take-off angle of 15°) The oxygen-to-metal ratio is higher than the theoretical value of 2 5 I his can be explainedby the adsorption of oxygen, C02 or water lhe O/M ratio of the XPS data
measured at a take-off angle of 75° approaches the theoretical value I his
observation agrees with the hypothesis of adsorbed oxygen, CO; and/or
water
Drastic reduction of the carbon concentration aftei treatment in the oxygen-
plasma was detected, reflecting the cleaning performance of the method
jtmt
IV Results and Discussion
For the reduction of adsorbed hydrocarbons, the ultrasonic treatment
was not very successful. Nevertheless, it is an important precleaning step for
the removal of particles and for highly contaminated surfaces. However,
oxygen-plasma cleaning is a high-performance cleaning method, providingmetal oxide surfaces with a very low amount of hydrocarbons.Consequently, the combination of both cleaning methods seems to be an
ideal pretreatment for further biosensor applications.
Except for the carbon signal, no other elements beside the expectedmetal and oxygen peaks could be detected by XPS.
UV cleaning for 30 minutes instead of 02-plasma treatment for 2
minutes resulted in contact-angle values of < 10° if the samples were
measured immediately after the cleaning process. XPS results show low
carbon concentrations after the cleaning with similar recontamination as for
the oxygen-plasma-treated samples.
1.3 Influence on Further Surface-Modification Steps
A cleaning procedure has been shown to be necessary to remove
macroscopic-to-microscopic particles and even molecular surface
contamination. Whether small amounts of contaminants can be replaced byphosph(on)ates during the self-assembly process is discussed below:
Ta2Û5 chips were cleaned using three different procedures: a) one
cleaning cycle of ultrasonic treatment in 2-propanol for 15 minutes, b) two
cycles of ultrasonic treatment in 2-propanol for 15 minutes and c) one cycleof ultrasonic treatment in 2-propanol for 15 minutes followed by UV-
cleaning for 30 minutes.
All chips were then immersed in a 0.05 mM ODPO4 solution (in n-heptane +0.4% 2-propanol). The samples were removed after 48 hours, rinsed with
78
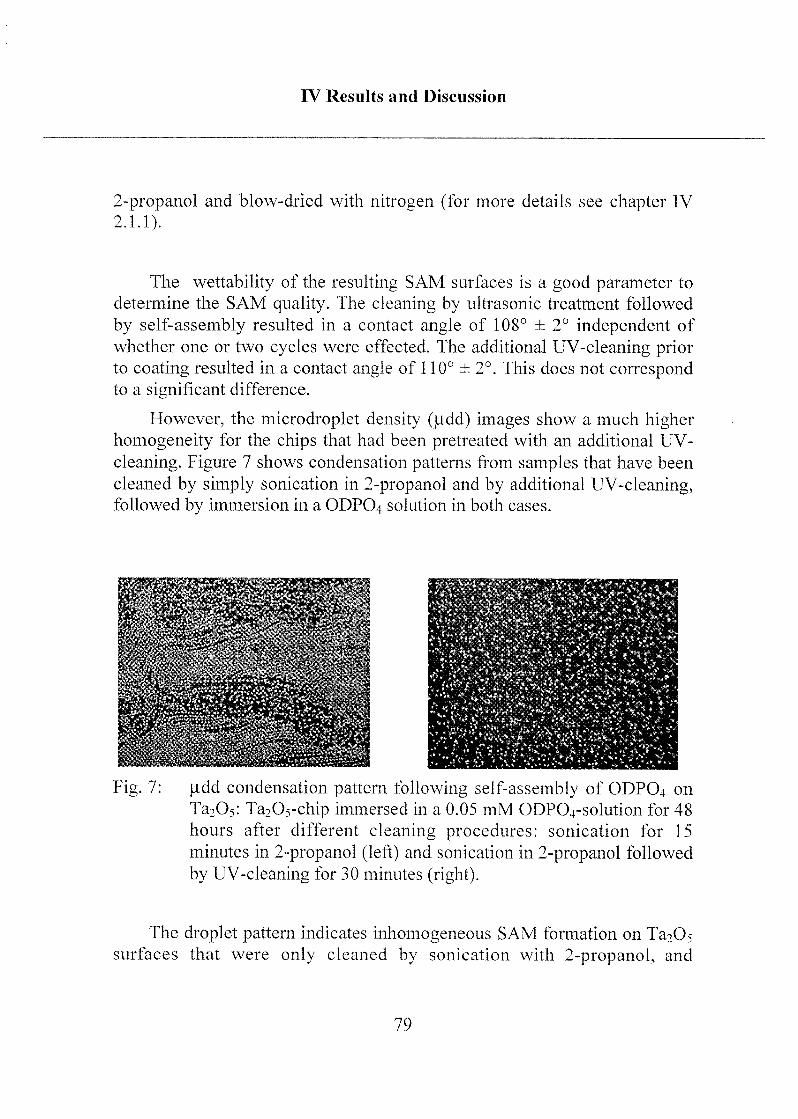
IV Results and Discussion
2-propanol and blow-dried with nitrogen (for more details see chapter IV
2.1.1).
The wettability of the resulting SAM surfaces is a good parameter to
determine the SAM quality. The cleaning by ultrasonic treatment followed
by self-assembly resulted in a contact angle of 108° ± 2° independent of
whether one or two cycles were effected. The additional UV-cleaning priorto coating resulted in a contact angle of 110° ± 2°. This does not coiTespondto a significant difference.
However, the microdroplet density ((idd) images show a much higherhomogeneity for the chips that had been pretreated with an additional UV-
cleaning. Figure 7 shows condensation patterns from samples that have been
cleaned by simply sonication in 2-propanol and by additional UV-cleaning,followed by immersion in a ODPO4 solution in both cases.
Fig. 7: judd condensation pattern following self-assembly of ODPO4 on
Ta205: Ta205-chip immersed in a 0.05 mM ODP04-solution for 48
hours after different cleaning procedures: sonication for 15
minutes in 2-propanol (left) and sonication in 2-propanol followed
by UV-cleaning for 30 minutes (right).
The droplet pattern indicates inhomogeneous SAM formation on l^Ossurfaces that were only cleaned by sonication with 2-propanol, and
79
IV Results and Discussion
homogeneous monolayer formation after the combination of sonication and
UV-cleaning.
According to the results of the previous chapters we conclude that a
combination of both sonication in 2-propanol for 15 minutes followed byUV-cleaning for 30 minutes is needed for good surface coating performance.
1.4 Influence on the Waveguide Properties
As shown in the previous sections, the cleanliness of the metal oxide
surfaces is an important factor. On the other hand, it is also essential that the
transparency of the waveguide layer remain as high as possible and that the
light mode intensity attenuation is small.
Planar waveguide chips consisted of an incoupling and an outcoupiinggrating (Scheme 14) were treated by different cleaning procedures and the
intensity of the light mode was determined by measuring the intensity of the
outcoupled light.
State of the chip treatment:
a) chip measured as received without any treatment
b) ultrasonic treatment in 2-propanol for 15 minutes
c) UV-cleaning for 30 minutes after treatment b)
d) chip stored at lab conditions for 10 minutes after treatment c)
e) chip stored at lab conditions for 60 minutes after treatment c)
f) chip stored at lab conditions for 2 hours after treatment c)
g) chip stored at lab conditions for 24 hours after treatment c)
h) additional ultrasonic treatment in 2-propanol for 15 minutes
i) chip stored at lab conditions for 5 more days
80
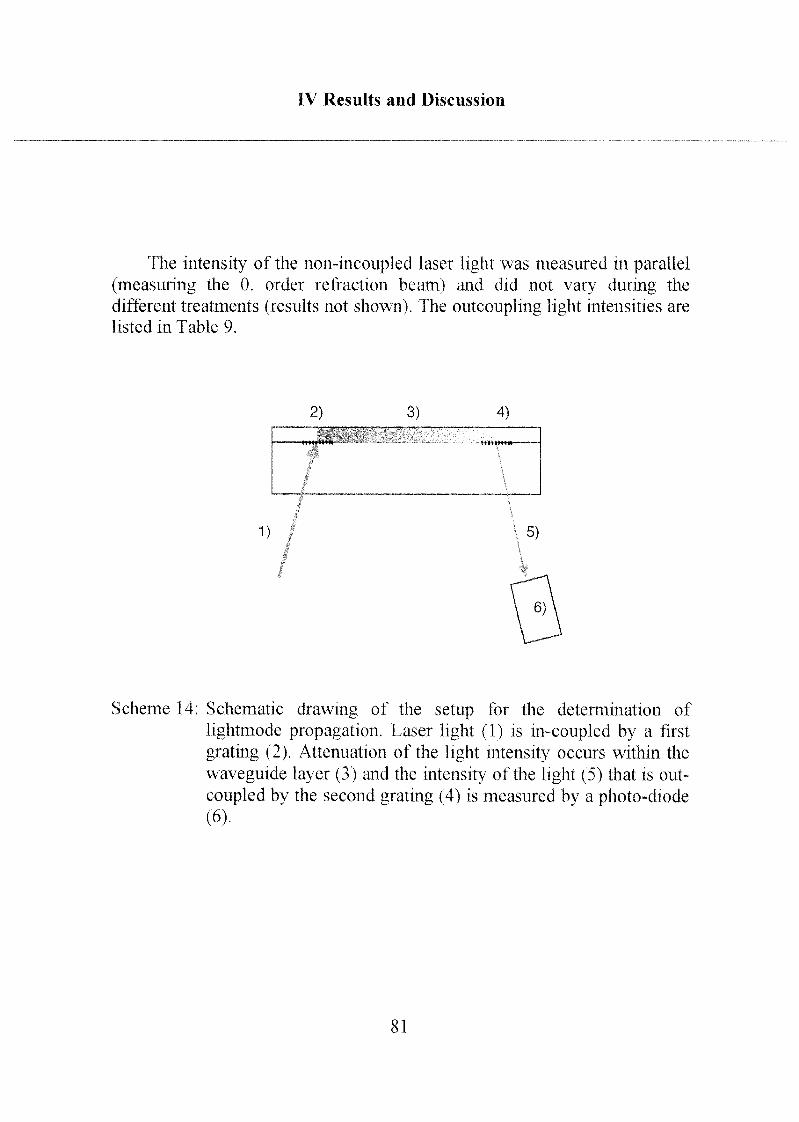
IV Results and Discussion
The intensity of the non-incoupled laser light was measured in parallel(measuring the 0, order refraction beam) and did not vary during the
different treatments (results not shown). The outcoupling light intensities are
listed in Table 9.
2) 3) 4)
„^V. HMttWM
1)
Scheme 14: Schematic drawing of the setup for the detennination of
lightmode propagation. Laser light (1) is in-coupled by a first
grating (2). Attenuation of the light intensity occurs within the
waveguide layer (3) and the intensity of the light (5) that is out-
coupled by the second grating (4) is measured by a photo-diode(6).
81
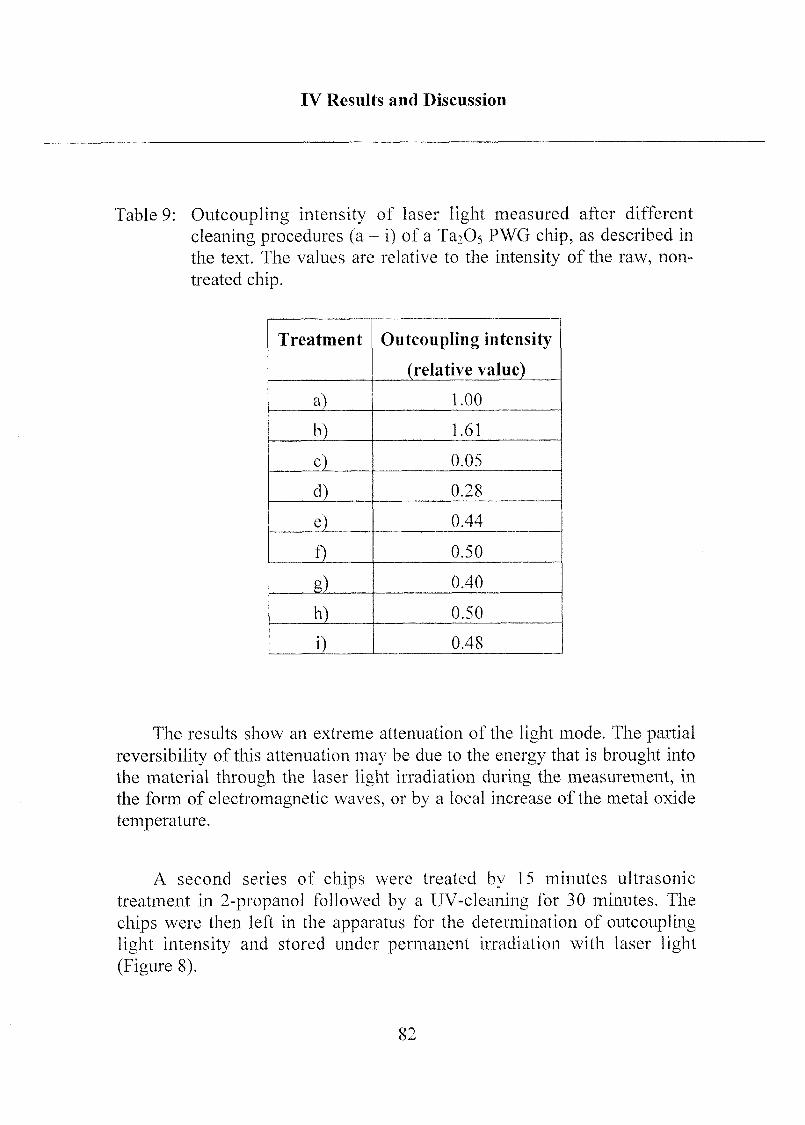
IV Results and Discussion
Table 9: Outcoupling intensity of laser light measured after different
cleaning procedures (a - i) of a Ta205 PWG chip, as described in
the text. The values are relative to the intensity of the raw, non-
treated chip.
Treatment Outcoupling intensity
(relative value)
a) 1.00
b) 1.61
c) 0.05
d) 0.28
e) 0.44
f) 0.50
g) 0.40
h) 0.50
i) 0.48
The results show an extreme attenuation of the light mode. The partial
reversibility of this attenuation may be due to the energy that is brought into
the material through the laser light irradiation during the measurement, in
the form of electromagnetic waves, or by a local increase of the metal oxide
temperature.
A second series of chips were treated by 15 minutes ultrasonic
treatment in 2-propanol followed by a UV-cleaning for 30 minutes. The
chips were then left in the apparatus for the determination of outcoupling
light intensity and stored under permanent irradiation with laser light
(Figure 8).
82
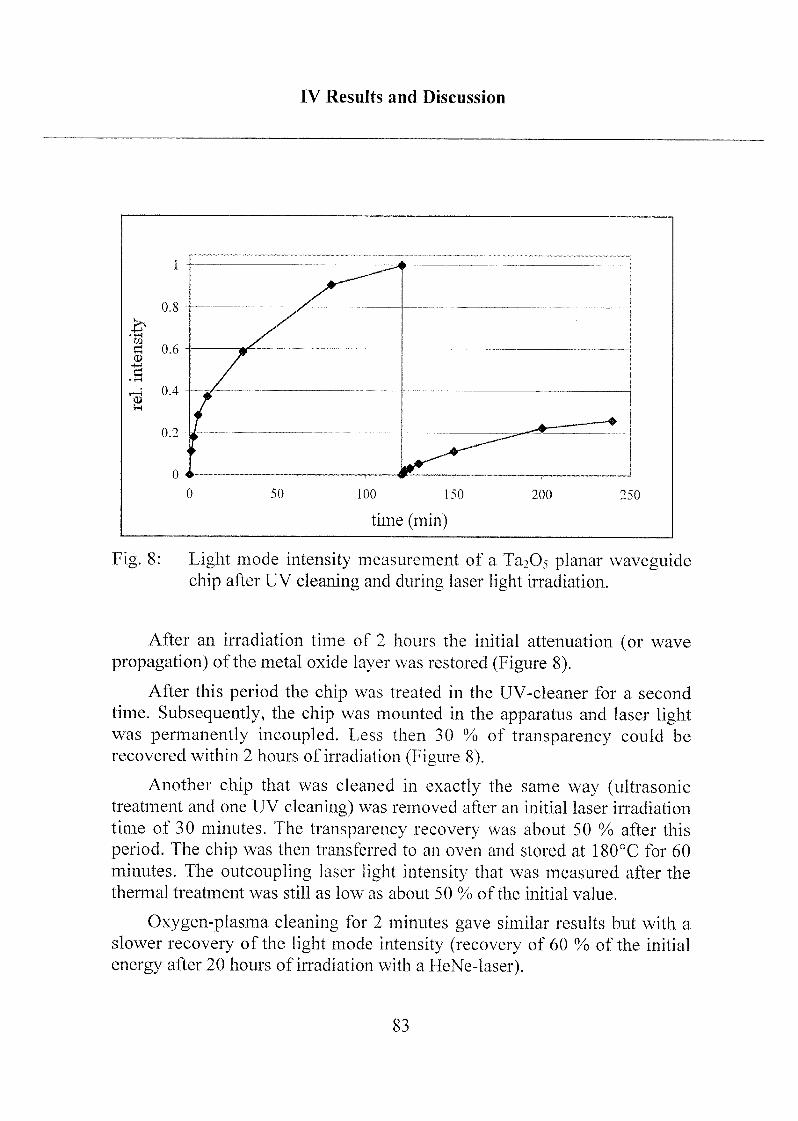
IV Results and Discussion
Fig. 8: Light mode intensity measurement of a Ta205 planar waveguidechip after UV cleaning and during laser light irradiation.
After an irradiation time of 2 hours the initial attenuation (or wave
propagation) of the metal oxide layer was restored (Figure 8).
After this period the chip was treated in the UV-cleaner for a second
time. Subsequently, the chip was mounted in the apparatus and laser lightwas permanently incoupled. Less then 30 % of transparency could be
recovered within 2 hours of irradiation (Figure 8).
Another chip that was cleaned in exactly the same way (ultrasonictreatment and one UV cleaning) was removed after an initial laser irradiation
time of 30 minutes. The transparency recovery was about 50 % after this
period. The chip was then transferred to an oven and stored at 180°C for 60
minutes. The outcoupling laser light intensity that was measured after the
thermal treatment was still as low as about 50 % of the initial value.
Oxygen-plasma cleaning for 2 minutes gave similar results but with a
slower recovery of the light mode intensity (recovery of 60 % of the initial
energy after 20 hours of irradiation with a HeNe-laser).
83
IV Results and Discussion
The influence on the optical biosensor performance of both the UV
cleaning and the plasma cleaning was tested with a simple rabbit IgGimmunoassay (for details see section IV 3.2). The chips of both cleaningprocedures gave good and sensitive detection by measuring the fluorescence
of immobilized tracer. The apparatus measures a region on the chip surface
that is illuminated by the evanescent field only. A strong attenuation of the
light mode intensity or even a complete absorption of the laser light wouldresult in a strong signal reduction of the immunoassay.
We conclude that UV cleaning and oxygen-plasma treatment changethe oxidation state of the metal ions and/or the structure [Lee,2000;Gabr,1999] at the chip surface. Photo-reduction of titanium oxide caused byUV-cleaning has been reported [Wang, 1998]. The metal oxide seems to be
in a metastable state similar to a transition state. The return to the initial
stable oxidation state may be promoted by low energy such as laser lightand/or ultrasonic treatment [Heng,1987]. The temperature of 180°C seems to
be too low in energy to have any detectable effect.
The second UV cleaning for 30 minutes may result in a more profoundphoto-reduction. This may explain the lower recovery of the wave
propagation after a second UV irradiation due to difficulties in reoxidatingthe metal ions.
Even after a treatment of 90 minutes in the UV cleaner no difference
could be measured by UV/VIS spectroscopy (300 - 700 nm ) between a
cleaned and a non-cleaned chip.
An overall conclusion about the cleaning of biosensor surfaces is that a
dedicated pretreatment step is essential for high reproducibility and
homogeneity of the following surface modification steps and the final
biosensor performance. Due to the less pronounced effect on the waveguideproperties we decided to treat the biosensor surfaces with UV cleaning and
not with oxygen-plasma cleaning.
The standard cleaning protocol is, therefore, the following: sonication in
2-propanol for 15 minutes followed by UV cleaning for 30 minutes.
84
IV Results and Discussion
2 Coating of substrate surfaces
2.1 Self-Assembled Monolayers (SAMs)
Self-assembled monolayers (SAMs) on metal [Folk, 1995] and metal oxide
surfaces [Gao,1997; Bain,1989; Nuzz,1983; Ulma,1991] represent a powerful and
highly flexible approach for the creation of surfaces and interfaces with a highdensity of functional groups (concentrated planes of surface functionality). This
methodology has the potential for applications in many areas, such as bio¬
sensors [Nyqu,2000; Hick,1991; Swal,l987], protein-adsorption investigations[Shum,2000; Hard, 1998], cell-behavior study [King, 1999], corrosion-resistant
systems [Alst,1999; Bram,1997], adhesion promotion [Maoz,1988], etc. The
principal classes of SAMs investigated and applied until now have been based
either on the interaction of chlorosilanes [Ulma,1990] with OH-terminated oxide
surfaces, or on the adsorption of thiols on gold [Bain, 1989]. A smaller number of
publications has appeared where alternative chemistries have been employed to
coat oxide surfaces with SAMs. These have included hydroxamic [Folk, 1995] and
carboxylic acid [Aron,1997; Laib, 1989] systems.
To date, the best-studied system has been that of self-assembled alkyl thiolates
on gold (or in certain cases silver [Port, 1987]), where thiols adsorb onto the metal
surface, first in a "lying-down" phase, followed by a rearrangement into a
"standing-up" phase, which completes the monolayer and results in a highlyordered two-dimensional structure [Folk, 1995; Chid,1991]. However, the use of
gold and silver is a problem where optical transmission is required, as in our case.
Alkyl phosphates and phosphonates constitute two systems that have been shown to
form ordered SAMs on metal oxide surfaces [Wood, 1996a; Maeg,1997; Folk, 1995;Gao,1996; Brov,1999]. Transition metal oxides, such as tantalum oxide (Ta205),niobium oxide (Nb2Os) and titanium oxide (Ti02), in particular, are known to
interact strongly with phosph(on)ates and to form stable interfacial bonds. Both
systems, thiol-gold and phosph(on)ate-metal oxide, form stable monolayers with a
"tail-up" orientation and a tilt angle of the hydrocarbon chains of about 30° with
respect to the surface normal [Text,2000]. Such amphiphile adlayers are generallyproduced from solutions in organic solvents.
85
TV Results and Discussion
2.1.1 Octadecyl Phosphate (ODPO4)
Octadecyl phosphate (ODP04), self-assembled onto Ta205 was the most
thoroughly investigated amphiphile - metal oxide combination in this work for two
reasons: a) Tantalum oxide is the standard coating material for the biosensor chipswhich we used for the assay performance, b) Since ODP04 possesses a longhydrocarbon chain (which is important for SAM stabilization due to Van der Waals
interactions between the alkyl chains), we assumed that its SAMs are best suited to
produce reproducible hydrophobic surfaces. This is the reason why this system is
treated in a separate chapter.
The long-chain monofunctional alkyl phosphate ODPO4 was used in its non-
charged acidic form, which is soluble in organic solvents and insoluble in water.
2.1.1.1 Influence of Different Solvents [Folk, 1995 ; Dann, 1998]
To study whether the polarity of the solvent has any influence on the SAM
quality we prepared ODPCVsolutions in different solvents or solvent mixtures. The
target concentration was as low as 0.5 mM. Nevertheless, in some solvents the
solubility limit was even lower. In these cases, we used saturated solutions.
Ta205 chips were cleaned according to the standard cleaning procedure (15minutes ultrasonic treatment in 2-propanol followed by 30 minutes UV cleaning)and immersed in the ODPO4 solutions. The chips were removed after 48 hours,rinsed with 2-propanol and blow-dried with nitrogen.
The hydrophobicity and the homogeneity of the SAMs were investigated usingcontact angle and (idd data, respectively. The results are listed in Table 10.
86
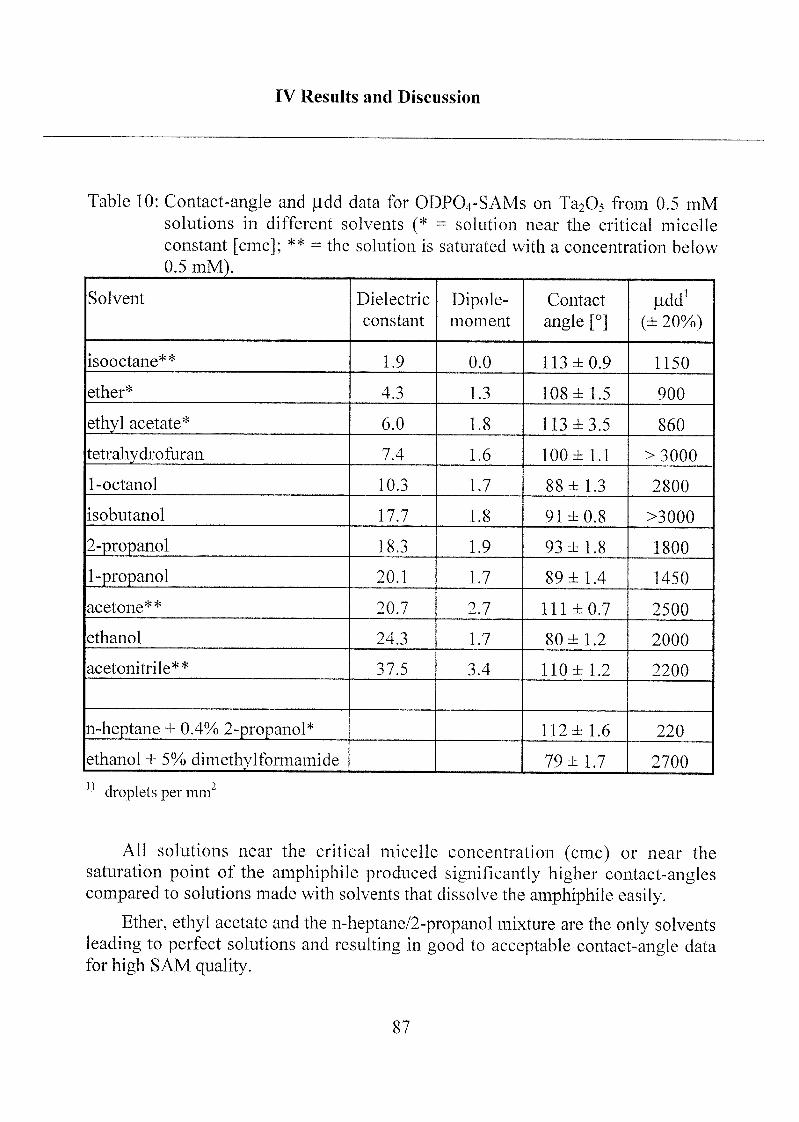
IV Results and Discussion
Table 10: Contact-angle and judd data for ODP04-SAMs on Ta205 from 0.5 mM
solutions in different solvents (* = solution near the critical micelle
constant [cmcj; ** = the solution is saturated with a concentration below
0.5 mM).
Solvent Dielectric
constant
Dipole¬moment
Contact
angle [°]
fidd1(± 20%)
isooctane** 1.9 0.0 113 ±0.9 1150
ether* 4.3 1.3 108 ±1.5 900
ethyl acetate* 6.0 1.8 113 ±3.5 860
tetrahydrofuran 7.4 1.6 100 ± 1.1 >3000
1-octanol 10.3 1.7 88 ±1.3 2800
isobutanol 17.7 1.8 91 ±0.8 >3000
2-propanol 18.3 1.9 93 ±1.8 1800
1-propanol 20.1 1.7 89 ±1.4 1450
acetone** 20.7 2.7 111 ± 0.7 2500
ethanol 24.3 1.7 80 ±1.2 2000
acetonitrile** 37.5 3.4 110± 1.2 2200
n-heptane + 0.4% 2-propanol* 112 dr 1.6 220
ethanol + 5% dimethylformamide 79 ±1.7 2700
droplets per mm'
All solutions near the critical micelle concentration (cmc) or near the
saturation point of the amphiphile produced significantly higher contact-anglescompared to solutions made with solvents that dissolve the amphiphile easily.
Ether, ethyl acetate and the n-heptane/2-propanol mixture are the only solvents
leading to perfect solutions and resulting in good to acceptable contact-angle data
for high SAM quality.
87
IV Results and Discussion
The microdroplet density (|idd) results suggest low homogeneity of the SAMs
with low hydrophobicity, an observation attributed to incompleteness of monolayerformation and a high degree of disorder,
Adlayers from saturated ODPO4 solutions (isooctane, acetone, acetonitrile) are
highly hydrophobic and slightly opaque. Loss of transparency of the samplessuggests partial multi-layer formation and/or micelle adsorption, resulting in higherroughness that may increase the contact angle due to the so-called lotus effect
[Bart,2000]. The high (idd is also an indication of the in-homogeneity of the
adlayers.
Considering only the solvents that were able to dissolve ODPO4 to a 0.5 mM
concentration, one can see that high polarity may be a stipulation for good SAM
quality. Another fact is that 0.5 mM ODPO4 solutions in ether, ethyl acetate and
n-heptane/2-propanol are near to the cmc.
With the knowledge of these first studies, we decided to use n-heptane/2-propanol as a standard solvent for the following experiments with ODPO4.
2.1.1.2 Adsorption Kinetics and SAM Stability
The self-assembly processes of alkyl phosphates onto metal oxides and alkylthiols onto gold are known to be very fast. Thiols adsorb at the gold surface and are
able to diffuse laterally. The lateral déplacement allows for dense packing of the
final monolayer. Phosph(on)ate SAMs are believed to grow in the form of islands
[Wood, 1996b]. The monolayers are then completed by coalescence of these
islands. The adsorption of the first 90 % of the phosph(on)ate and the thiol
monolayer, respectively, takes place in a few minutes or even seconds while
completion of 99 % or more of the SAM may take hours.
Self-assembled monolayers are often compared to 2-D crystals. If the growthmechanism of SAMs were similar to that of crystals one would expect more
homogeneous monolayers, if the metal oxide surfaces were immersed in solutions
at lower amphiphile concentrations and monolayer completion performed as slowlyas possible.
88
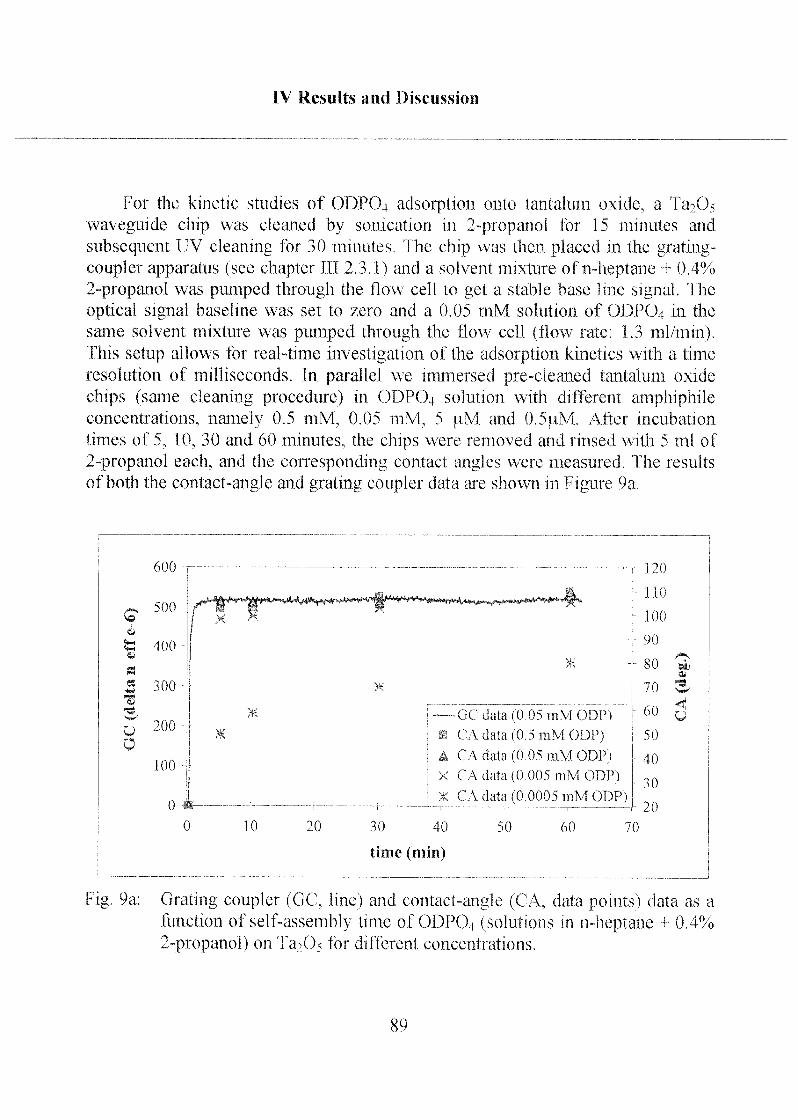
IV Results and Discussion
For the kinetic studies of ODPO4 adsorption onto tantalum oxide, a Ta_)Os
waveguide chip was cleaned by sonication in 2-propanol for 15 minutes and
subsequent UV cleaning for 30 minutes. The chip was then placed in the grating-coupler apparatus (see chapter TU 2.3.1) and a solvent mixture of n-heptane +- 0.4%
2-propanol was pumped through the flow cell to get a stable base line signal. The
optical signal baseline was set to zero and a 0.05 niM solution of ODP04 in the
same solvent mixture was pumped through the flow cell (How rate: 1.3 ml/min).This setup allows for real-time investigation of the adsorption kinetics with a time
resolution of milliseconds. In parallel we immersed pre-cleaned tantalum oxide
chips (same cleaning procedure) in ODP04 solution with different amphiphilcconcentrations, namely 0.5 mM, 0.05 mM. 5 jaM and 0.5w,M. After incubation
times of 5, 10, 30 and 60 minutes, the chips were removed and rinsed with 5 ml of
2-propanol each, and the corresponding contact angles were measured. The results
of both the contact-angle and grating coupler data are shown in Figure 9a.
VO
è
1
a
g
600
500
400
300
200
100
0
*r^O*/Sl*>!gj*«»^^
w
10 20
JSk
—GC data (0 05 ra MOD?)
u C\data(0 5mMODP)
A CA data (0 05 mM ODD
\ 0 \ data (0 005 mVIODP)
X 04. data (0 0005 mMODP)
120
110
100
90
80
70
60
50
40
30
20
30 40
time (min)
50 60 70
asw
u
Fig. 9a: Grating coupler (GC. line) and contact-angle (CA, data points) data as a
function of self-assembly time of ODP04 (solutions m n-heptane + 0.4%
2-propanol) on Ta^Os for different concentrations.
89
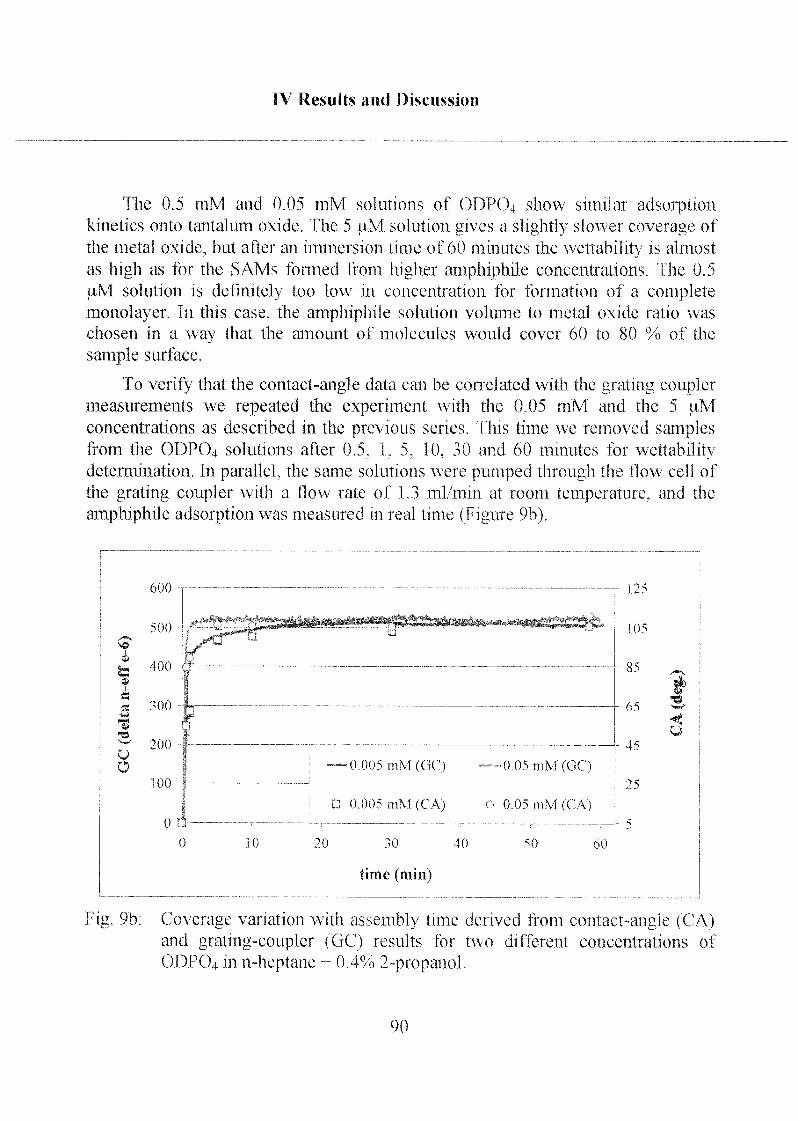
IV Results and Discussion
The 0.5 mM and 0.05 niM solutions of OüP04 show similar adsorptionkinetics onto tantalum oxide. The 5 uM solution gives a slightly slower coverage of
the metal oxide, but after an immersion time of 60 minutes the wettability is almost
as high as for the SAMs formed from higher amphiphile concentrations. The 0,5
uM solution is definitely too low 111 concentration for formation of a complete
monolayer. In this case, the amphiphile solution volume to metal oxide ratio was
chosen in a way that the amount of molecules would cover 60 to 80 % of the
sample surface.
To verify that the contact-angle data can be correlated with the grating couplermeasurements we repeated the experiment with the 0.05 mM and the 5 u.M
concentrations as described in the previous series, fhis time we removed samplesfrom the ODPO4 solutions after 0.5, 1, 5, 10, 30 and 60 minutes for wettabilitydetermination. In parallel, the same solutions were pumped through the flow cell of
the grating coupler with a How rate of 1.3 ml/mm at room temperature, and the
amphiphile adsorption was measured in real time (figure %).
600 12^
105
- XI^
(^
45
->«;
0 n —
0 20 30 40
time (min)
<
Fig. 9b: Coverage variation with assembly time derived from contact-angle (CA)and grating-coupler (GO results for two different concentrations of
ODPO4 in n-heptane + 0.4% 2-propanol.
90
IV Results and Discussion
Comparison of the results from the two methods demonstrates that contact-
angle data can be used as a sensitive marker for the SAM formation of ODPO4.
Grating-coupler data show that lower concentrations do not automatically result in
a higher mass adsorption, that would suggest for higher order in the monolayer.From these data we conclude that self-assembled monolayers may be compared to
2-D crystals, but their formation mechanism must be somehow different.
The samples used for the ODPO4-SAM-formation study by contact-angle were
also investigated by the |idd method. The distribution of condensed droplets was
already homogeneous (on the 10-|im scale) after an immersion time of 10 minutes.
However, the high density (> 2000 droplets/mm") showed that the SAM was not
yet densely packed at this time. The value dropped to about 1000 droplets/mmafter 60 minutes and about 300 droplets/mm*" after 180 minutes of immersion in the
ODPO4 solution. After 48 hours, the jidd reached 220 droplets/mm2.
For biosensor applications, one of the most important solutions is the PBS
buffer. This is the reason why SAM stability has been extensively studied in this
medium:
ODPO4 SAMs on Ta2Os were prepared in a standard manner (substratecleaning by ultrasonic treatment in 2-propanol for 15 minutes followed by UV
cleaning for 30 minutes, subsequent immersion in a 0.5 mM amphiphile solution in
n-heptane + 0.4% 2-propanol for 48 hours, removal of the substrates, and
immediate rinsing with 2-propanol, and blow-drying in nitrogen gas stream). The
samples were then transferred into a PTFE container and PBS buffer was added.
Chips were stored in the permanently stirred solution at room temperature for a few
minutes up to 16 days. Desorption of ODPO4 was determined by measuring the
contact angle (Figure 10) as well as XPS spectra at a grazing take-off angle (15°).The intensities of the carbon, oxygen, phosphorus and tantalum signals are plottedas a function of immersion time (Figure 11). The Ois signal was fitted and
deconvolved into two different types of oxygen: the phosphate oxygen (binding
energies: 531.8 and 533.1 eV) and the substrate oxygen (binding energy:
530.7 eV).
91

IV Results and Discussion
The monolayer thickness was calculated using a simplified 2-layer model
allowing for easy thickness comparison within a series such as the SAM stabilitystudies as well as for SAM formation from different amphiphiles on different
substrates (see later).
The 2-layer model only considers the substrate signal attenuation as a function
of the applied take-off angle due to the mean free path (or "attenuation lengthvalue") A,(Ekin). The equation used to calculate A.(Eun) is:
X = B •.y h v
- H- - EB equation 4
where B is the attenuation factor (B = 0.087 for organic overlayers), hv is the X-
ray energy (hv = 1486.6 eV for Al Ka), w is the work function (w = 3.95 eV) and
Eb is the binding energy of the substrate element electron (Eb = 27 eV for Ta4f).A-(Ekin) for Ta4f has been calculated to be 3.0 nm.
The calculation of the monolayer thickness d is shown in equation 5.
X»
d =
A{15°)
A(75°)1 1
equation 5
sin 75° sin 15°
where A is the integrated peak intensity (area) for the substrate (e.g. Ta4f) at the
corresponding take-off angle (15° or 75°).
92
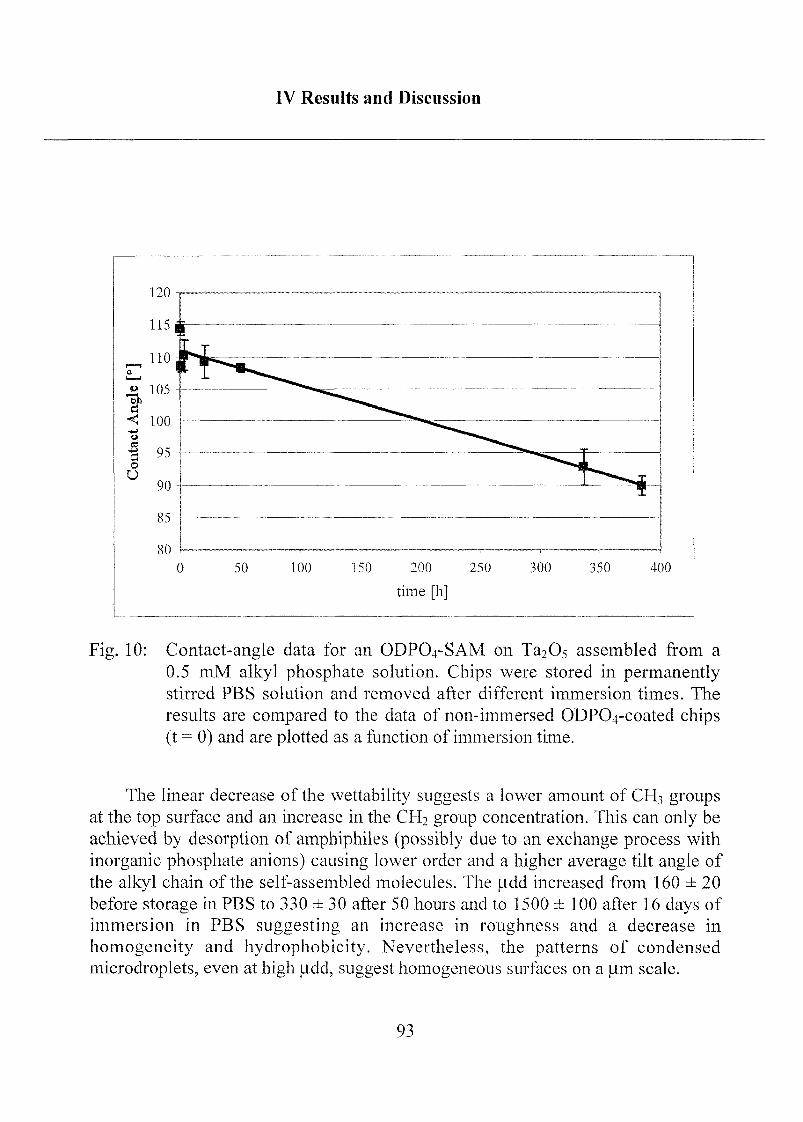
IV Results and Discussion
0 50 100 150 200 250 300 350 400
time [hj
Fig. 10: Contact-angle data for an ODPO4-SAM on Ta205 assembled from a
0.5 mM alkyl phosphate solution. Chips were stored in permanentlystirred PBS solution and removed after different immersion times. The
results are compared to the data of non-immersed ODPCVcoated chips(t = 0) and are plotted as a function of immersion time.
The linear decrease of the wettability suggests a lower amount of CH3 groups
at the top surface and an increase in the CH2 group concentration. This can only be
achieved by desorption of amphiphiles (possibly due to an exchange process with
inorganic phosphate anions) causing lower order and a higher average tilt angle of
the alkyl chain of the self-assembled molecules. The udd increased from 160 ± 20
before storage in PBS to 330 ± 30 after 50 hours and to 1500 ± 100 after 16 days of
immersion in PBS suggesting an increase in roughness and a decrease in
homogeneity and hydrophobicity. Nevertheless, the patterns of condensed
microdroplets, even at high uxld, suggest homogeneous surfaces on a \xm scale.
93
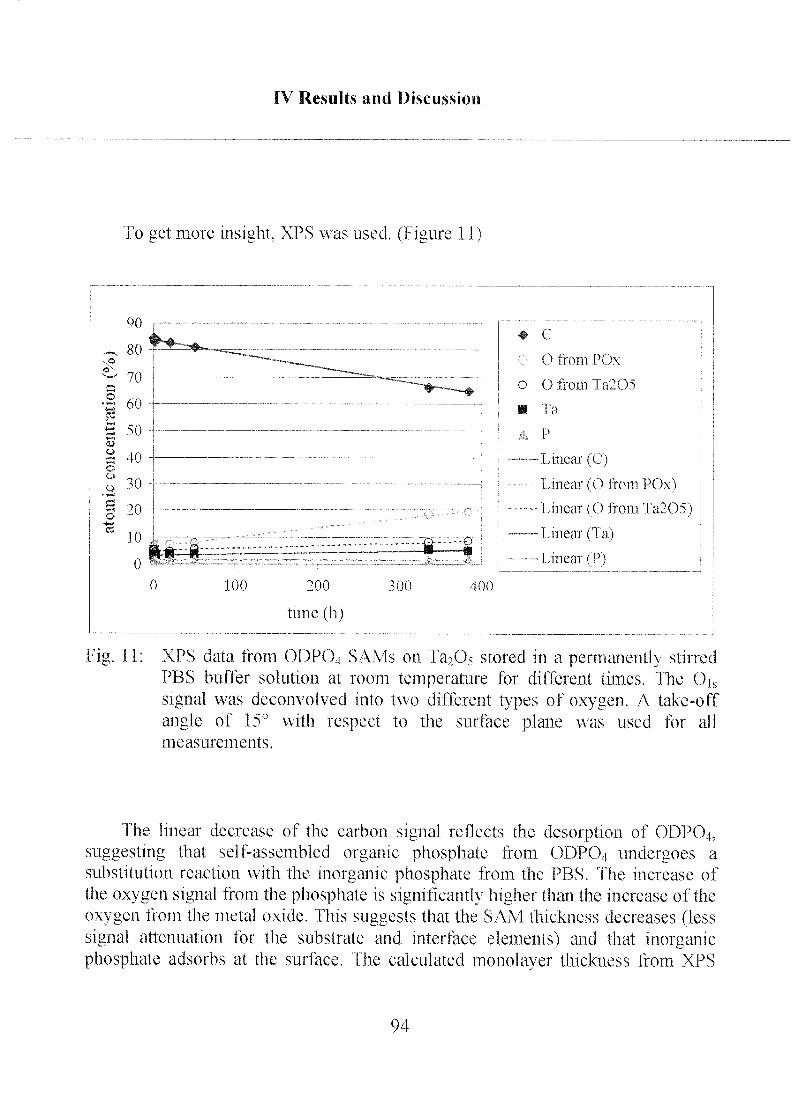
IV Results and Discussion
To get more insight. XPS was used, (Figure 11)
o
o
o
70
5 50
40
30
20
10
0(-11——Inr-
-o
100 200
time (h)
300 400
C
O from PCX
o O from Ta205
HI IB.
v
—— Linear (C)
Linear (() from PCX)
Linear (O from Fa205)
—Linear (Ta)
Linear (?)
Fig. 11: XPS data from ODP04 SAMs on Ta2Os stored in a permanently stirred
PBS buffer solution at room temperature for different times. The Ols
signal was deconvolved into two different types of oxygen. A take-off
angle of 15° with respect to the surface plane was used for all
measurements.
The linear decrease of the carbon signal reflects the desorption of ÜDPÜ4,
suggesting that self-assembled organic phosphate from ODP04 undergoes a
substitution reaction with the inorganic phosphate from the PBS. The increase of
the oxygen signal from the phosphate is significantly higher than the increase of the
oxygen from the metal oxide. This suggests that the SAM thickness decreases (lesssignal attenuation for the substrate and interface elements) and that inorganicphosphate adsorbs at the surface. Fhe calculated monolayer thickness from XPS
94
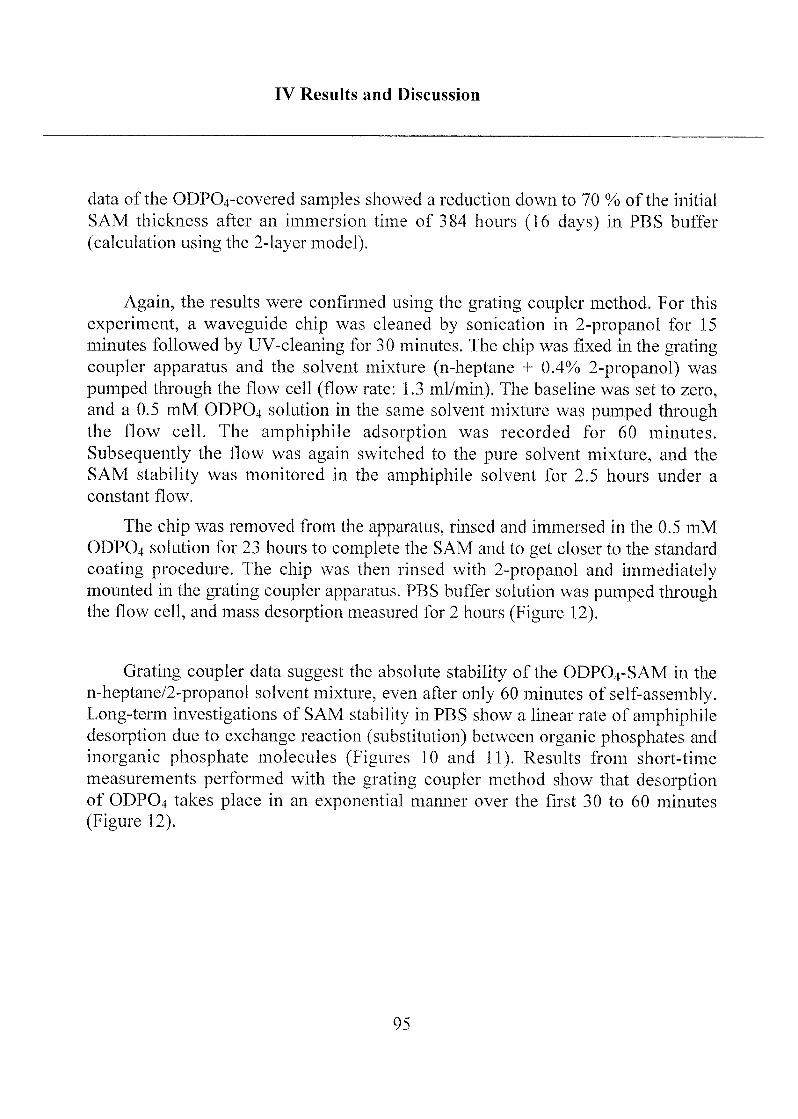
IV Results and Discussion
data of the ODP04-covered samples showed a reduction down to 70 % of the initial
SAM thickness after an immersion time of 384 hours (16 days) in PBS buffer
(calculation using the 2-layer model).
Again, the results were confirmed using the grating coupler method. For this
experiment, a waveguide chip was cleaned by sonication in 2-propanol for 15
minutes followed by UV-cleaning for 30 minutes. The chip was fixed in the gratingcoupler apparatus and the solvent mixture (n-heptane + 0.4% 2-propanol) was
pumped through the flow cell (flow rate: 1.3 ml/min). The baseline was set to zero,
and a 0.5 mM ODP04 solution in the same solvent mixture was pumped throughthe flow cell. The amphiphile adsorption was recorded for 60 minutes.
Subsequently the flow was again switched to the pure solvent mixture, and the
SAM stability was monitored in the amphiphile solvent for 2.5 hours under a
constant flow.
The chip was removed from the apparatus, rinsed and immersed in the 0.5 mM
ODPO4 solution for 23 hours to complete the SAM and to get closer to the standard
coating procedure. The chip was then rinsed with 2-propanol and immediatelymounted in the grating coupler apparatus. PBS buffer solution was pumped throughthe flow cell, and mass desorption measured for 2 hours (Figure 12).
Grating coupler data suggest the absolute stability of the ODPO4-SAM in the
n-heptane/2-propanol solvent mixture, even after only 60 minutes of self-assembly.Long-term investigations of SAM stability in PBS show a linear rate of amphiphiledesorption due to exchange reaction (substitution) between organic phosphates and
inorganic phosphate molecules (Figures 10 and 11). Results from short-time
measurements performed with the grating coupler method show that desorptionof ODPO4 takes place in an exponential manner over the first 30 to 60 minutes
(Figure 12).
95
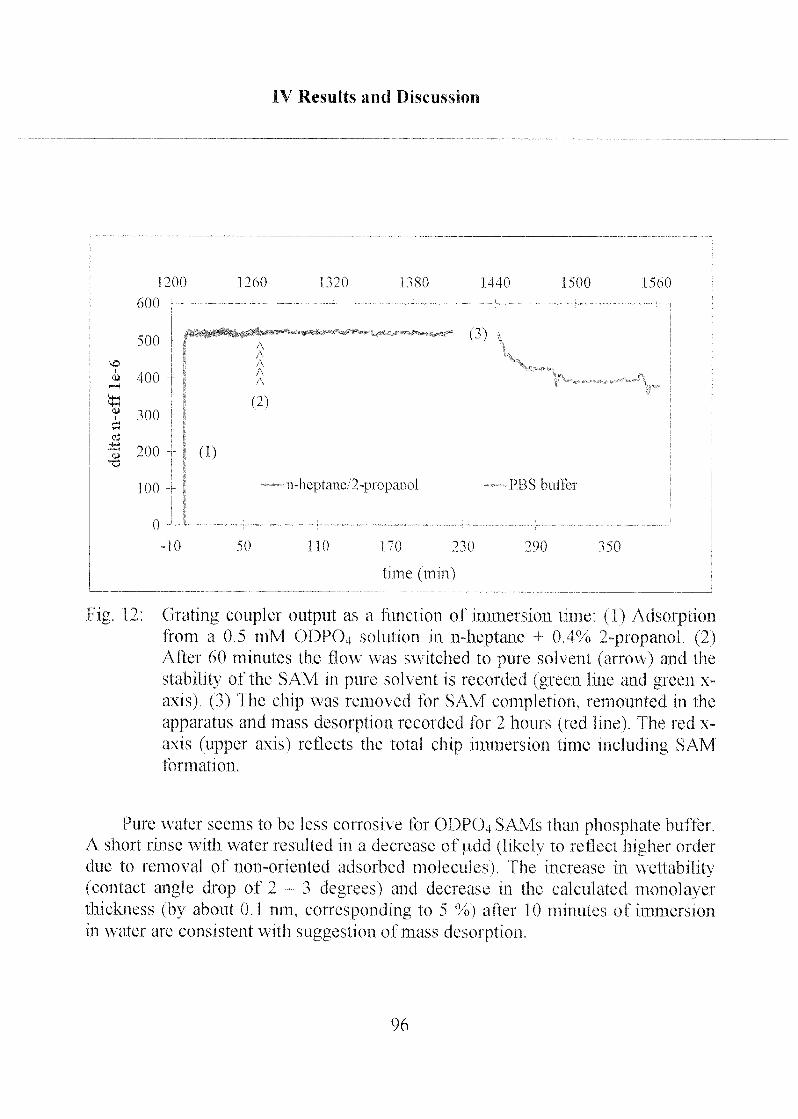
IV Results and Discussion
1200
600
500
i 400
t "00
3 200 J (I)
100'
1
0'
i 260 B20 1 ^80 1140 1500 : 560
*.* ^ \ % * (*> \ »^ 0)
\
(2)
n-lieptane/2-ptopanol
-10 50 170 ^0
time (mm)
PBS bulfei
290
Fig 12 Grating coupler output as a function of immersion time
from a 0 5 mM ODPO4. solution in n-heptane -+ 0 4%
After 60 minutes the flow was switched to pure solvent
stability of the SAM m pute solvent is recorded (green 1
axis) (3) fhe chip was removed for SAM completion, r
apparatus and mass desorption recorded for 2 houts (redaxis (upper axis) reflects the total chip immersion time
formation
350
(1) Adsotption2-propanol (2)(arrow) and the
me and green \-
emounted in the
line) fhe red x~
includmg SAM
Pure water seems to be less corrosnc for ODP04 SAMs than phosphate buffer
A short rmse with water resulted in a decrease of udd (likely to reflect higher order
due to removal of non-oriented adsorbed molecules) fhe increase 111 wettability(contact angle drop of 2 - 3 degrees) and decrease in the calculated monolayerthickness (by about 0 1 nm, corresponding to 5 %) alter 10 minutes of immersion
in water aie consistent w ith suggestion of mass desorption
96
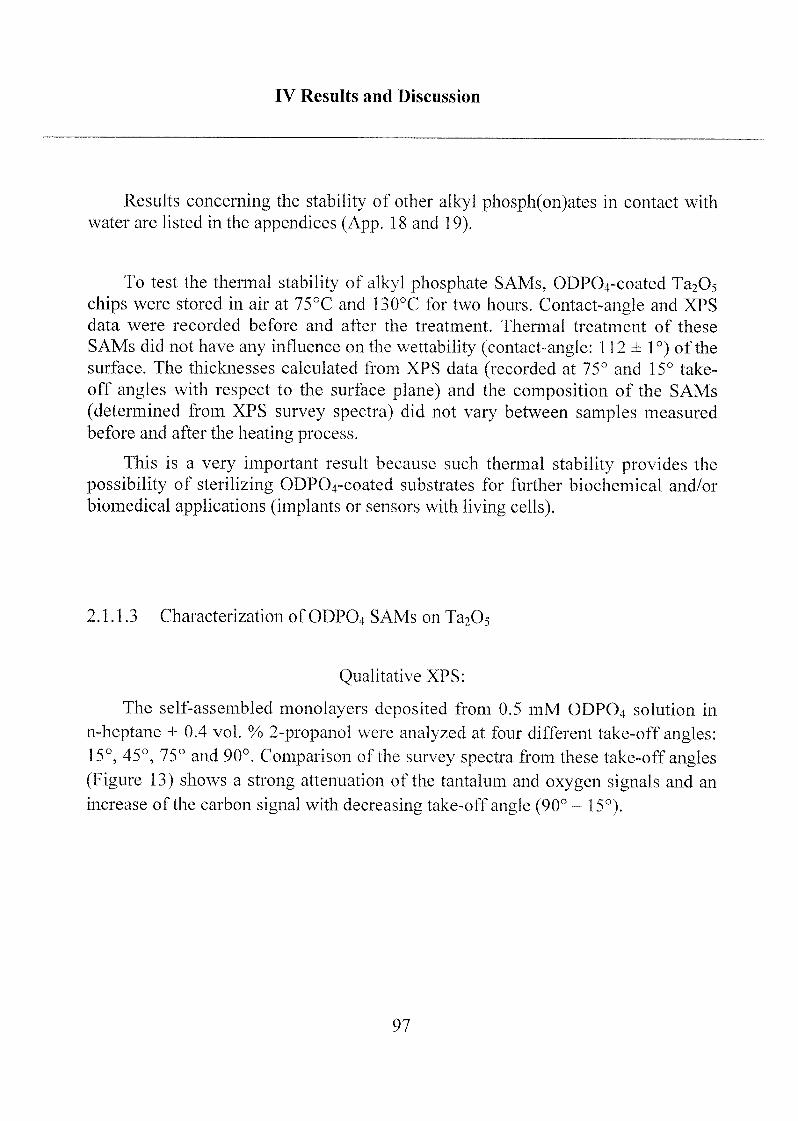
TV Results and Discussion
Results concerning the stability of other alkyl phosph(on)ates in contact with
water are listed in the appendices (App. 18 and 19).
To test the thermal stability of alkyl phosphate SAMs, ODPCVcoated Ta205
chips were stored in air at 75°C and 130°C for two hours. Contact-angle and XPS
data were recorded before and after the treatment. Thermal treatment of these
SAMs did not have any influence on the wettability (contact-angle: 112 ± 1°) of the
surface. The thicknesses calculated from XPS data (recorded at 75° and 15° take¬
off angles with respect to the surface plane) and the composition of the SAMs
(determined from XPS survey spectra) did not vary between samples measured
before and after the heating process.
This is a very important result because such thermal stability provides the
possibility of sterilizing ODPCVcoated substrates for further biochemical and/or
biomedical applications (implants or sensors with living cells).
2.1.1.3 Characterization of ODP04 SAMs on Ta205
Qualitative XPS:
The self-assembled monolayers deposited from 0.5 mM ODPO4 solution in
n-heptane + 0.4 vol. % 2-propanol were analyzed at four different take-off angles:15°, 45°, 75° and 90°. Comparison of the survey spectra from these take-off angles(Figure 13) shows a strong attenuation of the tantalum and oxygen signals and an
increase of the carbon signal with decreasing take-off angle (90° - 15°).
97
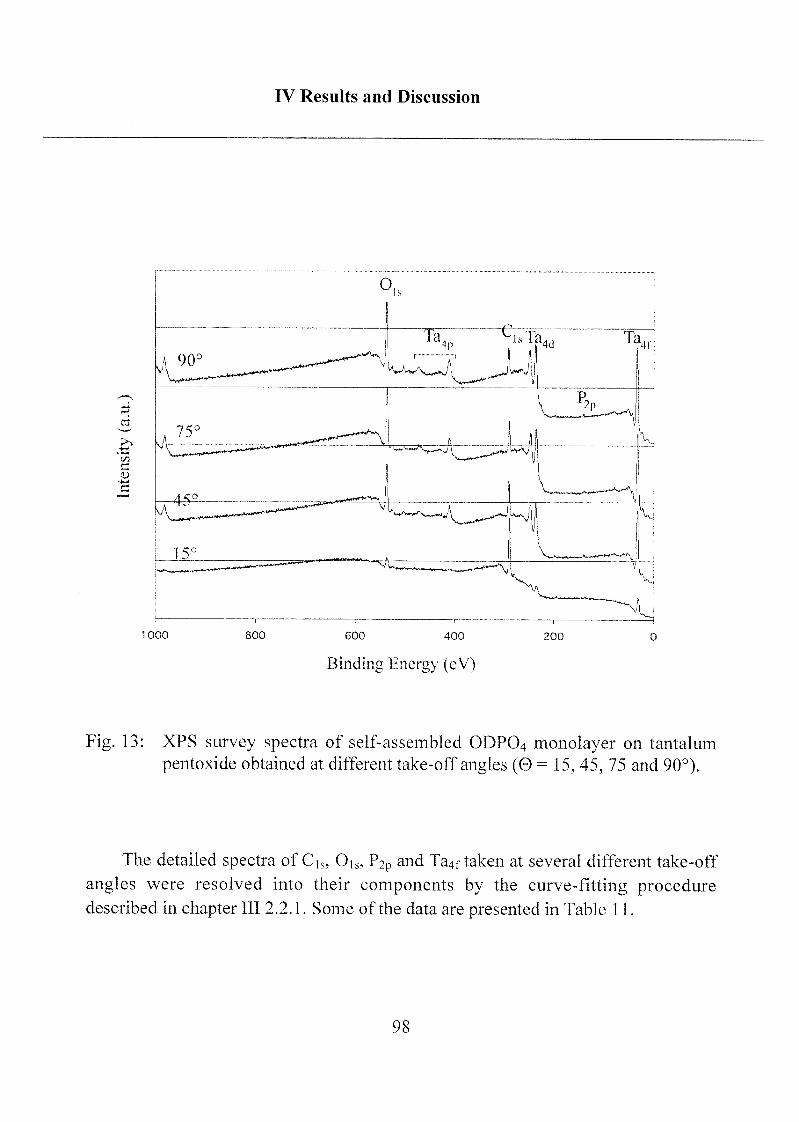
IV Results and Discussion
3
C
1000 800 600 400
Binding Energy (eV)
200
Fig. 13: XPS survey spectra of self-assembled ODP04 monolayer on tantalum
pentoxide obtained at different take-off angles (0=15, 45, 75 and 90°).
The detailed spectra of C|S, Ojs, ?2P and Ta4f taken at several different take-off
angles were resolved into their components by the curve-fitting proceduredescribed in chapter III 2.2.1. Some of the data are presented in Table 11.
98
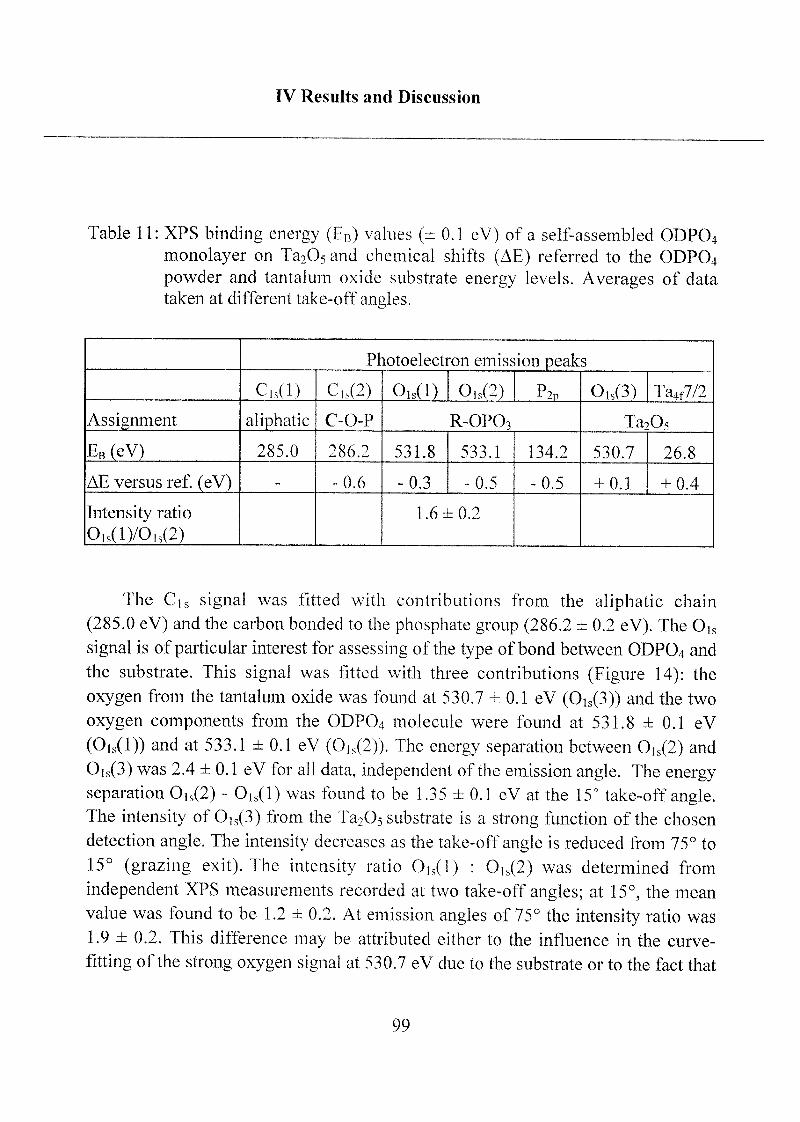
IV Results and Discussion
Table 11: XPS binding energy (EB) values (± 0.1 eV) of a self-assembled ODP04
monolayer on Ta20j and chemical shifts (ÀE) referred to the ODPO4
powder and tantalum oxide substrate energy levels. Averages of data
taken at different take-off angles.
Photoelectron emission peaks
Cls(l) C.s(2) 0ls(l) 0|S(2) P2P 0)s(3) Ta4f7/2
Assignment aliphatic C-O-P R-OPO3 Ta205
EB (eV) 285.0 286.2 531.8 533.1 134.2 530.7 26.8
AE versus ref. (eV) _ -0.6 -0.3 -0.5 -0.5 + 0.1 + 0.4
Intensity ratio
0ls(l)/0ls(2)
1.6 ±0.2
The C]S signal was fitted with contributions from the aliphatic chain
(285.0 eV) and the carbon bonded to the phosphate group (286.2 ± 0.2 eV). The 0]s
signal is of particular interest for assessing of the type of bond between ODPO4 and
the substrate. This signal was fitted with three contributions (Figure 14): the
oxygen from the tantalum oxide was found at 530.7 ±0.1 eV (Ois(3)) and the two
oxygen components from the ODPO4 molecule were found at 531.8 ± 0.1 eV
(Ois(l)) and at 533.1 ±0.1 eV (0]s(2)). The energy separation between 0ls(2) and
01s(3) was 2.4 ±0.1 eV for all data, independent of the emission angle. The energy
separation Ois(2) - Ois(l) was found to be 1.35 ±0.1 eV at the 15° take-off angle.The intensity of 0]s(3) from the Ta205 substrate is a strong function of the chosen
detection angle. The intensity decreases as the take-off angle is reduced from 75° to
15° (grazing exit). The intensity ratio Oi,(l) : 0]s(2) was determined from
independent XPS measurements recorded at two take-off angles; at 15°, the mean
value was found to be 1.2 ± 0.2. At emission angles of 75° the intensity ratio was
1.9 ± 0.2. This difference may be attributed either to the influence in the curve-
fitting of the strong oxygen signal at 530.7 eV due to the substrate or to the fact that
99

IV Results and Discussion
at this angle the contribution of the oxygen which faces the tantalum pentoxide is
higher. Therefore, it has been decided to take the average over all 22
measurements, equal to 1.6 ± 0.2.
—, , , , , , , , 1 , 1 , , , , 1 1—-, , , , , , , , , , , , , , ,_
535 534 531 532 531 530 529 528 ->T> 514 533 532 511 530 529 528
Binding Energy (eV) Binding Energy (eV)
Fig. 14: Curve fitting of the XPS 0,s signal of an ODP04 SAM on Ta205 at 15°
and 75° detection (take-off) angle.
The P2p signal showed a comparatively poor signal-to-noise ratio and was
fitted with a single 2p doublet. The binding energy of the P2p3/2 component was
134.2 ± 0.1 eV, independent of take-off angle. The binding energy of the Ta4f was
found to be 26.8 ±0.1 eV.
The binding energy data in Table 11 show a shift of + 0.4 eV for Ta4i- and
ca. - 0.5 eV in Cis(2), 0!s(l), Ois(2) and P2p, relative to the Ta205 substrate and the
free acid (ODPO4 powder; results see chapter III 1.2.1), respectively. The shift to
lower binding energies of the ODP04-related signals is likely due to a (full or
partial) deprotonation of the phosphoric acid head group upon coordination to the
surface and the corresponding formation of a negative charge on the phosphatehead group. The positive shift of the Ta205 substrate suggests a charge transfer
from the substrate to the ODPO4.
100
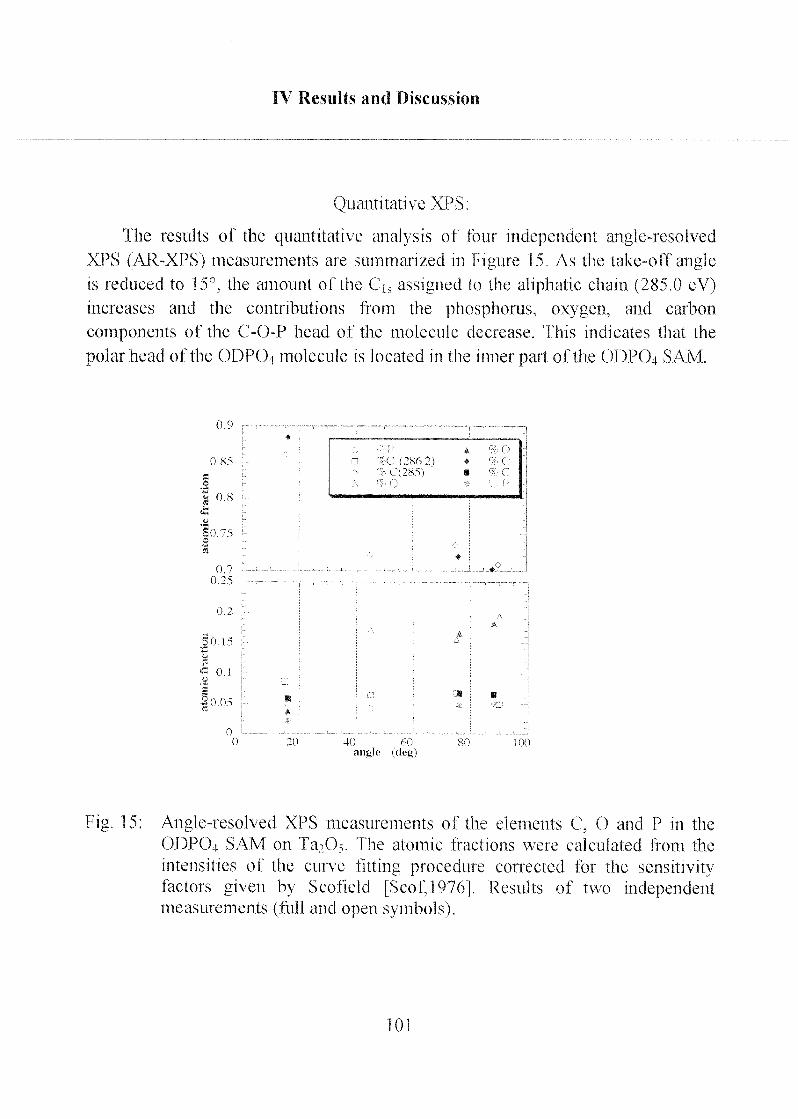
IV Results and Discussion
Quantitative XPS:
The results of the quantitative analysis of four independent angle-resolvedXPS (AR-XPS) measurements are summari/ed in Figure 15. As the take-off angleis reduced to 15°, the amount of the t\ assigned to the aliphatic chain (285.0 eV)
increases and the contributions from the phosphorus, oxygen, and carbon
components of the C-O-P head of the molecule decrease. This indicates that the
polar head of the ODPO4 molecule is located m the inner part of the ODP04 SAM.
0 9
08S
a0
1 0 8
0 7
0 2^
A '< I)
1 ',1 (286 2) '1 c
( )
cc (
0 2
oO IS
0 1
.2 0 (Hss
20 40 f>0
angle (dec)80 100
Fig. 15: Angle-resolved XPS measurements of the elements C, 0 and P in the
ODPO4 SAM on Ta:(X The atomic fractions were calculated from the
intensities of the curve fitting procedure corrected for the sensitivityfactors given by Scofield |Seof,1976J. Results of two independentmeasurements (full and open symbols).
101
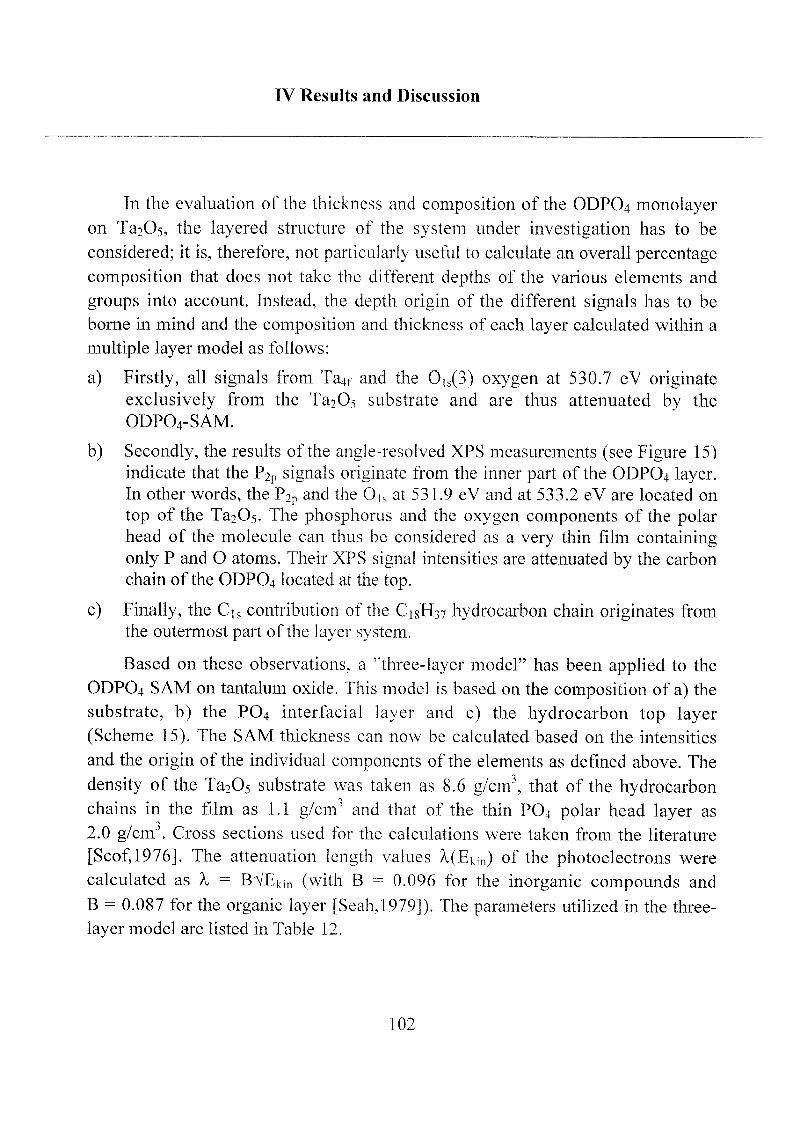
TV Results and Discussion
Tn the evaluation of the thickness and composition of the ODPO4 monolayeron Ta205-, the layered structure of the system under investigation has to be
considered; it is, therefore, not particularly useful to calculate an overall percentage
composition that does not take the different depths of the various elements and
groups into account. Instead, the depth origin of the different signals has to be
borne in mind and the composition and thickness of each layer calculated within a
multiple layer model as follows:
a) Firstly, all signals from Ta4f and the 0(s(3) oxygen at 530.7 eV originateexclusively from the Ta205 substrate and are thus attenuated by the
ODPO4-SAM.
b) Secondly, the results of the angle-resolved XPS measurements (see Figure 15)indicate that the P2p signals originate from the inner part of the ODPO4 layer.In other words, the P2P and the 0|, at 531.9 eV and at 533.2 eV are located on
top of the Ta205. The phosphorus and the oxygen components of the polarhead of the molecule can thus be considered as a very thin film containingonly P and O atoms. Their XPS signal intensities are attenuated by the carbon
chain of the ODP04 located at the top.
c) Finally, the C\s contribution of the C18H37 hydrocarbon chain originates from
the outermost part of the layer system.
Based on these observations, a "three-layer model" has been applied to the
ODPO4 SAM on tantalum oxide. This model is based on the composition of a) the
substrate, b) the PO4 interfacial layer and c) the hydrocarbon top layer
(Scheme 15). The SAM thickness can now be calculated based on the intensities
and the origin of the individual components of the elements as defined above. The
density of the Ta205 substrate was taken as 8.6 g/cm3, that of the hydrocarbonchains in the film as 1.1 g/cm"1 and that of the thin P04 polar head layer as
2.0 g/cm". Cross sections used for the calculations were taken from the literature
[Scof,l976]. The attenuation length values X(Ekin) of the photoelectrons were
calculated as X = BVEkin (with B = 0.096 for the inorganic compounds and
B = 0.087 for the organic layer [Seah,l979]). The parameters utilized in the three-
layer model are listed in Table 12.
102
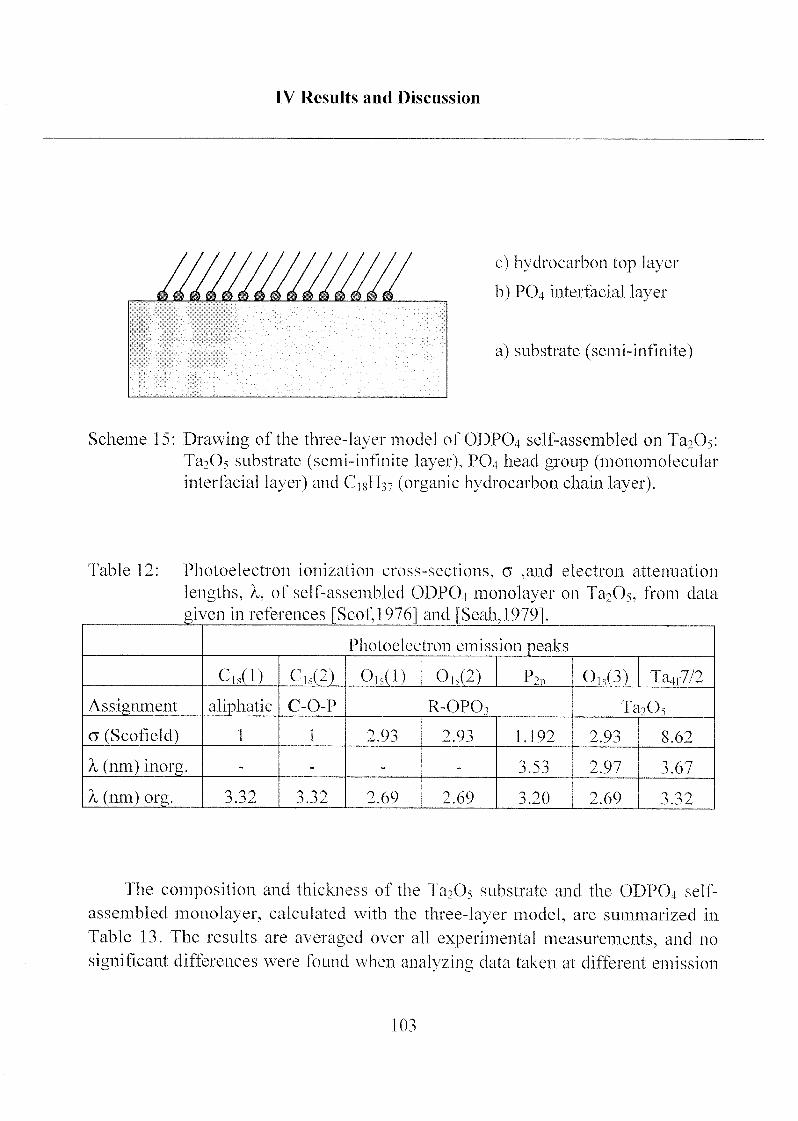
IV Results and Discussion
a) substrate (semi-infinite)
Scheme 15: Drawing of the three-layer model of ODPO4 self-assembled on Ta2C>5:
Ta2Oi substrate (semi-infinite layer), PO4 head group (monomolecularinterfacial layer) and CigH^ (organic hydrocarbon chain layer).
Table 12: Photoelectron ionization cross-sections, 0 ,and electron attenuation
lengths, X, of self-assembled ODPOj monolayer on Ta2C>5, from data
given in references [Scof,1976] and [Seah, 1979].
Photoelectron emission peaks
C,s(D C,,(2) 0,s(D 0,s(2) P2„ 0ls(3) Talf7/2
Assignment aliphatic C-O-P R-OPCh Ta205
a (Scofield) 1 1 2.93 2.93 1.192 2.93 8.62
X (nm) inorg. - _ _ _ 3.53 2.97 3.67
X (nm) org. 3.32 3.32 2.69 2.69 3.20 2.69 3.32
The composition and thickness of the Ta205 substrate and the ODP04 self-
assembled monolayer, calculated with the three-layer model, are summarized in
Table 13. The results are averaged over all experimental measurements, and no
significant differences were found when analyzing data taken at different emission
103
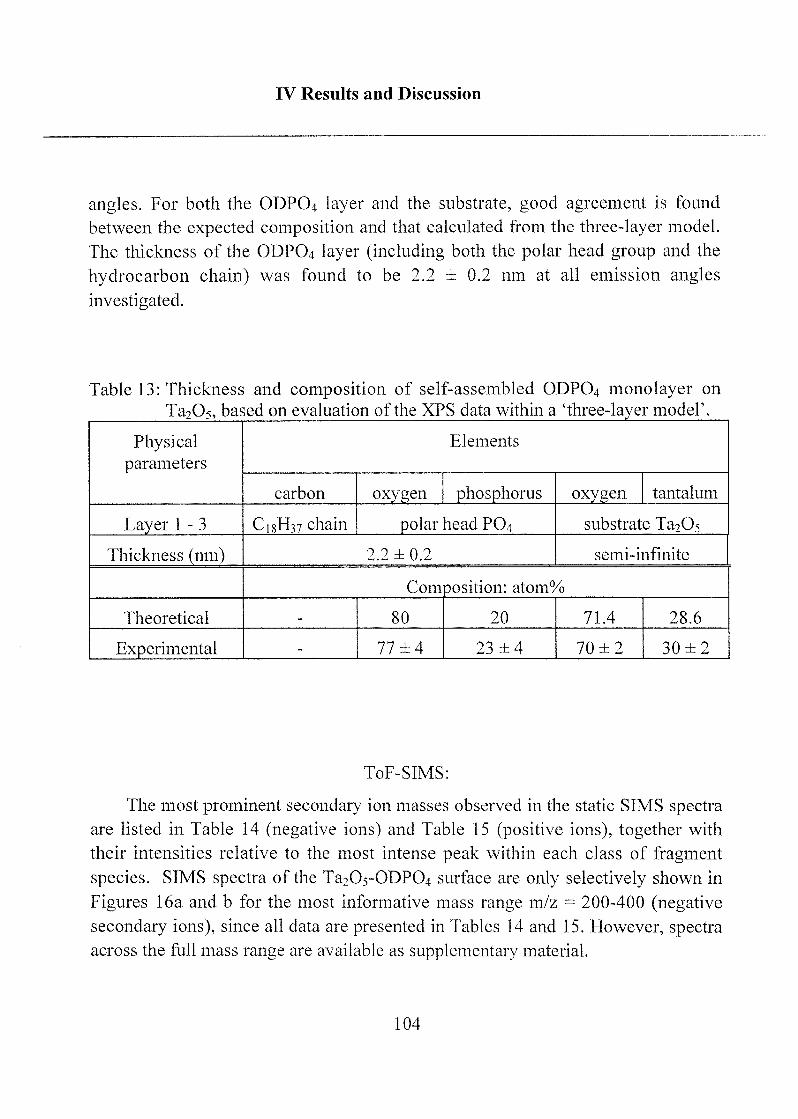
IV Results and Discussion
angles. For both the ODPO4 layer and the substrate, good agreement is found
between the expected composition and that calculated from the three-layer model.
The thickness of the ODP04 layer (including both the polar head group and the
hydrocarbon chain) was found to be 2.2 ± 0.2 nm at all emission angles
investigated.
Table 13: Thickness and composition of self-assembled ODPO4 monolayer on
Ta2Q5, based on evaluation of the XPS data within a 'three-layer model'.
Physicalparameters
Elements
carbon oxygen phosphorus oxygen tantalum
Layer 1-3 C18H37 chain polar head P04 substrate Ta20s
Thickness (nm) 2.2 ±0.2 semi-infinite
Composition: atom%
Theoretical _ 80 20 71.4 28.6
Experimental - 77 ±4 23 ±4 70 ±2 30 ±2
ToF-SIMS:
The most prominent secondary ion masses observed in the static SIMS spectra
are listed in Table 14 (negative ions) and Table 15 (positive ions), together with
their intensities relative to the most intense peak within each class of fragment
species. SIMS spectra of the Ta205-ODP04 surface are only selectively shown in
Figures 16a and b for the most informative mass range m/z = 200-400 (negative
secondary ions), since all data are presented in Tables 14 and 15. However, spectra
across the full mass range are available as supplementary material.
104
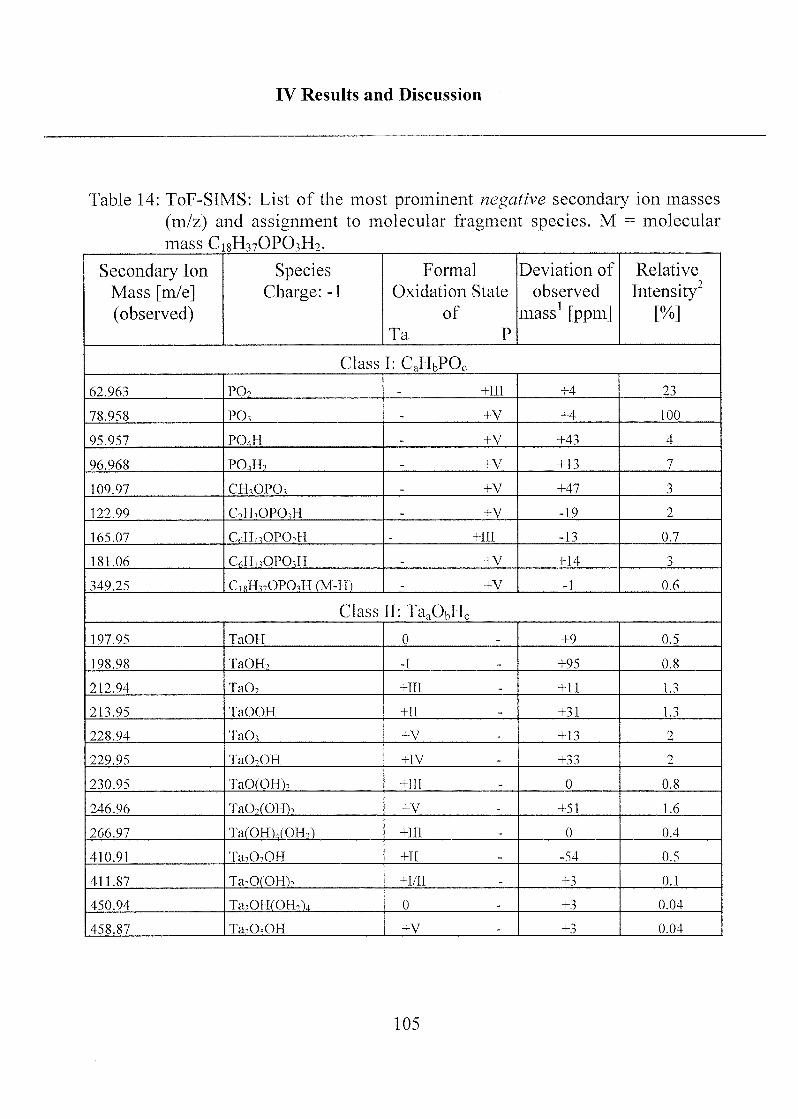
IV Results and Discussion
Table 14: ToF-SIMS: List of the most prominent negative secondary ion masses
(m/z) and assignment to molecular fragment species. M = molecular
mass C18H37OPO3H2.
Secondary Ion
Mass [m/e]
(observed)
SpeciesCharge: -1
Formal
Oxidation State
of
Ta P
Deviation of
observed
mass1 [ppm]
Relative
Intensity2[%]
Class I: CaHbPOc
62.963 PO> +nt +4 23
78.958 PO< +v +4 100
95.957 PO4H +v +43 4
96.968 PO4H. +v +13 7
109.97 CtUOPCh +v +47 3
122.99 CiHiOPCMI +v -19 2
165.07 CfiHnOPO,H +III -13 0.7
181.06 CfiHnOPO,H +v +14 3
349.25 CmH,7OPO,H (M-H) +v -1 0.6
Class 11: TaaObHc
197.95 TaOH 0 +9 0.5
198.98 TaOH, -I +95 0.8
212.94 TaO, +111 +11 1.3
213.95 TaOOH +11 +31 1.3
228.94 TaCh +v + 13 2
229.95 TaCbOH +IV +33 2
230.95 TaO(OH), +111 0 0.8
246.96 TaCbCOl-Tb +v +51 1.6
266.97 TafOHVOH-.") +111 0 0.4
410.91 Ta.OOH +ir -54 0.5
411.87 Ta^O(OH), +1/11 +3 0.1
450.94 Ta,OH<OFMi 0 +3 0.04
458.87 Ta.OsOH +v +3 0.04
105
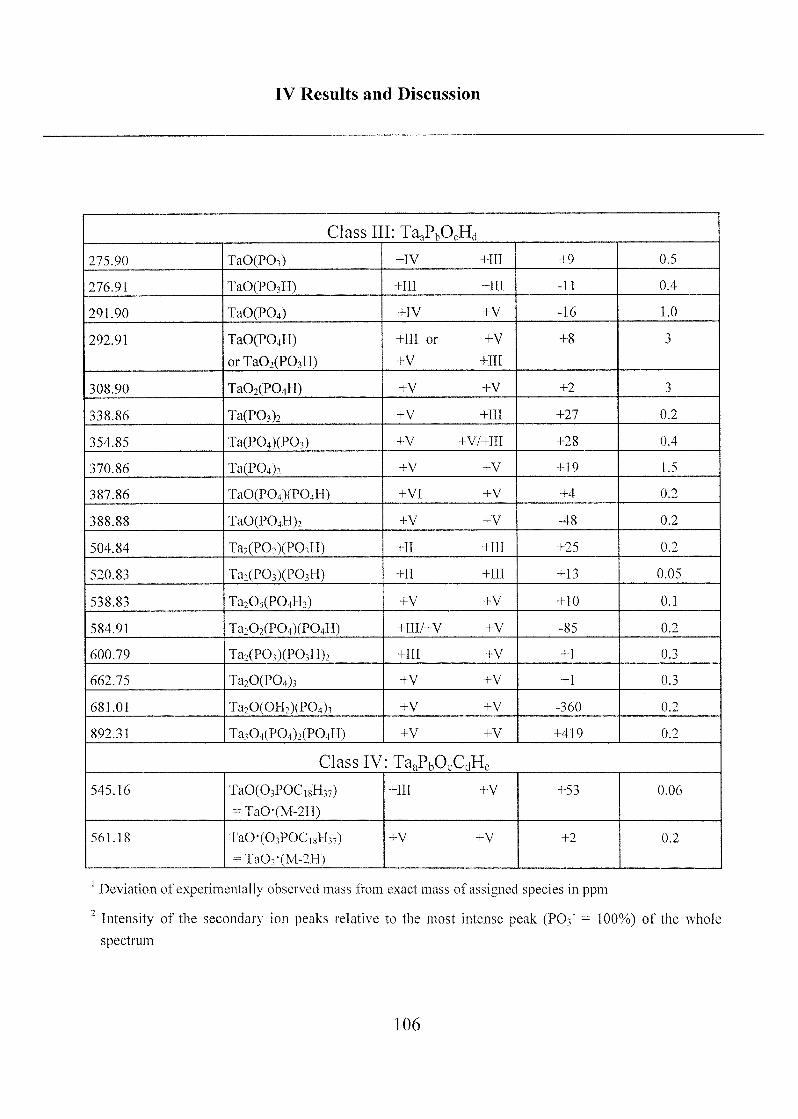
IV Results and Discussion
Class III: TaaPbOcHd
275.90 TaO(PO,) +1V +1IÏ +9 0.5
276.91 TaO(PO,H) +111 +ÏII -11 0.4
291.90 TaO(P04) +IV +V -16 1.0
292.91 TaO(P04H)
or Ta02(P03H)
+111 or +V
+V +IT1
+8 3
308.90 Ta02(P04H) +v +v +2 3
338.86 Ta(P03)2 +V +111 +27 0.2
354.85 Ta(P04)(PO,) +V +V/+1II +28 0.4
370.86 Ta(P04)2 +v +v +19 1.5
387.86 TaO(P04)(P04H) +VI +v +4 0.2
388.88 TaO(P04H)2 +v +v -48 0.2
504.84 Ta2(PQ2)(PChH) +11 +111 +25 0.2
520.83 Ta2(PO,)(PO,H) +11 +III +13 0.05
538.83 Ta20,(P04H2) +v +v +10 0.1
584.91 Ta202(P04)(PO,H) +1II/+V +v -85 0.2
600.79 Ta2(PO,)(PO,H)2 +III +v +1 0.3
662.75 Ta20(P04> +v +v +1 0.3
681.01 Ta20(OH2)(P04)3 +v +v -360 0.2
892.31 Ta304(P04)2(P04H) +v +v +419 0.2
Class IV: TaaPbOcCdHc
545.16 TaO(0,POC,8H,7)
= TaO-(M-2H)
+III +v +53 0.06
561.18 TaO*(OiPOCi8H^)
= Ta02'(M-2H)
+v +v +2 0.2
Deviation of experimentally observed mass from exact mass of assigned species in ppm
2
Intensity of the secondary ion peaks relative to the most intense peak (P03" = 100%) of the whole
spectrum
106

IV Results and Discussion
Table 15: ToF-SIMS: List of the most prominent positive secondary ion masses
(m/e) and assignment to molecular fragment species. M = molecular
mass C8H37OPO3H2.
Secondary Ion
Mass [m/e]
(observed)
Species
Charge: +1
Formal Oxidation
State of
Ta P
Deviation of
observed mass1
[ppm]
Relative
Intensity""
[%]
Class I: CaHbPOc
98.984 H4PO4 +v +6 100
120.97 CtTOPO, +v +6 8
125.00 C,H,OPO,H, +v 0 13
207.08 CsH„OPChH, +v +20 10
214.12 CnH,qOPO +1 +30 10
219.08 CoIinOPChPh +v +15 5
220.11 CmHixOPOoH, +IÏI +53 9
223.12 CgHi7OPO,H, +v +37 5
237.14 Ch>HiqOPO,H, +v -76 5
249.16 C„H^OPO,H, +111 +2 7
263.18 CnH7sOP07H, +TI1 -5 5
275.18 C,4H„OP07IT, +111 -3 3
277.20 CuH77OPO,H, +III -35 4
349.25 CirH^OPO^H^M-H) +v -3 0.3
351.27 CsH^OPO^rM+H) +v -2 0.2
Class II: TaaObHc
180.92 Ta +1 +182 26
181.93 TaH 0 +162 30
196.94 TaO +III 0 30
197.96 TaOH +11 +25 24
212.95 TaO. +v +43 5
230.94 TaO(OH), +v -20 6
231.95 TafOH), +IV -17 0.4
232.95 Ta(OH)?fOKR +111 -44 7
107
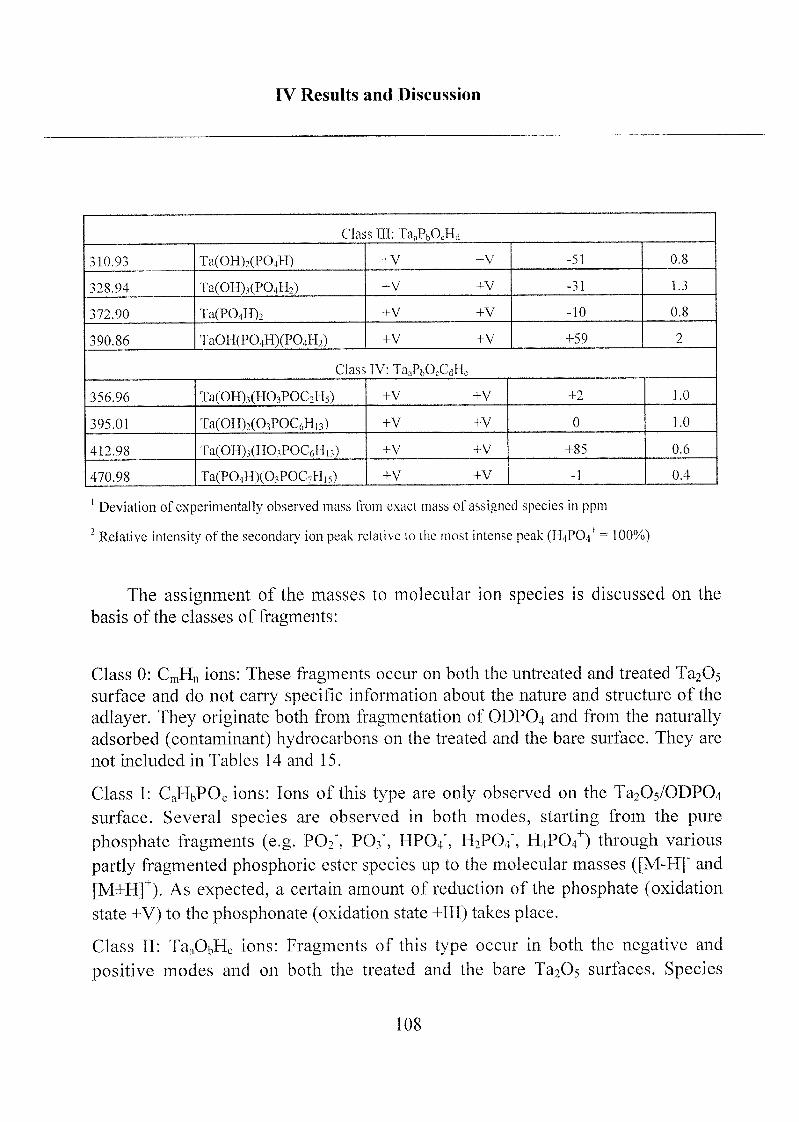
IV Results and Discussion
Class III: TaaPbOcHd
310.93 Ta(OH)2(P04ll) +V +V -51 0.8
328.94 Ta(OH),(P04H2) +v +v -31 1.3
372.90 Ta(P04H)2 +v +v -10 0.8
390.86 TaOH(P04H)(P04H2) +V IV +59 2
Class IV: TaAOcCdHc
356.96 Ta(OH),(HO,POC2H5) 4-V +V +2 1.0
395.01 Ta(OH)2(03POC6Hn) +V +v 0 1.0
412.98 Ta(OH),(HO,POC6Hn) +v +v +85 0.6
470.98 Ta(P04H)(CHPOC7Hi,) +v +v -1 0.4
1Deviation of experimentally observed mass from exact mass of assigned species in ppm
2Relative intensity of the secondary ion peak relative to the most intense peak (H4P(V - 100%)
The assignment of the masses to molecular ion species is discussed on the
basis of the classes of fragments:
Class 0: CmHn ions: These fragments occur on both the untreated and treated Ta2Os
surface and do not carry specific information about the nature and structure of the
adlayer. They originate both from fragmentation of ODPO4 and from the naturallyadsorbed (contaminant) hydrocarbons on the treated and the bare surface. They are
not included in Tables 14 and 15.
Class I: CaHbPOc ions: Ions of this type are only observed on the Ta2Os/ODP04
surface. Several species are observed in both modes, starting from the pure
phosphate fragments (e.g. P02\ PO3", HP04", H2P04", H4P04+) through various
partly fragmented phosphoric ester species up to the molecular masses ([M-H]~ and
[M±H]+). As expected, a certain amount of reduction of the phosphate (oxidation
state +V) to the phosphonate (oxidation state +III) takes place.
Class II: TaaObHc ions: Fragments of this type occur in both the negative and
positive modes and on both the treated and the bare Ta2Os surfaces. Species
108
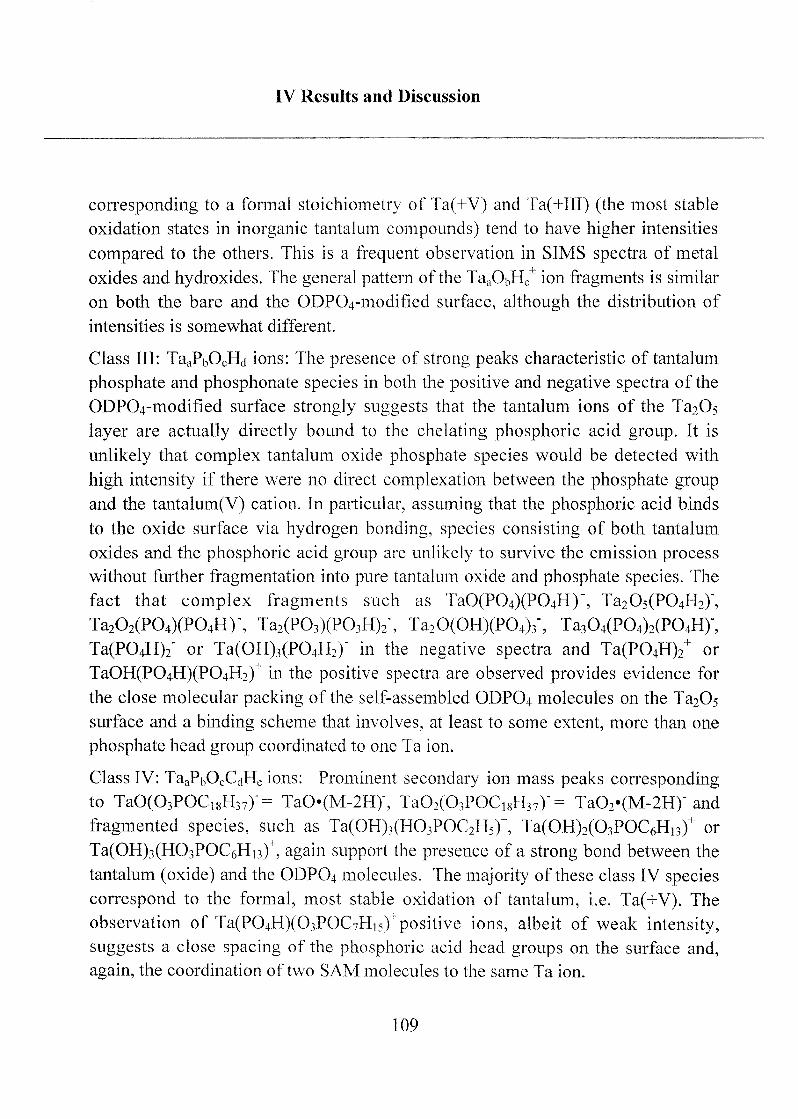
IV Results and Discussion
corresponding to a formal stoichiometry of Ta(+V) and Ta(+HI) (the most stable
oxidation states in inorganic tantalum compounds) tend to have higher intensities
compared to the others. This is a frequent observation in SIMS spectra of metal
oxides and hydroxides. The general pattern of the TaaObHc ion fragments is similar
on both the bare and the ODP04-modified surface, although the distribution of
intensities is somewhat different.
Class III: TaaPbOcHd ions: The presence of strong peaks characteristic of tantalum
phosphate and phosphonate species in both the positive and negative spectra of the
ODP04-modified surface strongly suggests that the tantalum ions of the Ta20s
layer are actually directly bound to the chelating phosphoric acid group. It is
unlikely that complex tantalum oxide phosphate species would be detected with
high intensity if there were no direct complexation between the phosphate group
and the tantalum(V) cation. In particular, assuming that the phosphoric acid binds
to the oxide surface via hydrogen bonding, species consisting of both tantalum
oxides and the phosphoric acid group are unlikely to survive the emission process
without further fragmentation into pure tantalum oxide and phosphate species. The
fact that complex fragments such as TaQ(P04)(P04H)~, Ta205(P04H2)",
Ta202(P04)(P04H)-, Ta2(P03)(P03H)2", Ta20(OH)(P04)3\ Ta304(P04)2(P04H)",
Ta(P04H)2" or Ta(OH)3(P04H2)~ in the negative spectra and Ta(P04H)2+ or
TaOH(P04H)(P04H2)+ in the positive spectra are observed provides evidence for
the close molecular packing of the self-assembled ODP04 molecules on the Ta2C>5
surface and a binding scheme that involves, at least to some extent, more than one
phosphate head group coordinated to one Ta ion.
Class IV: TaaPbOcCdHe ions: Prominent secondary ion mass peaks correspondingto TaO(03POC18H37y= TaO(M-2H)\ Ta02(03POC18H37y = Ta02«(M-2H)-and
fragmented species, such as Ta(OH)3(H03POC2H5)+, Ta(OH)2(03POC6H13)+ or
Ta(OH)3(H03POC6Hi3)+, again support the presence of a strong bond between the
tantalum (oxide) and the ODP04 molecules. The majorityoftheseclassIVspeciescorrespondtotheformal,moststableoxidationoftantalum,i.e.Ta(+V).TheobservationofTa(P04H)(03POC7Hi5)^positiveions,albeitofweakintensity,suggestsaclosespacingofthephosphoricacidheadgroupsonthesurfaceand,again,thecoordinationoftwoSAMmoleculestothesameTaion.109
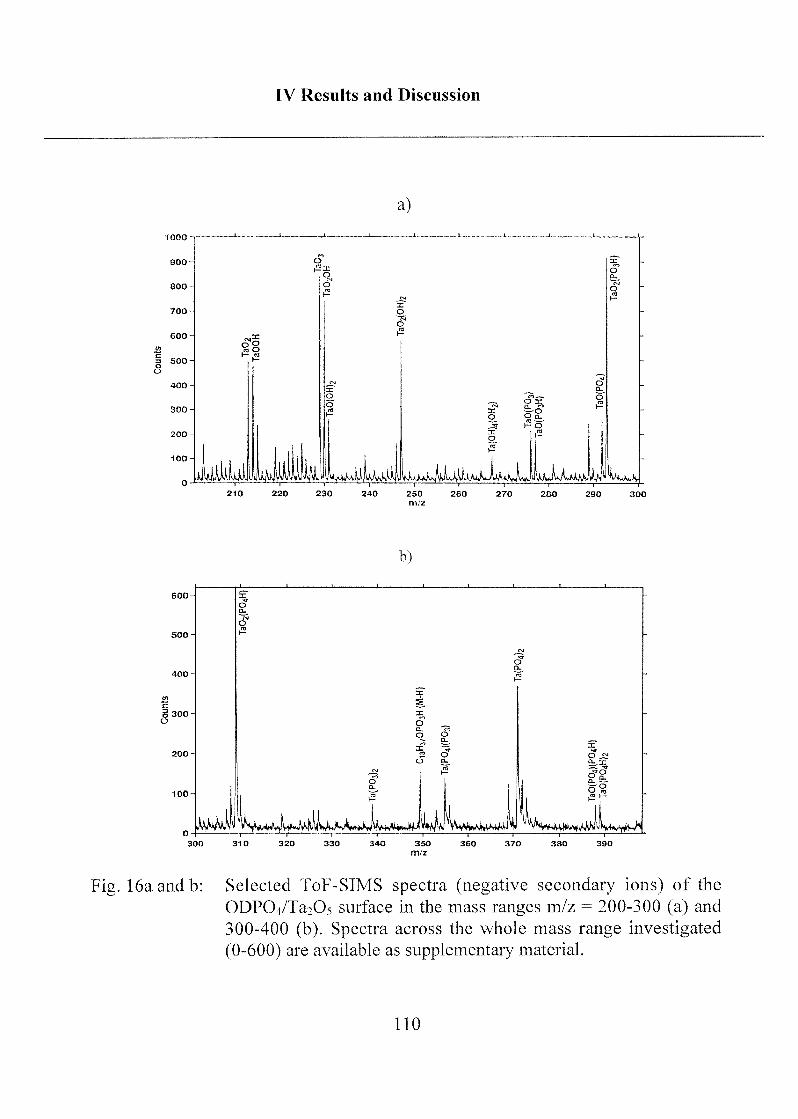
IV Results and Discussion
a)
900-« .—
O x -
ooCL.
800- oo
700- o
O
-
600-
m
g 500-
°1h
O
400- oa.
-
300-
o
ox ~-o
a ss=..J2J r O
-
200- »
100-
léki.Williy %^mM^,\
,3
230 250
m/z
290
b)
100-
-
o
O
-
H*
-
EN
c?a.
x"
^
XCI
o^
o 9*~ ^x1 "5? oo a.
O jSîcl x:
MW>w \w*^W^
"75Oa.
*W*<
1-,—. -*»
tJ Cla» Ä
—,—,
_—,:
î**
350
m/z
360
Fig. 16a and b: Selected ToF-SIMS spectra (negative secondary ions) of the
ODPCVTa^Os surface in the mass ranges m/z = 200-300 (a) and
300-400 (b). Spectra across the whole mass range investigated
(0-600) are available as supplementary material.
110
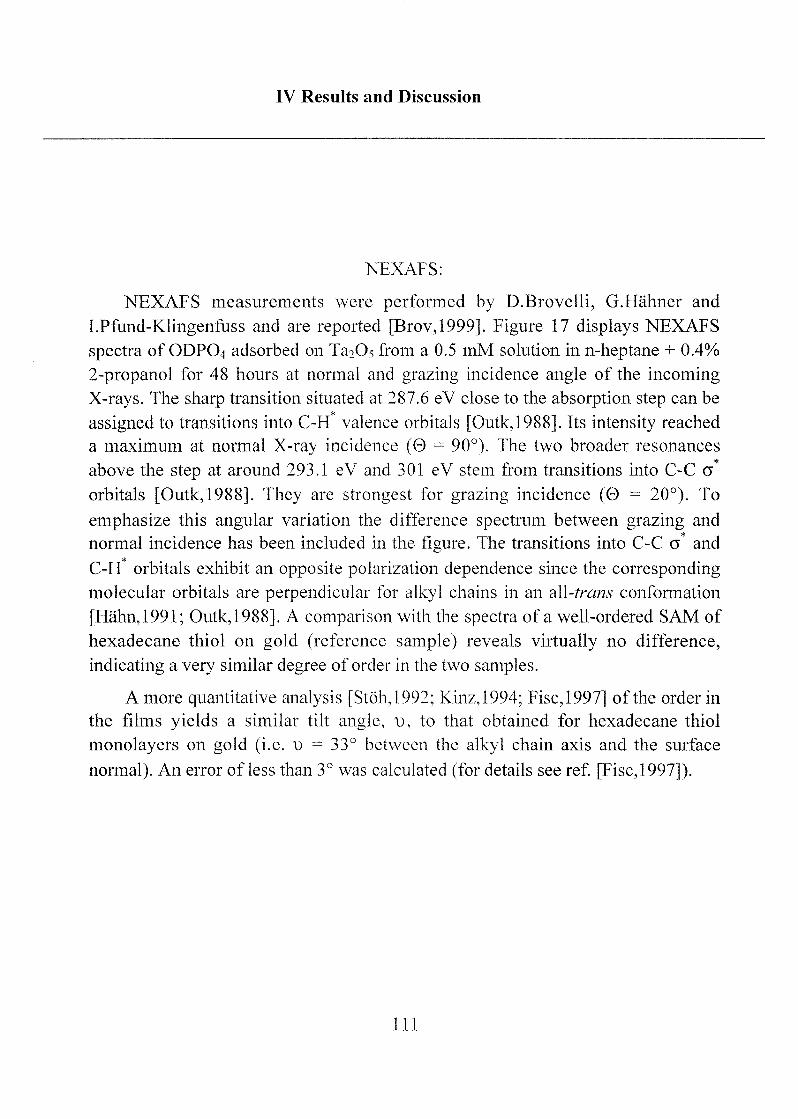
IV Results and Discussion
NEXAFS:
NEXAFS measurements were performed by D.Brovelli, G.Hähner and
I.Pfund-Klingenfuss and are reported [Brov,1999]. Figure 17 displays NEXAFS
spectra of ODPO4 adsorbed on Ta205 from a 0.5 mM solution in n-heptane + 0.4%
2-propanol for 48 hours at normal and grazing incidence angle of the incoming
X-rays. The sharp transition situated at 287.6 eV close to the absorption step can be
assigned to transitions into C-H* valence orbitals [Outk.,1988]. Its intensity reached
a maximum at normal X-ray incidence (0 = 90°). The two broader resonances
above the step at around 293.1 eV and 301 eV stem from transitions into C-C G
orbitals [Outk,1988]. They are strongest for grazing incidence (0 = 20°). To
emphasize this angular variation the difference spectrum between grazing and
normal incidence has been included in the figure. The transitions into C-C a and
C-H orbitals exhibit an opposite polarization dependence since the corresponding
molecular orbitals are perpendicular for alkyl chains in an all-trans conformation
[Hahn, 1991; Outk,1988]. A comparison with the spectra of a well-ordered SAM of
hexadecane thiol on gold (reference sample) reveals virtually no difference,
indicating a very similar degree of order in the two samples.
A more quantitative analysis [Stöh,1992; Kinz,1994; Fisc,1997] of the order in
the films yields a similar tilt angle, d, to that obtained for hexadecane thiol
monolayers on gold (i.e. u = 33° between the alkyl chain axis and the surface
normal). An error of less than 3° was calculated (for details see ref. [Fisc,1997]).
Ill
IV Results and Discussion
-PCO
a
275 285 295 305 315 325
Photon energy [cV]
Fig. 17: NEXAFS spectra of ODPO4 adsorbed on tantalum (V) oxide from a
0.5 mM solution in n-heptane + 0.4% 2-propanol for 48 h at normal and
grazing incidence
AFM:
AFM images were performed by K.Feldman. Figure 18 shows a lateral force
image of an ODPO4 layer on Ta205. Clearly visible is a certain degree of order in
the layer in the form of small patterned areas. However, apart from these ordered
regions, there are regions where no structure is clearly observable and the imagesare 'blurred'. Both structured and non-structured regions are on the order of a few
nanometers in diameter. The small, structured regions display a roughly hexagonal
112
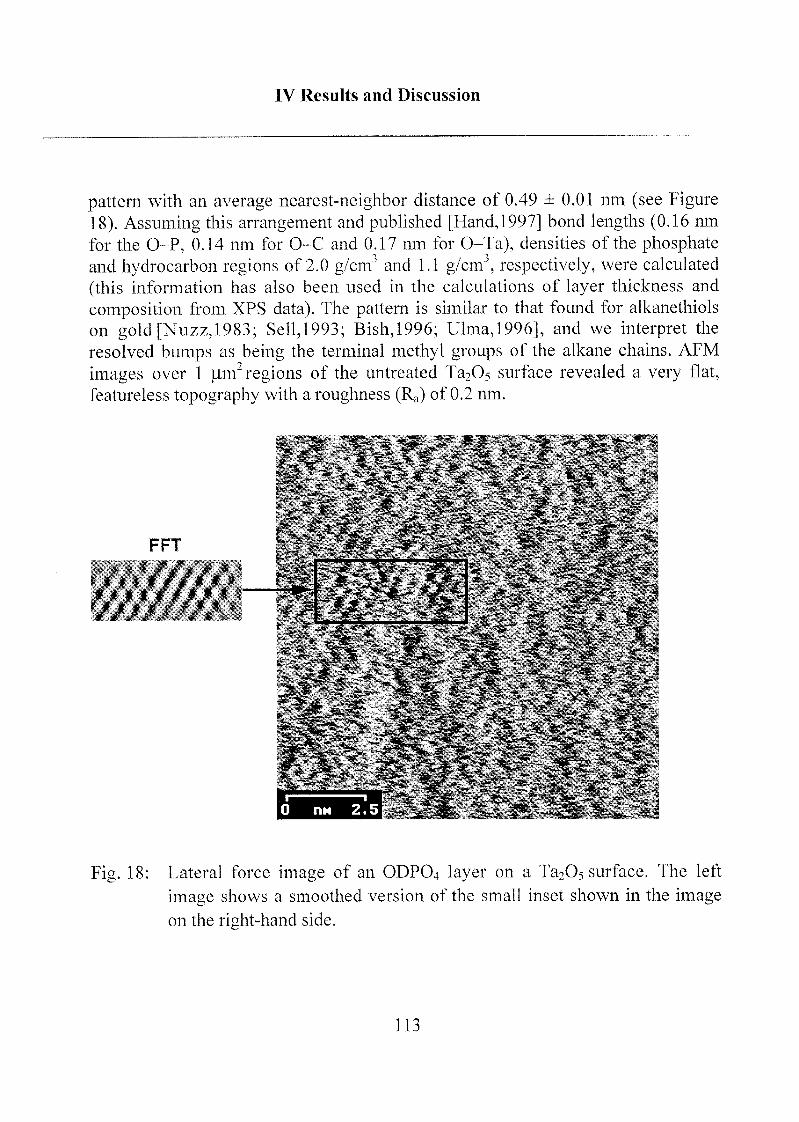
IV Results and Discussion
pattern with an average nearest-neighbor distance of 0.49 ± 0.01 nm (see Figure
18). Assuming this arrangement and published [Hand, 1997] bond lengths (0.16 nm
for the O-P, 0.14 nm for O-C and 0.17 nm for O-Ta), densities of the phosphateand hydrocarbon regions of 2 0 g/cm and 1.1 g/cm , respectively, were calculated
(this information has also been used in the calculations of layer thickness and
composition from XPS data). The pattern is similar to that found for alkanethiols
on gold[Nuzz,1983; Sell,1993; Bish,1996; Ulma,1996], and we interpret the
resolved bumps as being the terminal methyl groups of the alkane chains. AFM
images over 1 |im" regions of the untreated Ta20^ surface revealed a very flat,
featureless topography with a roughness (Ra) of 0.2 nm.
Fig. 18: Lateral force image of an ODPO4 layer on a Ta205 surface. The left
image shows a smoothed version of the small inset shown in the image
on the right-hand side.
113
IV Results and Discussion
2.1.1.4 Summary, Conclusions and Suggestions
Orientation, stoichiometry, and thickness of the ODP04 SAM:
The results of the angle-dependent XPS investigation of the ODP04/Ta205
surface demonstrate that the terminal phosphate groups are oriented towards the
Ta205 substrate surface. This is strongly suggested by the evolution of the carbon,
oxygen, phosphorus and tantalum XPS intensities as a function of electron-
emission angle (Figure 15). A three-layer model was used to calculate the thickness
and stoichiometry of each layer (hydrocarbon, phosphate head group, and tantalum
substrate) (Table 13). By using the AFM data, densities for each layer could be
estimated and hickness and stoichiometry values for the individual layers could be
subsequantly calculated:
a) The adlayer thickness of 2.2 ± 0.2 nm calculated using the three-layer model is
in excellent agreement with the value of 2.1 ± 0.05 nm calculated from the
total length of the ODPO4 molecule (2.5 nm) and from the (average) tilt angleof 30 - 35° determined experimentally from NEXAFS measurements
[Brov,1999].
b) The O/P atomic ratio of 3.4 ± 0.8, calculated from the deconvolved 0]S and
from the P2p XPS peak areas, is roughly consistent with the expected ratio of 4
: 1 for the phosphate group. The relatively high standard deviation is due to
the low signal-to-noise ratio for the P2p emission.
c) The O/Ta atomic ratio of 2.3 ± 0.3 is close to the expected value for the Ta2Os
stoichiometry.
Substrate Bonding:
In this section we discuss the observations from ToF-SIMS and XPS related to
the question of the bonding mechanism of the phosphate head group of the ODPO4
molecule to the tantalum oxide substrate:
114
IV Results and Discussion
The positive and negative ToF-SIMS spectra showing a variety of fragments
corresponding to the classes 1 through IV (see Section ToF-SIMS in previous
chapter) provide conclusive information about the coordination of the phosphatehead group to the Ta cations:
a) The fact that prominent peaks of class III (TaaPbOcHd) and IV (TaaPbOcCdHe)are observed gives strong evidence for a direct coordination of the phosphate
group to Ta cations. If the binding of the phosphate group were weak, such as
hydrogen bonding to tantalum oxides and hydroxides at the surface (e.g.
ROPO(OH)2"-0-Ta), it would be unlikely that complex fragments of type III
and IV would survive the fragmentation and detection process and lead to
mass peaks of relatively high intensity. Moreover, many of the observed
fragments such as m/z = 371 (negative), 391 (positive), 561 (negative) etc.
cannot readily be explained assuming indirect coordination via
P-O-'-H-O-Ta or P-O-H—-O-Ta hydrogen bonding.
b) The fact that a very particular pattern of fragment stoichiometries is observed
supports the findings of a preferred model of coordination, discussed in detail
in chapter 2.1.1.5. The fragmentation types that are experimentally observed
in the positive and/or negative SIMS spectra are summarized in Table 16.
The findings are exactly what one would expect for a model of coordination of
ODP04 on Ta205 involving the presence of both bidentate ODP04 bound to one Ta
ion and of monodentate coordination of two ODP04 molecules to one Ta ion. The
assumption is that the secondary fragments in (static) ToF-SIMS accurately reflect
the original molecular structure of the surface and that the recombination of
fragments that were originally apart from each other is not a likely process during
secondary ion formation.
Based on the structure and preferred coordination of tantalum (V) in oxides,
structures of the molecular ion species corresponding to some of the more
interesting fragments of Table 14 and Table 15 are proposed in Figure 19.
115
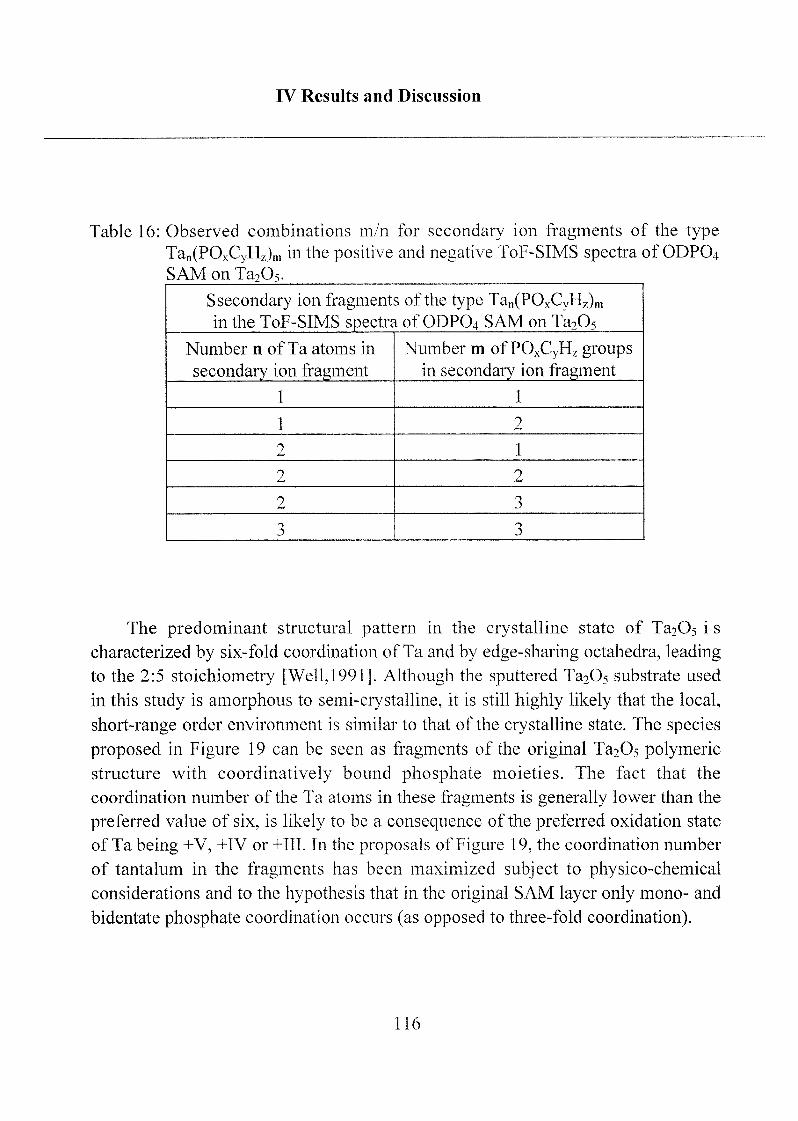
IV Results and Discussion
Table 16: Observed combinations m/n for secondary ion fragments of the type
Tan(POxCyHz)m in the positive and negative ToF-SIMS spectra of ODPO4
SAM on Ta205.
Ssecondary ion fragments of the type Tan(POxCyHz)min the ToF-SIMS spectra of ODP04 SAM on Ta205
Number n of Ta atoms in
secondaiy ion fragment
Number m of POxCyHz groups
in secondary ion fragment
1 1
1 2
2 1
2 2
2 3
3 3
The predominant structural pattern in the crystalline state of Ta2Os i s
characterized by six-fold coordination of Ta and by edge-sharing octahedra, leadingto the 2:5 stoichiometry [Well, 1991]. Although the sputtered Ta205 substrate used
in this study is amorphous to semi-crystalline, it is still highly likely that the local,
short-range order environment is similar to that of the crystalline state. The species
proposed in Figure 19 can be seen as fragments of the original Ta205 polymericstructure with coordinatively bound phosphate moieties. The fact that the
coordination number of the Ta atoms in these fragments is generally lower than the
preferred value of six, is likely to be a consequence of the preferred oxidation state
of Ta being +V, +IV or +111. In the proposals of Figure 19, the coordination number
of tantalum in the fragments has been maximized subject to physico-chemicalconsiderations and to the hypothesis that in the original SAM layer only mono- and
bidentate phosphate coordination occurs (as opposed to three-fold coordination).
116
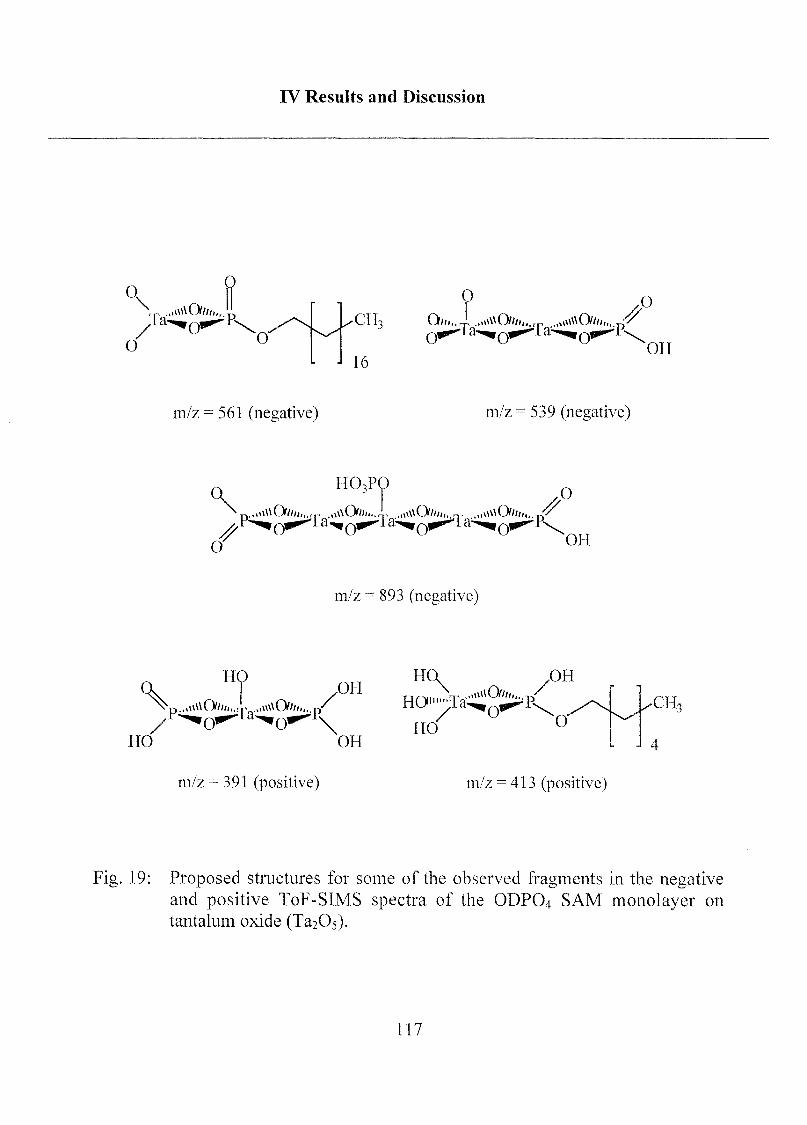
IV Results and Discussion
Q
O
\r, ...U\\CV//;„,-,
)
CH$ Oil,,.À .^\ùQllli„.rpf .„iirtttCV////,. jfso
J 16OH
m/z = 561 (negative) m/z =539 (negative)
HO3POQ
Xp...u\\0////;„.T .a\\0////,..
o
o
OH
m/z = 893 (negative)
\HO
,..,»l\\0//»J/,.r
HO/^O'
/OH
Vv..i\\\0////„. r>
d^o*^\OH
HO
HO Ta^r^I
HO
OH
O"*CH,
m/z = 391 (positive) m/z = 413 (positive)
Fig. 19: Proposed structures for some of the observed fragments in the negativeand positive ToF-SIMS spectra of the ODP04 SAM monolayer on
tantalum oxide (Ta205).
117
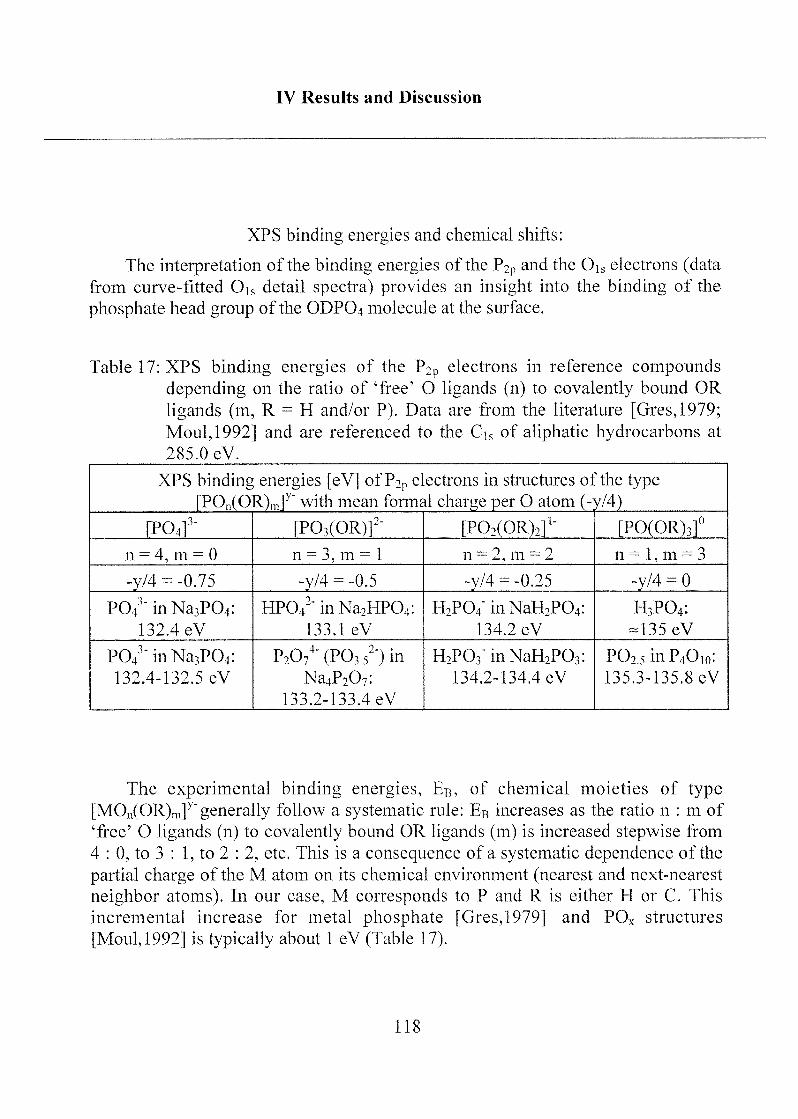
IV Results and Discussion
XPS binding energies and chemical shifts:
The interpretation of the binding energies of the P2p and the Ois electrons (datafrom curve-fitted Ois detail spectra) provides an insight into the binding of the
phosphate head group of the ODP04 molecule at the surface.
Table 17: XPS binding energies of the P2p electrons in reference compounds
depending on the ratio of 'free' O ligands (n) to covalently bound OR
ligands (m, R = H and/or P). Data are from the literature [Gres,1979;
Moul,1992] and are referenced to the Cis of aliphatic hydrocarbons at
285.0 eV.
XPS binding[POn(0
energies [eV] of P2p electrons in structures of the type
R-)m]y" with mean formal charge per O atom (-y/4)
[P04f pP03(OR)f [P02(OR)2]1" [PO(OR)3]°
n = 4, m = 0 n = 3, m = 1 n = 2, m = 2 n= l, m = 3
-y/4 = -0.75 -y/4 = -0.5 -y/4 = -0.25 -y/4 = 0
P043"inNa3P04:132.4 eV
HPO42" in Na2HP04:
133.1 eV
H2PO4" in NaH2P04:134.2 eV
H3PO4:-135 eV
P043"inNa3P04:132.4-132.5 eV
P2074- (P03 52") in
Na4P207:133.2-133.4 eV
H2P03~inNaH2P03:134.2-134.4 eV
P025 inP4O10:
135.3-135.8 eV
The experimental binding energies, ER, of chemical moieties of type
[MOn(OR)rn]y* generally follow a systematic rule: EB increases as the ratio n : m of
'free' O ligands (n) to covalently bound OR ligands (m) is increased stepwise from
4 : 0, to 3 : 1, to 2 : 2, etc. This is a consequence of a systematic dependence of the
partial charge of the M atom on its chemical environment (nearest and next-nearest
neighbor atoms). In our case, M corresponds to P and R is either H or C. This
incremental increase for metal phosphate [Ores, 1979] and POx structures
[Moul,1992] is typically about 1 eV (Table 17).
118
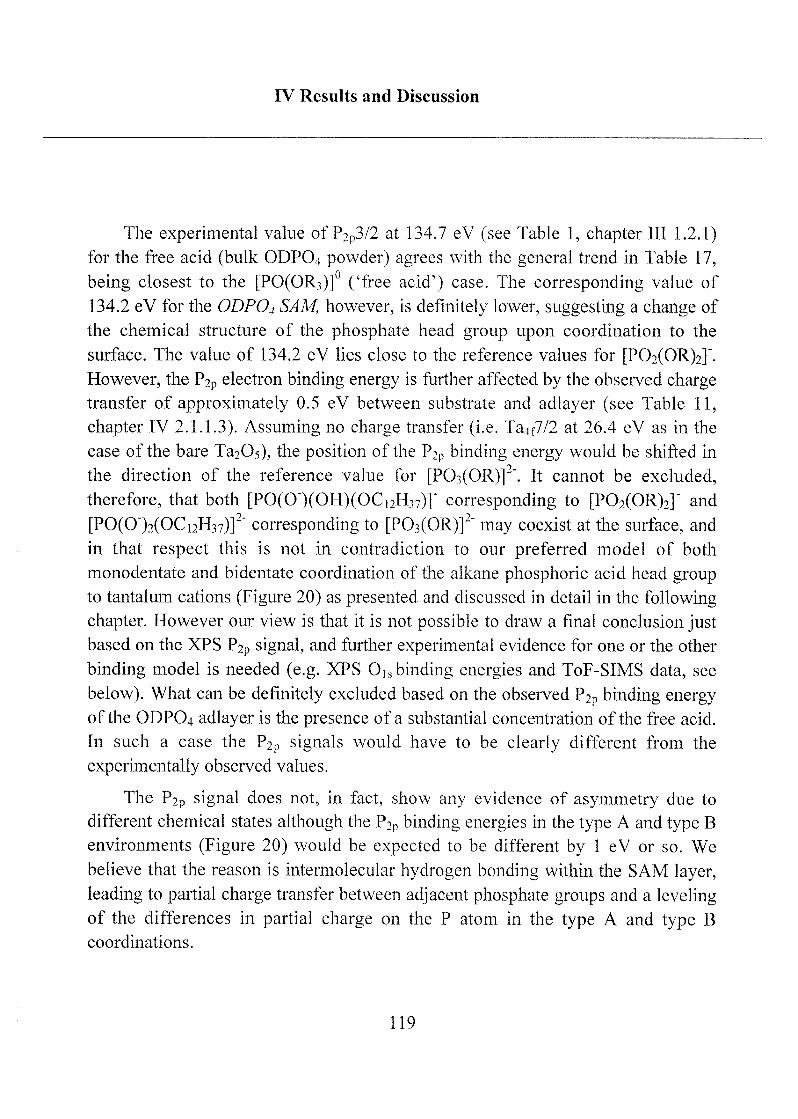
IV Results and Discussion
The experimental value of P2P3/2 at 134.7 eV (see Table 1, chapter III 1.2.1)for the free acid (bulk ODP04 powder) agrees with the general trend in Table 17,
being closest to the [PO(OR3)]° ('free acid') case. The corresponding value of
134.2 eV for the ODP04 SAM, however, is definitely lower, suggesting a change of
the chemical structure of the phosphate head group upon coordination to the
surface. The value of 134.2 eV lies close to the reference values for [P02(OR)2]".
However, the P2P electron binding energy is further affected by the observed chargetransfer of approximately 0.5 eV between substrate and adlayer (see Table 11,
chapter IV 2.1.1.3). Assuming no charge transfer (i.e. Ta4f7/2 at 26.4 eV as in the
case of the bare Ta205), the position of the P2p binding energy would be shifted in
the direction of the reference value for [P03(OR)]2\ It cannot be excluded,
therefore, that both [PO(0")(OH)(OCi2H37)]" corresponding to [P02(OR)2]" and
[PO(0")2(OC]2H37)]2" corresponding to [P03(OR)]2~ may coexist at the surface, and
in that respect this is not in contradiction to our preferred model of both
monodentate and bidentate coordination of the alkane phosphoric acid head group
to tantalum cations (Figure 20) as presented and discussed in detail in the following
chapter. However our view is that it is not possible to draw a final conclusion justbased on the XPS P2P signal, and further experimental evidence for one or the other
binding model is needed (e.g. XPS 0]S binding energies and ToF-SIMS data, see
below). What can be definitely excluded based on the observed P2p binding energy
of the ODPO4 adlayer is the presence of a substantial concentration of the free acid.
In such a case the P2p signals would have to be clearly different from the
experimentally observed values.
The P2p signal does not, in fact, show any evidence of asymmetry due to
different chemical states although the P2p binding energies in the type A and type B
environments (Figure 20) would be expected to be different by 1 eV or so. We
believe that the reason is intermolecular hydrogen bonding within the SAM layer,
leading to partial charge transfer between adjacent phosphate groups and a levelingof the differences in partial charge on the P atom in the type A and type B
coordinations.
119
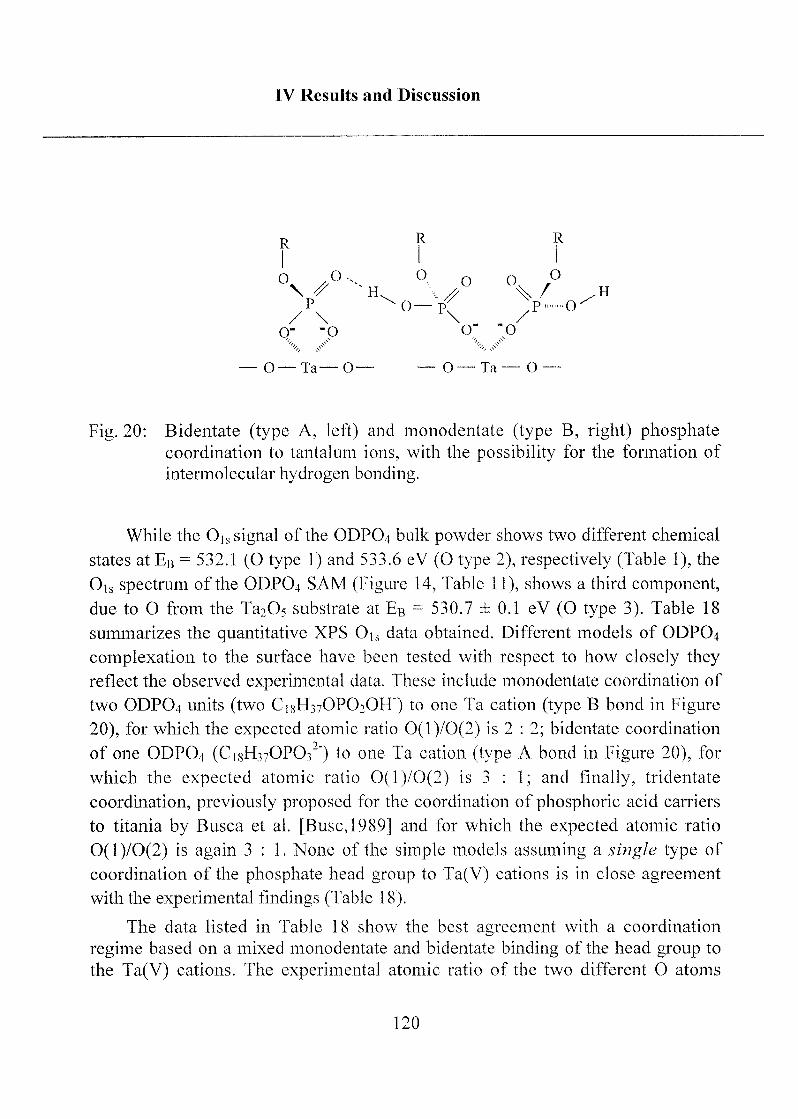
IV Results and Discussion
R K
0 ,o-\ //
P
/ \0" -o
00
H \ //
^0—p^0
R
X ,°P CK
o
0_Ta—0_ —0_Ta_o
Fig. 20: Bidentate (type A, left) and monodentate (type B, right) phosphatecoordination to tantalum ions, with the possibility for the formation of
intermolecular hydrogen bonding.
While the Ojs signal of the ODPO4 bulk powder shows two different chemical
states at EB - 532.1 (O type 1) and 533.6 eV (O type 2), respectively (Table 1), the
Ois spectrum of the ODPO4 SAM (Figure 14, Table 11), shows a third component,
due to O from the Ta205 substrate at EB = 530.7 ±0.1 eV (O type 3). Table 18
summarizes the quantitative XPS Ö]S data obtained. Different models of ODPO4
complexation to the surface have been tested with respect to how closely theyreflect the observed experimental data. These include monodentate coordination of
two ODPO4 units (two C18H37OPO2OH") to one Ta cation (type B bond in Figure
20), for which the expected atomic ratio 0(l)/0(2) is 2 : 2; bidentate coordination
of one ODPO4 (C18H37OPO32") to one Ta cation (type A bond in Figure 20), for
which the expected atomic ratio 0(l)/0(2) is 3 : 1; and finally, tridentate
coordination, previously proposed for the coordination of phosphoric acid carriers
to titania by Busca et al. [Buse, 1989] and for which the expected atomic ratio
0(l)/0(2) is again 3:1. None of the simple models assuming a single type of
coordination of the phosphate head group to Ta(V) cations is in close agreement
with the experimental findings (Table 18).
The data listed in Table 18 show the best agreement with a coordination
regime based on a mixed monodentate and bidentate binding of the head group to
the Ta(V) cations. The experimental atomic ratio of the two different O atoms
120
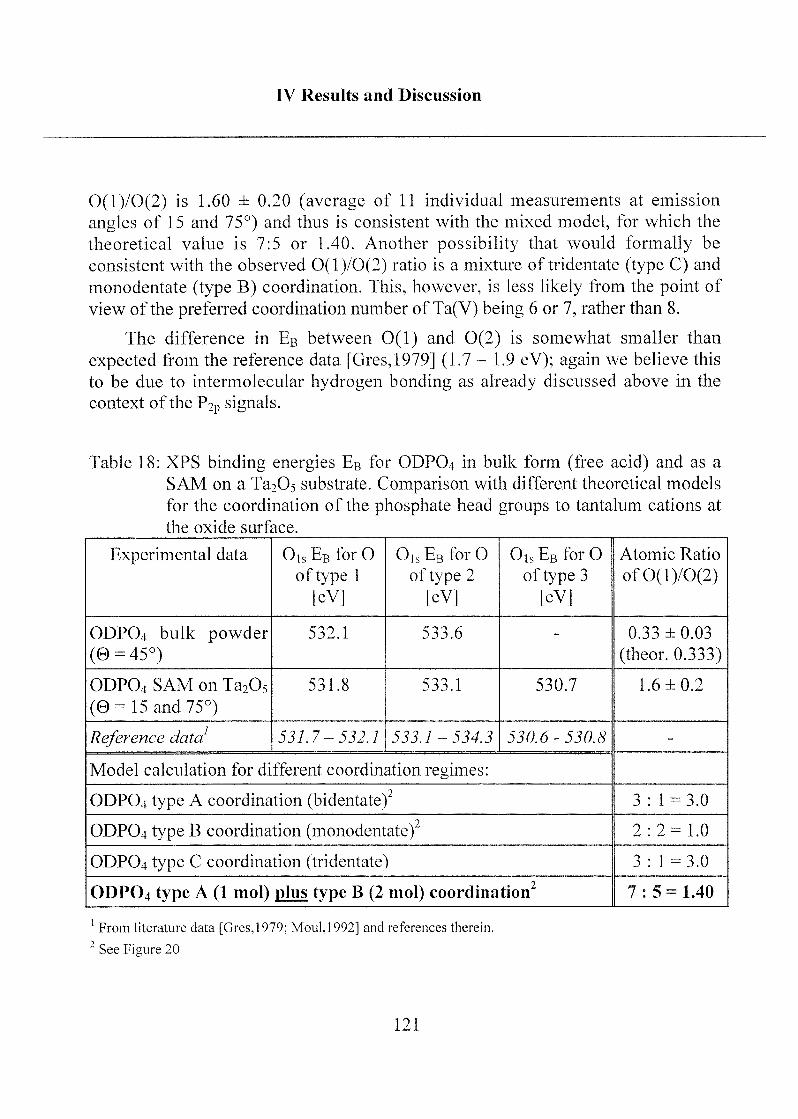
IV Results and Discussion
0(l)/0(2) is 1.60 ± 0.20 (average of 11 individual measurements at emission
angles of 15 and 75°) and thus is consistent with the mixed model, for which the
theoretical value is 7:5 or 1.40. Another possibility that would formally be
consistent with the observed 0(l)/0(2) ratio is a mixture of tridentate (type C) and
monodentate (type B) coordination. This, however, is less likely from the point of
view of the preferred coordination number of Ta(V) being 6 or 7, rather than 8.
The difference in EB between 0(1) and 0(2) is somewhat smaller than
expected from the reference data [Gres,1979] (1.7 - 1.9 eV); again we believe this
to be due to intermolecular hydrogen bonding as already discussed above in the
context of the P2p signals.
Table 18: XPS binding energies EB for ODPO4 in bulk form (free acid) and as a
SAM on a Ta205 substrate. Comparison with different theoretical models
for the coordination of the phosphate head groups to tantalum cations at
the oxide surface.
Experimental data Ois EB for O
of type 1
[eV]
OjSEB for O
of type 2
[eV]
Ois EB for O
of type 3
[eV]
Atomic Ratio
ofO(l)/0(2)
ODPO4 bulk powder(0 = 45°)
532.1 533.6 - 0.33 ±0.03
(theor. 0.333)
ODPO4 SAM on Ta205
(0= 15 and 75°)
531.8 533.1 530.7 1.6 ±0.2
Reference data 531.7-532.1 533.1-534.3 530.6-530.8 -
Model calculation for different coordination regimes:
ODPO4 type A coordination (bidentate)" 3 : 1-3.0
ODPO4 type B coordination (monodentate)2 2:2=1.0
ODPO4 type C coordination (tridentate) 3 : 1 = 3.0
ODPO4 type A (1 mol) plus type B (2 mol) coordination 7:5 = 1.40
From literature data [Gres,1979; Moul,]992] and references therein.
"
See Figure 20
121
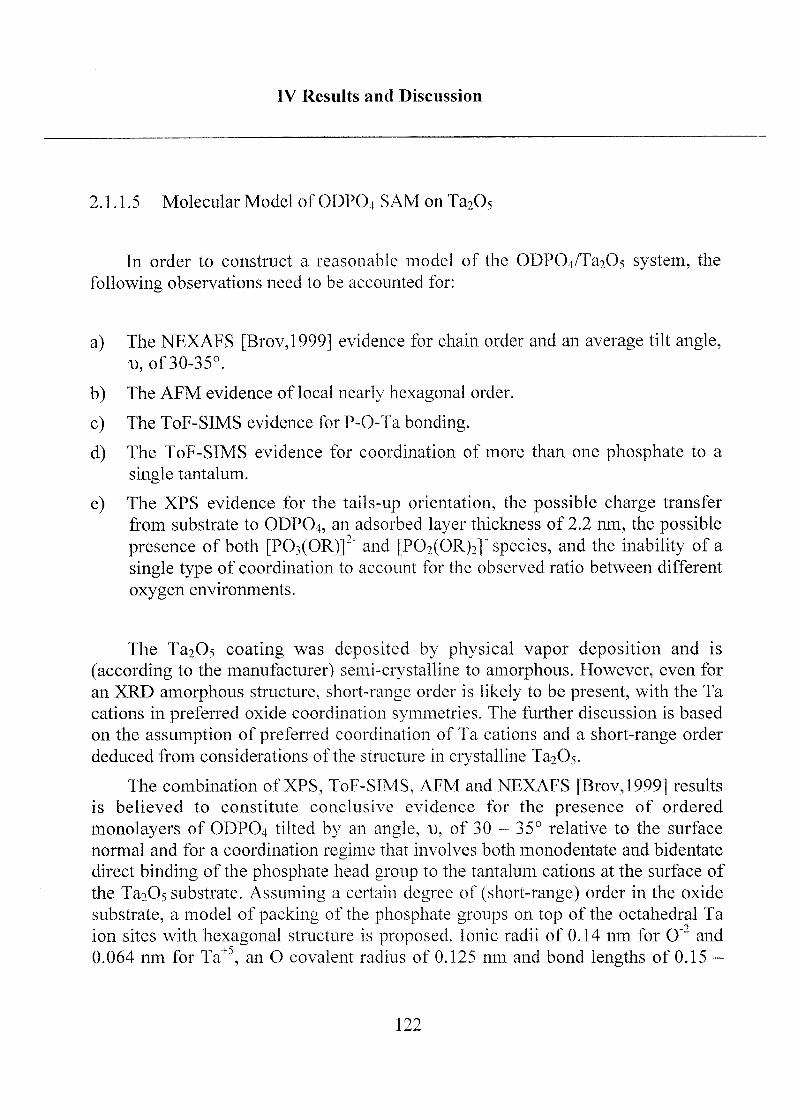
IV Results and Discussion
2.1.1.5 Molecular Model of ODPO4 SAMonTa205
In order to construct a reasonable model of the ODP04/Ta2C>5 system, the
following observations need to be accounted for:
a) The NEXAFS [Brov,1999] evidence for chain order and an average tilt angle,
\), of 30-35°.
b) The AFM evidence of local nearly hexagonal order.
c) The ToF-SIMS evidence for P-O-Ta bonding.
d) The ToF-SIMS evidence for coordination of more than one phosphate to a
single tantalum.
e) The XPS evidence for the tails-up orientation, the possible charge transfer
from substrate to ODPO4, an adsorbed layer thickness of 2.2 nm, the possible
presence of both [P03(OR)]2" and [P02(OR)2]" species, and the inability of a
single type of coordination to account for the observed ratio between different
oxygen environments.
The Ta2Os coating was deposited by physical vapor deposition and is
(according to the manufacturer) semi-crystalline to amorphous. However, even for
an XRD amorphous structure, short-range order is likely to be present, with the Ta
cations in preferred oxide coordination symmetries. The further discussion is based
on the assumption of preferred coordination of Ta cations and a short-range order
deduced from considerations of the structure in crystalline Ta2C>5.
The combination of XPS, ToF-SIMS, AFM and NEXAFS [Brov,1999] results
is believed to constitute conclusive evidence for the presence of ordered
monolayers of ODP04 tilted by an angle, d, of 30 - 35° relative to the surface
normal and for a coordination regime that involves both monodentate and bidentate
direct binding of the phosphate head group to the tantalum cations at the surface of
the Ta205 substrate. Assuming a certain degree of (short-range) order in the oxide
substrate, a model of packing of the phosphate groups on top of the octahedral Ta
ion sites with hexagonal structure is proposed. Ionic radii of 0.14 nm for O"2 and
0.064 nm for Ta+5, an O covalent radius of 0.125 nm and bond lengths of 0.15 -
122
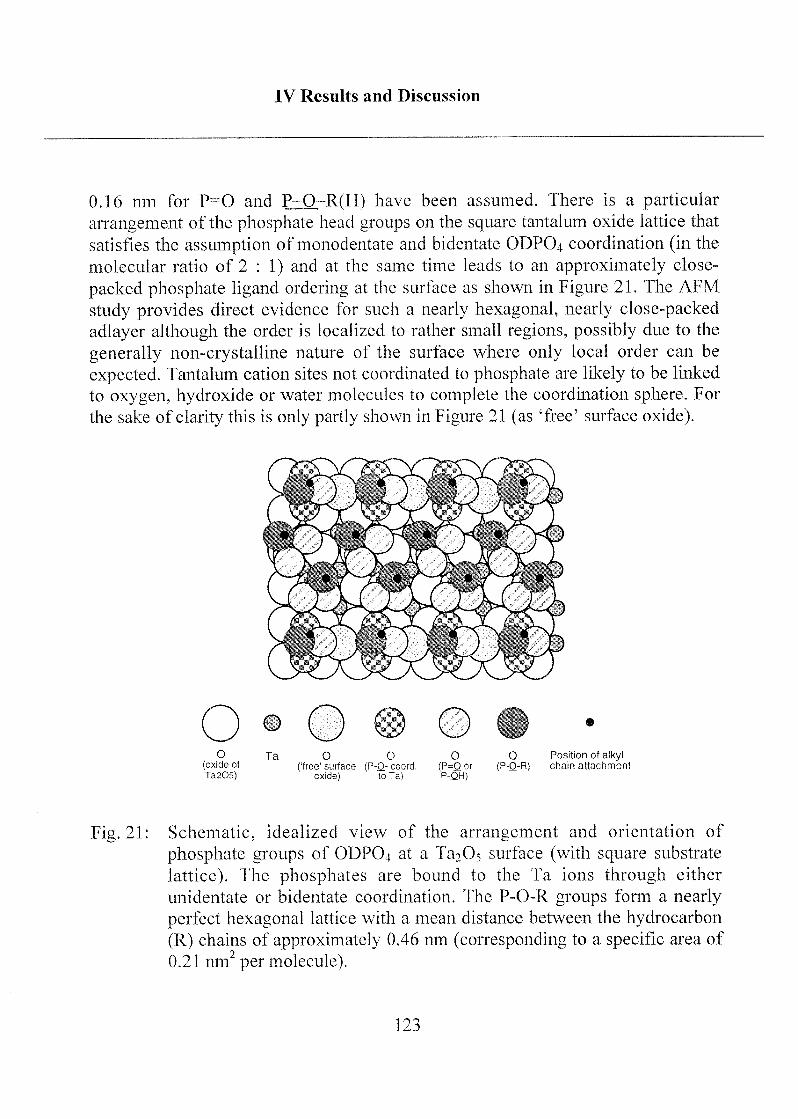
IV Results and Discussion
0.16 nm for P=0 and P-O-R(H) have been assumed. There is a particular
arrangement of the phosphate head groups on the square tantalum oxide lattice that
satisfies the assumption of monodentate and bidentate ODPO4 coordination (in the
molecular ratio of 2 : 1) and at the same time leads to an approximately close-
packed phosphate ligand ordering at the surface as shown in Figure 21. The AFM
study provides direct evidence for such a nearly hexagonal, nearly close-packed
adlayer although the order is localized to rather small regions, possibly due to the
generally non-crystalline nature of the surface where only local order can be
expected. Tantalum cation sites not coordinated to phosphate are likely to be linked
to oxygen, hydroxide or water molecules to complete the coordination sphere. For
the sake of clarity this is only partly shown in Figure 21 (as 'free' surface oxide).
O01f m ü mi t /
\ / v» m I V J
O Ta O 0 0 0 Position of alkyl(oxide of ('free'surface (P-Q- coord (P=Qor (P-Q-R) chain attachment
Ta205) oxide) to Ta) P-QH)
Fig. 21: Schematic, idealized view of the arrangement and orientation of
phosphate groups of ODPO4 at a Ta205 surface (with square substrate
lattice). The phosphates are bound to the Ta ions through either
unidentate or bidentate coordination. The P-O-R groups form a nearly
perfect hexagonal lattice with a mean distance between the hydrocarbon
(R) chains of approximately 0.46 nm (corresponding to a specific area of
0.21 nm2 per molecule).
123
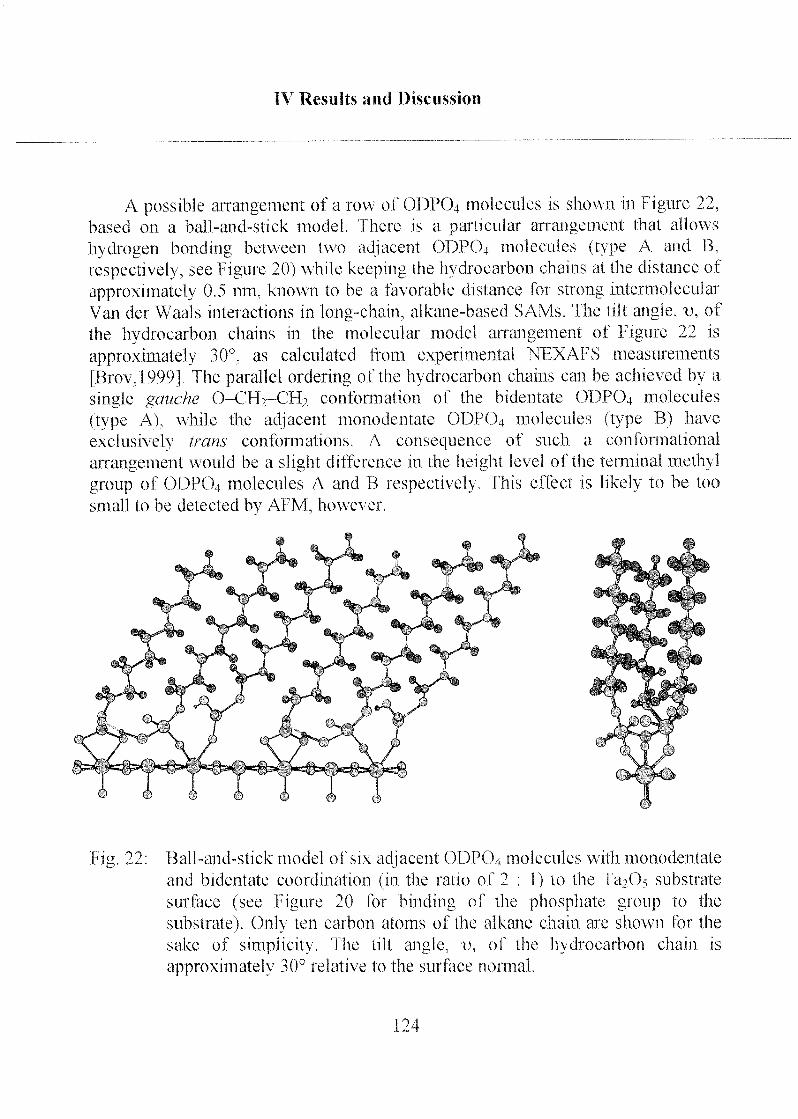
IV Results and Discussion
A possible arrangement of a row of ÜDPO4 molecules is shown 111 figure 22,
based on a ball-and-stick model fliere is a particular arrangement that allows
hydrogen bonding between two adjacent ODP04 molecules (type A and B,
respectively, see Figure 20) while keeping the hydrocarbon chains at the distance of
approximate!) 0.5 nm, known to be a favorable distance for strong mtermolecular
Van der Waals interactions in long-chain, alkane-based SAMs The tilt angle, v, of
the hydrocarbon chains m the molecular model arrangement of figure 22 is
approximately 30°, as calculated from experimental NEXAPS measurements
[Brov,l999| The parallel ordering of the hydrocarbon chains can be achieved b> a
single gauche 0-CH-.-CH2 conformation of the bidentate ODPO4 molecules
(type A), while the adjacent monodentate ODPOj molecules (type B) have
exclusively trans conformations A consequence of such a conformational
arrangement would be a slight difference m the height level of the terminal methyl
group of ODPO4 molecules A and B respectively This effect is Jikefy to be too
small to be detected by AFM, however
Fig 22 Ball-and-stick model of six adjacent ODPO t molecules w ilh monodentate
and bidentate coordination (111 the ratio of 2 1) to the ITbOs substrate
surface (see Figure 20 for binding of the phosphate group to the
substrate) Only ten carbon atoms of the alkane chain are shown for the
sake of simplicity The tilt angle, u, of the hydrocarbon chain is
approximate!) 30° relative to the surface normal
124
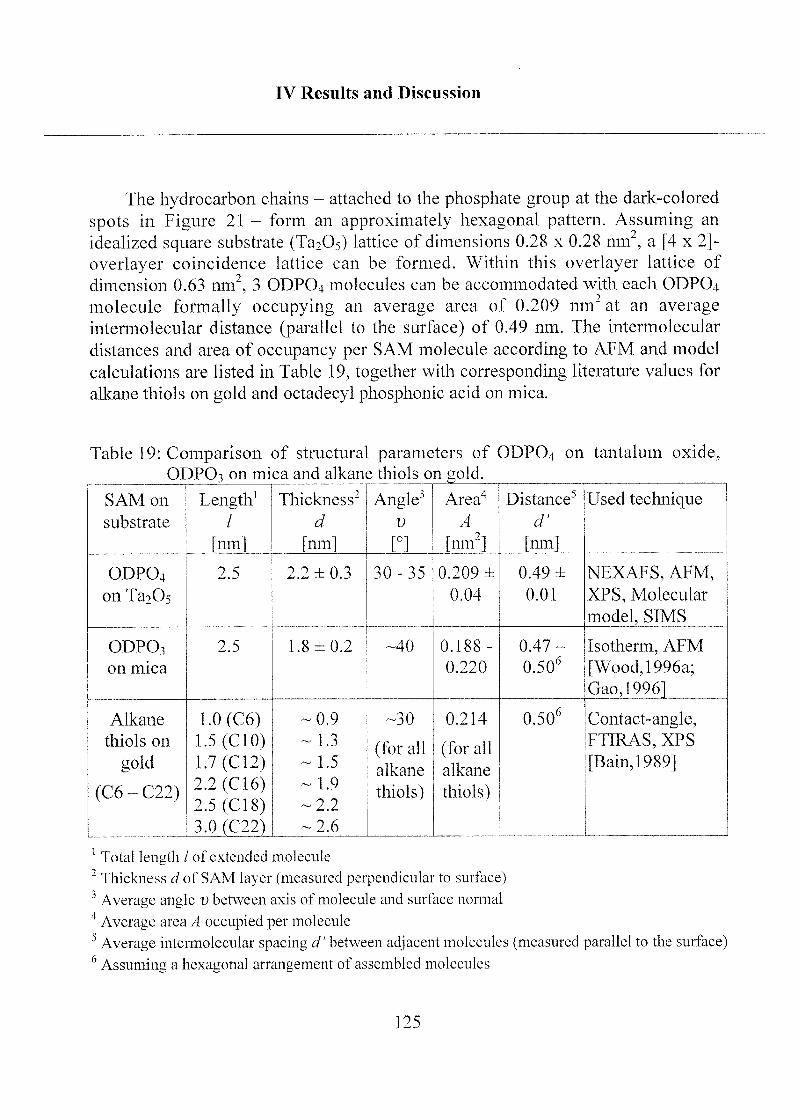
IV Results and Discussion
The hydrocarbon chains - attached to the phosphate group at the dark-colored
spots in Figure 21 - form an approximately hexagonal pattern. Assuming an
idealized square substrate (Ta205) lattice of dimensions 0.28 x 0.28 nm2, a [4 x 2]-
overlayer coincidence lattice can be formed. Within this overlayer lattice of
dimension 0.63 nm,3 ODPO4 molecules can be accommodated with each ODPO4
molecule formally occupying an average area of 0.209 nm" at an average
intermolecular distance (parallel to the surface) of 0.49 nm. The intermolecular
distances and area of occupancy per SAM molecule according to AFM and model
calculations are listed in Table 19, together with corresponding literature values for
alkane thiols on gold and octadecyl phosphonic acid on mica.
Table 19: Comparison of structural parameters of ODPO4 on tantalum oxide,
ODPO3 on mica and alkane thiols on gold.
SAM on
substrate
Length1/
[nm]
Thickness2
d
[nm]
Angle3i)
n
Area4
A
[nm2]
Distance5
d'
[nm]
Used technique
ODPO4
on Ta205
2.5 2.2 ±0.3 30-35 0.209 ±
0.04
0.49 ±
0.01
NEXAFS, AFM,
XPS, Molecular
model, SIMS
ODPO3
on mica
2.5 1.8 ±0.2 -40 0.188-
0.220
0.47-
0.506Isotherm, AFM
[Wood, 1996a;
Gao,1996]
Alkane
thiols on
gold
(C6-C22)
1.0 (C6)1.5 (C10)1.7 (C12)2.2 (C16)2.5 (C18)3.0 (C22)
-0.9
-1.3
-1.5
-1.9
-2.2
-2.6
-30
(for all
alkane
thiols)
0.214
(for all
alkane
thiols)
0.506 Contact-angle,FTIRAS, XPS
[Bain, 1989]
1Total length / of extended molecule
2Thickness d of SAM layer (measured perpendicular to surface)
1Average angle v between axis of molecule and surface normal
4Average area A occupied per molecule
5Average intermolecular spacing d' between adjacent molecules (measured parallel to the surface)
6Assuming a hexagonal arrangement of assembled molecules
125
IV Results and Discussion
The structural geometric parameters found for the ODP04/Ta20s system are
indeed very close to those reported for alkanethiols on gold [Ulma,1991] as well as
for octadecyl phosphoric acid on mica [Wood, 1996a; Gao,1996] (the adlayer of the
latter is, however, chemically not stable). For the alkanethiol/gold system there is
general agreement that the lateral periodicity of the SAM is directly linked to the
periodicity of the gold surface structure with the terminal sulfur occupying hollow
sites in the gold substrate lattice [Ulma,1991; Feut,1993]. Since the size of the
alkanethiol molecule is too large to occupy every hollow site, an overlayer is
formed that conforms with the steric requirements of the molecule. On Au(lll),the most extensively studied single crystal plane, a V3xV3 R30° overlayer structure
is formed. The observed specific tilt angle of the alkanethiol molecules is believed
to result from a maximization of the Van der Waals attraction between adjacentalkane chains within the SAM, leading to the energetically most favorable
conformation.
It is tempting to use argumentation based on the same or similar principles as
in the gold/thiol system to explain the (local) order observed for the ODP04/Ta205
system. In our proposed model, the periodicity of the Ta cations is again believed
to be the prime factor determining order in the ODPO4 adlayer. In view of the
extremely high strength of the Ta-0 bond (approximately 800 kJ/mol) and the
generally high strength of transition metal-phosphate bonds, one expects deeppotential wells for the phosphate at the Ta cation coordination sites. There are,
however, two main differences between the two SAM systems: (a) there is no
simple coincidence lattice for phosphate groups positioned directly on top of the
cation sites that results in a close-packed adlayer and at the same time maintains a
realistic intermolecular phosphate-phosphate distance; (b) for the phosphate
groups, on the other hand, there are several possible geometries to coordinate to
cations: one-, two- and three-fold which offers more flexibility as regardsgeometric orientation of the phosphate group relative to the cation lattice. Our
preferred model of an adlayer binding based on both monodentate and bidentate
phosphate coordination results in a hexagonal overlayer lattice geometry with an
intermolecular spacing that is almost exactly the same as the one in the thiol/goldsystem. It is then straightforward to assume that the experimentally observed mean
tilt angle, "0, of the ODPO4 molecules of 30 - 35° (relative to the surface normal)
again, results from a maximization of the Van der Waals attraction of the
hydrocarbon chains, as in the gold/thiol case.
126
IV Results and Discussion
Order in the ODP04/Ta205 system, as seen in our AFM results, is restricted to
areas of a few nm2 (much smaller than is observed in the case of alkanethiols on
gold). This may be due to the fact that the Ta2Os film is of nanocrystalline to
amorphous nature. If the assumption that the Ta cation lattice geometry is
responsible for adlayer order is correct, then it is straightforward to assume that
order in the ODP04/Ta205 system can only extend over areas comparable to the
size of the nanocrystals. Areas that show no order in the AFM investigation would
then correspond to entirely amorphous Ta205 regions, completely lacking
periodicity in the cation lattice, or to nanocrystalline patches that are too small to
induce measurable order in the adlayer. Nevertheless, NEXAFS data [Brov,1999]
suggest that the overlayer maintains its order over larger distances, essentially
bridging the gap between the ordered tantala patches. A second possibility could be
linked to the different crystallographic planes of the nanocrystals exposed at the
surface, not all of which would be expected to have the appropriate symmetry to
induce order in the ODPO4 SAM. Still another explanation could be the presence of
strongly coordinated ODPO4 molecules with a direct phosphate-Ta(V) bond in
ordered areas surrounded by areas with more weakly bound ODPO4 molecules, e.g.
weakly bound to the oxide surface through hydrogen bonding rather than
chemisorbed by direct coordination. AFM and NEXAFS studies on different single
crystal planes of transition metal oxides would be needed to determine which of
these factors is chiefly responsible for limiting the AFM-observed order to small
areas.
Regarding our proposal for the structure of the ordered ODPO4 areas, other
models, which may be in accord with some of the experimental findings are, of
course, feasible. Our belief in the proposed model is not based on singleobservations, but on the sum of the information from the various techniques appliedto characterize the surface and interface composition and structure. Also, from
purely chemical considerations, the two proposed coordination structures of the
phosphate/ Ta20_s interface may actually make more sense than alternative models,
since:
a) Both types of coordination proposed (A and B, see Figure 20) satisfy formal
charge considerations, in the sense that formally an oxide O2" is replaced byeither two single-coordinated anions of charge -1 or by one bidentate anion of
charge -2. In view of the high O-Ta bond strength (mostly ionic character) of
ca. 800 kJ/mol, it seems very important that a similar gain in enthalpy is
achieved through replacement of the oxide and coordination of the phosphate
127
IV Results and Discussion
in order to get a thermodynamically stable adlayer. Therefore coordination
involving anions of the same total negative charge should be preferred over
e.g. single coordination to an anion with charge -1.
b) Taking the simplified model of an octahedral structure of Ta2Os (edge- and
vertex-shared octahedra), the coordination number of the coordinated surface
Ta ion turns out to be 7 for both proposed types A and B of surface bonding.Seven is (in addition to six) a preferred coordination number for Ta(V). The
often proposed tridentate coordination of the phosphate group would, on the
other hand, lead to a coordination number of eight, which we believe is less
likely, in particular for steric reasons.
c) The combination of type A and B coordination bonding at adjacent sites
allows for the formation of hydrogen bonding, which may be important for
further stabilization of the monolayer. Most other models, such as pure
tridentate phosphate coordination or pure type A (bidentate) bonding, do not
provide the possibility for stabilization through hydrogen bonding.
d) Polymerization across the phosphate intermediate layer through condensation
of phosphate groups to form structures such as (R-OP02)oo (similar to NaP03)is unlikely for both thermodynamic and kinetic reasons, since a) there would
be no strong bond of sufficient ionic character (only P=0 Ta type of
coordination) and b) in contrast to silanes, which very easily form polymericsiloxane structures through condensation, phosphates are kinetically much
more inert. Furthermore, no fragments indicative of polyphosphates were
observed in the ToF-SIMS data.
e) Indirect (weak) coordination of the phosphate to the tantalum oxide or
hydroxide surface via hydrogen bonding is believed to be less likely than the
presence of strong phosphate-Ta(V) complexes. Tn the former case the surface
bonds are likely to be too weak to survive as complex secondary ion
fragments. Moreover, the SIMS fragmentation pattern can only be fullyunderstood when assuming direct complex coordination. However it cannot be
excluded that (in localized regions) less strongly bound states are also present,
e.g. hydrogen-bonded phosphoric acid molecules. In fact, one possible
explanation for the local lability of the SAM order as observed by AFM may
be the presence of such weaker surface interactions in localized areas.
128
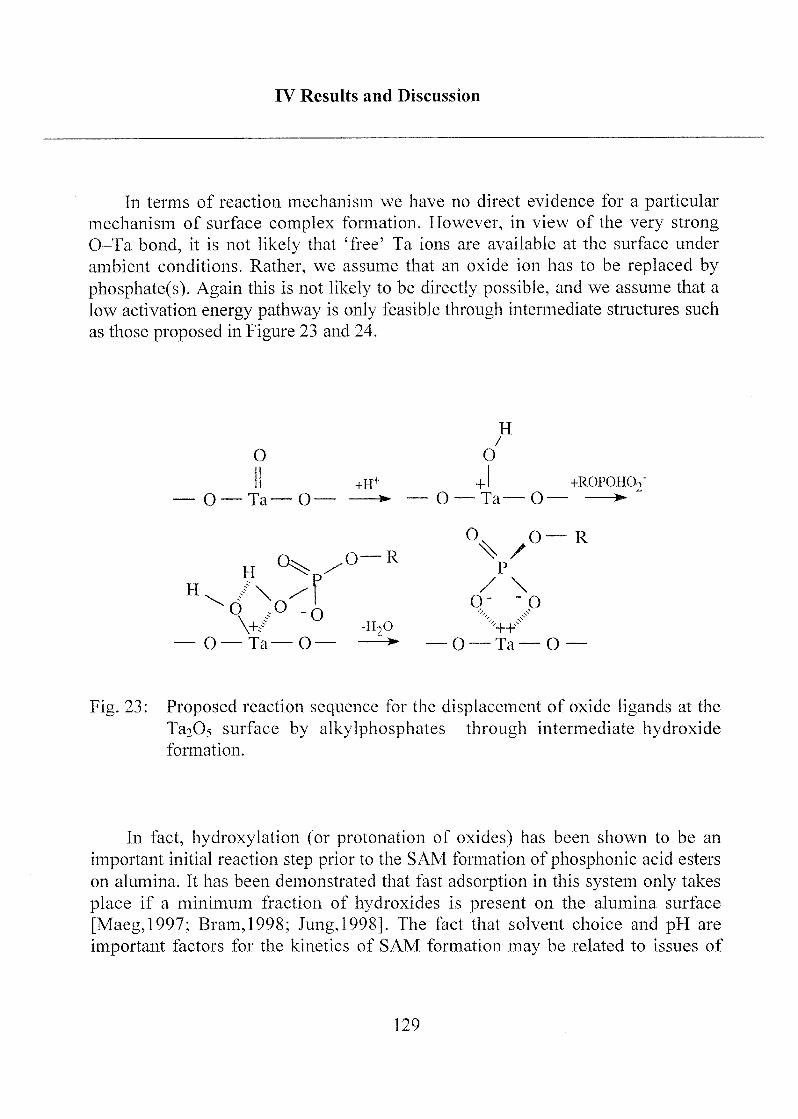
IV Results and Discussion
In terms of reaction mechanism we have no direct evidence for a particularmechanism of surface complex formation. However, in view of the very strong
O-Ta bond, it is not likely that 'free' Ta ions are available at the surface under
ambient conditions. Rather, we assume that an oxide ion has to be replaced by
phosphate(s). Again this is not likely to be directly possible, and we assume that a
low activation energy pathway is only feasible through intermediate structures such
as those proposed in Figure 23 and 24.
H
O O
Il +H+ +1 +ROPOHCV
__0__Ta^0 ^ — 0__Ta__0_ ^
h<w°-R V
H\ /\ A /- \\+/ -HoO '-HP
0___Ta__0__ ^ ___0_^_Ta_0_
Fig. 23: Proposed reaction sequence for the displacement of oxide ligands at the
Ta205 surface by alkylphosphates through intermediate hydroxideformation.
In fact, hydroxylation (or protonation of oxides) has been shown to be an
important initial reaction step prior to the SAM formation of phosphonic acid esters
on alumina. It has been demonstrated that fast adsorption in this system only takes
place if a minimum fraction of hydroxides is present on the alumina surface
[Maeg,1997; Bram,1998; Jung, 1998]. The fact that solvent choice and pH are
important factors for the kinetics of SAM formation may be related to issues of
129
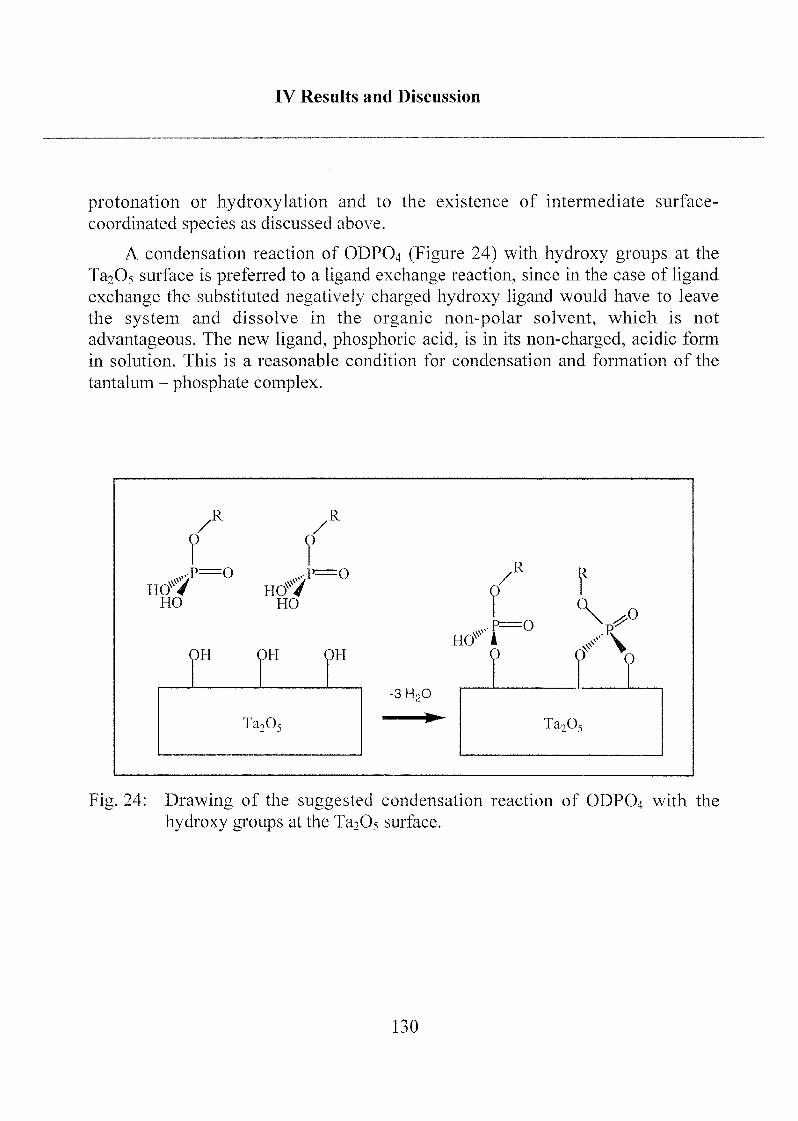
IV Results and Discussion
protonation or hydroxylation and to the existence of intermediate surface-
coordinated species as discussed above.
A condensation reaction of ODPO4 (Figure 24) with hydroxy groups at the
Ta205 surface is preferred to a ligand exchange reaction, since in the case of ligand
exchange the substituted negatively charged hydroxy ligand would have to leave
the system and dissolve in the organic non-polar solvent, which is not
advantageous. The new ligand, phosphoric acid, is in its non-charged, acidic form
in solution. This is a reasonable condition for condensation and formation of the
tantalum - phosphate complex.
,R R/ /
? r«crtT50 Hcff~° {
wfX~°
fHO HO
(?H \pH (pil
-3 H 2°
(I (|> \3
Ta2O5 Ta205
Fig. 24: Drawing of the suggested condensation reaction of ODPO4 with the
hydroxy groups at the Ta^O.s surface.
130
IV Results and Discussion
2.1.2 Mono- and Bifunctional Phosph(on)ates
Surface modifications with the bifunctional 12-hydroxy dodecyl
phosphate (OH-DDPO4) and 12-(N-ethylamino) dodecyl phosphonate (NEt-
DDPO3) were studied on Ta205, Ti02 and on titanium metal surfaces.
Monofunctional amphiphiles were investigated in parallel for different
reasons: dodecyl phosphonate (DDPO3) as an adsorbent with the same
hydrocarbon length as the bifunctional phosph(on)ates; octadecyl
phosphonate (ODPO3) and octadecyl phosphate (ODPO4) as long-chainreference amphiphiles and as tests for potential differences in behaviour
between phosphates and phosphonates, and finally biphenyl phosphate
(BIPH) as an arylic amphiphile.
2.1.2.1 Applied Methods
Microdroplet density (fidd) and contact angle:
The microdroplet density (jidd) was measured as described in chapterIII 2.2.4. The ^idd was measured both before and after rinsing the SAM-
coated surfaces with water. The average of 5 to 10 measurements over
different regions of each surface was determined. The data were used to
estimate the SAM homogeneity on a micrometer scale in the lateral
dimension. Even if the hydrophobicity (from contact-angle measurements) is
not indicative of highly ordered SAMs, as in the case of bifunctional
amphiphiles, the contact-angle results may give some interesting information
in combination with the jidd-data,
Time-of-flight Mass Spectrometry (ToF-SIMS):
Secondary ion mass spectra of the amphipbile-treated metal and metal
oxide surfaces were recorded. Data were correlated to the ToF-SIMS results
for ODPO4 on Ta205 and provided information on the type of chemical bond
between the phosph(on)ate head group and the metal oxide substrate.
131
IV Results and Discussion
X-ray photoelectron spectroscopy (XPS) analyses:
Angle-resolved XPS (AR-XPS) measurements were conducted at two
different take-off angles, namely 15° and 75° with respect to the surface
plane, to get depth-dependent information and to determine the thickness of
the monolayer deposited on the metal oxide substrate (using the 2-layermodel, presented in chapter IV 2.1.1.2). The oxygen signals of the different
phosph(on)ate/metal oxide combinations were fit and used to test the
applicability of the phosphate - metal oxide bonding model developed for
the ODP04/Ta205 system.
Near-edge X-ray absorption fine structure spectroscopy (NEXAFS):
NEXAFS measurements were performed by G.Hähner and I.Pfund-
Klingenfuss on different amphiphile/metal oxide combinations to investigatethe order and chain orientation of the phosph(on)ate SAMs.
2.1.2.2 Influence of Different Solvents [Folk,1995; Dann,1998J
The hydrophobicity and the homogeneity of the SAMs were
investigated using contact-angle and jidd data, respectively. A few solvents
were tested to investigate the self-assembly process of the mono- and
bifunctional phosph(on)ates and to find out the best solvent for each of the
amphiphiles. The criteria for the solvents were the solubility of the
amphiphiles and the toxicity of the solvents: The solvents with the best
performance for ODPO4, n-heptane/2-propanol 100:0.4 (No 1) and ethylacetate (No 2) were tested for all amphiphiles. For DDPO3
(n-heptane/2-propanol 100:0.8 (No 1')) as well as for ODPO3 (n-heptane/2-propanol 100:1.5 (No 1")) a slightly higher amount of 2-propanol was
needed to completely dissolve the amphiphiles at 0.5 mM concentration.
Ethanol/water 1:1 (No 4) and methanol/water/ethanol 10:10:1 (No 6) were
chosen as highly polar mixtures. Ethyl acetate mixtures with different
additives such as ethyl acetate/methanol 10:1 (No 5), ethyl acetate/ethanol
10:1 (No 7) and ethyl acetate/methanol/acetic acid 10:l:traces (No 8) were
132
IV Results and Discussion
solvents with acceptable solubility. Data from a solution of ODPO4 in ether
(No 3) are included in the list even though the solvent was not used for the
other amphiphiles. To provide a better overview, the solvents are listed in
Table 20.
For the monofunctional amphiphiles (ODPO4, ODPO3 and DDPO3) and
for the aromatic phosphate (BIPH) without a terminal polar functionality,measurement of the contact angle is a good method to determine the
performance of the corresponding solvents by measuring the hydrophobicityof the monolayer surfaces. For a highly oriented and densely packedmonolayer of the bifunctional amphiphiles (OH-DDPO4 and NEt-DDP03) a
higher wettability is expected, due to the polar terminal function. Advancingwater contact-angle data are listed in Table 21.
The jidd data (Table 22) may hint at the homogeneity of the SAM
surfaces independent of their wettability. High (idd data are suggestive of a
high amount of adsorbed clusters providing condensation nuclei for water
vapor at the surface. Washing with water may "clean" such surfaces
resulting in a reduction of the u;dd.
Table 20: List of solvents used for preparing amphiphile solutions
No 1 n-heptane/2-propanol 100:0.4 (v/v)
No 1' n-heptane/2-propanol 100:0.8 (v/v)
No 1" n-heptane/2-propanol 100:1.5 (v/v)
No 2 ethyl acetate
No 3 ether
No 4 ethanol/water 1:1 (v/v)
No 5 ethyl acetate/methanol 10:1 (v/v)
No 6 methanol/water/ethanol 10:10:1 (v/v/v)
No 7 ethyl acetate/ethanol 10:1 (v/v)
No 8 ethyl acetate/methanol/acetic acid 10:1 :traces (v/v)
133
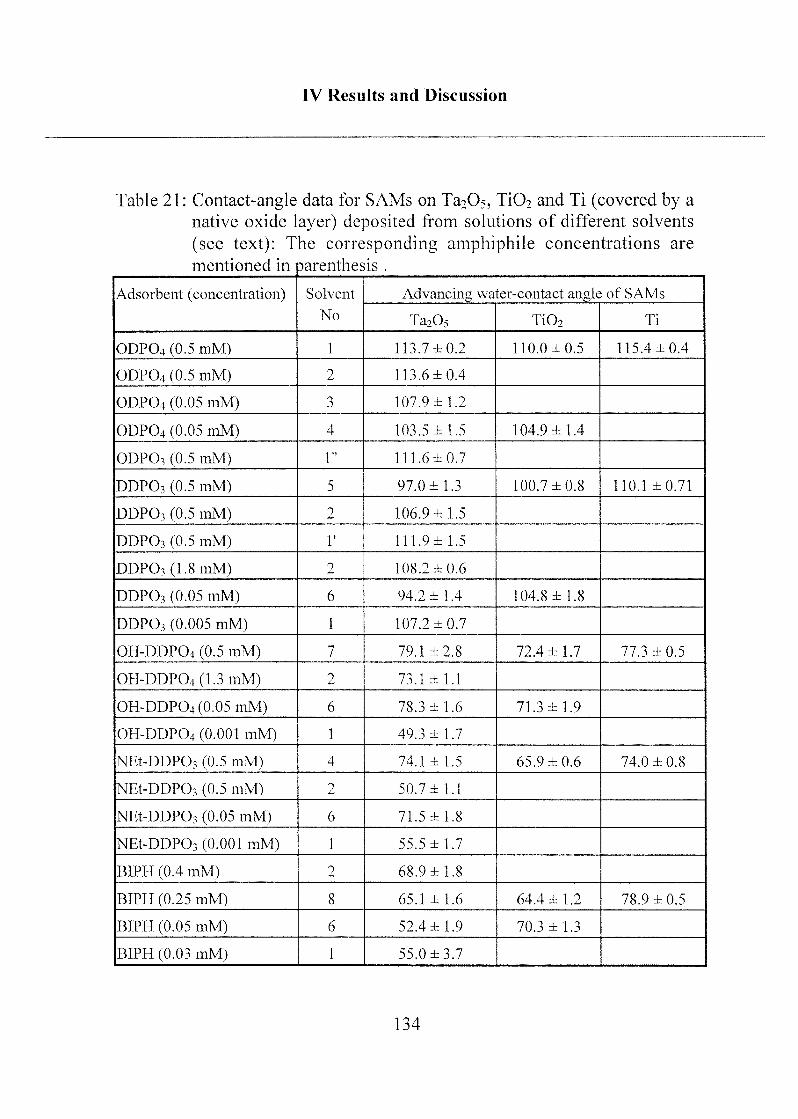
IV Results and Discussion
Table 21: Contact-angle data for SAMs on Ta205, Ti02 and Ti (covered by a
native oxide layer) deposited from solutions of different solvents
(see text): The corresponding amphiphile concentrations are
mentioned in Darenthes is .
Adsorbent (concentration) Solvent
No
Advancing water-contact angle of SAMs
Ta205 Ti02 Ti
ODPO4 (0.5 mM) 1 113.7 ±0.2 110.0 ±0.5 115.4 ±0.4
ODPO4 (0.5 mM) 2 113.6±0.4
ODPO4 (0.05 mM) 3 107.9 ±1.2
ODPO4 (0.05 mM) 4 103.5 ±1.5 104.9 ±1.4
ODPO3 (0.5 mM) 1" 111.6± 0.7
DDPO3 (0.5 mM) 5 97.0 ± 1.3 100.7 ±0.8 110.1 ±0.71
DDPO3 (0.5 mM) 2 106.9 ±1.5
DDPO3 (0.5 mM) 1* 111.9 ± 1.5
DDP03(1.8mM) 2 108.2 ±0.6
DDPO3 (0.05 mM) 6 94.2 ±1.4 104.8 ±1.8
DDPO3 (0.005 mM) 1 107.2 ±0.7
OII-DDP04 (0.5 mM) 7 79.1 ±2.8 72.4 ±1.7 77.3 ± 0.5
OH-DDP04(1.3mM) 2 73.1 ±1.1
OH-DDPO4 (0.05 mM) 6 78.3 ±1.6 71.3 ±1.9
OH-DDPO4 (0.001 mM) 1 49.3 ±1.7
NEt-DDP03 (0.5 mM) 4 74.1 ±1.5 65.9 ±0.6 74.0 ±0.8
NEt-DDP03 (0.5 mM) 2 50.7 ±1.1
NEt-DDP03 (0.05 mM) 6 71.5 ± 1.8
NEt-DDP03 (0.001 mM) 1 55.5 ± 1.7
BIPH (0.4 mM) 2 68.9 ±1.8
BIPH (0.25 mM) 8 65.1 ±1.6 64.4 ±1.2 78.9 ±0.5
BIPH (0.05 mM) 6 52.4 ±1.9 70.3 ±1.3
BIPH (0.03 mM) 1 55.0 ±3.7
134
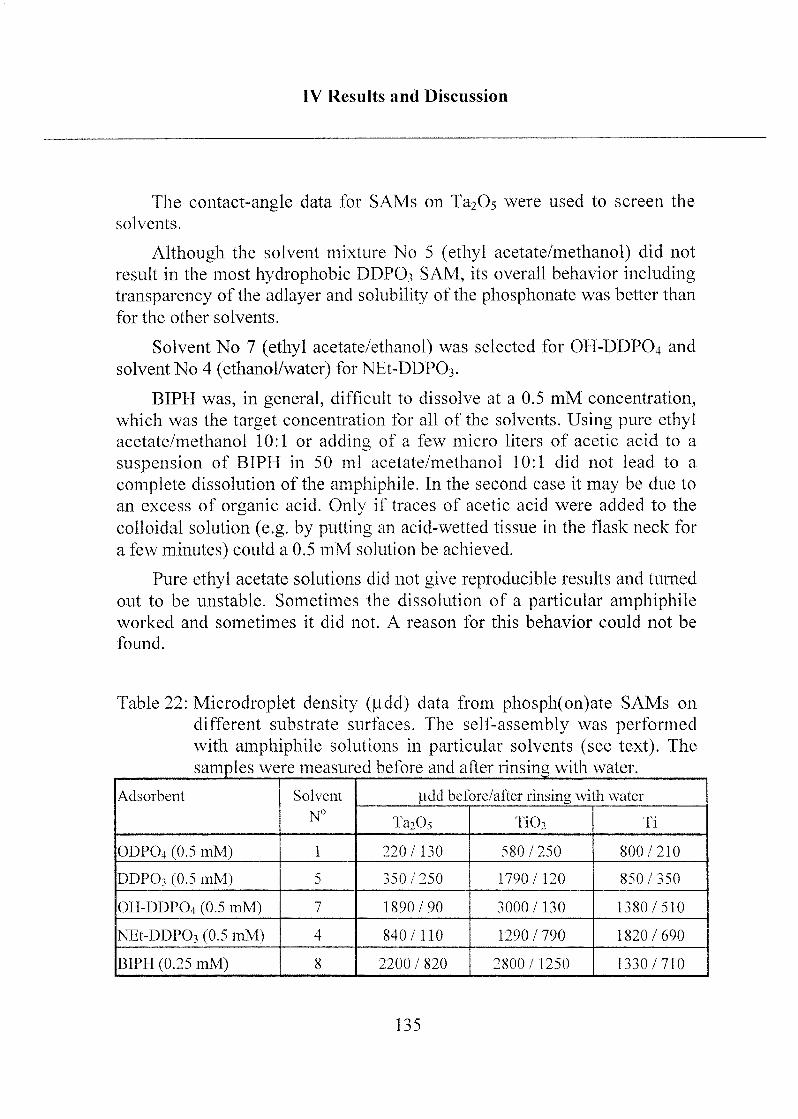
IV Results and Discussion
The contact-angle data for SAMs on Ta205 were used to screen the
solvents.
Although the solvent mixture No 5 (ethyl acetate/methanol) did not
result in the most hydrophobic DDPO, SAM, its overall behavior including
transparency of the adlayer and solubility of the phosphonate was better than
for the other solvents.
Solvent No 7 (ethyl acetate/ethanol) was selected for OH-DDPO4 and
solvent No 4 (ethanol/water) forNEt-DDPCV
BIPH was, in general, difficult to dissolve at a 0.5 mM concentration,which was the target concentration for all of the solvents. Using pure ethylacetate/methanol 10:1 or adding of a few micro liters of acetic acid to a
suspension of BIPH in 50 ml acetate/methanol 10:1 did not lead to a
complete dissolution of the amphiphile. In the second case it may be due to
an excess of organic acid. Only if traces of acetic acid were added to the
colloidal solution (e.g. by putting an acid-wetted tissue in the flask neck for
a few minutes) could a 0.5 mM solution be achieved.
Pure ethyl acetate solutions did not give reproducible results and turned
out to be unstable. Sometimes the dissolution of a particular amphiphileworked and sometimes it did not. A reason for this behavior could not be
found.
Table 22: Microdroplet density (|idd) data from phosph(on)ate SAMs on
different substrate surfaces. The self-assembly was performedwith amphiphile solutions in particular solvents (see text). The
samples were measured before and after rinsing with water.
Adsorbent Solvent
N°
(add before/after rinsing with water
Ta20, Ti02 Ti
ODPO4 (0.5 mM) 1 220/130 580/250 800/210
DDPO3 (0.5 mM) 5 350/250 1790/120 850/350
OH-DDPO4 (0.5 mM) 7 1890/90 3000/130 1380/510
NEt-DDPOi (0.5 mM) 4 840/110 1290/790 1820/690
BIPH (0.25 mM) 8 2200 / 820 2800/1250 1330/710
135
IV Results and Discussion
The additional rinsing step with pure water resulted in a generalreduction of the |idd, suggesting a higher order and homogeneity of the
adsorbed adlayer after this rinsing step. The removal of adsorbed amphiphileclusters and/or micelles is expected to reduce the average adlayer thickness.
A slight decrease of the phosph(on)ate layer thickness by about 0.1 nm in all
the combinations could be determined by AR-XPS (results not presented in
detail).
2.1.2.3 SAM Orientation and Order
Contact-angle data allow for a first estimation of orientation and order
in a SAM: Hydrophobicity of SAMs formed from monofunctional
phosph(on)ates is due to a tail-up orientation, where the hydrocarbon chains
are oriented away from the substrate and the molecules are attached by the
polar head groups. NEXAFS investigations on ODPO4 SAMs showed order
for monolayers with contact-angle values of 110° ± 2° or higher, indepen¬dent of the metal oxide substrate that was used for the self-assembly process.
For the bifunctional amphiphiles the contact-angle data give less
information. Here it is necessary to get more data from ToF-SIMS, XPS
and/or NEXAFS.
For the studies presented in this section, amphiphile solutions with a
0.5 mM concentration were prepared in the solvents listed in Table 20. The
solutions were used for self-assembly immediately after preparation.
Ta205, TiOa and Ti chips were cleaned in 2-propanol in an ultrasonic
bath followed by 30 minutes of UV cleaning. Chips were transferred into
glass containers, the amphiphile solutions were added, and the samples were
immersed for 48 hours. Samples were removed, rinsed with the pure ethylacetate, blow-dried with nitrogen and stored in a plastic container until
analysis.
ToF-SIMS (negative-ion spectra from all samples and positive-ionspectra from NE1-DDPO3 samples) and AR-XPS (at 15° and 75° with
respect to the surface) measurements were performed.
136
IV Results and Discussion
ToF-SIMS:
The most prominent secondary ion masses observed in the static SIMS
spectra are listed in Tables 23 a-f (negative ions). The mass of an entire
amphiphile combined to a metal oxide fragment could not be detected in all
the combinations. Nevertheless, a few fragments of phosph(on)ate/metal ion
and organo-phosph(on)ante/metal ion were present.
From the negative ToF-SIMS spectra showing a variety of fragments
corresponding to the classes II and III (see section IV 2.1.1.3), the bindingmodel can not be proven. Nevertheless, the strong interaction between the
phosph(on)ate and transition metal cations as Ti and Ta is clearly shown bythe presence of such fragments. Furthermore, the detected fragments have
metal-to-phosphoms ratios of 1:1, 1:2, 2:2 and 2:1, which are in agreement
with the structure suggested in Figure 25.
As in the case of ODP04/Ta205 SAMs (see section IV 2.1.1.3), the
prominent peaks of classes II (MnPmOxHy) and III (MnPm0xCyH7) supportdirect coordination ofthe phosph(on)ate group to Ta and Ti cations.
Complete tables of all detected fragments (positive and negative ions)and of all phosph(on)ate/metal oxide combinations are listed in the appendix
(App. 1-13).
The assignment of the masses to molecular ion species is discussed on
the basis of the classes of fragments:
Class I: CnHmPOxions: Species are observed starting from the pure
phosphate fragments (e.g. PCV, HP04", H2P04") through various partlyfragmented phosphoric ester species up to the molecular masses ([M-H]").As expected, reduction of the phosphate (oxidation state +V) to the
phosphonate (oxidation state +III) partly takes place.
Class II: MnPmOxHvions: Species coiTesponding to formal stoichiometrics of
Ta(^V), Ta(+TU), Ti^1 -1 and TiHI) - the most stable oxidation states of inorganictantalum and titanium compounds - tend to have higher intensities comparedto the others, a rale that is often observed in SIMS spectra of metal oxides
and hydroxides.
137
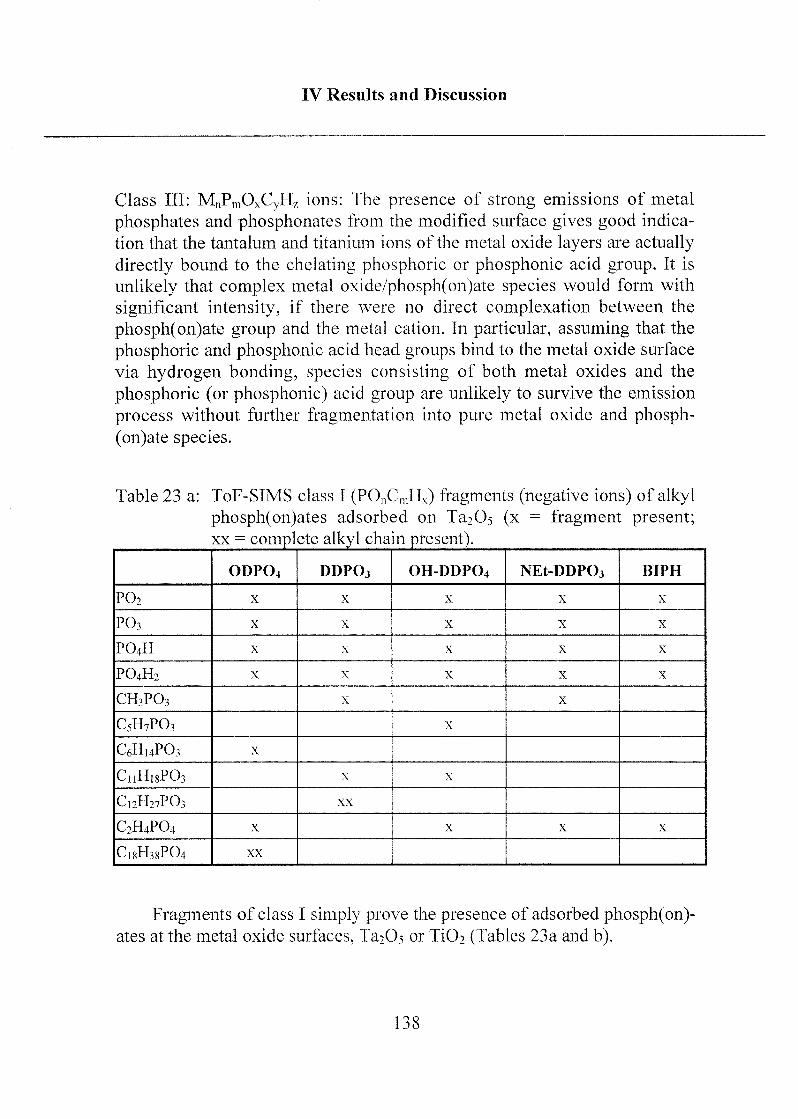
IV Results and Discussion
Class III: MnPmOxCyHy ions: The presence of strong emissions of metal
phosphates and phosphonates from the modified surface gives good indica¬
tion that the tantalum and titanium ions of the metal oxide layers are actually
directly bound to the chelating phosphoric or phosphonic acid group. It is
unlikely that complex metal oxide/phosph(on)ate species would form with
significant intensity, if there were no direct complexation between the
phosph(on)ate group and the metal cation. In particular, assuming that the
phosphoric and phosphonic acid head groups bind to the metal oxide surface
via hydrogen bonding, species consisting of both metal oxides and the
phosphoric (or phosphonic) acid group are unlikely to survive the emission
process without further fragmentation into pure metal oxide and phosph-
(on)ate species.
Table 23 a: ToF-SIMS class 1 (POnCmHv) fragments (negative ions) of alkyl
phosph(on)ates adsorbed on Ta205 (x = fragment present;xx = complete alkyl chain present).
ODP04 DDP03 OH-DDP04 NEt-DDP03 BIPH
P02 X X X X X
P03 X X X X X
P04H X X X X X
P04H2 X X X X X
CH3P03 X X
C5H7P03 X
C6H14P03 X
C11H18P03 X X
C12H27P03 XX
C2H4PO4 X X X X
C,8H38P04 XX
Fragments of class I simply prove the presence of adsorbed phosph(on)-ates at the metal oxide surfaces, TfaOs or T1O2 (Tables 23a and b).
138

IV Results and Discussion
Table 23 b: ToF-STMS class I (POnCmHx) fragments (negative ions) of alkylphosph(on)ates adsorbed on TiOi (x = fragment present;xx = complete alkyl chain present).
ODP04 DDPOa OH-ÜDP04 NEt-DDP03 BIPH
PO X X X X X
P02 X X X X X
P02H X X X X
P03 X X X X X
P03H X X X X
P04H X X X X
P04H2 X X X X
PO4NII2 X
CH2PO X X X X
CH3NC12H18PO X
C9H14P02 X
C12H26PO2 XX
C2H4PO3 X X X
C2H7P03 X X
C3H5PO3 X X
C5H10PO3 X X
C6H12P03 X X
C12H27PO3 XX X
NC12H28PO3 X
CH3NC2H27PO3 X
C2H5NC12H25P03 XX
CH3PO4 X X
C6H,4P04 X X
C12H11PO4 XX
C8H38PO4 XX
C2H5NC12H25P04 XX
139
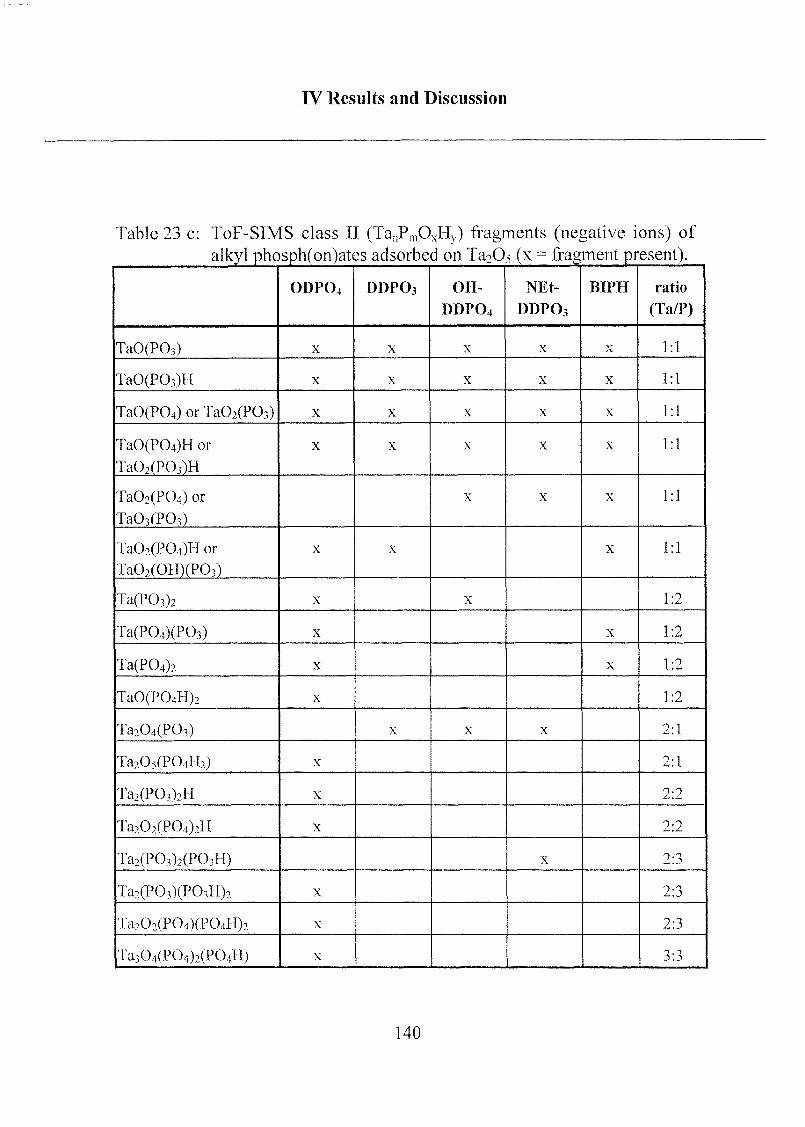
IV Results and Discussion
Table 23 c: ToF-SlMS class IT (Ta„PmOxHy) fragments (negative ions) of
alkyl phosph(on)ates adsorbed on Ta2Q5 (x = fragment present).
ODP04 DDPOa OH-
DDP04
NEt-
DDPO3
BIPH ratio
(Ta/P)
TaO(P03) X X X X X 1:1
TaO(P03)H X X X X X 1:1
TaO(P04) or Ta02(P03) X X X X X 1:1
TaO(P04)H or
Ta02(P03)H
X X X X * 1:1
Ta02(P04) or
Ta03(P03)
X X X 1:1
Ta02(P04)H or
Ta02(OH)(P03)
X X X 1:1
Ta(P03)2 X X 1:2
Ta(P04)(P03) X X 1:2
Ta(P04)2 X X 1:2
TaO(P04H)2 X 1:2
Ta204(P03) X X X 2:1
Ta205(P04H2) X 2:1
Ta2(P03)2H X 2:2
Ta202(P04)2H X 2:2
Ta2(P03)2(P03H) X 2:3
ïa2(P03)(P03H)2 X 2:3
Ta202(P04)(P04H)2 X 2:3
Ta304(P04)2(P04H) X 3:3
140
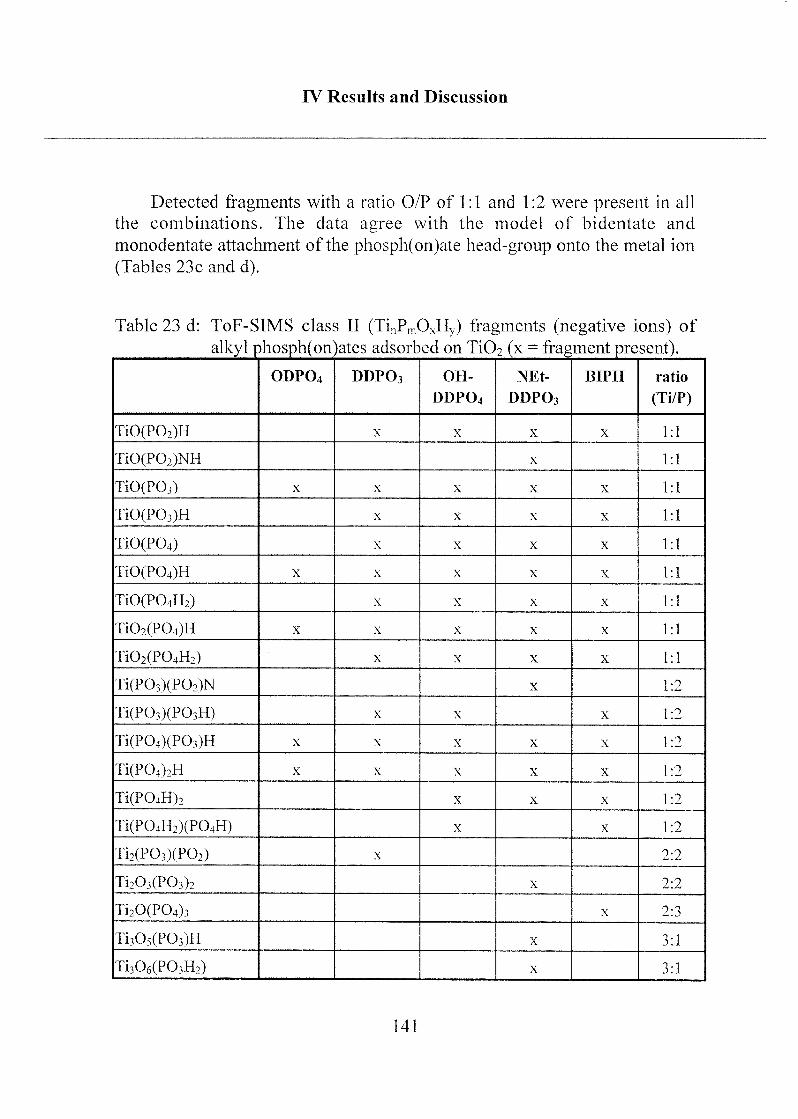
IV Results and Discussion
Detected fragments with a ratio O/P of 1:1 and 1:2 were present in all
the combinations. The data agree with the model of bidentate and
monodentate attachment of the phosph(on)ate head-group onto the metal ion
(Tables 23c and d).
Table 23 d: ToF-SIMS class II (TinPmOxHy) fragments (negative ions) of
alkyl phosph(on)ates adsorbed on TiQ2 (x = fragment present).
ODP04 DDPOJ OH-
DDP04
NEt-
DDPO3
BIPH ratio
(Ti/P)
TiO(P02)H X X X X 1:1
TiO(P02)NH X 1:1
TiO(P03) X X X X X 1:1
TiO(P03)H X X X X 1:1
TiO(P04) X X X X 1:1
TiO(P04)H X X X X X 1:1
TiO(P04H2) X X X X 1:1
Ti02(P04)H X X X X X 1:1
Ti02(P04H2) X X X X 1:1
Ti(P03)(P02)N X 1:2
Ti(P03)(P03H) X X X 1:2
Ti(P04)(P03)H X X X X X 1:2
Ti(P04)2H X X X X X 1:2
Ti(P04H)2 X X X 1:2
Ti(P04H2)(P04H) X X 1:2
Ti2(P03)(P02) X 2:2
Ti203(P03)2 X 2:2
Ti20(P04)3 X 2:3
Ti305(P03)H X 3:1
Ti306(P03H2) X 3:1
141
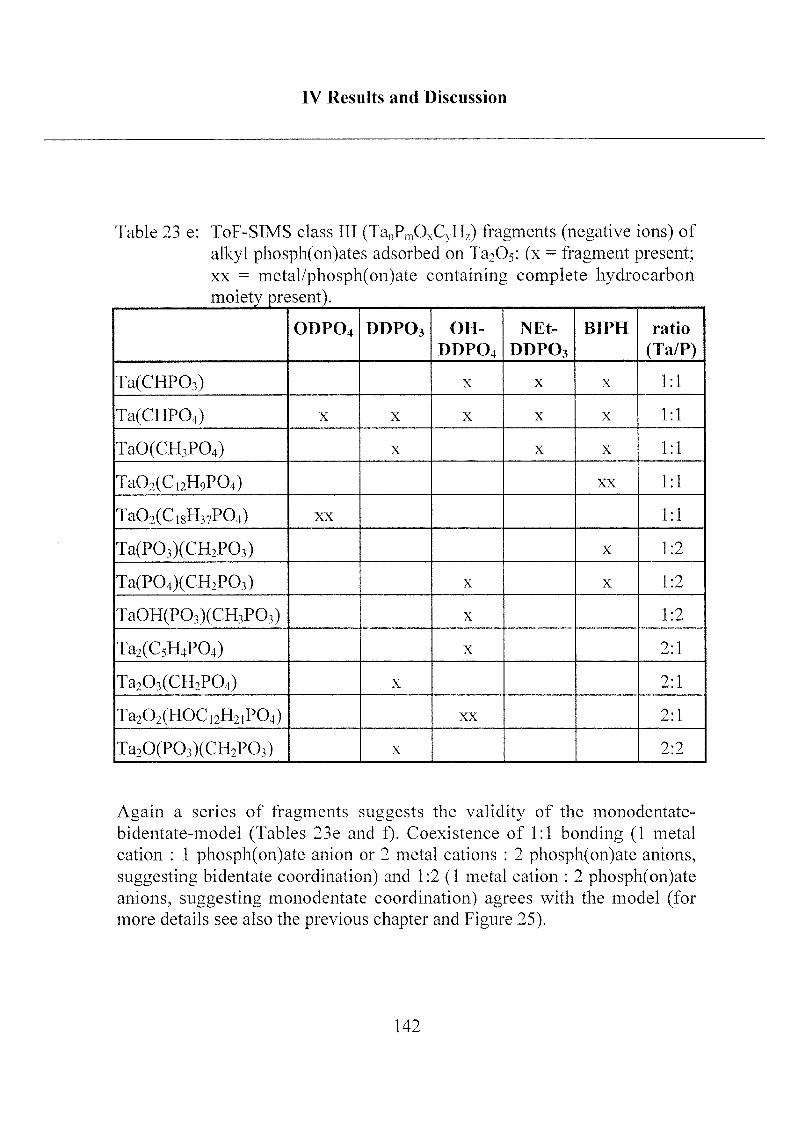
IV Results and Discussion
Table 23 e: ToF-STMS class III (TaJ^CXQH,) fragments (negative ions) of
alkyl phosph(on)ates adsorbed on Ta205: (x = fragment present;
xx = metal/phosph(on)ate containing complete hydrocarbonmoiety present).
ODPO4 DDPOa OH-
DDPO4
NEt-
DDP03
BIPH ratio
(Ta/P)
Ta(CHP03) X X X 1:1
Ta(CHP04) X X X X X 1:1
TaO(CH3P04) X X X 1:1
Ta02(Ci2H9P04) XX 1:1
Ta02(C18H37P04) XX 1:1
Ta(P03)(CH2P03) X 1:2
Ta(P04)(CH2P03) X X 1:2
TaOH(P03)(CH3P03) X 1:2
Ta2(C5H4P04) X 2:1
Ta203(CH2P04) X 2:1
Ta202(HOC,2H21P04) XX 2:1
Ta2O(PO3)(CH2PO0 X 2:2
Again a series of fragments suggests the validity of the monodentate-
bidentate-model (Tables 23e and f). Coexistence of 1:1 bonding (1 metal
cation : 1 phosph(on)ate anion or 2 metal cations : 2 phosph(on)ate anions,
suggesting bidentate coordination) and 1:2 (1 metal cation : 2 phosph(on)ateanions, suggesting monodentate coordination) agrees with the model (formore details see also the previous chapter and Figure 25).
142
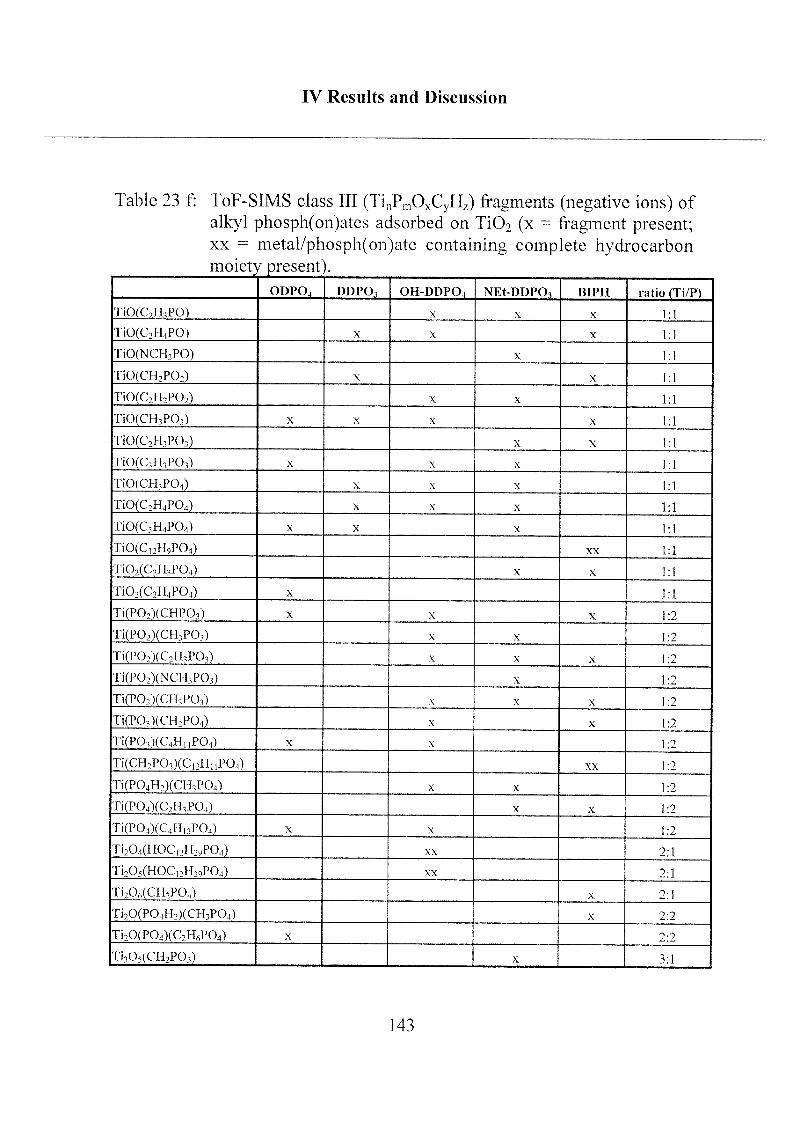
IV Results and Discussion
Table 23 f: ToF-SIMS class III (TinPmOxCyHz) fragments (negative ions) of
alkyl phosph(on)ates adsorbed on TiC>2 (x = fragment present;xx = metal/phosph(on)ate containing complete hydrocarbonmoiety present).
ODPOj DDP05 OH-DDP04 NEt-DDP03 BTPH ratio (TUP)
TiO(C2H3PO) X X X
TiO(C2H4PO) X X X
TiO(NCH3PO) X
TiO(CH2P02) X X
TiO(C2H2P02) X X
TiO(CH3P03) X X X X
TiO(C2H3P03) X X
TiO(C3H3P03) X X X
TiO(CH3P04) X X X
TiO(C2H4P04) X X X
TiO(C3H4P04) X X X
TiO(C,2H9P04) XX
Ti02(C2H3P04) X X
Ti02(C2H4P04) X
Ti(P02)(CHP03) X X X 1:2
Ti(P02)(CH3P03) X X 1:2
Ti(P02)(C2H,P03) X X X 1:2
Ti(P02)(NCH3P03) X 1:2
Ti(PO0(CH3PO3) X X X 1:2
Ti(PO,)(CH2P04) X X 1:2
Ti(P03)(C4H,,P04) X X 1:2
Ti(CH2P03)(C12H„P04) XX 1:2
Ti(P04H2)(CH3P04) X X 1:2
Ti(P04)(C2H3P04) X X 1:2
Ti(P04)(C4H13P04) X X 1:2
Ti204(HOC,2H29P04) XX 2:1
Ti20,(HOCl2HOTP04) XX 2:1
Ti206(CH2P04) X 2:1
Ti20(PO4H2)(CH3PO4) X 2:2
Ti20(P04)(C2H6P04) X 2:2
Ti305(CH2P03) X 3:1
143
IV Results and Discussion
XPS:
Angle-dependent X-ray photoelectron spectroscopy was performed on
the different self-assembled phosphates and phosphonates. In all cases, the
amphiphiles were shown to be oriented such that the polar head group was
adsorbed on the metal oxide surface.
The thickness of the organic part of the adlayer was calculated from the
attenuation of the photoelectron intensity of the Ta4r and the Ti2p- signals,(Table 24), using a two-layer model (for more information see chapter IV
2.1.1.2).
The measured SAM thicknesses of the monofunctional phosph(on)ates(DDPO4, ODPO3, ODPO4 and BIPH) on metal oxide substrates such as
Ta205 and Ti02 were found to be close to the expected value for a perfectmonolayer with an average tilt angle, t), of 33° between the molecules and
the surface normal (Figure 22). SAM thicknesses being significantly lower
than the calculated theoretical value for perfect monolayers were determined
for the bifunctional phosph(on)ates (OH-DDPO4 and NE1-DDPO3) self-
assembled on Ta205 or Ti02. The implied lower degree of coverage may be
due to the solvents used or due to the polar, end-standing functionality(hydroxy or N-ethylamino). These effects may prevent the formation of an
ordered, close-packed layer due either to steric repulsion which could
prevent molecules from reaching energetically preferred separation of ca.
0.5 nm, or to disadvantageous dipolar interactions.
In general, lower adlayer thicknesses (or lower degree of coverage)were determined for all amphiphiles adsorbed on metallic titanium (i.e.natural oxide film).
144
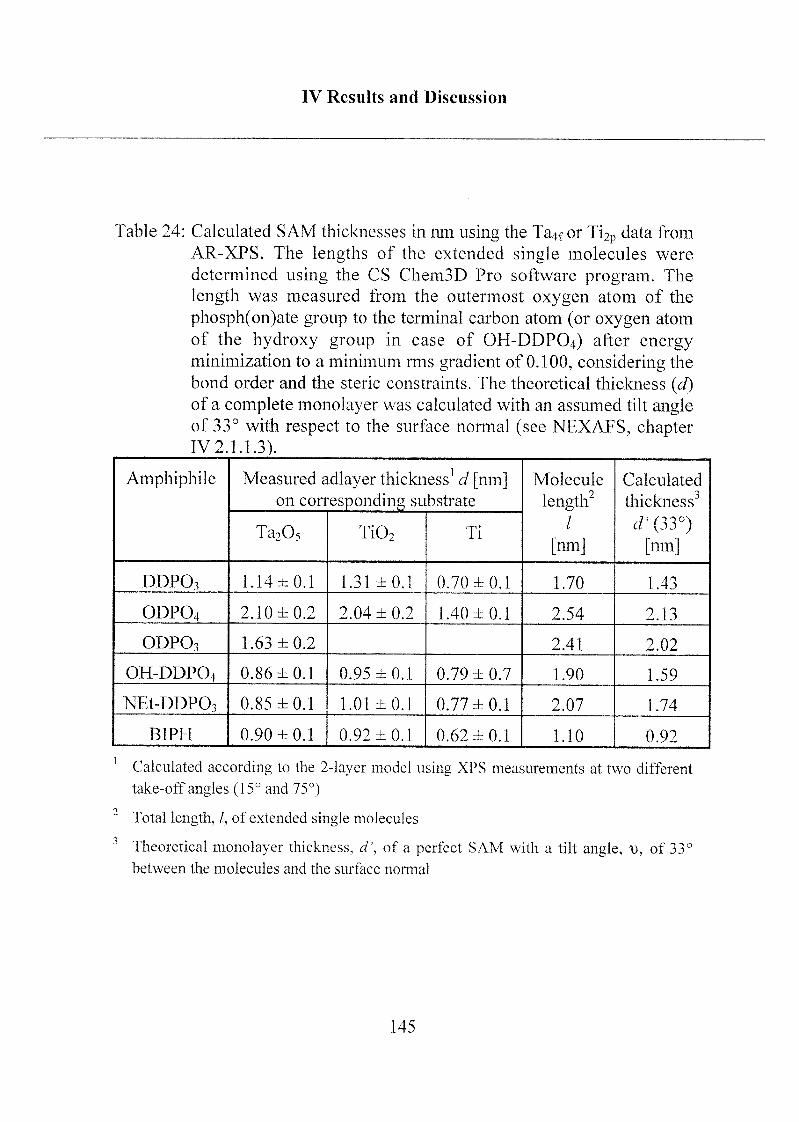
IV Results and Discussion
Table 24: Calculated SAM thicknesses in nm using the Ta4f or Ti2p data from
AR-XPS. The lengths of the extended single molecules were
determined using the CS Chem3D Pro software program. The
length was measured from the outermost oxygen atom of the
phosph(on)ate group to the terminal carbon atom (or oxygen atom
of the hydroxy group in case of OH-DDP04) after energyminimization to a minimum rms gradient of 0.100, considering the
bond order and the steric constraints. The theoretical thickness (d)of a complete monolayer was calculated with an assumed tilt angleof 33° with respect to the surface normal (see NEXAFS, chapterTV 2.1.1.3).
Amphiphile Measured adlayer thickness1 d [nm]on corresponding substrate
Molecule
length"/
[nm]
Calculated
thickness3
<f (33°)
[nm]Ta205 Ti02
r »
DDPO3 1.14 ±0.1 1.31±0.1 0.70 ±0.1 1.70 1.43
ODPO4 2.10 ±0.2 2.04 ±0.2 1.40 ±0.1 2.54 2.13
ODPO3 1.63 ±0.2 2.41 2.02
OH-DDPO4 0.86 ±0.1 0.95 ±0.1 0.79 ±0.7 1.90 1.59
NEt-DDP03 0.85 ±0.1 1.01 ±0.1 0.77 ±0.1 2.07 1.74
BIPH 0.90 ±0.1 0.92 ±0.1 0.62 ±0.1 1.10 0.92
Calculated according to the 2-layer model using XPS measurements at two different
take-off angles (15° and 75°)
2Total length, /, of extended single molecules
Theoretical monolayer thickness. d\ of a perfect SAM with a tilt angle, x>, of 33°
between the molecules and the surface normal
145
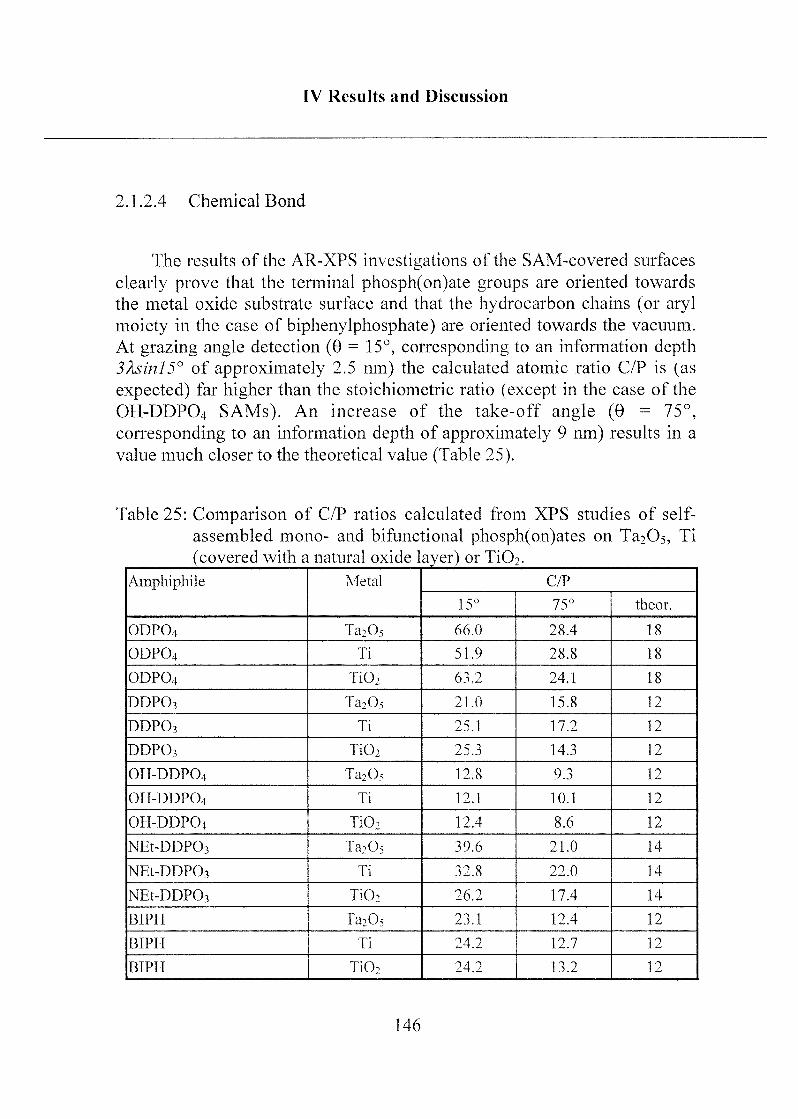
IV Results and Discussion
2.1.2.4 Chemical Bond
The results of the AR-XPS investigations of the SAM-covered surfaces
clearly prove that the terminal phosph(on)ate groups are oriented towards
the metal oxide substrate surface and that the hydrocarbon chains (or arylmoiety in the case of biphenylphosphate) are oriented towards the vacuum.
At grazing angle detection (9 = 15°, corresponding to an information depth3Àsinl5° of approximately 2.5 nm) the calculated atomic ratio C/P is (as
expected) far higher than the stoichiometric ratio (except in the case of the
OH-DDPO4 SAMs). An increase of the take-off angle (9 = 75°,
corresponding to an information depth of approximately 9 nm) results in a
value much closer to the theoretical value (Table 25).
Table 25: Comparison of C/P ratios calculated from XPS studies of self-
assembled mono- and bifunctional phosph(on)ates on Ta20s, Ti
(covered with a natural oxide layer) or TiQ2.
Araphiphile Metal C/P
15° 75° theor.
ODPO4 Ta2Os 66.0 28.4 18
ODPO4 Ti 51.9 28.8 18
ODPO4 Ti02 63.2 24.1 18
DDPO3 Ta2Os 21.0 15.8 12
DDPOi n 25.1 17.2 12
DDPO, Ti02 25.3 14.3 12
OH-DDPO4 Ta20, 12.8 9.3 12
OH-DDP04 Ti 12.1 10.1 12
OII-DDPO4 Ti02 12.4 8.6 12
NEt-DDPO^ Ta2Os 39.6 21.0 14
NEt-DDP03 n 32.8 22.0 14
NEt-DDPOi Ti02 26.2 17.4 14
BIPH Ta2Os 23.1 12.4 12
BIPH Ti 24.2 12.7 12
BIPH Ti02 24.2 13.2 12
146
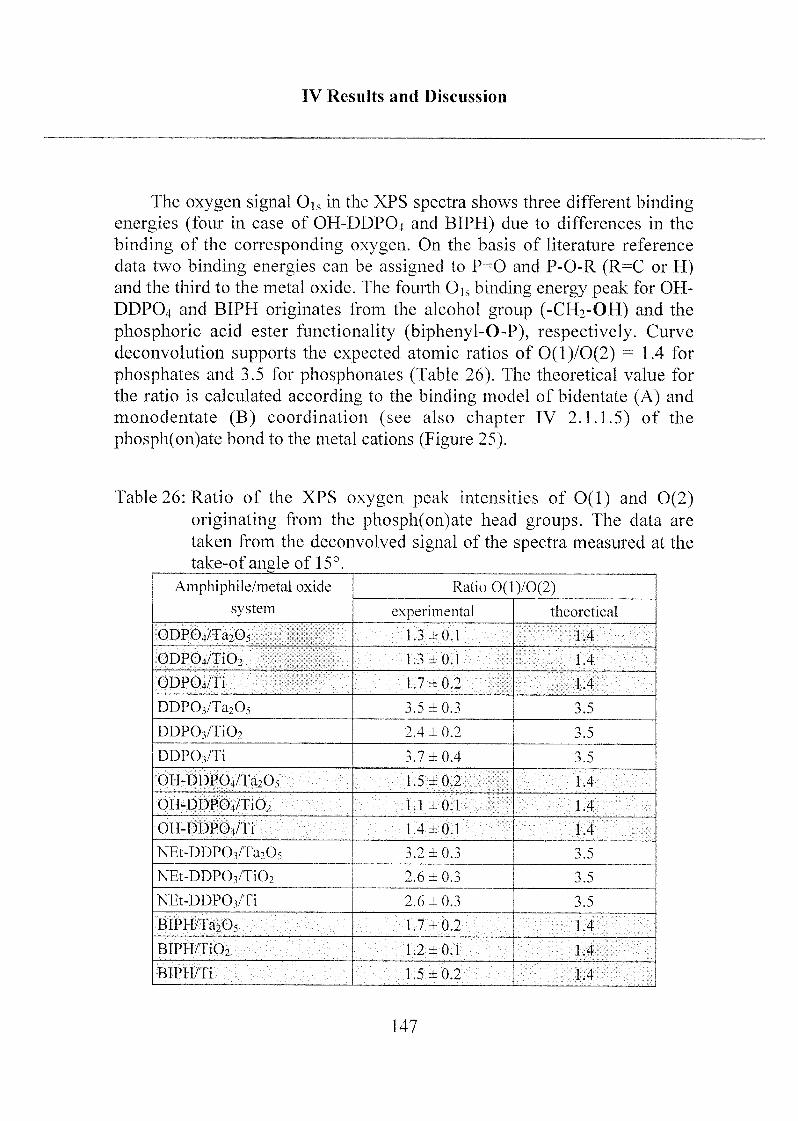
IV Results and Discussion
The oxygen signal Ois in the XPS spectra shows three different bindingenergies (four in case of OH-DDPO4 and BIPH) due to differences in the
binding of the corresponding oxygen. On the basis of literature reference
data two binding energies can be assigned to P=0 and P-O-R (R=C or H)and the third to the metal oxide. The fourth 0Js binding energy peak for OH-
DDPO4 and BIPH originates from the alcohol group (-CH2-OH) and the
phosphoric acid ester functionality (biphenyl-O-P), respectively. Curve
deconvolution supports the expected atomic ratios of 0(l)/0(2) - 1.4 for
phosphates and 3.5 for phosphonates (Table 26). The theoretical value for
the ratio is calculated according to the binding model of bidentate (A) and
monodentate (B) coordination (see also chapter IV 2.1.1.5) of the
phosph(on)ate bond to the metal cations (Figure 25).
Table 26: Ratio of the XPS oxygen peak intensities of 0(1) and 0(2)
originating from the phosph(on)ate head groups. The data are
taken from the deconvolved signal of the spectra measured at the
take-of angle of 15°.
Amphiphile/metal oxide
system
Ratio 0(l)/0(2)
experimental theoretical
ODP04/Ta205 1.3 ± 0.1 1.4
ODP04/Ti02 1.3 ±0-1 1.4
ODPO4/IÏ 1.7 ±0.2 1.4
DDP03/Ta205 3.5 ±0.3 3.5
DDP03/Ti02 2.4 ±0.2 3.5
DDPO3/TI 3.7 ±0.4 3.5
OH-DDP04/Ta205 1.5 ±0.2 1.4
OH-DDP04/Ti02 1.1 ±0.1 1.4
OH-DDPO/Ti 1.4±0.1 1.4
NEt-DDP03/Ta20, 3.2 ±0.3 3.5
NEt-DDP03/Ti02 2.6 ± 0.3 3.5
NEt-DDP03/Ti 2.6 ± 0.3 3.5
BIPH/Ta205 1.7 ±0.2 1.4
BIPH/Ti02 1.2 ±0.1 1.4
BIPH/Ti 1.5 ±0.2 1.4
147
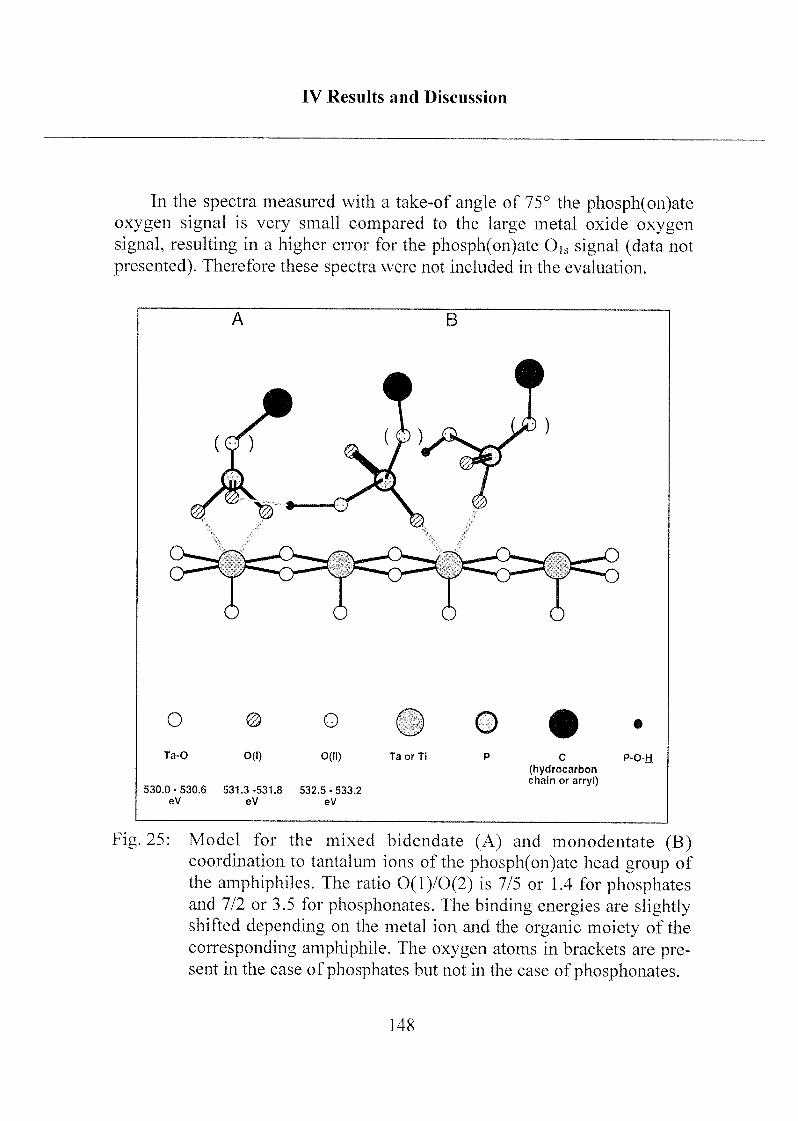
IV Results and Discussion
In the spectra measured with a take-of angle of 75° the phosph(on)atcoxygen signal is very small compared to the large metal oxide oxygen
signal, resulting in a higher error for the phosph(on)ate Ois signal (data not
presented). Therefore these spectra were not included in the evaluation.
A B
O
Ta-Q O(0
©
0(11)
O O
Ta or Ti
530.0 - 530.6 531.3 -531.8 532.5 - 533.2
eV eV eV
C P-O-H
(hydrocarbonchain or arryl)
Fig. 25: Model for the mixed bidendate (A) and monodentate (B)coordination to tantalum ions of the phosph(on)ate head group of
the amphiphiles. The ratio 0(l)/0(2) is 7/5 or 1.4 for phosphatesand 7/2 or 3.5 for phosphonates. The binding energies are slightlyshifted depending on the metal ion and the organic moiety of the
corresponding amphiphile. The oxygen atoms in brackets are pre¬sent in the case of phosphates but not in the case of phosphonates.
148
IV Results and Discussion
The experimental ratio of the two different oxygen atoms 0(l)/0(2)shows a large difference between the phosphates and the phosphonates. The
values are close to the model of both mono- and bidentate phosph(on)atecoordination with a theoretical value of 1.4 and 3.5 for phosphates and
phosphonates, respectively.
Hydroxide groups or water bound to the metal oxide surface may be
present even after the self-assembly process. They may affect the ratio of
intensities at the binding energy positions of 532 and 533 eV. However, we
do not believe that this would completely alter the conclusions presentedabove.
2.1.2.5 Summary
The interpretation of the binding energies of the deconvolved 0ls
spectra allows further insight into binding aspects of the phosphate and
phosphonate head groups at the surface.
NEXAFS studies [Hofe,2000b] suggest a homogeneous monolayer in
terms of order only for the long-chain alkyl phosphate ODPO4 self-
assembled on Ta205 or TiO? (HDPO4 and TDPO4 not measured). The
hydrocarbon chain of DDPO3 seems to be at or below the critical chain-
length limit to form ordered SAMs from solutions of the free acid in organicsolvents. Terminal functionalities such as ethylamino or hydroxy groups as
well as biphenyl seem to prevent the formation of ordered SAM.
Nevertheless, comparison of the amphiphiles concerning differences in chain
lengths, terminal functionalities or head groups (phosphate or phosphonate)is difficult since small variations (e.g. purity of the substances, pH of the
solutions or properties of the used solvents) may influence the SAM quality.
The calculation of the adlayer thicknesses for samples that have been
immersed for 48 hours agree well with the findings of the previouslypublished NEXAFS study [Brov,1999] of ODPO4. This long-chain alkylphosphate has been shown to form ordered structures, similar to the
149

IV Results and Discussion
thiol/gold system, with a tilted orientation of the unfolded hydrocarbon chain
and a mean tilt angle, 1), of 30 - 35° relative to the surface normal. This tilt
angle agrees with the theoretical value for maximal monolayer adsorptionwith dense arrangement of phosph(on)ate groups at the substrate surface and
an optimal Van der Waals distance between the unfolded hydrocarbonchains. The experimentally determined (perpendicular) adlayer thickness of
2.1 ± 0.1 ran agrees well with the theoretical value of /•cost» (/ = 2.5 nm)and is also strong evidence for the formation of a densely packed monolayeras opposed to submono- and/or multilayer formation. For o-functionalized
amphiphiles OH-DDPO4, NEt-DDP03 and for the aryl phosphate BIPH such
an order could not be reached on tantalum oxide or titanium oxide by the
self-assembly process, as mentioned above. Although a sufficiently highadlayer thickness could be calculated for BIPH/Ta205, BIPH/Ti02 and
DDPCVTiOi, no large areas of uniform order (or tilt angle orientation) could
be measured with NEXAFS for these combinations [Hofe,2000b]. The Van
der Waals interaction between the hydrocarbon chains is believed to be
needed for the stability of the SAM order. The relatively short hydrocarbonchain length and the electrostatic repulsion between the terminal ethylaminogroups (R-NH2+-CH2CH3) are believed to be the reasons for the missingorder in the NEt-DDP03 SAMs. In the case of OH-DDPO4, hydrogenbonding between the hydroxy groups could result in an additional
stabilization of SAMs, but in the case of this amphiphile as well as in the
case of NEt-DDP03 steric hindrance among the solvated terminal groups
may occur. An overall impression is that all tested amphiphiles adsorb in an
oriented way (phosph(on)ate group oriented towards the metal oxide
surface), with the SAMs formed from alkyl phosphates being more highlyordered than those formed from alkyl phosphonates. In all cases that did not
show any order of their SAMs it is possible that the optimum solvent has not
yet been found. SAMs formed from aqueous solution of the ammonium salts
of DDPO4 and OH-DDPO4 do have the potential to form ordered
monolayers. NEXAFS and XPS studies of such SAMs are in progress and
will be published [Tosa,2000].
All of the experimental results obtained so far are compatible with the
model for the complex binding of the phosph(on)ate head group to the metal
ion based on both mono- and bidentate binding.
150
TV Results and Discussion
2.1.2.6 Toxicology
Since surface coating with phosph(on)ate amphiphiles may be
interesting for corrosion protection and/or adhesion promotion for lacquersin the metal industry as well as for coating of implants to improvebiocompatibility, it is essential that there is no cell toxicity. Even if the
surface coating would be used for high tech materials without any contact to
living cells, toxic substances are always more difficult to handle.
Toxicity of these amphiphiles is inherently probable because
phosphoric acid esters are a prominent group of nerve poisons, blocking the
Cholinesterase reaction in nerve synapses.
0.05 mM solutions of five different phosph(on)ates were prepared(DDPO3, OH-DDPO4, NEt-DDP03 and BIPH in methanol/water/ethanol
10:10:1 and ODPO4 in ethanol/water 1:1), and SAMs were formed on TiCV
coated glass chips according to the following protocol:
Cutting of chips : Four samples of Ti02 coated glass were cut into a
13 x 51 mm format for each amphiphile
Cleaning protocol : Sonication for 15 minutes in ultra-pure water
(removal of inorganic impurities and glass powder).
Sonication for 15 minutes in 2-propanol (removal of
polar organic impurities)
Sonication for 15 minutes in n-heptane (removal of
non-polar organic impurities)
Sonication for 15 minutes in ether (removal of
possibly adsorbed n-heptane)
Blow-drying in nitrogen gas stream (evaporation of
possibly adsorbed ether)
151
IV Results and Discussion
Self-assembly
Rinsing
Storage in ultra-pure water for 3 days (desorption of
any alkali-metal ions from the substrate)
Sonication for 15 minutes in methanol/water (1:1)(preconditioning of the immersion container)
UV cleaning for 30 minutes (activation of the
substrate)
Subsequent transfer of the chips into the immerison
container, addition of one of the 0.05 mM amphiphilesolutions, and immersion of chips for 48 hours
Removal of the chips and rinsing with ca. 5 ml of
methanol/water/ethanol (10:10:1) each
The samples were sent to a toxicology lab (Dr. Hendrich,Universitätsklinik Würzburg). The chips were eluted for 72 hours accordingto the DIN norm procedure. The extracts of three to four chips of each
phosph(on)ate SAM were investigated by the DIN/ISO 10993 technique:cytometer determination of the number of cells after incubation in the
extracts and performance of a proliferation assay (WST-1 corresponding to a
XTT-test). m the WST-1-test the extinction was recorded as a function of
substrate turnover. Both tests were examined for the BALB/3T3 fibroblast
clone A31 and for hFOB osteoblast cells.
None of the extracts (performed on each phosph(on)ate/metal oxide
combination) that were tested with the two toxicology test systems showed
any cell-toxic reaction.
152
IV Results and Discussion
2.1.3 Ammonium Salts of Alkyl Phosphates
Metal oxide surfaces have been coated by self-assembled monolayers(SAMs) of dodecyl phosphate (DDPO4) and 12-hydroxy dodecyl phosphate(OH-DDPO4), by means of adsorption of the alkyl phosphate ammonium
salts from aqueous solution. The SAM formation of DDPO4 has been
successfully demonstrated on anodized aluminum (A1203) as well as on
smooth thin films of tantalum oxide (Ta205), niobium oxide (Nb205),zirconium oxide (ZrC>2), iron oxide (Fe203), titanium oxide (Ti02) and
titanium silicon oxide (Tio.4Sio.0O2) deposited on glass substrates, resulting in
highly hydrophobic surfaces with water-contact angles > 110°. SAM
formation does not occur on silica surfaces under the same conditions. The
formation of SAMs based on the adsorption of hydroxy-terminated alkylphosphates (OH-DDPO4) onto Ta205 and Nb2Os has been studied. DDPO4
and OH-DDPO4 were co-deposited onto Ta205 from aqueous solutions of
their ammonium salts at different concentration ratios. It is shown that the
water-contact-angle can be precisely controlled within the range of 110° to
55° by adjusting the molar ratio of the two different molecules in the SAM.
The SAMs were characterized by water-contact angle (wettability),microdroplet density (condensation to judge homogeneity and order) and X-
ray photoelectron spectroscopy (orientation and adlayer thickness).
The use of organic solvents in the deposition process of self-assembled
monolayers has three main disadvantages: 1) in biomaterial applications,organic solvent molecules may be trapped within the adlayer, reducing the
biocompatibility of the surface; 2) for the formation of mixed adlayersystems, it can be difficult to find an organic solvent that is suitable for both
adlayer components; and 3) on an industrial scale, organic solvents are
increasingly falling into disfavor due to both air-pollution and water-
pollution issues. We demonstrate in this chapter that both pure and mixed
alkyl phosphates with different terminal functionalities can be depositedfrom aqueous solution by converting the free (water-insoluble) alkylphosphoric acids into the corresponding water-soluble salts. Mixed SAMs
on metal oxide surfaces are of particular interest to the biosensor and
biomaterial communities, since they allow surface properties such as
153
IV Results and Discussion
wettability, polarity, surface charge, etc. to be tailored in a precise manner.
Such surface tailoring may prove to be highly relevant for controlling the
interaction between the SAM-modified surface and biological systems such
as proteins, antibodies and cells.
2.1.3.1 Applied Methods
Microdroplet density (jidd) and contact-angle:
The microdroplet density (p.dd) was measured as described in chapterIII 2.2.4. The (add of the SAM-coated surfaces was measured before and
after a rinsing step with water. The average over 5 to 10 different regions of
the surface was determined. The data were used to determine the SAM
homogeneity in a lateral micrometer dimension. Even if the hydrophobicityis not indicative of a high order of the SAMs formed from bifunctional
amphiphiles, the contact-angle results may give some interesting information
in combination with the fidd data.
X-ray photoelectron spectroscopy (XPS) analysis:
Angle-resolved XPS (AR-XPS) measurements were conducted at
different take-off angles (11.5° to 75° with respect to the surface plane) to
get depth-dependent information.
154
IV Results and Discussion
2.1.3,2 Sample Preparation
DDP04(NH4)2 and OH-DDP04(NH4)2 were precipitated as described in
chapter III 1.2.1.
Preparation of 0.5 mM amphiphile solutions:
a) 15.0 mg of DDP04(NH4)2 were dissolved in 5 ml of high-purity water byheating up to ca. 50°C and adjusted to a volume of 100 ml with water.
b) 15.8 mg of OH-DDP04(NH4)2 were dissolved in 5 ml of high-puritywater by heating up to ca. 80°C. The solution was cooled to room
temperature, filtered through a 0.22 jim filter (MILLEX-GV,MILLIPORE, Bedford, MA) and adjusted to a volume of 100 ml.
The alkyl phosphate and hydroxy-alkyl phosphate solutions, a) and b),were mixed in different ratios from 0 to 100 vol.-% with respect to the
amount of OH-DDP04(NH4)2, in steps of 10% leading to 11 different
solutions at a constant total phosphate concentration of 0.5 mM.
The substrates were sonicated in high-purity water for 15 minutes
followed by a second sonication in 2-propanol for another 15 minutes. The
chips were removed from the cleaning solvent, blow-dried with nitrogen and
transferred to an oxygen plasma. After 3 minutes of oxygen-plasmacleaning, the chips were transferred to 5-ml glass vials, and amphiphilesolution was subsequently added. The chips were immersed for 48 hours in
the solution for self-assembly, removed, rinsed with 10 ml of high-puritywater each and blow-dried with nitrogen.
155
IV Results and Discussion
2.1.3.3 Investigation of Surface Properties
DDPO4 on different metal oxides:
Self-assembled monolayers of dodecyl phosphate were produced on
AI2O3, Ta205, Nb205, Zr02, Fe203, Ti02, Tio.4Sio.0O2 and Si02 by immersion
in 0.5 mM DDP04(NH4)2 as described in the previous section.
Contact angle:
Advancing water-contact angles (CA) were measured immediatelyfollowing sample preparation (Table 27). The results show that highly
hydrophobic SAMs form on all the metal oxide surfaces used in this work,with the exception of silica and Tio.4Sio.6O2. The contact-angle values of
> 110° are typical for well-defined alkyl phosphate SAMs [Brov,1999]. The
isoelectric points (IEP) of the different bare metal oxides, which vary from
2.7 - 3.0 for Ta205 to 7.0 - 8.6 for Fe203, do not seem to be an importantparameter for SAM formation with this system (Table 27). On Si02, the
contact angle remains in the same range as it was prior to immersion in the
amphiphile solution. This suggests that DDPO4 does not adsorb on Si02with this approach.
The Ti0.4Si0.6O2-coated glass chips consist of a heterogeneous (two-phase) structure of Ti02 and Si02 nanoparticles at the substrate surface.
Tio.4Sioè02 samples immersed in the amphiphile solution show reduced
wettability. The contact-angle value of 64° suggests the formation of an
incomplete alkyl phosphate monolayer. This is consistent with the
observation that DDPO4 self-assembles onto Ti02 but does not adsorb on
Si02 from an aqueous solution of the amphiphile ammonium salt.
156
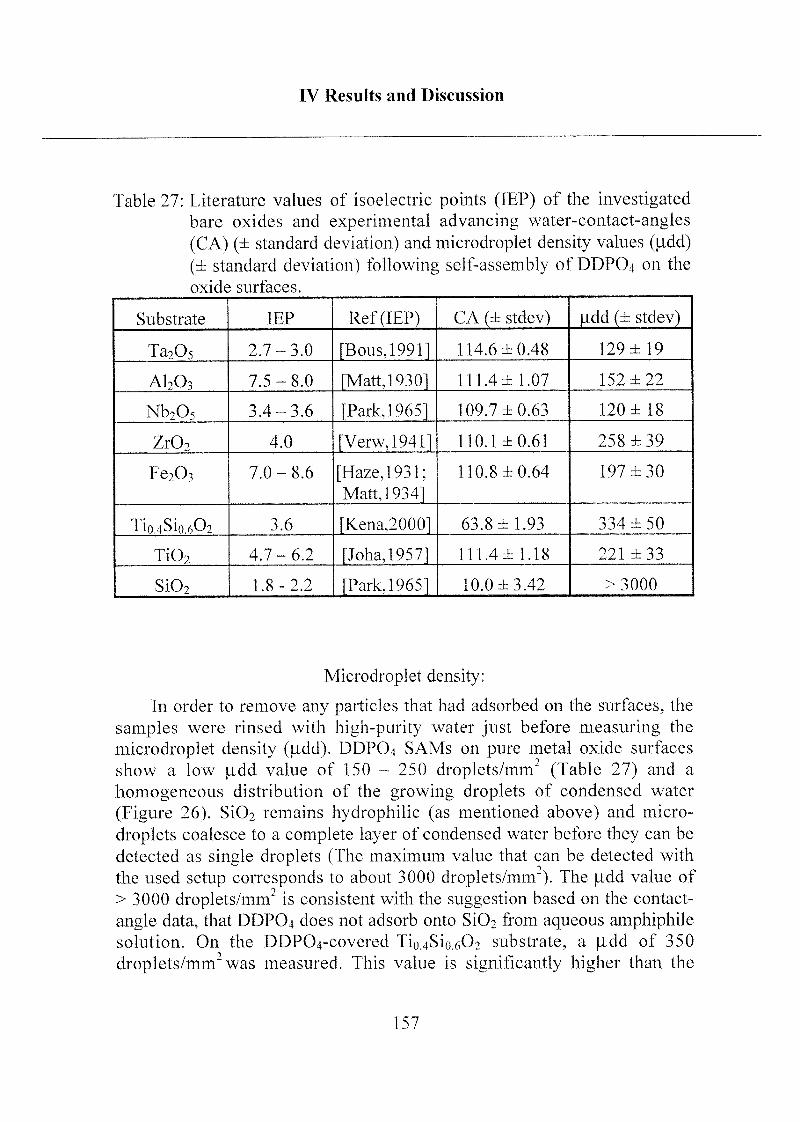
IV Results and Discussion
Table 27: Literature values of isoelectric points (IEP) of the investigatedbare oxides and experimental advancing water-contact-angles
(CA) (± standard deviation) and microdroplet density values ((add)
(± standard deviation) following self-assembly of DDPO4 on the
oxide surfaces.
Substrate IEP Ref(IEP) CA (± stdev) (idd (± stdev)
Ta205 2.7-3.0 [Bous,19911 114.6 ±0.48 129 ±19
A120, 7.5-8.0 [Matt, 19301 111.4± 1.07 152 ±22
Nb20, 3.4-3.6 [Park, 1965] 109.7 ±0.63 120 ± 18
Zr02 4.0 [Verw,19411 110.1 ±0.61 258 ±39
Fe2C>3 7.0-8.6 [Haze, 1931;Matt, 19341
110.8 ±0.64 197 ±30
Ti0 4Sio e02 3.6 [Kena,20001 63.8 ±1.93 334 ±50
Ti02 4.7-6.2 [Joha, 19571 111.4=4= 1.18 221 ± 33
Si02 1.8-2.2 [Park, 19651 10.0 ±3.42 >3000
Microdroplet density:
In order to remove any particles that had adsorbed on the surfaces, the
samples were rinsed with high-purity water just before measuring the
microdroplet density (jidd). DDPO4 SAMs on pure metal oxide surfaces
show a low |idd value of 150 - 250 droplets/mm2 (Table 27) and a
homogeneous distribution of the growing droplets of condensed water
(Figure 26). Si02 remains hydrophilic (as mentioned above) and micro-
droplets coalesce to a complete layer of condensed water before they can be
detected as single droplets (The maximum value that can be detected with
the used setup corresponds to about 3000 droplets/mm"). The jadd value of
> 3000 droplets/mm" is consistent with the suggestion based on the contact-
angle data, that DDPO4 does not adsorb onto Si02 from aqueous amphiphilesolution. On the DDP04-covered Ti04Sio602 substrate, a Ltdd of 350
droplets/mm"" was measured. This value is significantly higher than the
157
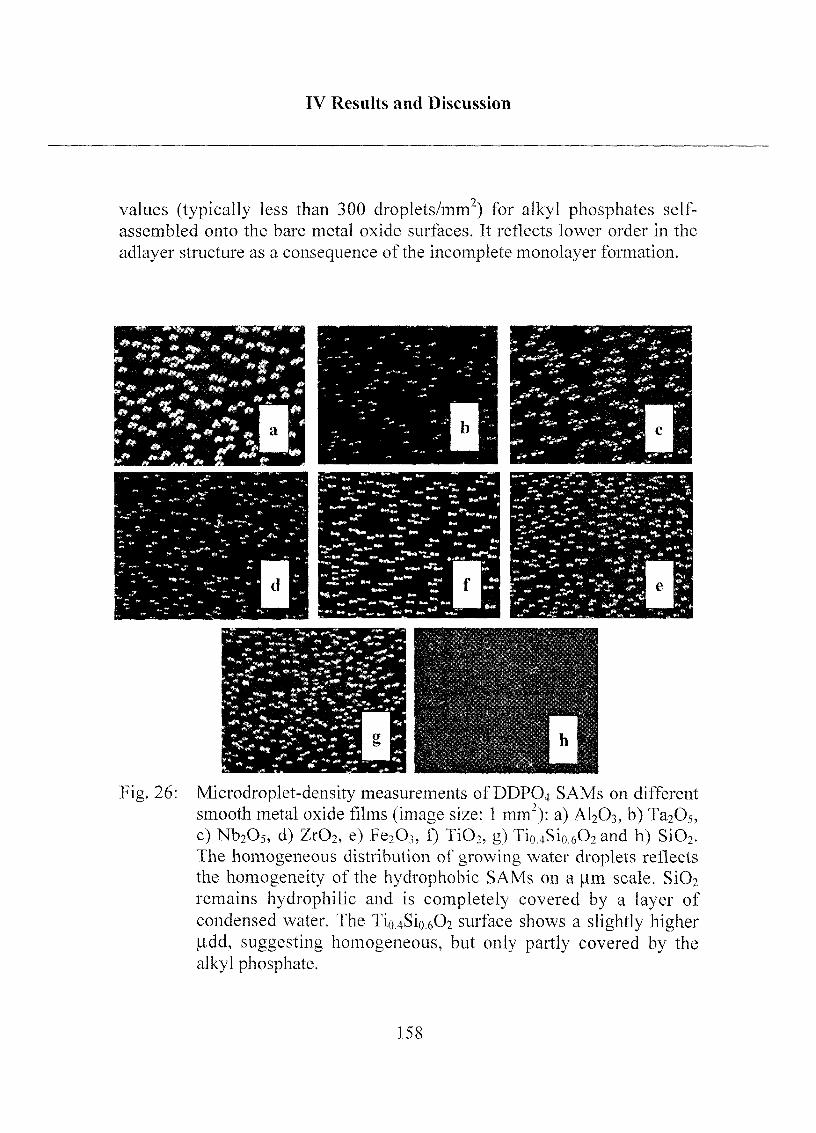
IV Results and Discussion
values (typically less than 300 droplets/mm ) for alkyl phosphates self-
assembled onto the bare metal oxide surfaces. It reflects lower order in the
adlayer structure as a consequence of the incomplete monolayer formation.
Fig. 26: Microdroplet-density measurements of DDP04 SAMs on different
smooth metal oxide films (image size: 1 mm2): a) AI2O3, b) Ta205,
c) Nb2Os, d) Zr02, e) Fe20,, f) Ti02, g) Ti0 4Si0 602 and h) Si02.The homogeneous distribution of growing water droplets reflects
the homogeneity of the hydrophobic SAMs on a Jim scale. Si02remains hydrophilic and is completely covered by a layer of
condensed water. The Ti0 4Si0 602 surface shows a slightly higher\xàà, suggesting homogeneous, but only partly covered by the
alkyl phosphate.
158
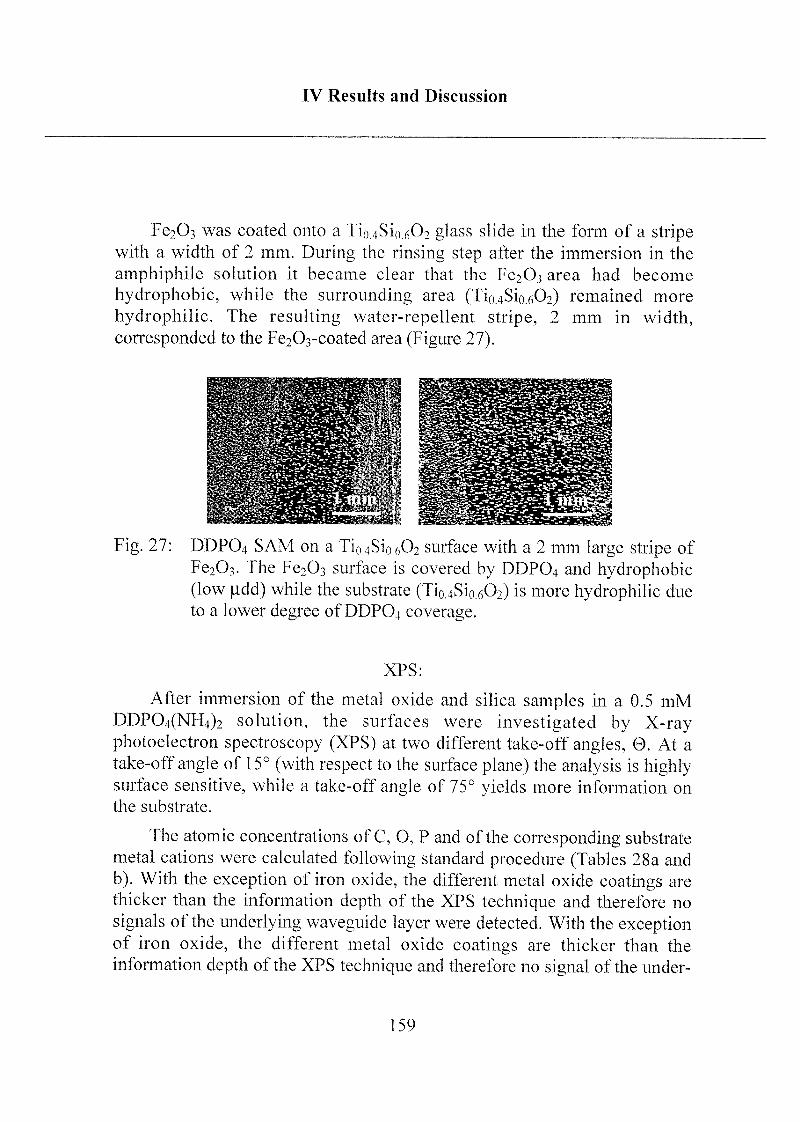
TV Results and Discussion
Fe203 was coated onto a Tio.4Sio.6O2 glass slide in the form of a stripewith a width of 2 mm. During the rinsing step after the immersion in the
amphiphile solution it became clear that the Fe203 area had become
hydrophobic, while the surrounding area (Tio.4Sio.6O2) remained more
hydrophilic. The resulting water-repellent stripe, 2 mm in width,
corresponded to the Fe203-coated area (Figure 27).
Fig. 27: DDPO4 SAM on a Tio.4Sio.6O2 surface with a 2 mm large stripe of
Fe203. The Fe203 surface is covered by DDPO4 and hydrophobic(low (J.dd) while the substrate (Tio.4Sio.0O2) is more hydrophilic due
to a lower degree ofDDPO4 coverage.
XPS:
After immersion of the metal oxide and silica samples in a 0.5 mM
DDP04(NH4)2 solution, the surfaces were investigated by X-rayphotoelectron spectroscopy (XPS) at two different take-off angles, 0. At a
take-off angle of 15° (with respect to the surface plane) the analysis is highlysurface sensitive, while a take-off angle of 75° yields more information on
the substrate.
The atomic concentrations of C, O, P and of the corresponding substrate
metal cations were calculated following standard procedure (Tables 28a and
b). With the exception of iron oxide, the different metal oxide coatings are
thicker than the information depth of the XPS technique and therefore no
signals of the underlying waveguide layer were detected. With the exceptionof iron oxide, the different metal oxide coatings are thicker than the
information depth of the XPS technique and therefore no signal of the under-
159
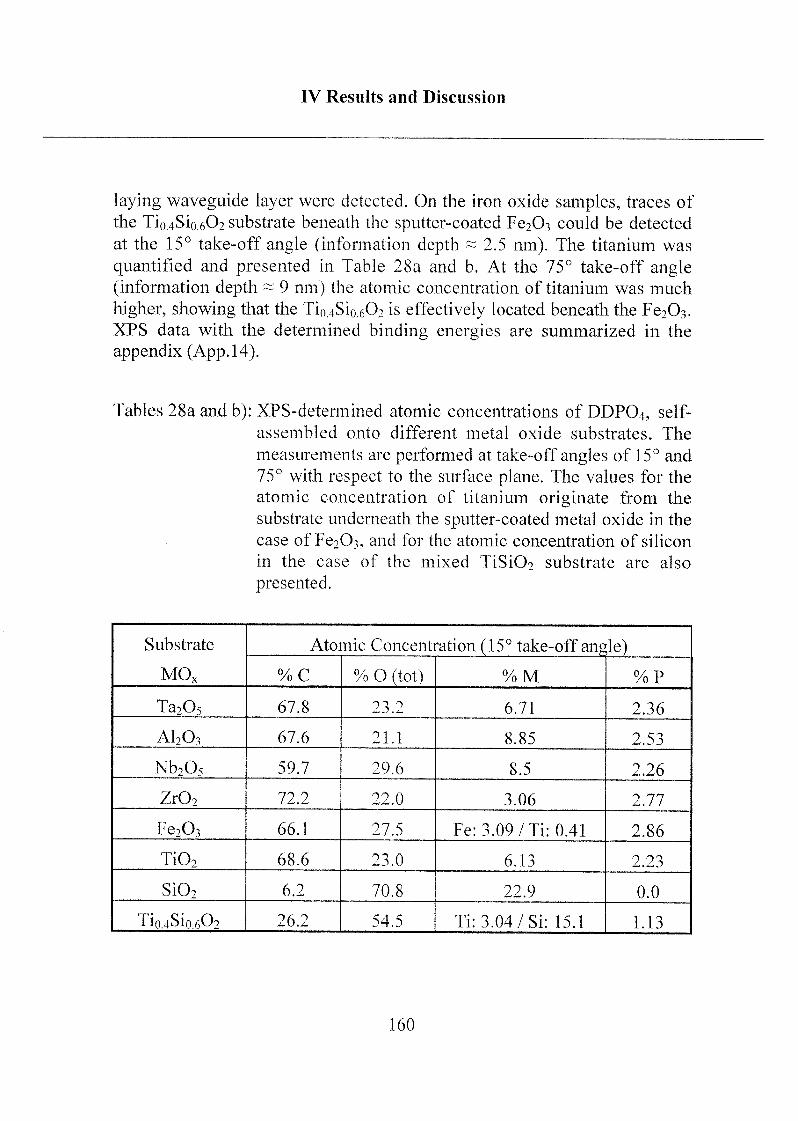
IV Results and Discussion
laying waveguide layer were detected. On the iron oxide samples, traces of
the Tio.4Sio.6O2 substrate beneath the sputter-coated Fe203 could be detected
at the 15° take-off angle (information depth ~ 2.5 nm). The titanium was
quantified and presented in Table 28a and b. At the 75° take-off angle(information depth ~ 9 nm) the atomic concentration of titanium was much
higher, showing that the Tio.4Sio.6O2 is effectively located beneath the Fe203.XPS data with the determined binding energies are summarized in the
appendix (App. 14).
Tables 28a and b): XPS-determined atomic concentrations of DDP04, self-
assembled onto different metal oxide substrates. The
measurements are performed at take-off angles of 15° and
75° with respect to the surface plane. The values for the
atomic concentration of titanium originate from the
substrate underneath the sputter-coated metal oxide in the
case of Fe203, and for the atomic concentration of silicon
in the case of the mixed TiSi02 substrate are also
presented.
Substrate
M0X
Atomic Concentration (15° take-off angle)
%C % 0 (tot) %M %P
Ta205 67.8 23.2 6.71 2.36
AI2O3 67.6 21.1 8.85 2.53
Nb205 59.7 29.6 8.5 2.26
Zr02 72.2 22.0 3.06 2.77
Fe203 66.1 27.5 Fe: 3.09/Ti: 0.41 2.06
Ti02 68.6 23.0 6.13 2.23
Si02 6.2 70.8 22.9 0.0
Tio.4Sio.6O2 26.2 54.5 Ti: 3.04/Si: 15.1 1.13
160
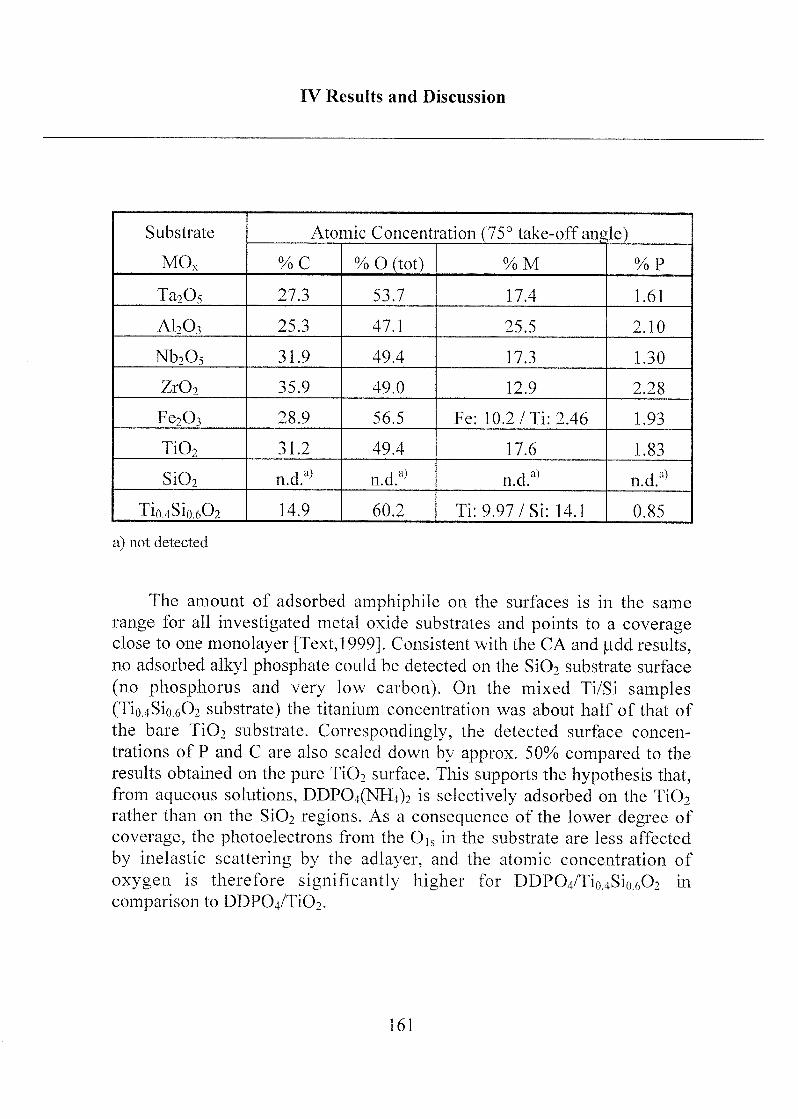
IV Results and Discussion
Substrate
MOx
Atomic Concentration (75° take-off angle)
%C % 0 (tot) %M %P
Ta205 27.3 53.7 17.4 1.61
A1203 25.3 47.1 25.5 2.10
Nb205 31.9 49.4 17.3 1.30
Zr02 35.9 49.0 12.9 2.28
Fe203 28.9 56.5 Fe: 10.2 /Ti: 2.46 1.93
Ti02 31.2 49.4 17.6 1.83
Si02 n.d.a) n.d.a) n.d.a) n.d.a)
Tio 4Sio 6Û2 14.9 60.2 Ti: 9.97/Si: 14.1 0.85
a) not detected
The amount of adsorbed amphiphile on the surfaces is in the same
range for all investigated metal oxide substrates and points to a coverageclose to one monolayer [Text, 1999]. Consistent with the CA and fidd results,no adsorbed alkyl phosphate could be detected on the Si02 substrate surface
(no phosphorus and very low carbon). On the mixed Ti/Si samples(Tio.4Sio.0O2 substrate) the titanium concentration was about half of that of
the bare Ti02 substrate. Correspondingly, the detected surface concen¬
trations of P and C are also scaled down by approx. 50% compared to the
results obtained on the pure Ti02 surface. This supports the hypothesis that,from aqueous solutions, DDP04(NH4)2 is selectively adsorbed on the Ti02rather than on the Si02 regions. As a consequence of the lower degree of
coverage, the photoelectrons from the 0)s in the substrate are less affected
by inelastic scattering by the adlayer, and the atomic concentration of
oxygen is therefore significantly higher for DDP04/Tio4Sio602 in
comparison to DDP04/Ti02.
161
IV Results and Discussion
OH-DDPO4 on Ta205 and Nb205:
12-hydroxy dodecyl phosphate (OH-DDPO4) was self-assembled on
Ta2Os and Nb205 chips by immersion in a 0.5 mM OH-DDP04(NH4)2aqueous solution, as described in a previous section.
Contact angle and XPS:
The advancing water-contact angle was measured immediately after the
self-assembly process. The contact angle was approximately 50°, i.e. the
surface is much more hydrophilic than in case of the methyl-terminatedDDPO4 SAMs (the water-contact angles of the clean substrates were close to
0°). This is good evidence that the terminal hydroxy1 groups are indeed
exposed at the SAM surface. To prove this hypothesis, XPS spectra were
recorded at different take-off angles (The information depth scales linearlywith the sine of the take-off angle). The variation of the signal intensity as a
function of the take-off angle may give information about the position of the
corresponding element. The Ois signal of the spectra at the two grazingangles 11.5° and 20.5° are shown in Figure 28. Compared to the non-
functionalized dodecyl phosphate, the oxygen signal of the hydroxy groupshows an additional shoulder at 533.4 eV (Figure 28) with a relative
intensity that is significantly higher at 11.5° compared to 20.5° (Peakdeconvolution presented in App. 15). This is due to the fact that the Oissignal from the external hydroxy1 group is not affected by inelastic scatteringwithin the alkyl monolayer, whereas the Ois signals from the interfacial
phosphate and the covered metal oxide are strongly reduced at grazing take¬
off angles.
No nitrogen could be detected by XPS, demonstrating that the
ammonium cations are not incorporated in the self-assembled adlayer.
162
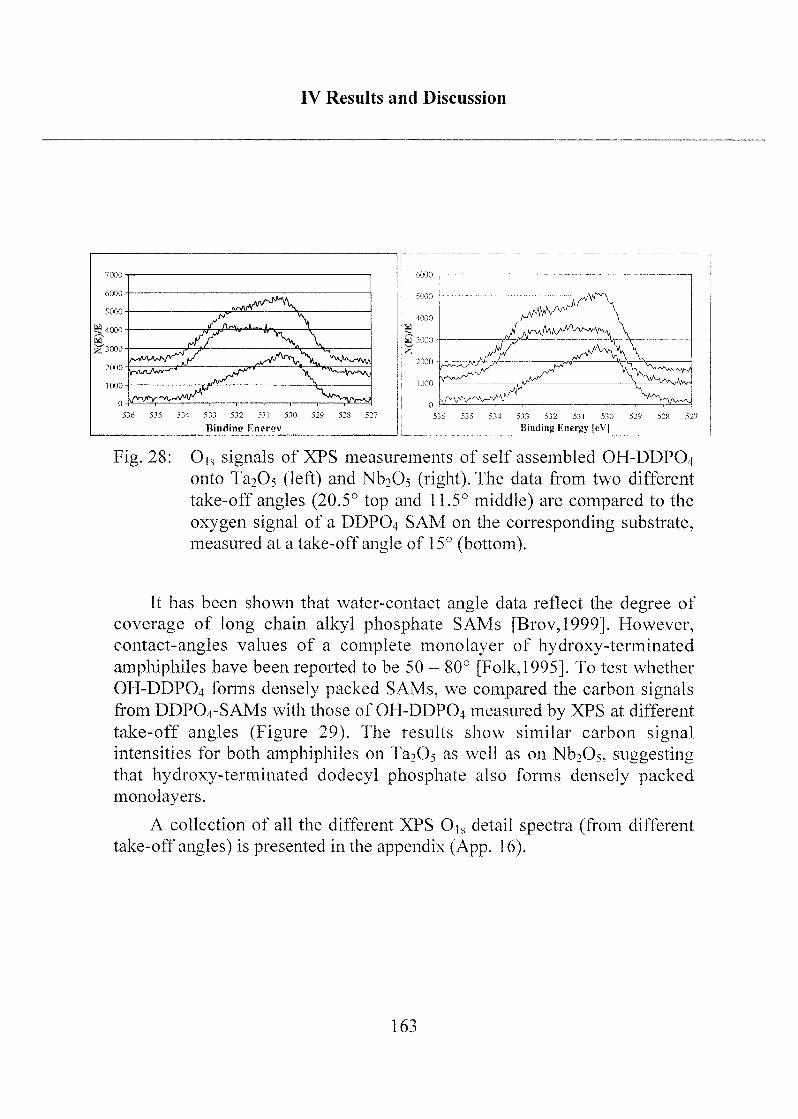
IV Results and Discussion
7000
>!"! 512 511 510
Hiiuliii!' Fnenn»
529 528 527 M4 53"! 512 531 510 52')
Binding Energv [eV|
Fig. 28: Ois signals of XPS measurements of self assembled OH-DDPO4
onto Ta20s (left) and NboOs (right). The data from two different
take-off angles (20.5° top and 11.5° middle) are compared to the
oxygen signal of a DDPO4 SAM on the corresponding substrate,measured at a take-off angle of 15° (bottom).
It has been shown that water-contact angle data reflect the degree of
coverage of long chain alkyl phosphate SAMs [Brov,1999]. However,
contact-angles values of a complete monolayer of hydroxy-terminatedamphiphiles have been reported to be 50 - 80° [Folk,1995]. To test whether
OH-DDPO4 forms densely packed SAMs, we compared the carbon signalsfrom DDP04-SAMs with those of OH-DDPO4 measured by XPS at different
take-off angles (Figure 29). The results show similar carbon signalintensities for both amphiphiles on Ta205 as well as on Nb205, suggestingthat hydroxy-terminated dodecyl phosphate also forms densely packedmonolayers.
A collection of all the different XPS Ois detail spectra (from different
take-off angles) is presented in the appendix (App. 16).
163
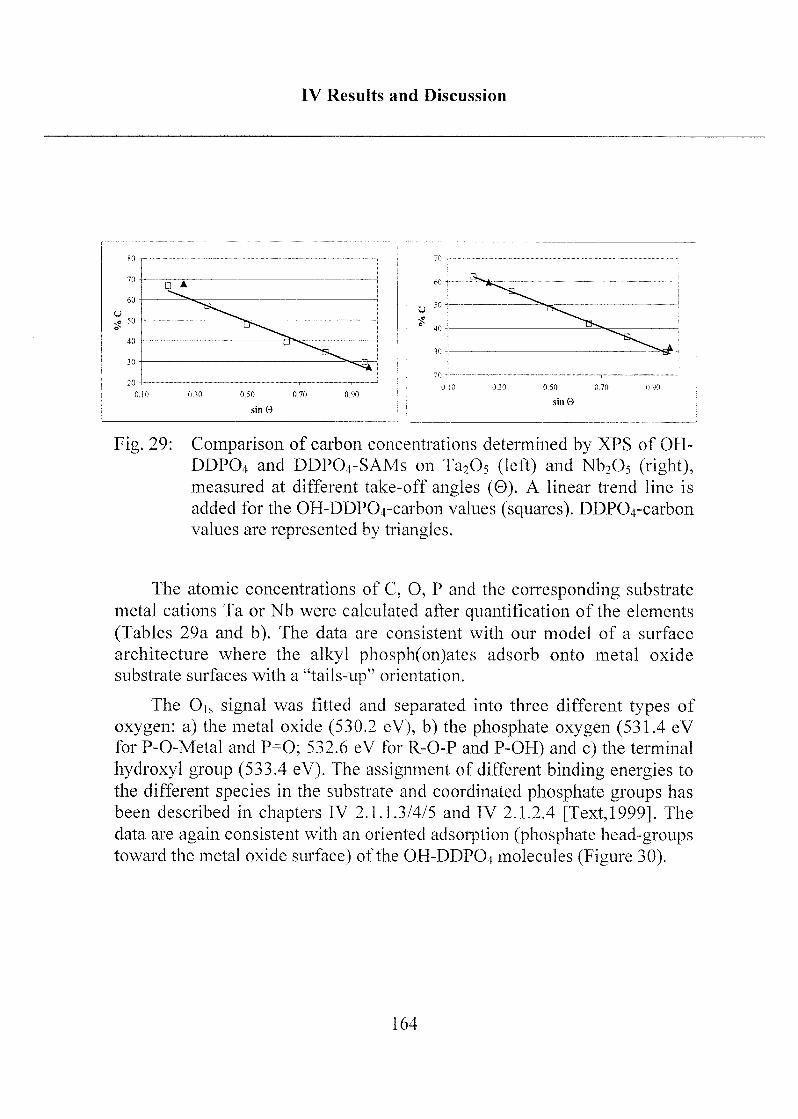
IV Results and Discussion
0 50
sin 0
Fig. 29: Comparison of carbon concentrations determined by XPS of OH-
DDP04 and DDP04-SAMs on Ta205 (left) and Nb205 (right),measured at different take-off angles (0). A linear trend line is
added for the OH-DDPCVcarbon values (squares). DDPCVcarbonvalues are represented by triangles.
The atomic concentrations of C, O, P and the corresponding substrate
metal cations Ta or Nb were calculated after quantification of the elements
(Tables 29a and b). The data are consistent with our model of a surface
architecture where the alkyl phosph(on)ates adsorb onto metal oxide
substrate surfaces with a "tails-up" orientation.
The Ois signal was fitted and separated into three different types of
oxygen: a) the metal oxide (530.2 eV), b) the phosphate oxygen (531.4 eV
for P-O-Metal and P=0; 532.6 eV for R-O-P and P-OH) and c) the terminal
hydroxyl group (533.4 eV). The assignment of different binding energies to
the different species in the substrate and coordinated phosphate groups has
been described in chapters IV 2.1.1.3/4/5 and IV 2.1.2.4 [Text, 1999]. The
data are again consistent with an oriented adsorption (phosphate head-groupstoward the metal oxide surface) of the OH-DDPO4 molecules (Figure 30).
164
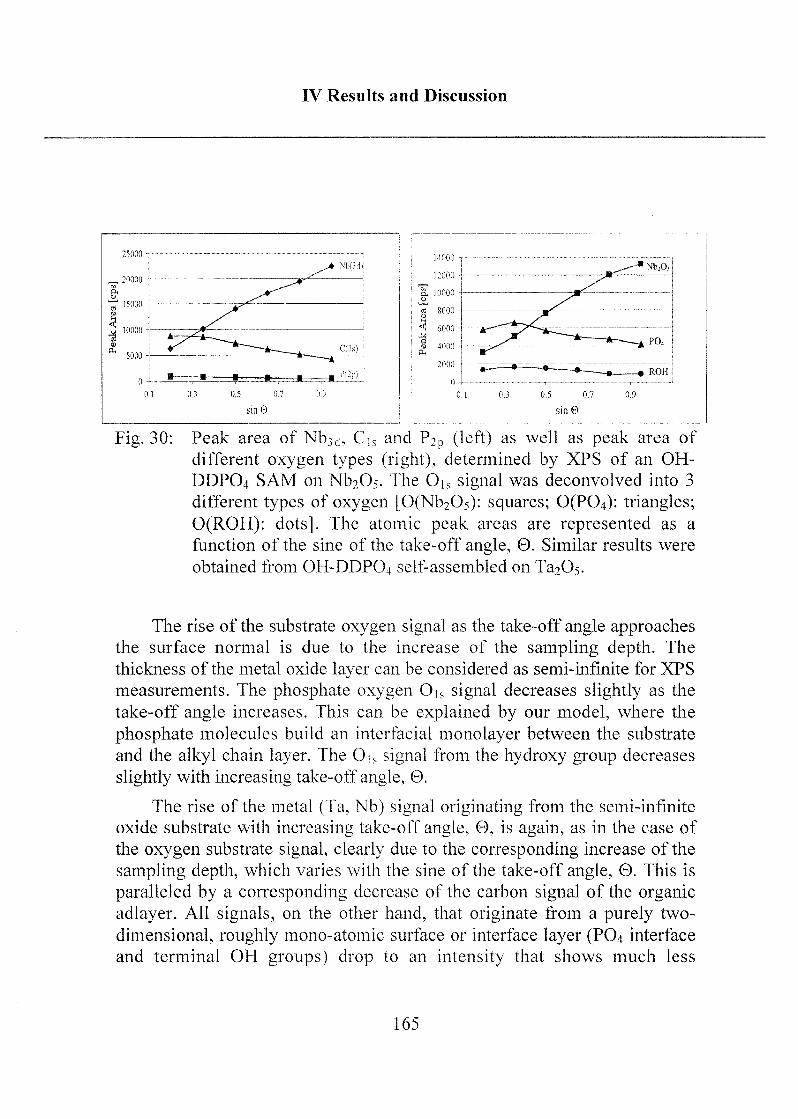
IV Results and Discussion
01 01 05 07 û 1 01 03 05 07 09
sin 0 sin 0
Fig. 30: Peak area of Nb3d, Cts and P2p (left) as well as peak area of
different oxygen types (right), determined by XPS of an OH-
DDP04 SAM on Nb205. The 0,q signal was deconvolved into 3
different types of oxygen [0(Nb2Os): squares; 0(PC>4): triangles;
O(ROH): dots], The atomic peak areas are represented as a
function of the sine of the take-off angle, 0, Similar results were
obtained from OH-DDPO4 self-assembled on Ta2Os.
The rise of the substrate oxygen signal as the take-off angle approachesthe surface normal is due to the increase of the sampling depth. The
thickness of the metal oxide layer can be considered as semi-infinite for XPS
measurements. The phosphate oxygen 0,s signal decreases slightly as the
take-off angle increases. This can be explained by our model, where the
phosphate molecules build an interfacial monolayer between the substrate
and the alkyl chain layer. The Ojs signal from the hydroxy group decreases
slightly with increasing take-off angle, 0.
The rise of the metal (Ta, Nb) signal originating from the semi-infinite
oxide substrate with increasing take-off angle, 0, is again, as in the case of
the oxygen substrate signal, clearly due to the corresponding increase of the
sampling depth, which varies with the sine of the take-off angle, 0. This is
paralleled by a corresponding decrease of the carbon signal of the organicadlayer. All signals, on the other hand, that originate from a purely two-
dimensional, roughly mono-atomic surface or interface layer (PO4 interface
and terminal OH groups) drop to an intensity that shows much less
165
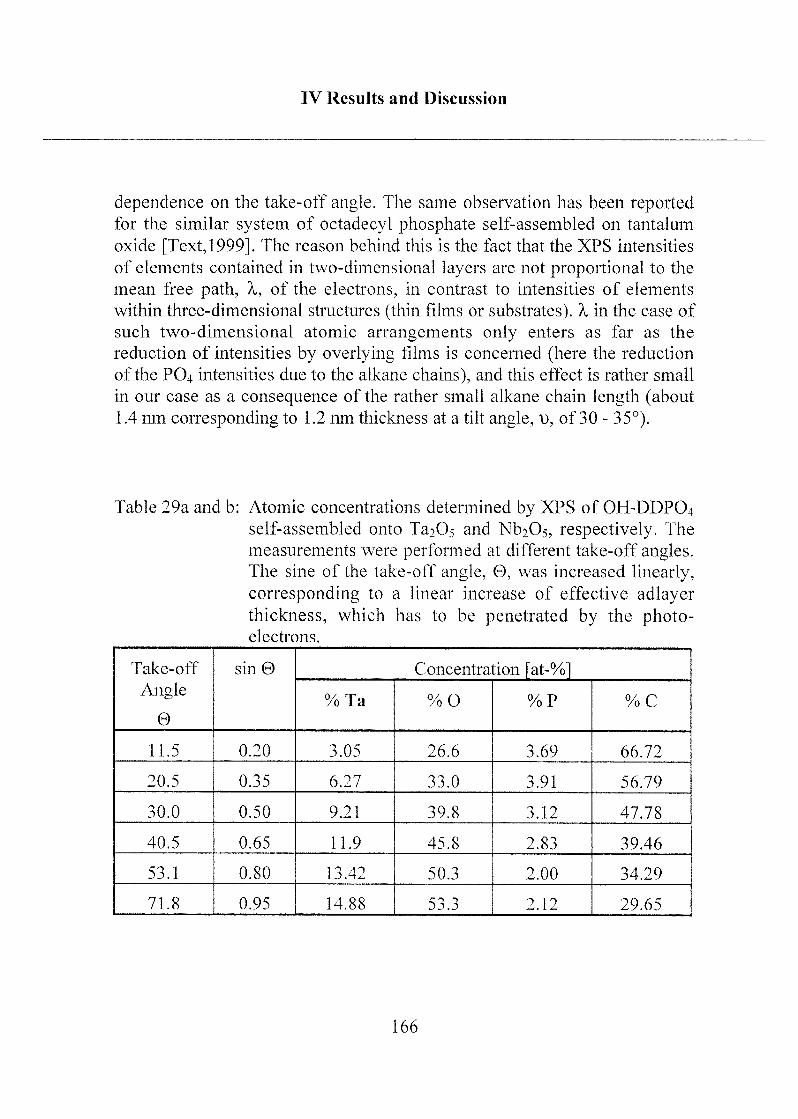
IV Results and Discussion
dependence on the take-off angle. The same observation has been reportedfor the similar system of octadecyl phosphate self-assembled on tantalum
oxide [Text, 1999]. The reason behind this is the fact that the XPS intensities
of elements contained in two-dimensional layers are not proportional to the
mean free path, X, of the electrons, in contrast to intensities of elements
within three-dimensional structures (thin films or substrates). X in the case of
such two-dimensional atomic arrangements only enters as far as the
reduction of intensities by overlying films is concerned (here the reduction
of the PO4 intensities due to the alkane chains), and this effect is rather small
in our case as a consequence of the rather small alkane chain length (about1.4 nm corresponding to 1.2 nm thickness at a tilt angle, t), of 30 - 35°).
Table 29a and b: Atomic concentrations determined by XPS of OH-DDPO4self-assembled onto Ta^Os and ND2O5, respectively. The
measurements were performed at different take-off angles.The sine of the take-off angle, 0, was increased linearly,corresponding to a linear increase of effective adlayerthickness, which has to be penetrated by the photo-electrons.
Take-off
Angle
0
sin 0 Concentraition [at-%]
%Ta %0 %P %C
11.5 0.20 3.05 26.6 3.69 66.72
20.5 0.35 6.27 33.0 3.91 56.79
30.0 0.50 9.21 39.8 3.12 47.78
40.5 0.65 11.9 45.8 2.83 39.46
53.1 0.80 13.42 50.3 2.00 34.29
71.8 0.95 14.88 53.3 2.12 29.65
166
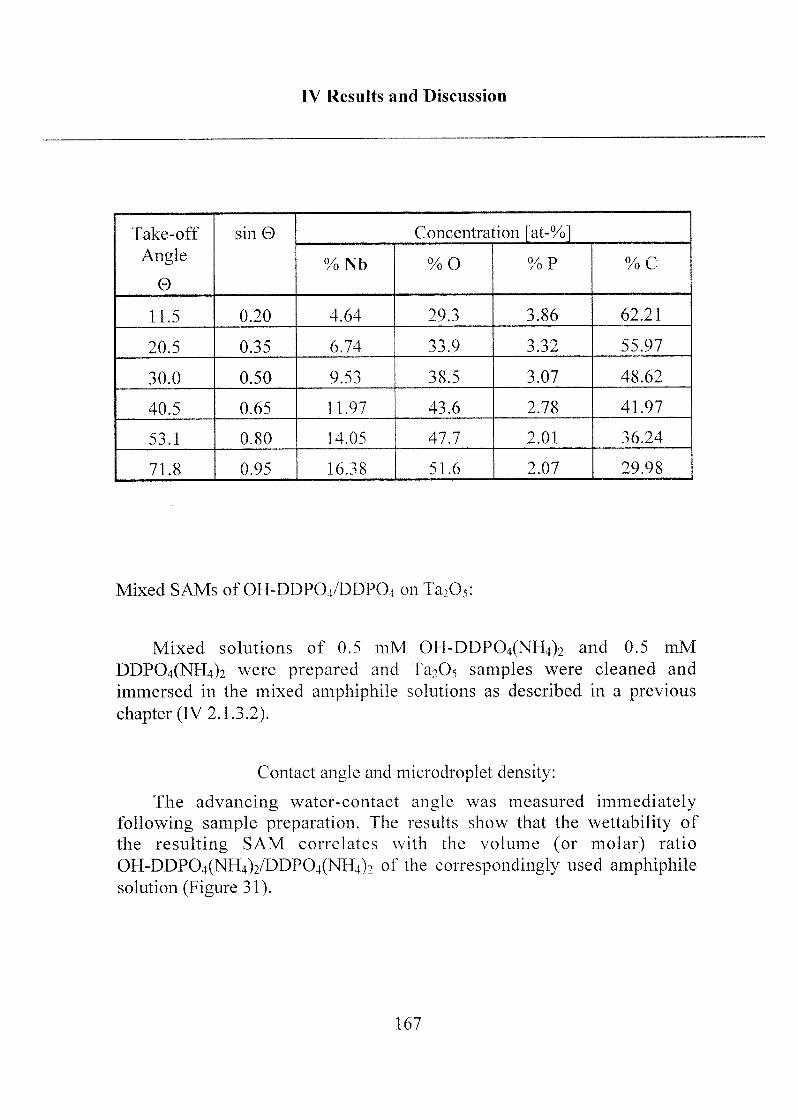
IV Results and Discussion
Take-off
Angle
0
sin© Concentration [at-%]
%Nb %0 %P %C
11.5 0.20 4.64 29.3 3.86 62.21
20.5 0.35 6.74 33.9 3.32 55.97
30.0 0.50 9.53 38.5 3.07 48.62
40.5 0.65 11.97 43.6 2.78 41.97
53.1 0.80 14.05 47.7 2.01 36.24
71.8 0.95 16.38 51.6 2.07 29.98
Mixed SAMs of OH-DDP04/DDP04 on Ta205:
Mixed solutions of 0.5 mM OH-DDP04(NH4)2 and 0.5 mM
DDP04(NH4)2 were prepared and Ta205 samples were cleaned and
immersed in the mixed amphiphile solutions as described in a previous
chapter (IV 2.1.3.2).
Contact angle and microdroplet density:
The advancing water-contact angle was measured immediately
following sample preparation. The results show that the wettability of
the resulting SAM correlates with the volume (or molar) ratio
OH-DDP04(NH4)2/DDP04(NH4)2 of the correspondingly used amphiphilesolution (Figure 31).
167
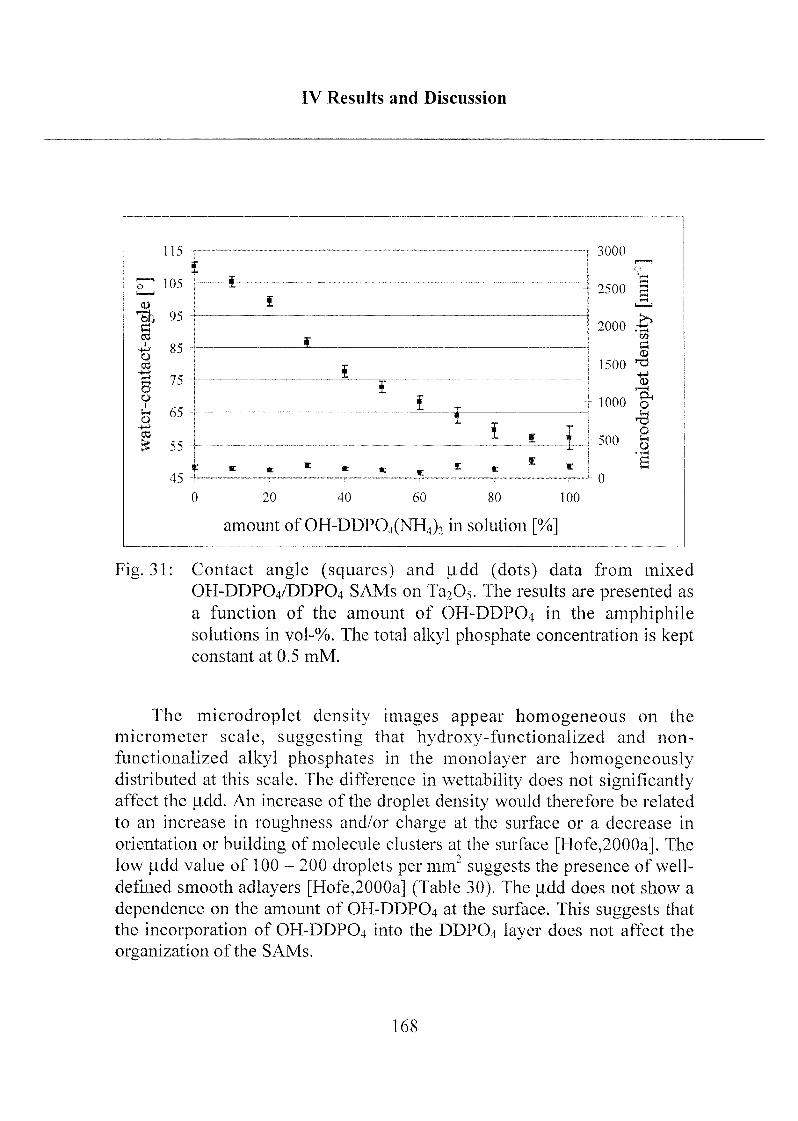
IV Results and Discussion
15
105
a»
1^ 95
i85
o03+-*
75oo
r-< 65a>4-»CO
£ 55
45
Fig. 31:
3000
2500 |
2000
40 60 80 100
amount of OH-DDP04(NH4)2 in solution [%]
&
a»
1500 "o
©.—i
1000 p4
O
500 g
Contact angle (squares) and u,dd (dots) data from mixed
OH-DDPO4/DDPO4 SAMs on Ta205. The results are presented as
a function of the amount of OH-DDPO4 in the amphiphilesolutions in vol-%. The total alkyl phosphate concentration is keptconstant at 0.5 rnM.
The microdroplet density images appear homogeneous on the
micrometer scale, suggesting that hydroxy-functionalized and non-
functionalized alkyl phosphates in the monolayer are homogeneouslydistributed at this scale. The difference in wettability does not significantlyaffect the u.dd. An increase of the droplet density would therefore be related
to an increase in roughness and/or charge at the surface or a decrease in
orientation or building of molecule clusters at the surface [Hofe,2000a]. The
low |add value of 100 - 200 droplets per mm" suggests the presence of well-
defined smooth adlayers [Hofe,2000a] (Table 30). The (idd does not show a
dependence on the amount of OH-DDPO4 at the surface. This suggests that
the incorporation of OH-DDPOt into the DDPO4 layer does not affect the
organization of the SAMs.
168
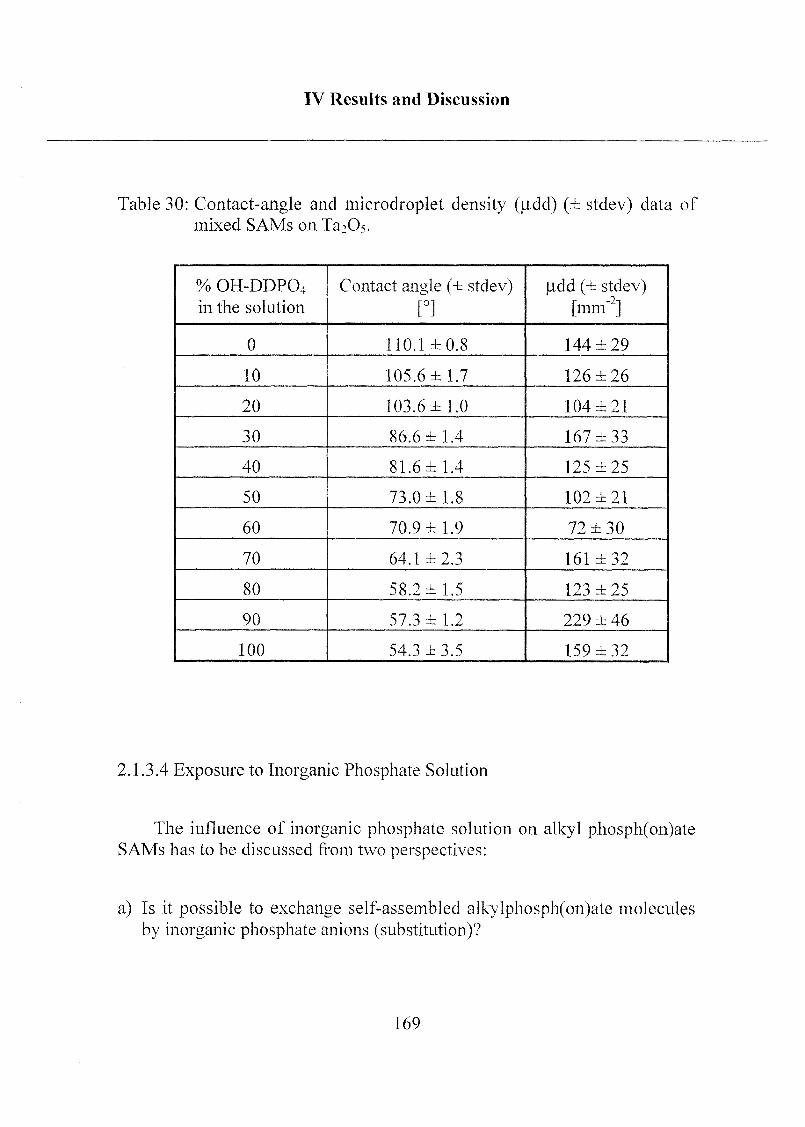
IV Results and Discussion
Table 30: Contact-angle and microdroplet density (jidd) (± stdev) data of
mixed SAMs on Ta20v
% OH-DDP04
in the solution
Contact angle (± stdev)
[°]
jidd (± stdev)
[mm" ]
0 110.1 ±0.8 144 ± 29
10 105.6±1.7 126 ±26
20 103.6 ±1.0 104 ±21
30 86.6 ±1.4 167 ±33
40 81.6 ± 1.4 125 ±25
50 73.0 ±1.8 102 ±21
60 70.9 ±1.9 72 ±30
70 64.1 ±2.3 161 ±32
80 58.2 ±1.5 123 ±25
90 57.3 ± 1.2 229 ± 46
100 54.3 ±3.5 159 ±32
2.1.3.4 Exposure to Inorganic Phosphate Solution
The influence of inorganic phosphate solution on alkyl phosph(on)ateSAMs has to be discussed from two perspectives:
a) Is it possible to exchange self-assembled alkylphosph(on)ate molecules
by inorganic phosphate anions (substitution)?
169
IV Results and Discussion
If there is a substitution reaction of inorganic and organic phosphates, a
significant increase of the surface wettability of hydrophobic alkyl
phosph(on)ate SAMs would be expected as a consequence of loweringthe monolayer order. Simultaneously, the microdroplet density would
increase due to lowering the surface homogeneity.
b) Do inorganic and organic phosphates competitively adsorb onto clean
metal oxide surfaces (competitive adsorption)?
If the driving force for self-assembly of alkyl phosph(on)ates is the
strong phosph(on)ate - metal cation interaction, one would expect a
lower degree of coverage by organic phosph(on)ates if inorganicphosphates are present in the amphiphile solution during the SAM-
formation process. If the driving force is the Van der Waals interaction
between the hydrocarbon chains, the SAM-formation process is expectedto be less influenced.
To answer these questions, hydrophobic DDPO^NTL^ SAMs were
stored in PBS buffer solution, and water-contact angle, |idd and XPS were
measured (see also chapter IV 2.1.1.2). XPS data were performed at a
detection angle of 15° with respect to the surface plane for high surface
sensitivity. In a second experiment, the SAM formation of DDP04(NH4)2 on
clean Ta20s from a solution in PBS was monitored by measuring the water-
contact angle since the hydrophobicity has been shown to be a good marker
for the determination of coverage for methyl-terminated alkyl phosphateSAMs [Text, 1999].
For the phosphate - alkyl phosphate exchange reaction studies, Ta205
chips were cleaned according to the standard cleaning procedure (sonicationin 2-propanol followed by UV-cleaning) and coated by DDP04 from a
0.5 mM aqueous solution of DDPO^NFLi)? as described in previouschapters. The SAM-coated chips were subsequently stored in PBS for
1 hour, 3 hours, 20 hours, 50 hours, 14 days and 16 days and continuouslystirred during this period. The samples were removed after the
corresponding storage time, rinsed with water and analyzed. Contact angleand [idd data are shown in Figure 32.
170
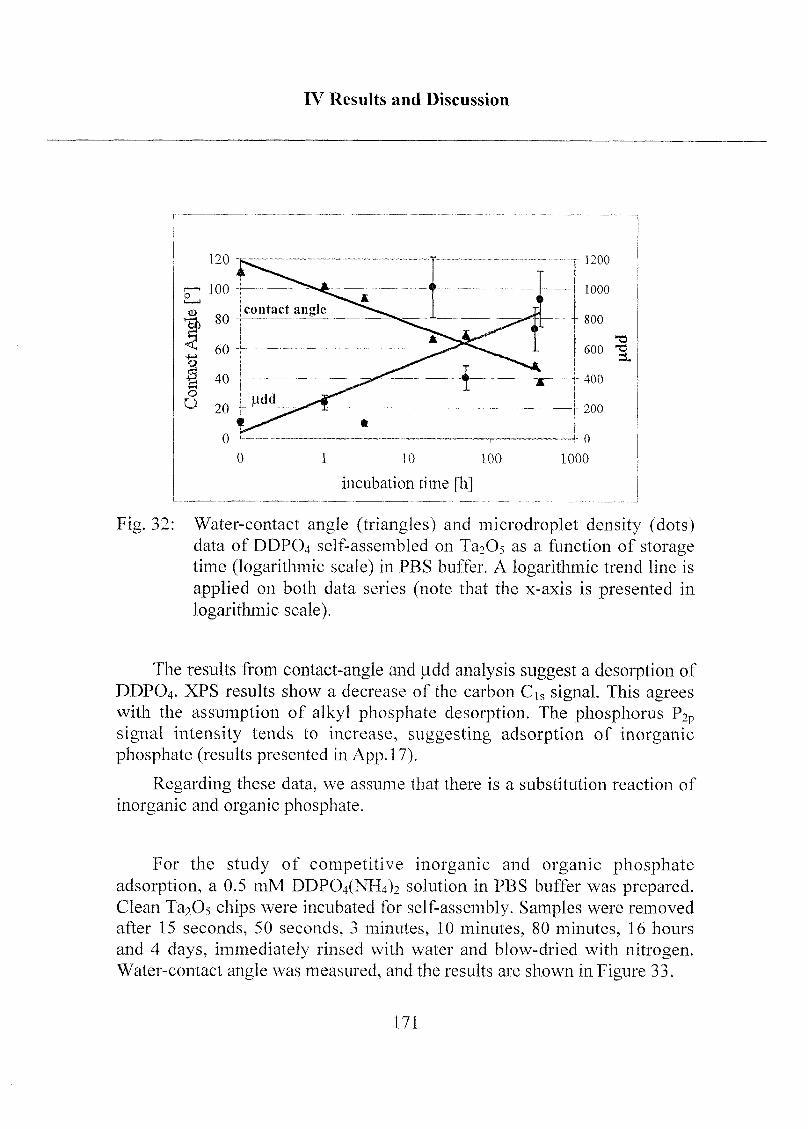
IV Results and Discussion
1200
1000
800
600 "3
400
200
0
Fig. 32: Water-contact angle (triangles) and microdroplet density (dots)data of DDPO4 self-assembled on Ta205 as a function of storagetime (logarithmic scale) in PBS buffer. A logarithmic trend line is
applied on both data series (note that the x-axis is presented in
logarithmic scale).
The results from contact-angle and (idd analysis suggest a desorption of
DDPO4. XPS results show a decrease of the carbon Cis signal. This agrees
with the assumption of alkyl phosphate desorption. The phosphorus P2psignal intensity tends to increase, suggesting adsorption of inorganicphosphate (results presented in App. 17).
Regarding these data, we assume that there is a substitution reaction of
inorganic and organic phosphate.
For the study of competitive inorganic and organic phosphateadsorption, a 0.5 mM DDPC^NHOi solution in PBS buffer was prepared.Clean Ta205 chips were incubated for self-assembly. Samples were removed
after 15 seconds, 50 seconds, 3 minutes, 10 minutes, 80 minutes, 16 hours
and 4 days, immediately rinsed with water and blow-dried with nitrogen.Water-contact angle was measured, and the results are shown in Figure 33.
0 1 10 100
incubation time [hj
171
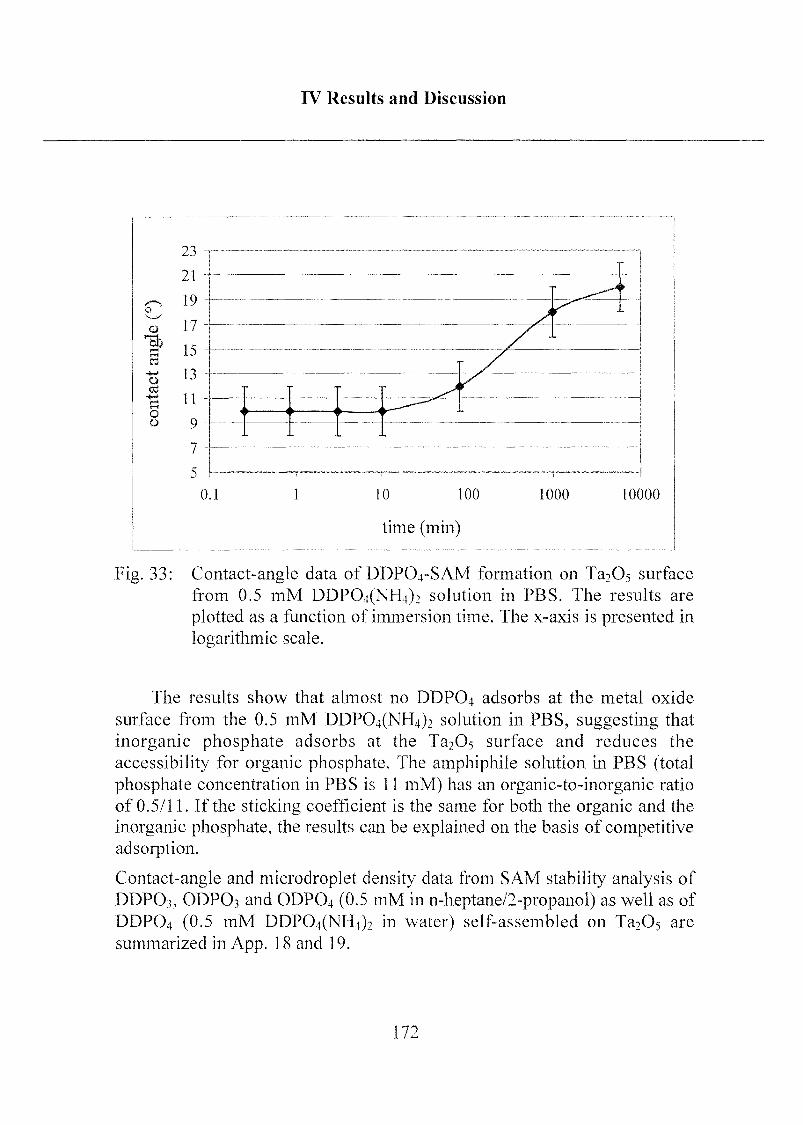
IV Results and Discussion
/J>
21
/""N 19O
(!) 17
"Ehr~r 15CO
13
CO-ti 11t-t
ÜÜ 9
7
5
0.1 100 1000 10000
time (min)
Fig. 33: Contact-angle data of DDP04-SAM formation on Ta20^ surface
from 0.5 mM DDPC^NH^ solution in PBS. The results are
plotted as a function of immersion time. The x-axis is presented in
logarithmic scale.
The results show that almost no DDPO4 adsorbs at the metal oxide
surface from the 0.5 mM DDP04(NH4)2 solution in PBS, suggesting that
inorganic phosphate adsorbs at the Ta205 surface and reduces the
accessibility for organic phosphate. The amphiphile solution in PBS (total
phosphate concentration in PBS is 11 mM) has an organic-to-inorganic ratio
of 0.5/11. If the sticking coefficient is the same for both the organic and the
inorganic phosphate, the results can be explained on the basis of competitiveadsorption.
Contact-angle and microdroplet density data from SAM stability analysis of
DDPO3, ODPCh and ODPO4 (0.5 mM in n-heptane/2-propanol) as well as of
DDPO4 (0.5 mM DDPO^NR^ in water) self-assembled on Ta20^ are
summarized in App. 18 and 19.
170
IV Results and Discussion
2.1.4 Poly-(L)-Lysine Polyethylene Glycol) (PLL-PEG)
Having a pKa of about 9.5, the PLL-backbone of the co-polymer is positivelycharged in pH-neutral solutions. However, metal oxides such as Ta2Os and TiC>2 are
negatively charged at this pH. The adsorption mechanism and the driving force for
self-assembly is therefore completely different from SAM formation from
phosph(on)ates on such substrates. One can consider the bonding between the
polymer molecules and the substrate to be a multiple Coulomb interaction.
Optical waveguide lightmode spectroscopy (OWLS) was used for the
monitoring of PLL-PEG adsorption, protein resistance and specific streptavidinbinding onto PLL-PEG/PEGbiotin coated surfaces. The OWLS measurements were
performed by J. Vörös.
PLL-g-PEG self-assembly, protein resistance [Prim, 1993]and strepatvidin binding:
Solutions of PLL(20)-g-PEG(2) derivatives having grafting ratios of g[2],g[3.5] and g[5], respectively, were prepared in 10 mM HEPES buffer (pH 7.4), at a
concentration of 1 mg/ml and filter-sterilized (0.22 (im Durapore Millex, Sigma-CH). Self-assembly of the different non-functionalized copolymers on T1O2(3 samples per polymer type) was allowed for proceeding for 90 minutes and the
adsorbed mass was determined. Samples were then rinsed extensively with filter-
sterilised HEPES buffer (pH 7.4), and protein solution (1 mg/ml in HEPES buffer)was applied for non-specific protein-adsorption studies (Figure 34).
173
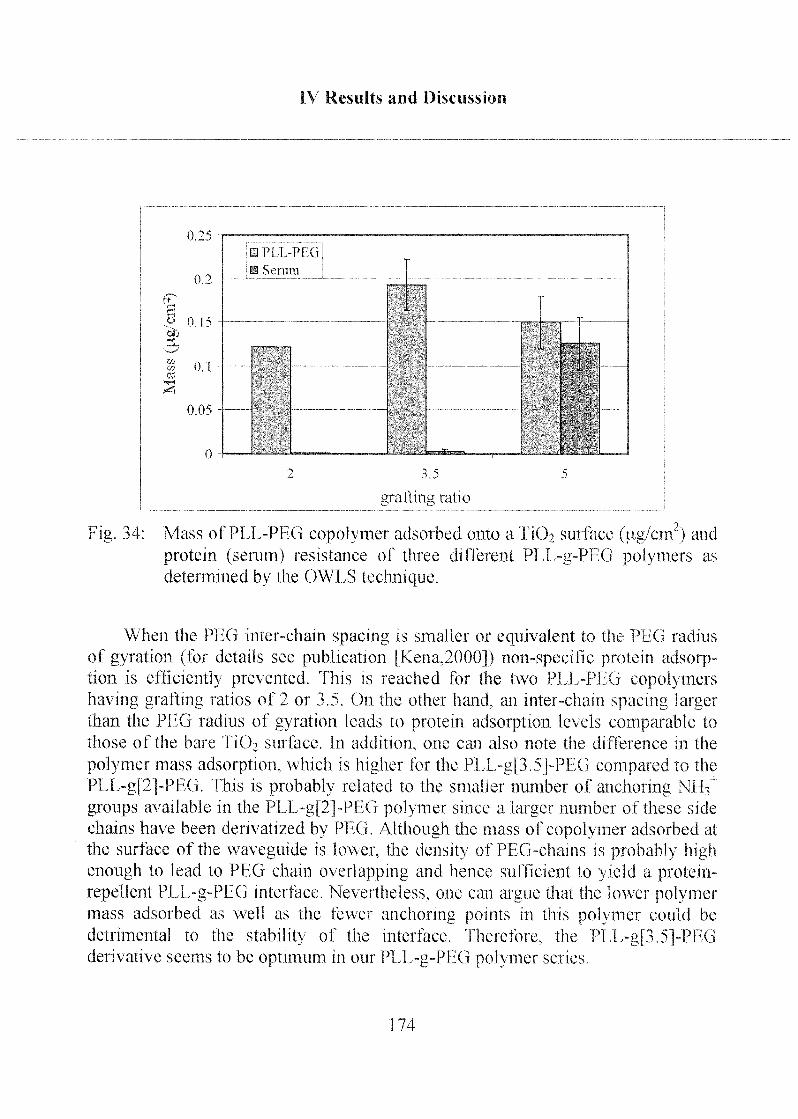
IV Results and Discussion
«r-
Of.=5
-/<
«
U ZS
DPU-PKilB Set ura
0 2 — — — —
40 15 -
IIBR!^
0 1
IBS0 05
A mifaa,—,
3 5
graftme ratio
Fig 34 Mass of PLL-PFG copolymer adsorbed onto aTiÖ2 surface (tig/cin2) and
protein (serum) resistance of three different PLL-g-Pl G polymers as
determined by the OWL S technique
When the PFG mter-cham spacing is smaller or equivalent to the PI G radius
of gyration (for details see publication (Kena,20()()]) non-specific protein adsorp¬tion is efficiently prevented This is reached tor the two PLI -PKi copolymcishaving giaftmg ratios of 2 or 3 5 On the othet hand, an mter-cham spacing largerthan the PPG radius of gyration leads to protein adsorption levels comparable to
those of the bare TiOz surface In addition, one can also note the difference m the
polymer mass adsorption, which is highei for the PI 1 -g[3 5|-PFG compared to the
PLL-g[2]-PFG This is probabfy related to the smaller number of anchoring NIL,1groups available m the PLL-g[2]-PI G polymer since a larger number oi these side
chains have been denvati/ed by PF G Although the mass of copolymer adsorbed at
the surface of the waveguide is lower, the density ol PLG-chams is probably highenough to lead to PPG chain o\erlappmg and hence sufficient to yield a protein-
repellent PL1 -g-PPG mteiface Nevertheless, one can argue that the lower polymermass adsoibed as well as the few et anchoring points m this polymer could be
detrimental to the stability of the interface Therefore, the PI 1 -g|3 5J-PFGderivative seems to be optimum in oui PI L -g-P! G polymer series
174
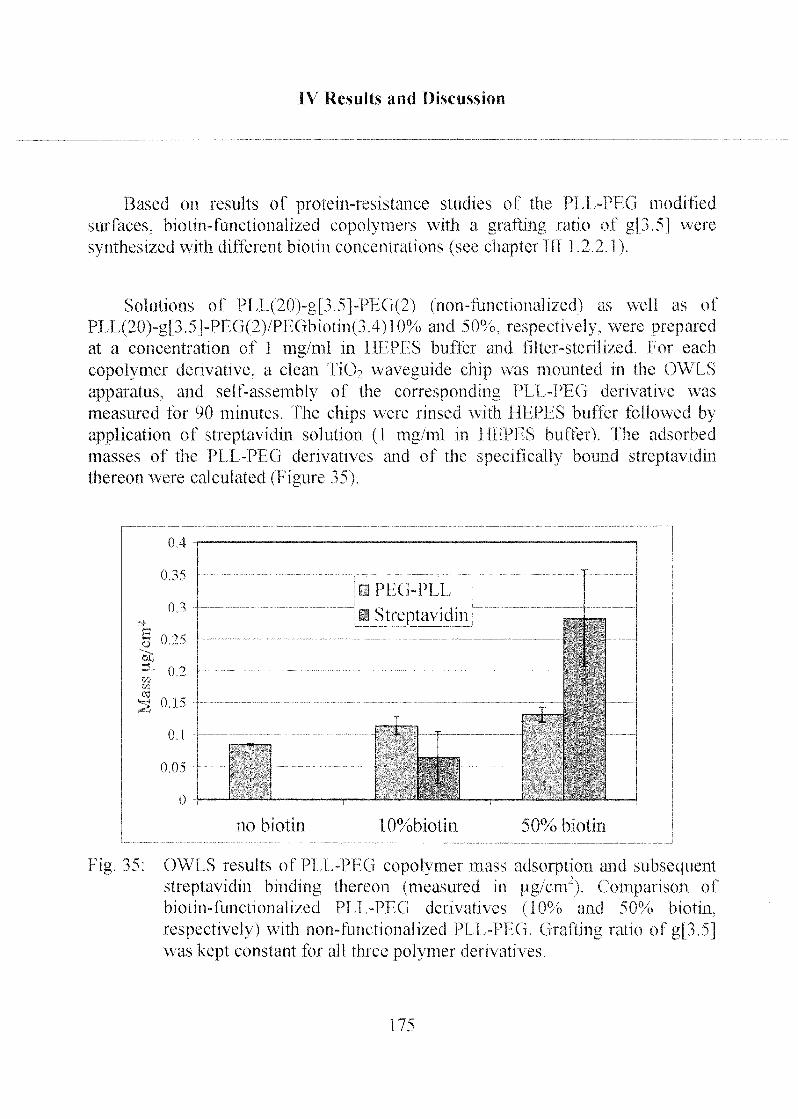
IV Results and Discussion
Based on results of protein-resistance studies of the PLt -PPG modified
surfaces, biotin-functionahzed copoljmers with a grafting ratio of g[3 5| were
synthesized with different biotin concentrations (see chapter III 1 2 2 i)
Solutions of PLL(20)-g[3 5|-PI G(2) (non-fimctionah/ed) as well as of
PLL(20)-gf3 5]~PFG(2)/PFGbiotin(3 4)10% and 50%, respectively, were preparedat a concentration of 1 mg/ml m HEPFS buffet and filter-sterilized tor each
copolymer derivative, a clean Ti07 waveguide chip was mounted in the OWLS
apparatus, and self-assembly of the corresponding P1L-PLG derivative was
measured for 90 minutes The chips were rinsed with HEPFS buffer followed by
application of streptavidm solution (1 mg/ml m I If PL S buffer) The adsorbed
masses of the PLL-PI G derivatives and of the specifically bound streptavidmthereon were calculated (Figure 35)
0 4
0 35
o i
>
I 0 25
tot3
0 2
w~ . -
o i
0 05
0
no biotin 10%biotin 50% biotini
_
Fig. 35 OWLS results of PL1 -PFG copolymer mass adsorption and subsequentstreptavidm binding thereon (measured m jig/cm") Comparison of
biotin-functionahzed PI I-PIG derivatives (10% and 50% biotin,
respectively) with non-functionalized PLI ~PLG Grafting tatio of g[3 5\was kept constant for ail three polvmer derivatives
PLG-PLL'
Streptav idin
175
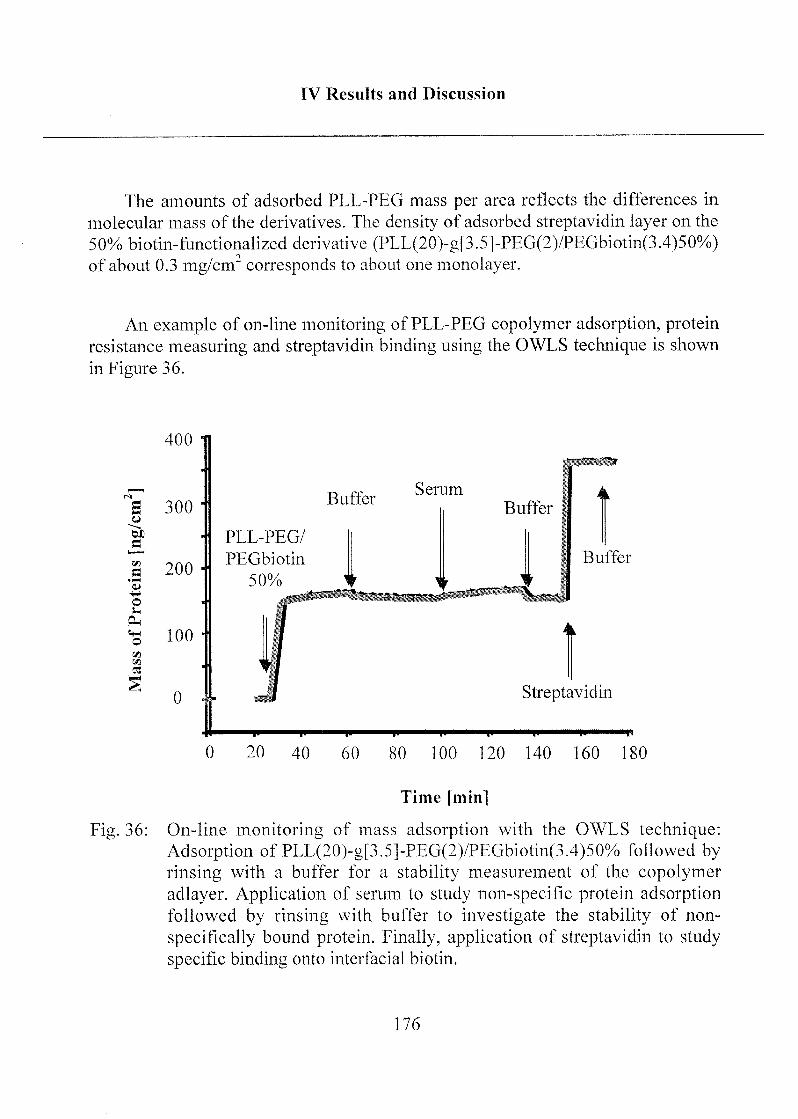
IV Results and Discussion
The amounts of adsorbed PLL-PEG mass per area reflects the differences in
molecular mass of the derivatives. The density of adsorbed streptavidin layer on the
50% biotin-functionaiized derivative (PLL(20)-g[3.5]-PEG(2)/PEGbiotin(3.4)50%)of about 0.3 mg/cm corresponds to about one monolayer.
An example of on-line monitoring of PLL-PEG copolymer adsorption, proteinresistance measuring and streptavidin binding using the OWLS technique is shown
in Figure 36.
s
"woJEL
a
ou
o
ViVi
400 H
300
200
100
0
BufferSerum
Buffer
PLL-PEG/
PEGbiotin
50%
Streptavidin
20 40 60 80 100 120 140 160 180
T* I • i
îme |min|
Fig. 36: On-line monitoring of mass adsorption with the OWLS technique:Adsorption of PLL(20)-g[3.5]-PEG(2)/PEGbiotin(3.4)50% followed by
rinsing with a buffer for a stability measurement of the copolymer
adlayer. Application of serum to study non-specific protein adsorptionfollowed by rinsing with buffer to investigate the stability of non-
specifically bound protein. Finally, application of streptavidm to study
specific binding onto interfacial biotin.
176
IV Results and Discussion
The curve illustrates the very fast self-assembly kinetics of PLL-PEG onto
TiOi surfaces. Rinsing with buffer only results in a small decrease of the adsorbed
mass, showing the stability of the copolymer adlayer. A slight increase of the mass
adsorption curve suggests a small amount of non-specific binding from the
subsequently applied serum. The adsorbed serum seems to be very loosely bound
since an additional rinsing step with buffer results in a fast decrease of the curve
back to the mass-level of the clean copolymer adlayer. However, application of
streptavidin yields a big "jump" in the mass adsorption curve, illustrating the highly
specific binding of streptavidin to biotin conjugated PEG. The near flatness of the
curve during the third rinsing step with buffer suggests the stable binding of
streptavidin.
177
IV Results and Discussion
2.2 Adsorption of Thiols onto Gold Surfaces
The motivation behind the use of gold chloride layers on metal oxide
surfaces was the combination of the evanescent field measuring techniquesand the large spectrum of commercially available alkyl thiols: Opticalevanescent field techniques need highly transparent waveguide layermaterial such as Ta2Û5. Thiols, on the other hand, preferably adsorb onto
gold (or silver) surfaces. Since an adlayer of gold (Au0) on a waveguide
layer would completely absorb incoupled light, the highly transparent goldchloride (Aum) was used for preliminary coating experiments.
2.2.1 Coating of Ta2Os with Gold Chloride
The pH-dependence of the gold chloride solution during the coating
process of the Ta2Os chips and the amount of self-assembled alkane thiol on
the resulting layer was investigated as follows:
A 0.4 % gold chloride solution was neutralized with a 0.1 M NaOH
solution (Figure 37). The stepwise neutralization of the acidic gold chloride
with NaOH and its proposed major chemical structure are shown in Figure38.
178
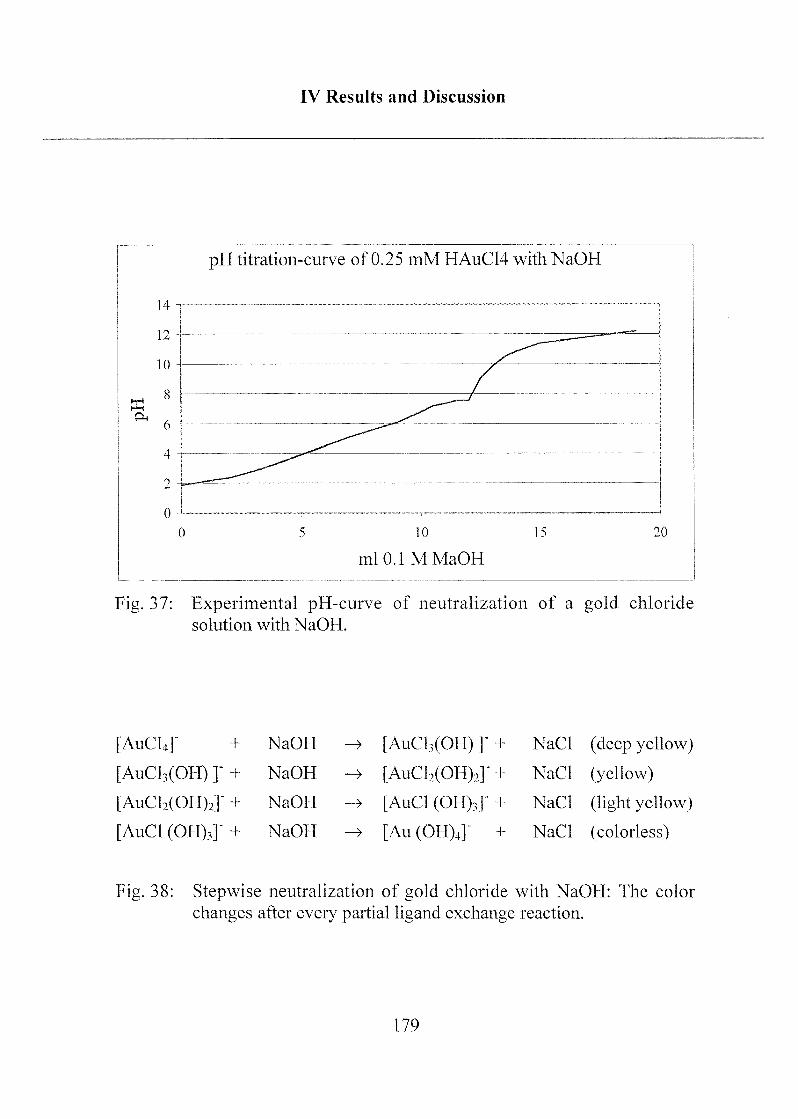
IV Results and Discussion
pH titration-curve of 0.25 mM HAuC14 with NaOH
5 10 15
mlO.lMMaOH
20
Fig. 37: Experimental pH-curve of neutralization of a gold chloride
solution with NaOH.
[AuClj]" + NaOH ~> [AuCl3(OH) ] + NaCl (deep yellow)
[AuCl,(OH) ]" + NaOH -> [AuCl2(OH)2]- + NaCl (yellow)
[AuCl2(OH)2]" + NaOH -» [AuCl (OH),]" + NaCl (light yellow)
[AuCl (OH),]" + NaOH -> [Au(OH)4]" + NaCl (colorless)
Fig. 38: Stepwise neutralization of gold chloride with NaOH: The color
changes after every partial ligand exchange reaction.
179
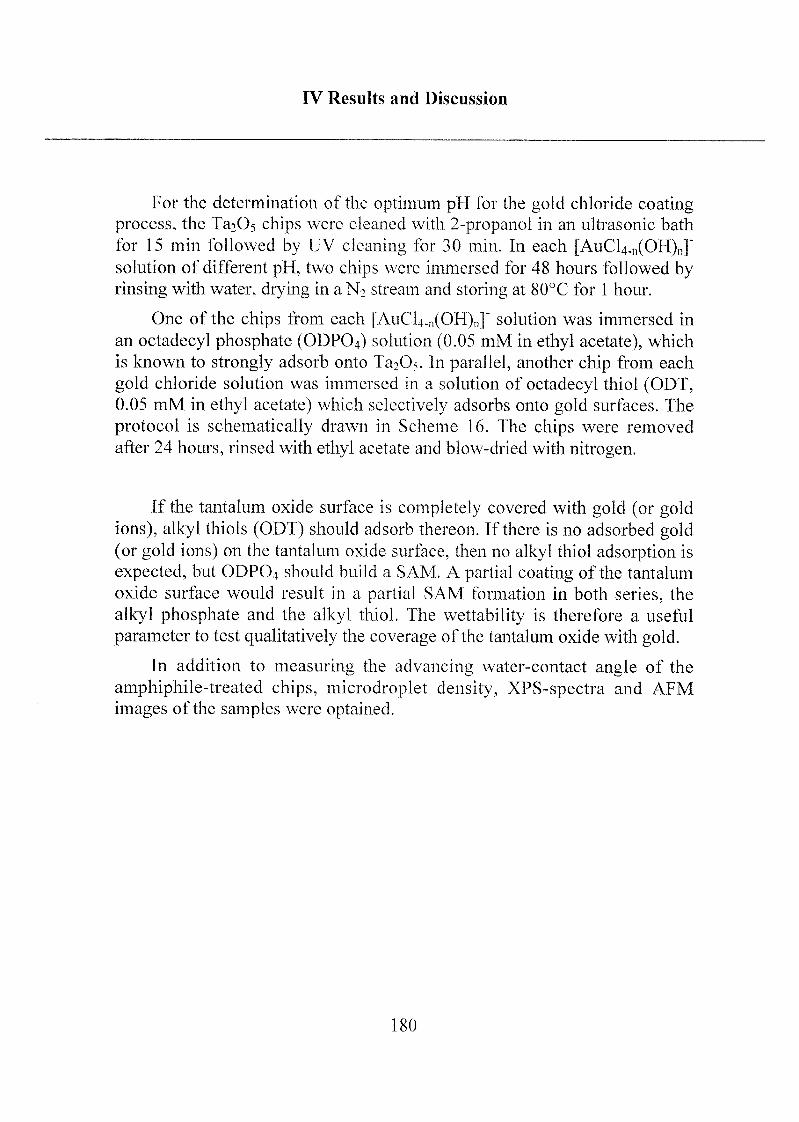
IV Results and Discussion
For the determination of the optimum pH for the gold chloride coatingprocess, the TajOj chips were cleaned with 2-propanol in an ultrasonic bath
for 15 min followed by UV cleaning for 30 min. In each [AuCl4.n(OH)n]"solution of different pH, two chips were immersed for 48 hours followed byrinsing with water, drying in a N2 stream and storing at 80°C for 1 hour.
One of the chips from each [AuCl4.n(OH)n]" solution was immersed in
an octadecyl phosphate (ODPO4) solution (0.05 mM in ethyl acetate), which
is known to strongly adsorb onto Ta20s. In parallel, another chip from each
gold chloride solution was immersed in a solution of octadecyl thiol (ODT,0.05 mM in ethyl acetate) which selectively adsorbs onto gold surfaces. The
protocol is schematically drawn in Scheme 16. The chips were removed
after 24 hours, rinsed with ethyl acetate and blow-dried with nitrogen.
If the tantalum oxide surface is completely covered with gold (or goldions), alkyl thiols (ODT) should adsorb thereon. If there is no adsorbed gold(or gold ions) on the tantalum oxide surface, then no alkyl thiol adsorption is
expected, but ODP04 should build a SAM. A partial coating of the tantalum
oxide surface would result in a partial SAM formation in both series, the
alkyl phosphate and the alkyl thiol. The wettability is therefore a useful
parameter to test qualitatively the coverage of the tantalum oxide with gold.
In addition to measuring the advancing water-contact angle of the
amphiphile-treated chips, microdroplet density, XPS-spectra and AFM
images of the samples were optained.
180
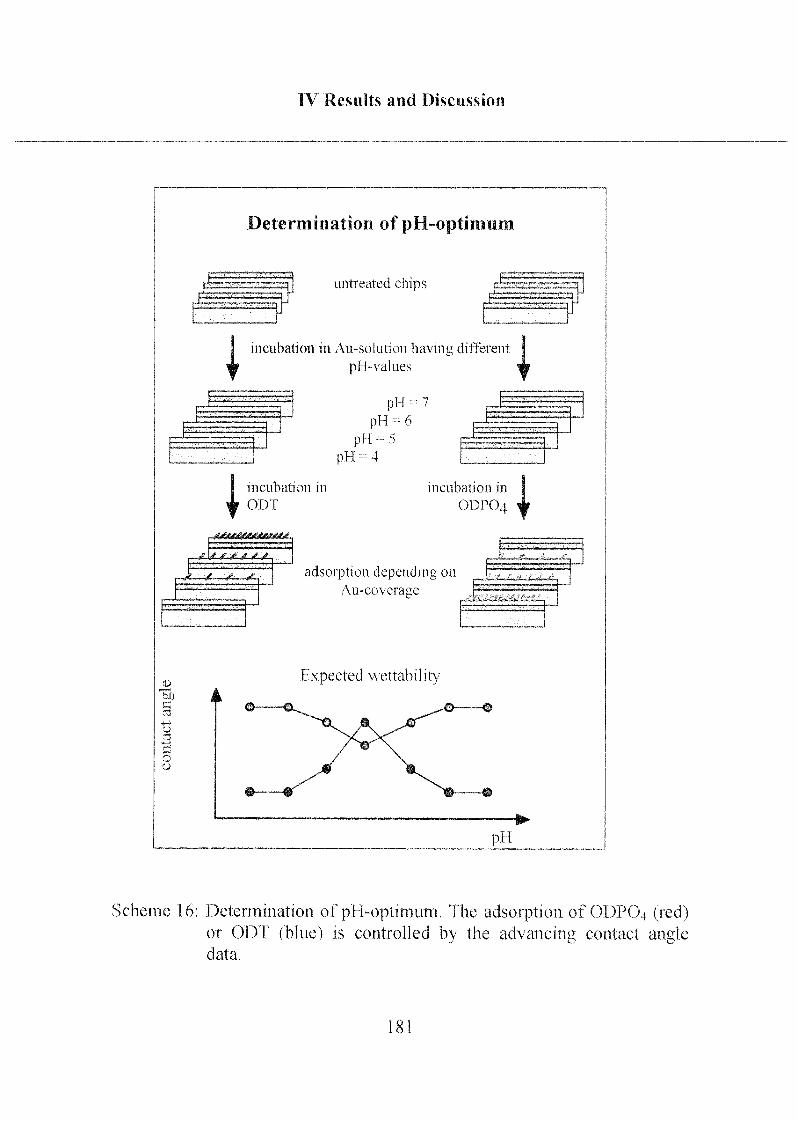
IV Results and Discussion
Determination of pH-optimum
vuntreated chips
V
i incubation in Au-solution having different
pH-\ alues IpH 7
pi I 6
pi I 5
pH 4
incubation in
ODT
JZZZZZZ
incubation m
ODPO4 1
J-^e^-^^t adsorption depending on C^Z^Z=Au-co\ erase p
p^-^H^ ^ .v.i*V»(i1.4k,1
c
COo
Hxpected wettability
pH
Scheme 16: Determination of pH-optimum. The adsorption of ODP04 (red)or ODT (blue) is controlled by the advancing contact angledata.
181
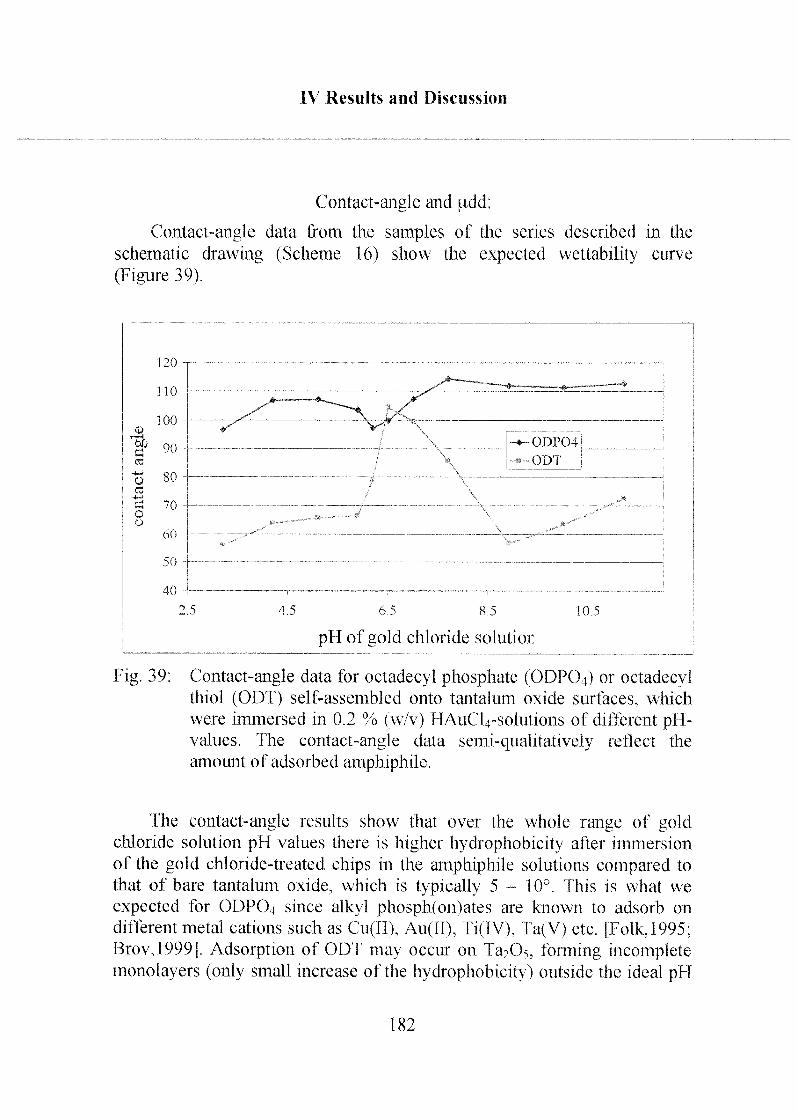
IV Results and Discussion
Contact-angle and iidd;
Contact-angle data from the samples of the series described in the
schematic drawing (Scheme 16) show the expected wettability curve
(Figure 39).
120
110
100CD
3 00
«
-t-1
U 80CS
-+*J
1-1 70oo
60
50
40
/"^0— —-•»
j/"S
.—
\
-ODPÖ4IODT J
\
—
2 5 4 5 6 5 8 5 10 5
pH of gold chloride solutior
Fig. 39; Contact-angle data for octadecyl phosphate (ODPÜ4) or octadecylthiol (ODT) self-assembled onto tantalum oxide surfaces, which
were immersed in 0.2 % (w/v) HAuCLpsolutions of different pll-values. The contact-angle data semi-qualitatively reflect the
amount of adsorbed amphiphile.
The contact-angle results show that over the whole range of goldchloride solution pH values there is higher hydrophobicity after immersion
of the gold chloride-treated chips in the amphiphile solutions compared to
that of bare tantalum oxide, which is typically 5 - 10°. This is what we
expected for ODPO4 since alkyl phosph(on)ates are known to adsorb on
different metal cations such as Cu(ll), Au(Il), Ti(IV), Ta(V) etc. [Folk,1995;Brov,1999]. Adsorption of ODT may occur on Ta20>, forming incompletemonolayers (only small increase of the hydrophobicity) outside the ideal pFl
182
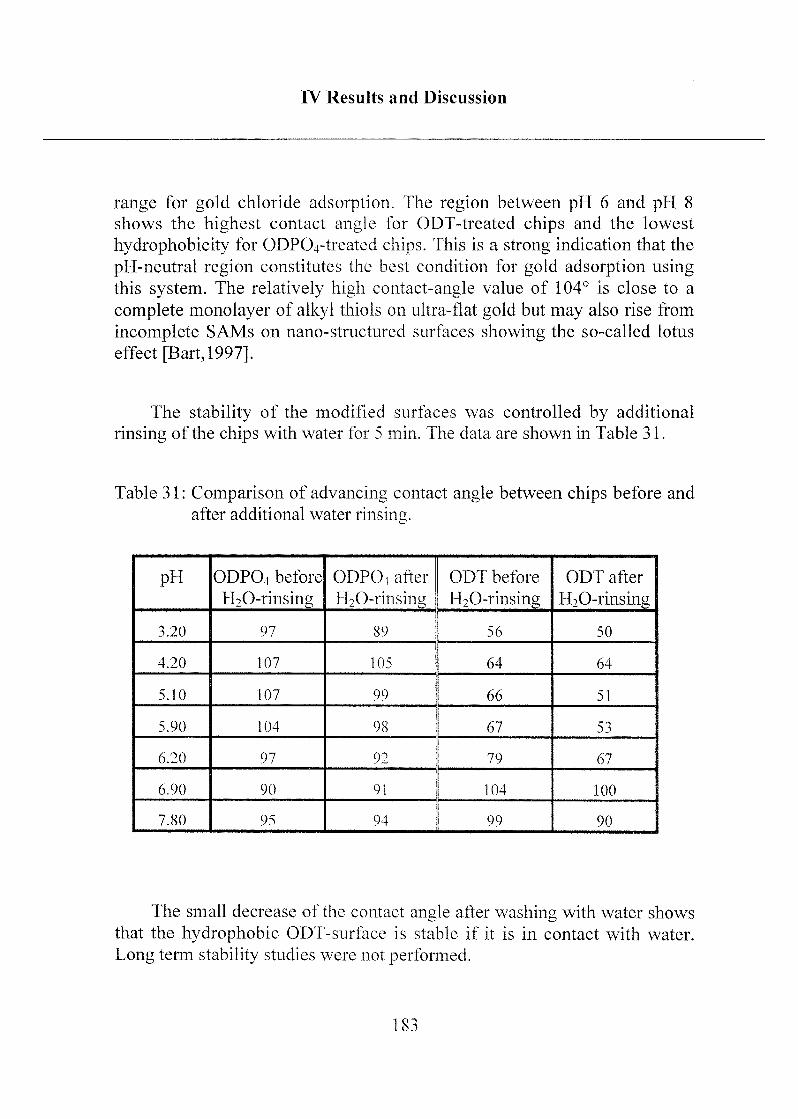
IV Results and Discussion
range for gold chloride adsorption, The region between pH 6 and pH 8
shows the highest contact angle for ODT-treated chips and the lowest
hydrophobicity for ODPCVtreated chips. This is a strong indication that the
pH-neutral region constitutes the best condition for gold adsorption usingthis system. The relatively high contact-angle value of 104° is close to a
complete monolayer of alkyl thiols on ultra-flat gold but may also rise from
incomplete SAMs on nano-structured surfaces showing the so-called lotus
effect [Bart,1997].
The stability of the modified surfaces was controlled by additional
rinsing of the chips with water for 5 min. The data are shown in Table 31.
Table 31 : Comparison of advancing contact angle between chips before and
after additional water rinsing.
pH ODP04 before
t^O-rinsing
ODPO4 after
H20-rinsing
ODT before
H20-rinsing
ODT after
H20-rinsing
3.20 97 89 56 50
4.20 107 105 64 64
5.10 107 99 66 51
5.90 104 98 67 53
6.20 97 92 79 67
6.90 90 91 104 100
7.80 95 94 99 90
The small decrease of the contact angle after washing with water shows
that the hydrophobic ODT-surface is stable if it is in contact with water.
Long term stability studies were not performed.
183
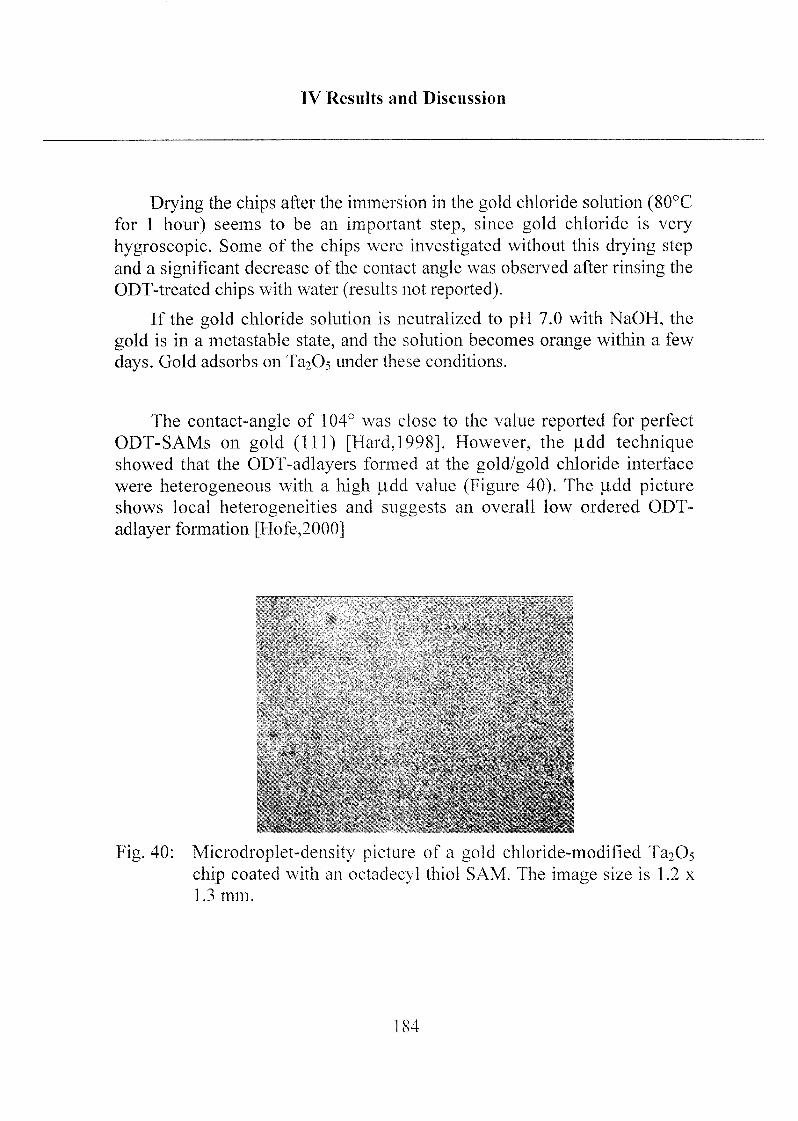
IV Results and Discussion
Drying the chips after the immersion in the gold chloride solution (80°Cfor 1 hour) seems to be an important step, since gold chloride is very
hygroscopic. Some of the chips were investigated without this drying stepand a significant decrease of the contact angle was observed after rinsing the
ODT-treated chips with water (results not reported).
If the gold chloride solution is neutralized to pH 7.0 with NaOH, the
gold is in a metastable state, and the solution becomes orange within a few
days. Gold adsorbs on Ta2Os under these conditions.
The contact-angle of 104° was close to the value reported for perfectODT-SAMs on gold (111) [Hard, 1998]. However, the jidd techniqueshowed that the ODT-adlayers formed at the gold/gold chloride interface
were heterogeneous with a high jJLdd value (Figure 40). The (idd pictureshows local heterogeneities and suggests an overall low ordered ODT-
adlayer formation [Hofe,2000]
Fig. 40: Microdroplet-density picture of a gold chloride-modified Ta20^
chip coated with an octadecyl thiol SAM. The image size is 1.2 x
1.3 mm.
184
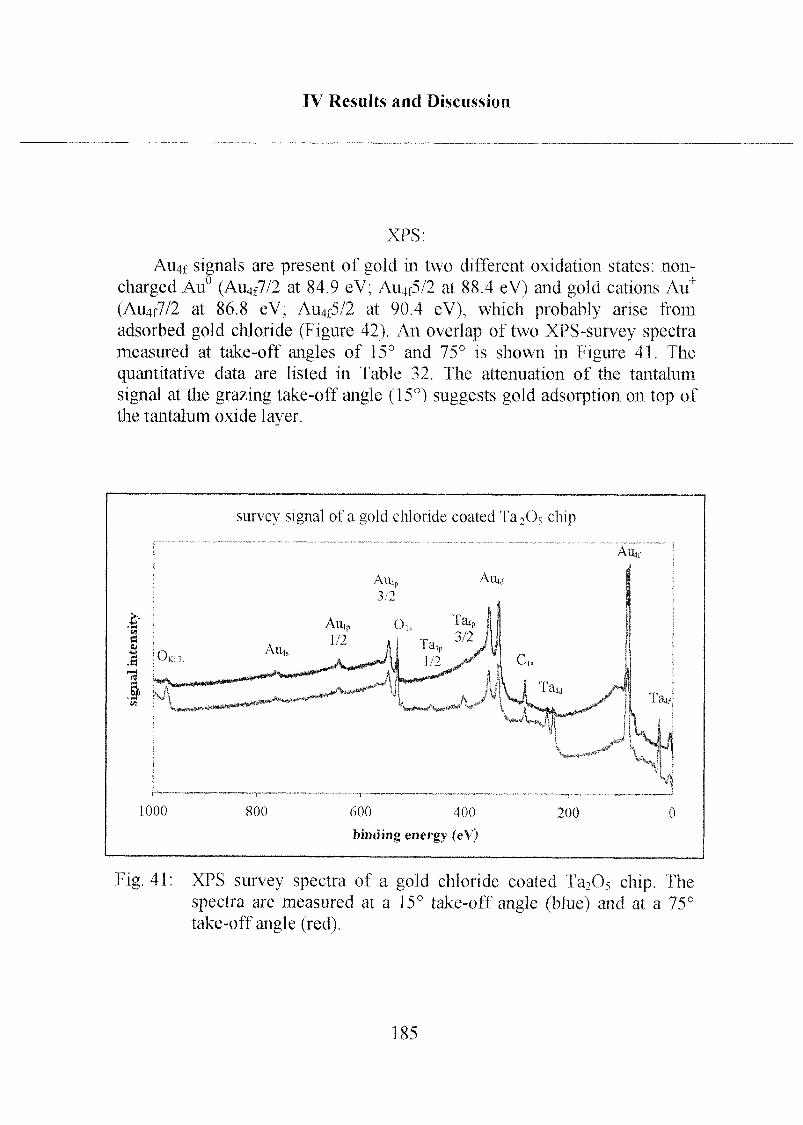
IV Results and Discussion
XPS:
Au4f signals are present of gold in two different oxidation states: non-
charged Au (Au4f7/2 at 84.9 eV; Au4t5/2 at 88.4 eV) and gold cations An1
(Au4f7/2 at 86.8 eV; Au4f5/2 at 90.4 eV), which probably anse from
adsorbed gold chloride (Figure 42). An overlap of two XPS-survey spectrameasured at take-off angles of 15° and 75° is shown in Figure 41. The
quantitative data are listed in Table 32. The attenuation of the tantalum
signal at the grazing take-off angle (15°) suggests gold adsorption on top of
the tantalum oxide layer.
Fig. 41: XPS survey spectra of a gold chloride coated Ta20 chip. The
spectra are measured at a 15° take-off angle (blue) and at a 75°
take-off angle (red).
185
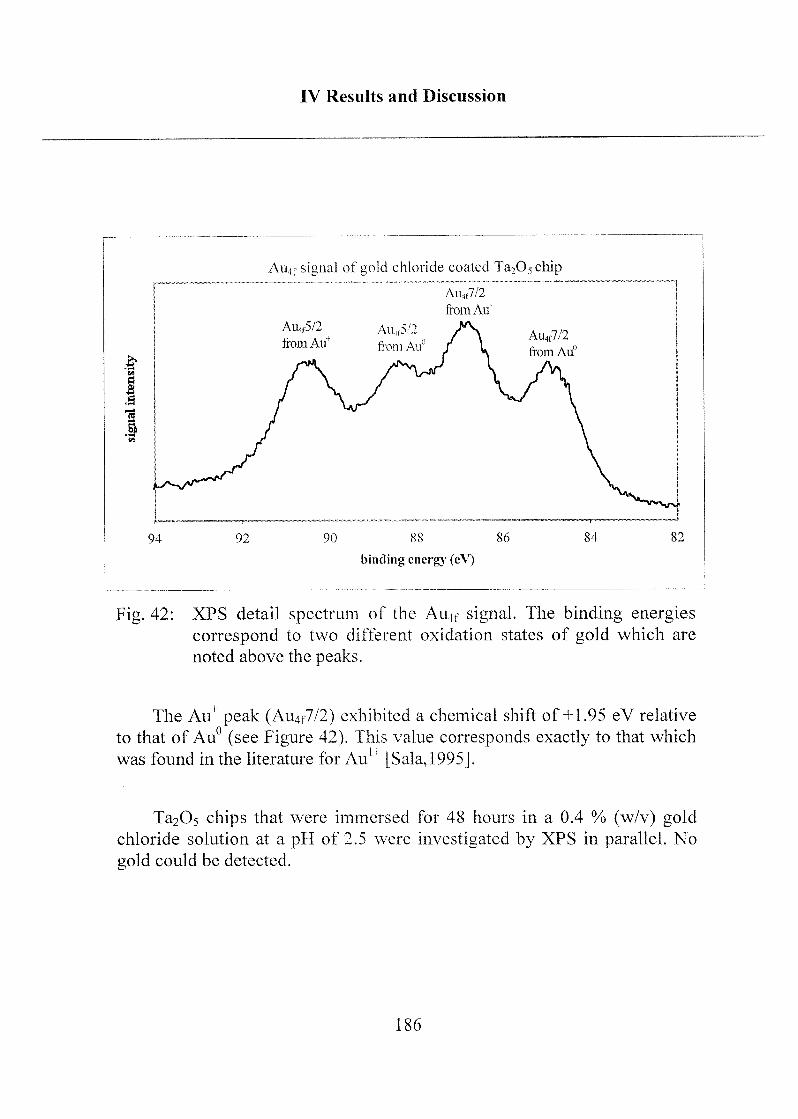
IV Results and Discussion
Au4t signal of gold chloride coated Ta205chip
Au,t7/2
from Au4
94 92 90 88 86 84 82
binding energy (eV)
Fig. 42: XPS detail spectrum of the Au4f signal. The binding energies
correspond to two different oxidation states of gold which are
noted above the peaks.
The Auf peak (Au4r7/2) exhibited a chemical shift of+1.95 eV relative
to that of Au° (see Figure 42). This value corresponds exactly to that which
was found in the literature for Au1* [Sala, 1995].
Ta2Os chips that were immersed for 48 hours in a 0.4 % (w/v) goldchloride solution at a pH of 2.5 were investigated by XPS in parallel. No
gold could be detected.
186
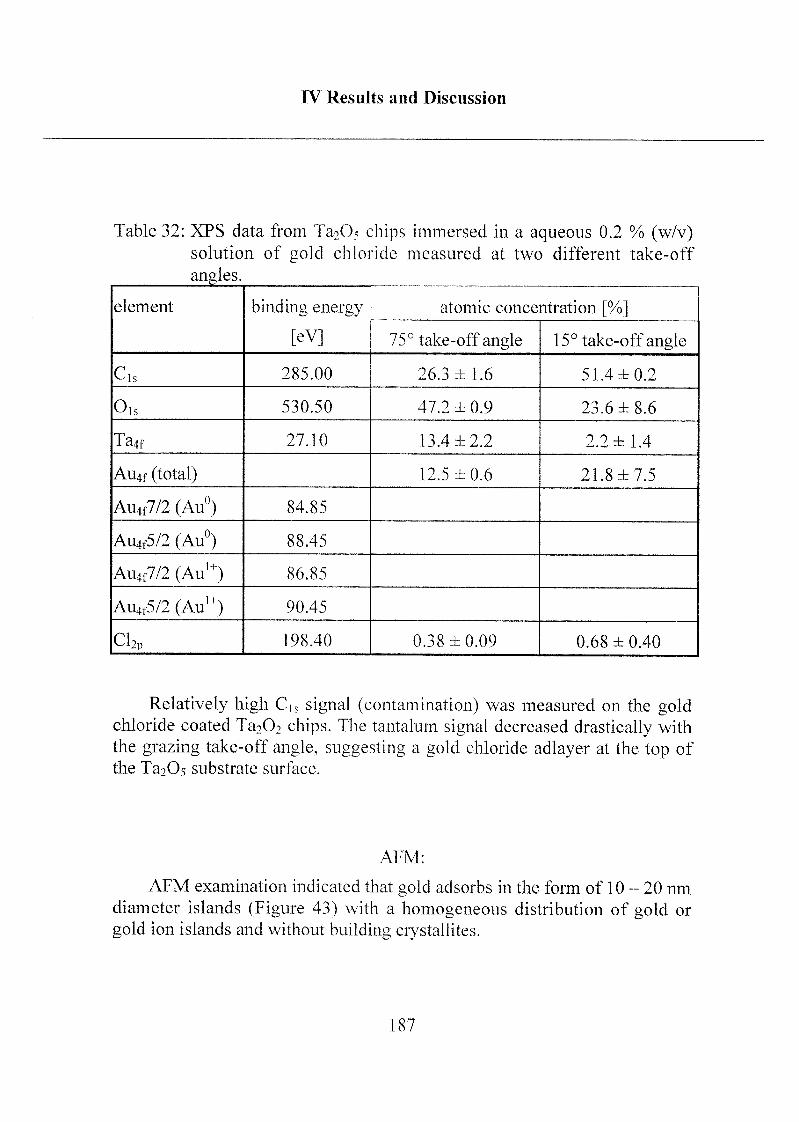
IV Results and Discussion
Table 32: XPS data from Ta^Os chips immersed in a aqueous 0.2 % (w/v)solution of gold chloride measured at two different take-off
angles.i
element binding energy
[eV]
atomic concentration [%]
75° take-off angle 15° take-off angle
Cls 285.00 26.3 ±1.6 51.4 ±0.2
Ou 530.50 47.2 ± 0.9 23.6 ±8.6
Ta4f 27.10 13.4 ±2.2 2.2 ±1.4
Au4f (total) 12.5 ±0.6 21.8 ±7.5
Au4f7/2 (Au°) 84.85
Au4f5/2 (Au°) 88.45
Au4f7/2 (Au,+) 86.85
Au4f5/2 (Au1+) 90.45
Cl2p 198.40 0.38 ±0.09 0.68 ±0.40
Relatively high Cis signal (contamination) was measured on the goldchloride coated Ta202 chips. The tantalum signal decreased drastically with
the grazing take-off angle, suggesting a gold chloride adlayer at the top of
the Ta2Os substrate surface.
ATM:
AFM examination indicated that gold adsorbs in the form of 10 - 20 nm
diameter islands (Figure 43) with a homogeneous distribution of gold or
gold ion islands and without building crystallites.
187
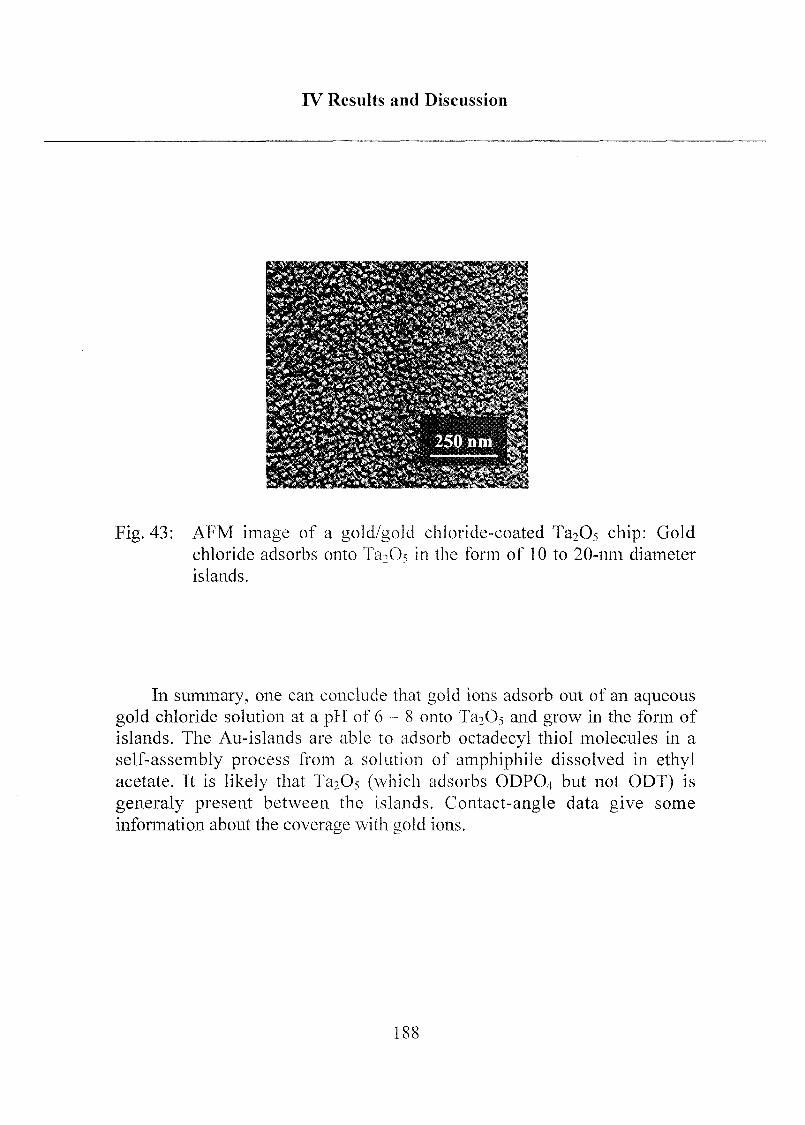
IV Results and Discussion
Fig. 43: AFM image of a gold/gold chloride-coated Ta2C>5 chip: Gold
chloride adsorbs onto Ta2Os in the form of 10 to 20-nm diameter
islands.
In summary, one can conclude that gold ions adsorb out of an aqueous
gold chloride solution at a pH of 6-8 onto Ta2C^ and grow in the form of
islands. The Au-islands are able to adsorb octadecyl thiol molecules in a
self-assembly process from a solution of amphiphile dissolved in ethylacetate. It is likely that Ta20, (which adsorbs ODP04 but not ODT) is
generaly present between the islands. Contact-angle data give some
information about the coverage with gold ions.
188
IV Results and Discussion
The waveguide properties of the Ta20s were completely changed after
the modification with gold chloride. The adsorbed gold/gold chloride
resulted in a complete absorption of the incoupled laser light. This makes the
system non-usable for the optical bio-affinity sensor method FOBIA.
Nevertheless, a more profound study of the applications of a gold ion
(or silver ion) interface in between the metal oxide waveguide layer and the
alkyl thiol SAM would be interesting. If the adsorbed noble metal (Au or
Ag) could be stabilized in the oxidized form (e.g. as a complex), thiols could
be self-assembled on evanescent field optical sensors. The advantages of
thiol chemistry (large number of commercially available functionalized alkylthiols) and the good waveguide properties of metal oxides such as TaiOs
could be combined in such a system.
Since the phosph(on)ate and the PLL-PEG chemistry constitute two systemsthat turned out to be very successful for the surface modification of metal
oxide-based chips, no further experiments were done with the gold/oxide
system.
189
IV Results and Discussion
2.3Stability of Modified Surfaces
Amphiphiles that were considered to be the most promising candidates
for sensor applications were investigated as regards the stability of their self-
assembled adlayers. The systems for the stability tests in water are octadecyl
phosphate (ODPO4), octadecyl phosphonate (ODPO3), dodecyl phosphate
(DDPO4) and dodecyl phosphonate (DDPO3), and the adlayer amphiphilesfor the stability studies in different buffers are ODPO4, ODPO3 as well as
the PLL(20)-g[5]-PEG(2) copolymer.
2.3.1 Stability of Hydrophobic Phosph(on)ate SAMs in Water
Ta205-chips were sonicated in 2-propanol for 15 minutes followed by
UV-cleaning for 30 minutes (standard cleaning protocol). Chips were then
immediately transferred into one of the 0.5 mM alkyl phosph(on)atesolutions for self-assembly. (Solutions: ODPO4 in n-heptane + 0.4%
2-propanol, ODPO3 in n-heptane + 1.5% 2-propanol, DDPO3 in n-heptane +
0.8% 2-propanol and DDP04(NH4)2 in water). The samples were removed
after 48 hours of immersion time, rinsed with 2-propanol and blow-dried
with nitrogen.
The stability of the hydrophobic alkyl phosph(on)ate SAMs on TaiOs
surfaces in contact with water were studied by rinsing the amphiphile-coatedchips with pure water and after an immersion time of 3 days.
Results of the SAM stability in water are listed in the appendix (App.18 and 19). Contact angle and (idd data are presented, showing similar
results as for ODPO4 (for details of ODPO4 SAM-stability in water or in
PBS, see chapter IV 2.1.1.2): A short rinsing results in a small decrease of
the contact-angle and a strong reduction of the u,dd. This is believed to be
due to removal of non-specifically adsorbed molecules. Longer storage in
water (e.g. 3 days) at room temperature reduces the average monolayerthickness by a few % and affects the homogeneity and the order within the
amphiphile adlayer, resulting in a significant increase of the (idd.
190
IV Results and Discussion
If the hydrophobic SAM is coated by macromolecules such as proteins(see chapter TV 3) a larger amount of alkyl phosphate molecules is
connected by hydrophobic interaction with the adsorbed macromolecules,resulting in a higher stability of the SAM.
2.3.2 Stability of Phosph(on)ate SAMs and PLL-PEG Adlayers in
Different Buffer Systems
Since the modified metal oxide surfaces may be used for DNA/RNA
sensor application studies, one candidate out of each adsorbent group (alkylphosphate, alkyl phosphonate and PLL-PEG) was investigated concerningits adlayer stability on Ta205. Amphiphile-coated Ta205 chips were, there¬
fore, immersed in different relevant buffer systems (Table 33) that are
widely used for surface chemistiy such as DNA hybridization, washing stepsand regeneration if working with immobilized recognition molecules.
Adsorbent solutions were prepared as follows: 0.5 mM ODPO4 in
n-heptane + 0.4%) 2-propanol, 0.5 mM ODPO3 in n-heptane + 1.5%
2-propanol and 1 mg/ml PLL(20)-g[5]-PEG(2) in HEPES-buffer pH 7.4.
Ta2Û5 chips were cleaned according to the standard cleaning protocolmentioned above and subsequently transferred into one of the preparedadsorbent solutions. Samples from PLL-PEG coating were removed after 2
hours from the solution, rinsed with water and blow-dried with nitrogen.Samples from phosph(on)ate self-assembly were removed from the solutions
after 48 hours, rinsed with 2-propanol and also blow-dried with nitrogen.
Two samples of each coating variant were now stored in one of the
buffer systems (see list below) for different times and different temperatures,according to the conditions that are needed for the correspondingapplications, such as oligonucleotide hybridization and regeneration.Samples were removed from the buffer solutions and extensively rinsed with
pure water (ca. 200 ml each).
191
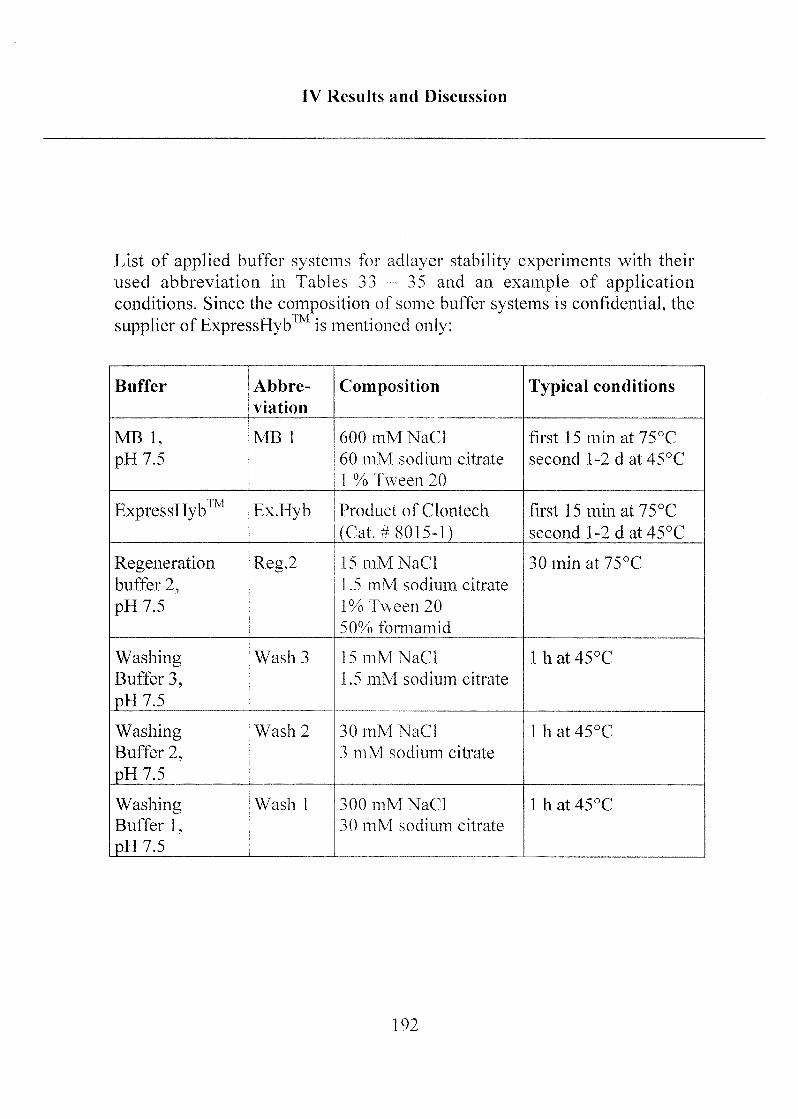
IV Results and Discussion
List of applied buffer systems for adlayer stability experiments with their
used abbreviation in Tables 33 - 35 and an example of applicationconditions. Since the composition of some buffer systems is confidential, the
supplier of ExpressHyb1M is mentioned only:
Buffer Abbre¬
viation
Composition Typical conditions
MB 1,
pH7.5
MB 1 600 mM NaCl
60 mM sodium citrate
1 % Tween 20
first 15 min at 75°C
second l-2dat45°C
ExpressHyb'M
Ex.Hyb Product of Clontech
(Cat. #8015-1)
first 15 minat 75°C
second 1-2 d at 45°C
Regenerationbuffer 2,
pH7.5
Reg.2 15 mM NaCl
1.5 mM sodium citrate
1% Tween 20
50% formamid
30 min at 75 °C
WashingBuffer 3,
pH7.5
Wash 3 15 mM NaCl
1.5 mM sodium citrate
1 h at 45°C
WashingBuffer 2,
pH7.5
Wash 2 30 mM NaCl
3 mM sodium citrate
1 h at 45°C
WashingBuffer 1,
pH7.5
Wash 1 300 mM NaCl
30 mM sodium citrate
1 h at 45°C
192

IV Results and Discussion
Advancing water-contact angle and XPS analyses were performed. XPS
spectra were measured at a take-off angle of 15° with respect to the surface
plane to get surface-sensitive information. The results are presented in
Tables 33-35.
Table 33: Contact-angle and XPS data from ODPO4 self-assembled from a
0.5 mM solution in n-heptane/2-propanol on Ta205. Samples were
measured before and after immersion in different buffer systems
(see list of buffers in text) and under different conditions.
Buffer conditions contact angle
[°l
XPS: atomic ratio [%] Add.
Elem.time temp. [°C] C Ta O P C/Ta
before 112.2 ±0.8 85 2.9 11 1.4 29.3 no
MB1 15 min 75° C 85.3 ± 1.5 54 9.4 36 1.4 5.7 no
2d 45° C 47.5 ±2.3 42 10.0 48 0.9 4.2 Na
Ex.Hyb 15 min 75° C 56.9 ±1.7 43 10.1 44 2.8 4.3 no
2d 45° C 47.0 ± 1.0 43 9.3 45 3.1 4.7 Na
Reg.2 30 min 75° C 100.4 ±1.4 70 6.4 23 1.3 10.9 no
Wash 3 60 min 45° C 108.4 ±0.9 80 4.4 14 1.4 18.2 no
Wash 2 60 min 45° C 98.5 ±3.5 66 7.5 27 1.5 8.8 no
Washl 60 min 45° C 82.7 ±1.9 55 9.2 35 1.5 6.0 Na
193
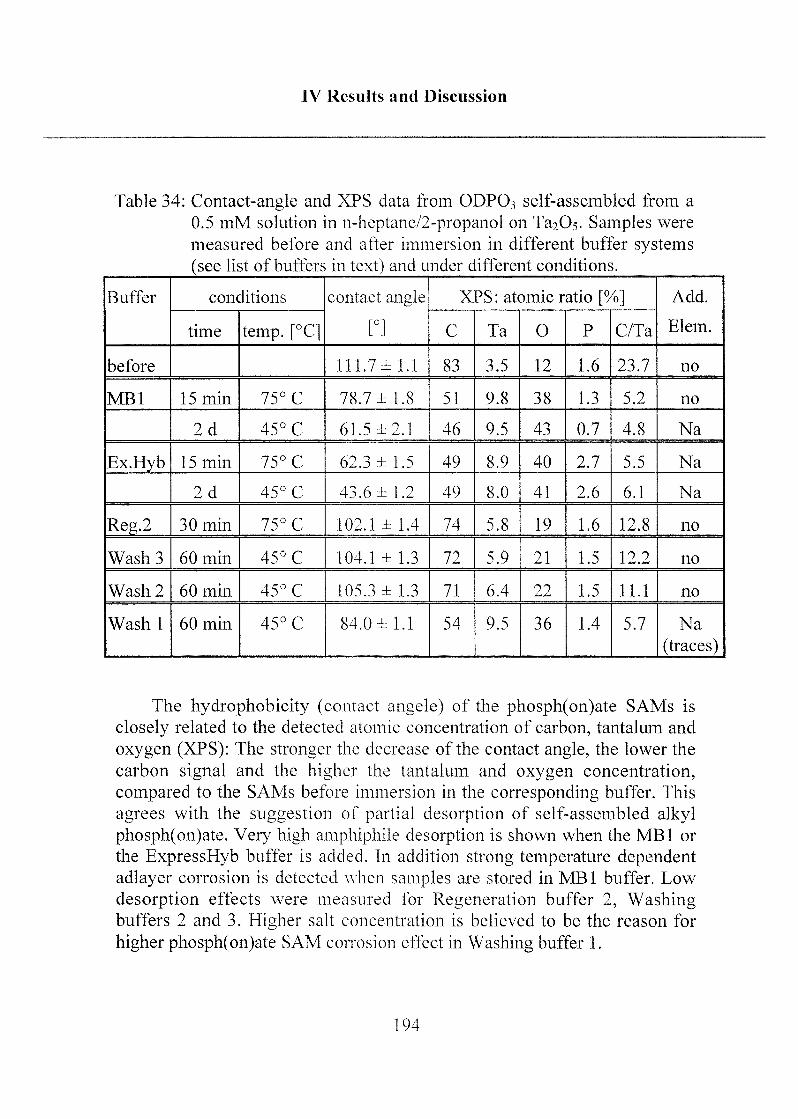
IV Results and Discussion
Table 34: Contact-angle and XPS data from ODPO3 self-assembled from a
0.5 mM solution in n-heptane/2-propanol on Ta20s. Samples were
measured before and after immersion in different buffer systems
(see list of buffers in text) and under different conditions.
Buffer conditions contact angle
L°l
XPS: atomic ratio [%] Add.
Elem.time temp. [°C] C Ta O P C/Ta
before 111.7 ±1.1 83 3.5 12 1.6 23.7 no
MBl 15 min 75° C 78.7±1.8 51 9.8 38 1.3 5.2 no
2d 45° C 61.5 ±2.1 46 9.5 43 0.7 4.8 Na
Ex.Hyb 15 min 75° C 62.3 ±1.5 49 8.9 40 2.7 5.5 Na
2d 45° C 43.6 ±1.2 49 8.0 41 2.6 6.1 Na
Reg.2 30 min 75° C 102.1 ±1.4 74 5.8 19 1.6 12.8 no
Wash 3 60 min 45° C 104.1 ±1.3 72 5.9 21 1.5 12.2 no
Wash 2 60 min 45° C 105.3 ±1.3 71 6.4 22 1.5 11.1 no
Washl 60 min 45° C 84.0±1.1 54 9.5 36 1.4 5.7 Na
(traces)
The hydrophobicity (contact angele) of the phosph(on)ate SAMs is
closely related to the detected atomic concentration of carbon, tantalum and
oxygen (XPS): The stronger the decrease of the contact angle, the lower the
carbon signal and the higher the tantalum and oxygen concentration,
compared to the SAMs before immersion in the corresponding buffer. This
agrees with the suggestion of partial desorption of self-assembled alkyl
phosph(on)ate. Very high amphiphile desorption is shown when the MBl or
the ExpressHyb buffer is added. In addition strong temperature dependentadlayer corrosion is detected when samples are stored in MBl buffer. Low
desorption effects were measured for Regeneration buffer 2, Washingbuffers 2 and 3. Higher salt concentration is believed to be the reason for
higher phosph(on)ate SAM corrosion effect in Washing buffer 1.
194
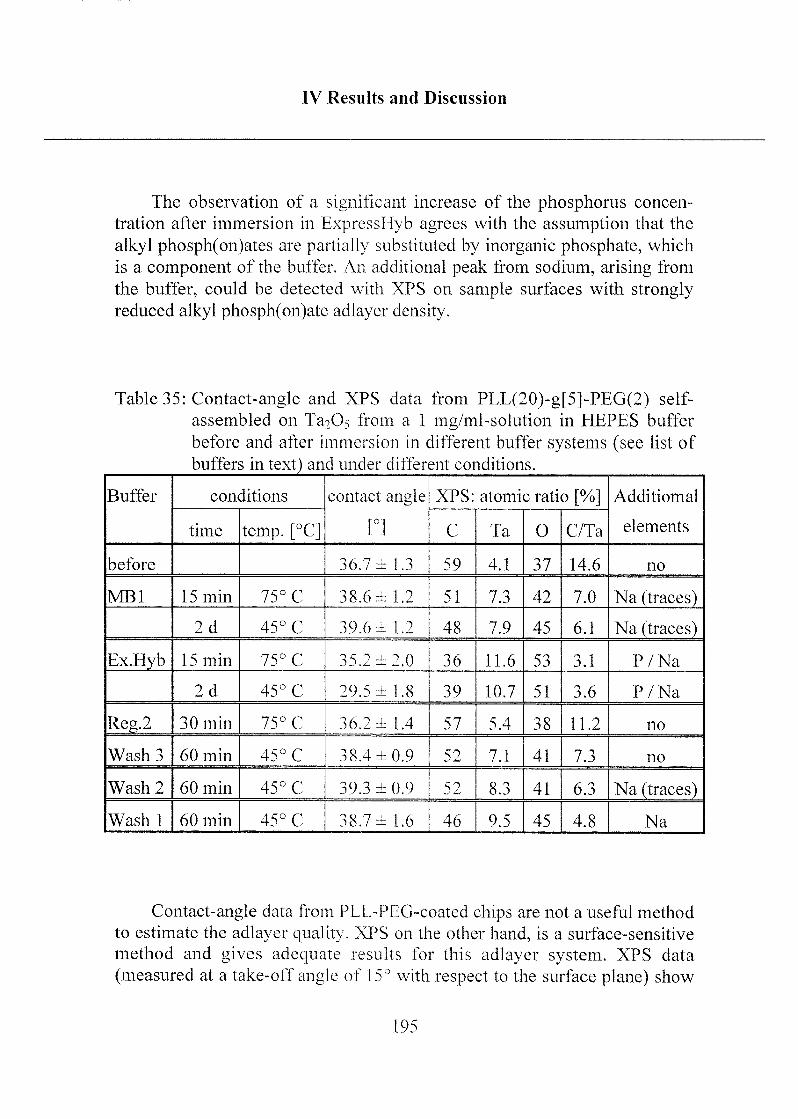
IV Results and Discussion
The observation of a significant increase of the phosphorus concen¬
tration after immersion in ExpressHyb agrees with the assumption that the
alkyl phosph(on)ates are partially substituted by inorganic phosphate, which
is a component of the buffer. An additional peak from sodium, arising from
the buffer, could be detected with XPS on sample surfaces with stronglyreduced alkyl phosph(on)ate adlayer density.
Table 35: Contact-angle and XPS data from PLL(20)-g[5]-PEG(2) self-
assembled on Ta2Os from a 1 mg/ml-solution in HEPES buffer
before and after immersion in different buffer systems (see list of
buffers in text) and under different conditions.
Buffer conditions contact angle
I°]
XPS: atomic ratio [%] Additiomal
elementstime temp. [°C] C Ta O C/Ta
before 36.7 ±1.3 59 4.1 37 14.6 no
MB1 15 min 75° C 38.6 ±1.2 51 7.3 42 7.0 Na (traces)
2d 45° C 39.6 ± 1.2 48 7.9 45 6.1 Na (traces)
Ex.Hyb 15 min 75° C 35.2 ±2.0 36 11.6 53 3.1 P/Na
2d 45° C 29.5 ±1.8 39 10.7 51 3.6 P/Na
Reg.2 30 min 75° C 36.2 ±1.4 57 5.4 38 11.2 no
Wash 3 60 min 45° C 38.4 ± 0.9 52 7.1 41 7.3 no
Wash 2 60 min 45° C 39.3 ± 0.9 52 8.3 41 6.3 Na (traces)
Wash I 60 min 45° C .1o,/ i l.O 46 9.5 45 4.8 Na
Contact-angle data from PLL-PEG-coated chips are not a useful method
to estimate the adlayer quality. XPS on the other hand, is a surface-sensitive
method and gives adequate results for this adlayer system. XPS data
(measured at a take-off angle of 15° with respect to the surface plane) show
195
IV Results and Discussion
similar results as for the hydrophobic alky I phosp(on)ate SAMs. Increased
tantalum and oxygen concentrations as well as significantly lower carbon
concentrations were detected after immersion in MB1 and ExpressIIybbuffer, respectively. Smaller, but still significant desorption effects could
also be detected for the other buffer s\ stems. Appearance of phosphorus and
sodium after immersion in ExpressHyb again points to phosphate-inducedmodification of the TaiCVPLL-PEG surface,
We conclude that the adlayers (especially hydrophobic SAMs) are
reasonably stable in water but less stable in buffer systems containingdetergents.
Since the surface modifications are predominantly performed for
further immobilization of proteins (enzymes or antibodies) without
additional chemical processes, the results of the ad layer stability in different
buffer systems will not be further discussed.
Nevertheless, the data pro\ ide results that have to be kept in mind for
the biosensor surface performance of the different oxide surface modifi¬
cations (see chapter IV 3.2.4). SAMs from ODPO3 and ODPO4, are formed
from a similar solvent and under the same conditions. Quantitative C/Ta
ratio XPS results from the coated chips before their incubation in the
different buffer solutions show a significant different between the two
octadecyl phosph(on)ate systems. The contact angle shows similar
wettability for both the ODPOi and ODPO, SAMs, but the C/Ta ratio for
alkyl phosphate SAMs is significant!} higher than that for alkyl phosphonateSAMs. This cannot be explained b\ the difference in length of the unfolded
molecules, but is believed to be due to differences in the densit> of
monolayer packing.
196
IV Results and Discussion
3 Immobilization of Biomolecules and Quantification of
Target Molecules
Recognition molecules were immobilized via the specific binding of
streptavidin conjugated enzymes onto biotinylated surfaces or by usingstreptavidin as an interface between biotin activated surfaces and biotin
conjugated antibodies.
The densities of immobilized recognition molecules were not measured
(e.g. by the OWLS technique) since we were essentially interested in their
activity, rather in the amount of adsorbed capture molecules. The activity of
immobilized biomolecules was determined by the quantification of
converted substrate in the case of enzymes and by measuring the targetmolecule concentration that binds to the antibody sensor surface.
As described in the introduction there is a large number of different
methods for the quantification of target molecules. We decided to use two
generally different methods: an enzyme/substrate and an antibody/antigen(immunoassay) system. For the enzymatic test setup we measured the
horseradish peroxidase activity of adsorbed biomolecules on the different
self-assembled monolayers. The results were used to screen the large list of
phosph(on)ates and PLL-PEG derivatives and to select the best candidates in
terms of dose-response for future implementation.
The adsorbents with the highest sensitivity were then used for the
optical biosensor application tests. The immunoassay that was chosen is a
simple rabbit IgG - goat anti rabbit IgG system.
197
IV Results and Discussion
3.1Enzymatic Activity of Horseradish Peroxidase
All the enzymatic activity tests were executed according to the protocol
explained in Scheme 17:
General test protocol: Metal oxide samples were cleaned by one of the
standard cleaning methods followed by self-assembly of the adsorbents. The
samples that were coated with PLL-PEG/PEGbiotin derivatives were readyfor the immobilization of streptavidin conjugated enzyme while the
hydrophobic phosph(on)ate SAMs had to be coated with an additional layerof biotinylated bovine serum albumin (BSA-biotin). This additional layer is
needed to activate the surfaces for the immobilization of the enzyme via the
conjugated streptavidin and to create a passivation layer for non-specific
protein adsorption. The coated metal oxide samples were then transferred in
a common glass container filled with a solution of streptavidin-conjugatedhorseradish peroxidase in HEPES buffer pH 7.4. After the enzyme-
immobilization step, the samples were rinsed with HEPES buffer followed
by a second rinsing with citrate buffer pH 6.0. All samples were then
separately stored in 0.8 ml of citrate buffer until the reaction was started. 0.8
ml of citrate buffer containing EbOi (substrate) and the indicator 3,3',5,5'-
tetramethylbenzidine (TMB) were used (reaction start). The solutions,
containing the enzyme-coated samples, were gently shaken during the
reaction (solution turned slowly to blue). After 10 minutes the metal oxide
slides were removed and the reaction was immediately stopped by adding100 (il of H2SO4 (solution turned yellow). The color intensity, which is
directly proportional to the enzymatic activity, was determined by measuringthe light absorption at X = 450 nm.
198
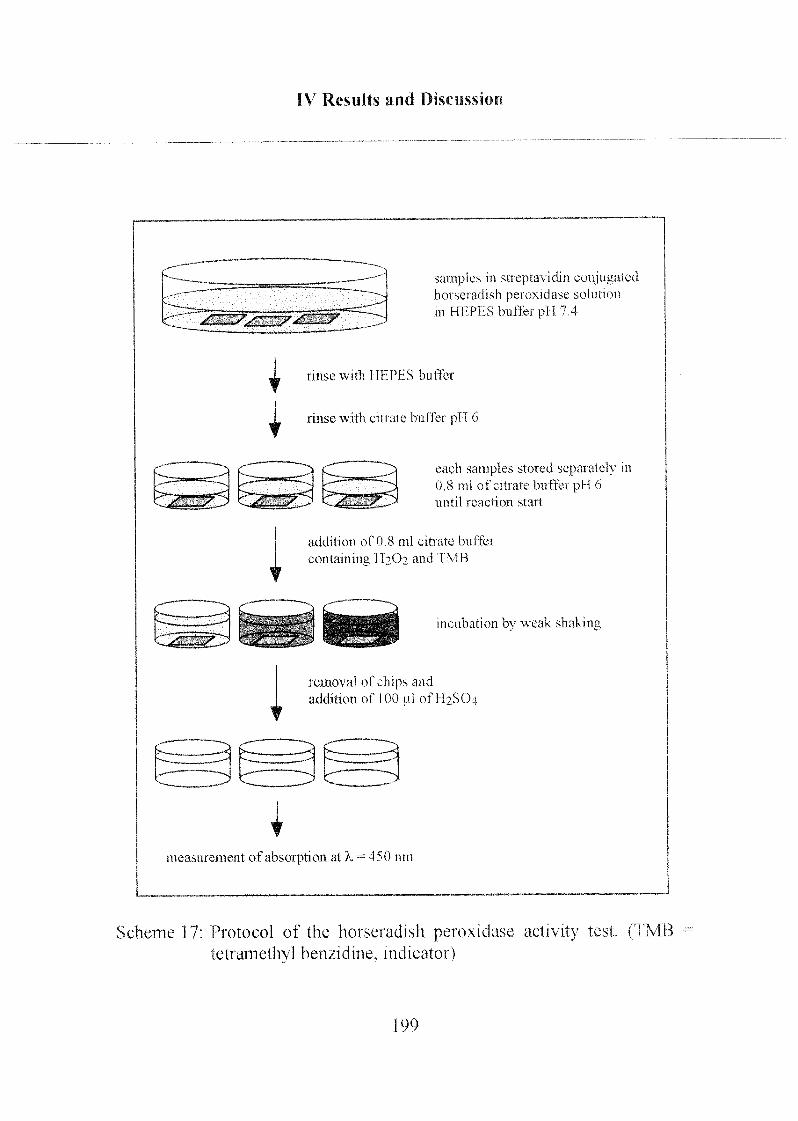
IV Results and Discussion
^^^^^^P'^^^P'
samples in streptavidin conjugatedhorseradish peroxidase solution
in HEPES buffer pH 7.4
X rinse with HEPES buffer
L rinse with citrate buffer pH 6
I
each samples stored separately in
0.8 ml of citrate buffer pH 6
until reaction start
addition of 0.8 ml citrate buffer
containing EbO? and TMB
incubation by weak shaking
removal of chips and
addition of 100 ul of H2SO4
measurement of absorption at X = 450 nm
Scheme 17: Protocol of the horseradish peroxidase activity test, (TMB
tetramethyl benzidine, indicator)
199
IV Results and Discussion
3.1.1 Peroxidase Activity on PLL-PEG Coated Chip
Buffers and solutions were prepared as follows:
HEPES buffer pH 7.4: 10 mM HEPES, adjusted to pH 7.4 with 1 M NaOH.
Enzyme solution: Streptavidin-conjugated horseradish peroxidase
(0.3 mg peroxidase/ml and 0.1 rag streptavidin/ml)was purchased as an aqueous solution.
Enzyme dilutions: The enzyme solution described above was diluted
with citrate buffer to 20 ppm, 10 ppm, 2 ppm,
1 ppm, 0.2 ppm, 0.1 ppm and 0.02 ppm.
Citrate buffer pH 6.0: 8.2 g of sodium acetate were dissolved in 1 liter of
water (0.1 mo El) and the pH was adjusted to 6.0
with citric acid.
EECE solution: 26 pi of hydrogen peroxide (30 %) were added to
100 nil of citrate buffer (0.008 %).
TMB solution: 21.3 mg of tetramethyl benzidin were dissolved in
2.13 mfof DMSO (42 mrnol/1).
Start-solution: 20 ml of EECE solution were mixed with 400 pi of
TMB solution.
Stop-solution: 1.1 ml EESCE (98%) were diluted with 8.9 ml of
water (2 mol/1).
The activity of the immobilized enzymes (specific binding) on self-
assembled functionalized copolymer derivatives PLL(20)-g[3.5]-PEG(2)
/PEGbiotin(3.4)10% and PLE(20)-g[3.51-PEG(2)/PEGbiotin(3.4)50% was
investigated in comparison with the non-specific binding on self-assembled
non-functionalized polymer PEL(20)-g[3.5 ]-PEG(2):
200
IV Results and Discussion
TiOi chips (10 x 10 mm) were sonicated in 2-propanol for 15 minutes
followed by an oxygen-plasma cleaning for 2 minutes. One glass container
was prepared for each of the PLL-PEG/PEGbiotin derivatives. The metal
oxide samples were transferred into the glass containers and covered with a
lmg/ml-solution (in HEPES buffer pH 7.4) of the corresponding adsorbent.
Samples were incubated in the solutions for self-assembly over 12 hours,rinsed with HEPES buffer and transferred in a common container for
enzyme immobilization.
A solution of streptavidin-conjugated horseradish peroxidase (dilution =
1/1000 with HEPES buffer pH 7.4) was added and the samples were
immersed for 40 minutes for enzyme immobilization. The samples were
removed and rinsed with 2 ml of HEPES buffer, followed by a rinsing with
2 ml of citrate buffer pH 6.0. Each sample was now stored separately in
0.8 ml of citrate buffer until reaction start.
Each sample was covered with 0.8 ml of freshly mixed "start-solution".
The containers were weakly shaken during the incubation step. The metal
oxide chips were removed after an incubation time of 10 minutes and the
enzymatic reaction was immediately stopped, by adding 0.1 ml of "stop-solution".
A standard series of diluted enzyme solution were prepared and 0.8 ml
of each dilution were filled in an empty container instead of the 0.8 ml
portions of citrate buffer at the first step of the procedure. The procedurewas followed according to the protocol exactly the same way as for the
samples containing the metal oxide chips.
The light absorption at the wavelength of 450 nm was measured for
each sample as well as the standard series. The results of the coated metal
oxide chips were divided by the corresponding metal oxide surface areas.
The absorption, corresponding to enzyme activities of the different surface
coatings, are plotted as a function of the enzyme concentration of the
standard series (Figure 44).
201
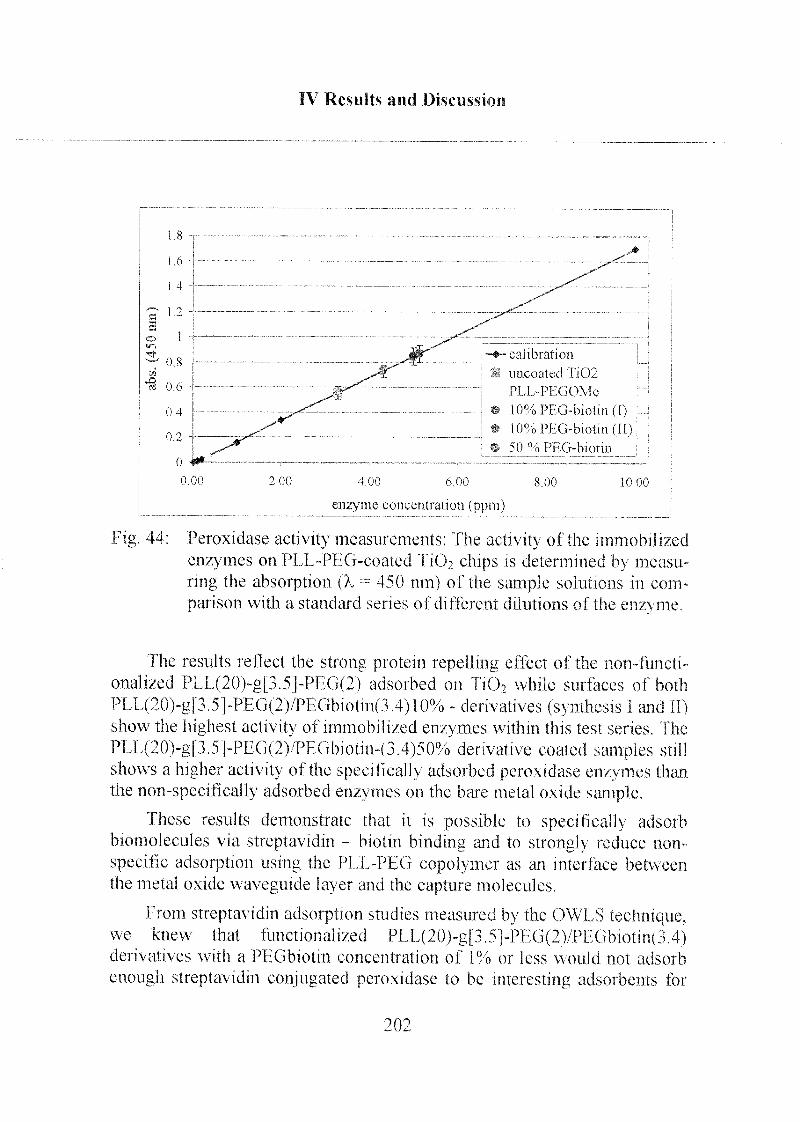
IV Results and Discussion
0 00 2 00 4 00 (> 00 8 00 10 00
enzyme concentration (ppm)
Fig, 44: Peroxidase activity measurements: The activity of the immobilized
enzymes on PLL-PEG-coated TiO: chips is determined by measu¬
ring the absorption (k ~ 450 nm) of the sample solutions in com¬
parison with a standard series of different dilutions of the en/yme.
The results reflect the strong protein repelling effect of the non-functi-
onalt/ed PLL(20)-g|3.5]-PHG(2) adsorbed on TiCb while surfaces of both
PI L(20)-gl3.5j-PHG(2VPEGbiotm(3.4)10% - derivatives (synthesis I and II)show the highest activity of immobili/ed enzymes within this test series. The
PLL(20)-g[3.5]-PHG(2)/PEGbiotin-(3.4)50% derivative coated samples still
shows a higher activity of the specifically adsorbed peroxidase enzymes than
the non-specifically adsorbed enzymes on the bare metal oxide sample,
These results demonstrate that it is possible to specifically adsorb
biomolecules via streptavidin - biotin binding and to strongly reduce non¬
specific adsorption using the PI 1 --PEG copolymer as an interface between
the metal oxide waveguide layer and the capture molecules,
from streptavidin adsorption studies measured by the OWES technique,we knew that functionahzed PEL(20)-g|3.5|-PHG(2)/PEGbiotin(3.4)derivatives with a PEGbiotin concentration of l°o or less would not adsorb
enough streptavidin conjugated peroxidase to be interesting adsorbents for
202
IV Results and Discussion
biosensor applications. The optimum amount of PEGbiotin was therefore
believed to be higher than 1% and lower than 50%.
The conjugation ratio of streptavidin/enzyme is 1 mg streptavidin(60'000 g/mol)/3mg peroxidase (44'000 g/mol), corresponding to a
molecular streptavidin/enzyme ratio of about 1/4. The area that is covered byone streptavidin-enzyme conjugate is about 50 nm~. However, the metal
oxide substrate area that is covered by one PLL-PEG/PEGbiotin copolymermolecule is about 20 nm2. Assuming a 100% accessibility of the biotin
groups on self-assembled PLL-PEG/PEGbiotin adlayers, and no overlap of
the copolymer molecules, a concentration of 0.4 biotin groups per
copolymer would be needed to bind one monolayer of streptavidin-enzymeconjugate (occupation of 1 of the 4 streptavidin binding sites by biotin; or
0.8 biotin groups per copolymer, if 2 of the 4 streptavidin binding sites are
used for the binding). The calculation predicts an excessively high biotin
concentration of the 50-%-PEGbiotin derivative (14 biotin molecules per
copolymer molecule). An excess of biotin functionalities allows for highlydense packing of immobilized recognition elements (surface overload). This
is in good agreement with the enzyme-activity tests, where an enzyme'sstress (or steric hindrance) is believed to reduce their activity. On the other
hand, a chip that is covered by the 1-%-PEGbiotin derivative (0.3 biotin
molecules per copolymer molecule) is not able to bind enough enzyme-
conjugate to form a complete enzyme monolayer. The average biotin
concentration of 2.7 biotin groups per PLL(20)-g[3.5]-PEG(2)/PEG-biotin(3.4)10% copolymer molecule is still significantly higher than the
calculated optimum of 0.4 to 0.8 biotin functionalities per copolymer.Considering that only a fraction of the biotin molecules is accessible, which
is reasonable for relatively long side-chain PEG polymers, the calculated
value for the 10-%-PEGbiotin derivative approaches to the optimum. This is
also reflected in the experimental results.
New derivatives such as PLL(20)-g[3.5J-PEG(2)/PEGbiotin(3.4)5%,15% and 20% were synthesized according to the protocol PLL(20)-g[3.5]-PEG(2)/PEGbiotin(3.4)10% II synthesis. These were directly tested with the
FOBIA system.
203
IV Results and Discussion
3.1.2 Peroxidase Activity on Phosph(on)ate Coated Chip
Buffers and solutions were prepared as follows:
HEPES buffer pH 7.4:
BSA-biotin:
Enzyme sol. (strept-hrp):
Enzyme dilutions T:
Enzyme sol. (hrp):
Enzyme dilutions II:
Citrate buffer pH 6.0:
H202 solution:
TMB solution:
Start-solution:
Stop-solution:
10 mM HEPES, adjusted to pH 7.4 with 1 M
NaOH.
1 mg/ml in ultra pure water
Streptavidin-conjugated horseradish peroxidase(0.3 mg peroxidase/ml and 0.1 mg streptavi-din/ml) was purchased as an aqueous solution.
The enzyme solution (strept-hrp) described
above was diluted with citrate buffer to 20 ppm,
10 ppm, 2 ppm, 1 ppm, 0.2 ppm, 0.1 ppm and
0.02 ppm for the standard series.
Non-conjugated horseradish peroxidase solution
( I kU/ml) was diluted to 1 U/ml.
The enzyme solution (hrp) described above was
diluted with citrate buffer to 20 ppm, 10 ppm,2 ppm, 1 ppm, 0.2 ppm, 0.1 ppm and 0.02 ppmfor the standard series.
8.2 g of sodium acetate were dissolved in 1 liter
of water (0.1 mol/1) and the pH was adjusted to
6.0 with citric acid.
26 (il of hydrogen peroxide (30 %) were added
to 100 ml of citrate buffer (0.008 %).
21.3 mg of TMB were dissolved in 2.13 ml of
DMSO (42 mmol/1).
20 ml of H2O2 solution were mixed with 400 julIof TMB solution.
1.1 ml H2S04 (98%) were diluted with 8.9 ml of
water (2 mol/1).
204
IV Results and Discussion
The activity of the immobilized enz\mes on hydrophobicphosph(on)ate SAMs was investigated: The specific binding of enzymes was
performed via activation of the SAMs with biotinylated BSA (BSA-biotin)and binding of streptavidin-conjugated horseradish peroxidase thereon. The
non-specific binding of the enzyme was studied by immersing
phosph(on)ate-coated and BSA-biotin-activated samples in a non-
streptavidin-conjugated horseradish peroxidase solution.
Four different phoph(on)ate solutions were prepared: a) 0.5 mM
ODPO4 in n-heptane + 0.4% 2-propanol. b) 0.5 mM ODP03 in n-heptane +
1.5% 2-propanol, c) 0.5 mM DDPCh in n-heptane + 0.8% 2-propanol and
d) 0.5 mM DDPOi(NTf)2 in water. T'a20^ chips (8x8 mm) were sonicated
in 2-propanol for 15 minutes followed by a oxygen plasma cleaning for
2 minutes. Five chips (three for SB- and two for NSB-studics) were
transferred in one of each phosph(on)ate solutions described above and
incubated for 48 hours for self-assembly. The chips were removed and
rinsed with 2-propanol (ODPOj, ODPO, and DDPO3) or water
(DDPO^MIfb) followed b> blow-dn ing with nitrogen.
The coated, hydrophobic chips were transferred into a common
container and covered with a BSA-biotin solution (lmg/ml in water) for
activating with biotin and passivating to improve protein resistance. The
samples were removed from the solution after 30 minutes and rinsed with
HEPES buffer.
Three samples of each phosph(on)ate SAM type were immersed in a
streptavidin-conjugated horseradish peroxidase solution (dilution of enzyme
sol. (strept-hrp) = 1/1000 in HE PES buffer pi I 7.4) for specific enzyme
immobilization (SB-stud\). Two chips of each SAM variant were immersed
in a horseradish peroxidase solution (dilution of enzyme sol. (hrp) = 1/1000
in FIEPES buffer) for non specific enz\me immobilization (NSB). Sampleswere removed after 1 hour and rinsed with 2 ml of HEPES buffer each,
followed by rinsing with 2 ml of citrate buffer pH 6. Sample were now
stored separately in 0.8 ml of citrate buffer until reaction start.
Each sample was covered with 0.8 ml of freshly mixed "start-solution".
The containers were weakly shaken during the incubation step. The metal
oxide chipsw7ereremovedafteranincubationtimeof30minutesandthe205
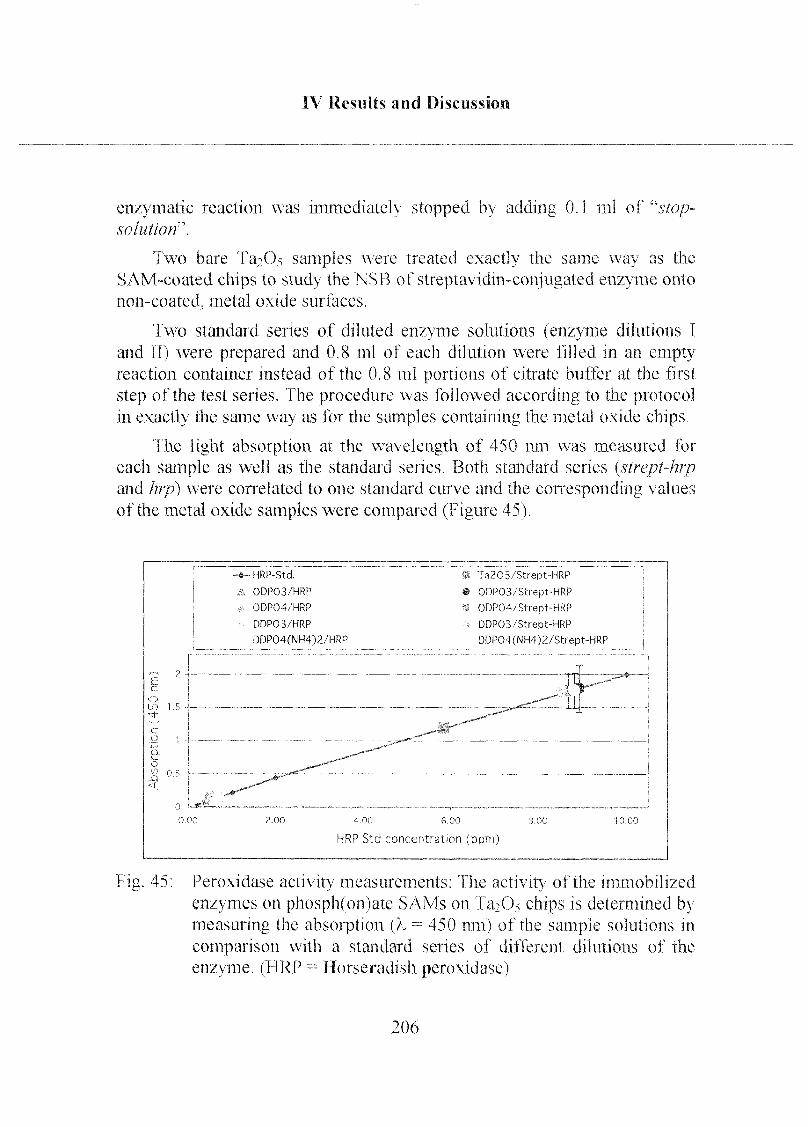
IV Results and Discussion
enzymatic reaction was immediate!} stopped by adding 0.1 ml of "sfop-solutiorf.
Two bare l^bOs samples were treated exactly the same way as the
SAM-coated chips to study the NSB of streptavidm-conjugated enzyme onto
non-coated, metal oxide surfaces,
Two standard series of diluted en/yme solutions (enzyme dilutions I
and 11) were prepared and 0.8 ml of each dilution were filled in an emptyreaction container instead of the 0.8 ml portions of citrate buffer at the first
step of the test series. The procedure was followed according to the protocolin exactly the same way as for the samples containing the metal oxide chips.
The light absorption at the wavelength of 450 nm was measured for
each sample as well as the standard series. Both standard series {strept-hrpand hrp) were correlated to one standard curve and the corresponding values
of the metal oxide samples were compared (Figure 45).
Fig. 45: Peroxidase activity measurements: The activity of the immobilized
enzymes on phosph(on)ate SAMs on Ta^O. chips is determined bymeasuring the absorption (k = 450 nm) of the sample solutions in
comparison with a standard series of different dilutions of the
en/yme. (HRP = Horseradish peroxidase)
206

IV Results and Discussion
Very little enzyme activity could be measured for the BSA-biotin-
activated samples that were immersed in the non-streptavidin-conjugatedhorse radish peroxidase solution {Enzyme sol, (hrp)). The average values are
indicated by orange to brown triangles. The results reflect the strong proteinresistance of hydrophobic phosph(on)ate-SAMs after passivation with BSA
(low NSB) (Scheme 18).
Mo significant difference could be detected between the enzyme activityof specific immobilized horseradish peroxidase on the different SAM-coated
and BSA-biotin activated samples. The average values are indicated with
yellow and green dots. The results demonstrate the constant degree of
immobilization on all different types of biotin activated phosph(on)ateSAMs and the high enzyme activities of the surfaces with specific bound
recognition elements (high SB) (Scheme 18).
^imr^
SB NSB
Scheme 18: Scheme demonstrating specific binding (SB) of streptavidinconjugated enzyme (strept-hrp) and non-specific binding (NSB)of bare enzyme (hrp), respectively, onto a BSA-biotin coated
phosph(on)ate SAM surface.
207
IV Results and Discussion
3.2Optical Biosensor Application
This chapter covers investigations of the applicability of modified metal
oxide surfaces as biosensors - immunoassay platform with the aim of
showing the high performance of such interfaces at least for one system.
Quantitative assays using rabbit IgG (RIgG) were performed with the
FOBIA system and Ta205-planar waveguide chips (for details see chapter III
1.1.4 and III 2.4.2). The samples were cleaned by sonication in 2-propanolfor 15 minutes followed by an UV-cleaning for 30 minutes. Samples were
subsequently transferred in the adsorbent solutions for self-assembly. Chipswere removed from the phosph(on)ate solution after an immersion time of
24 hours and from the PLL-PEG solution after an immersion time of 2
hours, respectively. The coated chips were then rinsed with 2-propanol
(phosph(on)ates) or water (PLL-PEG) and blow-dried with a nitrogenstream.
The concentrations (0.5 mM for the phosph(on)ates and lmg /ml for the
PLL-PEG-derivatives) as well as the solvents for the adsorbent solutions
were kept constant for all the sensor application studies: ODPO4 was
dissolved in n-heptane + 0.4% 2-propanol, ODPO3 solution was prepared in
n-heptane + 1.5 % 2-propanol, DDP04(NH4)2 was dissolved in water and
PLL(20)-g[3.5]-PEG(2)/PEGbiotin(3.4) in PBS buffer.
3.2.1 Labeling of Biomolecules
The quantification of biomolecules with the optical analysis apparatusFOBIA needs a fluorescent marker. Cy5 is such a molecule that is widelyused for the fluorescence labeling of cells [Ball, 1995], proteins and other
biomolecules [Yu,1994]. The advantage of Cy5-dye is its high quantum
yield and the simple labeling protocol.
Cy5 is commercially available and the labeling has been done according to
the protocol of the supplier [Amer,2000]:
208
IV Results and Discussion
For the labeling of the target molecules, 1.0 mg RIgG was dissolved in
1.0 ml of carbonate buffer pH 9.2 (Na2CO, 0.1 M and MaHCO, 0.1 M mixed
in a volume ratio of 1 : 9). The RIgG solution was transferred into a Cy5-vial (already prepared for use from the supplier), well shaken and stored for
30 minutes in the dark at room temperature (vial shortly shaken once every
10 minutes). The Cy5-conjugated RIgG was then cleaned by size exclusion
chromatography using a pre-conditioned PD-10 Sephadex G-25 M column
(pre-conditioning with 50 ml PBS). The pure product was then eluted by
adding portions of I ml PBS. The 1-mi-fractions were collected separately in
plastic tubes.
The determination of Cy5-RlgG concentration (mol/1) as well as the
tracer-to-biomolecule ratio were performed by measuring the absorption at
two different wavelengths (280 nm and 650 nm) and applying the simpleequations 6 to 8 with molar extinction coefficients of 250'000 and 170'000
for Cy5 and RIgG, respectively.
[Cy5-dye] = (A650)/250'000 equation 6
IRlgG] = [A28o-(0.05*A6<„)l / 170'000 equation 7
The determination of Cy5/RIgG ratio is a simply division of the
calculated concentrations of the two components (equation 8).
Cy5/RIgG = [Cy5 d\ ej / [RIgG] equation 8
The fractions No 3, 4 and 5, containing the product, were mixed and
aliquots of 100 pi were frozen and stored at -5° until use. The Cy5/RIgGratio has been calculated to 4.0.
209
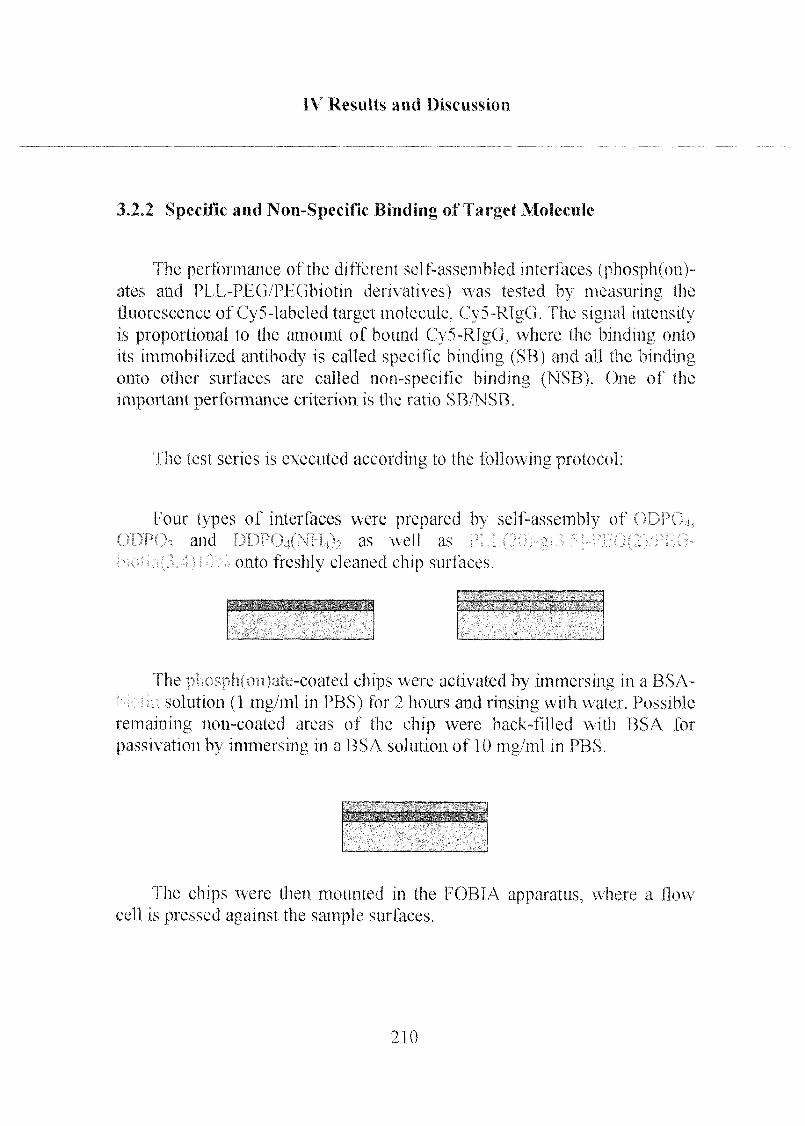
IV Results and Discussion
3.2.2 Specific and Non-Specific Binding of Target Molecule
The performance of the different self-assembled interfaces (phosph(on)-ates and PLL-PEG/PFXTbiotm dematives) was tested by measuring the
fluorescence of Cy5-labeled target molecule. Cy5-RlgG, The signal intensityis proportional to the amount of bound Cy5-RlgG, where the binding onto
its immobilized antibody is called specific binding (SB) and all the bindingonto other surfaces are called non-specific binding (NSB). One of the
important performance criterion is the ratio SB/NSB,
The test series is executed according to the following protocol:
Four types of interfaces were prepared by self-assembly of 01>J\
)WOx and MDIVMNlhV as well as
onto freshly cleaned chip surfaces.
V *u
„*,i\]U ..., v* .»V
"fhe pruNph(onMU'-coatcd chips were activated by immersing in a BSA-
solution (1 mg/ml m PBS) for 2 hours and rinsing with water. Possible
remaining non-coated areas of the chip were back-filled with BSA for
passivation by immersing m a BSA solution of 10 mg/ml in PBS.
The chips were then mounted m the FOB1A apparatus, where a flow
cell is pressed against the sample surfaces.
210
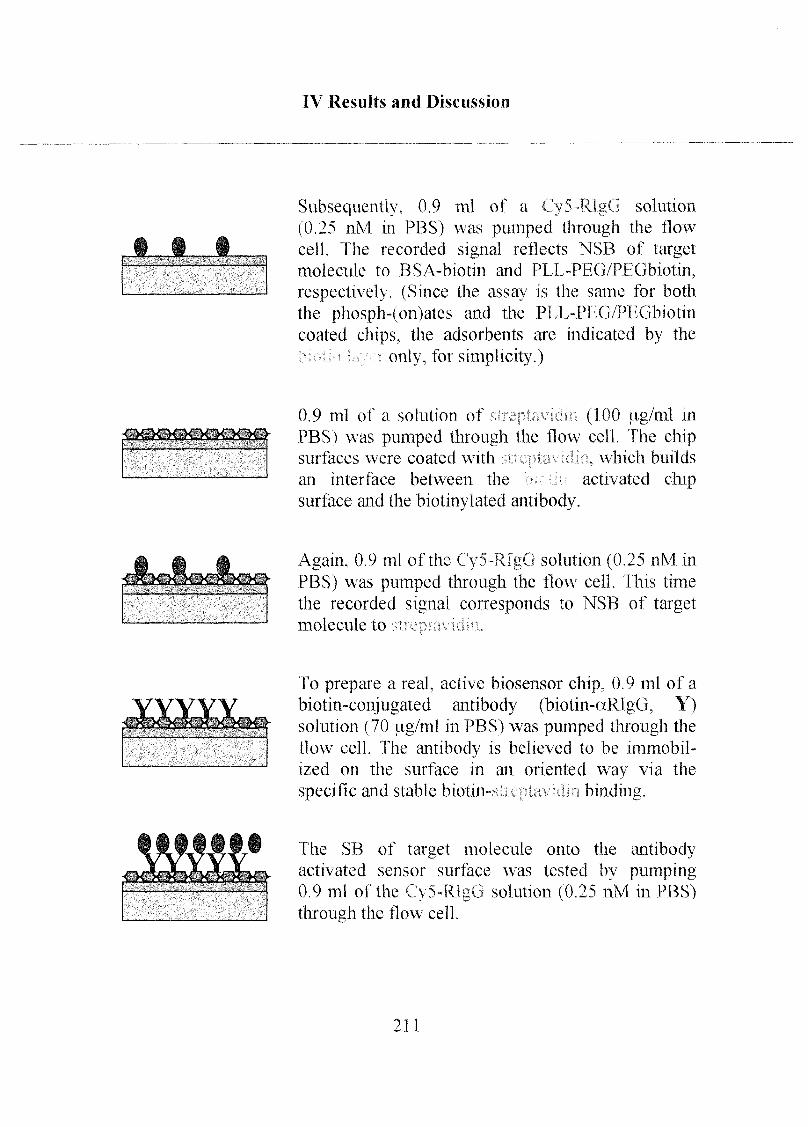
IV Results and Discussion
Subsequently, 0.9 ml of a C\5-RlgG solution
(0.25 nM in PBS) was pumped through the flow
cell. The recorded signal reflects NSB of targetmolecule to BSA-biotin and PLL-PEG/PEGbiotin,
respectiveh (Since the assay is the same for both
the phosph-(on)ates and the PLL-PEG/PEGbiotin
coated chips, the adsorbents are indicated by the
only, for simplicity.)
0.9 ml of a solution of • \ (100 ug/ml in
PBS) was pumped through the How cell. The chipsurfaces were coated with i
^ >
,which builds
an interface between the activated chipsurface and the biotmylated antibody.
Again, 0.9 ml of the C\5-RIgG solution (0.25 nM in
PBS) was pumped through the flow cell. This time
the recorded signal corresponds to NSB of targetmolecule to o ^ \ v .
To prepare a real, active biosensor chip, 0 9 ml of a
biotin-conjugated antibody (biotin-aRlgG, Y)solution (70 (.ig/ml in PBS) was pumped through the
How cell. The antibody is believed to be immobil¬
ized on the surface in an oriented way via the
specific and stable biotin- binding.
The SB of target molecule onto the antibodyactivated sensor surface was tested by pumping0.9 mi of the Cy5-RlgG solution (0.25 nM in PBS)
through the flow cell.
211
IV Results and Discussion
Figure 46 shows the results of test series for the ODPCVcoated chip.The concentration of 0.25 nM (= 2.5 x 10"1() M) Cy5~RIgG is close to the
upper detection limit. Application of 2.5 nM solution of labeled targetmolecule gave SB-signals that were outside the linear response regime of the
optical device of the FOBIA system.
Data points 1-19 are registered during the preconditioning phase, which
is a simple rinsing step with assay buffer solution (PBS). It is essential to use
exactly the same buffer mixture for the assay run cycles as well as for
preparing the solutions (Cy5-RIgG, streptavidin and aRIgG) to get a
quantitative signal not disturbed by change of the refractive indices of the
applied solutions. Any change of refractive index of the solution would
affect the result.
Data points 20-37 show the total fluorescence intensity from both the
bulk within the evanescent field volume and the molecules attached at the
sensor surface. We call this cycle time interval adsorption.
Data points 38-50 are registered during a second rinsing step with assaybuffer. A decrease of the signal intensity within this time interval may occur
due to desorption of fluorescent molecules (e.g. labeled tracer molecules)and bleaching of their fluorescence. We did not distinguish between these
two effects and call this time interval desorption.
The most interesting time window of the cycles is therefore that around
the data points 39-41, where bulk solution has already been replaced byassay buffer (no bulk signal) and a minimum bleaching effect has to be
considered.
212
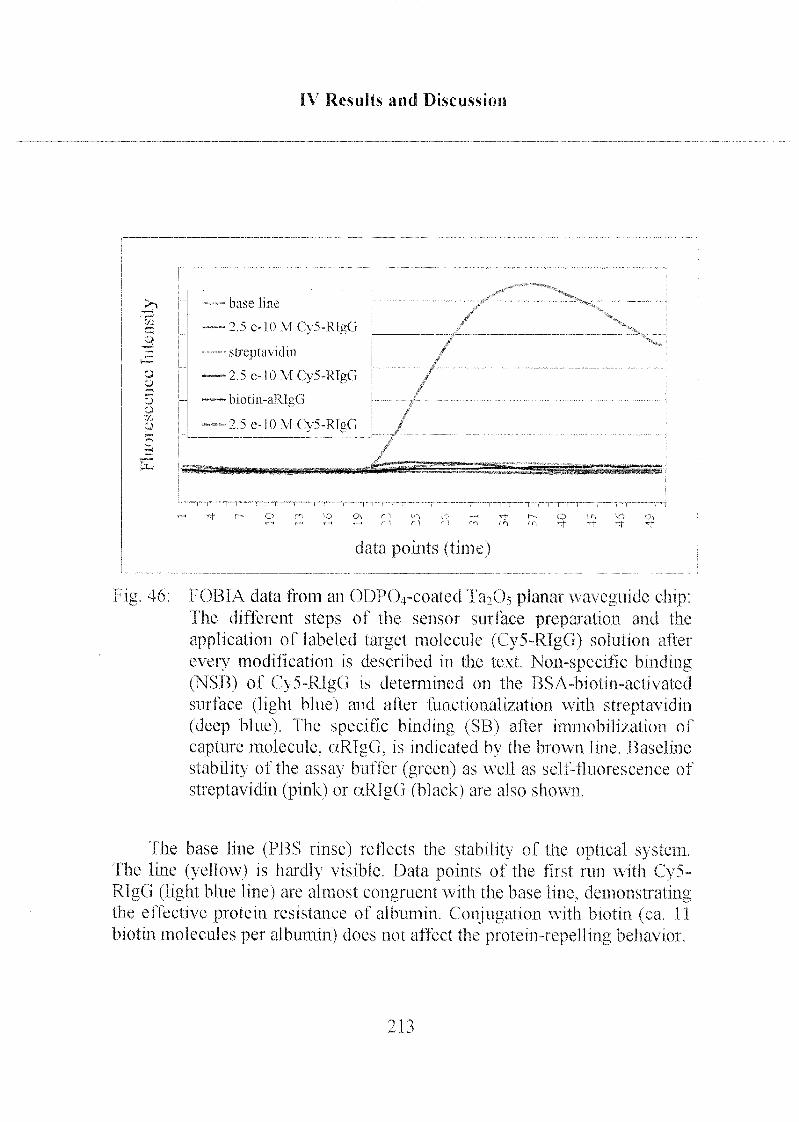
IV Results and Discussion
0)o
Su"A
Ü
pû-r
Fig, 46:
base hue
..—2 5e-IO\lCy5~RlgG
streptaudm
—-2^6-10 \HV5-RlgG
——biotm-aRlgG
~ 2 5e-lOMCV5-Rl«G
data points (time)
TOB1A data from an ODPOreoated Ta^O^ planar waveguide chip:The different steps of the sensor surface preparation and the
application of labeled target molecule (Cy5~RIgG) solution after
every modification is described in the text. Non-specific binding(NSB) of Cy5-RlgG is determined on the BSA-biotin-activated
surface (light blue) and after functionalization with streptavidin(deep blue). The specific binding (SB) after immobilization of
capture molecule. aRfgG, is indicated by the brown line. Baseline
stability of the assay buffer (green) as well as self-fluorescence of
streptavidin (pink) or aRfgG (black) are also shown.
The base line (PBS rinse) reflects the stability of the optical system.The line (yellow) is hardly visible. Data points of the first ran with Cy5-RlgG (light blue line) are almost congruent with the base line, demonstratingthe effective protein resistance of albumin. Conjugation with biotin (ca, 11
biolin molecules per albumin) does not affect the protein-repelling behavior.
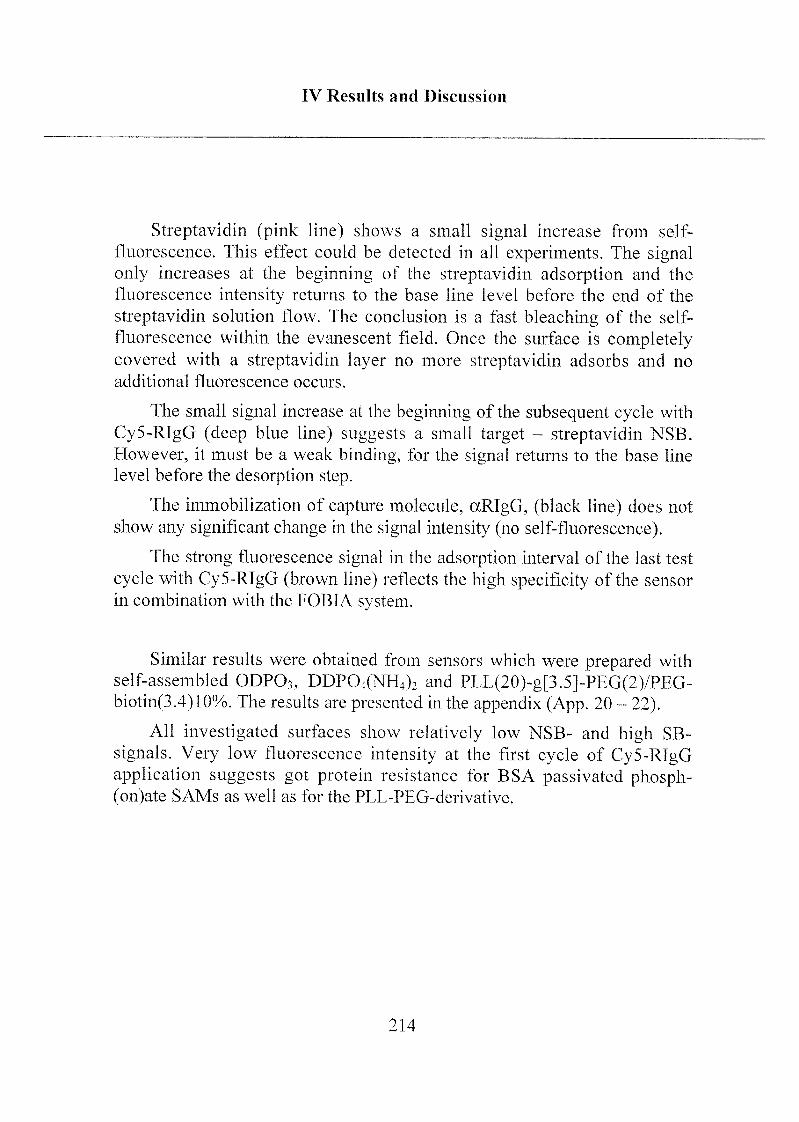
IV Results and Discussion
Streptavidin (pink line) shows a small signal increase from self-
fluorescence. This effect could be detected in all experiments. The signalonly increases at the beginning of the streptavidin adsorption and the
fluorescence intensity returns to the base line level before the end of the
streptavidin solution flow. The conclusion is a fast bleaching of the self-
fluorescence within the evanescent field. Once the surface is completelycovered with a streptavidin layer no more streptavidin adsorbs and no
additional fluorescence occurs.
The small signal increase at the beginning of the subsequent cycle with
Cy5-RIgG (deep blue line) suggests a small target - streptavidin NSB.
However, it must be a weak binding, for the signal returns to the base line
level before the desorption step.
The immobilization of capture molecule, aRIgG, (black line) does not
show any significant change in the signal intensity (no self-fluorescence).
The strong fluorescence signal in the adsorption interval of the last test
cycle with Cy5-RIgG (brown line) reflects the high specificity of the sensor
in combination with the FOBIA system.
Similar results were obtained from sensors which were prepared with
self-assembled ODPO,, DDP04(NH4)2 and PLL(20)-g[3.5]-PEG(2)/PEG-biotin(3.4)l 0%. The results are presented in the appendix (App. 20 - 22).
All investigated surfaces show relatively low NSB- and high SB-
signals. Very low fluorescence intensity at the first cycle of Cy5-RIgGapplication suggests got protein resistance for BSA passivated phosph-(on)ate SAMs as well as for the PTL-PEG-derivative.
214
IV Results and Discussion
3.2J Specific and Non-Specific Binding of Streptavidin
As mentioned in the previous chapter, streptavidin is used as an
interface between the BSA-biotm coated phosph(on)ate SAMs (or PLL-
PEG/PEGbiotin modified surfaces) and the biotin-conjugated antibody,biotin-aRIgG (Scheme 19).
cizzzzZ22zzrö22ZZzzz/
MJMMUUUJMIL,
biolin-antibody
streptavidin
BSA-biotin
hydrophobic SAM
Scheme 19: Schematic drawing of streptavidin interface between biotin-
conjugated BSA coated hydrophobic SAM and biotin-
conjugated antibody
The streptavidin accessibility of biotin-activated (or biotinylated)surfaces and the protem resistanee of the same non-biotinylated surface
variant was investigated with one example of hydrophobic SAM (01)P04)and with aPLL-PhG/PEG-biotin modified surface-
ODP04: Ta2Os sensor chips were cleaned according to the standard
procedures (someation in 2-propanol followed by UV cleaning),The chips were subsequently immersed m a 0.5 mM solution of
ODP04 in n-heptane + 0.4% 2-propanol for 24 hours, rinsed
with 2-propanol and dried with nitrogen.
215
IV Results and Discussion
For biotin activation and specific streptavidin binding (SB) one
chip was incubated in a BSA-biotin solution (1 mg/ml in PBS)for 1 hour, rinsed with PBS and immersed in a BSA solution
(10 mg/ml in assay buffer) for back-filling of any free spaces at
the hydrophobic sensor surface.
For the non-specific binding (NSB) test, another ODPO4-SAM-
chip (preparation as above) was directly incubated in BSA
(without biotin) solution (10 mg/ml in assay buffer) for 1 hour.
PLL-PEG: Ta20s sensor chips were cleaned according to the standard
procedures.
For the investigation of SB, one chip was subsequentlyimmersed in a PLL(20)-g[3.51-PEG(2)/PEGbiotin(3.4)10%solution (1 mg/ml in PBS) for 1 hour and rinsed with assay
buffer.
For the NSB test, one T^O, chip was incubated in a PLL(20)-g[3.5]-PEG(2) (without biotin) solution for 1 hour and
subsequently rinsed with assay buffer.
The chips were then mounted in the FOBIA apparatus and three cyclesof Cy5-streptavidin (3.3 pM in assay buffer), 0.9 ml each, were executed
(Figure 47). A rinsing step with pure assay buffer was introduced before
(pretreatment) and after (desorption) each Cy5-streptavidin application.
216
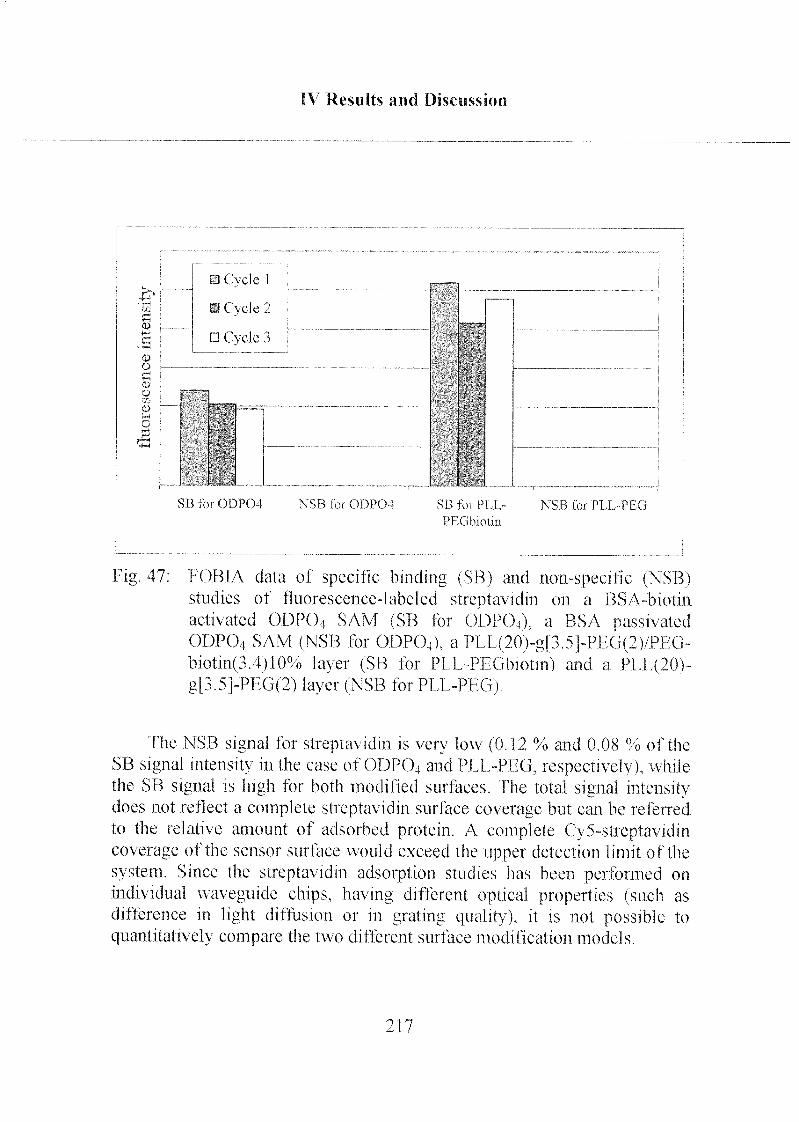
IV Results and Discussion
a Ovcle 1
H Cycle 2
SB fo! ODP04 NSB lot ODP04 SB lot PT L- NSB loi PI T -PL G
PBObiotmi
Fig 47 TOBTA data of specific binding (SB) and non-specific (NSB)studies of fluorescence-labeled streptavidm on a BSA-biotm
activated ÜÜPO4 SAM (SB for ODP04), a BSA passivatedODPO4 SAM (NSB for ODP04). a PLI (20)-g[3 5]-PT G(2)/PPG~biotm(3 4)I0% la\er (SB for PL I-PLGbiotin) and a PU (20)-
gL3 5]-PFG(2) layer (NSB for PI L-PFG)
I he NSB signal for streptavidm is very low (0 12 % and 0 08 % of the
SB signal intensity in the case of ODP04 and PU -PFG, respectively), while
the SB signal is high for both modified surfaces Fhe total signal intensitydoes not reilect a complete streptavidm surface coverage but can be referred
to the relative amount of adsorbed protein A complete Cy5-streptavidmcoverage of the sensor surface would exceed the upper detection limit of the
system Since the streptaMdm adsorption studies has been perlormed on
individual waveguide chips, having different optical properties (such as
difference m light diffusion or m grating quality), it is not possible to
quantitatively compare the two different sut face modification models
©
a
0>
217
IV Results and Discussion
3.2.4 Detection Limit of Target Molecule
The performance of the different self-assembled interfaces
(phosph(on)ates and PLL-PEG/PEGbiotin) in terms of the lower detection
limit was tested by measuring the fluorescence of Cy5-labeled target
molecule, Cy5-RIgG. The sensor surfaces are activated by a layer of
immobilized, biotinylated antibodies, biotin-aRIgG.
The antibody immobilization was executed according to two different
methods, corresponding to the two different types of surfaces: The
hydrophobic phosph(on)ate SAMs were coated by BSA-biotin followed byformation of a streptavidin interfacial adlayer. Self-assembled layers of
PLL-PEG/PEG-biotin derivatives can be directly coated with the
streptavidin adlayer. Both types of the phosph(on)ate SAMs as well as the
PLL-PEG/PEGbiotin samples are now ready for the antibody immobili¬
zation via the biotin - streptavidin biding. The process is described more in
detail in the previous chapter.
The test setup does not correspond to a real assay, because in a real
application it is not possible to directly label the target molecule.
The chemicals and dilutions that were used for the investigation of the
detection limits with their abbreviations are listed in Table 36.
Ta205 planar waveguide chips were sonicated for 15 minutes in
2-propanol followed by an UV-cleaning for 30 minutes. Subsequently, the
chips were separately incubated in one of each adsorbent solution.
The PLL-PEG/PEG-biotin coated chip was removed from the adsorbent
solution after 1 hour, rinsed with water and was ready for use.
The three phosph(on)ate chips were removed after 24 hours from the
amphiphile solution and rinsed with 2-propanol (ODP04, ODP03) or water
(DDP04(NH4)2). The hydrophobic SAM-chips had to be activated by
coating with a BSA-biotin adlayer (immersion of the chips in BSA-biotin
solution for 1 hour) followed by rinsing with 5 ml of PBS. Additional
immersion in a BSA solution was executed for back-filling of any free
218
IV Results and Discussion
adsorption areas at the hydrophobic SAM surfaces (passivation for non¬
specific protein binding).
Table 36: List of chemicals and dilutions with their abbreviation.
abbreviation Reagents / Delution
ODPO4 solution 0.5 mM in n-heptane + 0.4% 2-propanol
ODPO3 solution 0.5 mM in n-heptane + 1.5% 2-propanol
DDP04(NH4)2 solution 0.5 mM in water
PLL-PEG/PEGbiotin10%
solution
PLL(20)-g[3.5]-PEG(2)/PEGbiotin(3.4)10%1 mg/ml in PBS
BSA-biotin 1 mg/ml PBS
BSA 10 mg/ml assay buffer
Assay buffer PBS + tween 20 (0.5 ml/L)
Streptavidin 0.1 mg/ml in assay buffer
a-RIgG-biotin 0.12 mg/ml in assay buffer
Sample 1 Cy5-RIgG, 50 fM in assay buffer
Sample 2 Cy5-RIgG, 250 fM in assay buffer
Sample 3 Cy5-RIgG, 500 fM in assay buffer
Sample 4 Cy5-RIgG, 2.5 pM in assay buffer
Sample 5 Cy5-RIgG, 5 pM in assay buffer
Sample 6 Cy5-RIgG, 25 pM in assay buffer
Sample 7 Cy5-RIgG, 50 pM in assay buffer
Sample 8 Cy5-RIgG, 250 pM in assay buffer
Chips were mounted in the FOBIA apparatus and the test program
could be started.
219
IV Results and Discussion
The solutions and Cy5-R]gG samples were pumped through the flow
cell one after the other. An additional rinsing with assay buffer was executed
before (precondition) and after (des orpt ion) each solution or sampleapplication (adsorption), fhe test series was executed according to the
following protocol:
cycle N° Sample description Surface reaction
1 Assay buffer preconditioning
2 Streptavidin actuation for antibody immobilization
3 oc-RlgG-biotin aeti\ ation w ith antibody
4 Assay buffer blank (0.0 IM standard)
5 Sample 1 50 fM standard
6 Sample 2 250 fM standard
7 Sample 3 500 fM standard
8 Sample 4 2.5 pM standard
9 Sample 5 5 pVJ standard
10 Sample 6 25 pM standard
11 Sample 7 50 pM standard
12 Sample 8 250 pM standard
The data point No 18 (end ofprecondition) was used to define the zero
point of the scale and standard cycles are plotted in parallel. Figures 48a
and b show an example of such an immunoassay on an ODPOi-coated chip.The other adsorbent-covered sensors gave similar results (curves presentedin the appendix, App. 23 - 25). The average value of measuring pointsNo 40 - 45 within the desorption-time window were used to determine the
dose - response values. Figure 49a and b show an overlay of the dose-
response curves from two ODPO»-coated chips and two PLL-
PEG/PEGbiotin-coated chips.
220
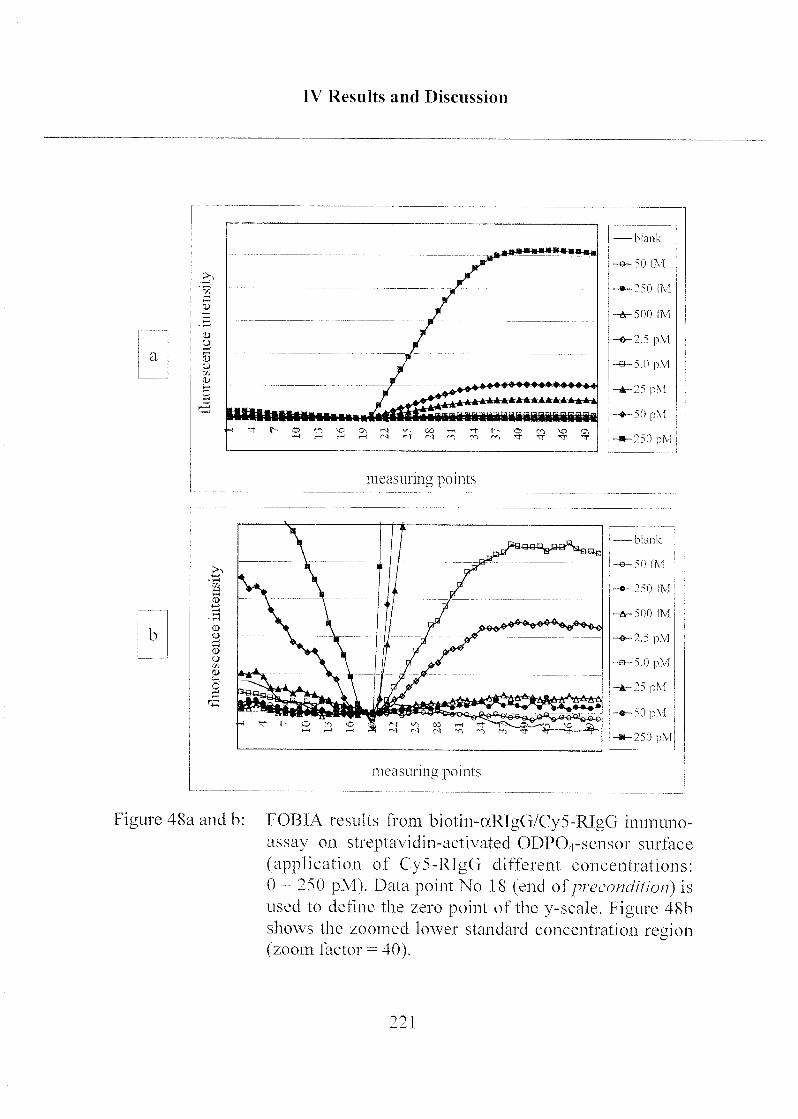
TV Results and Discussion
a
vi
.a
o
SO
a>
O
tllittilttWllilMM
>>
CD
O
o
-blank
-M)(M
-2^0 (TVI
-500 I'M
-2 5 pM
-5 0 pM
-2^p\[
o0p\l
-2^0 pM
measuring points
measming points
Figure 48a and b: FOBIA results from bioün-aRIgG/Cy5-RIgG immuno-
assa} on streptavidin-activated ODPOj-sensor surface
(application of Cy5-RTgG different concentrations:
0 - 250 pM). Data point No 1 8 (end of precondition) is
used to define the zero point of the y-scale. Figure 48b
shows the zoomed loAver standard concentration region(zoom factor = 40).
221
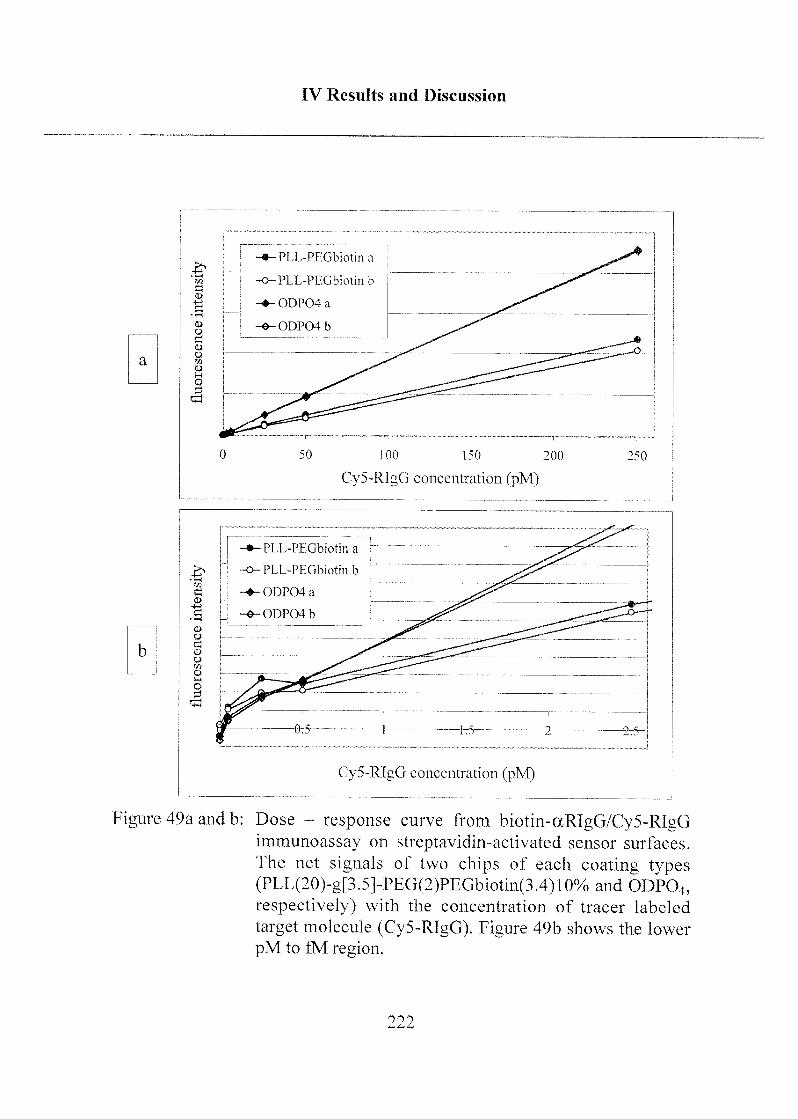
IV Results and Discussion
a
Ol
Soo
Ö<a
o'A
<0n
O
M
-fr
0>
o
r-t
©o!»
<D•H
O
-PLt-PFGbiotina
-PLL-PtGbiotmb
-0DP04a
-ODP04b
50 100 ISO 200
C>5-RIgG concent!ation (pM)
250
-PIL-PIGbiotina
-o-PLL-PEGbiotmb
-»-ODPCMa
-0-ODPO4b
Cy5-RIgG concentiation (pM)
Figure 49a and b: Dose -
response curve from biotin-aRIgG/Cy5-RIgGimmunoassay on streptavidm-activated sensor surfaces.
The net signals of two chips of each coating types
(PLL(20)-g[3.5]-PEG(2)PEGbiotin(3.4)10% and ODP04,respectively) with the concentration of tracer labeled
target molecule (Cy5-RJgG). Figure 49b shows the lower
pM to fM region.
222
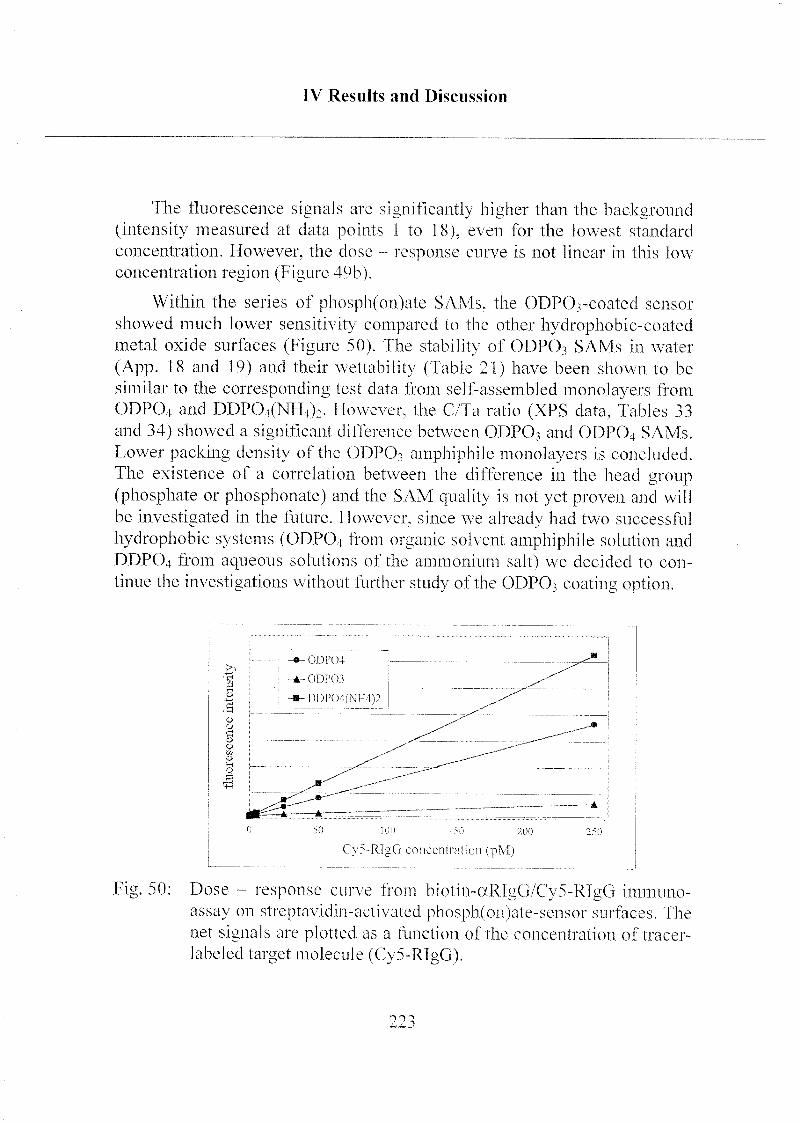
TV Results and Discussion
The fluorescence signals are significantly higher than the background(intensity measured at data points 1 to 18), even for the lowest standard
concentration. However, the dose - response curve is not linear in this low
concentration region (Figure 49b).
Within the series of phosph(on)ate SAMs, the ODPOrcoated sensor
showed much lower sensitivity compared to the other hydrophobic-coatedmetal oxide surfaces (Figure 50). The stability of ODP03 SAMs in water
(App. 18 and 19) and their wettability (Table 21) have been shown to be
similar to the corresponding test data from self-assembled monolayers from
ODPCH and DDPOt(NH4)2. Ho\\e\er, the C/Ta ratio (XPS data, Tables 33
and 34) showed a significant difference between ODPO3 and ODPO4 SAMs.
Lower packing density of the OÜPO, amphiphile monolayers is concluded.
The existence of a correlation between the difference in the head group
(phosphate or phosphonate) and the SAM quality is not yet proven and will
be investigated in the future. However, since we already had two successful
hydrophobic systems (ODPO4 from organic sohcnt amphiphile solution and
DDPO4 from aqueous solutions of the ammonium salt) we decided to con¬
tinue the investigations without further stud> of the ODPO3 coating option.
0 50 100 |so 200 250
C\ ^-RlgG coneentiation (pM)
Fig. 50: Dose - response cune from biotin-aRlgü/Cy5-RlgG immuno¬
assay on strepta\idin-acti\ated phosph(on)ate-scnsor surfaces. The
net signals are plotted as a function of the concentration of tracer-
labeled target molecule (Cy5-RJgG).
223
IV Results and Discussion
The detection limit for ODP04 or DDP04 coated sensors is in the low
femtomolar region if directly labeled target molecules are applied. The PLL-
PEG/PEGbiotin coated sensor is a little bit less sensitive, compared to the
two hydrophobic SAM sensors, but the detection limit is still in the
femtomolar region.
As mentioned above, the assay described in the preceding paragraphdoes not provide the effective detection limits of a real immunoassay. But
the results give important inputs for the decision which interfaces are most
promising as a platform technology to build real sensor systems.
3.2.5 Optimization of Biotin Concentration in PLL-PEG Derivatives
The optimum of grafted PEGbiotin in the PLL-PEG/PEGbiotin
copolymer has been shown to be between 1% and 50% for the
immobilization of horseradish peroxidase, where the PLL(20)~g[3.5]-PEG(2)/PEGbiotin(3.4)10% derivative showed the highest enzyme activity(see chapter IV 3.1.1). Similar to the procedure of the enzymatic activitymeasurements (chapter IV 3.1) the performance of the different PEGbiotin
concentrations in the copolymer derivatives were studied using the biotin-
ocRIgG/RIgG-CyS immunoassay on streptavidin activated PLL-PEG/PEG¬
biotin surfaces.
Solutions of PLL(20)-g[3.5]-PEG(2)/PEGbiotin(3.4)l%, 10% and 50%
were prepared (1 mg/ml in PBS) and clean Ta205 waveguide chips (standardcleaning procedure as mentioned above) were immersed for 2 hours. The
chips were washed with pure water, blow-dried with nitrogen and introduced
into the FOBIA apparatus.
Chemicals and dilutions as well as the assay protocols were executed
according to the information given in Table 36 and in the text of the
previous protocol.
224
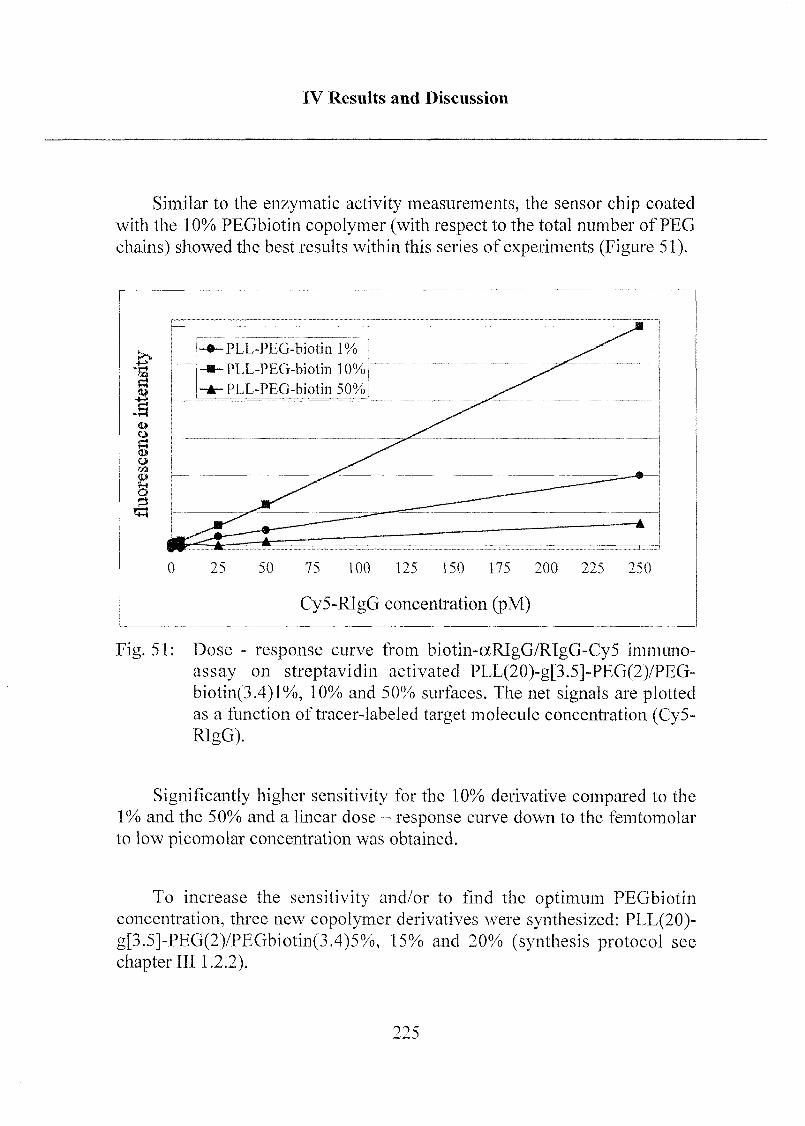
IV Results and Discussion
Similar to the enzymatic activity measurements, the sensor chip coated
with the 10% PEGbiotin copolymer (with respect to the total number of PEG
chains) showed the best results within this series of experiments (Figure 51).
0 25 50 75 100 125 150 175 200 225 250
Cy5-RIgG concentration (pM)
Fig. 51 : Dose - response curve from biotin-aRIgG/RIgG-Cy5 immuno¬
assay on streptavidin activated PLL(20)-g[3.5]-PEG(2)/PEG-biotin(3.4)l%, 10% and 50% surfaces. The net signals are plottedas a function of tracer-labeled target molecule concentration (Cy5-RlgG).
Significantly higher sensitivity for the 10% derivative compared to the
1% and the 50% and a linear dose - response curve down to the femtomolar
to low picomolar concentration was obtained.
To increase the sensitivity and/or to find the optimum PEGbiotin
concentration, three new copolymer derivatives were synthesized: PLL(20)-g[3.5]-PEG(2)/PEGbiotin(3.4)5%, 15% and 20% (synthesis protocol see
chapter III 1.2.2).
225
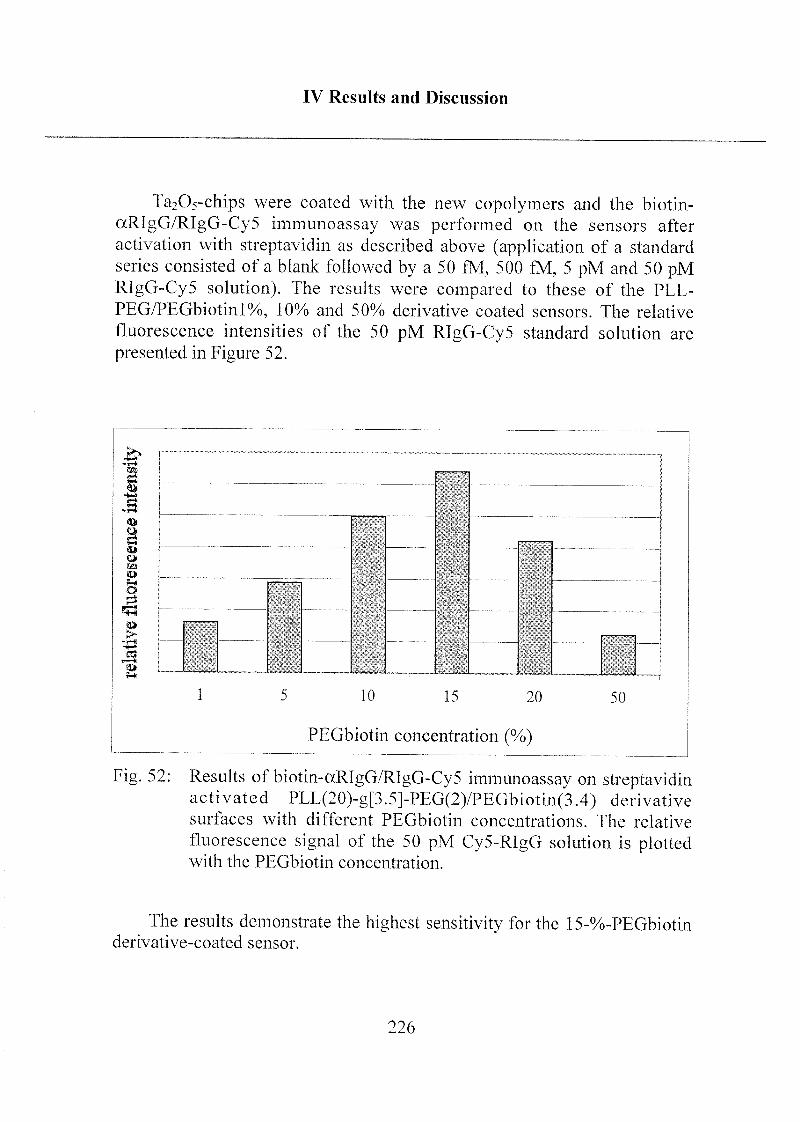
IV Results and Discussion
Ta205-chips were coated with the new copolymers and the biotin-
ocRlgG/RIgG-Cy5 immunoassay was performed on the sensors after
activation with streptavidin as described above (application of a standard
series consisted of a blank followed by a 50 fM, 500 fM, 5 pM and 50 pMRIgG-Cy5 solution). The results were compared to these of the PLL-
PEG/PEGbiotinl%, 10% and 50%) derivative coated sensors. The relative
fluorescence intensities of the 50 pM RIgG-Cy5 standard solution are
presented in Figure 52.
1 5 10 15 20 50
PEGbiotin concentration (%)
Fig. 52: Results of biotin~aRIgG/RIgG-Cy5 immunoassay on streptavidinactivated PLL(20)-g[3.5]-PEG(2)/PEGbiotin(3.4) derivative
surfaces with different PEGbiotin concentrations. The relative
fluorescence signal of the 50 pM Cy5-RIgG solution is plottedwith the PEGbiotin concentration.
The results demonstrate the highest sensitivity for the 15-%~PEGbiotin
derivative-coated sensor.
226
IV Results and Discussion
3.2.6 Immunoassay Design
As mentioned above, the recognition and quantification of labeled
target molecules do not correspond to a real immunoassay, since it is not
realistic to perform a direct fluorescence molecule conjugation of targetmolecule traces in a matrix such as blood or urine samples.
Two protocols that form the basis for potential bioassays are the
following (Scheme 20):
a) The sample, including target molecules (e.g. unlabeled RTgG), is appliedat the recognition molecule acthated sensor surface. Target molecules
bind to the immobilized recognition molecules (e.g. aRIgG antibody)and the surface is subsequent!}' rinsed with buffer to remove non-
specifically adsorbed target molecules. Fluorescently labeled tracer (e.g.
Cy5-cxRIgG) is now applied, which specifically binds to the free
accessible moieties of the previoush bound target molecules at the sensor
surface. The surface is rinsed again to reduce bulk signal.
b) The sample is first incubated with an excess of tracer (e.g. Cy5- oRIgG
antibody) where RIgG reacts with the antibody and forms a
RIgG/aRIgG-Cy5 - complex. This reaction solution is subsequently
applied to the sensor surface (consisting of immobilized recognitionmolecules, aRTgG). The sensor surface is rinsed to reduce bulk signal.
Both designs correspond to a sandwich immunoassay system.
">">7
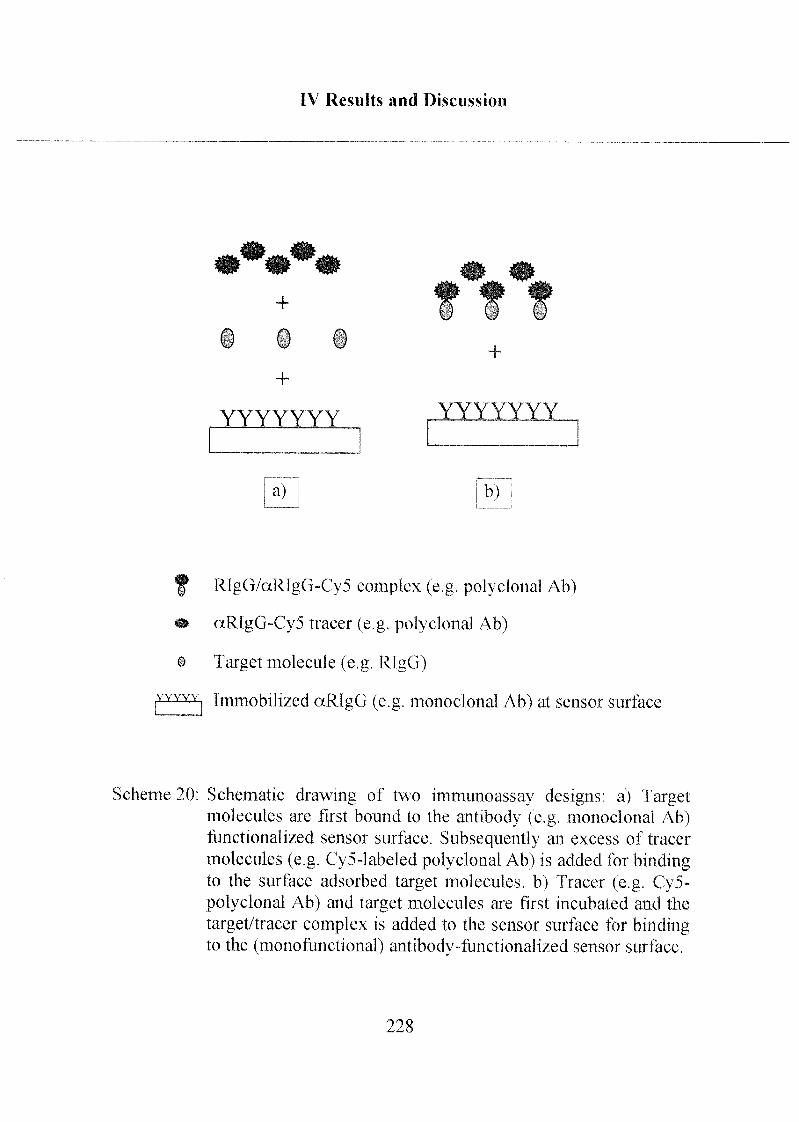
IV Results and Discussion
#*#*#
0
+ fmm
0 ¥
YYYYYYY YYYYYYY
a) b)
RIgG/aRlgG-Cy5 complex (e.g. polyclonal Ab)
• cxRlgG-Cy5 tracer (e.g. polyclonal Ab)
o Target molecule (e.g. RlgG)
p^^n Immobilized aRIgG (e.g. monoclonal Ab) at sensor surface
Scheme 20: Schematic drawing of two immunoassay designs: a) Targetmolecules are first bound to the antibody (e.g. monoclonal Ab)functionalized sensor surface. Subsequently an excess of tracer
molecules (e.g. Cy5-labeled polyclonal Ab) is added for bindingto the surface adsorbed target molecules, b) Tracer (e.g. Cy5-polyclonal Ab) and target molecules are first incubated and the
target/tracer complex is added to the sensor surface for bindingto the (monofunctional) antibody-functionalized sensor surface.
22o
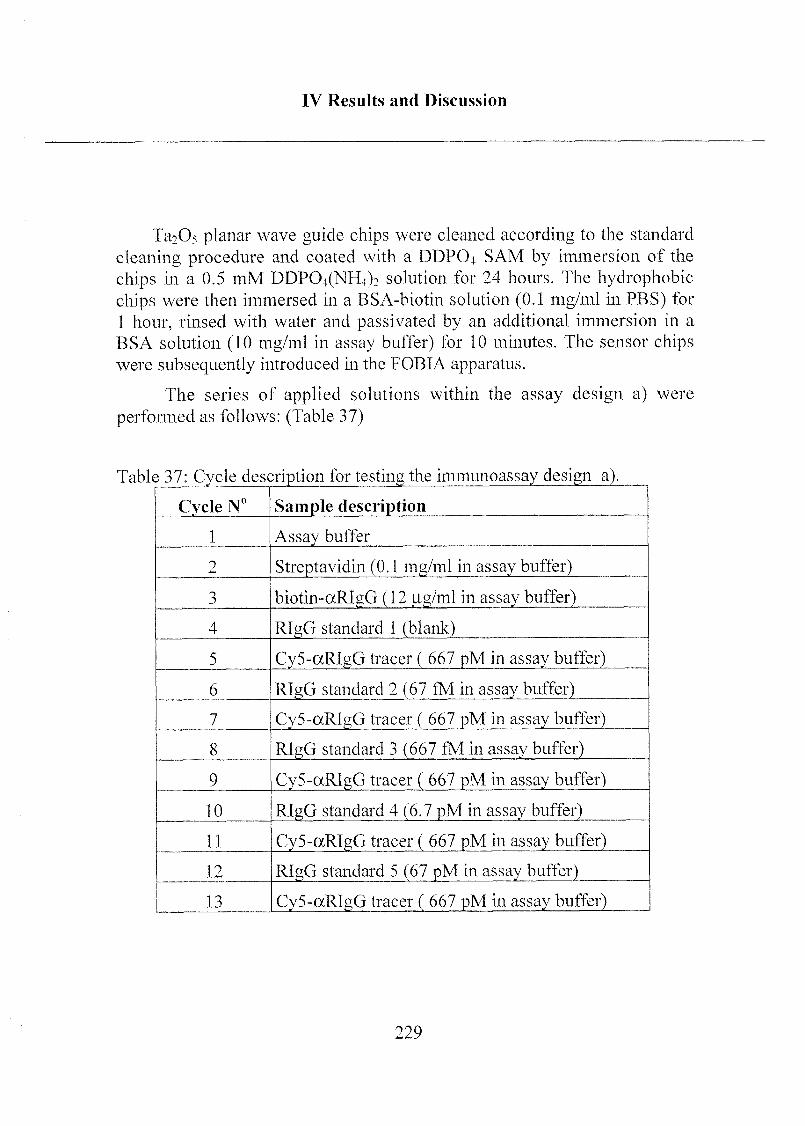
IV Results and Discussion
Ta2Os planar wave guide chips were cleaned according to the standard
cleaning procedure and coated with a DDP04 SAM by immersion of the
chips in a 0.5 mM DDPO^NH^ solution for 24 hours. The hydrophobic
chips were then immersed in a BSA-biotin solution (0.1 mg/ml in PBS) for
1 hour, rinsed with water and passivated by an additional immersion in a
BSA solution (10 mg/ml in assay buffer) for 10 minutes. The sensor chipswere subsequently introduced in the FOBIA apparatus.
The series of applied solutions within the assay design a) were
performed as follows: (Table 37)
Table 37: Cycle description for testing the immunoassay design a)
Cycle N° Sample description
1 Assay buffer
2 Streptavidin (0.1 mg/ml in assay buffer)
3 biotin-ocRIgG (12 |JLg/ml in assay buffer)
4 RIgG standard 1 (blank)
5 Cy5-ocRIgG tracer ( 667 pM in assay buffer)
6 RlgG standard 2 (67 fM in assay buffer)
7 Cy5-otRIgG tracer ( 667 pM in assay buffer)
8 RIgG standard 3 (667 fM in assay buffer)
9 Cy5-ooRlgG tracer ( 667 pM in assay buffer)
10 RIgG standard 4 (6.7 pM in assay buffer)
11 Cy5-ocRIgG tracer ( 667 pM in assay buffer)
12 RIgG standard 5 (67 pM in assay buffer)
13 Cy5-aRIgG tracer ( 667 pM in assay buffer)
229
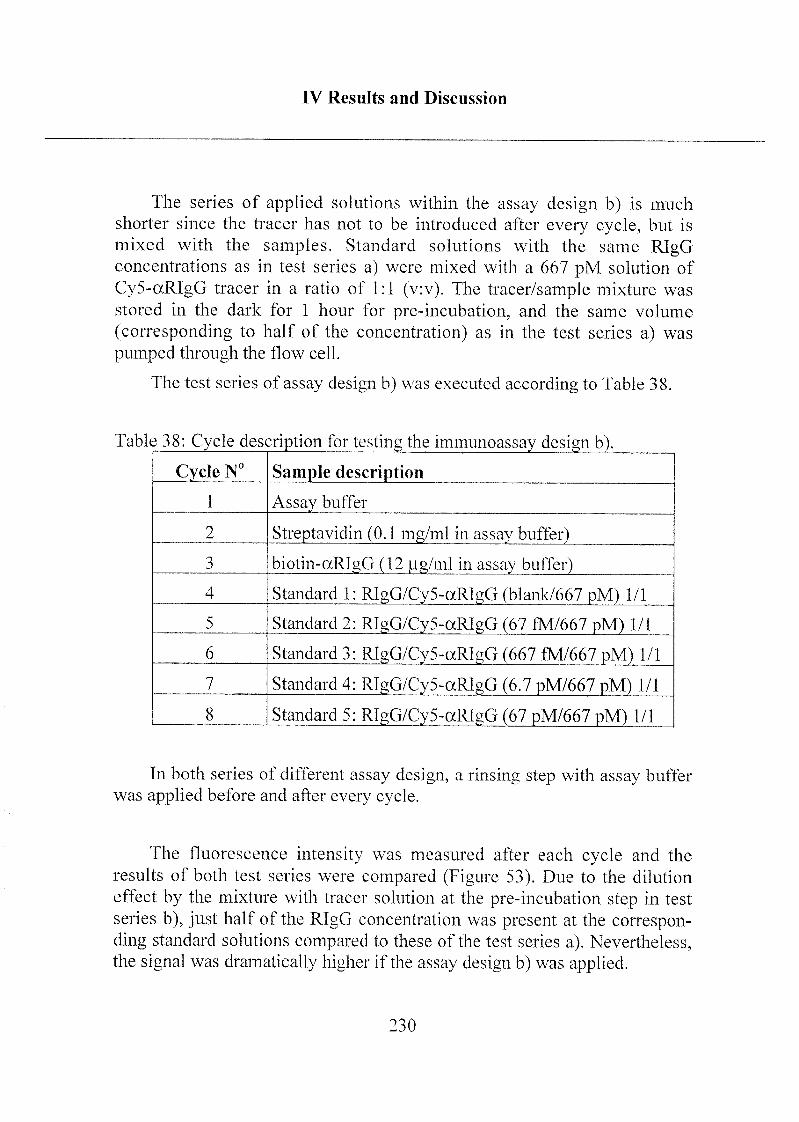
IV Results and Discussion
The series of applied solutions within the assay design b) is much
shorter since the tracer has not to be introduced after every cycle, but is
mixed with the samples. Standard solutions with the same RIgGconcentrations as in test series a) were mixed with a 667 pM solution of
Cy5-aRlgG tracer in a ratio of 1:1 (v:v). The tracer/sample mixture was
stored in the dark for 1 hour for pre-incubation, and the same volume
(corresponding to half of the concentration) as in the test series a) was
pumped through the flow cell.
The test series of assay design b) was executed according to Table 38.
Table 38: Cycle description for testing the immunoassay design b).
Cycle N° Sample description
1 Assay buffer
2 Streptavidin (0.1 mg/ml in assay buffer)
3 biotin-aRlgG (12 p,g/ml in assay buffer)
4 Standard 1: RlgG/Cy5-aRIgG (blank/667 pM) 1/1
5 Standard 2: RIgG/Cy5-aRIgG (67 fM/667 pM) 1/1
6 Standard 3: RIgG/Cy5-aRlgG (667 fM/667 pM) 1/1
7 Standard 4: RIgG/CyS-aRIgG (6.7 pM/667 pM) 1/1
8 Standard 5: RIgG/Cy5-aRlgG (67 pM/667 pM) 1/1
In both series of different assay design, a rinsing step with assay buffer
was applied before and after every cycle.
The fluorescence intensity was measured after each cycle and the
results of both test series were compared (Figure 53). Due to the dilution
effect by the mixture with tracer solution at the pre-incubation step in test
series b), just half of the RIgG concentration was present at the correspon¬
ding standard solutions compared to these of the test series a). Nevertheless,the signal was dramatically higher if the assay design b) was applied.
230
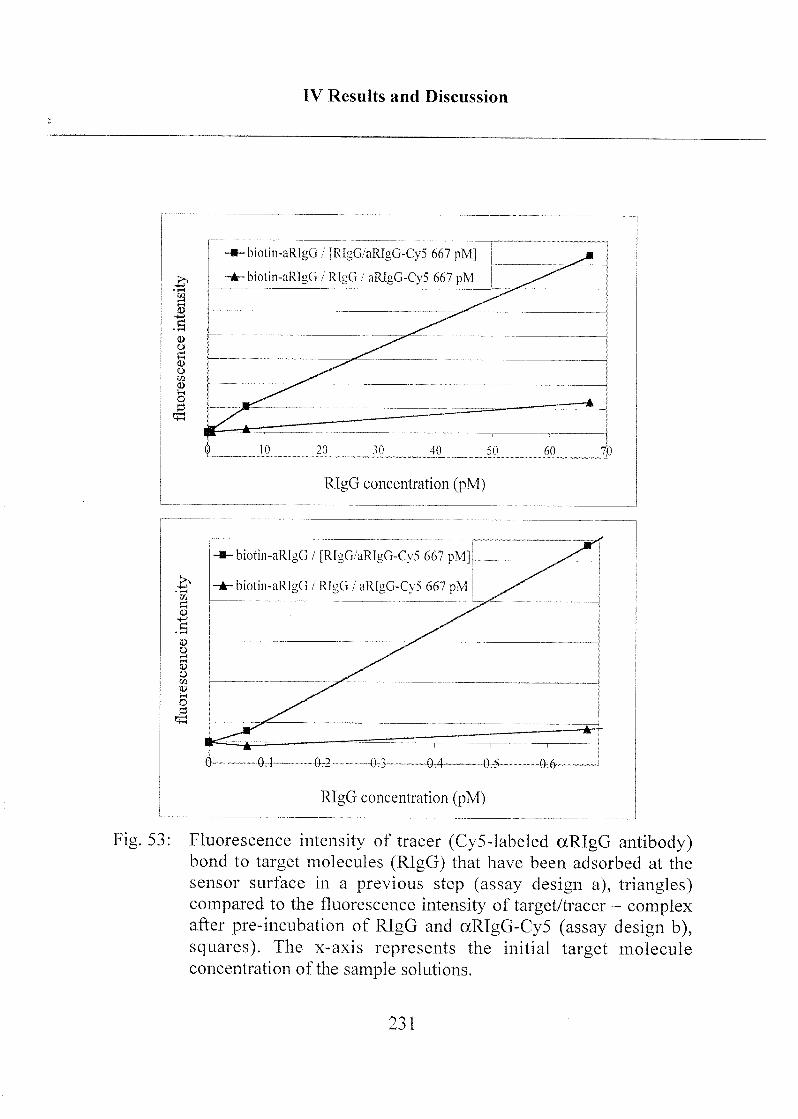
IV Results and Discussion
0 HL 20^
30 JO 50 60,
7J0
RIgG concentration (pM)
RIgG concentration (pM)
Fig. 53: Fluorescence intensity of tracer (Cy5-labeled aRIgG antibody)bond to target molecules (RIgG) that have been adsorbed at the
sensor surface in a previous step (assay design a), triangles)compared to the fluorescence intensity of target/tracer - complexafter pre-incubation of RIgG and aRlgG-Cy5 (assay design b),squares). The x-axis represents the initial target molecule
concentration of the sample solutions.
231
IV Results and Discussion
In comparison it is obvious that the pre-incubation of target molecules
with fluorescently labeled antibody (tracer) molecules followed by the
reaction of the target/tracer - complex with the sensor surface is much more
efficient than the stepwise application of target molecules at the antibody-functionalized sensor surface followed by the reaction of added target and
finally binding the tracer at the sensor. Concerning the RIgG concentration,one has to note that the pre-incubation in design b) leeds automatically to a
dilution of 1:1. The effective applied target molecule concentration is
therefore twice as much at the assay design a) compared to the design b).Nevertheless, the sensitivity for design b) is much higher and the detection
limit (ca. 20 fM) is significantly lower than that for design a). The curve
shows a relatively linear dose - response dependence.
Since the pre-incubation method (design b) is more sensitive and less
time consuming (almost half of the cycles within a test series) we decided to
continue with this assay design for the final step: the investigation, if the
sensor set-up also works for total serum applications.
3.2.7 Application of the Sensor for Serum Samples
The last step, namely the analysis of real biological samples such as
serum or urine is often a real challenge for the applicability of a sensor. Non¬
specific adsorption of proteins, the difference in ion composition of the
measured solutions or the difference in viscosity and diffusion behavior maybe factors that result in lower sensitivity, specificity and/or reproducibility.
Since such a sensor should be usable for different individuals (differentanimals or different patients) an excess of BSA was added to the previouslyused PBS assay buffer. An addition of 1 gram BSA per liter assay buffer
guarantees low relative deviation of the total protein concentration from
sample to sample (minimization of matrix effect). Tween 20 is another
additive, which is introduced to prevent protein adsorption as well as bubble
formation on the walls of the tubes and the flow cell within the apparatus.The new assay buffer was therefore: PBS containing 0.5 ml Tween 20 and 1
g BSA per liter.
232
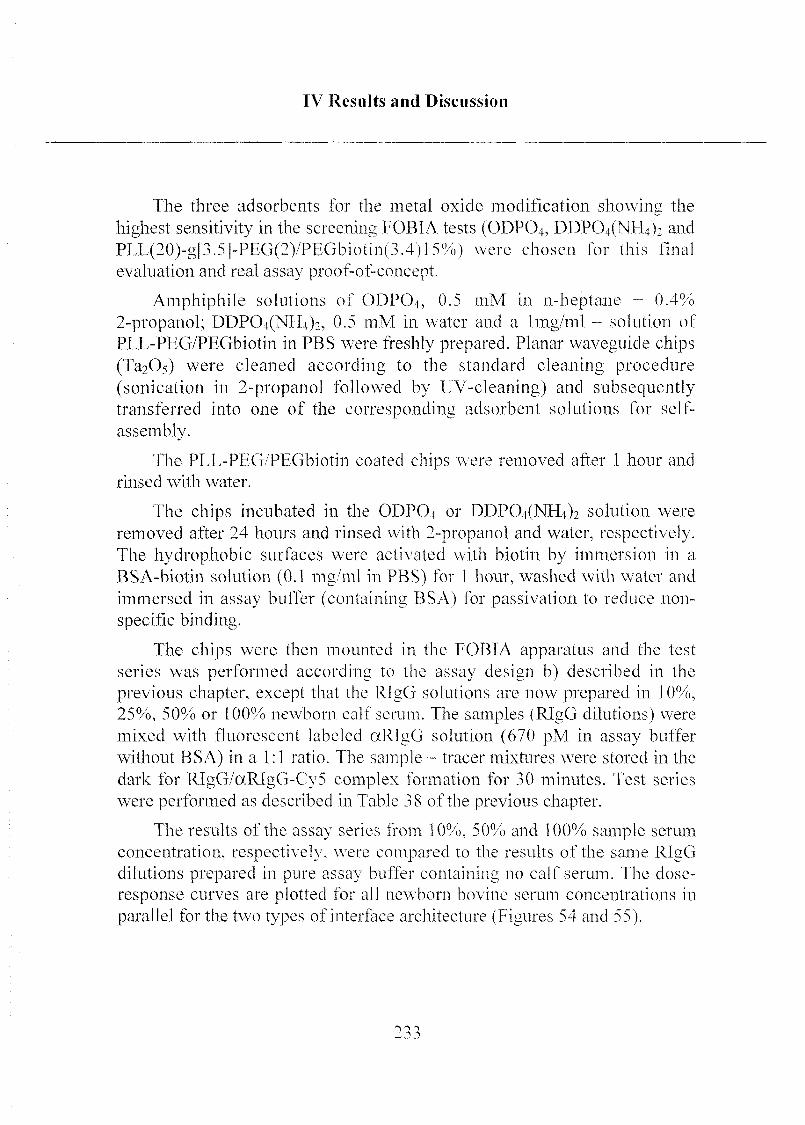
IV Results and Discussion
The three adsorbents for the metal oxide modification showing the
highest sensitivity in the screening FOB!A tests (ODPO4, DDFO^NH^ and
PLL(20)-g[3.5]-PEG(2)/PEGbioti"n(3.4)15%) were chosen for this Unat
evaluation and real assay proof-of-eoncept.
Amphiphile solutions of ODPO4, 0.5 mM in n-heptane 4 0.4%
2-propanol; DDPO^NHfli, 0.5 mM in water and a tmg/ml - solution of
PEE-PEG/PEGbiotin in PBS were freshly prepared. Planar waveguide chips
(TaaO^) were cleaned according to the standard cleaning procedure
(sonication in 2-propanol followed by UV-cleaning) and subsequentlytransferred into one of the corresponding adsorbent solutions for self-
assembly.
The PLE-PEG/PFGbiotin coated chips were removed after I hour and
rinsed with water.
The chips incubated in the ODP04 or DDPO^NH^ solution were
removed after 24 hours and rinsed with 2-propanol and water, respectively.The hydrophobic surfaces were actis ated with biotin by immersion in a
BSA-biotin solution (0.1 mg/ml in PBS) for 1 hour, washed with water and
immersed in assay buffer (containing BSA) for passivation to reduce non¬
specific binding.
The chips were then mounted in the FÖB1A apparatus and the test
series was performed according to the assay design b) described in the
previous chapter, except that the RlgG solutions are now prepared in 10%,
25%, 50% or 100% newborn calf serum. The samples (RIgG dilutions) were
mixed with fluorescent labeled aRlgG solution (670 pM in assay buffer
without BSA) in a 1:1 ratio. The sample - tracer mixtures were stored in the
dark for RIgG/aRIgG-Cy5 complex formation for 30 minutes. Test series
were performed as described in Table 38 of the previous chapter.
The results of the assay series from 10%, 50% and 100% sample serum
concentration, respectively, were compared to the results of the same RIgGdilutions prepared in pure assay buffer containing no calf serum. The dose-
response curves are plotted for all newborn bo\ine serum concentrations in
parallel for the two types of interface architecture (figures 54 and 55).
1j j
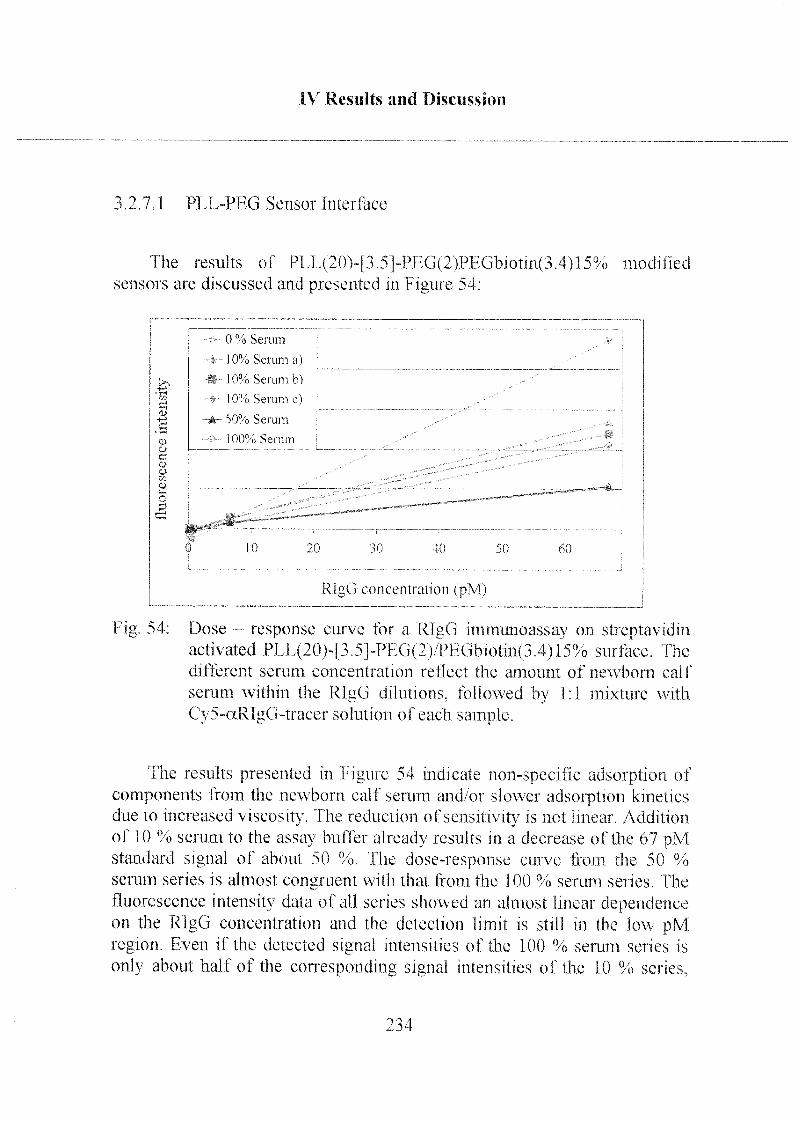
IV Results and Discussion
3.2.7.1 PLL-PEG Sensor Interface
The results of PLL(20V[3 5]-PEG(2)PHGbiotm(3.4)15% modified
sensors are discussed and presented in Figure 54-
0% Sei um
s 10% Seium a)
i?t* 10% Serum b)
% 10% Setum c)0}
-A- 50% Sei um.3
100% Sei umo
CD
5^
O
ê \ï^ „^, i-.ww.wW««wm**
0 10 20 30 40 50 60
RlgG concentration (pM)
Fig. 54: Dose - response curve for a RlgG immunoassay on streptavidinactivated PLL(20)-L3.5|-PHG(2)/Pi:übiotin(3.4)15% surface, fhe
different serum concentration reflect the amount of newborn calf
serum within the RlgG dilutions, followed by 1:1 mixture with
Cy5~aRIgG~traeer solution of each sample.
The results presented in Figure 54 indicate non-specific adsorption of
components from the newborn calf serum and/or slower adsorption kinetics
due to increased viscosity. The reduction of sensitivity is not linear. Addition
of 10 % serum to the assay buffer already results in a decrease of the 67 pMstandard signal of about 50 %. The dose-response curve from the 50 %
serum series is almost congruent with that from the 100 % serum series, fhe
fluorescence intensity data of all series showed an almost linear dependenceon the RlgG concentration and the detection limit is still in the low pMregion. Even if the detected signal intensities of the 100 % serum series is
only about half of the corresponding signal intensities of the 10 % scries,
234
IV Results and Discussion
one has to note thai the net sensitivity referred to the target/serumconcentration (the present assav data show the target/sample concentration)
is about five times higher for non-diluted samples (100% serum series), For
a real patient sample application, the target/serum concentration is the
determining factor.
3 2 7.2 H} drophobic Alkyl Phosphate Sensor Interfaces
The immunoassay results using DDPCH SAMs (front aqueous
DDP04(NPIf)> solution) or ODPOj SAMs as platforms are presented in
Figure 55 and App 26, respective!}
0 °o Set urn
\ 10° o Set urn — _ ^
25% Set urn
-A-SO0 o Set urn
0)
q
100° o Set urn L0)
5
O
ë
ST-"L _
<) 10 20 10 40 SO
R gG concentration (pîvf)
--Î-
60
Fig 55 Dose - response curve for a R[g(i immunoassay on BSA-biotm -
streptavidin activated I)DP04(NHfb surface Ihe different serum
concentrations reflect the amount of newborn calf serum within
the RlgG dilutions, followed b\ 1 1 mixture with Oy5-ccRIgG~tracer solution of each sample The 10 % serum curve correspondsto the average of 4 different series on separate sensors with the
error bars
235
IV Results and Discussion
The dose-response curve for a RIgG immunoassay on BSA-biotin -
streptavidin activated ODPO4 surface (see appendix, App. 26) gave similar
results as the test data from the DDPO4 based sensor surface, which are
presented in Figure 55. The dose-response deviation between the 0%, 10%,
25% and 50% serum concentrations is within the error range of the system
(differences from chip to chip, predominantly due to limits in the
reproducibility of the waveguide layers). Both sensors prepared via
hydrophobic phosphate SAMs of DDPO4 and ODPO( showed a decrease of
the fluorescence signals for the 100 % serum series compared to the signalintensities of lower serum concentration series. Nevertheless, the net
sensitivity referred to the target/serum concentration is the highest for non-
diluted serum samples. That means that 100 % of patient serum can be used
for the determination of the concentrations of similar target molecules.
3.2.7.3 Comparison of PLL-PEG and Alk\ I Phosphate Sensor Interfaces
The limiting factors for the sensitivity of a sensor are the signal-to-noiseas well as the SB/NSB ratio. These factors are indirectly represented in the
dose-response curves (Figures 54 and 55, and App. 26).
Both systems (PLL-PEG and alkyl phosphate SAMs) showed excellent
tolerance to biological material such as serum. The dose-response curves are
linear down to the low picomolar to femtomolar region, independent of the
serum concentration. The inherent protein resistance and specific activityagainst streptavidin make the PLL-PEG'PEGbiotin derivatives interestingfor biosensor applications. The good solubility in water is a further behavior
that simplifies its handling. Nevertheless, the alkyl phosphate SAM-based
sensors showed significantly higher sensitivity for the 100 % serum series
(about three times higher signal in the case of DDPO4 compared to the PLL-
PEG sensor surface). Since the increased viscosih with increasing serum
concentration and therefore the kinetics for specific adsorption is the same
for both systems we believe that the BSA-biotin - streptavidin activated (and
236
IV Results and Discussion
BSA passivated) surfaces have a better resistance against non-specific
protein adsorption, in comparison to PLL-PEG/PFG-biotinl5% surfaces.
The detection limit for RIgG (concentration referred to newborn bovine
serum), measured with the phosphate sensor chips, was found to be in the
femtomolar region and measured \\ ith the PT 1 -PFG based sensor chip in the
region of 1 to 10 pM.
3.2.8 Mixed SAMs for Biosensor Applications
First tests were executed to inxestigate the influence of the SAM
hydrophobicity on the activity of immobilized antibodies.
Planar waveguide chips (TaiOs) were cleaned and coated by immersion
in different DDPOt(NH4yOH-DDP04(NFI4)2 mixtures as described in
chapter IV 2.1.3.2, where the water-contact-angle data are presented in
Figure 3 1 and Table 30: 0.5 mM aqueous solutions from the two different
alky I phosphate ammonium salts were prepared. The solutions were mixed
in a ratio of 8:2, 6:4, 4:6 and 2:8 (corresponding to OH-DDPO^NHf)?concentrations of 80%, 60%, 40% and 20%, referred to the total amount of
alkyl phosphate, respectively).
Clean Ta2Os chips were separately incubated in the mixed amphiphilesolutions as well as in pure 0.5 mM DDP04(NITt)2 solution (0% hydroxy-terminated phosphate) and in pure 0.5 mM OH-DDPOt(NTT4)2 solution
(100% hydroxy-terminated phosphate). The resulting SAMs presentingdifferent hydrophobicities were then used for first biosensor tests.
For the determination of the activity of immobilized antibodies, we also
used the Cy5-RlgG/(xRIgG model system. Similar to the determination of
specific and non-specific binding of target molecules (chapter TV 3.2.2), the
SAM-coated sensor chips were incubated in a BSA-biotin solution
(0.1 mg/ml in PBS) for 1 hour, rinsed with water and immersed in a BSA
solution (I mg/ml in PBS) for 10 minutes, fhe chips were again rinsed with
water, blow-dried with nitrogen and mounted in the FOB1A apparatus.
237
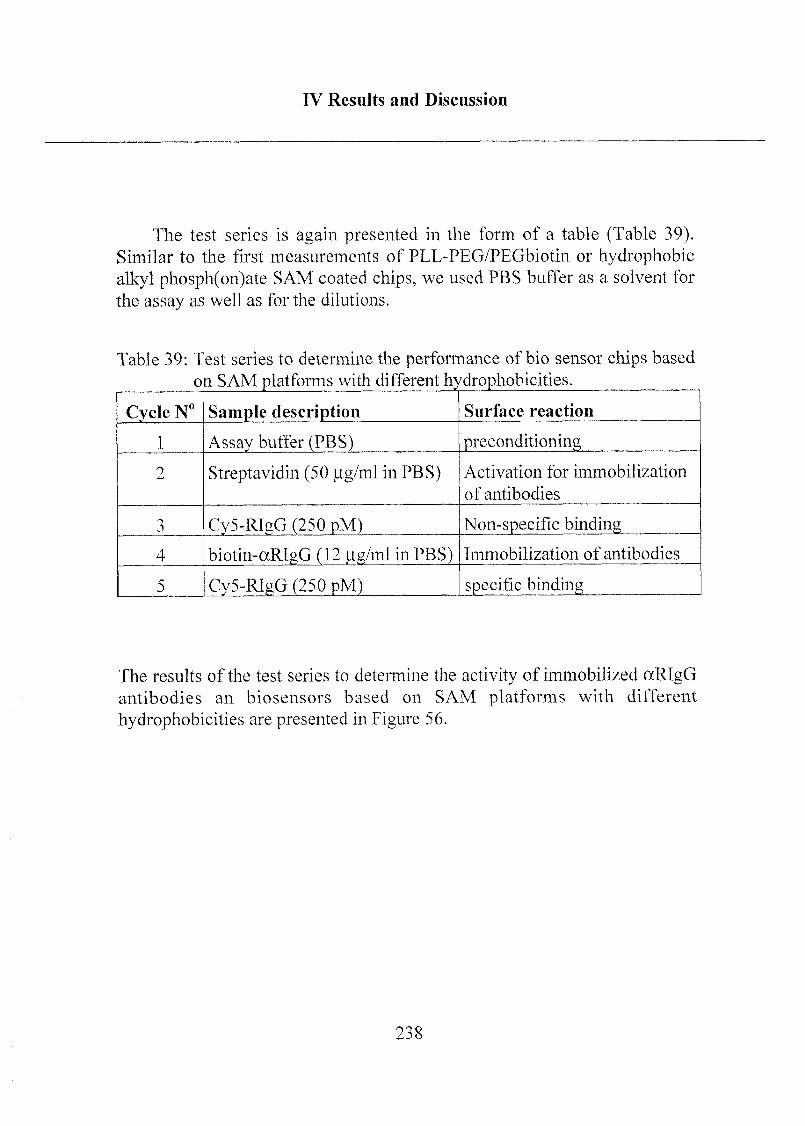
IV Results and Discussion
The test series is again presented in the form of a table (Table 39).Similar to the first measurements of PLL-PEG/PEGbiotin or hydrophobic
alkyl phosph(on)ate SAM coated chips, we used PBS buffer as a solvent for
the assay as well as for the dilutions.
Table 39: Test series to determine the performance of bio sensor chips based
on SAM platforms with different hydrophobicities.
Cycle N° Sample description Surface reaction
1 Assay buffer (PBS) preconditioning
2 Streptavidin (50 fig/ml in PBS) Activation for immobilization
of antibodies
3 Cy5-RlgG (250 pM) Non-specific binding
4 biotin-oeRIgG (12 p:g/ml in PBS) Immobilization of antibodies
5 Cy5-RIgG (250 pM) specific binding
The results of the test series to determine the activity of immobilized aRIgGantibodies an biosensors based on SAM platforms with different
hydrophobicities are presented in Figure 56.
238
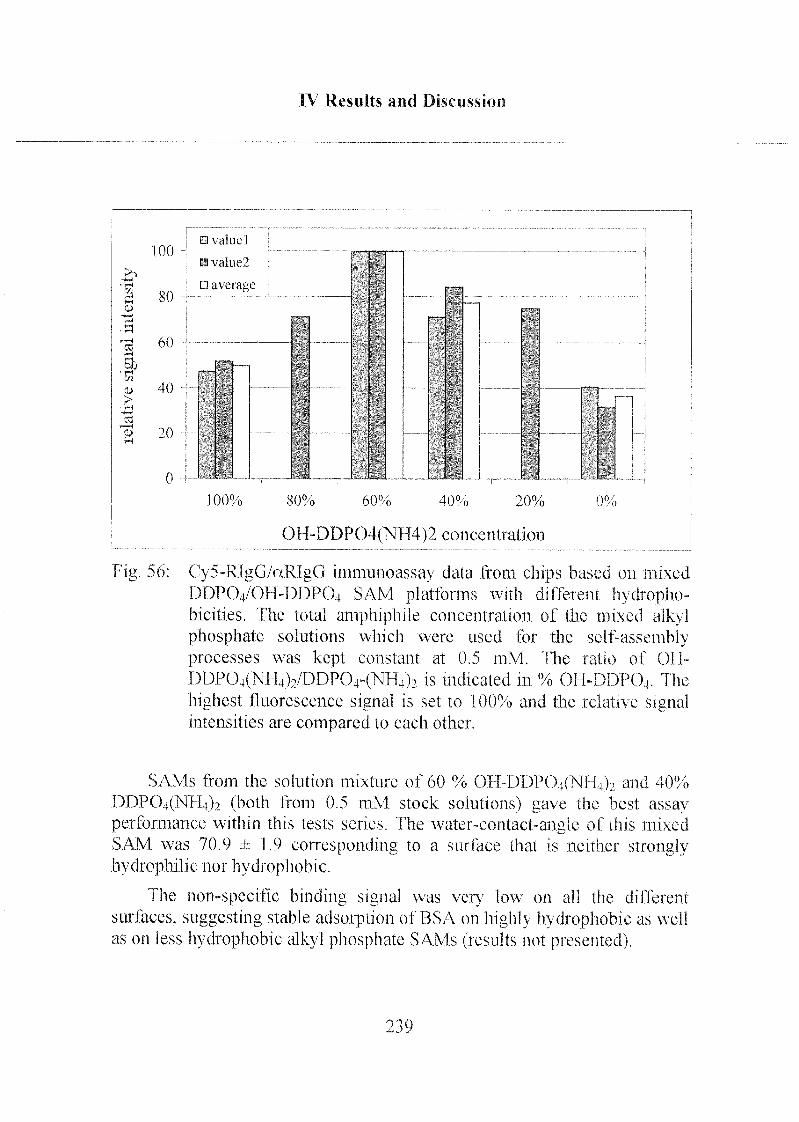
IV Results and Discussion
100% 80% 60% 40% 20% 0%
OH-DDP04(N 114)2 concentration
Fig. 56 Cy5-RlgG/aRIgü immunoassay data from chips based on mixed
DDPCVOH-DDPOj SAM platforms with different hydropho-bicities The total amphiphile concentration of the mixed alkylphosphate solutions which were used for the self-assemblyprocesses was kept constant at 0 5 mM The ratio of OH~
DDP04(NH4)2/DDP04~(NH4)2 is indicated in % OII-DDP04 I he
highest fluorescence signal is set to 100% and the relative signalintensities are compared to each other
SAMs from the solution mixture of 60 % OH-DDPO4(NFl0> and 40%
DDP04(N1I4)2 (both from 0 5 mM stock solutions) gave the best assay
performance within this tests series fhe water-contact-angle of this mixed
SAM was 70 9 ± 19 corresponding to a surface that is neithet stronglyhydrophilic nor hydrophobic
The non-specific binding signal was very low on all the different
surfaces, suggesting stable adsorption of BSA on highly hydrophobic as well
as on less hydrophobic alk\ I phosphate SAMs (results not presented)
239
TV Results and Discussion
More detailed analyses of the mixed SAMs based on techniques such as
XPS, ToF-SIMS and AFM are in preparation and will be published[Tosa,20001.
3.2.9 Summary of the Immunoassay Performance
A quantitative and generali} valid comparison between the three
different surface architectures in terms of their performance as immunoassayplatforms is difficult because onl} one test, the rabbit IgG - goat anti rabbit
IgG model system, has been investigated in detail. Another problem is the
currently low reproducibility of the planar waveguide chips which show
differences in their quality, especiall} from batch to batch. Nevertheless,there are several qualitative to semi-quantitative compared criteria that can
be used to judge the sensor performance of the different approaches.
The total concentration range for a RlgG immunoassay using our
system reaches from 1 to 250 pM (or higher1) and from 10 to 250 pM (orhigher1) for hydrophobic alky I phosphate SAMs and PLL-PEG based
sensors, respectively. The upper physical detection limit of the opticaldevice (including amplifier, filters, etc.) within a dose-response test series is
about 1 nM.
Concerning immunoassay applicability, the mixed SAMs show the best
performance in terms of a system without further functionalization, i.e. usingphysical adsorption of the recognition units. Nevertheless, PLL-PEG may
represent a platform which provide a surface architecture that is chemicallymore versatile (e.g. functionalization with succinimidyl group for
subsequent covalent binding of recognition elements) or for oligonucleotidesensor applications.
PLL-PEG derivatives and the ammonium salts of DDPO4 and 011-
DDPO4 are highl} suitable for industrial sensor production, for three
reasons: the substances are not toxic; aqueous solutions (no need for organicsolvents); cost-effective spontaneous adsorption by simple dipping processnot requiring multistage, expensive and difficult surface functionalization.
1) The upper detection limit or the linearitj. limit of the dose-response curve in the higherconcentration range were not tested.
240
V Conclusions and Outlook
Conclusions and Outlook
Two different principles of adsorbents (alkyl phosph(on)ates and poly-(L)-lysine - poly(ethylene glycol) derivatives) for the formation of self-
assembled adlayers were used to prepare biospecific surfaces and to studytheir performance for biosensor applications.
Metal oxide surfaces such as Ta2t>5, T1O2 and Nb205 have been coated
with different alkyl phosphates and phosphonates. The monofunctional
(methyl-terminated) phosph(on)ates adsorb as two-dimensionally ordered
self-assembled monolayers (SAMs) and form highly hydrophobic surfaces.
SAM formation kinetics were studied with a grating coupler method
and water-contact-angle. It has been shown that self-assembly of alkyl
phosphates on TaiOs is a fast process, where 90% of the monolayer has
formed after a few minutes. Alkyl phosph(on)ates have been shown to be
stable in air for long periods (months). Slow alkyl phosph(on)ate desorptioncould be measured when SAM coated metal oxide samples were stored in
water or phosphate buffer saline solution (PBS).
Based on water-contact angle measurements, X-ray photoelectron
spectroscopy (XPS), time-of-flight secondary-ion mass spectrometry (ToF-
STMS), near-edge X-ray absorption fine-structure spectroscopy (NEXAFS)and atomic force microscopy (AFM) we have developed a molecular model
describing orientation and order of the SAMs. The driving force for the
process is believed to be the strong complex binding of the polarphosph(on)ate head group to the metal cations. Strong evidence for this
conclusion is the fact that SAMs do not form if an excess of inorganic
phosphate is present in the amphiphile solution.
Octadecyl phosphate (ODP04), self-assembled on TajOs has been
studied most extensively. A binding model has been proposed, where the
phosphate (ligand) forms monodentate and bidentate complexes with the
tantalum cation. The model has been applied on the different
amphiphile/metal oxide combinations of monofunctional amphiphiles
241
V Conclusions and Outlook
(dodecyl phosphonate and biphenyl phosphate) or bifunctional amphiphiles(hydroxy dodecyl phosphate and N-ethylamino dodecyl phosphonate) self-
assembled on Ta20s or TiCb. The ratio of two different oxygen bindingtypes (0(1) : P-0 M and P=0; 0(2) : PO-R and PO-H) that were detected
by XPS analysis support the validity of the monodentate - bidentate model.
Ammonium salts of a monofunctional (DDPO4) and a bifunctional
(OII-DDPO4) phosphate were prepared by simple precipitation of the
products. Formation of the ammonium salts improves water solubility of the
alkyl phosphates.
The observation that DDPO4 selectively self-assembles (from aqueoussolution of its ammonium salt) onto metal oxide surfaces (such as TJO2,Ta20s, Fe203, ND2O5, ..) but not onto silicon oxide it will be possible to
produce hydrophobic/hydrophilic patterns on correspondingly preparedmetal oxide/silicon oxide surfaces (prepared by e.g. lithographic methods).Within the framework of the thesis it has been shown that it is also possibleto produce more hydrophilic SAMs using aqueous solutions of the
ammonium salt of hydroxy-terminated dodecyl phosphates (OH-DDP04(NH4)2). Furthermore, the hydrophobicity imposed onto a metal
oxide surface can be varied in a controlled, predictable way by the formation
of mixed methyl-/hydroxy-terminated dodecyl phosphate SAMs. Such
mixed SAMs have been shown to serve as sensor platforms for
immunoassay applications with a maximum recognition element activity for
SAM-coated samples that were produced from a solution with a
DDP04(NH4)2/OH-DDP04(NH4)2 ratio of 0.66.
Since hydrophobic SAMs from alkyl phosphates provide reproducible,homogeneous surfaces that can be easily functionalized by, for example,biotin-conjugated albumin, the system becomes an ideal substrate for
biosensor miniaturization.
For the investigation of these hydrophobic surfaces, a novel method
named microdroplet density (|add) has been introduced: Samples are cooled
down in air of high humidity and water vapor condenses at the surface in the
form of droplets. The distribution of growing droplets has been used to
estimate the homogeneity of the SAMs (qualitatively) on the jim scale.
Quantification (droplets per unit area) leads to a value (microdroplet density)that allows for the quantitative estimation of the surface quality. The method
V Conclusions and Outlook
is believed to be useful in a large field of application in materials science
and industry.
Polyethylene glycol)-grafted poly-(L)-lysine (PLL-g-PEG), with a PLL
backbone that is inherently positively charged at neutral pH, spontaneouslyadsorbs onto negatively charged surfaces, such as metal oxides, havingisoelectric points (IP) typically lower than 5, by electrostatic interaction,
PEG-grafted copolymers are not limited to molecules based on poly-lysinebackbones. Negatively charged backbone polymers such as poly-carboxylates would provide copolymers that could be selectively adsorbed
onto positively charged surfaces (e.g. AI2O3 or Fe203) at neutral pH.Patterned mixed adlayers of positively and negatively charged PEG-
copolymers could be realized on correspondingly prepared mixed metal
oxide surfaces.
Biotin-functionalized PLL-g-PEG copolymers have been successfullyused for the immobilization of recognition elements either by specificbinding of streptavidin-conjugated capture molecules or by the introduction
of an intermediate streptavidin adlayer followed by specific binding of
biotinylated capture molecules. Synthesis of other functionalized copoly¬mers such as vinylsulfone-terminated, PEG-grafted backbone polymers, are
potential candidates for further derivatization via covalent binding. Such
polymers are believed to provide protein-resistant adlayers for biosensor
applications and implant material modification for controlled binding of
biomolecules such as recognition elements and specifically biocompatibleunits (e.g. for selective cell growth), respectively.
The functionalization of alkyl phosphates with oligo(ethylene glycol) or
PEG at the ©-position is believed to have potential for producing protein-resistant surfaces based on the phosphate chemistry. The Van der Waals
interaction of the alkyl chains, responsible for two-dimensional ordered
SAMs, combined with the protein resistance of the PEG moiety and the
specific chemistry of terminal functions (e.g. biotin terminated PEG) is
believed to open a large field of applications due to the specific properties of
each components of such novel substances.
243
V Conclusions and Outlook
The detection limit of the used model system immunoassay (rabbitIgG/anti rabbit IgG) is in the temtomolar region, which is comparable to that
of well-established methods such as enzyme-linked immuno sorbent assay
(ELISA) or radio immunoassay (RIA). Further optimization of the system
(e.g. miniaturization) is expected to lower the detection limit to the attomolar
(1CT18M) or zeptomolar (10"21 M) region with a significant reduction of time-
to-result of 1 - 2 orders of magnitude.
The potential uses of biosensors cover a large spectrum, including:immunoassays, toxicology analysis, forensics, drug screening, genomics and
proteomics, agrodiagnostics, diagnostics and therametrics or patient
stratification. The worldwide financial impact of biochips has been
calculated to be about $ 40 million for the year 1998 and is estimated to
exceed the $ 500 million-per-year limit by the year 2005 [BioW,1999].
244
VI Literature
VI Literature
I Abel, 1995] A.P.Abel Faseroptischer hvancszenzfeld-Biosensor zum SequenzspezifischenNachweis von Oligonucleotide)!. Doktorarbeit, Basel, 1995.
[Ahlu, 19911 A.Aliluwalia, D.DcRossi. C.Ristori. A.Schirone, G.Serra Biosensors de
Bioelectronics 1991, 7 207.
[Ai/e,1998] J.Aizenberg. A.J.Black, G.M.Whitesides Nature 1998, 394, 868.
[AlarJ 990] J.P.Alarie. M.J.Sepaniak. T.Yo-Dinh. inal Chim. Acta 1990, 229, 169.
[Alst, 1999] J.G.Van Alston Langmuir. 1999, 75. 7605.
[Amer.2000] Amersham Life Science FluoreLink C> 5 Monofunctional Dye 5-Pack
Cat.No. PA25001. Amersham Rahn, Switzerland, 2000.
[Anza, 1993] J-I.Anzai, r.Hoshi. S.l ee. T.Osa Sensors and Actuators B 1993,13-14. 73.
1 Aron. 1997] Y.G.Aronoft B.Chen. G.I u. C.Seto. J.Schw art/. S.L.Bernasek J Am Chem
Soc. 1997, 119, 259.
[Bain, 1989] C.D.Bain, E.B.Throughton. Y.-T.Tao. J.F\ all. G.M.Whitesidcs. R.G.Nuzzo J.
Am. Chem. Soc. 1989, 111. 321.
[Ball. 1995] B.Ballou, G.W.Fisher. A.S.Waggoner. D.l .Parkas, J.M.Rciland, R.Jaffe.
R.B.Mujumdar. S.R.Mujumdar, T.R.Pfakala Cancer Immunology,
Immunotherapy 1995, 41, 257.
[Bart.2000] W.Barthlott, C.Neinhuis Planta 1997, 202, 1.
[BioW, 1999] Bio World 2/99 (Front Line, Foster Cit\, CA)
[Bier, 1991J K.Bier Ohcrflachenreinigung von Lithiumniohat und Ilerstellwig von
Aminosilanfilmen durch Gasphasenahscheidung Diplomarbeit, Heidelberg,1991.
[Bish,1996] A.R.Bishop, R.G.Yuz/o Curr Opin Colloid Interface Sei 1996,/, 127.
ß Ian. 1996] A.P.Blanchard. R.J.Kaiser. L.L.Ilood Biosensors & Bioelectronics 1996, /1,
687.
[Bous, 1991] L.J.Bousse J. Colloid Interface Sei. 1991, 142 22-32.
VI Literature
[Bram.l 997] Ch.Bram. Ch.Jtmg. M.Stratmann Fres. J. Anal Chem. 1997, 358, 108.
|Bram,1998] C.Bram Oherflachenanah tische l Untersuchungen zur Selhstorganisation von
aliphatischen Phosphonsauren auf Aluminium. PhD Dissertation. Erlangen,1998.
[Brov,1999] D.Brovelli, G.llähner, L.Rui/, R.Hofer. G. Kraus, A.Waldner, J.Schlösser,
P.Oroszlan, M.Ehrat N.D.Spencer Langmuir 1999,15, 4324.
[Busc, 1989] G.Busca, G.Rarais, V.Loren/elli. P.P.Rossi, A.L.Ginestra, P.Patrono
Langmuir 1989, 5, 911.
[Chid, 1991] C.R.D.Chidsey Science 1991, 251, 919.
[Cott.l988| F.A.Cotton, G.Wilkinson Advanced Inorganic Chemistry, 5th ed.; Wiley: "New
York, 1988.
fDann,1998] O.Dannenbcrger, J.J.Wolff. M.Buek Langmuir 1998,14, 4679.
|Desh, 1993] S.S.Deshpandc, B.P.Sharma: In P.Singh, B.P.Sharma, P.Tyle: Diagnostics in
the year 2000: VanNostratid Rcinhold. New York. 1993, 459.
[Desh, 1994] S.S.Deshpandc. R.M.Rocco Food technology 1994, June, 146.
[Duve, 1995] G.L.Duveneck. P.Oroszlan. A.P.Abel. B.Klee, V.Steiner, M.Ehrat. D.Gygax,Tl.M.Widmet* Proceedings of Medical and Fiber Optic Sensors and Delivery
Systems, SP1E. Vol. 2631, Barcelona. 1995, 14.
|Duve, 19961 G.L.Duveneck, M.Pawlak. D.Ncusehäler, W.Budach, M.Ehrat Proceedingsof Biomedical Systems und Technologies. SP1E, Vol. 2928, Vienna, 1996, 98.
|Elbe,1996] D.L.Elbert, J.A.llubbellJm?» Rev Mater Sei 1996,20", 365.
[Elbe, 19981 D.L.Elbert. J.A.I Iubbell J Biomed Mater Res 1998,72,55.
[Fcut,1993] P.Peuter. P.Eisenberger. K.S.l iang Fhys. Rev. Lett. 1993, "0. 2447.
[Fisc,1997| D.Fischer. A.Marti, G.Hähner,/; Vac. Sei. TeclmoT A 1997, 15, 2173.
[Folk,1995] J.P.Folkers, Ch.B.Gorman, P.P. Laibinis, S.Buchholz, G.M.Whitesides.
R.G.NU770 Langmuir 1995, //. 813.
[Fris,1994] C.D.Frisbie. LP.Ro/sm ai. A.No>, M.S.Wrightom C.M.Lieber Science 1994,
265, 2071.
LGabr.1999] CLGabriel J J'ac Sei Teelmol A 1999, /" 1494.
246
VI Literature
[Gao.1996] W.Gao, L.Dickinson. Ch.Grozinger. E.G.Morin, L.Rcven Lcmgmuir 1996, 12,
6429.
[Gao.1997] W.Gao. L.Dickinson. Ch.Gro/inger. F.G.Moria, L.Rcven Lcmgmuir 1997,13,
115.
LGate, 19641 B.M.Gatehouse, A.D.Wadsle\ Acta Cryst 1964, 17, 1545.
| Glas. 19961 J.E.Glass Hydrophilic Polymers, Performance with Environmental
Acceptance; Am. Chcm. Soc. Washington, DC 1996.
[Grcs. 19791 R.Gresch, W.Müller-Warmuth, H.Dutz J. Non-Cryst. Solids 1979, 34, 127.
[Hähn.19911 G.IIähner, M.Kinzler. Ch.Wöll. M.Grunze, M.K.Scheller, L.S.Cederbaum
Phys. Rev Lett, 1991, d", 851.
[Hatp,1992| A.Halperin, M.Tirrell. LP.Lodge Advances in Polymer Science 1992,100,
31.
[Hand, 19971 Handbook of Chemistry and Physics; CRC Press: Boca Raton, FL, 1997.
[Hard, 19981 P.I larder. M.Grunze, R.Dahint, G.M.Whitesides, P.R.Laibinis J. Phvs C hem
£1998, / 02. 426.
[Haze,19311 F.Ilazel, G.ILAyres J. Pin s Chem 1931, 35, 2930.
[Ileng,1987| A.Henglein Ultrasonics 1987, 25, 6.
[Hick. 19911 J.JJIickman, D.Ofer, P.E.Laibinis. G.M.Whitesides, M.S.Wrighton Science
1991, 252, 688.
[Higg,1987| I.L.lIiggins. C.R.LowcPhil frans R. Soc Land. 1987, B316, 3.
rilofe,2000a] R.Hofer, M.Textor. N.D.Spencer Langmuir 2000, (submitted).
[IIofe,2000bl R.Hoier. M.Textor, G.IIähner. N.D.Spencer Langmuir. 2000, (in prep.).
[Huan, 19961 S.-C.(P.)1 Luang. K.D.Caldwell. J.-N.Lin, H.-K.Wang, J.N.Hcrron Langmuir
1996, 12. 4292.
[Hubb,20001 J.A.Ilubbell. M.A.Textor Multifunctional Caiionic and Anionic Polymeric
Coatings for Surfaces in Analytic and Sensor Devices. Patent 2000,
(submitted).
|1 lula.l9911 A.lhilanicki. S.Glab, F.Fngman Pure & Appl Chem. 1991, 63,'9, 1247.
247
VI Literature
[Jana, 1998] J.Janata, M.Josowic/, P.Vanysek, D.M.DeVancy Anal. Chem. 1998, 70,
179R.
[ Joha,19571 P.G.Johannsen. A.S.Buchanan Australian J. Chem. 1957,10, 398.
[JohnJ 991] B.Johnssou, S.Lotas, G.Lindqvist/J^/. Bioehem. 1991, 198, 268.
[Jung,1998] C.Jung AIDiphosphonsäuren als molekulare Haftvermitllerfür Aluminium
und Zinkwerkstoff. PhD Dissertation, brlangen, 1998.
[Kena,2000] G.Kenausis, J.Vörös, D.L.Libert. N.Huang, R.Hofer, L.Ruiz, M.Textor,
J.A.Hubbell. N.D.Spencer J. Phys. Chem. B 2000,104, 8298.
[King. 1999 ] P.Kingshot. HLJ.Griesser Currant Option in Solid State and Materials Science
4 1999, 403.
[Kinz,l 994) M.Kinzler, A.Schertel. G.Hähner, Ch.Wöll, M.Grunze, H.Albrecht,
G.Holzhüter, Th.Gerber./ Chem. Phys. 1994,100, 7722.
[Kric, 1993] L.J.Kricka Clinical Biochemistry 1993, 26, 325.
[Krög, 1998[ D.Kroger, A.Katerkam. R.Renneberg. K.Cammann Biosensors &
Bioactivalors 1998, 75, 1141.
[Kuma, 2000] C.V.Kumar. A.Chaudhari J. Am. Chem Soc. 2000, 122, 830.
[Kurr, 1997] R.Kurrat. M.Textor, J.J.Ramsten. P.Böni. N.D.Spencer Rev. Sei. Insirum.
1997,68, 2172,
[Kurr,1998] R.Kurrat Ph.D. Adsorption of Biomoleeules on Titanium Oxide Layers in
Biological Model Solutions PhD Dissertation. RTH Zürich, Switzerland,
1998.
[Laib,1989| P.KLaibinis. J.J.llickman. M.S.Wrighton, G.M.Whitesides Science 1989,
245, 845.
[Lec,2000] K.P.Lee. Il.Cho, R.K.Singh. S.J.Pearton. C.Ilobbs. P.Tobin J. Vac. Sei.
Teehnol. B 2000, 18. 293.
[Lin,1991] J.-N.Lin. I.-N.Chang. J.D.Andrade. J.N.Herron. D.A.ChristensenJ. of
ChromaiogrA99h542. 41.
[Löpe.1993] G.P.LÖpez, H.A.Biebuyek. C.D.Friesbi. G.MAVhitesides Science 1993, 260,
647.
[Löse! 9981 F.Löscher. T.Ruckstuhl. S.Seeger Adv. Mater 1998, 10. 1005.
248

VI Literature
[Lu. 19961 B.Lu, M.R.Smith, R.C/Kermedy Analyst 1996,121, 29R.
[Maeg,1997] l.Maegc, E.Jaehne, A.Henke, H.-J.P.Adler. C.Bram, C.Jung, M.Stratmann
Macromol. Symp. 1997, 126. 7.
[Macg, 1998] T.Maege, E.Jaehne, Ai lenke. H.-J.P. Adler. C.Bram, C.Jung, M.Stratmann
Progress in Organic Coatings. 1998, 34, 1.
[Maoz, 1984] R.Maoz, J.Sagiv Journal of Colloid and Interface Science 1984, 100, 465.
[Maoz. 1988] R.Maoz, L.Net/er. J.Gun, J.Sasgiv J Chim. Phys. 1988, 85, 1059.
[Matt, 1930] S.Mattson Soil Sei. 1930, 30. 459.
[Matt, 1934] S.Mattson, A.J.Pugh Soil Sei. 1934, 38. 229.
|McNe,19931 C.McNeill Biosem, Bioeleclron. 1993, S"
i-v.
[Méri, 1937] R.Mérigaux Rev. Opt. 1937, 9, 281.
[Mitt, 1993] K.L.Mittal, Contact angle, wettability and adhesion, VSP, 1993.
[Moul, 1992] J.F.Moulder. W.F.Stickle. P.K.Sobol, K.D.Bomben Handbook ofX-ray
photoe/eclron spectroscopy; Perkin-Flmer CorporalioiEPHI Division: Eden
Prairie, MN, 1992.
[Naka,1996] K.NakanisM, H.Muguruma. l.Karube Anal. Chem. 1996, 68, 1695.
[Nath,1997] N.Nath. S.R.Jain. S.Anand Biosensors & Bioactivaiors 1997, 12, 491.
[Nuzz,1983 ] R.G.Nuzzo, D.L.Allara J. Am. Chem. Soc. 1983, 105, 4481.
[Nyqu.2000] RM.Nyquist. A.S.Eberhardt. L.A.Silks 111, Z.Li. X.Yang, B.I.Swanson
Langmuir 2000, 16. 1793.
| Okam. 1985] Y.Okamoto Bull. Chem. Soc. Jpn. 1985, 58, 3393.
[Outk, 1988] D.A.Outka. J.P.Stöhr, J.D.Schwalen J. Chem. Phys. 1988, 88, 4076.
[Park, 1965 ] G.A.Parks Chemical Reviews 1965, 65, 177.
[Pate.1997] N.Patek M.C.Da\ies. M.Hartshorne. R.J.Heaton. C.J.Roberts, S.J.B.Tendler,
P.M.Williams Langmuir 1997,13, 6485.
[Poir, 1996] G.E.Poirier. E.D.P\ lant Science 1996, 272, 1145.
[Port.1987] M.D.Porter, L.B.Bright, D.L.Allara. C.E.D.Chidsey J. Am. Chem. Soc. 1987,109, 3559.
249
VI Literature
[Prim. 19931 K.L.Primc, G.M.Whitesides J. Am. Chem. Soc. 1993, 7/5, 10714.
[Rams, 1993J J.J.Ramsten.7. Stat. Phys. 1993, ~J, 853.
[Rams, 1995] J.J.Ramsten. D.J. Roush. D.S.Gill R.Kurrat. R.C.Willson J. Am. Chem. Soc.
1995, 7 7" 8511.
[Rayl, 19ll| Lord Rayleigh Nature 1911,66,416.
[Roge,1992] K.R.Rogers, J.N.Lin Biosens. Bioelcctron. 1992, 7, 317-321.
[Roth.1965] R.S.Roth, A.D.Wadsley Ada ( 'ryst. 1965, 18, 724.
[Saka,1998] N.Sakai. R.Wang, A.Fujishima. T.Watanabe. K.ïlashimoto Langmuir 1998,
14, 5918.
[Sala, 19951 M.T.Salama, T.Shido, H.Minagawa. M.lchikawa J. Catal 1995, 152, 322.
[Sehe, 19871 F.W. Serieller Stud. Biophys. 1987,119, 221.
LScof,1976] J.H.Scofield J. Electron Spectrosc. Re/at. Phenom. 1976, 8, 129.
LScah, 19791 M.P.Seah. W.A.Dench Surf. Interface ,inal. 1979, 1, I.
[Sell.19931 TT.Sellers, A.Ulman. Y.Sehnidman, J.E.Eilers J. Am. Chem. Soc. 1993,115,
9389.
LShri, 1997J L.C.Shriver, B.Donner, R.Fdelstein, K.Breslin, S.K.Bhatia, F.S.Liglcr
Biosensors & Bioactivators 1997, 12, 1101.
[Shum,2000] I.S.Shumaker-Parry. Ch. LCampbeil. G.D.Stormo. F.S.Silbaq, R.Il.Aebersold
Proc. of Medical and Fiber Optic Seniors and Delivery Systems, SPIE, San
José, CA, submitted, 2000.
[ Sigg.2000 J K. Sigg Micro Droplet Den s it\ } lessungen aufhydrophilen und hydrophoben
Oberflächen mit und ohne Strukturierung Semesterarbeit I, Lab. for Surface
Science and Technology. Dept. of Mat., ETH Zürich, Switzerland, 2000.
[Situ, 1998] M.Situmorang, J.J.Gooding, D.B.llibbert. D.Barnett Biosensors &
Bioactivaton \998,13, 953.
[Soft. 19981 S.J.Sofia. V.Premnath, E.W.Merrill Maeromolecules 1998, 31. 5059.
[Spie, 1998] U.E.Spichiger-Keller Chemical Sensors and Biosensors for Medical and
Biomedical Applications: Wiley-VCH. Weinheim, 1998.
[Spin,l 993J J.Spinke. M.Liley, E.-J.Sehmitt J.Chem.Phys. 1993, 99, 7012.
250
VI Literature
I StepJ 9711 N.C.Stephenson. R.S.Roth Acta Crys. 1971, B27, 1037.
[Stöh. 1992] J.Stöhr XEXAFS Spectroscopy; Springer: I leidelberg, 1992.
[Swal, 1987] J.D.Swalan, D.L.Allara. J.D.Andrade, EA.Chandross, S.Garoff,
J.Israelachvili, T.J.McCarthy. R.Murray, R.F.Pease, J.F.Rabolt, K.J.Wanne,
H.Yu Lungmuir 1987, 3, 932.
|"Text,2000"| M.Textor. L.Ruiz, R.Hofer, A.Rossi. K.Feldman, G.Häliner, N.D.Spencer
Langmuir 2000, 16, 3257.
[Thie, 1997] A.J.Thiel. A.G.Frutos. C.E.Jordan. R.M.Corn, L.M.Smith Anal. ( "hem. 1997,
69. 4948.
[Tosa.2000] S.G.P.Tosatti, M.Textor. N.D.Spencer, in prep.
[Ulma. 1990] A.Ulman Adv. Mater. 1990, 2, 573.
[Ulma,1991] A.Ulman/f/7 introduction to organic thin films: from Langmuir-Blodgett to
SelfAssembly Academic Press: Sanüiego.CA, 1991; p 279.
[Ulma.1996] A.Ulman Chem. Rev. 1996, 96. 1533.
[VanG. 1991] J.VanGent, P.V.Lamheck. R.J.Bakker, Th.J.A.Popma, L.J.R.Sudhölter,
D.N.Rcinhoudl&won and Actuator* A 1991,25-27. 449.
[Verw,19411 L.J.W.Verwey Rec. Trav. Chim. 1941, 60. 625.
|Vikh,1998] LVikholm, W.M.Albers Langmuir 1998,14. 3865.
[Wang,1998] R.Wang, K.Hashimoto. A.Fujishima, M.Chikuni, E.kojima. A.Kitanuira,
M.Shimohigoshk T.Watanabe.L/v. Mater. 1998, 10. 135.
[Wcll.1984] A.F.Wells Structural Inorganic Chemistry. Clarendon Press, Oxford, 1984.
[Well, 1991] A.F.Wells Structural Inorganic Chemistry. Clarendon Press, Oxford, 1991.
[Wert,1999] C.F.Wert, M.M.Santore Langmuir 1999, 15, 8884.
[Will, 19941 R.A.Williams, H.W.Blanch Biosensors & Bioelectronics 1992, 7, 405.
|Wood,1996a] J.T.Woodward, A.Ulman. D.K.Schwartz Langmuir 1996, 12, 3626.
[Wood,1996bl J.T.Woodward, D.K.Schwartz J, Am. Chem. Soc. 1996, 118. 7861.
[Xiao,1999] S.-J.Xiao Tailored Organic Thin Films on Gold and Titanium. PhD
Dissertation, K FH Zürich, Switzerland. 1999.
| Yu. 1994] H.Yu Nucleic Acids Research 1994, 22. 3226.
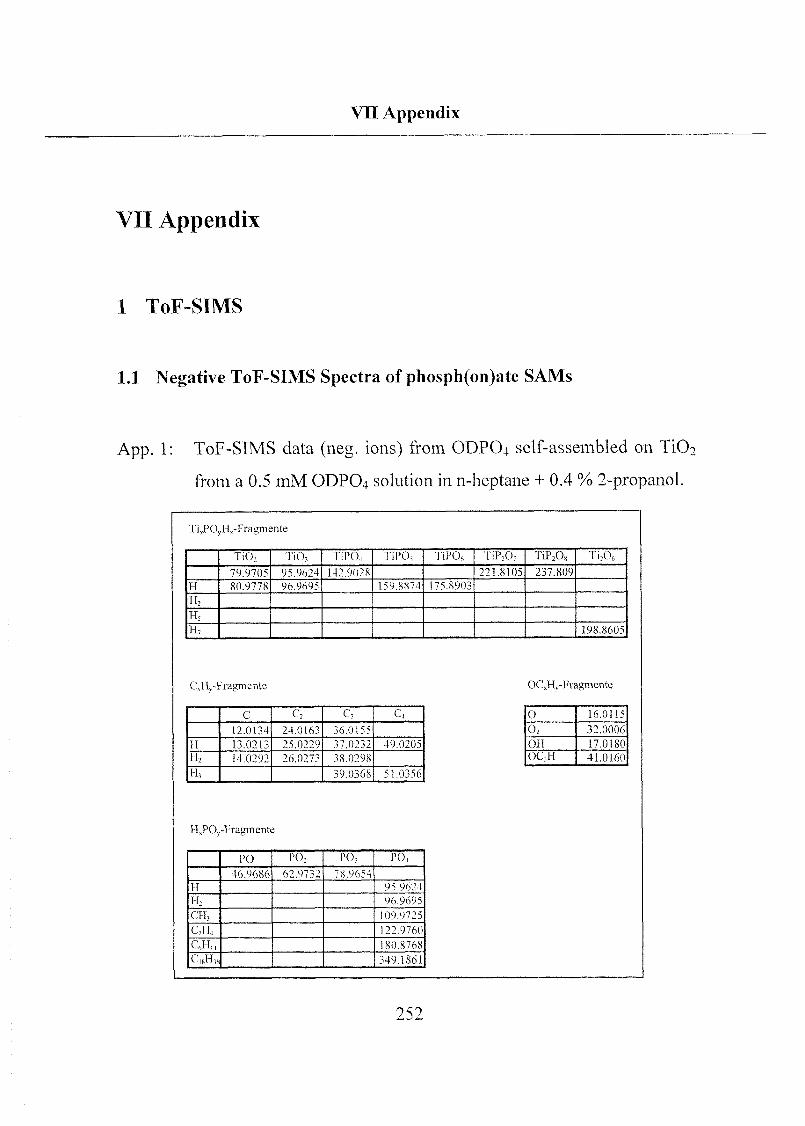
VII Appendix
VII Appendix
1 ToF-SIMS
1.1 Negative ToF-SIMS Spectra of phosph(on)ate SAMs
App. 1: ToF-SIMS data (neg. ions) from ODPO4 self-assembled on TiÖ2
from a 0.5 mM ODPO4 solution in n-heptane + 0.4 % 2-propanol.
TixPO%H,-Fragmente
TiO, no, TiPO, Il PO, TiPO«, TiP207 TiP20, Ti,0„
79.9705 95.9624 142.9028 221.8105 237.809
H 80.9778 96.9695 159.8874 175.8903
H2
H,
H7 198.8605
CJI, -Fragmente OCNH,-Fragmente
C C; C, c,
12.0134 24.0163 36.0155
H 13.0213 25.0229 37.0232 49.0205
II2 14.0292 26.0273 38.0298
H, 39.0368 51.0356
O 16.0115
0; 32.0006
011 17.0180
OC?H 41.0160
ll,POv-Fragmente
PO PO; PO, PO,
46.9686 62.9732 78.9654
11 95 9624
H, 96 9695
Cil, 109.9725
C\H, 122.9760
CJI,, 180.8768
CigHui 349.1861
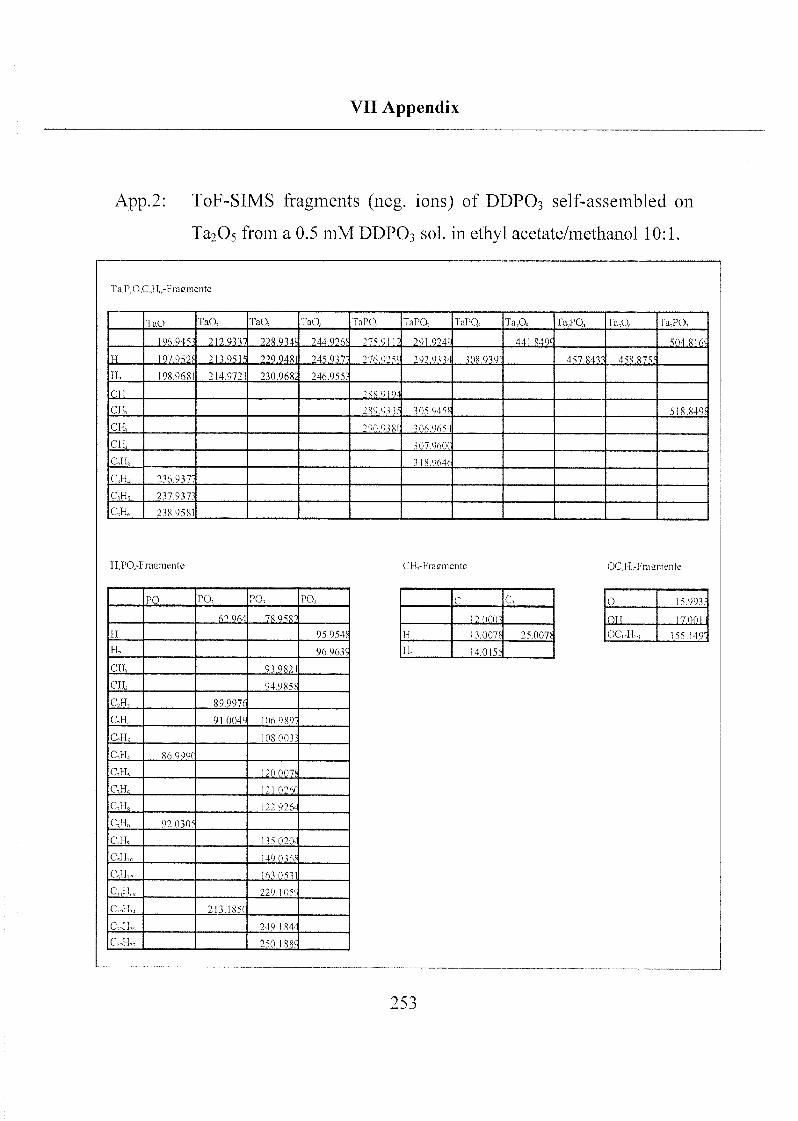
VII Appendix
App.2: ToF-SIMS fragments (neg. ions) of DDPO3 self-assembled on
Ta205 from a 0.5 mM DDPO3 sol. in ethyl acetate/methanol 10:1.
raP,0,C,H„-Fraementc
TaO TaO, TaO, TaO, FaPO, TaPQ TaPQ, Ta,0, Ta,PQ, Ta,Ofi Ta,PO,
1969453 212.9«" 228.934C 244.926,' 275.9112 291 924<3 441 849c 504.81«
H 197 952F 213.9515 229.9481 245.937-; 276.925*; 292.93 34 308.9391 457.8433 458.875.'
H, 198 9681 214.9721 230.968: 246 955?
CH 288.9 m
CH, 280 4335 3059458 518 849!
CH, 290 938(1 306 9654
CH 307 960C
CH, 3 18 964t
CH, 236 937"
CH, 237.9373
CH„ 238 9581
HLPO.-Fraemente OH,-Fraemente OCT 1,-Frasmente
PO PO, PO, PO,
62 964 78 9.582
H 95 954!
H, 96 963e;
CH, 93 9821
CH, 94 985!
CH, 89 9976
C,H, 91004 e 106 989^
CiHs 108 003;
CJL 86 999C
CT I, 120 007!
CÄ 121 026(
C-;H^ 122 926-
CH, 92 030e
CI I, 135 020-
CH,„ 149 036!
QH„ 1630531
G,H,V 229 1 05*
C,,H,j 213 185(1
GTk 249 1 84-
G 41„ 250 188*
C C
12 0003
H 13 007! 25.007!
H, 14015;
O 15 9933
OH 17 0011
OGT1,,, 155 149:
253
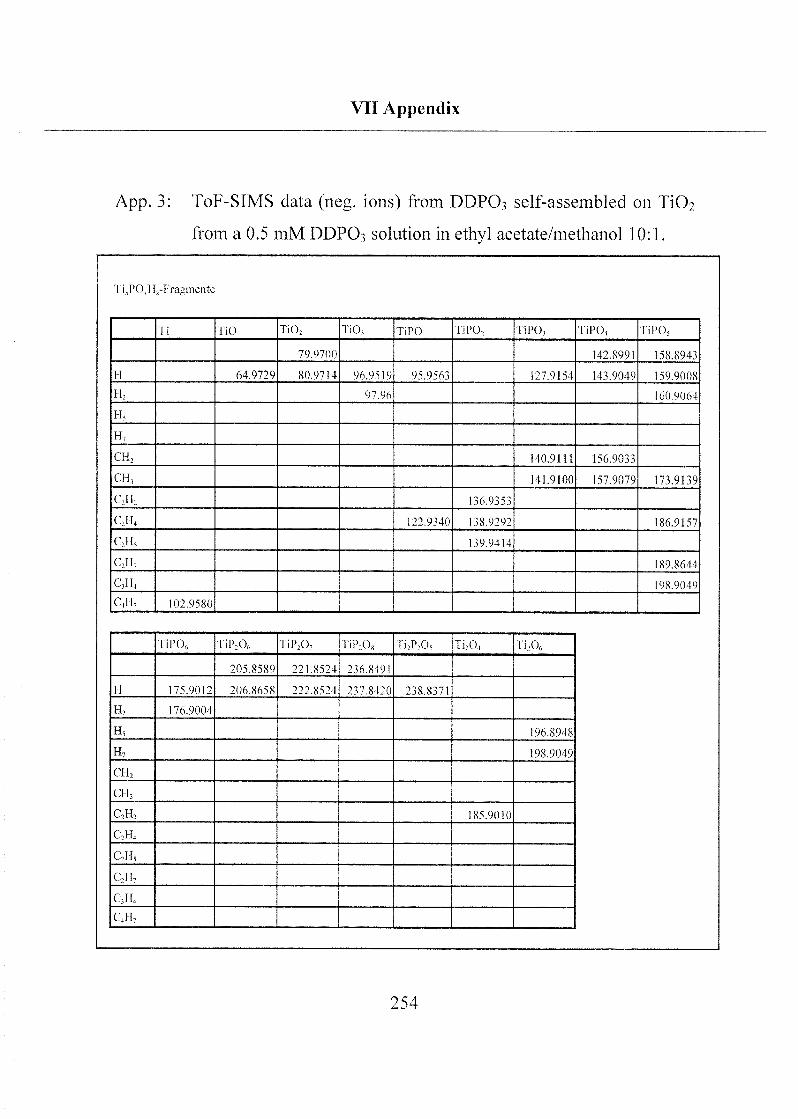
VII Appendix
App. 3: ToF-SIMS data (neg. ions) from DDPO3 self-assembled on Ti02
from a 0.5 mM DDPO3 solution in ethyl acetate/methanol 10:1.
T ixPO, 11,-Fragmentc
n TiO Ti02 TiO, TiPO TiPO, TiPOj TiP04 TiPO,
79.9700 142.8991 158.8943
11 64.9729 80.9714 96.9519 95.9563 127.9154 143.9049 159.9008
H, 97.96 160.9064
IT,
H7
CII, 140.9111 156.9033
GI3 141.9100 157.9079 173.9139
C2II2 136.9353
CJI4 122.9340 138.9292 186.9157
C2H, 139 9414
C2H7 189.8644
C,H4 198.9049
C4H7 102.9580
TiP06 TiP206 TiP20- TiP20, n2p:o, Ti204 TiA
205.8589 221.8524 236.8491
II 175.9012 206.8658 222.8524 237.8420 238.8371
H2 176.9004
H, 196.8948
H7 198.9049
CII,
CTT
QII2 185.9010
C2H4
C2TT,
QH,
CJI4
C,ll7
254
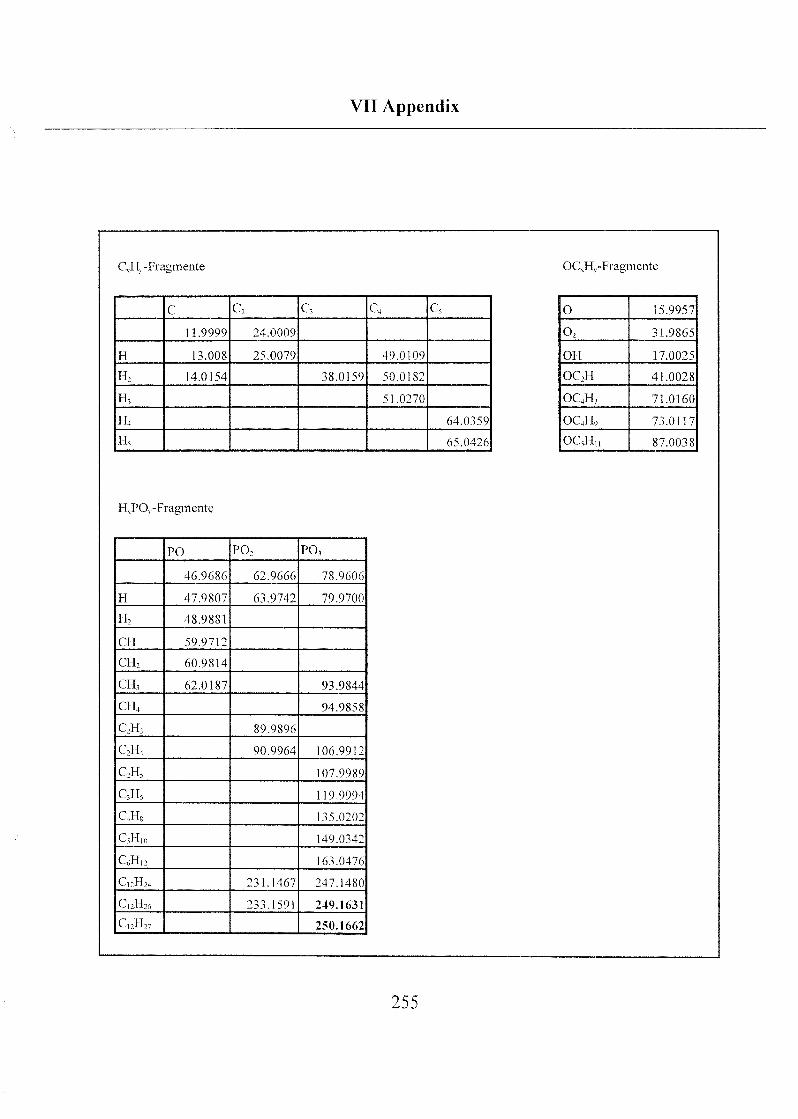
VII Appendix
QH, - Fragmente OCxH, -Fragmente
C Q c, c4 c,
11.9999 24.0009
H 13.008 25.0079 49.0109
H2 14.0154 38.0159 50.0182
H3 51.0270
H. 64.0359
II. 65.0426
O 15.9957
o2 31.9865
OH 17.0025
OC2H 41.0028
OC4H7 71.0160
OC4ri9 73.0117
OQII,, 87.0038
I1VP(X-Fragmente
PO PO, PO,
46.9686 62.9666 78.9606
H 47.9807 63.9742 79.9700
H3 48.9881
CH 59.9712
CH2 60.9814
CH, 62.0187 93.9844
CH4 94.9858
C2H3 89.9896
QII4 90.9964 106.9912
C2H, 107.9989
C,H5 119.9994
QH8 135.0202
C5H10 149.0342
C6H12 163.0476
C„HM 231.1467 247.1480
C12H26 233.1591 249.1631
O52H27 250.1662
255

VII Appendix
App. 4; ToF-SIMS data (neg. ions) from OH-DDPO4 self-asserabled on
Ta2Ü5 from a 0.5 mM OH-DDPO4 solution in ethyl acetate/ethanol
10:1.
TaJ\07C0HL-Fragmente
Ta TaO TaO, TaO, TaO, TaPO TaPO, TaP04 TaPO,
180.9454 196.9493 212.9402 228.928 244.9193 275.8834 291.8780
H 197.9573 213.9501 229.9390 245.9275 276.9003 292.8899
H2 198.9628 214.9583 230.9502 246.9457
CH 272.9132 288.8795
CH2
C2H,
C2H, 254.9414
C2H5 256.9426
C,H,
C12H22
TaPO„ TaPA TaP207 TaPA Ta:0, Ta2P04 Ta206 Ta2P07
307.8888 354.8752 370.8792 441.8700 457.8660 504.8408
H 308.9016 458.8733
H2
CH
CFI2 368.8794
C2H2 348.8761
C,H,
C2H,
C,H4 820.8773
^12^ '22 670.0019
256

VII Appendix
CXH%-Fragmente
C C; c3 c,
12.0008 24.0008
H, 13.0085 25.0088 49.0112
H2 14.0166 26.0052 38.0169 50 0091
II, 51.0264
HxPOy-Fragmente OxQ H,-Fragmente
o 15.9952
o2 31.9894
H02 32.9974
OH 17.003
C2FIO 41.0050
C2H20 42.0023
C2H30 43.0217
CH02 45.0017
CH202 45.9963
C,H30 55.0329
C2H20, 58.0083
C2H302 59.0165
C7H,oO 110.0732
CuHhO 163.1057
P PO po2 PO, P04
30.9750 46.9686 62.9641 78 9582 94.9520
H 47.9738 63.9671 79.9621 95.9566
H2 64.9697 80.9655 96.9637
CH 59.9672 75.9595
CH2 60.9748 76,9680
CH3 61.9884 77.9638
72.9998
C2[I.» 74.9887 122.9844
CJI, 123.9929
C3H, 71.0148
C3H6 137.0002
C5H 139.9726
C5H4 142.9878 158.9687
C5H, 143.9934
C,H7 146.0103
C5H14 137.0718
C6H4 138.9890
CnHis 229 0881
257
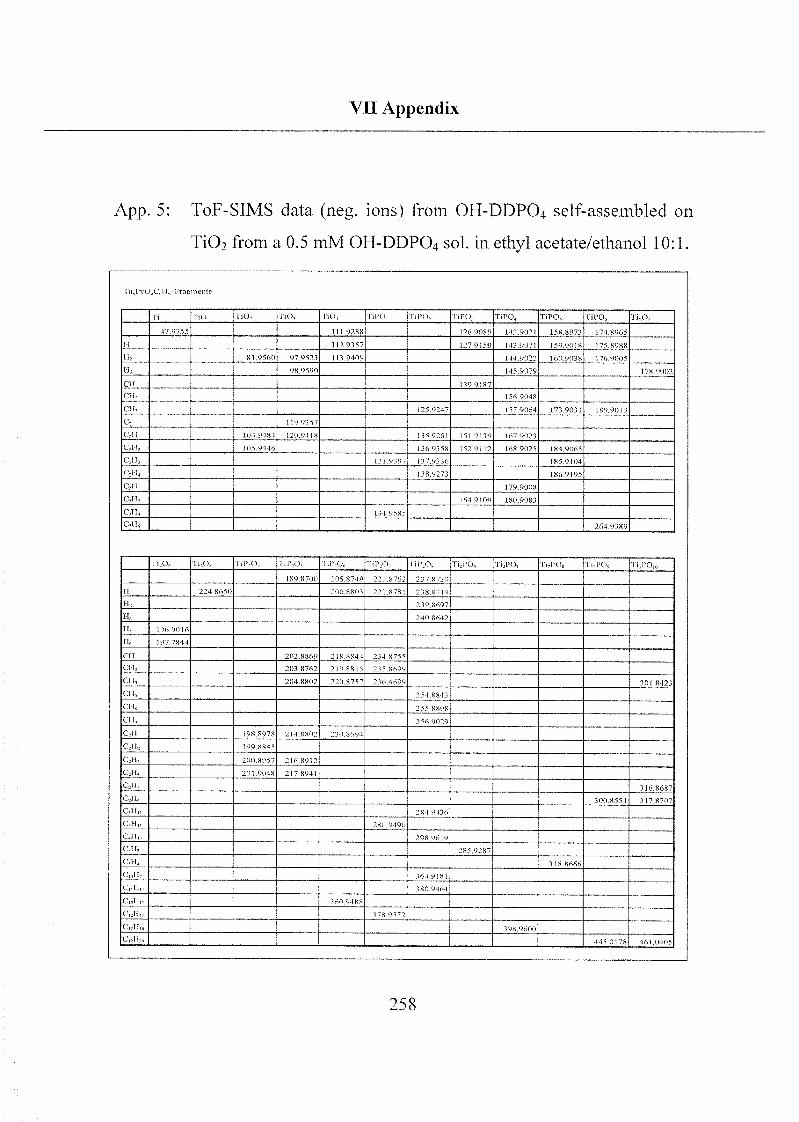
VII Appendix
App. 5: ToF-SIMS data (neg. ions) from OH-DDPO4 self-assembled on
Ti02 from a 0.5 mM OH-DDPO4 sol. in ethyl acetate/ethanol 10:1.
ld„l>vO,C U Ir.iEmcnlt
li liO hO no, MO, I iPO IlPO liPO, IiPO, 3 lPO, llPOf li O,
47 975 5 1 1 1 9288 1T» 9089 112 9021 158 8973 174 8965
II 1I29J57 127 9150 143 9071 159 9018 175 8988
11 81 9560 97 9523 1 13 9409 144 «02 "• 160 9038 176 9005
II, 98 9590 1 15 9079 178 9002
til 1399187
CI I 1 56 9048
CII, 125 9247 15-9064 173 9031 1899013
c 119 9357
CII 104 9484 12» 9418 H5 9261 1510139 167 9023
c 11 101 9t4b 136 9^8 l-i; 91 12 168 9025 1 8 1 9065
111, PI 9307 I1]Wb 185 9104
C 11, 138 92^j 1869195
CII 179 9008
CII 1 6 f 9109 180 9083
CMI4 131 95S-,
C,H, 264 9389
li Of ll O, 111' O, IlPO III» O, IlP O I iP O, 1 1 PÜ 11 PO, ll PO, 11 PO, ll PO,„
189 8700 205 8749 '21 S "'62 2i7r,ii
11 "1 8610 206 880j 22' 8"M '38 8-14
II HO 8697
II, 240 86 12
II, 196 9016
11, 197 7844
CII 202 8869 218 8841 2,4 875^
CII. 203 8762 210 8815 23 5 8600
CII, 204 8802 220 875T 2 56 11,00 301 8421
CII, 25 t 884',
en« 255 8808
(11, 2 56 9029
en 198 89-8 214 8802 230 869 1
C II, 199 8845
CII, 200 8957 216 8012
CII, 201 9048 217 8911
C2II< 316 8687
CJI, 300 8551 ,17 8707
CI1„ 2 84 9436
CII„ 280 9490
CII,, 208 0619
CII, 28.5 9287
Cll, ,18 8666
C, II 364 9181
CII,, 3 80 0464
C, II,, ,60 048 8
C, 11, ,~s 9572
C, II, 308 9600
c 11115 0178 461 0105
258
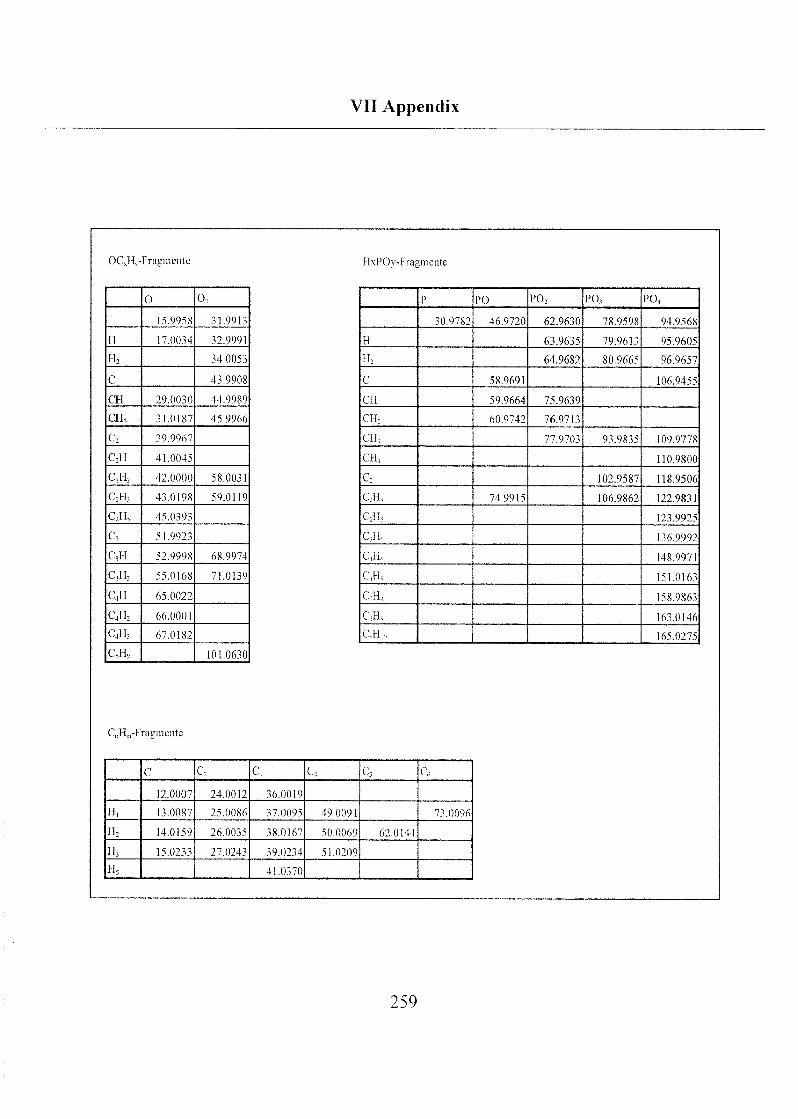
VII Appendix
OCJI,-Fragmente 1 1\P0\ -Fragmente
P PO PO, PO, PO„
30.97X2 46.9720 62.9630 78.9598 94.9568
H 63.9635 79.9613 95.9605
H: 64.9682 80.9665 96.9657
C 58.9691 106.9455
CH 59.9664 75.9639
CLL 60.9742 76.9713
CH, 77.9703 93.9835 109.9778
Cil, 110.9800
C; 102.9587 118.9506
C2FL 74.9915 106.9862 122.9831
C;IL 123.9925
CH, 136.9992
C,H, 148.9971
CIL 151.0163
CIL 158.9863
CR 163.0146
CIL 165.0275
O o2
15.9958 31.9913
11 17.0034 32.9991
IL 34.0053
C 43.9908
CH 29.0030 44.9989
CH, 31.0187 45.9966
C 39.9967
Cl! 41.0045
CIL 42.0000 58.0031
C2FT, 43.0198 59.0119
CIL 45.0393
C, 51.9923
CH 52.9998 68.9974
Cil, 55.0168 71.0139
C,H 65.0022
CIL 66.0001
C„H, 67.0182
CH, 101.0630
CnIIm-Fragmente
C C C, C C C
12.0007 24.0012 36.0019
H, 13.0087 25.0086 37.0095 49.0091 73.0096
IL 14.0159 26.0035 38.0167 50.0069 62.0144
H, 15.0233 27.0243 39.0234 51.0209
IL 41.0370
259

VII Appendix
App. 6: ToF-SIMS data (neg. ions) from NEt-DDPCb self-assembled on
Ta205 from a 0.5 mM NEt-DDP03 sol. in ethyl acetate/water 1:1.
FaPOCH-Fragmente
TaO TaO, TaO, TaO, 1 aPO IdPO, TaP05 TaPOs Ta,0« Ta;0,
] 96 9175 212 9289 228 9281 244 9215 275 898S 291 9023 307 8916 441 S487 457 8647
II 197 9544 213 9538 229 9422 245 9344 276 9096 292 9060 308 8980 458 8865
II, 198 960] 214 9684 230 9598 246 9494 309 9064
CH 272 9281 288 8961
on. 2899018
CH, 290 9011 306 9184
c. 236 931 5
CJI 237 9318
CH, 238 9391 254 9574 270 9500
C,ll, 239 9526 255 9617 271 9427 118 9487
CJI, 256 9716
C,H, 348 8916
C„Hm-rragmente C„N„-I ragmcntc
c C3 C, C,
12 0003 23 9996
iL 13 0077 25 0085 37 0077 49 0079
H2 140164 380151 50 0089
N NO NO,
45 9950
H 15 0103
C 26 0051 42 0013
CJIf 80 0538 96 0337
OCJF,-Fragmente
HxPOy-I'iagmente
o 15 9932
OH 17 0011
o2 31 9862
0,11 32 9838
CO 39 9963
C,OH 41 0054
C;OH, 43 0217
cry i 45 0004
C;0;H; 58 0101
C:0;H, 59 0195
C,0,H, 71 0192
PO PO, PO, PO, PO, PO
46 9637 62 9665 78 963
11 47 9637 63 9646 79 9622 95 9M6
H, SO 9689 96 9644
en 59 9679 75 9631
au 60 9773 76 9723
CH, 61 9914 919852
C,H, 136 9584 152 9481
CJI, 107 0042 122 995
CJI.c, 121 0398
260
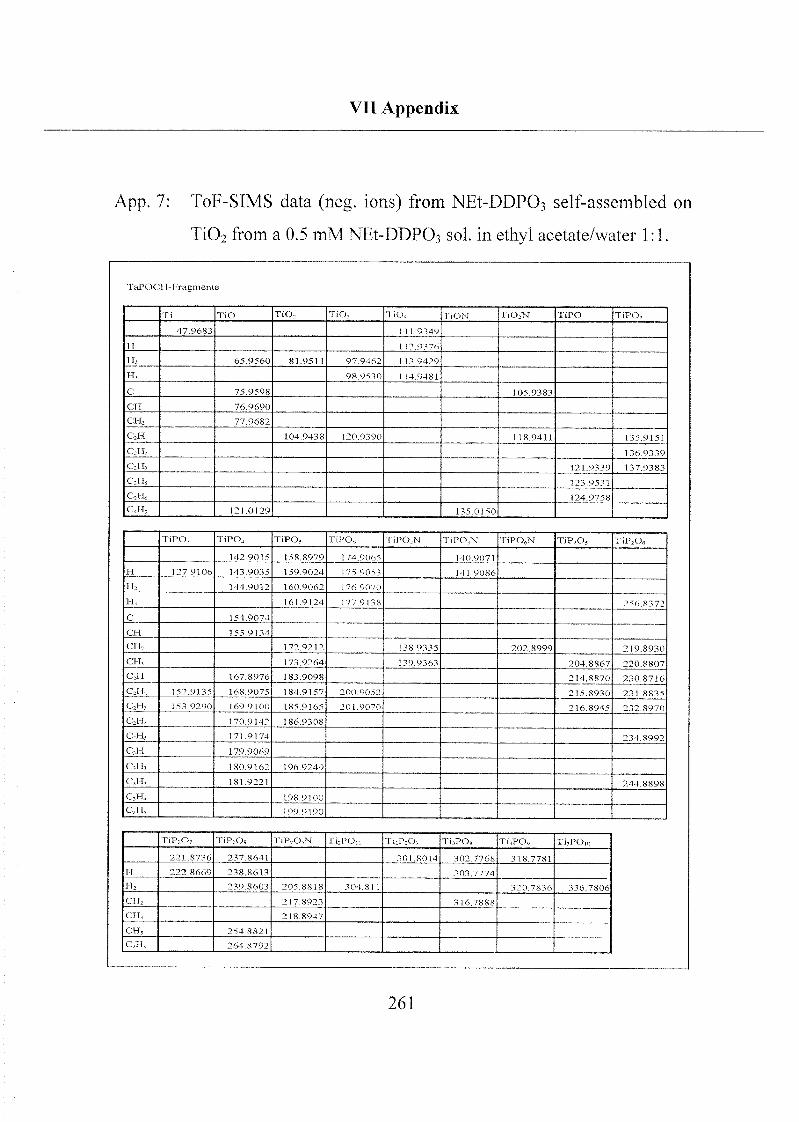
VII Appendix
App. 7: ToF-SIMS data (neg. ions) from NEt-DDPO, self-assembled on
Ti02 from a 0.5 mM NEt-DDPO-, sol. in ethyl acetate/water 1:1.
TaPOCH-rtagmente
11 IiO TiO, IiO, IiO, IiON 1lO,N liPO 1 iPO
47 9683 1 1 1 9349
H 112 93-6
H 65 9560 81 951 1 97 9 »62 113 9 »29
H, 98 9510 114 9481
C 75 9598 105 9383
err 76 9690
Cil 77 9682
c n 104 9438 120 9390 118 9411 135 915]
en 136 9339
C 11, 121 9339 137 9383
CH, 123 9531
CII 124 9758
CH 121 0129 135 0150
TiPO, 1 iPO., TiPO, liPO TiPO V 1 iPO,N 1 iP06N TiPjOj liP C\
1 12 9015 158 8979 174 906-, 140 9071
H 1279106 143 9035 1 59 9024 175 9053 141 9086
H 144 9012 160 9062 1 76 9070
Hi 161 9124 177 9138 256 8372
C 1 5 1 9071
Cll 155 9134
Cll, 172 9212 1 18 9335 202 8999 219 8930
CH, 173 9264 139 9363 204 8867 220 8807
Cll 167 8976 1 83 9098 214 8870 230 8716
C 11 152 9135 168 9075 1849157 200 90 -. 2 215 8930 231 8835
C 11, 1 53 9290 169 9100 (85 9165 201 9070 216 8945 232 8970
C 11, 1 70 9 1 42 186 9308
C H, 171 9171 2 34 8992
C,H 179 9069
Cll, 1809162 196 9249
c,ir, 181 9221 2 14 8898
Cll, 19891 00
CH, 199c> 190
liP o7 "liP Oi 1 iP 0,N Tl PO,i ll P O 1 l,PO, Ti.PO, Tl,PO,o
221 8736 237 8641 301 801 t 302 7768 318 7781
H 222 8669 238 8613 303 777 1
II, 239 8603 205 8818 104 81 1 320 7836 316 7806
CH2 217 8923 316 7888
Cll, 218 8947
CH5 254 8821
Cll, 264 8792
261
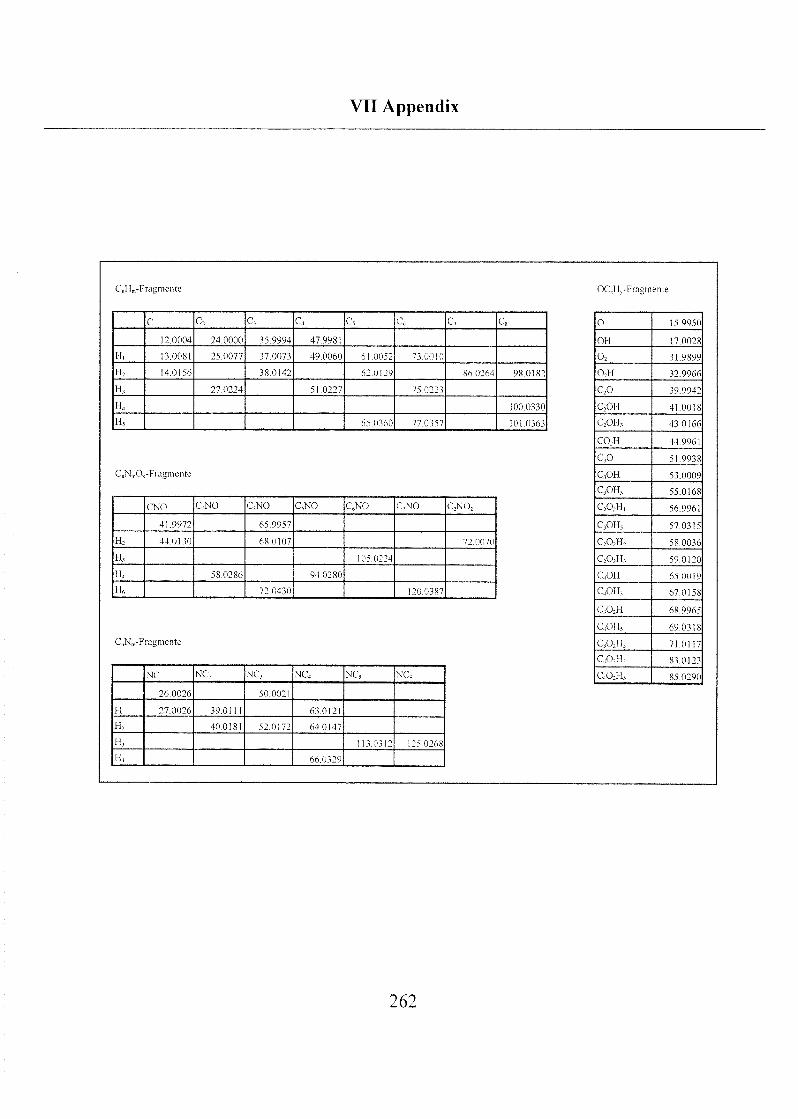
VII Appendix
CnHnrrragmcntc OCJi-Fragmente
C c. C c C L C C O 15 9950
12 0004 24 0000 35 9994 47 9981 OH 17 0028
H, 13 0081 25 0077 37 0073 49 0060 61 0052 710010 02 319899
TI2 140156 38 0142 62 0129 S6 0264 98 0182 0;H 32 9966
H, 27 0224 51 0227 75 0223 CO 39 9942
H, 100 0330 COH 41 0018
H, 65 0160 77 0357 1010363 COH, 43 0166
CO,H 44 9961
C„N,„(\-riagmente
CO 5 t 9938
COH 53 0009
C3OII, 55 0168
CNO CNO CNO CNO CNO CNO CNO; CjO;H, 56 9961
41 9972 65 9957 COH, 57 0315
H, 44 OHO 68 0107 72 0070 C202H; 58 0036
II, 105(1224 C02H, 59 0120
11. 58 0286 94 0280 COH 65 0019
M„ 72 0430 120 0387 COH, 67 0158
C,02H 68 9965
C„Nm-Fragmente
COH, 69 0318
CO;H, 71 0117
COJH, 83 0123
NC NC; NC, NC NC NC C02H, 85 0290
26 0026 50 0021
11 27 0026 39 0111 630121
H, 400181 52 0172 64 0147
II, 113 0312 125 0268
H, 66 0129
262
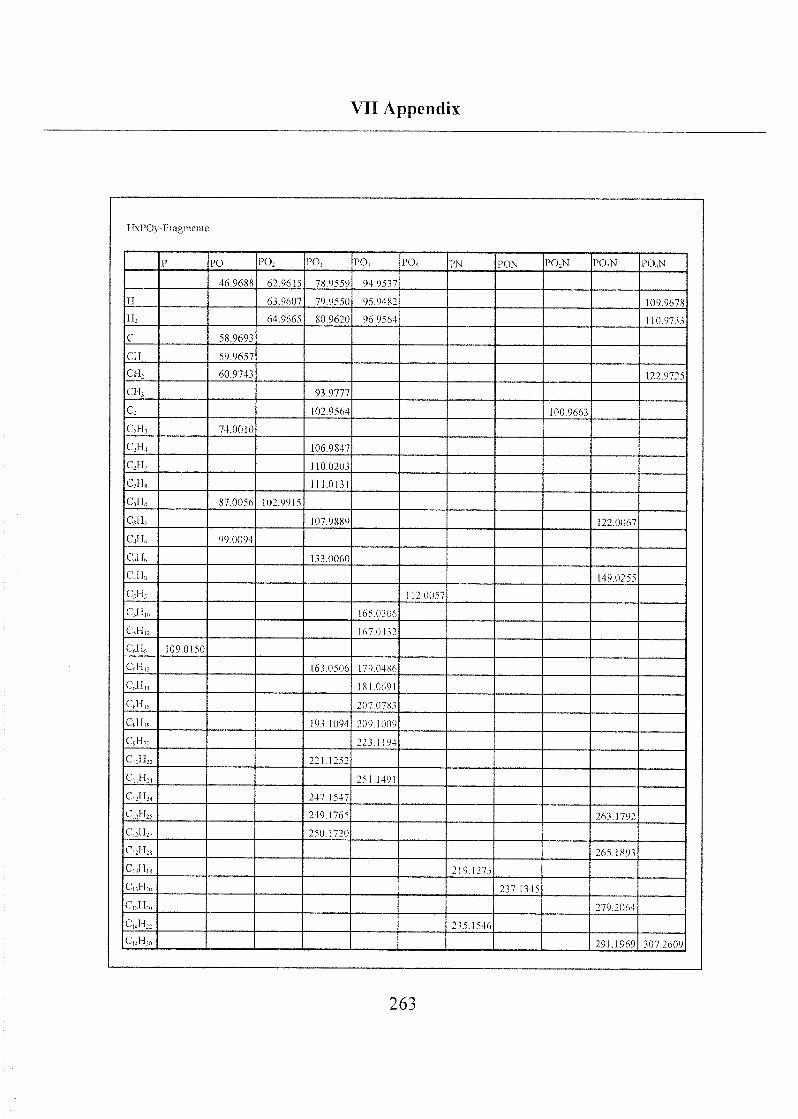
VII Appendix
IKPOy-Fragmente
P PO PO, PO- PO, PO, PN PON P02N PO,N PO^N
46 9688 62 9615 78 9559 94 9537
Tl 639607 79 9550 95 9482 109 9678
H2 64 9665 80 9620 96 9564 110 9733
C 58.9693
CH 59 9657
cn2 60 9743 122 9725
CIL 93 9777
C; 102 9564 100 9663
QU, 74 0010
C,ll, 106 9847
C2II7 110 0203
c2ns 1110131
C-,11, 87 0056 1029915
CIL 107 9889 122 0067
C.H, 99 0094
c,n„ 133 0060
c,u8 149 0255
C311, 112 0057
C,H,„ 165 0306
C,H,2 167 0432
QH« 109 0150
QU,, 163 0506 179 04S6
C6H„ 1810691
c,ti,6 207 078i
C8His 193 1094 209 1009
GH2„ 223 1194
C„,H22 221 1252
c„n2, 251 1491
C,2H;j 247 1547
c,2n26 249 1765 263 1792
CI2H27 250 1720
c12n28 265 1893
CnH|, 219 127?
C„H2„ 237 1345
CnH„, 279 2064
C„H22 235 1546
Cjiliio 291 1969 307 2609
263
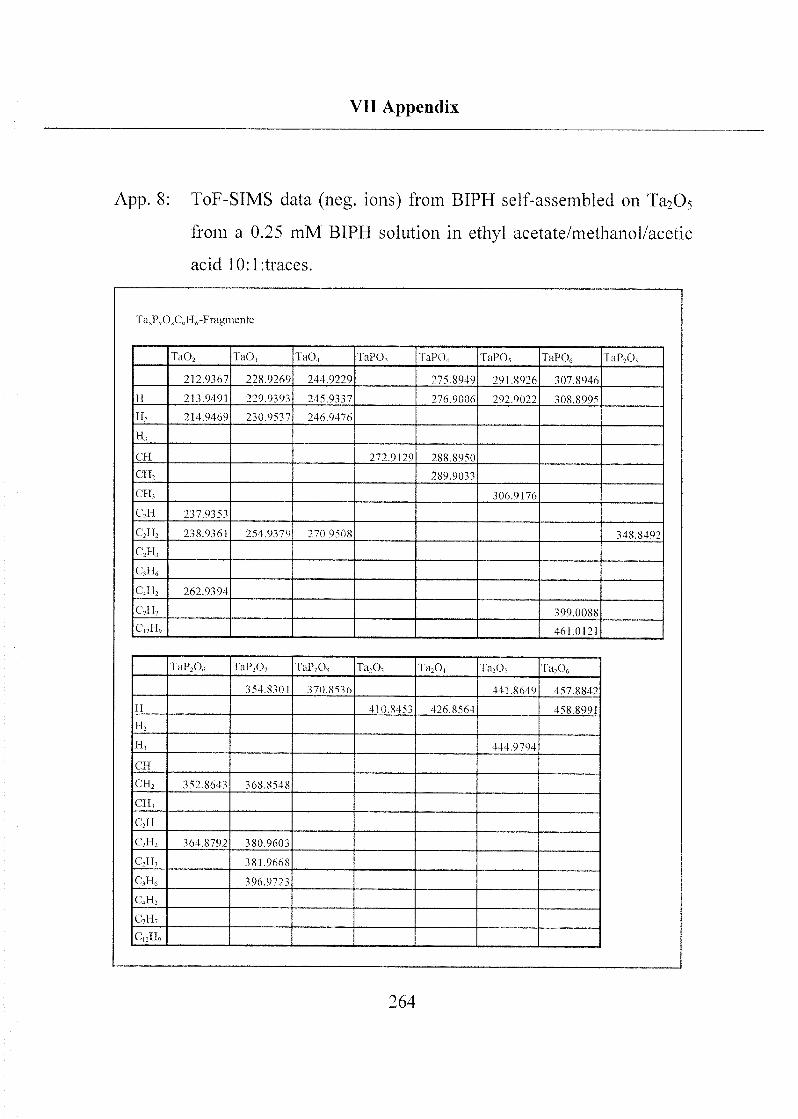
VII Appendix
App. 8: ToF-SIMS data (neg. ions) from BÏPH self-assembled on Ta2Os
from a 0.25 raM BIPH solution in ethyl acetate/methanol/acetic
acid 10:l:traces.
TaJ\0,CoH„-Fragmente
TaO, TaO, TaO, TaPO, TaPO, TaPO, TaP06 TaP,0,
2)2.9367 228.9269 244.9229 275.8949 291.8926 307.8946
H 213.9491 229.9393 245.9337 276.9006 292.9022 308.8995
H; 214.9469 230.9537 246.9476
H,
Cil 272.9129 288.8950
CH, 289.9033
eu, 306.9176
cyu 237.9353
C2H2 238.9361 254.9379 270.9508 348.8492
C2H,
C,IIf,
C4H2 262.9394
C,H7 399.0088
C,2H9 461.0121
TaP20„ TaP,0- TaP208 Ta20, Ta20, Fa20, Ta206
354.8301 370.8536 441.8649 457.8842
II 410.8453 426.8564 458.8991
H2
H, 444.9794
Cil
CHj, 352.8643 368.8548
CH,
cjr
C2H2 364.8792 380.9603
C2H, 381.9668
C,H0 396.9723
C4H2
C,H,
C,2H,
264
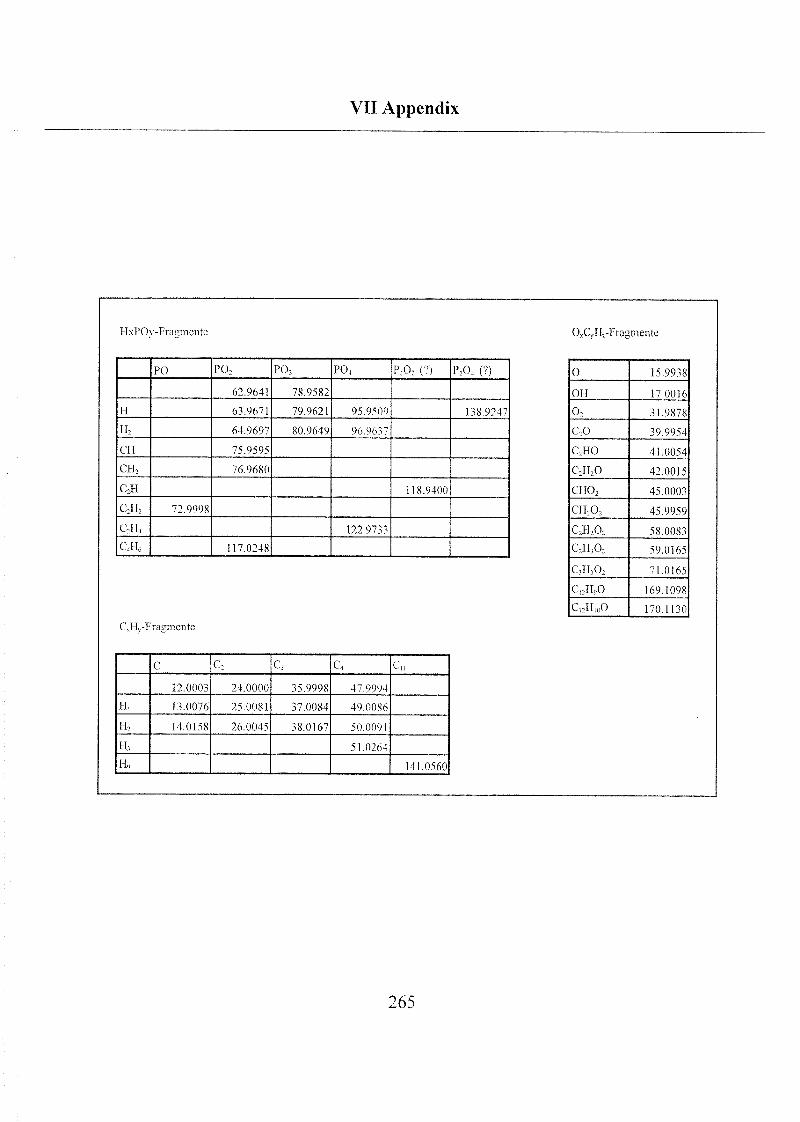
VIT Appendix
HxPOy-Fragmente OxCvH,-Fragmente
PO PO, PO, PO, P:Os (?) P20( (?)
62.9641 78.9582
II 63.9671 79.9621 95.9509 138.9247
H2 64.9697 80.9649 96 9637
CH 75.9595
CH2 76.9680
C2H 118.9400
C'2Hj 72.9998
C2H4 122.9733
C,H() 117.0248
O 15.9938
OH 17.0016
02 31.9878
C20 39.9954
C2HO 41.0054
C2II20 42.0015
CH02 45.0003
CH20, 45.9959
C2Pi202 58.0083
C2H,02 59.0165
0,11,0, 71.0165
C]2IT90 169.1098
C12H,oO 170.1130
CxHv-Fragmento
C c2 C, c, c,,
12.0003 24.0000 35.9998 47.9994
FI, 13.0076 25.0081 37.0084 49 0086
FI2 14.0158 26.0045 38.0167 50.0091
H, 51.0264
H, 141.0560
265
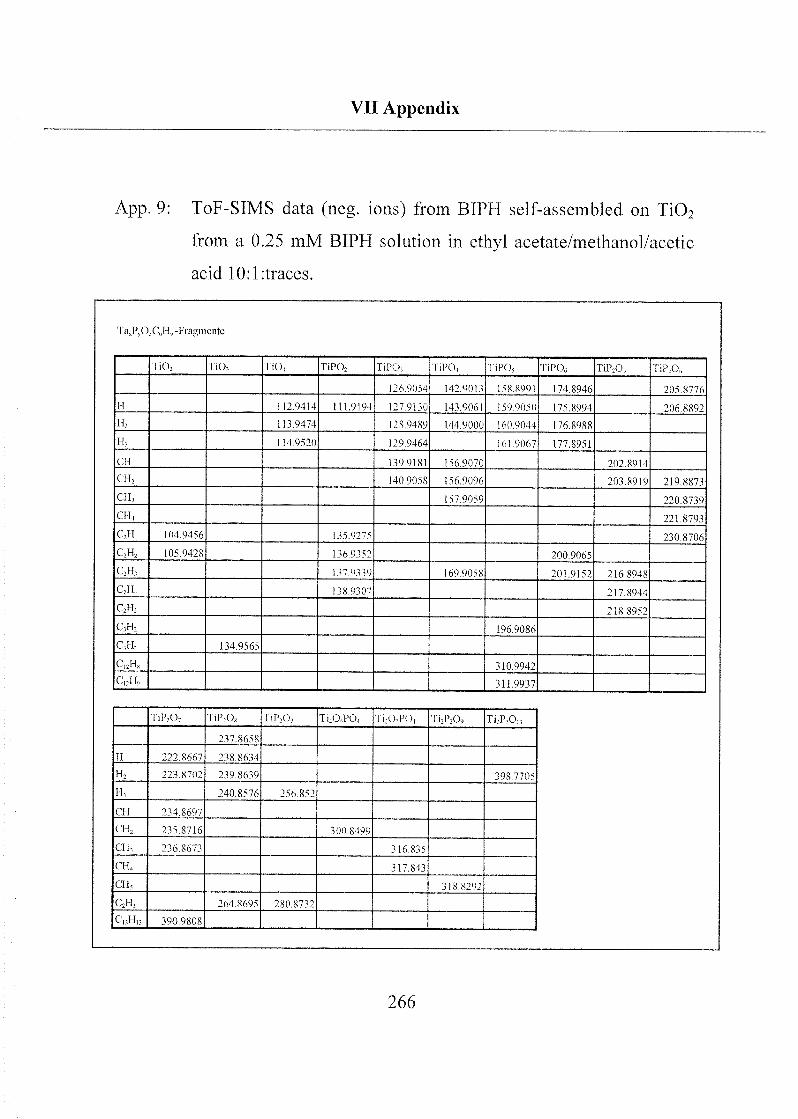
VII Appendix
App. 9: ToF-SIMS data (neg. ions) from BIPH self-assembled on TiC>2
from a 0.25 mM biph solution in ethyl acetate/methanol/acetic
acid 10:l:traces.
'laJ'ÄCHu-Fragmente
Ti02 IiO, TiQ, TiP02 TiPO I iPO, TiPCX I'lPOo TiP20, 1 iP20„
126 9054 142 9013 158 8991 174 8946 205 8776
II 112 9414 1119194 127 9130 143 9061 159 9050 175 8994 206 8892
Hi 1139474 128 9489 144 9000 160 9044 176 8988
H, 114 9520 129 9464 161 9067 177 8951
eu 139 9181 I56 9070 202 8914
Cil, 140 9058 156 9096 203 8919 219 8873
Cil, 157 9059 220 8739
en, 221 8793
cyi 104 9456 135 9275 230 8706
02H2 105 9428 136 9^2 200 9065
C2lh 137 93 39 169 9058 201 9152 216 8948
C2Il, 1389307 217 8944
C2I13 218 8952
C,H2 196 9086
Cil, 134 9565
C,2H8 310 9942
^ ! 2'
' " 3119937
TiP,0 1 iP2Os IiP.O, TiAPO, Ti.O PO, Ti2P20, Ti2P 0„
237 8658
H 222 8667 238 8634
H2 223 8702 239 8639 398 7705
H, 240 8576 256 852
CH 234 8697
CH; 235 8716 300 8499
CH, 236 8673 316 835
CI14 317 843
Cil, 318 8292
c2n, 264 8695 280 8732
CnH„ 390 9808
266
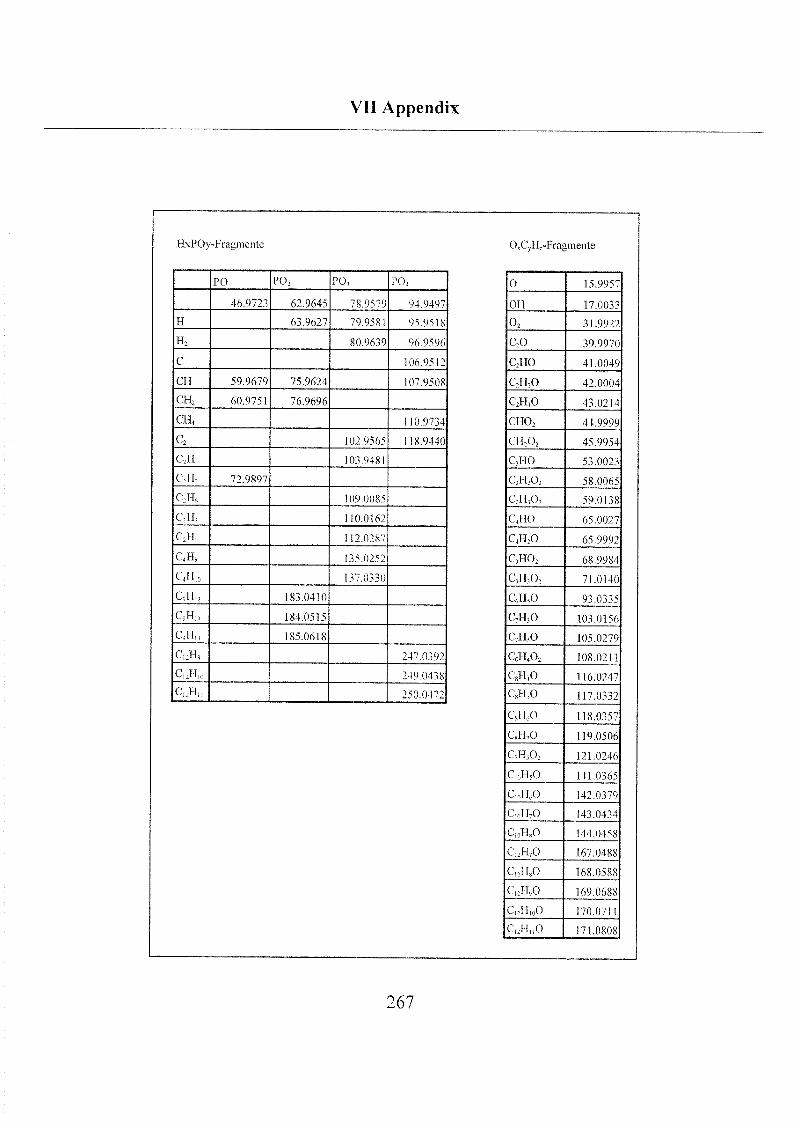
VII Appendix
HxPOy-Fragmentc 0NC, H7-Fragmente
0 15.9957
on 17.0033
o2 31.9922
c2o 39.9970
C2HO 41.0049
C2FI20 42.0004
C2H,0 43.0214
CH02 44.9999
CHA 45.9954
CIIO 53.0023
C,II202 58.0065
C2II,0, 59.0138
C.1IO 65.0027
C,H;0 65.9992
C,H02 68.9984
C,H,0, 71.0140
C6H50 93.0335
C7H,0 103.0156
C7H,0 105.0279
QJI,02 108.0211
C8H,0 116.0247
C,H,0 117.0332
C,H60 118.0357
C,1I,0 119.0506
C-IIA 121.0246
Clf,RO 141.0365
C„,H,0 142.0379
C„,H,0 143.0434
C„H80 144.0458
C,:H,0 167.0488
C:H„0 168.0588
CJW 169.0688
CpHK0 170.0711
C1:H„0 171.0808
PO PO: PO, PO,
46.9723 62.9645 78.9579 94.9497
H 63.9627 79.9581 95.9518
H2 80.9639 96.9596
C 106.9512
CH 59.9679 75.9624 107.9508
CH, 60.9751 76.9696
Cil, 110.9734
c2 102.9565 118.9440
C2II 103.9481
C2H2 72.9897
C;H6 109.0085
C2H7 110.0162
C2II» 112.0287
C,IIS 135.0252
CiHio 137.0330
C,H,2 183.0410
C,H„ 184.0515
C,TT„ 185.0618
C,;H, 247.0392
^~ 121 i ï 0 249.0438
C,2H„ 250.0472
267
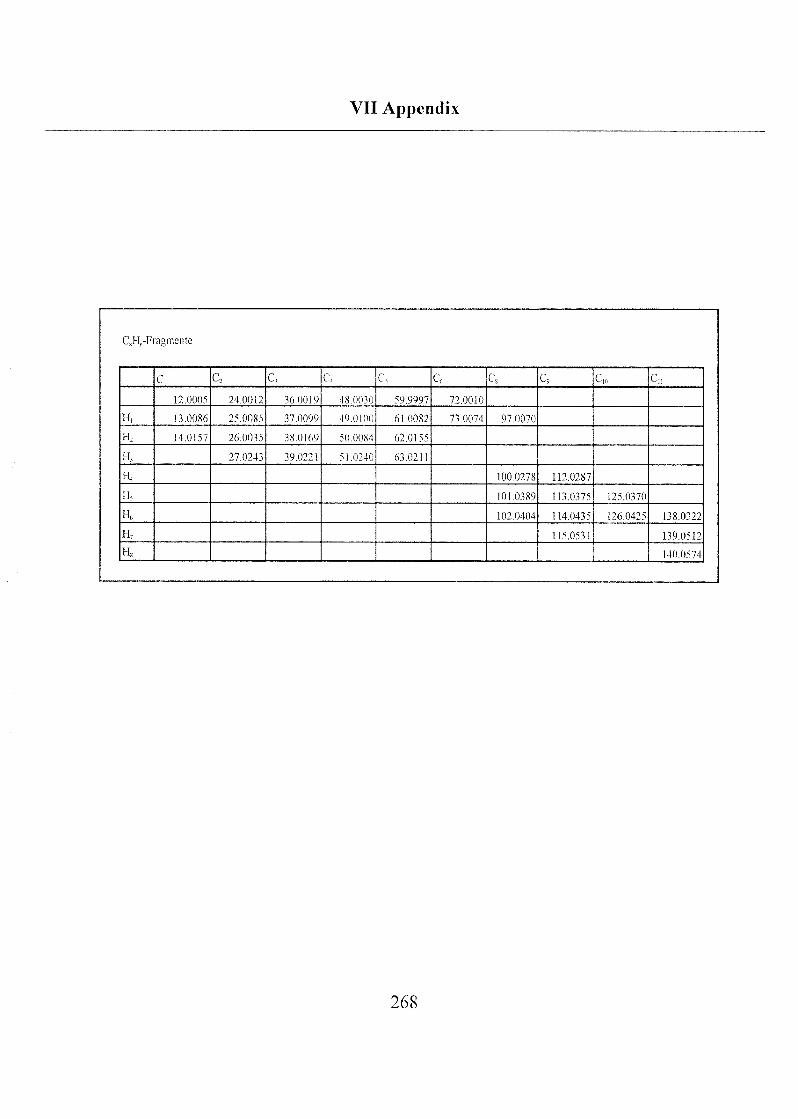
VII Appendix
CJlv-riagraente
C C, C, c4 C Q cfc C, *~io c„
12 0005 24 0012 36 0019 48 0030 se) 9997 72 0010
H, 13 0086 25 0085 37 0099 49 0100 61 0082 73 0074 97 0070
11 140157 26 0035 38 0169 •>0 0084 62 0155
H, 27 0243 39 0221 M 0240 63 0211
H, 100 0278 112 0287
H, 1010389 113 0375 125 0370
H, 102 0404 114 043<i 126 0425 138 0322
H7 1150531 139 0512
H, 140 0574
268
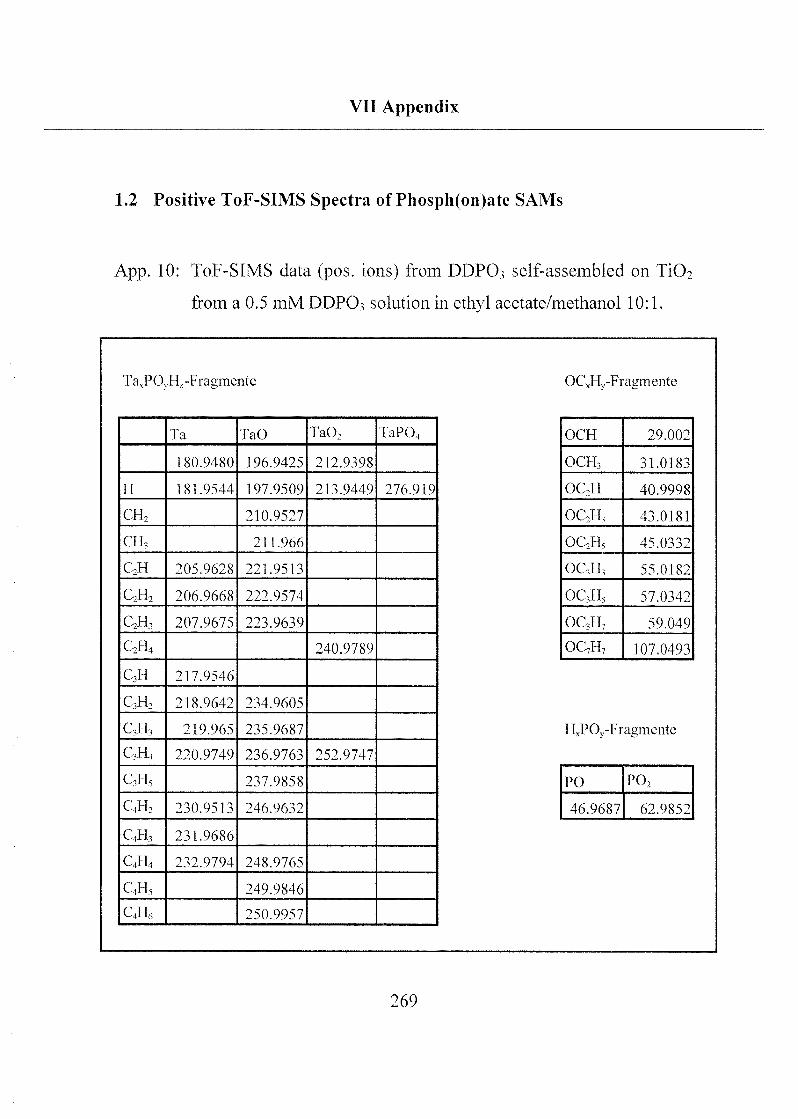
VII Appendix
1.2 Positive ToF-SIMS Spectra of Phosph(on)ate SAMs
App. 10: ToF-SIMS data (pos. ions) from DDPO3 self-assembled on ÜO2
from a 0.5 mM DDPO3 solution in ethyl acetate/methanol 10:1.
TaxPON H7-Fragmente OCJHy-Fragmente
OCH 29.002
OCH3 31.0183
OC2H 40.9998
OC2H3 43.0181
OC2H5 45.0332
OC3H3 55.0182
OCsHj 57.0342
OC3H7 59.049
OC7H7 107.0493
Ta TaO Ta02 TaP04
180.9480 196.9425 212.9398
H 181.9544 197.9509 213.9449 276.919
CH2 210.9527
CH, 211.966
C,H 205.9628 221.9513
C,H2 206.9668 222.9574
C2H3 207.9675 223.9639
C2H4 240.9789
C3II 217.9546
C3H2 218.9642 234.9605
C3IT3 219.965 235.9687
C3H4 220.9749 236.9763 252.9747
C3H5 237.9858
C4H2 230.9513 246.9632
C4H3 231.9686
C4H4 232.9794 248.9765
C4H, 249.9846
C4H6 250.9957
PC) PO,
46.9687 62.9852
269
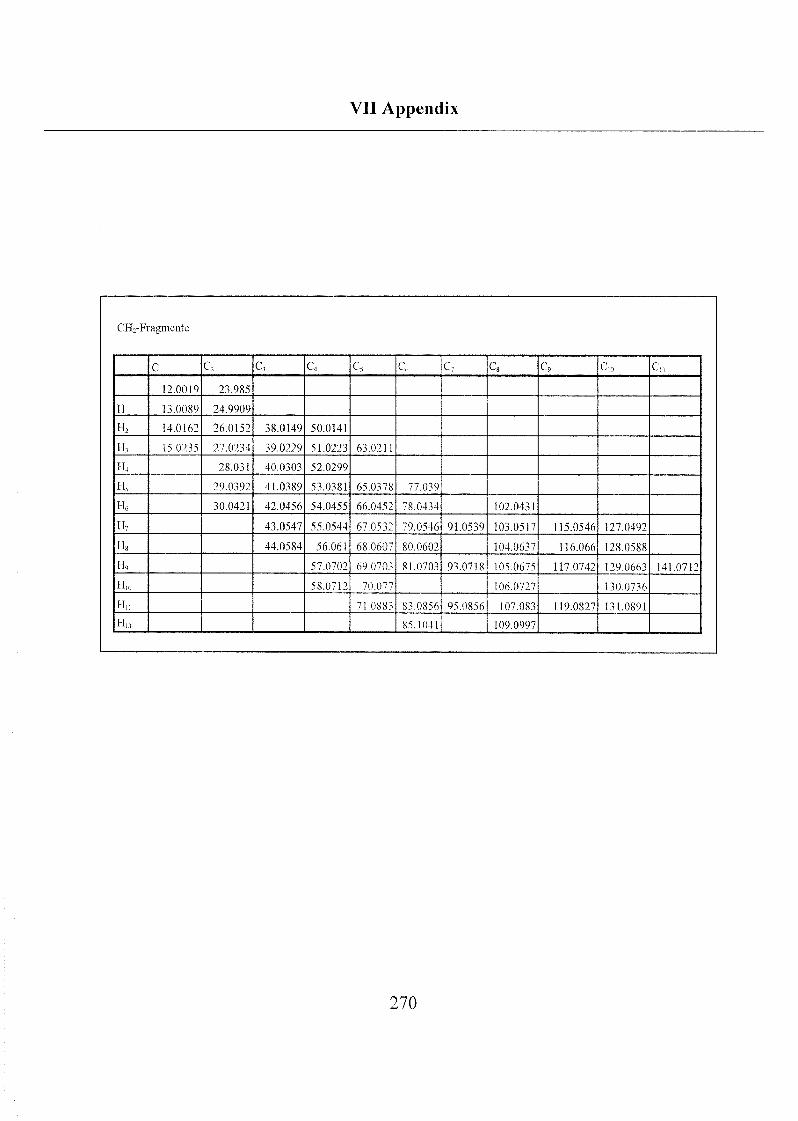
Vil Appendix
CH2-Fragmente
c c2 C, C, C, C, C- C, c9 C,o c„
12.0019 23.985
H 13.0089 24.9909
It 14.0162 26.0152 38.0149 50.0141
H, 15.0235 27.0234 39.0229 51.0223 63.0211
H4 28.031 40.0303 52.0299
Ils 29.0392 41.0389 53.0381 65.0378 77.039
Ü6 30.0421 42.0456 54.0455 66.0452 78.0434 102.0431
Tl7 43.0547 55.0544 67.0532 79.0546 91.0539 103.0517 115.0546 127.0492
H, 44.0584 56.061 68.0607 80.0602 104.0637 116.066 128.0588
H„ 57.0702 69 0703 81.0703 93.0718 105.0675 117.0742 129.0663 141.0712
H« 58.0712 70 077 106.0727 130.0736
II„ 71 0883 83.0856 95.0856 107.083 119.0827 131.0891
Un 85.1041 109.0997
270
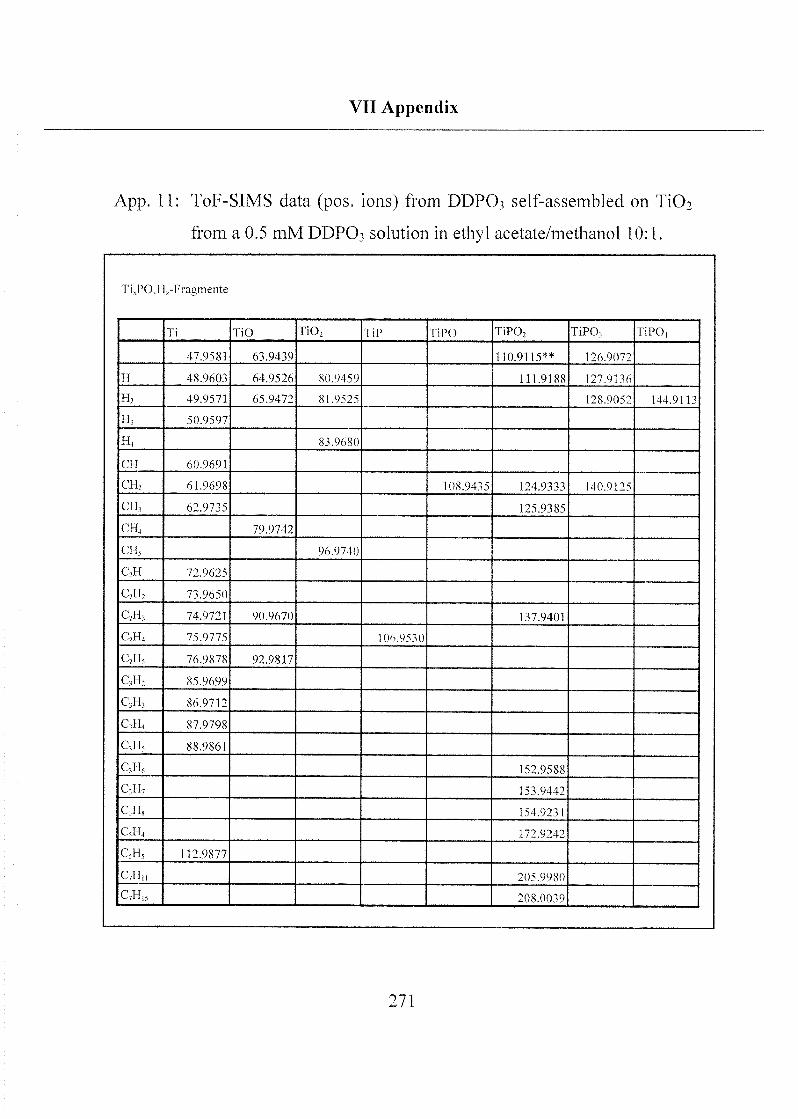
VII Appendix
App. 11: ToF-SIMS data (pos. ions) from DDP03 self-assembled on Ti02
from a 0.5 mM DDPO3 solution in ethyl acetate/methanol 10:1.
TivPO,H,-Fragmentc
Ti TiO Ti02 TiP TiPO TiP02 TiP03 TiP04
47.9581 63.9439 110.9115** 126.9072
H 48.9603 64.9526 80.9459 111.9188 127.9136
H2 49.9571 65.9472 81.9525 128.9052 144.9113
H3 50.9597
H4 83.9680
CH 60.9691
CH2 61.9698 108.9435 124.9333 140.9125
CH, 62.9735 125.9385
CH, 79.9742
CH, 96.9740
C2H 72.9625
QH2 73.9650
QU, 74.9721 90.9670 137.9401
C2H4 75.9775 106.9530
C2U, 76.9878 92.9817
C3U2 85.9699
C3H3 86.9712
C3H, 87.9798
C,I1, 88.9861
caif, 152.9588
C3H7 153.9442
C3H, 154.9231
c,T14 172.9242
C,H, 112.9877
C7H„ 205.9980
C7H„ 208.0039
271
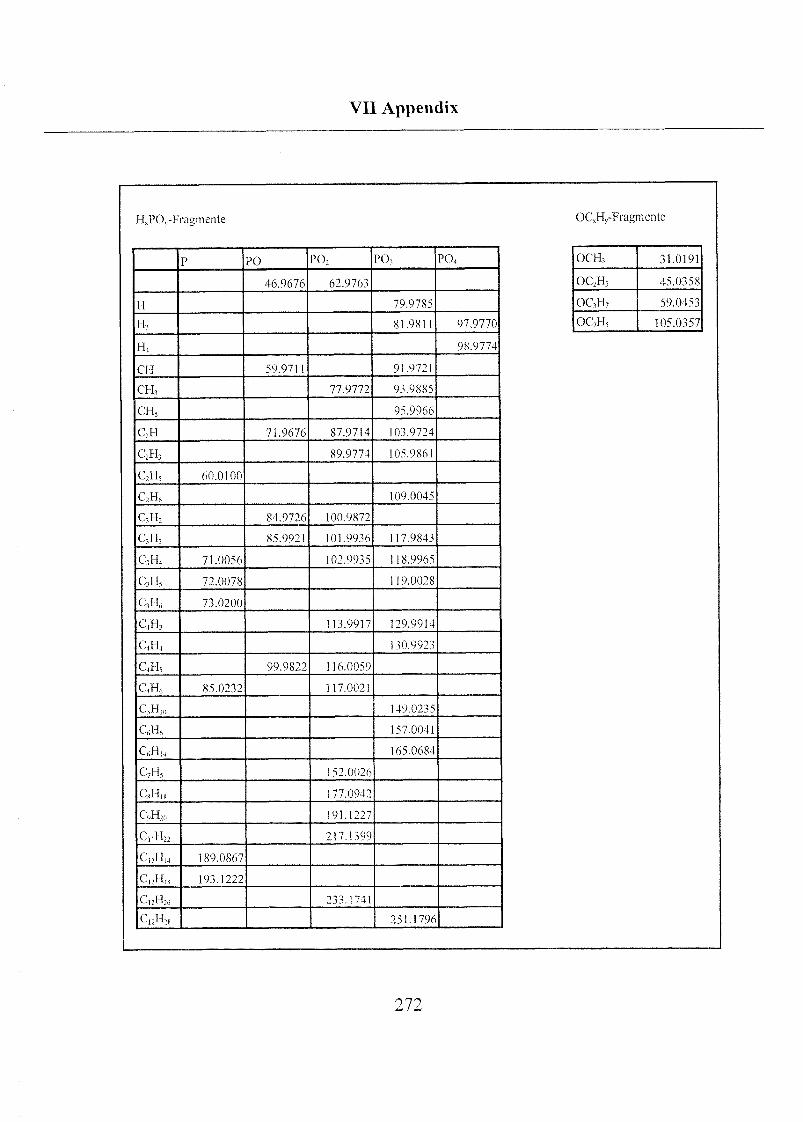
Vil Appendix
HJ"(X - Fragm ctite OCxH, - Fragmen te
OCH, 31.0191
OC2H5 45.0358
OC,H7 59.0453
OC7H, 105.0357
p PO PO, PO, P04
46.9676 62.9763
H 79.9785
H-, 81.9811 97.9770
H, 98.9774
Cil 59.9711 91.9721
Cl-h 77.9772 93.9885
CH5 95.9966
cyi 71.9676 87.9714 103.9724
C2IIi 89.9774 105,9861
C2I1, 60.0100
C2H6 109.0045
C\H2 84.9726 100.9872
C,H, 85.9921 101.9936 117.9843
C2H4 71.0056 102.9935 118.9965
C,H, 72.0078 119.0028
dk 73.0200
CA 113.9917 129.9914
C4H4 130.9923
C,II, 99.9822 116.0059
CA 85.0232 117.0021
C,H„, 149.0235
câ-k 157.0041
CöHh 165.0684
C7H, 152.0026
»—B-ti 1 g 177.0942
C,H2„ 191.1227
C„IIa 217.1399
C,2H14 189.0867
Cn^n 193.1222
CI2H26 233.1741
C12H,8 251.1796
272
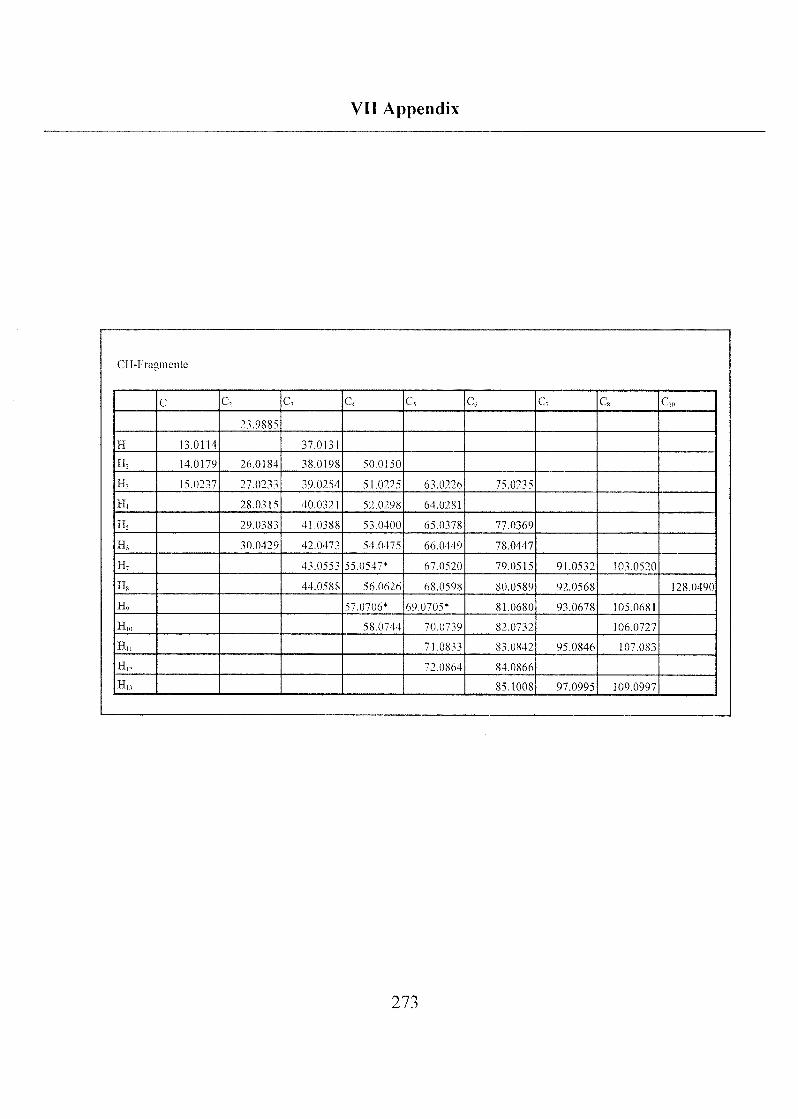
VII Appendix
CH-Fragmentc
C c, C, c4 C, Q C, c8 c,„
23.9885
H 13.0114 37.0131
Hj 14.0179 26.0184 38.0198 50.0150
H, 15.0237 27.0233 39.0254 51.0225 63.0226 75.0235
II, 28.0315 40.0321 52.0298 64.0281
H, 29.0383 41.0388 53.0400 65.0378 77.0369
H6 30.0429 42.0473 54.0475 66.0449 78.0447
H, 43.0553 55.0547* 67.0520 79.0515 91.0532 103.0520
Hs 44.0588 56.0626 68.0598 80.0589 92.0568 128.0490
H, 57.0706* 69.0705* 81.0680 93.0678 105.0681
H,„ 58.0744 70.0739 82.0732 106.0727
H„ 71.0833 83.0842 95.0846 107.083
H,2 72.0864 84.0866
H„ 85.1008 97.0995 109.0997
273
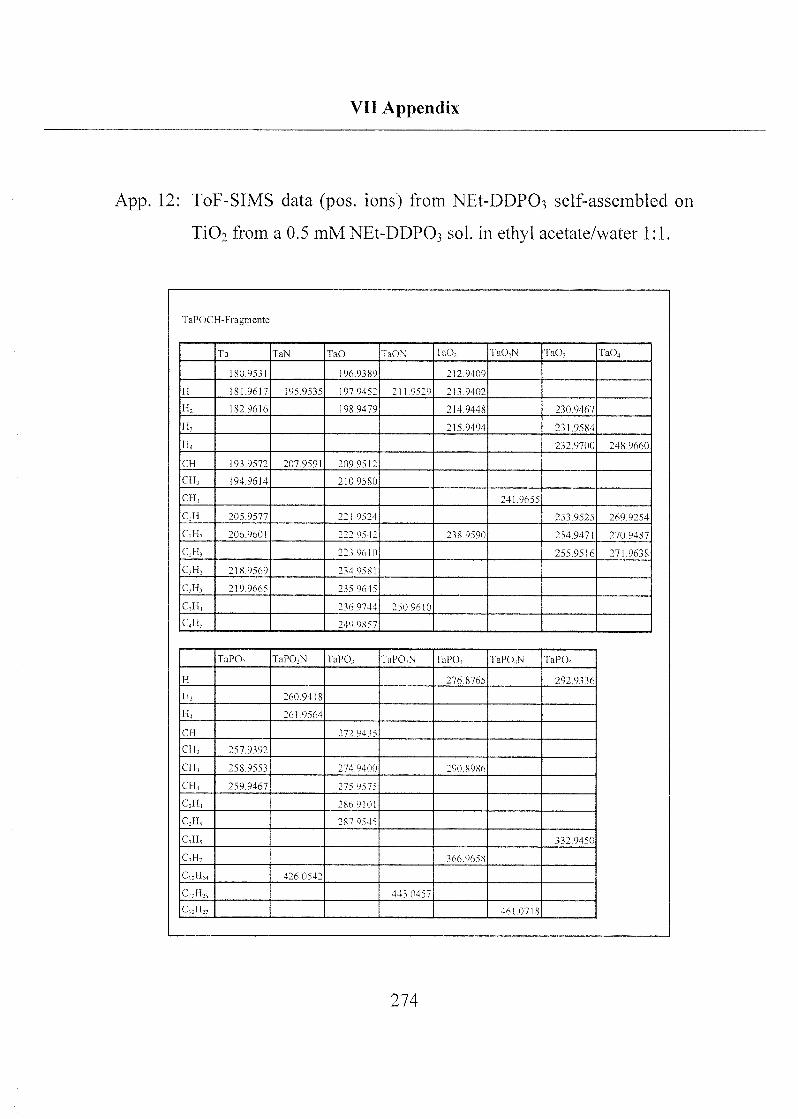
VII Appendix
App. 12: ToF-SIMS data (pos. ions) from NEt-DDPC>3 self-assembled on
ÜO2 from a 0.5 mMNEt-DDPOs sol. in ethyl acetate/water 1:1.
TaPOCH-Fragmente
Ta TaN TaO 1 aO\ IaO. Ta02N TaO, Ia04
180 9531 196 9389 212 9409
II 181 9617 195 9535 197 9452 211 9529 213 9402
IU 182 9616 198 9479 214 9448 230 9467
H, 215 9494 231 9584
II, 232 9700 248 9660
CH 193 9572 207 9591 209 9*12
CH, 194 9614 210 9580
CH, 241 9655
CI I 205 9577 221 9524 253 9525 269 9254
CH, 206 9601 222 9542 238 9590 254 9471 270 9487
CH, 22)9610 255 9516 271 9638
CH, 218 9569 234 9*S1
CJ I, 219 9665 235 964 S
CH, 236 9744 2*09610
C,H, 249 9857
TaPO; TaPO,N IaPO, 1 aPO \ IaPO, TaP(W IaPO,
II 276 8765 292 93 36
H. 260 9418
H, 261 9*64
CH 272 943*
CU2 257 9392
CH, 258 955) 274 9400 290 8986
CI I, 259 9467 27* 9*7*
CI I, 286 9101
CH, 287 9*4*.
CH, 332 9450
C-H- 366 96*8
C12H-, 426 0542
CplK 44U)457
C,;H^ 461 0718
274
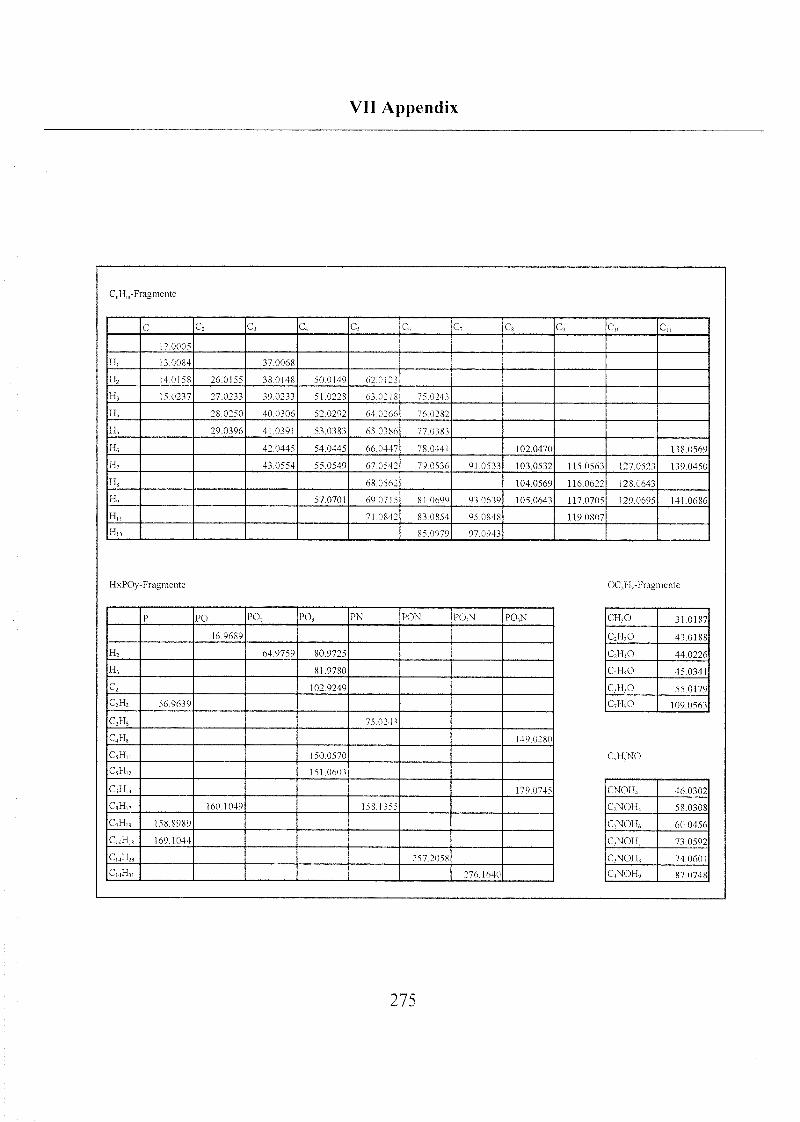
VII Appendix
C, Hm-rragmente
c C2 C, C, C C C C, c C,„ c„
12 0005
H, 1 ? 0084 37 0068
TU 140158 26 0155 38 0148 50 0149 62 0123
H, 15 0237 27 023 ? 39 0233 51 0228 63 0218 75 0243
H, 28 0250 40 0306 52 0292 64 Ü266 76 0282
H, 29 0396 41 0391 53 0383 65 03S6 77 0383
H, 42 0445 54 0445 66 0447 "8 0441 102 0470 138 0569
II7 43 0554 55 0549 67 0542 79 0536 91 0533 103 0532 1 15 0563 127 0523 139 0450
Hg 68 0562 104 0569 116 0622 128 0643
H, 57 0701 69 07^ 8 1 0699 9? 0639 105 0643 117 0705 129 0695 141 0686
II„ 71 0842 83 0854 95 0848 1190807
Un 85 0979 97 0943
I KPOy-rragmente OCJ 1 -1 ragrnente
P PO PO, PO, PN PO\ PON PO,N CH,0 31 0187
46 9689 Cl 1,0 43 0188
H2 64 9759 80 9725 CH,0 44 0226
H, 81 9780 CH.O 45 0341
C 102 9249 ci 1,0 55 0179
c2n2 56 9619 CHO 109 0563
C2TI, 75 0241
C4I1, 149 0280
C,H,NOCll„ 150 0570
Cl 1,2 151 0603
CfH„ 179 0745 CNOH, 46 0302
CxHn 160 1049 158 H55 CNOH, 58 0308
C,H„ 158 8989 CNOH« 60 0456
ChiHîs 169 1044 CNOH, 73 0592
C,,H„ 257 2058 CNOH, 74 0601
CmHij 276 1640 CNOH, 87 0748
275
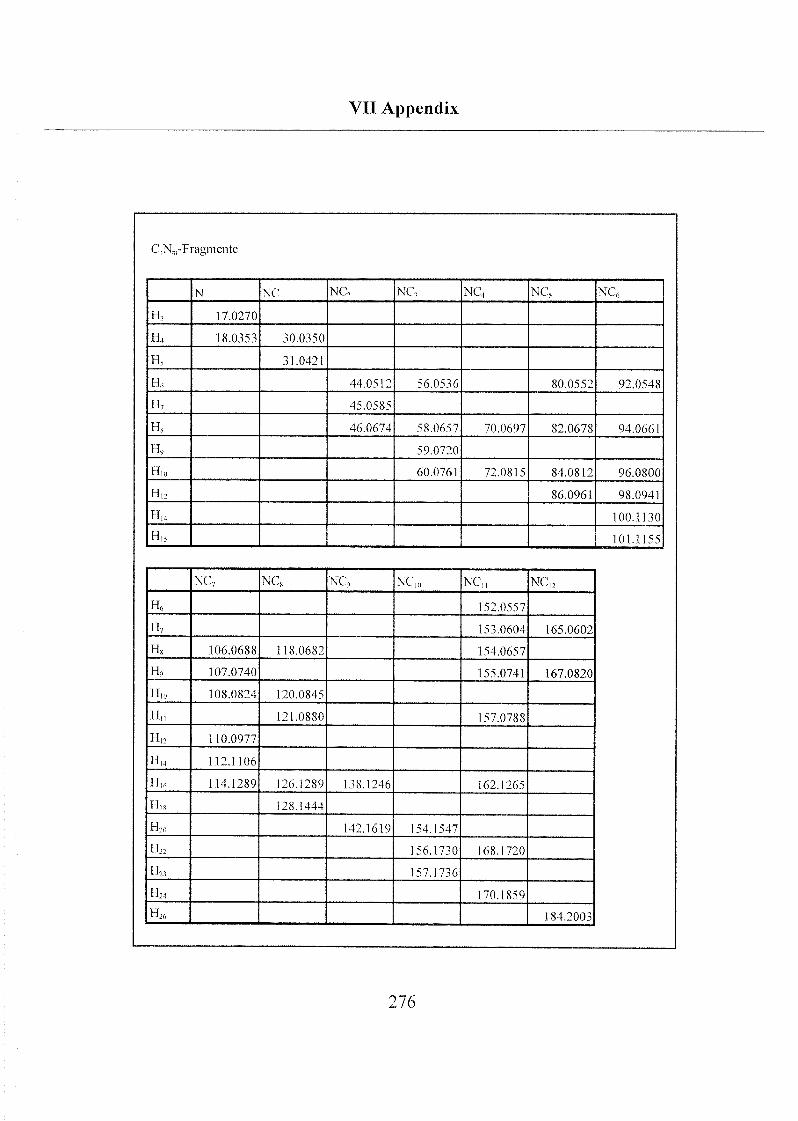
VTI Appendix
CnNm-Fragmente
N NC NC2 NC NC NC, NQ
Iii 17.0270
114 18.0353 30.0350
II, 31.0421
H6 44.0512 56.0536 80.0552 92.0548
H7 45.0585
Hs 46 0674 58 0657 70 0697 82.0678 94.0661
[], 59 0720
»,0 60.0761 72.0815 84.0812 96.0800
H,2 86.0961 98.0941
Hi. 100.1130
H„ 101.1155
NC7 NC, NC, NC,U NC,, NC,2
H« 152.0557
H7 153.0604 165.0602
H8 106.0688 118.0682 154.0657
H., 107.0740 155.0741 167.0820
H,o 108.0824 120.0845
H„ 121.0880 157.0788
H,2 110.0977
H,4 112.1106
Jiu, 114.1289 126.1289 138 1246 162.1265
His 128.1444
H;o 142 1619 154.1547
H22 156.1730 168.1720
Tin 157.1736
H24 170.1859
HJ6 184.2003
276
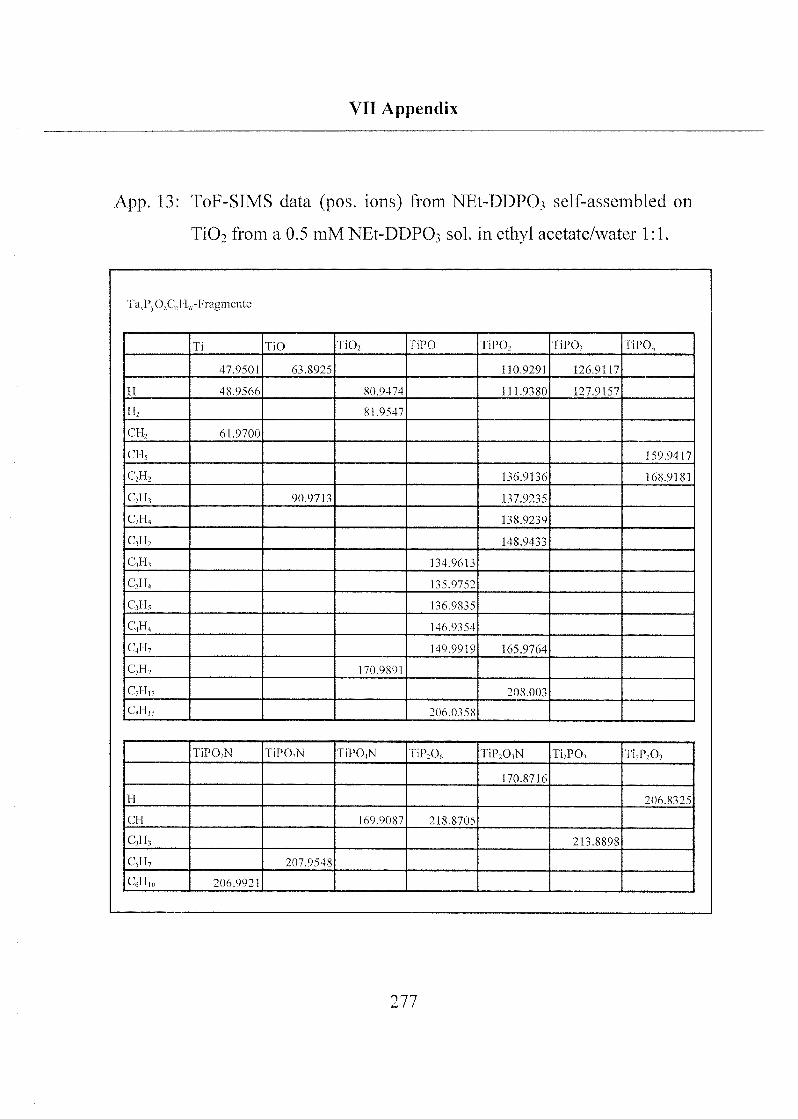
VII Appendix
App. 13: ToF-SIMS data (pos. ions) from NEt-DDPC^ self-assembled on
TiOi from a 0.5 mM NEt-DDPO.3 sol. in ethyl acetate/water 1:1.
Ta^PACH«-Fragmente
Ti TiO Ti02 I iPO TiPO, TiPO, TiPO,
47.9501 63.8925 110.9291 126.9117
H 48.9566 80.9474 111.9380 127.9157
H2 81.9547
cn2 61.9700
CI 1, 159.9417
QH, 136.9136 168.9181
C2H, 90.9713 137.9235
C2H4 138.9239
Cft 148.9433
C-,11, 134.9613
C,H„ 135.9752
CI I, 136.9835
C|H4 146.9354
C4II7 149.9919 165.9764
C7H7 170.9891
Clin 208.003
C.II„ 206.0358
TiP02N TiPO-,N TiP04N I iP20„ TiP20,N Ti?P03 Ti2P20,
170.8716
H 206.8325
CH 169.9087 218.8705
C3H3 213.8898
CH7 207.9548
Cmo 206.9921
ä f*> r~i
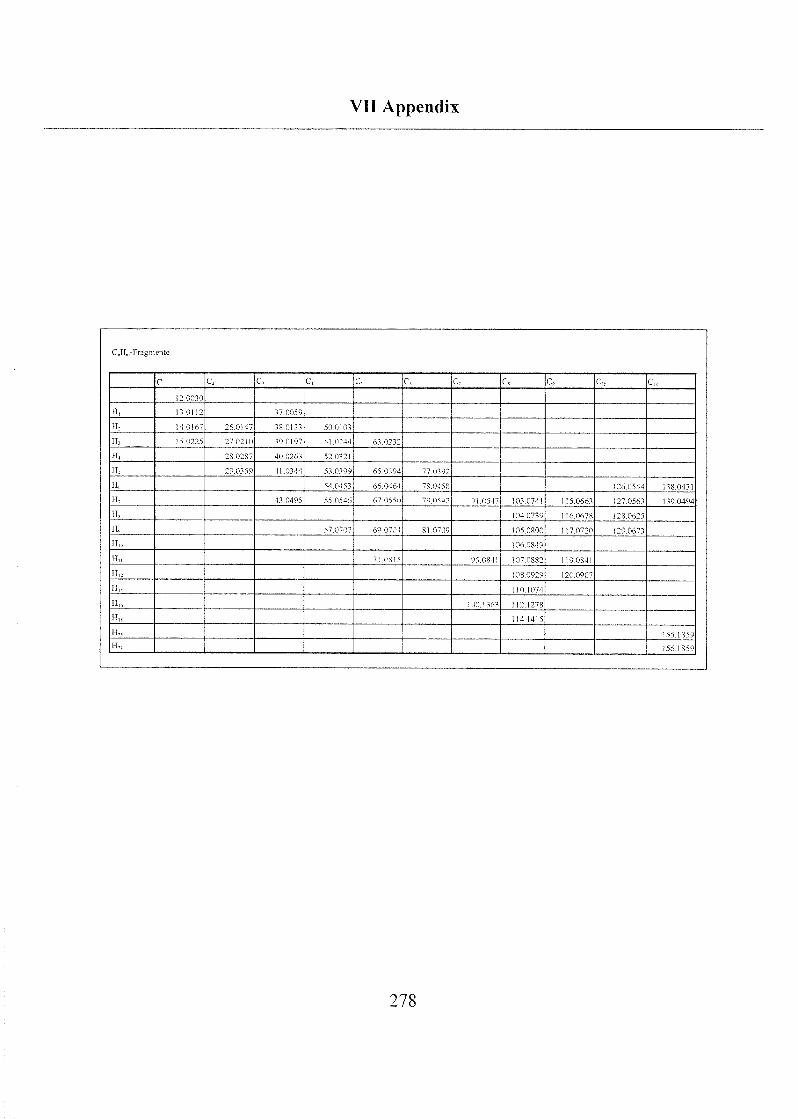
VII Appendix
CnHm-Fiagmcnte
C c C c, C, C» C, c, C, CV c„
12 0030
II, r» 0112 17 0059
IL 14 0167 26 0147 18 Olli 50 0101
Hi 15 0225 27 0210 19 0197 51 0244 61 0212
\li 28 0287 40 0261 S2 0121
H; 29 0159 (1 0141 51 0199 65 0194 77 0192
Hr 54 0411 66 0464 7S0158 126 0554 138 0431
41 0495 55 0546 67 05^0 79 05 t: 91 0547 103 0741 115 0661 127 0561 119 0494
Ilj 104 0719 116 0678 128 0625
5n 0707 ö9 0~04 81 0709 105 0890 117 0720 129 0671
Um 106 0849
Hu 71 OSli 95 08(1 107 0882 119 0841
II,, 108 0929 120 0907
Hu 110 1074
Hi« 100 1161 112 1278
Hl! 114 1415
II,, 155 1859
II2I 156 1859
278
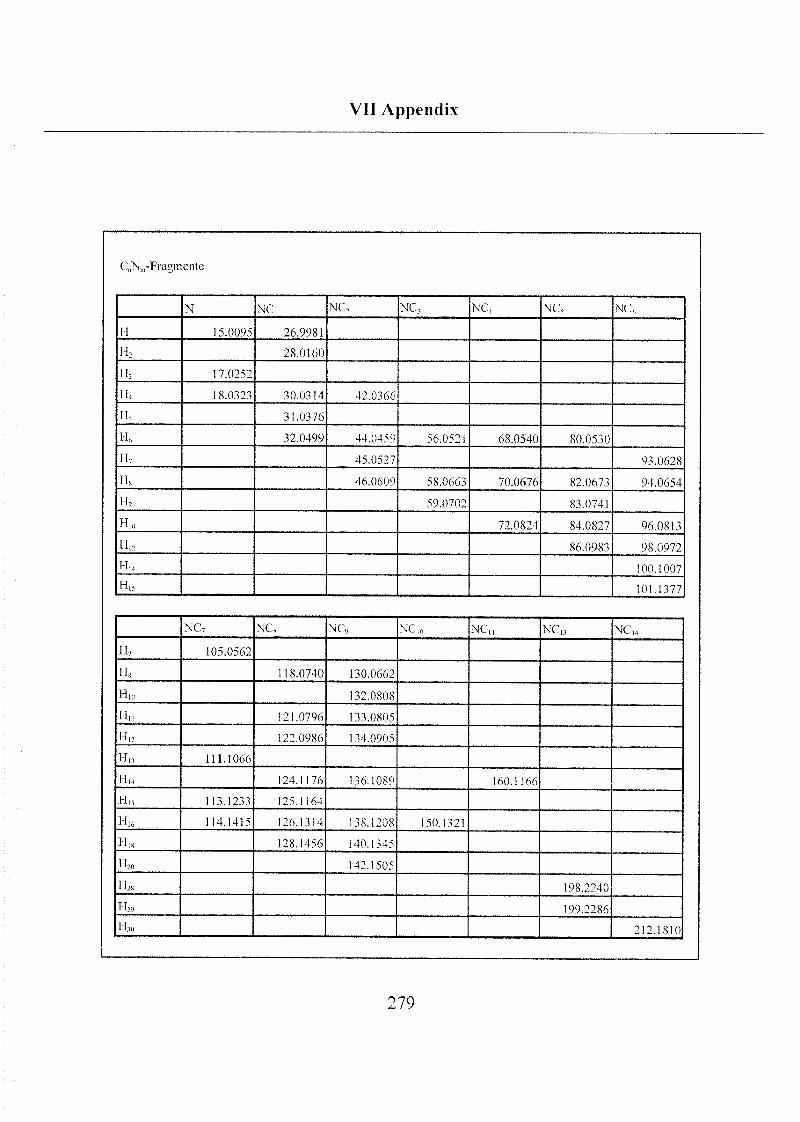
VII Appendix
C„Nm-Fragmente
N NC NC, NC, NC, NC, NCt
11 15.0095 26.9981
H2 28.0160
H, 17.0252
11, 18.0323 30.0314 42.0366
H, 31.0376
lk 32.0499 44.0459 56.0521 68.0540 80.0530
Il7 45.0527 93.0628
H, 46.0609 58.0663 70.0676 82.0673 94.0654
II9 59.0702 83.0741
H,o 72.0824 84.0827 96.0813
H12 86.0983 98.0972
HI4 100.1007
H„ 101.1377
NC7 NC, NC, NC,,, NC,, NC,, NC„
H, 105.0562
H, 118.0740 130.0662
Hm 132.0808
H„ 121.0796 133.0805
H,2 122.0986 134.0905
H,3 111.1066
H„ 124.1176 136.1089 160.1166
11h 113.1233 125.1164
Hi6 114.1415 126.1314 138.1208 150.1321
11,8 128.1456 140.1345
H20 142.1505
HM 198.2240
H29 199.2286
H,„ 212.1810
279
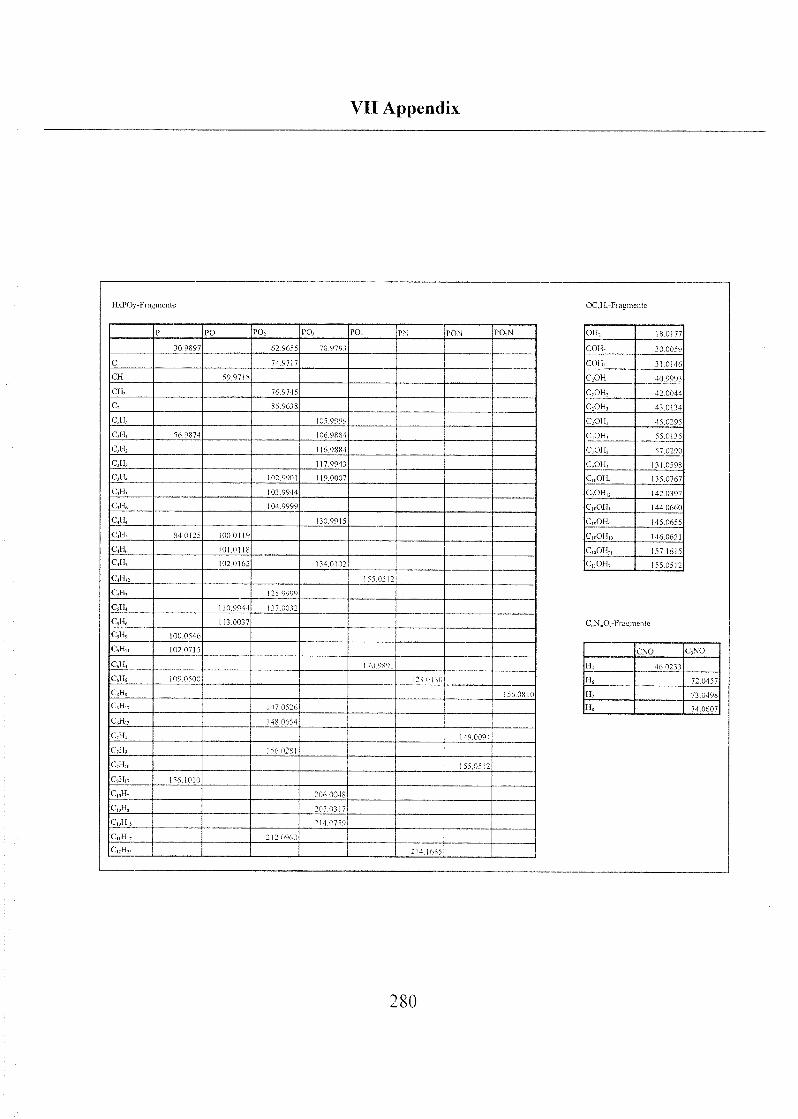
VII Appendix
HxPOy-Fi agmente OQH-I"! agmente
Oil, 180177
COU, 30 0059
COU, 11 0146
COH 40 9993
COU, 42 0044
COH, »0114
COHs 4"; 029:>
C,OH, «0135
COH, 57 0290
COH, 111 0598
C„,OH6 1310767
COH,, 142 0397
C,„OH, 144 0660
COH, 145 0655
C„OH,, 146 0621
C„,OH,, 1571615
C„OH, 155 0512
P PO PO, PO, PO, P\ PON PO,N
30 9897 62 9655 78 9793
C 74 9717
CH 59 9718
CH, 76 9745
C 86 9618
CH, 105 9999
CH, 56 9874 106 9884
CH, 116 98S4
CH, 117 9943
CH, 102 9901 119 0007
CH, 103 9944
CH« 104 9999
C,H4 130 9915
CH, 84 0125 1000119
C,HS 101 0118
C,H, 102 0162 114 0102
C,1I,, 1510512
CH, 125 9999
CH, 110 9914 12^0012
CH, 113 003''
CH» 100 0546
QH„ 102 0715
QH, 170 9891
C,H4 109 0500 i2,ono
QU, 156 0810
QH,, 147 0526
QH„ 148 0654
CH, 149 0094
QU, 1 56 0281
CH„ 1550512
QH„ 156 1010
C,„H, 206 0018
C,„II, 207 03 r
Q„H„ 214 07-.9
QiH„ 212 0960
C,,H,, 214 168-.
CNO' CNO
H, tb 0233
Hf, 72 0457
H, 73 0498
H» 74 0607
280
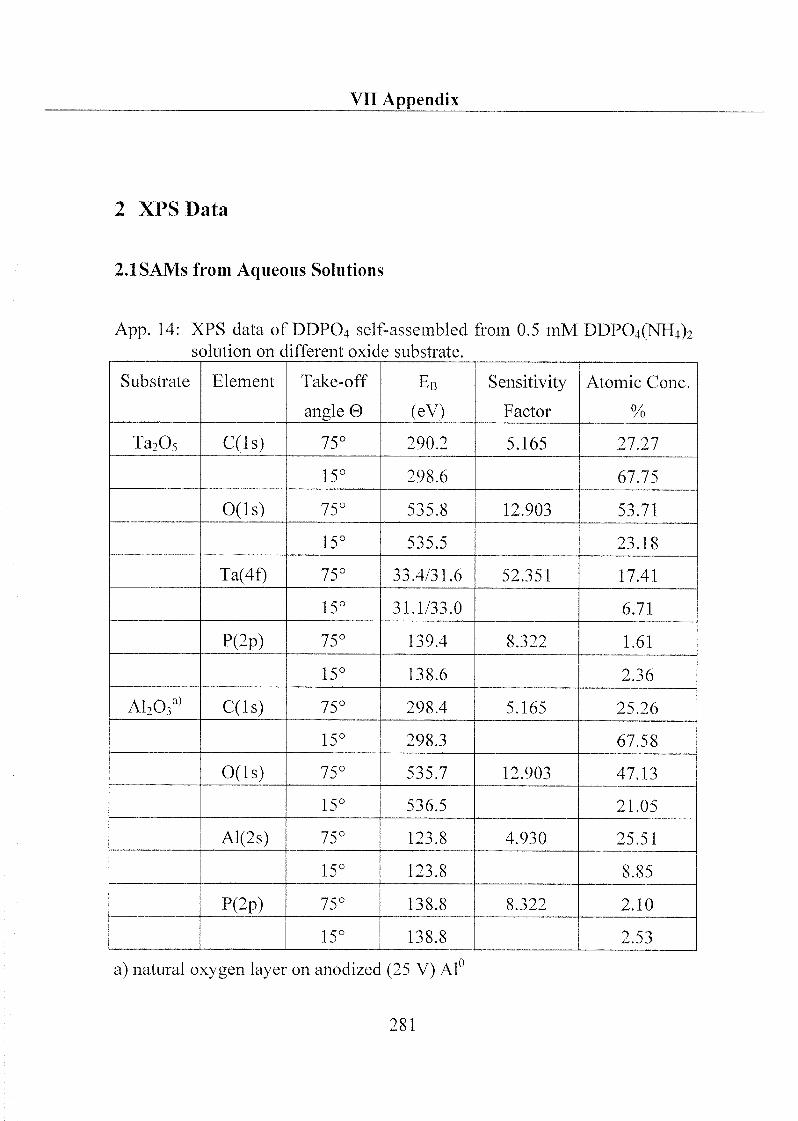
VII Appendix
2 XPS Data
2.1SAMs from Aqueous Solutions
App. 14: XPS data of DDP04 self-assembled from 0.5 mM DDP04(NH4)2solution on different oxide substrate.
Substrate Element Take-off
angle 0
Eb
(eV)
Sensitivity
Factor
Atomic Cone.
%
Ta205 C(ls) 75° 290.2 5.165 27.27
15° 298.6 67.75
O(ls) 75° 535.8 12.903 53.71
15° 535.5 23.18
Ta(4f) 75° 33.4/31.6 52.351 17.41
15° 31.1/33.0 6.71
P(2p) 75° 139.4 8.322 1.61
15° 138.6 2.36
Al203a) C(ls) 75° 298.4 5.165 25.26
15° 298.3 67.58
O(ls) 75° 535.7 12.903 47.13
15° 536.5 21.05
Al(2s) 75° 123.8 4.930 25.51
15° 123.8 8.85
P(2p) 75° 138.8 8.322 2.10
15° 138.8 2.53
a) natural oxygen layer on anodized (25 V) Al
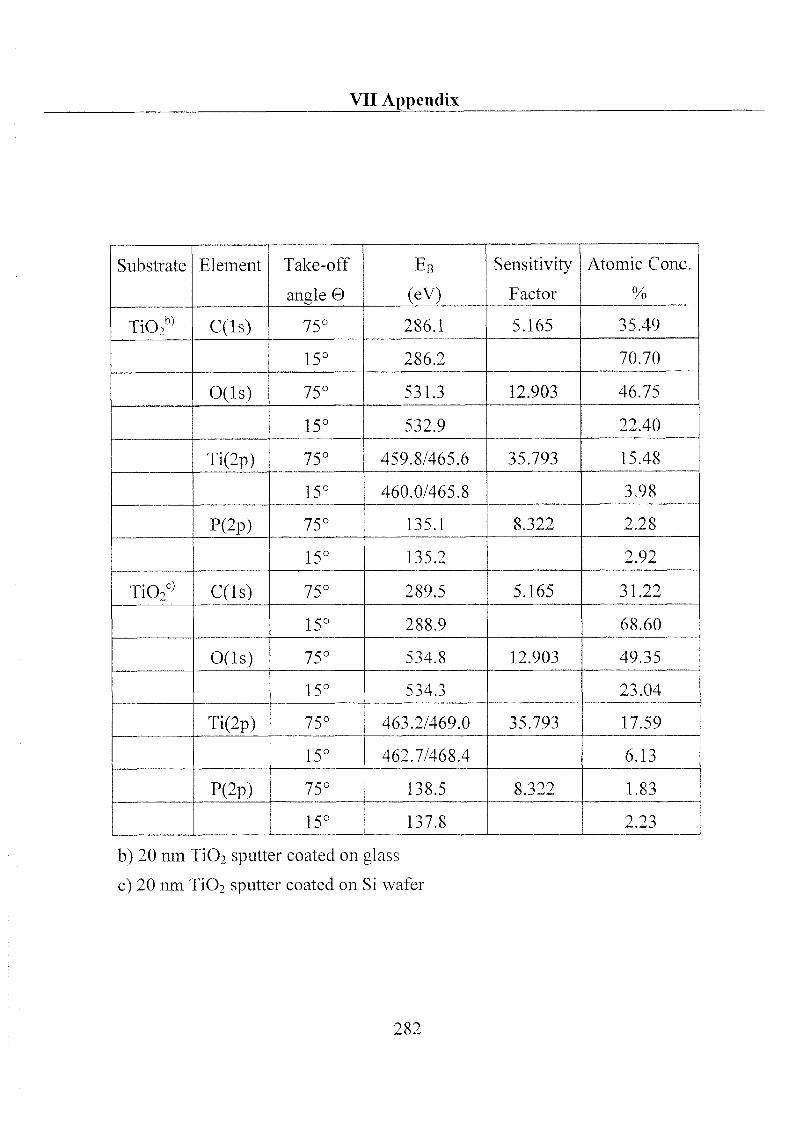
VII Appendix
Substrate Element Take-off
angle 0
En
(eV)
Sensitivity
Factor
Atomic Cone.
%
Ti02b) C(ls) 75° 286.1 5.165 35.49
15° 286.2 70.70
0(ls) 75° 531.3 12.903 46.75
15° 532.9 22.40
Ti(2p) 75° 459.8/465.6 35.793 15.48
15° 460.0/465.8 3.98
P(2p) 75° 135.1 8.322 À.Zo
15° 135.2 &*ä * V A/
Ti02c) C(ls) 75° 289.5 5.165 31.22
15° 288.9 68.60
0(ls) 75° 534.8 12.903 49.35
15° 534.3 23.04
Ti(2p) 75° 463.2/469.0 35.793 17.59
15° 462.7/468.4 6.13
P(2p) 75° 138.5 8.322 1.83
15° 137.8 2.23
b) 20 nm Ti02 sputter coated on glass
c) 20 nm Ti02 sputter coated on Si wafer
282
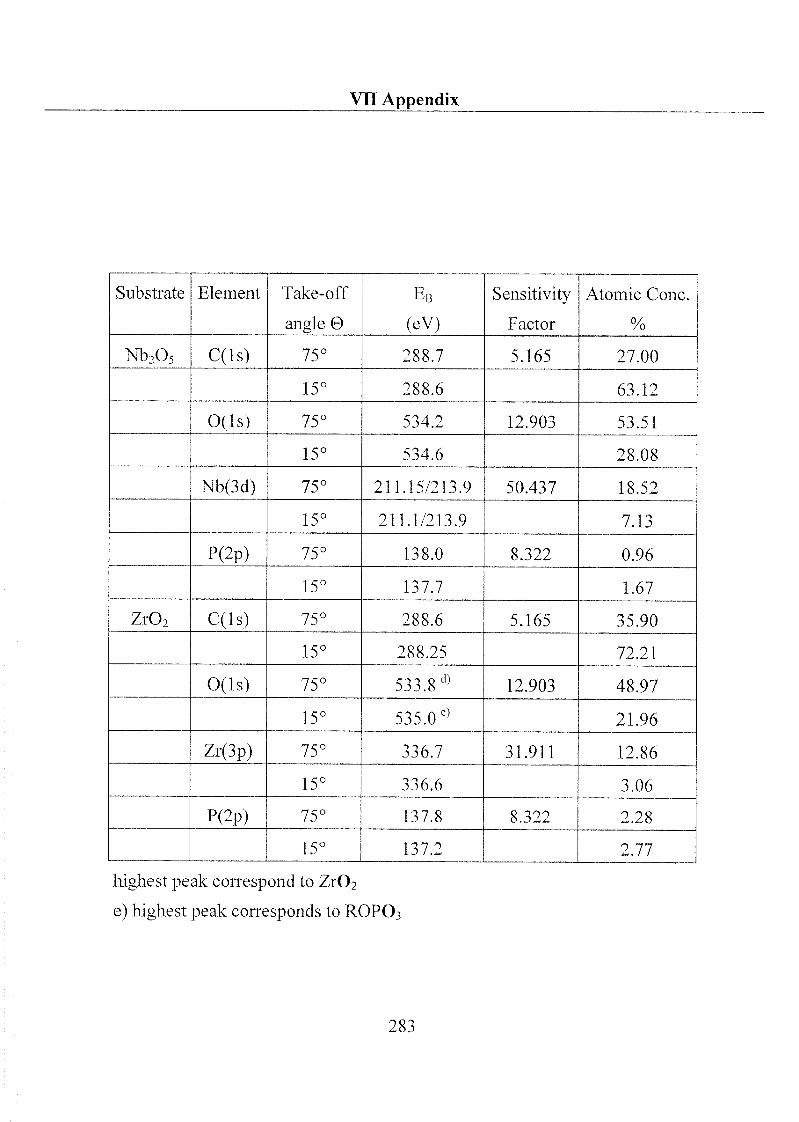
VII Appendix
Substrate Element Take-off
angle 0
EB
(eV)
Sensitivity
Factor
Atomic Cone.
%
Nb205 C(ls) 288.7 5.165 27.00
15° 288.6 63.12
0(ls) 75° 534.2 12.903 53.51
15° 534.6 28.08
Nb(3d) 75° 211.15/213.9 50.437 18.52
15° 211.1/213.9 7.13
P(2p) 75° 138.0 8.322 0.96
15° 137.7 1.67
Zr02 C(ls) 75° 288.6 5.165 35.90
15° 288.25 72.21
0(ls) 75° 533.8d)
12.903 48.97
15° 535.0 e)21.96
Zr(3p) 75° 336.7 31.911 12.86
15° 336.6 3.06
P(2p) 75° 137.8 8.322 2.28
15° 137.2 2.77
highest peak correspond to ZrCh
e) highest peak corresponds to ROPO3
283
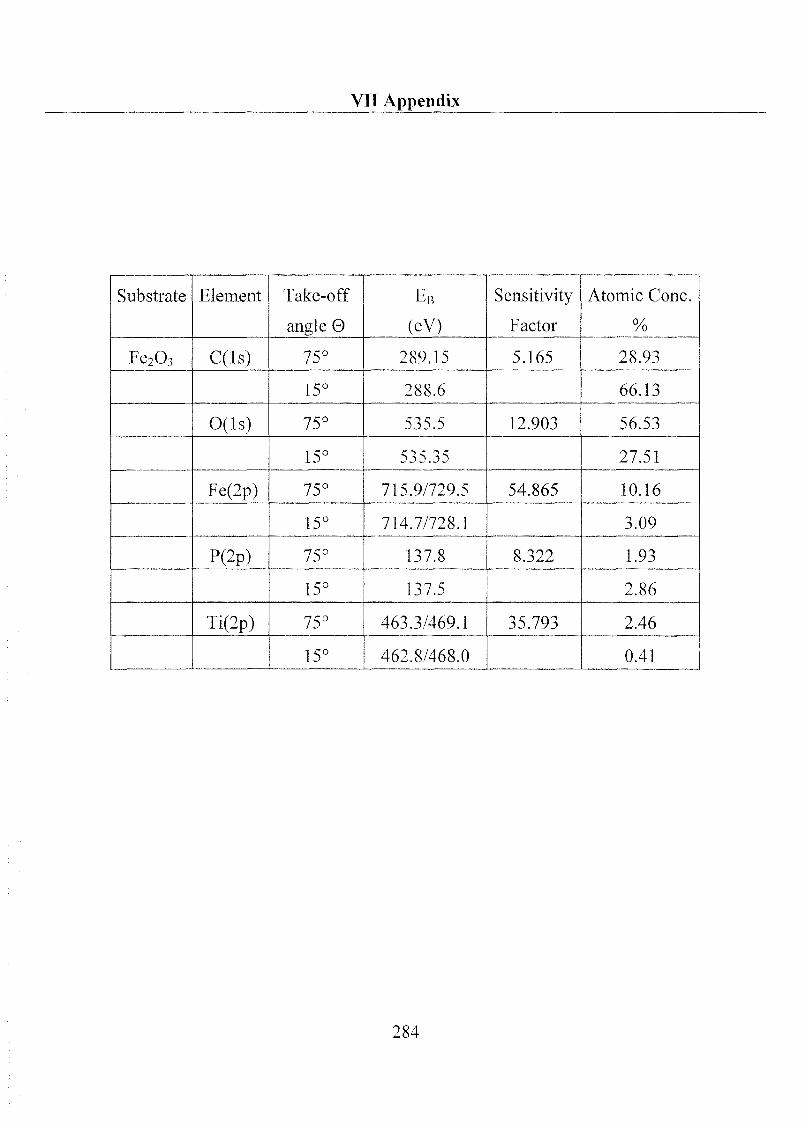
VII Appendix
Substrate Element Take-off
angle 0
EB
(eV)
Sensitivity
Factor
Atomic Cone.
%
Fe203 C(ls) 75° 289.15 5.165 28.93
15° 288.6 66.13
0(ls) 75° 535.5 12.903 56.53
15° 535.35 27.51
Fe(2p) 75° 715.9/729.5 54.865 10.16
15° 714.7/728.1 3.09
P(2p) 75° 137.8 8.322 1.93
15° 137.5 2.86
Ti(2p) 75° 463.3/469.1 35.793 2.46
15° 462.8/468.0 0.41
284
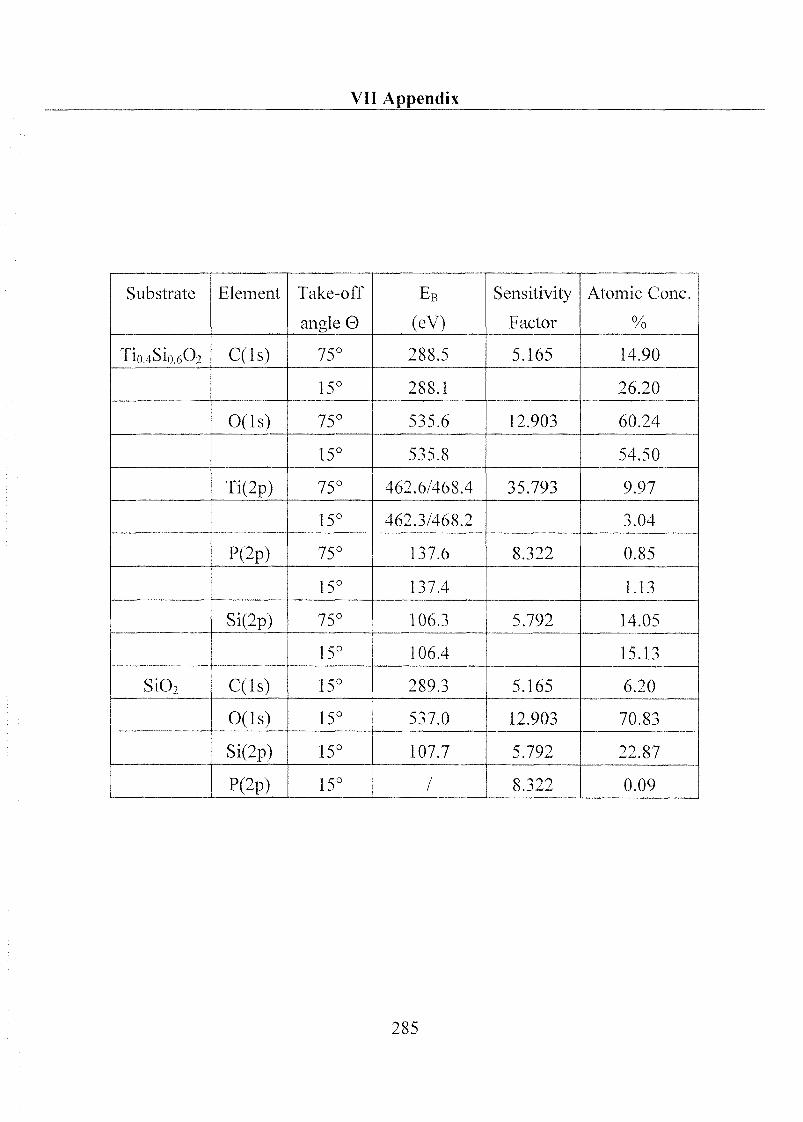
VII Appendix
Substrate Element Take-off
angle ö
EB
(eV)
Sensitivity
Factor
Atomic Cone.
%
Tio 4Sio 6O2 C(ls) 75° 288.5 5.165 14.90
15° 288.1 26.20
O(ls) 75° 535.6 12.903 60.24
15° 535.8 54.50
Ti(2p) 75° 462.6/468.4 35.793 9.97
15° 462.3/468.2 3.04
P(2p) 75° 137.6 8.322 0.85
15° 137.4 1.13
Si(2p) 75° 106.3 5.792 14.05
1 ro 106.4 15.13
Si02 C(ls) 15° 289.3 5.165 6.20
O(ls) 15° 537.0 12.903 70.83
Si(2p) 15° 107.7 5.792 22.87
P(2p) 15° / 8.322 0.09
285
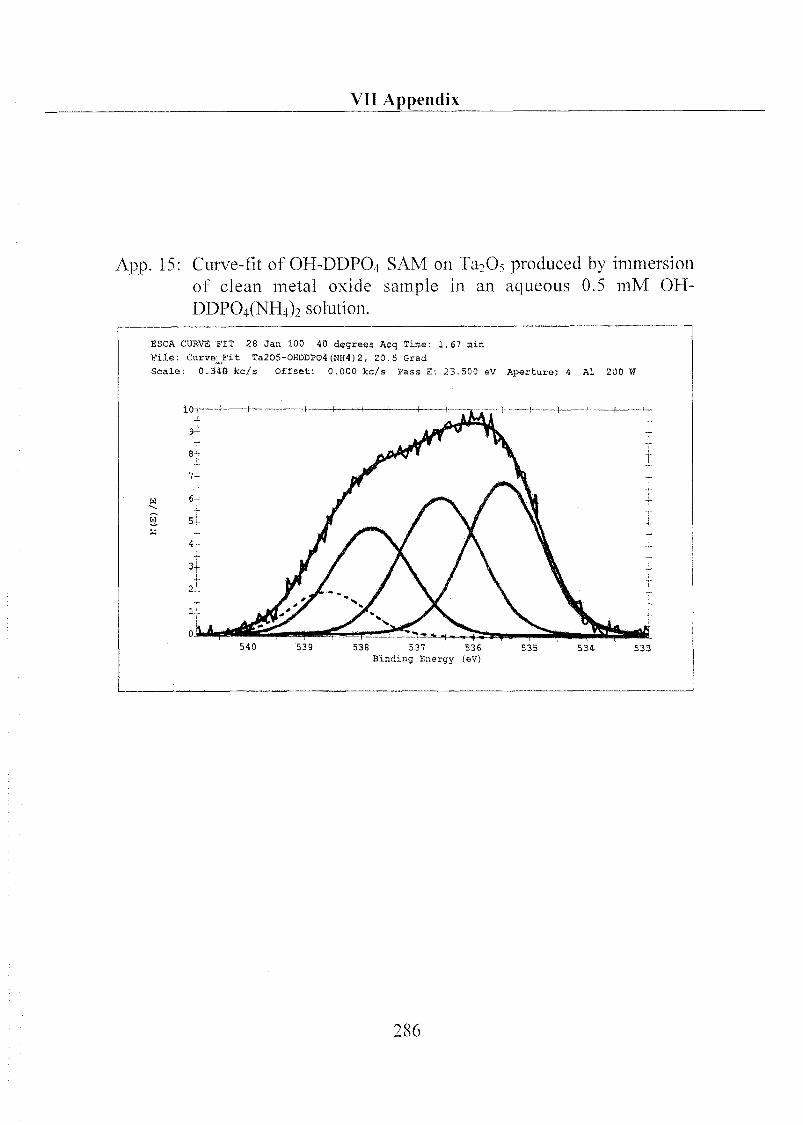
VII Appendix
App. 15: Curve-fit of OH-DDPO4 SAM on Ta205 produced by immersion
of clean metal oxide sample in an aqueous 0.5 mM OH-
DDP04(NH4)2 solution.
286
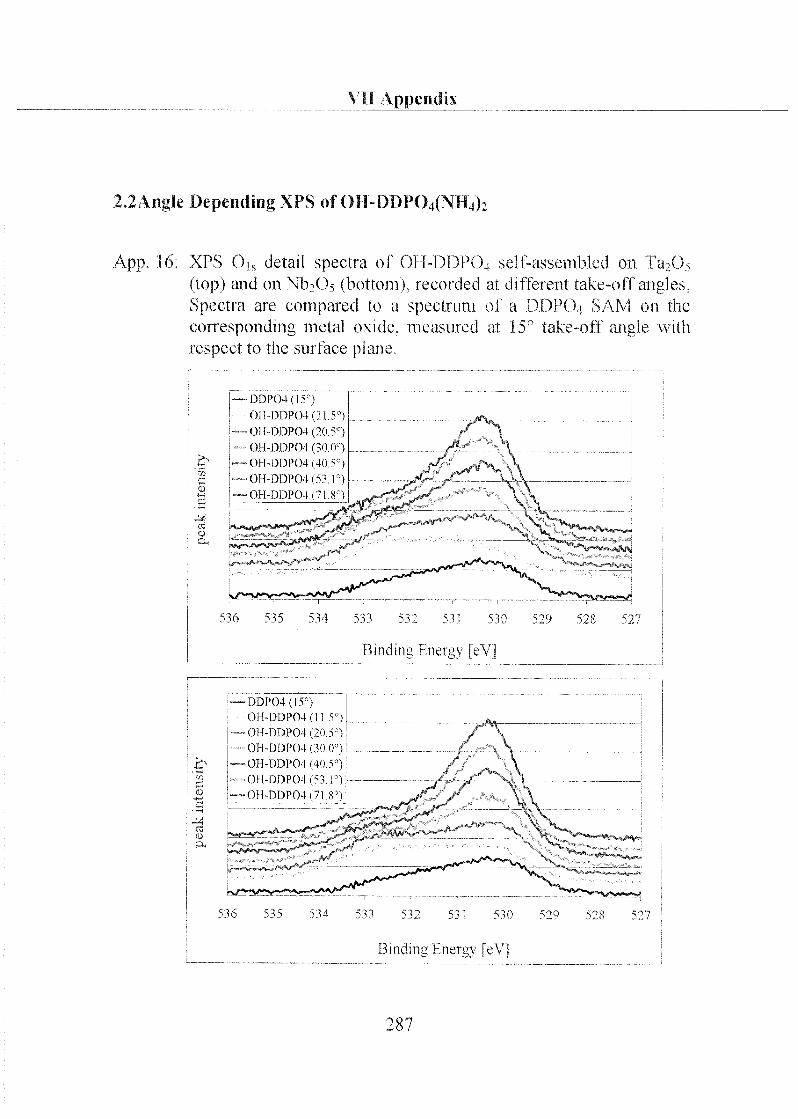
VII Appendix
2.2Angle Depending XPS of OH-DDP04(NH4)2
App. 16: XPS Ois detail spectra of OH-DDP04 self-assembled on fa^Os
(top) and on Nb^Os (bottom), recorded at different take-off angles.
Spectra are compared to a spectrum of a DDP04 SAM on the
corresponding metal oxide, measured at J 5° take-off angle with
respect to the surface plane
5 to M5 534 m M2 5 M 5*0 529 528 ^27
Binding Fnetgy [eV
536 515 514 Ml M2 S ^ I MO 529 528 *527
Binding Fneigy [eV]
JLC
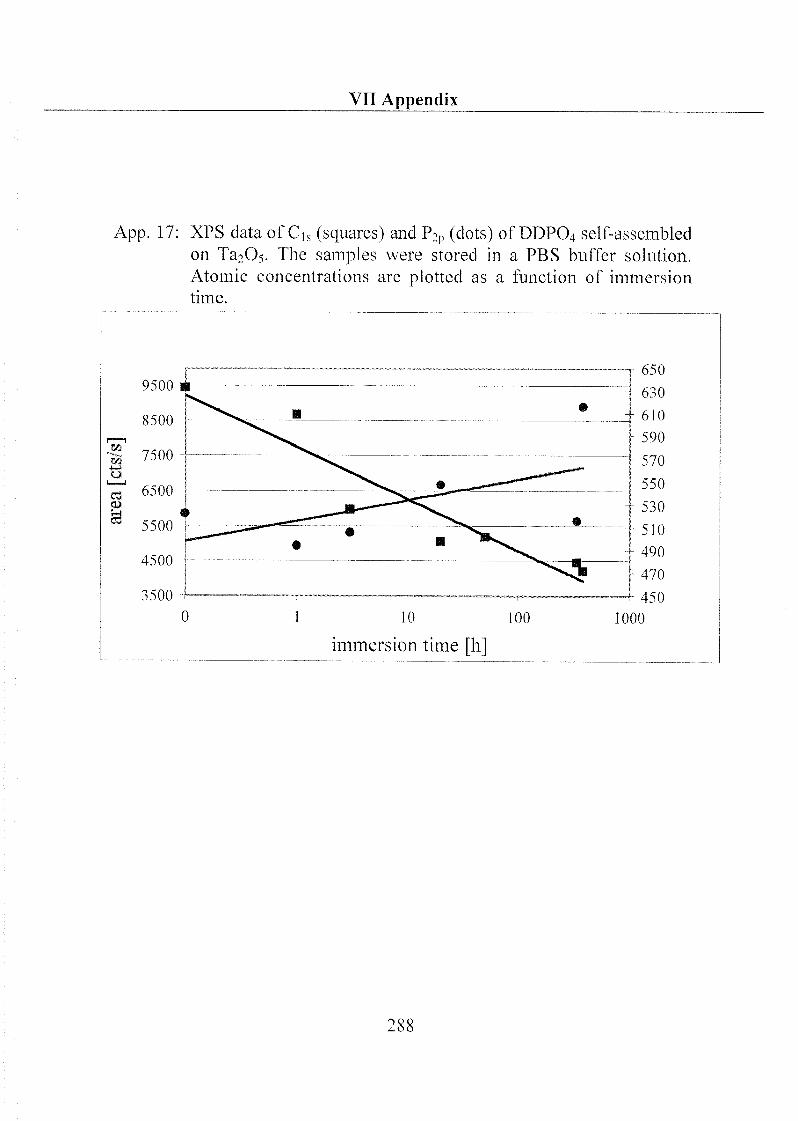
VII Appendix
App. 17: XPS data of C]s (squares) and P2p (dots) of DDP04 self-assembled
on Ta205. The samples were stored in a PBS buffer solution.
Atomic concentrations are plotted as a function of immersion
time.
9500 *a
8500
H 7500
u
~£ 6500 Î
^5500
4500
3500 Î-
0 1 10 100
immersion time [h]
1000
288
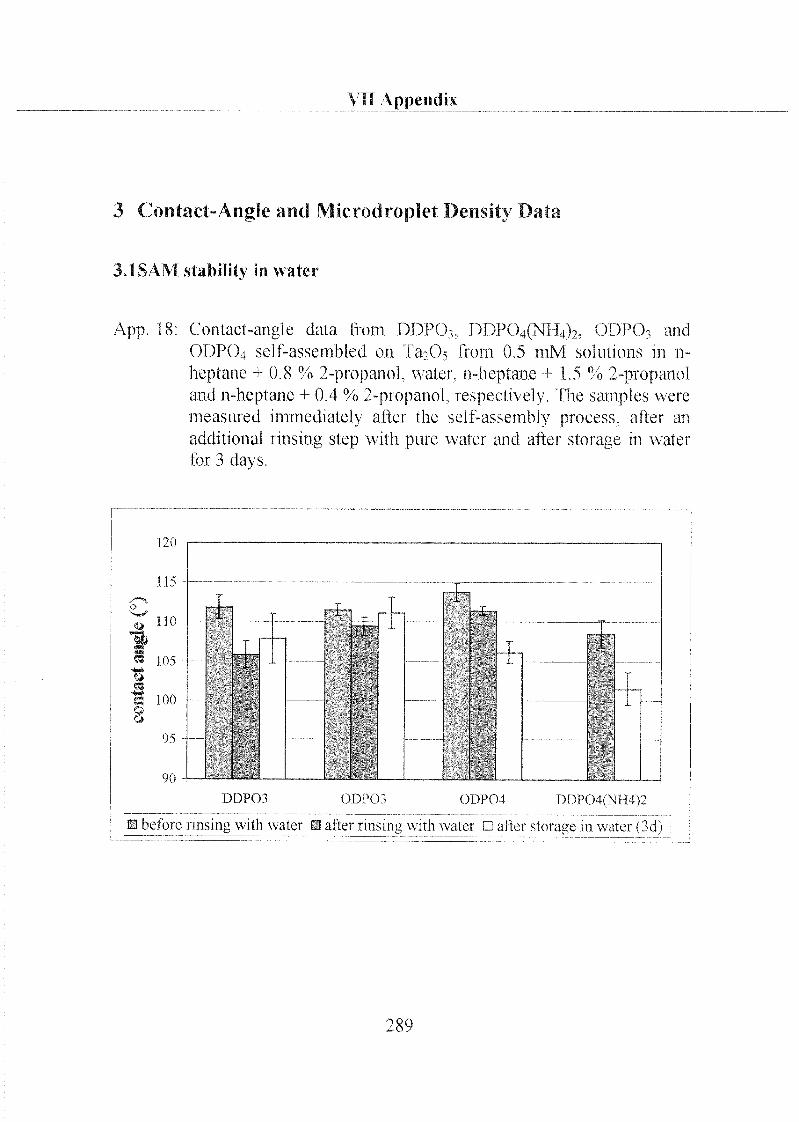
\ II Vppendix
3 Contact-Angle and Microdroplet Density Data
3J SAM stability in water
App 18 Contact-angle data from DDPCX DDP()4(Nïl4)2, ODPCX and
ODPO4 self-assembled on la^CX lioni 0 5 inM solutions 111 n-
hcptaiic + 0 8 % 2-propanol, watei. n-heptane ^ 1 5 % 2-propanoland n-heptane + 04% 2-propanol, lespectively The samples were
measmed immediately after the sell-assembly process, after an
additional nnsmg step with puie water and after storage m water
for 3 days
DDPCH ODPOï ODP04 1)DP04(\H4)2
ID before nnsmg with water B alter nnsmg with watet D after stoiage 111 watei ( Id)
289
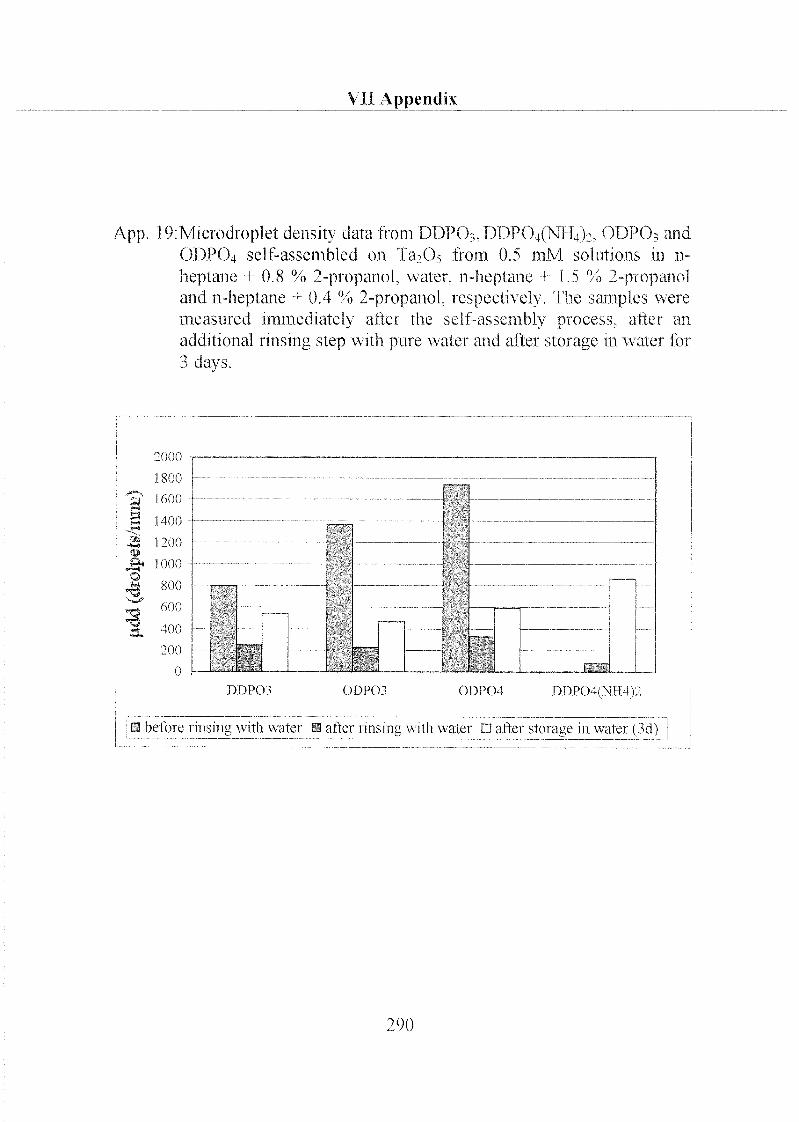
\ II Appendix
App. 19 Microdroplet density data from DDPCX DDPÖ4(NlIfh ODPCh and
ODPO4 self-assembled on la^Os from 0 5 mlM solutions in n-
heptane + 08 % 2-propanol, water, n-heptane -+ 1 5 % 2-propanoland n-heptane + 0.4 % 2-propanol, respectively The samples were
measured immediately after the ^elf-assembly proems, after an
additional rinsing step with pure water and after storage in "water for
3 days
<a
DDPCH ODPCH ODP04 DDPOt(\H4)2
\n before nnsing with watei H aftet iinsmg with watet D aftet stoiage in water (3d)
290
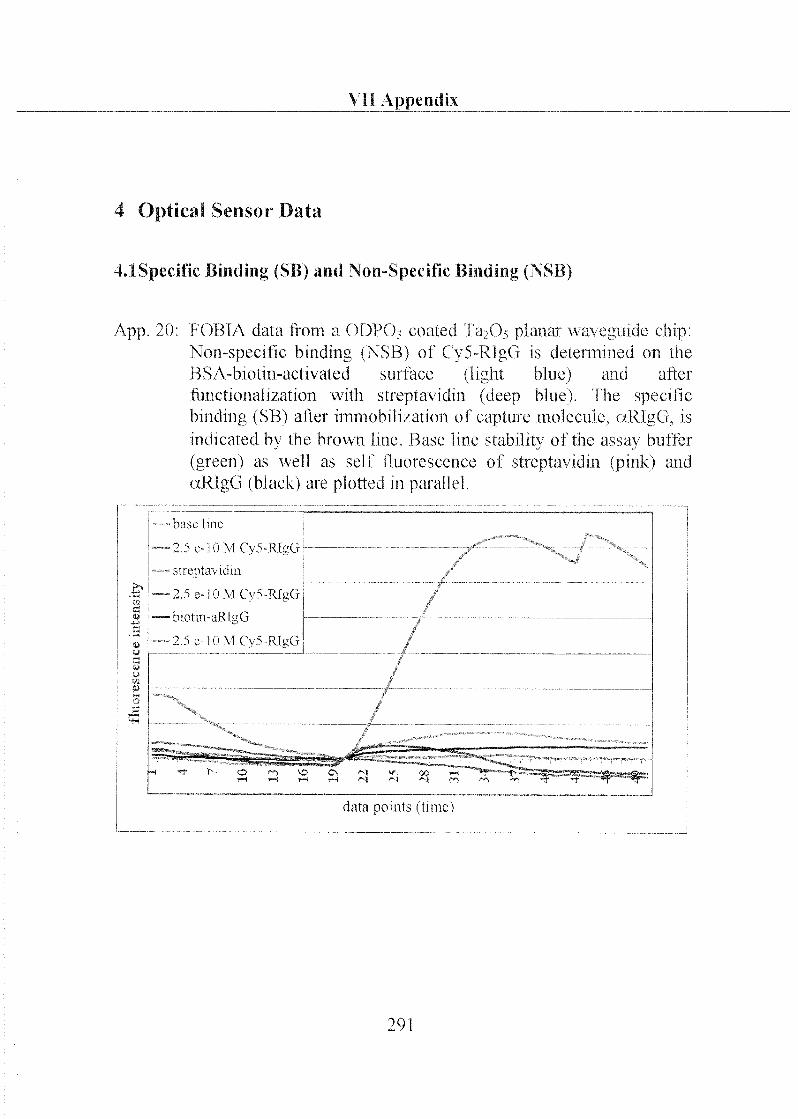
Vil Appendix
4 Optical Sensor Data
4.1 Specific Binding (SB) and \on-Specific Binding (NSB)
App 20 FOBIA data from a ÜDPO, coated 1 a->(\ planar waveguide chip
Non-specific binding (MSB) of Cv5-RlgG is determined on the
BSA-biotm-activated surface (light blue) and after
functionali/ation with streptavidin (deep blue) The specific
binding (SB) after immobilization of captme molecule, aRlgG, is
indicated by the brown line Base line stability of the assay buffer
(green) as well as self fluorescence of streptavidin (pink) and
aRlgG (black) are plotted m parallel
baseline
•2 5e-lÜMO\5-RIsG
stieptavidin
2 5e-IOMC\5-RIgü,
biotm-aRlgG
2Se-H)\fCvS-RlgG
O •*•") \o O^ *^> v 00rH ?»H rH î~H rv| ^î rs)(
data points (time)
291
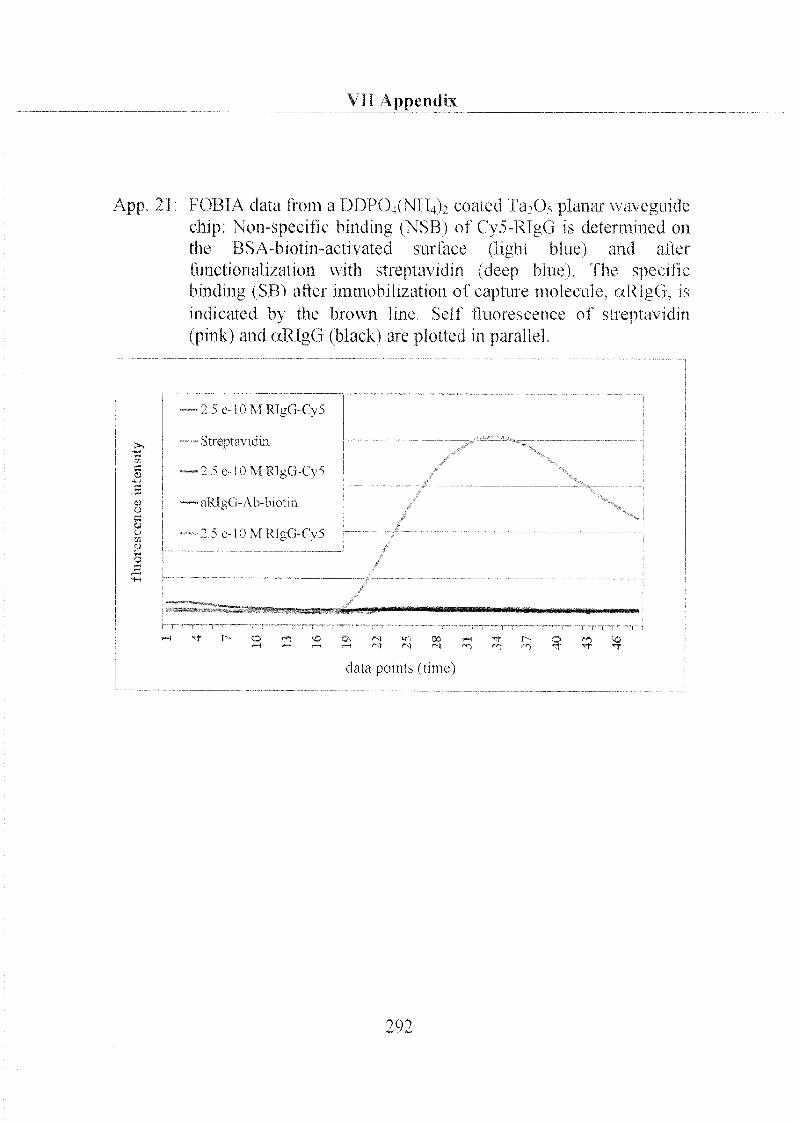
VII Appendix
App. 21
d
.3<x>
o
s4»o
V!
F0B1A data from a DDP04(NH4)2 coated 'Ya2®5 planar waveguidechip: Non-specific binding (NSB) of Cy5-RIgG is determined on
the BSA-biolm-activatcd surface (light blue) and after
functionali/ation with streptavidin (deep blue). The specificbinding (SB) after immobilization of capture molecule, <xRIgG, is
indicated by the brown line Self fluorescence of streptavidin(pink) and ctRTgG (black) are plotted in parallel.
— 2 5 e-10 M RIgG-Cy5
Stteptavtdni
—2^e-I0 M R1gG-Cy5
—- aRIgG- Alvbiotin
2 5e-10MR]gG-Oy5
G
S iN iN
data points (time)
-f r S
292
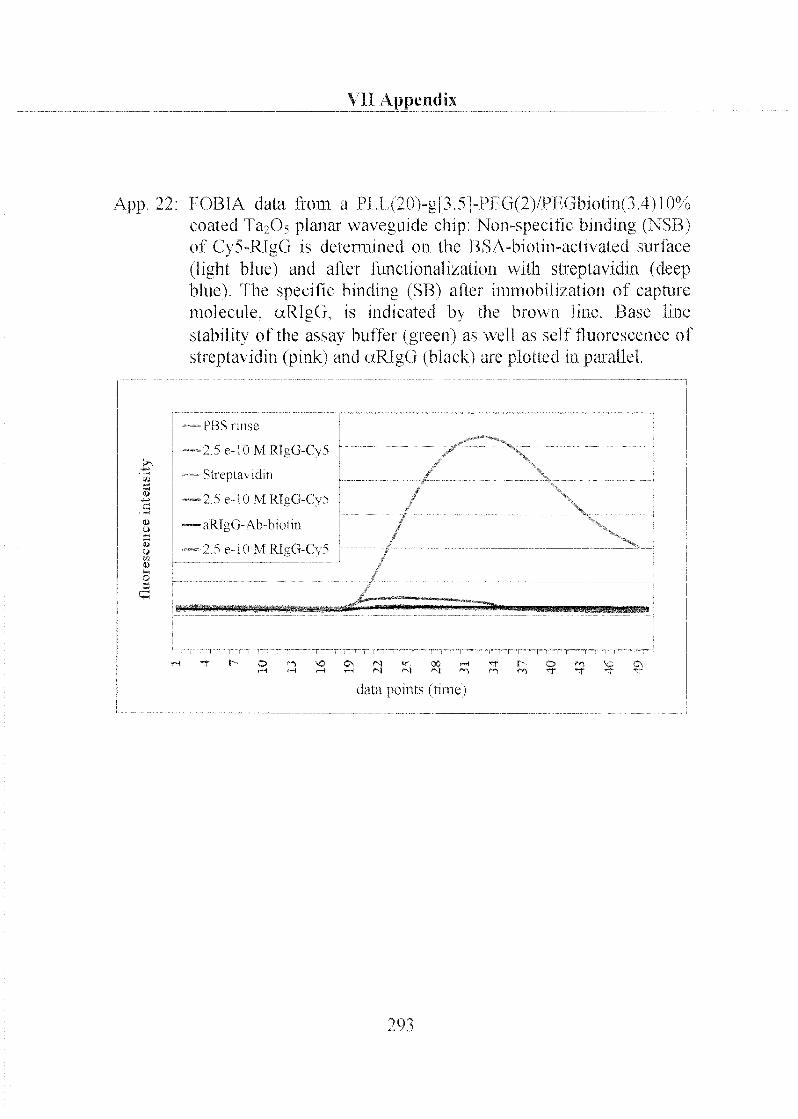
VII Appendix
p 22 rOBIA data from a PI 1 (20>g[3 5"|-PL G(2)/PDGhiotin(3 4)10%
coated 1^0-, planar waveguide chip Non-specific binding (NSB)of C\5-RlgG is determined on the BSA-biotin-activated sur race
(light blue) and after functionali/ation with btteptavidm (deepblue) The specific binding (SB) after immobilization of capture
molecule, aRIgG, is indicated by the brown line Base line
stability of the assay buffer (green) as well as sell fluorescence of
streptavidm (pink) and aRIgG (black) are plotted m parallel
1>
4»
3
PBS nnse
— 2 Se-10 Vf RIgG-CyS
Strepta\ldin
— 2 5 e-10 VI RlgG-Cy*
—aRlgG-Ab-biotin
2Se~10V1RTgG-t\5
«Mum*
vo o\
T 1 1
rs) *r 00 s»H "^r^ r\| r-$ f*^ fv*5
I o i"0 ON
data points (tunc)
293
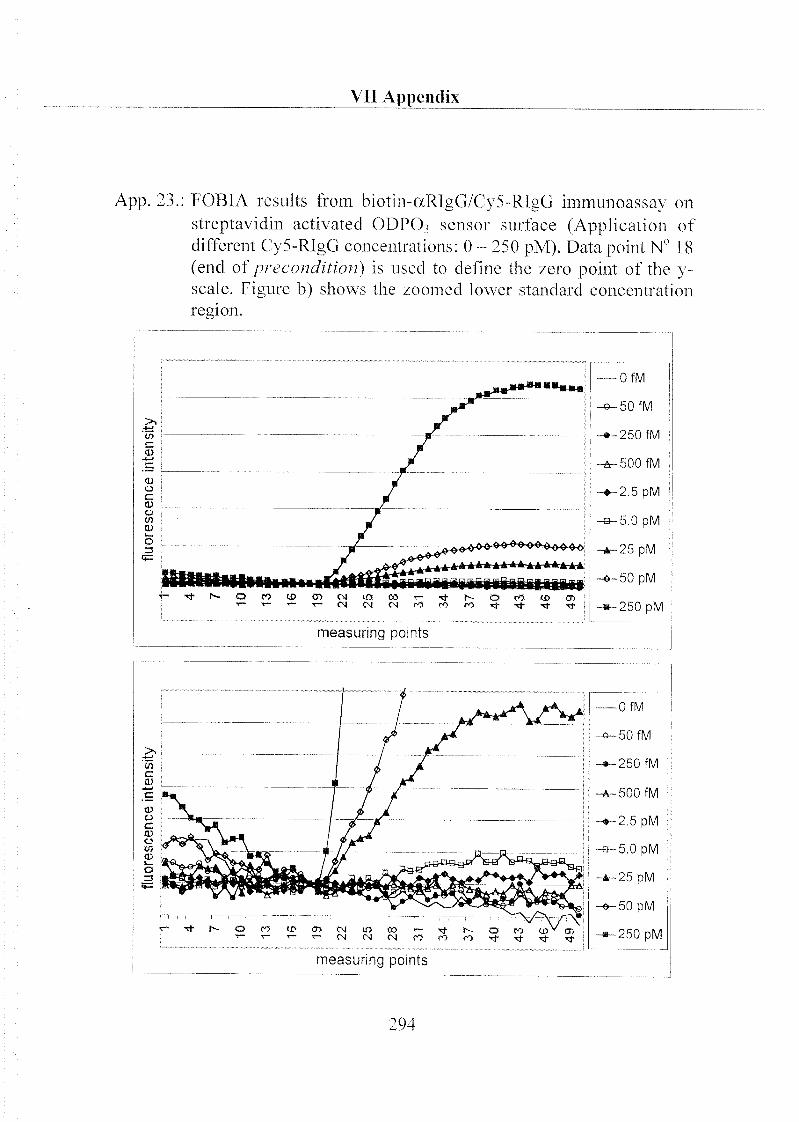
VII Appendix
App. 23.: FOBIA results from biotin-aRlgG/Cy5-RlgG immunoassay on
streptavidin activated ODPO, sensor surface (Application of
different Cy5-RIgG concentrations: 0 - 250 pM). Data point N° 18
(end of precondition) is used to define the zero point of the y-scale. Figure b) shows the zoomed lower standard concentration
region.
littmtlftMliiM»Milr~ Tf !**<
measuring points
measuring points
294
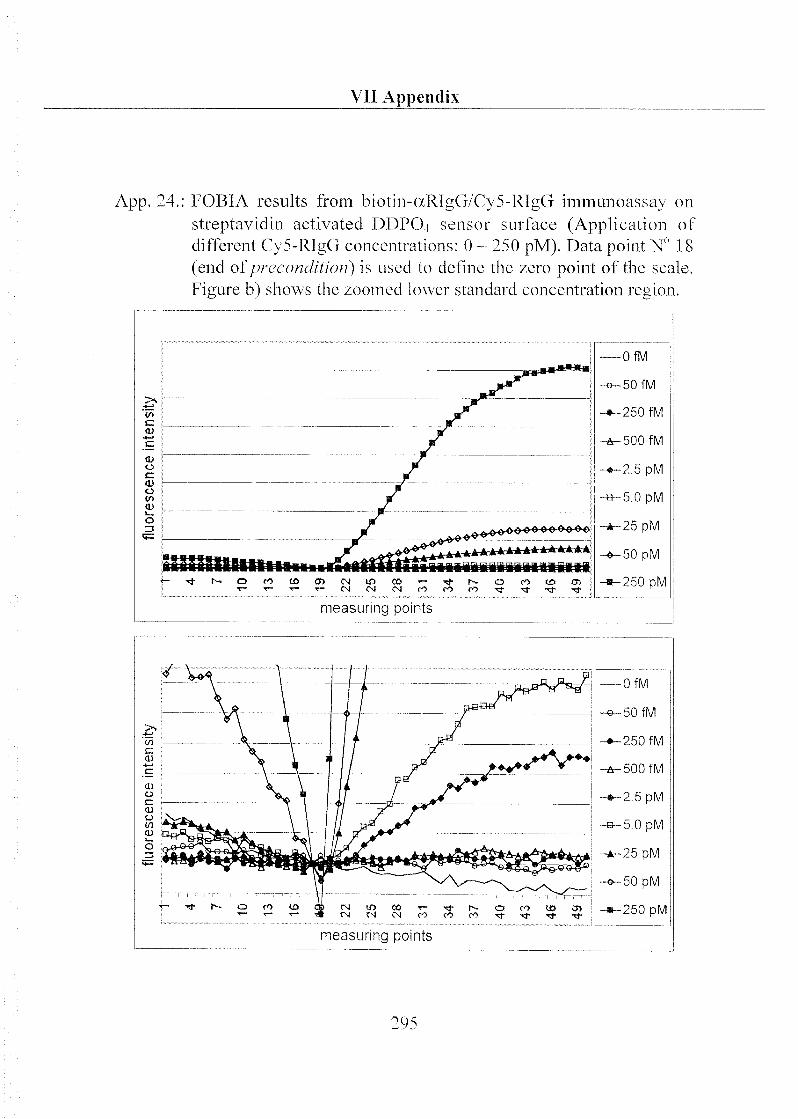
VTI Appendix
App. 24.: FOBIA results from biotin-«RlgG/Cy5-RIgG immunoassay on
streptavidin activated DDPOt. sensor surface (Application of
different Cy5-RIgG concentrations: 0 -- 250 pM). Data point N° 1 8
(end ofprecondition) is used to define the zero point of the scale.
Figure b) shows the zoomed lower standard concentration region.
c0)
mo
c
0)o
w
O)1_
o
KB M Ml Ml Ml HBLiim m ^m
iiiiiiliititm IMHMMMËWMMJiMMllHHH
-r-T-T-c^tMC^rOOcOo fO CO cr>
<t Tj- -«fr •*
measuring points
OfM
50 fM
250 fM
500 fM
-«-2 5 pM
-a-5 0 pM
-*-25pM
--50 pM
^s-250pM
__0fM
-©-50 fM
-•-250 fM
-*-500fM
~*-2 5pM
-&~5 0 pM
~*-25pM
50 pM
250 pM
measuring points
295
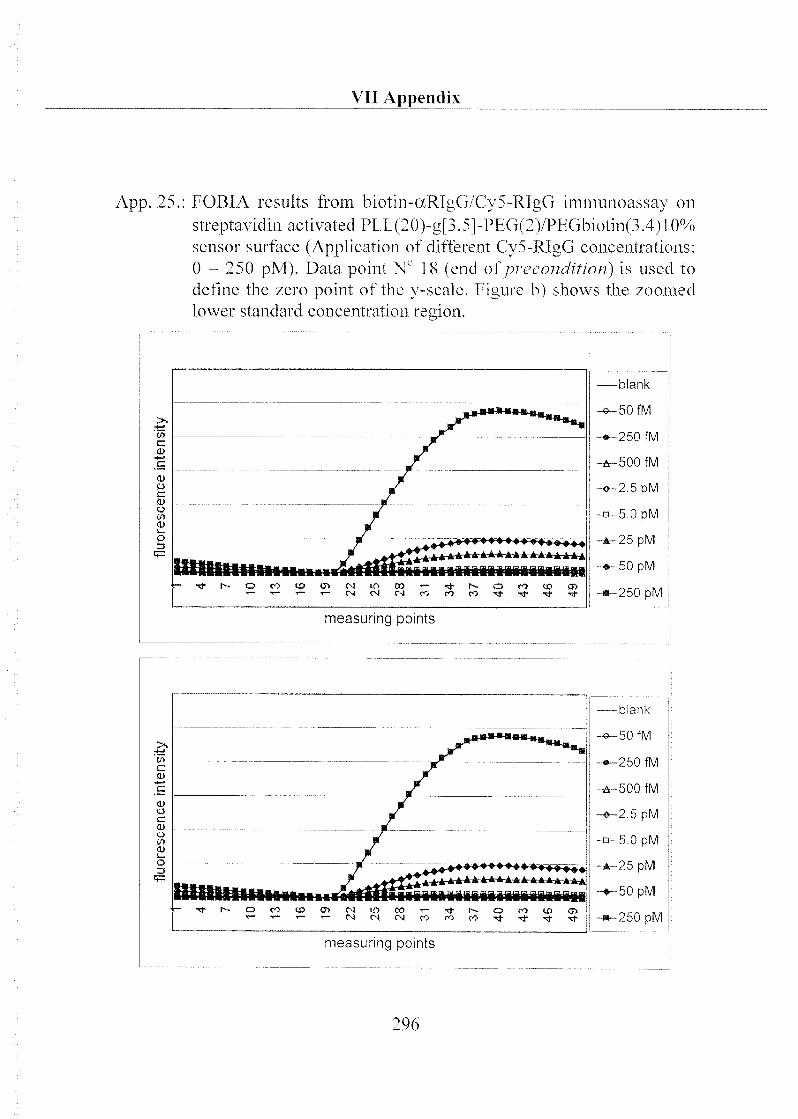
VU Appendix
App. 25.: FOBIA results from biotin-cxRïgG/C\5-RlgG immunoassay on
streptavidin activated PI I (20)-g[3.5]-PFG(2)/PEGbiotin(3.4) 10%
sensor surface (Application of different C}5-RIgG concentrations:
0 - 250 pM). Data point N° 18 (end of precondition) is used to
define the zero point of the \-scale. Figure b) shows the zoomed
lower standard concentration reeion.
MlllllMIllllUlllllMMMft,_ ^j. fOt0CDCNLDCOT-^r».OCOtOO>
'r-T-T-tNCNICMrOfOMTt'tJ-TfTt
measuring points
-blank
-50 fM
-250 fM
-500fM
-2 5pM
-5 0pM
-25 pM
-50 pM
-250 pM
c
o
c<uÜCDCDL-
o
üfil§ttttMlfl liai rillMllMiiilillllMllIMiMaCOtDO>CMlDCOT-Tj-h»-OCOC£>0>
measuring points
blank
50 fM
250 fM
500 fM
2 5pM
5 0pM
25 pM
50 pM
250 pM
296

VII Appendix
4.2Immunoassay performance in serum samples
App. 26: Dose-response curve for a RIgG immunoassay on BSA-biotin -
streptavidin activated ODPO4 surface. The different serum concentrations
reflect the amount of newborn calf serum the RIgG dilutions, followed by1:1 mixture with Cy5-ocRIgG-tracer solution of each sample.
0 10 20 30 40 50 60
concentration (pM)
297

Curriculum Vitae
Curriculum Vitae
Personal
Adress: Rolfllofcr
Fleideweg 40
CH-2503 Biel
>1.:-M1 365 39 22
Date of birth:
Martial status:
Children:
Nationality:
Languages:
Februan 3. 1961
married
Nathalie, 20.12.1990
Patrick, 14.4.1994
Swiss, Citizen of Langnau i.F.
Native language is German.
Fluent Fnglish and French and basic knowledge of Italian.
298
Curriculum Vitae
Education and Working Experience
2000 PhD.
Department of Materials, Swiss Federal Institute of Technology, ETH
Zürich, Switzerland. Thesis on 'Surface Modification for Optical
Biosensor Applications'.
1998-2000 PhD. student
Department of Materials, Swiss Federal Institute of Technology, ETH
Zürich, Switzerland / Novartis Pharma AG, CH-Basel
1997 Diploma in Chemistry
Institute of Chemistry, University of Fribourg, CH-Fribourg.
Diploma theses: Inorg. Chem.: 'Synthese neuer Pt(II)-Komplexe mit
duralen Bipyridinderivaten als Liganden.
Org. Chem.: "Isolation und Derivatisierung des Chloro-
phyll-Kataboliten von Cercidiphyllum japonicuin'
1995 Teacher at the professional school
Introduction course for laboratory assistants, CII-Bern.
1993 -1997 Student
Institute of Chemistry, University of Fribourg, CH-Fribourg.
1987-1993 Head of the group
Toxicological Laboratory of the Institute for Forensic Medicine,
University ofBern, CH-Bern.
1982 - 1987 Laboratory assistant
Toxicological Laboratory of the Institute for Forensic Medicine,
University of Bern, CH-Bern.
1980 - 1982 Laboratory assistant
Med. Chem. Laboratory. CH-Biel.
1977 - 1980 Apprenticeship for laboratory assistants
Gebr. Schnyder AG, CH-Biel.
299
Curriculum Vitae
Publications and Patents
2000 Multifunctional Calionic ami Anionic Polymeric Coalings for Surfaces in
Analytic and Sensor Devices
Patent submitted, USA, 2000.
2000 Verfahren zur Abscheidung von Monoschichten aus Organophosphaten und/
oder -phosphonaten und deren Verwendung ah Teil von Sensorplattformen,
Implantaten und medizinischen Hilfsgcraten
Patent submitted. OH, 2000.
2000 Alkyl Phosphate Monolayers, Self, i s scmbled from Aqueous Solution onto Metal
Oxide Surfaces
R.Hofer, M.l cvtor. N.D.Spencer langmuir in preparation.
2000 Self-Assembly of Organic Phosphoric and Phosphonic. \cids onto Tantalum
Oxide and Titanium Oxide Surfaces
R.Hofer, M. 1 extor, N.D.Spencer. E.Jaehne. H.-J,Adler Langmuir in preparation.
2000 Biotin-derivalised poly(L-lysine) graftedpoh (ethylene glycol) as a model inter¬
face for the specific récognition of strcptavidin via planar optical waveguides
J.Vörös, R.Hofer, N.P.Huang. M.Textor. N.D.Spencer Biomaterials in
preparation.
2000 Imaging ofSurface Heterogeneity In the \ficrodroplet Condensation Technique
R.Hofer, M.Textor. N.D.Spencer langmuir submitted, 2000.
2000 Poly(L-lysine)-g-poly(ethylcne glycol) layers on Metal Oxide Surfaces- Surface-
analytical C 'haraclcrization and Resistance to Serum and Fibrinogen Adsorption
N.P.Huang, R.Michel. J.Vörös. M.l extor. R.Hofer, A.Rossi, D.L.Elbert.
J.A.Hubbell. N.D.Spencer langmuir in press. 2000.
2000 The limpact of Xanomter-Scale Roughness on Contact Angle Hysteresis and
Globulin Adsorption
B.Müllcr, M.Riedel. RAlichol. S.DePaul, R.Hofer. D.Heger. D.Grützmacher./
Vac. Sei. Technol. submitted. 2000.
300

Curriculum Vitae
2000 Poly(L-lysine)-g-Poly(ethylene glycol) Layers on Metal Oxide Surfaces:
Attachment Mechanism and Effects ofPolymer Architecture on Resistance to
Protein Adsorption
G.L.Kenausis, J.Vörös, D.L.Elbert, N.Huang, R.Hofer, L.Ruiz-Taylor,
M.Textor, J. A.Hubbell, N.D.Spencer J, Phys. Chem. 5 2000,104, 3298.
2000 Structural Chemistry ofSelf-Assembled Monolayers ofOctadecylphosphoric
Acid on Tantalum Oxide Surfaces
M.Textor, L.Ruiz, R.Hofer, A.Rossi, K.Feldman, G.Hähner, N.D.Spencer
Langmuir 2000, 16, 3257.
1999 Highly Oriented, Self-Assembled Alkanephosphate Monolayers on Tantalum(V)
Oxide Surfaces
D.Brovelli, G.Hähner, L.Ruiz, R.Hofer, G.Kraus, A.Waldner, J.Schlösser,
P.Oroszlan, M.Ehrat, N.D.Spencer Langmuir 1999, 15, 4324.
1993 Bestimmung von Morphin in Spermafhissigkeit
R.Hofer Toxichem und Krimtech 1993, 4, 121.
1993 Glaskörperflüssigkeit als Untersuchungsmaterial
R.Hofer Toxichem und Krimtech 1993, 4, 116.
1993 Immunochemisehe Tests (EMIT) als Teil eines Screeningverfahrens
R.Hofer Toxichem und Krimtech 1993, 3, 84.
301
Acknowledgements
Acknowledgements
Many people have contributed, through their knowledge and friendship,to make my time at the ETH-Zürich and Novartis Pharma AG Basel such a
fruitful period of my life. In particular, T would like to express my thanks to
Prof. Dr. N.D. Spencer, ETH Zürich, for providing the opportunity to
do this interesting work at the Laboratory for Surface Science and
Technology, and for his support and confidence;
Dr. M. Textor, ETH Zürich, my advisor, for stimulating discussion,
permanent support and continued advice, for the familial atmosphere, for
performing ToF-SlMS measurements, and for teaching me thoroughness in
scientific thinking;
Dr. M. Ehrat, Zeptosens AG, Witterswil, for making it possible to have
access to high-performance apparatus and for supporting me through the
whole thesis;
People from Laboratory for Surface Science and Technology (LSST),ETHZ for the pleasant cooperation, especially V. Frauchiger for his help in
computer-trouble-shooting;
People of Zeptosens AG, Witterswil, especially Dipl. Ing. Chem. E.
Schürmann for helping me in the immunoassay measurements and
evaluations, Dr. A. Abel and Dr. M. Pawlak for their interesting inputs and
theoretical support, and Dr. G. Duveneck for helping in writing a patent;
Dr. L. Ruiz-Taylor, ETH Zürich, supervisor for the first year of the
thesis, for her help and introduction in the use of X-ray pliotoelectron
spectroscopy;
Dr. G. Kenausis and Dr. J. Vörös, LSST, Schlieren for executingOWLS measurements;
302
Acknowledgements
Dr. G. Hähner, Dr. D. Brovelli and I. Pfund-Klingenfuss for performingNEXAFS analyses;
Prof. A. Rossi, ETHZ/LSST, for supporting me in XPS measurements
and for the work-out concerning the application of the 3-layer model;
Dr. S. De Paul, ETHZ/LSST, for the careful proof reedings of the
dissertation;
F. Bangerter, ETHZ, for measuring NMR spectra;
People from Novartis Pharma AG, Basel, especially Dr. D. Neuschäfer,Dr. W. Budach, Dr. G. Kraus and Dr. P. Oroszlan, for introducing me in the
theme of immunoassays and the planar-waveguide technique;
Dr. D. Anselmetti, Novartis Pharma AG, Basel, and K. Feldman, ETH
Zürich, for AFM measurements;
Dr. E. Jahne and Prof. Dr. H.-J. Adler, Institut fur Makromolekulare
Chemie und Textilchemie, Dresden, for the synthesis of alkyl phosph(on)atederivatives;
Dr. Hendrich, University of Würzburg, for executing toxicology tests
on alkyl phosph(on)ate SAMs;
The Commission for Technology and Innovation (CT1) and the
MedTech Initiative for financial support.
Zürich, 2000
303


