Embed Size (px)
Citation preview
© 2021 International Institute for Sustainable Development | IISD.org /gsi
Supporting Marine Fishing Sustainably: A review of central and state government support for marine fisheries in India
GSI REPORT
IISD.org/gsi ii
Supporting Marine Fishing Sustainably: A review of central and state government support for marine fisheries in India
© 2021 International Institute for Sustainable Development Published by the International Institute for Sustainable Development
This publication is licensed under a Creative Commons Attribution-NonCommercial-ShareAlike 4.0 International License.
International Institute for Sustainable Development
The International Institute for Sustainable Development (IISD) is an award-winning independent think tank working to accelerate solutions for a stable climate, sustainable resource management, and fair economies. Our work inspires better decisions and sparks meaningful action to help people and the planet thrive. We shine a light on what can be achieved when governments, businesses, non-profits, and communities come together. IISD’s staff of more than 120 people, plus over 150 associates and consultants, come from across the globe and from many disciplines. With offices in Winnipeg, Geneva, Ottawa, and Toronto, our work affects lives in nearly 100 countries.
IISD is a registered charitable organization in Canada and has 501(c)(3) status in the United States. IISD receives core operating support from the Province of Manitoba and project funding from governments inside and outside Canada, United Nations agencies, foundations, the private sector, and individuals.
Global Subsidies Initiative
The IISD Global Subsidies Initiative (GSI) supports international processes, national governments and civil society organizations to align subsidies with sustainable development. GSI does this by promoting transparency on the nature and size of subsidies; evaluating the economic, social and environmental impacts of subsidies; and, where necessary, advising on how inefficient and wasteful subsidies can best be reformed. GSI is headquartered in Geneva, Switzerland, and works with partners located around the world. Its principal funders have included the governments of Denmark, Finland, New Zealand, Norway, Sweden, Switzerland and the United Kingdom, as well as the KR Foundation.
Supporting Marine Fishing Sustainably: A review of central and state government support for marine fisheries in India
October 2021
Written by Shruti Sharma, Christophe Bellmann, Christopher Beaton, and Aditya Pant.
Cover photo: Manini Bansal
Head Office
111 Lombard Avenue, Suite 325Winnipeg, ManitobaCanada R3B 0T4
Tel: +1 (204) 958-7700Website: www.iisd.orgTwitter: @IISD_news
Global Subsidies Initiative
International Environment House 2, 7–9 chemin de Balexert 1219 Châtelaine Geneva, Switzerland Canada R3B 0T4
Tel: +1 (204) 958-7700 Website: www.iisd.org/gsi Twitter: @globalsubsidies
IISD.org/gsi iii
Supporting Marine Fishing Sustainably: A review of central and state government support for marine fisheries in India
Acknowledgements
The authors would like to thank a number of individuals who contributed to this project, including Alice Tipping and Tristan Irschlinger, International Institute for Sustainable Development; Adithya Pillai and Marianne Manuel, Dakshin Foundation; Ramachandra Bhatta, Former Professor of Fisheries Economics and ICAR-Emeritus Professor College of Fisheries, Mangalore; and M. G. Deepika, Associate Professor, Department of Management, Amrita University, Bangalore.
The authors of this update would like to thank the following individuals and institutions for the valuable comments and recommendations that they provided as peer reviewers:
• Mahadev Bhat, Professor of Natural Resource Economics, Florida International University, Miami, Florida
• Pandian Krishnan, Principal Scientist, National Academy of Agricultural Research Management, ICAR-NAARM, Hyderabad
• C. K. Murthy, Vice-President, Society for Indian Fisheries and Aquaculture
• John Kurien, ICSF Trustee and Hon. Fellow, WorldFish
• Venkatesh Salagramma, Fisheries scholar
• Amalendu Jyotishi, Fisheries economist, Azim Premji University
• Siddharth Chakravarthy, The Research Collective
• Claire Delpeuch, Haengnok Oh, Fabiana Cerasa, Will Symes, and Kazuhiro Nomoto, Organisation for Economic Co-operation and Development (OECD)
The report also benefited from the guidance of a number of fisheries experts who participated in workshops organized as a part of this project. The authors are grateful to government officials, academic experts, and fisher’s unions who participated in these workshops and shared feedback.
This report was funded with UK aid from the UK government, and we are thankful for this support.
The opinions expressed and the arguments employed in this paper do not necessarily reflect those of the peer reviewers and funders, nor should they be attributed to them.
This report is an independent analysis and has not been commissioned or requested by the Government of India.
IISD.org/gsi iv
Supporting Marine Fishing Sustainably: A review of central and state government support for marine fisheries in India
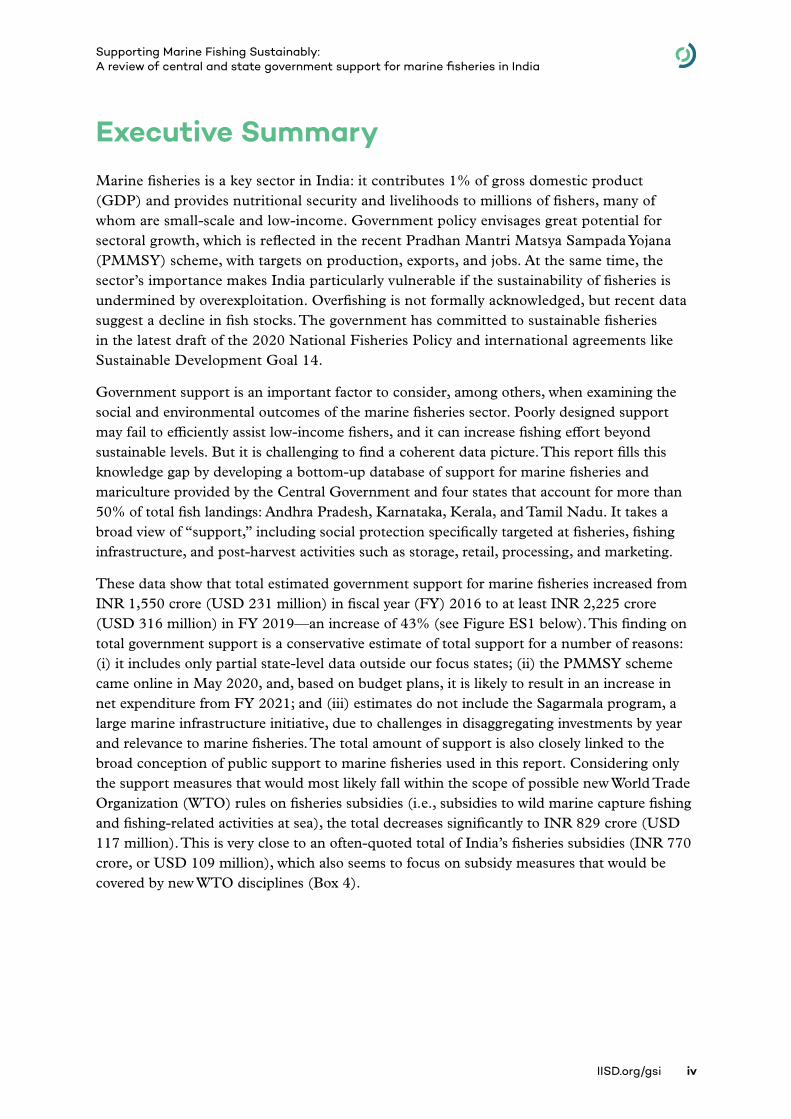
Executive SummaryMarine fisheries is a key sector in India: it contributes 1% of gross domestic product (GDP) and provides nutritional security and livelihoods to millions of fishers, many of whom are small-scale and low-income. Government policy envisages great potential for sectoral growth, which is reflected in the recent Pradhan Mantri Matsya Sampada Yojana (PMMSY) scheme, with targets on production, exports, and jobs. At the same time, the sector’s importance makes India particularly vulnerable if the sustainability of fisheries is undermined by overexploitation. Overfishing is not formally acknowledged, but recent data suggest a decline in fish stocks. The government has committed to sustainable fisheries in the latest draft of the 2020 National Fisheries Policy and international agreements like Sustainable Development Goal 14.
Government support is an important factor to consider, among others, when examining the social and environmental outcomes of the marine fisheries sector. Poorly designed support may fail to efficiently assist low-income fishers, and it can increase fishing effort beyond sustainable levels. But it is challenging to find a coherent data picture. This report fills this knowledge gap by developing a bottom-up database of support for marine fisheries and mariculture provided by the Central Government and four states that account for more than 50% of total fish landings: Andhra Pradesh, Karnataka, Kerala, and Tamil Nadu. It takes a broad view of “support,” including social protection specifically targeted at fisheries, fishing infrastructure, and post-harvest activities such as storage, retail, processing, and marketing.
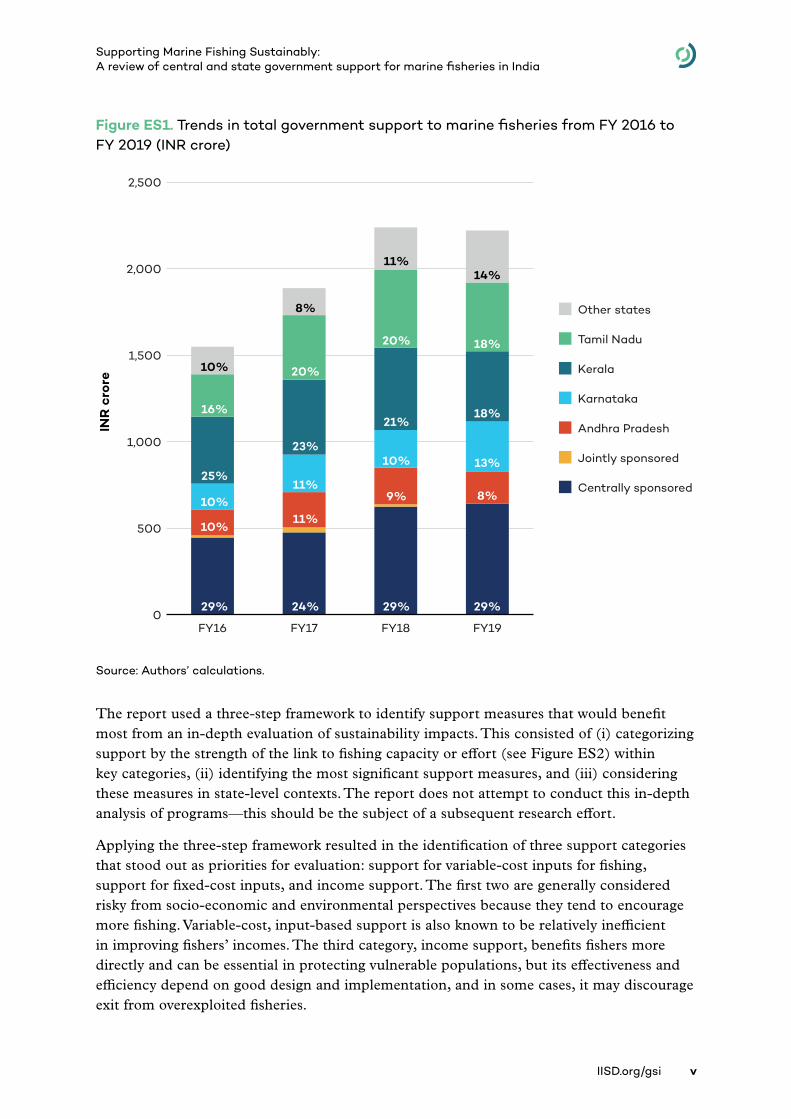
These data show that total estimated government support for marine fisheries increased from INR 1,550 crore (USD 231 million) in fiscal year (FY) 2016 to at least INR 2,225 crore (USD 316 million) in FY 2019—an increase of 43% (see Figure ES1 below). This finding on total government support is a conservative estimate of total support for a number of reasons: (i) it includes only partial state-level data outside our focus states; (ii) the PMMSY scheme came online in May 2020, and, based on budget plans, it is likely to result in an increase in net expenditure from FY 2021; and (iii) estimates do not include the Sagarmala program, a large marine infrastructure initiative, due to challenges in disaggregating investments by year and relevance to marine fisheries. The total amount of support is also closely linked to the broad conception of public support to marine fisheries used in this report. Considering only the support measures that would most likely fall within the scope of possible new World Trade Organization (WTO) rules on fisheries subsidies (i.e., subsidies to wild marine capture fishing and fishing-related activities at sea), the total decreases significantly to INR 829 crore (USD 117 million). This is very close to an often-quoted total of India’s fisheries subsidies (INR 770 crore, or USD 109 million), which also seems to focus on subsidy measures that would be covered by new WTO disciplines (Box 4).
IISD.org/gsi v
Supporting Marine Fishing Sustainably: A review of central and state government support for marine fisheries in India
Figure ES1. Trends in total government support to marine fisheries from FY 2016 to FY 2019 (INR crore)
Source: Authors’ calculations.
The report used a three-step framework to identify support measures that would benefit most from an in-depth evaluation of sustainability impacts. This consisted of (i) categorizing support by the strength of the link to fishing capacity or effort (see Figure ES2) within key categories, (ii) identifying the most significant support measures, and (iii) considering these measures in state-level contexts. The report does not attempt to conduct this in-depth analysis of programs—this should be the subject of a subsequent research effort.
Applying the three-step framework resulted in the identification of three support categories that stood out as priorities for evaluation: support for variable-cost inputs for fishing, support for fixed-cost inputs, and income support. The first two are generally considered risky from socio-economic and environmental perspectives because they tend to encourage more fishing. Variable-cost, input-based support is also known to be relatively inefficient in improving fishers’ incomes. The third category, income support, benefits fishers more directly and can be essential in protecting vulnerable populations, but its effectiveness and efficiency depend on good design and implementation, and in some cases, it may discourage exit from overexploited fisheries.
0
500
1,000
1,500
2,000
2,500
FY16 FY17 FY18 FY19
INR
cro
re
Centrally sponsored
Jointly sponsored
Andhra Pradesh
Karnataka
Kerala
Tamil Nadu
Other states
29% 24% 29% 29%
10%11%
9% 8%10%11%
10% 13%25%
23%
21%18%16%
20%
20% 18%
10%
8%
11%14%
IISD.org/gsi vi
Supporting Marine Fishing Sustainably: A review of central and state government support for marine fisheries in India
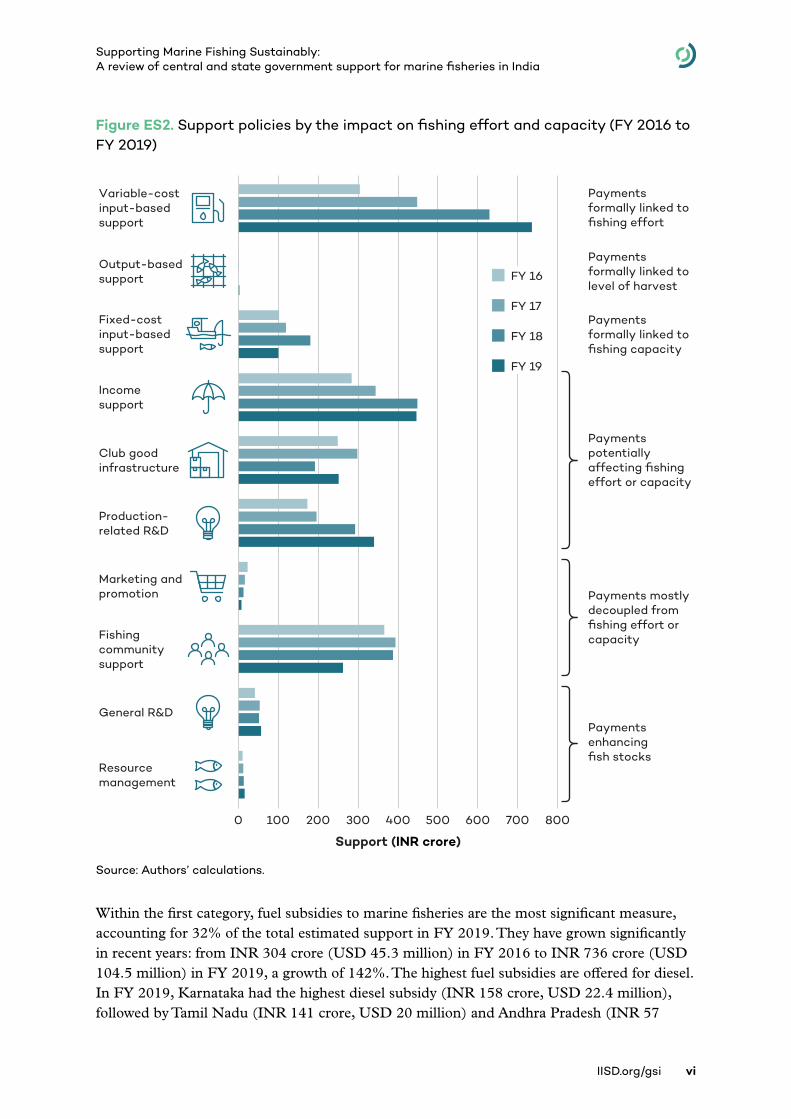
Figure ES2. Support policies by the impact on fishing effort and capacity (FY 2016 to FY 2019)
Source: Authors’ calculations.
Within the first category, fuel subsidies to marine fisheries are the most significant measure, accounting for 32% of the total estimated support in FY 2019. They have grown significantly in recent years: from INR 304 crore (USD 45.3 million) in FY 2016 to INR 736 crore (USD 104.5 million) in FY 2019, a growth of 142%. The highest fuel subsidies are offered for diesel. In FY 2019, Karnataka had the highest diesel subsidy (INR 158 crore, USD 22.4 million), followed by Tamil Nadu (INR 141 crore, USD 20 million) and Andhra Pradesh (INR 57
Payments formally linked to fishing effort
Payments formally linked to level of harvest
Payments formally linked to fishing capacity
Payments potentially affecting fishing effort or capacity
Payments mostly decoupled from fishing effort or capacity
Payments enhancing fish stocks
Fishing community support
Marketing and promotion
Income support
Fixed-cost input-based support
General R&D
Production- related R&D
Resource management
Output-based support
Variable-cost input-based support
Club good infrastructure
Support (INR crore)
0 100 200 300 400 700600500 800
FY 16
FY 17
FY 18
FY 19
IISD.org/gsi vii
Supporting Marine Fishing Sustainably: A review of central and state government support for marine fisheries in India
crore, USD 8.1 million). State-level data suggests they predominantly benefit better-off fishers, and experiences with fuel subsidy reform suggest that subsidies can be better targeted to poor fishers. No specific information about the impact of fuel subsidies on the sustainability of fisheries was identified.
Within the second category, the promotion of deep-sea fishing, measures to promote mariculture, and vessel modernization stood out as the most significant. These measures are reflected in ongoing national strategies on fisheries development. Support levels vary significantly by year, with the highest values from FY 2016 to FY 2019 being seen in Tamil Nadu and Maharashtra. Little state-level data were identified on how they benefit low-income fishers or how they are affecting fishing effort and fish stocks.
In the third category, the most important support was relief payments and savings schemes during the fishing ban period of 3 months and insurance to help cover risk from accidents. Together, these increased by 57%, from INR 284 crore (USD 42 million) in FY 2016 to INR 446 crore (USD 63 million) in FY 2019. Since FY 2016, Tamil Nadu has offered the highest ban period assistance, followed by Andhra Pradesh. Of the four focus states, only Kerala gave significant support to pensions and debt relief. State-level data suggests that not all fishers benefit from these measures, and marine fishers have additional development needs.
RecommendationsThis report makes the following recommendations:
1. Evaluate the social and environmental impacts of key support measures
All governments should periodically identify major schemes that are most in need of evaluation to ensure they are aligned with national objectives. By mapping support at a national level and in four states, this report identifies specific measures that are a high priority for evaluation in India to ensure that support is achieving its desired social impacts without undermining the environmental viability of the sector. These measures have been selected based on an analysis of the financial value of measures and the typical impacts that can be associated with certain categories of policy measures. Evaluations themselves should, of course, consider schemes holistically within their broader contexts. In case evaluations already exist for some of these support schemes but are kept for government agencies’ internal use only, they should be made publicly available. The recommended schemes for evaluation are as follows:
1. Diesel and kerosene subsidies: State fisheries departments are recommended to investigate the relationship between diesel and kerosene support and the risk of overfishing, and how fuel subsidies are distributed across different types of fishers and income groups. A comparative analysis could investigate the relative social impacts of expenditure on fuel versus increased support for incomes or communities.
2. Support for deep-sea fishing, mariculture, and vessel modernization: The Ministry of Fisheries, Animal Husbandry and Dairying and state fisheries departments are recommended to evaluate the social and environmental impacts of these measures,
IISD.org/gsi viii
Supporting Marine Fishing Sustainably: A review of central and state government support for marine fisheries in India
given their importance in national fisheries strategies, broad relevance across many states, and direct link to fishing capacity.
3. Income support: This report finds that much income support falls into a limited number of categories, and very different approaches are taken by different states. State fisheries departments are recommended to conduct comparisons with other states and to evaluate the effectiveness of their schemes in addressing fishers’ needs. In particular, it is recommended that evaluations in Karnataka, Kerala, and Tamil Nadu consider whether more diverse approaches could help address traditional fishers’ wider needs. Evaluation should also consider how income support can best align with the long-term sustainability of fisheries.
4. Improving fisheries management: This report did not identify a fish stock rebuilding or enhancement program. Only in FY 2017 did it find low levels of support for conservation and awareness, and this was limited to two states. The National Fisheries Policy 2020 calls for the establishment of sustainable fisheries management plans, but the PMMSY has yet to allocate funds to follow up on this vision. Ensuring robust fish stocks is essential for food security and the economic stability of fisheries.
2. Enable better transparency and reporting
In its attempt to gather data on government support for marine fishing, this report reveals several data limitations. Data are scattered between different levels of government institutions (central, state, district) and various government institutions (National Fisheries Development Board, Marine Products Export Development Authority, and Central Marine Fisheries Research Institute). Reporting formats and definitions vary with sources. It is recommended that the Ministry of Fisheries, Animal Husbandry and Dairying explore how data reporting could be improved, thereby enabling more informed and effective policy-making. This should ideally include disaggregating support data by type of fishery, stage in the value chain, and primary beneficiary.
IISD.org/gsi ix
Supporting Marine Fishing Sustainably: A review of central and state government support for marine fisheries in India
Table of Contents
1.0 Introduction .................................................................................................................................................................... 1
2.0 Context ............................................................................................................................................................................ 2
2.1 Social Context: Poverty and vulnerability of fisherfolk ................................................................................ 3
2.2 Economic Context: Production and trade ...............................................................................................................4
2.3 Sustainability Context: Pressure on fish stocks ................................................................................................. 5
3.0 Approach and Scope .................................................................................................................................................8
4.0 Key Findings: Support for marine fisheries ................................................................................................. 10
4.1 Central Government Support ........................................................................................................................................12
4.2 State Government Support ............................................................................................................................................ 16
4.3 Flow of Funds for Supporting Marine Fisheries ............................................................................................... 18
5.0 Is India’s Support Aligned With its Objectives? ....................................................................................... 20
5.1 Step 1: Prioritizing support measures by likely impact ...............................................................................21
5.2 Step 2: Identifying the largest support measures in priority categories ..................................... 27
5.3 Step 3: Reviewing shortlisted policies in context ..........................................................................................36
6.0 Conclusion and Recommendations ................................................................................................................. 43
6.1 Recommendations ...................................................................................................................................................................45
References ............................................................................................................................................................................47
Annex A. Details on Support Methodology and Calculations .....................................................................52
Annex B. National and State Schemes Based on the Type of Support .................................................61
Annex C. Pradhan Mantri Matsya Sampada Yojana and Sagarmala Schemes ................................ 69
Annex D. How Do These Estimates Compare With Other Studies? .........................................................75
IISD.org/gsi x
Supporting Marine Fishing Sustainably: A review of central and state government support for marine fisheries in India
List of Figures
Figure ES1. Trends in total government support to marine fisheries from FY 2016 to FY 2019 (INR crore) ............................................................................................................................................................................................................v
Figure ES2. Support policies by the impact on fishing effort and capacity (FY 2016 to FY 2019) .................................................................................................................................................................................vi
Figure 1. Major policy objectives relevant to marine fisheries in India .............................................................. 2
Figure 2. Plateauing of marine catch in India ....................................................................................................................... 5
Figure 3. Classification of fisheries support based on the type of support .................................................9
Figure 4. Total government support to marine fisheries, FY 2016 to FY 2019 (INR crore) ...............11
Figure 5. Breakdown of centrally sponsored schemes (%) .......................................................................................13
Figure 6. Treemap: Major central contributions to state-level schemes in FY2019 ..............................15
Figure 7. State-wise key schemes in FY 2019 ...................................................................................................................... 17
Figure 8. Flow of support for marine fisheries in India ..................................................................................................19
Figure 9. A three-step prioritization framework for the evaluation of fisheries support ................20
Figure 10. Prioritizing measures according to impacts on fishing effort and capacity ................... 22
Figure 11. Support by the impact on fishing effort and capacity from FY 2016 to FY 2019 ........ 23
Figure 12. Centre and state share of support in FY 2019 .......................................................................................... 25
Figure 13. Variable-cost, input-based subsidies by states from FY 2016 to FY 2019 .......................28
Figure 14. Composition of fishing vessels in different states in 2019 ............................................................ 29
Figure 15. All fixed cost, input-based support by states (FY 2016 to FY 2019) ...................................... 32
Figure 16. All income support by states (FY 2016 to FY 2019) .............................................................................34
Figure 17. Support by type of beneficiary in Andhra Pradesh in FY 2019 .....................................................38
Figure 18. Support by type of beneficiary in Karnataka in FY 2019 .................................................................39
Figure 19. Support by type of beneficiary in Kerala in FY 2019 ...........................................................................40
Figure 20. Support by type of beneficiary in Tamil Nadu in FY 2019 ...............................................................42
IISD.org/gsi xi
Supporting Marine Fishing Sustainably: A review of central and state government support for marine fisheries in India
List of Tables
Table 1. Support intensity (INR) per fisher in FY 2019 for four focus states ..............................................36
Table A1. Classifications based on the mechanism through which subsidies are provided .........54
Table A2. Classification based on the type of support ...............................................................................................54
Table A3. Names and definitions of labels ............................................................................................................................56
Table A4. Categories for prioritizing different types of fisheries support measures for evaluation ......................................................................................................................................................................................................... 59
Table B1. National and state schemes based on the type of support .............................................................61
Table C1. Pradhan Mantri Matsya Sampada Yojana (PMMSY) scheme-wise distribution..............69
Table C2. Sagarmala project-wise allocation (2015–2035) as on September 30, 2019 ....................71
Table D1. International estimates of support for marine fisheries in India ..................................................75
List of Boxes
Box 1. Mechanized, motorized, non-motorized, artisanal, and small scale ....................................................4
Box 2. Fishmeal ...............................................................................................................................................................................................6
Box 3. Declining fish stocks ...................................................................................................................................................................7
Box 4. Government support to marine fisheries versus subsidies for marine wild capture fishing at sea ..................................................................................................................................................................................................12
Box 5. Should support levels be increased for fisheries management? ......................................................... 27
Box 6. Gendered roles in fisheries ................................................................................................................................................. 35
Box A1. Definition of subsidies according to the ASCM ............................................................................................ 52
IISD.org/gsi xii
Supporting Marine Fishing Sustainably: A review of central and state government support for marine fisheries in India
Abbreviations and AcronymsASCM Agreement on Subsidies and Countervailing Measures
BPL Below Poverty Level
CMFRI Central Marine Fisheries Research Institute
DAHD Ministry of Fisheries, Animal Husbandry and Dairying
DBT Direct Benefit Transfer
DoF Department of Fisheries
EEZ Exclusive Economic Zone
FAO Food and Agricultural Organization of the United Nations
FDS fisheries development scheme
FRP fibre-reinforced plastic
FSI Fishery Survey of India
FY financial year
GDP gross domestic product
ICAR Indian Council of Agricultural Research
MFRA Marine Fishing Regulation Act
MPEDA Marine Products Export Development Authority
MSY Maximum Sustainable Yield
NETFISH Network for Fish Quality Management and Sustainable Fishing
NFDB National Fisheries Development Board
NFP National Fisheries Policy
OECD Organisation for Economic Co-operation and Development
PIB Press Information Bureau
PMMSY Pradhan Mantri Matsya Sampada Yojana
R&D research and development
UT Union Territory
WTO World Trade Organization
IISD.org/gsi 1
Supporting Marine Fishing Sustainably: A review of central and state government support for marine fisheries in India
1.0 IntroductionThe importance of sustainability for India’s fisheries is well recognized. India is the world’s sixth-largest marine fishing nation (Food and Agricultural Organization of the United Nations [FAO], 2020), and fisheries provide nutrition, employment, and income, particularly for vulnerable coastal communities. Fisheries contributed 1% of gross domestic product (GDP) in 2019 (Press Information Bureau [PIB], 2019) and play a significant role in development by employing 28 million people, most of whom are poor (PIB, 2020). The sector includes marine, aquaculture, and inland subsectors, with a marine fisheries potential of 5.3 million tonnes (24%), mostly in deeper waters, and inland and aquaculture potential of 17 million tonnes (76%) (National Fisheries Development Board [NFDB], 2020). The draft National Fisheries Policy (NFP) 2020 envisions “an ecologically healthy, economically viable and socially inclusive fisheries sector” (NFDB, 2020). Internationally, India has agreed to Sustainable Development Goal 14, “conserve and sustainably use the oceans, seas and marine resources for sustainable development” (United Nations General Assembly, 2015).
One core theme for the sustainable management of fisheries is the role played by government support. If support is not well designed, it can fail to achieve lasting social benefits in an efficient way, particularly if it undermines the fish stocks upon which livelihoods depend. Poorly designed support can deteriorate the conditions of both fishers and the environment by encouraging overcapacity and overfishing (Organisation for Economic Co-operation and Development [OECD], 2020). If it is well designed, support can address market failures and advance critical public policy objectives, promoting better social and economic outcomes while investing in environmental resilience. This is recognized in national policy direction as well. An initial draft of NFP 2020 stated an intention to periodically review “interventions in terms of incentives and support measures” to assess policy impacts (NFDB, 2020).
This report aims to contribute to national discussions on government support for fisheries. It is focused exclusively on marine fisheries (including mariculture) to keep its scope manageable. It is based on a bottom-up database of support measures—available for download online—covering policies issued by the Central Government and four states: Andhra Pradesh, Karnataka, Kerala, and Tamil Nadu. The data are all based on official government sources, though in some cases, we have quantified the value of policies independently. It takes a broad view across the full value chain and examines all forms of support, including measures such as social protection, fishing infrastructure, and spending to monitor and evaluate marine fisheries.
Given that accurate data is the foundation of good policy, the improved transparency provided by this report is intended to enable more informed decision-making on the best role for government support for marine fisheries, taking into account social, economic, and environmental objectives.
IISD.org/gsi 2
Supporting Marine Fishing Sustainably: A review of central and state government support for marine fisheries in India
2.0 Context Marine fisheries are a shared responsibility between state and central governments in India. The 13 maritime states and Union Territories (UTs) each have a state Department of Fisheries (DoF), and their regulations apply within territorial waters, up to 12 nautical miles (22 km) from shore. At the national level, the DoF—within the Ministry of Fisheries, Animal Husbandry, and Dairying—supports and coordinates in the spirit of cooperative federalism, as well as governing fisheries beyond territorial waters and within India’s exclusive economic zone (EEZ), between 12 and 200 nautical miles (22–370 km) from shore.
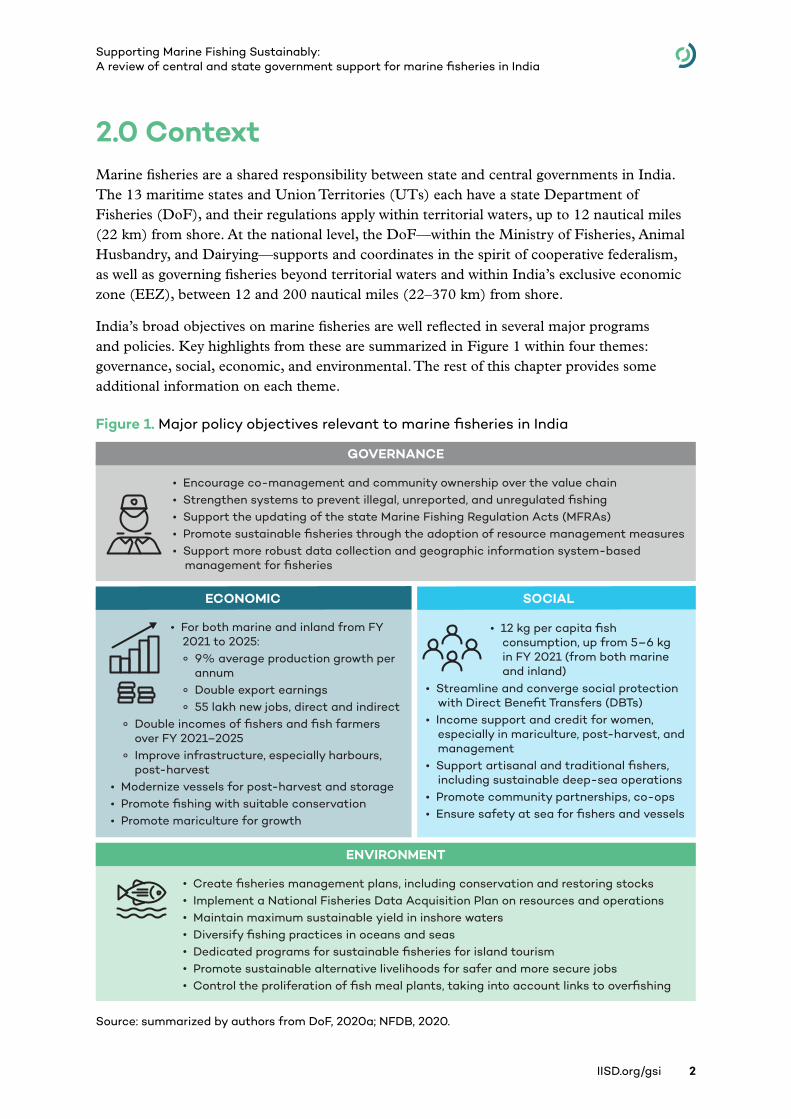
India’s broad objectives on marine fisheries are well reflected in several major programs and policies. Key highlights from these are summarized in Figure 1 within four themes: governance, social, economic, and environmental. The rest of this chapter provides some additional information on each theme.
Figure 1. Major policy objectives relevant to marine fisheries in India
Source: summarized by authors from DoF, 2020a; NFDB, 2020.
• Encourage co-management and community ownership over the value chain• Strengthen systems to prevent illegal, unreported, and unregulated fishing• Support the updating of the state Marine Fishing Regulation Acts (MFRAs) • Promote sustainable fisheries through the adoption of resource management measures• Support more robust data collection and geographic information system-based
management for fisheries
GOVERNANCE
• Create fisheries management plans, including conservation and restoring stocks• Implement a National Fisheries Data Acquisition Plan on resources and operations• Maintain maximum sustainable yield in inshore waters• Diversify fishing practices in oceans and seas • Dedicated programs for sustainable fisheries for island tourism• Promote sustainable alternative livelihoods for safer and more secure jobs• Control the proliferation of fish meal plants, taking into account links to overfishing
ENVIRONMENT
• For both marine and inland from FY 2021 to 2025:
° 9% average production growth per annum
° Double export earnings
° 55 lakh new jobs, direct and indirect
ECONOMIC
• 12 kg per capita fish consumption, up from 5–6 kg in FY 2021 (from both marine and inland)
SOCIAL
• Streamline and converge social protection with Direct Benefit Transfers (DBTs)
• Income support and credit for women, especially in mariculture, post-harvest, and management
• Support artisanal and traditional fishers, including sustainable deep-sea operations
• Promote community partnerships, co-ops• Ensure safety at sea for fishers and vessels
° Double incomes of fishers and fish farmers over FY 2021–2025
° Improve infrastructure, especially harbours, post-harvest
• Modernize vessels for post-harvest and storage• Promote fishing with suitable conservation• Promote mariculture for growth
IISD.org/gsi 3
Supporting Marine Fishing Sustainably: A review of central and state government support for marine fisheries in India
2.1 Social Context: Poverty and vulnerability of fisherfolkThe improvement of socio-economic conditions is at the heart of India’s policies on marine fishing, as fishing communities are reported to be among the poorest in India. This context drives policy targets like doubling fishers’ incomes and improving social protection coverage and gender outcomes.
According to the Central Marine Fisheries Research Institute (CMFRI) Marine Census 2016 data, close to 67% of marine fisher households are Below Poverty Line (BPL), up from 61% in 2010 (CMFRI et al., 2012, 2020). Poverty among marine fishers is high compared to all households; national data from 2011 found that 30% of all households, not just marine, are BPL (NITI Aayog, 2018). In 2016, Andhra Pradesh had the largest share of BPL fisher households at 97%, followed by Tamil Nadu at 91%. In Karnataka, the share of BPL fisher households increased between 2010 and 2016, from 66% to 71% (CMFRI et al. 2012, 2020). Kerala had the lowest share of BPL fisher households at 59% (CMFRI et al., 2020).1 The monthly income of Indian fishers was estimated at around INR 4,387 (USD 67.37) in FY 2017 (DoF, 2018), compared to an average per capita income of INR 11,254 (USD 159.8) in FY 2020 (Ministry of Statistics, 2020).
NFP 2020 estimates that fisherfolk represented around 2% of the total national population in 2016, with marine fisherfolk making up 13.5% and inland fisherfolk 86.5% (NFDB, 2020). This could be an underestimate, as government data do not include migrant workers (CMFRI, 2020). In absolute terms, the total marine fisherfolk population was around 3.7 million, including household members not actively involved in fishing. Of this, around 0.9 million were active marine fisherfolk and 0.5 million were engaged in allied activities. Active fishing is typically conducted by men, but women make up 69% of the allied activities workforce and an even larger share in marketing (NFDB, 2020). In 2010, 33% of active fishers were employed in the mechanized sector, 62% in motorized, and 5% in the non-motorized sector (see Box 1) (Department of Animal Husbandry & Dairying [DAHD], 2017).
1 Although indicative of high levels of poverty, BPL estimates made on the basis of ownership of BPL cards such as CMFRIs tend to be an overestimate, as card-holders often include ineligible non-BPL beneficiaries (Ram et al., 2009).
IISD.org/gsi 4
Supporting Marine Fishing Sustainably: A review of central and state government support for marine fisheries in India
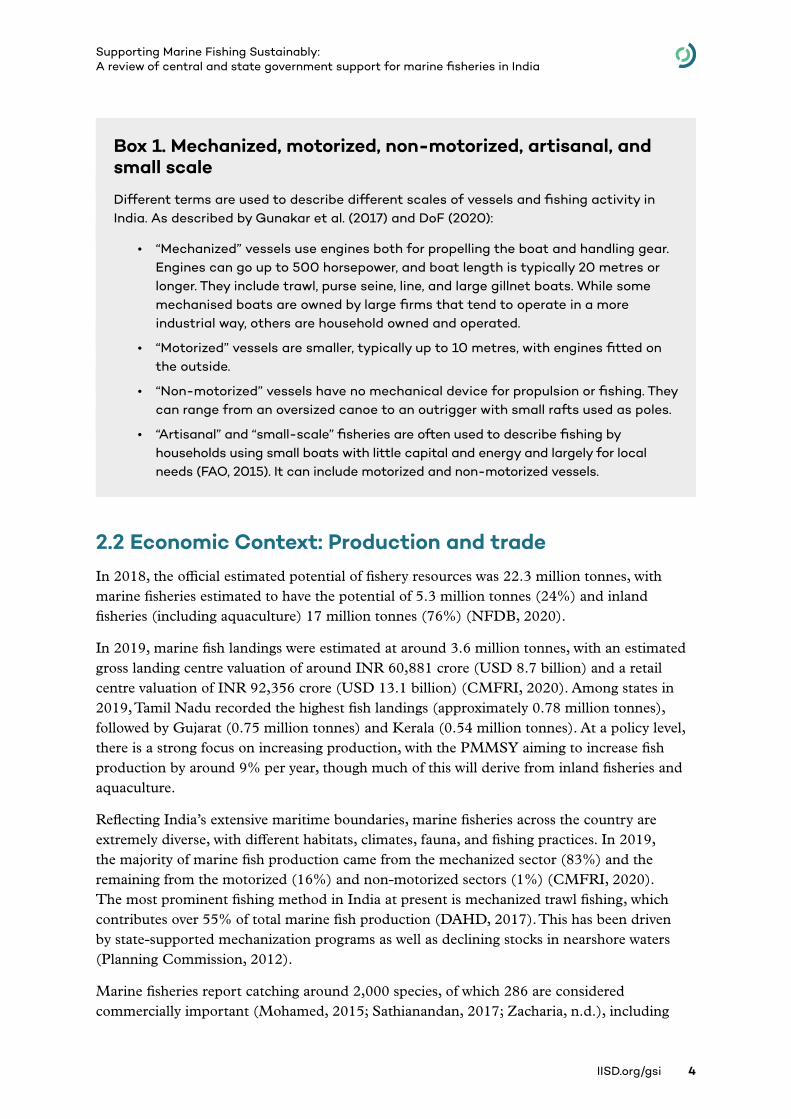
Box 1. Mechanized, motorized, non-motorized, artisanal, and small scale
Different terms are used to describe different scales of vessels and fishing activity in India. As described by Gunakar et al. (2017) and DoF (2020):
• “Mechanized” vessels use engines both for propelling the boat and handling gear. Engines can go up to 500 horsepower, and boat length is typically 20 metres or longer. They include trawl, purse seine, line, and large gillnet boats. While some mechanised boats are owned by large firms that tend to operate in a more industrial way, others are household owned and operated.
• “Motorized” vessels are smaller, typically up to 10 metres, with engines fitted on the outside.
• “Non-motorized” vessels have no mechanical device for propulsion or fishing. They can range from an oversized canoe to an outrigger with small rafts used as poles.
• “Artisanal” and “small-scale” fisheries are often used to describe fishing by households using small boats with little capital and energy and largely for local needs (FAO, 2015). It can include motorized and non-motorized vessels.
2.2 Economic Context: Production and tradeIn 2018, the official estimated potential of fishery resources was 22.3 million tonnes, with marine fisheries estimated to have the potential of 5.3 million tonnes (24%) and inland fisheries (including aquaculture) 17 million tonnes (76%) (NFDB, 2020).
In 2019, marine fish landings were estimated at around 3.6 million tonnes, with an estimated gross landing centre valuation of around INR 60,881 crore (USD 8.7 billion) and a retail centre valuation of INR 92,356 crore (USD 13.1 billion) (CMFRI, 2020). Among states in 2019, Tamil Nadu recorded the highest fish landings (approximately 0.78 million tonnes), followed by Gujarat (0.75 million tonnes) and Kerala (0.54 million tonnes). At a policy level, there is a strong focus on increasing production, with the PMMSY aiming to increase fish production by around 9% per year, though much of this will derive from inland fisheries and aquaculture.
Reflecting India’s extensive maritime boundaries, marine fisheries across the country are extremely diverse, with different habitats, climates, fauna, and fishing practices. In 2019, the majority of marine fish production came from the mechanized sector (83%) and the remaining from the motorized (16%) and non-motorized sectors (1%) (CMFRI, 2020). The most prominent fishing method in India at present is mechanized trawl fishing, which contributes over 55% of total marine fish production (DAHD, 2017). This has been driven by state-supported mechanization programs as well as declining stocks in nearshore waters (Planning Commission, 2012).
Marine fisheries report catching around 2,000 species, of which 286 are considered commercially important (Mohamed, 2015; Sathianandan, 2017; Zacharia, n.d.), including
IISD.org/gsi 5
Supporting Marine Fishing Sustainably: A review of central and state government support for marine fisheries in India
ribbonfishes, penaeid and non-penaeid prawns, oil and lesser sardines, Indian mackerel, and threadfin breams. Out of the total marine landings in 2019, 48% were pelagic (caught mainly by seines), 34% demersal (caught mainly by trawlers), 12% crustaceans, and 6% molluscs.
In terms of exports, India is among the top five largest exporters of fish and fish products globally. In 2020, total export quantity of fish and fish products (marine and inland) stood at 1.2 million tonnes, valued at INR 46,662.85 crore (USD 6.29 billion) (Marine Products Export Development Authority [MPEDA], 2020). Disaggregated data for marine-only exports remain unavailable, but seafood remained the most dominant export because exports of frozen shrimp—vannamei (whiteleg) and black tiger shrimp (aquaculture and marine)––accounted for nearly 50% in quantity and around 73% of total dollar earnings (MPEDA, 2020). In terms of the quantity of exports, China was the largest market in 2020, with a share of 25.55%. In terms of market value, the United States was the largest (38.37%), followed by China (20.58%), the European Union (13.15%), Southeast Asia (10.56%), Japan (6.26%), the Middle East (4.46%), and other countries (6.59%). Under PMMSY, the government aims to double the value of its exports by FY 2025 (DoF, 2020b).
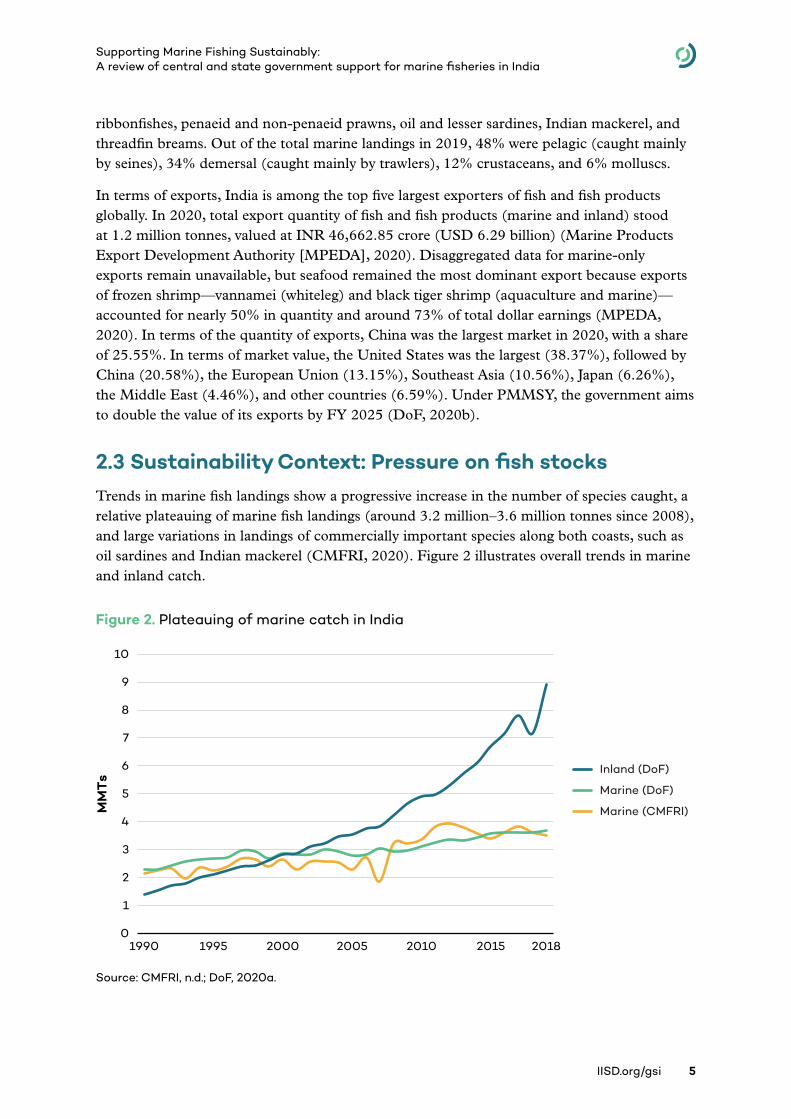
2.3 Sustainability Context: Pressure on fish stocksTrends in marine fish landings show a progressive increase in the number of species caught, a relative plateauing of marine fish landings (around 3.2 million–3.6 million tonnes since 2008), and large variations in landings of commercially important species along both coasts, such as oil sardines and Indian mackerel (CMFRI, 2020). Figure 2 illustrates overall trends in marine and inland catch.
Figure 2. Plateauing of marine catch in India
Source: CMFRI, n.d.; DoF, 2020a.
0
1
2
3
4
5
6
7
8
9
10
1990 1995 2000 2005 2010 2015 2018
MM
Ts
Inland (DoF)
Marine (DoF)
Marine (CMFRI)
IISD.org/gsi 6
Supporting Marine Fishing Sustainably: A review of central and state government support for marine fisheries in India
India lacks an up-to-date assessment of fish stocks, data that are integral for fisheries management. Yet, the overexploitation of fish stocks can be noted through two points: overexploitation of nearshore resources and increased quantity of low-value bycatch. In 2012, the Planning Commission recognized that inshore resources on both coasts are overexploited (see Box 3). NFP 2020 recognizes fish stock decline and notes the possibility of expanding efforts to offshore fishing grounds (>500 metres) (NFDB, 2020).
The increased quantity of low-value bycatch in Indian fisheries is driven by the mechanization of the sector and changing demand from interlinked industries (see Box 2) (Dineshbabu, et al., 2014; Lobo, et al., 2010). The poultry and aquaculture industries both use fishmeal and fish oil in feed, which is made up of small pelagics and low-value bycatch from marine fisheries (NFDB, 2020). Aquaculture, in particular, has increased significantly since the 1980s, making India the second-largest farmed fish producer in the world (NFDB, 2020; FAO, 2018). This has significantly increased the demand for fishmeal. Large discrepancies have also been found between the total amount of fishmeal production and the reported amount of fish stocks diverted for fish meal (Cashion, 2016), suggesting that this may be driving unreported landings sourced from trawling.
In January 2019, the Central Government initiated a process to regulate the number of trawlers and demarcate areas in which trawlers are allowed to fish (Chandrashekhar, 2019). However, on-the-ground enforcement of these deliberations is yet to be seen. In Tamil Nadu, an effort has begun to encourage the conversion of bottom trawlers into deep-sea vessels under the Diversification of Trawl Fishing Boats from Palk Straits scheme, with subsidies being provided by both the central and state governments (Hemalatha, 2019). Notwithstanding these few policy measures, marine fisheries still remain open access through much of India’s coastline. Key policies such as the Marine Fisheries Regulation and Management Bill, 2019 are meant to curb unregulated fishing in the EEZ, but they remain in their draft stages. The unregulated increase in fishing capacity, together with an absence of catch limits, continues to pose a problem for the sustainability of marine fisheries in India.
Box 2. Fishmeal
The increasing quantity of low-value bycatch characteristic of non-targeted fishing is shown to be an indicator of the ecological costs of supporting mechanized and industrialized fishing. With growing poultry and aquaculture industries and growing demand for fishmeal and fish oil, small pelagics and low-value bycatch have become more marketable, often caught in large numbers and in bulk, which helps keep operations economically viable and leads to intensified efforts to further fish for bycatch (Changing Markets Foundation, 2019). This has an impact on the overall health of the marine fisheries in India, primarily on account of the large number of juveniles caught. The sixth draft of NFP now indicates a need to regulate fishmeal production and monitor the growth of fish meal plants, given their dependence on non-targeted fishing and wild collection of juveniles.
IISD.org/gsi 7
Supporting Marine Fishing Sustainably: A review of central and state government support for marine fisheries in India
Box 3. Declining fish stocks
As reported by CMFRI (2020), total catch has increased significantly compared to the first decade of mechanization beginning in the 1970s. However, since around 2008, it has stagnated at around 3.2 million–3.6 million tonnes, even with the increasing mechanization of the fleet (CMFRI, 2020). In 2019, of the 3.6 million tonnes landed, 83% was caught by the mechanized sector, 16% by the motorized sector, and only 1% by the non-motorized sector (CMFRI, 2020). There have also been large fluctuations in fish landings of commercially important species, including oil sardines and Indian mackerel, and a decline in the biomass of a few non-targeted species such as stomatopods (mantis shrimps). Nearshore fishing areas on the east and west coasts have been recognized as overexploited (Planning Commission, 2012). Missing from official reports, however, is a time series of catch-per-unit effort of marine fisheries and level of bycatch, making it difficult to interpret the overall trends. Additionally, there is a lack of comprehensive data on the status of stocks of key marine fish species, a critical gap for the sustainable management of fisheries.
IISD.org/gsi 8
Supporting Marine Fishing Sustainably: A review of central and state government support for marine fisheries in India
3.0 Approach and Scope This report covers government support provided directly or indirectly to marine fisheries, including mariculture and post-harvest activities such as storage, retail, processing, and marketing. We track “support” based on a broad interpretation of the term “subsidy” as defined by the Agreement on Subsidies and Countervailing Measures of the WTO (n.d.): a financial contribution—or any form of income or price support—by a government or public body within its territory which confers a benefit. We aim to capture all types of support, including social protection targeted at fisheries, support to fisheries-related research and development (R&D), and fishing infrastructure and management of fisheries.
The data—which can be downloaded in Excel form, online—cover all support measures from FY 2016 to FY 2019 at a central level and in four states: Andhra Pradesh, Karnataka, Kerala, and Tamil Nadu. These four states account for more than 50% of the total marine fish landings in India (CMFRI, 2020). For other states and UTs, we have included data where it is readily available but not attempted to exhaustively identify all support measures. Further, some support policies allocate lump-sum amounts for the fisheries sector that include both marine and inland fisheries. In such cases, where possible, the data has been restricted to marine only when the original data did not provide disaggregation to best reflect marine estimates. Further details on these policies can be found in the accompanying database.
The overall estimates are, therefore, conservative as an estimate of total support at an all-India level. Data on the value of support is actual expenditure taken from official sources, such as budget documents and annual reports from both the central government and state governments’ fisheries departments, WTO notifications, and policy notes, as well as from NFDB.2 Where this is not available, various methods have been used to quantify support following international standards (Steenblick & Jones, 2010). Full details on the approach are provided in Annex A.
Our database classifies support measures according to various criteria. First, we sort by type of measure: (i) direct transfer of funds or liabilities, (ii) government revenue foregone, (iii) government below-value provision of goods or services, and (iv) income or price support. Second, we sort according to the type of support or the conditions under which support is provided (see Figure 3). This builds on work by the Organisation for Economic Co-operation and Development (2017), distinguishing between support for individual fishers and support for general services. It is also elaborated upon in greater detail in Annex A. Such classification allows us to determine how a transfer may affect the behaviour of fishers and gives a first indication of the likely impacts of different programs.
2 This report has taken some government expenditure on marine fisheries from annual reports of NFDB, but such reports are not endorsed by the Ministry of Fisheries, Animal Husbandry and Dairying’s Department of Fisheries.
IISD.org/gsi 9
Supporting Marine Fishing Sustainably: A review of central and state government support for marine fisheries in India
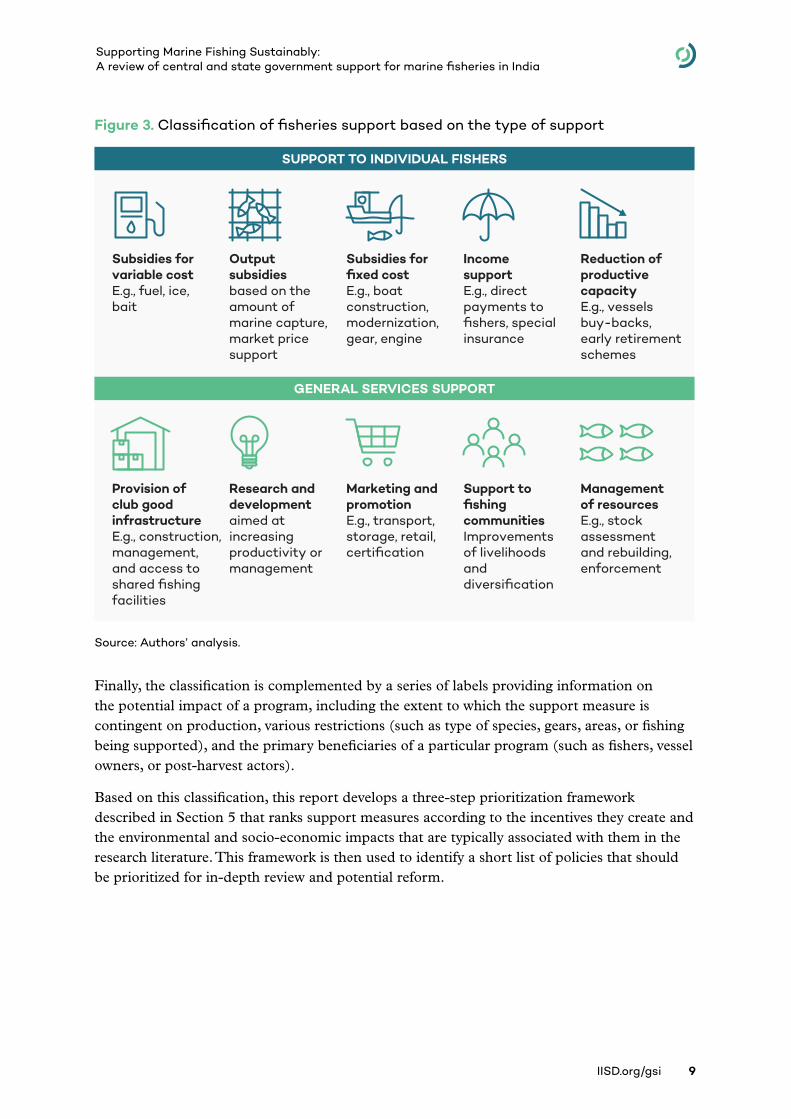
Figure 3. Classification of fisheries support based on the type of support
Source: Authors’ analysis.
Finally, the classification is complemented by a series of labels providing information on the potential impact of a program, including the extent to which the support measure is contingent on production, various restrictions (such as type of species, gears, areas, or fishing being supported), and the primary beneficiaries of a particular program (such as fishers, vessel owners, or post-harvest actors).
Based on this classification, this report develops a three-step prioritization framework described in Section 5 that ranks support measures according to the incentives they create and the environmental and socio-economic impacts that are typically associated with them in the research literature. This framework is then used to identify a short list of policies that should be prioritized for in-depth review and potential reform.
Provision of club good infrastructure E.g., construction, management, and access to shared fishing facilities
Research and developmentaimed at increasing productivity or management
Marketing and promotion E.g., transport, storage, retail, certification
Support to fishing communities Improvements of livelihoods and diversification
Management of resources E.g., stock assessment and rebuilding, enforcement
GENERAL SERVICES SUPPORT
Subsidies for variable cost E.g., fuel, ice, bait
Output subsidies based on the amount of marine capture, market price support
Subsidies for fixed cost E.g., boat construction, modernization, gear, engine
Income support E.g., direct payments to fishers, special insurance
Reduction of productive capacity E.g., vessels buy-backs, early retirement schemes
SUPPORT TO INDIVIDUAL FISHERS
IISD.org/gsi 10
Supporting Marine Fishing Sustainably: A review of central and state government support for marine fisheries in India
4.0 Key Findings: Support for marine fisheries
Government support to marine fisheries in FY 2019 was at least INR 2,225 crore (USD 316 million), a 43% increase since FY 2016.
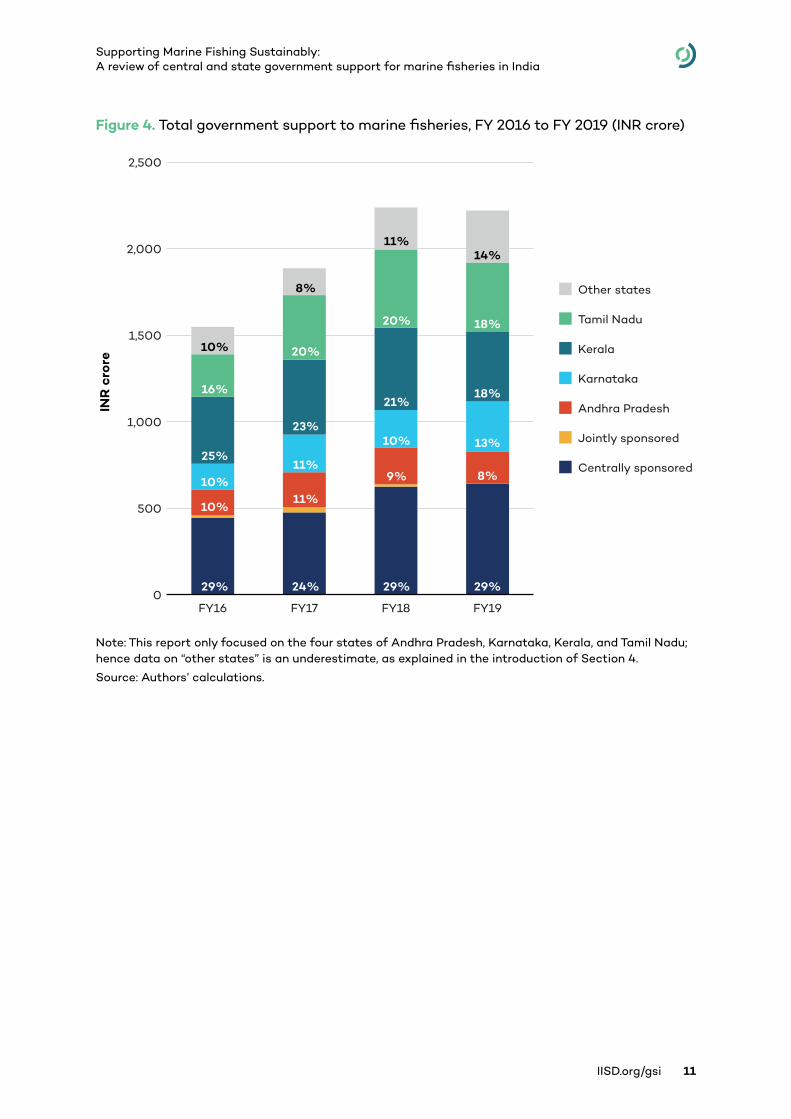
As shown in Figure 4, total quantified government support for marine fisheries increased from INR 1,550 crore (USD 231 million) in FY 2016 to at least INR 2,225 crore (USD 316 million) in FY 2019—an increase of 43%.3 Since FY 2016, both central and state support have increased at approximately the same rate. This estimate includes support offered by Central Government schemes and comprehensive data on schemes from four states (Andhra Pradesh, Karnataka, Kerala, and Tamil Nadu) but only partial data from other states. Thus, this finding is a conservative estimate of total national support levels for marine fisheries.
This data is accurate as of FY 2019, but as elaborated upon later in this chapter, this means that it does not include the major new umbrella scheme PMMSY, which runs from FY 2020 to 2025, with an average annual central contribution of at least INR 246 crore4 (USD 34.9 million). This would significantly increase average annual support levels, but it is difficult to assess exact net impacts on marine fishing alone—PMMSY will continue some existing schemes as well as introducing new ones and covers both marine and inland fishing. Our estimates also do not include expenditures related to the Sagarmala program. This approach aims to harness ports as drivers of economic development, including INR 479 crore (USD 68 million) on coastal projects in FY 2019. It is excluded because of the challenge of attributing expenditure to specific years and to marine fisheries. Despite methodological challenges, both of these schemes should be borne in mind as part of any assessment to capture total levels of support for marine fisheries in India.
3 Given the short time period, estimates have not been adjusted for inflation.4 Based on amounts disbursed under PMMSY from centre to states in February 2021 for marine fishing only. It excludes schemes for welfare, post-harvest activities, and others because that could not be adjusted for marine only.
IISD.org/gsi 11
Supporting Marine Fishing Sustainably: A review of central and state government support for marine fisheries in India
Figure 4. Total government support to marine fisheries, FY 2016 to FY 2019 (INR crore)
Note: This report only focused on the four states of Andhra Pradesh, Karnataka, Kerala, and Tamil Nadu; hence data on “other states” is an underestimate, as explained in the introduction of Section 4.
Source: Authors’ calculations.
0
500
1,000
1,500
2,000
2,500
FY16 FY17 FY18 FY19
INR
cro
re
Centrally sponsored
Jointly sponsored
Andhra Pradesh
Karnataka
Kerala
Tamil Nadu
Other states
29% 24% 29% 29%
10%11%
9% 8%10%11%
10% 13%25%
23%
21%18%16%
20%
20% 18%
10%
8%
11%14%
IISD.org/gsi 12
Supporting Marine Fishing Sustainably: A review of central and state government support for marine fisheries in India
Box 4. Government support to marine fisheries versus subsidies for marine wild capture fishing at sea
This report provides an inventory of the measures used by central and state governments to support the marine fisheries sector in India, including mariculture. To do so, it uses a broad conception of “support,” which relies on a broad interpretation of the subsidy definition found in the WTO’s Agreement on Subsidies and Countervailing Measures. The report includes measures that support marine fisheries both directly and indirectly at various stages of the value chain, including support measures connected to fisheries-related R&D, infrastructure, and social protection; fisheries resources management; post-harvest activities such as such as storage, retail, processing, and marketing; and broader support to fishing communities. The aim of this approach is to provide a holistic view of public support to the sector.
It should be noted, however, that the total amount of support of INR 2,224.5 crore (USD 316 million) in FY 2019 found in this report is closely linked to its broad conception of public support to marine fisheries. Reducing the scope of the measures covered would, logically, decrease the total amount of support. In ongoing negotiations on fisheries subsidies at the WTO, for example, WTO members are considering new subsidy rules that would only apply to marine wild capture fishing and fishing-related activities at sea. Considering only the support measures that would most likely fall within that scope—that is, direct support to fishing at sea—we find a total of INR 829 crore (USD 118 million). This number is very close to the total of INR 770 crore (USD 109 million) that has been reported as the total of fisheries subsidies provided by the Indian government in a number of media articles about ongoing WTO negotiations, which we assume also focuses on measures that would be covered by new WTO rules (Business World 2021).
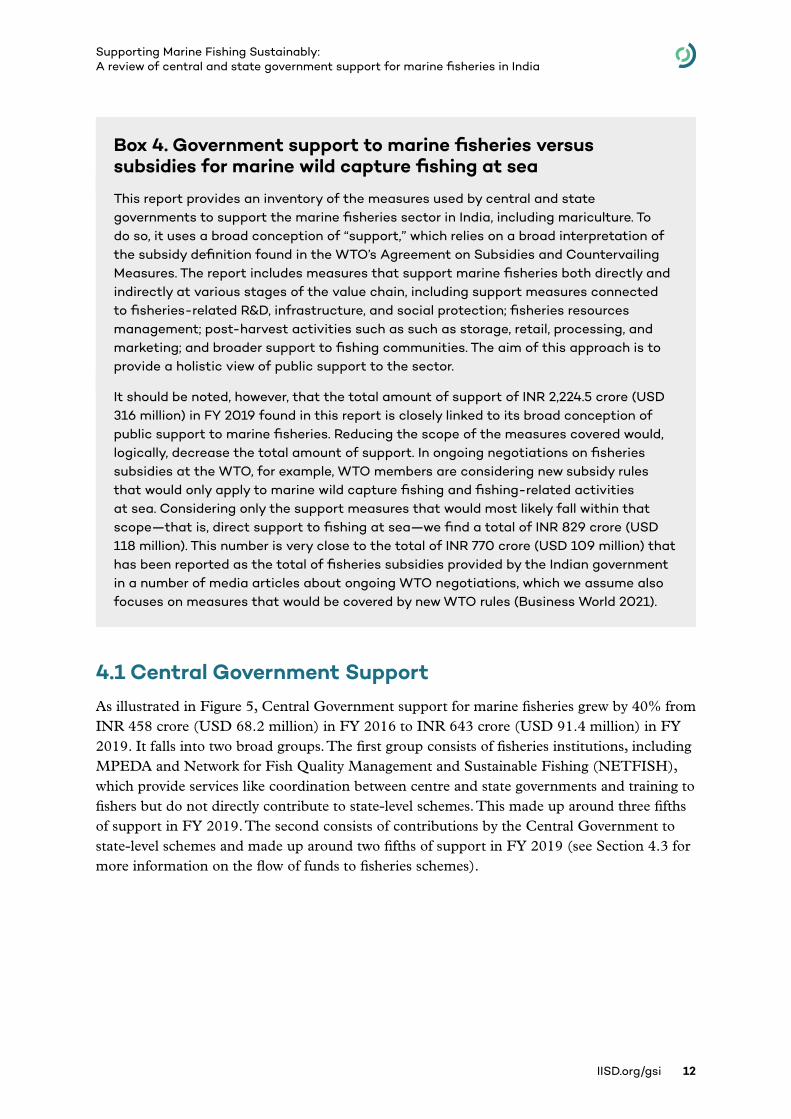
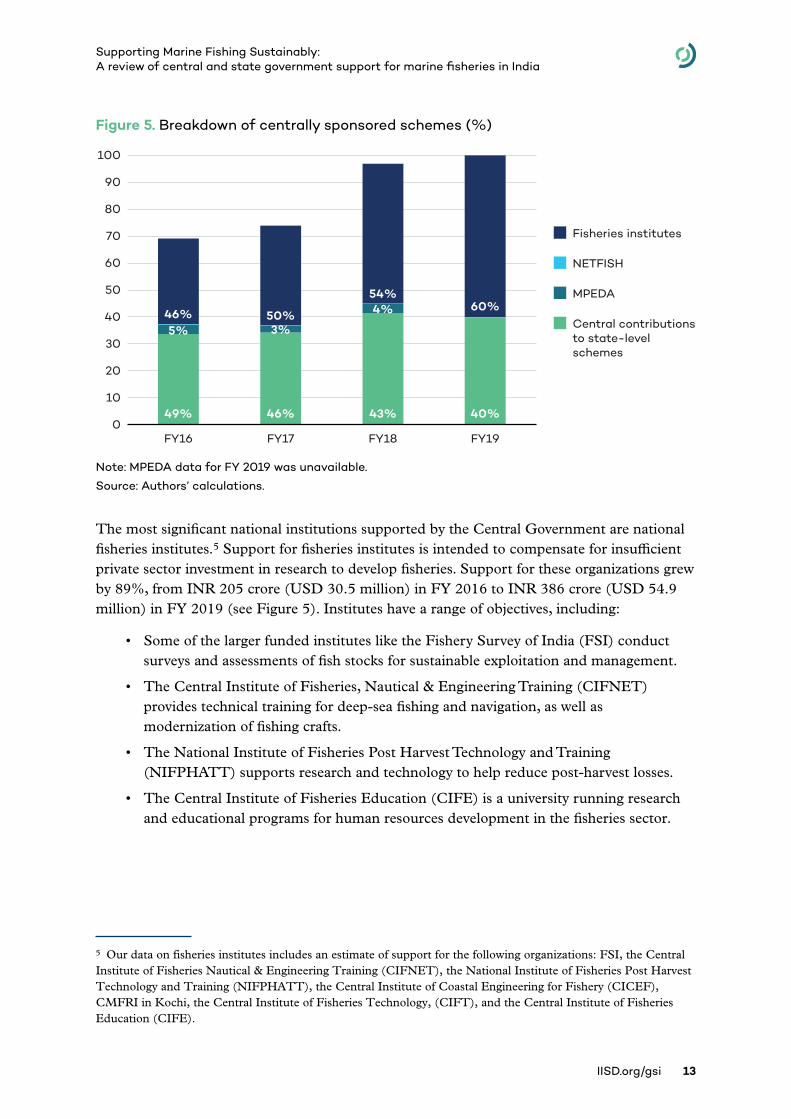
4.1 Central Government Support As illustrated in Figure 5, Central Government support for marine fisheries grew by 40% from INR 458 crore (USD 68.2 million) in FY 2016 to INR 643 crore (USD 91.4 million) in FY 2019. It falls into two broad groups. The first group consists of fisheries institutions, including MPEDA and Network for Fish Quality Management and Sustainable Fishing (NETFISH), which provide services like coordination between centre and state governments and training to fishers but do not directly contribute to state-level schemes. This made up around three fifths of support in FY 2019. The second consists of contributions by the Central Government to state-level schemes and made up around two fifths of support in FY 2019 (see Section 4.3 for more information on the flow of funds to fisheries schemes).
IISD.org/gsi 13
Supporting Marine Fishing Sustainably: A review of central and state government support for marine fisheries in India
Figure 5. Breakdown of centrally sponsored schemes (%)
Note: MPEDA data for FY 2019 was unavailable.
Source: Authors’ calculations.
The most significant national institutions supported by the Central Government are national fisheries institutes.5 Support for fisheries institutes is intended to compensate for insufficient private sector investment in research to develop fisheries. Support for these organizations grew by 89%, from INR 205 crore (USD 30.5 million) in FY 2016 to INR 386 crore (USD 54.9 million) in FY 2019 (see Figure 5). Institutes have a range of objectives, including:
• Some of the larger funded institutes like the Fishery Survey of India (FSI) conduct surveys and assessments of fish stocks for sustainable exploitation and management.
• The Central Institute of Fisheries, Nautical & Engineering Training (CIFNET) provides technical training for deep-sea fishing and navigation, as well as modernization of fishing crafts.
• The National Institute of Fisheries Post Harvest Technology and Training (NIFPHATT) supports research and technology to help reduce post-harvest losses.
• The Central Institute of Fisheries Education (CIFE) is a university running research and educational programs for human resources development in the fisheries sector.
5 Our data on fisheries institutes includes an estimate of support for the following organizations: FSI, the Central Institute of Fisheries Nautical & Engineering Training (CIFNET), the National Institute of Fisheries Post Harvest Technology and Training (NIFPHATT), the Central Institute of Coastal Engineering for Fishery (CICEF), CMFRI in Kochi, the Central Institute of Fisheries Technology, (CIFT), and the Central Institute of Fisheries Education (CIFE).
Central contributions to state-level schemes
MPEDA
NETFISH
Fisheries institutes
49% 46% 43% 40%
5% 3%
4%46% 50%
54%60%
0
10
20
30
40
60
90
80
100
70
50
FY16 FY17 FY18 FY19
IISD.org/gsi 14
Supporting Marine Fishing Sustainably: A review of central and state government support for marine fisheries in India
Our data includes all support provided to these specialized research institutions.6 For all of these organizations except two,7 our estimates are based on the net budgets of the institutes. This means that we deducted revenue generated by the institute from the full budget when information was available and included the full budget allocations when disaggregation was unavailable.
Central Government support also includes funding for the MPEDA and NETFISH, a society registered under MPEDA that imparts training on sustainable fishing practices to fishers and fish workers. MPEDA is a government-owned enterprise under the Department of Commerce that acts as a coordination agency between the central and state governments on different activities linked to marine fisheries. It promotes the export of marine products by supporting infrastructure development of post-harvest activities and promoting deep-sea fishing, marketing, and training. For MPEDA, the budget has been adjusted as necessary to capture the share focused on marine fishing only, while for NETFISH, the full budget allocation has been used. No data on MPEDA were available for FY 2019, so it is not included in FY 2019 totals.
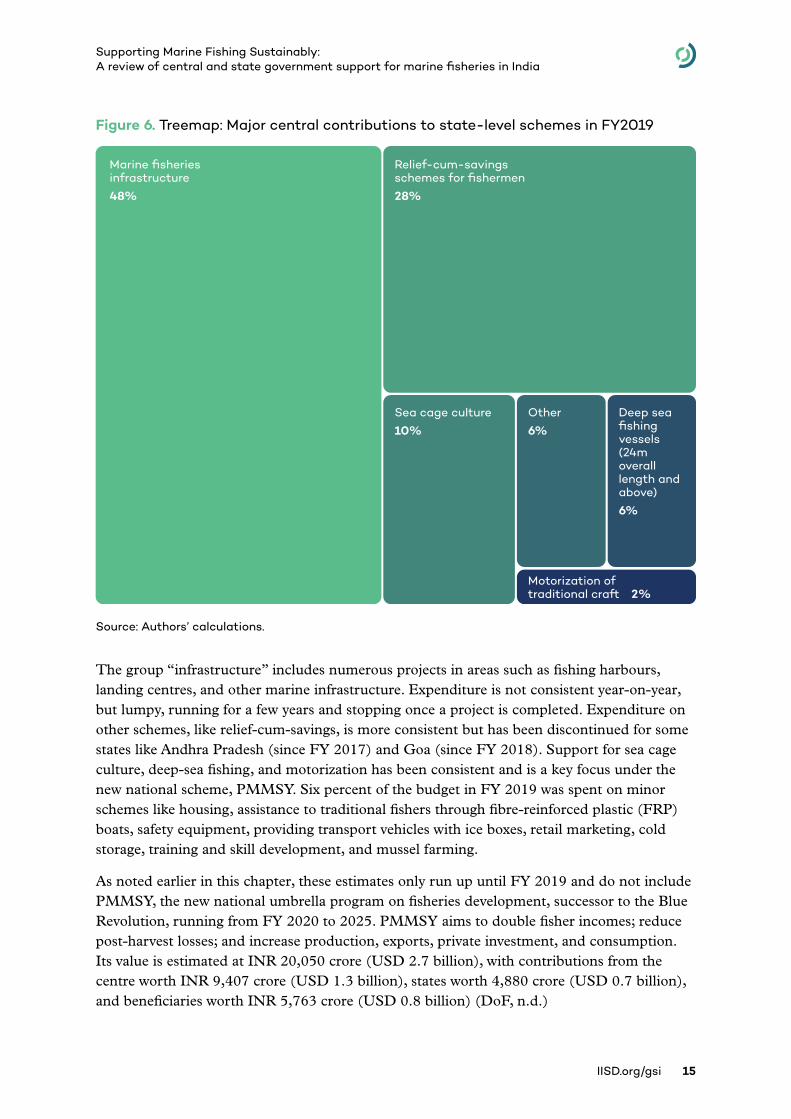
In contrast with fisheries institutes, there is excellent disaggregated reporting on “central contribution to state-level schemes” reported in Figure 5. These are Central Government-sponsored schemes for marine fisheries. Figure 6 visualizes the relative size of each scheme. Total support of this kind grew by 18%, from INR 217 crore (USD 32.3 million) in FY 2016 to INR 256 crore (USD 36.4 million) in FY 2019. While many schemes exist, the large majority of expenditure (~94%) is concentrated in five main support measures: marine fisheries infrastructure, relief-cum-savings schemes8 for fishers, sea cage culture, support for deep-sea fishing vessels, and motorization of traditional crafts.
6 Support for fisheries institutes can encompass, among other things, cost of personnel (researchers, technicians, and support staff); cost of instruments, equipment, land, and buildings; cost of consultancy and equivalent services; and additional overhead and other running costs incurred directly as a result of the research activity.7 The Central Institute of Coastal Engineering for Fishery and CMFRI, Kochi are the two organizations where the entire budget has been used in our estimates, as no information on revenue was available.8 This is a financial support scheme offered to fishers to compensate income loss during the fishing ban imposed for 3 months in the monsoon. Under the scheme, fishers contribute a certain amount per month that is matched by central and state governments. The total is accrued over 9 months and then paid to the fishers during the ban period.
IISD.org/gsi 15
Supporting Marine Fishing Sustainably: A review of central and state government support for marine fisheries in India
Figure 6. Treemap: Major central contributions to state-level schemes in FY2019
Source: Authors’ calculations.
The group “infrastructure” includes numerous projects in areas such as fishing harbours, landing centres, and other marine infrastructure. Expenditure is not consistent year-on-year, but lumpy, running for a few years and stopping once a project is completed. Expenditure on other schemes, like relief-cum-savings, is more consistent but has been discontinued for some states like Andhra Pradesh (since FY 2017) and Goa (since FY 2018). Support for sea cage culture, deep-sea fishing, and motorization has been consistent and is a key focus under the new national scheme, PMMSY. Six percent of the budget in FY 2019 was spent on minor schemes like housing, assistance to traditional fishers through fibre-reinforced plastic (FRP) boats, safety equipment, providing transport vehicles with ice boxes, retail marketing, cold storage, training and skill development, and mussel farming.
As noted earlier in this chapter, these estimates only run up until FY 2019 and do not include PMMSY, the new national umbrella program on fisheries development, successor to the Blue Revolution, running from FY 2020 to 2025. PMMSY aims to double fisher incomes; reduce post-harvest losses; and increase production, exports, private investment, and consumption. Its value is estimated at INR 20,050 crore (USD 2.7 billion), with contributions from the centre worth INR 9,407 crore (USD 1.3 billion), states worth 4,880 crore (USD 0.7 billion), and beneficiaries worth INR 5,763 crore (USD 0.8 billion) (DoF, n.d.)
Marine fisheries infrastructure
48%
Relief-cum-savings schemes for fishermen
28%
Sea cage culture
10%Other
6%
Motorization of traditional craft 2%
Deep sea fishing vessels (24m overall length and above)
6%
IISD.org/gsi 16
Supporting Marine Fishing Sustainably: A review of central and state government support for marine fisheries in India
Based on the sanctioned amounts from May 2020 to February 2021 and where disaggregation for marine fishing was possible, it is likely that there will be increased expenditure on central contributions to state-level schemes in future years. Centre-sponsored support under PMMSY is likely to be over INR 246 crore (USD 34.9 million) per year—we cannot estimate the full amount because it is not possible to disaggregate all schemes for marine fisheries. In comparison, total centre-sponsored support was INR 256 crore (USD 36.4 million) in FY 2019. Given the importance of PMMSY, we have included it in our database of marine fisheries support but separate from other data, reflecting its different timelines and the fact that it is based on budgeted measures rather than expenditures. As of January 2021, the largest measures under the scheme include the purchase of deep-sea vessels, boat replacements, fish kiosks, and the construction of cold storage and fish feed mills. A review of the PMMSY reveals the centre’s focus on productivity, intensive mariculture, and deep-sea fishing. Many fewer resources are dedicated to safeguarding coastal communities and long-term ecological health. See Annex C for supporting figures on PMMSY.
The estimates also do not include the Sagarmala program, a flagship of the Central Government under the Ministry of Shipping that is focused on harnessing ports to drive economic development. The program runs from 2015 to 2035. As of its inception, Sagarmala consisted of 397 projects, of which 111 were already being implemented, 83 would begin after FY 2020, and 203 had not yet identified financing. Programs were categorized into four pillars: port modernization, port connectivity, port-led industrialization, and coastal community development (Ministry of Shipping, 2016). Overall, it was estimated that the program would represent around INR 4.5 lakh crore (USD 66.9 billion) of investment from both government and public–private partnerships (Ministry of Shipping, 2016). The environmental implications and social costs of Sagarmala, along with the increasing role of non-fisher corporate players in coastal communities and habitats, have come under criticism (The Research Collective, 2017a, 2017b). See Annex C for supporting figures on Sagarmala.
Our database of marine support measures includes Sagarmala programs relevant to marine fisheries but, as with PMMSY, separated from the rest of the data. This reflects the difficulty of attributing Sagarmala support across years, as well as the methodological challenge of attributing the share of a general infrastructure project to marine fisheries, as Sagarmala projects are also intended to support shipping. As of September 2019, we identified INR 479 crore (USD 68 million) of coastal-related projects under Sagarmala. This is almost twice the value of all Central Government contributions to state schemes in our core database. As such, Sagarmala is another important consideration in trying to assess total support levels for marine fisheries in India.
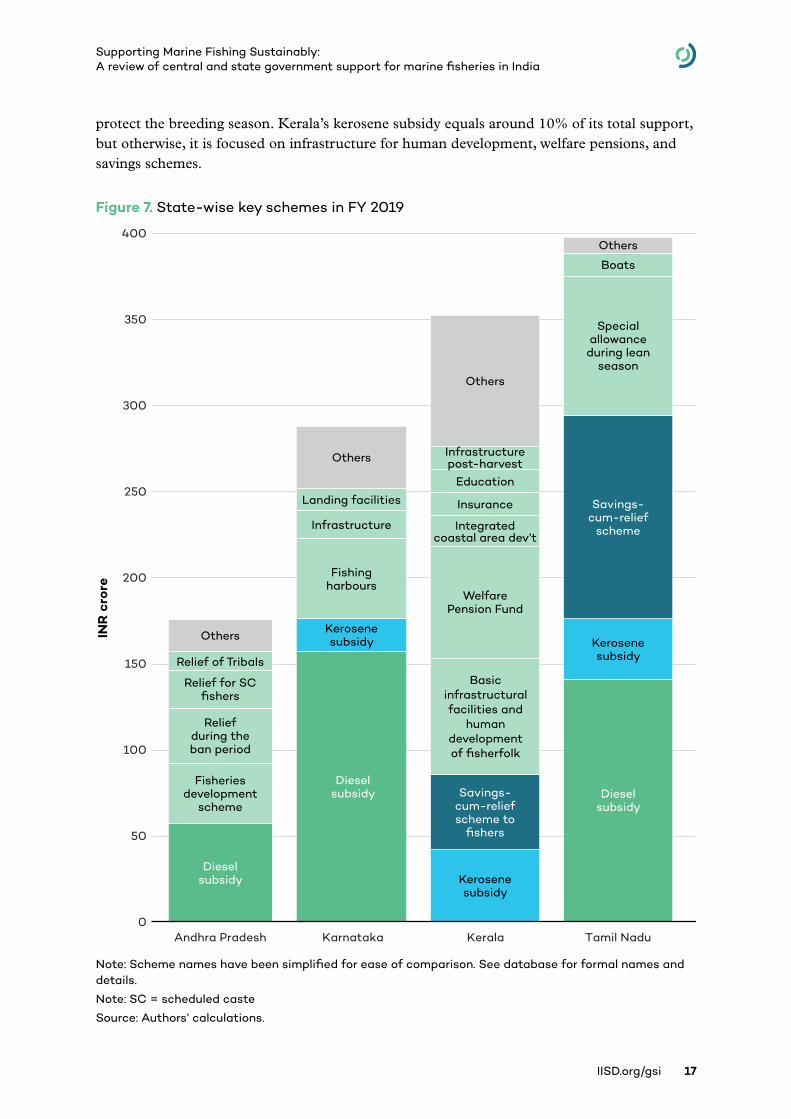
4.2 State Government Support Figure 7 illustrates the major components of state support for marine fisheries in our focus states—Andhra Pradesh, Karnataka, Kerala, and Tamil Nadu—and shows considerable variation. The largest measures in all states except Kerala are fuel subsidies. Karnataka stands out for having support predominantly focused on fuel subsidies and infrastructure. Andhra Pradesh and Tamil Nadu, on the other hand, have significant fuel subsidies but dedicate a similar scale of support to fisher savings schemes during “ban” periods when fishing ceases to
IISD.org/gsi 17
Supporting Marine Fishing Sustainably: A review of central and state government support for marine fisheries in India
protect the breeding season. Kerala’s kerosene subsidy equals around 10% of its total support, but otherwise, it is focused on infrastructure for human development, welfare pensions, and savings schemes.
Figure 7. State-wise key schemes in FY 2019
Note: Scheme names have been simplified for ease of comparison. See database for formal names and details.
Note: SC = scheduled caste
Source: Authors’ calculations.
INR
cro
re
0
50
100
150
200
250
300
350
400
Andhra Pradesh Karnataka Kerala Tamil Nadu
Others
Relief of Tribals
Relief for SC fishers
Relief during the ban period
Fisheries development
scheme
Fishing harbours
Kerosene subsidy
Kerosene subsidy
Kerosene subsidy
Infrastructure
Landing facilities
Diesel subsidy
Diesel subsidy
Integrated coastal area dev’t
Infrastructure post-harvest
Education
Boats
Insurance
Diesel subsidy
Special allowance
during lean season
Savings- cum-relief
scheme
Basic infrastructural facilities and
human development of fisherfolk
Welfare Pension Fund
Savings- cum-relief scheme to
fishers
Others
Others
Others
IISD.org/gsi 18
Supporting Marine Fishing Sustainably: A review of central and state government support for marine fisheries in India
States also differ in reporting practices. For example, Andhra Pradesh reports an expenditure of INR 35 crore (USD 4.9 million) in FY 2019 on the fisheries development scheme (FDS), but this is spread across several FDS programs, including funding for Matsya Mitra Groups of fisherwoman cooperatives, nets to fishers, maintenance for fish seed production, and vehicles for fish vending. In other states, such elements might be reported on individually. This makes it challenging to consistently track and compare what is supported and by how much. Similar challenges were found for the Tribal Sub-plan and Scheduled Caste Sub-plan.
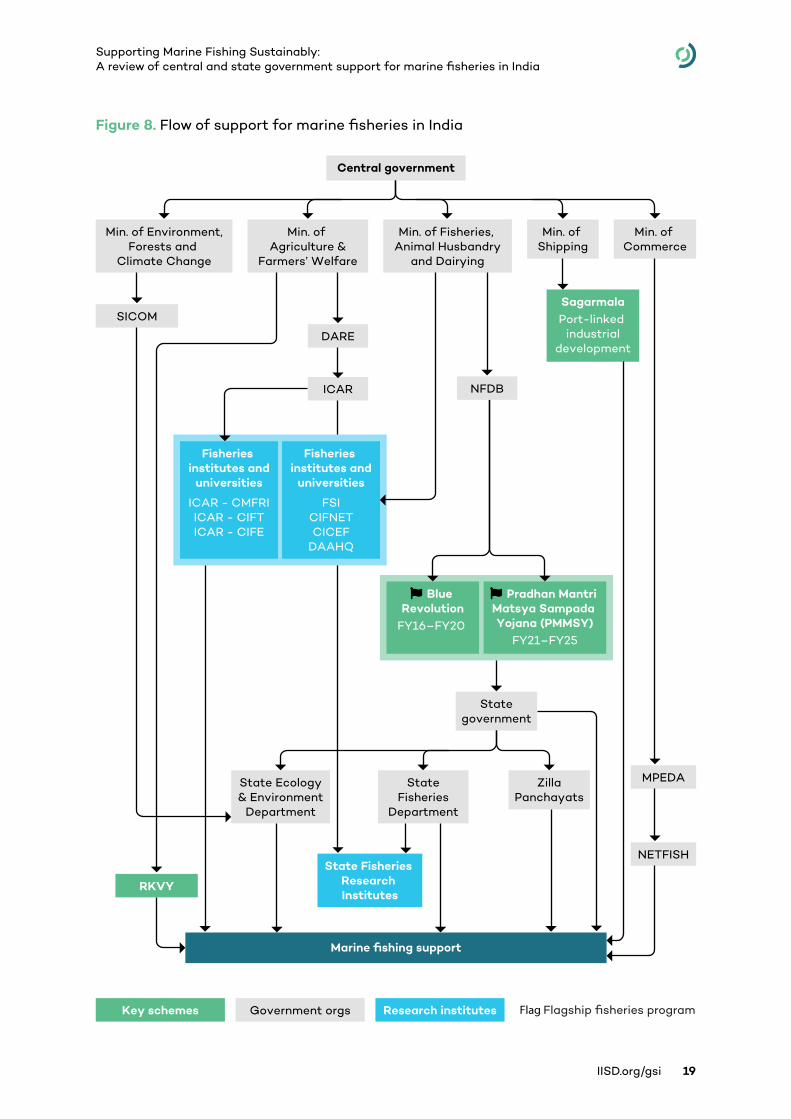
4.3 Flow of Funds for Supporting Marine FisheriesThe approach taken by this study—looking at both central and state support measures—is important because it captures the complex ways in which support for marine fisheries is provided by both state and central governments. Some of these key relationships are illustrated in Figure 8: the Central Government disburses funds to key ministries, which in turn distribute funds to major national programs, such as Blue Revolution, Sagarmala, and Rashtriya Krishi Vikas Yojana, and major agencies, such as the Indian Council of Agricultural Research, fisheries institutes, NFDB, and MPEDA. States also fully fund some of their own schemes from state budgets, which may reach beneficiaries independently or be co-sponsored by Central Government programs or agencies.
Data reported here has been carefully combed from central and state government sources, as well as other organizations, to ensure no double counting. For Karnataka and Tamil Nadu, the annual reports from the state departments of fisheries give clarity on central and state contributions on various schemes. Therefore, for these two states, only state shares of actual expenditures have been directly taken from the reports of state departments of fisheries.
For Andhra Pradesh and Kerala, similar reports from the departments of fisheries are unavailable. For these two states, state budgets have been used to record actual expenditures. In the absence of official government information indicating state-only contributions for schemes that can include central government support, this report has adopted a simple methodology to account for state-only contribution to ensure no double counting. For Kerala, the percentage of central government support, indicated against the scheme’s name in the budget, was deducted to account only for the state’s share. For Andhra Pradesh, no level of information was available, so an assumption was made on the percentage of central government contribution for a number of schemes—related in particular to infrastructure and income support —based on similar support schemes in other states where this percentage was known. This methodology eliminates the risk of double counting to the maximum extent possible but also brings in a minor risk of losing some state-only contributions for Andhra Pradesh and Kerala, which means that the totals for these states could be slight underestimates.
It should also be noted that many support measures in India are for fisheries generally and not only for marine fisheries. For some measures, official documents already disaggregate the share of support by marine and non-marine fisheries. For others, there is no disaggregation in official documents. In such cases, we have made reasonable assumptions to estimate the share of support likely going to marine fisheries. The method for doing so is elaborated upon in Annex A.
IISD.org/gsi 19
Supporting Marine Fishing Sustainably: A review of central and state government support for marine fisheries in India
Figure 8. Flow of support for marine fisheries in India
Marine fishing support
Central government
Min. of Commerce
MPEDA
Key schemes Government orgs Research institutes
SICOM
NETFISH
Min. of Shipping
Stategovernment
State Ecology& Environment
Department
StateFisheries
Department
ZillaPanchayats
SagarmalaPort-linked
industrial development
Fisheries institutes and
universities
ICAR - CMFRIICAR - CIFTICAR - CIFE
Fisheries institutes and
universities
FSICIFNETCICEF
DAAHQ
� Blue Revolution
FY16–FY20
� Pradhan Mantri Matsya Sampada Yojana (PMMSY)
FY21–FY25
Min. of Environment,Forests and
Climate Change
Min. of Fisheries, Animal Husbandry
and Dairying
Min. of Agriculture &
Farmers’ Welfare
RKVY
DARE
ICAR
Flag Flagship fisheries programs
State Fisheries Research Institutes
NFDB
IISD.org/gsi 20
Supporting Marine Fishing Sustainably: A review of central and state government support for marine fisheries in India
5.0 Is India’s Support Aligned With its Objectives? A database of support measures is only a helpful tool if there is some way to draw meaning from the data, to determine whether support is flowing in the right direction, taking into account national objectives and how well they map onto likely impacts.
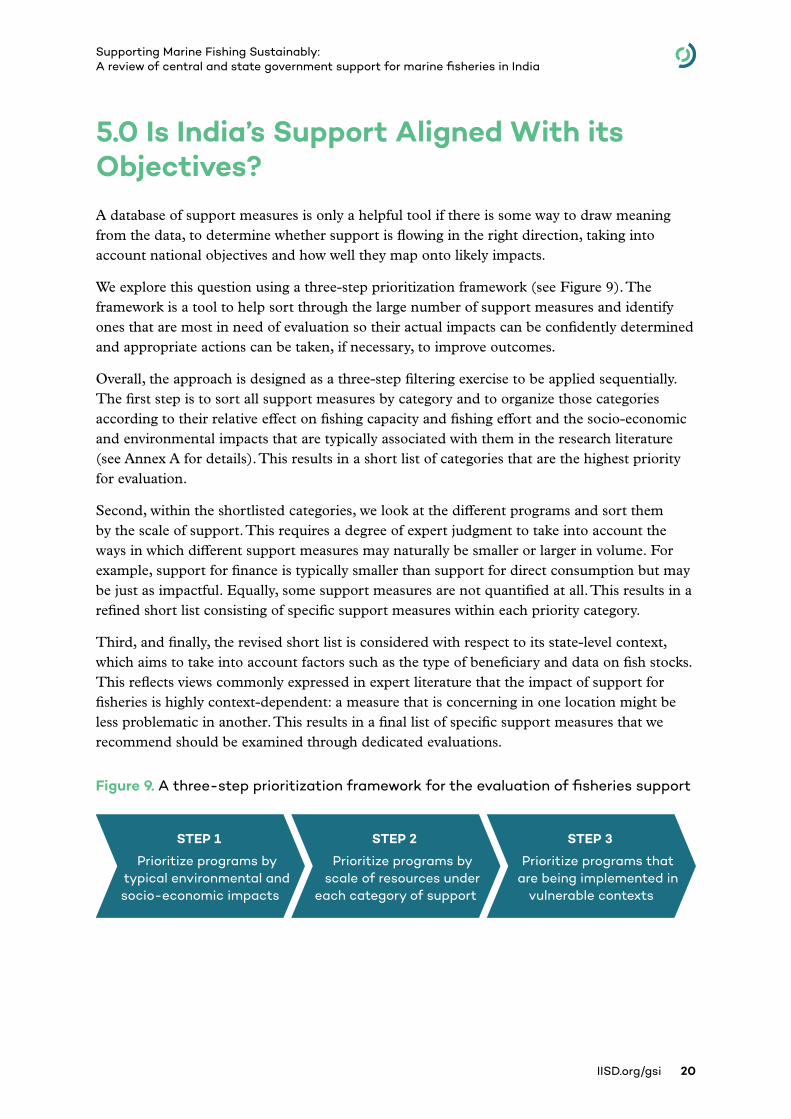
We explore this question using a three-step prioritization framework (see Figure 9). The framework is a tool to help sort through the large number of support measures and identify ones that are most in need of evaluation so their actual impacts can be confidently determined and appropriate actions can be taken, if necessary, to improve outcomes.
Overall, the approach is designed as a three-step filtering exercise to be applied sequentially. The first step is to sort all support measures by category and to organize those categories according to their relative effect on fishing capacity and fishing effort and the socio-economic and environmental impacts that are typically associated with them in the research literature (see Annex A for details). This results in a short list of categories that are the highest priority for evaluation.
Second, within the shortlisted categories, we look at the different programs and sort them by the scale of support. This requires a degree of expert judgment to take into account the ways in which different support measures may naturally be smaller or larger in volume. For example, support for finance is typically smaller than support for direct consumption but may be just as impactful. Equally, some support measures are not quantified at all. This results in a refined short list consisting of specific support measures within each priority category.
Third, and finally, the revised short list is considered with respect to its state-level context, which aims to take into account factors such as the type of beneficiary and data on fish stocks. This reflects views commonly expressed in expert literature that the impact of support for fisheries is highly context-dependent: a measure that is concerning in one location might be less problematic in another. This results in a final list of specific support measures that we recommend should be examined through dedicated evaluations.
Figure 9. A three-step prioritization framework for the evaluation of fisheries support
STEP 1
Prioritize programs by typical environmental and socio-economic impacts
STEP 2
Prioritize programs by scale of resources under
each category of support
STEP 3
Prioritize programs that are being implemented in
vulnerable contexts
IISD.org/gsi 21
Supporting Marine Fishing Sustainably: A review of central and state government support for marine fisheries in India
5.1 Step 1: Prioritizing support measures by likely impactFigure 10 summarizes the different categories that are used to sort support measures. Categories on the left are the ones that expert literature suggests most directly influence fishing pressure and that are associated with the highest risk of adverse environmental and socio-economic impacts due to overcapacity and overfishing. This includes support measures targeting individual fishers, which are more likely to alter the marginal benefits or costs of fishing than support targeting the sector as a whole. Similarly, programs that are closely linked to production, such as those that help fishers cover variable-cost (e.g., fuel) and fixed-cost (e.g., vessels or engines) inputs, are more likely to incentivize overcapacity and overfishing than those clearly decoupled from production. To the right are categories that are associated with the least risk. These include programs that are formally decoupled from production but may still have an impact on fishing capacity and effort, as well as programs that have no effect on production or even contribute to enhancing the well-being of stocks.
This assignment of “risk” is based on a review of an expert international analysis of policy impacts of fisheries support measures, summarized in Annex A. It is a generalization, so it requires careful interpretation, including context-specific considerations, which we come to later in this prioritization framework.
Figure 11 illustrates the distribution of the support measures in our database across these categories. It shows that support for marine fishing in India is largely clustered around input-based support, income and community support for fishers and fishing communities, production-related R&D, and club good infrastructure. It should also be borne in mind that the Sagarmala program is not integrated into our database due to difficulties in attributing support over years and to marine fisheries specifically. This exclusion could have significantly affected the values of support for club good infrastructure, which may be much higher.
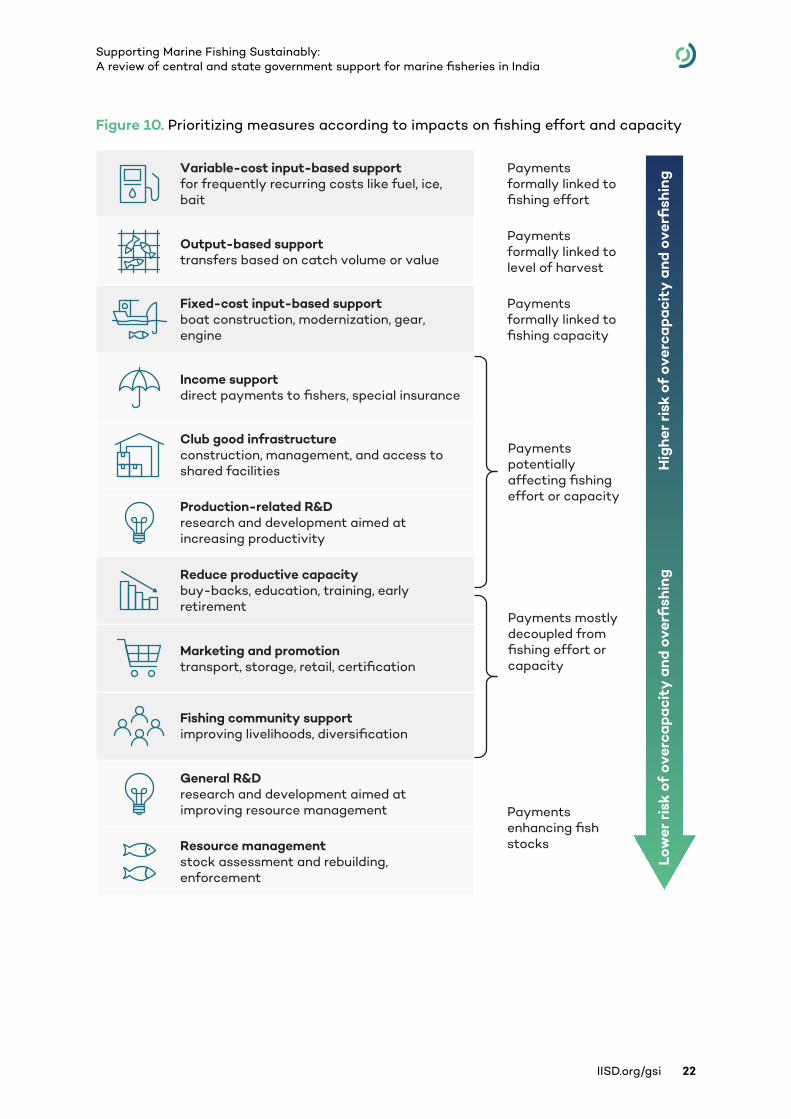
IISD.org/gsi 22
Supporting Marine Fishing Sustainably: A review of central and state government support for marine fisheries in India
Figure 10. Prioritizing measures according to impacts on fishing effort and capacity
Variable-cost input-based support for frequently recurring costs like fuel, ice, bait
Payments formally linked to fishing effort
Payments formally linked to level of harvest
Payments formally linked to fishing capacity
Payments potentially affecting fishing effort or capacity
Payments mostly decoupled from fishing effort or capacity
Payments enhancing fish stocks
Output-based support transfers based on catch volume or value
Fixed-cost input-based support boat construction, modernization, gear, engine
Income support direct payments to fishers, special insurance
Reduce productive capacity buy-backs, education, training, early retirement
Production-related R&Dresearch and development aimed at increasing productivity
Club good infrastructureconstruction, management, and access to shared facilities
General R&Dresearch and development aimed at improving resource management
Marketing and promotion transport, storage, retail, certification
Fishing community support improving livelihoods, diversification
Resource management stock assessment and rebuilding, enforcement
Low
er r
isk
of o
verc
apac
ity
and
ove
rfish
ing
Hig
her
risk
of
over
capa
city
and
ove
rfish
ing
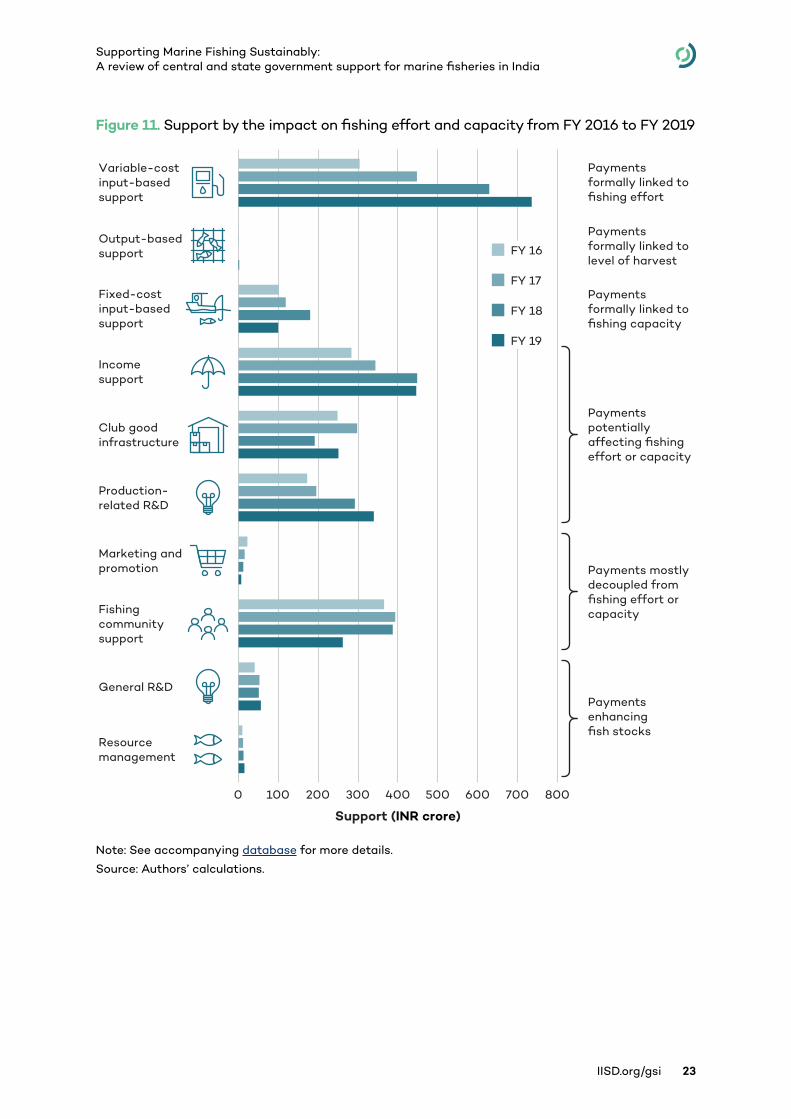
IISD.org/gsi 23
Supporting Marine Fishing Sustainably: A review of central and state government support for marine fisheries in India
Figure 11. Support by the impact on fishing effort and capacity from FY 2016 to FY 2019
Note: See accompanying database for more details.
Source: Authors’ calculations.
Payments formally linked to fishing effort
Payments formally linked to level of harvest
Payments formally linked to fishing capacity
Payments potentially affecting fishing effort or capacity
Payments mostly decoupled from fishing effort or capacity
Payments enhancing fish stocks
Fishing community support
Marketing and promotion
Income support
Fixed-cost input-based support
General R&D
Production- related R&D
Resource management
Output-based support
Variable-cost input-based support
Club good infrastructure
Support (INR crore)
0 100 200 300 400 700600500 800
FY 16
FY 17
FY 18
FY 19
IISD.org/gsi 24
Supporting Marine Fishing Sustainably: A review of central and state government support for marine fisheries in India
Based on the data that are available, we shortlisted three categories of support to investigate at a policy level in the second step of this framework: variable-cost, input-based support; fixed-cost, input-based support; and income support. Expert literature generally considers the first two categories to be high-risk measures because they tend to encourage increased fishing effort and fishing capacity and tend to favour large-scale segments of the sector, often at the expense of small-scale fishers.9 Variable-cost, input-based support is also known for being largely inefficient at improving fishers’ incomes. The third category, income support, can be essential for safeguarding vulnerable populations and is the form of support most directly beneficial to fishers, but its effectiveness and efficiency are highly dependent on good design and implementation. In some cases, it can discourage exit from an industry where a resource is being overexploited.
Figure 12 illustrates the split between central and state government support measures, according to the same categories (see Annex B for a list of schemes by category). This suggests that state policy plays a key role in all three of the categories that have been shortlisted, while Central Government policy plays an important role in the provision of fixed-cost, input-based support and a significant but less weighty role in providing income support.
9 See Martini & Innes, 2018.
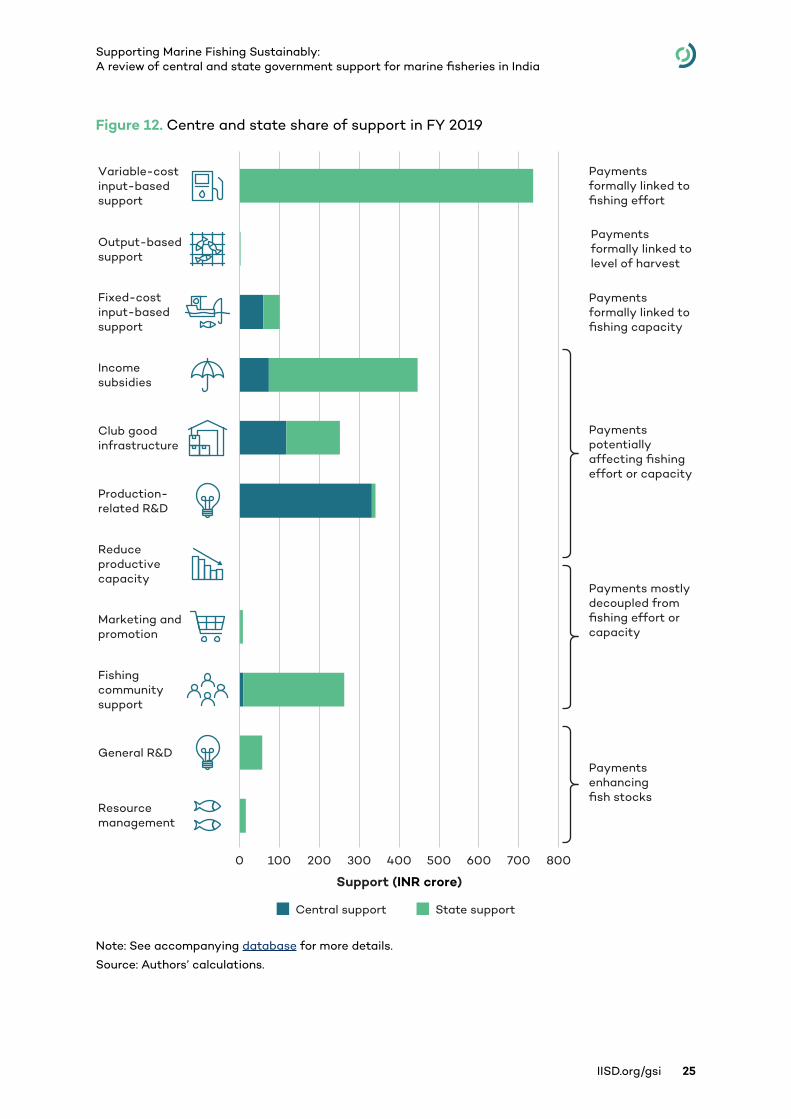
IISD.org/gsi 25
Supporting Marine Fishing Sustainably: A review of central and state government support for marine fisheries in India
Figure 12. Centre and state share of support in FY 2019
Note: See accompanying database for more details.
Source: Authors’ calculations.
Support (INR crore)
0 100 200 300 400 700600500 800
Variable-cost input-based support
Payments formally linked to fishing effort
Payments formally linked to level of harvest
Payments formally linked to fishing capacity
Payments potentially affecting fishing effort or capacity
Payments mostly decoupled from fishing effort or capacity
Payments enhancing fish stocks
Output-based support
Fixed-cost input-based support
Income subsidies
Reduce productive capacity
Production- related R&D
Club good infrastructure
General R&D
Marketing and promotion
Fishing community support
Resource management
State supportCentral support
IISD.org/gsi 26
Supporting Marine Fishing Sustainably: A review of central and state government support for marine fisheries in India
Among the categories where there are large levels of support, but we have not shortlisted them as priorities for evaluation, it can be noted:
• The main support for club good infrastructure was payments related to ice plants, cold storage, fish landing centres, and fishing harbours.
• Under production-related R&D, the main support measure was grants for capital assets, research, and operational expenses for funding of national fisheries research institutions like the CMFRI in Kochi. This has increased significantly in recent years, from INR 205 crore (USD 30.5 million) in FY 2016 to INR 386 crore (USD 54.8 million) in FY 2019. See Section 4.1 for details of Central Government support for fisheries institutions.
• The high level of support for fishing communities was largely driven by housing schemes, skills development and training schemes, special interest loans, and support for fish cooperative societies and self-help groups to procure ice boxes and other fishing inputs. These payments have fallen by more than a quarter in recent years, from INR 366 crore (USD 54 million) in FY 2016 to INR 262 crore (USD 37 million) in FY 2019.
It is also worth noting the low levels of support in certain areas. No schemes were identified that aim to reduce productive capacity. Support for marketing and promotion, general R&D, and resource management were also fairly low. The main measures in these areas were, respectively, support for retail fish markets and mobile kiosks; support for FSI, which assesses fish stocks nationally; support for schemes that promote conservation and awareness; and schemes for regulating fishing through patrolling and maintenance of shore stations.10
Given the fact that all such measures are relatively low risk, it is possible that, should there be a desire to increase support for fisheries in India, it may be worth reviewing the relatively scarce resources dedicated to these areas, though noting the need for a clear relationship with sectoral needs and careful interpretation of data (see Box 4).
10 Shore stations are coastal establishments that are used for various monitoring purposes. They enforce fishing regulations by dispatching patrol units to curb illegal, unreported, and unregulated fishing.
IISD.org/gsi 27
Supporting Marine Fishing Sustainably: A review of central and state government support for marine fisheries in India
Box 5. Should support levels be increased for fisheries management?
Good fisheries management is at the heart of social and economic objectives for fisheries: if stocks are healthy, nutritional objectives can be achieved, livelihoods can prosper, and economic growth is possible within resource constraints. In the absence of effective management measures ensuring the sustainable use of resources, support measures benefiting the sector run the risk of contributing to overfishing and overcapacity at the expense of fishing communities relying on the sector for their livelihood. Based on the measures identified as part of this report, fisheries management only accounts for a relatively low level of support. Does this mean that there is a gap in resourcing for management?
This is a challenging question to answer. It is first important to establish the principle that resources should be driven by sectoral needs: what management services are required, who can provide them, and what is the right role for government support? It is also important to interpret the data carefully. This assessment of government support identified a large expenditure under resources management for the FSI, a large fisheries institute responsible for monitoring fish stocks. Yet India lacks an up-to-date assessment of fish stocks. Reliable fish stock data is integral to fisheries management, and currently, there is no stock rebuilding or conservation goals (Mohamed et al., 2011). This report did not identify other types of resource management expenditure that can support fisheries management, like defining domestic management goals and objectives from an economic, social, or conservation perspective or the desired level of fishing capacity.
Under stock enhancement, this report identified only two states—Karnataka and West Bengal—that spent small amounts in FY 2017 on conservation and awareness. This expenditure was not observed in any other states or FYs. Similarly, enforcement expenditure—for patrolling, enforcing marine laws, and building shore stations—was observed in a few states: Andhra Pradesh, Kerala, and Tamil Nadu. Barring Kerala, all these states spent very little on this type of support.
Better data transparency and a deeper investigation would allow for a more meaningful comparison between the scale of resources dedicated to fishing activities versus ensuring a healthy ecosystem that can support those activities.
5.2 Step 2: Identifying the largest support measures in priority categories
5.2.1 Variable-Cost, Input-Based Support
This category of support would include measures like support for input costs such as fuel, ice, and bait. In India, the largest support measure today in this category is fuel subsidies, as illustrated in Figure 13. As such, we shortlist diesel and kerosene subsidies as being the priority candidate for further evaluation.
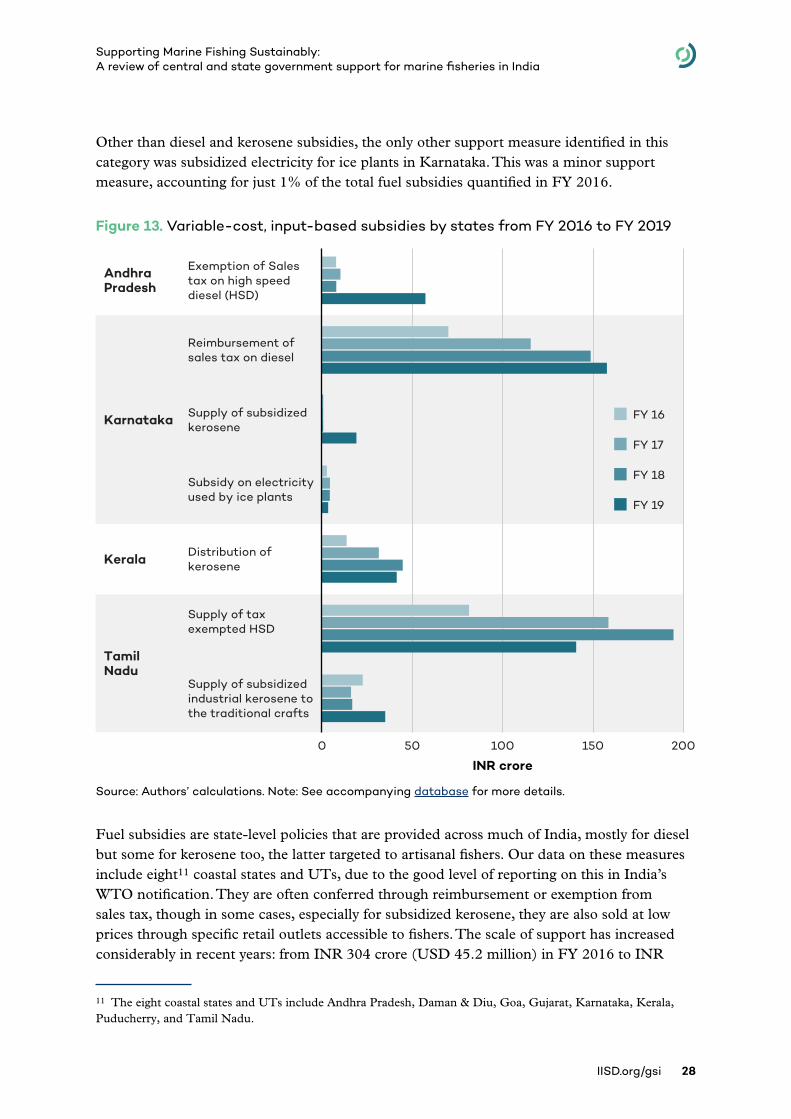
IISD.org/gsi 28
Supporting Marine Fishing Sustainably: A review of central and state government support for marine fisheries in India
Other than diesel and kerosene subsidies, the only other support measure identified in this category was subsidized electricity for ice plants in Karnataka. This was a minor support measure, accounting for just 1% of the total fuel subsidies quantified in FY 2016.
Figure 13. Variable-cost, input-based subsidies by states from FY 2016 to FY 2019
Source: Authors’ calculations. Note: See accompanying database for more details.
Fuel subsidies are state-level policies that are provided across much of India, mostly for diesel but some for kerosene too, the latter targeted to artisanal fishers. Our data on these measures include eight11 coastal states and UTs, due to the good level of reporting on this in India’s WTO notification. They are often conferred through reimbursement or exemption from sales tax, though in some cases, especially for subsidized kerosene, they are also sold at low prices through specific retail outlets accessible to fishers. The scale of support has increased considerably in recent years: from INR 304 crore (USD 45.2 million) in FY 2016 to INR
11 The eight coastal states and UTs include Andhra Pradesh, Daman & Diu, Goa, Gujarat, Karnataka, Kerala, Puducherry, and Tamil Nadu.
INR crore
Exemption of Sales tax on high speed diesel (HSD)
Reimbursement of sales tax on diesel
Supply of subsidized kerosene
Subsidy on electricity used by ice plants
Andhra Pradesh
Karnataka
Kerala
Tamil Nadu
Distribution of kerosene
Supply of tax exempted HSD
Supply of subsidized industrial kerosene to the traditional crafts
0 50 100 150 200
FY 16
FY 17
FY 18
FY 19
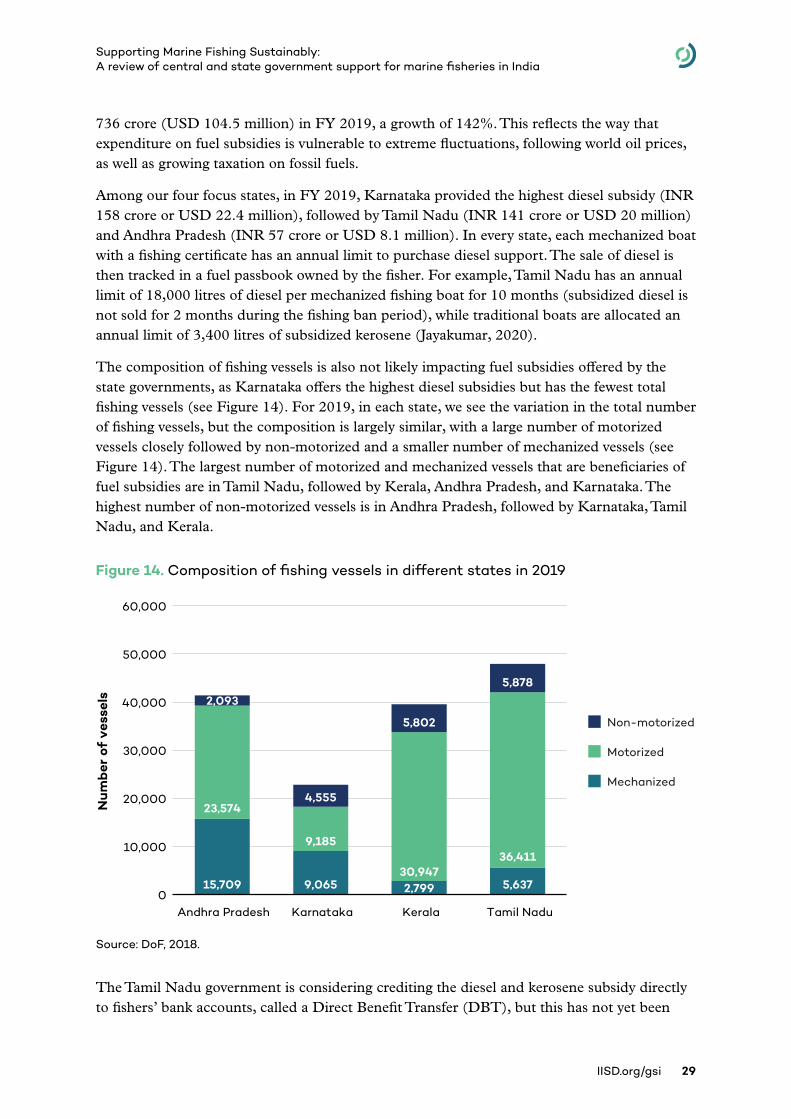
IISD.org/gsi 29
Supporting Marine Fishing Sustainably: A review of central and state government support for marine fisheries in India
736 crore (USD 104.5 million) in FY 2019, a growth of 142%. This reflects the way that expenditure on fuel subsidies is vulnerable to extreme fluctuations, following world oil prices, as well as growing taxation on fossil fuels.
Among our four focus states, in FY 2019, Karnataka provided the highest diesel subsidy (INR 158 crore or USD 22.4 million), followed by Tamil Nadu (INR 141 crore or USD 20 million) and Andhra Pradesh (INR 57 crore or USD 8.1 million). In every state, each mechanized boat with a fishing certificate has an annual limit to purchase diesel support. The sale of diesel is then tracked in a fuel passbook owned by the fisher. For example, Tamil Nadu has an annual limit of 18,000 litres of diesel per mechanized fishing boat for 10 months (subsidized diesel is not sold for 2 months during the fishing ban period), while traditional boats are allocated an annual limit of 3,400 litres of subsidized kerosene (Jayakumar, 2020).
The composition of fishing vessels is also not likely impacting fuel subsidies offered by the state governments, as Karnataka offers the highest diesel subsidies but has the fewest total fishing vessels (see Figure 14). For 2019, in each state, we see the variation in the total number of fishing vessels, but the composition is largely similar, with a large number of motorized vessels closely followed by non-motorized and a smaller number of mechanized vessels (see Figure 14). The largest number of motorized and mechanized vessels that are beneficiaries of fuel subsidies are in Tamil Nadu, followed by Kerala, Andhra Pradesh, and Karnataka. The highest number of non-motorized vessels is in Andhra Pradesh, followed by Karnataka, Tamil Nadu, and Kerala.
Figure 14. Composition of fishing vessels in different states in 2019
Source: DoF, 2018.
The Tamil Nadu government is considering crediting the diesel and kerosene subsidy directly to fishers’ bank accounts, called a Direct Benefit Transfer (DBT), but this has not yet been
Mechanized
Motorized
Non-motorized
15,709 9,065 2,799 5,637
23,574
9,185
30,94736,411
2,093
4,555
5,802
5,878
0
10,000
20,000
30,000
40,000
50,000
60,000
Andhra Pradesh Karnataka Kerala Tamil Nadu
Num
ber
of
vess
els
IISD.org/gsi 30
Supporting Marine Fishing Sustainably: A review of central and state government support for marine fisheries in India
confirmed (Jayakumar, 2020). The Karnataka state government has begun a direct credit of diesel subsidy to the bank accounts of boat owners (Government of Karnataka, 2020). DBT is used by both the national and state governments for various schemes involving support like scholarships and liquefied petroleum gas support. Fisher associations regularly demand hikes in diesel support (The Hindu, 2021), and these have recently been granted by state governments (The Hindu, 2020). Some states, like Andhra Pradesh, have also hiked diesel support to mitigate the impacts of rising fuel prices and loss of incomes during the pandemic (Rao, 2020).
In FY 2019, kerosene support was highest in Kerala (INR 41 crore or USD 5.8 million), followed by Tamil Nadu (INR 35 crore or USD 4.9 million) and Karnataka (INR 19 crore or USD 2.7 million). In Kerala, kerosene is sold at market prices at special retail outlets in coastal districts. Eligible fishers are allowed to purchase kerosene at market prices, and the subsidy is credited directly to their bank accounts (Matsyafed, n.d.).
An evaluation of diesel and kerosene support could focus on several aspects, including their impacts on fishing levels, the state of fish stocks, and their effectiveness and efficiency in achieving their policy objectives. Fuel subsidies are typically inefficient in transferring benefits to fishers (Martini & Innes, 2018). Fuel subsidies in India have a long history of being prone to leakages, where they are captured by middlemen who then resell the fuel at higher prices to fishers or other users (Clarke, 2015; Garg et al., 2017). They can also be socially regressive because greater benefits tend to accrue to richer consumers, who can afford to purchase more (Garg et al., 2017). Larger vessels (>130 horsepower) can receive up to four times more diesel support than smaller vessels (<40 horsepower) (Government of Karnataka, 2017). The reform of diesel and kerosene subsidies for non-fisheries has been undertaken at an economy-wide national level in India over the past decade, allowing resources to be reallocated to more effective measures.
There are also a number of operational issues that could be investigated. Recent reporting suggests that there have been delays of over a year in reimbursement of the diesel subsidy to the fishers (DT Next, 2020; Government of Karnataka, 2017). Fisher associations have also reported delays in the granting of fishers’ identification cards, which can affect access to these benefits, particularly among small-scale fishers who may have less capacity to resolve administrative challenges (Government of Karnataka, 2017).
5.2.2 Fixed-Cost, Input-Based Support
This category of support is for fixed-cost inputs such as vessel purchase or construction, vessel modernization, and other fixed costs like equipment for sea cage culture or transportation, ice boxes, and safety gear. Our data on these measures include 1312 coastal states and UTs, as well as some of the expenditures made by MPEDA.
This form of support has fallen marginally, by 2% from INR 101 crore (USD 15 million) in FY 2016 to INR 100 crore (USD 14 million) in FY 2019. Over the four years of data, “other
12 The 13 coastal states and UTs include Andaman & Nicobar, Andhra Pradesh, Daman & Diu, Goa, Gujarat, Karnataka, Kerala, Lakshadweep, Maharashtra, Odisha, Puducherry, Tamil Nadu, and West Bengal.
IISD.org/gsi 31
Supporting Marine Fishing Sustainably: A review of central and state government support for marine fisheries in India
fixed costs” have received the most support, followed by vessel construction and modernization. Figure 15 illustrates the main measures from FY 2016 to FY 2019. The figure contains a much wider range of measures than variable-cost, input-based support, and the patterns in government resourcing also tend to be “lumpy,” with little consistency between years. This reflects the way in which state governments are supporting one-off investments rather than ongoing consumption. The measures are also typically smaller than ongoing support linked to fuel consumption or incomes. This also reflects the nature of the support category, which is generally built around strategic assistance to unlock larger private investments.
We shortlisted three key schemes that receive high financial support and remain a key focus of the government in the PMMSY policy: support to deep-sea fishing vessels, vessel purchase for traditional fishers, and the construction of sea cages.
Over the four years of data, one vessel construction scheme in Tamil Nadu is significantly larger than any other: INR 100 crore (USD 14 million) of support in FY 2018 for the introduction of deep-sea fishing vessels. This is part of a centrally sponsored scheme that has counterparts in Andhra Pradesh and Karnataka as well. We recommend short listing this scheme as a priority for evaluation, given its broad relevance across many states and its focus on vessel construction, which has a risk of increasing fishing capacity to unsustainable levels. It is part of a general strategy articulated in the recent draft of NFP 2020 to help shift fishing efforts away from heavily exploited nearshore fisheries and to increase production in deep-sea fisheries that are thought to have room for further development. An evaluation could focus on the extent to which actual impacts are in line with these intended impacts. Tamil Nadu offered another scheme for vessel purchase with high support through a subsidy on the purchase of new tuna longliner vessels13 at INR 13.2 crore (USD 1.9 million) in FY 2019. This scheme has consistently seen increasing support over the four years of data in this report.
For similar reasons, we also shortlisted a key scheme focused on vessel purchase: support to help artisanal fishers use FRP boats instead of traditional wooden boats. This is offered in all four states in our dataset, sponsored by the Central Government. Annual disbursements are not typically large but can accumulate to more significant levels over time. Karnataka—the state in our dataset that spent the most on FRP boats—for example, disbursed a total of INR 5.67 crore (USD 805,168) from FY 2016 to FY 2019.
The third shortlisted scheme is the construction of sea cages: a form of aquaculture (viewed as part of “other fixed costs”) that received high financial support in FY 2018 and FY 2019. In FY 2019, most of the expenditure, INR 25 crore (USD 3.6 million) or 96% of the expenditure toward all types of mariculture schemes, was made in Maharashtra for the construction of cage pens in open waters. The remaining states offer a range of smaller-value schemes for the construction of sea cages but also for seaweed culture, mussel farming, and pearl culture. The government is actively promoting sea cages in the PMMSY policy (see Annex C) to avoid depending on marine fishing. Sea cage fish production has seen high uptake that has increased the demand for a key input—fish meal—which has wider environmental impacts (see Box 2 on fish meal in Section 2). An environmental impact
13 Note that in government documentation, tuna longliner vessels are sometimes referred to as “tuna longliner-cum-gillnetter boats.”
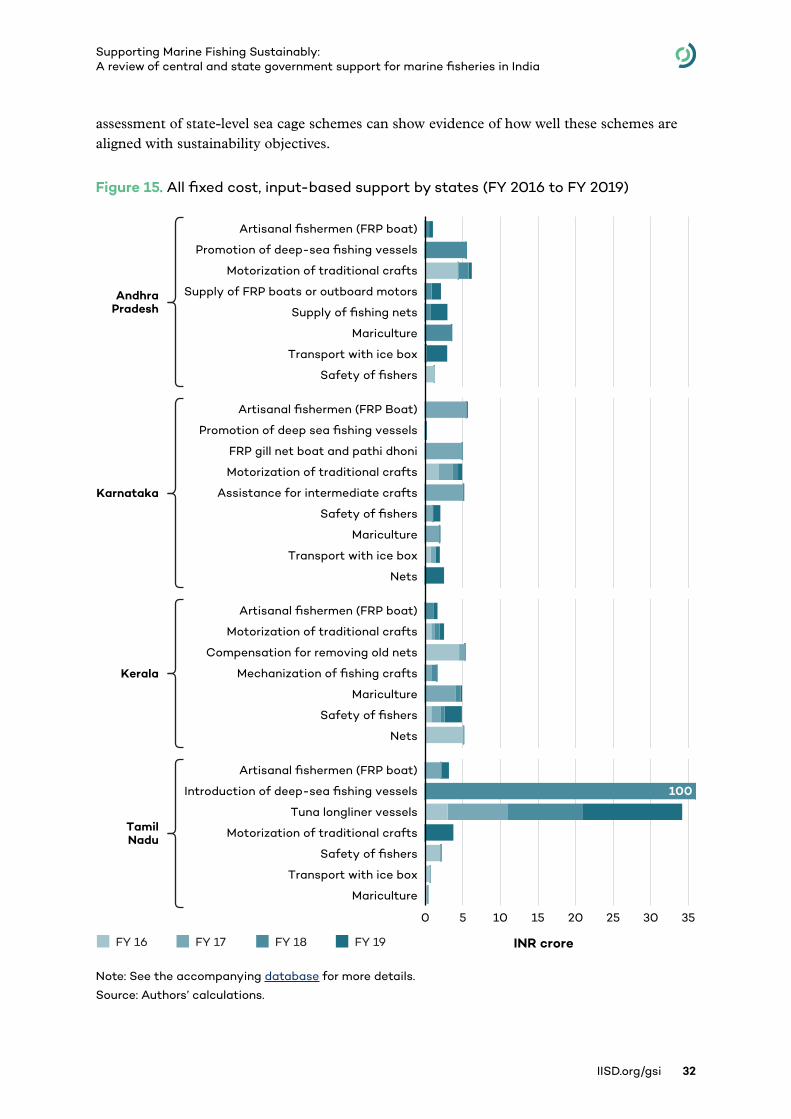
IISD.org/gsi 32
Supporting Marine Fishing Sustainably: A review of central and state government support for marine fisheries in India
assessment of state-level sea cage schemes can show evidence of how well these schemes are aligned with sustainability objectives.
Figure 15. All fixed cost, input-based support by states (FY 2016 to FY 2019)
Note: See the accompanying database for more details.
Source: Authors’ calculations.
AndhraPradesh
Karnataka
Kerala
TamilNadu
Artisanal fishermen (FRP boat)
Promotion of deep-sea fishing vessels
Motorization of traditional crafts
Supply of FRP boats or outboard motors
Supply of fishing nets
Mariculture
Transport with ice box
Safety of fishers
Artisanal fishermen (FRP Boat)
Promotion of deep sea fishing vessels
FRP gill net boat and pathi dhoni
Motorization of traditional crafts
Assistance for intermediate crafts
Safety of fishers
Mariculture
Transport with ice box
Nets
Artisanal fishermen (FRP boat)
Motorization of traditional crafts
Compensation for removing old nets
Mechanization of fishing crafts
Mariculture
Nets
Safety of fishers
Artisanal fishermen (FRP boat)
Introduction of deep-sea fishing vessels
Tuna longliner vessels
Motorization of traditional crafts
Safety of fishers
Transport with ice box
Mariculture
INR crore
0 5 10 15 25 3020 35
FY 16 FY 17 FY 18 FY 19
100
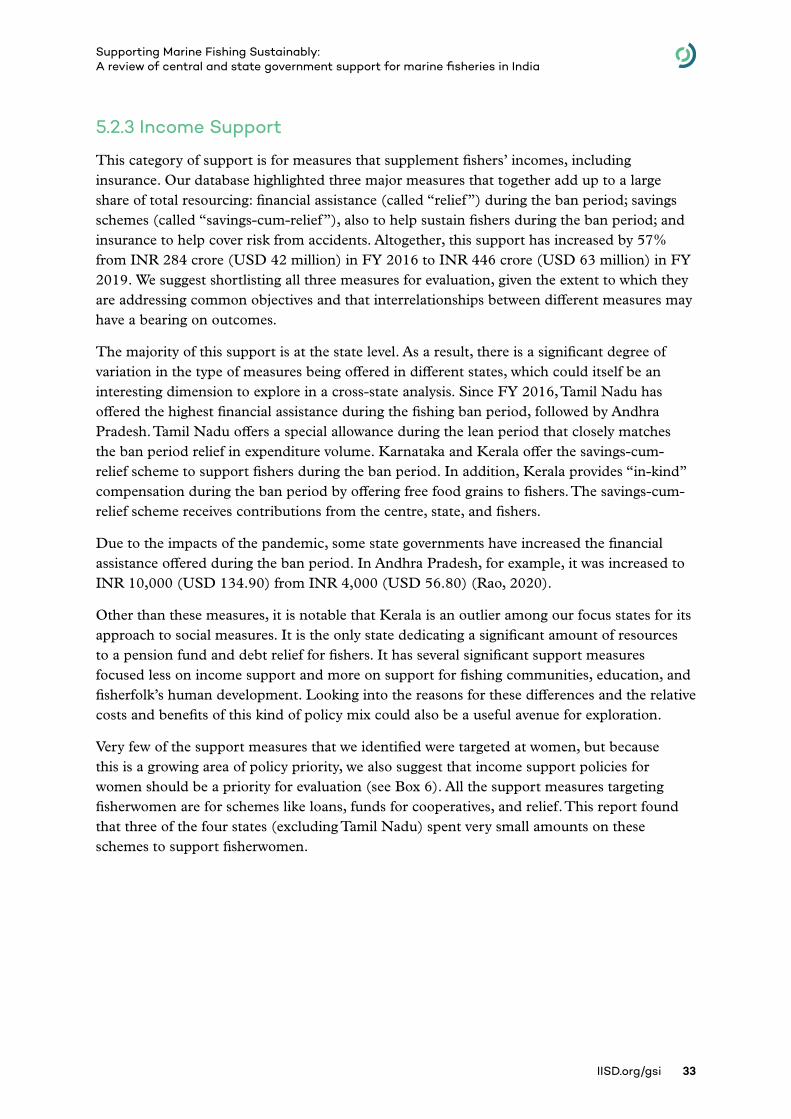
IISD.org/gsi 33
Supporting Marine Fishing Sustainably: A review of central and state government support for marine fisheries in India
5.2.3 Income Support
This category of support is for measures that supplement fishers’ incomes, including insurance. Our database highlighted three major measures that together add up to a large share of total resourcing: financial assistance (called “relief”) during the ban period; savings schemes (called “savings-cum-relief”), also to help sustain fishers during the ban period; and insurance to help cover risk from accidents. Altogether, this support has increased by 57% from INR 284 crore (USD 42 million) in FY 2016 to INR 446 crore (USD 63 million) in FY 2019. We suggest shortlisting all three measures for evaluation, given the extent to which they are addressing common objectives and that interrelationships between different measures may have a bearing on outcomes.
The majority of this support is at the state level. As a result, there is a significant degree of variation in the type of measures being offered in different states, which could itself be an interesting dimension to explore in a cross-state analysis. Since FY 2016, Tamil Nadu has offered the highest financial assistance during the fishing ban period, followed by Andhra Pradesh. Tamil Nadu offers a special allowance during the lean period that closely matches the ban period relief in expenditure volume. Karnataka and Kerala offer the savings-cum-relief scheme to support fishers during the ban period. In addition, Kerala provides “in-kind” compensation during the ban period by offering free food grains to fishers. The savings-cum-relief scheme receives contributions from the centre, state, and fishers.
Due to the impacts of the pandemic, some state governments have increased the financial assistance offered during the ban period. In Andhra Pradesh, for example, it was increased to INR 10,000 (USD 134.90) from INR 4,000 (USD 56.80) (Rao, 2020).
Other than these measures, it is notable that Kerala is an outlier among our focus states for its approach to social measures. It is the only state dedicating a significant amount of resources to a pension fund and debt relief for fishers. It has several significant support measures focused less on income support and more on support for fishing communities, education, and fisherfolk’s human development. Looking into the reasons for these differences and the relative costs and benefits of this kind of policy mix could also be a useful avenue for exploration.
Very few of the support measures that we identified were targeted at women, but because this is a growing area of policy priority, we also suggest that income support policies for women should be a priority for evaluation (see Box 6). All the support measures targeting fisherwomen are for schemes like loans, funds for cooperatives, and relief. This report found that three of the four states (excluding Tamil Nadu) spent very small amounts on these schemes to support fisherwomen.
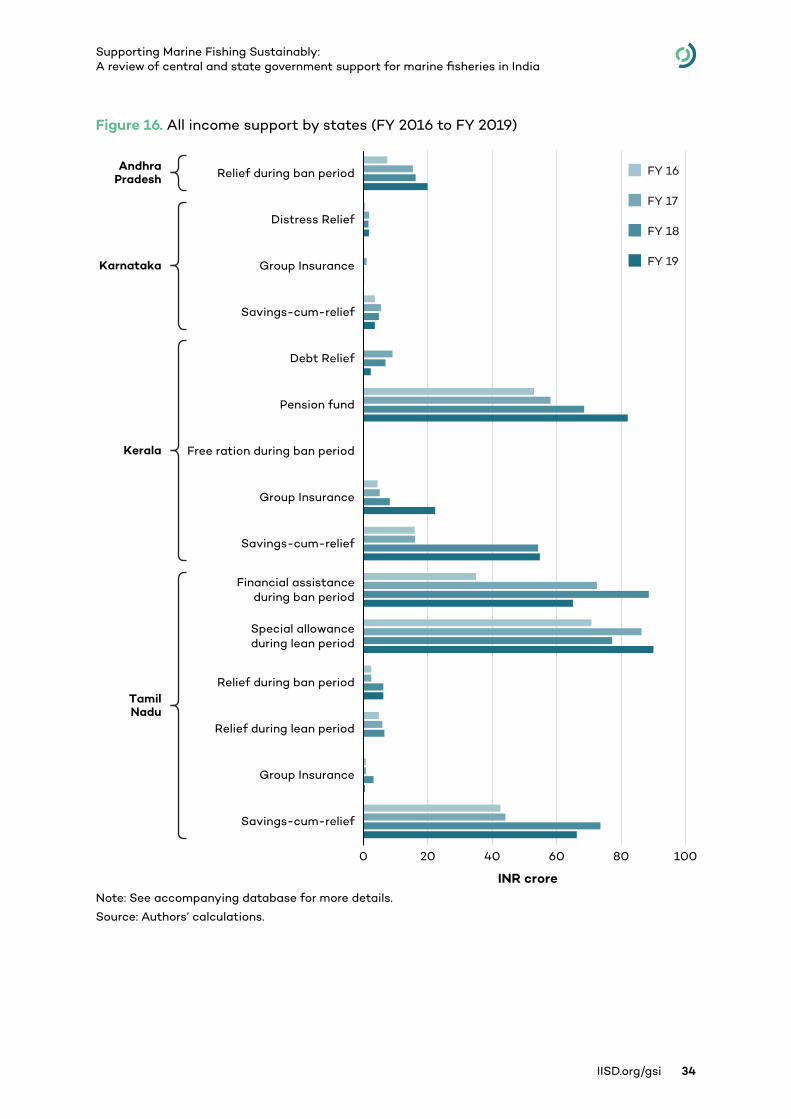
IISD.org/gsi 34
Supporting Marine Fishing Sustainably: A review of central and state government support for marine fisheries in India
Figure 16. All income support by states (FY 2016 to FY 2019)
Note: See accompanying database for more details.
Source: Authors’ calculations.
INR crore
AndhraPradesh
Karnataka
Kerala
TamilNadu
FY 16
FY 17
FY 18
FY 19
0 20 40 60 80 100
Relief during ban period
Distress Relief
Group Insurance
Savings-cum-relief
Debt Relief
Pension fund
Free ration during ban period
Group Insurance
Savings-cum-relief
Financial assistanceduring ban period
Special allowanceduring lean period
Relief during ban period
Relief during lean period
Group Insurance
Savings-cum-relief
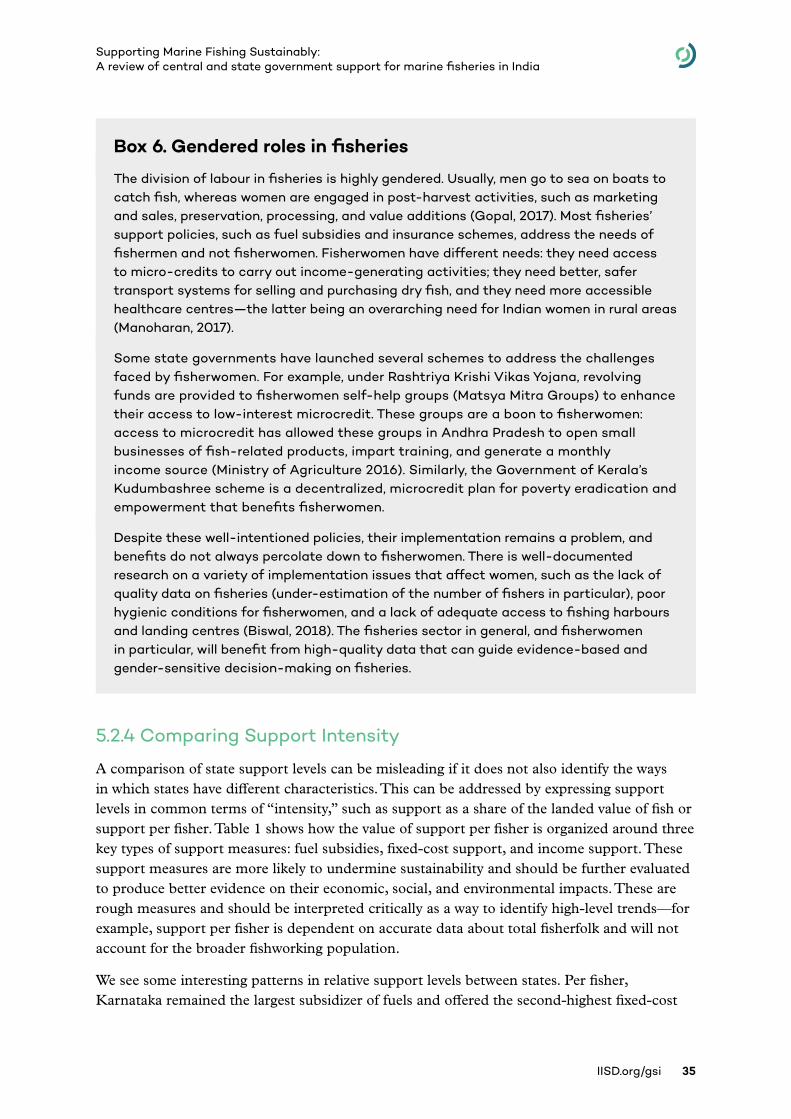
IISD.org/gsi 35
Supporting Marine Fishing Sustainably: A review of central and state government support for marine fisheries in India
Box 6. Gendered roles in fisheries
The division of labour in fisheries is highly gendered. Usually, men go to sea on boats to catch fish, whereas women are engaged in post-harvest activities, such as marketing and sales, preservation, processing, and value additions (Gopal, 2017). Most fisheries’ support policies, such as fuel subsidies and insurance schemes, address the needs of fishermen and not fisherwomen. Fisherwomen have different needs: they need access to micro-credits to carry out income-generating activities; they need better, safer transport systems for selling and purchasing dry fish, and they need more accessible healthcare centres—the latter being an overarching need for Indian women in rural areas (Manoharan, 2017).
Some state governments have launched several schemes to address the challenges faced by fisherwomen. For example, under Rashtriya Krishi Vikas Yojana, revolving funds are provided to fisherwomen self-help groups (Matsya Mitra Groups) to enhance their access to low-interest microcredit. These groups are a boon to fisherwomen: access to microcredit has allowed these groups in Andhra Pradesh to open small businesses of fish-related products, impart training, and generate a monthly income source (Ministry of Agriculture 2016). Similarly, the Government of Kerala’s Kudumbashree scheme is a decentralized, microcredit plan for poverty eradication and empowerment that benefits fisherwomen.
Despite these well-intentioned policies, their implementation remains a problem, and benefits do not always percolate down to fisherwomen. There is well-documented research on a variety of implementation issues that affect women, such as the lack of quality data on fisheries (under-estimation of the number of fishers in particular), poor hygienic conditions for fisherwomen, and a lack of adequate access to fishing harbours and landing centres (Biswal, 2018). The fisheries sector in general, and fisherwomen in particular, will benefit from high-quality data that can guide evidence-based and gender-sensitive decision-making on fisheries.
5.2.4 Comparing Support Intensity
A comparison of state support levels can be misleading if it does not also identify the ways in which states have different characteristics. This can be addressed by expressing support levels in common terms of “intensity,” such as support as a share of the landed value of fish or support per fisher. Table 1 shows how the value of support per fisher is organized around three key types of support measures: fuel subsidies, fixed-cost support, and income support. These support measures are more likely to undermine sustainability and should be further evaluated to produce better evidence on their economic, social, and environmental impacts. These are rough measures and should be interpreted critically as a way to identify high-level trends—for example, support per fisher is dependent on accurate data about total fisherfolk and will not account for the broader fishworking population.
We see some interesting patterns in relative support levels between states. Per fisher, Karnataka remained the largest subsidizer of fuels and offered the second-highest fixed-cost
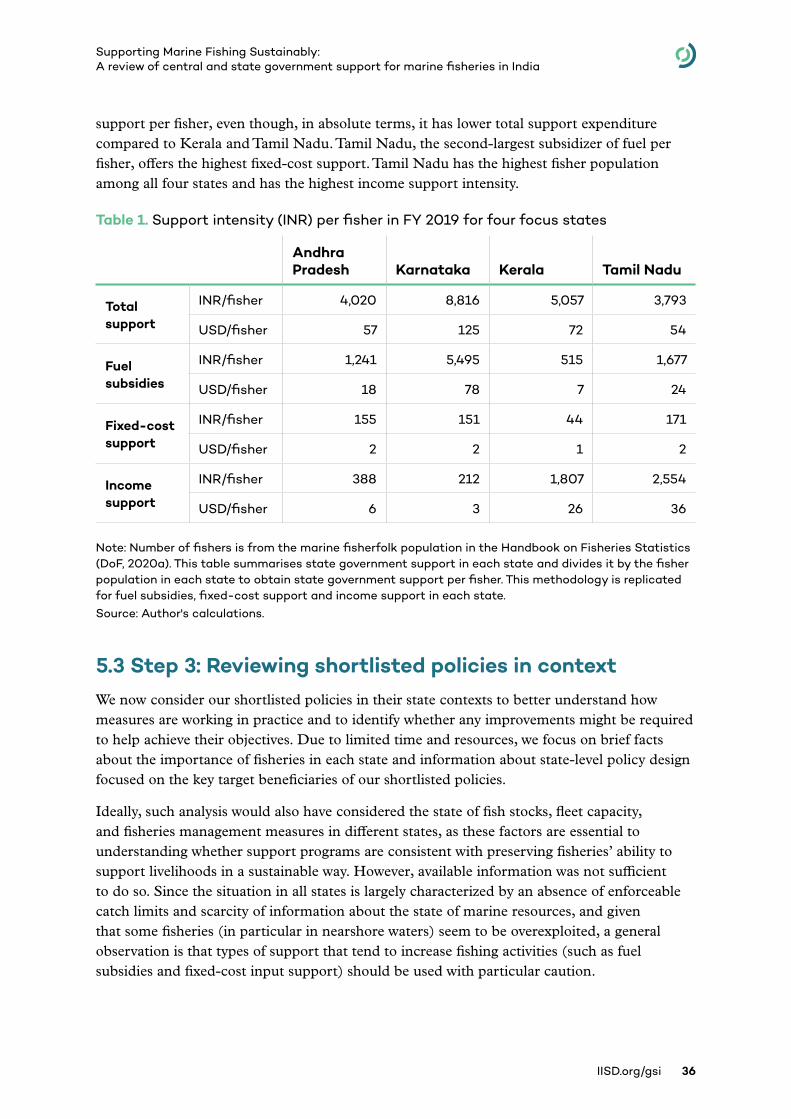
IISD.org/gsi 36
Supporting Marine Fishing Sustainably: A review of central and state government support for marine fisheries in India
support per fisher, even though, in absolute terms, it has lower total support expenditure compared to Kerala and Tamil Nadu. Tamil Nadu, the second-largest subsidizer of fuel per fisher, offers the highest fixed-cost support. Tamil Nadu has the highest fisher population among all four states and has the highest income support intensity.
Table 1. Support intensity (INR) per fisher in FY 2019 for four focus states
Andhra Pradesh Karnataka Kerala Tamil Nadu
Total support
INR/fisher 4,020 8,816 5,057 3,793
USD/fisher 57 125 72 54
Fuel subsidies
INR/fisher 1,241 5,495 515 1,677
USD/fisher 18 78 7 24
Fixed-cost support
INR/fisher 155 151 44 171
USD/fisher 2 2 1 2
Income support
INR/fisher 388 212 1,807 2,554
USD/fisher 6 3 26 36
Note: Number of fishers is from the marine fisherfolk population in the Handbook on Fisheries Statistics (DoF, 2020a). This table summarises state government support in each state and divides it by the fisher population in each state to obtain state government support per fisher. This methodology is replicated for fuel subsidies, fixed-cost support and income support in each state. Source: Author's calculations.
5.3 Step 3: Reviewing shortlisted policies in context We now consider our shortlisted policies in their state contexts to better understand how measures are working in practice and to identify whether any improvements might be required to help achieve their objectives. Due to limited time and resources, we focus on brief facts about the importance of fisheries in each state and information about state-level policy design focused on the key target beneficiaries of our shortlisted policies.
Ideally, such analysis would also have considered the state of fish stocks, fleet capacity, and fisheries management measures in different states, as these factors are essential to understanding whether support programs are consistent with preserving fisheries’ ability to support livelihoods in a sustainable way. However, available information was not sufficient to do so. Since the situation in all states is largely characterized by an absence of enforceable catch limits and scarcity of information about the state of marine resources, and given that some fisheries (in particular in nearshore waters) seem to be overexploited, a general observation is that types of support that tend to increase fishing activities (such as fuel subsidies and fixed-cost input support) should be used with particular caution.
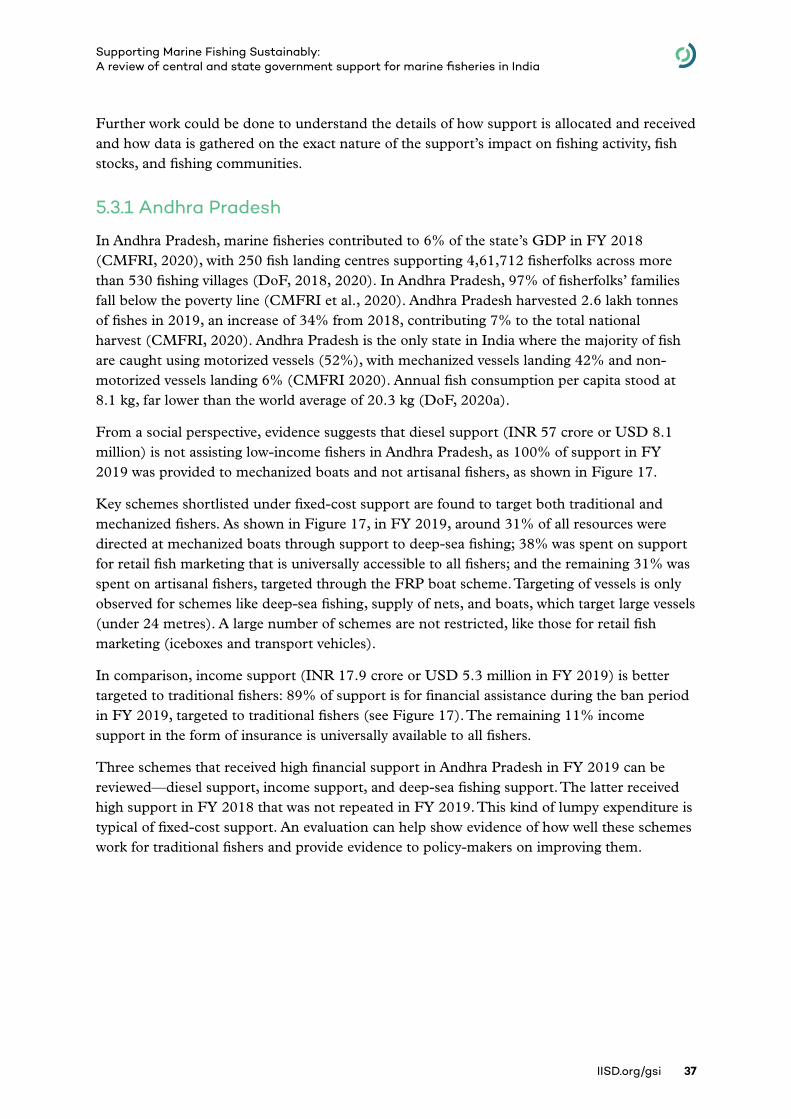
IISD.org/gsi 37
Supporting Marine Fishing Sustainably: A review of central and state government support for marine fisheries in India
Further work could be done to understand the details of how support is allocated and received and how data is gathered on the exact nature of the support’s impact on fishing activity, fish stocks, and fishing communities.
5.3.1 Andhra Pradesh
In Andhra Pradesh, marine fisheries contributed to 6% of the state’s GDP in FY 2018 (CMFRI, 2020), with 250 fish landing centres supporting 4,61,712 fisherfolks across more than 530 fishing villages (DoF, 2018, 2020). In Andhra Pradesh, 97% of fisherfolks’ families fall below the poverty line (CMFRI et al., 2020). Andhra Pradesh harvested 2.6 lakh tonnes of fishes in 2019, an increase of 34% from 2018, contributing 7% to the total national harvest (CMFRI, 2020). Andhra Pradesh is the only state in India where the majority of fish are caught using motorized vessels (52%), with mechanized vessels landing 42% and non-motorized vessels landing 6% (CMFRI 2020). Annual fish consumption per capita stood at 8.1 kg, far lower than the world average of 20.3 kg (DoF, 2020a).
From a social perspective, evidence suggests that diesel support (INR 57 crore or USD 8.1 million) is not assisting low-income fishers in Andhra Pradesh, as 100% of support in FY 2019 was provided to mechanized boats and not artisanal fishers, as shown in Figure 17.
Key schemes shortlisted under fixed-cost support are found to target both traditional and mechanized fishers. As shown in Figure 17, in FY 2019, around 31% of all resources were directed at mechanized boats through support to deep-sea fishing; 38% was spent on support for retail fish marketing that is universally accessible to all fishers; and the remaining 31% was spent on artisanal fishers, targeted through the FRP boat scheme. Targeting of vessels is only observed for schemes like deep-sea fishing, supply of nets, and boats, which target large vessels (under 24 metres). A large number of schemes are not restricted, like those for retail fish marketing (iceboxes and transport vehicles).
In comparison, income support (INR 17.9 crore or USD 5.3 million in FY 2019) is better targeted to traditional fishers: 89% of support is for financial assistance during the ban period in FY 2019, targeted to traditional fishers (see Figure 17). The remaining 11% income support in the form of insurance is universally available to all fishers.
Three schemes that received high financial support in Andhra Pradesh in FY 2019 can be reviewed––diesel support, income support, and deep-sea fishing support. The latter received high support in FY 2018 that was not repeated in FY 2019. This kind of lumpy expenditure is typical of fixed-cost support. An evaluation can help show evidence of how well these schemes work for traditional fishers and provide evidence to policy-makers on improving them.
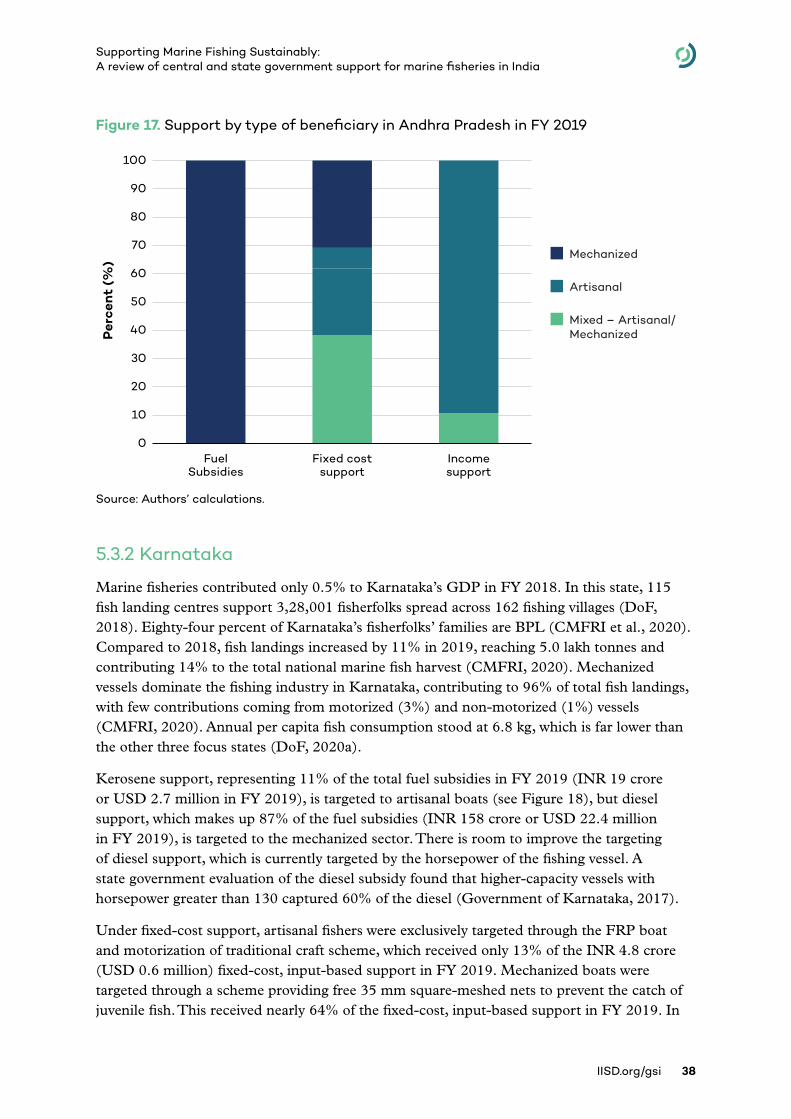
IISD.org/gsi 38
Supporting Marine Fishing Sustainably: A review of central and state government support for marine fisheries in India
Figure 17. Support by type of beneficiary in Andhra Pradesh in FY 2019
Source: Authors’ calculations.
5.3.2 Karnataka
Marine fisheries contributed only 0.5% to Karnataka’s GDP in FY 2018. In this state, 115 fish landing centres support 3,28,001 fisherfolks spread across 162 fishing villages (DoF, 2018). Eighty-four percent of Karnataka’s fisherfolks’ families are BPL (CMFRI et al., 2020). Compared to 2018, fish landings increased by 11% in 2019, reaching 5.0 lakh tonnes and contributing 14% to the total national marine fish harvest (CMFRI, 2020). Mechanized vessels dominate the fishing industry in Karnataka, contributing to 96% of total fish landings, with few contributions coming from motorized (3%) and non-motorized (1%) vessels (CMFRI, 2020). Annual per capita fish consumption stood at 6.8 kg, which is far lower than the other three focus states (DoF, 2020a).
Kerosene support, representing 11% of the total fuel subsidies in FY 2019 (INR 19 crore or USD 2.7 million in FY 2019), is targeted to artisanal boats (see Figure 18), but diesel support, which makes up 87% of the fuel subsidies (INR 158 crore or USD 22.4 million in FY 2019), is targeted to the mechanized sector. There is room to improve the targeting of diesel support, which is currently targeted by the horsepower of the fishing vessel. A state government evaluation of the diesel subsidy found that higher-capacity vessels with horsepower greater than 130 captured 60% of the diesel (Government of Karnataka, 2017).
Under fixed-cost support, artisanal fishers were exclusively targeted through the FRP boat and motorization of traditional craft scheme, which received only 13% of the INR 4.8 crore (USD 0.6 million) fixed-cost, input-based support in FY 2019. Mechanized boats were targeted through a scheme providing free 35 mm square-meshed nets to prevent the catch of juvenile fish. This received nearly 64% of the fixed-cost, input-based support in FY 2019. In
Per
cent
(%
)
Mechanized
Artisanal
Mixed – Artisanal/Mechanized
0
10
20
30
40
50
60
70
80
90
100
FuelSubsidies
Fixed costsupport
Incomesupport
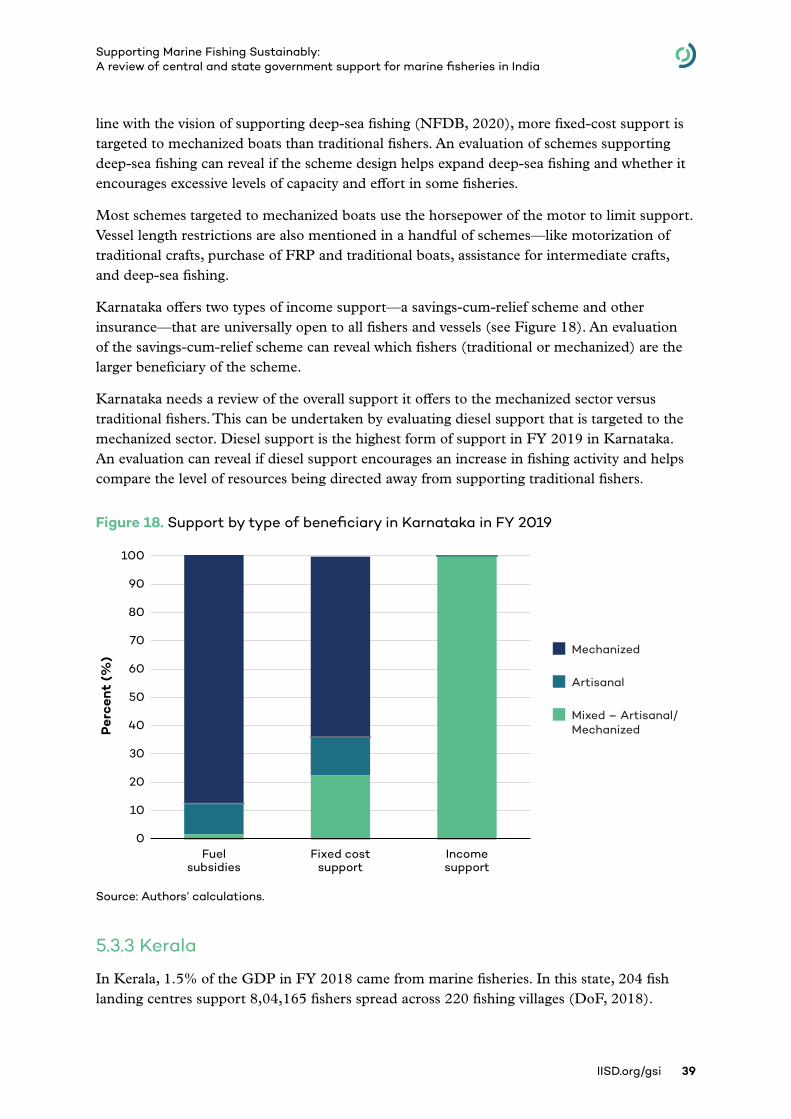
IISD.org/gsi 39
Supporting Marine Fishing Sustainably: A review of central and state government support for marine fisheries in India
line with the vision of supporting deep-sea fishing (NFDB, 2020), more fixed-cost support is targeted to mechanized boats than traditional fishers. An evaluation of schemes supporting deep-sea fishing can reveal if the scheme design helps expand deep-sea fishing and whether it encourages excessive levels of capacity and effort in some fisheries.
Most schemes targeted to mechanized boats use the horsepower of the motor to limit support. Vessel length restrictions are also mentioned in a handful of schemes—like motorization of traditional crafts, purchase of FRP and traditional boats, assistance for intermediate crafts, and deep-sea fishing.
Karnataka offers two types of income support—a savings-cum-relief scheme and other insurance—that are universally open to all fishers and vessels (see Figure 18). An evaluation of the savings-cum-relief scheme can reveal which fishers (traditional or mechanized) are the larger beneficiary of the scheme.
Karnataka needs a review of the overall support it offers to the mechanized sector versus traditional fishers. This can be undertaken by evaluating diesel support that is targeted to the mechanized sector. Diesel support is the highest form of support in FY 2019 in Karnataka. An evaluation can reveal if diesel support encourages an increase in fishing activity and helps compare the level of resources being directed away from supporting traditional fishers.
Figure 18. Support by type of beneficiary in Karnataka in FY 2019
Source: Authors’ calculations.
5.3.3 Kerala
In Kerala, 1.5% of the GDP in FY 2018 came from marine fisheries. In this state, 204 fish landing centres support 8,04,165 fishers spread across 220 fishing villages (DoF, 2018).
Per
cent
(%
)
0
10
20
30
40
50
60
70
80
90
100
Fuelsubsidies
Fixed costsupport
Incomesupport
Mechanized
Artisanal
Mixed – Artisanal/Mechanized
IISD.org/gsi 40
Supporting Marine Fishing Sustainably: A review of central and state government support for marine fisheries in India
Around 60% of Kerala’s fishers are living below the poverty line, notably lower than fisher poverty levels in other states (CMFRI et al., 2020). In FY 2018, 78% of fish in the state were landed by mechanized vessels, 21% by motorized, and 1% by non-motorized vessels (CMFRI, 2020). Frequent cyclones in the Arabian Sea were responsible for a 15% decline in Kerala’s FY 2019 fish landings, amounting to 5.44 lakh tonnes and contributing to 15% of the total national marine fish harvest (CMFRI, 2020). Annual per capita fish consumption was higher compared to other states at 19.41 kg (DoF, 2020a).
Kerala is progressive compared to other states, as the state targets kerosene support (INR 41 crore or USD 5.8 million in FY 2019) at artisanal fishers only (see Figure 19). The state does not offer diesel support, which is more likely to benefit the mechanized sector.
Fixed-cost, input-based support is a much smaller expenditure at INR 3.6 crore (USD 0.5 million) in FY 2019, with most of it spent universally on the safety of fishers. The smaller amounts spent on motorization of traditional crafts and the purchase of FRP boats are targeted to artisanal fishers (see Figure 19).
In FY 2019, Kerala spent more on income support (INR 145 crore or USD 20.6 million) than on fuel subsidies (INR 41 crore USD 5.8 million). Income support in the form of contributions to the pension fund, savings-cum-relief scheme, insurance, and free rations to fishers is not restricted to a type of beneficiary. An evaluation of the savings-cum-relief scheme can reveal which fishers (traditional or mechanized) are the larger beneficiary of the scheme.
Figure 19. Support by type of beneficiary in Kerala in FY 2019
Source: Authors’ calculations.
Mechanized
Artisanal
Mixed – Artisanal/MechanizedP
erce
nt (
%)
0
10
20
30
40
50
60
70
80
90
100
Fuelsubsidies
Fixed costsupport
Incomesupport
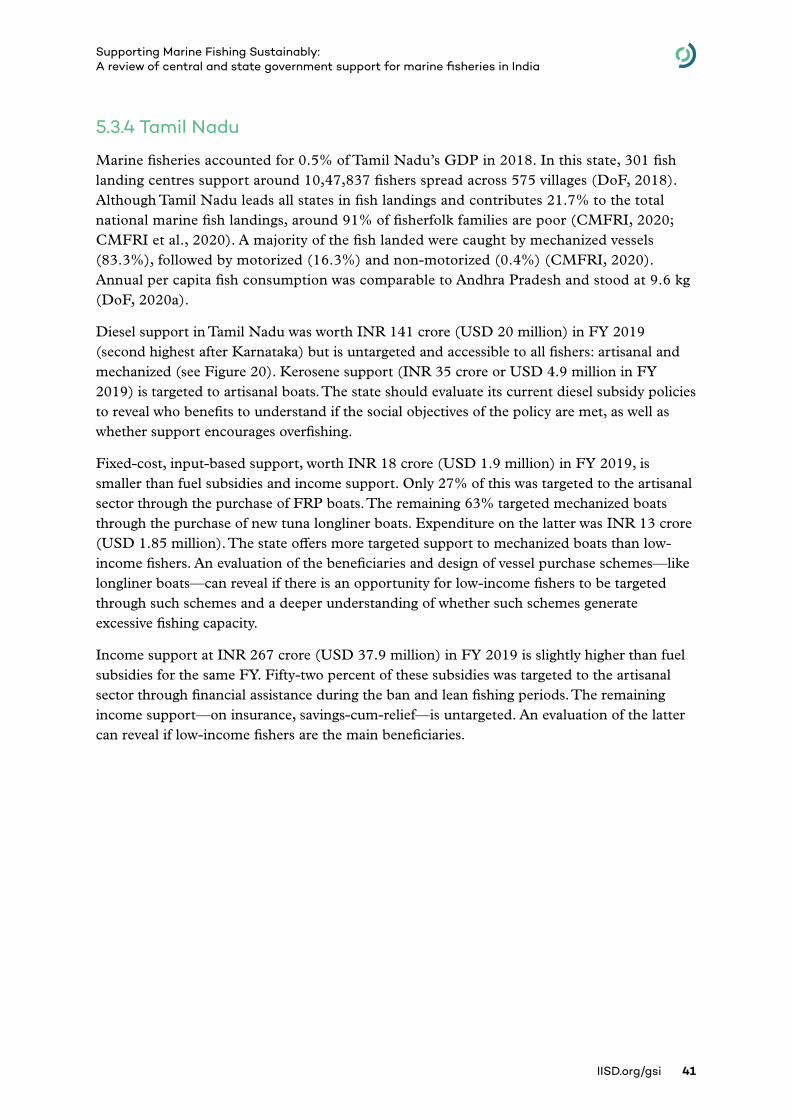
IISD.org/gsi 41
Supporting Marine Fishing Sustainably: A review of central and state government support for marine fisheries in India
5.3.4 Tamil Nadu
Marine fisheries accounted for 0.5% of Tamil Nadu’s GDP in 2018. In this state, 301 fish landing centres support around 10,47,837 fishers spread across 575 villages (DoF, 2018). Although Tamil Nadu leads all states in fish landings and contributes 21.7% to the total national marine fish landings, around 91% of fisherfolk families are poor (CMFRI, 2020; CMFRI et al., 2020). A majority of the fish landed were caught by mechanized vessels (83.3%), followed by motorized (16.3%) and non-motorized (0.4%) (CMFRI, 2020). Annual per capita fish consumption was comparable to Andhra Pradesh and stood at 9.6 kg (DoF, 2020a).
Diesel support in Tamil Nadu was worth INR 141 crore (USD 20 million) in FY 2019 (second highest after Karnataka) but is untargeted and accessible to all fishers: artisanal and mechanized (see Figure 20). Kerosene support (INR 35 crore or USD 4.9 million in FY 2019) is targeted to artisanal boats. The state should evaluate its current diesel subsidy policies to reveal who benefits to understand if the social objectives of the policy are met, as well as whether support encourages overfishing.
Fixed-cost, input-based support, worth INR 18 crore (USD 1.9 million) in FY 2019, is smaller than fuel subsidies and income support. Only 27% of this was targeted to the artisanal sector through the purchase of FRP boats. The remaining 63% targeted mechanized boats through the purchase of new tuna longliner boats. Expenditure on the latter was INR 13 crore (USD 1.85 million). The state offers more targeted support to mechanized boats than low-income fishers. An evaluation of the beneficiaries and design of vessel purchase schemes—like longliner boats—can reveal if there is an opportunity for low-income fishers to be targeted through such schemes and a deeper understanding of whether such schemes generate excessive fishing capacity.
Income support at INR 267 crore (USD 37.9 million) in FY 2019 is slightly higher than fuel subsidies for the same FY. Fifty-two percent of these subsidies was targeted to the artisanal sector through financial assistance during the ban and lean fishing periods. The remaining income support––on insurance, savings-cum-relief––is untargeted. An evaluation of the latter can reveal if low-income fishers are the main beneficiaries.
IISD.org/gsi 42
Supporting Marine Fishing Sustainably: A review of central and state government support for marine fisheries in India
Figure 20. Support by type of beneficiary in Tamil Nadu in FY 2019
Source: Authors’ calculations.
Mechanized
Artisanal
Mixed – Artisanal/Mechanized
Per
cent
(%
)
0
10
20
30
40
50
60
70
80
90
100
Fuelsubsidies
Fixed costsupport
Incomesupport
IISD.org/gsi 43
Supporting Marine Fishing Sustainably: A review of central and state government support for marine fisheries in India
6.0 Conclusion and RecommendationsGiven the crucial role played by the fisheries sector in India’s socio-economic development, the importance of ensuring the sustainability of marine resources is well recognized in national development plans. Poverty among Indian marine fishers is high: 67% of the marine fishing population is poor, more than double the national average. At the same time, there is pressure on fish stocks, with overexploitation of nearshore resources and increasing low-value bycatch, which could undermine nutrition and livelihoods in the future if it is not well managed.
With recent fish production-enhancing policies, India’s governments—both at the central and the state levels—are aiming to expand support to the fisheries sector and fisherfolks. As India moves forward, efficient allocation of budgetary resources to achieve fish production and poverty reduction targets requires understanding the impact of support measures on fishers, fishing activities, and marine resources themselves.
Government support for marine fisheries impacts the entire supply chain, ranging from vessel construction to support to fuel subsidies to post-harvest activities like storage, processing, retail, and marketing. If support policies are poorly designed, they will not only be ineffective or inefficient in achieving their objectives, but they can also undermine the fish stocks upon which livelihoods depend.
By mapping support for marine fisheries, this report aims to contribute to national and state-level discussions for improving the effectiveness and efficiency of government support for marine fisheries. The report is based on a bottom-up database of support measures for marine fisheries only. It covers policies issued by the Central Government and comprehensive data on schemes from four states (Andhra Pradesh, Karnataka, Kerala, and Tamil Nadu), as well as partial data from other states. The report is limited to publicly available government data. The data has been restricted to marine fisheries, including through the use of estimates when the original data did not provide a sufficient level of disaggregation.
The main findings are:
• Government support for fisheries in FY 2019 was at least INR 2,225 crore (USD 316 million), and since FY 2016, support has increased by 43%. This is a conservative estimate of total national support levels for marine fisheries.
• Support for centrally sponsored schemes for states for marine fisheries reached INR 256 crore (USD 36.4 million) in FY 2019, an increase of 18% from FY 2016. Compared to the state governments, the Central Government provides a greater contribution in the provision of fixed-cost, input-based support and a significant but less weighty role in providing income support.
• Fuel subsidies provided by the state governments are the highest form of support for marine fisheries. Fuel subsidies have grown significantly: from INR 304 crore (USD 45.2 million) in FY 2016 to INR 736 crore (USD 104.5 million) in FY 2019, a growth of 142%.
IISD.org/gsi 44
Supporting Marine Fishing Sustainably: A review of central and state government support for marine fisheries in India
° In FY 2019, Karnataka provided the highest diesel subsidy (INR 158 crore or USD 22.4 million), followed by Tamil Nadu (INR 141 crore or USD 20 million) and Andhra Pradesh (INR 57 crore or USD 8.1 million).
° In FY 2019, kerosene support was highest in Kerala (INR 41 crore or USD 5.8 million), followed by Tamil Nadu (INR 35 crore or USD 4.9 million) and Karnataka (INR 19 crore or USD 2.7 million).
• Support for fixed costs consistently received high support over the four years of data. This includes several cross-state, centrally sponsored schemes, such as the promotion of deep-sea fishing, the installation of cages in open water bodies, the motorization of traditional crafts through replacement with FRP boats, and the replacement of kerosene outboard motors with petrol.
° Tamil Nadu offered the highest support for deep-sea fishing vessels. This included a centrally sponsored scheme for INR 100 crore in FY 2018. This scheme has counterparts in other states and is part of the strategy articulated in the NFP 2020 to shift focus toward deep-sea fishing. As of January 2021, the largest expenditure under the PMMSY scheme included the purchase of deep-sea vessels at INR 144 crore (USD 19.4 million). Tamil Nadu also supported deep-sea fishing through another scheme that supported vessel purchase of new tuna longliner boats at INR 13.2 crore (USD 1.87 million) in FY 2019. This scheme has consistently seen increasing support over the four years of data in this report.
° Maharashtra offered the most support for the construction of cage pens in FY 2019. Nationally, there is a focus on promoting aquaculture under the PMMSY. As of January 2021, aquaculture received INR 64.2 crore (USD 8.7 million), the second-highest support after deep-sea fishing.
° All states offer support to help artisanal fishers purchase FRP boats instead of traditional wooden boats. Annual disbursements are not typically large but can accumulate to more significant levels over time. Karnataka, for example, the state in our dataset that spent the most on FRP boats, disbursed a total of INR 5.67 crore (USD 0.8 million) from FY 2016 to FY 2019.
• Income support comprises three categories: financial assistance (called “relief”) during the ban period; savings schemes (called “savings-cum-relief”), also to help sustain fishers during the ban period; and insurance to help cover risk from accidents. Altogether, this support has increased by 57%, from INR 284 crore (USD 42 million) in FY 2016 to INR 446 crore (USD 63 million) in FY 2019.
° Since FY 2016, Tamil Nadu has offered the highest financial assistance during the fishing ban period, followed by Andhra Pradesh.
° Kerala is the only state among the four dedicating a significant amount of resources to a pension fund and debt relief for fishers.
IISD.org/gsi 45
Supporting Marine Fishing Sustainably: A review of central and state government support for marine fisheries in India
6.1 RecommendationsThis report makes the following recommendations:
1. Evaluate a number of key policies in three key categories
There is a need for a comprehensive evaluation of the efficiency and impacts of different support schemes. In cases where evaluations already exist for some of the support schemes but are kept for government agencies’ internal use only, they should be made publicly available. This report identifies a number of schemes as priorities for detailed evaluation.
• Fuel support: This report found that fuel subsidies are the highest form of support and recommends that states conduct a deeper investigation to understand the relationship between diesel support and the risk of overfishing. Additionally, a distributional analysis can show how fuel support is benefiting different income groups of fishers. In the absence of this information, it is unclear which fishers could be included or excluded if fuel support were to be better targeted and their costs reduced. Any savings from reforming fuel subsidies, which are possibly riskier for sustainability, could be swapped with schemes that are better at supporting the livelihoods of fishers—possibly through relief schemes if there is evidence that they work better. Such a move would also have other benefits, like reducing pressure on fish stocks.
• Fixed-cost support schemes: We recommend reviewing the schemes for fixed-cost support related to the promotion of deep-sea fishing, the construction of sea cages, and vessel purchase and modernization through FRP or new tuna longliner boats. These schemes are present in almost all coastal states, with especially high support in Tamil Nadu and Maharashtra. A review should also assess whether these schemes contribute to encouraging excessive fishing capacity, with associated risks for the sustainability of fisheries. An evaluation could focus on the extent to which actual impacts are in line with the intended impacts.
• Income support: This report identifies three categories of income support to supplement fishers’ income. States differ in their scheme design, with some offering untargeted income support. We recommend that states like Karnataka, Kerala, and Tamil Nadu review their scheme design and focus benefits only on traditional fishers. Further, women in the fishing sector are mostly employed in post-harvest fishing activities and miss out on support. Lastly, any income support must also include the migrant workers, who are a large part of the marine fisheries sector. We recommend that future marine censuses include reporting the number of migrant workers involved in the state in a step toward giving them a formal status and access to income support. Evaluation efforts should also consider how income support measures can best align with the need for ensuring the long-term sustainability of fisheries.
• Fisheries management: There is a need for better up-to-date data assessing the status of fish stocks in order to help improve fisheries management. Other measures that can support fisheries management include fish stock rebuilding or enhancement goals. This report identified low levels of support for stock enhancement programs directed toward conservation and awareness. This type of expenditure was limited to FY 2017 and for only two states. A similar lack of focus on sustainability is observed
IISD.org/gsi 46
Supporting Marine Fishing Sustainably: A review of central and state government support for marine fisheries in India
in the expenditure pattern of PMMSY, even though the policy calls for sustainable marine fisheries. As of January 2021, no expenditure had been sanctioned by the Central Government for improving fisheries management. NFP 2020 calls for the establishment of sustainable fisheries management plans, but the PMMSY is yet to allocate funds to follow up on this vision.
2. Improve reporting practices
In gathering data on government support for marine fishing, this report came across several data limitations. Data are scattered between different levels of government institutions (central, state, and district) and various government institutions (such as NFDB, MPEDA, and CMFRI). Reporting formats and definitions vary with sources. Improving data reporting can help inform effective policy-making. We recommend that the Ministry of Fisheries, Animal Husbandry and Dairying:
• Explore a uniform reporting format on government expenditure and synchronize terminology on scheme names and beneficiaries between central and all coastal state governments.
• Release annual data reports from fisheries institutions in a timely manner, like those from MPEDA that hold statistical information on several Central Government assistance schemes to various states.
IISD.org/gsi 47
Supporting Marine Fishing Sustainably: A review of central and state government support for marine fisheries in India
ReferencesBiswas, N. (2018). Towards gender-equitable small-scale fisheries governance and development: A
handbook in support of the implementation of the Voluntary Guidelines for Securing Sustainable Small-scale Fisheries in the Context of Food Security and Poverty Eradication. Food and Agriculture Organization of the United Nations. http://www.fao.org/3/i7419e/i7419e.pdf
Business World (2021, July 15). Fisheries subsidies: WTO chief convenes key meeting of trade ministers on Thursday. http://www.businessworld.in/article/Fisheries-Subsidies-WTO-Chief-Convenes-Key-Meeting-Of-Trade-Ministers-On-Thursday/15-07-2021-396680/
Cashion, T. (2016). The end use of marine fisheries landings. Fisheries Centre Research Reports, 24(3) https://doi.org/10.14288/1.0354481
Chandrashekhar, V. (2019). India begins regulating its fisheries. Mongabay-India. https://india.mongabay.com/2019/07/fishing-india-begins-regulating-its-fisheries/
Changing Markets Foundation. (2019). Fishing for catastrophe. https://changingmarkets.org/wp-content/uploads/2019/10/CM-WEB-FINAL-FISHING-FOR-CATASTROPHE-2019.pdf
Clarke, K. (2015). Diesel subsidy reform in India: Lessons learned. https://www.iisd.org/gsi/sites/default/files/ffsr_india_lessons%20learned_may_2015.pdf
Central Marine Fisheries Research Institute. (2020). Marine fish landings in India 2019 [Technical Report]. ICAR & Central Marine Fisheries Research Institute. http://eprints.cmfri.org.in/14325/1/Marine%20Fish%20Landings%20in%20India_2020_CMFRI.pdf
Central Marine Fisheries Research Institute, Fishery Survey of India (FSI), & Department of Fisheries. (n.d.). Annual data: Data on national marine fish landings. https://www.cmfri.org.in/annual-data/
Central Marine Fisheries Research Institute, Fishery Survey of India, & Department of Fisheries. (2012). Marine fisheries census 2010 – India. Central Marine Fisheries Research Institute; Indian Council of Agricultural Research; Ministry of Agriculture and Farmers Welfare; Fishery Survey of India; Department of Fisheries; Ministry of Fisheries, Animal Husbandry and Dairying; and Government of India.
Central Marine Fisheries Research Institute, Fishery Survey of India, & Department of Fisheries. (2020). Marine fisheries census 2016 – India. Central Marine Fisheries Research Institute; Indian Council of Agricultural Research; Ministry of Agriculture and Farmers Welfare; Fishery Survey of India; Department of Fisheries; Ministry of Fisheries, Animal Husbandry and Dairying; and Government of India.
Department of Animal Husbandry & Dairying, Government of India. (2017). National policy on marine fisheries 2017 (in Hindi). http://dahd.nic.in/news/notification-national-policy-marine-fisheries-2017
IISD.org/gsi 48
Supporting Marine Fishing Sustainably: A review of central and state government support for marine fisheries in India
Department of Fisheries (DoF). (2018). Handbook on fisheries statistics 2018. Ministry of Fisheries, Animal Husbandry and Dairying, Government of India. http://dof.gov.in/sites/default/files/2020-08/HandbookonFS2018.pdf
Department of Fisheries. (2020a). Handbook on fisheries statistics 2020. Ministry of Fisheries, Animal Husbandry and Dairying, Government of India. http://dof.gov.in/sites/default/files/2021-02/Final_Book.pdf
Department of Fisheries. (2020b). Pradhan Mantri Matsya Sampada Yojana. Operational guidelines. Ministry of Fisheries, Animal Husbandry and Dairying, Government of India. https://www.nfdb.gov.in/PDF/PMMSY-Guidelines24-June2020.pdf
Department of Fisheries. (n.d.). Pradhan Mantri Matsya Sampada Yojana (PMMSY). Ministry of Fisheries, Animal Husbandry and Dairying, Government of India. http://pmmsy.dof.gov.in/dashboard
Dineshbabu, A. P., Thomas, S., & Vivekanandan, E. (2014). Assessment of low value bycatch and its application for management of trawl fisheries. http://eprints.cmfri.org.in/10249/1/AP_Dineshbabu_JMBAI_56_2.pdf
DT Next. (2020, August 10). Over 1K fishermen awaiting diesel subsidy for a year. https://www.dtnext.in/News/TamilNadu/2020/08/10042948/1245122/Over-1K-fishermen-awaiting-diesel-subsidy-for-a-year.vpf
Food and Agriculture Organizations of the United Nations (FAO). (2015). Artisanal fisheries. http://www.fao.org/family-farming/detail/en/c/335263/
Food and Agriculture Organizations of the United Nations. (2018). The state of world fisheries and aquaculture. https://reliefweb.int/sites/reliefweb.int/files/resources/I9540EN.pdf
Food and Agriculture Organizations of the United Nations. (2020). The state of world fisheries and aquaculture 2020: Sustainability in action. http://www.fao.org/3/ca9229en/ca9229en.pdf
Garg, V., Sharma, S., Clarke, K., & Bridle, R. (2017). Kerosene subsidies in India: The status quo, challenges and the emerging path to reform. https://www.iisd.org/system/files/publications/kerosene-in-india-staus-quo-path-to-reform.pdf
Raju, S. S. (2013). Centrally sponsored schemes on marine fisheries and its effect on development of fisheries: A study on motorization of traditional crafts and HSD oil schemes. Niti Aayog. https://niti.gov.in/planningcommission.gov.in/docs/reports/sereport/ser/ser_cssmarine3101.pdf
Steenblick, R., & Jones, D. (2010). Subsidy estimation: A survey of current practice. Global Subsidies Initiative of the International Institute for Sustainable Development (IISD) https://www.iisd.org/library/subsidy-estimation-survey-current-practice
Gopal, N. (2017). Gender in fisheries development. In Central Institute of Fisheries Technology (Ed.), Recent trends in harvest and post-harvest technologies in fisheries (pp. 431–438). https://krishi.icar.gov.in/jspui/bitstream/123456789/24983/1/36_Gender%20in%20fisheries%20development.pdf
IISD.org/gsi 49
Supporting Marine Fishing Sustainably: A review of central and state government support for marine fisheries in India
Government of India. (2016). New and full notification pursuant to Article XVI:1 of the GATT 1994 and Article 25 of the Agreement on Subsidies and Countervailing Measures (G/SCM/N/253/IND/Suppl.3).
Government of India. (2018). New and full notification pursuant to Article XVI:1 of the GATT 1994 and Article 25 of the Agreement on Subsidies and Countervailing Measures (G/SCM/N/284/IND/Suppl.2, G/SCM/N/315/IND).
Government of India. (2019). New and full notification pursuant to Article XVI:1 of the GATT 1994 and Article 25 of the Agreement on Subsidies and Countervailing Measures. (G/SCM/N/284/IND/Suppl.3, G/SCM/N/315/IND/Suppl.1).
Government of Karnataka. (2017). Evaluation of distribution of tax exempted diesel and kerosene to fishing boats in Karnataka. Department of Fisheries. https://kmea.karnataka.gov.in/storage/pdf-files/Reports%20and%20other%20docs/Kerosene.pdf
Government of Karnataka. (2020). Department of Fisheries annual report 2019–20. https://fisheries.karnataka.gov.in/storage/pdf-files/Annual%20report/2019-20%20Annual%20Report%20ENG.pdf
Gunakar, S., Jadhav, A., & Bhatta, R. (2017). Protections for small-scale fisheries in India: A study of India’s monsoon fishing ban. In S. Jentoft, R. Chuenpagdee, & M. José Barragán-Paladines (Eds.), The small-scale fisheries guidelines (pp. 291–311). https://doi.org/10.1007/978-3-319-55074-9_14
Hemalatha, K. (2019). India’s first attempt at regulating fishing trawlers underway. Mongabay-India. https://india.mongabay.com/2019/01/indias-first-attempt-at-regulating-fishing-trawlers-underway/
Jayakumar, D. (2020). Fisheries policy note 2020–2021. Department of Animal Husbandry, Dairying, and Fisheries, Government of Tamil Nadu. https://www.fisheries.tn.gov.in/includes/assets/cms_uploads/pdf/glance/Fisheries_-_Policy_Note_2020-21_-_English_4605.pdf
Lobo, Aaron Savio, Balmford, A., Arthur, R., & Manica, A. (2010). Commercializing bycatch can push a fishery beyond economic extinction. Conservation Letters, 3(4), 277–285. https://doi.org/10.1111/j.1755-263X.2010.00117.x
Manoharan, S. (2017). Health status of the Indian women: A brief report. MOJ Proteomics & Bioinformatics, 5(3). https://doi.org/10.15406/mojpb.2017.05.00162
Martini, R. & Innes, J. (2018). Relative effects of fisheries support policies (OECD Food, Agriculture and Fisheries Papers, No. 115). OECD Publishing.
Matsyafed. (n.d.). https://matsyafed.in/
Ministry of Agriculture. (2016). Fisheries: Success stories. https://rkvy.nic.in/Uploads/SucessStory/TELANGANA/2016/2016050519Fish_%20Success%20Storie_Revolving%20Fund%20SHGS%20.pdf
IISD.org/gsi 50
Supporting Marine Fishing Sustainably: A review of central and state government support for marine fisheries in India
Ministry of Shipping. (2016). Sagarmala: Report on government imperatives including financing plan. http://sagarmala.gov.in/sites/default/files/7298227416DraftReportonImperativesSagarmala.pdf
Ministry of Statistics. (2020). First advance estimates of national income, 2019-20. https://pib.gov.in/PressReleseDetail.aspx?PRID=1598643
Mohamed, K. S. (2015). Future of India’s marine fisheries. CMFRI. http://www.cmfri.org.in/uploads/files/Future%20of%20indias%20marine%20fisheries%20jan%202015.pdf
Mohamed, K., Sathianandan, T., Zacharia, P. U., Asokan, P., Krishnakumar, P., Abdurahiman, K. P., Shettigar, V., & Durgekar, R. N. (2011). Depleted and collapsed marine fish stocks along south-west coast of India: A simple criterion to assess the status. Proceedings of the Symposium on Conservation of Marine Resources-Coastal Fishery Resources of India –Conservation and Sustainable Utilisation (pp. 67–78). http://eprints.cmfri.org.in/7855/1/sunil1.pdf
Marine Products Export Development Authority (MPEDA). (2020). India’s seafood exports pegged at 12,89,651 MT in FY 2019-20. https://mpeda.gov.in/wp-content/uploads/2020/11/MPEDA_Export-Performance_2019-2020_ENG_Aug-17.pdf
National Fisheries Development Board (NFDB). (2020). National Fisheries Policy: Sixth draft for consideration. http://nfdb.gov.in/PDF/Policy/english.pdf
NITI Aayog. (2018). Task Force on Elimination of Poverty in India. https://niti.gov.in/sites/default/files/2018-12/presentation-for-regional-meetings-NITI-AAYOG.pdf
Organisation for Economic Co-operation and Development (OECD). (n.d.). Fisheries support estimate. https://stats.oecd.org/Index.aspx?datasetcode=FISH_FSE
Organisation for Economic Co-operation and Development. (2017). Support to fisheries: Levels and impacts (OECD Food, Agriculture and Fisheries Papers, No. 103). OECD Publishing. https://www.oecd.org/greengrowth/fisheries/support-to-fisheries.pdf
Organisation for Economic Co-operation and Development. (2020). OECD review of fisheries 2020. OECD Publishing. https://doi.org/10.1787/7946bc8a-en
Planning Commission. (2012). Report of the Working Group on Development and Management of Fisheries and Aquaculture: XIIth Five-Year Plan (2012–2017). https://niti.gov.in/planningcommission.gov.in/docs/aboutus/committee/wrkgrp12/agri/wgrep_fish.pdf
Press Information Bureau (PIB). (2019). Fish production and consumption. https://pib.gov.in/Pressreleaseshare.aspx?PRID=1559072
Press Information Bureau. (2020). Year end review 2020: Department of Fisheries. https://pib.gov.in/Pressreleaseshare.aspx?PRID=1682945
Ram, F., Mohanty, S. K. & Ram, U. (2009). Understanding the distribution of BPL cards: All-India and selected states. Economic and Political Weekly, 44(7), 66–71. https://pdfs.semanticscholar.org/ab41/19fe740279a275197ad30e802f79ad24c89e.pdf
IISD.org/gsi 51
Supporting Marine Fishing Sustainably: A review of central and state government support for marine fisheries in India
Rao, G. V. R. Subba. (2020, May 5). A.P. govt. unveils fishermen-friendly steps. The Hindu. https://www.thehindu.com/news/national/andhra-pradesh/ap-govt-unveils-fishermen-friendly-steps/article31512919.ece
Sathianandan, T. V. (2017). Marine fish production in India: Present status. Central Marine Fisheries Research Institute. http://eprints.cmfri.org.in/12164/1/2-Marine%20fish%20production%20in%20India.pdf
Sumaila, U. R., Skerritt, D., Schuhbauer, A., Ebrahim, N., Li, Y., Kim, H.S., Mallory, T.G., Lam, V. W. L., & Pauly, D. (2019). A global dataset on support to the fisheries sector. Data in Brief, 27.
The Hindu. (2020, May 7). Fishermen seek increase in diesel subsidy. https://www.thehindu.com/news/national/tamil-nadu/fishermen-seek-increase-in-diesel-subsidy/article31529567.ece
The Hindu. (2021, February 14). Rising diesel prices worry fishers. https://www.thehindu.com/news/cities/chennai/rising-diesel-prices-worry-fishers/article33832892.ece
The Research Collective. (2017a). Occupation of the coast: Blue economy in India. https://updatecollective.files.wordpress.com/2018/01/occupationofthecoast_trc2017.pdf
The Research Collective. (2017b). Where have the fish gone? The impact of industrial development on fishworkers in Gujarat. https://static1.squarespace.com/static/559b6c31e4b02802c8b26ce9/t/5a2689d50d9297bd22e1b01c/1512475271725/Where+have+the+fish+gone_TRC+Publication+2017-ilovepdf-compressed.pdf
United Nations General Assembly. (2015, October 21). Transforming our world: The 2030 Agenda for Sustainable Development (A/RES/70/1). https://www.refworld.org/docid/57b6e3e44.html
World Trade Organization. (n.d.). Agreement of Subsidies and Countervailing Measures. https://www.wto.org/english/docs_e/legal_e/24-scm.pdf
Von Moltke, A. (2011). Fisheries support, sustainable development and the WTO. United Nations Environment Programme & Earthscan. Routledge.
Zacharia, P. U. (n.d.). Present and future scenario of Indian fisheries. Central Marine Fisheries Research Institute. hwww.cmfri.org.in/uploads_en/divisions/files/Present%20and%20future%20scenario%20of%20Indfian%20marine%20fisheries.pdf
IISD.org/gsi 52
Supporting Marine Fishing Sustainably: A review of central and state government support for marine fisheries in India
Annex A. Details on Support Methodology and CalculationsAnnex A provides a description of the methodological approach adopted in the production of International Institute for Sustainable Development (IISD) national fisheries support inventories. It covers four main aspects: (i) the definition of fisheries support, (ii) the classification or categorization of support, (iii) methods for quantifying support, and (iv) a prioritization framework to identify priorities for action.
A1. Defining Fisheries SupportThe definition of support used in this report is taken from Article 1.1. of the World Trade Organization (WTO) Agreement on Subsidies and Countervailing Measures (ASCM). Under this internationally agreed definition, a subsidy is a financial contribution—or any form of income or price support—by a government or public body within the territory of a member, which confers a benefit (World Trade Organization, n.d.; see Box A1). A financial contribution entails either a direct transfer of funds, revenue forgone, the provision of goods or services, or the purchase of goods (WTO, n.d.).
Box A1. Definition of subsidies according to the ASCM
"1.1 For the purpose of this Agreement, a subsidy shall be deemed to exist if:
(a)(1) there is a financial contribution by a government or any public body within the territory of a Member (referred to in this Agreement as "government"), i.e. where:
i. a government practice involves a direct transfer of funds (e.g. grants, loans, and equity infusion), potential direct transfers of funds or liabilities (e.g. loan guarantees);
ii. government revenue that is otherwise due is foregone or not collected (e.g. fiscal incentives such as tax credits);
iii. a government provides goods or services other than general infrastructure, or purchases goods;
iv. a government makes payments to a funding mechanism, or entrusts or directs a private body to carry out one or more of the type of functions illustrated in (i) to (iii) above which would normally be vested in the government and the practice, in no real sense, differs from practices normally followed by governments;
or
(a)(2) there is any form of income or price support in the sense of Article XVI of GATT 1994;
and
(b) a benefit is thereby conferred."
Source: (WTO, n.d.)
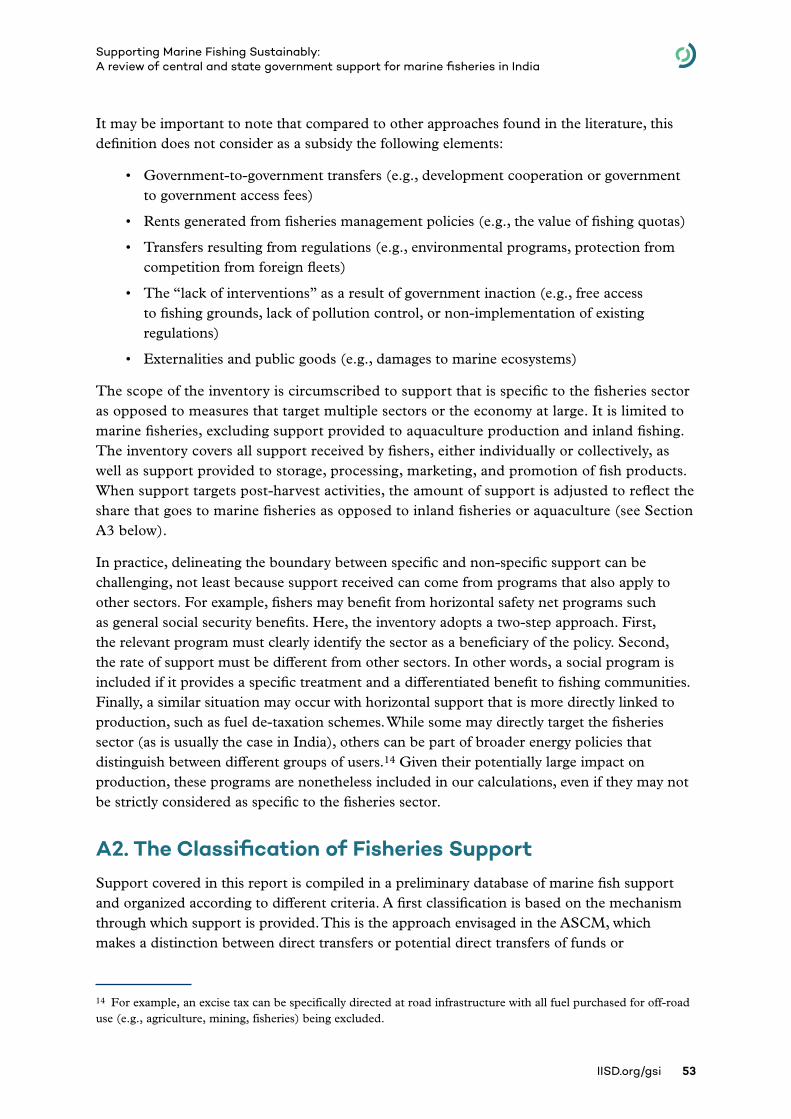
IISD.org/gsi 53
Supporting Marine Fishing Sustainably: A review of central and state government support for marine fisheries in India
It may be important to note that compared to other approaches found in the literature, this definition does not consider as a subsidy the following elements:
• Government-to-government transfers (e.g., development cooperation or government to government access fees)
• Rents generated from fisheries management policies (e.g., the value of fishing quotas)
• Transfers resulting from regulations (e.g., environmental programs, protection from competition from foreign fleets)
• The “lack of interventions” as a result of government inaction (e.g., free access to fishing grounds, lack of pollution control, or non-implementation of existing regulations)
• Externalities and public goods (e.g., damages to marine ecosystems)
The scope of the inventory is circumscribed to support that is specific to the fisheries sector as opposed to measures that target multiple sectors or the economy at large. It is limited to marine fisheries, excluding support provided to aquaculture production and inland fishing. The inventory covers all support received by fishers, either individually or collectively, as well as support provided to storage, processing, marketing, and promotion of fish products. When support targets post-harvest activities, the amount of support is adjusted to reflect the share that goes to marine fisheries as opposed to inland fisheries or aquaculture (see Section A3 below).
In practice, delineating the boundary between specific and non-specific support can be challenging, not least because support received can come from programs that also apply to other sectors. For example, fishers may benefit from horizontal safety net programs such as general social security benefits. Here, the inventory adopts a two-step approach. First, the relevant program must clearly identify the sector as a beneficiary of the policy. Second, the rate of support must be different from other sectors. In other words, a social program is included if it provides a specific treatment and a differentiated benefit to fishing communities. Finally, a similar situation may occur with horizontal support that is more directly linked to production, such as fuel de-taxation schemes. While some may directly target the fisheries sector (as is usually the case in India), others can be part of broader energy policies that distinguish between different groups of users.14 Given their potentially large impact on production, these programs are nonetheless included in our calculations, even if they may not be strictly considered as specific to the fisheries sector.
A2. The Classification of Fisheries SupportSupport covered in this report is compiled in a preliminary database of marine fish support and organized according to different criteria. A first classification is based on the mechanism through which support is provided. This is the approach envisaged in the ASCM, which makes a distinction between direct transfers or potential direct transfers of funds or
14 For example, an excise tax can be specifically directed at road infrastructure with all fuel purchased for off-road use (e.g., agriculture, mining, fisheries) being excluded.
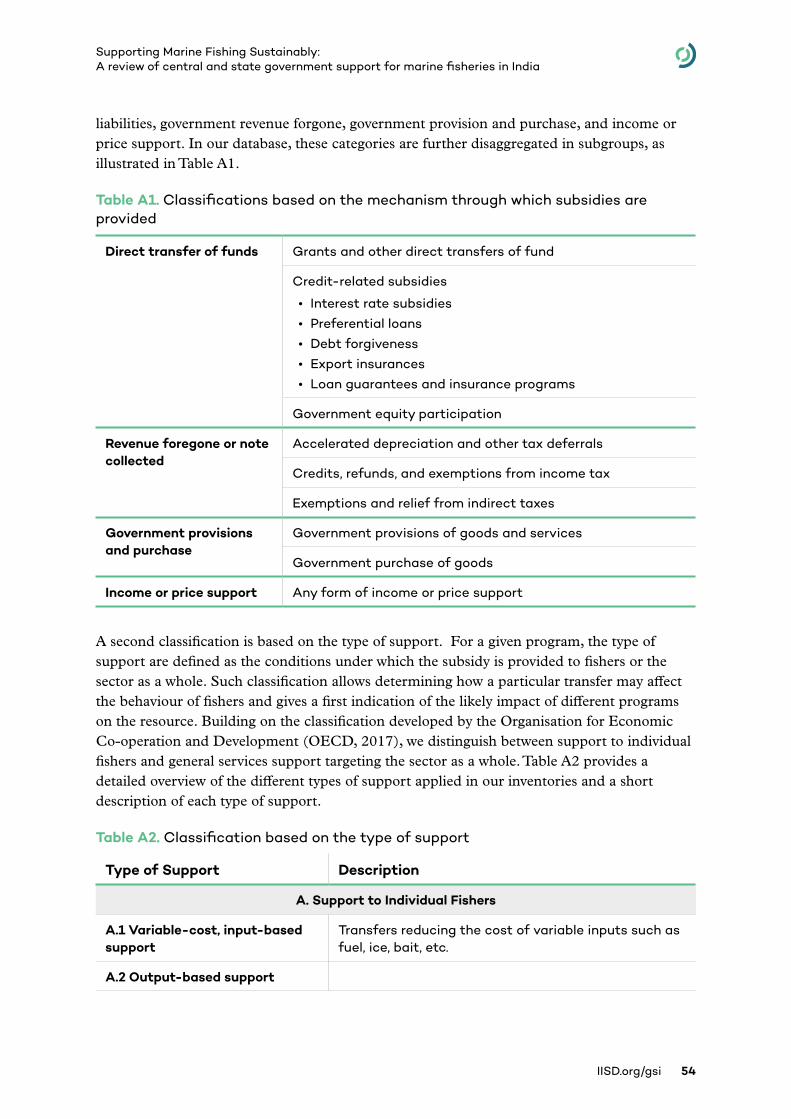
IISD.org/gsi 54
Supporting Marine Fishing Sustainably: A review of central and state government support for marine fisheries in India
liabilities, government revenue forgone, government provision and purchase, and income or price support. In our database, these categories are further disaggregated in subgroups, as illustrated in Table A1.
Table A1. Classifications based on the mechanism through which subsidies are provided
Direct transfer of funds Grants and other direct transfers of fund
Credit-related subsidies
• Interest rate subsidies
• Preferential loans
• Debt forgiveness
• Export insurances
• Loan guarantees and insurance programs
Government equity participation
Revenue foregone or note collected
Accelerated depreciation and other tax deferrals
Credits, refunds, and exemptions from income tax
Exemptions and relief from indirect taxes
Government provisions and purchase
Government provisions of goods and services
Government purchase of goods
Income or price support Any form of income or price support
A second classification is based on the type of support. For a given program, the type of support are defined as the conditions under which the subsidy is provided to fishers or the sector as a whole. Such classification allows determining how a particular transfer may affect the behaviour of fishers and gives a first indication of the likely impact of different programs on the resource. Building on the classification developed by the Organisation for Economic Co-operation and Development (OECD, 2017), we distinguish between support to individual fishers and general services support targeting the sector as a whole. Table A2 provides a detailed overview of the different types of support applied in our inventories and a short description of each type of support.
Table A2. Classification based on the type of support
Type of Support Description
A. Support to Individual Fishers
A.1 Variable-cost, input-based support
Transfers reducing the cost of variable inputs such as fuel, ice, bait, etc.
A.2 Output-based support
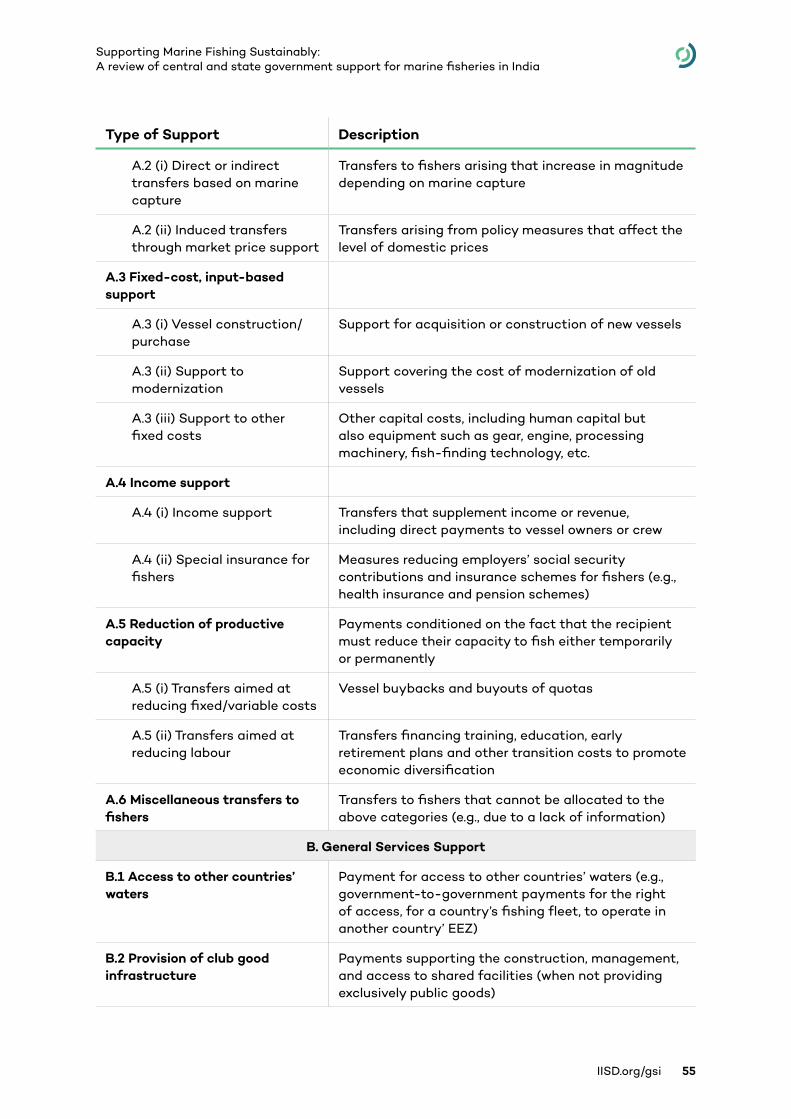
IISD.org/gsi 55
Supporting Marine Fishing Sustainably: A review of central and state government support for marine fisheries in India
Type of Support Description
A.2 (i) Direct or indirect transfers based on marine capture
Transfers to fishers arising that increase in magnitude depending on marine capture
A.2 (ii) Induced transfers through market price support
Transfers arising from policy measures that affect the level of domestic prices
A.3 Fixed-cost, input-based support
A.3 (i) Vessel construction/purchase
Support for acquisition or construction of new vessels
A.3 (ii) Support to modernization
Support covering the cost of modernization of old vessels
A.3 (iii) Support to other fixed costs
Other capital costs, including human capital but also equipment such as gear, engine, processing machinery, fish-finding technology, etc.
A.4 Income support
A.4 (i) Income support Transfers that supplement income or revenue, including direct payments to vessel owners or crew
A.4 (ii) Special insurance for fishers
Measures reducing employers’ social security contributions and insurance schemes for fishers (e.g., health insurance and pension schemes)
A.5 Reduction of productive capacity
Payments conditioned on the fact that the recipient must reduce their capacity to fish either temporarily or permanently
A.5 (i) Transfers aimed at reducing fixed/variable costs
Vessel buybacks and buyouts of quotas
A.5 (ii) Transfers aimed at reducing labour
Transfers financing training, education, early retirement plans and other transition costs to promote economic diversification
A.6 Miscellaneous transfers to fishers
Transfers to fishers that cannot be allocated to the above categories (e.g., due to a lack of information)
B. General Services Support
B.1 Access to other countries’ waters
Payment for access to other countries’ waters (e.g., government-to-government payments for the right of access, for a country’s fishing fleet, to operate in another country’ EEZ)
B.2 Provision of club good infrastructure
Payments supporting the construction, management, and access to shared facilities (when not providing exclusively public goods)
IISD.org/gsi 56
Supporting Marine Fishing Sustainably: A review of central and state government support for marine fisheries in India
Type of Support Description
B.2(i) Capital expenditures Injection of capital in the construction and maintenance of infrastructure
B.2(ii) Subsidized access to infrastructure
Support to reduce the cost of accessing and using infrastructure
B.3 R&D
B.3(i) Production-related R&D
Transfer for R&D expenditure in the fisheries sector aimed at increasing productivity of fishing
B.3(ii) Management related R&D
Transfer for R&D expenditure in the fisheries sector, if aimed at improving resource management
B.4 Marketing and promotion Transfers financing services to marketing and promotion of fish product
B.5 Support to fishing communities
Transfers supporting improvements of livelihoods and economic diversification in fishing communities e.g., housing facilities, food aid, education and training, new village infrastructure, IT
B.6 Management of resources
B.6 (i) Management expenditures
Expenditures associated with resource management programs
B.6 (ii) Stock enhancement programs
Expenditures associated with fish stock rebuilding
B.6 (iii) Enforcement expenditures
Expenditures associated with enforcement of management measures
B.7 Miscellaneous transfers to general services
Financing other general services that cannot be disaggregated and allocated to the above categories (e.g., due to a lack of information)
Finally, the classification of support is complemented by additional information about the programs to be included in the database through a system of labels. As illustrated in Table A3, some of these labels contain critical information to assess the potential impact of a program, like the link to production; restrictions to specific species, gears, or areas; or the type of fishing (e.g., small-scale artisanal vs. large-scale industrial).
Table A3. Names and definitions of labels
Type of label Description Objective
Production-linked
Indicates if the payment increases with the level of harvest.
Shows if a support measure can potentially impact effort or harvest.
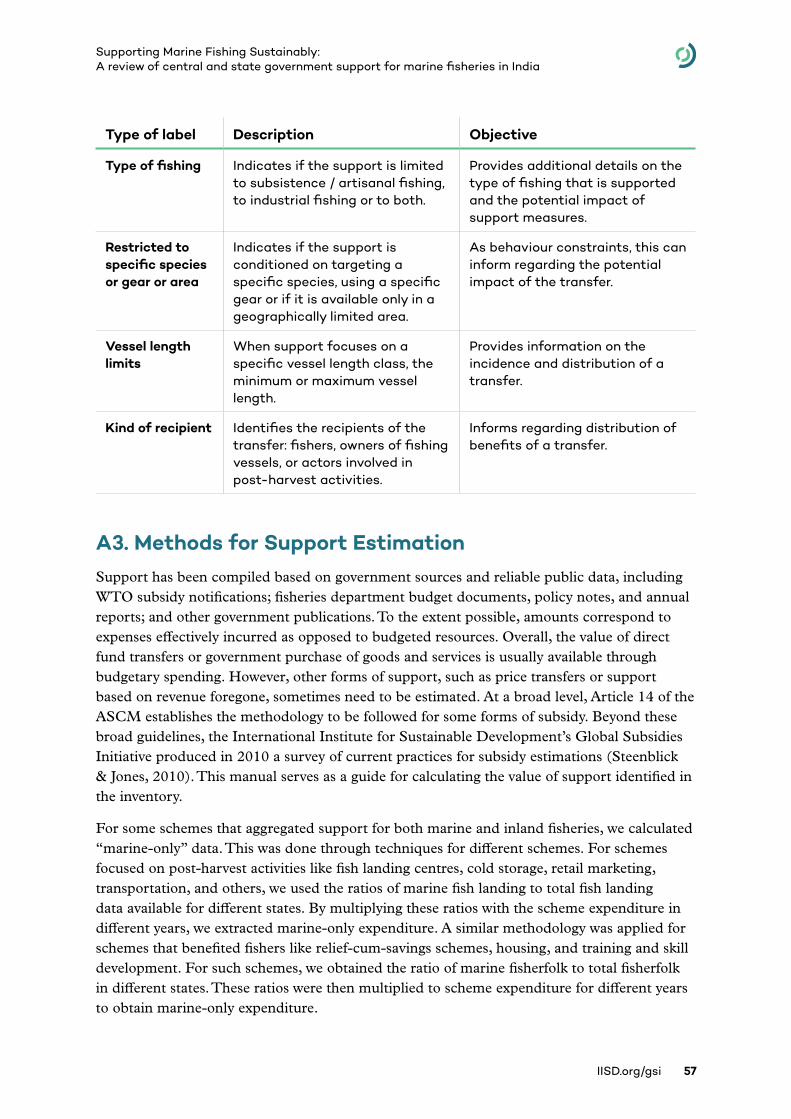
IISD.org/gsi 57
Supporting Marine Fishing Sustainably: A review of central and state government support for marine fisheries in India
Type of label Description Objective
Type of fishing Indicates if the support is limited to subsistence / artisanal fishing, to industrial fishing or to both.
Provides additional details on the type of fishing that is supported and the potential impact of support measures.
Restricted to specific species or gear or area
Indicates if the support is conditioned on targeting a specific species, using a specific gear or if it is available only in a geographically limited area.
As behaviour constraints, this can inform regarding the potential impact of the transfer.
Vessel length limits
When support focuses on a specific vessel length class, the minimum or maximum vessel length.
Provides information on the incidence and distribution of a transfer.
Kind of recipient Identifies the recipients of the transfer: fishers, owners of fishing vessels, or actors involved in post-harvest activities.
Informs regarding distribution of benefits of a transfer.
A3. Methods for Support EstimationSupport has been compiled based on government sources and reliable public data, including WTO subsidy notifications; fisheries department budget documents, policy notes, and annual reports; and other government publications. To the extent possible, amounts correspond to expenses effectively incurred as opposed to budgeted resources. Overall, the value of direct fund transfers or government purchase of goods and services is usually available through budgetary spending. However, other forms of support, such as price transfers or support based on revenue foregone, sometimes need to be estimated. At a broad level, Article 14 of the ASCM establishes the methodology to be followed for some forms of subsidy. Beyond these broad guidelines, the International Institute for Sustainable Development’s Global Subsidies Initiative produced in 2010 a survey of current practices for subsidy estimations (Steenblick & Jones, 2010). This manual serves as a guide for calculating the value of support identified in the inventory.
For some schemes that aggregated support for both marine and inland fisheries, we calculated “marine-only” data. This was done through techniques for different schemes. For schemes focused on post-harvest activities like fish landing centres, cold storage, retail marketing, transportation, and others, we used the ratios of marine fish landing to total fish landing data available for different states. By multiplying these ratios with the scheme expenditure in different years, we extracted marine-only expenditure. A similar methodology was applied for schemes that benefited fishers like relief-cum-savings schemes, housing, and training and skill development. For such schemes, we obtained the ratio of marine fisherfolk to total fisherfolk in different states. These ratios were then multiplied to scheme expenditure for different years to obtain marine-only expenditure.

IISD.org/gsi 58
Supporting Marine Fishing Sustainably: A review of central and state government support for marine fisheries in India
A4. Support Prioritization FrameworkWhile the subsidy estimates under the present inventory are useful in their own right, they may not be sufficient to help promote an informed national discussion about which fisheries support may be undermining or advancing sustainability. To address this concern, while acknowledging the need to base such analysis on solid empirical evidence, IISD has developed a prioritization framework aimed at identifying policies that are more likely to undermine sustainability and that should be targeted as a priority for further evaluation so that governments have better evidence on their economic, social, and environmental impacts. It also identifies the forms of support that are typically more effective from a sustainability perspective, considering economic, social, and environmental objectives. Ultimately, this framework should help governments identify policies to be prioritized for reform after a thorough evaluation––ideally by a national institution––has confirmed the need for redesign, replacement, or removal. Overall, the approach is designed as a three-step filtering exercise to be applied sequentially.
The first step consists of prioritizing policies according to the incentives they create and the environmental and socio-economic impacts that are typically associated with them, based on empirical analysis by international organizations (OECD, 2017; von Moltke, 2011) and researchers (Sumaila et al., 2019). The ranking does not reflect an absolute or definitive value judgment on each type of support but rather an indication of the overall level of risk associated with different types of programs. It starts from the assumption that support targeting individual fishers is more likely to alter the marginal benefits or costs of fishing than support targeting the sector as a whole. Similarly, subsidy programs that are closely linked to production are more likely to incentivize overcapacity and overfishing than those clearly decoupled from production.
Building on the classification of support described above, Table A4 divides support between individual fishers and companies (Category A) and general services (Category B). Under both columns, programs are ranked vertically according to their link to production, starting with support that increases according to the level of capture or inputs used, through programs that are formally decoupled from production but may have an impact on production, to programs that have no effect on production or even contribute to enhancing the size of stocks. In short, programs falling under the top left part of the table are likely to have more harmful effects than those in the bottom right part of the table. Support in between may have more ambiguous effects, depending on how they are designed.
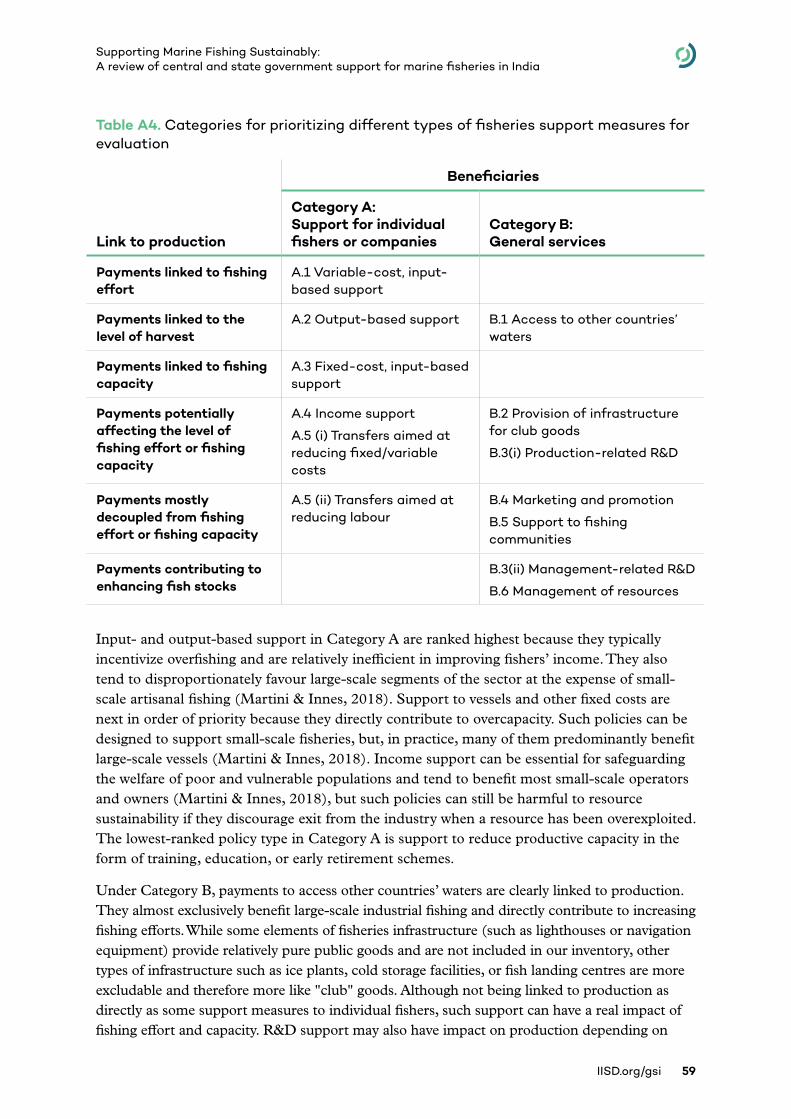
IISD.org/gsi 59
Supporting Marine Fishing Sustainably: A review of central and state government support for marine fisheries in India
Table A4. Categories for prioritizing different types of fisheries support measures for evaluation
Link to production
Beneficiaries
Category A: Support for individual fishers or companies
Category B: General services
Payments linked to fishing effort
A.1 Variable-cost, input-based support
Payments linked to the level of harvest
A.2 Output-based support B.1 Access to other countries’ waters
Payments linked to fishing capacity
A.3 Fixed-cost, input-based support
Payments potentially affecting the level of fishing effort or fishing capacity
A.4 Income support
A.5 (i) Transfers aimed at reducing fixed/variable costs
B.2 Provision of infrastructure for club goods
B.3(i) Production-related R&D
Payments mostly decoupled from fishing effort or fishing capacity
A.5 (ii) Transfers aimed at reducing labour
B.4 Marketing and promotion
B.5 Support to fishing communities
Payments contributing to enhancing fish stocks
B.3(ii) Management-related R&D
B.6 Management of resources
Input- and output-based support in Category A are ranked highest because they typically incentivize overfishing and are relatively inefficient in improving fishers’ income. They also tend to disproportionately favour large-scale segments of the sector at the expense of small-scale artisanal fishing (Martini & Innes, 2018). Support to vessels and other fixed costs are next in order of priority because they directly contribute to overcapacity. Such policies can be designed to support small-scale fisheries, but, in practice, many of them predominantly benefit large-scale vessels (Martini & Innes, 2018). Income support can be essential for safeguarding the welfare of poor and vulnerable populations and tend to benefit most small-scale operators and owners (Martini & Innes, 2018), but such policies can still be harmful to resource sustainability if they discourage exit from the industry when a resource has been overexploited. The lowest-ranked policy type in Category A is support to reduce productive capacity in the form of training, education, or early retirement schemes.
Under Category B, payments to access other countries’ waters are clearly linked to production. They almost exclusively benefit large-scale industrial fishing and directly contribute to increasing fishing efforts. While some elements of fisheries infrastructure (such as lighthouses or navigation equipment) provide relatively pure public goods and are not included in our inventory, other types of infrastructure such as ice plants, cold storage facilities, or fish landing centres are more excludable and therefore more like "club" goods. Although not being linked to production as directly as some support measures to individual fishers, such support can have a real impact of fishing effort and capacity. R&D support may also have impact on production depending on
IISD.org/gsi 60
Supporting Marine Fishing Sustainably: A review of central and state government support for marine fisheries in India
how it is designed and what it focuses on. R&D to improve bottom trawling, for example, may be more harmful than research aimed at improving resource management. Transfers financing marketing and promotion services and support to the livelihood of fisheries communities (e.g., through housing facilities, food aid, or education) are usually clearly decoupled from production. Finally, management services are virtually always positive from environmental and socio-economic perspectives, not least by improving the status of stocks.
The second step consists of prioritizing programs that represent a large absolute amount or a significant share of national and state-level support. Small programs may have important impacts in specific contexts, but if analytical and policy resources are scarce, it is important to prioritize support that has larger and more widespread impacts. In practice, certain forms of subsidies are likely to involve more resources than others. Typically, support for large infrastructure projects or income support targeting a high number of recipients will tend to be very significant. On the other hand, support linked to investment decisions in the form of low-cost loans may involve smaller amounts but have significant impacts in attracting additional private capital. In other words, comparing absolute amounts across different categories of support may be misleading. To address this concern, step two should identify the largest programs under key categories separately. The exact threshold for inclusion under each category will depend on the data collected. It could be expressed to cover a certain percentage of all subsidy programs or of the value or volume of total wild marine capture.
Finally, the third step consists of prioritizing programs that are being implemented in vulnerable contexts. It is based on the assumption that the impact of support not only depends on the types of incentives they create but also on context-specific variables such as the existing capacity of a particular fleet or the management regime in place.15 In other words, policy evaluation and potential policy reforms may be most urgent in areas where overfishing is already a problem and arguably less urgent when support plays a critical role in helping vulnerable segments of the sector.
From an environmental perspective, we define “vulnerable contexts” as jurisdictions or fisheries where:
• Fish stocks are already overexploited or projected to be so soon
• Fishing capacity is already fully or over-developed, or projected to be so soon
• Management measures do not explicitly include enforceable and sustainable catch limits.
Where official government data exist on stocks, capacity, and management regimes, these are used as primary information sources. Where these sources are not available, we rely on proxy indicators such as the evolution of catches over time or fleet data. Other context-specific elements include the extent to which the subsidy is more or less concentrated on vulnerable segments of the sector, with the assumption that policies heavily skewed toward large-scale industrial fishers are less likely to contribute to essential needs and poverty reduction for the most vulnerable and marginalized. Indicators to take this dimension into account include the information gathered using labels described in Table A3.
15 For example, an underexploited stock might withstand increased harvesting for a while, whereas an already overexploited stock will rapidly become depleted as a result of subsidization. Similarly, effective management measures can moderate the capacity-enhancing effect of support by controlling catches and limiting effort.
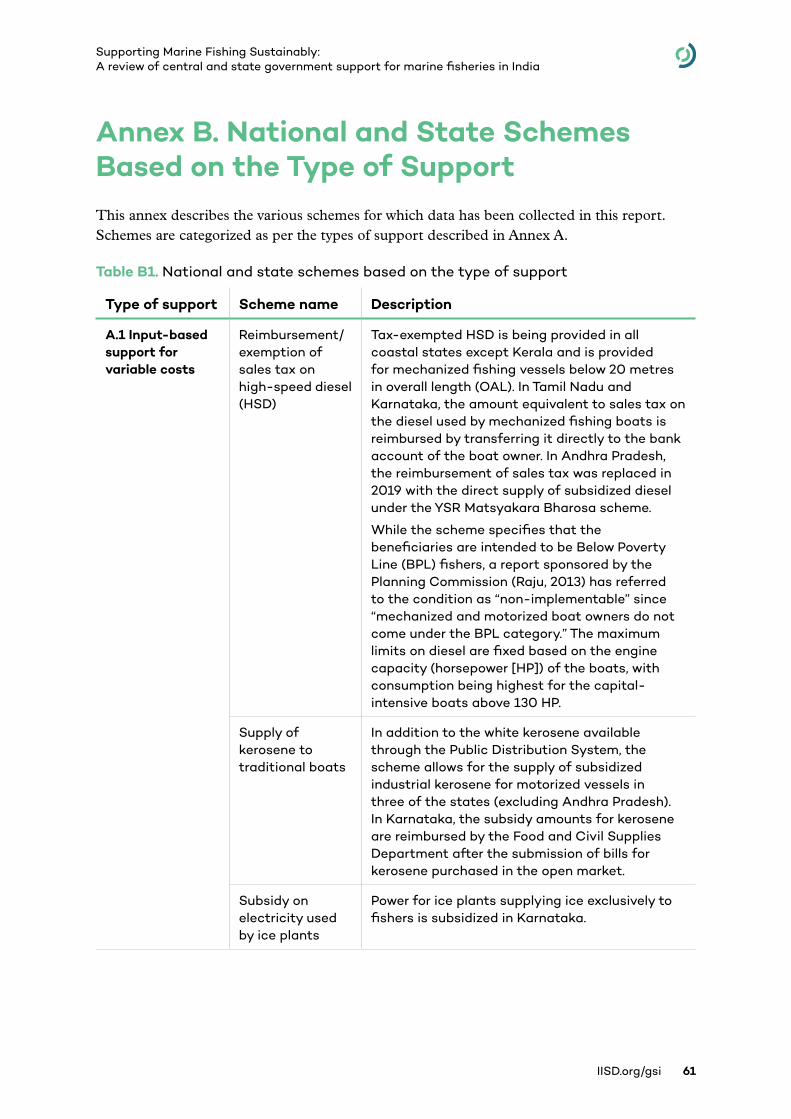
IISD.org/gsi 61
Supporting Marine Fishing Sustainably: A review of central and state government support for marine fisheries in India
Annex B. National and State Schemes Based on the Type of SupportThis annex describes the various schemes for which data has been collected in this report. Schemes are categorized as per the types of support described in Annex A.
Table B1. National and state schemes based on the type of support
Type of support Scheme name Description
A.1 Input-based support for variable costs
Reimbursement/exemption of sales tax on high-speed diesel (HSD)
Tax-exempted HSD is being provided in all coastal states except Kerala and is provided for mechanized fishing vessels below 20 metres in overall length (OAL). In Tamil Nadu and Karnataka, the amount equivalent to sales tax on the diesel used by mechanized fishing boats is reimbursed by transferring it directly to the bank account of the boat owner. In Andhra Pradesh, the reimbursement of sales tax was replaced in 2019 with the direct supply of subsidized diesel under the YSR Matsyakara Bharosa scheme.
While the scheme specifies that the beneficiaries are intended to be Below Poverty Line (BPL) fishers, a report sponsored by the Planning Commission (Raju, 2013) has referred to the condition as “non-implementable” since “mechanized and motorized boat owners do not come under the BPL category.” The maximum limits on diesel are fixed based on the engine capacity (horsepower [HP]) of the boats, with consumption being highest for the capital-intensive boats above 130 HP.
Supply of kerosene to traditional boats
In addition to the white kerosene available through the Public Distribution System, the scheme allows for the supply of subsidized industrial kerosene for motorized vessels in three of the states (excluding Andhra Pradesh). In Karnataka, the subsidy amounts for kerosene are reimbursed by the Food and Civil Supplies Department after the submission of bills for kerosene purchased in the open market.
Subsidy on electricity used by ice plants
Power for ice plants supplying ice exclusively to fishers is subsidized in Karnataka.
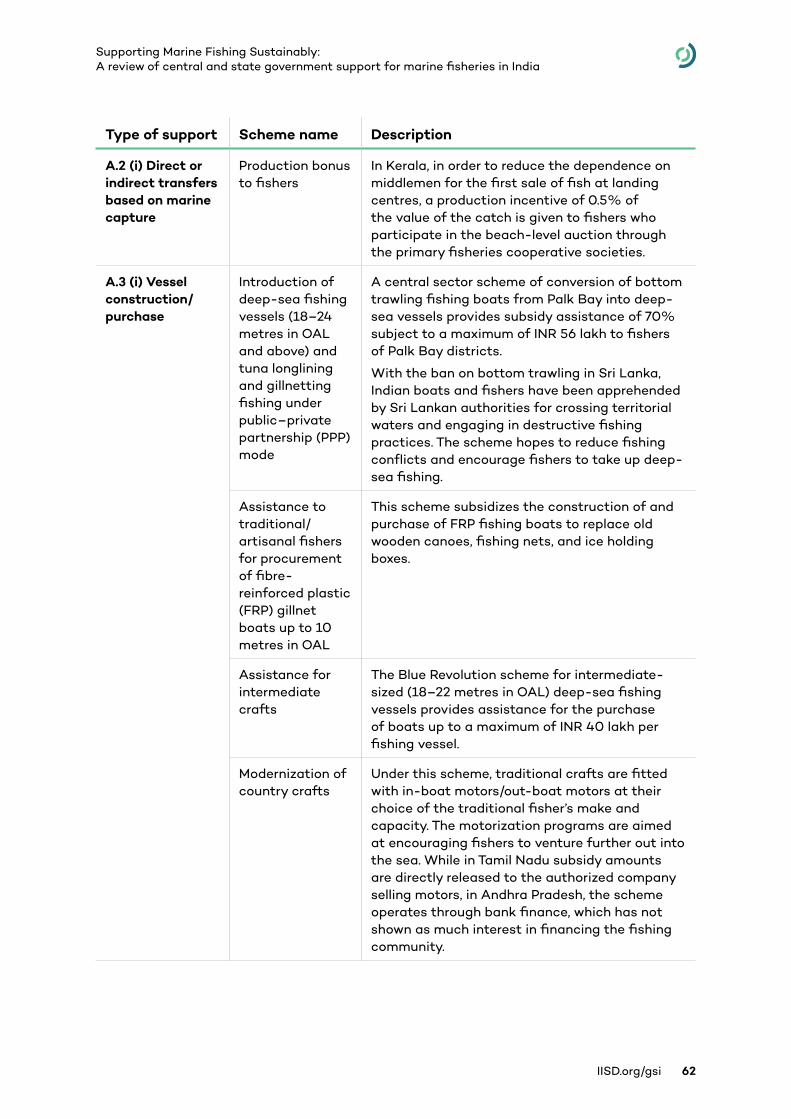
IISD.org/gsi 62
Supporting Marine Fishing Sustainably: A review of central and state government support for marine fisheries in India
Type of support Scheme name Description
A.2 (i) Direct or indirect transfers based on marine capture
Production bonus to fishers
In Kerala, in order to reduce the dependence on middlemen for the first sale of fish at landing centres, a production incentive of 0.5% of the value of the catch is given to fishers who participate in the beach-level auction through the primary fisheries cooperative societies.
A.3 (i) Vessel construction/purchase
Introduction of deep-sea fishing vessels (18–24 metres in OAL and above) and tuna longlining and gillnetting fishing under public–private partnership (PPP) mode
A central sector scheme of conversion of bottom trawling fishing boats from Palk Bay into deep-sea vessels provides subsidy assistance of 70% subject to a maximum of INR 56 lakh to fishers of Palk Bay districts.
With the ban on bottom trawling in Sri Lanka, Indian boats and fishers have been apprehended by Sri Lankan authorities for crossing territorial waters and engaging in destructive fishing practices. The scheme hopes to reduce fishing conflicts and encourage fishers to take up deep-sea fishing.
Assistance to traditional/artisanal fishers for procurement of fibre-reinforced plastic (FRP) gillnet boats up to 10 metres in OAL
This scheme subsidizes the construction of and purchase of FRP fishing boats to replace old wooden canoes, fishing nets, and ice holding boxes.
Assistance for intermediate crafts
The Blue Revolution scheme for intermediate-sized (18–22 metres in OAL) deep-sea fishing vessels provides assistance for the purchase of boats up to a maximum of INR 40 lakh per fishing vessel.
Modernization of country crafts
Under this scheme, traditional crafts are fitted with in-boat motors/out-boat motors at their choice of the traditional fisher’s make and capacity. The motorization programs are aimed at encouraging fishers to venture further out into the sea. While in Tamil Nadu subsidy amounts are directly released to the authorized company selling motors, in Andhra Pradesh, the scheme operates through bank finance, which has not shown as much interest in financing the fishing community.
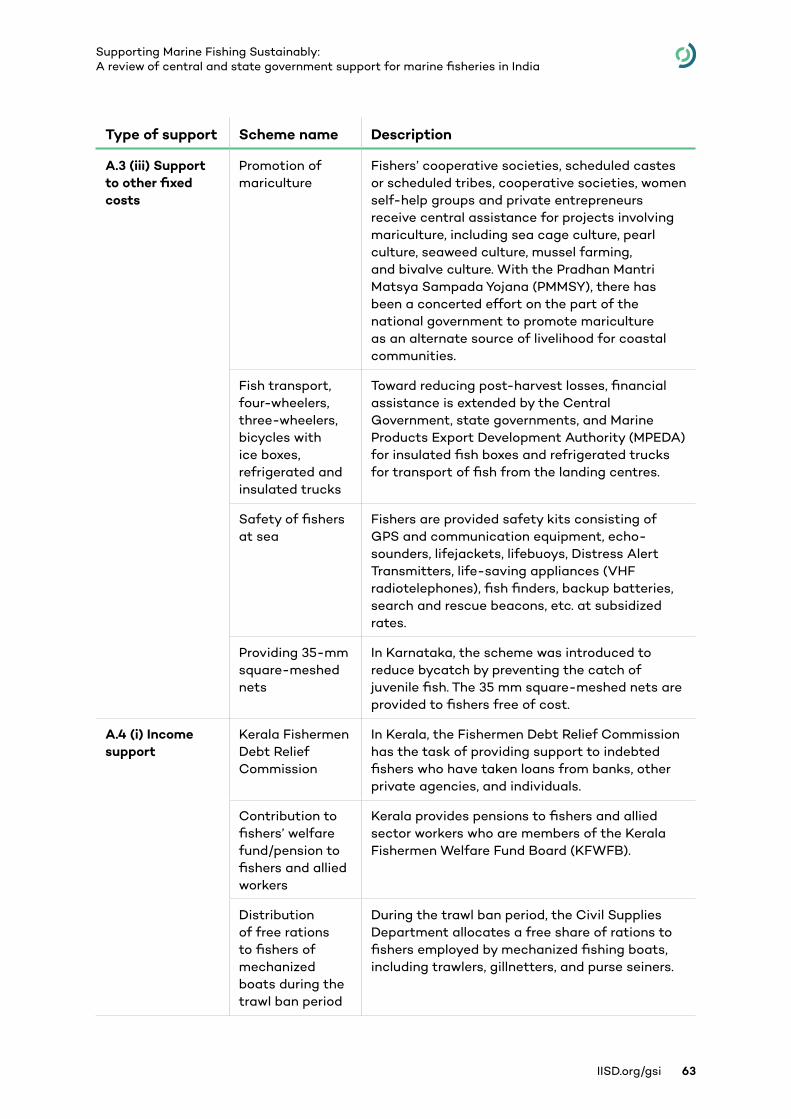
IISD.org/gsi 63
Supporting Marine Fishing Sustainably: A review of central and state government support for marine fisheries in India
Type of support Scheme name Description
A.3 (iii) Support to other fixed costs
Promotion of mariculture
Fishers’ cooperative societies, scheduled castes or scheduled tribes, cooperative societies, women self-help groups and private entrepreneurs receive central assistance for projects involving mariculture, including sea cage culture, pearl culture, seaweed culture, mussel farming, and bivalve culture. With the Pradhan Mantri Matsya Sampada Yojana (PMMSY), there has been a concerted effort on the part of the national government to promote mariculture as an alternate source of livelihood for coastal communities.
Fish transport, four-wheelers, three-wheelers, bicycles with ice boxes, refrigerated and insulated trucks
Toward reducing post-harvest losses, financial assistance is extended by the Central Government, state governments, and Marine Products Export Development Authority (MPEDA) for insulated fish boxes and refrigerated trucks for transport of fish from the landing centres.
Safety of fishers at sea
Fishers are provided safety kits consisting of GPS and communication equipment, echo-sounders, lifejackets, lifebuoys, Distress Alert Transmitters, life-saving appliances (VHF radiotelephones), fish finders, backup batteries, search and rescue beacons, etc. at subsidized rates.
Providing 35-mm square-meshed nets
In Karnataka, the scheme was introduced to reduce bycatch by preventing the catch of juvenile fish. The 35 mm square-meshed nets are provided to fishers free of cost.
A.4 (i) Income support
Kerala Fishermen Debt Relief Commission
In Kerala, the Fishermen Debt Relief Commission has the task of providing support to indebted fishers who have taken loans from banks, other private agencies, and individuals.
Contribution to fishers’ welfare fund/pension to fishers and allied workers
Kerala provides pensions to fishers and allied sector workers who are members of the Kerala Fishermen Welfare Fund Board (KFWFB).
Distribution of free rations to fishers of mechanized boats during the trawl ban period
During the trawl ban period, the Civil Supplies Department allocates a free share of rations to fishers employed by mechanized fishing boats, including trawlers, gillnetters, and purse seiners.
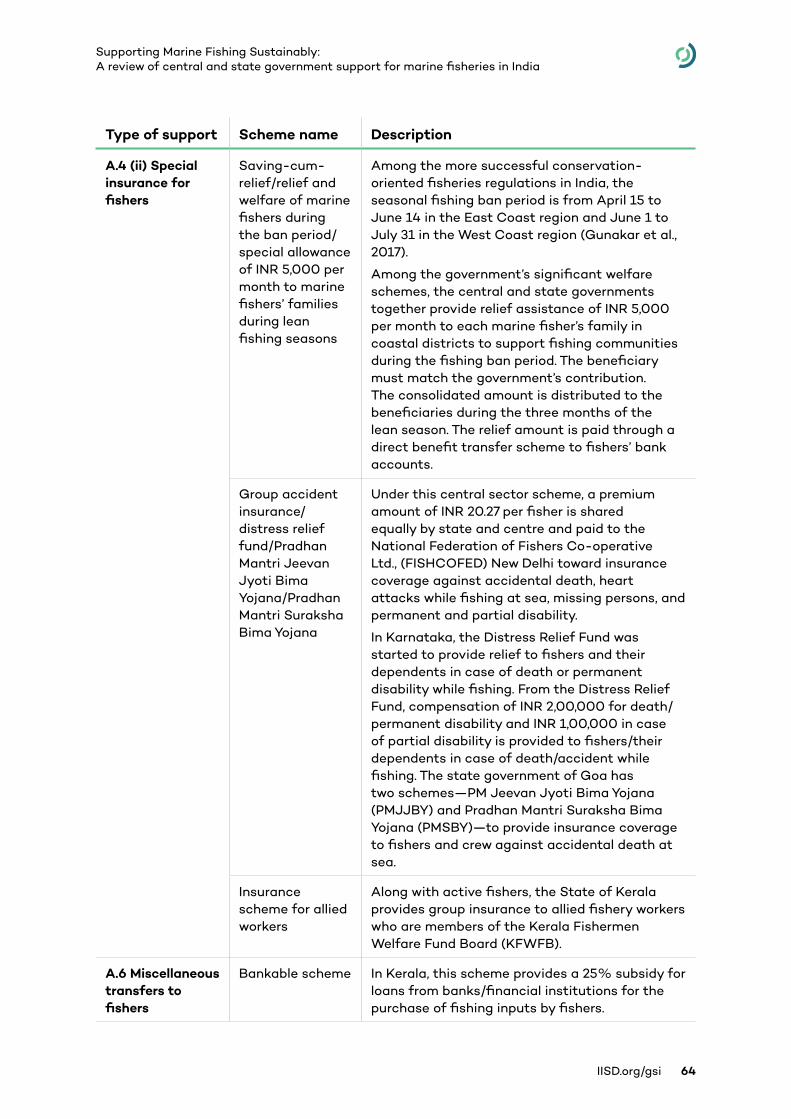
IISD.org/gsi 64
Supporting Marine Fishing Sustainably: A review of central and state government support for marine fisheries in India
Type of support Scheme name Description
A.4 (ii) Special insurance for fishers
Saving-cum-relief/relief and welfare of marine fishers during the ban period/special allowance of INR 5,000 per month to marine fishers’ families during lean fishing seasons
Among the more successful conservation-oriented fisheries regulations in India, the seasonal fishing ban period is from April 15 to June 14 in the East Coast region and June 1 to July 31 in the West Coast region (Gunakar et al., 2017).
Among the government’s significant welfare schemes, the central and state governments together provide relief assistance of INR 5,000 per month to each marine fisher’s family in coastal districts to support fishing communities during the fishing ban period. The beneficiary must match the government’s contribution. The consolidated amount is distributed to the beneficiaries during the three months of the lean season. The relief amount is paid through a direct benefit transfer scheme to fishers’ bank accounts.
Group accident insurance/distress relief fund/Pradhan Mantri Jeevan Jyoti Bima Yojana/Pradhan Mantri Suraksha Bima Yojana
Under this central sector scheme, a premium amount of INR 20.27 per fisher is shared equally by state and centre and paid to the National Federation of Fishers Co-operative Ltd., (FISHCOFED) New Delhi toward insurance coverage against accidental death, heart attacks while fishing at sea, missing persons, and permanent and partial disability.
In Karnataka, the Distress Relief Fund was started to provide relief to fishers and their dependents in case of death or permanent disability while fishing. From the Distress Relief Fund, compensation of INR 2,00,000 for death/permanent disability and INR 1,00,000 in case of partial disability is provided to fishers/their dependents in case of death/accident while fishing. The state government of Goa has two schemes—PM Jeevan Jyoti Bima Yojana (PMJJBY) and Pradhan Mantri Suraksha Bima Yojana (PMSBY)—to provide insurance coverage to fishers and crew against accidental death at sea.
Insurance scheme for allied workers
Along with active fishers, the State of Kerala provides group insurance to allied fishery workers who are members of the Kerala Fishermen Welfare Fund Board (KFWFB).
A.6 Miscellaneous transfers to fishers
Bankable scheme In Kerala, this scheme provides a 25% subsidy for loans from banks/financial institutions for the purchase of fishing inputs by fishers.
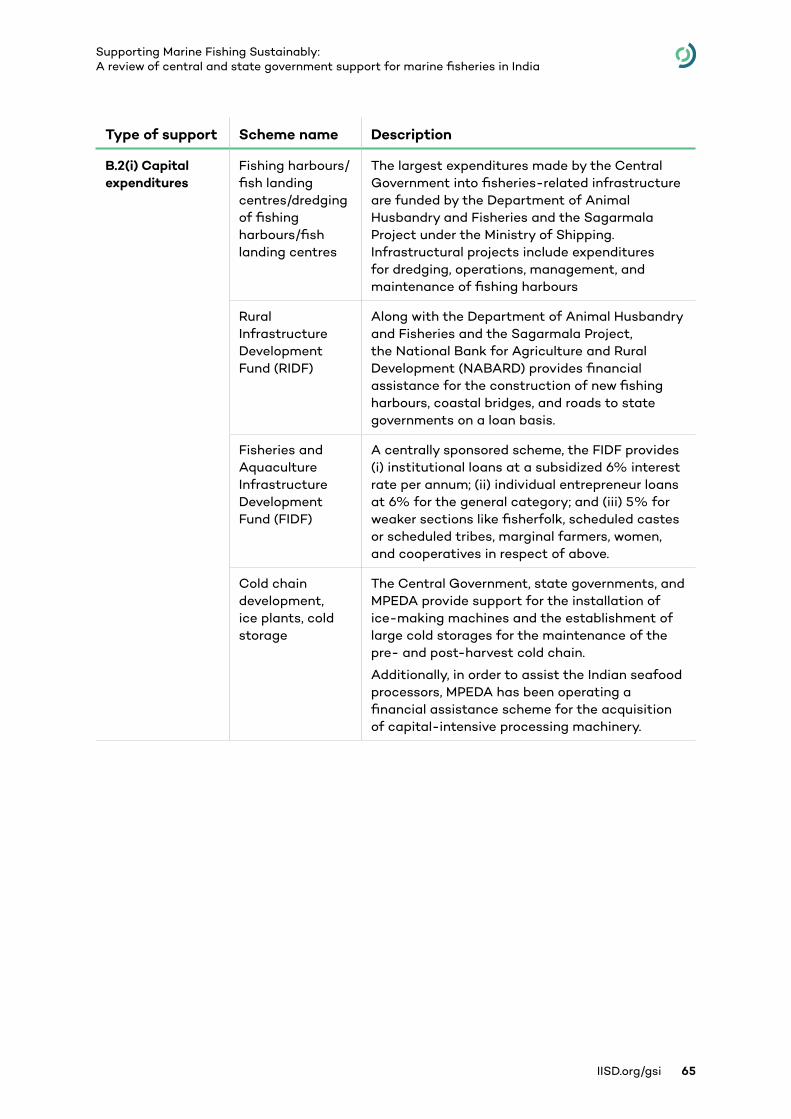
IISD.org/gsi 65
Supporting Marine Fishing Sustainably: A review of central and state government support for marine fisheries in India
Type of support Scheme name Description
B.2(i) Capital expenditures
Fishing harbours/fish landing centres/dredging of fishing harbours/fish landing centres
The largest expenditures made by the Central Government into fisheries-related infrastructure are funded by the Department of Animal Husbandry and Fisheries and the Sagarmala Project under the Ministry of Shipping. Infrastructural projects include expenditures for dredging, operations, management, and maintenance of fishing harbours
Rural Infrastructure Development Fund (RIDF)
Along with the Department of Animal Husbandry and Fisheries and the Sagarmala Project, the National Bank for Agriculture and Rural Development (NABARD) provides financial assistance for the construction of new fishing harbours, coastal bridges, and roads to state governments on a loan basis.
Fisheries and Aquaculture Infrastructure Development Fund (FIDF)
A centrally sponsored scheme, the FIDF provides (i) institutional loans at a subsidized 6% interest rate per annum; (ii) individual entrepreneur loans at 6% for the general category; and (iii) 5% for weaker sections like fisherfolk, scheduled castes or scheduled tribes, marginal farmers, women, and cooperatives in respect of above.
Cold chain development, ice plants, cold storage
The Central Government, state governments, and MPEDA provide support for the installation of ice-making machines and the establishment of large cold storages for the maintenance of the pre- and post-harvest cold chain.
Additionally, in order to assist the Indian seafood processors, MPEDA has been operating a financial assistance scheme for the acquisition of capital-intensive processing machinery.
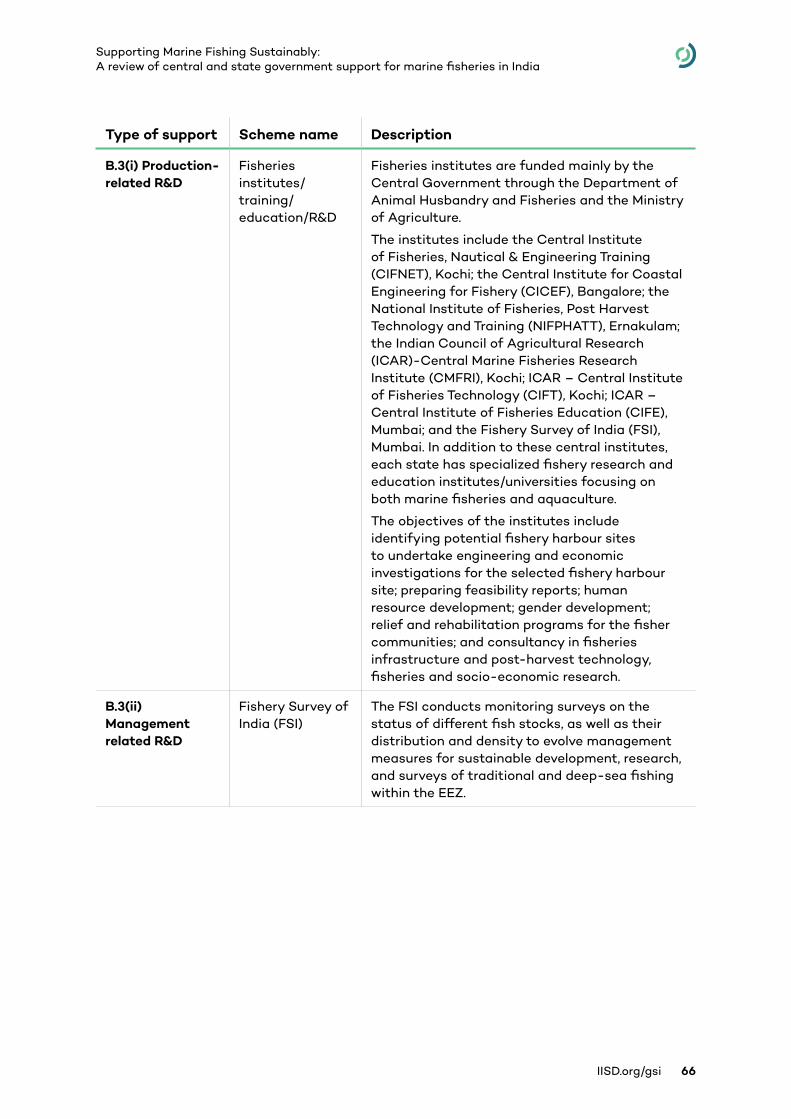
IISD.org/gsi 66
Supporting Marine Fishing Sustainably: A review of central and state government support for marine fisheries in India
Type of support Scheme name Description
B.3(i) Production-related R&D
Fisheries institutes/training/education/R&D
Fisheries institutes are funded mainly by the Central Government through the Department of Animal Husbandry and Fisheries and the Ministry of Agriculture.
The institutes include the Central Institute of Fisheries, Nautical & Engineering Training (CIFNET), Kochi; the Central Institute for Coastal Engineering for Fishery (CICEF), Bangalore; the National Institute of Fisheries, Post Harvest Technology and Training (NIFPHATT), Ernakulam; the Indian Council of Agricultural Research (ICAR)-Central Marine Fisheries Research Institute (CMFRI), Kochi; ICAR – Central Institute of Fisheries Technology (CIFT), Kochi; ICAR – Central Institute of Fisheries Education (CIFE), Mumbai; and the Fishery Survey of India (FSI), Mumbai. In addition to these central institutes, each state has specialized fishery research and education institutes/universities focusing on both marine fisheries and aquaculture.
The objectives of the institutes include identifying potential fishery harbour sites to undertake engineering and economic investigations for the selected fishery harbour site; preparing feasibility reports; human resource development; gender development; relief and rehabilitation programs for the fisher communities; and consultancy in fisheries infrastructure and post-harvest technology, fisheries and socio-economic research.
B.3(ii) Management related R&D
Fishery Survey of India (FSI)
The FSI conducts monitoring surveys on the status of different fish stocks, as well as their distribution and density to evolve management measures for sustainable development, research, and surveys of traditional and deep-sea fishing within the EEZ.
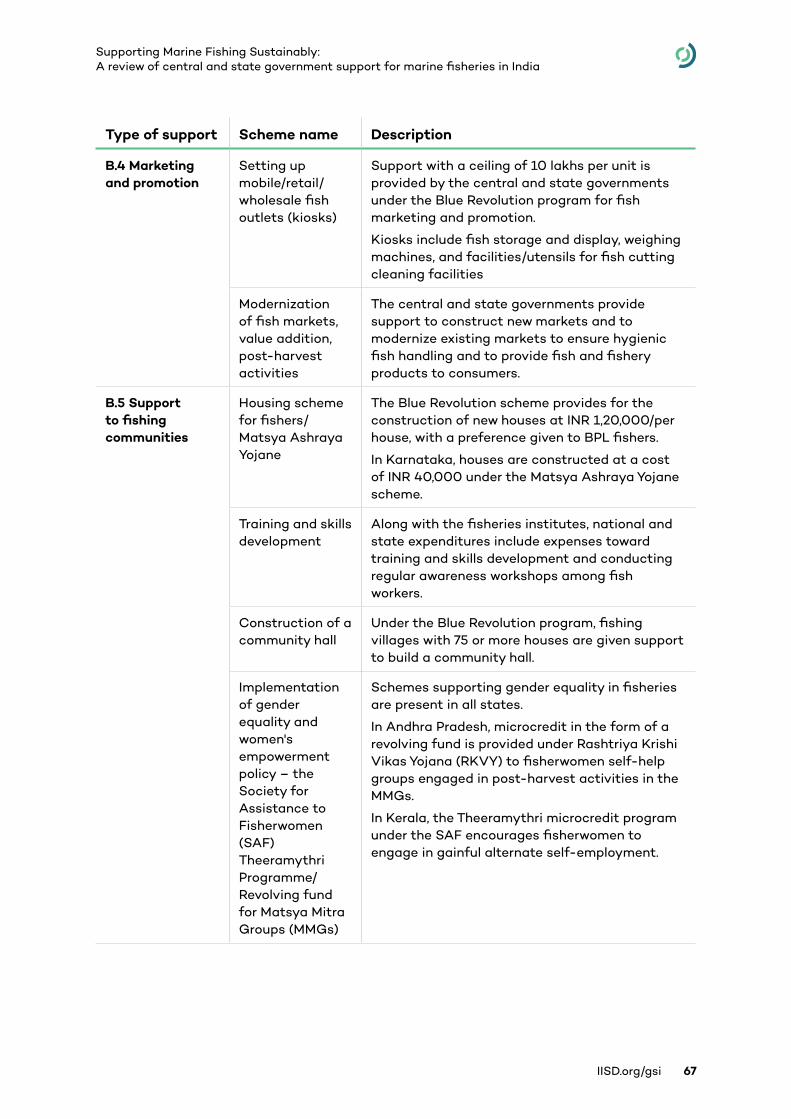
IISD.org/gsi 67
Supporting Marine Fishing Sustainably: A review of central and state government support for marine fisheries in India
Type of support Scheme name Description
B.4 Marketing and promotion
Setting up mobile/retail/wholesale fish outlets (kiosks)
Support with a ceiling of 10 lakhs per unit is provided by the central and state governments under the Blue Revolution program for fish marketing and promotion.
Kiosks include fish storage and display, weighing machines, and facilities/utensils for fish cutting cleaning facilities
Modernization of fish markets, value addition, post-harvest activities
The central and state governments provide support to construct new markets and to modernize existing markets to ensure hygienic fish handling and to provide fish and fishery products to consumers.
B.5 Support to fishing communities
Housing scheme for fishers/Matsya Ashraya Yojane
The Blue Revolution scheme provides for the construction of new houses at INR 1,20,000/per house, with a preference given to BPL fishers.
In Karnataka, houses are constructed at a cost of INR 40,000 under the Matsya Ashraya Yojane scheme.
Training and skills development
Along with the fisheries institutes, national and state expenditures include expenses toward training and skills development and conducting regular awareness workshops among fish workers.
Construction of a community hall
Under the Blue Revolution program, fishing villages with 75 or more houses are given support to build a community hall.
Implementation of gender equality and women's empowerment policy – the Society for Assistance to Fisherwomen (SAF) Theeramythri Programme/Revolving fund for Matsya Mitra Groups (MMGs)
Schemes supporting gender equality in fisheries are present in all states.
In Andhra Pradesh, microcredit in the form of a revolving fund is provided under Rashtriya Krishi Vikas Yojana (RKVY) to fisherwomen self-help groups engaged in post-harvest activities in the MMGs.
In Kerala, the Theeramythri microcredit program under the SAF encourages fisherwomen to engage in gainful alternate self-employment.
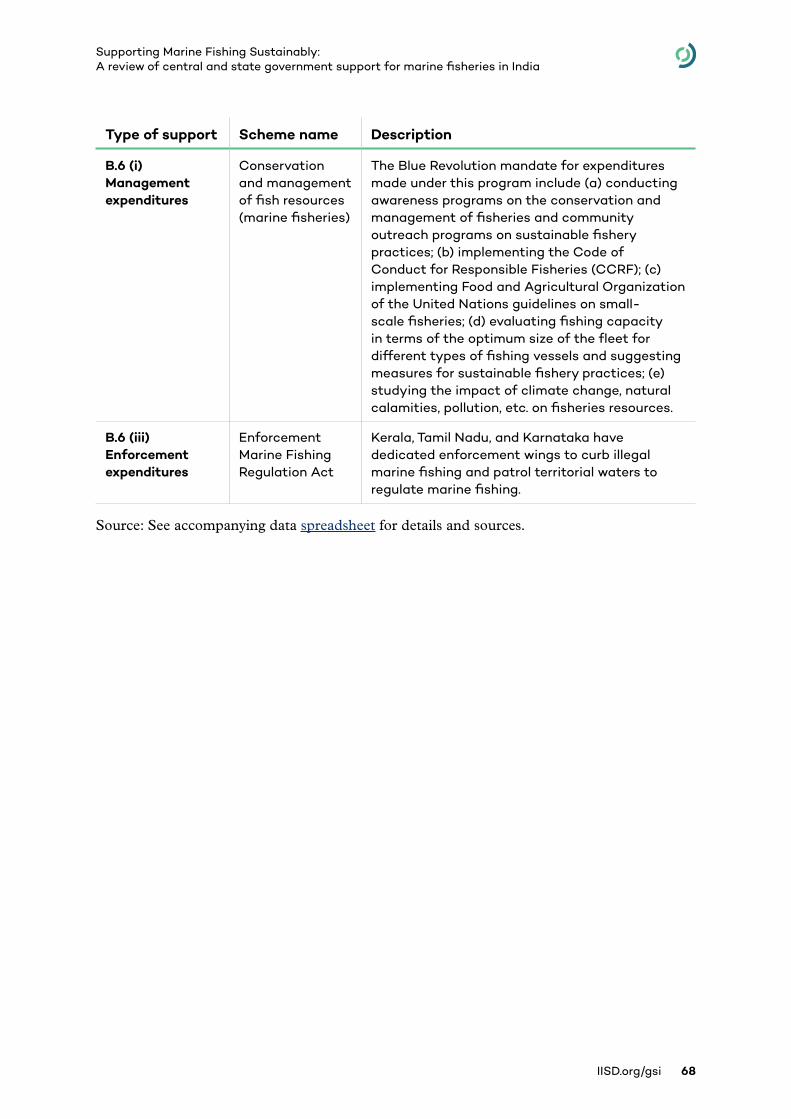
IISD.org/gsi 68
Supporting Marine Fishing Sustainably: A review of central and state government support for marine fisheries in India
Type of support Scheme name Description
B.6 (i) Management expenditures
Conservation and management of fish resources (marine fisheries)
The Blue Revolution mandate for expenditures made under this program include (a) conducting awareness programs on the conservation and management of fisheries and community outreach programs on sustainable fishery practices; (b) implementing the Code of Conduct for Responsible Fisheries (CCRF); (c) implementing Food and Agricultural Organization of the United Nations guidelines on small-scale fisheries; (d) evaluating fishing capacity in terms of the optimum size of the fleet for different types of fishing vessels and suggesting measures for sustainable fishery practices; (e) studying the impact of climate change, natural calamities, pollution, etc. on fisheries resources.
B.6 (iii) Enforcement expenditures
Enforcement Marine Fishing Regulation Act
Kerala, Tamil Nadu, and Karnataka have dedicated enforcement wings to curb illegal marine fishing and patrol territorial waters to regulate marine fishing.
Source: See accompanying data spreadsheet for details and sources.
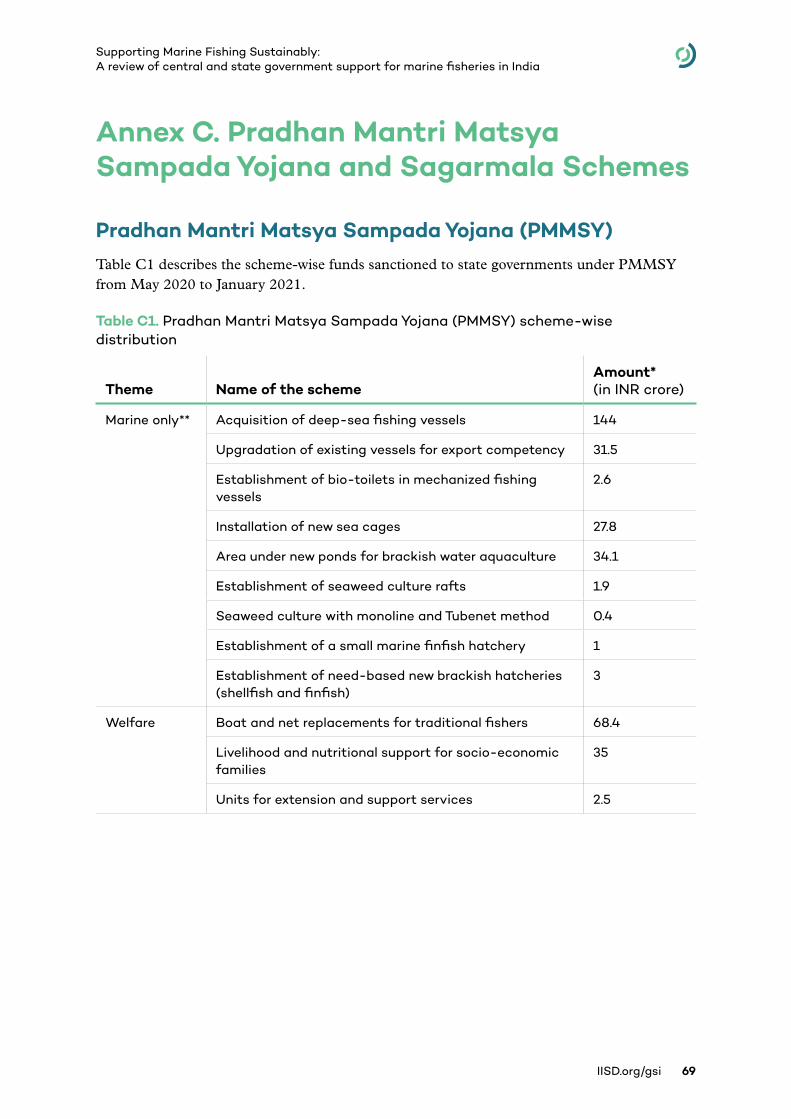
IISD.org/gsi 69
Supporting Marine Fishing Sustainably: A review of central and state government support for marine fisheries in India
Annex C. Pradhan Mantri Matsya Sampada Yojana and Sagarmala Schemes
Pradhan Mantri Matsya Sampada Yojana (PMMSY) Table C1 describes the scheme-wise funds sanctioned to state governments under PMMSY from May 2020 to January 2021.
Table C1. Pradhan Mantri Matsya Sampada Yojana (PMMSY) scheme-wise distribution
Theme Name of the schemeAmount* (in INR crore)
Marine only** Acquisition of deep-sea fishing vessels 144
Upgradation of existing vessels for export competency 31.5
Establishment of bio-toilets in mechanized fishing vessels
2.6
Installation of new sea cages 27.8
Area under new ponds for brackish water aquaculture 34.1
Establishment of seaweed culture rafts 1.9
Seaweed culture with monoline and Tubenet method 0.4
Establishment of a small marine finfish hatchery 1
Establishment of need-based new brackish hatcheries (shellfish and finfish)
3
Welfare Boat and net replacements for traditional fishers 68.4
Livelihood and nutritional support for socio-economic families
35
Units for extension and support services 2.5
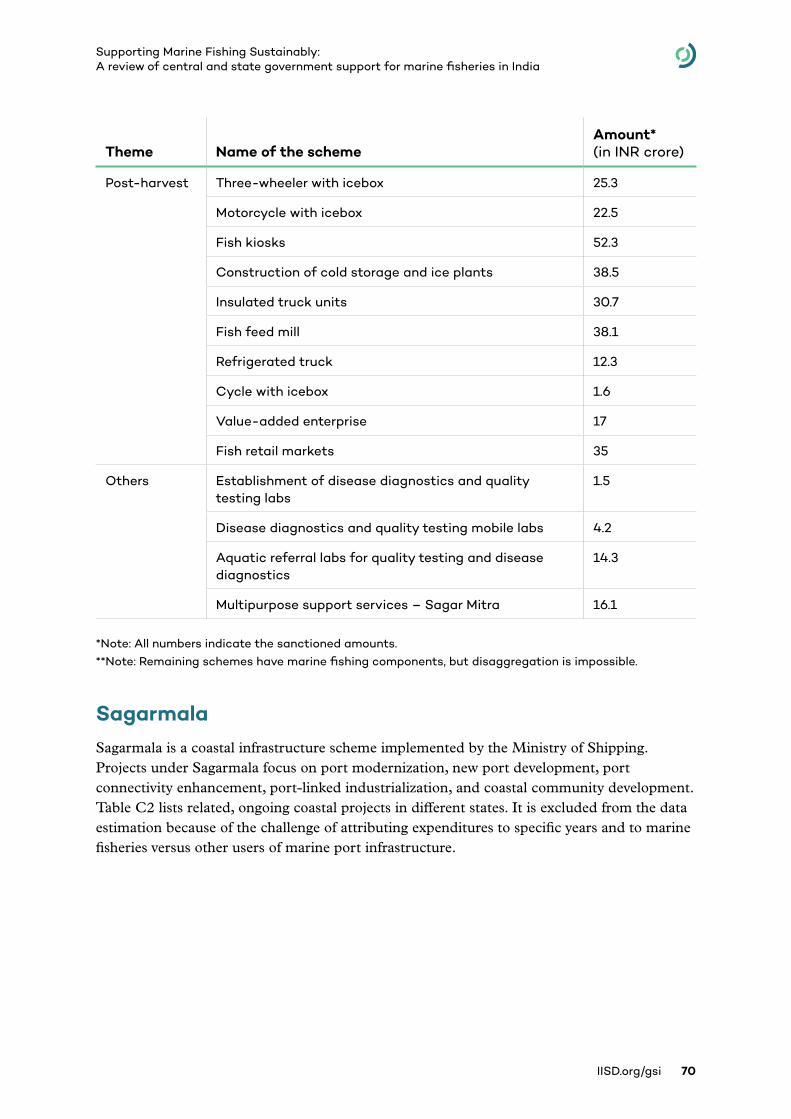
IISD.org/gsi 70
Supporting Marine Fishing Sustainably: A review of central and state government support for marine fisheries in India
Theme Name of the schemeAmount* (in INR crore)
Post-harvest Three-wheeler with icebox 25.3
Motorcycle with icebox 22.5
Fish kiosks 52.3
Construction of cold storage and ice plants 38.5
Insulated truck units 30.7
Fish feed mill 38.1
Refrigerated truck 12.3
Cycle with icebox 1.6
Value-added enterprise 17
Fish retail markets 35
Others Establishment of disease diagnostics and quality testing labs
1.5
Disease diagnostics and quality testing mobile labs 4.2
Aquatic referral labs for quality testing and disease diagnostics
14.3
Multipurpose support services – Sagar Mitra 16.1
*Note: All numbers indicate the sanctioned amounts.**Note: Remaining schemes have marine fishing components, but disaggregation is impossible.
SagarmalaSagarmala is a coastal infrastructure scheme implemented by the Ministry of Shipping. Projects under Sagarmala focus on port modernization, new port development, port connectivity enhancement, port-linked industrialization, and coastal community development. Table C2 lists related, ongoing coastal projects in different states. It is excluded from the data estimation because of the challenge of attributing expenditures to specific years and to marine fisheries versus other users of marine port infrastructure.
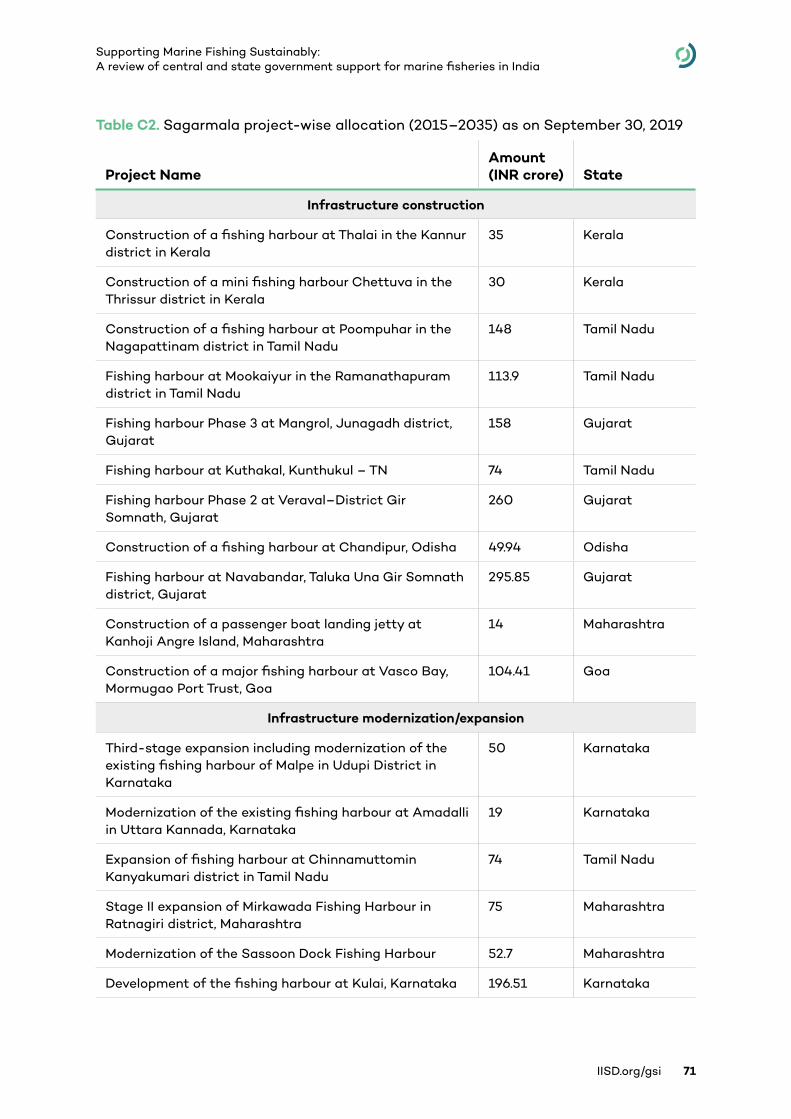
IISD.org/gsi 71
Supporting Marine Fishing Sustainably: A review of central and state government support for marine fisheries in India
Table C2. Sagarmala project-wise allocation (2015–2035) as on September 30, 2019
Project NameAmount (INR crore) State
Infrastructure construction
Construction of a fishing harbour at Thalai in the Kannur district in Kerala
35 Kerala
Construction of a mini fishing harbour Chettuva in the Thrissur district in Kerala
30 Kerala
Construction of a fishing harbour at Poompuhar in the Nagapattinam district in Tamil Nadu
148 Tamil Nadu
Fishing harbour at Mookaiyur in the Ramanathapuram district in Tamil Nadu
113.9 Tamil Nadu
Fishing harbour Phase 3 at Mangrol, Junagadh district, Gujarat
158 Gujarat
Fishing harbour at Kuthakal, Kunthukul – TN 74 Tamil Nadu
Fishing harbour Phase 2 at Veraval–District Gir Somnath, Gujarat
260 Gujarat
Construction of a fishing harbour at Chandipur, Odisha 49.94 Odisha
Fishing harbour at Navabandar, Taluka Una Gir Somnath district, Gujarat
295.85 Gujarat
Construction of a passenger boat landing jetty at Kanhoji Angre Island, Maharashtra
14 Maharashtra
Construction of a major fishing harbour at Vasco Bay, Mormugao Port Trust, Goa
104.41 Goa
Infrastructure modernization/expansion
Third-stage expansion including modernization of the existing fishing harbour of Malpe in Udupi District in Karnataka
50 Karnataka
Modernization of the existing fishing harbour at Amadalli in Uttara Kannada, Karnataka
19 Karnataka
Expansion of fishing harbour at Chinnamuttomin Kanyakumari district in Tamil Nadu
74 Tamil Nadu
Stage II expansion of Mirkawada Fishing Harbour in Ratnagiri district, Maharashtra
75 Maharashtra
Modernization of the Sassoon Dock Fishing Harbour 52.7 Maharashtra
Development of the fishing harbour at Kulai, Karnataka 196.51 Karnataka
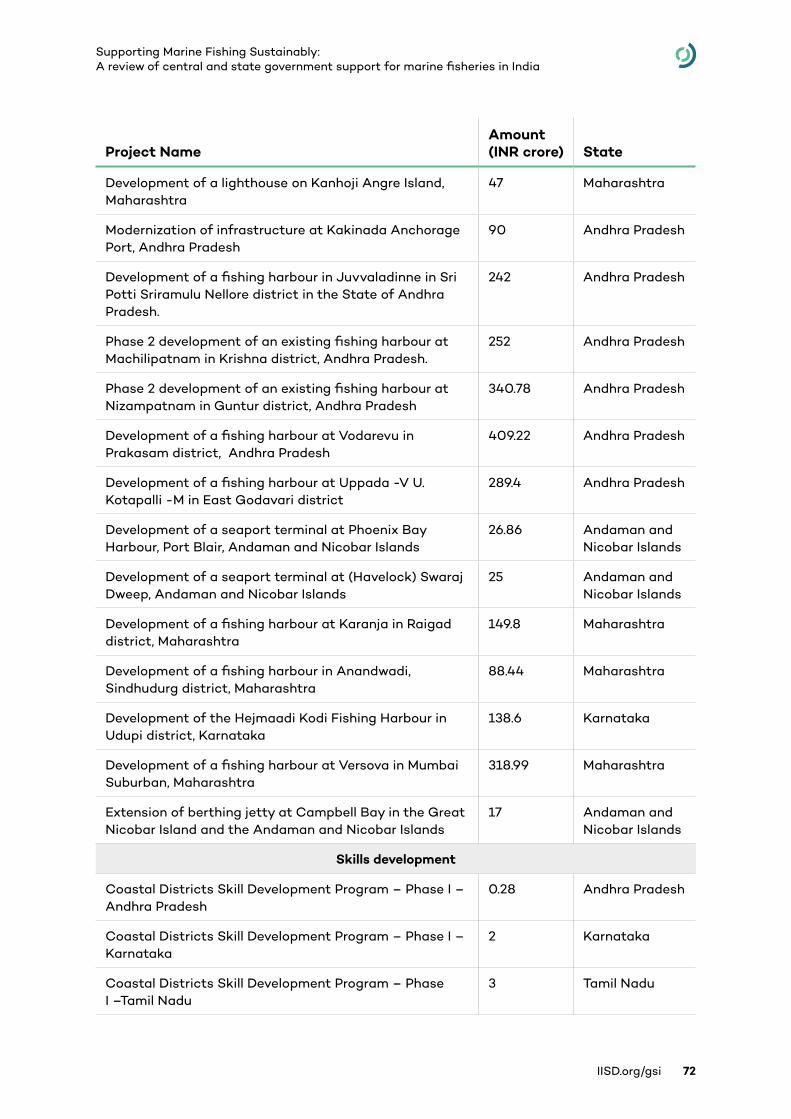
IISD.org/gsi 72
Supporting Marine Fishing Sustainably: A review of central and state government support for marine fisheries in India
Project NameAmount (INR crore) State
Development of a lighthouse on Kanhoji Angre Island, Maharashtra
47 Maharashtra
Modernization of infrastructure at Kakinada Anchorage Port, Andhra Pradesh
90 Andhra Pradesh
Development of a fishing harbour in Juvvaladinne in Sri Potti Sriramulu Nellore district in the State of Andhra Pradesh.
242 Andhra Pradesh
Phase 2 development of an existing fishing harbour at Machilipatnam in Krishna district, Andhra Pradesh.
252 Andhra Pradesh
Phase 2 development of an existing fishing harbour at Nizampatnam in Guntur district, Andhra Pradesh
340.78 Andhra Pradesh
Development of a fishing harbour at Vodarevu in Prakasam district, Andhra Pradesh
409.22 Andhra Pradesh
Development of a fishing harbour at Uppada -V U. Kotapalli -M in East Godavari district
289.4 Andhra Pradesh
Development of a seaport terminal at Phoenix Bay Harbour, Port Blair, Andaman and Nicobar Islands
26.86 Andaman and Nicobar Islands
Development of a seaport terminal at (Havelock) Swaraj Dweep, Andaman and Nicobar Islands
25 Andaman and Nicobar Islands
Development of a fishing harbour at Karanja in Raigad district, Maharashtra
149.8 Maharashtra
Development of a fishing harbour in Anandwadi, Sindhudurg district, Maharashtra
88.44 Maharashtra
Development of the Hejmaadi Kodi Fishing Harbour in Udupi district, Karnataka
138.6 Karnataka
Development of a fishing harbour at Versova in Mumbai Suburban, Maharashtra
318.99 Maharashtra
Extension of berthing jetty at Campbell Bay in the Great Nicobar Island and the Andaman and Nicobar Islands
17 Andaman and Nicobar Islands
Skills development
Coastal Districts Skill Development Program – Phase I – Andhra Pradesh
0.28 Andhra Pradesh
Coastal Districts Skill Development Program – Phase I – Karnataka
2 Karnataka
Coastal Districts Skill Development Program – Phase I –Tamil Nadu
3 Tamil Nadu
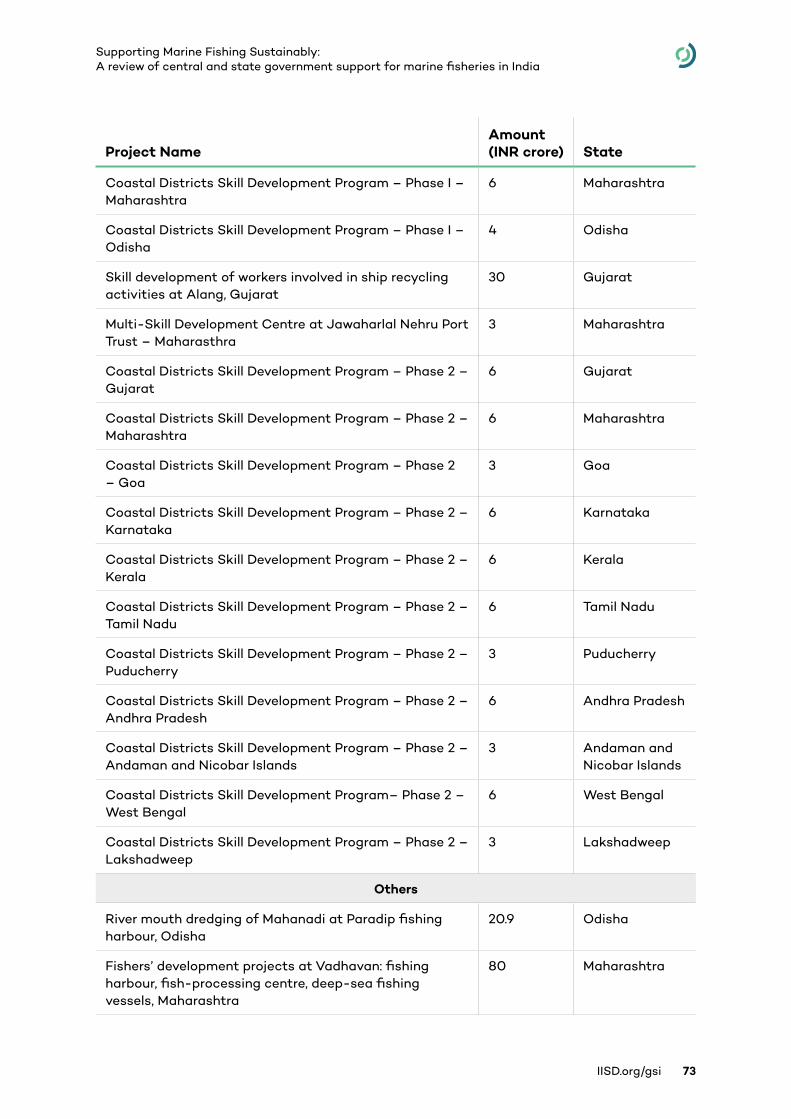
IISD.org/gsi 73
Supporting Marine Fishing Sustainably: A review of central and state government support for marine fisheries in India
Project NameAmount (INR crore) State
Coastal Districts Skill Development Program – Phase I – Maharashtra
6 Maharashtra
Coastal Districts Skill Development Program – Phase I – Odisha
4 Odisha
Skill development of workers involved in ship recycling activities at Alang, Gujarat
30 Gujarat
Multi-Skill Development Centre at Jawaharlal Nehru Port Trust – Maharasthra
3 Maharashtra
Coastal Districts Skill Development Program – Phase 2 – Gujarat
6 Gujarat
Coastal Districts Skill Development Program – Phase 2 – Maharashtra
6 Maharashtra
Coastal Districts Skill Development Program – Phase 2 – Goa
3 Goa
Coastal Districts Skill Development Program – Phase 2 – Karnataka
6 Karnataka
Coastal Districts Skill Development Program – Phase 2 – Kerala
6 Kerala
Coastal Districts Skill Development Program – Phase 2 – Tamil Nadu
6 Tamil Nadu
Coastal Districts Skill Development Program – Phase 2 – Puducherry
3 Puducherry
Coastal Districts Skill Development Program – Phase 2 – Andhra Pradesh
6 Andhra Pradesh
Coastal Districts Skill Development Program – Phase 2 – Andaman and Nicobar Islands
3 Andaman and Nicobar Islands
Coastal Districts Skill Development Program– Phase 2 – West Bengal
6 West Bengal
Coastal Districts Skill Development Program – Phase 2 – Lakshadweep
3 Lakshadweep
Others
River mouth dredging of Mahanadi at Paradip fishing harbour, Odisha
20.9 Odisha
Fishers’ development projects at Vadhavan: fishing harbour, fish-processing centre, deep-sea fishing vessels, Maharashtra
80 Maharashtra
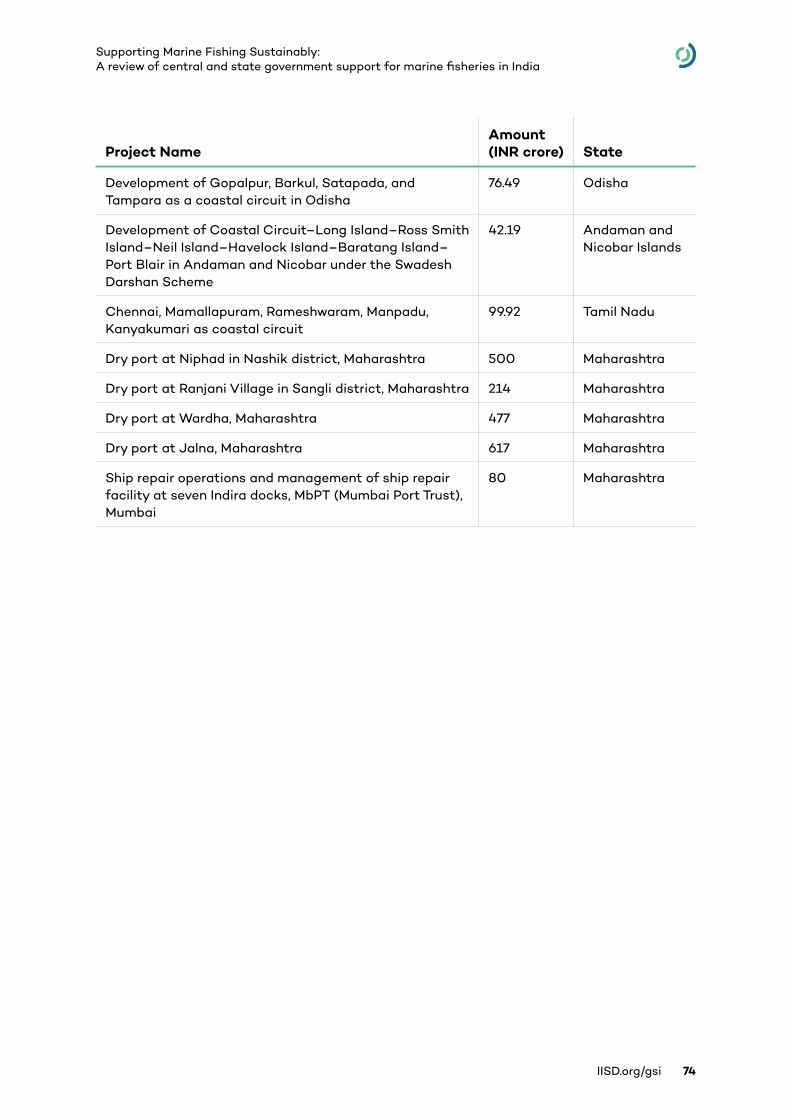
IISD.org/gsi 74
Supporting Marine Fishing Sustainably: A review of central and state government support for marine fisheries in India
Project NameAmount (INR crore) State
Development of Gopalpur, Barkul, Satapada, and Tampara as a coastal circuit in Odisha
76.49 Odisha
Development of Coastal Circuit–Long Island–Ross Smith Island–Neil Island–Havelock Island–Baratang Island–Port Blair in Andaman and Nicobar under the Swadesh Darshan Scheme
42.19 Andaman and Nicobar Islands
Chennai, Mamallapuram, Rameshwaram, Manpadu, Kanyakumari as coastal circuit
99.92 Tamil Nadu
Dry port at Niphad in Nashik district, Maharashtra 500 Maharashtra
Dry port at Ranjani Village in Sangli district, Maharashtra 214 Maharashtra
Dry port at Wardha, Maharashtra 477 Maharashtra
Dry port at Jalna, Maharashtra 617 Maharashtra
Ship repair operations and management of ship repair facility at seven Indira docks, MbPT (Mumbai Port Trust), Mumbai
80 Maharashtra
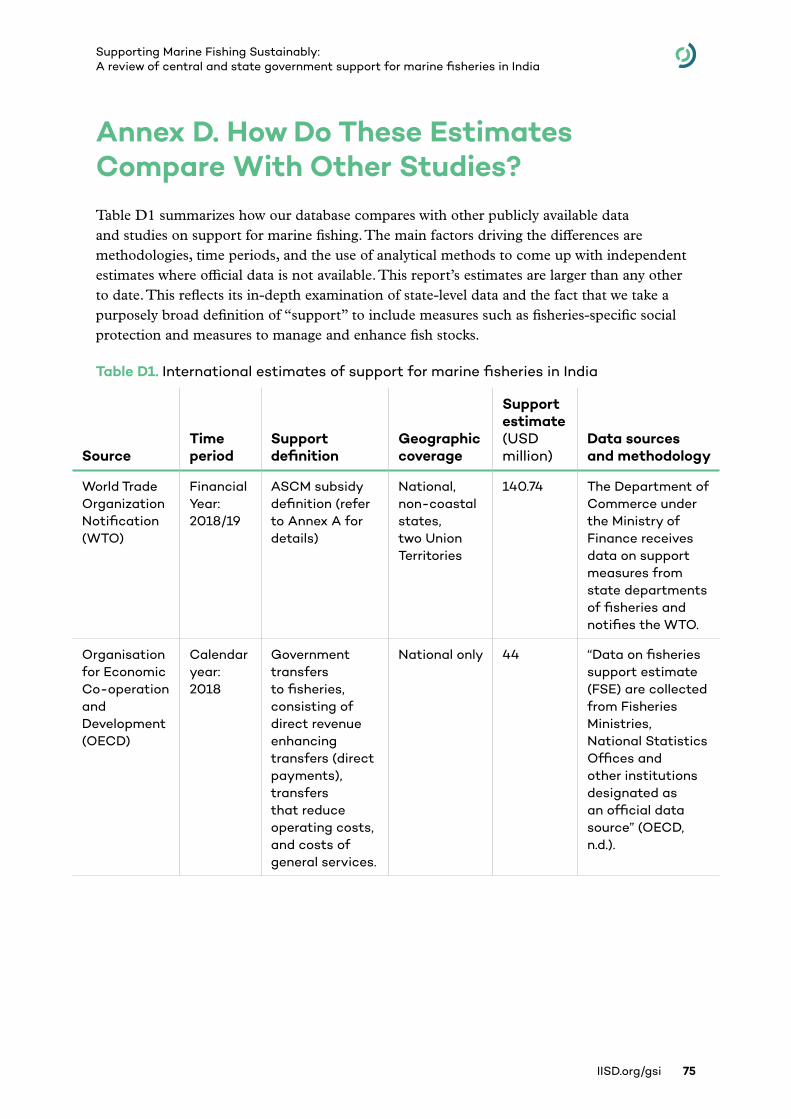
IISD.org/gsi 75
Supporting Marine Fishing Sustainably: A review of central and state government support for marine fisheries in India
Annex D. How Do These Estimates Compare With Other Studies?Table D1 summarizes how our database compares with other publicly available data and studies on support for marine fishing. The main factors driving the differences are methodologies, time periods, and the use of analytical methods to come up with independent estimates where official data is not available. This report’s estimates are larger than any other to date. This reflects its in-depth examination of state-level data and the fact that we take a purposely broad definition of “support” to include measures such as fisheries-specific social protection and measures to manage and enhance fish stocks.
Table D1. International estimates of support for marine fisheries in India
SourceTime period
Support definition
Geographic coverage
Support estimate (USD million)
Data sources and methodology
World Trade Organization Notification (WTO)
Financial Year: 2018/19
ASCM subsidy definition (refer to Annex A for details)
National, non-coastal states, two Union Territories
140.74 The Department of Commerce under the Ministry of Finance receives data on support measures from state departments of fisheries and notifies the WTO.
Organisation for Economic Co-operation and Development (OECD)
Calendar year: 2018
Government transfers to fisheries, consisting of direct revenue enhancing transfers (direct payments), transfers that reduce operating costs, and costs of general services.
National only 44 “Data on fisheries support estimate (FSE) are collected from Fisheries Ministries, National Statistics Offices and other institutions designated as an official data source” (OECD, n.d.).
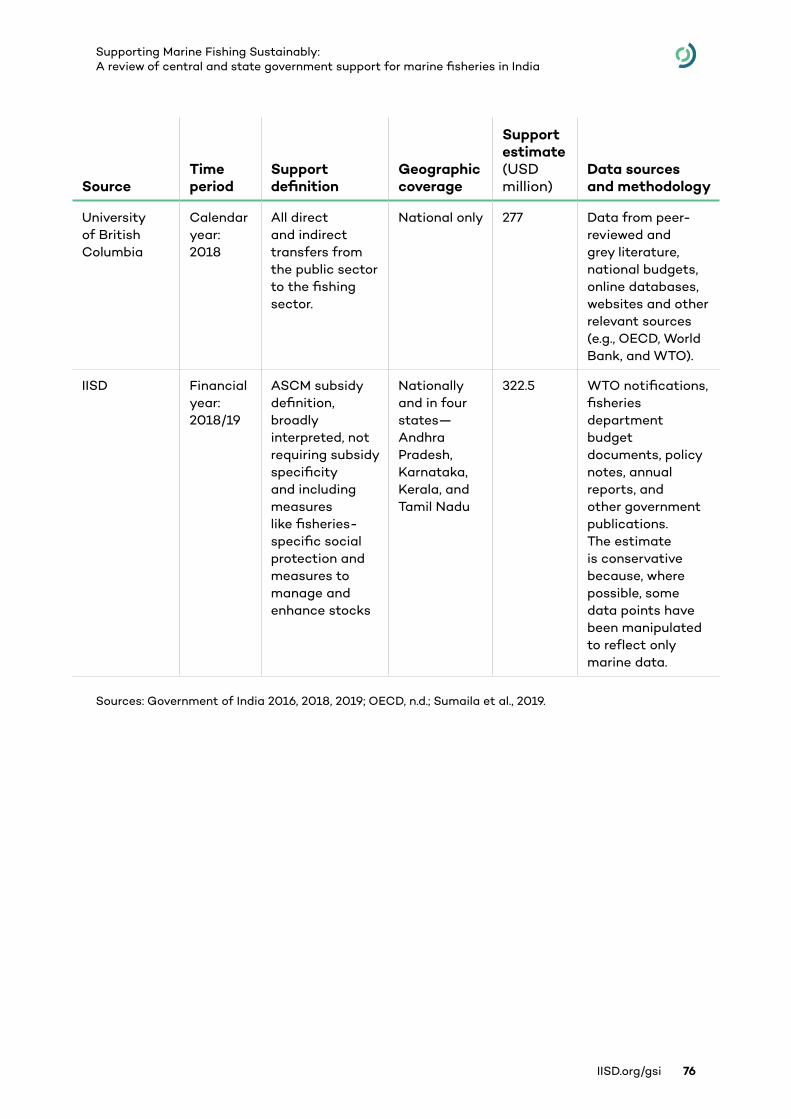
IISD.org/gsi 76
Supporting Marine Fishing Sustainably: A review of central and state government support for marine fisheries in India
SourceTime period
Support definition
Geographic coverage
Support estimate (USD million)
Data sources and methodology
University of British Columbia
Calendar year: 2018
All direct and indirect transfers from the public sector to the fishing sector.
National only 277 Data from peer-reviewed and grey literature, national budgets, online databases, websites and other relevant sources (e.g., OECD, World Bank, and WTO).
IISD Financial year: 2018/19
ASCM subsidy definition, broadly interpreted, not requiring subsidy specificity and including measures like fisheries-specific social protection and measures to manage and enhance stocks
Nationally and in four states—Andhra Pradesh, Karnataka, Kerala, and Tamil Nadu
322.5 WTO notifications, fisheries department budget documents, policy notes, annual reports, and other government publications. The estimate is conservative because, where possible, some data points have been manipulated to reflect only marine data.
Sources: Government of India 2016, 2018, 2019; OECD, n.d.; Sumaila et al., 2019.
©2021 The International Institute for Sustainable Development Published by the International Institute for Sustainable Development
Head Office
111 Lombard Avenue, Suite 325 Winnipeg, Manitoba Canada R3B 0T4
Tel: +1 (204) 958-7700 Website: www.iisd.org Twitter: @IISD_news
Global Subsidies Initiative
International Environment House 2 9 chemin de Balexert, 1219 Châtelaine Geneva, Switzerland
Tel: +41 22 917-8683 Website: www.iisd.org/gsi Twitter: @globalsubsidies


