Embed Size (px)
Citation preview
SuiteAnalytics Workbook
September 9, 2020 2020.2

Copyright © 2005, 2020, Oracle and/or its affiliates. All rights reserved.
This software and related documentation are provided under a license agreement containing restrictionson use and disclosure and are protected by intellectual property laws. Except as expressly permittedin your license agreement or allowed by law, you may not use, copy, reproduce, translate, broadcast,modify, license, transmit, distribute, exhibit, perform, publish, or display any part, in any form, or by anymeans. Reverse engineering, disassembly, or decompilation of this software, unless required by law forinteroperability, is prohibited.
The information contained herein is subject to change without notice and is not warranted to be error-free. If you find any errors, please report them to us in writing.
If this is software or related documentation that is delivered to the U.S. Government or anyone licensing iton behalf of the U.S. Government, then the following notice is applicable:
U.S. GOVERNMENT END USERS: Oracle programs, including any operating system, integrated software,any programs installed on the hardware, and/or documentation, delivered to U.S. Government endusers are "commercial computer software" pursuant to the applicable Federal Acquisition Regulationand agency-specific supplemental regulations. As such, use, duplication, disclosure, modification, andadaptation of the programs, including any operating system, integrated software, any programs installedon the hardware, and/or documentation, shall be subject to license terms and license restrictionsapplicable to the programs. No other rights are granted to the U.S. Government.
This software or hardware is developed for general use in a variety of information managementapplications. It is not developed or intended for use in any inherently dangerous applications, includingapplications that may create a risk of personal injury. If you use this software or hardware in dangerousapplications, then you shall be responsible to take all appropriate fail-safe, backup, redundancy, and othermeasures to ensure its safe use. Oracle Corporation and its affiliates disclaim any liability for any damagescaused by use of this software or hardware in dangerous applications.
Oracle and Java are registered trademarks of Oracle and/or its affiliates. Other names may be trademarksof their respective owners.
Intel and Intel Xeon are trademarks or registered trademarks of Intel Corporation. All SPARC trademarksare used under license and are trademarks or registered trademarks of SPARC International, Inc.AMD, Opteron, the AMD logo, and the AMD Opteron logo are trademarks or registered trademarks ofAdvanced Micro Devices. UNIX is a registered trademark of The Open Group.
This software or hardware and documentation may provide access to or information about content,products, and services from third parties. Oracle Corporation and its affiliates are not responsible for andexpressly disclaim all warranties of any kind with respect to third-party content, products, and servicesunless otherwise set forth in an applicable agreement between you and Oracle. Oracle Corporation andits affiliates will not be responsible for any loss, costs, or damages incurred due to your access to or useof third-party content, products, or services, except as set forth in an applicable agreement between youand Oracle.
If this document is in public or private pre-General Availability status:
This documentation is in pre-General Availability status and is intended for demonstration and preliminaryuse only. It may not be specific to the hardware on which you are using the software. Oracle Corporationand its affiliates are not responsible for and expressly disclaim all warranties of any kind with respect tothis documentation and will not be responsible for any loss, costs, or damages incurred due to the use ofthis documentation.
If this document is in private pre-General Availability status:
The information contained in this document is for informational sharing purposes only and should beconsidered in your capacity as a customer advisory board member or pursuant to your pre-GeneralAvailability trial agreement only. It is not a commitment to deliver any material, code, or functionality, and

should not be relied upon in making purchasing decisions. The development, release, and timing of anyfeatures or functionality described in this document remains at the sole discretion of Oracle.
This document in any form, software or printed matter, contains proprietary information that is theexclusive property of Oracle. Your access to and use of this confidential material is subject to the termsand conditions of your Oracle Master Agreement, Oracle License and Services Agreement, OraclePartnerNetwork Agreement, Oracle distribution agreement, or other license agreement which hasbeen executed by you and Oracle and with which you agree to comply. This document and informationcontained herein may not be disclosed, copied, reproduced, or distributed to anyone outside Oraclewithout prior written consent of Oracle. This document is not part of your license agreement nor can it beincorporated into any contractual agreement with Oracle or its subsidiaries or affiliates.
For information about Oracle's commitment to accessibility, visit the Oracle Accessibility Program websiteat http://www.oracle.com/pls/topic/lookup?ctx=acc&id=docacc
Oracle customers that have purchased support have access to electronic support through My OracleSupport. For information, visit http://www.oracle.com/pls/topic/lookup?ctx=acc&id=info or visit http://www.oracle.com/pls/topic/lookup?ctx=acc&id=trs if you are hearing impaired.
Sample Code
Oracle may provide sample code in SuiteAnswers, the Help Center, User Guides, or elsewhere throughhelp links. All such sample code is provided "as is” and “as available”, for use only with an authorizedNetSuite Service account, and is made available as a SuiteCloud Technology subject to the SuiteCloudTerms of Service at www.netsuite.com/tos.
Oracle may modify or remove sample code at any time without notice.
No Excessive Use of the Service
As the Service is a multi-tenant service offering on shared databases, Customer may not use the Servicein excess of limits or thresholds that Oracle considers commercially reasonable for the Service. If Oraclereasonably concludes that a Customer’s use is excessive and/or will cause immediate or ongoingperformance issues for one or more of Oracle’s other customers, Oracle may slow down or throttleCustomer’s excess use until such time that Customer’s use stays within reasonable limits. If Customer’sparticular usage pattern requires a higher limit or threshold, then the Customer should procure asubscription to the Service that accommodates a higher limit and/or threshold that more effectively alignswith the Customer’s actual usage pattern.
Beta Features
This software and related documentation are provided under a license agreement containing restrictionson use and disclosure and are protected by intellectual property laws. Except as expressly permittedin your license agreement or allowed by law, you may not use, copy, reproduce, translate, broadcast,modify, license, transmit, distribute, exhibit, perform, publish, or display any part, in any form, or by anymeans. Reverse engineering, disassembly, or decompilation of this software, unless required by law forinteroperability, is prohibited.
The information contained herein is subject to change without notice and is not warranted to be error-free. If you find any errors, please report them to us in writing.
If this is software or related documentation that is delivered to the U.S. Government or anyone licensing iton behalf of the U.S. Government, then the following notice is applicable:
U.S. GOVERNMENT END USERS: Oracle programs (including any operating system, integrated software,any programs embedded, installed or activated on delivered hardware, and modifications of suchprograms) and Oracle computer documentation or other Oracle data delivered to or accessed byU.S. Government end users are "commercial computer software" or “commercial computer softwaredocumentation” pursuant to the applicable Federal Acquisition Regulation and agency-specificsupplemental regulations. As such, the use, reproduction, duplication, release, display, disclosure,modification, preparation of derivative works, and/or adaptation of i) Oracle programs (including any
operating system, integrated software, any programs embedded, installed or activated on deliveredhardware, and modifications of such programs), ii) Oracle computer documentation and/or iii) otherOracle data, is subject to the rights and limitations specified in the license contained in the applicablecontract. The terms governing the U.S. Government’s use of Oracle cloud services are defined by theapplicable contract for such services. No other rights are granted to the U.S. Government.
This software or hardware is developed for general use in a variety of information managementapplications. It is not developed or intended for use in any inherently dangerous applications, includingapplications that may create a risk of personal injury. If you use this software or hardware in dangerousapplications, then you shall be responsible to take all appropriate fail-safe, backup, redundancy, and othermeasures to ensure its safe use. Oracle Corporation and its affiliates disclaim any liability for any damagescaused by use of this software or hardware in dangerous applications.
Oracle and Java are registered trademarks of Oracle and/or its affiliates. Other names may be trademarksof their respective owners.
Intel and Intel Inside are trademarks or registered trademarks of Intel Corporation. All SPARC trademarksare used under license and are trademarks or registered trademarks of SPARC International, Inc. AMD,Epyc, and the AMD logo are trademarks or registered trademarks of Advanced Micro Devices. UNIX is aregistered trademark of The Open Group.
This software or hardware and documentation may provide access to or information about content,products, and services from third parties. Oracle Corporation and its affiliates are not responsible for andexpressly disclaim all warranties of any kind with respect to third-party content, products, and servicesunless otherwise set forth in an applicable agreement between you and Oracle. Oracle Corporation andits affiliates will not be responsible for any loss, costs, or damages incurred due to your access to or useof third-party content, products, or services, except as set forth in an applicable agreement between youand Oracle.
This documentation is in pre-General Availability status and is intended for demonstration and preliminaryuse only. It may not be specific to the hardware on which you are using the software. Oracle Corporationand its affiliates are not responsible for and expressly disclaim all warranties of any kind with respect tothis documentation and will not be responsible for any loss, costs, or damages incurred due to the use ofthis documentation.
The information contained in this document is for informational sharing purposes only and should beconsidered in your capacity as a customer advisory board member or pursuant to your pre-GeneralAvailability trial agreement only. It is not a commitment to deliver any material, code, or functionality, andshould not be relied upon in making purchasing decisions. The development, release, and timing of anyfeatures or functionality described in this document remains at the sole discretion of Oracle.
This document in any form, software or printed matter, contains proprietary information that is theexclusive property of Oracle. Your access to and use of this confidential material is subject to the termsand conditions of your Oracle Master Agreement, Oracle License and Services Agreement, OraclePartnerNetwork Agreement, Oracle distribution agreement, or other license agreement which hasbeen executed by you and Oracle and with which you agree to comply. This document and informationcontained herein may not be disclosed, copied, reproduced, or distributed to anyone outside Oraclewithout prior written consent of Oracle. This document is not part of your license agreement nor can it beincorporated into any contractual agreement with Oracle or its subsidiaries or affiliates.
Send Us Your FeedbackWe'd like to hear your feedback on this document.
Answering the following questions will help us improve our help content:
■ Did you find the information you needed? If not, what was missing?
■ Did you find any errors?
■ Is the information clear?
■ Are the examples correct?
■ Do you need more examples?
■ What did you like most about this document?
Click here to send us your comments. If possible, please provide a page number or section title to identifythe content you're describing.
To report software issues, contact NetSuite Customer Support.
Table of ContentsSuiteAnalytics Workbook Overview . . . . . . . . . . . . . . . . . . . . . . . . . . . . . . . . . . . . . . . . . . . . . . . . . . . . . . . . . . . . . . . . . . . . . . . . . . . . . . . . . . . . . . . . . . . . . 1
Getting Started with SuiteAnalytics Workbook . . . . . . . . . . . . . . . . . . . . . . . . . . . . . . . . . . . . . . . . . . . . . . . . . . . . . . . . . . . . . . . . . . . . . . . . . . 1Enabling SuiteAnalytics Workbook in Your NetSuite Account . . . . . . . . . . . . . . . . . . . . . . . . . . . . . . . . . . . . . . . . . . . . . . . . . . . . . . . 2The Analytics Administrator Permission . . . . . . . . . . . . . . . . . . . . . . . . . . . . . . . . . . . . . . . . . . . . . . . . . . . . . . . . . . . . . . . . . . . . . . . . . . . . . . . . . . . 3Accessing and Sharing Workbooks and Datasets . . . . . . . . . . . . . . . . . . . . . . . . . . . . . . . . . . . . . . . . . . . . . . . . . . . . . . . . . . . . . . . . . . . . . . 5Data Refresh in SuiteAnalytics Workbook . . . . . . . . . . . . . . . . . . . . . . . . . . . . . . . . . . . . . . . . . . . . . . . . . . . . . . . . . . . . . . . . . . . . . . . . . . . . . . . . 7
Understanding Data Caching in Charts and Pivot Tables . . . . . . . . . . . . . . . . . . . . . . . . . . . . . . . . . . . . . . . . . . . . . . . . . . . . . . . . 7Clearing the Cache for Pivot Tables and Charts . . . . . . . . . . . . . . . . . . . . . . . . . . . . . . . . . . . . . . . . . . . . . . . . . . . . . . . . . . . . . . . . . . . . 8
Known Limitations in SuiteAnalytics Workbook . . . . . . . . . . . . . . . . . . . . . . . . . . . . . . . . . . . . . . . . . . . . . . . . . . . . . . . . . . . . . . . . . . . . . . . . . 9Analytics Data Source Overview . . . . . . . . . . . . . . . . . . . . . . . . . . . . . . . . . . . . . . . . . . . . . . . . . . . . . . . . . . . . . . . . . . . . . . . . . . . . . . . . . . . . . . . . . . . . . . . 10
The Analytics Data Source and SuiteAnalytics Workbook . . . . . . . . . . . . . . . . . . . . . . . . . . . . . . . . . . . . . . . . . . . . . . . . . . . . . . . . . . 10Available Record Types . . . . . . . . . . . . . . . . . . . . . . . . . . . . . . . . . . . . . . . . . . . . . . . . . . . . . . . . . . . . . . . . . . . . . . . . . . . . . . . . . . . . . . . . . . . . . . . . . . . 11Analytics Data Source Changes . . . . . . . . . . . . . . . . . . . . . . . . . . . . . . . . . . . . . . . . . . . . . . . . . . . . . . . . . . . . . . . . . . . . . . . . . . . . . . . . . . . . . . . . 11Guidelines for Joining Record Types in SuiteAnalytics Workbook . . . . . . . . . . . . . . . . . . . . . . . . . . . . . . . . . . . . . . . . . . . . 18
SuiteQL . . . . . . . . . . . . . . . . . . . . . . . . . . . . . . . . . . . . . . . . . . . . . . . . . . . . . . . . . . . . . . . . . . . . . . . . . . . . . . . . . . . . . . . . . . . . . . . . . . . . . . . . . . . . . . . . . . . . . . . . . . . . 24Using SuiteQL . . . . . . . . . . . . . . . . . . . . . . . . . . . . . . . . . . . . . . . . . . . . . . . . . . . . . . . . . . . . . . . . . . . . . . . . . . . . . . . . . . . . . . . . . . . . . . . . . . . . . . . . . . . . . . . 25SuiteQL Syntax and Examples . . . . . . . . . . . . . . . . . . . . . . . . . . . . . . . . . . . . . . . . . . . . . . . . . . . . . . . . . . . . . . . . . . . . . . . . . . . . . . . . . . . . . . . . . . 31SuiteQL Limitations and Exceptions . . . . . . . . . . . . . . . . . . . . . . . . . . . . . . . . . . . . . . . . . . . . . . . . . . . . . . . . . . . . . . . . . . . . . . . . . . . . . . . . . . 32SuiteQL Supported and Unsupported Functions . . . . . . . . . . . . . . . . . . . . . . . . . . . . . . . . . . . . . . . . . . . . . . . . . . . . . . . . . . . . . . . . . 33
Analytics Browser . . . . . . . . . . . . . . . . . . . . . . . . . . . . . . . . . . . . . . . . . . . . . . . . . . . . . . . . . . . . . . . . . . . . . . . . . . . . . . . . . . . . . . . . . . . . . . . . . . . . . . . . . . . . . . 38Working with the Analytics Browser . . . . . . . . . . . . . . . . . . . . . . . . . . . . . . . . . . . . . . . . . . . . . . . . . . . . . . . . . . . . . . . . . . . . . . . . . . . . . . . . . . 38
Custom Workbooks and Datasets . . . . . . . . . . . . . . . . . . . . . . . . . . . . . . . . . . . . . . . . . . . . . . . . . . . . . . . . . . . . . . . . . . . . . . . . . . . . . . . . . . . . . . . . . . . . 44Defining a Dataset . . . . . . . . . . . . . . . . . . . . . . . . . . . . . . . . . . . . . . . . . . . . . . . . . . . . . . . . . . . . . . . . . . . . . . . . . . . . . . . . . . . . . . . . . . . . . . . . . . . . . . . . . . . . . 45
Editing a Dataset . . . . . . . . . . . . . . . . . . . . . . . . . . . . . . . . . . . . . . . . . . . . . . . . . . . . . . . . . . . . . . . . . . . . . . . . . . . . . . . . . . . . . . . . . . . . . . . . . . . . . . . . . . . 46Formula Fields . . . . . . . . . . . . . . . . . . . . . . . . . . . . . . . . . . . . . . . . . . . . . . . . . . . . . . . . . . . . . . . . . . . . . . . . . . . . . . . . . . . . . . . . . . . . . . . . . . . . . . . . . . . . . . 47Hierarchical Fields . . . . . . . . . . . . . . . . . . . . . . . . . . . . . . . . . . . . . . . . . . . . . . . . . . . . . . . . . . . . . . . . . . . . . . . . . . . . . . . . . . . . . . . . . . . . . . . . . . . . . . . . . . 62Advanced Sorting Options . . . . . . . . . . . . . . . . . . . . . . . . . . . . . . . . . . . . . . . . . . . . . . . . . . . . . . . . . . . . . . . . . . . . . . . . . . . . . . . . . . . . . . . . . . . . . . 64Joining Records Types in a Dataset . . . . . . . . . . . . . . . . . . . . . . . . . . . . . . . . . . . . . . . . . . . . . . . . . . . . . . . . . . . . . . . . . . . . . . . . . . . . . . . . . . . 65
Dataset Criteria Filters . . . . . . . . . . . . . . . . . . . . . . . . . . . . . . . . . . . . . . . . . . . . . . . . . . . . . . . . . . . . . . . . . . . . . . . . . . . . . . . . . . . . . . . . . . . . . . . . . . . . . . . . 65Filter Types . . . . . . . . . . . . . . . . . . . . . . . . . . . . . . . . . . . . . . . . . . . . . . . . . . . . . . . . . . . . . . . . . . . . . . . . . . . . . . . . . . . . . . . . . . . . . . . . . . . . . . . . . . . . . . . . . . . 66Grouping Filters . . . . . . . . . . . . . . . . . . . . . . . . . . . . . . . . . . . . . . . . . . . . . . . . . . . . . . . . . . . . . . . . . . . . . . . . . . . . . . . . . . . . . . . . . . . . . . . . . . . . . . . . . . . . 68
Creating a Workbook . . . . . . . . . . . . . . . . . . . . . . . . . . . . . . . . . . . . . . . . . . . . . . . . . . . . . . . . . . . . . . . . . . . . . . . . . . . . . . . . . . . . . . . . . . . . . . . . . . . . . . . . . 68Workbook Table Views . . . . . . . . . . . . . . . . . . . . . . . . . . . . . . . . . . . . . . . . . . . . . . . . . . . . . . . . . . . . . . . . . . . . . . . . . . . . . . . . . . . . . . . . . . . . . . . . . . . 71Workbook Pivot Tables . . . . . . . . . . . . . . . . . . . . . . . . . . . . . . . . . . . . . . . . . . . . . . . . . . . . . . . . . . . . . . . . . . . . . . . . . . . . . . . . . . . . . . . . . . . . . . . . . . . 73Workbook Charts . . . . . . . . . . . . . . . . . . . . . . . . . . . . . . . . . . . . . . . . . . . . . . . . . . . . . . . . . . . . . . . . . . . . . . . . . . . . . . . . . . . . . . . . . . . . . . . . . . . . . . . . . . . 78Workbook Visualization Filters . . . . . . . . . . . . . . . . . . . . . . . . . . . . . . . . . . . . . . . . . . . . . . . . . . . . . . . . . . . . . . . . . . . . . . . . . . . . . . . . . . . . . . . . . 80
Currency Conversion and Consolidation in Datasets and Workbooks . . . . . . . . . . . . . . . . . . . . . . . . . . . . . . . . . . . . . . . . . . 85Currency Conversion in Workbook . . . . . . . . . . . . . . . . . . . . . . . . . . . . . . . . . . . . . . . . . . . . . . . . . . . . . . . . . . . . . . . . . . . . . . . . . . . . . . . . . . . 85Currency Consolidation in Workbook . . . . . . . . . . . . . . . . . . . . . . . . . . . . . . . . . . . . . . . . . . . . . . . . . . . . . . . . . . . . . . . . . . . . . . . . . . . . . . . . 87
Workbook and Dataset Templates . . . . . . . . . . . . . . . . . . . . . . . . . . . . . . . . . . . . . . . . . . . . . . . . . . . . . . . . . . . . . . . . . . . . . . . . . . . . . . . . . . . . . . . . . . . . 89Dataset Templates . . . . . . . . . . . . . . . . . . . . . . . . . . . . . . . . . . . . . . . . . . . . . . . . . . . . . . . . . . . . . . . . . . . . . . . . . . . . . . . . . . . . . . . . . . . . . . . . . . . . . . . . . . . . . 89Workbook Templates . . . . . . . . . . . . . . . . . . . . . . . . . . . . . . . . . . . . . . . . . . . . . . . . . . . . . . . . . . . . . . . . . . . . . . . . . . . . . . . . . . . . . . . . . . . . . . . . . . . . . . . . . 90
Workbook-based Portlets . . . . . . . . . . . . . . . . . . . . . . . . . . . . . . . . . . . . . . . . . . . . . . . . . . . . . . . . . . . . . . . . . . . . . . . . . . . . . . . . . . . . . . . . . . . . . . . . . . . . . . . . 92Displaying Chart and Pivot Data in the Analytics Portlets . . . . . . . . . . . . . . . . . . . . . . . . . . . . . . . . . . . . . . . . . . . . . . . . . . . . . . . . . . 92
SuiteAnalytics Workbook Tutorial . . . . . . . . . . . . . . . . . . . . . . . . . . . . . . . . . . . . . . . . . . . . . . . . . . . . . . . . . . . . . . . . . . . . . . . . . . . . . . . . . . . . . . . . . . . . . 93Step 1: Select a Root Record Type . . . . . . . . . . . . . . . . . . . . . . . . . . . . . . . . . . . . . . . . . . . . . . . . . . . . . . . . . . . . . . . . . . . . . . . . . . . . . . . . . . . . . . . . 93Step 2: Add Fields and Join Record Types . . . . . . . . . . . . . . . . . . . . . . . . . . . . . . . . . . . . . . . . . . . . . . . . . . . . . . . . . . . . . . . . . . . . . . . . . . . . . . 94Step 3: Filter Your Dataset . . . . . . . . . . . . . . . . . . . . . . . . . . . . . . . . . . . . . . . . . . . . . . . . . . . . . . . . . . . . . . . . . . . . . . . . . . . . . . . . . . . . . . . . . . . . . . . . . . 95Step 4: Create a Workbook Based on Your Dataset . . . . . . . . . . . . . . . . . . . . . . . . . . . . . . . . . . . . . . . . . . . . . . . . . . . . . . . . . . . . . . . . . 97Step 5: Pivot Your Dataset Query Results . . . . . . . . . . . . . . . . . . . . . . . . . . . . . . . . . . . . . . . . . . . . . . . . . . . . . . . . . . . . . . . . . . . . . . . . . . . . . . 97Step 6: Connect a Second Dataset to Your Workbook . . . . . . . . . . . . . . . . . . . . . . . . . . . . . . . . . . . . . . . . . . . . . . . . . . . . . . . . . . . . 100Step 7: Set up a Table View . . . . . . . . . . . . . . . . . . . . . . . . . . . . . . . . . . . . . . . . . . . . . . . . . . . . . . . . . . . . . . . . . . . . . . . . . . . . . . . . . . . . . . . . . . . . . . . 100
Navigating SuiteAnalytics Workbook . . . . . . . . . . . . . . . . . . . . . . . . . . . . . . . . . . . . . . . . . . . . . . . . . . . . . . . . . . . . . . . . . . . . . . . . . . . . . . . . . . . . . . . . 102

Analytics Home Page . . . . . . . . . . . . . . . . . . . . . . . . . . . . . . . . . . . . . . . . . . . . . . . . . . . . . . . . . . . . . . . . . . . . . . . . . . . . . . . . . . . . . . . . . . . . . . . . . . . . . . . . 102Dataset Builder . . . . . . . . . . . . . . . . . . . . . . . . . . . . . . . . . . . . . . . . . . . . . . . . . . . . . . . . . . . . . . . . . . . . . . . . . . . . . . . . . . . . . . . . . . . . . . . . . . . . . . . . . . . . . . . . 103Table Tab . . . . . . . . . . . . . . . . . . . . . . . . . . . . . . . . . . . . . . . . . . . . . . . . . . . . . . . . . . . . . . . . . . . . . . . . . . . . . . . . . . . . . . . . . . . . . . . . . . . . . . . . . . . . . . . . . . . . . . . 106Pivot Tab . . . . . . . . . . . . . . . . . . . . . . . . . . . . . . . . . . . . . . . . . . . . . . . . . . . . . . . . . . . . . . . . . . . . . . . . . . . . . . . . . . . . . . . . . . . . . . . . . . . . . . . . . . . . . . . . . . . . . . . . 108Chart Tab . . . . . . . . . . . . . . . . . . . . . . . . . . . . . . . . . . . . . . . . . . . . . . . . . . . . . . . . . . . . . . . . . . . . . . . . . . . . . . . . . . . . . . . . . . . . . . . . . . . . . . . . . . . . . . . . . . . . . . . 111
SuiteAnalytics Workbook Glossary . . . . . . . . . . . . . . . . . . . . . . . . . . . . . . . . . . . . . . . . . . . . . . . . . . . . . . . . . . . . . . . . . . . . . . . . . . . . . . . . . . . . . . . . . . 114
SuiteAnalytics Workbook Overview 1
SuiteAnalytics Workbook OverviewSuiteAnalytics Workbook is a new analytical tool available in NetSuite.
Separation of Dataset and Workbook in 2020.1
With SuiteAnalytics Workbook, you can create highly customizable workbooks that combine datasets,tables, pivot tables, and charts using a single tool that leverages the new analytics data source. Theanalytics data source is designed to ensure that fields are consistently exposed in Workbook, withconsistent results across all workbook visualizations. Additionally, support for multilevel joins has beenadded to Workbook, enabling you to author workbooks and datasets using field data from multiple recordtypes, including custom records. Custom formula fields are also supported in Workbook, so you cancreate and add fields with dynamically calculated values to your workbooks. Finally, Workbook also offersmultiple display options for hierarchical fields, so you can easily view data for fields with parent-childrelationships.
The SuiteAnalytics Workbook user interface has been designed so that even users with limited knowledgeof record schemas and query language can still create complex workbooks and datasets through actionssuch as drag and drop editing. For example, when you define a dataset you can scroll through all theavailable record types and fields that you have access to in the Records and Fields lists. When you createa workbook or workbook visualization, you can also base it on any dataset that you have access to in youraccount. You can even combine multiple datasets in the same workbook, enabling you to analyze differentmetrics without switching browser tabs or workbooks. Additionally, the interface makes Workbook idealfor ad-hoc diagnostic analysis, with options for instant formula validation, data refresh, and drilling downthrough query results. A range of customization options have also been added to the interface to enablerich formatting, filtering, and visualizations of your data.
The latest iteration of SuiteAnalytics Workbook enables you to create workbooks and datasets for a varietyof record types. You can also use analytical record types created specifically for Workbook, such as thesales (invoiced) record.
Important: SuiteAnalytics Workbook is currently not supported by SuiteBundler. To avoidinstallation errors with your bundles, do not include SuiteAnalytics Workbook objects. For moreinformation about SuiteBundler, see the help topic SuiteBundler Overview.
To help familiarize yourself with SuiteAnalytics Workbook and to better understand the content availablein the Workbook Help Center, see Getting Started with SuiteAnalytics Workbook.
Getting Started with SuiteAnalytics WorkbookTo help familiarize yourself with SuiteAnalytics Workbook, see the following video and help topics:
Getting Started with SuiteAnalytics Workbook
■ To learn how to set up Workbook:
□ Workbook is enabled by default. However, if you do not see the Analytics tab in the NetSuitenavigation menu, see Enabling SuiteAnalytics Workbook in Your NetSuite Account.
□ There should be at least one user with the Analytics Administrator in your account. To learn whatthis user is enabled to do in Workbook, see The Analytics Administrator Permission.
■ To learn about custom workbooks and datasets, and predefined workbook and dataset templates:
□ Custom Workbooks and Datasets contains information about creating your own workbooks anddatasets. This section includes steps for defining, filtering, and pivoting your workbook source data,as well procedures for how to create custom formula fields and charts.
SuiteAnalytics Workbook
Getting Started with SuiteAnalytics Workbook 2
□ Workbook supports multiple predefined workbook and dataset templates, some of which are in abeta state. For more information, see Workbook and Dataset Templates.
■ To learn about the analytics data source:
□ Workbook uses the new analytics data source which might require different fields, record types,joins, or formulas to replicate your existing saved searches. Review the Analytics Data SourceOverview for more information, including guidelines for joining record types and steps forauthoring sample workbooks.
■ To learn how to navigate the Workbook user interface:
□ Workbook is built using a new user interface. To learn about the elements within the interface, seeNavigating SuiteAnalytics Workbook.
□ There is new terminology associated with Workbook. For more information, see the SuiteAnalyticsWorkbook Glossary.
■ Additional resources:
□ Complete the SuiteAnalytics Workbook Tutorial to walkthrough the creation of a sample sales orderworkbook.
□ For information about how to add workbook-based portlets to your NetSuite dashboards, seeWorkbook-based Portlets.
□ There are some known limitations with the current iteration of Workbook. For more information,see Known Limitations in SuiteAnalytics Workbook.
□ You can also visit the SuiteAnalytics Workbook Community to find answers and other informationabout Workbook.
■ Workbook videos:
□ Data Model Basics: This video describes the different record types available in the analyticsdata source that is used by Workbook.
□ Joining Record Types in Workbook: This video explains the implications of joining record typesin Workbook. It also provides some information about the SQL that is used to accomplish thesejoins in the background, and some suggestions to improve performance.
□ Separation of Dataset and Workbook in 2020.1: This video describes the change in NetSuite2020.1 that separates datasets from workbooks.
□ Using Filters in SuiteAnalytics Workbook: This video describes the different filtering optionsavailable in Workbook, including: data grid filters, value-based and measure-based filters for pivottables, chart filtering options, and workbook criteria filters.
□ Transaction Data Model in 2020.1: This video discusses the implications of joining thetransaction, transaction line, and transaction accounting line record types in NetSuite 2020.1. Thevideo also generally describes some of the changes between a transaction saved search and atransaction workbook. You will also learn some guidelines for using the transaction record type asthe root record for a dataset.
Enabling SuiteAnalytics Workbook in Your NetSuiteAccountBy default, the SuiteAnalytics Workbook feature is enabled in all NetSuite accounts. If you do not see theAnalytics tab in the NetSuite navigation menu, complete the following steps to verify that the feature hasbeen enabled in your account.
SuiteAnalytics Workbook
Enabling SuiteAnalytics Workbook in Your NetSuite Account 3
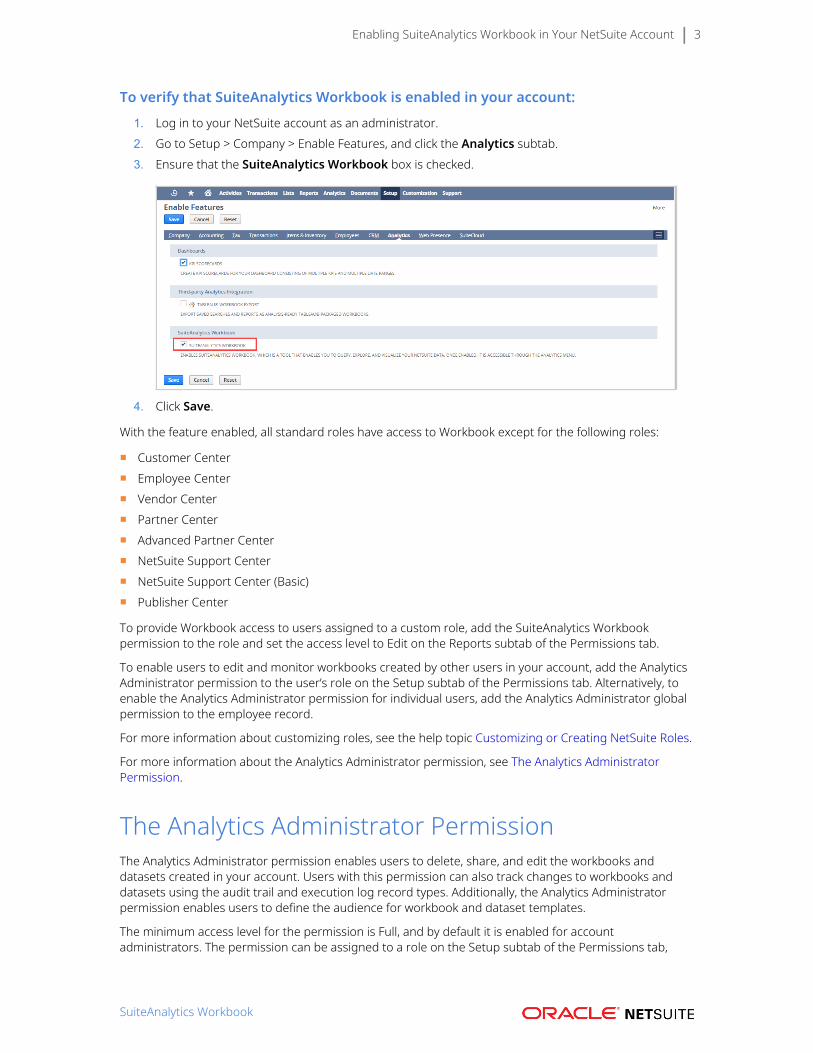
To verify that SuiteAnalytics Workbook is enabled in your account:1. Log in to your NetSuite account as an administrator.2. Go to Setup > Company > Enable Features, and click the Analytics subtab.3. Ensure that the SuiteAnalytics Workbook box is checked.
4. Click Save.
With the feature enabled, all standard roles have access to Workbook except for the following roles:
■ Customer Center■ Employee Center■ Vendor Center■ Partner Center■ Advanced Partner Center■ NetSuite Support Center■ NetSuite Support Center (Basic)■ Publisher Center
To provide Workbook access to users assigned to a custom role, add the SuiteAnalytics Workbookpermission to the role and set the access level to Edit on the Reports subtab of the Permissions tab.
To enable users to edit and monitor workbooks created by other users in your account, add the AnalyticsAdministrator permission to the user’s role on the Setup subtab of the Permissions tab. Alternatively, toenable the Analytics Administrator permission for individual users, add the Analytics Administrator globalpermission to the employee record.
For more information about customizing roles, see the help topic Customizing or Creating NetSuite Roles.
For more information about the Analytics Administrator permission, see The Analytics AdministratorPermission.
The Analytics Administrator PermissionThe Analytics Administrator permission enables users to delete, share, and edit the workbooks anddatasets created in your account. Users with this permission can also track changes to workbooks anddatasets using the audit trail and execution log record types. Additionally, the Analytics Administratorpermission enables users to define the audience for workbook and dataset templates.
The minimum access level for the permission is Full, and by default it is enabled for accountadministrators. The permission can be assigned to a role on the Setup subtab of the Permissions tab,
SuiteAnalytics Workbook
The Analytics Administrator Permission 4
or as a global permission on an employee record. Deleted workbooks and datasets are irretrievablehowever, so the permission should only be enabled for a small number of users in your account.Additionally, while users with the Analytics Administrator permission can delete workbooks and datasetscreated by other users, they can still only view the fields and records that they have access to based ontheir NetSuite permissions. Users with the Analytics Administrator permission are also not automaticallygiven access to SuiteAnalytics Workbook and must be assigned to a role with the SuiteAnalytics Workbookpermission to access the tool.
Editing Employee Workbooks and DatasetsUsers with the Analytics Administrator permission have access to every workbook and dataset in youraccount through the Analytics Home page.
■ To view workbooks and datasets created by other users, select Employee Workbooks or EmployeeDatasets in the drop down list of the respective subtab.
■ To change the properties of a workbook or dataset without opening it, click the Edit icon next to name,description, or owner fields. You can also share or delete workbooks and datasets using the iconsin the Actions column. Currently, notifications are not sent when workbooks are deleted, shared, orassigned to new owners.
Auditing Workbooks and DatasetsImportant: As of 2020.1, the audit trail and execution log record types only contain data fromrelease 2019.2 and earlier. You should not use these record types for auditing changes made toworkbooks and datasets after your account was upgrading to 2020.1.
To monitor the use of Workbook, users with Analytics Administrator permission have access to the audittrail and execution log record types. There is a version of each record type for workbooks and datasets,which you can differentiate using the record ID. The dataset audit trail and execution log record typesboth contain ‘Ds’ in the record ID. You can use these record types to create datasets that show you thedata being accessed through Workbook and to track changes to the saved workbooks and datasets inyour account.
Record Type Description Fields
Audit trail Displays changes made to each saved workbook or dataset in youraccount, including the date the change was saved and the user whosaved it. Records for each saved workbook and dataset are storedindefinitely, or until the workbook or dataset is deleted.
■ To view the most recent saved changes, join fields from thechange audit change record type to the audit trail dataset.
■ To view the details of each saved change in a workbook ordataset, including the fields that were changed and the new andoriginal values, join the new value and old value fields from thedetail audit detail record type to the audit trail dataset.
Date/Time, ID, User, SavedWorkbook
Execution log Displays all workbooks and datasets that were created in the past30 days, including those that were not saved. For each workbook ordataset listed, the execution log displays the following data:
■ All fields used on the dataset
■ The base record type
■ The date the workbook or dataset was run
Base Record Type, Date/Time,Export, Expression, Fields,Formulas, ID, User Name, SavedWorkbook
SuiteAnalytics Workbook
The Analytics Administrator Permission 5
■ The name of the user who ran the workbook or dataset
■ If a workbook visualization or dataset was exported
■ Any formulas used
■ If applicable, the name of the associated saved workbook
Defining the Audience for Workbook and DatasetTemplatesWorkbook offers many predefined workbook and dataset templates. For a detailed list includingsummaries of the content within each workbook or dataset, see Workbook and Dataset Templates.
Some of these templates are in a beta or demo state and should be used for test purposes only.
To provide access to these templates, users with the Analytics Administrator permission can sharemost templates with specific users or roles directly from the Analytics Home page. If the Share icon isunavailable for a workbook or dataset, users with the Analytics Administrator permission must open theworkbook or dataset and save and share a copy of it. For more information about sharing workbooks anddatasets, see Saving and Sharing Workbooks and Datasets.
Accessing and Sharing Workbooks and DatasetsImportant: Workbooks created prior to 20.1 now exist as two separate workbook and datasetobjects. Consequently, any users that you shared a workbook with prior to 20.1 have accessto both the workbook and the associated dataset. However, because changes to a dataset areautomatically propagated to any associated workbooks, recipients cannot edit a shared datasetunless they save their own versions. For more information, see Custom Workbooks and Datasets.
When you first click the Analytics tab from the NetSuite navigation menu, you are presented with allthe workbooks and datasets that you have access to on the Analytics Home page. This includes anyworkbooks or datasets that you own and any that have been shared with you. To preview the contentsof a workbook or dataset, click the Details link to open the Details Panel. If you have the AnalyticsAdministrator permission, you can also open workbooks and datasets created by other users in youraccount, and access or share predefined workbook and dataset templates. For more information aboutthe Analytics Administrator permission, see The Analytics Administrator Permission.
The record types and fields displayed in each workbook or dataset are based on the features enabledin your account and the permissions assigned to the role you use to login to NetSuite. For example, toview fields and data from the invoice record type or to create a dataset based on the invoice record type,you must have the Invoice permission assigned to your role. Additionally, certain actions in SuiteAnalyticsWorkbook are controlled by your NetSuite permissions. For example, to export a dataset to a CSV file, youmust have the Exports Lists permission at the Create level or higher.
For more information about specific record type and field access in Workbook, download the followingworksheet: NetSuitePermissionsUsage.xls. If you do not see a specific record type or field that youneed to access, contact your system administrator. Also, keep in mind that you can only access certainworkbooks and datasets such as the Sales (Invoiced) workbook, if they are shared with you by otherusers in your account. For more information, see Saving and Sharing Workbooks and Datasets.
Saving and Sharing Workbooks and DatasetsYou can share workbooks and datasets with individual users or groups of users on a role by role basis.To prevent data discrepancies in workbooks that use the same datasets, recipients of a shared workbook
SuiteAnalytics Workbook
Accessing and Sharing Workbooks and Datasets 6
cannot edit the associated datasets. For example, if you share a workbook with users assigned to theAccountant role, all users assigned to that role can access and save their own versions of the workbookor connected datasets, but they cannot edit the original datasets. Additionally, if there are multipledatasets connected to a workbook, you must save each dataset before saving and sharing the workbook.This includes datasets that you create during the workbook authoring process but do not connect to avisualization. If you do not want to share datasets that are not connected to a workbook visualization,delete them before saving and sharing the workbook.
Any user with access to Workbook can share a workbook or dataset, however users can only view therecord types and fields they have permissions for in shared content. Record types and fields that a userdoes not have access to are simply not displayed in the shared workbook or dataset.
Shared workbooks include all workbook visualizations, including any selections made on the Table View,Pivot, or Chart tabs. Shared datasets contain all the joined record types, fields, and criteria filters used todefine the dataset. If you have the export lists permission and you only want to share a specific dataset,click the Export icon in the dataset to download a CSV file of the Data Grid.
To save and share a workbook or dataset:
Important: You cannot save and share a workbook if it has visualizations based on unsaveddatasets. Before you begin, save or delete any datasets connected to the workbook. Additionally,you cannot save and share workbooks and datasets that contain fields that are in a beta state.These fields are for test purposes only and are subject to change. Remove these fields before youattempt to save and share.
Note: If you have the Analytics Administrator permission and you want to share workbook ordataset templates such as Open Sales Orders Lines or Number of Fulfillments, you must follow thesteps in this procedure. These templates cannot be shared from the Analytics Home page.
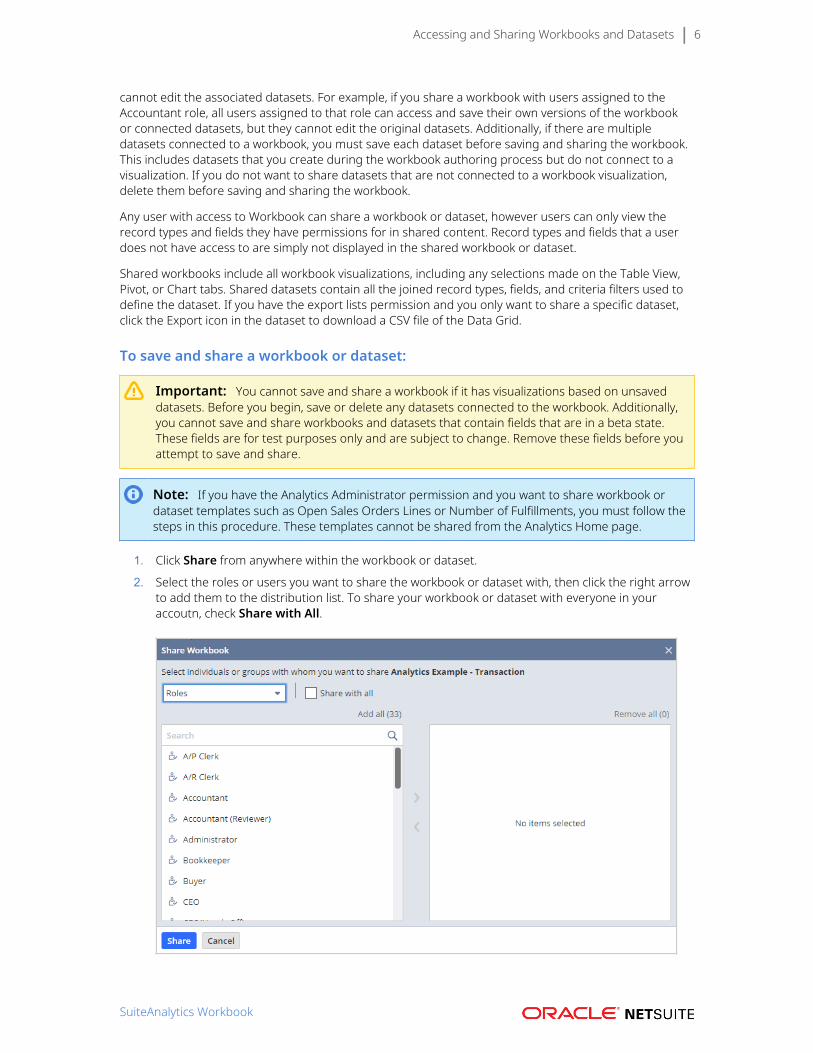
1. Click Share from anywhere within the workbook or dataset.
2. Select the roles or users you want to share the workbook or dataset with, then click the right arrowto add them to the distribution list. To share your workbook or dataset with everyone in youraccoutn, check Share with All.
SuiteAnalytics Workbook
Accessing and Sharing Workbooks and Datasets 7
3. Click Save and share.The object is shared and will appear on the Analytics Home page for the selected recipients.Currently, notifications are not sent when a workbook or dataset is shared with a user.
Data Refresh in SuiteAnalytics WorkbookIn SuiteAnalytics Workbook, by default the data presented in pivot tables and charts is cached every 60minutes. This caching process provides better performance by returning results faster. However, theseresults might not display the most current data.
To find out when the data was last refreshed in your workbook, verify the time displayed in the Lastupdated field, in the upper-right corner of the Viewer. To better understand the default caching processand how to clear the cache manually, see the following topics:
■ Understanding Data Caching in Charts and Pivot Tables■ Clearing the Cache for Pivot Tables and Charts
Understanding Data Caching in Charts and Pivot TablesThe data that is displayed in each tab of a workbook varies depending on the following scenarios:
■ Creating and modifying pivot tables and charts in an existing workbook■ Saving and re-opening a workbook before 60 minutes have elapsed■ Saving and re-opening a workbook after 60 minutes have elapsed■ Working with the Analytics Portlet
Creating and modifying pivot tables and charts in an existingworkbookAfter you set the layout of a new pivot table or chart, click the Refresh icon to apply the changes andupdate the results. If you make changes to a pivot table directly from the Pivot Table Viewer, the resultsare automatically displayed.
When you create or modify your pivot tables and charts, SuiteAnalytics Workbook creates a backendquery. This backend query definition retrieves the results for the defined pivot tables and charts, andenables you to see the results in the Viewer. If there are pivot tables and charts that share the samebackend query definition, the data used for the refresh can vary:
■ If the backend query was refreshed less than 60 minutes ago from either the pivot or chart tab, thedata from the cache is used for the refresh.
■ If the backend query was refreshed more than 60 minutes ago from either the pivot or chart tab, themost current data is used for the refresh.
You can verify the time of the last refresh in the upper-right corner of the pivot table or chart viewer.
Saving and re-opening a workbook before 60 minutes haveelapsedWhen you re-open a saved workbook before 60 minutes have elapsed and open a pivot table or chart, bydefault the Viewer displays cached data. The time of the last refresh appears in the upper-right corner ofthe Viewer. To retrieve the most current data, click the Refresh icon.
SuiteAnalytics Workbook
Data Refresh in SuiteAnalytics Workbook 8
Saving and re-opening a workbook after 60 minutes haveelapsedWhen you re-open a saved workbook after 60 minutes have elapsed, the cached data has expired.Consequently, when you open a pivot table or chart, the Viewer automatically displays the most currentresults.
Working with the Analytics PortletThe pivot tables and charts in the Analytics portlet display the same data as their correspondingworkbooks. However, you can retrieve the most current results by clicking the Refresh icon .
For more information about how to clear the cache manually, see Clearing the Cache for Pivot Tables andCharts.
Clearing the Cache for Pivot Tables and ChartsThe Clear cache option clears cached data from workbook pivot tables and charts so that you canretrieve the most current results. You can verify when the data was last updated by checking the date andtime displayed in the upper-right corner of the pivot table or chart Viewer. The following steps describehow you can clear the cache for your open pivot tables and charts.
To clear the cache for pivot tables and charts:
1. On the Pivot or Chart tab, click the menu icon in the upper right corner of the Viewer.
A popup message appears asking if you want to clear the cache.
2. Choose how you want to proceed:
■ Clear cache - Clears the cache for the entire workbook. The time and date in the upper-rightcorner of the Viewer is updated to reflect when the data was updated.
■ Cancel - The cache is not cleared. Data is updated following the default caching process.
3. If you clear the cache, a popup message appears asking you to refresh all pivot tables and chartsand an icon is displayed next to each pivot table and chart in the workbook. There are threeavailable icons:
■ Warning icon - The displayed results are not up to date according to the date and timeshown in the Last updated field. To retrieve the most current results, click the Refresh icon .
■ Loading icon - The data is currently being updated according to the date and time shown inthe Last updated field. After the refresh is completed, the icon changes to either the pivot orchart icon.
■ Pivot and Chart icons - The data displayed is up to date according to the date and timeshown in the Last updated field.
4. To retrieve the most current results in each open pivot table and chart, click the Refresh icon ineach tab.
For more information about the Pivot table and Chart tabs, see Pivot Tab and Chart Tab.
To better understand the caching process of SuiteAnalytics Workbook, see Understanding Data Cachingin Charts and Pivot Tables.
SuiteAnalytics Workbook
Known Limitations in SuiteAnalytics Workbook 9
Known Limitations in SuiteAnalytics WorkbookThe following features and interactions in SuiteAnalytics Workbook have known limitations that arecurrently being addressed by our development teams:
■ The audit trail and execution log record types only contain data from 2019.2 and earlier. For moreinformation, see Auditing Workbooks and Datasets.
■ On the Pivot tab, you cannot apply measure-based filters to fields that contain date or text valueswhen the aggregation types for those fields are set to Min or Max.
For more information about measure-based filters, see Workbook Visualization Filters.
■ Some ad blocker plug-ins can prevent you from creating pivot tables or charts. To avoid errors withthe Pivot or Chart tabs, deactivate these plug-ins and mark NetSuite as an exception. For moreinformation about NetSuite browser support, see the help topic Supported Browsers for NetSuite.
■ If you define a criteria filter that is invalidated based on changes to the field used in the filter condition,you are currently unable to edit the filter.
■ Users assigned to the employee center or partner center roles who have permission to accessWorkbook might not see the Analytics option in the NetSuite navigation menu.
■ Filters that you create on the Dataset Builder based on custom duration values currently do not workas expected.
■ When you query the analytics data source using SuiteScript, you currently cannot filter data usingrecord types such as invoice.
■ If you add multiple pivot tables or charts in a workbook, the user interface does not always displayarrows so that you can switch between each table and chart.
■ Certain ad blocking software can prevent data from loading in your workbook pivot tables.
■ The search field on the Dataset Builder searches across record types that are a few joins away fromthe root record type. To find record types or fields that are further from the root record type, clickShow more results.
SuiteAnalytics Workbook
Analytics Data Source Overview 10
Analytics Data Source OverviewData Model Basics
The analytics data source is a collection of NetSuite data that is grouped according to record types andfields. The structure of the analytics data source enhances the capabilities of analyzing your NetSuite datawhich you can query using SuiteQL. This advanced query language lets you run complex SQL queries.
The analytics data source has been used in SuiteAnalytics Workbook since 2019.1. You can also retrievedata from the analytics data source using SuiteAnalytics Connect, SuiteScript, and SuiteTalk REST webservices.
To help you understand the analytics data source, see the following topics:
■ You can see an overview of all record types and fields available in the analytics data source in theAnalytics Browser. For more information, see Analytics Browser.
■ You can use SuiteQL to run queries against the analytics data source through SuiteAnalytics Connect,SuiteScript, and SuiteTalk REST web services. For more information, see SuiteQL.
■ In Workbook, you can further customize the record types and fields available in the analyticsdata source for use in your workbooks. For more information, see The Analytics Data Source andSuiteAnalytics Workbook.
■ To locate fields in the analytics data source using the Workbook user interface, you can browse andsearch the Records and Fields list on the Dataset tab. For more information, see Locating Fields inWorkbook.
The Analytics Data Source and SuiteAnalyticsWorkbookFor every NetSuite account, all data is stored using a single database. The data sources used to exposethis data through Saved Searches and Reports however, are slightly unique. For some record types, theseunique data sources have resulted in inconsistent field naming and data exposure between the two tools.
In SuiteAnalytics Workbook, fields and record types are exposed using a new analytics data source thatis designed to display consistent data across the Workbook application. Fields created in support of newNetSuite features are exposed to Workbook using the analytics data source, as of 2019.1.
The location, names, and IDs of some fields and record types might be different in the analytics datasource. Additionally, some record types and fields have not been ported to the analytics data source.This includes fields that contain calculated values for certain record types. Consequently, you might needto use different record types and fields, or create new joins and custom formula fields to recreate yourexisting saved searches using Workbook.
To help you navigate the analytics data source, see the following topics:
■ You can browse all record types and fields available in the analytics data source with the AnalyticsBrowser. For more information, see Analytics Browser.
■ The analytics data source supports hundreds of record types and fields. For more information aboutthe record types and fields that you can find in Workbook, see Available Record Types.
■ The location and names of some fields in the analytics data source might be different from theirSearch and Report counterparts. Additionally, some fields such as fields with calculated values havenot yet been ported to the analytics data source. For more information about differences in the newdata source, see Analytics Data Source Changes.
SuiteAnalytics Workbook
The Analytics Data Source and SuiteAnalytics Workbook 11
■ After you select a root record type for a custom dataset or open a saved or shared dataset, all relatedrecord types that you have access to are displayed in the Records list. For more information aboutusing the Dataset Builder to select and join related record types, see Defining a Dataset.
■ Workbook supports multilevel joins, however there are certain functions and interactions that youshould be cautious of when adding specific record types or fields to a dataset. For more information,see Guidelines for Joining Record Types in SuiteAnalytics Workbook.
Available Record TypesSuiteAnalytics Workbook supports hundreds of record types available through the analytics data source.The analytics data source includes most of the record types used throughout NetSuite, plus analyticalrecord types currently in development for Workbook, such as the sales analytical record type. Analyticalrecord types are currently in a beta state and are subject to change. The data displayed within theserecord types are also subject to change and should be used for test purposes only.
You can find a list of all record types and fields available for Workbook in the Analytics Browser. Eachrecord type page provides details such as the name and the ID of all available fields, and whether thefield is available in Workbook. For more information about how to work using the Analytics Browser, seeWorking with the Analytics Browser.
To view each record type that you have access to in your account, you can also click New Dataset on theAnalytics Home page. The record category and ID for each record type is displayed. Record types aredivided into three categories:
■ Standard – Record types that are included in each account of your NetSuite implementation and areavailable through all NetSuite data sources. For example, the transaction record type. Standard recordtypes consist of concrete and generic record types. For more information, see Analytics Data SourceChanges.
■ Analytical – Record types that have been created specifically for use with Workbook. These recordtypes are based on standard record types but contain a unique set of fields. For example, the salesanalytical record type.
■ Custom – Record types created by users in your company that are unique to your NetSuite account.
Access to record types and fields in Workbook depends on the same permissions used for NetSuite savedsearches. For example, to access sales order data through the transaction record type using Workbook,you must have the Sales Order permission assigned to your role. Analytical record types such as thesales (invoiced) record type are only accessible to users with the Analytics Administrator permission.Additionally, some record types are only available in Workbook if you have specific features enabledin your account. For information about permissions—related access to record types and fields in theanalytics data source, download the following worksheet: NetSuitePermissionsUsage.xls
After you select a root record type for a dataset or open an existing dataset, the Records list on theDataset Builder shows all the related record types that you have access to. If you cannot find a recordtype that you think you should have access to, contact your administrator.
Note: The search field in the Dataset Builder searches across record types that are a few joinsaway from the root record type. To search across record types that are further away, click Showmore results.
Analytics Data Source ChangesThe analytics data source is different than the data sources used by the NetSuite Saved Search andReport applications. In the analytics data source, concrete record types that have a corresponding entry
SuiteAnalytics Workbook
The Analytics Data Source and SuiteAnalytics Workbook 12
form in NetSuite remain mostly unchanged and use the same field labels. For example, the employeerecord type in SuiteAnalytics Workbook contains mostly all the of fields that are on the NetSuite employeeform, with the same field labels that are used in saved searches and reports. Generic record types that donot have a single corresponding form in NetSuite, such as the transaction, entity, and item record types,use generic field labels. This is because generic record types are representative of multiple concreterecord types. Additionally, some fields in the analytics data source are accessible through different recordtypes than in saved searches and reports.
The design of the analytics data source means that the names of some record types and fields havechanged or appear differently than on NetSuite forms, saved searches, and reports. Some fields, suchas those with calculated values, have also not been ported to the data source and other fields are onlyaccessible by joining specific record types. Furthermore, the analytics data source includes some recordtypes and fields that have been created specifically for SuiteAnalytics Workbook and are not availablethrough saved searches and reports. These record types and fields are in a beta state and should be usedfor test purposes only.
To help you navigate the analytics data source, the following resources are available in the Workbook userinterface and the NetSuite Help Center:
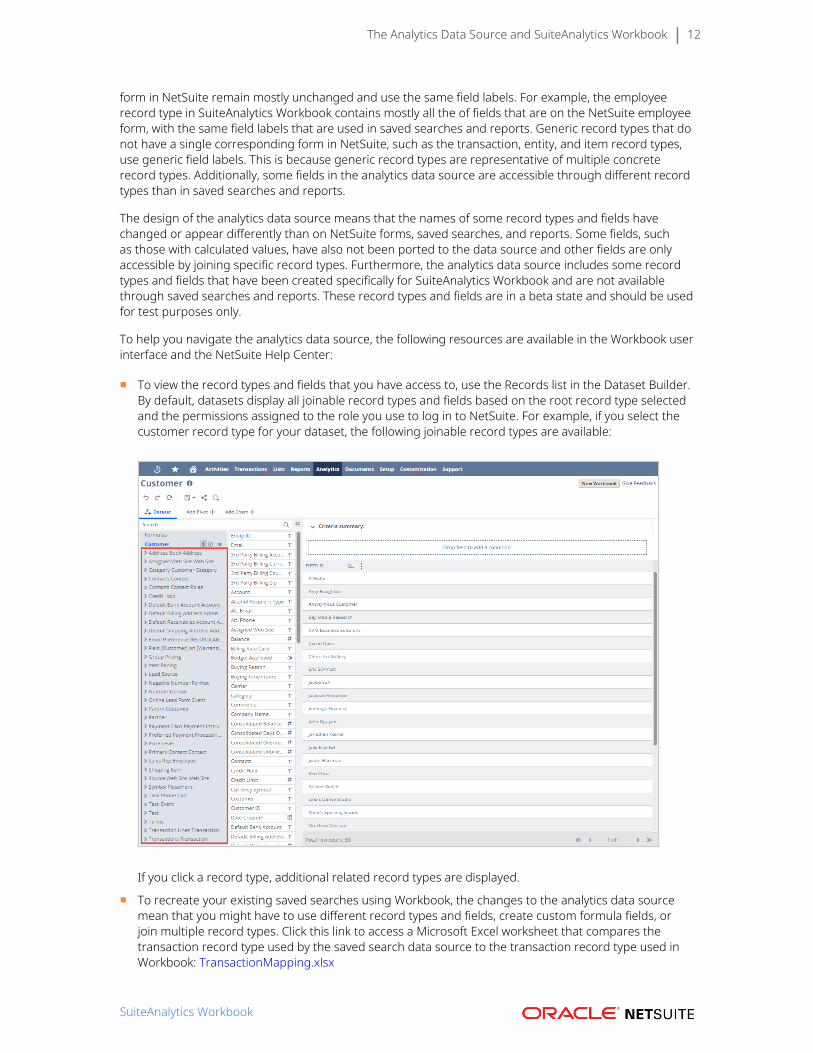
■ To view the record types and fields that you have access to, use the Records list in the Dataset Builder.By default, datasets display all joinable record types and fields based on the root record type selectedand the permissions assigned to the role you use to log in to NetSuite. For example, if you select thecustomer record type for your dataset, the following joinable record types are available:
If you click a record type, additional related record types are displayed.
■ To recreate your existing saved searches using Workbook, the changes to the analytics data sourcemean that you might have to use different record types and fields, create custom formula fields, orjoin multiple record types. Click this link to access a Microsoft Excel worksheet that compares thetransaction record type used by the saved search data source to the transaction record type used inWorkbook: TransactionMapping.xlsx
SuiteAnalytics Workbook
The Analytics Data Source and SuiteAnalytics Workbook 13
■ For annotated steps on how to recreate some of your saved searches using Workbook, see thefollowing topics. Each sample includes the fields, record types, and formulas required to recreate thesearch:□ Open Sales Orders Lines□ Number of Fulfillments□ Journal Entry to Approve
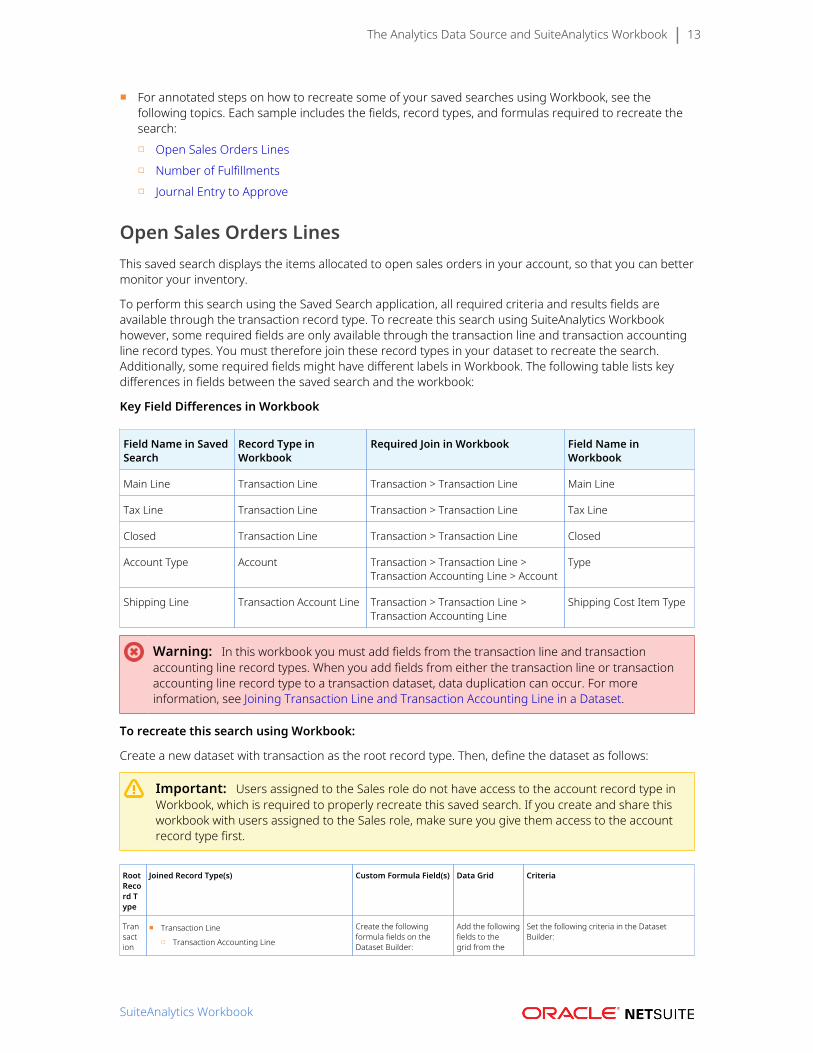
Open Sales Orders LinesThis saved search displays the items allocated to open sales orders in your account, so that you can bettermonitor your inventory.
To perform this search using the Saved Search application, all required criteria and results fields areavailable through the transaction record type. To recreate this search using SuiteAnalytics Workbookhowever, some required fields are only available through the transaction line and transaction accountingline record types. You must therefore join these record types in your dataset to recreate the search.Additionally, some required fields might have different labels in Workbook. The following table lists keydifferences in fields between the saved search and the workbook:
Key Field Differences in Workbook
Field Name in SavedSearch
Record Type inWorkbook
Required Join in Workbook Field Name inWorkbook
Main Line Transaction Line Transaction > Transaction Line Main Line
Tax Line Transaction Line Transaction > Transaction Line Tax Line
Closed Transaction Line Transaction > Transaction Line Closed
Account Type Account Transaction > Transaction Line >Transaction Accounting Line > Account
Type
Shipping Line Transaction Account Line Transaction > Transaction Line >Transaction Accounting Line
Shipping Cost Item Type
Warning: In this workbook you must add fields from the transaction line and transactionaccounting line record types. When you add fields from either the transaction line or transactionaccounting line record type to a transaction dataset, data duplication can occur. For moreinformation, see Joining Transaction Line and Transaction Accounting Line in a Dataset.
To recreate this search using Workbook:
Create a new dataset with transaction as the root record type. Then, define the dataset as follows:
Important: Users assigned to the Sales role do not have access to the account record type inWorkbook, which is required to properly recreate this saved search. If you create and share thisworkbook with users assigned to the Sales role, make sure you give them access to the accountrecord type first.
RootRecord Type
Joined Record Type(s) Custom Formula Field(s) Data Grid Criteria
Transaction
■ Transaction Line
□ Transaction Accounting Line
Create the followingformula fields on theDataset Builder:
Add the followingfields to thegrid from the
Set the following criteria in the DatasetBuilder:
SuiteAnalytics Workbook
The Analytics Data Source and SuiteAnalytics Workbook 14
▬ Account
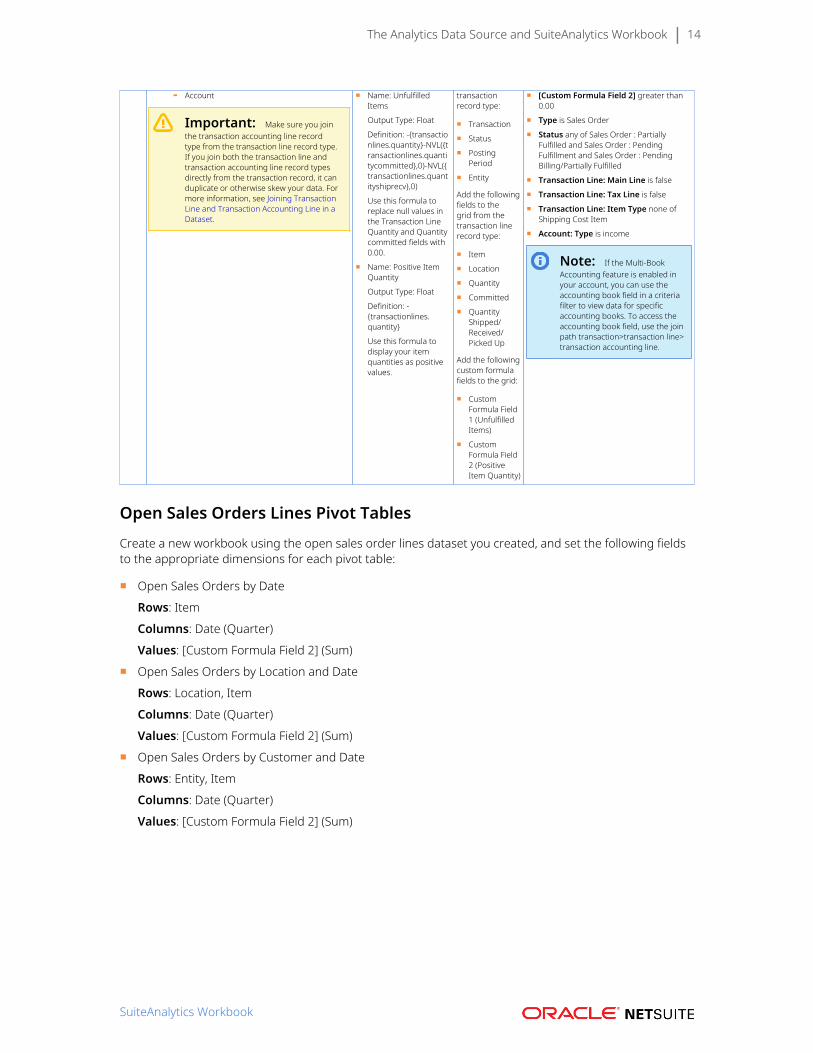
Important: Make sure you jointhe transaction accounting line recordtype from the transaction line record type.If you join both the transaction line andtransaction accounting line record typesdirectly from the transaction record, it canduplicate or otherwise skew your data. Formore information, see Joining TransactionLine and Transaction Accounting Line in aDataset.
■ Name: UnfulfilledItems
Output Type: Float
Definition: -{transactionlines.quantity}-NVL({transactionlines.quantitycommitted},0)-NVL({transactionlines.quantityshiprecv},0)
Use this formula toreplace null values inthe Transaction LineQuantity and Quantitycommitted fields with0.00.
■ Name: Positive ItemQuantity
Output Type: Float
Definition: -{transactionlines.quantity}
Use this formula todisplay your itemquantities as positivevalues.
transactionrecord type:
■ Transaction
■ Status
■ PostingPeriod
■ Entity
Add the followingfields to thegrid from thetransaction linerecord type:
■ Item
■ Location
■ Quantity
■ Committed
■ QuantityShipped/Received/Picked Up
Add the followingcustom formulafields to the grid:
■ CustomFormula Field1 (UnfulfilledItems)
■ CustomFormula Field2 (PositiveItem Quantity)
■ [Custom Formula Field 2] greater than0.00
■ Type is Sales Order
■ Status any of Sales Order : PartiallyFulfilled and Sales Order : PendingFulfillment and Sales Order : PendingBilling/Partially Fulfilled
■ Transaction Line: Main Line is false
■ Transaction Line: Tax Line is false
■ Transaction Line: Item Type none ofShipping Cost Item
■ Account: Type is income
Note: If the Multi-BookAccounting feature is enabled inyour account, you can use theaccounting book field in a criteriafilter to view data for specificaccounting books. To access theaccounting book field, use the joinpath transaction>transaction line>transaction accounting line.
Open Sales Orders Lines Pivot TablesCreate a new workbook using the open sales order lines dataset you created, and set the following fieldsto the appropriate dimensions for each pivot table:
■ Open Sales Orders by DateRows: Item
Columns: Date (Quarter)
Values: [Custom Formula Field 2] (Sum)
■ Open Sales Orders by Location and DateRows: Location, Item
Columns: Date (Quarter)
Values: [Custom Formula Field 2] (Sum)
■ Open Sales Orders by Customer and DateRows: Entity, Item
Columns: Date (Quarter)
Values: [Custom Formula Field 2] (Sum)
SuiteAnalytics Workbook
The Analytics Data Source and SuiteAnalytics Workbook 15
After you set each field to the appropriate table dimension, click the refresh icon to generate the table.
You can also customize the table and add totals and grand totals, or rename each table. For moreinformation, see Pivot Table Customization.
Open Sales Orders Lines ChartsBy recreating this saved search using Workbook, you can also chart your source data to visualize theinformation using different chart types.
Create the following charts by dragging the listed fields from the Dataset Panel to the correspondingsection of the Layout panel, and select the chart type.
■ Open Sales by ItemX-Axis: ItemSeries: N/AValues: Total Amount (Sum)Chart type: Column chart
■ Open Sales by DateX-Axis: Date (Quarter)Series: ItemValues: Total Amount (Sum)Chart type: Line chart
After you set each field and the chart type, click the Refresh icon to generate the chart. You can alsofilter values, add a title and subtitle, and rename each axis. For more information, see Workbook Charts.
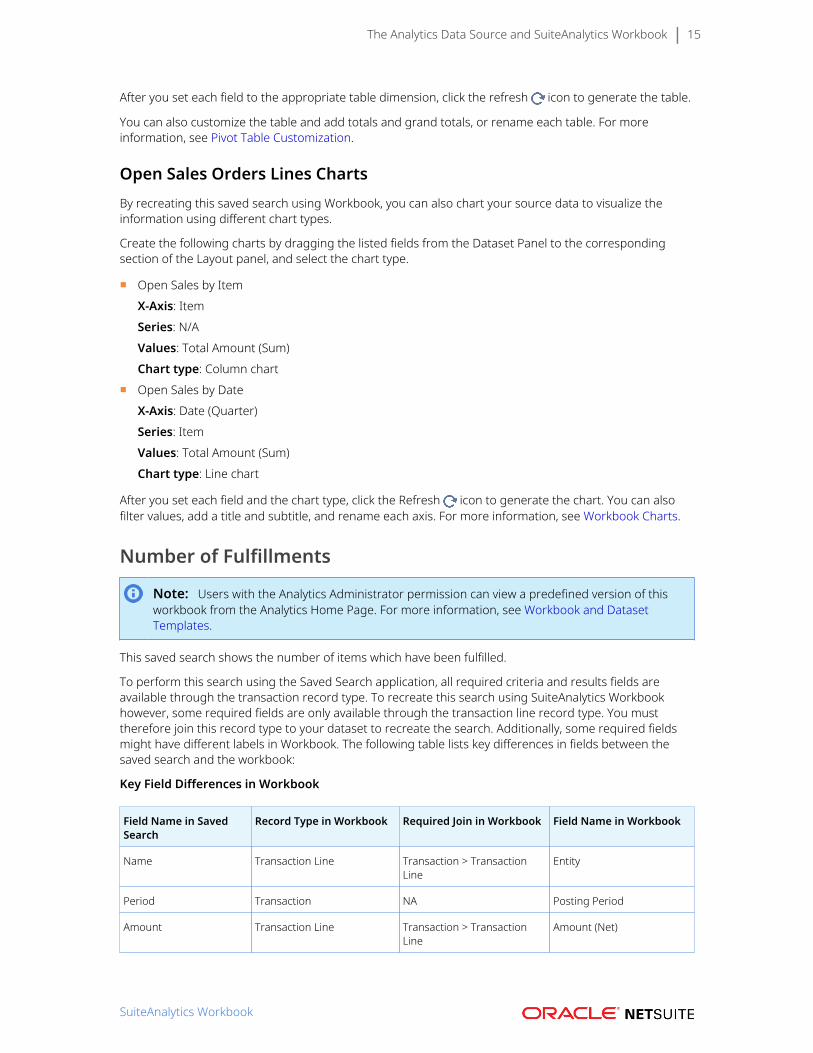
Number of Fulfillments
Note: Users with the Analytics Administrator permission can view a predefined version of thisworkbook from the Analytics Home Page. For more information, see Workbook and DatasetTemplates.
This saved search shows the number of items which have been fulfilled.
To perform this search using the Saved Search application, all required criteria and results fields areavailable through the transaction record type. To recreate this search using SuiteAnalytics Workbookhowever, some required fields are only available through the transaction line record type. You musttherefore join this record type to your dataset to recreate the search. Additionally, some required fieldsmight have different labels in Workbook. The following table lists key differences in fields between thesaved search and the workbook:
Key Field Differences in Workbook
Field Name in SavedSearch
Record Type in Workbook Required Join in Workbook Field Name in Workbook
Name Transaction Line Transaction > TransactionLine
Entity
Period Transaction NA Posting Period
Amount Transaction Line Transaction > TransactionLine
Amount (Net)
SuiteAnalytics Workbook
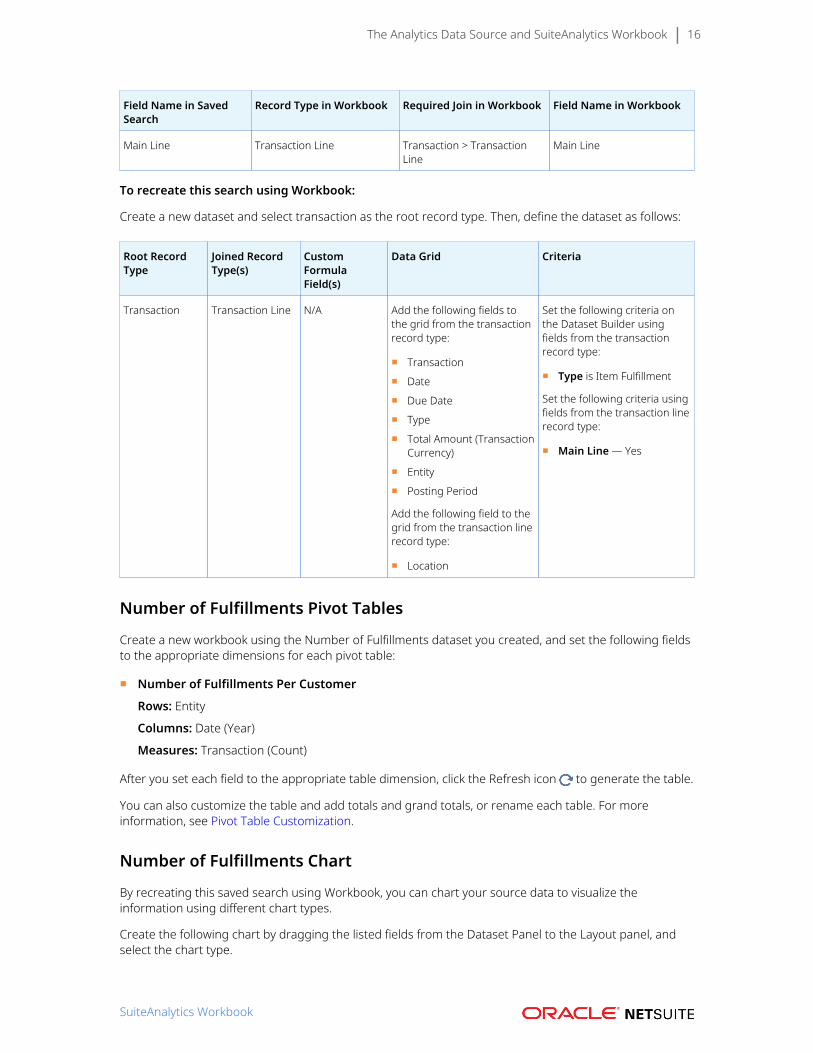
The Analytics Data Source and SuiteAnalytics Workbook 16
Field Name in SavedSearch
Record Type in Workbook Required Join in Workbook Field Name in Workbook
Main Line Transaction Line Transaction > TransactionLine
Main Line
To recreate this search using Workbook:
Create a new dataset and select transaction as the root record type. Then, define the dataset as follows:
Root RecordType
Joined RecordType(s)
CustomFormulaField(s)
Data Grid Criteria
Transaction Transaction Line N/A Add the following fields tothe grid from the transactionrecord type:
■ Transaction
■ Date
■ Due Date
■ Type
■ Total Amount (TransactionCurrency)
■ Entity
■ Posting Period
Add the following field to thegrid from the transaction linerecord type:
■ Location
Set the following criteria onthe Dataset Builder usingfields from the transactionrecord type:
■ Type is Item Fulfillment
Set the following criteria usingfields from the transaction linerecord type:
■ Main Line — Yes
Number of Fulfillments Pivot Tables
Create a new workbook using the Number of Fulfillments dataset you created, and set the following fieldsto the appropriate dimensions for each pivot table:
■ Number of Fulfillments Per Customer
Rows: Entity
Columns: Date (Year)
Measures: Transaction (Count)
After you set each field to the appropriate table dimension, click the Refresh icon to generate the table.
You can also customize the table and add totals and grand totals, or rename each table. For moreinformation, see Pivot Table Customization.
Number of Fulfillments Chart
By recreating this saved search using Workbook, you can chart your source data to visualize theinformation using different chart types.
Create the following chart by dragging the listed fields from the Dataset Panel to the Layout panel, andselect the chart type.
SuiteAnalytics Workbook
The Analytics Data Source and SuiteAnalytics Workbook 17
■ Number of Fulfillments per Customer
X-Axis: Entity
Series: Date (Year)
Values: Transaction (Count)
Chart type: Column chart
After you set each field, click the Refresh icon to generate the chart. You can also filter values, add atitle and subtitle, and rename each axis. For more information, see Workbook Charts.
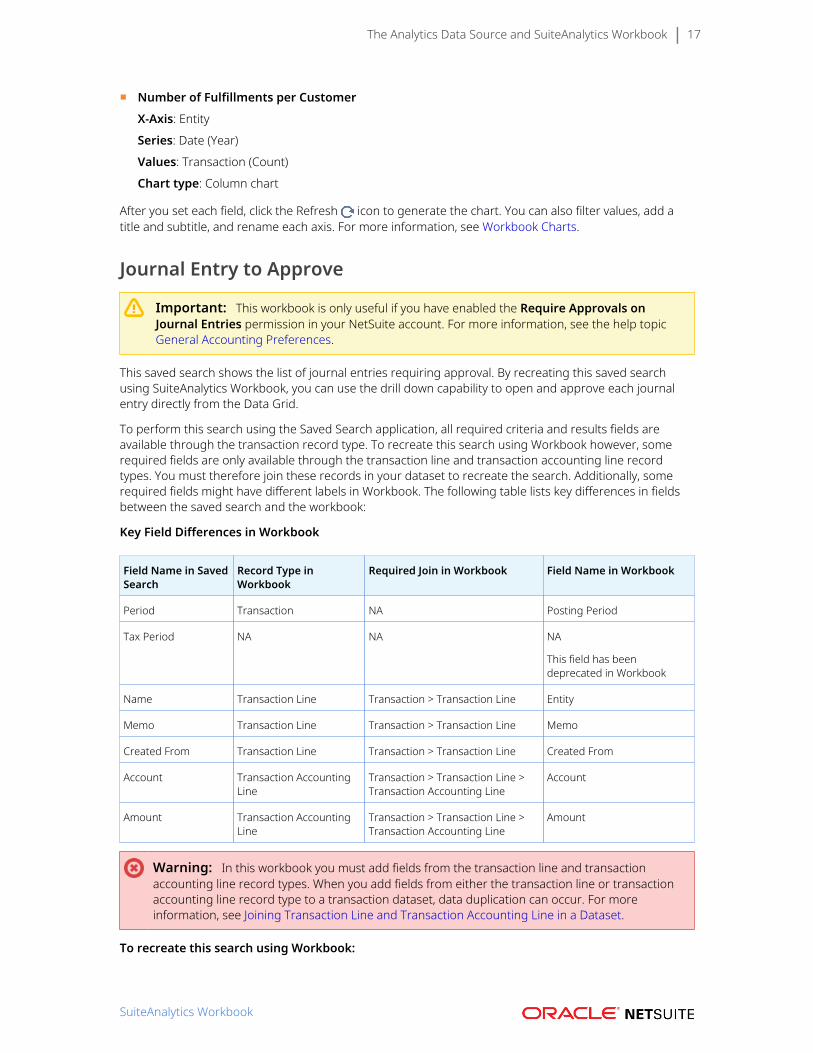
Journal Entry to Approve
Important: This workbook is only useful if you have enabled the Require Approvals onJournal Entries permission in your NetSuite account. For more information, see the help topicGeneral Accounting Preferences.
This saved search shows the list of journal entries requiring approval. By recreating this saved searchusing SuiteAnalytics Workbook, you can use the drill down capability to open and approve each journalentry directly from the Data Grid.
To perform this search using the Saved Search application, all required criteria and results fields areavailable through the transaction record type. To recreate this search using Workbook however, somerequired fields are only available through the transaction line and transaction accounting line recordtypes. You must therefore join these records in your dataset to recreate the search. Additionally, somerequired fields might have different labels in Workbook. The following table lists key differences in fieldsbetween the saved search and the workbook:
Key Field Differences in Workbook
Field Name in SavedSearch
Record Type inWorkbook
Required Join in Workbook Field Name in Workbook
Period Transaction NA Posting Period
Tax Period NA NA NA
This field has beendeprecated in Workbook
Name Transaction Line Transaction > Transaction Line Entity
Memo Transaction Line Transaction > Transaction Line Memo
Created From Transaction Line Transaction > Transaction Line Created From
Account Transaction AccountingLine
Transaction > Transaction Line >Transaction Accounting Line
Account
Amount Transaction AccountingLine
Transaction > Transaction Line >Transaction Accounting Line
Amount
Warning: In this workbook you must add fields from the transaction line and transactionaccounting line record types. When you add fields from either the transaction line or transactionaccounting line record type to a transaction dataset, data duplication can occur. For moreinformation, see Joining Transaction Line and Transaction Accounting Line in a Dataset.
To recreate this search using Workbook:
SuiteAnalytics Workbook
The Analytics Data Source and SuiteAnalytics Workbook 18
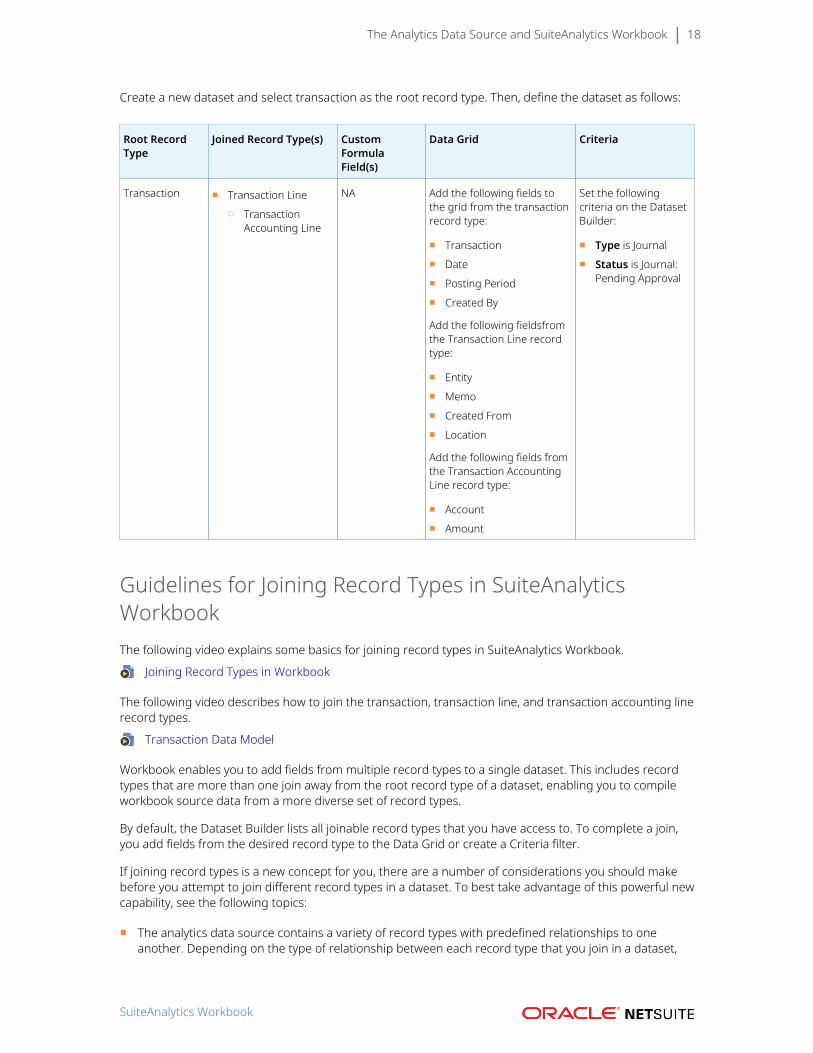
Create a new dataset and select transaction as the root record type. Then, define the dataset as follows:
Root RecordType
Joined Record Type(s) CustomFormulaField(s)
Data Grid Criteria
Transaction ■ Transaction Line
□ TransactionAccounting Line
NA Add the following fields tothe grid from the transactionrecord type:
■ Transaction
■ Date
■ Posting Period
■ Created By
Add the following fieldsfromthe Transaction Line recordtype:
■ Entity
■ Memo
■ Created From
■ Location
Add the following fields fromthe Transaction AccountingLine record type:
■ Account
■ Amount
Set the followingcriteria on the DatasetBuilder:
■ Type is Journal
■ Status is Journal:Pending Approval
Guidelines for Joining Record Types in SuiteAnalyticsWorkbookThe following video explains some basics for joining record types in SuiteAnalytics Workbook.
Joining Record Types in Workbook
The following video describes how to join the transaction, transaction line, and transaction accounting linerecord types.
Transaction Data Model
Workbook enables you to add fields from multiple record types to a single dataset. This includes recordtypes that are more than one join away from the root record type of a dataset, enabling you to compileworkbook source data from a more diverse set of record types.
By default, the Dataset Builder lists all joinable record types that you have access to. To complete a join,you add fields from the desired record type to the Data Grid or create a Criteria filter.
If joining record types is a new concept for you, there are a number of considerations you should makebefore you attempt to join different record types in a dataset. To best take advantage of this powerful newcapability, see the following topics:
■ The analytics data source contains a variety of record types with predefined relationships to oneanother. Depending on the type of relationship between each record type that you join in a dataset,
SuiteAnalytics Workbook
The Analytics Data Source and SuiteAnalytics Workbook 19
certain joins can cause unwanted duplication of your workbook source data. For more information, seeData Duplication Based on Record Joins.
■ The transaction and transaction line record types share a one-to-many relationship which can resultin duplication of your workbook source data. Joining the transaction accounting line record type to atransaction dataset can also cause data duplication. For more information about using the transactionrecord type in a dataset, see Joining Transaction Line and Transaction Accounting Line in a Dataset.
■ Based on the relationship between each record type that you add to a dataset, the order in whichyou join record types can also impact your source data. For more information, see Join Order inSuiteAnalytics Workbook.
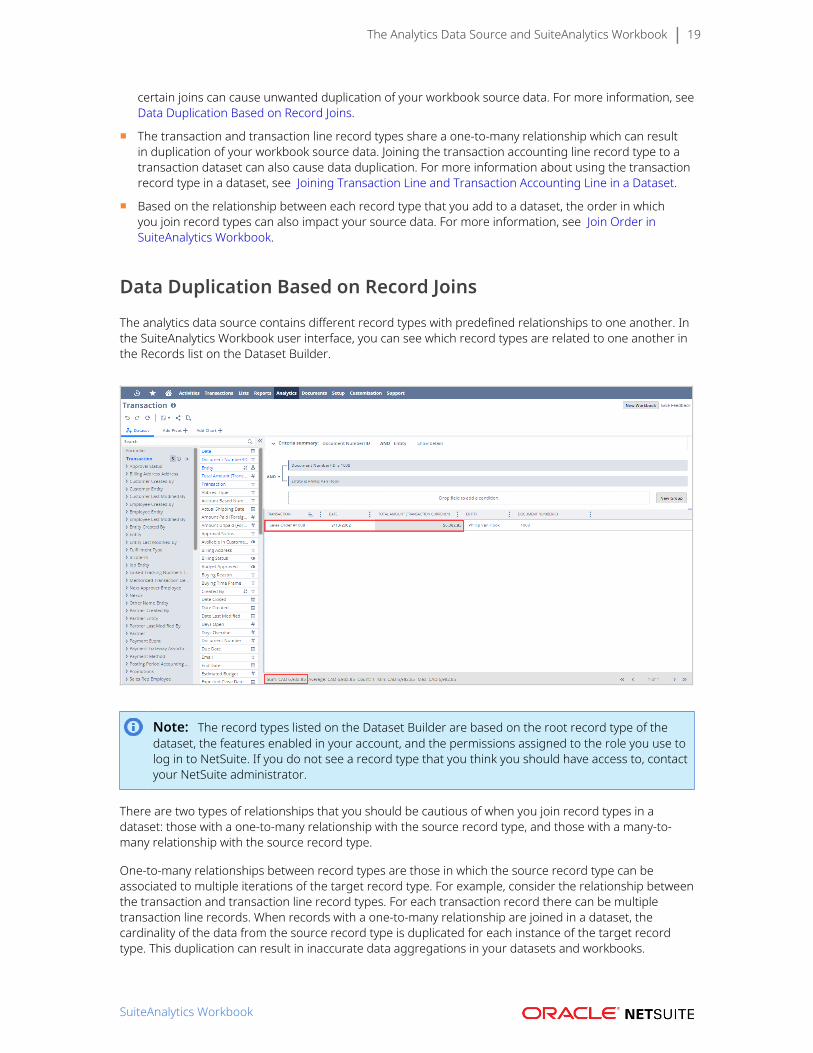
Data Duplication Based on Record Joins
The analytics data source contains different record types with predefined relationships to one another. Inthe SuiteAnalytics Workbook user interface, you can see which record types are related to one another inthe Records list on the Dataset Builder.
Note: The record types listed on the Dataset Builder are based on the root record type of thedataset, the features enabled in your account, and the permissions assigned to the role you use tolog in to NetSuite. If you do not see a record type that you think you should have access to, contactyour NetSuite administrator.
There are two types of relationships that you should be cautious of when you join record types in adataset: those with a one-to-many relationship with the source record type, and those with a many-to-many relationship with the source record type.
One-to-many relationships between record types are those in which the source record type can beassociated to multiple iterations of the target record type. For example, consider the relationship betweenthe transaction and transaction line record types. For each transaction record there can be multipletransaction line records. When records with a one-to-many relationship are joined in a dataset, thecardinality of the data from the source record type is duplicated for each instance of the target recordtype. This duplication can result in inaccurate data aggregations in your datasets and workbooks.
SuiteAnalytics Workbook
The Analytics Data Source and SuiteAnalytics Workbook 20
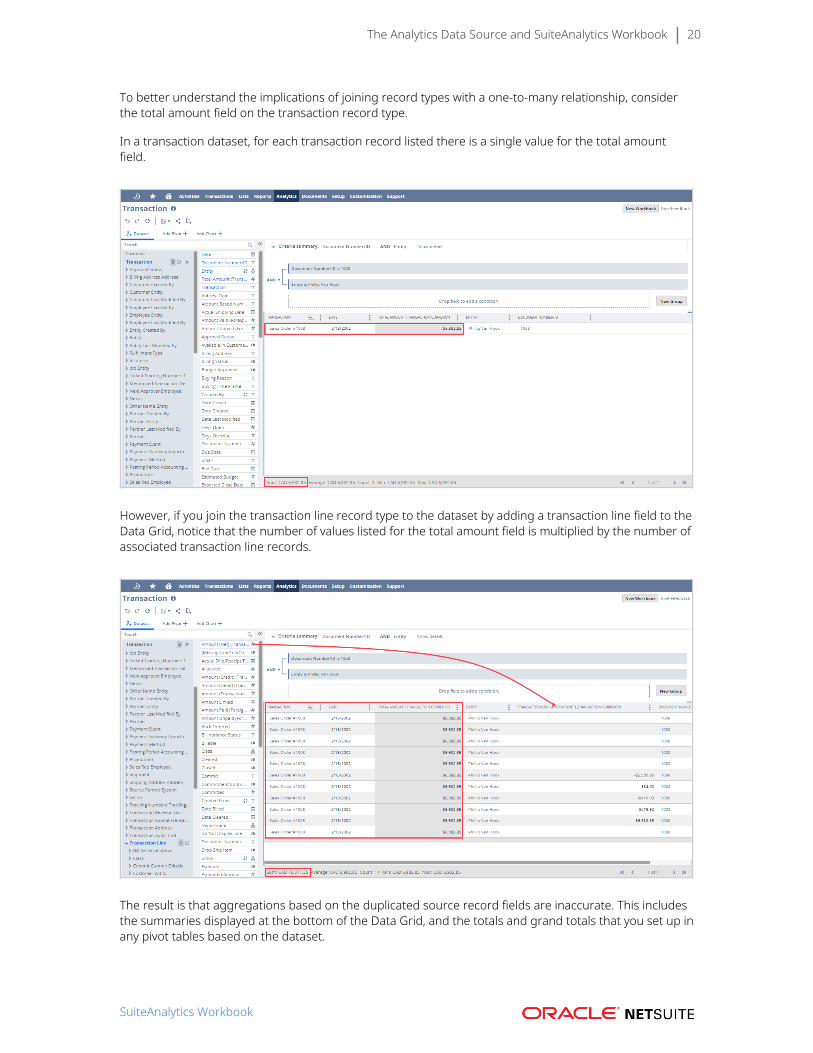
To better understand the implications of joining record types with a one-to-many relationship, considerthe total amount field on the transaction record type.
In a transaction dataset, for each transaction record listed there is a single value for the total amountfield.
However, if you join the transaction line record type to the dataset by adding a transaction line field to theData Grid, notice that the number of values listed for the total amount field is multiplied by the number ofassociated transaction line records.
The result is that aggregations based on the duplicated source record fields are inaccurate. This includesthe summaries displayed at the bottom of the Data Grid, and the totals and grand totals that you set up inany pivot tables based on the dataset.
SuiteAnalytics Workbook
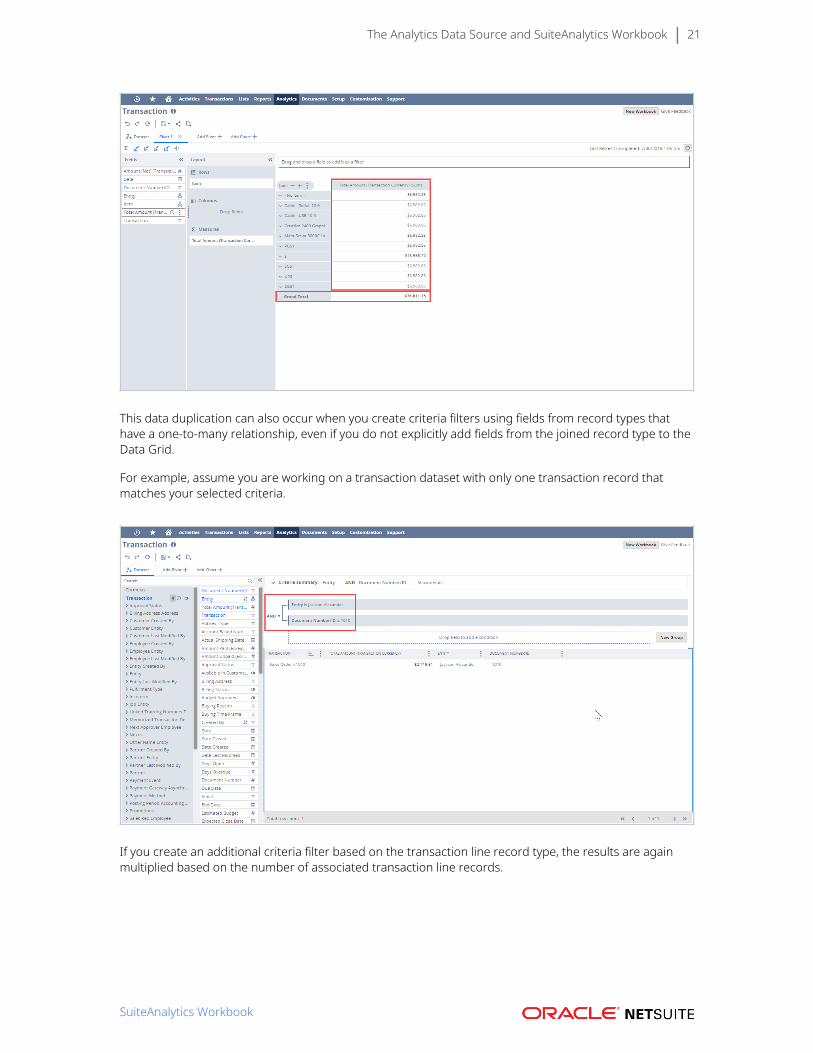
The Analytics Data Source and SuiteAnalytics Workbook 21
This data duplication can also occur when you create criteria filters using fields from record types thathave a one-to-many relationship, even if you do not explicitly add fields from the joined record type to theData Grid.
For example, assume you are working on a transaction dataset with only one transaction record thatmatches your selected criteria.
If you create an additional criteria filter based on the transaction line record type, the results are againmultiplied based on the number of associated transaction line records.
SuiteAnalytics Workbook
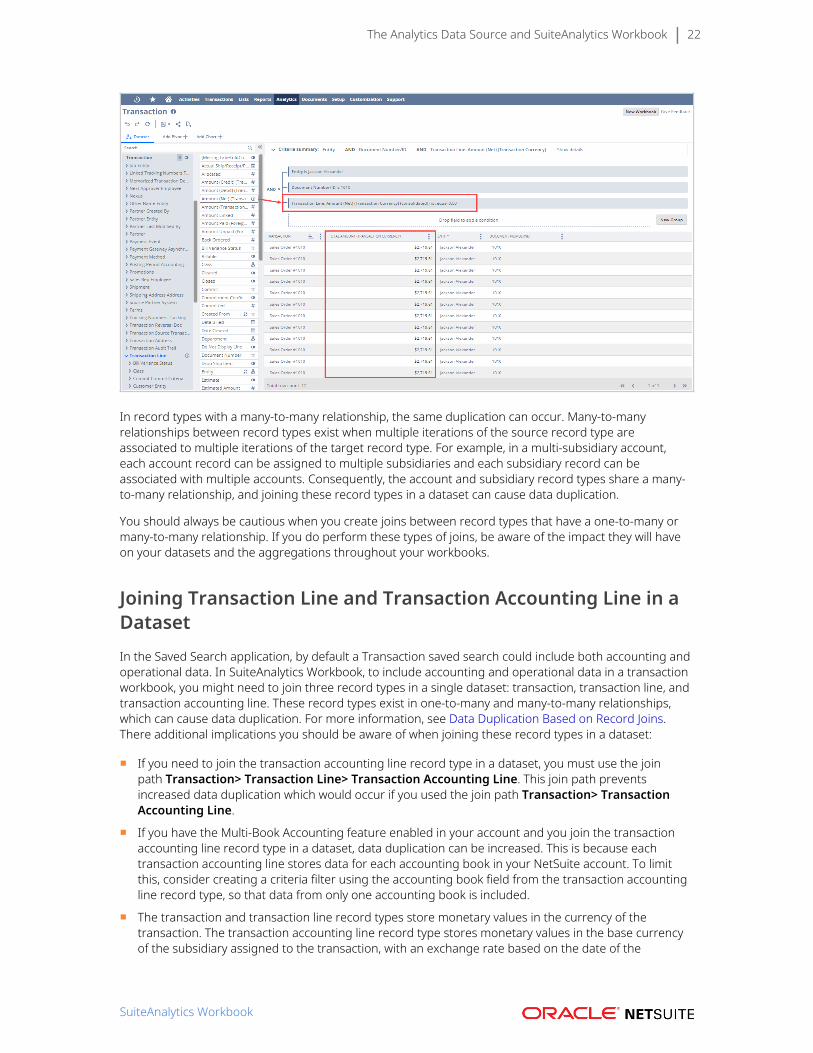
The Analytics Data Source and SuiteAnalytics Workbook 22
In record types with a many-to-many relationship, the same duplication can occur. Many-to-manyrelationships between record types exist when multiple iterations of the source record type areassociated to multiple iterations of the target record type. For example, in a multi-subsidiary account,each account record can be assigned to multiple subsidiaries and each subsidiary record can beassociated with multiple accounts. Consequently, the account and subsidiary record types share a many-to-many relationship, and joining these record types in a dataset can cause data duplication.
You should always be cautious when you create joins between record types that have a one-to-many ormany-to-many relationship. If you do perform these types of joins, be aware of the impact they will haveon your datasets and the aggregations throughout your workbooks.
Joining Transaction Line and Transaction Accounting Line in aDatasetIn the Saved Search application, by default a Transaction saved search could include both accounting andoperational data. In SuiteAnalytics Workbook, to include accounting and operational data in a transactionworkbook, you might need to join three record types in a single dataset: transaction, transaction line, andtransaction accounting line. These record types exist in one-to-many and many-to-many relationships,which can cause data duplication. For more information, see Data Duplication Based on Record Joins.There additional implications you should be aware of when joining these record types in a dataset:
■ If you need to join the transaction accounting line record type in a dataset, you must use the joinpath Transaction> Transaction Line> Transaction Accounting Line. This join path preventsincreased data duplication which would occur if you used the join path Transaction> TransactionAccounting Line.
■ If you have the Multi-Book Accounting feature enabled in your account and you join the transactionaccounting line record type in a dataset, data duplication can be increased. This is because eachtransaction accounting line stores data for each accounting book in your NetSuite account. To limitthis, consider creating a criteria filter using the accounting book field from the transaction accountingline record type, so that data from only one accounting book is included.
■ The transaction and transaction line record types store monetary values in the currency of thetransaction. The transaction accounting line record type stores monetary values in the base currencyof the subsidiary assigned to the transaction, with an exchange rate based on the date of the
SuiteAnalytics Workbook
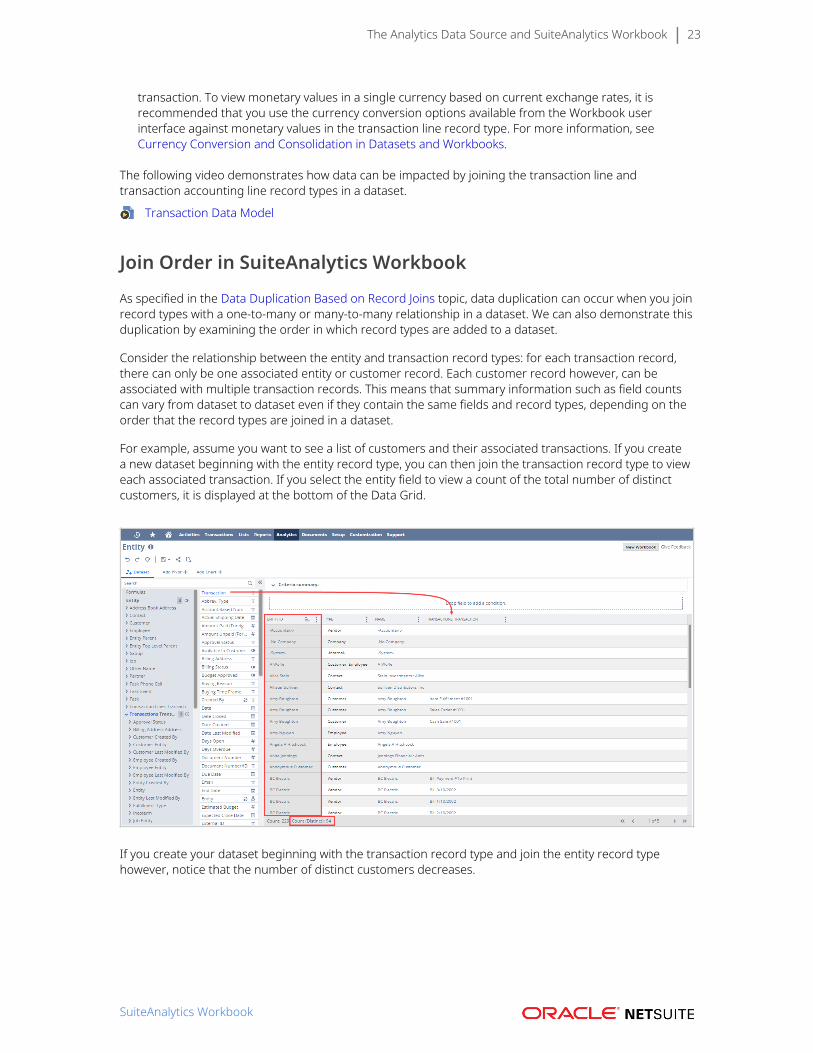
The Analytics Data Source and SuiteAnalytics Workbook 23
transaction. To view monetary values in a single currency based on current exchange rates, it isrecommended that you use the currency conversion options available from the Workbook userinterface against monetary values in the transaction line record type. For more information, seeCurrency Conversion and Consolidation in Datasets and Workbooks.
The following video demonstrates how data can be impacted by joining the transaction line andtransaction accounting line record types in a dataset.
Transaction Data Model
Join Order in SuiteAnalytics Workbook
As specified in the Data Duplication Based on Record Joins topic, data duplication can occur when you joinrecord types with a one-to-many or many-to-many relationship in a dataset. We can also demonstrate thisduplication by examining the order in which record types are added to a dataset.
Consider the relationship between the entity and transaction record types: for each transaction record,there can only be one associated entity or customer record. Each customer record however, can beassociated with multiple transaction records. This means that summary information such as field countscan vary from dataset to dataset even if they contain the same fields and record types, depending on theorder that the record types are joined in a dataset.
For example, assume you want to see a list of customers and their associated transactions. If you createa new dataset beginning with the entity record type, you can then join the transaction record type to vieweach associated transaction. If you select the entity field to view a count of the total number of distinctcustomers, it is displayed at the bottom of the Data Grid.
If you create your dataset beginning with the transaction record type and join the entity record typehowever, notice that the number of distinct customers decreases.
SuiteAnalytics Workbook
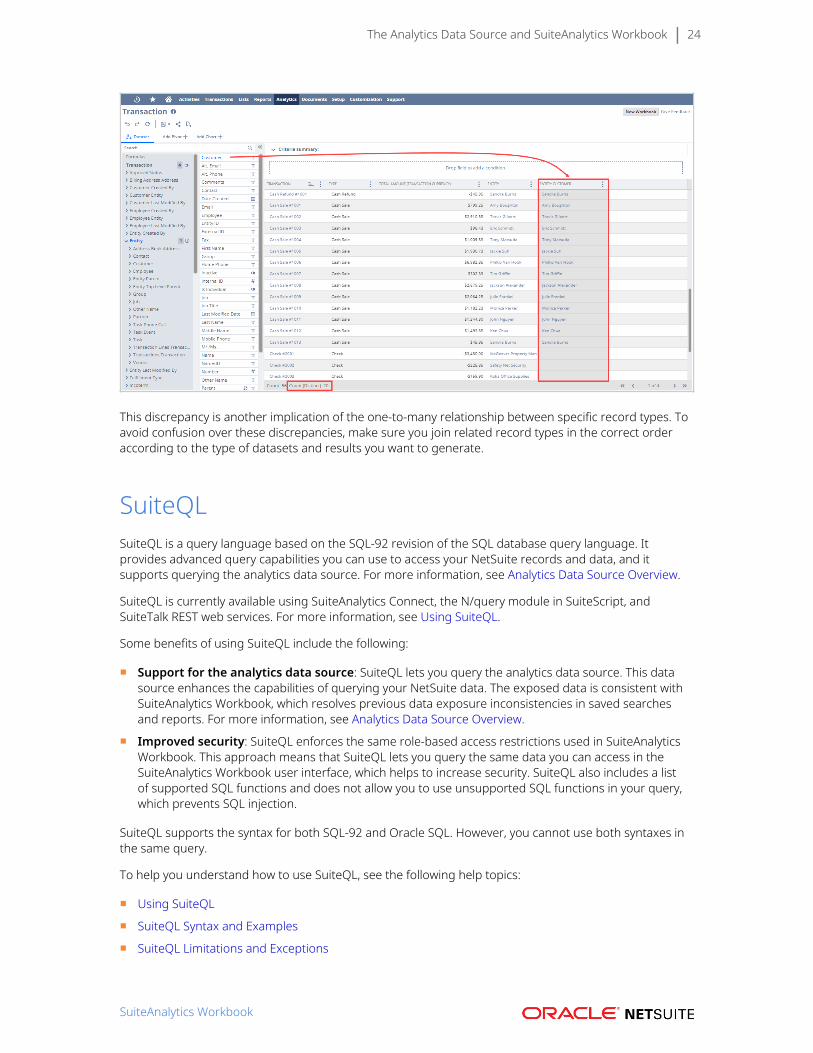
The Analytics Data Source and SuiteAnalytics Workbook 24
This discrepancy is another implication of the one-to-many relationship between specific record types. Toavoid confusion over these discrepancies, make sure you join related record types in the correct orderaccording to the type of datasets and results you want to generate.
SuiteQLSuiteQL is a query language based on the SQL-92 revision of the SQL database query language. Itprovides advanced query capabilities you can use to access your NetSuite records and data, and itsupports querying the analytics data source. For more information, see Analytics Data Source Overview.
SuiteQL is currently available using SuiteAnalytics Connect, the N/query module in SuiteScript, andSuiteTalk REST web services. For more information, see Using SuiteQL.
Some benefits of using SuiteQL include the following:
■ Support for the analytics data source: SuiteQL lets you query the analytics data source. This datasource enhances the capabilities of querying your NetSuite data. The exposed data is consistent withSuiteAnalytics Workbook, which resolves previous data exposure inconsistencies in saved searchesand reports. For more information, see Analytics Data Source Overview.
■ Improved security: SuiteQL enforces the same role-based access restrictions used in SuiteAnalyticsWorkbook. This approach means that SuiteQL lets you query the same data you can access in theSuiteAnalytics Workbook user interface, which helps to increase security. SuiteQL also includes a listof supported SQL functions and does not allow you to use unsupported SQL functions in your query,which prevents SQL injection.
SuiteQL supports the syntax for both SQL-92 and Oracle SQL. However, you cannot use both syntaxes inthe same query.
To help you understand how to use SuiteQL, see the following help topics:
■ Using SuiteQL
■ SuiteQL Syntax and Examples
■ SuiteQL Limitations and Exceptions
SuiteAnalytics Workbook
SuiteQL 25
■ SuiteQL Supported and Unsupported Functions
Using SuiteQLSuiteQL lets you query your NetSuite data using advanced query capabilities. SuiteQL includes a list ofsupported SQL functions and does not allow you to use unsupported SQL functions in your query, whichprevents SQL injection and other unauthorized access to data.
SuiteQL is currently available using SuiteAnalytics Connect and the N/query module in SuiteScript. Youcan also learn how to find record type names and field names to use in SuiteQL queries. See the followinghelp topics:
■ Using SuiteQL with the Connect Service
■ Using SuiteQL with the N/query Module in SuiteScript
■ Using SuiteQL with SuiteTalk REST Web Services
■ Finding Record Type and Field Names
Using SuiteQL with the Connect ServiceYou can use SuiteQL to query your NetSuite data through the Connect Service. To do so, you mustconsider the following:
■ Syntax Requirements
■ Querying the Analytics Data Source
■ Unsupported Features in SQL-92
Syntax Requirements
As you create queries using SuiteQL and the Connect Service, consider the following syntax requirements:
■ For string concatenation, you cannot use the + operator. You should use the || operator instead. Thisrestriction applies to both field and literal concatenation.
■ You cannot use more than 1000 arguments in a single IN clause.
■ You cannot use date literals. You must encapsulate dates using the to_date() function.
■ When using Oracle SQL syntax, you cannot use right outer joins. For example, the following OracleSQL is not valid in SuiteQL:
select a1.id from account a1, account a2 where a1.id (+) = a2.id
For more information, see the help topic SQL Compliance.
Querying the Analytics Data Source
To find all record types and fields that are currently available for the analytics data source schema, youcan do the following:
■ Use the Analytics Browser. To access the browser and learn how to use it, see Analytics Browser.
■ Use the OA_COLUMNS, OA_TABLES, and OA_FKEYS database tables. To learn about the tables, see the helptopic SuiteAnalytics Connect System Tables.
SuiteAnalytics Workbook
SuiteQL 26
Note: The OA_FKEYS table does not provide information about foreign keys for NetSuite2.comdata source. The table provides primary keys only.
The analytics data source is not accessible for the following roles: Administrator, Full Access (Deprecated),roles requiring Two-Factor Authentication (2FA), and roles accessing the Connect Service with IPrestrictions. For more information, see the help topic Role-based Permissions for the Analytics DataSource.
Unsupported Features in SQL-92
When using SQL-92 syntax, there are several features that are not supported, including embedded nullvalues in CHAR fields, DEFAULT clauses for column values, and subqueries in SELECT lists.
For a full list of unsupported features, see Non-Supported SQL-92 functionality.
Using SuiteQL with the N/query Module in SuiteScriptYou can use SuiteQL to query your NetSuite data using the N/query module in SuiteScript. The followingobject and methods are available in the N/query module to work with SuiteQL:
■ The query.SuiteQL object represents a SuiteQL query. It includes properties that represent the querytype, the SuiteQL string representation of the query, result columns to return from the query, and anyadditional parameters the query requires. You can use SuiteQL.run() to run the query as a non-pagedquery or SuiteQL.runPaged(options) to run the query as a paged query.
■ The Query.toSuiteQL() method converts an existing query (as a query.Query object) to its SuiteQLrepresentation (as a query.SuiteQL object).
■ The query.runSuiteQL(options) and query.runSuiteQLPaged(options) methods let you run an arbitrarySuiteQL query. You can specify this query as a SuiteQL string, query.SuiteQL object, or genericJavaScript Object containing a required query property and an optional params property.
Note: If the SuiteAnalytics Connect feature is enabled in your NetSuite account, there is no limitto the number of results these methods can return. If the SuiteAnalytics Connect feature is notenabled, these methods can return a maximum of 100,000 results across all pages in the resultset. For more information about SuiteAnalytics Connect, see the help topic SuiteAnalytics Connect.
Here is an example of how to load an existing query, convert it to SuiteQL, and run it:
var myLoadedQuery = query.load({ id: 'custworkbook237'});
var mySuiteQLQuery = myLoadedQuery.toSuiteQL();var myResultSet = mySuiteQLQuery.run();
For more information, see the help topic SuiteQL in the N/query Module.
Supported Built-in Functions
You can use built-in functions to perform certain operations in SuiteQL queries. These functions extendthe capabilities that are provided by the SQL-92 specification. For example, you can use the CONSOLIDATEbuilt-in function to convert a currency amount stored in a field to a target currency.
SuiteAnalytics Workbook
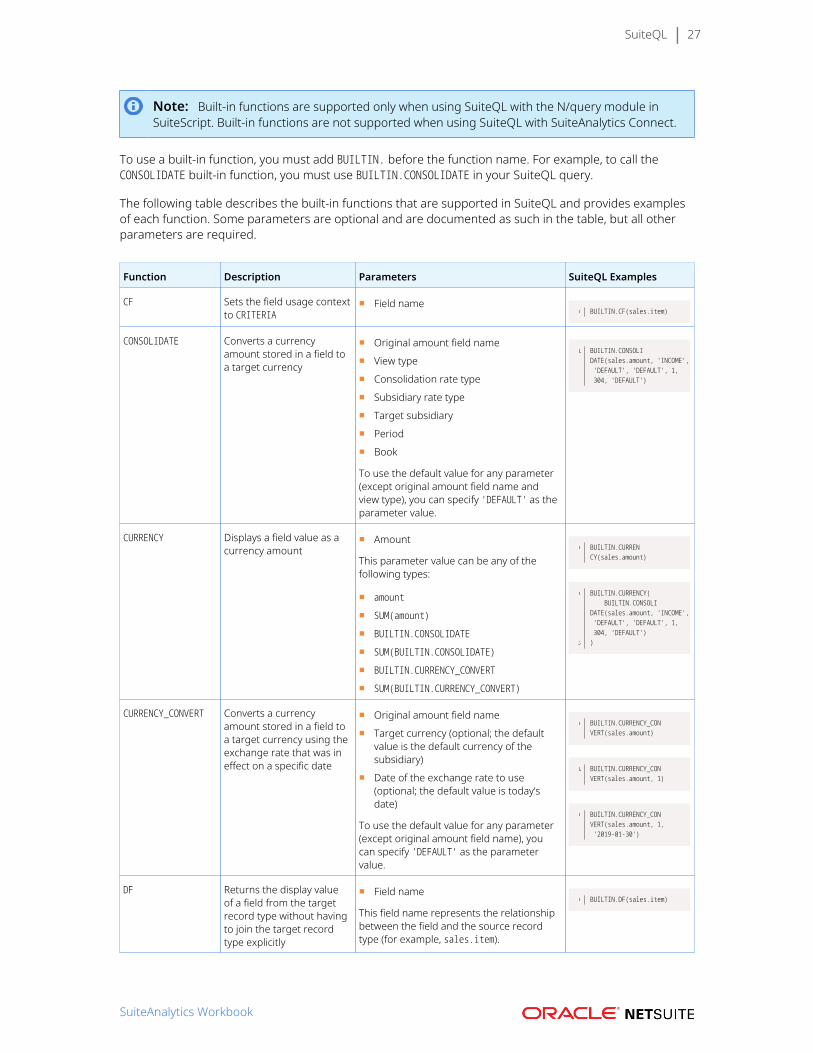
SuiteQL 27
Note: Built-in functions are supported only when using SuiteQL with the N/query module inSuiteScript. Built-in functions are not supported when using SuiteQL with SuiteAnalytics Connect.
To use a built-in function, you must add BUILTIN. before the function name. For example, to call theCONSOLIDATE built-in function, you must use BUILTIN.CONSOLIDATE in your SuiteQL query.
The following table describes the built-in functions that are supported in SuiteQL and provides examplesof each function. Some parameters are optional and are documented as such in the table, but all otherparameters are required.
Function Description Parameters SuiteQL Examples
CF Sets the field usage contextto CRITERIA
■ Field nameBUILTIN.CF(sales.item)
CONSOLIDATE Converts a currencyamount stored in a field toa target currency
■ Original amount field name
■ View type
■ Consolidation rate type
■ Subsidiary rate type
■ Target subsidiary
■ Period
■ Book
To use the default value for any parameter(except original amount field name andview type), you can specify 'DEFAULT' as theparameter value.
BUILTIN.CONSOLIDATE(sales.amount, 'INCOME', 'DEFAULT', 'DEFAULT', 1, 304, 'DEFAULT')
CURRENCY Displays a field value as acurrency amount
■ Amount
This parameter value can be any of thefollowing types:
■ amount
■ SUM(amount)
■ BUILTIN.CONSOLIDATE
■ SUM(BUILTIN.CONSOLIDATE)
■ BUILTIN.CURRENCY_CONVERT
■ SUM(BUILTIN.CURRENCY_CONVERT)
BUILTIN.CURRENCY(sales.amount)
BUILTIN.CURRENCY( BUILTIN.CONSOLIDATE(sales.amount, 'INCOME', 'DEFAULT', 'DEFAULT', 1, 304, 'DEFAULT'))
CURRENCY_CONVERT Converts a currencyamount stored in a field toa target currency using theexchange rate that was ineffect on a specific date
■ Original amount field name
■ Target currency (optional; the defaultvalue is the default currency of thesubsidiary)
■ Date of the exchange rate to use(optional; the default value is today’sdate)
To use the default value for any parameter(except original amount field name), youcan specify 'DEFAULT' as the parametervalue.
BUILTIN.CURRENCY_CONVERT(sales.amount)
BUILTIN.CURRENCY_CONVERT(sales.amount, 1)
BUILTIN.CURRENCY_CONVERT(sales.amount, 1, '2019-01-30')
DF Returns the display valueof a field from the targetrecord type without havingto join the target recordtype explicitly
■ Field name
This field name represents the relationshipbetween the field and the source recordtype (for example, sales.item).
BUILTIN.DF(sales.item)
SuiteAnalytics Workbook
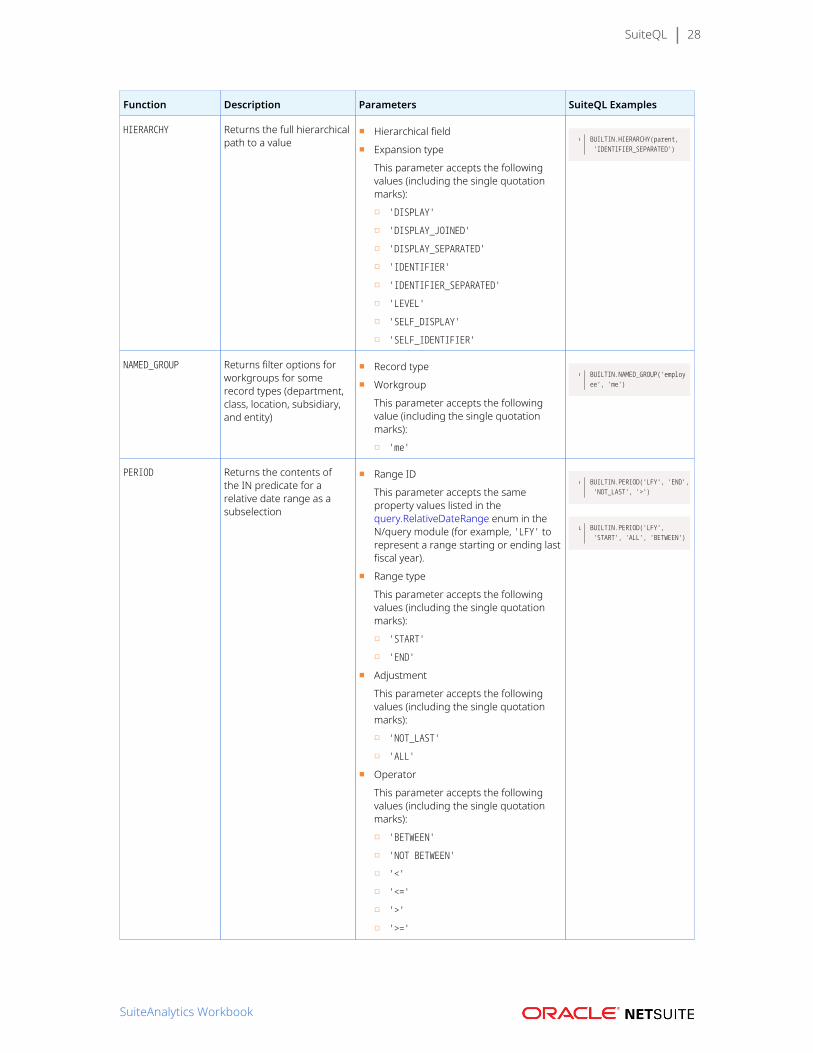
SuiteQL 28
Function Description Parameters SuiteQL Examples
HIERARCHY Returns the full hierarchicalpath to a value
■ Hierarchical field
■ Expansion type
This parameter accepts the followingvalues (including the single quotationmarks):
□ 'DISPLAY'
□ 'DISPLAY_JOINED'
□ 'DISPLAY_SEPARATED'
□ 'IDENTIFIER'
□ 'IDENTIFIER_SEPARATED'
□ 'LEVEL'
□ 'SELF_DISPLAY'
□ 'SELF_IDENTIFIER'
BUILTIN.HIERARCHY(parent, 'IDENTIFIER_SEPARATED')
NAMED_GROUP Returns filter options forworkgroups for somerecord types (department,class, location, subsidiary,and entity)
■ Record type
■ Workgroup
This parameter accepts the followingvalue (including the single quotationmarks):
□ 'me'
BUILTIN.NAMED_GROUP('employee', 'me')
PERIOD Returns the contents ofthe IN predicate for arelative date range as asubselection
■ Range ID
This parameter accepts the sameproperty values listed in thequery.RelativeDateRange enum in theN/query module (for example, 'LFY' torepresent a range starting or ending lastfiscal year).
■ Range type
This parameter accepts the followingvalues (including the single quotationmarks):
□ 'START'
□ 'END'
■ Adjustment
This parameter accepts the followingvalues (including the single quotationmarks):
□ 'NOT_LAST'
□ 'ALL'
■ Operator
This parameter accepts the followingvalues (including the single quotationmarks):
□ 'BETWEEN'
□ 'NOT BETWEEN'
□ '<'
□ '<='
□ '>'
□ '>='
BUILTIN.PERIOD('LFY', 'END', 'NOT_LAST', '>')
BUILTIN.PERIOD('LFY', 'START', 'ALL', 'BETWEEN')
SuiteAnalytics Workbook
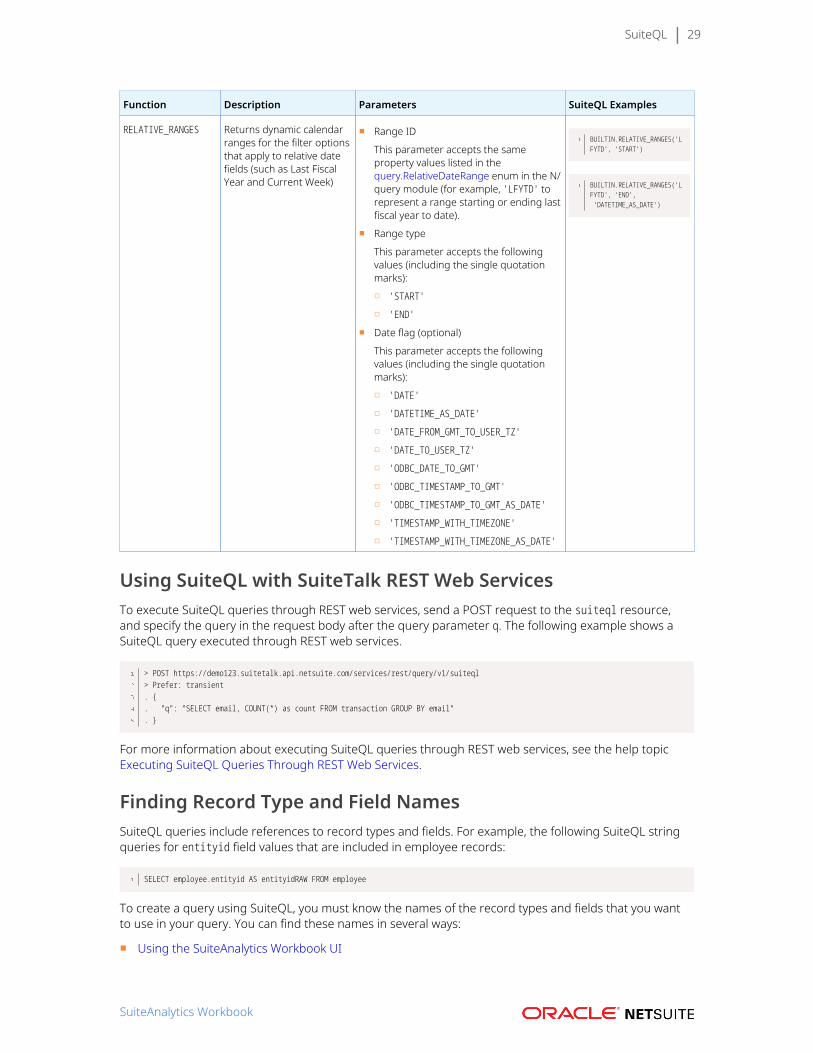
SuiteQL 29
Function Description Parameters SuiteQL Examples
RELATIVE_RANGES Returns dynamic calendarranges for the filter optionsthat apply to relative datefields (such as Last FiscalYear and Current Week)
■ Range ID
This parameter accepts the sameproperty values listed in thequery.RelativeDateRange enum in the N/query module (for example, 'LFYTD' torepresent a range starting or ending lastfiscal year to date).
■ Range type
This parameter accepts the followingvalues (including the single quotationmarks):
□ 'START'
□ 'END'
■ Date flag (optional)
This parameter accepts the followingvalues (including the single quotationmarks):
□ 'DATE'
□ 'DATETIME_AS_DATE'
□ 'DATE_FROM_GMT_TO_USER_TZ'
□ 'DATE_TO_USER_TZ'
□ 'ODBC_DATE_TO_GMT'
□ 'ODBC_TIMESTAMP_TO_GMT'
□ 'ODBC_TIMESTAMP_TO_GMT_AS_DATE'
□ 'TIMESTAMP_WITH_TIMEZONE'
□ 'TIMESTAMP_WITH_TIMEZONE_AS_DATE'
BUILTIN.RELATIVE_RANGES('LFYTD', 'START')
BUILTIN.RELATIVE_RANGES('LFYTD', 'END', 'DATETIME_AS_DATE')
Using SuiteQL with SuiteTalk REST Web ServicesTo execute SuiteQL queries through REST web services, send a POST request to the suiteql resource,and specify the query in the request body after the query parameter q. The following example shows aSuiteQL query executed through REST web services.
> POST https://demo123.suitetalk.api.netsuite.com/services/rest/query/v1/suiteql> Prefer: transient. {. "q": "SELECT email, COUNT(*) as count FROM transaction GROUP BY email". }
For more information about executing SuiteQL queries through REST web services, see the help topicExecuting SuiteQL Queries Through REST Web Services.
Finding Record Type and Field NamesSuiteQL queries include references to record types and fields. For example, the following SuiteQL stringqueries for entityid field values that are included in employee records:
SELECT employee.entityid AS entityidRAW FROM employee
To create a query using SuiteQL, you must know the names of the record types and fields that you wantto use in your query. You can find these names in several ways:
■ Using the SuiteAnalytics Workbook UI
SuiteAnalytics Workbook
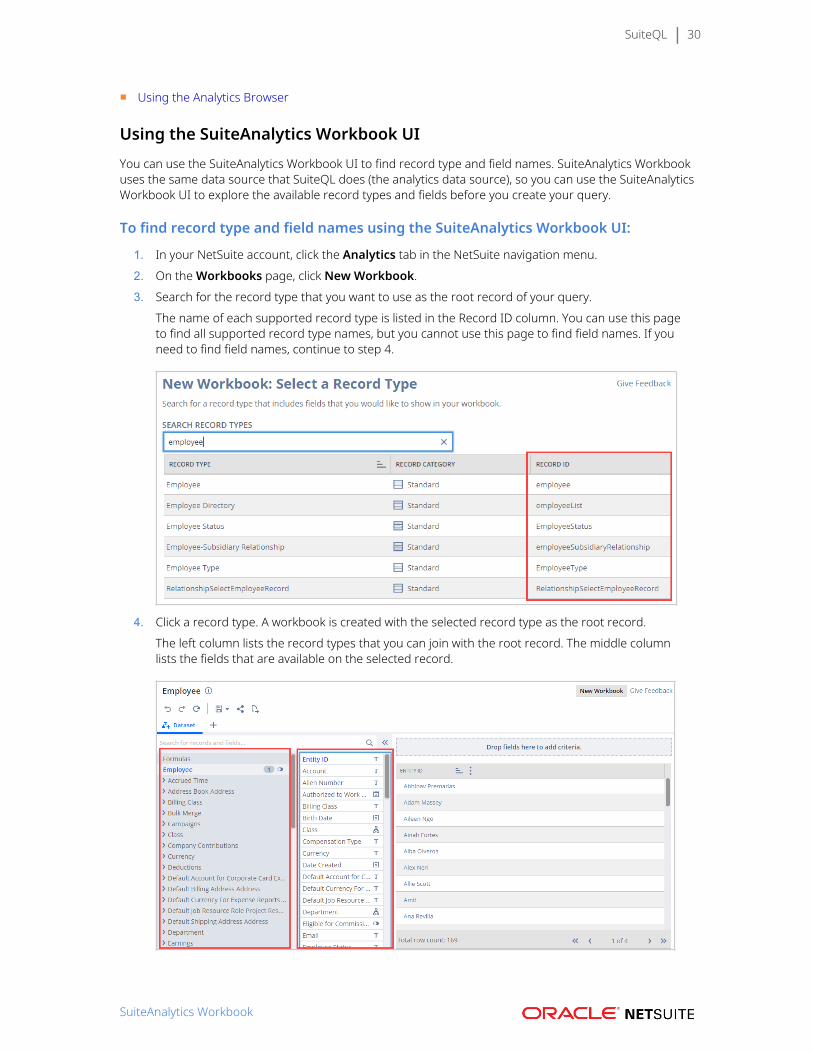
SuiteQL 30
■ Using the Analytics Browser
Using the SuiteAnalytics Workbook UIYou can use the SuiteAnalytics Workbook UI to find record type and field names. SuiteAnalytics Workbookuses the same data source that SuiteQL does (the analytics data source), so you can use the SuiteAnalyticsWorkbook UI to explore the available record types and fields before you create your query.
To find record type and field names using the SuiteAnalytics Workbook UI:
1. In your NetSuite account, click the Analytics tab in the NetSuite navigation menu.2. On the Workbooks page, click New Workbook.3. Search for the record type that you want to use as the root record of your query.
The name of each supported record type is listed in the Record ID column. You can use this pageto find all supported record type names, but you cannot use this page to find field names. If youneed to find field names, continue to step 4.
4. Click a record type. A workbook is created with the selected record type as the root record.The left column lists the record types that you can join with the root record. The middle columnlists the fields that are available on the selected record.
SuiteAnalytics Workbook
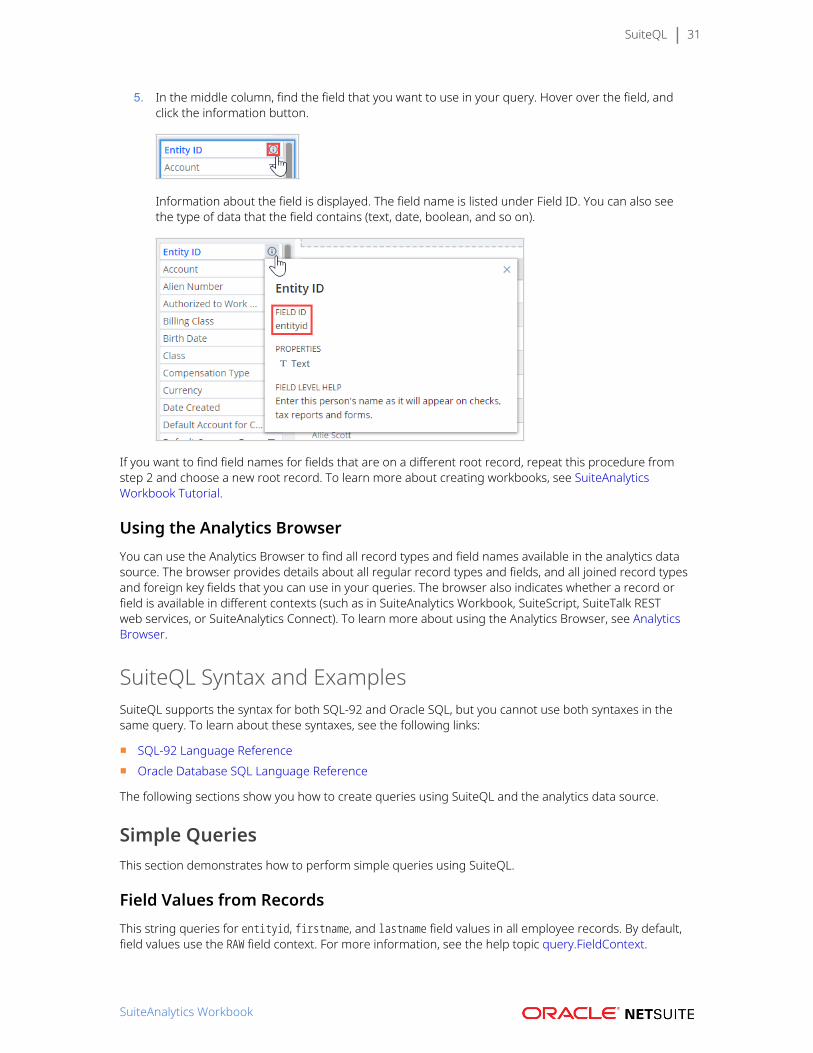
SuiteQL 31
5. In the middle column, find the field that you want to use in your query. Hover over the field, andclick the information button.
Information about the field is displayed. The field name is listed under Field ID. You can also seethe type of data that the field contains (text, date, boolean, and so on).
If you want to find field names for fields that are on a different root record, repeat this procedure fromstep 2 and choose a new root record. To learn more about creating workbooks, see SuiteAnalyticsWorkbook Tutorial.
Using the Analytics BrowserYou can use the Analytics Browser to find all record types and field names available in the analytics datasource. The browser provides details about all regular record types and fields, and all joined record typesand foreign key fields that you can use in your queries. The browser also indicates whether a record orfield is available in different contexts (such as in SuiteAnalytics Workbook, SuiteScript, SuiteTalk RESTweb services, or SuiteAnalytics Connect). To learn more about using the Analytics Browser, see AnalyticsBrowser.
SuiteQL Syntax and ExamplesSuiteQL supports the syntax for both SQL-92 and Oracle SQL, but you cannot use both syntaxes in thesame query. To learn about these syntaxes, see the following links:
■ SQL-92 Language Reference■ Oracle Database SQL Language Reference
The following sections show you how to create queries using SuiteQL and the analytics data source.
Simple QueriesThis section demonstrates how to perform simple queries using SuiteQL.
Field Values from RecordsThis string queries for entityid, firstname, and lastname field values in all employee records. By default,field values use the RAW field context. For more information, see the help topic query.FieldContext.
SuiteAnalytics Workbook
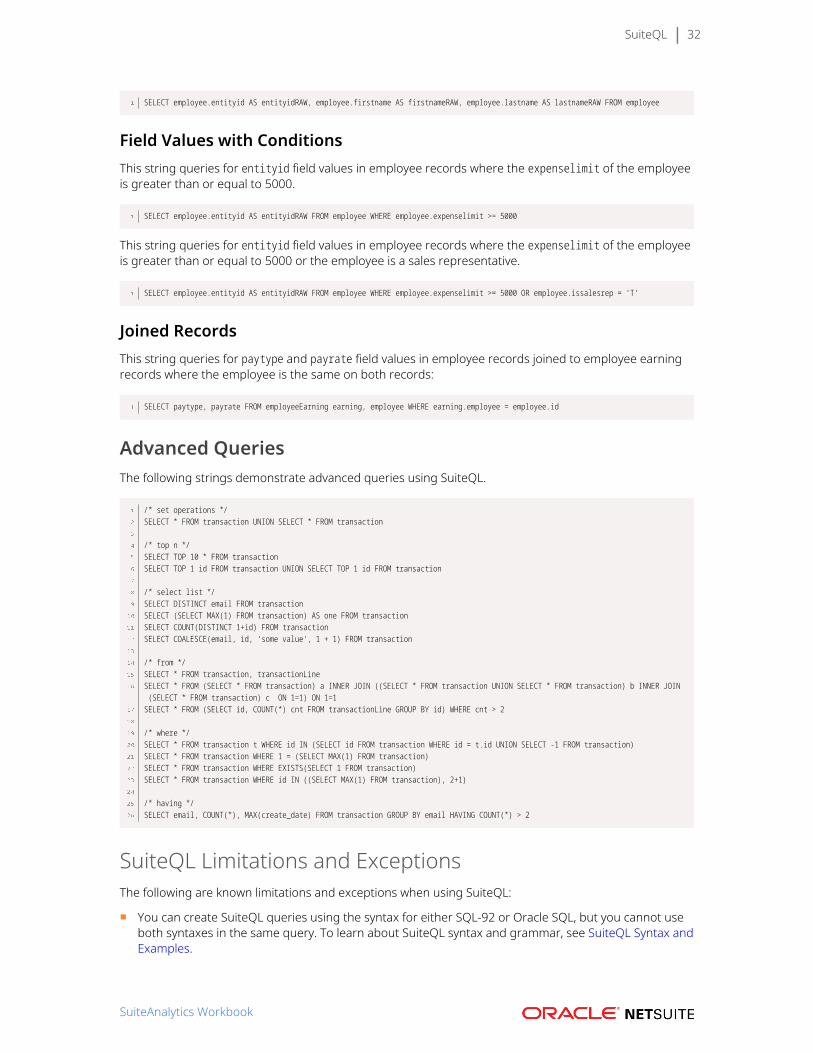
SuiteQL 32
SELECT employee.entityid AS entityidRAW, employee.firstname AS firstnameRAW, employee.lastname AS lastnameRAW FROM employee
Field Values with ConditionsThis string queries for entityid field values in employee records where the expenselimit of the employeeis greater than or equal to 5000.
SELECT employee.entityid AS entityidRAW FROM employee WHERE employee.expenselimit >= 5000
This string queries for entityid field values in employee records where the expenselimit of the employeeis greater than or equal to 5000 or the employee is a sales representative.
SELECT employee.entityid AS entityidRAW FROM employee WHERE employee.expenselimit >= 5000 OR employee.issalesrep = 'T'
Joined RecordsThis string queries for paytype and payrate field values in employee records joined to employee earningrecords where the employee is the same on both records:
SELECT paytype, payrate FROM employeeEarning earning, employee WHERE earning.employee = employee.id
Advanced QueriesThe following strings demonstrate advanced queries using SuiteQL.
/* set operations */SELECT * FROM transaction UNION SELECT * FROM transaction
/* top n */SELECT TOP 10 * FROM transactionSELECT TOP 1 id FROM transaction UNION SELECT TOP 1 id FROM transaction
/* select list */SELECT DISTINCT email FROM transactionSELECT (SELECT MAX(1) FROM transaction) AS one FROM transactionSELECT COUNT(DISTINCT 1+id) FROM transactionSELECT COALESCE(email, id, 'some value', 1 + 1) FROM transaction
/* from */SELECT * FROM transaction, transactionLineSELECT * FROM (SELECT * FROM transaction) a INNER JOIN ((SELECT * FROM transaction UNION SELECT * FROM transaction) b INNER JOIN (SELECT * FROM transaction) c ON 1=1) ON 1=1SELECT * FROM (SELECT id, COUNT(*) cnt FROM transactionLine GROUP BY id) WHERE cnt > 2
/* where */SELECT * FROM transaction t WHERE id IN (SELECT id FROM transaction WHERE id = t.id UNION SELECT -1 FROM transaction)SELECT * FROM transaction WHERE 1 = (SELECT MAX(1) FROM transaction)SELECT * FROM transaction WHERE EXISTS(SELECT 1 FROM transaction)SELECT * FROM transaction WHERE id IN ((SELECT MAX(1) FROM transaction), 2+1)
/* having */SELECT email, COUNT(*), MAX(create_date) FROM transaction GROUP BY email HAVING COUNT(*) > 2
SuiteQL Limitations and ExceptionsThe following are known limitations and exceptions when using SuiteQL:
■ You can create SuiteQL queries using the syntax for either SQL-92 or Oracle SQL, but you cannot useboth syntaxes in the same query. To learn about SuiteQL syntax and grammar, see SuiteQL Syntax andExamples.
SuiteAnalytics Workbook
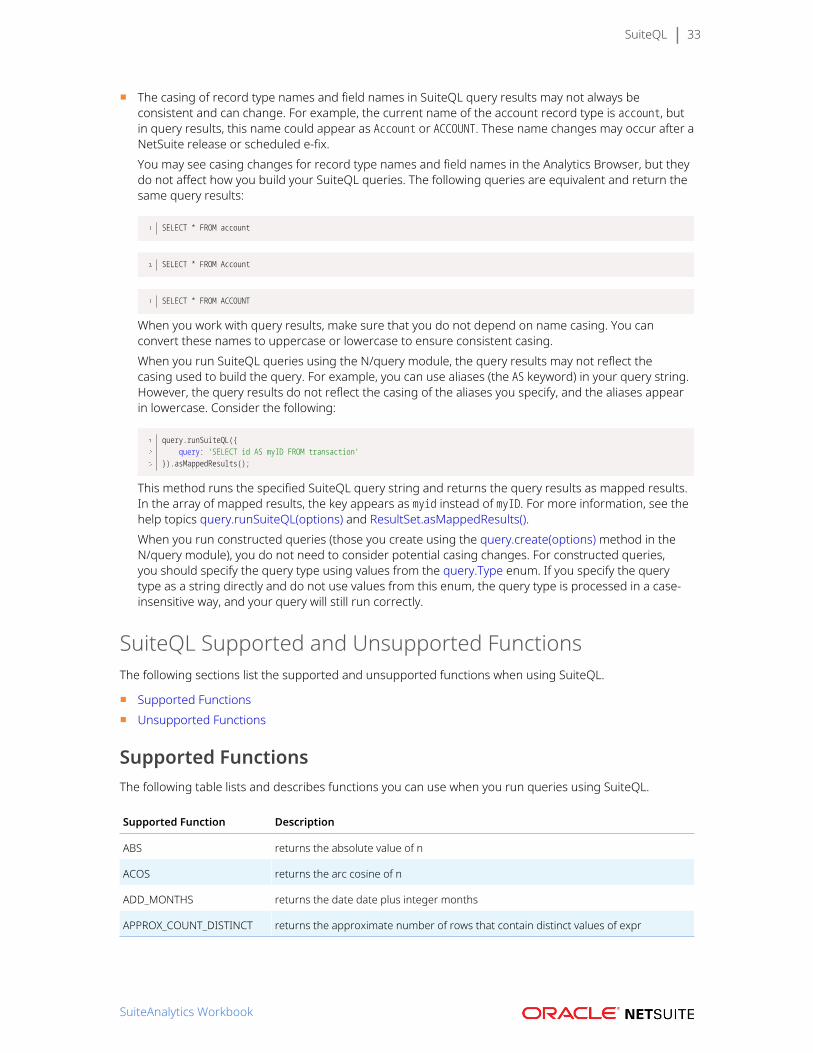
SuiteQL 33
■ The casing of record type names and field names in SuiteQL query results may not always beconsistent and can change. For example, the current name of the account record type is account, butin query results, this name could appear as Account or ACCOUNT. These name changes may occur after aNetSuite release or scheduled e-fix.You may see casing changes for record type names and field names in the Analytics Browser, but theydo not affect how you build your SuiteQL queries. The following queries are equivalent and return thesame query results:
SELECT * FROM account
SELECT * FROM Account
SELECT * FROM ACCOUNT
When you work with query results, make sure that you do not depend on name casing. You canconvert these names to uppercase or lowercase to ensure consistent casing.When you run SuiteQL queries using the N/query module, the query results may not reflect thecasing used to build the query. For example, you can use aliases (the AS keyword) in your query string.However, the query results do not reflect the casing of the aliases you specify, and the aliases appearin lowercase. Consider the following:
query.runSuiteQL({ query: 'SELECT id AS myID FROM transaction'}).asMappedResults();
This method runs the specified SuiteQL query string and returns the query results as mapped results.In the array of mapped results, the key appears as myid instead of myID. For more information, see thehelp topics query.runSuiteQL(options) and ResultSet.asMappedResults().When you run constructed queries (those you create using the query.create(options) method in theN/query module), you do not need to consider potential casing changes. For constructed queries,you should specify the query type using values from the query.Type enum. If you specify the querytype as a string directly and do not use values from this enum, the query type is processed in a case-insensitive way, and your query will still run correctly.
SuiteQL Supported and Unsupported FunctionsThe following sections list the supported and unsupported functions when using SuiteQL.
■ Supported Functions■ Unsupported Functions
Supported FunctionsThe following table lists and describes functions you can use when you run queries using SuiteQL.
Supported Function Description
ABS returns the absolute value of n
ACOS returns the arc cosine of n
ADD_MONTHS returns the date date plus integer months
APPROX_COUNT_DISTINCT returns the approximate number of rows that contain distinct values of expr
SuiteAnalytics Workbook
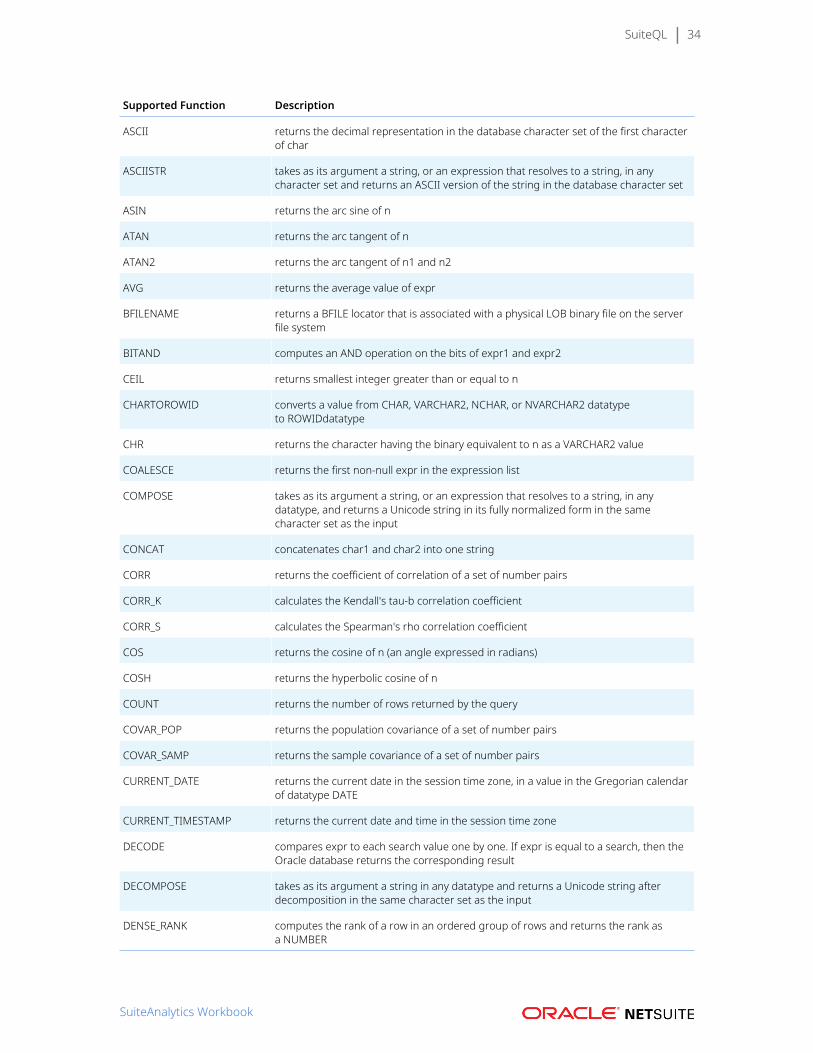
SuiteQL 34
Supported Function Description
ASCII returns the decimal representation in the database character set of the first characterof char
ASCIISTR takes as its argument a string, or an expression that resolves to a string, in anycharacter set and returns an ASCII version of the string in the database character set
ASIN returns the arc sine of n
ATAN returns the arc tangent of n
ATAN2 returns the arc tangent of n1 and n2
AVG returns the average value of expr
BFILENAME returns a BFILE locator that is associated with a physical LOB binary file on the serverfile system
BITAND computes an AND operation on the bits of expr1 and expr2
CEIL returns smallest integer greater than or equal to n
CHARTOROWID converts a value from CHAR, VARCHAR2, NCHAR, or NVARCHAR2 datatypeto ROWIDdatatype
CHR returns the character having the binary equivalent to n as a VARCHAR2 value
COALESCE returns the first non-null expr in the expression list
COMPOSE takes as its argument a string, or an expression that resolves to a string, in anydatatype, and returns a Unicode string in its fully normalized form in the samecharacter set as the input
CONCAT concatenates char1 and char2 into one string
CORR returns the coefficient of correlation of a set of number pairs
CORR_K calculates the Kendall's tau-b correlation coefficient
CORR_S calculates the Spearman's rho correlation coefficient
COS returns the cosine of n (an angle expressed in radians)
COSH returns the hyperbolic cosine of n
COUNT returns the number of rows returned by the query
COVAR_POP returns the population covariance of a set of number pairs
COVAR_SAMP returns the sample covariance of a set of number pairs
CURRENT_DATE returns the current date in the session time zone, in a value in the Gregorian calendarof datatype DATE
CURRENT_TIMESTAMP returns the current date and time in the session time zone
DECODE compares expr to each search value one by one. If expr is equal to a search, then theOracle database returns the corresponding result
DECOMPOSE takes as its argument a string in any datatype and returns a Unicode string afterdecomposition in the same character set as the input
DENSE_RANK computes the rank of a row in an ordered group of rows and returns the rank asa NUMBER
SuiteAnalytics Workbook
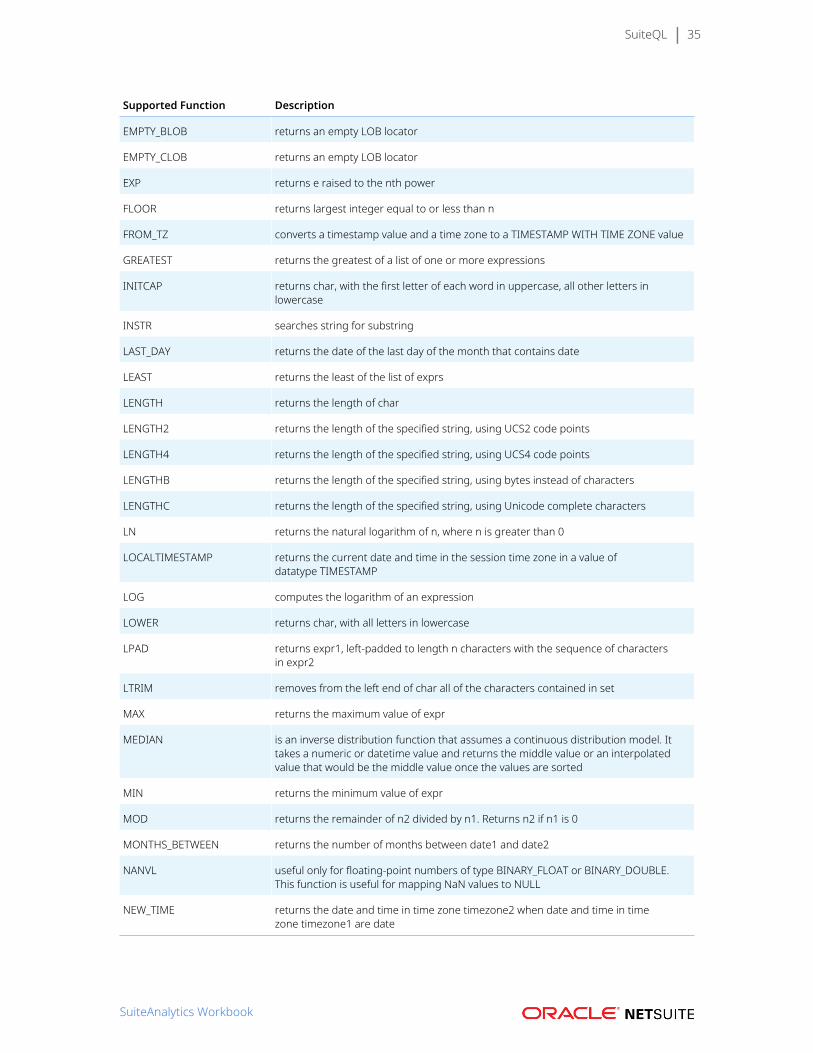
SuiteQL 35
Supported Function Description
EMPTY_BLOB returns an empty LOB locator
EMPTY_CLOB returns an empty LOB locator
EXP returns e raised to the nth power
FLOOR returns largest integer equal to or less than n
FROM_TZ converts a timestamp value and a time zone to a TIMESTAMP WITH TIME ZONE value
GREATEST returns the greatest of a list of one or more expressions
INITCAP returns char, with the first letter of each word in uppercase, all other letters inlowercase
INSTR searches string for substring
LAST_DAY returns the date of the last day of the month that contains date
LEAST returns the least of the list of exprs
LENGTH returns the length of char
LENGTH2 returns the length of the specified string, using UCS2 code points
LENGTH4 returns the length of the specified string, using UCS4 code points
LENGTHB returns the length of the specified string, using bytes instead of characters
LENGTHC returns the length of the specified string, using Unicode complete characters
LN returns the natural logarithm of n, where n is greater than 0
LOCALTIMESTAMP returns the current date and time in the session time zone in a value ofdatatype TIMESTAMP
LOG computes the logarithm of an expression
LOWER returns char, with all letters in lowercase
LPAD returns expr1, left-padded to length n characters with the sequence of charactersin expr2
LTRIM removes from the left end of char all of the characters contained in set
MAX returns the maximum value of expr
MEDIAN is an inverse distribution function that assumes a continuous distribution model. Ittakes a numeric or datetime value and returns the middle value or an interpolatedvalue that would be the middle value once the values are sorted
MIN returns the minimum value of expr
MOD returns the remainder of n2 divided by n1. Returns n2 if n1 is 0
MONTHS_BETWEEN returns the number of months between date1 and date2
NANVL useful only for floating-point numbers of type BINARY_FLOAT or BINARY_DOUBLE.This function is useful for mapping NaN values to NULL
NEW_TIME returns the date and time in time zone timezone2 when date and time in timezone timezone1 are date
SuiteAnalytics Workbook
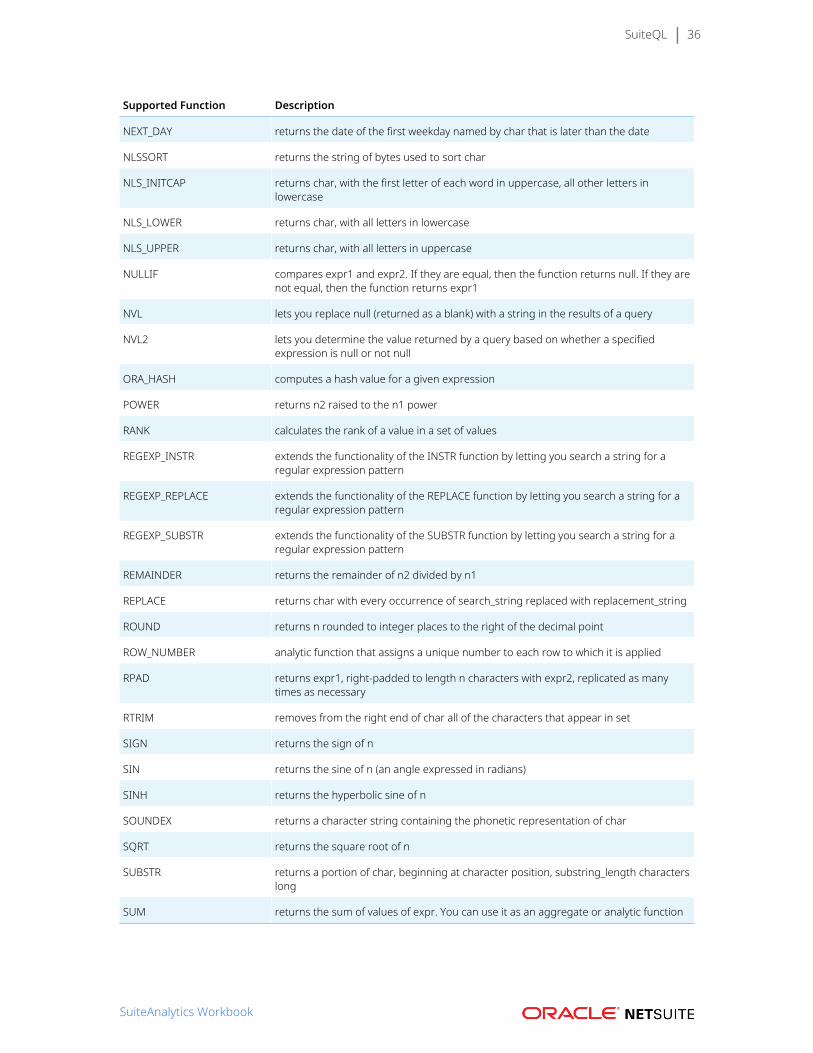
SuiteQL 36
Supported Function Description
NEXT_DAY returns the date of the first weekday named by char that is later than the date
NLSSORT returns the string of bytes used to sort char
NLS_INITCAP returns char, with the first letter of each word in uppercase, all other letters inlowercase
NLS_LOWER returns char, with all letters in lowercase
NLS_UPPER returns char, with all letters in uppercase
NULLIF compares expr1 and expr2. If they are equal, then the function returns null. If they arenot equal, then the function returns expr1
NVL lets you replace null (returned as a blank) with a string in the results of a query
NVL2 lets you determine the value returned by a query based on whether a specifiedexpression is null or not null
ORA_HASH computes a hash value for a given expression
POWER returns n2 raised to the n1 power
RANK calculates the rank of a value in a set of values
REGEXP_INSTR extends the functionality of the INSTR function by letting you search a string for aregular expression pattern
REGEXP_REPLACE extends the functionality of the REPLACE function by letting you search a string for aregular expression pattern
REGEXP_SUBSTR extends the functionality of the SUBSTR function by letting you search a string for aregular expression pattern
REMAINDER returns the remainder of n2 divided by n1
REPLACE returns char with every occurrence of search_string replaced with replacement_string
ROUND returns n rounded to integer places to the right of the decimal point
ROW_NUMBER analytic function that assigns a unique number to each row to which it is applied
RPAD returns expr1, right-padded to length n characters with expr2, replicated as manytimes as necessary
RTRIM removes from the right end of char all of the characters that appear in set
SIGN returns the sign of n
SIN returns the sine of n (an angle expressed in radians)
SINH returns the hyperbolic sine of n
SOUNDEX returns a character string containing the phonetic representation of char
SQRT returns the square root of n
SUBSTR returns a portion of char, beginning at character position, substring_length characterslong
SUM returns the sum of values of expr. You can use it as an aggregate or analytic function
SuiteAnalytics Workbook
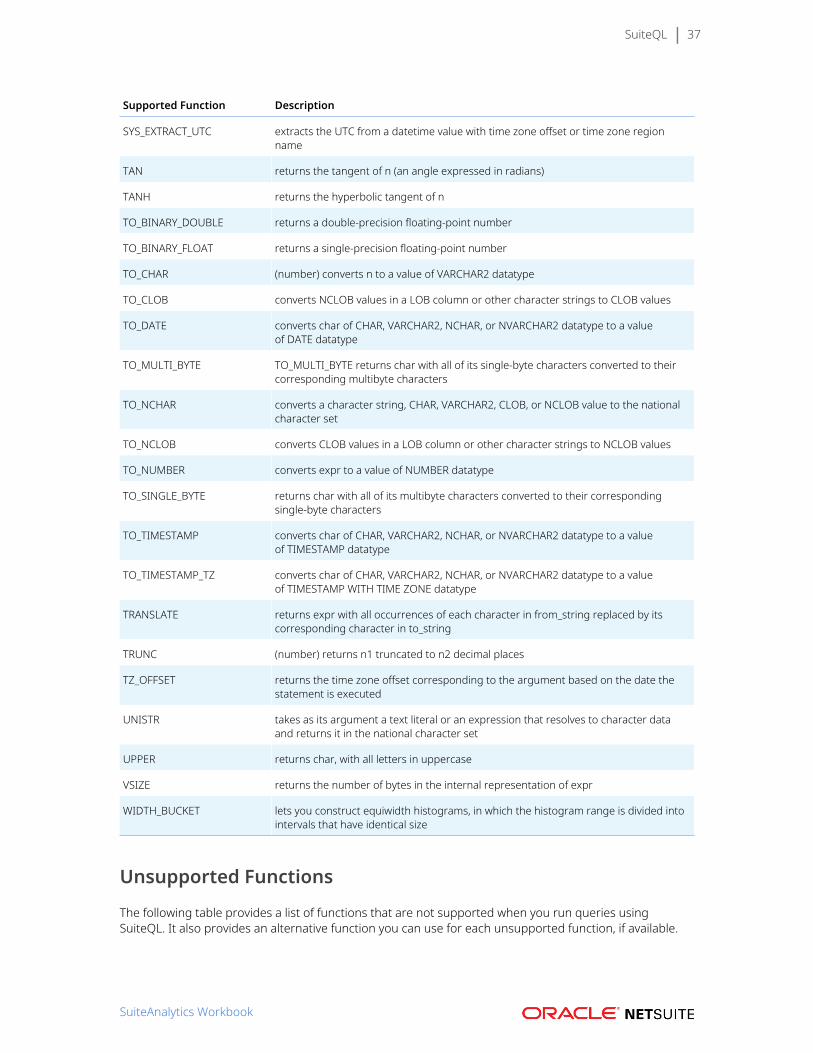
SuiteQL 37
Supported Function Description
SYS_EXTRACT_UTC extracts the UTC from a datetime value with time zone offset or time zone regionname
TAN returns the tangent of n (an angle expressed in radians)
TANH returns the hyperbolic tangent of n
TO_BINARY_DOUBLE returns a double-precision floating-point number
TO_BINARY_FLOAT returns a single-precision floating-point number
TO_CHAR (number) converts n to a value of VARCHAR2 datatype
TO_CLOB converts NCLOB values in a LOB column or other character strings to CLOB values
TO_DATE converts char of CHAR, VARCHAR2, NCHAR, or NVARCHAR2 datatype to a valueof DATE datatype
TO_MULTI_BYTE TO_MULTI_BYTE returns char with all of its single-byte characters converted to theircorresponding multibyte characters
TO_NCHAR converts a character string, CHAR, VARCHAR2, CLOB, or NCLOB value to the nationalcharacter set
TO_NCLOB converts CLOB values in a LOB column or other character strings to NCLOB values
TO_NUMBER converts expr to a value of NUMBER datatype
TO_SINGLE_BYTE returns char with all of its multibyte characters converted to their correspondingsingle-byte characters
TO_TIMESTAMP converts char of CHAR, VARCHAR2, NCHAR, or NVARCHAR2 datatype to a valueof TIMESTAMP datatype
TO_TIMESTAMP_TZ converts char of CHAR, VARCHAR2, NCHAR, or NVARCHAR2 datatype to a valueof TIMESTAMP WITH TIME ZONE datatype
TRANSLATE returns expr with all occurrences of each character in from_string replaced by itscorresponding character in to_string
TRUNC (number) returns n1 truncated to n2 decimal places
TZ_OFFSET returns the time zone offset corresponding to the argument based on the date thestatement is executed
UNISTR takes as its argument a text literal or an expression that resolves to character dataand returns it in the national character set
UPPER returns char, with all letters in uppercase
VSIZE returns the number of bytes in the internal representation of expr
WIDTH_BUCKET lets you construct equiwidth histograms, in which the histogram range is divided intointervals that have identical size
Unsupported Functions
The following table provides a list of functions that are not supported when you run queries usingSuiteQL. It also provides an alternative function you can use for each unsupported function, if available.
SuiteAnalytics Workbook
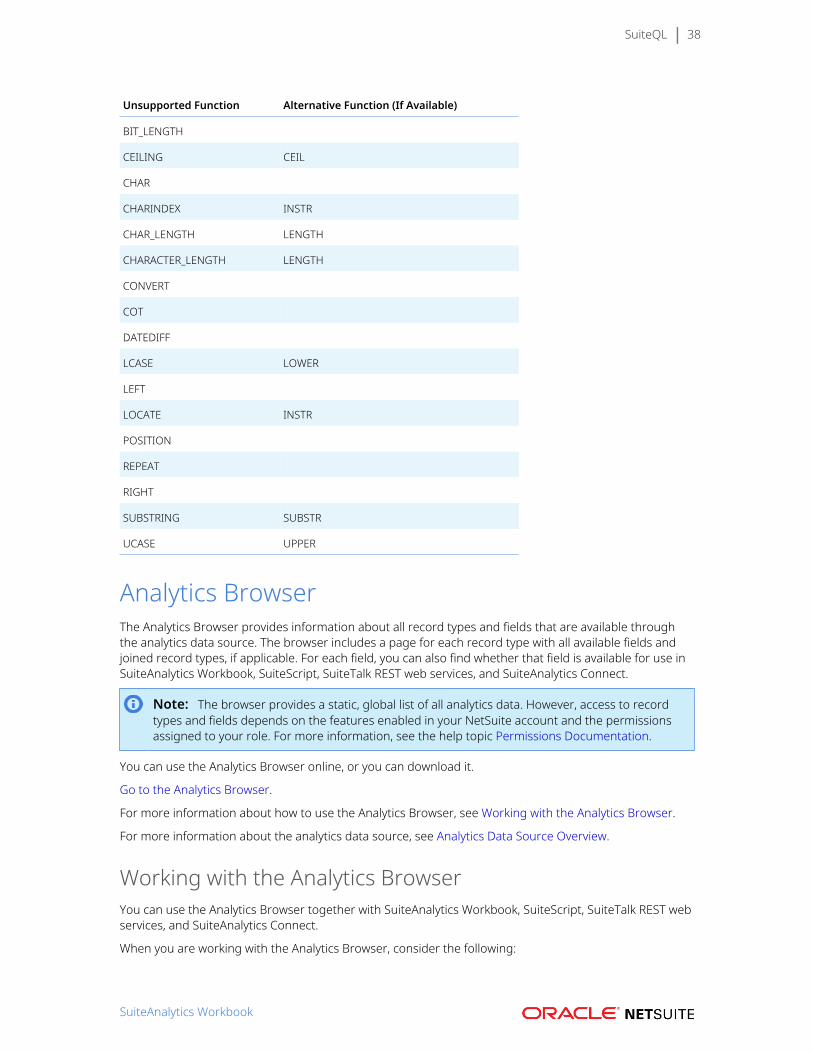
SuiteQL 38
Unsupported Function Alternative Function (If Available)
BIT_LENGTH
CEILING CEIL
CHAR
CHARINDEX INSTR
CHAR_LENGTH LENGTH
CHARACTER_LENGTH LENGTH
CONVERT
COT
DATEDIFF
LCASE LOWER
LEFT
LOCATE INSTR
POSITION
REPEAT
RIGHT
SUBSTRING SUBSTR
UCASE UPPER
Analytics BrowserThe Analytics Browser provides information about all record types and fields that are available throughthe analytics data source. The browser includes a page for each record type with all available fields andjoined record types, if applicable. For each field, you can also find whether that field is available for use inSuiteAnalytics Workbook, SuiteScript, SuiteTalk REST web services, and SuiteAnalytics Connect.
Note: The browser provides a static, global list of all analytics data. However, access to recordtypes and fields depends on the features enabled in your NetSuite account and the permissionsassigned to your role. For more information, see the help topic Permissions Documentation.
You can use the Analytics Browser online, or you can download it.
Go to the Analytics Browser.
For more information about how to use the Analytics Browser, see Working with the Analytics Browser.
For more information about the analytics data source, see Analytics Data Source Overview.
Working with the Analytics BrowserYou can use the Analytics Browser together with SuiteAnalytics Workbook, SuiteScript, SuiteTalk REST webservices, and SuiteAnalytics Connect.
When you are working with the Analytics Browser, consider the following:
SuiteAnalytics Workbook

Analytics Browser 39
■ Accessing the Analytics Browser■ Record Types in the Analytics Browser■ Finding Record Types in the Analytics Browser■ Record Type Page
Accessing the Analytics BrowserYou can use the Analytics Browser online, or you can download it.
■ Working Online■ Downloading the Analytics Browser
Working OnlineTo access the Analytics Browser online, use the following link:
Go to the Analytics Browser.
Downloading the Analytics BrowserIf you want to use the Analytics Browser when working offline, you must download the AnalyticsBrowser .zip file.
After downloading the .zip file to your local machine, extract the file contents and navigate to the scriptdirectory. To view the content of the browser, open the index.html file.
Record Types in the Analytics BrowserThe Analytics Browser provides two different record types that you can use in your query.
■ Regular record types - A regular record type is a set of fields that is part of the analytics data source.Each record type contains fields that let you query NetSuite data. Regular record types are listed byname in alphabetical order. Each regular record type includes a name and the ID that you need to usein your query.
■ Joined record types - A joined record type is the combination of data from two record types. Joinedrecord types provide advanced query capabilities to access data that you cannot retrieve using a singlerecord type. Some joined record types contain the ID only. In this case, they do not include a namebecause they are not displayed in the NetSuite user interface. Within the Analytics Browser, you canfind all joined record types and the ID of the foreign key fields in the -No label- key.
For more information about how to find the details of the record types that you want, see Finding RecordTypes in the Analytics Browser.
Finding Record Types in the Analytics BrowserThe index at the top of the browser window lets you navigate through all available record types. Youcan choose to browse the record types by name or ID. To find the record type that you want, see thefollowing:
■ Finding a Regular Record Type or Field■ Viewing a List of all Joined Record Types
Finding a Regular Record Type or FieldBy default, the Analytics Browser lists all record types by label, which is the name of the record type. Ifyou do not know the name of a record type, you can choose to find the record type by ID. After you selectwhether you want to see the list of record types by name or ID, use the index at the top of the browser
SuiteAnalytics Workbook
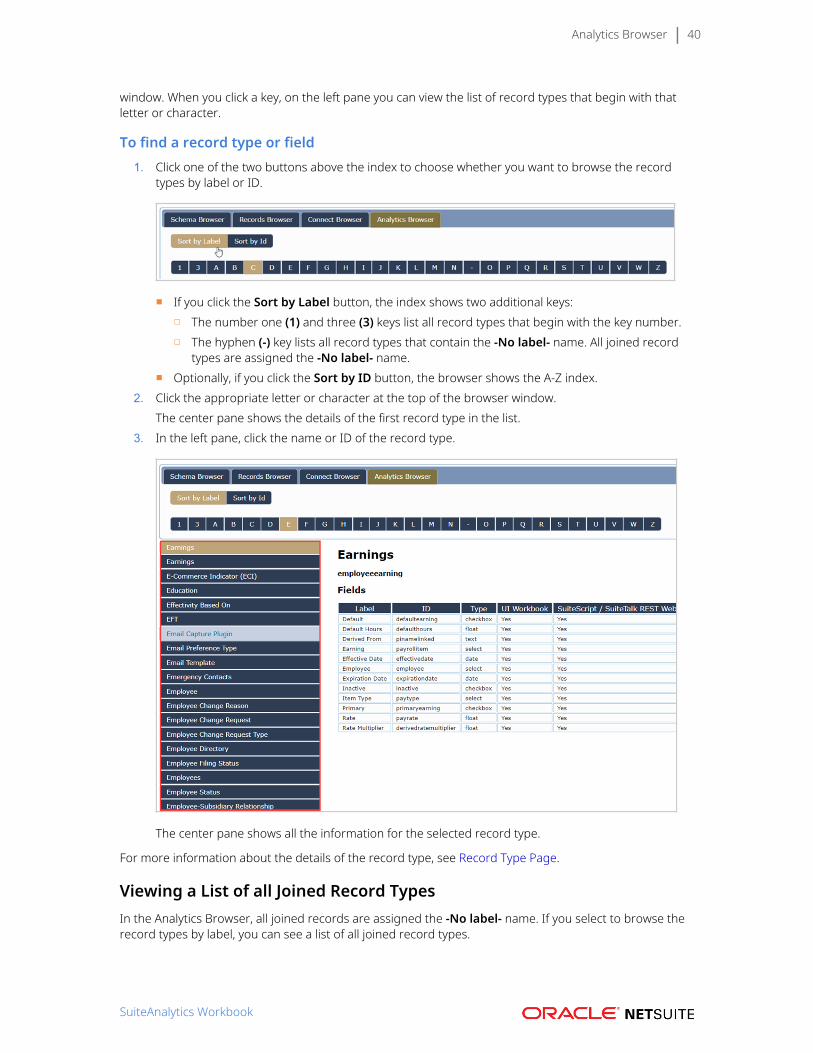
Analytics Browser 40
window. When you click a key, on the left pane you can view the list of record types that begin with thatletter or character.
To find a record type or field1. Click one of the two buttons above the index to choose whether you want to browse the record
types by label or ID.
■ If you click the Sort by Label button, the index shows two additional keys:□ The number one (1) and three (3) keys list all record types that begin with the key number.□ The hyphen (-) key lists all record types that contain the -No label- name. All joined record
types are assigned the -No label- name.■ Optionally, if you click the Sort by ID button, the browser shows the A-Z index.
2. Click the appropriate letter or character at the top of the browser window.The center pane shows the details of the first record type in the list.
3. In the left pane, click the name or ID of the record type.
The center pane shows all the information for the selected record type.
For more information about the details of the record type, see Record Type Page.
Viewing a List of all Joined Record TypesIn the Analytics Browser, all joined records are assigned the -No label- name. If you select to browse therecord types by label, you can see a list of all joined record types.
SuiteAnalytics Workbook
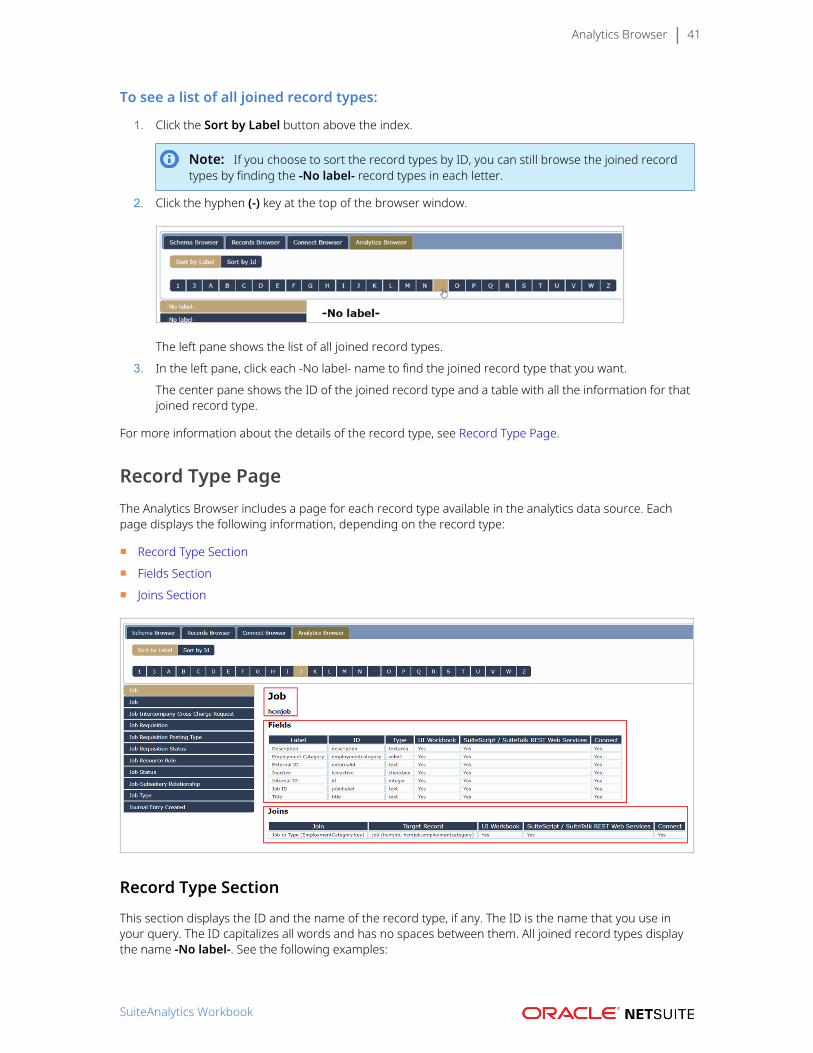
Analytics Browser 41
To see a list of all joined record types:
1. Click the Sort by Label button above the index.
Note: If you choose to sort the record types by ID, you can still browse the joined recordtypes by finding the -No label- record types in each letter.
2. Click the hyphen (-) key at the top of the browser window.
The left pane shows the list of all joined record types.
3. In the left pane, click each -No label- name to find the joined record type that you want.
The center pane shows the ID of the joined record type and a table with all the information for thatjoined record type.
For more information about the details of the record type, see Record Type Page.
Record Type PageThe Analytics Browser includes a page for each record type available in the analytics data source. Eachpage displays the following information, depending on the record type:
■ Record Type Section
■ Fields Section
■ Joins Section
Record Type Section
This section displays the ID and the name of the record type, if any. The ID is the name that you use inyour query. The ID capitalizes all words and has no spaces between them. All joined record types displaythe name -No label-. See the following examples:
SuiteAnalytics Workbook
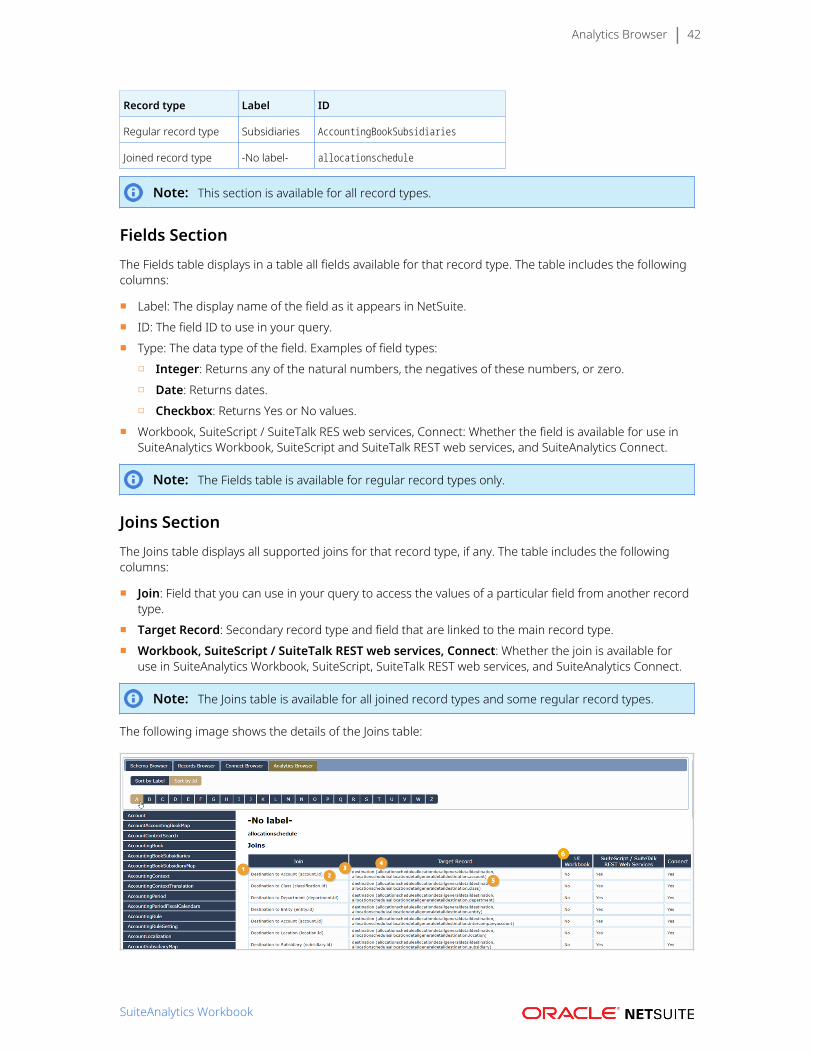
Analytics Browser 42
Record type Label ID
Regular record type Subsidiaries AccountingBookSubsidiaries
Joined record type -No label- allocationschedule
Note: This section is available for all record types.
Fields SectionThe Fields table displays in a table all fields available for that record type. The table includes the followingcolumns:
■ Label: The display name of the field as it appears in NetSuite.■ ID: The field ID to use in your query.■ Type: The data type of the field. Examples of field types:
□ Integer: Returns any of the natural numbers, the negatives of these numbers, or zero.□ Date: Returns dates.□ Checkbox: Returns Yes or No values.
■ Workbook, SuiteScript / SuiteTalk RES web services, Connect: Whether the field is available for use inSuiteAnalytics Workbook, SuiteScript and SuiteTalk REST web services, and SuiteAnalytics Connect.
Note: The Fields table is available for regular record types only.
Joins SectionThe Joins table displays all supported joins for that record type, if any. The table includes the followingcolumns:
■ Join: Field that you can use in your query to access the values of a particular field from another recordtype.
■ Target Record: Secondary record type and field that are linked to the main record type.■ Workbook, SuiteScript / SuiteTalk REST web services, Connect: Whether the join is available for
use in SuiteAnalytics Workbook, SuiteScript, SuiteTalk REST web services, and SuiteAnalytics Connect.
Note: The Joins table is available for all joined record types and some regular record types.
The following image shows the details of the Joins table:
SuiteAnalytics Workbook
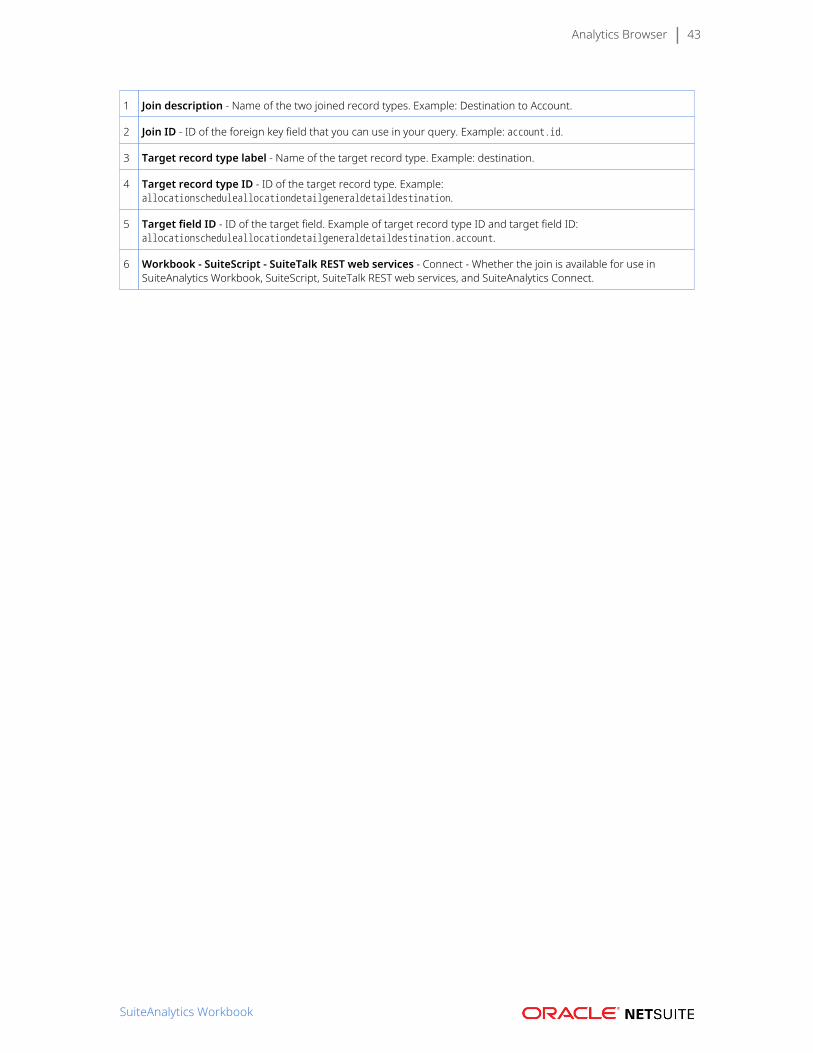
Analytics Browser 43
1 Join description - Name of the two joined record types. Example: Destination to Account.
2 Join ID - ID of the foreign key field that you can use in your query. Example: account.id.
3 Target record type label - Name of the target record type. Example: destination.
4 Target record type ID - ID of the target record type. Example:allocationscheduleallocationdetailgeneraldetaildestination.
5 Target field ID - ID of the target field. Example of target record type ID and target field ID:allocationscheduleallocationdetailgeneraldetaildestination.account.
6 Workbook - SuiteScript - SuiteTalk REST web services - Connect - Whether the join is available for use inSuiteAnalytics Workbook, SuiteScript, SuiteTalk REST web services, and SuiteAnalytics Connect.
SuiteAnalytics Workbook
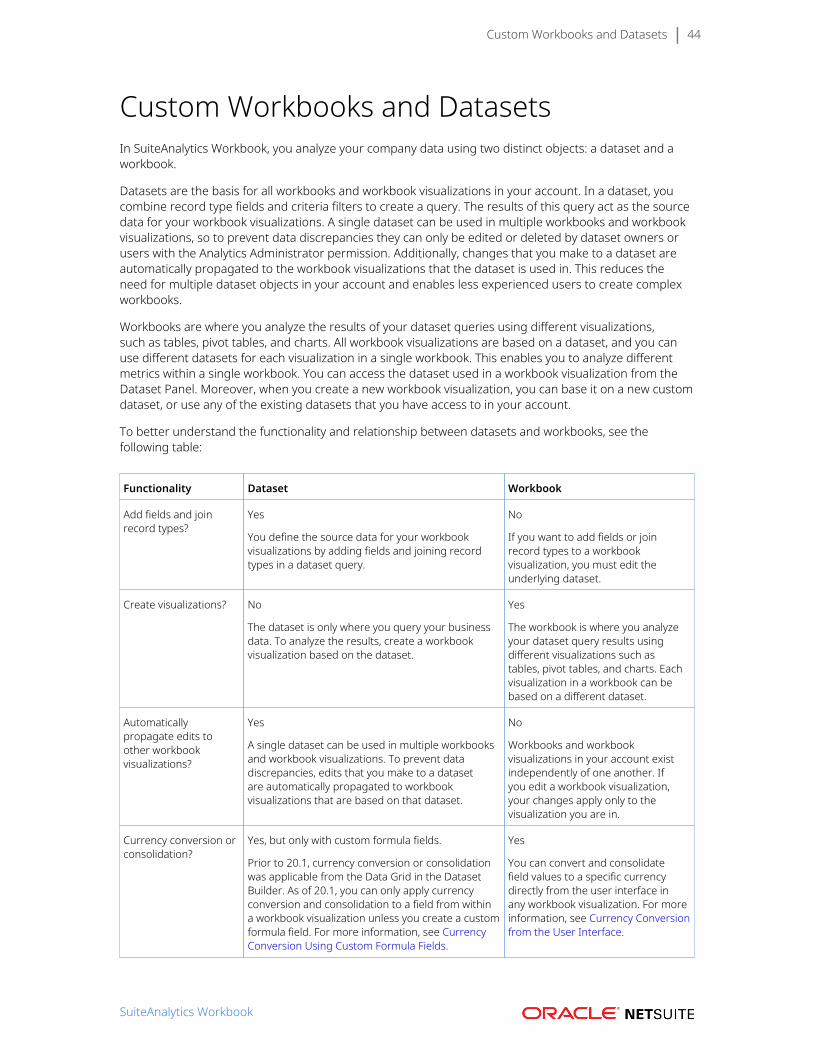
Custom Workbooks and Datasets 44
Custom Workbooks and DatasetsIn SuiteAnalytics Workbook, you analyze your company data using two distinct objects: a dataset and aworkbook.
Datasets are the basis for all workbooks and workbook visualizations in your account. In a dataset, youcombine record type fields and criteria filters to create a query. The results of this query act as the sourcedata for your workbook visualizations. A single dataset can be used in multiple workbooks and workbookvisualizations, so to prevent data discrepancies they can only be edited or deleted by dataset owners orusers with the Analytics Administrator permission. Additionally, changes that you make to a dataset areautomatically propagated to the workbook visualizations that the dataset is used in. This reduces theneed for multiple dataset objects in your account and enables less experienced users to create complexworkbooks.
Workbooks are where you analyze the results of your dataset queries using different visualizations,such as tables, pivot tables, and charts. All workbook visualizations are based on a dataset, and you canuse different datasets for each visualization in a single workbook. This enables you to analyze differentmetrics within a single workbook. You can access the dataset used in a workbook visualization from theDataset Panel. Moreover, when you create a new workbook visualization, you can base it on a new customdataset, or use any of the existing datasets that you have access to in your account.
To better understand the functionality and relationship between datasets and workbooks, see thefollowing table:
Functionality Dataset Workbook
Add fields and joinrecord types?
Yes
You define the source data for your workbookvisualizations by adding fields and joining recordtypes in a dataset query.
No
If you want to add fields or joinrecord types to a workbookvisualization, you must edit theunderlying dataset.
Create visualizations? No
The dataset is only where you query your businessdata. To analyze the results, create a workbookvisualization based on the dataset.
Yes
The workbook is where you analyzeyour dataset query results usingdifferent visualizations such astables, pivot tables, and charts. Eachvisualization in a workbook can bebased on a different dataset.
Automaticallypropagate edits toother workbookvisualizations?
Yes
A single dataset can be used in multiple workbooksand workbook visualizations. To prevent datadiscrepancies, edits that you make to a datasetare automatically propagated to workbookvisualizations that are based on that dataset.
No
Workbooks and workbookvisualizations in your account existindependently of one another. Ifyou edit a workbook visualization,your changes apply only to thevisualization you are in.
Currency conversion orconsolidation?
Yes, but only with custom formula fields.
Prior to 20.1, currency conversion or consolidationwas applicable from the Data Grid in the DatasetBuilder. As of 20.1, you can only apply currencyconversion and consolidation to a field from withina workbook visualization unless you create a customformula field. For more information, see CurrencyConversion Using Custom Formula Fields.
Yes
You can convert and consolidatefield values to a specific currencydirectly from the user interface inany workbook visualization. For moreinformation, see Currency Conversionfrom the User Interface.
SuiteAnalytics Workbook
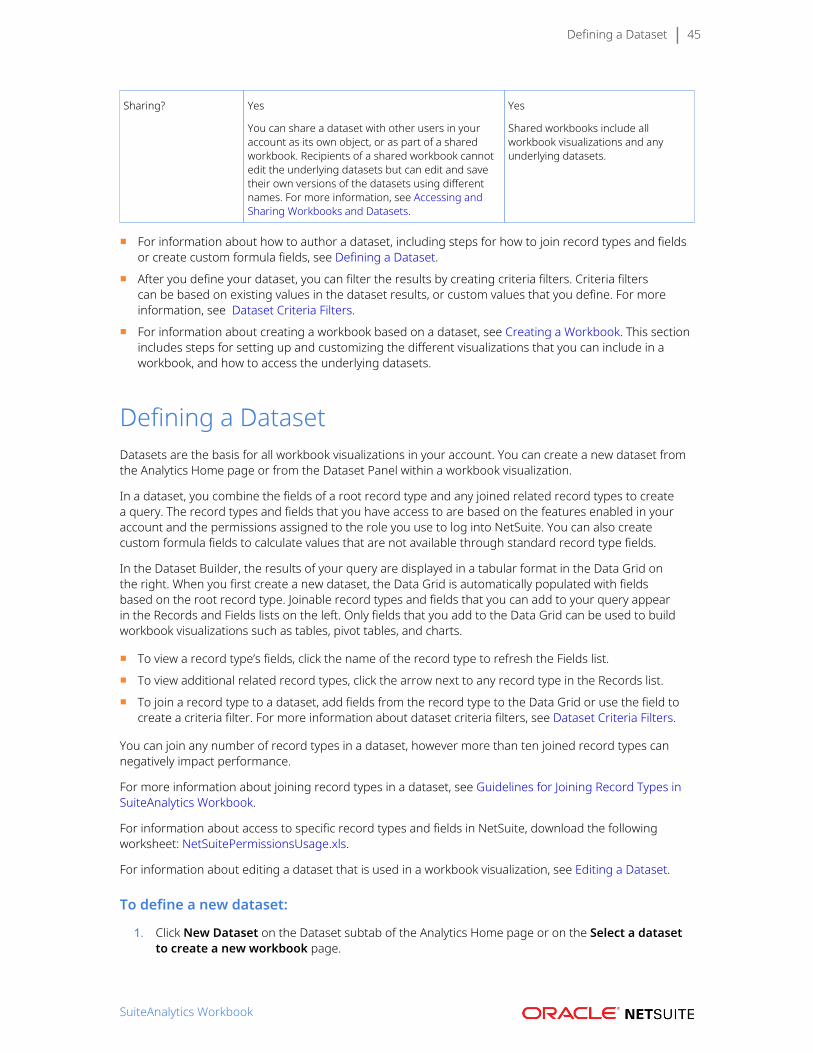
Defining a Dataset 45
Sharing? Yes
You can share a dataset with other users in youraccount as its own object, or as part of a sharedworkbook. Recipients of a shared workbook cannotedit the underlying datasets but can edit and savetheir own versions of the datasets using differentnames. For more information, see Accessing andSharing Workbooks and Datasets.
Yes
Shared workbooks include allworkbook visualizations and anyunderlying datasets.
■ For information about how to author a dataset, including steps for how to join record types and fieldsor create custom formula fields, see Defining a Dataset.
■ After you define your dataset, you can filter the results by creating criteria filters. Criteria filterscan be based on existing values in the dataset results, or custom values that you define. For moreinformation, see Dataset Criteria Filters.
■ For information about creating a workbook based on a dataset, see Creating a Workbook. This sectionincludes steps for setting up and customizing the different visualizations that you can include in aworkbook, and how to access the underlying datasets.
Defining a DatasetDatasets are the basis for all workbook visualizations in your account. You can create a new dataset fromthe Analytics Home page or from the Dataset Panel within a workbook visualization.
In a dataset, you combine the fields of a root record type and any joined related record types to createa query. The record types and fields that you have access to are based on the features enabled in youraccount and the permissions assigned to the role you use to log into NetSuite. You can also createcustom formula fields to calculate values that are not available through standard record type fields.
In the Dataset Builder, the results of your query are displayed in a tabular format in the Data Grid onthe right. When you first create a new dataset, the Data Grid is automatically populated with fieldsbased on the root record type. Joinable record types and fields that you can add to your query appearin the Records and Fields lists on the left. Only fields that you add to the Data Grid can be used to buildworkbook visualizations such as tables, pivot tables, and charts.
■ To view a record type’s fields, click the name of the record type to refresh the Fields list.
■ To view additional related record types, click the arrow next to any record type in the Records list.
■ To join a record type to a dataset, add fields from the record type to the Data Grid or use the field tocreate a criteria filter. For more information about dataset criteria filters, see Dataset Criteria Filters.
You can join any number of record types in a dataset, however more than ten joined record types cannegatively impact performance.
For more information about joining record types in a dataset, see Guidelines for Joining Record Types inSuiteAnalytics Workbook.
For information about access to specific record types and fields in NetSuite, download the followingworksheet: NetSuitePermissionsUsage.xls.
For information about editing a dataset that is used in a workbook visualization, see Editing a Dataset.
To define a new dataset:
1. Click New Dataset on the Dataset subtab of the Analytics Home page or on the Select a datasetto create a new workbook page.
SuiteAnalytics Workbook
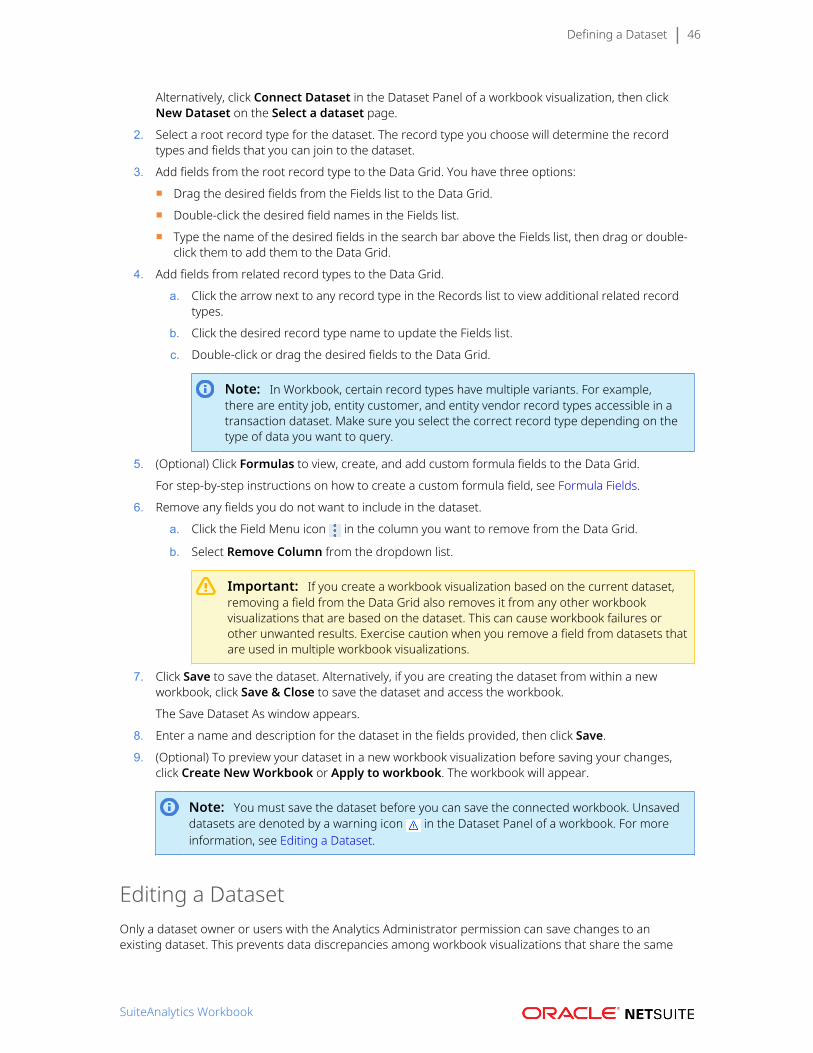
Defining a Dataset 46
Alternatively, click Connect Dataset in the Dataset Panel of a workbook visualization, then clickNew Dataset on the Select a dataset page.
2. Select a root record type for the dataset. The record type you choose will determine the recordtypes and fields that you can join to the dataset.
3. Add fields from the root record type to the Data Grid. You have three options:
■ Drag the desired fields from the Fields list to the Data Grid.
■ Double-click the desired field names in the Fields list.
■ Type the name of the desired fields in the search bar above the Fields list, then drag or double-click them to add them to the Data Grid.
4. Add fields from related record types to the Data Grid.
a. Click the arrow next to any record type in the Records list to view additional related recordtypes.
b. Click the desired record type name to update the Fields list.
c. Double-click or drag the desired fields to the Data Grid.
Note: In Workbook, certain record types have multiple variants. For example,there are entity job, entity customer, and entity vendor record types accessible in atransaction dataset. Make sure you select the correct record type depending on thetype of data you want to query.
5. (Optional) Click Formulas to view, create, and add custom formula fields to the Data Grid.
For step-by-step instructions on how to create a custom formula field, see Formula Fields.
6. Remove any fields you do not want to include in the dataset.
a. Click the Field Menu icon in the column you want to remove from the Data Grid.
b. Select Remove Column from the dropdown list.
Important: If you create a workbook visualization based on the current dataset,removing a field from the Data Grid also removes it from any other workbookvisualizations that are based on the dataset. This can cause workbook failures orother unwanted results. Exercise caution when you remove a field from datasets thatare used in multiple workbook visualizations.
7. Click Save to save the dataset. Alternatively, if you are creating the dataset from within a newworkbook, click Save & Close to save the dataset and access the workbook.
The Save Dataset As window appears.
8. Enter a name and description for the dataset in the fields provided, then click Save.
9. (Optional) To preview your dataset in a new workbook visualization before saving your changes,click Create New Workbook or Apply to workbook. The workbook will appear.
Note: You must save the dataset before you can save the connected workbook. Unsaveddatasets are denoted by a warning icon in the Dataset Panel of a workbook. For moreinformation, see Editing a Dataset.
Editing a DatasetOnly a dataset owner or users with the Analytics Administrator permission can save changes to anexisting dataset. This prevents data discrepancies among workbook visualizations that share the same
SuiteAnalytics Workbook
Defining a Dataset 47
dataset. Users with whom a dataset is shared can edit the dataset but must save it under a new name.Additionally, all users with access to a dataset can edit it and preview their changes in a workbook to seehow they will affect their workbook visualizations. This enables you to create a single dataset for multipleusers with different use cases.
To edit a dataset that you own:
1. Click the dataset or workbook name on the Analytics Home page. To quickly filter the availableoptions, select My Workbooks or My Datasets in the dropdown list of either the Workbooks orDatasets subtabs.
2. Edit the dataset. For information, see Defining a Dataset.
3. Click Save. Alternatively, if you accessed the dataset through a connected workbook, click Save &Close to save your changes and open the workbook.
4. (Optional) Click Create New Workbook or Apply to workbook to preview your changes in aworkbook visualization before saving the dataset .
The workbook will appear with a warning icon next to the dataset name, denoting an unsaveddataset.
5. If you are satisfied with your changes, click the arrow next to the dataset name and select SaveChanges.
If you are not satisfied, click the arrow and select Open Dataset to continue editing the dataset, orDiscard Changes.
Important: Remember that changes you save to your datasets are automaticallypropagated to any workbook visualizations based on the dataset, including visualizationscreated by other users in other workbooks. This can drastically change the associatedworkbook visualizations so if you are not sure about the impact of your changes, considersaving the dataset using a different name.
To edit a dataset that has been shared with you:
1. Click the dataset or workbook name on the Analytics Home page. To quickly filter the availableoptions, select Shared with me in the dropdown list of either the Workbooks or Datasets subtabs.
2. Edit the dataset. For more information, see Defining a Dataset.
3. Click Save As.
The Save Dataset As window appears.
4. Enter a name and description for the dataset in the fields provided, then click Save.
5. (Optional) Click Create New Workbook or Apply to workbook to preview your changes in aworkbook.
The workbook will appear with a warning icon next to the dataset name, denoting an unsaveddataset.
6. If you are satisfied with your changes, click the arrow next to the dataset name and select OpenDataset to save it using a new name.
Formula FieldsIn SuiteAnalytics Workbook, you can create custom formula fields to calculate values that are not availablethrough standard record fields. You can add formula fields to your datasets on the Data Grid and use
SuiteAnalytics Workbook
Defining a Dataset 48
them to define criteria filters. You can also use them in any workbook visualizations that are based on thedataset.
The values of custom formula fields are updated each time you refresh the dataset or the connectedworkbook visualizations. Currently, you cannot create custom formula fields based on existing formulafields.
To create a custom formula field, you combine NetSuite fields and SQL formula functions in a formuladefinition. You can also customize some fields by using formula context values such as #converted. Whenyou define a custom formula field, you must also select an output type for the formula, depending onthe fields, functions, and context values you include in your definition. Workbook supports the followingformula output types:
■ Boolean- Returns True, False, or NULL values
■ Date- Returns day, month, and year values
■ Datetime- Returns day, month, year, hour, minute, and second values
■ Float- Returns values that include a decimal, such as currency values
■ Integer- Returns values that are in whole numbers only, such count values
■ String- Returns fixed string character values, such as names
■ Clobtext- Returns long unicode character strings, such as item descriptions
■ Percent- Returns numeric values as percentages
■ Duration- Returns hour and minute values, such as hours worked
Knowledge of SQL will help you to fully leverage the supported SQL functions when you are defininga new formula. To read a description of each SQL function currently supported in the formula builder,click the Functions subtab of the Formula Field window. From the Functions subtab, you can also add asample formula definition for each of the listed functions. Use this feature if you are not sure about whichfunction to use in your formula definitions.
For more information about SQL formula functions, see the help topic SQL Expressions.
For more information about how to use formula fields, see Creating Formula Fields in SuiteAnalyticsWorkbook.
For sample formulas you can create, see Sample Formulas.
Creating Formula Fields in SuiteAnalytics WorkbookYou can customize formula fields by using SQL functions and context values. After you create formulafields, you can use them in your datasets and workbook visualizations. When you are working with customformula fields, consider the following:
■ Creating a Custom Formula Field in SuiteAnalytics Workbook
■ Creating Criteria Filters Using Formula Fields
■ Using Context Values in Formula Fields
■ Adding Formula Fields to a Workbook Visualization
Creating a Custom Formula Field in SuiteAnalytics Workbook
In the following example, you create a formula field that converts date values to a different format.Remember that the Formula Field window includes only fields from the root record type on the datasetand any fields from related record types that have been added to the Data Grid.
SuiteAnalytics Workbook
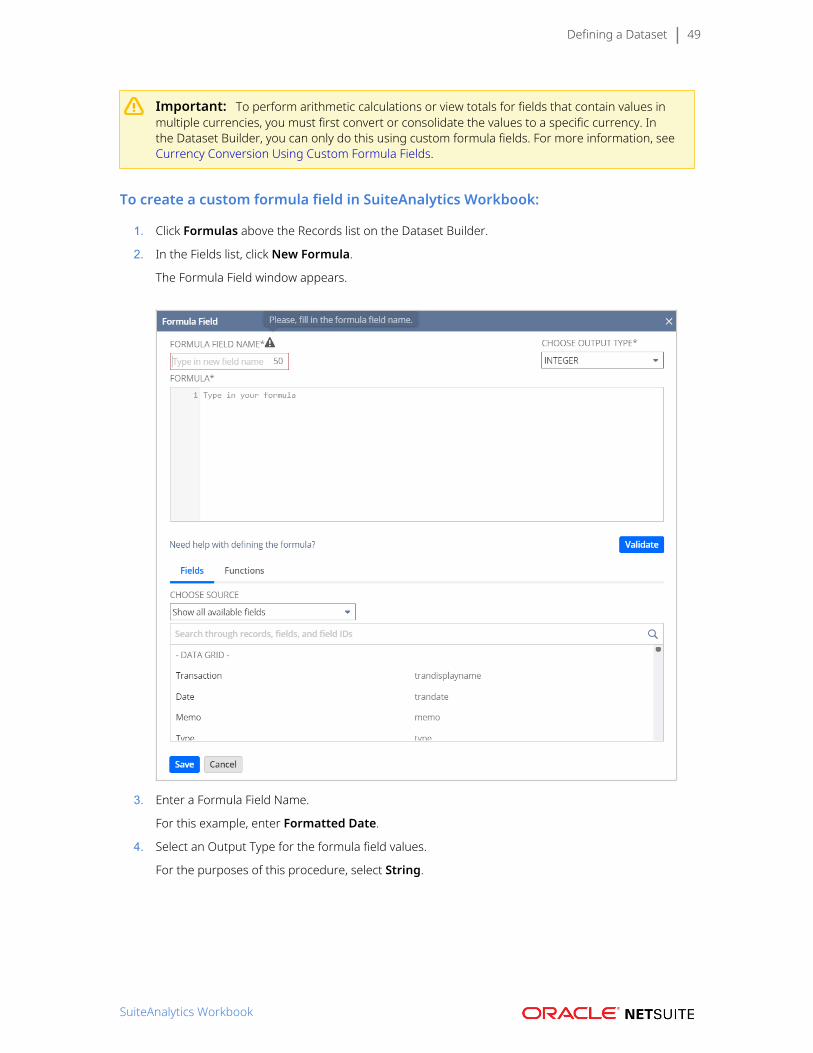
Defining a Dataset 49
Important: To perform arithmetic calculations or view totals for fields that contain values inmultiple currencies, you must first convert or consolidate the values to a specific currency. Inthe Dataset Builder, you can only do this using custom formula fields. For more information, seeCurrency Conversion Using Custom Formula Fields.
To create a custom formula field in SuiteAnalytics Workbook:
1. Click Formulas above the Records list on the Dataset Builder.
2. In the Fields list, click New Formula.
The Formula Field window appears.
3. Enter a Formula Field Name.
For this example, enter Formatted Date.
4. Select an Output Type for the formula field values.
For the purposes of this procedure, select String.
SuiteAnalytics Workbook
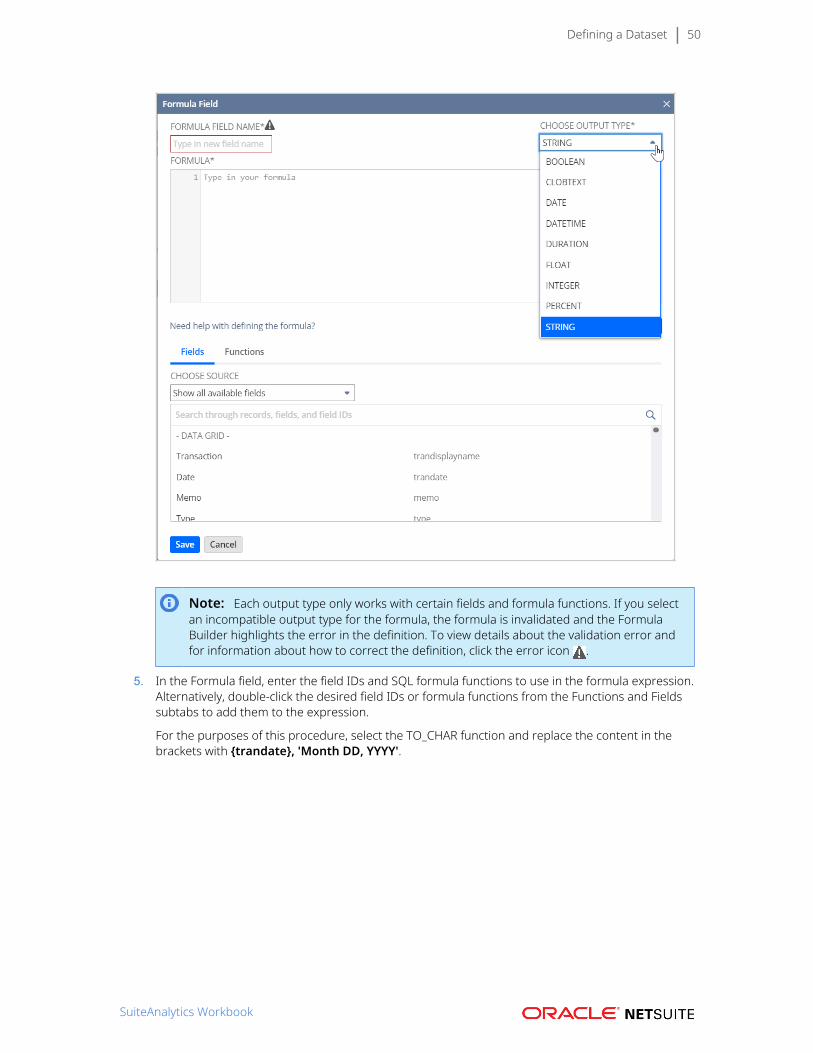
Defining a Dataset 50
Note: Each output type only works with certain fields and formula functions. If you selectan incompatible output type for the formula, the formula is invalidated and the FormulaBuilder highlights the error in the definition. To view details about the validation error andfor information about how to correct the definition, click the error icon .
5. In the Formula field, enter the field IDs and SQL formula functions to use in the formula expression.Alternatively, double-click the desired field IDs or formula functions from the Functions and Fieldssubtabs to add them to the expression.
For the purposes of this procedure, select the TO_CHAR function and replace the content in thebrackets with {trandate}, 'Month DD, YYYY'.
SuiteAnalytics Workbook
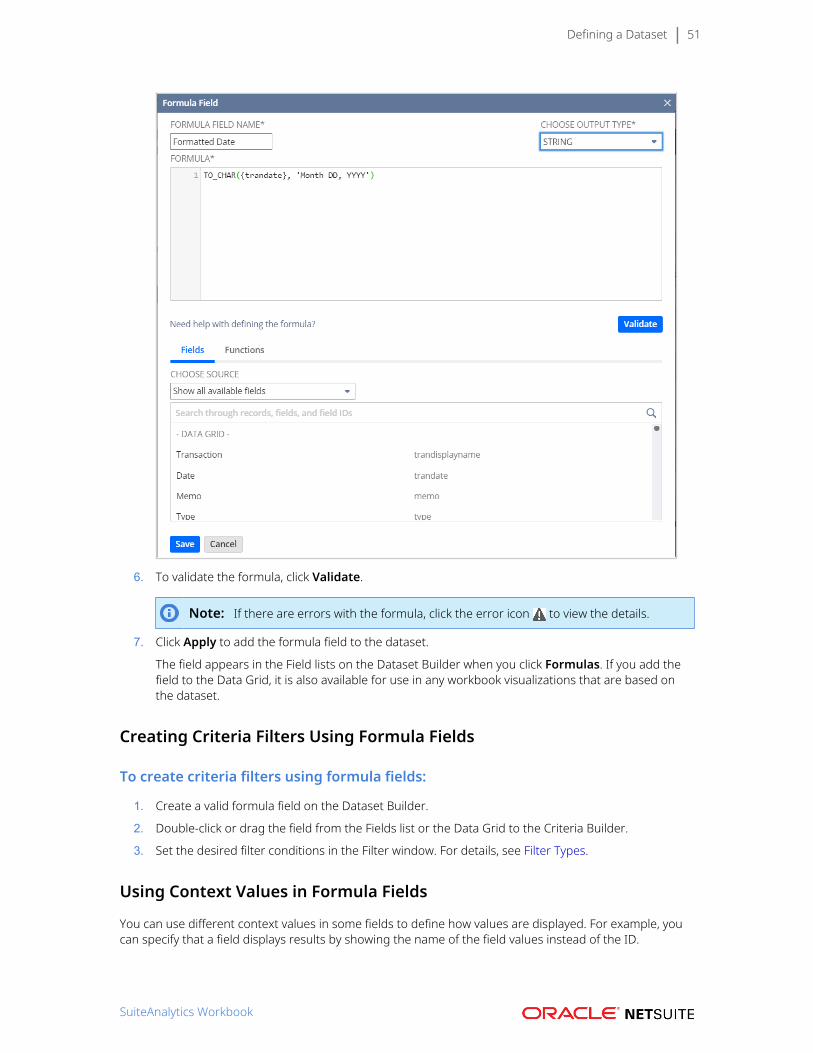
Defining a Dataset 51
6. To validate the formula, click Validate.
Note: If there are errors with the formula, click the error icon to view the details.
7. Click Apply to add the formula field to the dataset.
The field appears in the Field lists on the Dataset Builder when you click Formulas. If you add thefield to the Data Grid, it is also available for use in any workbook visualizations that are based onthe dataset.
Creating Criteria Filters Using Formula Fields
To create criteria filters using formula fields:
1. Create a valid formula field on the Dataset Builder.
2. Double-click or drag the field from the Fields list or the Data Grid to the Criteria Builder.
3. Set the desired filter conditions in the Filter window. For details, see Filter Types.
Using Context Values in Formula Fields
You can use different context values in some fields to define how values are displayed. For example, youcan specify that a field displays results by showing the name of the field values instead of the ID.
SuiteAnalytics Workbook
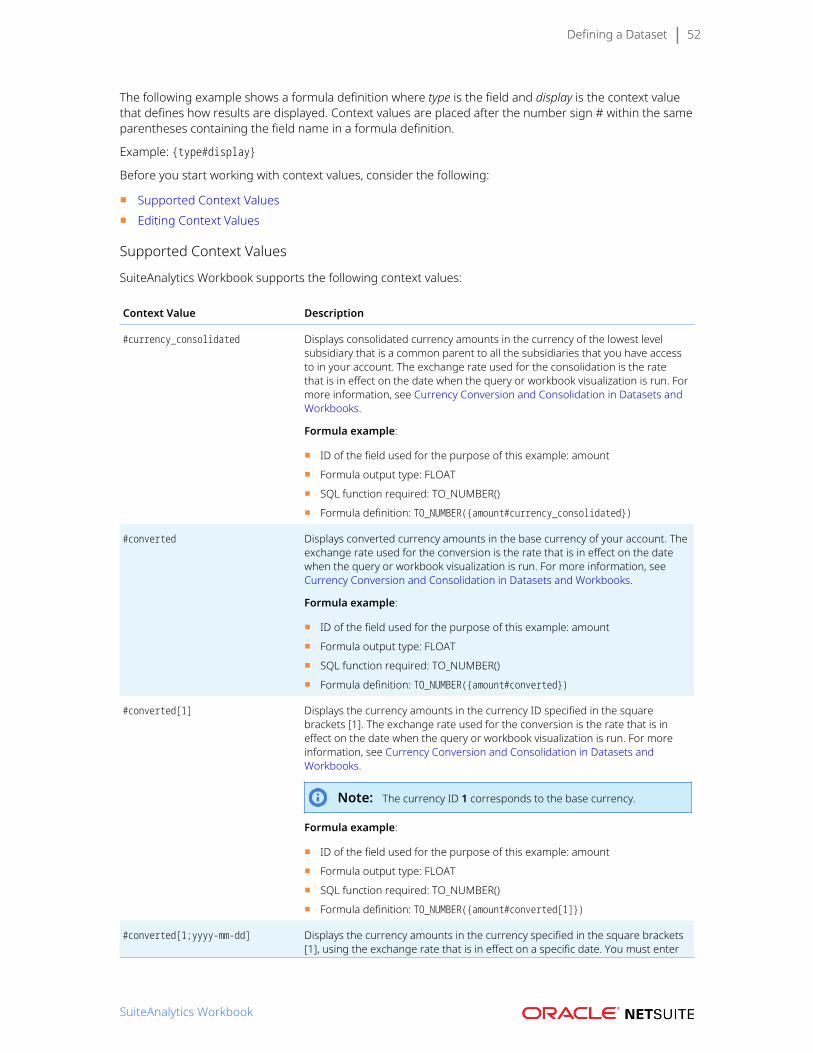
Defining a Dataset 52
The following example shows a formula definition where type is the field and display is the context valuethat defines how results are displayed. Context values are placed after the number sign # within the sameparentheses containing the field name in a formula definition.
Example: {type#display}
Before you start working with context values, consider the following:
■ Supported Context Values■ Editing Context Values
Supported Context Values
SuiteAnalytics Workbook supports the following context values:
Context Value Description
#currency_consolidated Displays consolidated currency amounts in the currency of the lowest levelsubsidiary that is a common parent to all the subsidiaries that you have accessto in your account. The exchange rate used for the consolidation is the ratethat is in effect on the date when the query or workbook visualization is run. Formore information, see Currency Conversion and Consolidation in Datasets andWorkbooks.
Formula example:
■ ID of the field used for the purpose of this example: amount
■ Formula output type: FLOAT
■ SQL function required: TO_NUMBER()
■ Formula definition: TO_NUMBER({amount#currency_consolidated})
#converted Displays converted currency amounts in the base currency of your account. Theexchange rate used for the conversion is the rate that is in effect on the datewhen the query or workbook visualization is run. For more information, seeCurrency Conversion and Consolidation in Datasets and Workbooks.
Formula example:
■ ID of the field used for the purpose of this example: amount
■ Formula output type: FLOAT
■ SQL function required: TO_NUMBER()
■ Formula definition: TO_NUMBER({amount#converted})
#converted[1] Displays the currency amounts in the currency ID specified in the squarebrackets [1]. The exchange rate used for the conversion is the rate that is ineffect on the date when the query or workbook visualization is run. For moreinformation, see Currency Conversion and Consolidation in Datasets andWorkbooks.
Note: The currency ID 1 corresponds to the base currency.
Formula example:
■ ID of the field used for the purpose of this example: amount
■ Formula output type: FLOAT
■ SQL function required: TO_NUMBER()
■ Formula definition: TO_NUMBER({amount#converted[1]})
#converted[1;yyyy-mm-dd] Displays the currency amounts in the currency specified in the square brackets[1], using the exchange rate that is in effect on a specific date. You must enter
SuiteAnalytics Workbook
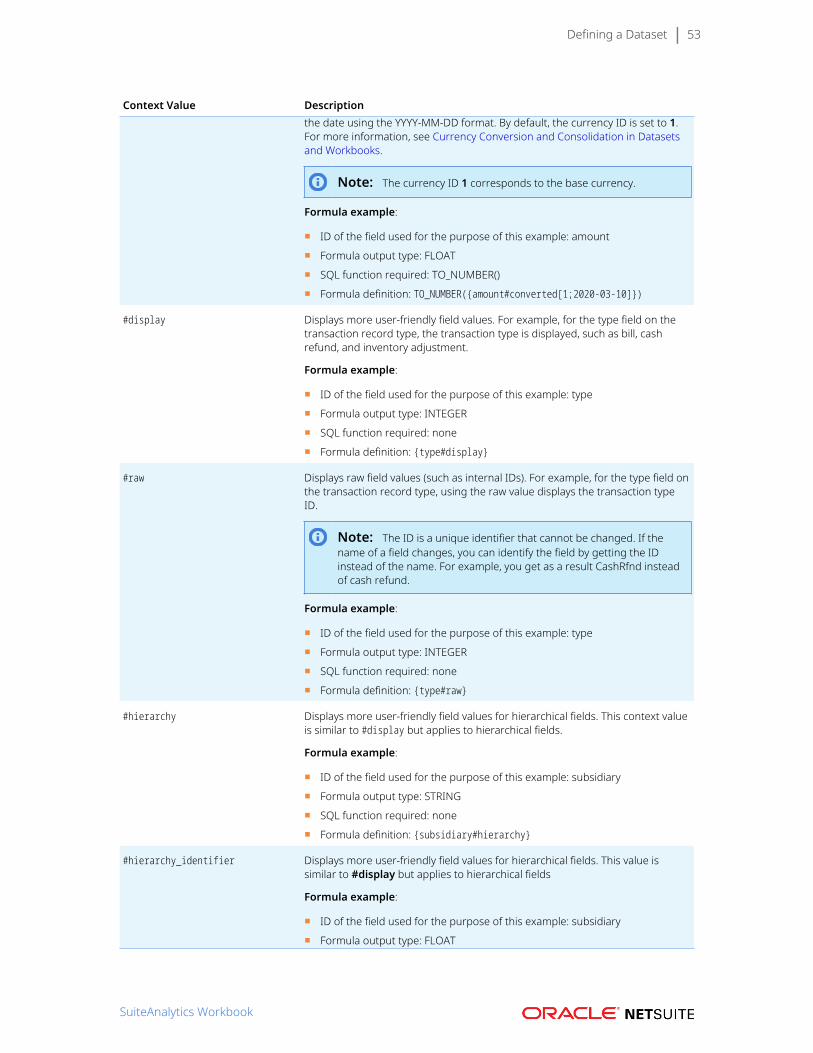
Defining a Dataset 53
Context Value Descriptionthe date using the YYYY-MM-DD format. By default, the currency ID is set to 1.For more information, see Currency Conversion and Consolidation in Datasetsand Workbooks.
Note: The currency ID 1 corresponds to the base currency.
Formula example:
■ ID of the field used for the purpose of this example: amount
■ Formula output type: FLOAT
■ SQL function required: TO_NUMBER()
■ Formula definition: TO_NUMBER({amount#converted[1;2020-03-10]})
#display Displays more user-friendly field values. For example, for the type field on thetransaction record type, the transaction type is displayed, such as bill, cashrefund, and inventory adjustment.
Formula example:
■ ID of the field used for the purpose of this example: type
■ Formula output type: INTEGER
■ SQL function required: none
■ Formula definition: {type#display}
#raw Displays raw field values (such as internal IDs). For example, for the type field onthe transaction record type, using the raw value displays the transaction typeID.
Note: The ID is a unique identifier that cannot be changed. If thename of a field changes, you can identify the field by getting the IDinstead of the name. For example, you get as a result CashRfnd insteadof cash refund.
Formula example:
■ ID of the field used for the purpose of this example: type
■ Formula output type: INTEGER
■ SQL function required: none
■ Formula definition: {type#raw}
#hierarchy Displays more user-friendly field values for hierarchical fields. This context valueis similar to #display but applies to hierarchical fields.
Formula example:
■ ID of the field used for the purpose of this example: subsidiary
■ Formula output type: STRING
■ SQL function required: none
■ Formula definition: {subsidiary#hierarchy}
#hierarchy_identifier Displays more user-friendly field values for hierarchical fields. This value issimilar to #display but applies to hierarchical fields
Formula example:
■ ID of the field used for the purpose of this example: subsidiary
■ Formula output type: FLOAT
SuiteAnalytics Workbook
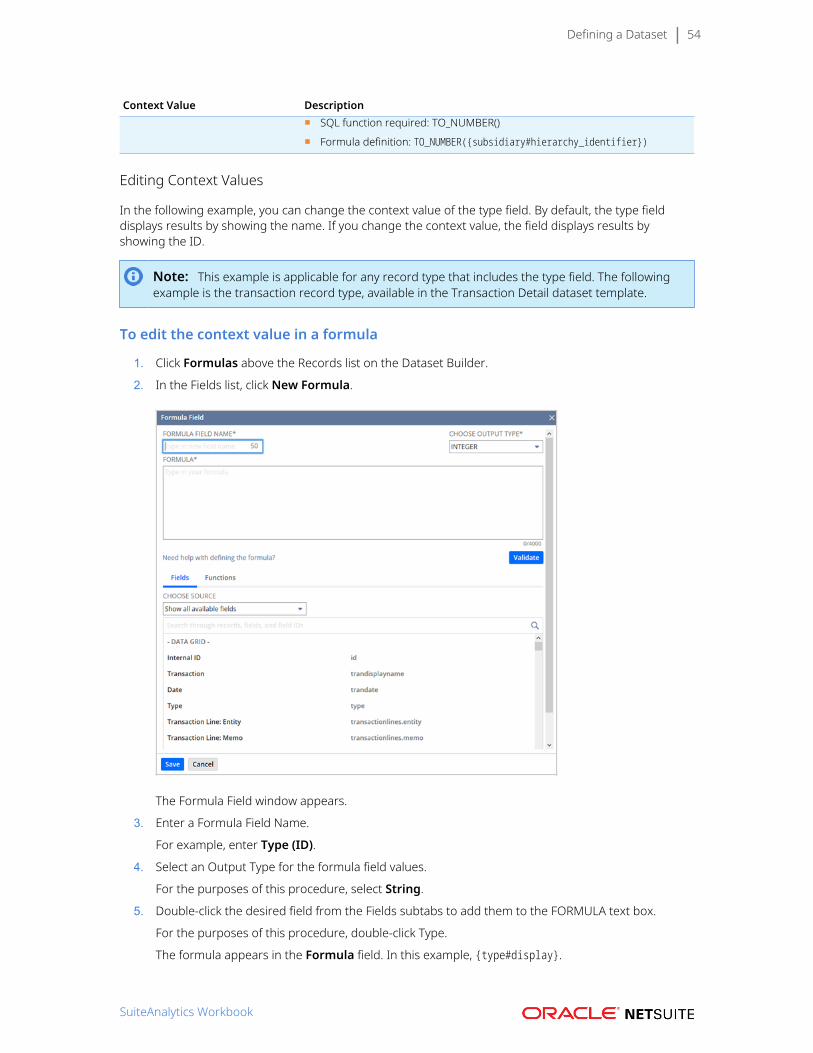
Defining a Dataset 54
Context Value Description■ SQL function required: TO_NUMBER()
■ Formula definition: TO_NUMBER({subsidiary#hierarchy_identifier})
Editing Context Values
In the following example, you can change the context value of the type field. By default, the type fielddisplays results by showing the name. If you change the context value, the field displays results byshowing the ID.
Note: This example is applicable for any record type that includes the type field. The followingexample is the transaction record type, available in the Transaction Detail dataset template.
To edit the context value in a formula
1. Click Formulas above the Records list on the Dataset Builder.
2. In the Fields list, click New Formula.
The Formula Field window appears.
3. Enter a Formula Field Name.
For example, enter Type (ID).
4. Select an Output Type for the formula field values.
For the purposes of this procedure, select String.
5. Double-click the desired field from the Fields subtabs to add them to the FORMULA text box.
For the purposes of this procedure, double-click Type.
The formula appears in the Formula field. In this example, {type#display}.
SuiteAnalytics Workbook
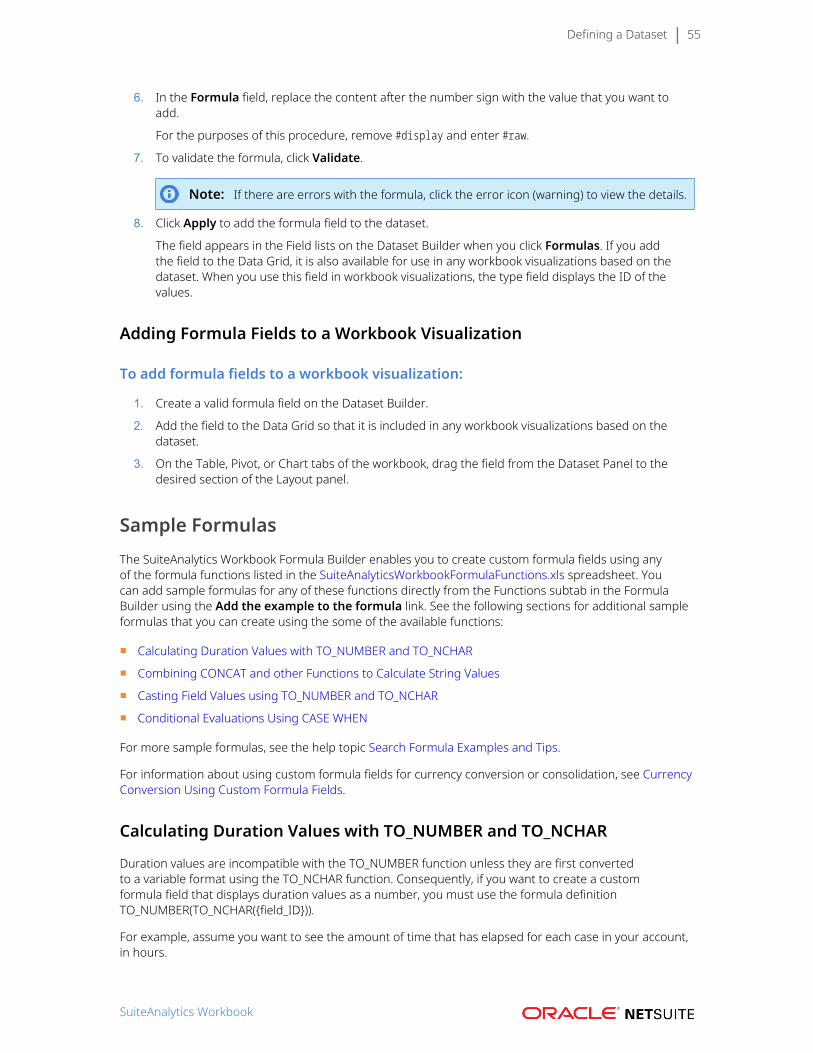
Defining a Dataset 55
6. In the Formula field, replace the content after the number sign with the value that you want toadd.
For the purposes of this procedure, remove #display and enter #raw.
7. To validate the formula, click Validate.
Note: If there are errors with the formula, click the error icon (warning) to view the details.
8. Click Apply to add the formula field to the dataset.
The field appears in the Field lists on the Dataset Builder when you click Formulas. If you addthe field to the Data Grid, it is also available for use in any workbook visualizations based on thedataset. When you use this field in workbook visualizations, the type field displays the ID of thevalues.
Adding Formula Fields to a Workbook Visualization
To add formula fields to a workbook visualization:
1. Create a valid formula field on the Dataset Builder.
2. Add the field to the Data Grid so that it is included in any workbook visualizations based on thedataset.
3. On the Table, Pivot, or Chart tabs of the workbook, drag the field from the Dataset Panel to thedesired section of the Layout panel.
Sample FormulasThe SuiteAnalytics Workbook Formula Builder enables you to create custom formula fields using anyof the formula functions listed in the SuiteAnalyticsWorkbookFormulaFunctions.xls spreadsheet. Youcan add sample formulas for any of these functions directly from the Functions subtab in the FormulaBuilder using the Add the example to the formula link. See the following sections for additional sampleformulas that you can create using the some of the available functions:
■ Calculating Duration Values with TO_NUMBER and TO_NCHAR
■ Combining CONCAT and other Functions to Calculate String Values
■ Casting Field Values using TO_NUMBER and TO_NCHAR
■ Conditional Evaluations Using CASE WHEN
For more sample formulas, see the help topic Search Formula Examples and Tips.
For information about using custom formula fields for currency conversion or consolidation, see CurrencyConversion Using Custom Formula Fields.
Calculating Duration Values with TO_NUMBER and TO_NCHAR
Duration values are incompatible with the TO_NUMBER function unless they are first convertedto a variable format using the TO_NCHAR function. Consequently, if you want to create a customformula field that displays duration values as a number, you must use the formula definitionTO_NUMBER(TO_NCHAR({field_ID})).
For example, assume you want to see the amount of time that has elapsed for each case in your account,in hours.
SuiteAnalytics Workbook
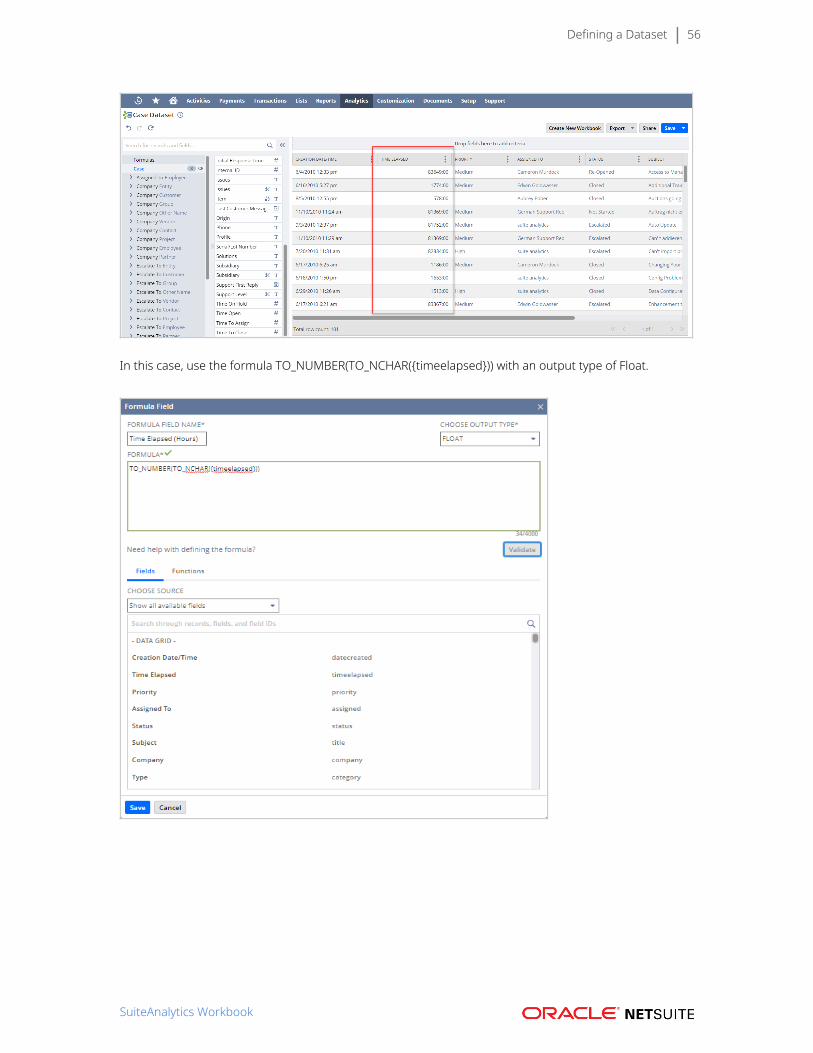
Defining a Dataset 56
In this case, use the formula TO_NUMBER(TO_NCHAR({timeelapsed})) with an output type of Float.
SuiteAnalytics Workbook
Defining a Dataset 57
Combining CONCAT and other Functions to Calculate String Values
You can combine the CONCAT function with other functions to calculate complex string values. Forexample, if you want to view the duration values for all the cases in your account in days and hours, youmust normalize the values with TO_NUMBER and TO_NCHAR, then concatenate them using the followingdefinition. The output type for this formula definition is STRING:
CONCAT(CONCAT('Days: ',TO_NCHAR(FLOOR(TO_NUMBER(TO_NCHAR({timeelapsed}/24))))),
CONCAT(' Hours: ',TO_NCHAR(MOD(TO_NUMBER(TO_NCHAR({timeelapsed})),24))))
SuiteAnalytics Workbook
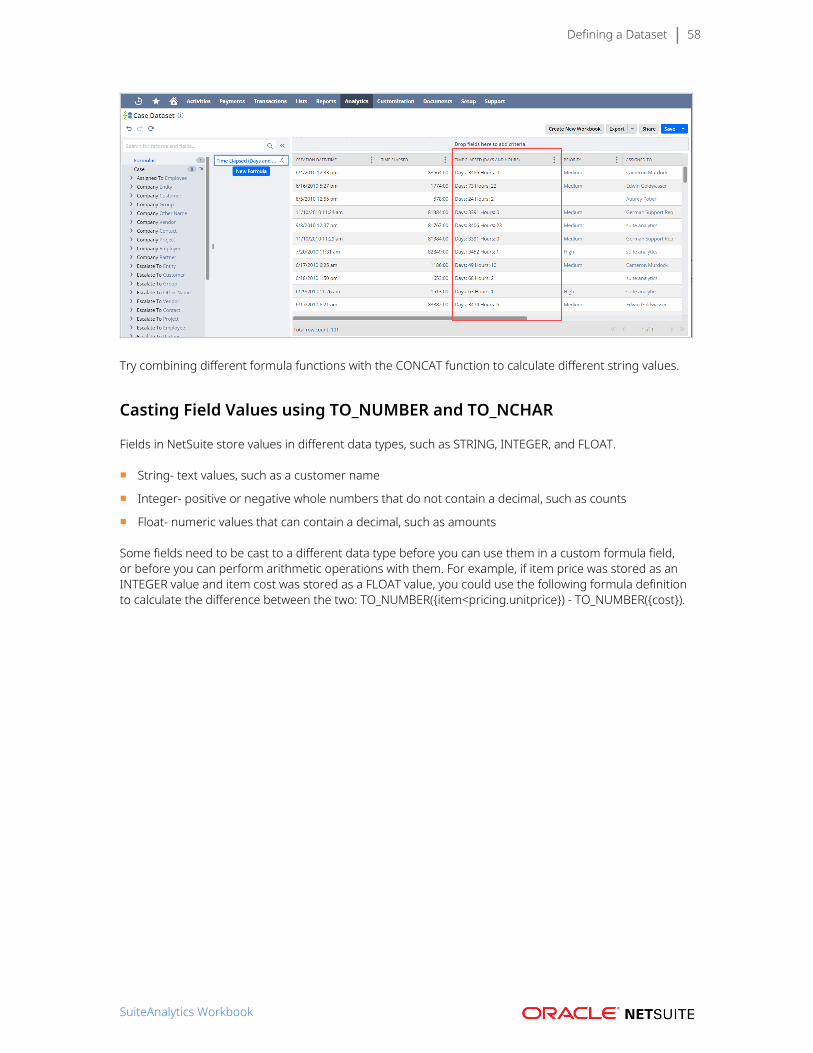
Defining a Dataset 58
Try combining different formula functions with the CONCAT function to calculate different string values.
Casting Field Values using TO_NUMBER and TO_NCHAR
Fields in NetSuite store values in different data types, such as STRING, INTEGER, and FLOAT.
■ String- text values, such as a customer name
■ Integer- positive or negative whole numbers that do not contain a decimal, such as counts
■ Float- numeric values that can contain a decimal, such as amounts
Some fields need to be cast to a different data type before you can use them in a custom formula field,or before you can perform arithmetic operations with them. For example, if item price was stored as anINTEGER value and item cost was stored as a FLOAT value, you could use the following formula definitionto calculate the difference between the two: TO_NUMBER({item<pricing.unitprice}) - TO_NUMBER({cost}).
SuiteAnalytics Workbook
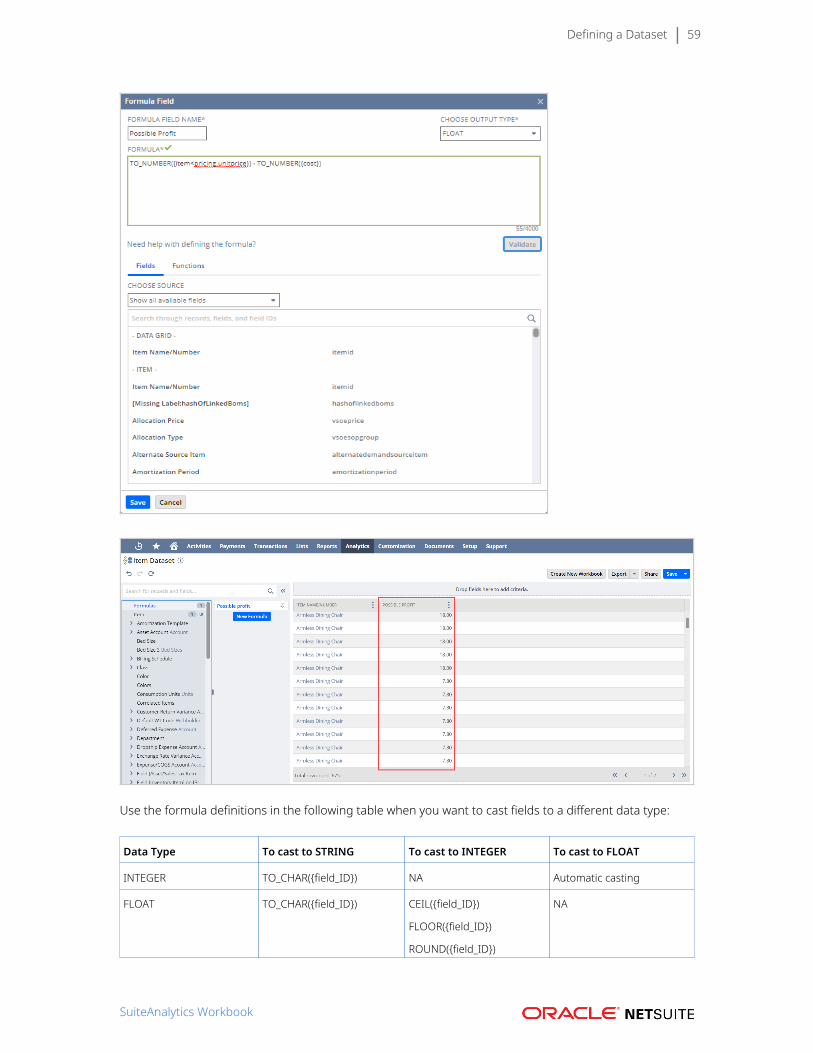
Defining a Dataset 59
Use the formula definitions in the following table when you want to cast fields to a different data type:
Data Type To cast to STRING To cast to INTEGER To cast to FLOAT
INTEGER TO_CHAR({field_ID}) NA Automatic casting
FLOAT TO_CHAR({field_ID}) CEIL({field_ID})
FLOOR({field_ID})
ROUND({field_ID})
NA
SuiteAnalytics Workbook

Defining a Dataset 60
TRUNC({field_ID})
BOOLEAN Automatic casting, returns ‘T’or ‘F’
CASE field WHEN ‘T’ THEN 1ELSE 0 END
CASE field WHEN ‘T’ THEN 1ELSE 0 END
DATE TO_CHAR({field_ID}) NA NA
DATETIME TO_CHAR({field_ID}) NA NA
PERCENT TO_CHAR({field_ID})
Returns values between 0and 1
NA TO_NUMBER({field_ID})
DURATION TO_CHAR({field_ID})
Returns FLOAT values, not inthe hours:minutes format
NA TO_NUMBER({field_ID})
STRING NA TO_NUMBER({field_ID})
Not recommended
TO_NUMBER({field_ID})
CURRENCY TO_CHAR({field_ID})
Returns values without thecurrency symbol
NA TO_NUMBER({field_ID})
CURRENCY_HIGH_PRECISION
TO_CHAR({field_ID})
Returns values without thecurrency symbol
NA TO_NUMBER({field_ID})
Conditional Evaluations Using CASE WHEN
You can perform conditional evaluations by creating a formula field using the CASE WHEN function. Inthese formulas, values that meet the conditions you set in the WHEN statement produce the results youdefine in the THEN statement. Values that do not meet the conditions in the WHEN statement producethe results that you define in the ELSE statement.
For example, if you want to determine the season that a transaction took place, you can use the followingformula definition:
CASE
WHEN EXTRACT(Month FROM {trandate})= 12 THEN 'winter'
WHEN EXTRACT(Month FROM {trandate})= 6 THEN 'summer'
ELSE 'it was fall or spring' END
The output type for this formula is STRING.
SuiteAnalytics Workbook
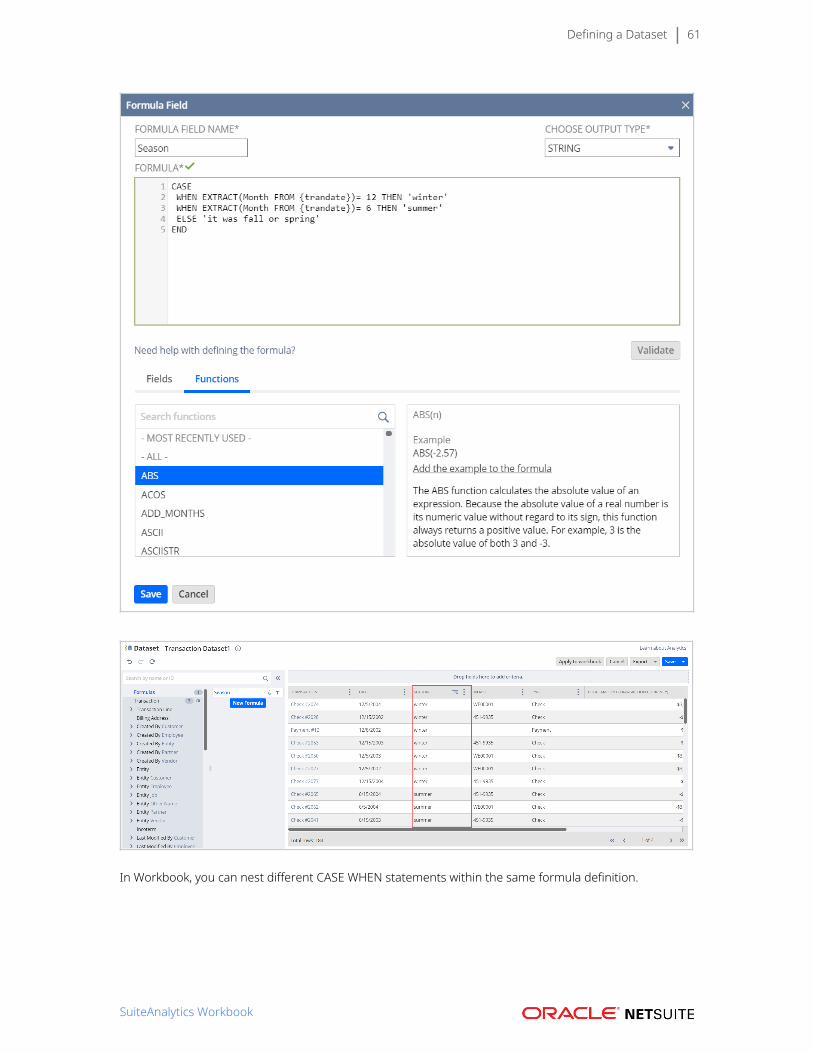
Defining a Dataset 61
In Workbook, you can nest different CASE WHEN statements within the same formula definition.
SuiteAnalytics Workbook
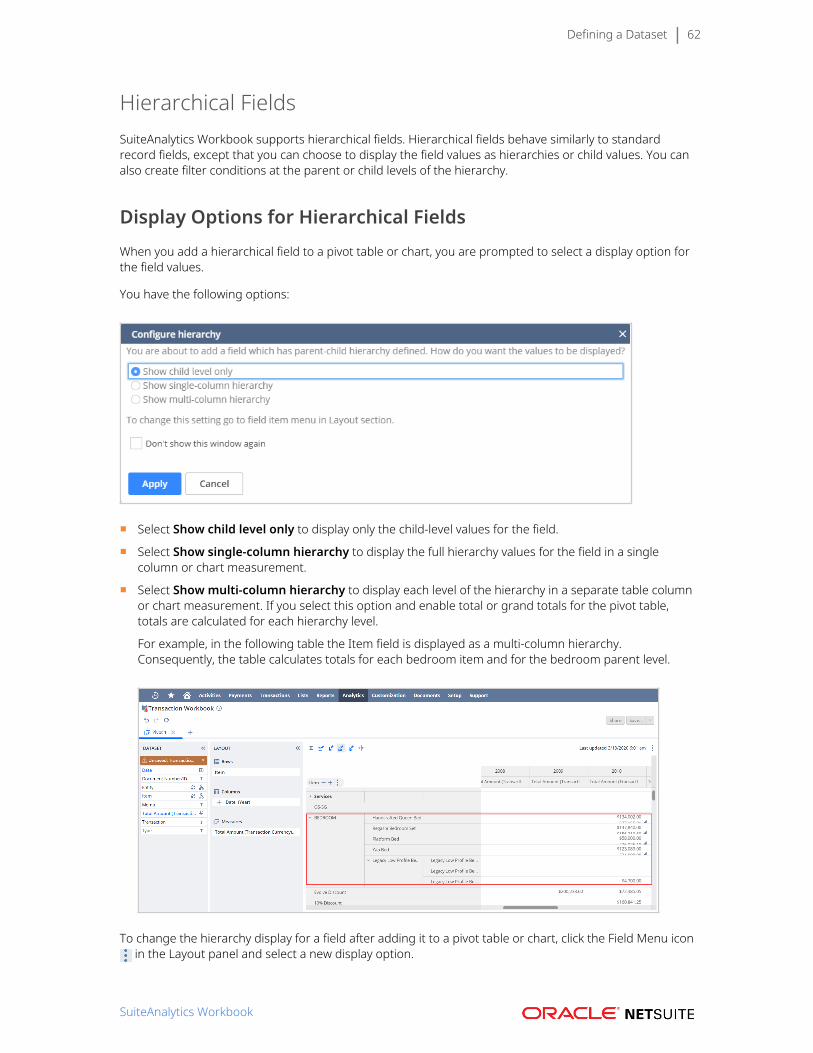
Defining a Dataset 62
Hierarchical FieldsSuiteAnalytics Workbook supports hierarchical fields. Hierarchical fields behave similarly to standardrecord fields, except that you can choose to display the field values as hierarchies or child values. You canalso create filter conditions at the parent or child levels of the hierarchy.
Display Options for Hierarchical FieldsWhen you add a hierarchical field to a pivot table or chart, you are prompted to select a display option forthe field values.
You have the following options:
■ Select Show child level only to display only the child-level values for the field.
■ Select Show single-column hierarchy to display the full hierarchy values for the field in a singlecolumn or chart measurement.
■ Select Show multi-column hierarchy to display each level of the hierarchy in a separate table columnor chart measurement. If you select this option and enable total or grand totals for the pivot table,totals are calculated for each hierarchy level.
For example, in the following table the Item field is displayed as a multi-column hierarchy.Consequently, the table calculates totals for each bedroom item and for the bedroom parent level.
To change the hierarchy display for a field after adding it to a pivot table or chart, click the Field Menu icon in the Layout panel and select a new display option.
SuiteAnalytics Workbook
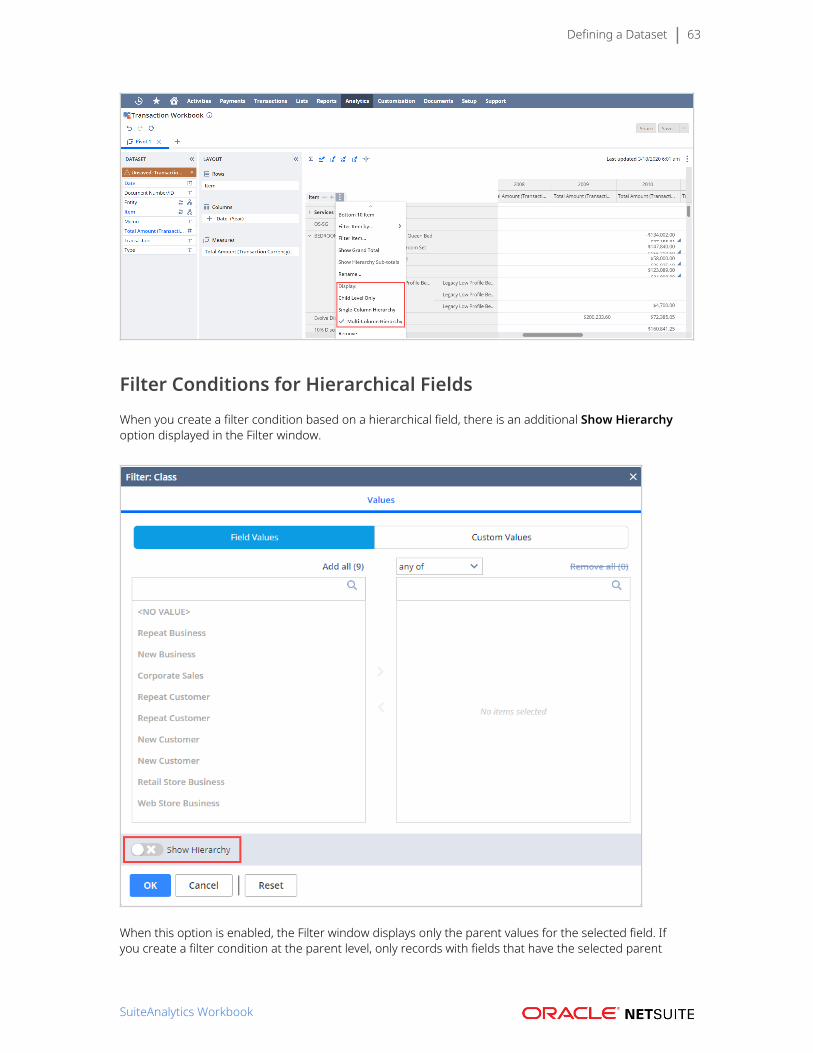
Defining a Dataset 63
Filter Conditions for Hierarchical FieldsWhen you create a filter condition based on a hierarchical field, there is an additional Show Hierarchyoption displayed in the Filter window.
When this option is enabled, the Filter window displays only the parent values for the selected field. Ifyou create a filter condition at the parent level, only records with fields that have the selected parent
SuiteAnalytics Workbook
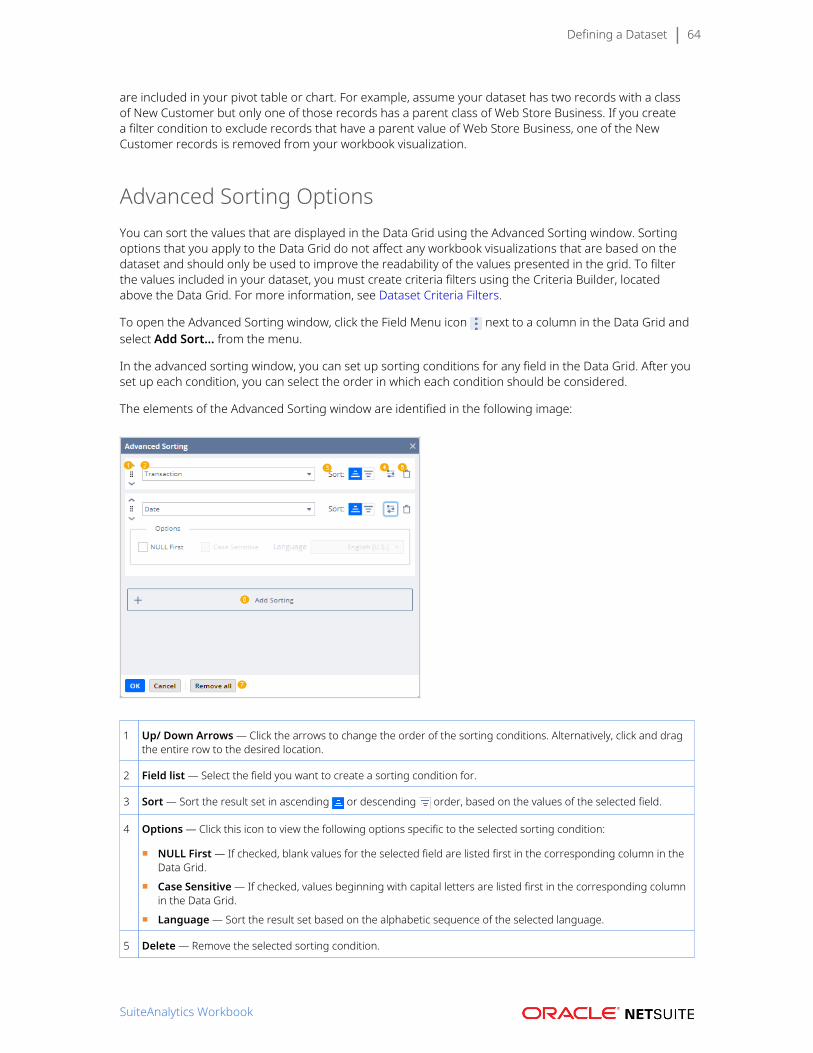
Defining a Dataset 64
are included in your pivot table or chart. For example, assume your dataset has two records with a classof New Customer but only one of those records has a parent class of Web Store Business. If you createa filter condition to exclude records that have a parent value of Web Store Business, one of the NewCustomer records is removed from your workbook visualization.
Advanced Sorting OptionsYou can sort the values that are displayed in the Data Grid using the Advanced Sorting window. Sortingoptions that you apply to the Data Grid do not affect any workbook visualizations that are based on thedataset and should only be used to improve the readability of the values presented in the grid. To filterthe values included in your dataset, you must create criteria filters using the Criteria Builder, locatedabove the Data Grid. For more information, see Dataset Criteria Filters.
To open the Advanced Sorting window, click the Field Menu icon next to a column in the Data Grid andselect Add Sort... from the menu.
In the advanced sorting window, you can set up sorting conditions for any field in the Data Grid. After youset up each condition, you can select the order in which each condition should be considered.
The elements of the Advanced Sorting window are identified in the following image:
1 Up/ Down Arrows — Click the arrows to change the order of the sorting conditions. Alternatively, click and dragthe entire row to the desired location.
2 Field list — Select the field you want to create a sorting condition for.
3 Sort — Sort the result set in ascending or descending order, based on the values of the selected field.
4 Options — Click this icon to view the following options specific to the selected sorting condition:
■ NULL First — If checked, blank values for the selected field are listed first in the corresponding column in theData Grid.
■ Case Sensitive — If checked, values beginning with capital letters are listed first in the corresponding columnin the Data Grid.
■ Language — Sort the result set based on the alphabetic sequence of the selected language.
5 Delete — Remove the selected sorting condition.
SuiteAnalytics Workbook
Defining a Dataset 65
6 Add Sorting — Add another sorting condition, for a different field.
7 OK — Apply the selected sorting conditions to the Data Grid.
Cancel — Close the Advanced Sorting window without making any changes to the existing sorting conditions.
Remove All — Remove all of the sorting conditions currently listed in the Advanced Sorting window.
Joining Records Types in a DatasetSuiteAnalytics Workbook enables you to join multiple record types in the same dataset. This includesrecord types that are more than one join away from the root record type selected for the dataset,enabling you to compile data from more diverse record types.
By default, the Dataset Builder lists all joinable record types that you have access to. To complete a join,simply add fields from the desired record type to the Data Grid or create a criteria filter using the CriteriaBuilder. If you are not sure which record type to join to your dataset, look for the field you want to addusing the Records and Fields list search function. For more information, see Locating Fields in Workbook.
If joining record types is a new concept for you, there are a number of considerations you should makebefore you begin, such as the effect of one—to—many relationships between record types, and thedirection and order of your joins. This is especially true if you are working on a transaction dataset andwant to join the transaction line and transaction accounting line record types.
For more information, see Guidelines for Joining Record Types in SuiteAnalytics Workbook.
Locating Fields in WorkbookIf you are not sure which record type you want to join to a dataset, you can browse or search the Recordsand Fields list in the Dataset Builder. The record types and fields that you have access to are based onyour permissions and the role you use to log in to NetSuite. If you do not see a record type or field thatyou think you should have access to, contact your administrator.
By default, record types and fields are listed in alphabetical order except if you are in a transactiondataset. In a transaction dataset, the transaction line and transaction accounting line record types arelisted at the top of the Records list. This is because these are the most commonly joined record types in atransaction dataset.
You can search for fields using their labels or internal IDs. Searches are performed across record typesthat are up to three joins away from the root record type of the dataset. If you want to search acrossmore record types, click Show more results.
If you are working in an existing dataset and you do not know which record type a field belongs to,point to the field in the Data Grid or in the criteria filter, then click the field menu icon and select ShowLocation in Field List. The associated record type is highlighted in the Records List.
Dataset Criteria FiltersOn the Dataset Builder above the Data Grid, the Criteria Builder enables you to filter your dataset results.Unlike filters that you create within workbook visualizations such as charts, pivot tables or table views,criteria filters remove entire records and fields from a dataset which, impacts all workbook visualizationsthat are based on the dataset. For example, if you create a criteria filter that removes invoice records
SuiteAnalytics Workbook
Dataset Criteria Filters 66
from a dataset, workbook visualizations based on that dataset will also no longer include invoice data. Usecaution when applying new criteria filters to a dataset that is used in multiples workbook visualizations.
Criteria filters are joined by AND/OR logic within the Criteria Builder and can be grouped so that multiplefilter conditions are evaluated as one item within the list of filters. You can edit or delete criteria filtersas necessary, or move filters so that they are evaluated in a different order. Any fields that you use in acriteria filter are highlighted in the Fields list, however they do not appear at the top of the Fields list likefields that are added to the Data Grid. If you are not sure which record type a field in the Criteria Builderbelongs to, click the Field menu icon next to a criteria filter and click Show Location in Field List.
When you create a new criteria filter, the results in the Data Grid are automatically updated. To updatethe results in a chart or pivot table that is based on the dataset however, you must manually refresh it.
Important: If you create a criteria filter based on a joined record type that has a one-to-many or many-to-many relationship with the root record type of the dataset, it can cause dataduplication. For more information, see Data Duplication Based on Record Joins.
To create a dataset criteria filter:
1. On the Dataset Builder, drag a field from the Fields list or the Data Grid to the Criteria Builder.
The Filter window appears.
2. In the Filter window, select the filter conditions you want to apply to the field. Up to four types offilters are available depending on the field you select. For more information, see Filter Types.
3. (Optional) If you want to group your criteria filters, click New Group.
Grouped criteria filters are considered one item in the list of criteria filters and are evaluated in theorder that they appear in the Criteria Builder. For more information, see Grouping Filters.
4. Repeat steps 1–3 for each filter or filter group you want to define.
By default, criteria filters are added using an AND operator. To change the relationship betweenfilters and filter groups, click AND and select OR from the popup window.
5. (Optional) If you accessed the dataset from within a workbook, click Apply to workbook to previewyour changes in the workbook.
6. Click Save to save your dataset changes.
If you do not own the dataset, click Save As to save it under a different name.
Filter TypesWhen you add a field from the Fields list or the Data Grid to the Criteria Builder, the Filter windowappears. Use the Filter window to set up specific filter conditions for a field. The types of filters you canset up depend on the values of the field, with each filter type represented by a different tab in the Filterwindow.
SuiteAnalytics Workbook
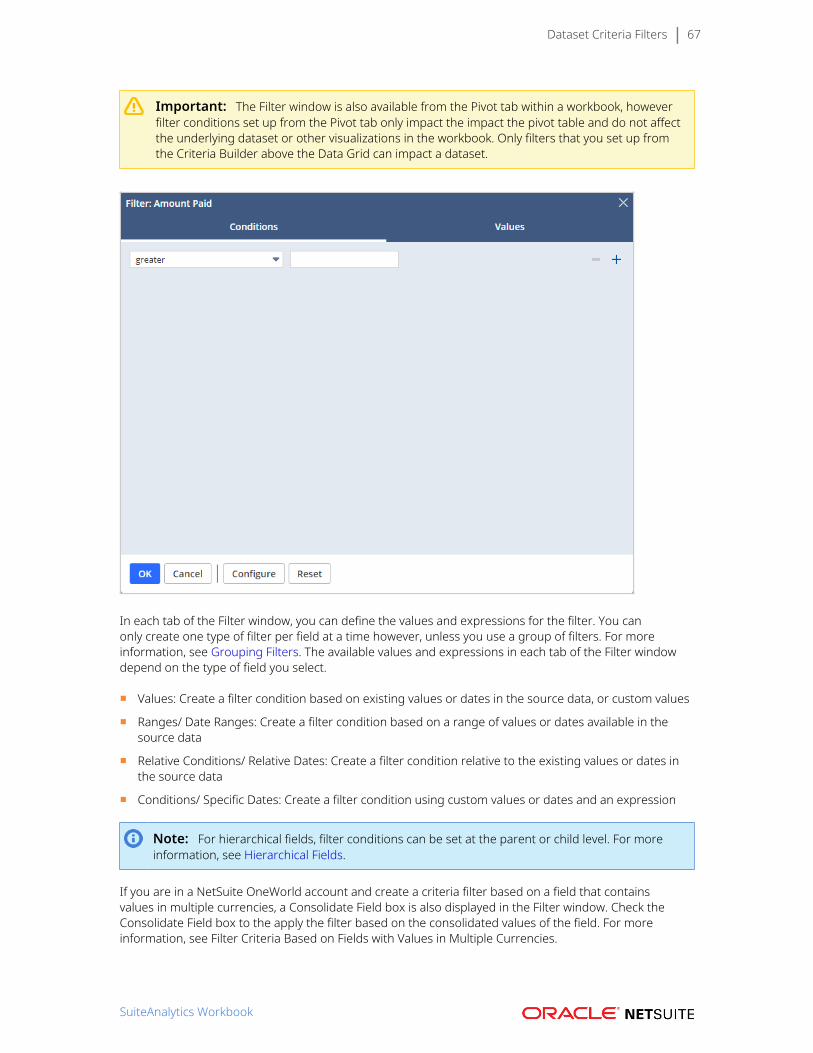
Dataset Criteria Filters 67
Important: The Filter window is also available from the Pivot tab within a workbook, howeverfilter conditions set up from the Pivot tab only impact the impact the pivot table and do not affectthe underlying dataset or other visualizations in the workbook. Only filters that you set up fromthe Criteria Builder above the Data Grid can impact a dataset.
In each tab of the Filter window, you can define the values and expressions for the filter. You canonly create one type of filter per field at a time however, unless you use a group of filters. For moreinformation, see Grouping Filters. The available values and expressions in each tab of the Filter windowdepend on the type of field you select.
■ Values: Create a filter condition based on existing values or dates in the source data, or custom values
■ Ranges/ Date Ranges: Create a filter condition based on a range of values or dates available in thesource data
■ Relative Conditions/ Relative Dates: Create a filter condition relative to the existing values or dates inthe source data
■ Conditions/ Specific Dates: Create a filter condition using custom values or dates and an expression
Note: For hierarchical fields, filter conditions can be set at the parent or child level. For moreinformation, see Hierarchical Fields.
If you are in a NetSuite OneWorld account and create a criteria filter based on a field that containsvalues in multiple currencies, a Consolidate Field box is also displayed in the Filter window. Check theConsolidate Field box to the apply the filter based on the consolidated values of the field. For moreinformation, see Filter Criteria Based on Fields with Values in Multiple Currencies.
SuiteAnalytics Workbook
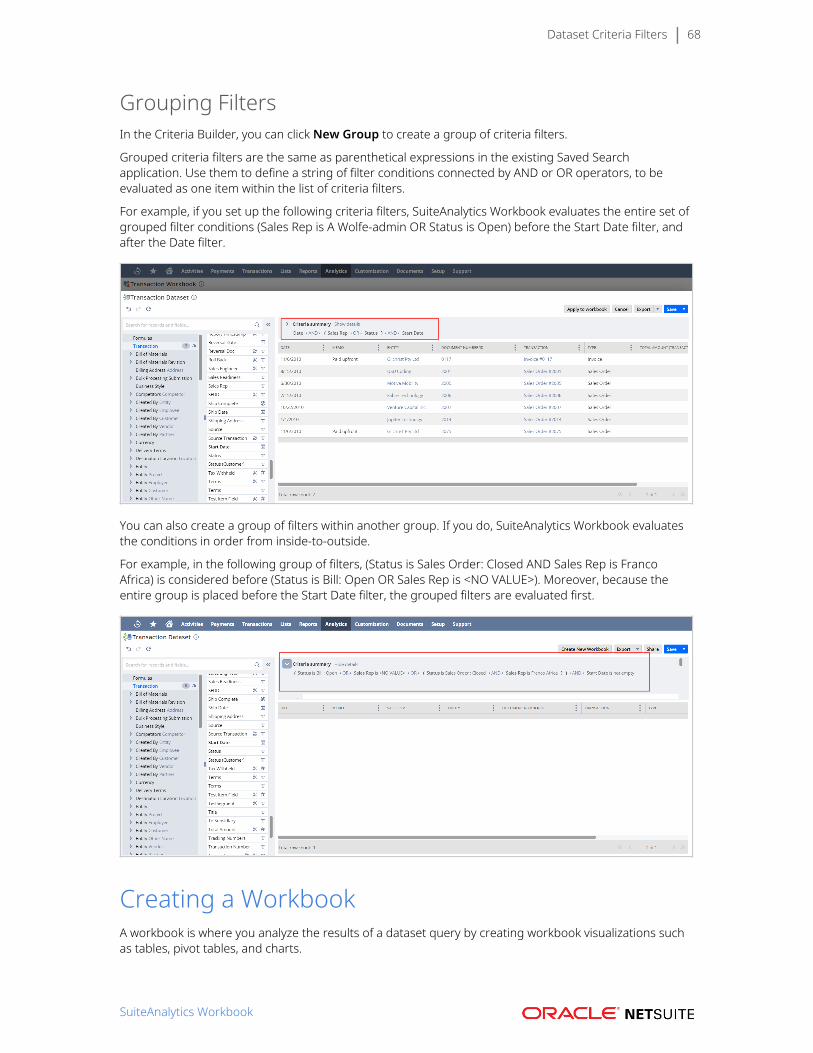
Dataset Criteria Filters 68
Grouping FiltersIn the Criteria Builder, you can click New Group to create a group of criteria filters.
Grouped criteria filters are the same as parenthetical expressions in the existing Saved Searchapplication. Use them to define a string of filter conditions connected by AND or OR operators, to beevaluated as one item within the list of criteria filters.
For example, if you set up the following criteria filters, SuiteAnalytics Workbook evaluates the entire set ofgrouped filter conditions (Sales Rep is A Wolfe-admin OR Status is Open) before the Start Date filter, andafter the Date filter.
You can also create a group of filters within another group. If you do, SuiteAnalytics Workbook evaluatesthe conditions in order from inside-to-outside.
For example, in the following group of filters, (Status is Sales Order: Closed AND Sales Rep is FrancoAfrica) is considered before (Status is Bill: Open OR Sales Rep is <NO VALUE>). Moreover, because theentire group is placed before the Start Date filter, the grouped filters are evaluated first.
Creating a WorkbookA workbook is where you analyze the results of a dataset query by creating workbook visualizations suchas tables, pivot tables, and charts.
SuiteAnalytics Workbook
Creating a Workbook 69
All workbook visualizations are based on a dataset, however a single dataset can be used in multipleworkbooks and workbook visualizations. Additionally, you can use a different dataset for each visualizationin a workbook. Although you can access the underlying dataset from within a workbook visualization, thedataset exists as its own object, with its own creator and access rights. Moreover, changes to a datasetare automatically propagated to any connected workbook visualizations. This prevents data discrepanciesbut also means that your workbooks can change unexpectedly if you do not own the underlying dataset.
You can only create workbook visualizations using fields that have been added to the underlying dataset.If you do not see a field that you want to include in a workbook visualization, you must add it to thedataset or contact the dataset owner so that they can add it for you. For more information about defininga dataset, see Defining a Dataset.
The types of workbook visualizatinos that you can create include table views, pivot tables, and charts:
■ Table Views enable you to display and analyze your dataset results in a simplified table. For moreinformation, see Workbook Table Views.
Note: By default, all workbook templates include a Table View based on the underlyingdataset. For more information about workbook and dataset templates, see Workbook andDataset Templates.
■ Pivot tables enable you to pivot your dataset results so that you can analyze different subsets of thedata, such as the number of unfulfilled orders per customer in your account. For more information,see Workbook Pivot Tables.
■ Charts enable you to create different visualizations of your dataset results so that they can be analyzedat a glance. For more information, see Workbook Charts.
After you create your workbook visualizations, you can rearrange the order in which the workbook tabsare displayed as needed.
To create a new workbook or workbook visualization based on new dataset:
1. From the Analytics Home page on the Workbooks subtab, click New Workbook.2. On the Select a dataset to create a new workbook page, click New Dataset.3. Select a record type for the dataset.
The Dataset Builder appears with preselected fields in the Data Grid.4. Select the fields and criteria filters you want to include in the dataset. For more information, see
Defining a Dataset and Dataset Criteria Filters.5. When you are satisfied with your results, click Apply to workbook.6. Select a workbook visualization to begin.7. Edit the layout for each workbook visualization that you add.
For more information, see Workbook Table Views, Workbook Pivot Tables, or Workbook Charts.8. Click Save...
The Save Workbook As window appears.
Important: You cannot save a workbook if it has visualizations that are based onunsaved datasets. If you have unsaved datasets connected to your workbook, click themenu icon next to the dataset name in the Dataset Panel and select Save changes as orDiscard changes. Alternatively, if you want to continue editing the dataset, click OpenDataset.
9. Enter a name and description for the workbook in the fields provided, then click Save.10. (Optional) Click Share to share the workbook with other users in your account.
SuiteAnalytics Workbook
Creating a Workbook 70
The Share Workbook window appears.
11. Select the roles or user IDs that you want to share the workbook with, then click Share.
For more information about sharing workbooks, see Accessing and Sharing Workbooks andDatasets.
12. (Optional) To change the order in which the workbook visualizations are displayed, drag theworkbook tab to the desired position.
To create a new workbook or workbook visualization based on an existing dataset:
1. From the Analytics Home page on the Workbooks subtab, click New Workbook.
Alternatively, if you are already in an existing dataset, click Create New Workbook and proceed tostep 3.
2. Select a dataset on the Select a dataset to create a new workbook page.
3. Select a workbook visualization to begin.
Important: Keep in mind that you can only create workbook visualizations using fieldsthat have been added to the selected dataset. If you do not own the selected dataset andyou want to add fields or criteria to it, you must save the dataset using a different name.Additionally, if you proceed without saving your own version of the dataset, the datasetcreator can make changes to the dataset which will impact your visualization. Use cautionwhen creating workbook visualizations based on datasets that you do not own.
4. Edit the layout for each workbook visualization that you add.
For more information, see Workbook Table Views, Workbook Pivot Tables, or Workbook Charts.
5. Click Save...
The Save Workbook As window appears.
6. Enter a name and description for the workbook in the fields provided, then click Save.
7. (Optional) click Share to share the workbook with other users in your account.
The Share Workbook window appears.
8. Select the roles or user IDs that you want to share the workbook with, then click Share.
For more information about sharing workbooks, see Accessing and Sharing Workbooks andDatasets.
9. (Optional) To change the order in which the workbook visualizations are displayed, drag theworkbook tab to the desired position.
To create a new workbook visualization within an existing workbook:
1. From the Analytics Home page on the Workbooks subtab, click the name of the workbook you wantto add the visualization to.
2. Click the Add icon.
3. Select the visualization type you want to add to the workbook.
By default, the visualization is based on the dataset currently selected in the Dataset Panel. If youwant to base it on a different dataset, click Connect Dataset.
4. Edit the layout for the visualization.
For more information, see Workbook Table Views, Workbook Pivot Tables, or Workbook Charts.
5. (Optional) To change the order in which the workbook visualizations are displayed, drag theworkbook tab to the desired position.
SuiteAnalytics Workbook
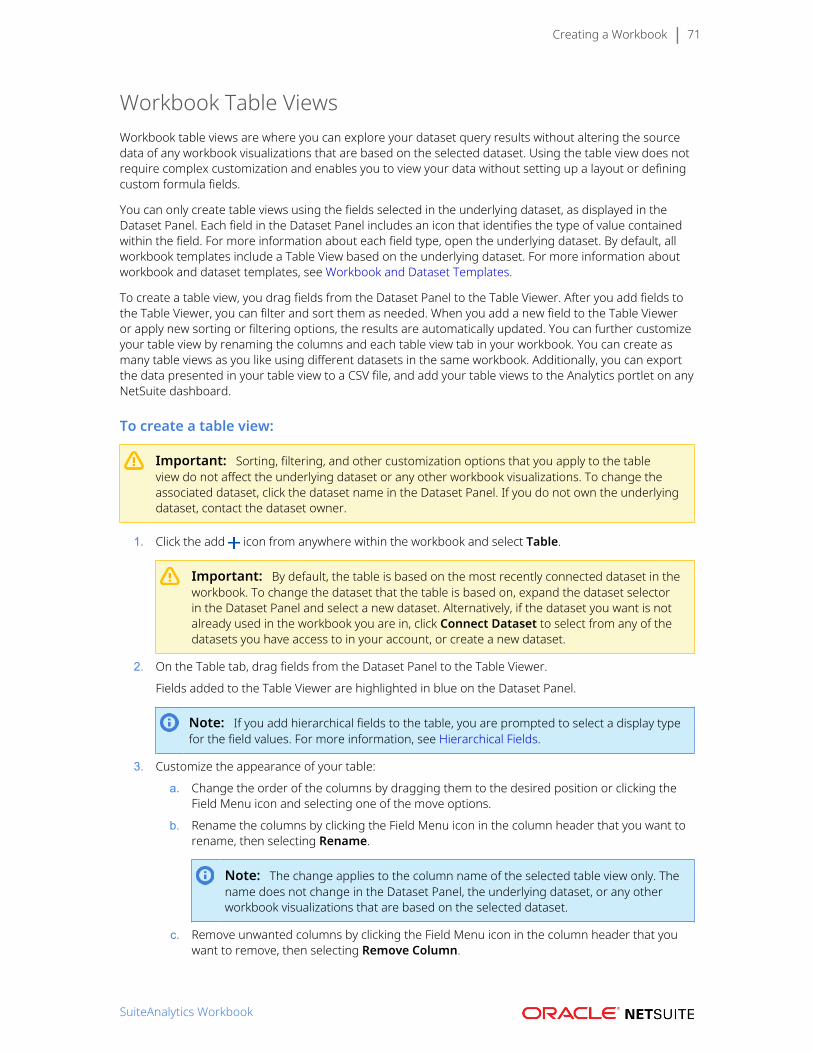
Creating a Workbook 71
Workbook Table ViewsWorkbook table views are where you can explore your dataset query results without altering the sourcedata of any workbook visualizations that are based on the selected dataset. Using the table view does notrequire complex customization and enables you to view your data without setting up a layout or definingcustom formula fields.
You can only create table views using the fields selected in the underlying dataset, as displayed in theDataset Panel. Each field in the Dataset Panel includes an icon that identifies the type of value containedwithin the field. For more information about each field type, open the underlying dataset. By default, allworkbook templates include a Table View based on the underlying dataset. For more information aboutworkbook and dataset templates, see Workbook and Dataset Templates.
To create a table view, you drag fields from the Dataset Panel to the Table Viewer. After you add fields tothe Table Viewer, you can filter and sort them as needed. When you add a new field to the Table Vieweror apply new sorting or filtering options, the results are automatically updated. You can further customizeyour table view by renaming the columns and each table view tab in your workbook. You can create asmany table views as you like using different datasets in the same workbook. Additionally, you can exportthe data presented in your table view to a CSV file, and add your table views to the Analytics portlet on anyNetSuite dashboard.
To create a table view:
Important: Sorting, filtering, and other customization options that you apply to the tableview do not affect the underlying dataset or any other workbook visualizations. To change theassociated dataset, click the dataset name in the Dataset Panel. If you do not own the underlyingdataset, contact the dataset owner.
1. Click the add icon from anywhere within the workbook and select Table.
Important: By default, the table is based on the most recently connected dataset in theworkbook. To change the dataset that the table is based on, expand the dataset selectorin the Dataset Panel and select a new dataset. Alternatively, if the dataset you want is notalready used in the workbook you are in, click Connect Dataset to select from any of thedatasets you have access to in your account, or create a new dataset.
2. On the Table tab, drag fields from the Dataset Panel to the Table Viewer.
Fields added to the Table Viewer are highlighted in blue on the Dataset Panel.
Note: If you add hierarchical fields to the table, you are prompted to select a display typefor the field values. For more information, see Hierarchical Fields.
3. Customize the appearance of your table:
a. Change the order of the columns by dragging them to the desired position or clicking theField Menu icon and selecting one of the move options.
b. Rename the columns by clicking the Field Menu icon in the column header that you want torename, then selecting Rename.
Note: The change applies to the column name of the selected table view only. Thename does not change in the Dataset Panel, the underlying dataset, or any otherworkbook visualizations that are based on the selected dataset.
c. Remove unwanted columns by clicking the Field Menu icon in the column header that youwant to remove, then selecting Remove Column.
SuiteAnalytics Workbook
Creating a Workbook 72
4. Sort the data presented in the table:
a. Click the Field Menu icon next to the field you want to sort.
b. Select Ascending or Descending to apply one of the default sorting options, or select AddSort... to apply advanced sorting.
Note: The advanced sorting options available for a table view are the same asthose that you can apply to a dataset. For more information, see Advanced SortingOptions.
5. Filter the data presented in the table:
a. Click the Field Menu icon next to the field that you want to filter and select Filter...
The Filter window appears.
b. Select the conditions or values for the filter, then click Apply. For more information aboutthe available filtering options, see Value-based Filters.
The Table Viewer is automatically updated.
6. (Optional) Click the Export icon to save a CSV file of your completed table.
Note: To export your table view, you must have the Export Lists permission.
Table View Portlets
You can see your table view data on your home dashboard by adding the Analytics portlet. The portletenables you to quickly see the workbook data on your dashboard and provides quick access to yourworkbook. Visualizing the data right on your dashboard enables you to spend more time learning from itand less time gathering it.
You can also choose how you want to visualize your table view portlet by entering the number of resultrows you want to view at once. To identify the Analytics portlet on your dashboard, you can also enter atitle. By default, the title displays the name of the workbook and the pivot table.
In your table view portlets, you can do the following:
■ View the column summary – When you select a column in your table view, you can also view thesummary of the results in the table footer. The information shown depends on the field type, and candisplay information such as the count, count (distinct), average, and so on.
■ Sort and filter your results – You can use the same sorting and filtering options that are included inyour workbook table view.
SuiteAnalytics Workbook
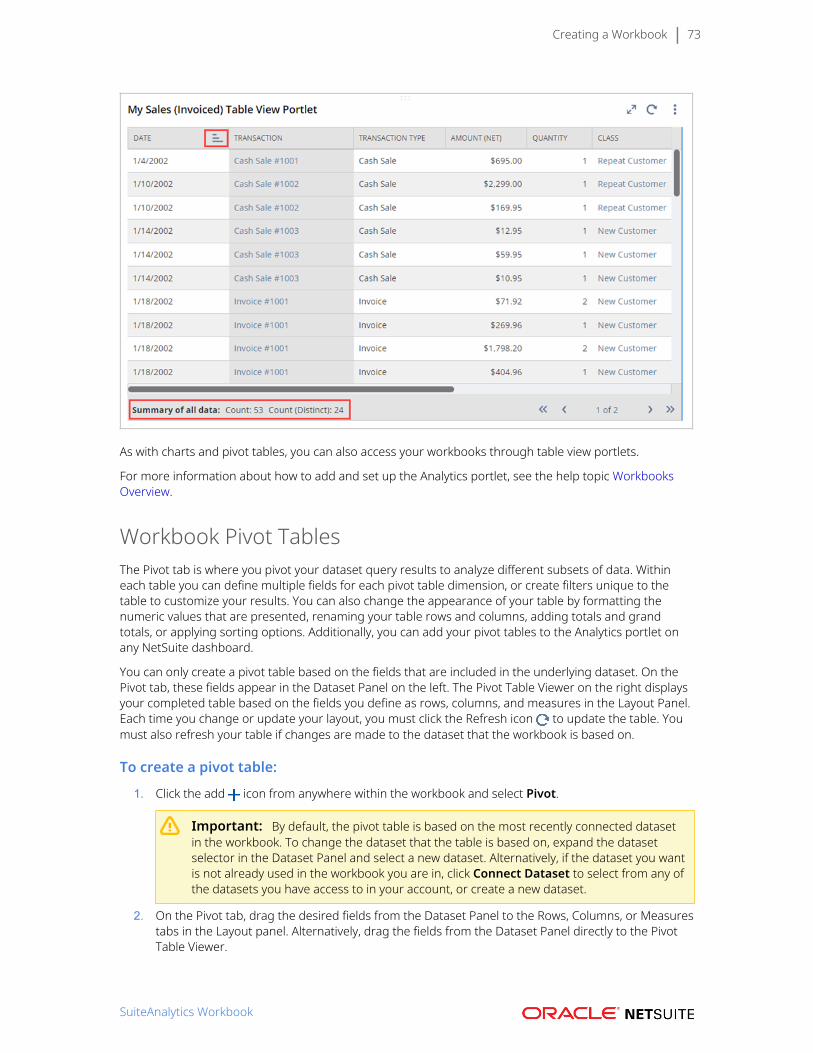
Creating a Workbook 73
As with charts and pivot tables, you can also access your workbooks through table view portlets.
For more information about how to add and set up the Analytics portlet, see the help topic WorkbooksOverview.
Workbook Pivot TablesThe Pivot tab is where you pivot your dataset query results to analyze different subsets of data. Withineach table you can define multiple fields for each pivot table dimension, or create filters unique to thetable to customize your results. You can also change the appearance of your table by formatting thenumeric values that are presented, renaming your table rows and columns, adding totals and grandtotals, or applying sorting options. Additionally, you can add your pivot tables to the Analytics portlet onany NetSuite dashboard.
You can only create a pivot table based on the fields that are included in the underlying dataset. On thePivot tab, these fields appear in the Dataset Panel on the left. The Pivot Table Viewer on the right displaysyour completed table based on the fields you define as rows, columns, and measures in the Layout Panel.Each time you change or update your layout, you must click the Refresh icon to update the table. Youmust also refresh your table if changes are made to the dataset that the workbook is based on.
To create a pivot table:
1. Click the add icon from anywhere within the workbook and select Pivot.
Important: By default, the pivot table is based on the most recently connected datasetin the workbook. To change the dataset that the table is based on, expand the datasetselector in the Dataset Panel and select a new dataset. Alternatively, if the dataset you wantis not already used in the workbook you are in, click Connect Dataset to select from any ofthe datasets you have access to in your account, or create a new dataset.
2. On the Pivot tab, drag the desired fields from the Dataset Panel to the Rows, Columns, or Measurestabs in the Layout panel. Alternatively, drag the fields from the Dataset Panel directly to the PivotTable Viewer.
SuiteAnalytics Workbook
Creating a Workbook 74
Note: If you add hierarchical fields to the table, you are prompted to select a display typefor the field values. Depending on where you add the field and the display type you select,you can also add additional subtotals to the pivot table for each level in the hierarchy. Formore information, see Hierarchical Fields.
3. Select the summary type and format options for any date or numerical fields you add to the pivottable.
1. Click the Field Menu icon next to the field you want to format in the Layout panel.
2. Select a summary type from the popup window.
The summary options vary depending on the type of field you select.
3. (Optional) Select Currency... to view the currency consolidation or conversion options forany fields with values in multiple currencies.
For more information, see Currency Conversion from the User Interface.
4. (Optional) Click Format... to customize the numeric values for a field.
For more information about numeric formatting options, see Customizing Numeric Values.
4. Add totals and grand totals to the pivot table.
1. Click the Totaling icon .
2. In the Totaling window, select where you want the totals or grand totals for each applicablefield to appear. If there are multiple fields that can be totalled in the rows or columns, checkthe Set Individually box to select where the totals for each field will appear on the pivottable.
3. Click OK.
5. Click the Refresh icon to generate the pivot table.
6. Filter the data displayed in the pivot table.
Note: Filter conditions created on the Pivot tab only impact the data displayed in the pivottable. No changes are made to the dataset that the workbook is based on.
1. Click the Field Menu icon next to the field you want to create a filter for. Depending onwhether the field has been defined as a column, row, or measure, the following options areavailable. If you click the Field menu icon from the Fields List or the Layout Panel, it can alsoimpact the available options:
■ Top 10: display only the top 10 rows or columns based on the measures defined for thetable.
■ Bottom 10: display only the bottom 10 rows or columns based on the measures definedfor the table.
■ Filter [Field Name] by...: enables you to define a custom measure-based filter for theselected row or column.
■ Filter [Field Name]: enables you to define a custom value-based filter based on specificvalues within the table results.
■ Add as Filter...: enables you to define a custom value-based filter based on specificvalues within the table results.
■ Filter Date: enables you to define a custom date filter based on date ranges that youchoose.
2. The results in the table are updated automatically.
For more information, see Workbook Visualization Filters.
SuiteAnalytics Workbook
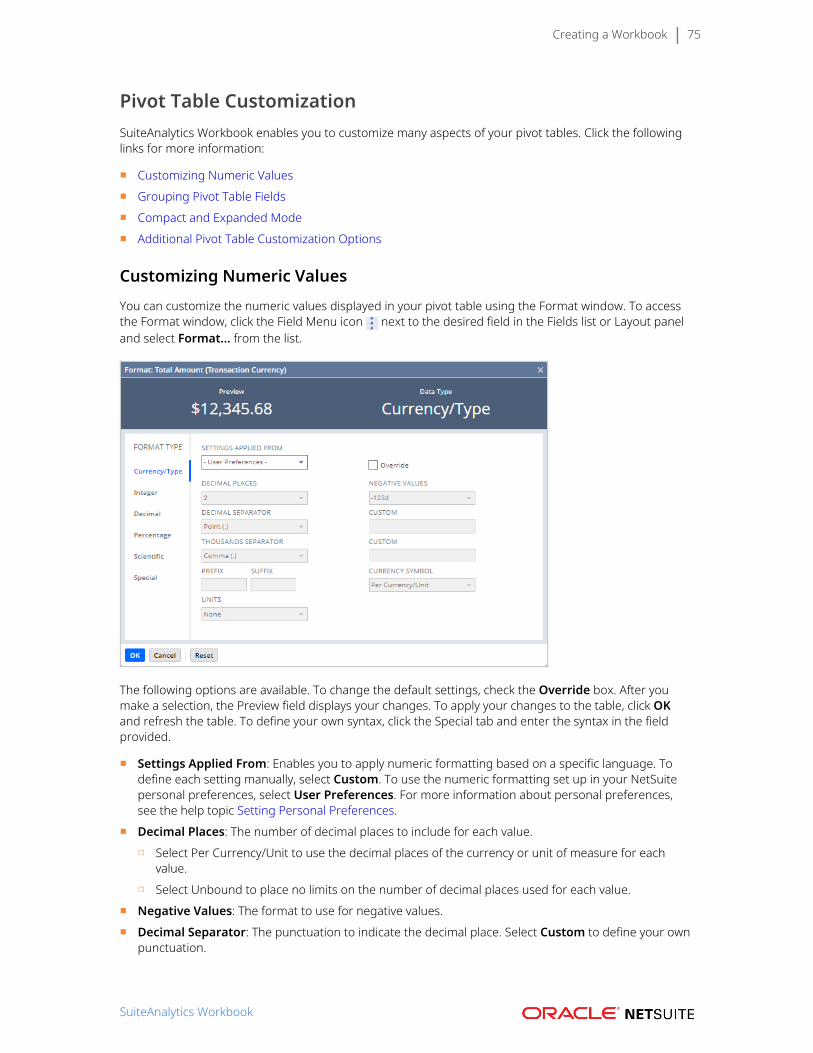
Creating a Workbook 75
Pivot Table CustomizationSuiteAnalytics Workbook enables you to customize many aspects of your pivot tables. Click the followinglinks for more information:
■ Customizing Numeric Values■ Grouping Pivot Table Fields■ Compact and Expanded Mode■ Additional Pivot Table Customization Options
Customizing Numeric ValuesYou can customize the numeric values displayed in your pivot table using the Format window. To accessthe Format window, click the Field Menu icon next to the desired field in the Fields list or Layout paneland select Format... from the list.
The following options are available. To change the default settings, check the Override box. After youmake a selection, the Preview field displays your changes. To apply your changes to the table, click OKand refresh the table. To define your own syntax, click the Special tab and enter the syntax in the fieldprovided.
■ Settings Applied From: Enables you to apply numeric formatting based on a specific language. Todefine each setting manually, select Custom. To use the numeric formatting set up in your NetSuitepersonal preferences, select User Preferences. For more information about personal preferences,see the help topic Setting Personal Preferences.
■ Decimal Places: The number of decimal places to include for each value.□ Select Per Currency/Unit to use the decimal places of the currency or unit of measure for each
value.□ Select Unbound to place no limits on the number of decimal places used for each value.
■ Negative Values: The format to use for negative values.■ Decimal Separator: The punctuation to indicate the decimal place. Select Custom to define your own
punctuation.
SuiteAnalytics Workbook
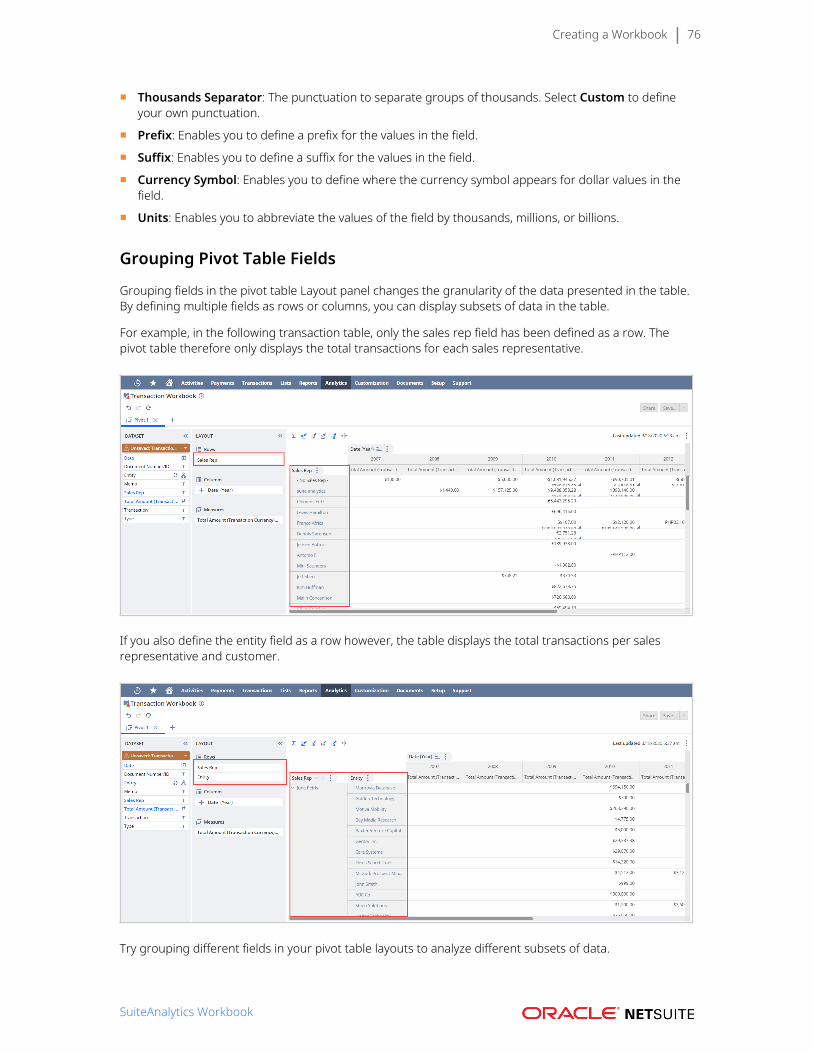
Creating a Workbook 76
■ Thousands Separator: The punctuation to separate groups of thousands. Select Custom to defineyour own punctuation.
■ Prefix: Enables you to define a prefix for the values in the field.
■ Suffix: Enables you to define a suffix for the values in the field.
■ Currency Symbol: Enables you to define where the currency symbol appears for dollar values in thefield.
■ Units: Enables you to abbreviate the values of the field by thousands, millions, or billions.
Grouping Pivot Table Fields
Grouping fields in the pivot table Layout panel changes the granularity of the data presented in the table.By defining multiple fields as rows or columns, you can display subsets of data in the table.
For example, in the following transaction table, only the sales rep field has been defined as a row. Thepivot table therefore only displays the total transactions for each sales representative.
If you also define the entity field as a row however, the table displays the total transactions per salesrepresentative and customer.
Try grouping different fields in your pivot table layouts to analyze different subsets of data.
SuiteAnalytics Workbook
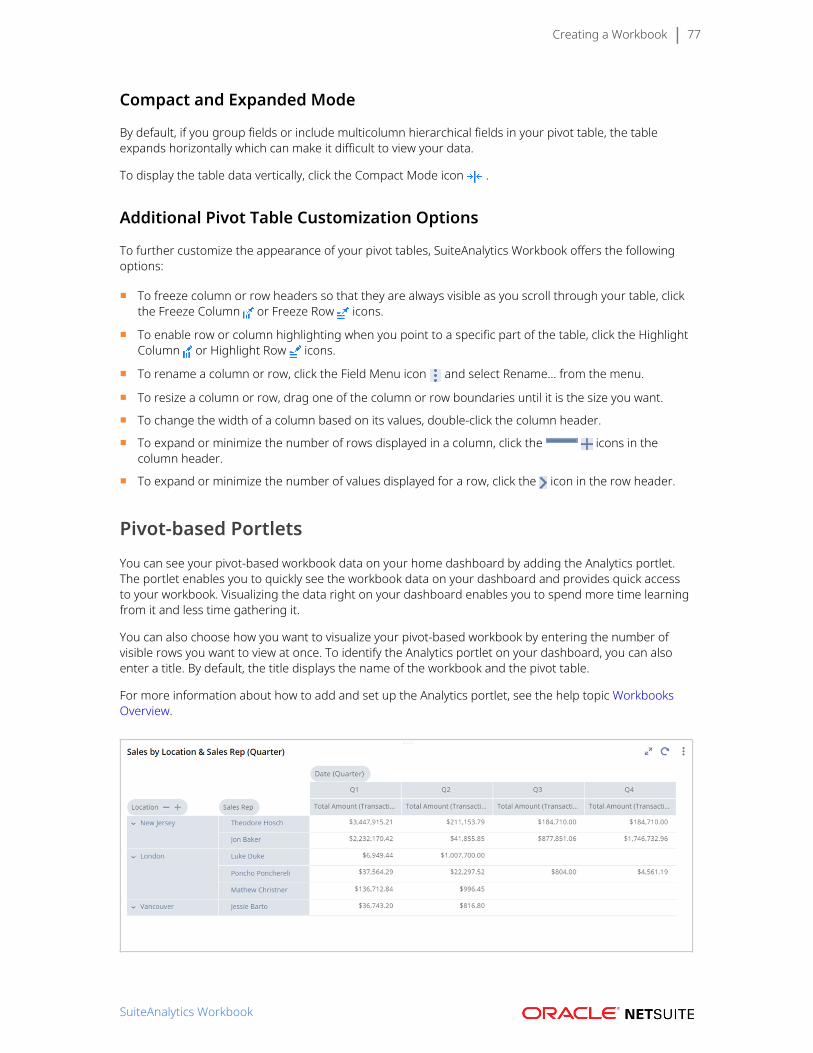
Creating a Workbook 77
Compact and Expanded Mode
By default, if you group fields or include multicolumn hierarchical fields in your pivot table, the tableexpands horizontally which can make it difficult to view your data.
To display the table data vertically, click the Compact Mode icon .
Additional Pivot Table Customization Options
To further customize the appearance of your pivot tables, SuiteAnalytics Workbook offers the followingoptions:
■ To freeze column or row headers so that they are always visible as you scroll through your table, clickthe Freeze Column or Freeze Row icons.
■ To enable row or column highlighting when you point to a specific part of the table, click the HighlightColumn or Highlight Row icons.
■ To rename a column or row, click the Field Menu icon and select Rename... from the menu.
■ To resize a column or row, drag one of the column or row boundaries until it is the size you want.
■ To change the width of a column based on its values, double-click the column header.
■ To expand or minimize the number of rows displayed in a column, click the icons in thecolumn header.
■ To expand or minimize the number of values displayed for a row, click the icon in the row header.
Pivot-based PortletsYou can see your pivot-based workbook data on your home dashboard by adding the Analytics portlet.The portlet enables you to quickly see the workbook data on your dashboard and provides quick accessto your workbook. Visualizing the data right on your dashboard enables you to spend more time learningfrom it and less time gathering it.
You can also choose how you want to visualize your pivot-based workbook by entering the number ofvisible rows you want to view at once. To identify the Analytics portlet on your dashboard, you can alsoenter a title. By default, the title displays the name of the workbook and the pivot table.
For more information about how to add and set up the Analytics portlet, see the help topic WorkbooksOverview.
SuiteAnalytics Workbook
Creating a Workbook 78
Workbook ChartsThe Chart tab is where you create visualizations of your dataset query results. There are multiple charttypes you can create, all of which you can add to the Analytics portlet on any NetSuite dashboard. Youcan also print or export your charts to an SVG file. Additionally, you can customize the appearance of yourchart by adding a title and subtitle, or by renaming each axis. Filtering capabilities are also supported,enabling you to display only the most pertinent values in each chart.
The Chart tab displays any fields that are included in the underlying dataset in the Dataset Panel on theleft. Completed charts are displayed in the Chart Viewer on the right, based on the fields you define as thex-axis, series, and measures in the Layout Panel. Each time you change or update your layout, you mustclick the Refresh icon to update the chart. You must also refresh the chart if you make changes to theunderlying dataset.
To create a chart:
1. Click the add icon from anywhere within the workbook and select Chart.
Important: By default, the chart is based on the most recently connected dataset in theworkbook. To change the dataset that the chart is based on, expand the dataset selectorin the Dataset Panel and select a new dataset. Alternatively, if the dataset you want is notalready used in the workbook you are in, click Connect Dataset to select from any of thedatasets you have access to in your account, or create a new dataset.
2. Drag the desired fields from the Dataset Panel to the X-Axis, Series, or Measures tabs in the Layoutpanel.
3. Select the summary type and format options for any date or numerical fields you add to the chart.a. Click the Field Menu icon next to the field you want to format in the Layout panel.b. Select a summary type from the popup window.c. (Optional) Click Format... to customize the numeric values for a field.
For more information about numeric formatting options, see Customizing Numeric Values.d. (Optional) Select Currency... to view the currency consolidation or conversion options for
any fields with values in multiple currencies.For more information, see Currency Conversion from the User Interface.
4. In the Layout panel, select the type of chart you want to produce from the popup window.For information about each chart type, see the Chart Types topic.
5. (Optional) Click the Properties subtab in the Layout panel to add a title and subtitle to the chart, orto rename each axis.
6. Click the Refresh icon to generate your chart.
7. (Optional) Filter the data displayed in the chart:
Note: Filters applied on the Chart tab affect only the data displayed in the chart. Nochanges are made to the underlying dataset or any other workbook visualizations.
a. Click the Field Menu icon next to the field you want to create a filter for. Depending onwhether the field has been defined as the X-Axis, Series, or Measure, or if you click the Fieldmenu icon from the Fields List or the Layout Panel, the following options are available:■ Top 10: display only the top 10 results based on the measures defined for the chart.■ Bottom 10: display only the bottom 10 results based on the measures defined for the
chart.
SuiteAnalytics Workbook
Creating a Workbook 79
■ Filter [Field Name] by...: enables you to define a custom measure-based filter for theselected chart.
■ Filter [Field Name]: enables you to define a custom value-based filter based on specificvalues within the chart results.
■ Add as Filter...: enables you to define a custom value-based filter based on specific valueswithin the chart results.
b. The results in the table are updated automatically.
For more information, see Workbook Visualization Filters.
Chart TypesThere are multiple chart types you can use to visualize your data. To apply a chart type from either theChart tab or the Analytics portlet, click the chart type dropdown and select an option from the popupwindow. Changing the chart type from the Analytics portlet does not affect the chart type selected for thecorresponding workbook. Chart types let you compare values, and show trends. When you select a charttype, keep in mind the data included in the chart and the type of information you want to display. Thefollowing chart type options are available:
■ Column Chart – Enables you to compare values for different categories or compare value changesover a period of time for a single category. For example, sales by period of time (weekly, monthly,quarterly, or yearly). You can also use column charts to display negative values and to show anoverview of the highest and lowest categories.
■ Bar Chart – Enables you to compare values offering the same capabilities of the column chart. You canuse this chart type when the data labels are long as it improves readability. For example, when usingregions or sales representatives as dimensions.
■ Area Chart – Enables you to display trends and accumulative value changes over time, such as itemstock, number of employees, or savings account.
■ Line Chart – Enables you to display trends for a higher number of data points. For example, whenshowing more than 20 data points.
■ Stacked Column Chart – Enables you to show the composition of the data, by displaying the proportionof each category to a whole. For example, you can use it to see the percentage of the base price anddiscount price by customer.
■ Stacked Bar Chart –Enables you to display data in a bar chart emphasizing the composition, instead ofcomparison.
■ Stacked Area Chart – Enables you to display data in an area chart showing how each categorycontributes to the total over a period of time.
To see some examples, see the following charts:
■ Open Sales Orders Lines Charts
■ Number of Fulfillments Chart
■ Value of Shipping Charges Charts
Chart-based PortletsYou can see your chart data on your home dashboard by adding the Analytics portlet. The portlet enablesyou to quickly see the chart on your dashboard and provides quick access to your workbook. Visualizingthe data on your dashboard enables you to spend more time learning from it and less time gathering it.
SuiteAnalytics Workbook
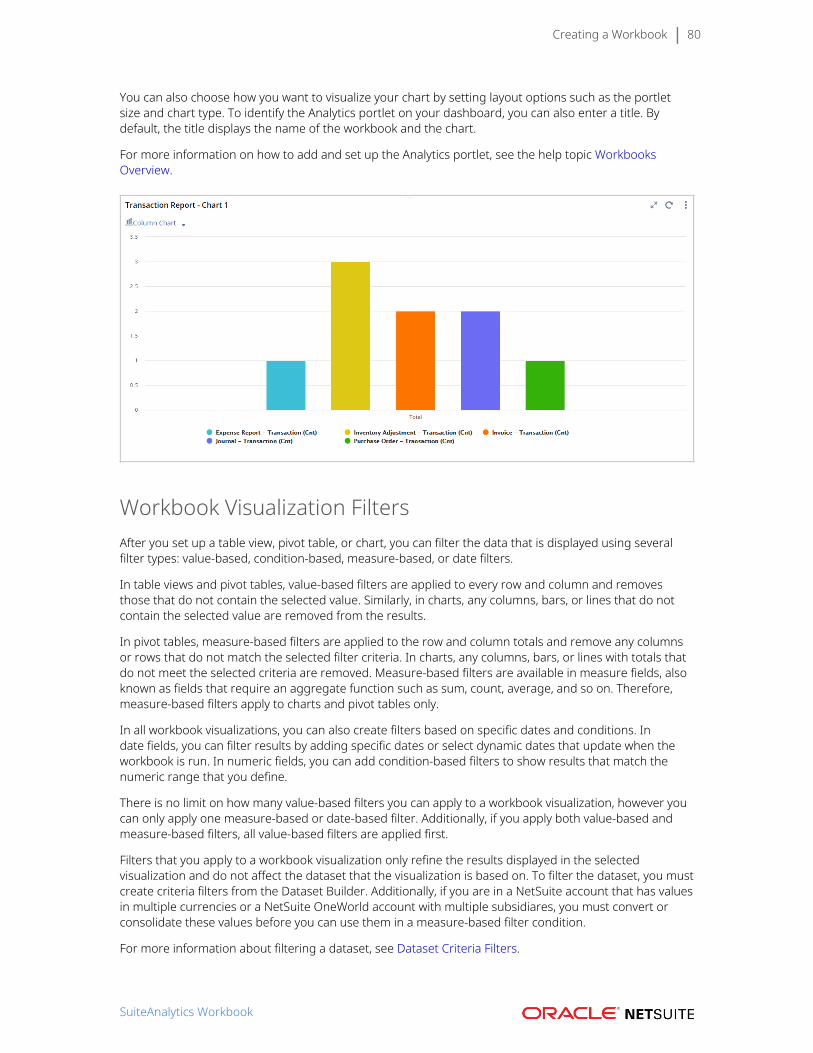
Creating a Workbook 80
You can also choose how you want to visualize your chart by setting layout options such as the portletsize and chart type. To identify the Analytics portlet on your dashboard, you can also enter a title. Bydefault, the title displays the name of the workbook and the chart.
For more information on how to add and set up the Analytics portlet, see the help topic WorkbooksOverview.
Workbook Visualization FiltersAfter you set up a table view, pivot table, or chart, you can filter the data that is displayed using severalfilter types: value-based, condition-based, measure-based, or date filters.
In table views and pivot tables, value-based filters are applied to every row and column and removesthose that do not contain the selected value. Similarly, in charts, any columns, bars, or lines that do notcontain the selected value are removed from the results.
In pivot tables, measure-based filters are applied to the row and column totals and remove any columnsor rows that do not match the selected filter criteria. In charts, any columns, bars, or lines with totals thatdo not meet the selected criteria are removed. Measure-based filters are available in measure fields, alsoknown as fields that require an aggregate function such as sum, count, average, and so on. Therefore,measure-based filters apply to charts and pivot tables only.
In all workbook visualizations, you can also create filters based on specific dates and conditions. Indate fields, you can filter results by adding specific dates or select dynamic dates that update when theworkbook is run. In numeric fields, you can add condition-based filters to show results that match thenumeric range that you define.
There is no limit on how many value-based filters you can apply to a workbook visualization, however youcan only apply one measure-based or date-based filter. Additionally, if you apply both value-based andmeasure-based filters, all value-based filters are applied first.
Filters that you apply to a workbook visualization only refine the results displayed in the selectedvisualization and do not affect the dataset that the visualization is based on. To filter the dataset, you mustcreate criteria filters from the Dataset Builder. Additionally, if you are in a NetSuite account that has valuesin multiple currencies or a NetSuite OneWorld account with multiple subsidiares, you must convert orconsolidate these values before you can use them in a measure-based filter condition.
For more information about filtering a dataset, see Dataset Criteria Filters.
SuiteAnalytics Workbook
Creating a Workbook 81
For more information converting or consolidating values in a workbook visualization, see CurrencyConversion and Consolidation in Datasets and Workbooks.
To learn how to use the workbook visualization filters, see the following:
■ Available Filters for Aggregate and Non-Aggregate Fields
■ Value-based Filters
■ Condition-based Filters
■ Measure-based Filters
■ Date Filters
Available Filters for Aggregate and Non-Aggregate FieldsWhen you work with filters, each field displays different options depending on the type of field thatyou select (numeric field, date field, and so on) and how you use the available fields in your workbookvisualizations. In charts and pivot tables, you can use some fields in two different ways:
■ Use fields as aggregate fields – If you drag fields to the Measure section, the visualization displaysresults as an aggregate field. Therefore, results are grouped together to display a single summaryresult for several value entries.
■ Use fields as non-aggregate fields – If you drag fields to the Rows or Columns sections (for pivottables) or the X-Axis and Color Stack sections (for charts), each aggregate field displays a result foreach value entry.
Using fields as aggregate or non-aggregate values has an impact on how your workbook visualizationsdisplay results. For example, if you want to see the sales amount broken by sales rep, your workbookvisualization can display results in different ways. By using the Amount (Net) field as an aggregate field,also known as a measure field, the visualization displays a single result for all the sales transactions ofa particular sales rep, based on the aggregate function that you select. For example, if you select thesum function, the result returns a single value for all the sales transactions. In this case, the field displays10,000 USD. If you use the Amount (Net) field as a non-aggregate field, the visualization displays a resultfor each sales transaction of the same sales rep. In this case, the visualization displays the following fieldresults: transaction A (9,000 USD), transaction B (600 USD), and transaction C (400 USD).
Value-based FiltersValue-based filters enable you to filter the data displayed in your workbook visualizations using specificvalues from any field that has been added to the Layout panel or Table Viewer. In pivot tables, value-based filters are applied to every row and column in the table and removes those that do not contain theselected value. In charts, any columns, bars, or lines that do not contain the selected value are removedfrom the results.
Note: Value-based filters are available in fields used as aggregate and non-aggregate fields.They apply to all workbook visualizations (charts, pivot tables, and table views).
To apply a value-based filter to a workbook visualization:
1. Click the Field Menu icon next to any field in the Layout panel or Viewer and select Filter [FieldName]...
The Filter window appears.
2. In the Filter window, select the field values and operator to use in the filter condition.
SuiteAnalytics Workbook
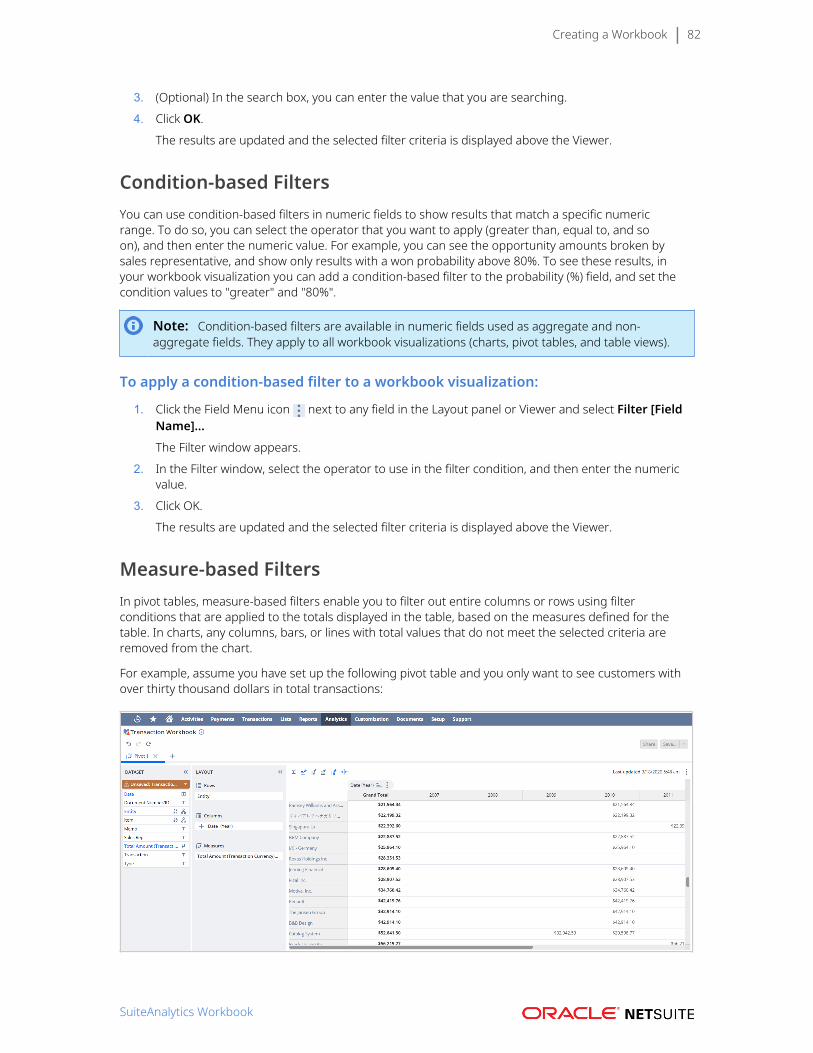
Creating a Workbook 82
3. (Optional) In the search box, you can enter the value that you are searching.
4. Click OK.
The results are updated and the selected filter criteria is displayed above the Viewer.
Condition-based FiltersYou can use condition-based filters in numeric fields to show results that match a specific numericrange. To do so, you can select the operator that you want to apply (greater than, equal to, and soon), and then enter the numeric value. For example, you can see the opportunity amounts broken bysales representative, and show only results with a won probability above 80%. To see these results, inyour workbook visualization you can add a condition-based filter to the probability (%) field, and set thecondition values to "greater" and "80%".
Note: Condition-based filters are available in numeric fields used as aggregate and non-aggregate fields. They apply to all workbook visualizations (charts, pivot tables, and table views).
To apply a condition-based filter to a workbook visualization:
1. Click the Field Menu icon next to any field in the Layout panel or Viewer and select Filter [FieldName]...
The Filter window appears.
2. In the Filter window, select the operator to use in the filter condition, and then enter the numericvalue.
3. Click OK.
The results are updated and the selected filter criteria is displayed above the Viewer.
Measure-based FiltersIn pivot tables, measure-based filters enable you to filter out entire columns or rows using filterconditions that are applied to the totals displayed in the table, based on the measures defined for thetable. In charts, any columns, bars, or lines with total values that do not meet the selected criteria areremoved from the chart.
For example, assume you have set up the following pivot table and you only want to see customers withover thirty thousand dollars in total transactions:
SuiteAnalytics Workbook
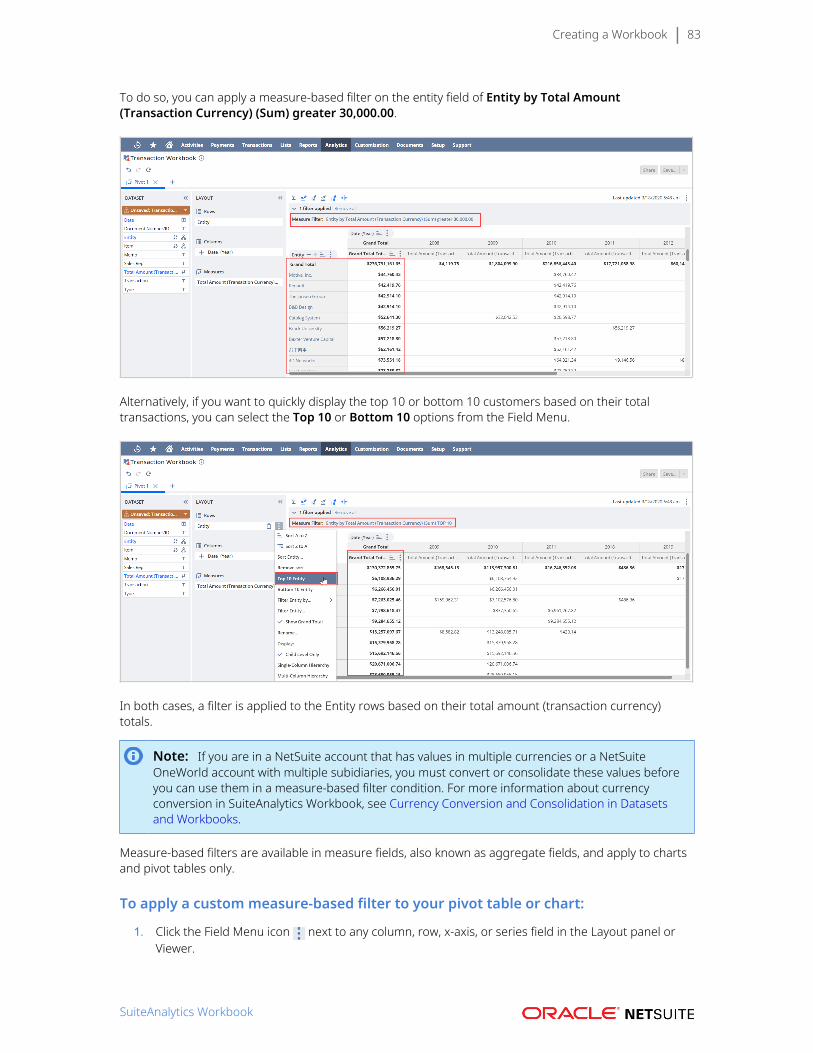
Creating a Workbook 83
To do so, you can apply a measure-based filter on the entity field of Entity by Total Amount(Transaction Currency) (Sum) greater 30,000.00.
Alternatively, if you want to quickly display the top 10 or bottom 10 customers based on their totaltransactions, you can select the Top 10 or Bottom 10 options from the Field Menu.
In both cases, a filter is applied to the Entity rows based on their total amount (transaction currency)totals.
Note: If you are in a NetSuite account that has values in multiple currencies or a NetSuiteOneWorld account with multiple subidiaries, you must convert or consolidate these values beforeyou can use them in a measure-based filter condition. For more information about currencyconversion in SuiteAnalytics Workbook, see Currency Conversion and Consolidation in Datasetsand Workbooks.
Measure-based filters are available in measure fields, also known as aggregate fields, and apply to chartsand pivot tables only.
To apply a custom measure-based filter to your pivot table or chart:
1. Click the Field Menu icon next to any column, row, x-axis, or series field in the Layout panel orViewer.
SuiteAnalytics Workbook
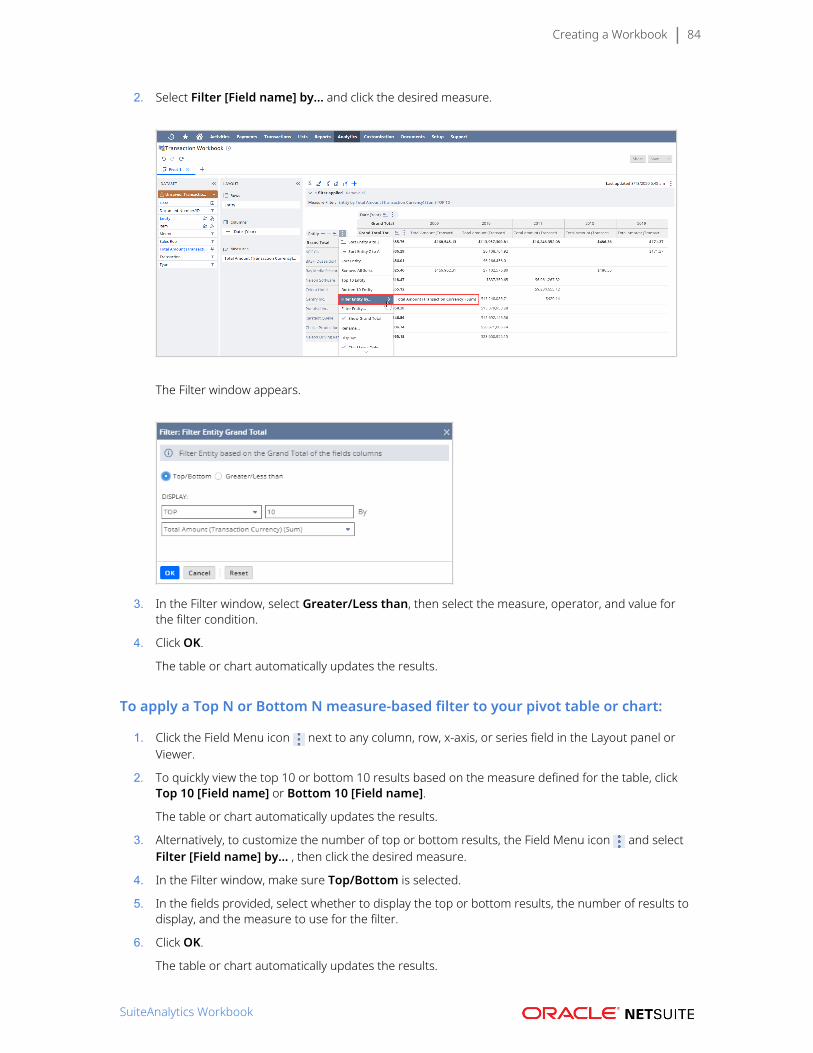
Creating a Workbook 84
2. Select Filter [Field name] by... and click the desired measure.
The Filter window appears.
3. In the Filter window, select Greater/Less than, then select the measure, operator, and value forthe filter condition.
4. Click OK.
The table or chart automatically updates the results.
To apply a Top N or Bottom N measure-based filter to your pivot table or chart:
1. Click the Field Menu icon next to any column, row, x-axis, or series field in the Layout panel orViewer.
2. To quickly view the top 10 or bottom 10 results based on the measure defined for the table, clickTop 10 [Field name] or Bottom 10 [Field name].
The table or chart automatically updates the results.
3. Alternatively, to customize the number of top or bottom results, the Field Menu icon and selectFilter [Field name] by... , then click the desired measure.
4. In the Filter window, make sure Top/Bottom is selected.
5. In the fields provided, select whether to display the top or bottom results, the number of results todisplay, and the measure to use for the filter.
6. Click OK.
The table or chart automatically updates the results.
SuiteAnalytics Workbook
Creating a Workbook 85
Date FiltersDate filters enable you to filter your results based on a specific date, custom date, or dynamic daterange that you choose. For example, you can select a dynamic date such as today, that update when theworkbook is run. You can only apply one date filter per workbook visualization.
Note: Date filters are available in date fields and apply to all workbook visualizations (charts,pivot tables, and table views).
To apply a date filter to a workbook visualization:
1. Click the Field Menu icon in the Dataset Panel or Layout Panel next to a date field and selectFilter Date> Advanced...
2. In the Filter Date (Advanced...) window, use the Specific Dates tab to enter a custom date or theDate Ranges tab to select a dynamic date. Use the Values tab to select specific dates from theunderlying dataset query results.
3. Click Apply.The workbook visualization automatically updates the results.
The results are updated and the selected filter criteria is displayed above the Viewer.
Currency Conversion and Consolidation in Datasetsand WorkbooksIf you are in a NetSuite account with transactions in multiple currencies, or a NetSuite Oneworld accountwith multiple subsidiaries, amount fields in your datasets and workbooks might display data in multiplecurrencies. To perform arithmetic operations and view totals for these fields, you must convert orconsolidate the field values to a single currency. This is particularly important if you are working with thetransaction, transaction line, or transaction accounting line record types. In transaction and transactionline, monetary values are stored in the currency of the transaction. In transaction accounting line,monetary values are stored in the base currency of the subsidiary assigned to the transaction, with anexchange rate based on the date of the transaction. For more information, see the video TransactionData Model in 2020.1.
Currency conversion in Workbook enables you to convert the values of a field to any currency that youhave set up in your account. Currency consolidation converts the values of a field to the currency of thelowest level subsidiary that is a common parent to all the subsidiaries that you have access to in youraccount.
You can perform currency conversion or consolidation directly from the user interface in any workbookvisualization. To convert or consolidate field values in a dataset, you must use a custom formula field.
For more information about currency conversion and consolidation in Workbook, see the following topics:
■ Currency Conversion in Workbook■ Currency Consolidation in Workbook
Currency Conversion in WorkbookCurrency conversion in Workbook enables you to convert the values of a field to any currency that youhave set up in your account. To apply currency conversion in a dataset or workbook, you must have
SuiteAnalytics Workbook
Currency Conversion and Consolidation in Datasets and Workbooks 86
the Multiple Currencies feature enabled in your account. Additionally, you should make sure that yourcurrency records, chart of accounts, currency exchange rates, and currency conversion rates are all set upcorrectly to ensure that the correct rates and accounting periods are used during conversion. For moreinformation, see the following topics:
■ Currency Exchange Rates
■ Consolidated Exchange Rates
■ Multiple Currencies in OneWorld
Currency Conversion Using Custom Formula FieldsIn the Dataset Builder, you can create custom formula fields using the context value #converted toconvert field values that are in multiple currencies. This is useful for when you want to perform arithmeticoperations using two fields that contain values in multiples currencies, or display totals for fields withvalues in multiple currencies.
For example, to display the remaining balances on the invoices in your account regardless of the originalcurrency used on each invoice, you can create a custom formula field using the following definition:TO_NUMBER({foreignamountpaid#converted}) - TO_NUMBER({foreignamountunpaid#converted}).The function TO_NUMBER is required because the current version of the Formula Builder does notsupport the CURRENCY output type, and TO_NUMBER casts these values to the FLOAT output type. Insingle currency accounts for example, you could use the formula TO_NUMBER({foreignamountpaid}) -TO_NUMBER({foreignamountunpaid}), without the #converted context value.
Depending on your formula definition, you can convert the values of a field to the base currency of youraccount or a specific currency that you choose. You can also specify the exchange rate based on the dateyou enter in the formula definition.
Use the following sample formulas to convert the values of the total amount (transaction currency) field.The output type for these formulas is FLOAT:
Note: To convert values from other fields, replace foreigntotal with a different field ID.
■ TO_NUMBER({foreigntotal#converted})
□ Displays the currency amounts in the base currency of your account. The exchange rate used forthe conversion is the rate that is in effect on the date when the query or workbook visualization isrun.
■ TO_NUMBER({foreigntotal#converted[1]})
□ Displays the currency amounts in the currency ID specified in the square brackets [1]. Theexchange rate used for the conversion is the rate that is in effect on the date when the query orworkbook visualization is run.
■ TO_NUMBER({foreigntotal#converted[1;2017-01-30]})
□ Displays the currency amounts in the currency specified in the square brackets [1], using theexchange rate that is in effect on a specific date. You must enter the date using the YYYY-MM-DDformat.
Currency Conversion from the User InterfaceIn a workbook visualization, you can convert currency values directly from the user interface. Theseoptions are not available from within a dataset.
SuiteAnalytics Workbook

Currency Conversion and Consolidation in Datasets and Workbooks 87
To apply conversion from within a workbook visualization, click the Field Menu icon next to atransaction or transaction line field in the Layout Panel or column header, then select Currency. Thefollowing options are presented:
■ Display Original: displays each amount in the original currency used for the transaction. In tableviews and pivot tables, this is the default selection for transaction and transaction line fields.
■ Apply Conversion: converts each amount using the currency and date selected on the Convert Towindow. By default, the Convert To window is set to the current date and the base currency assignedto your account. In charts, this is the default selection for transaction and transaction line fields.
■ Conversion Options...: opens the Convert To window. In the Convert To window, you select thecurrency and date to use when the Apply Conversion option is selected. The rates used in theconversion are drawn from the table of currency exchange rates set up in your account. For moreinformation, see the help topic Currency Exchange Rates List Page.
Note: If you check the Anchor Relative to Today box, the current date will be used for theconversion each time the workbook is opened.
Currency Consolidation in WorkbookCurrency consolidation in Workbook converts the values of a field to the currency of the lowest levelsubsidiary that is a common parent to all the subsidiaries that you have access to in your account. Therate type used for the consolidation is based on the general rate type set up for each account in yourchart of accounts: either Historical, Average, or Current. This is the same as the Per-Account optionused for exchange rate types in transaction saved searches. For more information, see the help topicConsolidated Exchange Rate Types for Transaction Searches.
Note: In Workbook, if Current is selected for an account, you cannot choose the exact periodor date to be used for the exchange rate. Instead, the rate is based on the date you run theworkbook visualization that the formula field is in. For more information, see the help topicConsolidated Exchange Rates.
Important: If a consolidated exchange rate is not available, the default rate of 1 is used.
Currency Consolidation Using Custom Formula FieldsTo apply currency consolidation in a dataset, you must create a custom formula field usingthe context value #currency_consolidated. For example, to consolidate the values ofthe amount net field from the transaction accounting line record type, use the formulaTO_NUMBER({transactionlines.accountingimpact.netamount#currency_consolidated}).
Currency Consolidation from the User InterfaceIn a workbook visualization, you can apply currency consolidation directly from the user interface onlyfor amount fields from the transaction accounting line record type. To do so, click the Field Menu icon next to a transaction accounting line field in the Layout Panel or column header, then point to Currencyand click Apply Consolidation. By default, this option is enabled in all workbook visualizations for amountfields from the transaction accounting line record type.
In the Dataset Builder, the Filter window also includes a Consolidate Field box when you create criteriafilters based on transaction accounting line fields.
SuiteAnalytics Workbook
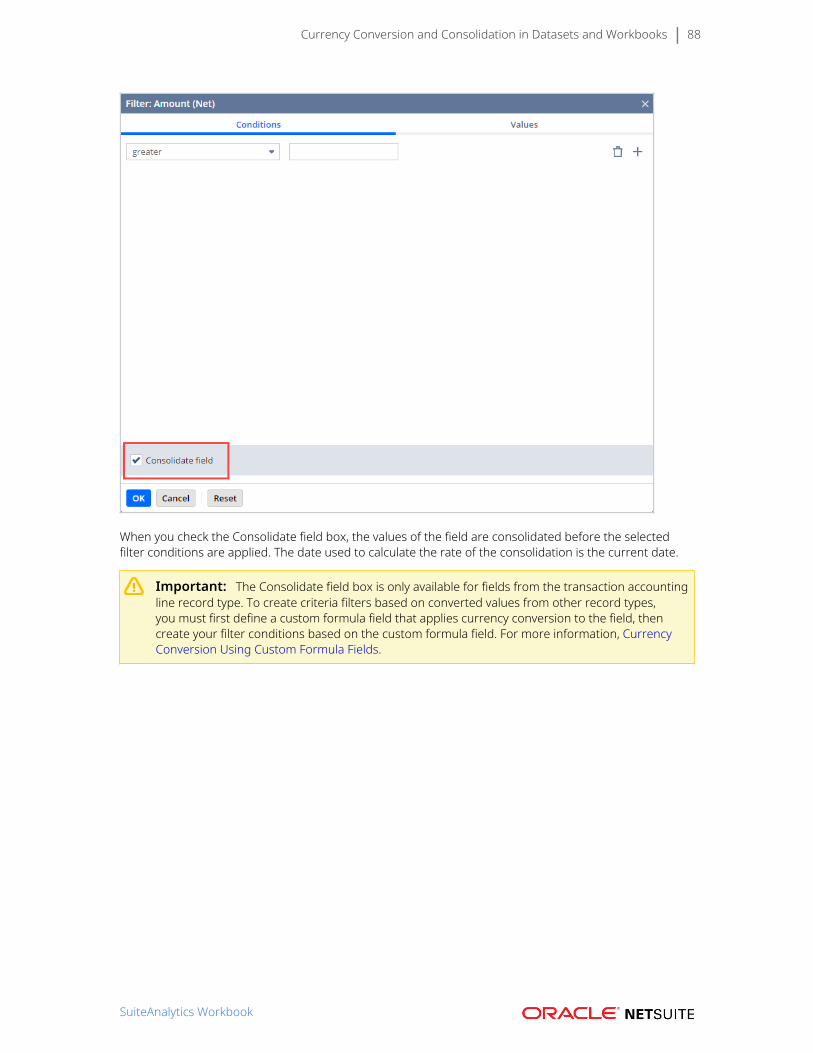
Currency Conversion and Consolidation in Datasets and Workbooks 88
When you check the Consolidate field box, the values of the field are consolidated before the selectedfilter conditions are applied. The date used to calculate the rate of the consolidation is the current date.
Important: The Consolidate field box is only available for fields from the transaction accountingline record type. To create criteria filters based on converted values from other record types,you must first define a custom formula field that applies currency conversion to the field, thencreate your filter conditions based on the custom formula field. For more information, CurrencyConversion Using Custom Formula Fields.
SuiteAnalytics Workbook
Workbook and Dataset Templates 89
Workbook and Dataset TemplatesSuiteAnalytics Workbook currently offers over 20 predefined workbook and dataset templates.
In a dataset template, all of the required fields, record types, and criteria filters are predefined so that youcan create a workbook without having to first define a complex, custom dataset. Conversely, workbooktemplates include predefined workbook visualizations such as table views, pivot tables, and charts, so thatyou can analyze and visualize the results of the accompanying dataset templates. In a workbook templateyou can also add additional visualizations based the dataset template already connected to the workbook,or any datasets that you have access to in your account.
By default, only users with the Analytics Administrator permission can access workbook and datasettemplates. If you do not have the Analytics Administrator permission, you can access these templatesonly if a user with the Analytics Administrator permission shares them with you. You must also haveaccess to the underlying dataset template to open a workbook template. Additionally, some templates arefeature dependent. If you do not see one of the listed templates in your account, contact your accountadministrator.
If you have the Analytics Administrator permission, you can access the templates from the Analytics Homepage, from either the Workbooks or Datasets subtabs.
For more information about the Analytics Administrator permission, see Analytics AdministratorPermission.
To see the dataset templates currently available in SuiteAnalytics Workbook, see Dataset Templates.
To see the workbook templates currently available in SuiteAnalytics Workbook, see Workbook Templates.
The sales (ordered) and sales (invoiced) workbook and dataset templates are based on custom analyticalrecord types designed specifically for SuiteAnalytics Workbook. These record types combine data fromthe transaction, transaction line, and transaction accounting line record types and are currently in a betastate. Consequently, the content of these workbooks is subject to change and is for test purposes only.Additionally, you cannot add charts, pivot tables or table views from these workbooks to the Analyticsportlet.
All other workbook and dataset templates that are in a beta state are also for test purposes only. Donot use these templates in your production accounts unless they are first reviewed by a NetSuiteadministrator.
Dataset TemplatesImportant: By default, only users with the Analytics Administrator permission can access theworkbook and dataset templates in your account. If you do not have the Analytics Administratorpermission, contact a user with the Analytics Administrator permission about sharing thetemplates with you.
SuiteAnalytics Workbook offers over 20 dataset templates. Each template includes preselected fields,joined record types, and criteria filters so that you can quickly create a custom workbook or your ownversion of the dataset. Additionally, each dataset template has an accompanying, predefined workbooktemplate. For information about workbook templates, see Workbook Templates.
The following dataset templates are currently available in SuiteAnalytics Workbook. If you have theAnalytics Adminstrator permission, access the templates by selecting Templates on the Datasets subtabof the Analytics Home page:
SuiteAnalytics Workbook
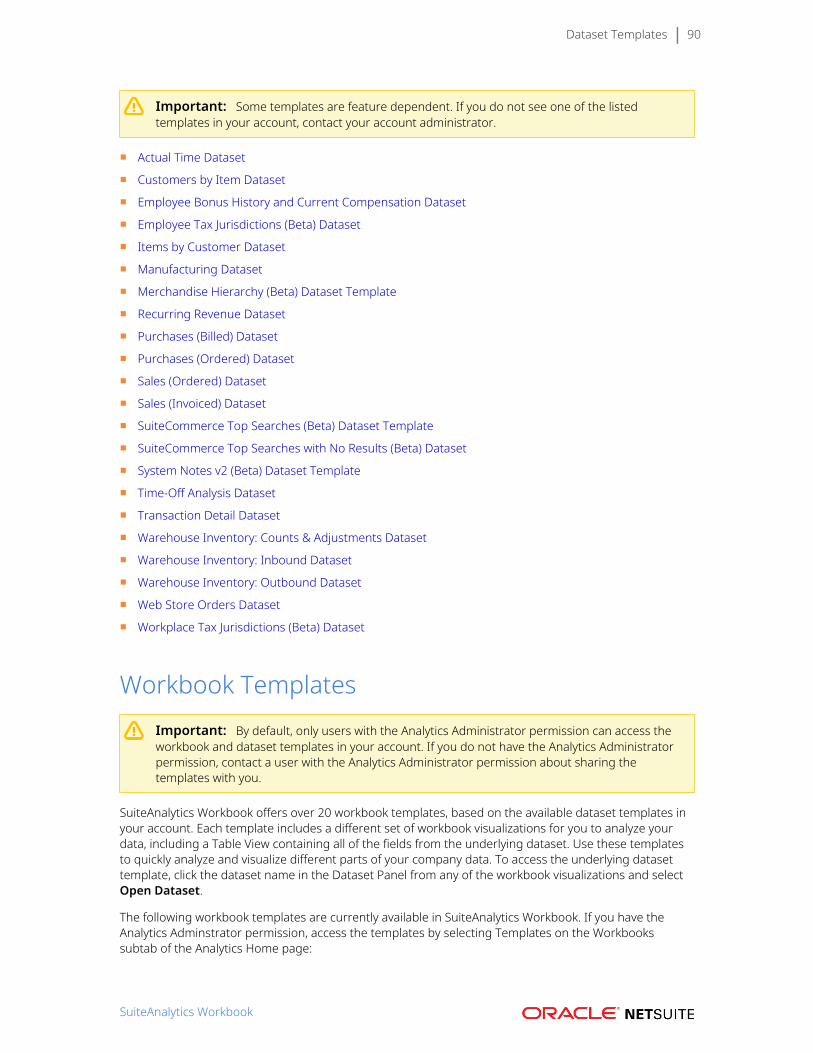
Dataset Templates 90
Important: Some templates are feature dependent. If you do not see one of the listedtemplates in your account, contact your account administrator.
■ Actual Time Dataset
■ Customers by Item Dataset
■ Employee Bonus History and Current Compensation Dataset
■ Employee Tax Jurisdictions (Beta) Dataset
■ Items by Customer Dataset
■ Manufacturing Dataset
■ Merchandise Hierarchy (Beta) Dataset Template
■ Recurring Revenue Dataset
■ Purchases (Billed) Dataset
■ Purchases (Ordered) Dataset
■ Sales (Ordered) Dataset
■ Sales (Invoiced) Dataset
■ SuiteCommerce Top Searches (Beta) Dataset Template
■ SuiteCommerce Top Searches with No Results (Beta) Dataset
■ System Notes v2 (Beta) Dataset Template
■ Time-Off Analysis Dataset
■ Transaction Detail Dataset
■ Warehouse Inventory: Counts & Adjustments Dataset
■ Warehouse Inventory: Inbound Dataset
■ Warehouse Inventory: Outbound Dataset
■ Web Store Orders Dataset
■ Workplace Tax Jurisdictions (Beta) Dataset
Workbook TemplatesImportant: By default, only users with the Analytics Administrator permission can access theworkbook and dataset templates in your account. If you do not have the Analytics Administratorpermission, contact a user with the Analytics Administrator permission about sharing thetemplates with you.
SuiteAnalytics Workbook offers over 20 workbook templates, based on the available dataset templates inyour account. Each template includes a different set of workbook visualizations for you to analyze yourdata, including a Table View containing all of the fields from the underlying dataset. Use these templatesto quickly analyze and visualize different parts of your company data. To access the underlying datasettemplate, click the dataset name in the Dataset Panel from any of the workbook visualizations and selectOpen Dataset.
The following workbook templates are currently available in SuiteAnalytics Workbook. If you have theAnalytics Adminstrator permission, access the templates by selecting Templates on the Workbookssubtab of the Analytics Home page:
SuiteAnalytics Workbook
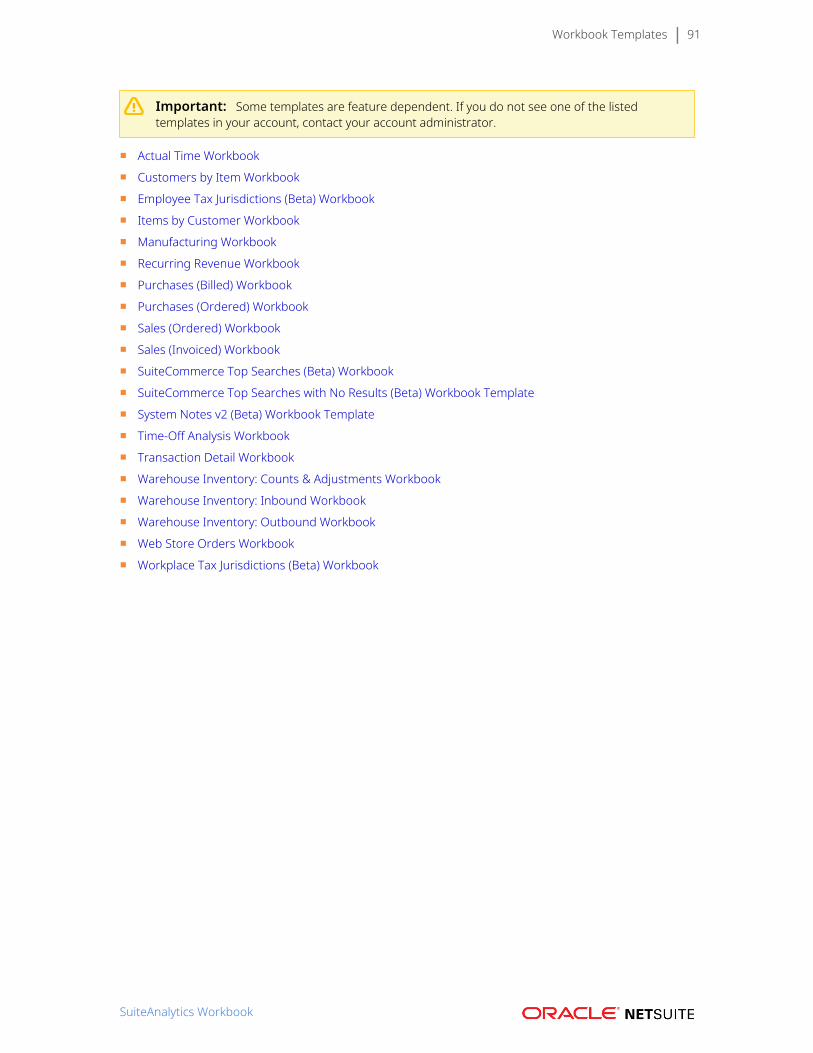
Workbook Templates 91
Important: Some templates are feature dependent. If you do not see one of the listedtemplates in your account, contact your account administrator.
■ Actual Time Workbook
■ Customers by Item Workbook
■ Employee Tax Jurisdictions (Beta) Workbook
■ Items by Customer Workbook
■ Manufacturing Workbook
■ Recurring Revenue Workbook
■ Purchases (Billed) Workbook
■ Purchases (Ordered) Workbook
■ Sales (Ordered) Workbook
■ Sales (Invoiced) Workbook
■ SuiteCommerce Top Searches (Beta) Workbook
■ SuiteCommerce Top Searches with No Results (Beta) Workbook Template
■ System Notes v2 (Beta) Workbook Template
■ Time-Off Analysis Workbook
■ Transaction Detail Workbook
■ Warehouse Inventory: Counts & Adjustments Workbook
■ Warehouse Inventory: Inbound Workbook
■ Warehouse Inventory: Outbound Workbook
■ Web Store Orders Workbook
■ Workplace Tax Jurisdictions (Beta) Workbook
SuiteAnalytics Workbook
Workbook-based Portlets 92
Workbook-based PortletsWith the Analytics portlet, SuiteAnalytics Workbook enables you to view your workbook data on yourdashboards. The Analytics portlet lets you add charts, pivot tables, and table views from workbooks listedin the My Workbooks and Shared with Me sections of the Workbook Listing Page. You can add up to 10Analytics portlets to your dashboards, each with a unique chart and pivot table.
For more information, see the help topic Workbooks Overview.
Displaying Chart and Pivot Data in the AnalyticsPortletsTo display your chart and pivot data on your home dashboard, you can add and set up the Analyticsportlet. The portlet enables you to quickly see the workbook data and provides quick access to yourworkbook. Visualizing the data right on your dashboard enables you to spend more time learning from itand less time gathering it.
You can also choose how you want to visualize the workbook data on your portlet. To identify theAnalytics portlet on your dashboard, you can enter a title. By default the title displays the name of theworkbook and the chart. Additionally, you can set layout options, such as the following:
■ For charts, you can set the portlet size and chart type.
■ For pivot tables and table views, you can enter the number of rows you want to view at once whenloading the pivot table.
For more information on how to add and set up an Analytics portlet, see the help topics Adding anAnalytics Portlet and Setting Up the Analytics Portlet.
SuiteAnalytics Workbook
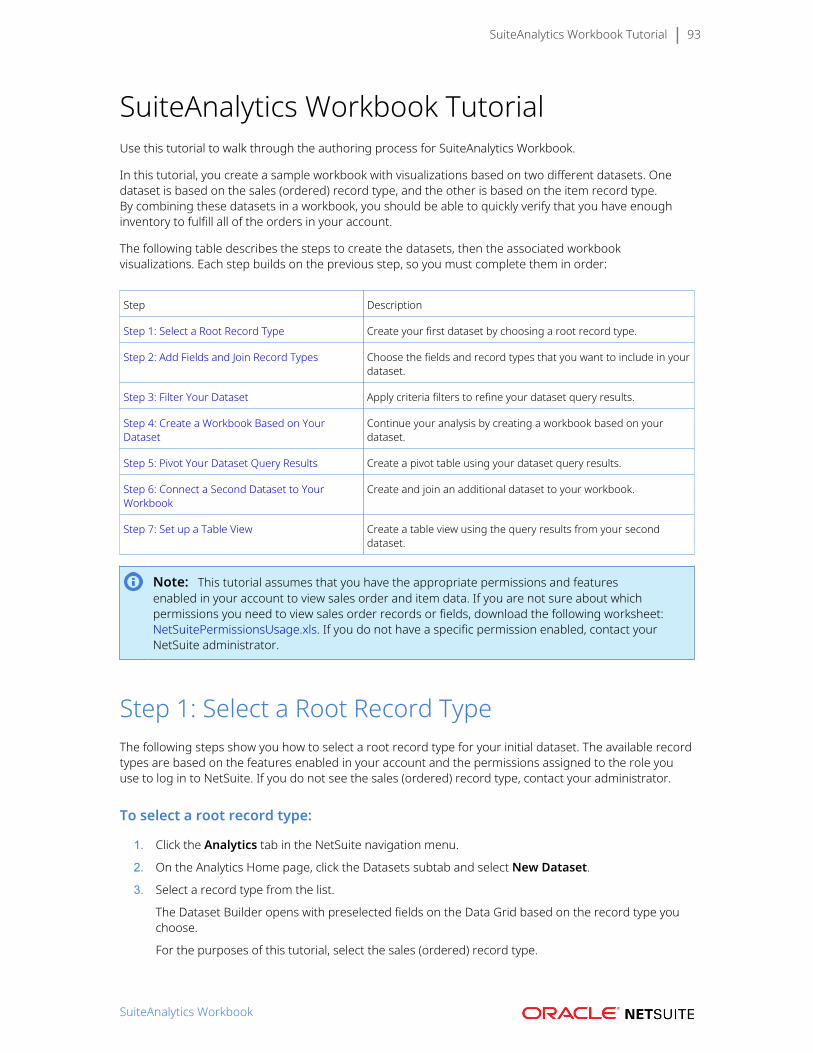
SuiteAnalytics Workbook Tutorial 93
SuiteAnalytics Workbook TutorialUse this tutorial to walk through the authoring process for SuiteAnalytics Workbook.
In this tutorial, you create a sample workbook with visualizations based on two different datasets. Onedataset is based on the sales (ordered) record type, and the other is based on the item record type.By combining these datasets in a workbook, you should be able to quickly verify that you have enoughinventory to fulfill all of the orders in your account.
The following table describes the steps to create the datasets, then the associated workbookvisualizations. Each step builds on the previous step, so you must complete them in order:
Step Description
Step 1: Select a Root Record Type Create your first dataset by choosing a root record type.
Step 2: Add Fields and Join Record Types Choose the fields and record types that you want to include in yourdataset.
Step 3: Filter Your Dataset Apply criteria filters to refine your dataset query results.
Step 4: Create a Workbook Based on YourDataset
Continue your analysis by creating a workbook based on yourdataset.
Step 5: Pivot Your Dataset Query Results Create a pivot table using your dataset query results.
Step 6: Connect a Second Dataset to YourWorkbook
Create and join an additional dataset to your workbook.
Step 7: Set up a Table View Create a table view using the query results from your seconddataset.
Note: This tutorial assumes that you have the appropriate permissions and featuresenabled in your account to view sales order and item data. If you are not sure about whichpermissions you need to view sales order records or fields, download the following worksheet:NetSuitePermissionsUsage.xls. If you do not have a specific permission enabled, contact yourNetSuite administrator.
Step 1: Select a Root Record TypeThe following steps show you how to select a root record type for your initial dataset. The available recordtypes are based on the features enabled in your account and the permissions assigned to the role youuse to log in to NetSuite. If you do not see the sales (ordered) record type, contact your administrator.
To select a root record type:
1. Click the Analytics tab in the NetSuite navigation menu.
2. On the Analytics Home page, click the Datasets subtab and select New Dataset.
3. Select a record type from the list.
The Dataset Builder opens with preselected fields on the Data Grid based on the record type youchoose.
For the purposes of this tutorial, select the sales (ordered) record type.
SuiteAnalytics Workbook

Step 1: Select a Root Record Type 94
Continue to Step 2: Add Fields and Join Record Types.
Step 2: Add Fields and Join Record TypesIf you have not already done so, complete Step 1: Select a Root Record Type.
The following steps show you how to add fields and join record types to your dataset. Only fields that areincluded on the Data Grid can be used to build workbook visualizations such as tables, pivot tables, andcharts.
By default, the Data Grid displays preselected fields based on the root record type selected for thedataset. Fields that you add to the grid appear highlighted at the top of the Fields list.
To add fields and join record types:
1. Add fields from the root record type to the Data Grid. You have three options:
■ Drag the fields from the Fields list to the Data Grid.
■ Double-click the fields in the Fields list.
■ Type the name of the fields in the search bar at the top of the Fields list, then drag or double-click them to add them to the Data Grid.
For the purposes of this tutorial, you do not need to add any additional fields from the sales(ordered) record type.
2. Join related record types to the dataset by adding their fields to the Data Grid.
a. By default, the Records list on the Dataset Builder shows all related record types that youhave access to in your account.
Click the arrow next to any record type in the Records list to view additional related recordtypes.
b. Click the desired record type name to update the Fields list.
c. Double-click or drag the desired fields to the Data Grid.
Note: Depending on the relationship between record types that you join in adataset, data duplication might occur. For more information, see Guidelines forJoining Record Types in SuiteAnalytics Workbook.
For the purposes of this tutorial, add the status field from the transaction record type.
3. Create and add formula fields to the Data Grid.
a. Click the Formulas link above the Records list.
b. Click New Formula in the Fields list.
c. In the Formula Field window, enter the formula field name.
d. Select an output type for the formula field values.
Note: Each output type only works with certain fields and formula functions. If youselect an incompatible output type for the formula, the formula is invalidated. Formore information, see Formula Fields.
e. In the Formula field, enter the field IDs and SQL formula functions to use in the formulaexpression. Alternatively, double-click the desired field IDs or formula functions from theFunctions and Fields subtabs to add them to the expression.
SuiteAnalytics Workbook
Step 2: Add Fields and Join Record Types 95
Note: The Fields subtab only includes fields from the root record type in thedataset and any related record types that you have accessed on the Dataset Builder.If you want to include fields from a related record type in your formula expression,you must either access the record type on the Dataset Builder or manually enter thefield ID into the expression.
f. To validate the formula, click Validate.
g. If there are no errors, click Apply to add the formula field to the dataset.
For the purposes of this tutorial, no formula fields are required.
4. Remove any fields you do not want to include in the dataset.
a. Click the Field Menu icon in the column you want to remove from the Data Grid.
b. Select Remove Column from the dropdown list.
For the purposes of this tutorial, remove the memo and partner fields.
Warning: Any changes you make to a dataset are automatically propagated toworkbook visualizations that are based on the dataset. Removing a field from theData Grid can therefore cause failures in the associated workbook visualizations.Exercise caution when removing a field from the grid.
Continue to Step 3: Filter Your Dataset.
Step 3: Filter Your DatasetIf you have not already done so, complete Step 2: Add Fields and Join Record Types.
The following steps show you how to filter you dataset query results. Criteria filters that you apply to thedataset are propagated to any new or existing workbook visualizations that you create based on thedataset. For example, if you create a criteria filter to exclude any sales orders created in the last week,data from those sales orders are not presented in any previously associated workbook visualizations, ornew visualizations that you create using this dataset.
To filter your dataset:
1. On the Dataset Builder, drag the desired record field or formula field from the Fields list to theCriteria Builder above the Data Grid.
(Optional) If the field you want to use is already in the Data Grid, drag the field header from the gridto the Criteria Builder.
SuiteAnalytics Workbook
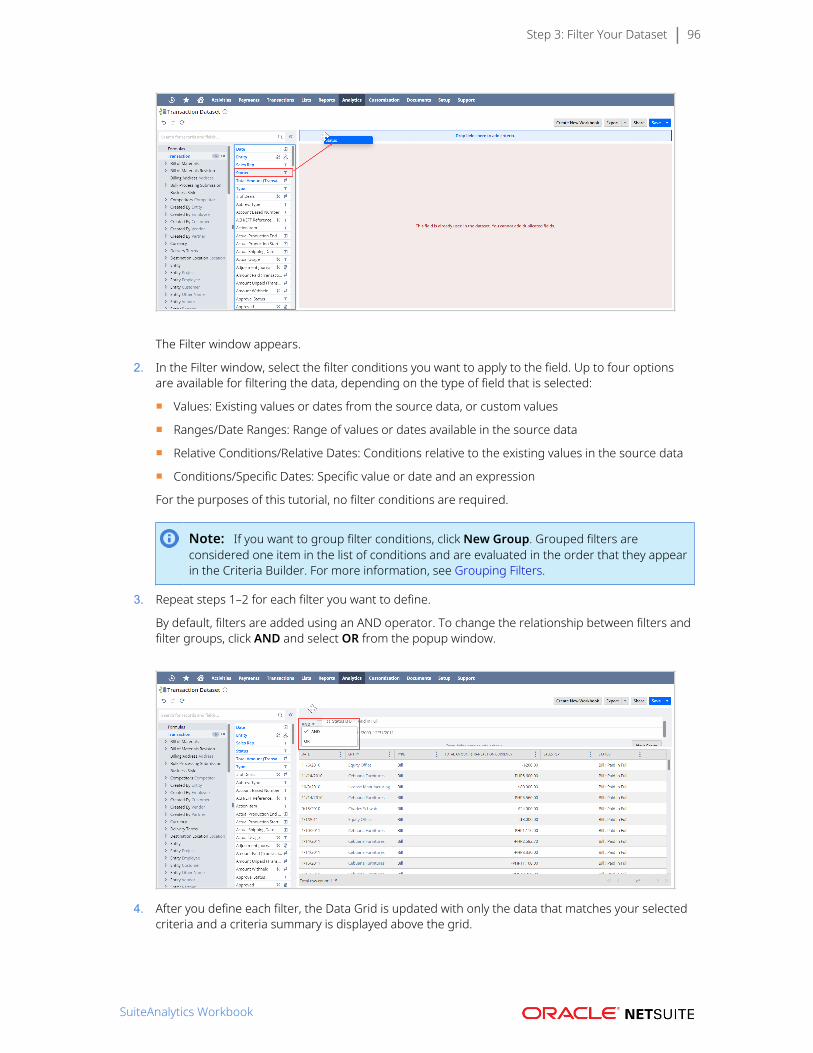
Step 3: Filter Your Dataset 96
The Filter window appears.
2. In the Filter window, select the filter conditions you want to apply to the field. Up to four optionsare available for filtering the data, depending on the type of field that is selected:
■ Values: Existing values or dates from the source data, or custom values
■ Ranges/Date Ranges: Range of values or dates available in the source data
■ Relative Conditions/Relative Dates: Conditions relative to the existing values in the source data
■ Conditions/Specific Dates: Specific value or date and an expression
For the purposes of this tutorial, no filter conditions are required.
Note: If you want to group filter conditions, click New Group. Grouped filters areconsidered one item in the list of conditions and are evaluated in the order that they appearin the Criteria Builder. For more information, see Grouping Filters.
3. Repeat steps 1–2 for each filter you want to define.
By default, filters are added using an AND operator. To change the relationship between filters andfilter groups, click AND and select OR from the popup window.
4. After you define each filter, the Data Grid is updated with only the data that matches your selectedcriteria and a criteria summary is displayed above the grid.
SuiteAnalytics Workbook

Step 3: Filter Your Dataset 97
Important: If you want to convert field values that are in multiple currencies, youmust do so from within a workbook visualization or using a custom formula field with theTO_NUMBER function. For more information, see Currency Conversion and Consolidation inDatasets and Workbooks.
5. Click Save.
The Save Dataset As window appears.
6. Enter a name and description for the dataset in the fields provided.
7. Click Save.
Continue to Step 4: Create a Workbook Based on Your Dataset.
Step 4: Create a Workbook Based on Your DatasetIf you have not already done so, complete Step 3: Filter Your Dataset.
The following steps show you how to create a workbook based on your completed dataset.
Note: If you want to create additional workbooks based on the dataset you saved in Step 3, goto the Analytics Home page and click New Workbook on the Workbooks subtab. Then, select thedataset you saved to open a new workbook.
If you want to edit the dataset from within your workbook, click the dataset name in the DatasetPanel in any workbook visualization.
To create a workbook based on your dataset:
1. On the Dataset Builder, click Create New Workbook.
2. A workbook will open.
By default, the workbook is named after the root record type on the dataset.
3. Select a workbook visualization you want to create: either a Table View, Pivot table, or Chart.
For the purposes of this procedure, select Pivot.
Continue to Step 5: Pivot Your Dataset Query Results.
Step 5: Pivot Your Dataset Query ResultsIf you have not already done so, complete Step 4: Create a Workbook Based on Your Dataset.
The following steps show you how to pivot your dataset query results to create a pivot table.
To pivot your source data:
1. On the Pivot tab, drag the desired fields from the Fields list to the Rows, Columns, or Values tabs inthe Layout panel. Alternatively, drag the fields from the Fields list directly to the Pivot Table Viewer.
SuiteAnalytics Workbook
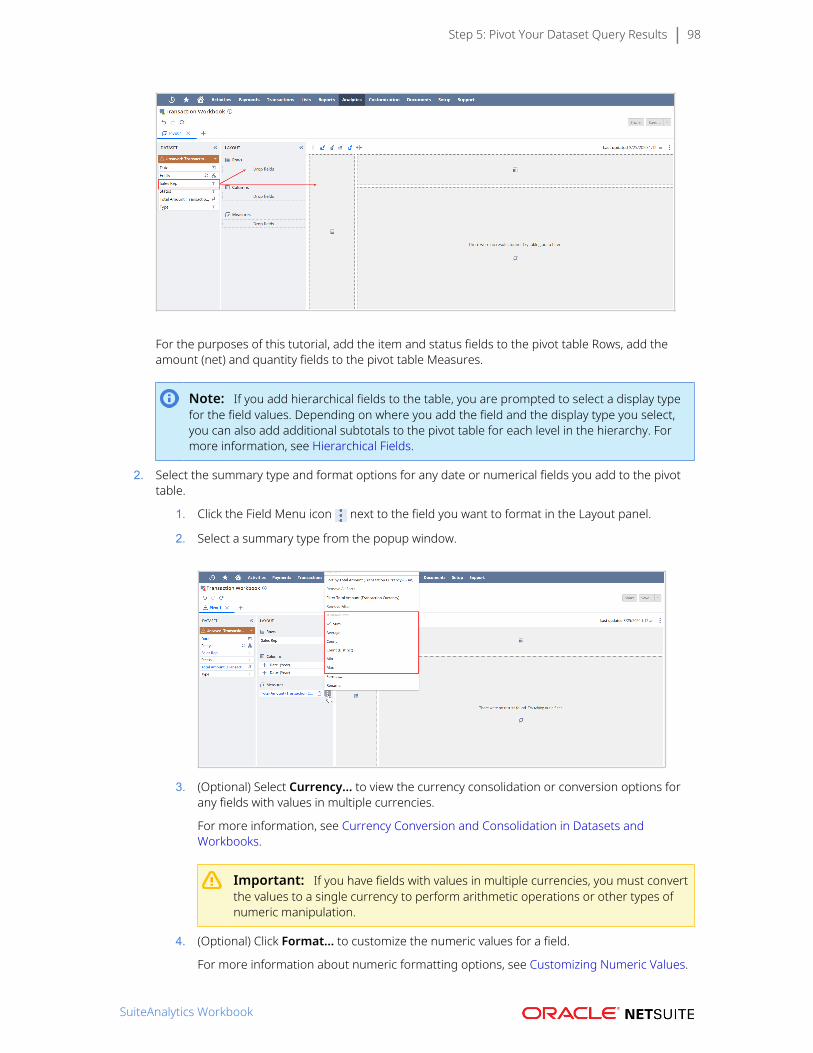
Step 5: Pivot Your Dataset Query Results 98
For the purposes of this tutorial, add the item and status fields to the pivot table Rows, add theamount (net) and quantity fields to the pivot table Measures.
Note: If you add hierarchical fields to the table, you are prompted to select a display typefor the field values. Depending on where you add the field and the display type you select,you can also add additional subtotals to the pivot table for each level in the hierarchy. Formore information, see Hierarchical Fields.
2. Select the summary type and format options for any date or numerical fields you add to the pivottable.
1. Click the Field Menu icon next to the field you want to format in the Layout panel.
2. Select a summary type from the popup window.
3. (Optional) Select Currency... to view the currency consolidation or conversion options forany fields with values in multiple currencies.
For more information, see Currency Conversion and Consolidation in Datasets andWorkbooks.
Important: If you have fields with values in multiple currencies, you must convertthe values to a single currency to perform arithmetic operations or other types ofnumeric manipulation.
4. (Optional) Click Format... to customize the numeric values for a field.
For more information about numeric formatting options, see Customizing Numeric Values.
SuiteAnalytics Workbook
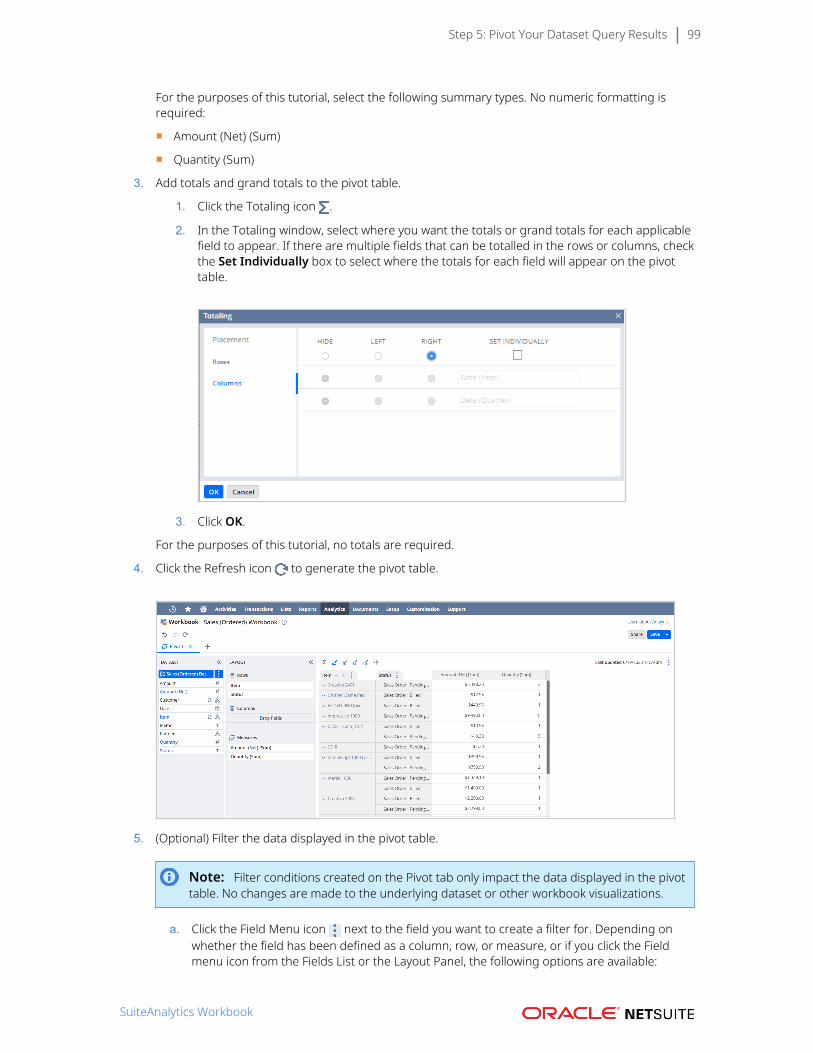
Step 5: Pivot Your Dataset Query Results 99
For the purposes of this tutorial, select the following summary types. No numeric formatting isrequired:
■ Amount (Net) (Sum)
■ Quantity (Sum)
3. Add totals and grand totals to the pivot table.
1. Click the Totaling icon .
2. In the Totaling window, select where you want the totals or grand totals for each applicablefield to appear. If there are multiple fields that can be totalled in the rows or columns, checkthe Set Individually box to select where the totals for each field will appear on the pivottable.
3. Click OK.
For the purposes of this tutorial, no totals are required.
4. Click the Refresh icon to generate the pivot table.
5. (Optional) Filter the data displayed in the pivot table.
Note: Filter conditions created on the Pivot tab only impact the data displayed in the pivottable. No changes are made to the underlying dataset or other workbook visualizations.
a. Click the Field Menu icon next to the field you want to create a filter for. Depending onwhether the field has been defined as a column, row, or measure, or if you click the Fieldmenu icon from the Fields List or the Layout Panel, the following options are available:
SuiteAnalytics Workbook
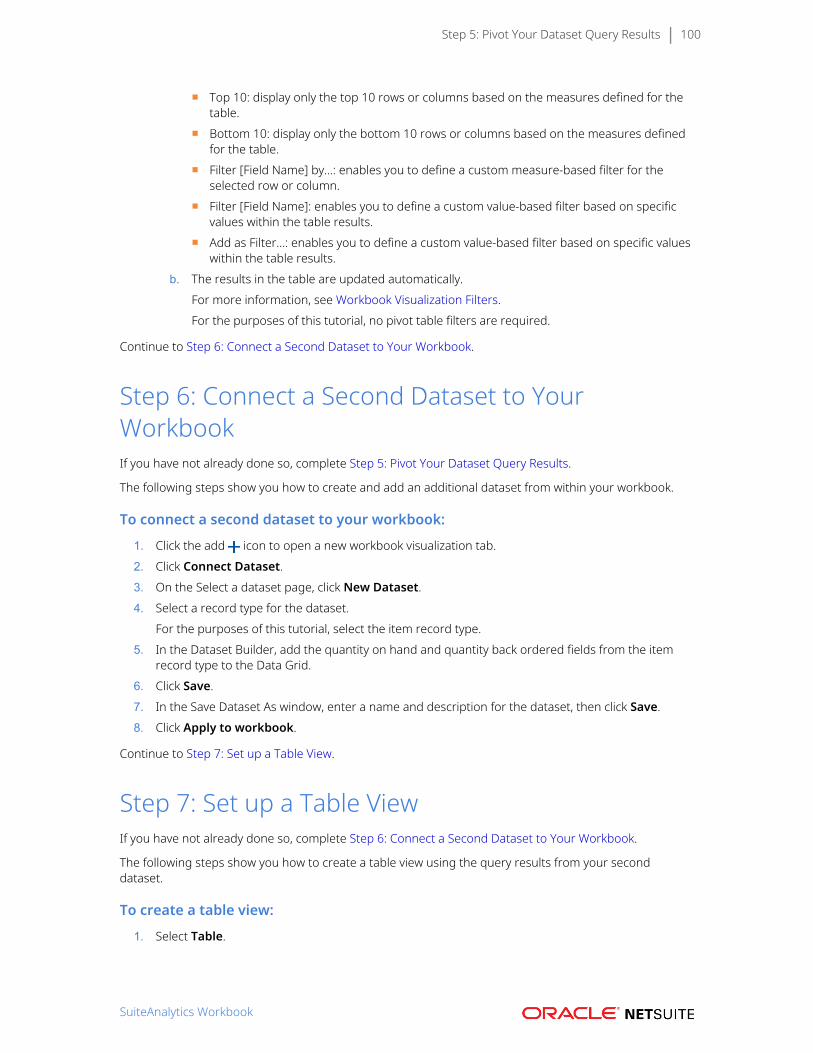
Step 5: Pivot Your Dataset Query Results 100
■ Top 10: display only the top 10 rows or columns based on the measures defined for thetable.
■ Bottom 10: display only the bottom 10 rows or columns based on the measures definedfor the table.
■ Filter [Field Name] by...: enables you to define a custom measure-based filter for theselected row or column.
■ Filter [Field Name]: enables you to define a custom value-based filter based on specificvalues within the table results.
■ Add as Filter...: enables you to define a custom value-based filter based on specific valueswithin the table results.
b. The results in the table are updated automatically.For more information, see Workbook Visualization Filters.For the purposes of this tutorial, no pivot table filters are required.
Continue to Step 6: Connect a Second Dataset to Your Workbook.
Step 6: Connect a Second Dataset to YourWorkbookIf you have not already done so, complete Step 5: Pivot Your Dataset Query Results.
The following steps show you how to create and add an additional dataset from within your workbook.
To connect a second dataset to your workbook:
1. Click the add icon to open a new workbook visualization tab.2. Click Connect Dataset.3. On the Select a dataset page, click New Dataset.4. Select a record type for the dataset.
For the purposes of this tutorial, select the item record type.5. In the Dataset Builder, add the quantity on hand and quantity back ordered fields from the item
record type to the Data Grid.6. Click Save.7. In the Save Dataset As window, enter a name and description for the dataset, then click Save.8. Click Apply to workbook.
Continue to Step 7: Set up a Table View.
Step 7: Set up a Table ViewIf you have not already done so, complete Step 6: Connect a Second Dataset to Your Workbook.
The following steps show you how to create a table view using the query results from your seconddataset.
To create a table view:
1. Select Table.
SuiteAnalytics Workbook
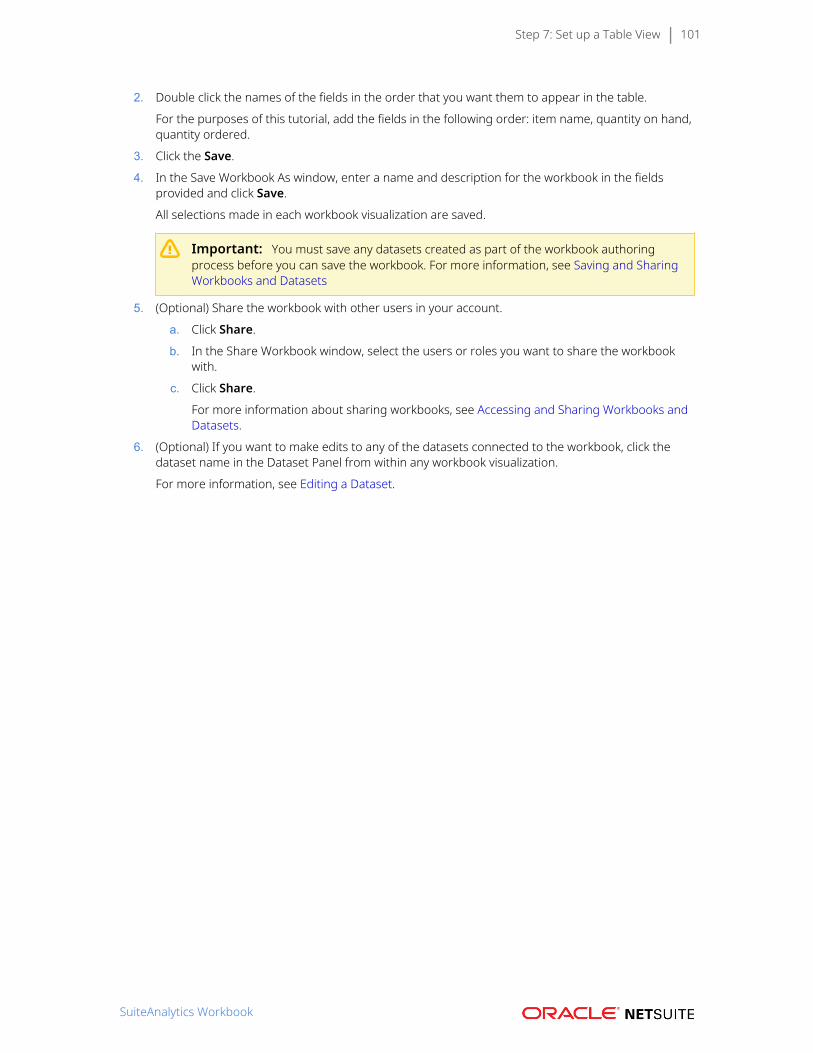
Step 7: Set up a Table View 101
2. Double click the names of the fields in the order that you want them to appear in the table.
For the purposes of this tutorial, add the fields in the following order: item name, quantity on hand,quantity ordered.
3. Click the Save.
4. In the Save Workbook As window, enter a name and description for the workbook in the fieldsprovided and click Save.
All selections made in each workbook visualization are saved.
Important: You must save any datasets created as part of the workbook authoringprocess before you can save the workbook. For more information, see Saving and SharingWorkbooks and Datasets
5. (Optional) Share the workbook with other users in your account.
a. Click Share.
b. In the Share Workbook window, select the users or roles you want to share the workbookwith.
c. Click Share.
For more information about sharing workbooks, see Accessing and Sharing Workbooks andDatasets.
6. (Optional) If you want to make edits to any of the datasets connected to the workbook, click thedataset name in the Dataset Panel from within any workbook visualization.
For more information, see Editing a Dataset.
SuiteAnalytics Workbook
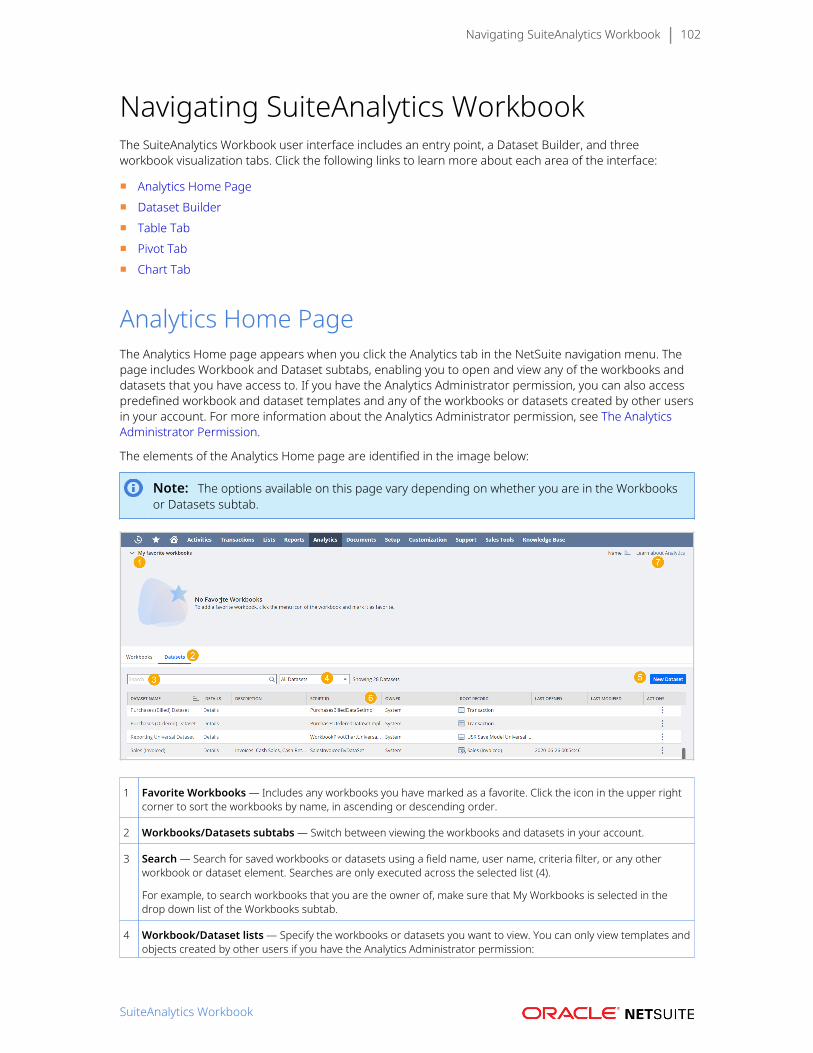
Navigating SuiteAnalytics Workbook 102
Navigating SuiteAnalytics WorkbookThe SuiteAnalytics Workbook user interface includes an entry point, a Dataset Builder, and threeworkbook visualization tabs. Click the following links to learn more about each area of the interface:
■ Analytics Home Page■ Dataset Builder■ Table Tab■ Pivot Tab■ Chart Tab
Analytics Home PageThe Analytics Home page appears when you click the Analytics tab in the NetSuite navigation menu. Thepage includes Workbook and Dataset subtabs, enabling you to open and view any of the workbooks anddatasets that you have access to. If you have the Analytics Administrator permission, you can also accesspredefined workbook and dataset templates and any of the workbooks or datasets created by other usersin your account. For more information about the Analytics Administrator permission, see The AnalyticsAdministrator Permission.
The elements of the Analytics Home page are identified in the image below:
Note: The options available on this page vary depending on whether you are in the Workbooksor Datasets subtab.
1 Favorite Workbooks — Includes any workbooks you have marked as a favorite. Click the icon in the upper rightcorner to sort the workbooks by name, in ascending or descending order.
2 Workbooks/Datasets subtabs — Switch between viewing the workbooks and datasets in your account.
3 Search — Search for saved workbooks or datasets using a field name, user name, criteria filter, or any otherworkbook or dataset element. Searches are only executed across the selected list (4).
For example, to search workbooks that you are the owner of, make sure that My Workbooks is selected in thedrop down list of the Workbooks subtab.
4 Workbook/Dataset lists — Specify the workbooks or datasets you want to view. You can only view templates andobjects created by other users if you have the Analytics Administrator permission:
SuiteAnalytics Workbook
Analytics Home Page 103
■ All Workbooks/ Datasets- Every workbook or dataset that you have access to in your account.
■ My Workbooks/ Datasets- Workbooks or datasets that you have created.
■ Shared with me- Workbooks and datasets that other users have created and shared with you.
■ Employee Workbooks/ Datasets- Workbooks and datasets created by other users in your account.
■ Templates- Predefined workbook and dataset templates. For more information, see Workbook and DatasetTemplates.
5 New Workbook/Dataset — On the Workbook subtab, click New Workbook to begin authoring a workbook usingan existing dataset or a new dataset that you create. On the Dataset subtab, click New Dataset to select a recordtype and begin authoring a new dataset. For more information, see Custom Workbooks and Datasets.
6 Workbook/Dataset Viewer — All workbooks and datasets that you have access to are presented in a table. Ifyou are on the Workbooks subtab, you can also view each workbook as a thumbnail.
In the table, the owner, creation date, and other information is displayed for each object.
■ To view additional details about a dataset including a summary of the fields and criteria filters used, or therecord types that are joined within it, click Details. From the Details Panel, you can also create a new workbookbased on the dataset.
■ To view additional details about a workbook including a list of each visualization and the datasets they arebased on, click Details. From the Details Panel, you can also access each dataset that the visualizations arebased on.
■ To delete or share a workbook or dataset, click the menu icon and select Share or Delete. For datasets, youalso have the option to Create Workbook.
7 Learn about Analytics — Click Learn about Analytics to open a panel that lists all SuiteAnaltyics Workbookvideos as well as a description. To view a video, click the thumbnail and it will open in a new window.
Dataset BuilderThe Dataset Builder appears after you select a root record type for a new dataset, or if you click thedataset name in the Dataset Panel of a workbook. On this tab you combine record types, fields, andcriteria filters to create queries. The results of these queries are the basis for all workbook visualizations inyour account.
On the Dataset Builder, your query results are displayed in a tabular format in the Data Grid on the right.Record types, fields, custom formula fields, and configuration options appear in the Records and Fieldslists on the left. Only fields that are included in the Data Grid can be used to build workbook visualizationssuch as pivot tables and charts.
Above the Data Grid is the Criteria Builder where you create criteria filters to refine the results displayedin the grid. Criteria filters impact not only your dataset query results but also the data presented inworkbook visualizations that are based on the dataset.
To build your dataset, drag fields from the Fields list to the Data Grid. To create a filter condition, dragfields from the Fields list or the Data Grid to the Criteria Builder. On the grid itself, you can sort and filterthe values that are presented. After you create your query, you have multiple options to apply or previewthe results in a workbook.
■ For information about how to use the Dataset Builder to create a query, see Defining a Dataset.
■ For information about creating criteria filters to refine your query results, see Dataset Criteria Filters.
■ For information about creating a workbook based on your dataset query results, see Creating aWorkbook.
The elements of the Dataset Builder are identified in the image below:
SuiteAnalytics Workbook
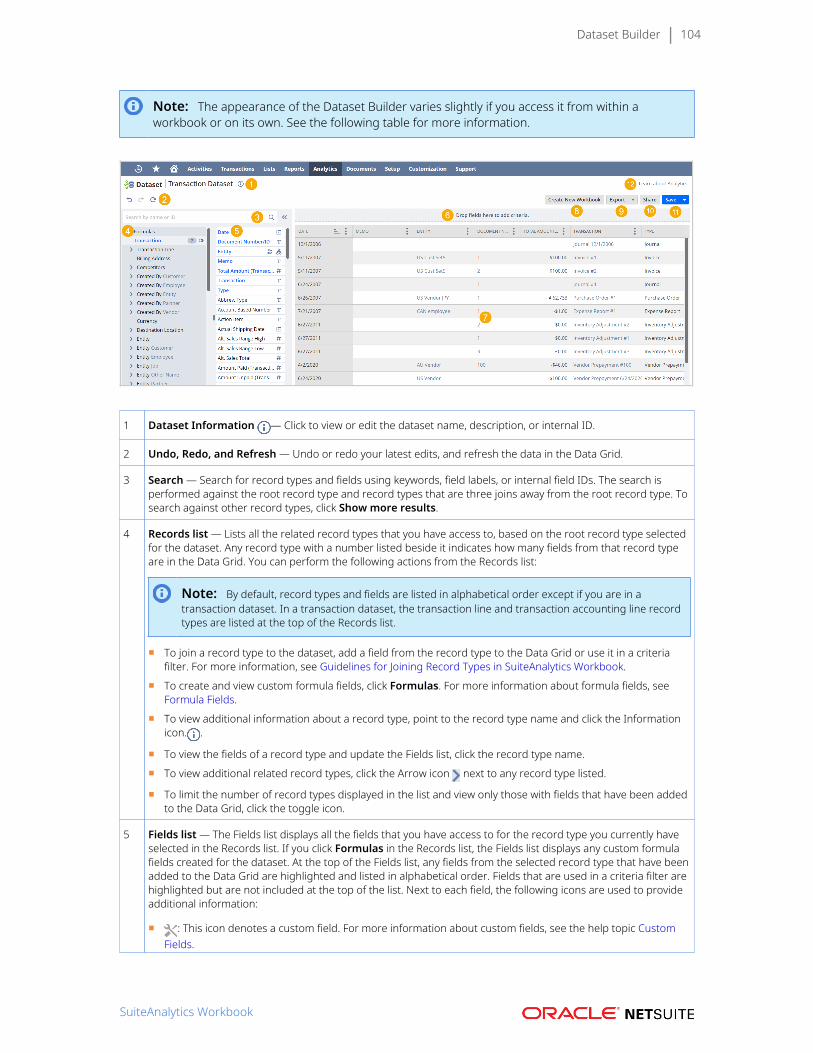
Dataset Builder 104
Note: The appearance of the Dataset Builder varies slightly if you access it from within aworkbook or on its own. See the following table for more information.
1 Dataset Information — Click to view or edit the dataset name, description, or internal ID.
2 Undo, Redo, and Refresh — Undo or redo your latest edits, and refresh the data in the Data Grid.
3 Search — Search for record types and fields using keywords, field labels, or internal field IDs. The search isperformed against the root record type and record types that are three joins away from the root record type. Tosearch against other record types, click Show more results.
4 Records list — Lists all the related record types that you have access to, based on the root record type selectedfor the dataset. Any record type with a number listed beside it indicates how many fields from that record typeare in the Data Grid. You can perform the following actions from the Records list:
Note: By default, record types and fields are listed in alphabetical order except if you are in atransaction dataset. In a transaction dataset, the transaction line and transaction accounting line recordtypes are listed at the top of the Records list.
■ To join a record type to the dataset, add a field from the record type to the Data Grid or use it in a criteriafilter. For more information, see Guidelines for Joining Record Types in SuiteAnalytics Workbook.
■ To create and view custom formula fields, click Formulas. For more information about formula fields, seeFormula Fields.
■ To view additional information about a record type, point to the record type name and click the Informationicon. .
■ To view the fields of a record type and update the Fields list, click the record type name.
■ To view additional related record types, click the Arrow icon next to any record type listed.
■ To limit the number of record types displayed in the list and view only those with fields that have been addedto the Data Grid, click the toggle icon.
5 Fields list — The Fields list displays all the fields that you have access to for the record type you currently haveselected in the Records list. If you click Formulas in the Records list, the Fields list displays any custom formulafields created for the dataset. At the top of the Fields list, any fields from the selected record type that have beenadded to the Data Grid are highlighted and listed in alphabetical order. Fields that are used in a criteria filter arehighlighted but are not included at the top of the list. Next to each field, the following icons are used to provideadditional information:
■ : This icon denotes a custom field. For more information about custom fields, see the help topic CustomFields.
SuiteAnalytics Workbook
Dataset Builder 105
■ : This icon denotes a polymorphic field. Polymorphic fields contain values that exist on multiple recordtypes. For example, the customer field on the sales (ordered) record type, which contains the same data asthe Name/ID field in the Customer record.
■ : This icon denotes a hierarchical field. Hierarchical fields have a defined parent-child relationship inNetSuite. These fields have multiple display options and can be used to create criteria filters based on theparent or child values in each record. For more information, see Hierarchical Fields.
■ : These icons denote the type of values contained within the field. Fields can include eithertext, numerical, date, or boolean data.
Using the Fields list, you can perform the following actions:
■ To collapse the Records and Fields lists and expand the Data Grid, click the double arrows .
■ To view additional information about a field, point to the field and click the icon.
■ To add a field to your dataset, double-click or drag the field from the Fields list to the Data Grid.
■ To create a criteria filter, drag a field from the Fields list to the Criteria Builder above the Data Grid.
■ (Optional) If the field you want to use is already in the Data Grid, drag the field header from the grid to theCriteria Builder.
Important: When you add fields from related record types to the Data Grid or use fields fromrelated record types to create criteria filters, the record type is joined to the dataset. Depending onthe relationship between the related record type and the root record type of the dataset, certainjoins can have unexpected results such as data duplication. If joining record types is a new conceptfor you, see Guidelines for Joining Record Types in SuiteAnalytics Workbook for more information.
6 Criteria Builder — The Criteria Builder displays the criteria filters you have created for the dataset in the orderthat they are applied to the Data Grid, as well as the operators that connect them. For example, the filters“Cleared is true AND Status any of Open, Paid In Full” means the values of the cleared field are evaluated first,followed by the values of the status field.
Criteria filters refine your dataset query results and are automatically propagated to any workbook visualizationsthat are based on the dataset. For example, if you create a criteria filter to remove all invoices from your dataset,invoice data is also removed from any connected workbook visualizations.
You can add filters to the Criteria Builder by dragging fields from the Fields list to the builder, then setting thespecific filter conditions in the Filter window. Alternatively, you can drag a column header from the Data Gridto the Criteria Builder. For more information, see Dataset Criteria Filters. Within the Criteria Builder, you canperform the following actions:
■ To edit a filter, click the name of the filter.
■ To delete a filter, point to the filter and click the Delete icon.
■ To change the order of the filters, point to the filter you want to move and click the arrows.
■ To create a group of filters, click New Group. For more information about grouping filters, see GroupingFilters.
■ To change the operator between individual or grouped filters, click AND or OR and select a differentoperator from the popup window.
■ To see where a field is located in the Fields list, point to the associated filter, click the Menu icon and selectShow Location in Field List.
■ To reset your criteria filters, click Reset Criteria.
■ To hide the Criteria Builder and expand the Data Grid, click the arrow next to the criteria summary.
7 Data Grid — Your dataset query results are displayed in the Data Grid. By default, the grid displays preselectedfields based on the root record type selected for the dataset. You can add fields to the grid by double-clickingthem on the Fields list, or dragging them to the grid. The number of rows displayed on each page of the gridis based on the Number of Rows in List Segments setting in your NetSuite user preferences, to a maximumof 500 rows per page. Only fields that are included on the grid can be used in workbook visualizations that arebased on the dataset. On the grid itself, you can perform the following actions:
SuiteAnalytics Workbook
Dataset Builder 106
■ To sort the values displayed in the grid, click the Field Menu icon in the column header and select SortAscending, Sort Descending, or Edit Sort... to apply advanced sorting to the grid.
For more information, see Advanced Sorting Options.
■ To filter the values that are displayed in the grid, click the Field Menu icon next to the field you want toapply the filter to and select Filter... from the dropdown list. The filter window appears with up to four typesof filters you can set depending on the values of the field. For more information about the Filter window, seeFilter Types.
Note: Filter conditions and sorting options set up on the Data Grid only impact the values that aredisplayed in the grid itself and do not affect field values in any connected workbook visualizations.If you want to change your dataset query results and any associated visualizations, you must setup criteria filters using the Criteria Builder above the Data Grid. For more information, see DatasetCriteria Filters.
■ To move a column, drag the column header to the desired location. Alternatively, click the Field Menu icon next to the column you want to move and select a move option from the list.
■ To remove a column from the grid, click the Field Menu icon next to the column you want to delete andselect Remove Column.
■ To rename a column, click the Field Menu icon next to the field column and select Rename....
■ To change the width of a column, drag the right boundary of the column header until it is as wide as youwant.
■ To view the records associated to any links displayed in the grid, click the link. The corresponding NetSuiterecord opens in a new browser tab.
■ To view different pages, click the arrows at the bottom of the grid.
■ To view a summary of the values for any column in the grid, click the column header. The summary isdisplayed at the bottom of the grid.
■ To see where a field is located in the Records and Fields lists, click the Field Menu icon and select ShowLocation in Field List.
8 Create New Workbook/ Apply to Workbook — Click Create New Workbook to create a workbook based onthe current dataset. If you accessed the dataset from within an existing workbook, click Apply to Workbookto apply your dataset changes to the workbook visualiations before saving them. This feature enables you topreview the impact that your dataset changes will have before saving the connected workbook.
9 Export — Export the data presented in the Data Grid to a CSV file. To use this feature, you must have the ExportLists permission.
10 Share — Share your dataset with individual users or roles. For more information about sharing, see Accessingand Sharing Workbooks and Datasets
11 Save — Save your dataset, including any joined record types, custom formula fields, or criteria filters. If you donot own the dataset you are working in, you must save a copy of the dataset using the Save As function.
12 Learn about Analytics — Click Learn about Analytics to open a panel that lists all SuiteAnaltyics Workbookvideos as well as a description. To view a video, click the thumbnail and it will open in a new window.
Table TabThe Table tab is where you can explore your dataset query results without altering the source data ofany associated workbook visualizations and without having to set a layout. Any fields that are included inthe underlying dataset appear in the Dataset Panel on the left. To build your table, drag fields from theDataset Panel to the Viewer.
You can create multiple table views in a single workbook using the dataset query results.
For information about how to explore your data in a table view, see Workbook Table Views.
SuiteAnalytics Workbook

Table Tab 107
The elements of the Table View tab are identified in the image below:
1 Workbook Information — Click to view or edit the workbook name, description, or internal ID. This informationis available from anywhere within the workbook.
2 Undo, Redo, and Refresh — Undo or redo your latest edits, and refresh the data in the workbook visualizationyou are currently in. The undo and redo options apply to any action within the workbook and not just the currenttab you are in. For more information about data refreshing, see Data Refresh in SuiteAnalytics Workbook.
3 Add — Click the add icon to add a new workbook visualization.
4 Dataset Panel — The leftmost area of any workbook visualization, the Dataset Panel contains all of the fieldsincluded in the selected dataset. To build a workbook visualization, drag fields from the Dataset Panel to theLayout Panel or the Table Viewer. You can also access and edit the underlying dataset, or switch to a differentdataset using the Dataset Selector at the top of the panel.
■ To view or edit a dataset, click the dataset name in the Dataset Selector.
■ To view additional information about a field, point to the field and click the icon.
■ To collapse the Dataset Panel and expand the Viewer, click the double arrows .
5 Dataset Selector — This list enables you to access and edit the selected dataset, select a different dataset, orconnect a dataset that is not already used in another workbook visualization.
■ To view or edit a dataset, click the dataset name in the Dataset Selector. Alternatively, click the menu icon andselect Open Dataset.
■ To connect or create a new dataset, click the arrow and select Connect Dataset.
■ To save or discard changes to the selected dataset, click the menu icon and select Save Changes or DiscardChanges. You must save or discard changes to any datasets connected to the workbook before you can savethe workbook.
6 Export — Click this icon to export a CSV file of the table.
7 Table Viewer — The Table Viewer displays your table automatically after you add fields to it. In the Table Vieweritself, you can customize the appearance of the columns, and sort and filter your data.
■ To customize the appearance of the your table, you can perform the following actions:
□ To rename a field, click the Field Menu icon and select Rename....
SuiteAnalytics Workbook
Table Tab 108
Note: The change applies only to the column name of the selected table view .
□ To change the order of the columns, drag them to the desired position or click the Field Menu icon and select one of the move options.
□ To remove unwanted columns, click the Field Menu icon in the column header that you want toremove, and then select Remove Column.
■ To filter and sort your data, click the Field Menu icon next to the field you want and then perform thefollowing actions as needed:
□ To apply the default sorting options to the table, select Ascending or Descending.
□ To apply advanced sorting options, select Add Sort.... For more information, see Advanced SortingOptions.
□ To filter your data, select Filter... and then define the filtering conditions. For more information, seeValue-based Filters.
8 Navigation Panel — Displays the number of rows shown in your table view and lets you navigate throughdifferent pages.
To view different pages, click the arrows at the bottom of the viewer.
9 Last Updated — Displays when the data in the current workbook visualization was last updated. To retrieve thelatest results, click the Refresh icon.
For more information, see Data Refresh in SuiteAnalytics Workbook.
10 Workbook Menu — This menu is available from within all workbook visualizations.
■ Click Share to share the workbook and any connected datasets with other users in your account.
For more information, see Accessing and Sharing Workbooks and Datasets
■ Click Save to save your workbook, including all selections made in each visualization. You can only save yourworkbook if the connected datasets have also been saved. If you do not own the connected datasets, savecopies using different names.
11 Learn about Analytics — Click Learn about Analytics to open a panel that lists all SuiteAnaltyics Workbookvideos as well as a description. To view a video, click the thumbnail and it will open in a new window.
Pivot TabThe Pivot tab is where you pivot your dataset query results. Any fields that are included in the underlyingdataset appear in the Dataset Panel on the left. To build your pivot table, drag fields from the DatasetPanel to the Layout panel, then click the Refresh icon . The generated pivot table is displayed in thePivot Table Viewer on the right.
You can create multiple pivot tables using the same dataset query results.
For information about how to use the Pivot tab to pivot your dataset query results, see Creating aWorkbook.
The elements of the Pivot tab are identified in the image below:
SuiteAnalytics Workbook
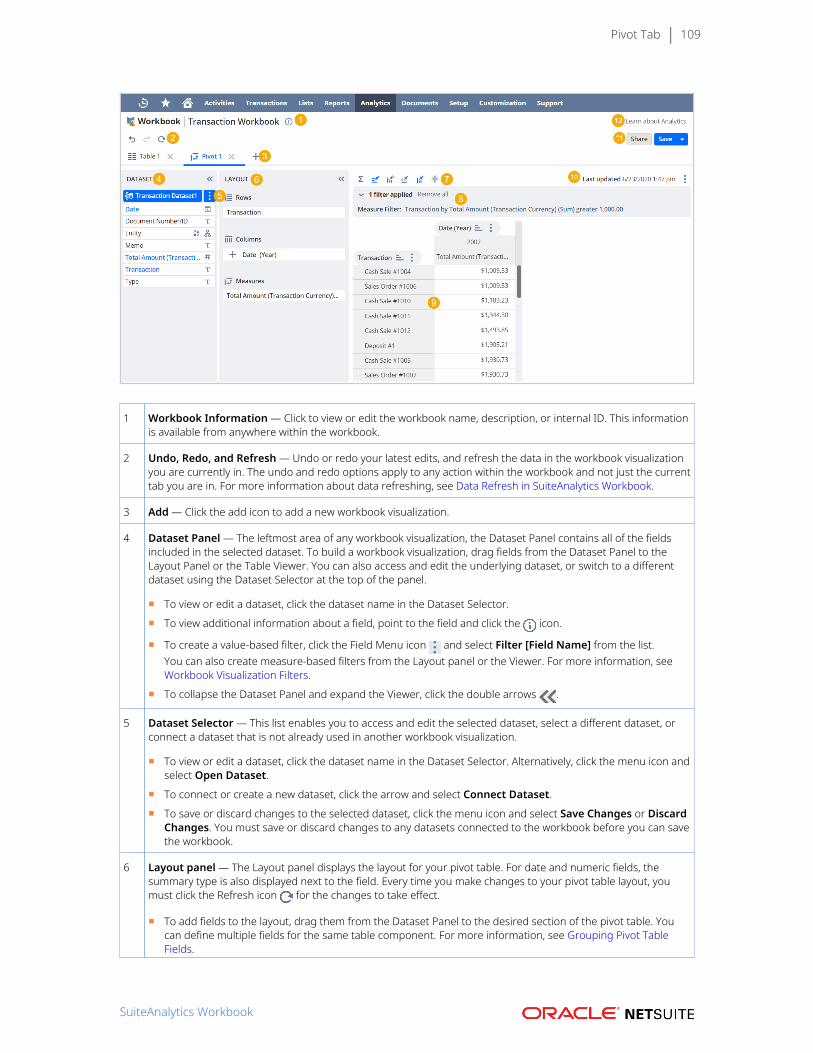
Pivot Tab 109
1 Workbook Information — Click to view or edit the workbook name, description, or internal ID. This informationis available from anywhere within the workbook.
2 Undo, Redo, and Refresh — Undo or redo your latest edits, and refresh the data in the workbook visualizationyou are currently in. The undo and redo options apply to any action within the workbook and not just the currenttab you are in. For more information about data refreshing, see Data Refresh in SuiteAnalytics Workbook.
3 Add — Click the add icon to add a new workbook visualization.
4 Dataset Panel — The leftmost area of any workbook visualization, the Dataset Panel contains all of the fieldsincluded in the selected dataset. To build a workbook visualization, drag fields from the Dataset Panel to theLayout Panel or the Table Viewer. You can also access and edit the underlying dataset, or switch to a differentdataset using the Dataset Selector at the top of the panel.
■ To view or edit a dataset, click the dataset name in the Dataset Selector.
■ To view additional information about a field, point to the field and click the icon.
■ To create a value-based filter, click the Field Menu icon and select Filter [Field Name] from the list.You can also create measure-based filters from the Layout panel or the Viewer. For more information, seeWorkbook Visualization Filters.
■ To collapse the Dataset Panel and expand the Viewer, click the double arrows .
5 Dataset Selector — This list enables you to access and edit the selected dataset, select a different dataset, orconnect a dataset that is not already used in another workbook visualization.
■ To view or edit a dataset, click the dataset name in the Dataset Selector. Alternatively, click the menu icon andselect Open Dataset.
■ To connect or create a new dataset, click the arrow and select Connect Dataset.
■ To save or discard changes to the selected dataset, click the menu icon and select Save Changes or DiscardChanges. You must save or discard changes to any datasets connected to the workbook before you can savethe workbook.
6 Layout panel — The Layout panel displays the layout for your pivot table. For date and numeric fields, thesummary type is also displayed next to the field. Every time you make changes to your pivot table layout, youmust click the Refresh icon for the changes to take effect.
■ To add fields to the layout, drag them from the Dataset Panel to the desired section of the pivot table. Youcan define multiple fields for the same table component. For more information, see Grouping Pivot TableFields.
SuiteAnalytics Workbook
Pivot Tab 110
■ If you are in a NetSuite account with multiple currencies or subsidiaries and your workbook containsfields with values in multiple currencies, click the Field Menu icon next to an applicable field and selectCurrency... to apply currency conversion or consolidation. You must convert or consolidate values that arein multiple currencies to perform arithmetic operations and other types of numeric manipulation. For moreinformation, see Currency Conversion and Consolidation in Datasets and Workbooks.
■ To create a value-based filter for the table, click the Field Menu icon and select Filter [Field name]....You also create measure-based filters for the table if you select the Top 10 [Field name], Bottom 10 [Fieldname], or Filter [Field name] by options. For more information, see Workbook Visualization Filters.
■ To rename a field, click the Field Menu icon and select Rename....
■ To format the numeric values that are displayed in the table, click the Field Menu icon and selectFormat.... For more information, see Customizing Numeric Values.
■ To change the summary type for dates and numeric values displayed in the table, click the Field Menu icon next to an applicable field and select the preferred summary type.
■ To collapse the Layout panel and expand the Pivot Table Viewer, click the double arrows .
■ To add a grand total for a field, click the Field Menu icon and select Show Grand Total.
7 Pivot Table menu — This menu contains additional formatting options for the pivot table. The following optionsare available:
■ Totaling icon — Add totals and grand totals to your pivot table for any applicable fields. Totals for columnscan be added to the right or left of the table. Totals for rows can be added to the top or bottom.
■ Highlight Rows icon — When enabled, rows are highlighted when you point to them.
■ Highlight Columns icon — When enabled, columns are highlighted when you point to them.
■ Row Lock icon — When enabled, the top row is locked so that it remains visible while scrolling through thetable.
■ Column Lock icon — When enabled, the first column is locked so that it remains visible while scrollingthrough the table.
■ Compact Mode icon — If you define multiple fields as rows or add a multi-column hierarchy to your table,turn on compact mode to condense the fields into a single column.
8 Pivot Table filter summary — Displays a summary of the filter conditions applied to the pivot table. Filterconditions created on the Pivot tab only affect the pivot table and do not change the underlying dataset.
9 Pivot Table Viewer — The Pivot Table Viewer displays your generated pivot table after updating the layout andclicking the Refresh icon. As an alternative to dragging fields to the Layout panel to construct your table, youcan add them directly to the Pivot Table Viewer.
In the Pivot Table Viewer itself, you can perform the following actions:
■ To resize a column or row, drag one of the column or row boundaries until it is the size you want.
■ To change the width of a column based on its values, double-click the column header.
■ To add a total for a column or row, click the Field Menu icon and select Show Grand Total.
■ To create a measure-based filter for the table, click the Field Menu icon and select Top 10 [Field name],Bottom 10 [Field name], or Filter [Field name].
■ To create a value-based filter for the table, click the Field Menu icon and select Filter [Field Name]....
For more information, see Workbook Visualization Filters.
■ To rename a field, click the Field Menu icon and select Rename... from the list.
■ To apply sorting to the table, click the Field Menu icon and select Sort A to Z, Sort Z to A, or Sort [Fieldname...].
10 Last updated — Displays when the data in the table was last updated. Keep in mind that this does notnecessarily correspond to the time of the last refresh, since the table might have been refreshed using cached
SuiteAnalytics Workbook
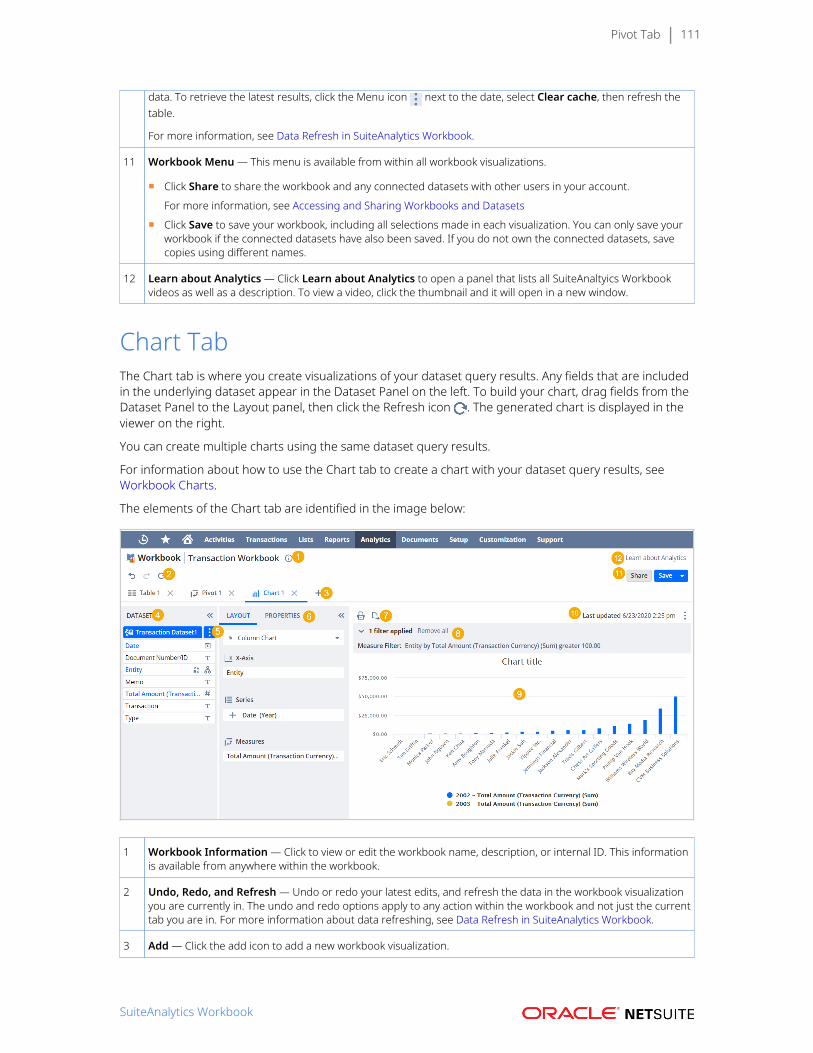
Pivot Tab 111
data. To retrieve the latest results, click the Menu icon next to the date, select Clear cache, then refresh thetable.
For more information, see Data Refresh in SuiteAnalytics Workbook.
11 Workbook Menu — This menu is available from within all workbook visualizations.
■ Click Share to share the workbook and any connected datasets with other users in your account.
For more information, see Accessing and Sharing Workbooks and Datasets
■ Click Save to save your workbook, including all selections made in each visualization. You can only save yourworkbook if the connected datasets have also been saved. If you do not own the connected datasets, savecopies using different names.
12 Learn about Analytics — Click Learn about Analytics to open a panel that lists all SuiteAnaltyics Workbookvideos as well as a description. To view a video, click the thumbnail and it will open in a new window.
Chart TabThe Chart tab is where you create visualizations of your dataset query results. Any fields that are includedin the underlying dataset appear in the Dataset Panel on the left. To build your chart, drag fields from theDataset Panel to the Layout panel, then click the Refresh icon . The generated chart is displayed in theviewer on the right.
You can create multiple charts using the same dataset query results.
For information about how to use the Chart tab to create a chart with your dataset query results, seeWorkbook Charts.
The elements of the Chart tab are identified in the image below:
1 Workbook Information — Click to view or edit the workbook name, description, or internal ID. This informationis available from anywhere within the workbook.
2 Undo, Redo, and Refresh — Undo or redo your latest edits, and refresh the data in the workbook visualizationyou are currently in. The undo and redo options apply to any action within the workbook and not just the currenttab you are in. For more information about data refreshing, see Data Refresh in SuiteAnalytics Workbook.
3 Add — Click the add icon to add a new workbook visualization.
SuiteAnalytics Workbook
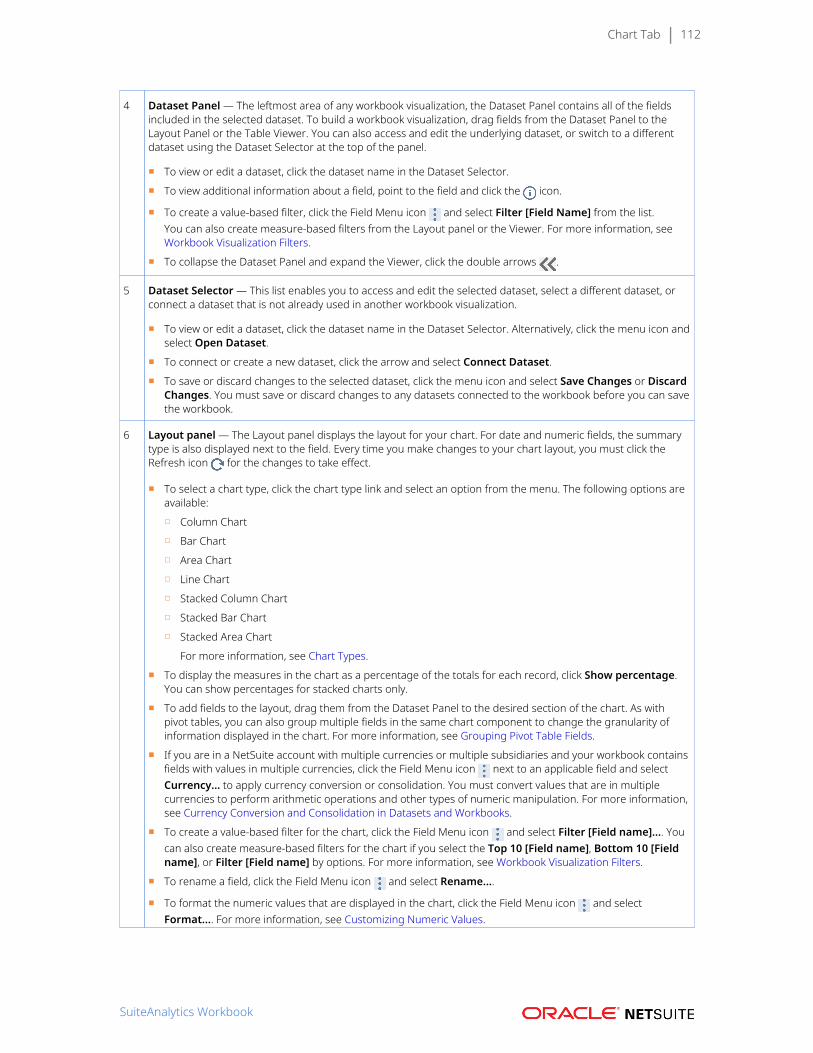
Chart Tab 112
4 Dataset Panel — The leftmost area of any workbook visualization, the Dataset Panel contains all of the fieldsincluded in the selected dataset. To build a workbook visualization, drag fields from the Dataset Panel to theLayout Panel or the Table Viewer. You can also access and edit the underlying dataset, or switch to a differentdataset using the Dataset Selector at the top of the panel.
■ To view or edit a dataset, click the dataset name in the Dataset Selector.
■ To view additional information about a field, point to the field and click the icon.
■ To create a value-based filter, click the Field Menu icon and select Filter [Field Name] from the list.You can also create measure-based filters from the Layout panel or the Viewer. For more information, seeWorkbook Visualization Filters.
■ To collapse the Dataset Panel and expand the Viewer, click the double arrows .
5 Dataset Selector — This list enables you to access and edit the selected dataset, select a different dataset, orconnect a dataset that is not already used in another workbook visualization.
■ To view or edit a dataset, click the dataset name in the Dataset Selector. Alternatively, click the menu icon andselect Open Dataset.
■ To connect or create a new dataset, click the arrow and select Connect Dataset.
■ To save or discard changes to the selected dataset, click the menu icon and select Save Changes or DiscardChanges. You must save or discard changes to any datasets connected to the workbook before you can savethe workbook.
6 Layout panel — The Layout panel displays the layout for your chart. For date and numeric fields, the summarytype is also displayed next to the field. Every time you make changes to your chart layout, you must click theRefresh icon for the changes to take effect.
■ To select a chart type, click the chart type link and select an option from the menu. The following options areavailable:
□ Column Chart
□ Bar Chart
□ Area Chart
□ Line Chart
□ Stacked Column Chart
□ Stacked Bar Chart
□ Stacked Area Chart
For more information, see Chart Types.
■ To display the measures in the chart as a percentage of the totals for each record, click Show percentage.You can show percentages for stacked charts only.
■ To add fields to the layout, drag them from the Dataset Panel to the desired section of the chart. As withpivot tables, you can also group multiple fields in the same chart component to change the granularity ofinformation displayed in the chart. For more information, see Grouping Pivot Table Fields.
■ If you are in a NetSuite account with multiple currencies or multiple subsidiaries and your workbook containsfields with values in multiple currencies, click the Field Menu icon next to an applicable field and selectCurrency... to apply currency conversion or consolidation. You must convert values that are in multiplecurrencies to perform arithmetic operations and other types of numeric manipulation. For more information,see Currency Conversion and Consolidation in Datasets and Workbooks.
■ To create a value-based filter for the chart, click the Field Menu icon and select Filter [Field name].... Youcan also create measure-based filters for the chart if you select the Top 10 [Field name], Bottom 10 [Fieldname], or Filter [Field name] by options. For more information, see Workbook Visualization Filters.
■ To rename a field, click the Field Menu icon and select Rename....
■ To format the numeric values that are displayed in the chart, click the Field Menu icon and selectFormat.... For more information, see Customizing Numeric Values.
SuiteAnalytics Workbook
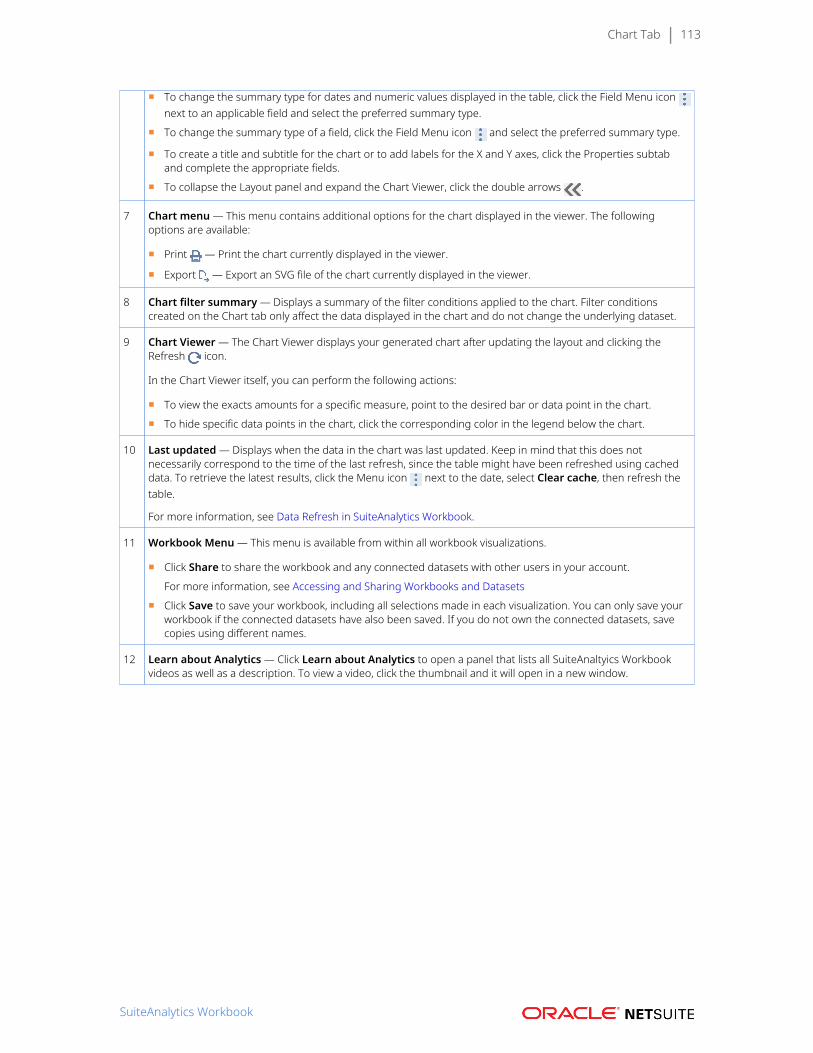
Chart Tab 113
■ To change the summary type for dates and numeric values displayed in the table, click the Field Menu icon next to an applicable field and select the preferred summary type.
■ To change the summary type of a field, click the Field Menu icon and select the preferred summary type.
■ To create a title and subtitle for the chart or to add labels for the X and Y axes, click the Properties subtaband complete the appropriate fields.
■ To collapse the Layout panel and expand the Chart Viewer, click the double arrows .
7 Chart menu — This menu contains additional options for the chart displayed in the viewer. The followingoptions are available:
■ Print — Print the chart currently displayed in the viewer.
■ Export — Export an SVG file of the chart currently displayed in the viewer.
8 Chart filter summary — Displays a summary of the filter conditions applied to the chart. Filter conditionscreated on the Chart tab only affect the data displayed in the chart and do not change the underlying dataset.
9 Chart Viewer — The Chart Viewer displays your generated chart after updating the layout and clicking theRefresh icon.
In the Chart Viewer itself, you can perform the following actions:
■ To view the exacts amounts for a specific measure, point to the desired bar or data point in the chart.
■ To hide specific data points in the chart, click the corresponding color in the legend below the chart.
10 Last updated — Displays when the data in the chart was last updated. Keep in mind that this does notnecessarily correspond to the time of the last refresh, since the table might have been refreshed using cacheddata. To retrieve the latest results, click the Menu icon next to the date, select Clear cache, then refresh thetable.
For more information, see Data Refresh in SuiteAnalytics Workbook.
11 Workbook Menu — This menu is available from within all workbook visualizations.
■ Click Share to share the workbook and any connected datasets with other users in your account.
For more information, see Accessing and Sharing Workbooks and Datasets
■ Click Save to save your workbook, including all selections made in each visualization. You can only save yourworkbook if the connected datasets have also been saved. If you do not own the connected datasets, savecopies using different names.
12 Learn about Analytics — Click Learn about Analytics to open a panel that lists all SuiteAnaltyics Workbookvideos as well as a description. To view a video, click the thumbnail and it will open in a new window.
SuiteAnalytics Workbook

SuiteAnalytics Workbook Glossary 114
SuiteAnalytics Workbook GlossaryThis glossary contains descriptions of the elements used for workbook and dataset authoring.
Analytics Browser: A browser that provides a static, global list of all record types and fields that areavailable through the analytics data source. To access the browser, see Analytics Browser.
Analytics data source: The data source used by SuiteAnalytics Workbook. Record types and fields in thisdata source might have different locations or labels than the data sources used for saved searches andreports. For more information, see Analytics Data Source Overview.
Charts: A workbook visualization that enables you to visualize your dataset query results using predefinedchart and graph types, such as line graphs and bar charts. For more information, see Workbook Charts.
Criteria Builder: The area above the Data Grid in the Dataset Builder. You use this area to create criteriafilters, which change the dataset query results and the values presented in any workbooks that are basedon the dataset.
Criteria filters: Filter conditions that are applied to a dataset using the Criteria Builder. Criteria filters areautomatically propagated to any workbooks and workbook visualizations that are based on the dataset,when the dataset is saved. For more information, see Dataset Criteria Filters.
Data Grid: The Data Grid is where you add fields to your dataset. You can only build workbookvisualizations such as table views, pivot tables, and charts using fields that have been added to theunderlying dataset of a workbook, and therefore the Data Grid.
Dataset: Datasets are the basis for all workbooks and workbook visualizations in your account. In adataset, you combine record type fields and criteria filters to create a query. The results of this query actas the source data for the workbook visualizations you create. A single dataset can be used in multipleworkbook visualizations, so to prevent data discrepancies, they can only be edited or deleted by datasetowners or users with the Analytics Administrator permission. Additionally, you can use multiple differentdatasets in the same workbook, enabling you to analyze different metrics. For more information, seeDefining a Dataset.
Dataset Builder: The area of the user interface where you build your datasets by creating a query. TheDataset Builder contains the Records and Fields lists, the Data Grid, and the Criteria Builder. For moreinformation, see Dataset Builder.
Dataset Panel: The leftmost area of any workbook visualization, containing all of the fields of the selecteddataset. You can access and edit the underlying dataset, switch to a different dataset, or create a newdataset from this panel if the selected one does not contain the fields you need. Use the fields in thispanel to build your table views, pivot tables, and charts.
Filters: Filter conditions applied only to a specific workbook visualization, such as a table view, pivot table,or chart. These filters do not affect the underlying dataset or any other visualizations within the workbook.For example, if you apply a filter to a pivot table, it does not change the data presented in the workbook’scharts. To filter the values presented throughout the workbook or in the underlying dataset, you need tocreate a criteria filter.
Join: The action of combining fields from multiple record types to define a dataset. To complete a join,select a record type from the Records list in the Dataset Builder, then add one of the record type fieldsto the Data Grid or use it to build a criteria filter. There are certain behaviors you should be aware ofwhen you join record types in a dataset, such as unwanted data duplication. For more information, seeGuidelines for Joining Record Types in SuiteAnalytics Workbook.
Join path: Some record types are only accessible through a specific join path. For example, to join thetransaction accounting line record type in a dataset, you must first access the transaction line recordtype through the transaction record type. In this scenario, the join path is transaction> transaction line>transaction accounting line.
SuiteAnalytics Workbook
SuiteAnalytics Workbook Glossary 115
Pivot Table: A workbook visualization that enables you to pivot your dataset query results by definingmeasures and dimensions, so that you can analyze different subsets of data. For more information, seeWorkbook Pivot Tables.
Records and Fields lists: The leftmost area of the Dataset Builder. These lists display any of the recordtypes and fields that you can join in a dataset, based on the selected root record type on the dataset, yourNetSuite permissions, and the features enabled in your account.
Table View: A workbook visualization that enables you to view your dataset query results in a simpletable. For more information, see Workbook Table Views.
Workbook: Workbooks are where you analyze the results of your dataset queries using differentvisualizations, such as table views, pivot tables, and charts. All workbook visualizations are based on adataset, and you can use different datasets for each visualization in a single workbook. This enables youto analyze different metrics within a single workbook. You can access the underlying dataset from theDataset Panel in any workbook visualization. When you author a workbook visualization you can eitherdefine a new custom dataset, or use any of the existing datasets that you have access to in your account.For more information, see Creating a Workbook.
SuiteAnalytics Workbook


