Embed Size (px)
Citation preview
Wang et al. EPJ Data Science (2019) 8:31 https://doi.org/10.1140/epjds/s13688-019-0208-6
R E G U L A R A R T I C L E Open Access
Success in books: predicting book salesbefore publicationXindi Wang1, Burcu Yucesoy1, Onur Varol1, Tina Eliassi-Rad2 and Albert-László Barabási1,2,3,4*
*Correspondence:[email protected] for Complex NetworkResearch and Department ofPhysics, Northeastern University,Boston, USA2College of Computer andInformation Science, NortheasternUniversity, Boston, USAFull list of author information isavailable at the end of the article
AbstractReading remains a preferred leisure activity fueling an exceptionally competitivepublishing market: among more than three million books published each year, only atiny fraction are read widely. It is largely unpredictable, however, which book will thatbe, and how many copies it will sell. Here we aim to unveil the features that affect thesuccess of books by predicting a book’s sales prior to its publication. We do so byemploying the Learning to Placemachine learning approach, that can predicts salesfor both fiction and nonfiction books as well as explaining the predictions bycomparing and contrasting each book with similar ones. We analyze featurescontributing to the success of a book by feature importance analysis, finding that astrong driving factor of book sales across all genres is the publishing house. We alsouncover differences between genres: for thrillers and mystery, the publishing historyof an author (as measured by previous book sales) is highly important, while in literaryfiction and religion, the author’s visibility plays a more central role. These observationsprovide insights into the driving forces behind success within the current publishingindustry, as well as how individuals choose what books to read.
Keywords: Success; Books; Learning to place
1 IntroductionBooks, important cultural products, play a big role in our daily lives—they both educateand entertain. And it is big business: the publishing industry revenue is projected to bemore than 43 billion dollars, selling more than 2.7 billion books only in the United Statesevery year [1]. Meanwhile, authors enter a very competitive marketplace: of the over threemillion books published in 2015 in the United States [1], only about 4000 new titles soldmore than 1000 copies within a year, and only about 500 of them became New York Timesbestsellers. There are more than 45,000 published authors in the US market; while most ofthem struggle to get published, a few of them like J.K. Rowling earn hundreds of millionsof dollars from their books [1].
The driving forces shaping the success of books have been studied by various researchersover the years, explaining the role of writing styles [2], critics [3], book reviews [4],awards [5], advertisements [6], social network [7] and word of mouth effect [8], etc. How-ever, predicting book success from multiple factors has received much less attention. Theonly published study in this area focused on book sales in the German market, applying alinear model [9] and reported limited accuracy.
© The Author(s) 2019. This article is distributed under the terms of the Creative Commons Attribution 4.0 International License(http://creativecommons.org/licenses/by/4.0/), which permits unrestricted use, distribution, and reproduction in anymedium, pro-vided you give appropriate credit to the original author(s) and the source, provide a link to the Creative Commons license, andindicate if changes were made.

Wang et al. EPJ Data Science (2019) 8:31 Page 2 of 20
Similar studies have focused on other cultural products, from music to movies, like usingon-line reviews to forecast motion pictures sales [10], predicting the success of music andmovie products by analyzing blogs [11], predicting success within the fashion industryusing social media such as Instagram [12]. Nevertheless, the early-prediction of successis of great importance in cultural products. Early-prediction has been studied in variouspapers to address market needs for introducing new products [13], to predict movie boxoffice success using Wikipedia [14] or to detect promoted social media campaigns [15].Yet, predicting which cultural product will succeed before its release and understandingthe mechanisms behind its success or failure remains a difficult task.
In our previous work [16], we analyzed and modeled the dynamics of book sales, iden-tifying a series of reproducible patterns: (i) most bestsellers reach their sales peak in lessthan ten weeks after release; (ii) sales follow a universal “early peak, slow decay” patternthat can be described by an accurate statistical model; (iii) we showed that the formulapredicted by the model helps us predict future sales. Yet, to accurately predict the futuresales using the model of Ref. [16], we need at least the first 25 weeks of sales after publica-tion, a period within which most books have already reached their peak sales and startedto lose momentum. Therefore, predictions derived from this statistical model, potentiallyuseful for long-term inventory management, are not particularly effective for foreseeingthe sales potential of a new book.
In the publishing industry, limited information is available to publishers to assist theirdecisions on publishing (including how many copies to print, how much advance to pro-vide, how much should they invest in marketing, etc.). Currently, publishers base theirdecision on the authors’ previous success, the appeal of the topic, and insights from writ-ing samples and sales of similar books, rather than relying on data specifically linked to thebook considered for publication. Early-prediction of book success using the available pre-publication information could be instrumental in supporting decision makers. Indeed, wewould like to predict performance of a book prior to its publication. To offer such predic-tions, here we focus on variables available before the actual publication date, pertainingto the book’s author, topic and publisher, and use machine learning to unearth their pre-dictive power. As we show, the employed machine learning is able to accurately predictsales and to discover which features are the most influential in determining the sales ofthe book.
2 DataOur main data source is NPD Bookscan, a data provider for the publishing industry inUnited States, providing meta-data including ISBN number, author name, title, category(fiction and nonfiction), Bisac code [17], publisher, price, and weekly sales of all printbooks published in the US since 2003. We focus on the top selling 10,000 books based onBookscan published each month between 2008–2015 and limit our study to hardcovers—the format in which most books are published initially. We filter the data to exclude spe-cial books that are not representative of the general market (see Additional file 1). Afterfiltering, we obtain 170,927 hardcovers published between 2008–2015. We further dividethis collection into two distinct groups: baseline books published between 2008–2014 forhistorical sales records and statistics about genres and publishers, and evaluation booksfrom 2015 with author’s publishing history and additional information collected online forevaluating the models. Our evaluation books consist of 9702 fiction and nonfiction bookspublished in 2015 to train and test our model.
Wang et al. EPJ Data Science (2019) 8:31 Page 3 of 20
To supplement our model with additional online information, we collect Wikipediapageview data for authors [18, 19] that counts the number of visits to each author’sWikipedia page during a given time period offering a snapshot of each author’s popu-larity prior to the publication of their book. We also collect book descriptions created bypublishing house prior to release date from Amazon and Goodreads to obtain informationabout a book’s content that is not available from Bookscan.
3 Machine-learning approach3.1 FeaturesReaders tend to choose books by authors they have read before or books written by celebri-ties; they often have a strong preference for specific genres and are more likely to noticewell marketed books. Our features are designed and consolidated with the domain expertsto capture each of these aspects of book selection.
Some of the aforementioned factors are easily quantified. For authors, visibility can bemeasured using Wikipedia pageviews at any given date, capturing how many people visitan author’s Wikipedia page over time [14, 20–22]. The sales of an author’s previous booksare provided by Bookscan. The genre information is contained in the Bisac code, as dis-cussed in Sect. 3.1.2. Topic information is produced by employing Non-negative MatrixFactorization applied to book descriptions collected from Amazon and Goodreads [23,24]. However, it is difficult to quantify advertising. Marketing and advertising are usu-ally the publishers’ responsibility and some publishers devote more marketing resourcesthan others. Therefore, we use the publisher as a proxy to quantify the extent of resourcesand know-how devoted to marketing. Publishers also play a role beyond marketing: theypass quality judgment by selecting books for publication, hence publisher quality/prestigealso facilitates access to more prestigious authors and better manuscripts. Finally, we alsoconsider seasonal fluctuations in book sales previously demonstrated as predictive [16].
In summary, we explore three feature categories: (1) author, which includes author’svisibility and previous book sales; (2) book, which includes a book’s genre, topic and pub-lishing month and, (3) publisher, which captures the prominence the of book’s publisher,potentially capturing its marketing and distribution power. Next, we discuss each of thesefeature categories separately.
3.1.1 Author featuresAuthor visibility: We use Wikipedia pageviews as a proxy of the public’s interest in anauthor, capturing his or her fame or overall visibility. There are many aspects of visibility:cumulative visibility representing all visits starting from the page’s creation date is morerelevant for some authors, while recent visibility is more relevant for others. To capturethese multiple aspects of visibility, we explore several author-linked parameters for eachbook, representing the visibility feature group:
• Cumulative visibility, F tot, counts the total pageviews of an author up until the book’spublication date.
• Longevity, tF , counts the days since the first appearance of an author’s Wikipedia pageuntil the book’s publication date.
• Normalized cumulative visibility, f tot, divides the cumulative visibility with itslongevity, i.e., f tot = Ftot
tF .
Wang et al. EPJ Data Science (2019) 8:31 Page 4 of 20
• Recent visibility, Frec, counts the total pageviews of an author during the monthbefore the book’s publication. It captures the momentary popularity of the authoraround publication time.
Previous sales: We use the Bookscan weekly sales data to calculate previous sales of allbooks written by an author. Similar to an author’s visibility, we have multiple ways to incor-porate previous sales. For example, previous sales in different genres from the predictedbook is relevant for authors who change genres during their career (for genre informationsee Sect. 3.1.2). We use the following information for each book, representing the previoussales feature group:
• Total sales, Stot, obtained by querying an author’s entire publishing history fromBookscan and summing up the sales of her previous books up until the publicationdate of the predicted book.
• Sales in this genre, Stotin , counts the author’s previous total sale in the same genre as the
predicted book.• Sales in other genres, Stot
out, counts the author’s previous sale in other genres.• Career length, tp, counts the number of days from the date of the author’s first book
publication till the publishing date of the upcoming book.• Normalized sales, stot, normalizes the total sales based on the author’s career length,
i.e., stot = Stot
tp .
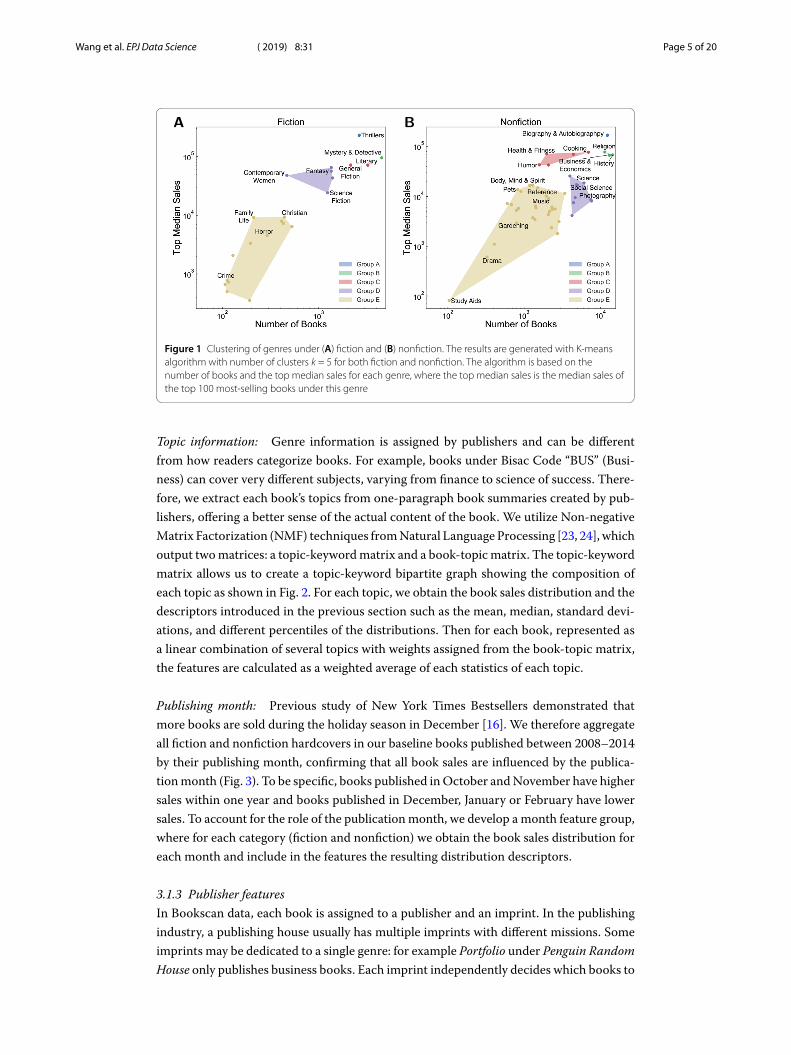
3.1.2 Book featuresGenre information: Fiction and nonfiction books have different sales patterns as shownin previous work [16] and within fiction and nonfiction, each sub-genre may have its ownbehavior as well. We obtain direct information about genres from the Bisac Code [17], astandard code used to categorize books into 53 topical contents like “FICTION”, “HIS-TORY”, “COMPUTERS”, etc. Under each major topic, there are more than 4000 sub-genres. For example there are 189 genres under fiction, such as “FIC022000” for “FIC-TION / Mystery & Detective / General”. While we would like to account for each genreseparately, some genres have too few books to offer representative statistics. To solve thisproblem, we use clustering to reduce the number of genres, aggregating genres with com-parable size (i.e., number of books) and comparable potential sales. The clustering criteriais based on the number of books and the median sales of the books in each genre thatare listed among top-selling (top 100) books, rather than the content of the topics. Weconduct clustering on fiction and nonfiction separately using the K-means (k = 5) cluster-ing algorithm [25]. Figure 1 shows the outcomes of clustering for fiction and nonfiction.For example, General Fiction and Literary are clustered to Fiction Group B. Some clus-ters are unexpected content-wise, like the Nonfiction Group B, which combines Religion,Business & Economics and History. This indicates that in size and sales potential, thesethree genres are similar. The result of genre clustering is used to group books and calculatefeatures.
We use various distribution descriptors (including the mean, median, standard devia-tions, 10th, 25th, 75th and 90th percentile, same hereafter) of book sales within each genrecluster, forming a genre cluster feature group. We form these set of features to quantifythe properties of each explored distribution.
Wang et al. EPJ Data Science (2019) 8:31 Page 5 of 20
Figure 1 Clustering of genres under (A) fiction and (B) nonfiction. The results are generated with K-meansalgorithm with number of clusters k = 5 for both fiction and nonfiction. The algorithm is based on thenumber of books and the top median sales for each genre, where the top median sales is the median sales ofthe top 100 most-selling books under this genre
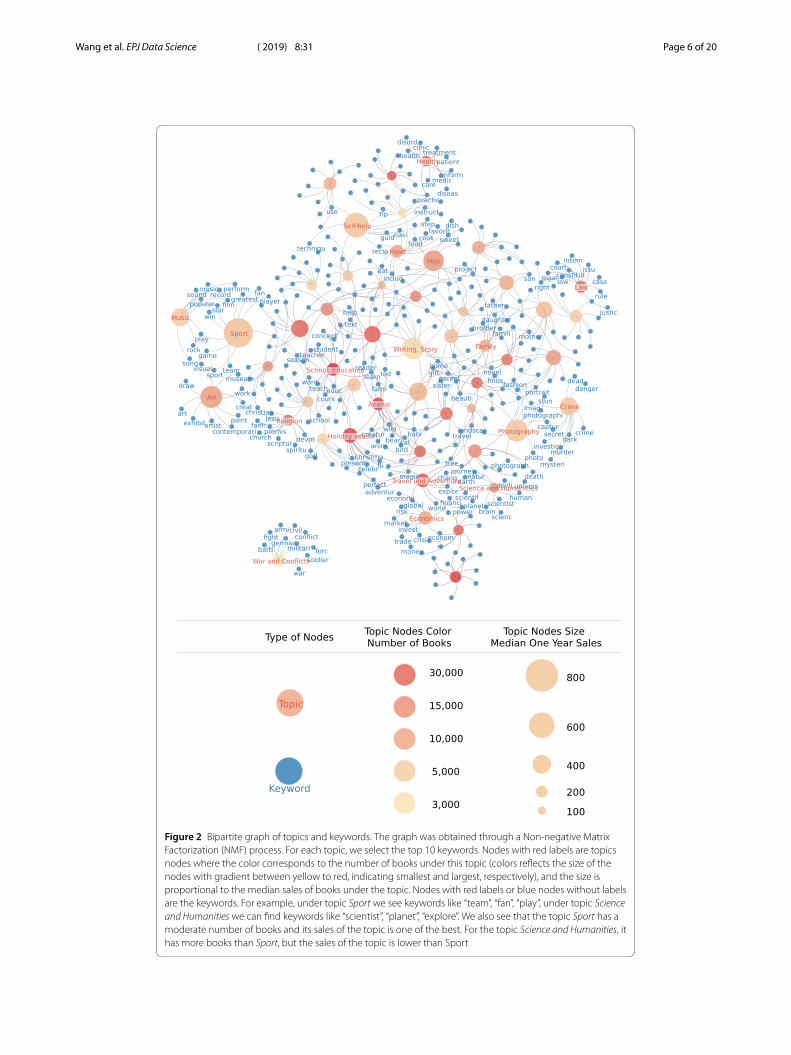
Topic information: Genre information is assigned by publishers and can be differentfrom how readers categorize books. For example, books under Bisac Code “BUS” (Busi-ness) can cover very different subjects, varying from finance to science of success. There-fore, we extract each book’s topics from one-paragraph book summaries created by pub-lishers, offering a better sense of the actual content of the book. We utilize Non-negativeMatrix Factorization (NMF) techniques from Natural Language Processing [23, 24], whichoutput two matrices: a topic-keyword matrix and a book-topic matrix. The topic-keywordmatrix allows us to create a topic-keyword bipartite graph showing the composition ofeach topic as shown in Fig. 2. For each topic, we obtain the book sales distribution and thedescriptors introduced in the previous section such as the mean, median, standard devi-ations, and different percentiles of the distributions. Then for each book, represented asa linear combination of several topics with weights assigned from the book-topic matrix,the features are calculated as a weighted average of each statistics of each topic.
Publishing month: Previous study of New York Times Bestsellers demonstrated thatmore books are sold during the holiday season in December [16]. We therefore aggregateall fiction and nonfiction hardcovers in our baseline books published between 2008–2014by their publishing month, confirming that all book sales are influenced by the publica-tion month (Fig. 3). To be specific, books published in October and November have highersales within one year and books published in December, January or February have lowersales. To account for the role of the publication month, we develop a month feature group,where for each category (fiction and nonfiction) we obtain the book sales distribution foreach month and include in the features the resulting distribution descriptors.
3.1.3 Publisher featuresIn Bookscan data, each book is assigned to a publisher and an imprint. In the publishingindustry, a publishing house usually has multiple imprints with different missions. Someimprints may be dedicated to a single genre: for example Portfolio under Penguin RandomHouse only publishes business books. Each imprint independently decides which books to
Wang et al. EPJ Data Science (2019) 8:31 Page 6 of 20
Figure 2 Bipartite graph of topics and keywords. The graph was obtained through a Non-negative MatrixFactorization (NMF) process. For each topic, we select the top 10 keywords. Nodes with red labels are topicsnodes where the color corresponds to the number of books under this topic (colors reflects the size of thenodes with gradient between yellow to red, indicating smallest and largest, respectively), and the size isproportional to the median sales of books under the topic. Nodes with red labels or blue nodes without labelsare the keywords. For example, under topic Sport we see keywords like “team”, “fan”, “play”, under topic Scienceand Humanities we can find keywords like “scientist”, “planet”, “explore”. We also see that the topic Sport has amoderate number of books and its sales of the topic is one of the best. For the topic Science and Humanities, ithas more books than Sport, but the sales of the topic is lower than Sport

Wang et al. EPJ Data Science (2019) 8:31 Page 7 of 20
Figure 3 Seasonal fluctuations for book sales. Themedian of the one year sales of the top-selling booksthat published in the same month from 2008 to2015. For fiction, sales increases in the summer, andOctober, November have the highest sales. Fornonfiction, the increase in sales is not very significantover the summer months; instead October has thehighest sales
publish and takes responsibility for its editorial process and marketing. Some imprints aremore attractive to authors because they offer higher advances and have more marketingresources. Additionally, more prominent imprints tend to be more selective, and bookspublished by those imprints have higher sales.
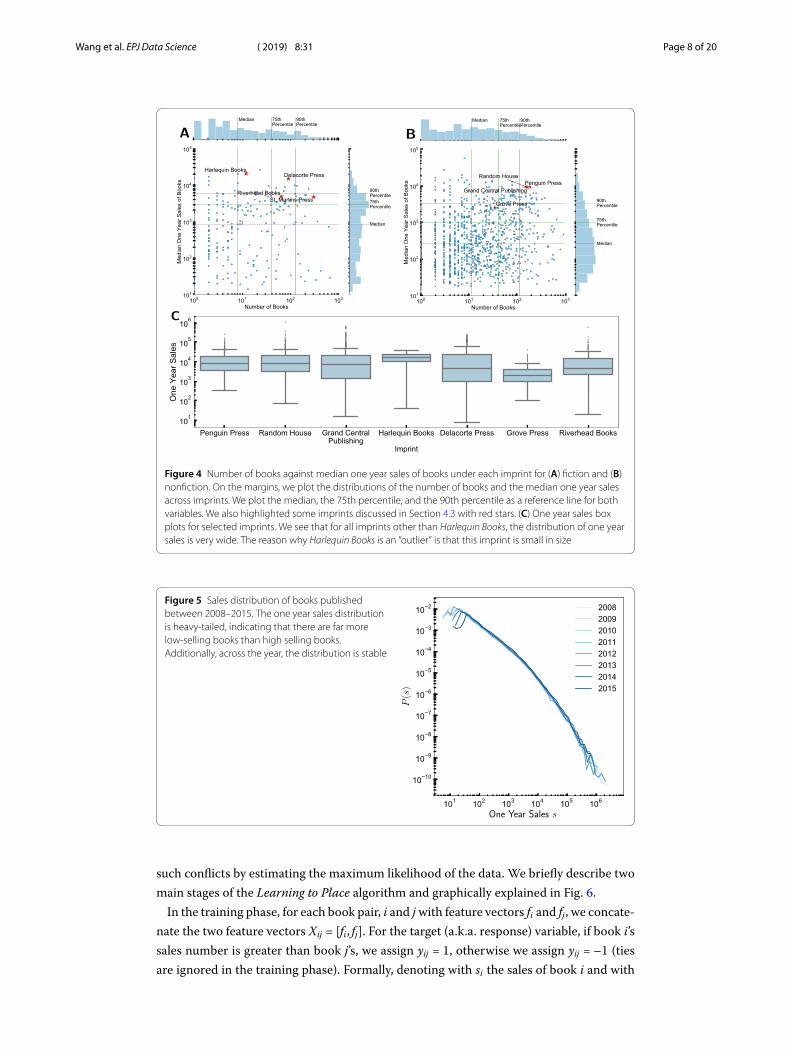
To capture the prominence of a particular imprint, we looked at our baseline books col-lection published between 2008–2014, and discovered that the variation in sales withineach imprint can span several orders of magnitude (Fig. 4). For example for RandomHouse, the highest selling book sold one million copies in a year while the lowest sellingbook sold less than a hundred copies. Similar to publishing month, we develop an imprintfeature group where for each category (fiction and nonfiction) we obtain the book salesdistribution of each imprint and use the distribution descriptors as the predictive features.
3.2 Learning algorithmsBook sales follow a heavy-tail distribution (see Fig. 5), and in general the prediction andregression of such heavy-tailed distributions are challenging [26, 27]. Indeed, the higher-order moments and the variance of heavy-tailed distributions are not well-defined, andstatistical methods based on assumptions of bounded variance leads to biased estimates.The literature on heavy-tail regression problem has developed methods based on priorcorrection or weighing data points [28, 29]. However, most regression methods showlimited performance in learning non-linear decision boundaries and underpredict high-selling books. These high selling books, however, are the most important for publishers,hence for these accuracy is the most desired.
3.2.1 Learning to placeTo address the imbalance and heavy-tail outcome prediction problems, we employedLearning to Place algorithm [30] which addresses the following problem: Given a sequenceof previously published books ranked by their sales, where would we place a new book inthis sequence and estimate sales based on this placement?
Learning to Place has two stages: (1) learn a pairwise preference classifier which predictswhether a new book will sell more or less than each book in the training set; (2) given infor-mation from stage 1, place the new book in the ordered list of previously published bookssorted by their sales. Note that going from the pairwise preferences to even a partial order-ing to a ranking is not trivial. The pairwise preferences may have conflicting predictions.For example, the classifier might predict that A is better than B, B is better than C, and Cis better than A. Our majority-vote technique in the second stage is designed to resolve
Wang et al. EPJ Data Science (2019) 8:31 Page 8 of 20
Figure 4 Number of books against median one year sales of books under each imprint for (A) fiction and (B)nonfiction. On the margins, we plot the distributions of the number of books and the median one year salesacross imprints. We plot the median, the 75th percentile, and the 90th percentile as a reference line for bothvariables. We also highlighted some imprints discussed in Section 4.3 with red stars. (C) One year sales boxplots for selected imprints. We see that for all imprints other than Harlequin Books, the distribution of one yearsales is very wide. The reason why Harlequin Books is an “outlier” is that this imprint is small in size
Figure 5 Sales distribution of books publishedbetween 2008–2015. The one year sales distributionis heavy-tailed, indicating that there are far morelow-selling books than high selling books.Additionally, across the year, the distribution is stable
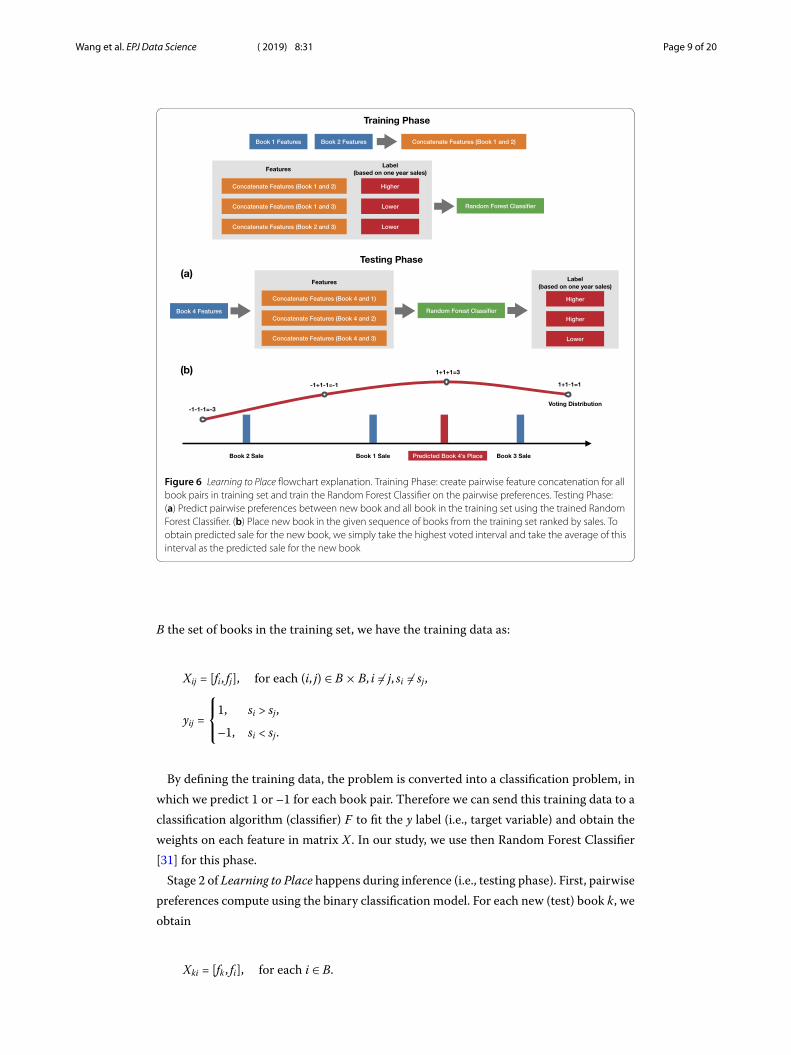
such conflicts by estimating the maximum likelihood of the data. We briefly describe twomain stages of the Learning to Place algorithm and graphically explained in Fig. 6.
In the training phase, for each book pair, i and j with feature vectors fi and fj, we concate-nate the two feature vectors Xij = [fi, fj]. For the target (a.k.a. response) variable, if book i’ssales number is greater than book j’s, we assign yij = 1, otherwise we assign yij = –1 (tiesare ignored in the training phase). Formally, denoting with si the sales of book i and with
Wang et al. EPJ Data Science (2019) 8:31 Page 9 of 20
Figure 6 Learning to Place flowchart explanation. Training Phase: create pairwise feature concatenation for allbook pairs in training set and train the Random Forest Classifier on the pairwise preferences. Testing Phase:(a) Predict pairwise preferences between new book and all book in the training set using the trained RandomForest Classifier. (b) Place new book in the given sequence of books from the training set ranked by sales. Toobtain predicted sale for the new book, we simply take the highest voted interval and take the average of thisinterval as the predicted sale for the new book
B the set of books in the training set, we have the training data as:
Xij = [fi, fj], for each (i, j) ∈ B × B, i �= j, si �= sj,
yij =
⎧⎨
⎩
1, si > sj,
–1, si < sj.
By defining the training data, the problem is converted into a classification problem, inwhich we predict 1 or –1 for each book pair. Therefore we can send this training data to aclassification algorithm (classifier) F to fit the y label (i.e., target variable) and obtain theweights on each feature in matrix X. In our study, we use then Random Forest Classifier[31] for this phase.
Stage 2 of Learning to Place happens during inference (i.e., testing phase). First, pairwisepreferences compute using the binary classification model. For each new (test) book k, weobtain
Xki = [fk , fi], for each i ∈ B.
Wang et al. EPJ Data Science (2019) 8:31 Page 10 of 20
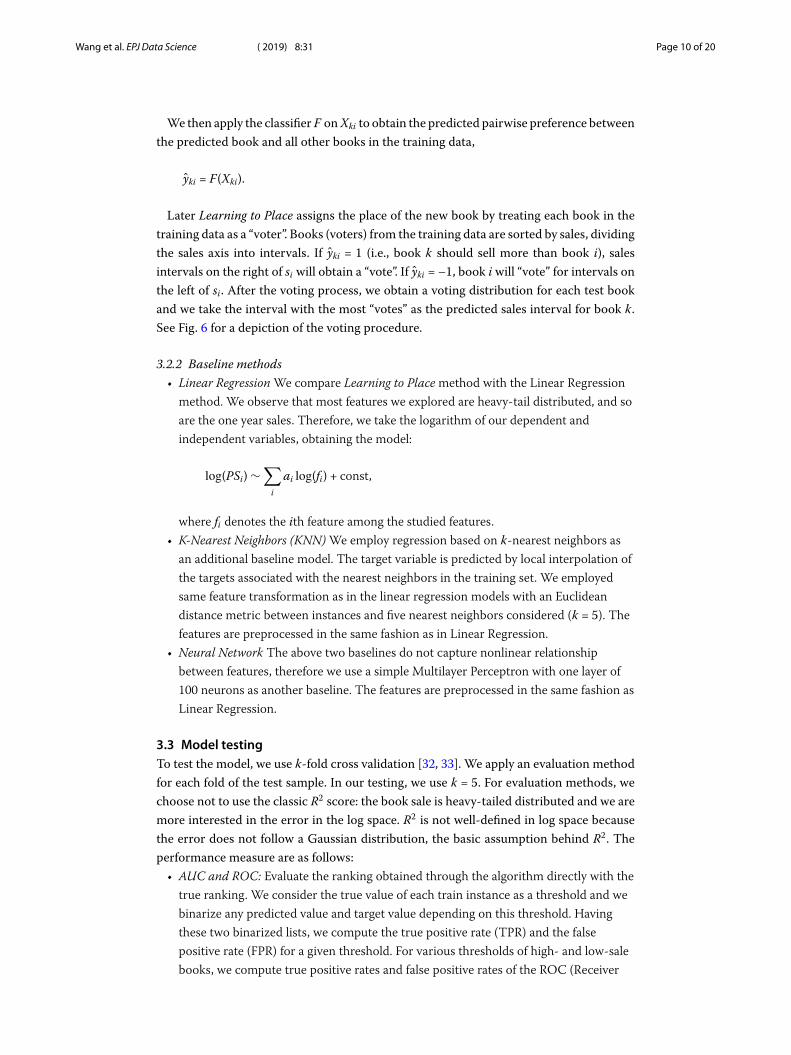
We then apply the classifier F on Xki to obtain the predicted pairwise preference betweenthe predicted book and all other books in the training data,
yki = F(Xki).
Later Learning to Place assigns the place of the new book by treating each book in thetraining data as a “voter”. Books (voters) from the training data are sorted by sales, dividingthe sales axis into intervals. If yki = 1 (i.e., book k should sell more than book i), salesintervals on the right of si will obtain a “vote”. If yki = –1, book i will “vote” for intervals onthe left of si. After the voting process, we obtain a voting distribution for each test bookand we take the interval with the most “votes” as the predicted sales interval for book k.See Fig. 6 for a depiction of the voting procedure.
3.2.2 Baseline methods• Linear Regression We compare Learning to Place method with the Linear Regression
method. We observe that most features we explored are heavy-tail distributed, and soare the one year sales. Therefore, we take the logarithm of our dependent andindependent variables, obtaining the model:
log(PSi) ∼∑
i
ai log(fi) + const,
where fi denotes the ith feature among the studied features.• K-Nearest Neighbors (KNN) We employ regression based on k-nearest neighbors as
an additional baseline model. The target variable is predicted by local interpolation ofthe targets associated with the nearest neighbors in the training set. We employedsame feature transformation as in the linear regression models with an Euclideandistance metric between instances and five nearest neighbors considered (k = 5). Thefeatures are preprocessed in the same fashion as in Linear Regression.
• Neural Network The above two baselines do not capture nonlinear relationshipbetween features, therefore we use a simple Multilayer Perceptron with one layer of100 neurons as another baseline. The features are preprocessed in the same fashion asLinear Regression.
3.3 Model testingTo test the model, we use k-fold cross validation [32, 33]. We apply an evaluation methodfor each fold of the test sample. In our testing, we use k = 5. For evaluation methods, wechoose not to use the classic R2 score: the book sale is heavy-tailed distributed and we aremore interested in the error in the log space. R2 is not well-defined in log space becausethe error does not follow a Gaussian distribution, the basic assumption behind R2. Theperformance measure are as follows:
• AUC and ROC: Evaluate the ranking obtained through the algorithm directly with thetrue ranking. We consider the true value of each train instance as a threshold and webinarize any predicted value and target value depending on this threshold. Havingthese two binarized lists, we compute the true positive rate (TPR) and the falsepositive rate (FPR) for a given threshold. For various thresholds of high- and low-salebooks, we compute true positive rates and false positive rates of the ROC (Receiver
Wang et al. EPJ Data Science (2019) 8:31 Page 11 of 20
Operating Characteristic) curve and then calculate the AUC (Area Under Curve)score (see Additional file 1).
• High-end RMSE: We calculate RMSE (Root-mean-square Error) for high-selling booksto measure the accuracy of the sales prediction for high-selling books in the top 20percentile. Since book sales follow a heavy tailed distribution, we calculate the RMSEbased on the log values of the predicted and the actual sales.
4 ResultsWe evaluated Learning to Place and other baseline algorithms on hardcover books pub-lished in 2015, aiming to predict the one year sales of each book. In our experiments, wetrain models and evaluate their performance on leave-out fraction of the 5-fold cross-validation.
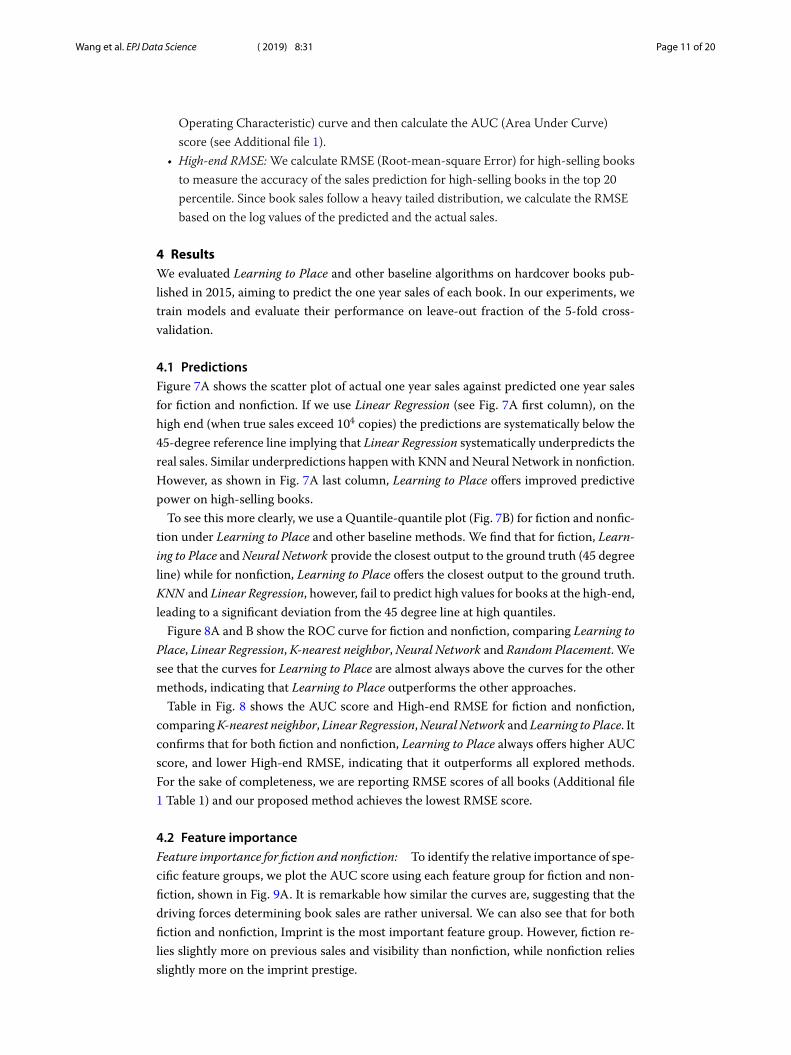
4.1 PredictionsFigure 7A shows the scatter plot of actual one year sales against predicted one year salesfor fiction and nonfiction. If we use Linear Regression (see Fig. 7A first column), on thehigh end (when true sales exceed 104 copies) the predictions are systematically below the45-degree reference line implying that Linear Regression systematically underpredicts thereal sales. Similar underpredictions happen with KNN and Neural Network in nonfiction.However, as shown in Fig. 7A last column, Learning to Place offers improved predictivepower on high-selling books.
To see this more clearly, we use a Quantile-quantile plot (Fig. 7B) for fiction and nonfic-tion under Learning to Place and other baseline methods. We find that for fiction, Learn-ing to Place and Neural Network provide the closest output to the ground truth (45 degreeline) while for nonfiction, Learning to Place offers the closest output to the ground truth.KNN and Linear Regression, however, fail to predict high values for books at the high-end,leading to a significant deviation from the 45 degree line at high quantiles.
Figure 8A and B show the ROC curve for fiction and nonfiction, comparing Learning toPlace, Linear Regression, K-nearest neighbor, Neural Network and Random Placement. Wesee that the curves for Learning to Place are almost always above the curves for the othermethods, indicating that Learning to Place outperforms the other approaches.
Table in Fig. 8 shows the AUC score and High-end RMSE for fiction and nonfiction,comparing K-nearest neighbor, Linear Regression, Neural Network and Learning to Place. Itconfirms that for both fiction and nonfiction, Learning to Place always offers higher AUCscore, and lower High-end RMSE, indicating that it outperforms all explored methods.For the sake of completeness, we are reporting RMSE scores of all books (Additional file1 Table 1) and our proposed method achieves the lowest RMSE score.
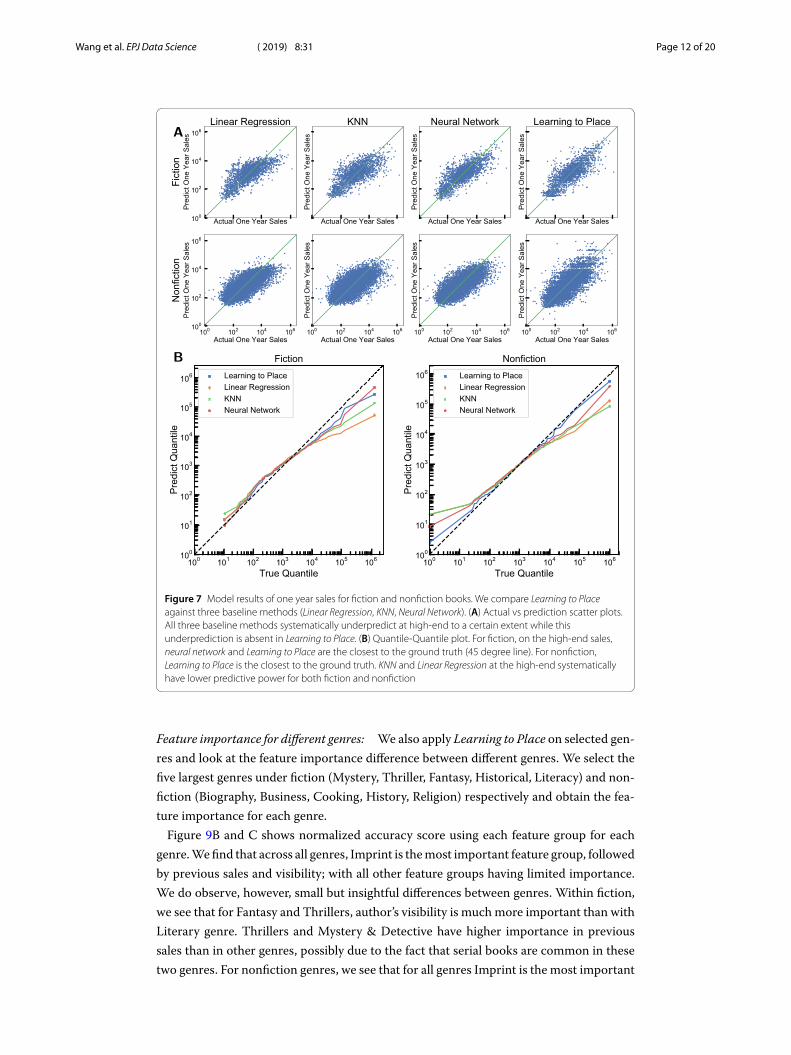
4.2 Feature importanceFeature importance for fiction and nonfiction: To identify the relative importance of spe-cific feature groups, we plot the AUC score using each feature group for fiction and non-fiction, shown in Fig. 9A. It is remarkable how similar the curves are, suggesting that thedriving forces determining book sales are rather universal. We can also see that for bothfiction and nonfiction, Imprint is the most important feature group. However, fiction re-lies slightly more on previous sales and visibility than nonfiction, while nonfiction reliesslightly more on the imprint prestige.
Wang et al. EPJ Data Science (2019) 8:31 Page 12 of 20
Figure 7 Model results of one year sales for fiction and nonfiction books. We compare Learning to Placeagainst three baseline methods (Linear Regression, KNN, Neural Network). (A) Actual vs prediction scatter plots.All three baseline methods systematically underpredict at high-end to a certain extent while thisunderprediction is absent in Learning to Place. (B) Quantile-Quantile plot. For fiction, on the high-end sales,neural network and Learning to Place are the closest to the ground truth (45 degree line). For nonfiction,Learning to Place is the closest to the ground truth. KNN and Linear Regression at the high-end systematicallyhave lower predictive power for both fiction and nonfiction
Feature importance for different genres: We also apply Learning to Place on selected gen-res and look at the feature importance difference between different genres. We select thefive largest genres under fiction (Mystery, Thriller, Fantasy, Historical, Literacy) and non-fiction (Biography, Business, Cooking, History, Religion) respectively and obtain the fea-ture importance for each genre.
Figure 9B and C shows normalized accuracy score using each feature group for eachgenre. We find that across all genres, Imprint is the most important feature group, followedby previous sales and visibility; with all other feature groups having limited importance.We do observe, however, small but insightful differences between genres. Within fiction,we see that for Fantasy and Thrillers, author’s visibility is much more important than withLiterary genre. Thrillers and Mystery & Detective have higher importance in previoussales than in other genres, possibly due to the fact that serial books are common in thesetwo genres. For nonfiction genres, we see that for all genres Imprint is the most important

Wang et al. EPJ Data Science (2019) 8:31 Page 13 of 20
C
Category Fiction Nonfiction
Method AUC score High-end RMSE AUC score High-end RMSE
KNN 0.83 ± 0.03 0.71 ± 0.06 0.82 ± 0.01 0.62 ± 0.02
Linear Regression 0.85 ± 0.01 0.60 ± 0.07 0.85 ± 0.01 0.52 ± 0.03
Neural Network 0.86 ± 0.03 0.50 ± 0.12 0.85 ± 0.01 0.48 ± 0.05
Learning to Place 0.88 ± 0.01 0.46 ± 0.13 0.86 ± 0.01 0.43 ± 0.01
Figure 8 ROC curve and measurement table for one year sales. ROC curve for (A) fiction books and (B)nonfiction books. The Learning to Placemethod performs better than Linear Regression as well as the KNNBaseline. Neural Network achieves comparable ROC curves. Band around the curve represents the standarddeviation of the score across 5-fold cross validation. (C) Measurement Table comparing the performance ofKNN, Linear Regression, Neural Network and Learning to Place. A higher AUC is better; a lower RMSE is better.We see that Learning to Place outperforms in every measure
feature group. Biography relies more on the author’s visibility than his/her previous sales;while Religion shows the exact opposite pattern: previous sales matters more than authorvisibility.
Since we have features in three main categories: author, book and publisher, we can alsolook at the importance for each of these categories. To achieve this, we train three models,each including only one feature category. We then predict the sales of each book usingeach of these three models separately, and obtain the absolute error Eauthor, Ebook, Epublisher
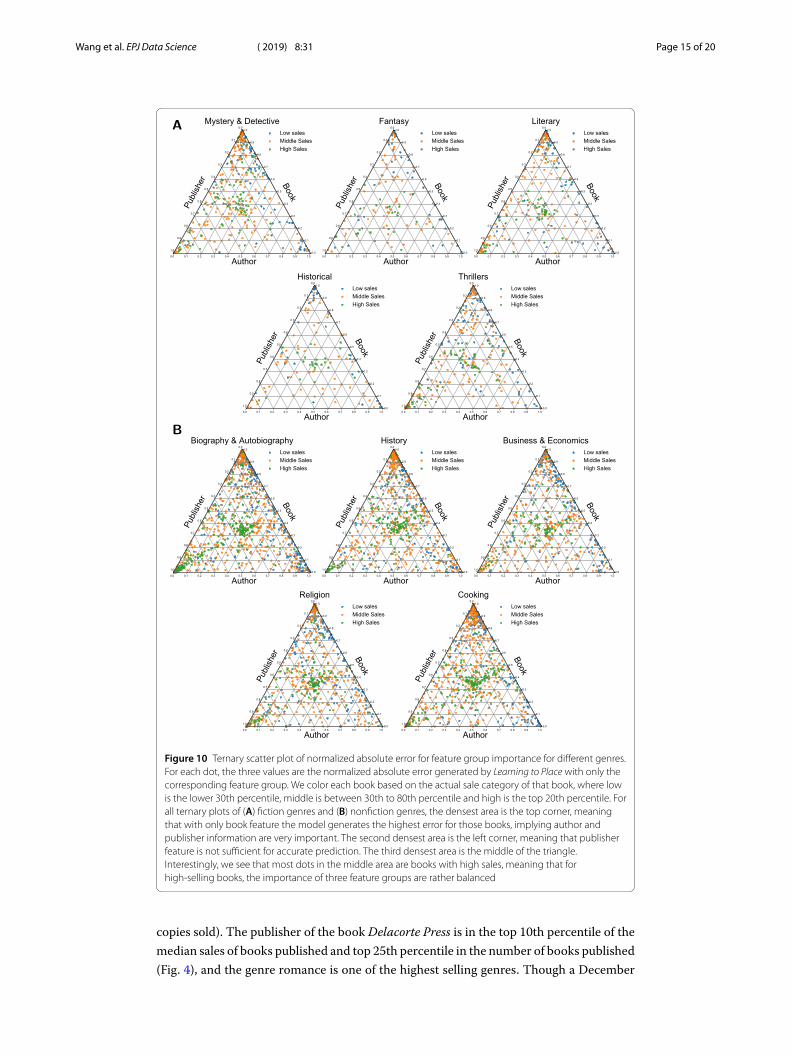
compared to the true sales of the book, and normalize these three errors so that they sumup to one. Finally, we use a ternary plot to inspect the source of errors for different books.
Figure 10 shows the ternery plot for books in different genres in fiction and nonfiction.To help interpret the plot, we color the books based on their actual sales. We observethat for all genres, the top corner has the highest density, meaning that if we rely only onthe book feature category, we have the largest prediction error, showing that imprint andauthor feature are very important sales predictors. The left corner has the second highestdensity for most genres, meaning that for many books, having only publisher informationis not sufficient to obtain a good prediction. The middle of the triangle has the third highestdensity, which is seen more clearly in nonfiction genres. Most books in the middle areaare high selling books, which indicates that true excellence in book sales require excellingin all three dimensions: author, book and publisher.
Wang et al. EPJ Data Science (2019) 8:31 Page 14 of 20
Figure 9 Feature group importance radar plot. (A) Radar plot of feature group importance for fiction andnonfiction books. Imprint is the most important feature group for both fiction and nonfiction. However, wesee that fiction relies more on the author’s previous sale and visibility than nonfiction; while nonfiction reliesmore on imprint. (B) Radar plot of feature group importance for fiction sub-genres. Imprint is still the mostimportant feature group. For fiction genres, we see that for Fantasy and Thrillers, author’s visibility is muchmore important than for the Literary genre. Thrillers and Mystery & Detective have higher importance inprevious sales than other genres. (C) Radar plot of feature group importance for nonfiction sub-genres.Similarly, imprint is the most important feature group for all sub-genres. Biography relies more on the author’svisibility than his/her previous sales while Religion is the exact opposite
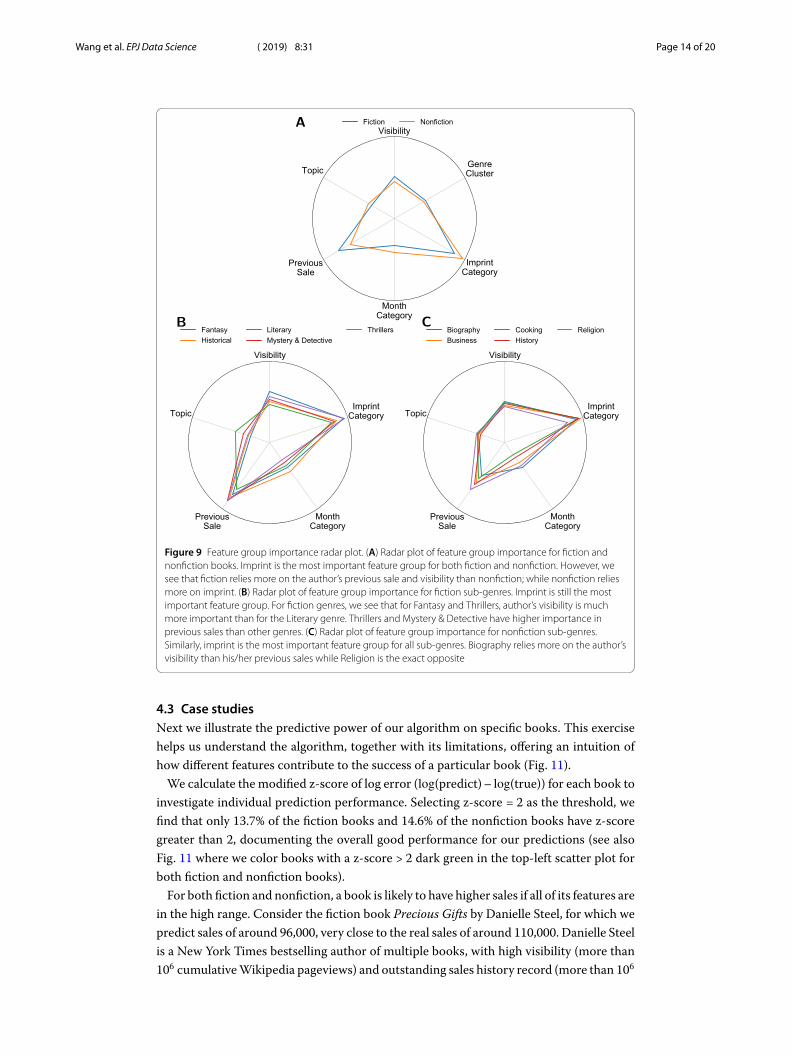
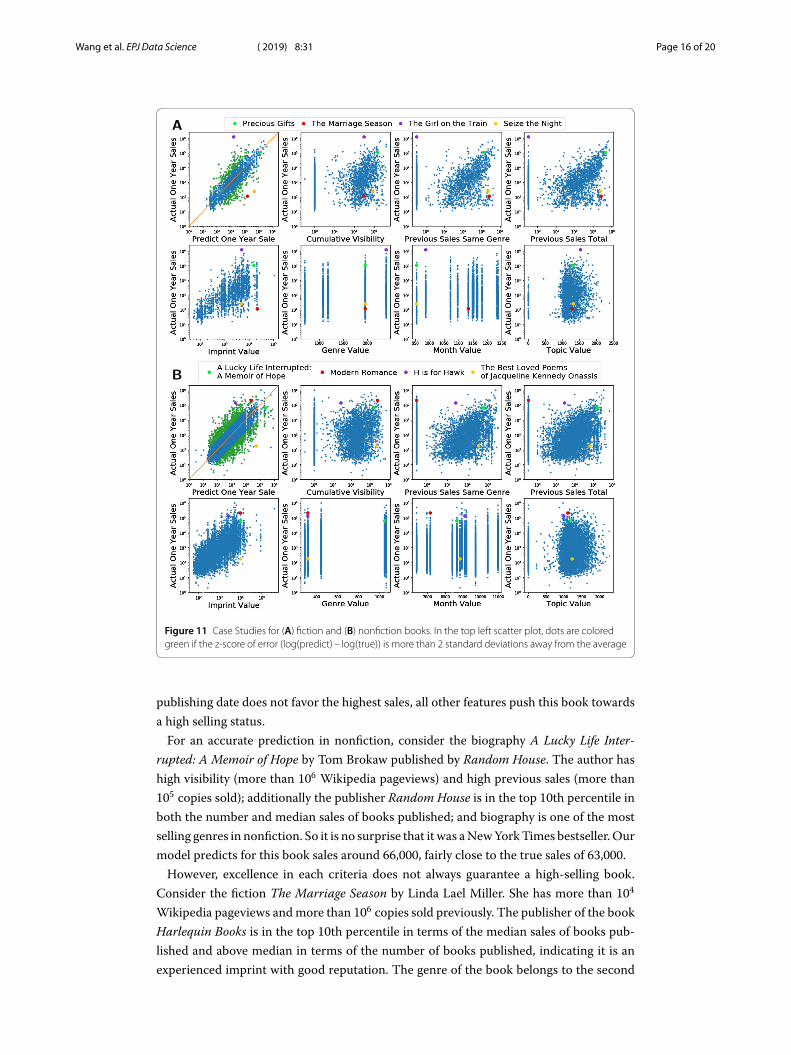
4.3 Case studiesNext we illustrate the predictive power of our algorithm on specific books. This exercisehelps us understand the algorithm, together with its limitations, offering an intuition ofhow different features contribute to the success of a particular book (Fig. 11).
We calculate the modified z-score of log error (log(predict) – log(true)) for each book toinvestigate individual prediction performance. Selecting z-score = 2 as the threshold, wefind that only 13.7% of the fiction books and 14.6% of the nonfiction books have z-scoregreater than 2, documenting the overall good performance for our predictions (see alsoFig. 11 where we color books with a z-score > 2 dark green in the top-left scatter plot forboth fiction and nonfiction books).
For both fiction and nonfiction, a book is likely to have higher sales if all of its features arein the high range. Consider the fiction book Precious Gifts by Danielle Steel, for which wepredict sales of around 96,000, very close to the real sales of around 110,000. Danielle Steelis a New York Times bestselling author of multiple books, with high visibility (more than106 cumulative Wikipedia pageviews) and outstanding sales history record (more than 106
Wang et al. EPJ Data Science (2019) 8:31 Page 15 of 20
Figure 10 Ternary scatter plot of normalized absolute error for feature group importance for different genres.For each dot, the three values are the normalized absolute error generated by Learning to Place with only thecorresponding feature group. We color each book based on the actual sale category of that book, where lowis the lower 30th percentile, middle is between 30th to 80th percentile and high is the top 20th percentile. Forall ternary plots of (A) fiction genres and (B) nonfiction genres, the densest area is the top corner, meaningthat with only book feature the model generates the highest error for those books, implying author andpublisher information are very important. The second densest area is the left corner, meaning that publisherfeature is not sufficient for accurate prediction. The third densest area is the middle of the triangle.Interestingly, we see that most dots in the middle area are books with high sales, meaning that forhigh-selling books, the importance of three feature groups are rather balanced
copies sold). The publisher of the book Delacorte Press is in the top 10th percentile of themedian sales of books published and top 25th percentile in the number of books published(Fig. 4), and the genre romance is one of the highest selling genres. Though a December
Wang et al. EPJ Data Science (2019) 8:31 Page 16 of 20
Figure 11 Case Studies for (A) fiction and (B) nonfiction books. In the top left scatter plot, dots are coloredgreen if the z-score of error (log(predict) – log(true)) is more than 2 standard deviations away from the average
publishing date does not favor the highest sales, all other features push this book towardsa high selling status.
For an accurate prediction in nonfiction, consider the biography A Lucky Life Inter-rupted: A Memoir of Hope by Tom Brokaw published by Random House. The author hashigh visibility (more than 106 Wikipedia pageviews) and high previous sales (more than105 copies sold); additionally the publisher Random House is in the top 10th percentile inboth the number and median sales of books published; and biography is one of the mostselling genres in nonfiction. So it is no surprise that it was a New York Times bestseller. Ourmodel predicts for this book sales around 66,000, fairly close to the true sales of 63,000.
However, excellence in each criteria does not always guarantee a high-selling book.Consider the fiction The Marriage Season by Linda Lael Miller. She has more than 104
Wikipedia pageviews and more than 106 copies sold previously. The publisher of the bookHarlequin Books is in the top 10th percentile in terms of the median sales of books pub-lished and above median in terms of the number of books published, indicating it is anexperienced imprint with good reputation. The genre of the book belongs to the second

Wang et al. EPJ Data Science (2019) 8:31 Page 17 of 20
high-selling genre cluster. Our model predicts it will sell 14,000 copies; however, it soldonly about 110 copies in one year. According to the top review on Amazon of this book,one reader remarked that it was “boring when it comes to romance and the depth of char-acters”. In other words, the quality of the book failed to appeal to the readers, somethingour features fail to capture.
We also find that visibility can be very important. Consider, for example, Modern Ro-mance by Aziz Ansari, an author without previous sales, but a well-known actor and co-median, with more than 106 Wikipedia pageviews. Together with the fact that the pub-lisher is Penguin Press, which is one of the highest ranked publishers in Nonfiction (top10th percentile in both median sales and number of books published), this book ended upbeing a bestseller. Our model underpredicts its sales (prediction is around 23,000 whilethe true sales is around 211,000), because most bestselling books are by authors with highprevious sales.
Finally, there are always surprising cases in publishing industry, for example, the phe-nomenal bestseller The Girl on the Train by Paula Hawkins. She worked as a journalist forthe Times in the Business section, having some visibility (about 104 pageviews) before herbook. She has written several romantic comedy fiction books but under the pseudonymAmy Silver. Therefore, when we look at the features of The Girl on the Train, we find thatshe has no previous sales in Thrillers & Suspense. The book was out in January—a monththat is very unlikely to lead to high one-year sales. Yet the publisher of the book, River-head Books, has a good reputation (top 25th percentile in both median sales and numberof books published). However, since there are not many fiction authors that obtain suchtremendous sales without any publishing history, our model greatly underpredicts herbook (prediction around 1500 vs. actual sales 1,300,000). In nonfiction, we have H is forHawk by Helen Macdonald published by Grove Press, in which case both the visibility andprevious sales of the author are not very high (about 102 pageviews and copies sold pre-viously); the publisher is strong but not among the top publishers (top 25th percentile inmedian sales and above median in number of books published); the genre and topic of thebook is not the most-selling one. However, this book became a bestseller while our modelfails to predict it (our prediction is around 3000 and actual sales was 140,000).
Additionally, note that some of the incorrect predictions are rooted in data error. Con-sider for example for Seize the Night by Sherrilyn Kenyon, an author with high visibility(more than 105 pageviews) and previous sales (more than 106 copies sold), good imprint(St. Martins Press is in the top 10th percentile in number of books and top 25th percentilein median sales of books published), so our model predicts sales of 45,000 while the bookonly sold about 200 copies. With further inspection, we found out that the novel is origi-nally published in 2004, not 2015 as Bookscan recorded, and has sold well. Similarly, non-fiction The Best Loved Poems of Jacqueline Kennedy Onassis by Caroline Kennedy underGrand Central Publishing, with claimed publication year 2015 in Bookscan is underpre-dicted: prediction around 53,000 while the database shows the actual sales around 180.It turns out that the book was originally published in 2001 and was a New York Timesbestseller.
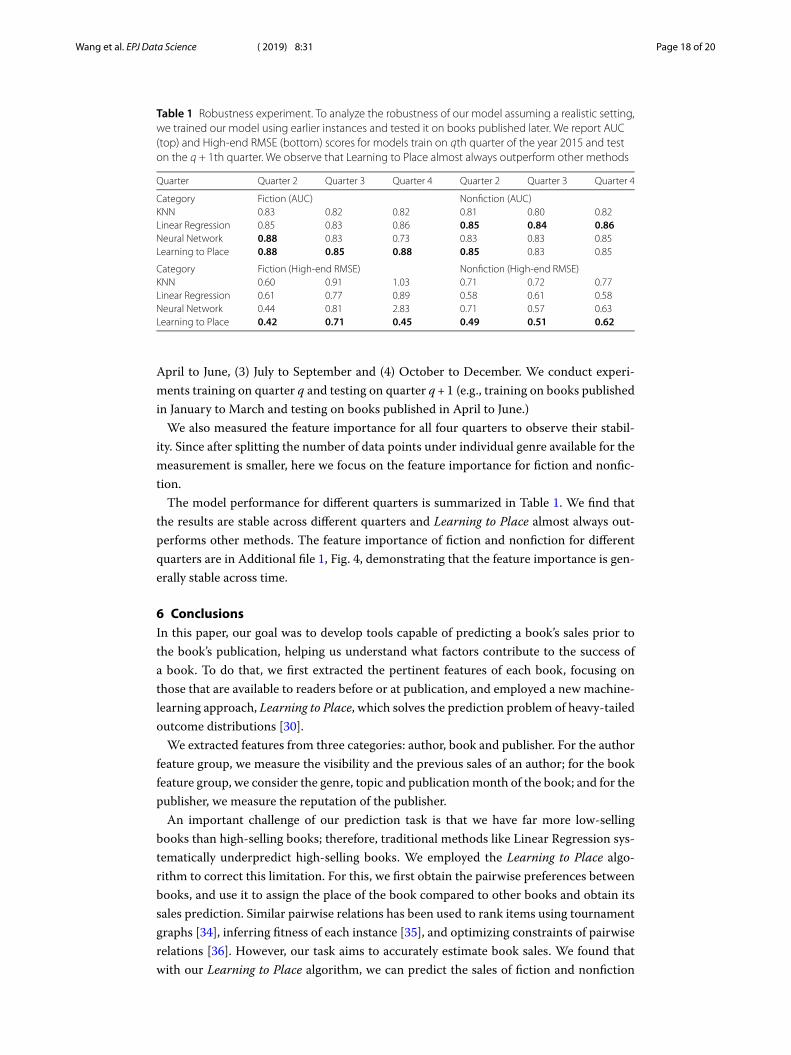
5 Robustness analysisWe conducted a robustness experiment to evaluate the model’s performance across time.For this, we split the book’s publication date in four quarters: (1) January to March, (2)
Wang et al. EPJ Data Science (2019) 8:31 Page 18 of 20
Table 1 Robustness experiment. To analyze the robustness of our model assuming a realistic setting,we trained our model using earlier instances and tested it on books published later. We report AUC(top) and High-end RMSE (bottom) scores for models train on qth quarter of the year 2015 and teston the q + 1th quarter. We observe that Learning to Place almost always outperform other methods
Quarter Quarter 2 Quarter 3 Quarter 4 Quarter 2 Quarter 3 Quarter 4
Category Fiction (AUC) Nonfiction (AUC)KNN 0.83 0.82 0.82 0.81 0.80 0.82Linear Regression 0.85 0.83 0.86 0.85 0.84 0.86Neural Network 0.88 0.83 0.73 0.83 0.83 0.85Learning to Place 0.88 0.85 0.88 0.85 0.83 0.85
Category Fiction (High-end RMSE) Nonfiction (High-end RMSE)KNN 0.60 0.91 1.03 0.71 0.72 0.77Linear Regression 0.61 0.77 0.89 0.58 0.61 0.58Neural Network 0.44 0.81 2.83 0.71 0.57 0.63Learning to Place 0.42 0.71 0.45 0.49 0.51 0.62
April to June, (3) July to September and (4) October to December. We conduct experi-ments training on quarter q and testing on quarter q + 1 (e.g., training on books publishedin January to March and testing on books published in April to June.)
We also measured the feature importance for all four quarters to observe their stabil-ity. Since after splitting the number of data points under individual genre available for themeasurement is smaller, here we focus on the feature importance for fiction and nonfic-tion.
The model performance for different quarters is summarized in Table 1. We find thatthe results are stable across different quarters and Learning to Place almost always out-performs other methods. The feature importance of fiction and nonfiction for differentquarters are in Additional file 1, Fig. 4, demonstrating that the feature importance is gen-erally stable across time.
6 ConclusionsIn this paper, our goal was to develop tools capable of predicting a book’s sales prior tothe book’s publication, helping us understand what factors contribute to the success ofa book. To do that, we first extracted the pertinent features of each book, focusing onthose that are available to readers before or at publication, and employed a new machine-learning approach, Learning to Place, which solves the prediction problem of heavy-tailedoutcome distributions [30].
We extracted features from three categories: author, book and publisher. For the authorfeature group, we measure the visibility and the previous sales of an author; for the bookfeature group, we consider the genre, topic and publication month of the book; and for thepublisher, we measure the reputation of the publisher.
An important challenge of our prediction task is that we have far more low-sellingbooks than high-selling books; therefore, traditional methods like Linear Regression sys-tematically underpredict high-selling books. We employed the Learning to Place algo-rithm to correct this limitation. For this, we first obtain the pairwise preferences betweenbooks, and use it to assign the place of the book compared to other books and obtain itssales prediction. Similar pairwise relations has been used to rank items using tournamentgraphs [34], inferring fitness of each instance [35], and optimizing constraints of pairwiserelations [36]. However, our task aims to accurately estimate book sales. We found thatwith our Learning to Place algorithm, we can predict the sales of fiction and nonfiction
Wang et al. EPJ Data Science (2019) 8:31 Page 19 of 20
fairly accurately and the algorithm does not suffer from systematic underprediction forhigh-selling books comparing to Linear Regression and k-nearest neighbors.
The developed framework also allows us to understand the features driving the booksales. We found that for both fiction and nonfiction, the publisher quality and experienceis the most important feature, due to the fact that the publisher both pre-selects and ad-vertises the book. Previous publishing history and visibility of the author are very impor-tant as well since readers are more likely to read books written by experienced authorsor celebrities. The genre, topic and publication month of the book, however, have onlylimited influence on the sales of the book.
We also found that the feature importance are slightly different for different genres. ForThrillers and Mystery & Detective, author’s visibility and previous sales are more impor-tant than in other fiction genres. In nonfiction genres, Biography relies more on visibilitythan previous sales; while this is the opposite for History. Using the ternery plot we alsofind that author and publisher are very important for most books and for most of highselling books, author, publisher and book contributes equally to the sales.
We expect our methodology and findings to serve as a starting point towards a betterunderstanding of the mechanisms driving the publishing industry and reader preferences.We hope that our research will inspire more investigation in the success of books and au-thors, helping us to create a more innovative, predictive as well as profitable environmentfor authors as well as for the publishing industry.
Supplementary informationSupplementary information accompanies this paper at https://doi.org/10.1140/epjds/s13688-019-0208-6.
Additional file 1. Supplementary information (PDF 987 kB)
AcknowledgementsWe wish to thank Douglas Abrams, Akos Erdös and Adam Halmes for offering insider’s view to the publishing word andhelping us understand it better, Alice Grishchenko for helpful visualizations, Peter Rupert and other colleagues at theCCNR, especially those in the success group, for valuable discussions and comments.
FundingThis research was supported by Air Force Office of Scientific Research (AFOSR) under agreements FA9550-15-1-0077 andFA9550-19-1-0359, John Templeton Foundation under agreement 61066 and DARPA under agreementN66001-16-1-4067. ALB has received funding from the European Union’s Horizon 2020 research and innovationprogramme under grant agreement No 810115-DYNASNET.
Competing interestsALB is the founder and holds shares of three startups that use network science and data science tools. The other authorsdeclare that they have no competing interests.
Authors’ contributionsAll authors designed the research. XW and BY, prepared and cleaned the data. XW, BY, OV and TE-R designed thealgorithm, conducted the experiments and prepared the figures. XW and A-LB wrote the manuscript. All authors readand approved the final manuscript.
Author details1Center for Complex Network Research and Department of Physics, Northeastern University, Boston, USA. 2College ofComputer and Information Science, Northeastern University, Boston, USA. 3Department of Medicine, Brigham andWomen’s Hospital, Harvard Medical School, Boston, USA. 4Center for Network Science, Central European University,Budapest, Hungary.
Publisher’s NoteSpringer Nature remains neutral with regard to jurisdictional claims in published maps and institutional affiliations.
Received: 21 February 2019 Accepted: 10 September 2019
Wang et al. EPJ Data Science (2019) 8:31 Page 20 of 20
References1. Statista: U.S. Book Industry/Market—Statistics & Facts. https://www.statista.com/topics/1177/book-market/ [Online;
accessed 23-May-2018] (2018)2. Ashok VG, Feng S, Choi Y (2013) Success with style: using writing style to predict the success of novels. In:
Proceedings of the 2013 conference on empirical methods in natural language processing, pp 1753–17643. Clement M, Proppe D, Rott A (2007) Do critics make bestsellers? Opinion leaders and the success of books. J Media
Econ 20(2):77–1054. Chevalier JA, Mayzlin D (2006) The effect of word of mouth on sales: online book reviews. J Mark Res 43(3):345–3545. Kovács B, Sharkey AJ (2014) The paradox of publicity: how awards can negatively affect the evaluation of quality.
Adm Sci Q 59(1):1–336. Shehu E, Prostka T, Schmidt-Stölting C, Clement M, Blömeke E (2014) The influence of book advertising on sales in
the German fiction book market. J Cult Econ 38(2):109–1307. Nakamura L (2013) “Words with friends”: socially networked reading on Goodreads. PMLA 128(1):238–2438. Beck J (2007) The sales effect of word of mouth: a model for creative goods and estimates for novels. J Cult Econ
31(1):5–239. Schmidt-Stölting C, Blömeke E, Clement M (2011) Success drivers of fiction books: an empirical analysis of hardcover
and paperback editions in Germany. J Media Econ 24(1):24–47. https://doi.org/10.1080/08997764.2011.54942810. Dellarocas C, Zhang XM, Awad NF (2007) Exploring the value of online product reviews in forecasting sales: the case
of motion pictures. J Interact Mark 21(4):23–45. https://doi.org/10.1002/dir.2008711. Abel F, Diaz-Aviles E, Henze N, Krause D, Siehndel P (2010) Analyzing the blogosphere for predicting the success of
music and movie products. In: Advances in social networks analysis and mining (ASONAM), 2010 internationalconference on. IEEE Press, New York, pp 276–280
12. Park J, Ciampaglia GL, Ferrara E (2016) Style in the age of instagram: predicting success within the fashion industryusing social media. In: Proceedings of the 19th ACM conference on computer-supported cooperative work & socialcomputing. CSCW ’16. ACM, New York, pp 64–73. https://doi.org/10.1145/2818048.2820065
13. Fourt LA, Woodlock JW (1960) Early prediction of market success for new grocery products. J Mark 25(2):31–3814. Mestyán M, Yasseri T, Kertész J (2013) Early prediction of movie box office success based on Wikipedia activity big
data. PLoS ONE 8(8):7122615. Varol O, Ferrara E, Menczer F, Flammini A (2017) Early detection of promoted campaigns on social media. EPJ Data Sci
6(1):1316. Yucesoy B, Wang X, Huang J, Barabási A-L (2018) Success in books: a big data approach to bestsellers. EPJ Data Sci
7(1):717. Group, B.I.S.: Complete BISAC Subject Headings List, 2017 Edition. http://bisg.org/page/BISACEdition [Online;
accessed 4-October-2017] (2017)18. Wikipedia: Data dumps. https://meta.wikimedia.org/wiki/Data_dumps [Online; accessed 13-April-2018] (2018)19. Wikipedia: API:Main page. https://www.mediawiki.org/wiki/API:Main_page [Online; accessed 13-April-2018] (2018)20. Spoerri A (2007) What is popular on Wikipedia and why? First Monday 12(4)21. Keegan B, Gergle D, Contractor N (2013) Hot off the Wiki: structures and dynamics of Wikipedia’s coverage of
breaking news events. Am Behav Sci 57(5):595–62222. Yucesoy B, Barabási A-L (2016) Untangling performance from success. EPJ Data Sci 5(1):1723. Bird S, Klein E, Loper E (2009) Natural language processing with Python, 1st edn. O’Reilly Media, Sebastopol24. Manning CD, Schütze H (1999) Foundations of statistical natural language processing. MIT Press, Cambridge25. Lloyd S (1982) Least squares quantization in pcm. IEEE Trans Inf Theory 28(2):129–13726. King G, Zeng L (2001) Logistic regression in rare events data. Polit Anal 9(2):137–16327. Hsu D, Sabato S (2016) Loss minimization and parameter estimation with heavy tails. J Mach Learn Res 17(1):543–58228. Maalouf M, Homouz D, Trafalis TB (2018) Logistic regression in large rare events and imbalanced data: a performance
comparison of prior correction and weighting methods. Comput Intell 34(1):161–17429. Schubach M, Re M, Robinson PN, Valentini G (2017) Imbalance-aware machine learning for predicting rare and
common disease-associated non-coding variants. Sci Rep 7(1):295930. Wang X, Varol O, Eliassi-Rad T (2019) L2P: an algorithm for estimating heavy-tailed outcomes. arXiv preprint.
arXiv:1908.0462831. Breiman L (2001) Random forests. Mach Learn 45(1):5–3232. Mosteller F, Tukey JW (1968) Data analysis, including statistics. Handb Soc Psychol 2:80–20333. Stone M (1974) Cross-validatory choice and assessment of statistical predictions. J R Stat Soc, Ser B, Methodol
36:111–14734. Cohen WW, Schapire RE, Singer Y (1998) Learning to order things. In: Advances in neural information processing
systems, pp 451–45735. Herbrich R, Minka T, Graepel T (2007) Trueskill™: a Bayesian skill rating system. In: Advances in neural information
processing systems, pp 569–57636. Joachims T (2002) Optimizing search engines using clickthrough data. In: Proc of the 8th ACM SIGKDD intl conf on
knowledge discovery and data mining. ACM, New York, pp 133–142