Embed Size (px)
Citation preview
TSINGHUA SCIENCE AND TECHNOLOGY ISSNll1007-0214ll02/15llpp121-132 Volume 16, Number 2, April 2011
Suboptimal Auditory Dominance in Audiovisual Integration of Temporal Cues*
M Maiworm**, B Röder
Biological Psychology and Neuropsychology, University of Hamburg, D-20146 Hamburg, Germany
Abstract: The present study examined whether audiovisual integration of temporal stimulus features in hu-
mans can be predicted by the maximum likelihood estimation (MLE) model which is based on the weighting
of unisensory cues by their relative reliabilities. In an audiovisual temporal order judgment paradigm, the re-
liability of the auditory signal was manipulated by Gaussian volume envelopes, introducing varying degrees
of temporal uncertainty. While statistically optimal weighting according to the MLE rule was found in half of
the participants, the other half consistently overweighted the auditory signal. The results are discussed in
terms of a general auditory bias in time perception, interindividual differences, as well as in terms of the
conditions and limits of statistically optimal multisensory integration.
Key words: audiovisual integration; statistically optimal behavior; temporal perception
Introduction
In order to successfully interact with our environment, various pieces of information available in the envi-ronment are gathered through our different senses and combined into a coherent perceptual sensation.
The question of how the brain takes advantage of redundant perceptual data when combining input from different modalities has given rise to an extensive body of experimental work.
Bayesian methods have been successfully applied to model perceptual processing in the human brain[1,2]. The reason is that perception might be understood as an inference process estimating physical stimulus pa-rameters from noisy, incomplete, and ambiguous data. Bayes rule states that the probability of a hypothesis given a set of data depends on the probability of the data given the hypothesis (called likelihood) as well as
prior belief about the hypothesis. This can be used to model perceptual inference, implying that the nervous system takes into consideration generative models of perception, i.e., models of how perceived stimulus features result from different states of nature. In a Bayesian framework, a generative model can be taken into account by the likelihood distribution. In a subse-quent step, the likelihood distribution is weighted with prior belief about the given object (prior distribution) to come up with statistical estimates for the physical pa-rameters of distal stimuli. In addition, the use of prob-ability distributions is well suited to model perceptual uncertainty and incompleteness. The fact that Bayesian formalisms were capable of predicting experimental data from humans under different conditions[3-6] and of even simulating well-known perceptual illusions[7] sug-gests that the human perceptual system may indeed take into account not only the perceptual input itself, but also generative models of perception.
Ernst and Banks[8] were among the first to propose a maximum likelihood model for the integration of multisensory stimuli which can be derived from Bayes rule[9]. In order to test the model, they conducted a visuohaptic size discrimination task. Besides
Received: 2011-01-26
* Supported by the German Research Foundation (DFG) (No. GK 1247/1)
** To whom correspondence should be addressed. E-mail: [email protected]; Tel: 49-(0)40-42838-8265
Tsinghua Science and Technology, April 2011, 16(2): 121-132 122
manipulating the size of visuohaptic objects on a trial-by-trial basis, different levels of perceptual noise were imposed on the visual stimulus. By presenting subtle discrepancies between the visual and the haptic stimuli, they were able to assess how the overall per-ceived object height was influenced by each of the two modalities across the different levels of visual noise. As a main finding, the participants relied more on the haptic input with increasing visual noise, demonstrat-ing that, in a multisensory world, humans are able to take into account the reliabilities of the unisensory in-put streams to dynamically adjust how much each of the involved modalities contribute to the perceived multisensory percept. Crucially, the behavioral data could be well predicted quantitatively by means of the maximum likelihood estimation (MLE) model.
According to this model, the “statistically optimal” perceptual estimate in a multisensory situation is a weighted sum of the unisensory estimates. The weight of each cue is determined by the reliability of the cor-responding modality, which again is estimated as the inverse of the variance of the response distribution across the parameter space, obtained from uni-sensory pre-experiments. This multisensory estimate is “statis-tically optimal” because it represents the unbiased es-timator with the least variance for the perceptual task.
One major assumption behind predicting cue inte-gration by means of the MLE model is that the brain has access to the reliabilities of the different modalities. Ma et al.[10] (see also Ref. [11]) demonstrated that, given the realistic scenario of Poisson-like neuronal spiking behavior, the firing rates of sets of neurons could be understood as representing posterior probabil-ity distributions across the parameter space of a stimu-lus. This conception of probabilistic population coding even implies, under some further assumptions, that the multiplicative rule of the MLE model can be reduced to a simple neuron-by-neuron addition, an algorithm that can easily be implemented in neuronal tissue.
On grounds of the experimental support for statisti-cally optimal multisensory integration as exemplified by the study of Ernst and Banks[8], several studies have addressed the question whether human multisensory perception follows the predictions of the MLE rule in other physical domains and across other modalities as well. Alais and Burr[12] demonstrated that audiovisual integration of spatial cues could be well predicted by the MLE rule (see also Refs. [13,14]). In the temporal
domain, integration of auditory and vibrotactile infor-mation was in accord with the predictions from the MLE model in a similar manner[15]. For audiovisual integration of temporal stimulus aspects, however, findings are less clear. Shams et al.[16] reported that the sound-induced flash illusion (a single flash is per-ceived as multiple flashes when accompanied by mul-tiple auditory beeps[17]) could be explained as resulting from statistically optimal integration. On the contrary, Bentvelzen et al.[18] demonstrated that, in an audiovis-ual speed discrimination task, human performance fol-lowed the MLE prediction only if the relative weights for the two modalities did not differ by more than a factor of 3:1. Burr et al.[19] conducted a temporal bisec-tion task including audiovisual stimuli. Two different auditory stimuli were used to influence perceptual un-certainty of the auditory modality. The two tones dif-fered by the width of a Gaussian volume envelope (10 ms versus 80 ms standard deviation), mean fre-quency (1700 Hz vs 200 Hz), and intensity (82 dB versus 70 dB). The participants’ task was to respond whether the second of three subsequently presented stimuli was temporally closer to the first or the third stimulus. Comparison of predicted and empirical per-ceptual weights revealed that relative to the MLE model predictions, human observers consistently over-weighted the auditory input. The authors hypothesized that one of the reasons why the model failed to predict the empirical weights could be that additional percep-tual noise was introduced in their paradigm. This is be-cause participants had to estimate the temporal mid be-tween the first and the last stimulus before being able to judge the relative timing of the second stimulus.
Given the many findings in favor of statistically op-timal multisensory integration on the one hand and the controversial findings for optimal audiovisual binding specifically in the temporal domain on the other hand, the goal of the present study was to examine whether the auditory and visual weights for temporal perception follow the MLE predictions, or whether the dominant role of audition (relative to the model predictions) re-ported by Burr et al.[19] could be confirmed. We used a novel paradigm including temporal order judgments (TOJs) that allowed participants to directly compare two stimuli instead of comparing one stimulus with the temporal mid of two other stimuli. Participants were required to judge the relative timing of audiovisual stimuli presented in the left and the right hemifield.
M Maiworm et al.:Suboptimal Auditory Dominance in Audiovisual Integration … 123
Similar to the experiment by Burr et al.[19], the stimuli were temporally blurred by Gaussian envelopes modu-lating the intensity of the signal over time, thereby ma-nipulating the relative perceptual uncertainty (regard-ing the time of maximal intensity) of the auditory mo-dality. In this way, the predictions from the MLE rule could be computed both for situations of (expected) auditory dominance and situations of (expected) visual dominance within the same paradigm.
1 Method 1.1 Participants
Sixteen right-handed healthy adults (four male) with normal or corrected-to-normal vision and normal hearing capabilities participated in this study. They were all students of the University of Hamburg and received either course credit or monetary compensa-tion. The participants were aged from 20 to 46 years (mean age: 26 years). They were naїve regarding the purpose of the experiment.
1.2 Materials
Throughout the experiments, visual and auditory stim-uli were presented alone or in combination. Auditory stimuli were played from two loudspeakers placed in front of the participants, one in each hemifield. The location of the loudspeakers extended 21° to the left and right from midline. A light-emitting diode (LED) was attached to each of the two speakers, generating the visual stimuli. The distance between the location where the participants were seated and the loudspeak-ers was 63 cm. At midline, a fixation cross was pre-sented on a 17 inch LCD screen (type: Samsung SyncMaster 172x) with a refresh rate of 50 Hz.
The auditory stimulus was a 440 Hz sine tone which was temporally blurred by a temporal Gaussian volume envelope of varying width (5, 50 or 100 ms standard deviation). Likewise, the luminance of the visual stim-uli emitted from the LEDs was controlled by a Gaus-sian envelope. The area under the curve was held con-stant across the three intensity envelopes. Thus, the peak intensity was highest for the 5 ms stimuli.
1.3 Procedure
The whole procedure consisted of a visual, an auditory, and an audiovisual experiment, the latter being
distributed to two sessions. All participants were invited to four sessions on four different days. On the first day, half of the individuals took part in the visual experi-ment, the other half in the auditory one. For each par-ticipant, the unimodal experiment that had not been con-ducted on the first day was run on the second day. On the last two days, the audiovisual experiments were run.
In all experimental sessions, an audiovisual refer-ence stimulus was presented in one hemifield and a target stimulus in the other hemifield. The positions of the reference and target stimuli (i.e., left or right hemi-field) were switched after each block. Both the audi-tory and the visual part of the reference stimulus were controlled by a Gaussian envelope with a standard de-viation of five milliseconds. In the visual experiment, the target stimulus was an LED flash with a temporal luminance profile that had a standard deviation of 100 ms. The broad luminance profile was chosen be-cause visual dominance over audition had emerged in pre-experiments using visual stimuli with a short lu-minance profile (5 ms standard deviation). The audi-tory experiment included an auditory target stimulus, the width of the Gaussian controlling its loudness was varied over the blocks of the experiment (standard de-viation of 5 (“low auditory noise condition”), 50 (“me-dium auditory noise condition”), or 100 ms (“high auditory noise condition”), randomly shuffled across experimental blocks). For the audiovisual experiment, the target stimulus consisted of an auditory and a vis-ual part, being temporally displaced by either −50, −20, 20, or 50 ms (negative values indicate the auditory stimulus part leading). The temporal displacement was shuffled randomly over the trials of each block. In ad-dition, the loudness profile of the auditory part of the target stimulus was modulated the same way as in the auditory experiment, while the intensity of the visual part of the target was the same as in the visual experi-ment (100 ms Gaussian).
Each of the two unimodal experiments consisted of 24 blocks with 42 trials per block. The tested stimu-lus onset asynchronies (SOAs) between the reference stimulus and the temporal mid of the target stimulus (the time of highest stimulus intensity) were 35, 45, 60, 75, 100, 150, and 300 ms in both directions. All of these SOAs were presented three times – in random order – in each block. The two audiovisual experiments consisted of fifteen blocks each. The SOAs, the possible intervals between the time of the
Tsinghua Science and Technology, April 2011, 16(2): 121-132
124
reference stimulus and the temporal mid of the visual part of the target stimulus, were 35, 75, 150, and 300 ms in both directions. In each block, all possible combinations of the eight SOAs and the four bimodal displacements (−50, −20, 20, and 50 ms) were pre-sented. The four trials with SOA −300 ms and the four trials with SOA 300 ms were presented once in a block, the +/−150 ms trials twice, the +/−75 ms trials thrice, and the +/−35 trials four times, summing up to 80 trials in one block. All those trials were presented in random order in every block.
At the beginning of each experimental session, the participants were introduced to the stimuli and the task. They were instructed to fixate the central cross on the screen in front of them during the experiment. It was carefully explained to them that visual and auditory stimuli would be presented in the left and right hemi-field during the experiment, and that their task was to indicate in every trial on which side the stimulus was perceived first by pressing one of two response buttons (“left”, “right”). They were explicitly asked to base their temporal decision on the point in time when the stimu-lus was most intense (with regard to luminance for the visual stimuli and loudness for the auditory stimuli), rather than on the onset of the stimuli. Crucially, the participants were not informed that in the audiovisual experiment, the auditory and the visual parts of the target stimulus were never presented at the same time.
To familiarize the participants with the stimuli and the task, each of the experiments started with a training session. During the training session, feedback on whether the response was correct or not was given af-ter each trial. The training was aborted either after 25 min or after the variability of the participant’s rate of correct responses across the last five training blocks fell below a fixed threshold value (5×10⁻³ for the auditory experiment, 1×10⁻³ for the visual and audio-visual experiments). Data from the training sessions were not analyzed.
2 Results
We conducted a temporal order judgment paradigm with visual, auditory, and audiovisual stimuli in order to assess the weights the participants gave to each of the two modalities when integrating temporal informa-tion from audition and vision under different levels of auditory noise. Psychometric functions were used to
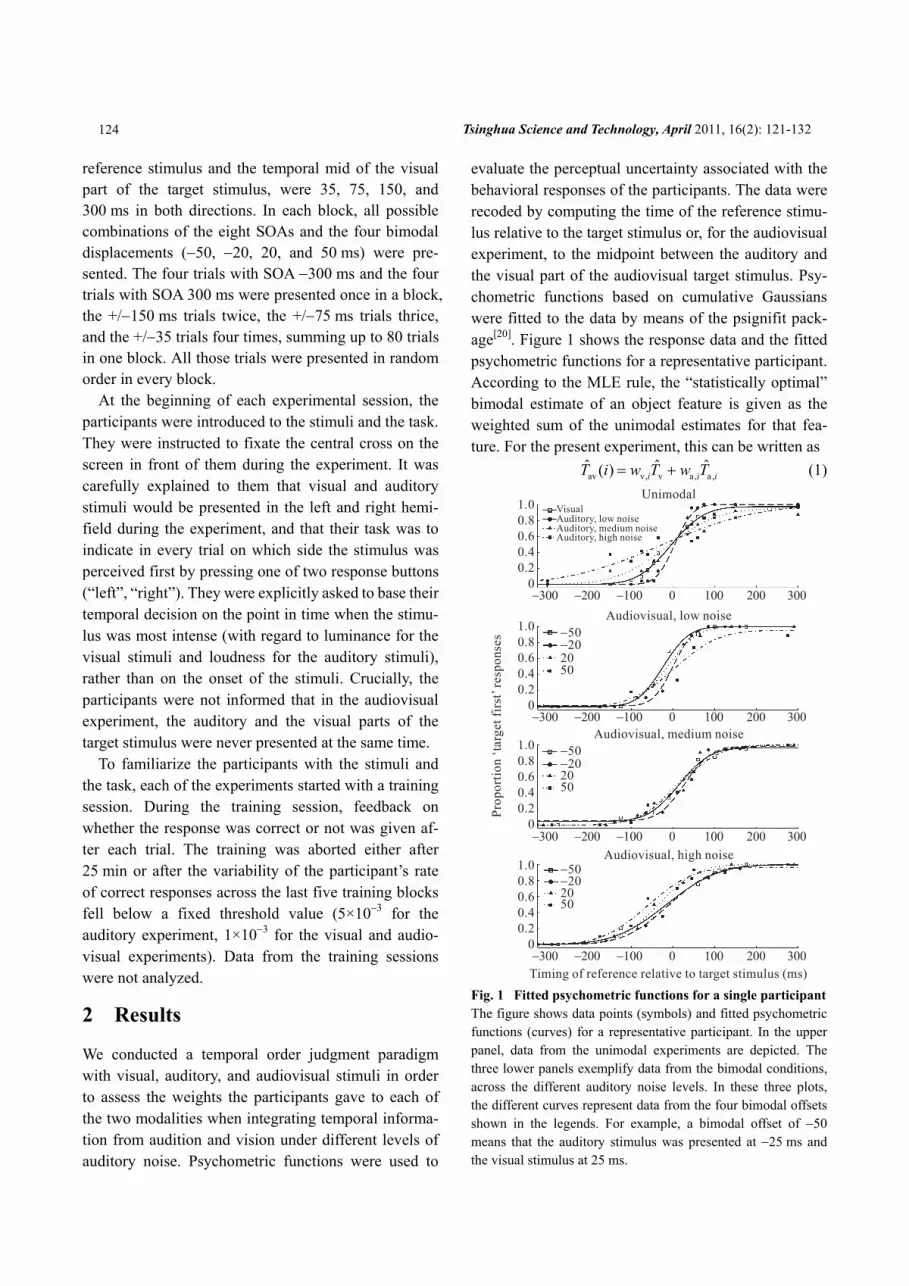
evaluate the perceptual uncertainty associated with the behavioral responses of the participants. The data were recoded by computing the time of the reference stimu-lus relative to the target stimulus or, for the audiovisual experiment, to the midpoint between the auditory and the visual part of the audiovisual target stimulus. Psy-chometric functions based on cumulative Gaussians were fitted to the data by means of the psignifit pack-age[20]. Figure 1 shows the response data and the fitted psychometric functions for a representative participant. According to the MLE rule, the “statistically optimal” bimodal estimate of an object feature is given as the weighted sum of the unimodal estimates for that fea-ture. For the present experiment, this can be written as
av v, v a, a,ˆ ˆ( ˆ) i i iT i w w TT= + (1)
Fig. 1 Fitted psychometric functions for a single participant The figure shows data points (symbols) and fitted psychometric functions (curves) for a representative participant. In the upper panel, data from the unimodal experiments are depicted. The three lower panels exemplify data from the bimodal conditions, across the different auditory noise levels. In these three plots, the different curves represent data from the four bimodal offsets shown in the legends. For example, a bimodal offset of −50 means that the auditory stimulus was presented at −25 ms and the visual stimulus at 25 ms.
M Maiworm et al.:Suboptimal Auditory Dominance in Audiovisual Integration … 125
Here, avˆ ( )T i is the estimated time of occurrence of the
(temporally discrepant) audiovisual target stimulus for a given participant at auditory noise level i. v,iw and
a,iw are the corresponding visual and auditory weights for that noise level. v̂T and a,
ˆiT are the unimodal
estimates, respectively. The assumptions to be made are that the unimodal estimates are unbiased, statisti-cally independent, and perturbed by Gaussian noise. Moreover, by using this equation, flat priors are as-sumed, meaning that there is no prior expectation to perceive the stimuli at a specific point in time.
The unimodal estimates are weighted by the inverse of the perceptual uncertainty of each modality, and normalized to sum to one,
2v
v,
2 2v a,
1
1 1i
i
wσ
σ σ
=+
(2)
and 2a,
a,
2 2v a,
1
1 1i
i
i
wσ
σ σ
=+
(3)
In this way, the more precise modality for a given task (here: temporal discrimination) has a higher influ-ence on the bimodally perceived stimulus feature. The
perceptual uncertainties 2vσ and 2
a,iσ can be estimated as the variance of the Gaussians underlying the psy-chometric functions from the unimodal experiments,
2 1 1 2v v v( (0.84) (0.5))σ Ψ Ψ− −= − (4)
and 2 1 1 2a, a, a,( (0.84) (0.5))i i iσ Ψ Ψ− −= − (5)
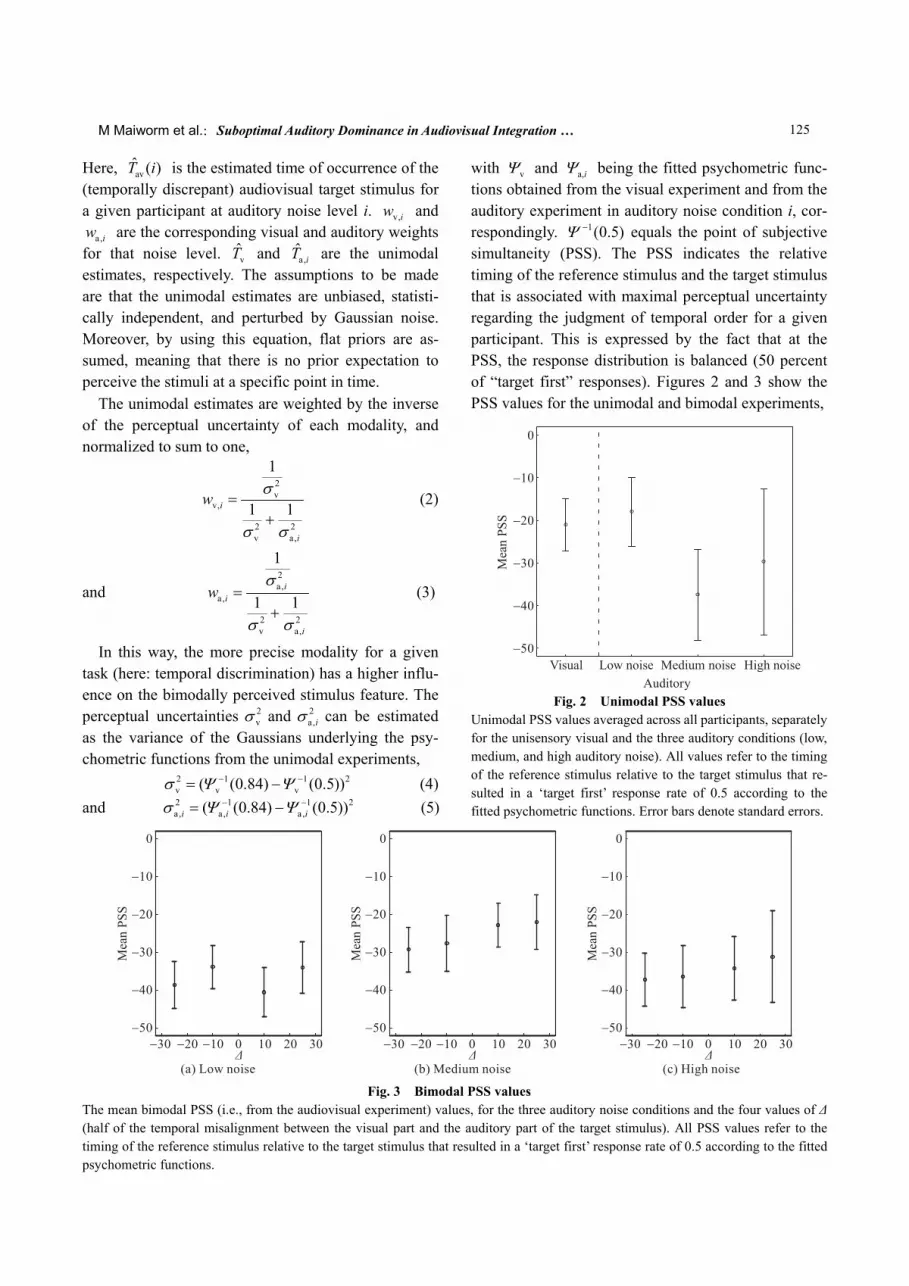
with vΨ and a,iΨ being the fitted psychometric func-tions obtained from the visual experiment and from the auditory experiment in auditory noise condition i, cor-respondingly. 1(0.5)Ψ − equals the point of subjective simultaneity (PSS). The PSS indicates the relative timing of the reference stimulus and the target stimulus that is associated with maximal perceptual uncertainty regarding the judgment of temporal order for a given participant. This is expressed by the fact that at the PSS, the response distribution is balanced (50 percent of “target first” responses). Figures 2 and 3 show the PSS values for the unimodal and bimodal experiments,
Fig. 2 Unimodal PSS values
Unimodal PSS values averaged across all participants, separately for the unisensory visual and the three auditory conditions (low, medium, and high auditory noise). All values refer to the timing of the reference stimulus relative to the target stimulus that re-sulted in a ‘target first’ response rate of 0.5 according to the fitted psychometric functions. Error bars denote standard errors.
Fig. 3 Bimodal PSS values
The mean bimodal PSS (i.e., from the audiovisual experiment) values, for the three auditory noise conditions and the four values of Δ (half of the temporal misalignment between the visual part and the auditory part of the target stimulus). All PSS values refer to the timing of the reference stimulus relative to the target stimulus that resulted in a ‘target first’ response rate of 0.5 according to the fitted psychometric functions.
Tsinghua Science and Technology, April 2011, 16(2): 121-132 126
respectively. The weights from Eqs. (2) and (3) can be called predicted weights because they are based on the MLE model assumptions and the unimodal data, and predict the weights for audiovisual integration.
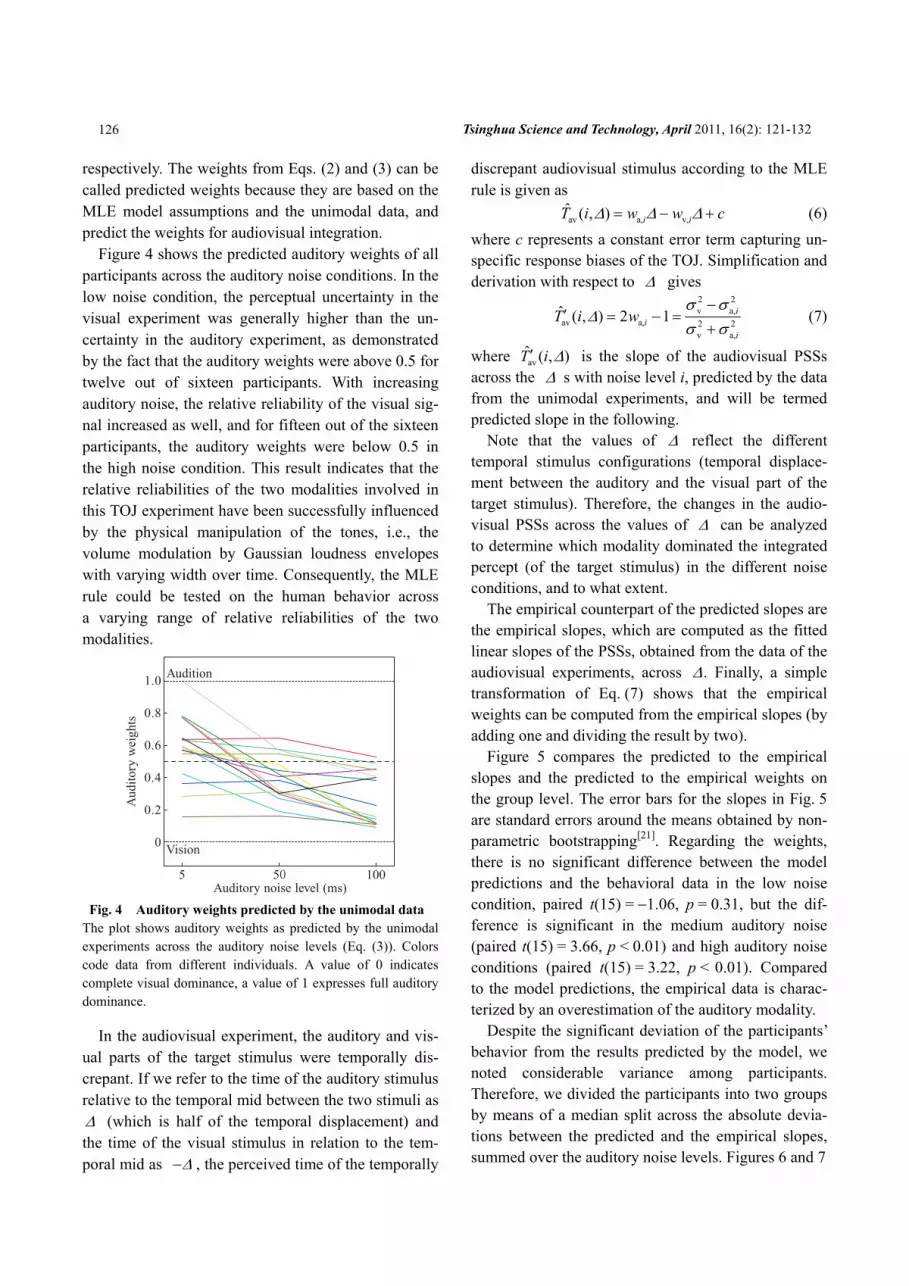
Figure 4 shows the predicted auditory weights of all participants across the auditory noise conditions. In the low noise condition, the perceptual uncertainty in the visual experiment was generally higher than the un-certainty in the auditory experiment, as demonstrated by the fact that the auditory weights were above 0.5 for twelve out of sixteen participants. With increasing auditory noise, the relative reliability of the visual sig-nal increased as well, and for fifteen out of the sixteen participants, the auditory weights were below 0.5 in the high noise condition. This result indicates that the relative reliabilities of the two modalities involved in this TOJ experiment have been successfully influenced by the physical manipulation of the tones, i.e., the volume modulation by Gaussian loudness envelopes with varying width over time. Consequently, the MLE rule could be tested on the human behavior across a varying range of relative reliabilities of the two modalities.
Fig. 4 Auditory weights predicted by the unimodal data
The plot shows auditory weights as predicted by the unimodal experiments across the auditory noise levels (Eq. (3)). Colors code data from different individuals. A value of 0 indicates complete visual dominance, a value of 1 expresses full auditory dominance.
In the audiovisual experiment, the auditory and vis-ual parts of the target stimulus were temporally dis-crepant. If we refer to the time of the auditory stimulus relative to the temporal mid between the two stimuli as Δ (which is half of the temporal displacement) and the time of the visual stimulus in relation to the tem-poral mid as Δ− , the perceived time of the temporally
discrepant audiovisual stimulus according to the MLE rule is given as
av a, v,ˆ ( , ) i iT i w w cΔ Δ Δ= − + (6)
where c represents a constant error term capturing un-specific response biases of the TOJ. Simplification and derivation with respect to Δ gives
2 2v a,
a, 2 2v a,
av ( , ) 2 1ˆ ii
i
T i wσ σ
Δσ σ
−= − =
+′ (7)
where av ( , )T̂ i Δ′ is the slope of the audiovisual PSSs across the Δ s with noise level i, predicted by the data from the unimodal experiments, and will be termed predicted slope in the following.
Note that the values of Δ reflect the different temporal stimulus configurations (temporal displace-ment between the auditory and the visual part of the target stimulus). Therefore, the changes in the audio-visual PSSs across the values of Δ can be analyzed to determine which modality dominated the integrated percept (of the target stimulus) in the different noise conditions, and to what extent.
The empirical counterpart of the predicted slopes are the empirical slopes, which are computed as the fitted linear slopes of the PSSs, obtained from the data of the audiovisual experiments, across Δ. Finally, a simple transformation of Eq. (7) shows that the empirical weights can be computed from the empirical slopes (by adding one and dividing the result by two).
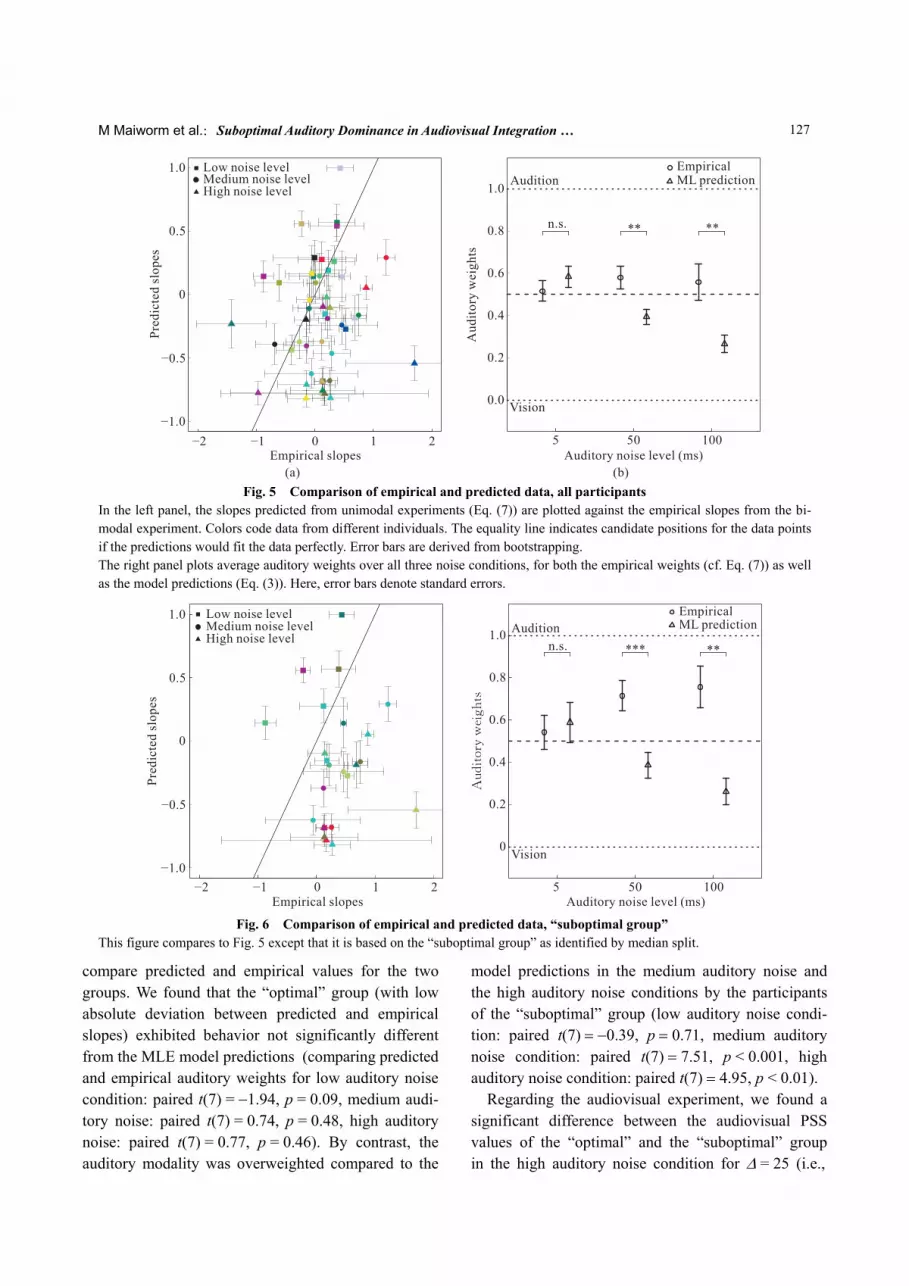
Figure 5 compares the predicted to the empirical slopes and the predicted to the empirical weights on the group level. The error bars for the slopes in Fig. 5 are standard errors around the means obtained by non- parametric bootstrapping[21]. Regarding the weights, there is no significant difference between the model predictions and the behavioral data in the low noise condition, paired t(15) = −1.06, p = 0.31, but the dif-ference is significant in the medium auditory noise (paired t(15) = 3.66, p < 0.01) and high auditory noise conditions (paired t(15) = 3.22, p < 0.01). Compared to the model predictions, the empirical data is charac-terized by an overestimation of the auditory modality.
Despite the significant deviation of the participants’ behavior from the results predicted by the model, we noted considerable variance among participants. Therefore, we divided the participants into two groups by means of a median split across the absolute devia-tions between the predicted and the empirical slopes, summed over the auditory noise levels. Figures 6 and 7
M Maiworm et al.:Suboptimal Auditory Dominance in Audiovisual Integration … 127
Fig. 5 Comparison of empirical and predicted data, all participants
In the left panel, the slopes predicted from unimodal experiments (Eq. (7)) are plotted against the empirical slopes from the bi-modal experiment. Colors code data from different individuals. The equality line indicates candidate positions for the data points if the predictions would fit the data perfectly. Error bars are derived from bootstrapping. The right panel plots average auditory weights over all three noise conditions, for both the empirical weights (cf. Eq. (7)) as well as the model predictions (Eq. (3)). Here, error bars denote standard errors.
Fig. 6 Comparison of empirical and predicted data, “suboptimal group”
This figure compares to Fig. 5 except that it is based on the “suboptimal group” as identified by median split.
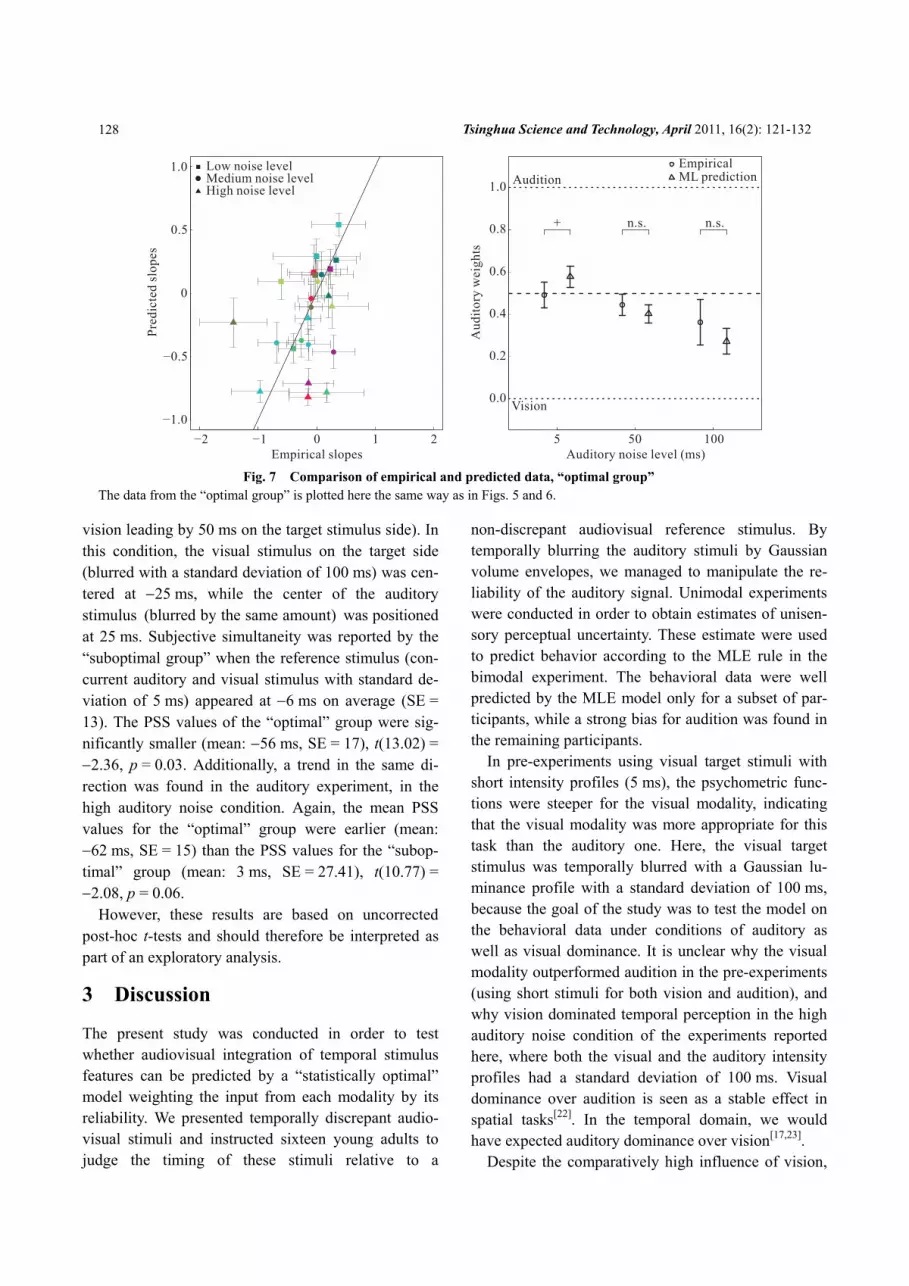
compare predicted and empirical values for the two groups. We found that the “optimal” group (with low absolute deviation between predicted and empirical slopes) exhibited behavior not significantly different from the MLE model predictions (comparing predicted and empirical auditory weights for low auditory noise condition: paired t(7) = −1.94, p = 0.09, medium audi-tory noise: paired t(7) = 0.74, p = 0.48, high auditory noise: paired t(7) = 0.77, p = 0.46). By contrast, the auditory modality was overweighted compared to the
model predictions in the medium auditory noise and the high auditory noise conditions by the participants of the “suboptimal” group (low auditory noise condi-tion: paired t(7) = −0.39, p = 0.71, medium auditory noise condition: paired t(7) = 7.51, p < 0.001, high auditory noise condition: paired t(7) = 4.95, p < 0.01).
Regarding the audiovisual experiment, we found a significant difference between the audiovisual PSS values of the “optimal” and the “suboptimal” group in the high auditory noise condition for Δ = 25 (i.e.,
Tsinghua Science and Technology, April 2011, 16(2): 121-132 128
Fig. 7 Comparison of empirical and predicted data, “optimal group”
The data from the “optimal group” is plotted here the same way as in Figs. 5 and 6.
vision leading by 50 ms on the target stimulus side). In this condition, the visual stimulus on the target side (blurred with a standard deviation of 100 ms) was cen-tered at −25 ms, while the center of the auditory stimulus (blurred by the same amount) was positioned at 25 ms. Subjective simultaneity was reported by the “suboptimal group” when the reference stimulus (con-current auditory and visual stimulus with standard de-viation of 5 ms) appeared at −6 ms on average (SE = 13). The PSS values of the “optimal” group were sig-nificantly smaller (mean: −56 ms, SE = 17), t(13.02) = −2.36, p = 0.03. Additionally, a trend in the same di-rection was found in the auditory experiment, in the high auditory noise condition. Again, the mean PSS values for the “optimal” group were earlier (mean: −62 ms, SE = 15) than the PSS values for the “subop-timal” group (mean: 3 ms, SE = 27.41), t(10.77) = −2.08, p = 0.06.
However, these results are based on uncorrected post-hoc t-tests and should therefore be interpreted as part of an exploratory analysis.
3 Discussion
The present study was conducted in order to test whether audiovisual integration of temporal stimulus features can be predicted by a “statistically optimal” model weighting the input from each modality by its reliability. We presented temporally discrepant audio-visual stimuli and instructed sixteen young adults to judge the timing of these stimuli relative to a
non-discrepant audiovisual reference stimulus. By temporally blurring the auditory stimuli by Gaussian volume envelopes, we managed to manipulate the re-liability of the auditory signal. Unimodal experiments were conducted in order to obtain estimates of unisen-sory perceptual uncertainty. These estimate were used to predict behavior according to the MLE rule in the bimodal experiment. The behavioral data were well predicted by the MLE model only for a subset of par-ticipants, while a strong bias for audition was found in the remaining participants.
In pre-experiments using visual target stimuli with short intensity profiles (5 ms), the psychometric func-tions were steeper for the visual modality, indicating that the visual modality was more appropriate for this task than the auditory one. Here, the visual target stimulus was temporally blurred with a Gaussian lu-minance profile with a standard deviation of 100 ms, because the goal of the study was to test the model on the behavioral data under conditions of auditory as well as visual dominance. It is unclear why the visual modality outperformed audition in the pre-experiments (using short stimuli for both vision and audition), and why vision dominated temporal perception in the high auditory noise condition of the experiments reported here, where both the visual and the auditory intensity profiles had a standard deviation of 100 ms. Visual dominance over audition is seen as a stable effect in spatial tasks[22]. In the temporal domain, we would have expected auditory dominance over vision[17,23].
Despite the comparatively high influence of vision,
M Maiworm et al.:Suboptimal Auditory Dominance in Audiovisual Integration … 129
we successfully managed to manipulate the relative perceptual uncertainties associated with the two mo-dalities involved so that audition dominated in the low auditory noise condition and vision dominated in the high auditory noise condition, as indicated by the pre-dicted auditory weights which decreased from above 0.5 to below 0.5 with increasing auditory noise level for most participants (Fig. 4).
The mean PSS values were negative across all mo-dalities and conditions (Figs. 2 and 3). It is a common result that for temporal comparison of auditory and visual stimuli, the auditory stimulus has to be delayed to be perceived as occurring at the same time, a phe-nomenon that has been attributed to differences in transduction and/ or neural processing time for the two modalities[24-26]. After all, these typical findings cannot directly be applied to our data, because our comparison stimulus was bimodal across all experiments. Never-theless, if visual stimuli need more time to be proc-essed than auditory ones, we would expect negative PSS values at least for the auditory experiment, since an audiovisual cue (the reference stimulus) should still be perceived later than a purely auditory stimulus (tar-get stimulus). Following this line of reasoning, we would expect positive PSS values in the visual ex-periment. However, we observed a negative average PSS value in the visual experiment as well. This result might be explained by the fact that the visual target stimulus had a broad Gaussian intensity envelope (100 ms standard deviation), while the reference stimulus was short (5 ms standard deviation). Although the par-ticipants had been carefully instructed to base their temporal judgments on the time when the stimulus in-tensity peaked, they might have tended to refer to the stimulus onset instead. This explanation would account for the negative visual PSS values found in our par-ticipants, and predict negative auditory PSS values as well, which indeed were found. However, the auditory PSS values did not decrease (i.e., become more nega-tive) with increasing auditory noise level, which would have been expected if the participants would have re-ferred to the stimulus onset instead of the peak.
Before we address the comparison of the MLE model predictions and the empirical data, it should be pointed out that in order to compute the predicted per-ceptual weights, we used the variances of the fitted psychometric functions gathered in the unimodal
experiments. Hence, these estimates represent the per-ceptual uncertainty associated with determining the time of the target stimulus and the perceptual uncer-tainty associated with the reference stimulus. In this regard, the results presented here could be criticized in a similar manner than the ones of Burr et al.[19], namely that the predicted weights are poor estimates for the empirical weights because they include additional noise. However, we believe that this problem is less severe in our study – and actually negligible – for three reasons. In comparison to the experiment of Burr et al.[19], there was no additional processing stage (like estimating the temporal midpoint between two stimuli) involved in our TOJ paradigm that could add further noise to the variances of the psychometric functions. Secondly, the reference stimulus used in our paradigm was precisely positioned in time (5 ms standard devia-tion) and it was a bimodal stimulus. This should result in a relatively low level of additional perceptual un-certainty introduced by the reference stimulus, as compared to the degree of perceptual uncertainty asso-ciated with the timing of the target stimulus. Finally, these physical properties of the reference stimulus re-mained constant across all three experiments and all conditions, and the perceptual noise associated with this stimulus was included in the estimates of the em-pirical weights as well.
Regarding the main research question addressed by this study, the MLE predictions for the perceptual weights did not match the empirical weights for the group of sixteen participants. After splitting the group of participants into two subgroups according to the difference between the model predictions and the be-havioral data, the MLE model predicted the behavior well across all auditory noise conditions in one group, while a general bias towards audition was observed in the other group. Of course, it is a rather tautological finding that a median split according to statistical op-timality results in two groups with different degrees of statistical optimality. However, our data suggest that a remarkable degree of interindividual variability with regard to statistical optimality exists among human observers.
The fact that a pronounced auditory bias was found in half of the participants, resulting in a mean auditory bias in the whole group, fits well the data of Burr et al.[19], who found an auditory overweighting in their
Tsinghua Science and Technology, April 2011, 16(2): 121-132 130
audiovisual temporal bisection task as well. Neverthe-less, Burr et al.[19] were able to predict the bimodal improvement of the discrimination thresholds (over the unimodal thresholds) by means of the MLE model. The present study was not designed to measure the empirical audiovisual discrimination thresholds in a non-discrepant stimulus setting, therefore it could not be tested whether the bimodal improvement of the dis-crimination thresholds would be in accordance with the MLE predictions in our TOJ paradigm.
In a sensorimotor synchronization task (tapping in time with a bimodal metronome), Elliott et al.[27] found auditory over-dominance compared to MLE predic-tions for audiotactile synchronization and suboptimal integration for the audiovisual condition (that was ei-ther due to visual or auditory over-dominance).
In line with the findings of Burr et al.[19] and Elliott et al.[27], our data suggest a general effect of subopti-mal auditory bias for multisensory integration in the time domain, at least for some participants and/ or un-der certain conditions. Given the literature on statisti-cally optimal audiovisual integration in the spatial domain, it is unclear why the MLE model fails to pre-dict behavioral data consistently across the majority of participants in the temporal domain in several studies.
The conceptual idea behind maximum likelihood integration of perceptual input is that the contributions of the different senses are flexibly weighted according to their effectiveness for the task at hand. However, there might be a “hard-coded” preference for certain modalities under particular circumstances, driven by ecological validity rather than statistical optimality. In particular, there might be several reasons why a hard-coded auditory dominance could be more suitable than an elaborate weighting scheme for evaluating temporal cues. First of all, the factors influencing the temporal accuracy of the sensory input from different modalities might be less volatile as compared to the spatial domain. While the superiority of vision over audition in spatial tasks can be affected by lighting conditions or simply the fact that the stimulus gets out of sight, the predominance of audition for temporal perception might be more stable across environmental conditions, i.e., even under conditions of auditory noise or multiple auditory input. Secondly, the differ-ence in perceptual uncertainty between audition and vision might be too small to justify an internal
weighting scheme that keeps track of the reliabilities of the two senses. Finally, little is known about possible neural implementations of the MLE rule, as well as resources needed for the computations. If the process of statistically optimal binding would take too much time itself, it would not be suited for accurate temporal perception.
We found a considerable amount of interindividual variability with regard to statistically optimal temporal integration. This is indicated by the different patterns of result for the two subgroups resulting from the me-dian split. We were unable to relate those differences to the age or sex of our participants.
Especially given these interindividual differences, there might be another explanation to account for the pattern of results we observed. The study of interindi-vidual differences with regard to the way humans inte-grate auditory and visual temporal cues can be traced back over 200 years to astronomers who used the eye-and-ear method to examine stellar transits. This method included counting the number of metronome clicks (one per second) while the stellar object crossed the meridian wire of the telescope. The finding that these audiovisual observations were confounded with constant interpersonal differences gave rise to the con-cept of the “personal equation”, the observer-specific time needed for the perceptual and cognitive process-ing of object features[28,29].
In a more recent experiment, Stone et al.[26] found that the PSS for audiovisual stimuli – as measured in a simultaneity judgment paradigm – varied from −21 ms (sound first) to 150 ms across participants. This distri-bution of multisensory PSS values was broad and uni-form, the values of single observers were significantly different from the estimated population mean. Notably, the PSS values were stable over time for each observer. These findings demonstrate that there are pronounced observer-specific differences in the way auditory and visual stimuli are combined in time, and that these dif-ferences are reliable, i.e., stable over time. This may help to explain the interindividual differences with regard to statistical optimality, because the empirical weights and slopes reported here are based on the mul-tisensory PSS values (and their dependence on Δ). In-deed, our post-hoc exploratory analysis revealed that there are differences in PSS values between the “opti-mal” and the “suboptimal” group not only in the
M Maiworm et al.:Suboptimal Auditory Dominance in Audiovisual Integration …
131
audiovisual experiment, but (as a trend) in the auditory experiment as well.
The idea of the “personal equation” is often ex-plained by means of prior entry, a term describing the fact that stimuli which are selectively attended become conscious earlier in time and/or are processed faster when compared to unattended stimuli[30]. Consequently, consistent inter-observer differences in PSS values could be explained by personal predispositions to at-tend either more to vision or to audition. This form of individual predisposition might interact with stimulus uncertainty, even in a manner opposed to the MLE predictions. Only for a subgroup of our participants, the “suboptimal” group, increasing the auditory noise level might have lead to an increased level of attention directed towards the auditory modality, which finally resulted in a shift of the PSS values due to a prior entry effect. This would explain that the shift of PSS values towards the auditory cue compared to the “optimal” group (found in the exploratory analysis in the auditory and audiovisual experiments) was only observed in the high noise conditions. More importantly, this explana-tion would account for the discrepancy between em-pirical and predicted weights/slopes for the “subopti-mal” group in the medium and high noise condition.
During the last decade, many studies have success-fully demonstrated statistically optimal multisensory integration[1-3,31]. Many of those studies were run with only few participants, and designed to examine whether multisensory integration in humans can be optimal. It is still widely unknown whether and how humans differ in their ability or disposition to opti-mally integrate multisensory cues. Given our findings, the degree of statistical optimality might be distributed across individuals, exhibiting the same amount of variability as other biological variables. There remains a need for future studies to address interindividual dif-ferences in statistical optimality and the conditions under which humans integrate optimally.
References
[1] Knill D C, Pouget A. The bayesian brain: The role of un-certainty in neural coding and computation. Trends Neuro-sci., 2004, 27(12): 712-719.
[2] Körding K. Decision theory: What “should” the nervous system do? Science, 2007, 318(5850): 606-610.
[3] Kersten D, Mamassian P, Yuille A. Object perception as
bayesian inference. Annu. Rev. Psychol., 2004, 55: 271-304.
[4] Kersten D, Yuille A. Bayesian models of object perception. Curr. Opin. Neurobiol., 2003, 13(2): 150-158.
[5] Weiss Y, Simoncelli E P, Adelson E H. Motion illusions as optimal percepts. Nat. Neurosci., 2002, 5(6): 598-604.
[6] Körding K P, Wolpert D M. Bayesian decision theory in sensorimotor control. Trends Cogn. Sci., 2006, 10(7): 319-326.
[7] Sato Y, Toyoizumi T, Aihara K. Bayesian inference ex-plains perception of unity and ventriloquism aftereffect: Identification of common sources of audiovisual stimuli. Neural Comput., 2007, 19(12): 3335-3355.
[8] Ernst M O, Banks M S. Humans integrate visual and haptic information in a statistically optimal fashion. Nature, 2002, 415(6870): 429-433.
[9] Witten I B, Knudsen E I. Why seeing is believing: Merging auditory and visual worlds. Neuron, 2005, 48(3): 489-496.
[10] Ma W J, Beck J M, Latham P E, et al. Bayesian inference with probabilistic population codes. Nat. Neurosci., 2006, 9(11): 1432-1438.
[11] Barber M J, Clark J W, Anderson C H. Neural representa-tion of probabilistic information. Neural Comput., 2003, 15(8): 1843-1864.
[12] Alais D, Burr D. The ventriloquist effect results from near-optimal bimodal integration. Curr. Biol., 2004, 14(3): 257-262.
[13] Battaglia P W, Jacobs R A, Aslin R N. Bayesian integration of visual and auditory signals for spatial localization. J. Opt. Soc. Am. A. Opt. Image Sci. Vis., 2003, 20(7): 1391-1397.
[14] Körding K P, Beierholm U, Ma W J, et al. Causal inference in multisensory perception. PLoS One, 2007, 2(9): e943.
[15] Ley I, Haggard P, Yarrow K. Optimal integration of audi-tory and vibrotactile information for judgments of temporal order. J. Exp. Psychol. Hum. Percept Perform, 2009, 35(4): 1005-1019.
[16] Shams L, Ma W J, Beierholm U. Sound-induced flash illu-sion as an optimal percept. Neuroreport, 2005, 16(17): 1923-1927.
[17] Shams L, Kamitani Y, Shimojo S. Illusions: What you see is what you hear. Nature, 2000, 408(6814): 788.
[18] Bentvelzen A, Leung J, Alais D. Discriminating audiovis-ual speed: Optimal integration of speed defaults to prob-ability summation when component reliabilities diverge. Perception, 2009, 38(7): 966-987.
[19] Burr D, Banks M S, Morrone M C. Auditory dominance
Tsinghua Science and Technology, April 2011, 16(2): 121-132 132
over vision in the perception of interval duration. Exp. Brain Res., 2009, 198(1): 49-57.
[20] Wichmann F A, Hill N J. The psychometric function: I. Fitting, sampling, and goodness of fit. Percept Psychophys, 2001, 63(8): 1293-313.
[21] Efron B, Tibshirani R J. An Introduction to the Bootstrap. Boca Raton: Chapman & Hall, 1998.
[22] Bertelson P, Radeau M. Cross-modal bias and perceptual fusion with auditory-visual spatial discordance. Percept Psychophys, 1981, 29(6): 578-584.
[23] Glenberg A M, Jona M. Temporal coding in rhythm tasks revealed by modality effects. Mem. Cognit., 1991, 19(5): 514-522.
[24] Arrighi R, Alais D, Burr D. Perceptual synchrony of audiovisual streams for natural and artificial motion se-quences. J. Vis., 2006, 6(3): 260-268.
[25] van Eijk R L J, Kohlrausch A, Juola J F, et al. Temporal interval discrimination thresholds depend on perceived
synchrony for audio-visual stimulus pairs. J. Exp. Psychol. Hum. Percept Perform, 2009, 35(4): 1254-1263.
[26] Stone J V, Hunkin N M, Porrill J, et al. When is now? Per-ception of simultaneity. Proc. R. Soc. Lond. B, 2001, 268: 31-38.
[27] Elliott M T, Wing A M, Welchman A E. Multisensory cues improve sensorimotor synchronisation. Eur. J. Neurosci., 2010, 31(10): 1828-1835.
[28] Mollon J D, Perkins A J. Errors of judgement at Greenwich in 1796. Nature, 1996, 380: 101-102.
[29] Spence C, Squire S. Multisensory Integration: Maintaining the perception of synchrony. Curr. Biol., 2003, 13: R519-R521.
[30] Spence C, Shore D I, Klein R M. Multisensory prior entry. J. Exp. Psychol. Gen., 2001, 130(4): 799-832.
[31] Ernst M O, Bülthoff H H. Merging the senses into a robust percept. Trends Cogn. Sci., 2004, 8(4): 162-169.


