Embed Size (px)
Citation preview
1
Study report on mercury from non-ferrous metals mining and smelting
First draft – 22 April 2021
Note by the Secretariat
1. Initiated in 2005, the UNEP Global Mercury Partnership aims to protect human health
and the environment from the releases of mercury and its compounds to air, water and land.
With over 200 partners to date from Governments, intergovernmental and non-governmental
organizations, industry and academia, the Partnership focuses on supporting timely and effective
implementation of the Minamata Convention on Mercury, providing state of the art knowledge
and science and raising awareness towards global action on mercury1.
2. Recognizing the sector was estimated to be a major source of mercury emissions and
releases, the Partnership Advisory Group (PAG) decided at its tenth meeting (Geneva, 23
November 2019) to initiate work on mercury from non-ferrous metals mining and smelting,
which it had identified as a cross-cutting topic amongst different Partnership areas. The PAG
hence requested the Secretariat of the Partnership to convene targeted discussions with interested
Partnership area leads, partners as well as other relevant stakeholders2. Expert consultations
were launched on 29 April 2020, with the overall objective to identify potential useful
contributions from the Partnership, within the context of its mission and its existing areas of
work3. Participants were invited to attend in their expert capacity, to share views and ideas, and
any useful background information.
3. Interested Partnership area leads subsequently agreed to guide a process for developing a
study report on the topic. As per their guidance, the report should be concise, benefit from global
experience, and aim to better understand the mercury mass balance globally between supply,
storage, and waste treatment related to non-ferrous metals mining and smelting operations. The
guidance further indicated that the report could include: a review of existing knowledge and
information gaps concerning mercury volumes from different stages of the processes; a
showcase of the different methods currently in use for reducing mercury releases and disposing
mercury at different key stages of the processes, highlighting best practices (including methods
of detection and monitoring of mercury releases along the processes); and potential ideas for
further research and cooperation, including opportunities for capacity development.
4. A draft annotated outline of the study report on mercury from non-ferrous metals mining
and smelting was developed and presented for consideration and further discussion by the PAG
at its eleventh meeting (document UNEP/Hg/PAG.11/5)4.. Together with the information
collected, the finalized annotated outline was used as a basis to develop the present study report.
5. In reviewing the present draft report, reviewers are encouraged to provide general input
as well as additional sources of information, data and best practice, and considerations for the
conclusions and suggestions for future work.
1 For more information, please visit: web.unep.org/globalmercurypartnership 2 The report of the tenth meeting of the Partnership Advisory Group (document UNEP/ Hg/PAG.10/5) is available at:
https://web.unep.org/globalmercurypartnership/partnership-advisory-group-meeting-10 3 Further information, including summary of main discussion points, may be found at:
https://web.unep.org/globalmercurypartnership/expert-consultations-“mercury-non-ferrous-metals-mining-and-smelting” 4 Meeting documents of the eleventh meeting of the Partnership Advisory Group are available at:
https://web.unep.org/globalmercurypartnership/partnership-advisory-group-meeting-11
2
Acknowledgements
The United Nations Environment Programme wishes to thank all individuals and organizations that have
generously contributed their expertise, time, and energy. Macquarie University was commissioned to draft the
report, under the overall coordination of Peter Nelson, Professor Emeritus of Environmental Studies, Department
of Earth and Environmental Sciences, Macquarie University. (to be further completed)
Disclaimer
The designations employed and the presentation of the material in this publication do not imply the expression
of any opinion whatsoever on the part of the United Nations Environment Programme concerning the legal
status of any country, territory, city or area or of its authorities, or concerning delimitation of its frontiers or
boundaries. Moreover, the views expressed do not necessarily represent the decision or the stated policy of the
United Nations Environment Programme, nor does citing of trade names or commercial processes constitute
endorsement.
3
Study report on mercury from non-ferrous metals mining and smelting 1
First draft – 22 April 2021 2
TABLE OF CONTENTS 3
1. EXECUTIVE SUMMARY ......................................................................................................................................... 5 4
2. INTRODUCTION ...................................................................................................................................................... 5 5
2.1. MERCURY IN THE ENVIRONMENT – THE NEED FOR ACTION ............................................................................................ 5 6 2.2. METHODOLOGY AND OBJECTIVE OF THE REPORT .............................................................................................................. 5 7 2.3. MERCURY EMISSIONS AND RELEASES FROM THE NON-FERROUS SECTOR ...................................................................... 6 8
2.3.1. Emissions of mercury to the atmosphere from the non-ferrous sector .............................................. 7 9 2.3.2. Releases of mercury to land and water from non-ferrous mineral processing and mercury-10 containing by-products and waste ......................................................................................................................................... 8 11
2.4. CONTRIBUTIONS OF THE NON-FERROUS SECTOR TO GLOBAL MERCURY SUPPLY .......................................................... 9 12 2.5. FUTURE GROWTH IN THE NON-FERROUS SECTOR ........................................................................................................... 10 13
3. EXISTING ACTIVITIES RELATED TO MERCURY IN THE NON-FERROUS SECTOR .......................... 12 14
3.1. NATIONAL AND REGIONAL REGULATIONS AND GUIDELINES ......................................................................................... 12 15 3.2. INTERNATIONAL AGREEMENTS, PARTNERSHIPS AND GUIDANCE................................................................................ 13 16
3.2.1. UNEP Global Mercury Partnership ................................................................................................................ 13 17 3.2.2. Minamata Convention on Mercury ................................................................................................................ 14 18
3.3. INDUSTRY SECTOR ACTIVITIES ........................................................................................................................................... 15 19 3.3.1. The International Council on Mining & Metals (ICMM) ........................................................................ 16 20 3.3.2. The International Study Groups ...................................................................................................................... 16 21
3.4. NON-GOVERNMANTAL ORGANISATIONS (NGOS) .......................................................................................................... 17 22
4. LIFE CYCLE OF MERCURY IN NON-FERROUS METALS MINING AND SMELTING ............................ 18 23
4.1. INDICATIVE PROCESSES ....................................................................................................................................................... 18 24 4.1.1. Gold processing ...................................................................................................................................................... 18 25 4.1.2. Zinc extraction and processing ........................................................................................................................ 19 26
4.2. QUANTITATIVE STUDIES AND DATA .................................................................................................................................. 20 27
5. MERCURY EMISSIONS AND RELEASES ESTIMATES FROM THE NON FERROUS SECTOR – 28 EXISTING KNOWLEDGE AND KNOWLEDGE GAPS .............................................................................................. 22 29
5.1. BACKGROUND ON PREVIOUS WORK ON ESTIMATION OF MERCURY EMISSIONS AND RELEASES AND MERCURY 30 RELEASE MECHANISMS AND SPECIATION .......................................................................................................................................... 22 31 5.2. METHODOLOGY FOR ESTIMATING EMISSIONS AND RELEASES FROM THE NON-FERROUS SECTOR – KEY INPUTS 32 AND KNOWLEDGE GAPS ....................................................................................................................................................................... 26 33 5.3. THE IMPACT OF GLOBAL TRADE IN CONCENTRATES ON THE LOCATION OF MERCURY EMISSIONS AND RELEASES 30 34
6. CONTROL OF MERCURY EMISSIONS AND RELEASES ............................................................................... 30 35
6.1. PROCESS DESCRIPTIONS ..................................................................................................................................................... 31 36 6.2. EMISSION CONTROL TECHNIQUES..................................................................................................................................... 31 37
6.2.1. Boliden Norzink Process ..................................................................................................................................... 32 38 6.2.2. Selenium Filter ....................................................................................................................................................... 32 39 6.2.3. Activated Carbon................................................................................................................................................... 32 40 6.2.4. DOWA filter process ............................................................................................................................................. 33 41 6.2.5. Co-benefits of air pollution abatement technologies .............................................................................. 33 42 6.2.6. Acid plants in mercury control ........................................................................................................................ 33 43
4
6.2.7. Sulfuric acid ............................................................................................................................................................ 34 44 6.2.8. Process changes to eliminate smelting and emissions from that source ........................................ 34 45
6.3. SMELTER/ ROASTING WASTE AND BY-PRODUCT MANAGEMENT AND RELEASES TO LAND AND WATER................ 35 46 6.4. CASE STUDIES PREPARED FOR BAT/BEP GUIDANCE .................................................................................................... 36 47
7. MAJOR CONCLUSIONS AND IDENTIFIED NEEDS FOR FURTHER INVESTIGATION, RESEARCH 48 AND COOPERATION ...................................................................................................................................................... 37 49
8. GUIDANCE ON BEST PRACTICES ..................................................................................................................... 40 50
8.1. AVAILABLE GUIDANCE, TOOLS AND RESOURCES: .......................................................................................................... 40 51
9. REFERENCES AND BIBLIOGRAPHY ................................................................................................................ 41 52
10. ATTACHMENT: CASE STUDIES......................................................................................................................... 46 53
1. CASE STUDY – ZINC/LEAD SMELTER AND REFINERY......................................................................................... 46 54
2. CASE STUDY ON MERCURY CONTROLS FOR A GOLD ORE ROASTING FACILITY .......................................... 48 55
3. CASE STUDY: MERCURY SCRUBBING DURING ZINC SMELTING IN ISF FURNACE ........................................ 52 56
4. CASE STUDY ZINC/LEAD/COPPER PRODUCTION AT BOLIDEN RÖNNSKÄR (SWEDEN) .............................. 55 57
5. MERCURY AIR EMISSION SOURCES AND CONTROLS - PT. SMELTING - GRESIK SMELTER & REFINERY .. 60 58
59
5
1. EXECUTIVE SUMMARY 60
61
(To be developed on the basis of the revised draft report) 62
2. INTRODUCTION 63
2.1. Mercury in the Environment – the need for action 64
65
Mercury is a major global, regional and national challenge in terms of threats to human health 66
and the environment (Science for Environment Policy 2017). The benefits of reducing exposure 67
to mercury are large. A significant pathway for exposure is through the ingestion of seafood, and 68
as seafood provides 2.5 billion people with at least 20% of their animal protein this can have 69
major impacts on the global burden of disease. In small island states and coastal regions this 70
amount can increase to 50% (UNEP 2013b). A US study estimated cumulative lifetime benefits 71
from measures to be implemented through the Minamata Convention for individuals affected by 72
2050 at $339 billion (Giang and Selin 2016). 73
74
Mercury is an environmentally extremely harmful pollutant, due to its toxicity, long range 75
mobility, and persistence. Mercury can not only cause localized harm, to which children and 76
pregnant women are especially vulnerable, through air borne emissions or soil and water 77
contamination, but also travel long distances that can reach around the globe. 78
79
2.2. Methodology and objective of the report 80
81
As described in the note above Global Mercury Partnership (GMP) area leads agreed to guide a 82
process for developing a study report on mercury from non-ferrous metals mining and smelting. 83
As per their guidance, the report should: 84
• be concise, 85
• benefit from global experience, 86
• improve understanding of the mercury mass balance globally between supply, storage, 87
and waste treatment related to non-ferrous metals mining and smelting operations. 88
89
The report has been compiled from expert consultations, and open access sources of 90
information, including published reports and toolkits, websites and the peer reviewed scientific 91
research literature, and presents a critical review of existing knowledge and information gaps 92
concerning mercury from the non-ferrous sector; a showcase of the different methods currently 93
in use for reducing mercury emissions and releases and disposing of mercury from mining and 94
smelting at different key stages of the processes; and suggestions for further work including 95
capacity development. 96
97
Non-ferrous metals are all metals apart from iron. The emphasis on this report is on copper, 98
lead, zinc and large scale gold which all have significant emissions and releases of mercury and 99
are included in the Minamata Convention as a point source category of emissions (see Section 100
3.2.2). In addition the Global Mercury Assessment also includes estimates of emissions and 101
releases for aluminium, and the UNEP Mercury Toolkit enables estimates from extraction and 102
6
processing of additional non-ferrous metals such as nickel and others, so the report also 103
includes some consideration of these non-ferrous metals. 104
105
The report does not include consideration of the primary mining of mercury, or the use of 106
mercury in artisanal and small scale gold mining (ASGM) as these have been extensively 107
addressed in other global reports and toolkits (O’Neill and Telmer 2017; Intergovernmental 108
Forum on Mining Minerals Metals and Sustainable Development (IGF) 2018) 109
110
Secondary metals smelting is also not in scope as in this case negligible amounts of mercury 111
emissions are produced because these are, in fact, metal recycling processes that use scrap 112
metal and drosses as feed (UNEP 2019b). The only case where there may be small amounts of 113
mercury released is during the recycling of zinc batteries that contain trace amounts of the 114
element. The mercury content of batteries is also expected to decrease significantly in the 115
future. 116
117
This is supported by available data on mercury emissions from secondary smelters. For 118
example, the United States Environmental Protection Agency required testing for mercury 119
emissions from several secondary lead smelters in the United States in 2010 and established 120
that in about 70 per cent of cases, the emissions were below the detection limit (UNEP 2019b). 121
In some cases, secondary smelting of electronic material may produce significant mercury 122
emissions. In such cases, however, activated carbon is usually used to reduce emissions (UNEP 123
2019b). 124
125
These conclusions concerning secondary metals may need to be re-visited as the 126
amounts of metals recycled in this way increase and as these activities occur in more 127
locations. 128
129
2.3. Mercury emissions and releases from the non-ferrous sector 130
131
In spite of the significance of the non-ferrous sector as a source of mercury emissions and 132
releases (Kerfoot et al. 2004) it has received less attention, in the context of the Global Mercury 133
Partnership, than other major sources, and this report aims to identify existing information and 134
knowledge gaps. 135
136
Mercury exists as a trace element in many ore bodies of the non-ferrous metals and the mining 137 and mineral processing of these ores has the potential to mobilize mercury and emit it to the 138 atmosphere, or to release it to land and water. Waste rock and tailings that are created during 139
the mining may result in exposure of the mercury to oxygen and water which can result in 140 releases to water systems or in leaching processes which result in mercury release to soil. 141 These processes are addressed below in Section 2.3.2 on releases. Unlike ASGM, the mining 142
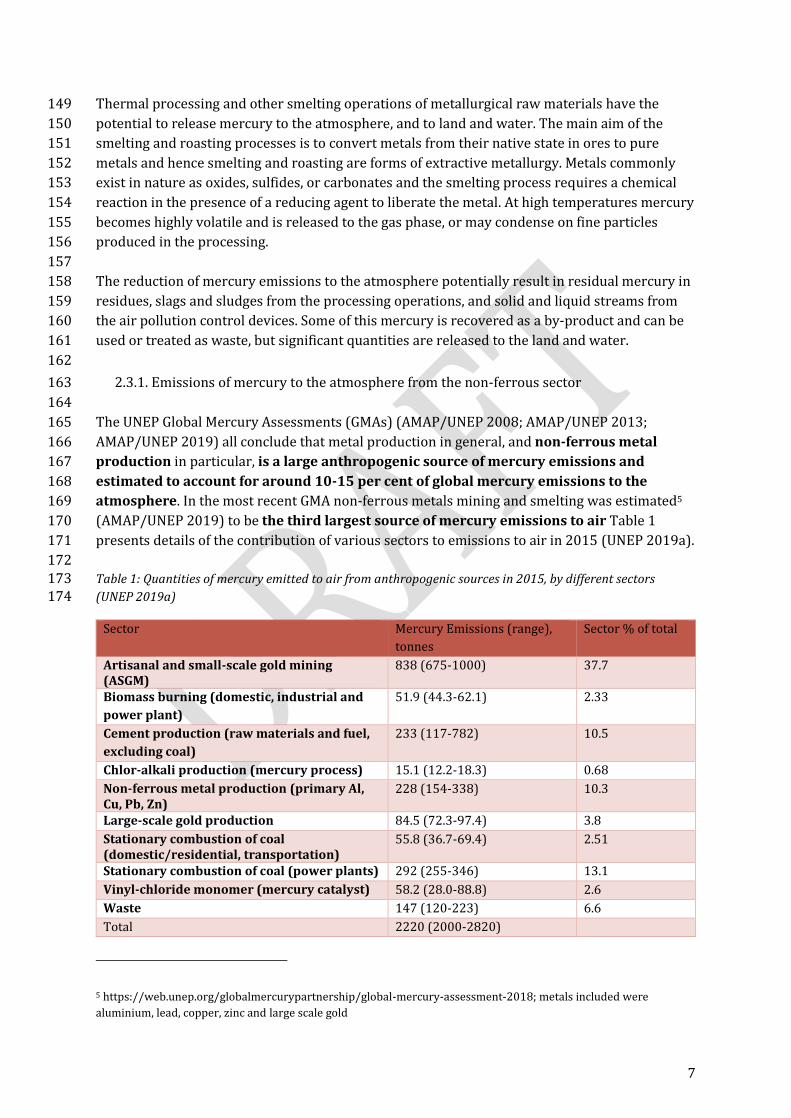
process is not considered to be a significant source of mercury emissions to the atmosphere 143 for industrial scale processing (UNEP 2019c). 144 145 Mercury may also be recovered during mineral processing as a by-product and then contribute 146
to mercury supply, trade and demand (see Section 2.4) . 147
148
7
Thermal processing and other smelting operations of metallurgical raw materials have the 149
potential to release mercury to the atmosphere, and to land and water. The main aim of the 150
smelting and roasting processes is to convert metals from their native state in ores to pure 151
metals and hence smelting and roasting are forms of extractive metallurgy. Metals commonly 152
exist in nature as oxides, sulfides, or carbonates and the smelting process requires a chemical 153
reaction in the presence of a reducing agent to liberate the metal. At high temperatures mercury 154
becomes highly volatile and is released to the gas phase, or may condense on fine particles 155
produced in the processing. 156
157
The reduction of mercury emissions to the atmosphere potentially result in residual mercury in 158
residues, slags and sludges from the processing operations, and solid and liquid streams from 159
the air pollution control devices. Some of this mercury is recovered as a by-product and can be 160
used or treated as waste, but significant quantities are released to the land and water. 161
162
2.3.1. Emissions of mercury to the atmosphere from the non-ferrous sector 163
164
The UNEP Global Mercury Assessments (GMAs) (AMAP/UNEP 2008; AMAP/UNEP 2013; 165
AMAP/UNEP 2019) all conclude that metal production in general, and non-ferrous metal 166
production in particular, is a large anthropogenic source of mercury emissions and 167
estimated to account for around 10-15 per cent of global mercury emissions to the 168
atmosphere. In the most recent GMA non-ferrous metals mining and smelting was estimated5 169
(AMAP/UNEP 2019) to be the third largest source of mercury emissions to air Table 1 170
presents details of the contribution of various sectors to emissions to air in 2015 (UNEP 2019a). 171
172 Table 1: Quantities of mercury emitted to air from anthropogenic sources in 2015, by different sectors 173 (UNEP 2019a) 174
Sector Mercury Emissions (range),
tonnes
Sector % of total
Artisanal and small-scale gold mining (ASGM)
838 (675-1000) 37.7
Biomass burning (domestic, industrial and
power plant)
51.9 (44.3-62.1) 2.33
Cement production (raw materials and fuel,
excluding coal)
233 (117-782)
10.5
Chlor-alkali production (mercury process) 15.1 (12.2-18.3) 0.68
Non-ferrous metal production (primary Al, Cu, Pb, Zn)
228 (154-338) 10.3
Large-scale gold production 84.5 (72.3-97.4) 3.8
Stationary combustion of coal (domestic/residential, transportation)
55.8 (36.7-69.4) 2.51
Stationary combustion of coal (power plants) 292 (255-346) 13.1
Vinyl-chloride monomer (mercury catalyst) 58.2 (28.0-88.8) 2.6
Waste 147 (120-223) 6.6
Total 2220 (2000-2820)
5 https://web.unep.org/globalmercurypartnership/global-mercury-assessment-2018; metals included were
aluminium, lead, copper, zinc and large scale gold
8
With respect to emissions, the GMA assessment (UNEP 2019a) estimated that 326 tonnes of 175
mercury originated in 2015 from the production of non-ferrous metals (aluminum, copper, large 176
scale gold, lead, and zinc), representing about 15% of total emissions. Zinc, large scale gold, 177
copper and lead dominated these estimates, of which they respectively accounted for 43%, 178
26% , 15% and 10%, followed by primary mercury and aluminum. Total mercury emissions 179
were estimated at 140 tonnes for zinc, 84.5 tonnes for large scale gold, 50 tonnes for copper and 180
30 tonnes for lead. 181
182
2.3.2. Releases of mercury to land and water from non-ferrous mineral processing and 183
mercury-containing by-products and waste 184
185
The GMA report also noted that with an estimated 240 tonnes per year, the sector was 186
responsible for roughly 40% of total releases to water, which makes it the largest source of 187
mercury releases to water after artisanal and small-scale gold mining. A quarter of these 188
releases was estimated to be from large-scale gold production. 189
190
In addition to direct releases to water, non-ferrous metals contribute large quantities to the 191
land, general waste products and storage of mercury (UNEP 2019a). The waste materials 192
include carbon contaminated with mercury, recovered elemental mercury and calomel 193
(mercurous chloride, Hg2Cl2). All of these indirect releases contribute to the complex processes 194
of the global mercury cycle. Zinc production is responsible (UNEP 2019a) for an estimated 4200 195
tonnes of mercury per year. Large-scale gold mining is estimated (UNEP 2019a) to put 2700 196
tonnes of mercury into soils each year, 45 times more than it releases directly to water. A rough 197
estimate of anthropogenic mercury input to soils is 7000-8000 tonnes and hence the non-198
ferrous sector is a major contributor (UNEP 2019a). All of this mercury becomes a potential 199
secondary source of emissions to the atmosphere and releases to water. A great deal remains 200
unknown (UNEP 2019a) about this pathway of mercury pollution, making it an important 201
subject for future study. 202
203
The GMA report (AMAP/UNEP 2019; UNEP 2019a) noted however that estimates from non-204
ferrous metals production had relatively large uncertainties, and that their secondary 205
production was not yet addressed as a separate activity (see comments in Section 2.2 above for 206
the probable scale of this secondary production). In addition, no quantitative data was available 207
for releases to land for non-ferrous metals other than aluminum, copper, lead, industrial gold, 208
mercury and zinc. 209
210
Identified as a source category in the UNEP Mercury Inventory Toolkit (UNEP 2017b; UNEP 211
2019b), countries with occurrence of non-ferrous metals mining and smelting production have 212
reported mercury releases from the sector in the inventory conducted as part of their Minamata 213
Initial Assessment. While information currently available does not allow for a global picture of 214
the mercury generated by the sector, the 2019 Global Mercury Synthesis report produced by 215
UNEP in partnership with the Biodiversity Research Institute (Burton and Evers 2019), 216
indicated the prevalence of primary metal production in the studied inventories, with industrial 217
gold production appearing as a dominant sector. Regarding the latter, the need for more 218
information on the mercury content in ores, including at country level, was highlighted 219
9
(Burton and Evers 2019), in order to properly assess the burden of the sector and further refine 220
and develop the Toolkit. 221
The issue of releases to land and water more broadly is currently under discussion in the 222
Minamata Convention Group of Technical Experts on releases established by the Conference of 223
the Parties to the Convention at its second meeting (decision MC-2/3). The work program6 of 224
this group of technical experts was established to produce a report including: 225
• draft guidance on the methodology for preparing inventories of releases, 226
• the proposed categories of point sources of releases and 227
• a road map for the development of guidance on best available techniques and best 228
environmental practices. 229
230
Non-ferrous metals have been listed as point sources of releases. The work of this group will 231
inform the issues concerning releases from the non-ferrous sector. 232
233
2.4. Contributions of the non-ferrous sector to global mercury supply 234
235
By-product mercury recovery from non-ferrous mining and processing operations is an 236
important source of global mercury supply, estimated at about 15% in the UNEP Global 237
Mercury Supply, Trade and Demand report 20177 (UNEP 2017a). As noted above, mercury 238
occurs at low concentrations in many non-ferrous ores. If the concentration of mercury is high 239
enough to justify removal, methods exist to produce mercury of the necessary purity for sale 240
and/or supply. This by-product mercury is typically in the form of calomel, metallic (elemental) 241
mercury, or it may be adsorbed on activated carbon filters or at other points in the removal 242
process (UNEP 2017a). 243
244
Use of this by-product mercury is preferable to extracting mercury from new mining operations 245
or new mercury products. However it is probable that most of the recovered mercury still goes 246
to disposal or is released to the environment (AMAP/UNEP 2013; AMAP/UNEP 2019). For these 247
and other reasons, including a paucity of reliable data, estimates of how much by-product 248
mercury from the non-ferrous sector is eventually marketed is problematic (UNEP 2017a). 249
250
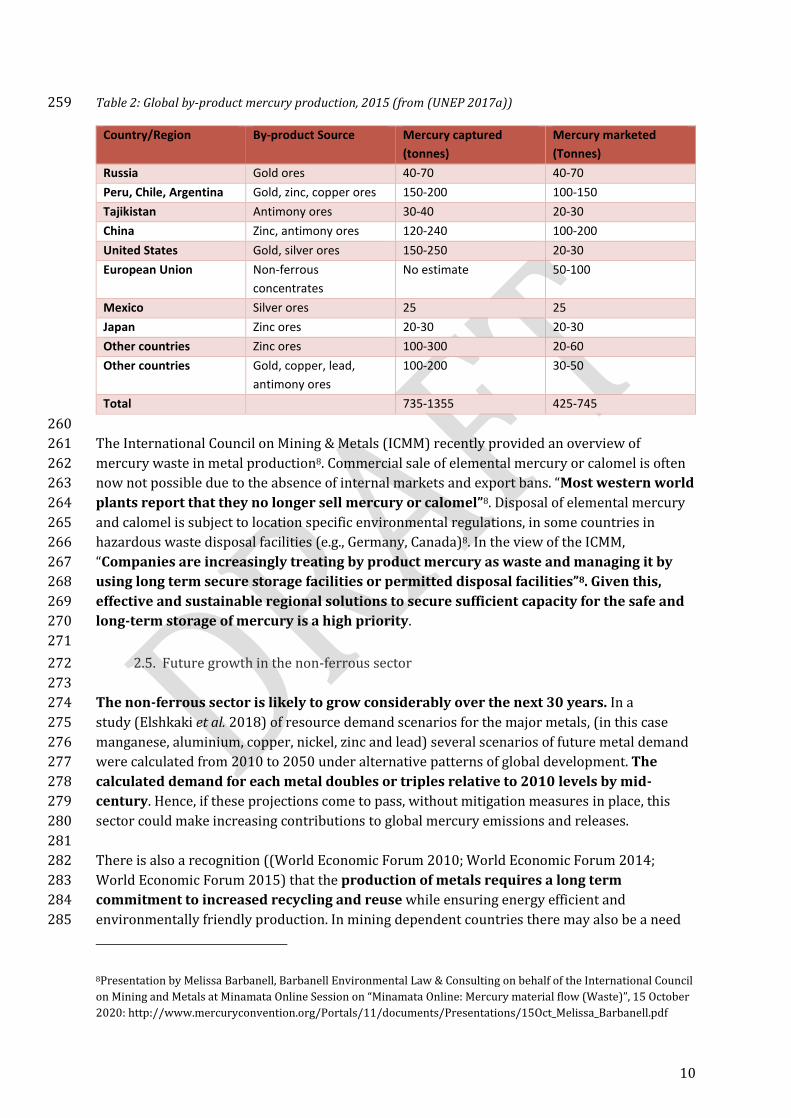
The Global Mercury Supply, Trade and Demand Report (UNEP 2017a) describes in detail, using 251
government and industry data, estimations of by-product mercury production and marketing 252
for a range of major non-ferrous metal producing countries. The estimates are presented in 253
Table 2, and show that that many countries generate by-product mercury but not all makes 254
its way to market. Restrictions on mercury export (e.g. in the United States and Europe) 255
reduce this source of supply but it is still significant. 256
257
258
6
http://www.mercuryconvention.org/News/fromtheConvention/ExpertgroupsonAnnexesAandBandmercuryrelea/ta
bid/8416/language/en-US/Default.aspx 7 https://www.unenvironment.org/resources/report/global-mercury-supply-trade-and-demand
10
Table 2: Global by-product mercury production, 2015 (from (UNEP 2017a)) 259
Country/Region By-product Source Mercury captured
(tonnes)
Mercury marketed
(Tonnes)
Russia Gold ores 40-70 40-70
Peru, Chile, Argentina Gold, zinc, copper ores 150-200 100-150
Tajikistan Antimony ores 30-40 20-30
China Zinc, antimony ores 120-240 100-200
United States Gold, silver ores 150-250 20-30
European Union Non-ferrous
concentrates
No estimate 50-100
Mexico Silver ores 25 25
Japan Zinc ores 20-30 20-30
Other countries Zinc ores 100-300 20-60
Other countries Gold, copper, lead,
antimony ores
100-200 30-50
Total 735-1355 425-745
260
The International Council on Mining & Metals (ICMM) recently provided an overview of 261
mercury waste in metal production8. Commercial sale of elemental mercury or calomel is often 262
now not possible due to the absence of internal markets and export bans. “Most western world 263
plants report that they no longer sell mercury or calomel”8. Disposal of elemental mercury 264
and calomel is subject to location specific environmental regulations, in some countries in 265
hazardous waste disposal facilities (e.g., Germany, Canada)8. In the view of the ICMM, 266
“Companies are increasingly treating by product mercury as waste and managing it by 267
using long term secure storage facilities or permitted disposal facilities”8. Given this, 268
effective and sustainable regional solutions to secure sufficient capacity for the safe and 269
long-term storage of mercury is a high priority. 270
271
2.5. Future growth in the non-ferrous sector 272
273
The non-ferrous sector is likely to grow considerably over the next 30 years. In a 274
study (Elshkaki et al. 2018) of resource demand scenarios for the major metals, (in this case 275
manganese, aluminium, copper, nickel, zinc and lead) several scenarios of future metal demand 276
were calculated from 2010 to 2050 under alternative patterns of global development. The 277
calculated demand for each metal doubles or triples relative to 2010 levels by mid-278
century. Hence, if these projections come to pass, without mitigation measures in place, this 279
sector could make increasing contributions to global mercury emissions and releases. 280
281
There is also a recognition ((World Economic Forum 2010; World Economic Forum 2014; 282
World Economic Forum 2015) that the production of metals requires a long term 283
commitment to increased recycling and reuse while ensuring energy efficient and 284
environmentally friendly production. In mining dependent countries there may also be a need 285
8Presentation by Melissa Barbanell, Barbanell Environmental Law & Consulting on behalf of the International Council
on Mining and Metals at Minamata Online Session on “Minamata Online: Mercury material flow (Waste)”, 15 October
2020: http://www.mercuryconvention.org/Portals/11/documents/Presentations/15Oct_Melissa_Barbanell.pdf
11
to adjust economies to ensure adding a significant share of downstream value to their mining 286
and sectors (World Economic Forum 2015). Such adjustments would represent significant 287
change: for example, in Peru mineral production represents a value of 16% of GDP, and 288
contributes 63% to exports; in Zambia the corresponding figures are 43% and 84%. 289
290
Should no controls be in place, the non-ferrous sector has the potential to make 291
significant and growing contributions to mercury emissions and releases to the global 292
cycling of mercury. 293
294
It is also notable that non-ferrous metals are abundant in South America9 and are more likely to 295
be developed in coming years. The continent’s copper reserves represent more than one-296
quarter (International Bank for Reconstruction and Development/The World Bank 2017) of the 297
world’s known reserves, nearly all of which are found in Chile and Peru9. In Chile the 298
Chuquicamata deposits of the northern Atacama Desert contain the largest amounts of copper 299
known in the world and have ores containing 2.5 percent copper. Peru’s most important 300
deposits are found in the country’s central Andean ranges, as well as in the south. Lead and zinc 301
are dispersed among many countries but are found in greatest abundance in the central Andes 302
of Peru; in the state of Minas Gerais, Brazil; in highland Bolivia; and in the northern Argentine 303
Andes. 304
305
306
307
9 https://www.britannica.com/place/South-America/Mineral-fuels
Mercury and the non-ferrous metals sector
• Mercury exists as a trace element in many ore bodies of the non-ferrous metals
and the mining and mineral processing of these ores has the potential to mobilize
mercury and emit it to the atmosphere, or to release it to land and water
• The non-ferrous sector is a large anthropogenic source of mercury emissions
estimated to account for more than 300 tonnes per year - around 10-15 per cent
of global mercury emissions to the atmosphere, the third largest source
• Releases to water are also high at more than 200 tonnes per year, about 40% of
the total releases much of it from large scale gold production
• Much larger amounts are released to land, but a great deal remains unknown
about this pathway of mercury pollution
• By-product mercury recovery from non-ferrous mining and processing operations
is an important source of global mercury supply, estimated at around 500 tonnes
per year or about 15% of the total global supply
• The non-ferrous sector is likely to grow considerably over the next 30 years
12
3. EXISTING ACTIVITIES RELATED TO MERCURY IN THE NON-308
FERROUS SECTOR 309
310
3.1. National and regional regulations and guidelines 311
312
Regulations to control industrial emissions and releases, including from the non-ferrous sector, 313
in countries and regions have been in operation and development for many years. It is beyond 314
the scope of this report to review these measures in detail but some brief comments are useful. 315
316
In the US extensive study of the issue of mercury pollution resulted in the Mercury Study Report 317
to Congress (USEPA 1997a; USEPA 1997b), and follow up studies specifically addressing, for 318
example, gold mining and processing. In 2011, the U.S. Environmental Protection Agency (EPA) 319
promulgated National Emissions Standards for Hazardous Air Pollutants for gold ore processing 320
and production facilities, the seventh largest source of mercury air emission in the United 321
States. It was estimated that this measure would reduce mercury emissions by 1,460 pounds 322
per year, or about a 77 percent reduction from 2007 levels. The Nevada Mercury Air Emissions 323
Control Program10, which requires controls at precious metal mining facilities, also resulted in 324
significant reductions in mercury emissions and releases. Standards were also introduced for 325
other mineral processing facilities. 326
327
Similarly in Canada, Canada-wide Standards for Mercury Emissions (Canadian Council of 328
Ministers of the Environment 2000) from base metal smelting facilities were imposed in 200011-329 12. 330 331
In Europe, the Best Available Techniques (BAT) Reference Document for the Non-Ferrous 332
Metals Industries (European Commission (Joint Research Centre) et al. 2017) includes BAT-333
associated emission limits (AEL) for mercury. The European Environment Agency also tracks 334
emissions of heavy metals over time13, extending back to 1990. Legislation is in place to address 335
heavy metals, including: 336
337
• the 1998 Aarhus Protocol on Heavy Metals (to the 1979 United Nations Economic 338
Commission for Europe (UNECE) Convention on LRTAP), which targets three 339
particularly harmful substances: Cd, Hg and Pb; 340
• EU Directive 2001/80/EC on the limitation of emissions of certain pollutants into the air 341
from large combustion plants (the LCP Directive), which aims to limit heavy metal 342
emissions via dust control and absorption of heavy metals; 343
• EU Directive 2010/75/EU on industrial emissions (integrated pollution prevention and 344
control) (EU, 2010), which aims to prevent or minimise pollution of water, air and soil; 345
this directive targets certain industrial, agricultural and waste treatment installations; 346
10 https://ndep.nv.gov/air/nevada-mercury-control-program-nmcp 11 https://www.ccme.ca/en/resources/air/mercury.html 12 http://www.ccme.ca/files/Resources/air/mercury/mercury_emis_std_e1.pdf 13 https://www.eea.europa.eu/data-and-maps/indicators/eea32-heavy-metal-hm-emissions-1
13
• the European Pollutant Release and Transfer Register (E-PRTR) Regulation 347
(166/2006/EC), under the requirements of which emissions of a number of heavy 348
metals released from certain industrial facilities are also estimated and reported. 349
350
Many countries also have reporting systems in place for national emissions to air (e.g. the US 351
National Emissions Inventory (NEI)14 and the Toxics Releases Inventory (TRI)15; Australian 352
National Pollutant Inventory16; the UK National Atmospheric Emissions Inventory (NAEI)17), 353
which include mercury and other heavy metals. 354
355
In the most recent GMA national estimates of emission were compared with the results of the 356
GMA . It was noted (AMAP/UNEP 2019) that the recent initiatives of Minamata Initial 357
Assessments (MIAs) or Minamata National Action Plans (NAPs) have resulted in a large increase 358
in the numbers of countries preparing new national inventories or national emission/release 359
estimates. The importance of the non-ferrous sector to mercury emissions and releases in Latin 360
America18 was highlighted in the inventories carried out in the context of Minamata Initial 361
Assesments. Argentina, Ecuador, Peru and Uruguay were included in this work. 362
363
3.2. International Agreements, Partnerships and Guidance 364
365
3.2.1. UNEP Global Mercury Partnership 366
367
Initiated in 2005 by the UNEP Governing Council, the UNEP Global Mercury Partnership aims to 368
protect human health and the environment from the releases of mercury and its compounds to 369
air, water and land. With over 200 partners to date from Governments, intergovernmental and 370
non-governmental organizations, industry and academia, the Partnership focuses on supporting 371
timely and effective implementation of the Minamata Convention on Mercury, providing state of 372
the art knowledge and science and raising awareness towards global action on mercury. 373
374
The Partnership is structured around eight partnership areas- that are reflective of the major 375
source of mercury emission and release categories19. Despite discussions on the relevance of an 376
area of work on “mercury releases from non-ferrous metals mining” dedicated to “non-ferrous 377
metals”, none is currently devoted to the sector. However, the Partnership areas on mercury 378
waste management, mercury air transport and fate research and mercury supply and storage 379
are of relevance to various aspects related to mining and metal production. 380
381
In spite of the lack of a Partnership Area, it is also clear from the material gathered from this 382
report that there has been substantial progress in addressing the issue of mercury emissions 383
14 https://www.epa.gov/air-emissions-inventories/national-emissions-inventory-nei 15 https://www.epa.gov/toxics-release-inventory-tri-program 16 https://www.npi.gov.au/ 17 https://naei.beis.gov.uk/ 18 http://www.mercuryconvention.org/Portals/11/documents/Presentations/15Oct_Gabriela_Medina.pdf 19 Areas are: artisanal and small scale gold mining (ASGM), mercury releases from coal combustion, mercury cell
chlor-alkali production, mercury in products, mercury air transport and fate research, mercury waste management,
mercury supply and storage, mercury releases from the cement industry
14
and releases from the non-ferrous sector. Government regulators, industry and NGOs have all 384
contributed to this progress. 385
386
3.2.2. Minamata Convention on Mercury 387
388
Adopted in 2013, the Minamata Convention on mercury is an international legally binding 389
instrument aiming at protecting human health and the environment from anthropogenic 390
emissions and releases of mercury and mercury compounds. The Minamata Convention 391
contains provisions that relate to the entire life cycle of mercury and addresses issues of 392
mercury supply, trade, uses, emissions, releases, storage and disposal, providing the framework 393
for countries to take coordinated actions to reduce the concentration of this toxic metal in the 394
environment. Articles 3 (mercury supply sources and trade), 8 (emissions), 9 (releases), 11 395
(mercury wastes), and 12 (contaminated sites) are all of potential relevance to the non-ferrous 396
sector. 397
398
Article 8 of the convention stipulates measures to be undertaken by parties to control and, 399
where feasible, reduce emissions of mercury and mercury compounds. In addition, it suggests 400
separate approaches for new and existing sources. For new sources these measures require the 401
use of best available techniques and best environmental practices (BAT/BEP). For existing 402
sources parties shall include in any national plan and shall implement one or more of the 403
following measures: a quantified goal; emission limit values; BAT/BEP; a multi-pollutant 404
strategy capable of producing co-benefits for control of mercury emissions; and, alternative 405
measures. 406
407
The Convention identifies smelting and roasting processes used in the production of lead, zinc, 408
copper and industrial gold, which are listed (annex D) among the source categories for which 409
Parties are required to take measures to control emissions of mercury and mercury compounds 410
to the atmosphere. 411
412
Minamata Convention Article 8 Guidance20 413
414
A BAT/BEP guidance was developed by a technical experts group and adopted by the first 415
meeting of the Conference of the Parties to the Minamata Convention to support Parties in 416
meeting the requirements of Article 8. Details of the guidance for the non-ferrous sector can be 417
found under section 6 of this document. 418
The guidance (UNEP 2019b) includes: 419
• guidance on best available techniques and best environmental practices, 420
• guidance on criteria that parties might develop pursuant to paragraph 2 (b) of article 8, 421
• guidance on preparing inventories of emissions, and 422
20 http://mercuryconvention.org/Convention/Formsandguidance/tabid/5527/language/en-US/Default.aspx
15
• guidance on support for parties in implementing the measures set out in paragraph 5 of 423
article 8, in particular in determining goals and in setting emissions limit values. 424
The guidance will function as a crucial source of information, criteria and support as parties to 425
the Convention develop responses to the requirements to reduce and where possible eliminate 426
mercury emissions from the sources included in Annex D, amongst which smelting and roasting 427
processes used in the production of non-ferrous metals (for the purpose of this Annex, “non-428
ferrous metals” refers to lead, zinc, copper and industrial gold), and specific details of the 429
guidance are listed below in Section 6. This guidance includes a section dedicated to addressing 430
sound management measures for smelting and roasting processes for industrial gold, lead, zinc 431
and copper. Amongst other issues, it also provides recommendations in terms of the production 432
of sulfuric acid that takes place as part of the exhaust gas cleaning process at many metals 433
production sites. 434
435
While Article 8 focuses on emissions to the atmosphere, Article 9 addresses the releases to land 436
and water of mercury and mercury compounds from significant anthropogenic point sources 437
that are not addressed in other provisions of the Convention. In contrast to the article on 438
emissions, the sources of releases are not identified, and Parties are to identify the categories of 439
relevant point sources. 440
441
At the request of the Convention’s Conference of the Parties, a group of technical experts21 was 442
established to produce a report including draft guidance on the methodology for preparing 443
inventories of releases, the proposed categories of point sources of releases and a road map for 444
the development of guidance on best available techniques and best environmental practices. 445
The guidance is to support Parties to identify relevant point sources and control their mercury 446
releases. Non-ferrous metals have been listed as point sources of release. It is expected that the 447
fourth meeting of the Conference of the Parties to the Minamata Convention (COP-4) will be 448
presented for possible adoption the inventory guidance and for consideration the road map to 449
develop BAT/BEP guidance on releases. 450
451
Article 11 also requires the Conference of the Parties to establish thresholds for defining 452
mercury waste. Managing mercury waste is a long-term imperative of the Convention and work 453
is currently in progress. COP-3 agreed on the definition of certain types of mercury waste and 454
requested the group of technical experts established at COP-2, to further work on the thresholds 455
for waste contaminated with mercury and for mine tailings. Work to update the guidelines for 456
the environmentally sound management of mercury waste, which Parties to the Minamata 457
Convention shall take into account in the environmentally sound management of mercury 458
waste, is currently underway under the Basel Convention22. 459
460
3.3. Industry Sector activities 461
21 http://mercuryconvention.org/Meetings/Intersessionalwork/tabid/8279/language/en-US/Default.aspx 22 The Conference of the Parties to the Basel Convention on the Control of Transboundary Movements of Hazardous
Wastes and their Disposal adopted at its twelth meeting the “Technical guidelines for the environmentally sound
management of wastes consisting of elemental mercury and wastes containing or contaminated with
mercury”(Decision BC-12/4), which it decided at its fourteenth meeting to update (Decision BC-14/8)
16
462
3.3.1. The International Council on Mining & Metals (ICMM) 463
464
Members of the International Council on Mining & Metals (ICMM), which brings together 27 465
mining and metals companies and over 30 regional and commodities associations, have taken a 466
number of commitments related to mercury, including to: 467
468
• Not open any mines designed to produce mercury as the primary product. 469
• Apply materials stewardship to promote the responsible management of the mercury 470
produced from ICMM members’ operations including the mercury which naturally occurs in 471
their products. 472
• Identify and quantify point source mercury air emissions from their operations and 473
minimise them through the application of cost effective best available technology, using a 474
risk based approach. 475
• Report significant point source mercury air emissions from their operations consistent with 476
their commitment to report in accordance with the GRI framework. 477
• Participate in government-led partnerships to transfer low- to no-mercury technologies into 478
the ASM sector in locations where ICMM member companies have operations in close 479
proximity to ASM activity such that livelihoods are enhanced through increased 480
productivity and reduced impacts to human health. 481
• Through ICMM, encourage the development of sound science on the fate and transport of 482
mercury as well as natural sources of mercury in the environment. 483
• Work on an integrated multi-stakeholder strategy through ICMM to reduce and eventually 484
cease supplying mercury into the global market once policy and economically viable long-485
term technological solutions for the retirement of mercury are developed. 486
487
As part of its efforts to support the development and implementation of the Convention, ICMM 488
has been actively engaged in the development of the Minamata Convention (INC and COP 489
processes), participated as an observer in the experts groups on air emissions, and is currently 490
involved in the experts groups on waste and releases. In addition, ICMM has presented as part 491
of the Minamata Online programme23, provided comments to the contaminated sites guidelines, 492
the interim storage guidelines developed in the context of the Minamata Convention and the 493
Basel Convention technical guidelines on mercury waste management. 494
495
3.3.2. The International Study Groups 496
497
The International Lead and Zinc (ILZSG)24 and International Copper (ICSG)25 Study Groups have 498
also engaged with the global initiatives in environmental mercury management. 499
500
(section to be further developed) 501
502
23 Presentation at Minamata Online webinar on “Mercury material flow (Waste)”, 15 October 2020 24 https://www.ilzsg.org/static/home.aspx?from=3 25 http://www.icsg.org/
17
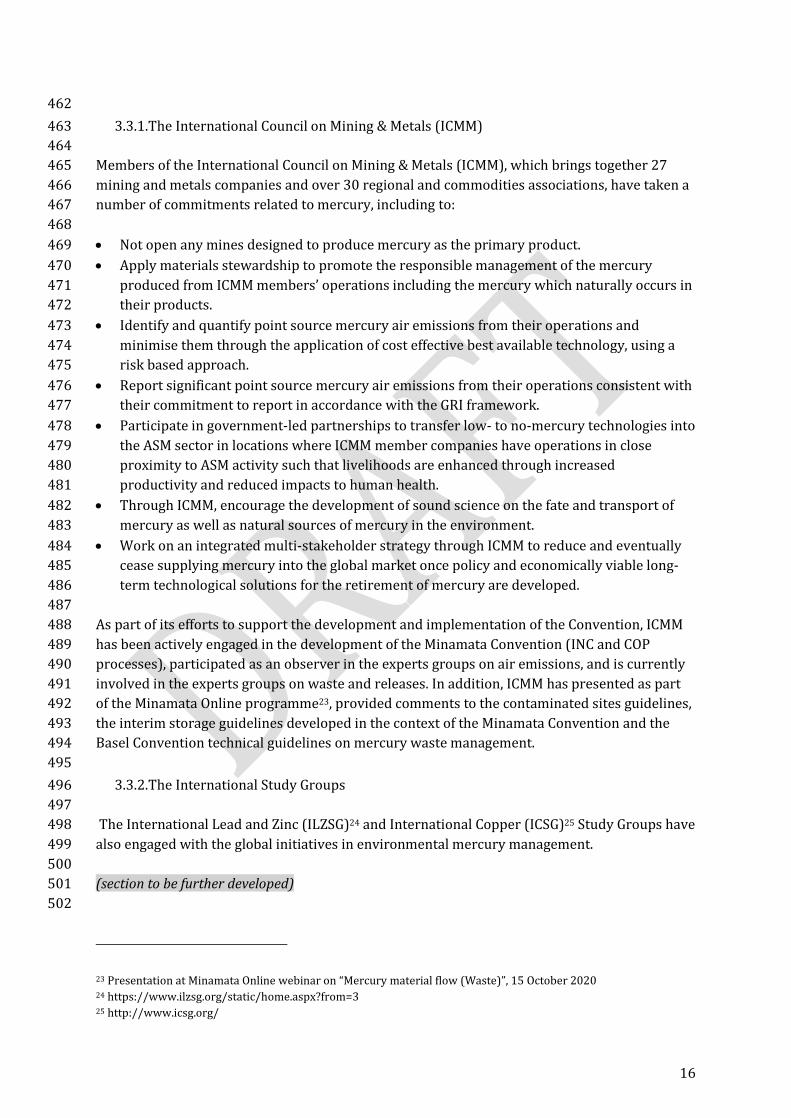
3.4. Non-governmental Organisations (NGOs) 503
504
Non-governmental Organisations (NGOs) have also been very engaged with mercury initiatives 505
and the development of the Minamata Convention, including specific work on the non-ferrous 506
sector. In the International Pollutants Elimination Network (IPEN) 2014 report26 (Bell et al. 507
2014) the potential for substantial releases to land and water from metal ore mining was 508
identified in addition to the air emissions from mineral processing: 509
510 metal ore mining is a large and often relatively ignored source of mercury releases to the environment. 511 Of the almost 2,500 metric tons of mercury and mercury compounds released into the environment in 2008 512 from U.S. mining operations, almost all of it stayed on-site and was released to land. None (0 pounds) was 513 put into certified hazardous waste landfills and approximately 10 percent was put into landfills that are not 514 certified for hazardous waste. The majority, approximately 90 percent of the mercury and mercury 515 compounds—a reported 2,205.22 metric tons (4,861,684 pounds)—was just dumped. (The technical 516 description of this waste disposal category is “on-site land disposal other than landfills including activities 517 such as placement in waste piles and spills or leaks.”) When we consider that metal ore mining in the United 518 States (where good data is easily available) makes up only a small fraction of total global metal ore mining 519 and that in the United States alone, the amount of mercury and mercury compounds in wastes dumped at 520 metal ore mining sites in one year (2008) was more than 2,200 metric tons, we see that the global total of 521 mercury and mercury compounds contained in all dumped mining wastes at all past and present metal 522 ore mining operations must be extremely large. These dumped wastes are continuously subject to weathering 523 activities and other natural processes that certainly result in high but unrecorded air emissions, water 524 discharges, and other mercury releases from mining waste dumps (Bell et al. 2014). 525 526
The Natural Resources Defense Council (NRDC) has recently produced two reports in China, 527
partnering with experts and local NGOs to promote more effective mercury air emissions 528
controls, quantify and reduce mercury production from mercury mining and other sources, and 529
reduce the use of mercury in products and industrial processes. In one NRDC study (Zhang et al. 530
2019), a technology-based probabilistic emission factor model, was used to estimate mercury 531
emissions in the non-ferrous metal smelting (NFMS) industry in China by province. The total 532
mercury emission from the sector in 2015 was 75.6 t, 34% lower than in 2010. The reduction of 533
mercury emission from 2010 to 2015 was achieved by phasing out outdated production 534
capacity and the widespread application of the double contact and double absorption (DCDA) 535
acid plants. In addition, the mercury flow in the treatment processes for by-products from non-536
ferrous metal smelters was evaluated (see Section 4 for additional detail). 537
538
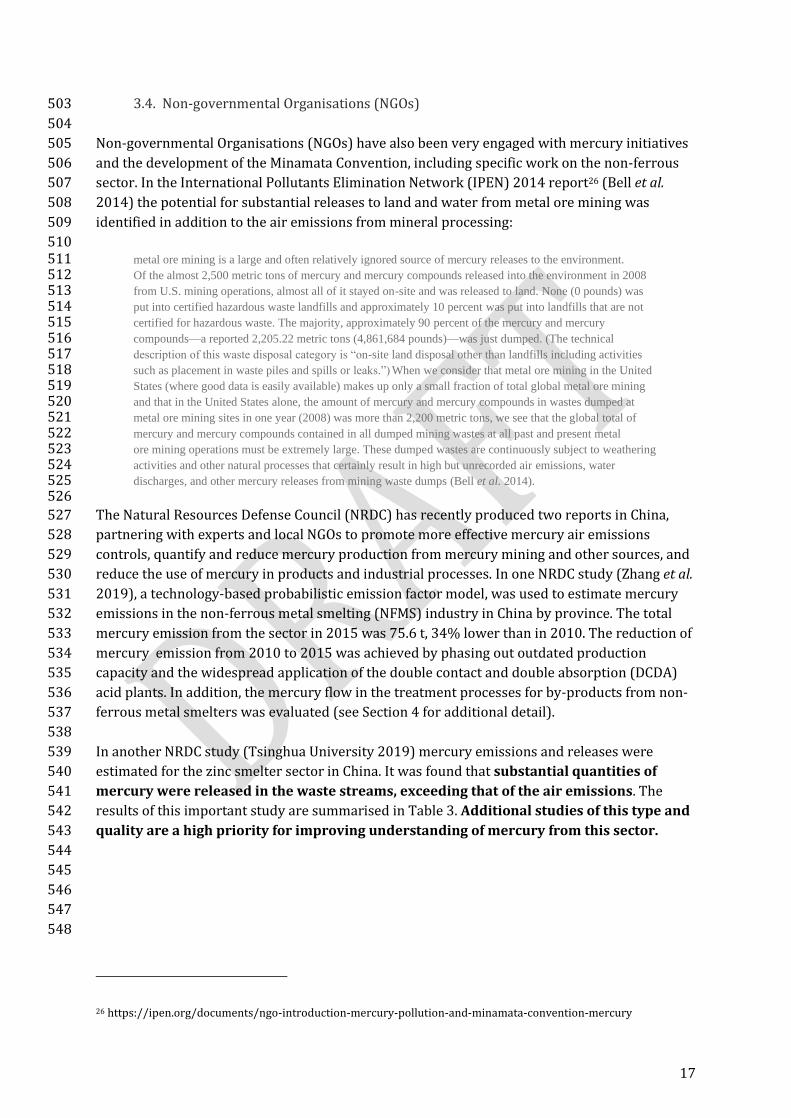
In another NRDC study (Tsinghua University 2019) mercury emissions and releases were 539
estimated for the zinc smelter sector in China. It was found that substantial quantities of 540
mercury were released in the waste streams, exceeding that of the air emissions. The 541
results of this important study are summarised in Table 3. Additional studies of this type and 542
quality are a high priority for improving understanding of mercury from this sector. 543
544
545
546
547
548
26 https://ipen.org/documents/ngo-introduction-mercury-pollution-and-minamata-convention-mercury
18
Table 3: Mercury emissions from different processes in zinc smelters in China (Tsinghua University 2019) 549
Process Emission point Emissions (t) Note
Production process Smelting furnace 27 Mainly from hydrometallurgical process
Waste disposal process
Waste acid disposal process
7 Recovering Hg from SUL slag and calomel; Smelting slag in the furnace
Leaching slag treatment
25 Recovering ZnO from leaching slag
Metal slag disposal 12 Metal slag from the
leaching step of
production process was
treated to recover
metal. The
pyrometallugical
process led to mercury
emissions.
Sulfuric acid disposal 5 Smelter using sulfuric
acid to produce metals
4. LIFE CYCLE OF MERCURY IN NON-FERROUS METALS MINING AND 550
SMELTING 551
4.1. Indicative processes 552
553
The major steps and considerations for mercury emissions, releases and control from the non-554
ferrous sector are described in Section 4.3 of the UNEP report Guide for Major Uses and Releases 555
of Mercury (UNEP 2006). In practice these processes are complex and have important 556
differences particularly in the case of gold. The Minamata Convention BAT/BEP guidance 557
includes pictorial generic descriptions of the four metals covered under the Convention (lead, 558
copper, zinc and large scale gold). Here general descriptions are given for gold and zinc (drawn 559
from the Minamata online presentation8 on mercury waste in metal production, by ICMM on 15 560
October 2020) in order to illustrate the complexities of metal processing, pollutant capture and 561
waste management. 562
563
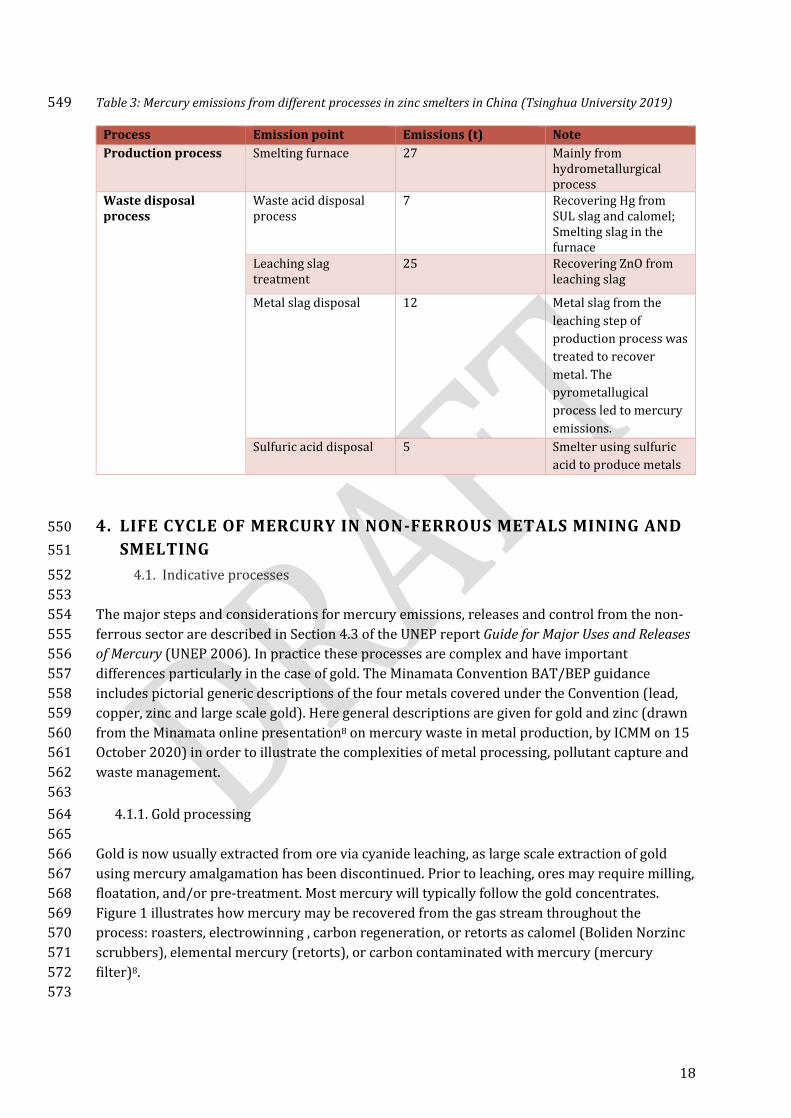
4.1.1. Gold processing 564
565
Gold is now usually extracted from ore via cyanide leaching, as large scale extraction of gold 566
using mercury amalgamation has been discontinued. Prior to leaching, ores may require milling, 567
floatation, and/or pre-treatment. Most mercury will typically follow the gold concentrates. 568
Figure 1 illustrates how mercury may be recovered from the gas stream throughout the 569
process: roasters, electrowinning , carbon regeneration, or retorts as calomel (Boliden Norzinc 570
scrubbers), elemental mercury (retorts), or carbon contaminated with mercury (mercury 571
filter)8. 572
573
19
574 Figure 1: Example of gold production processing8 575
576
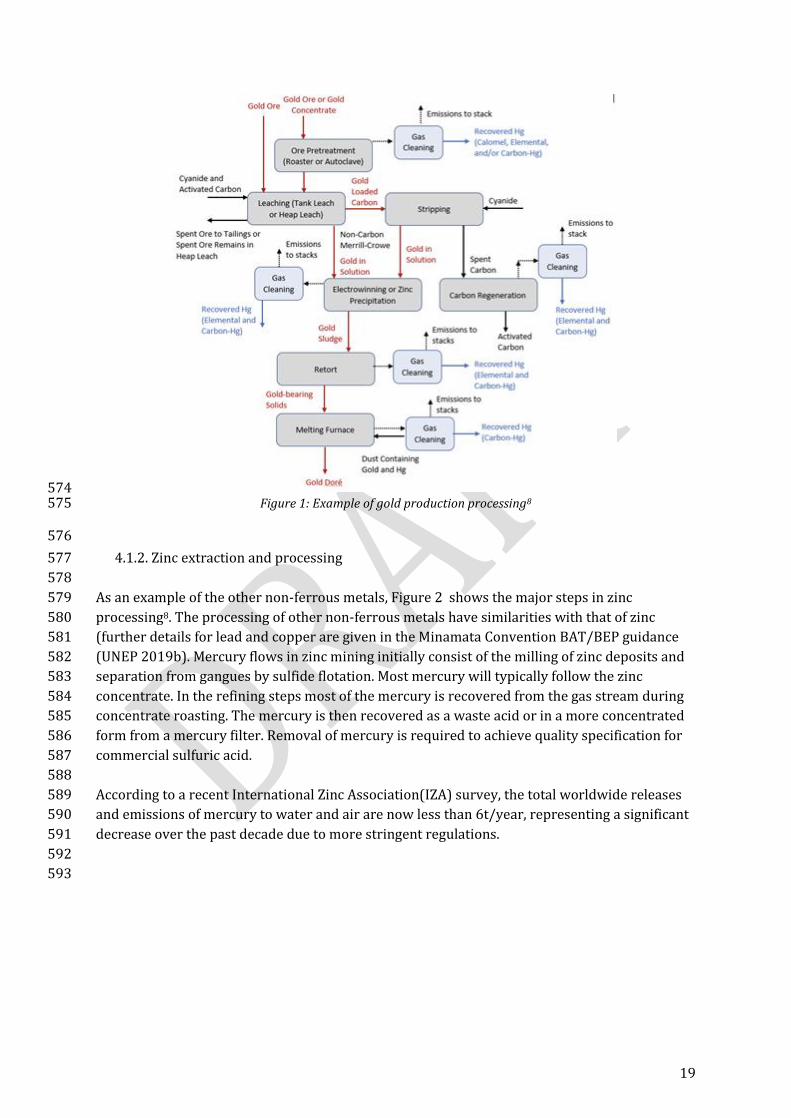
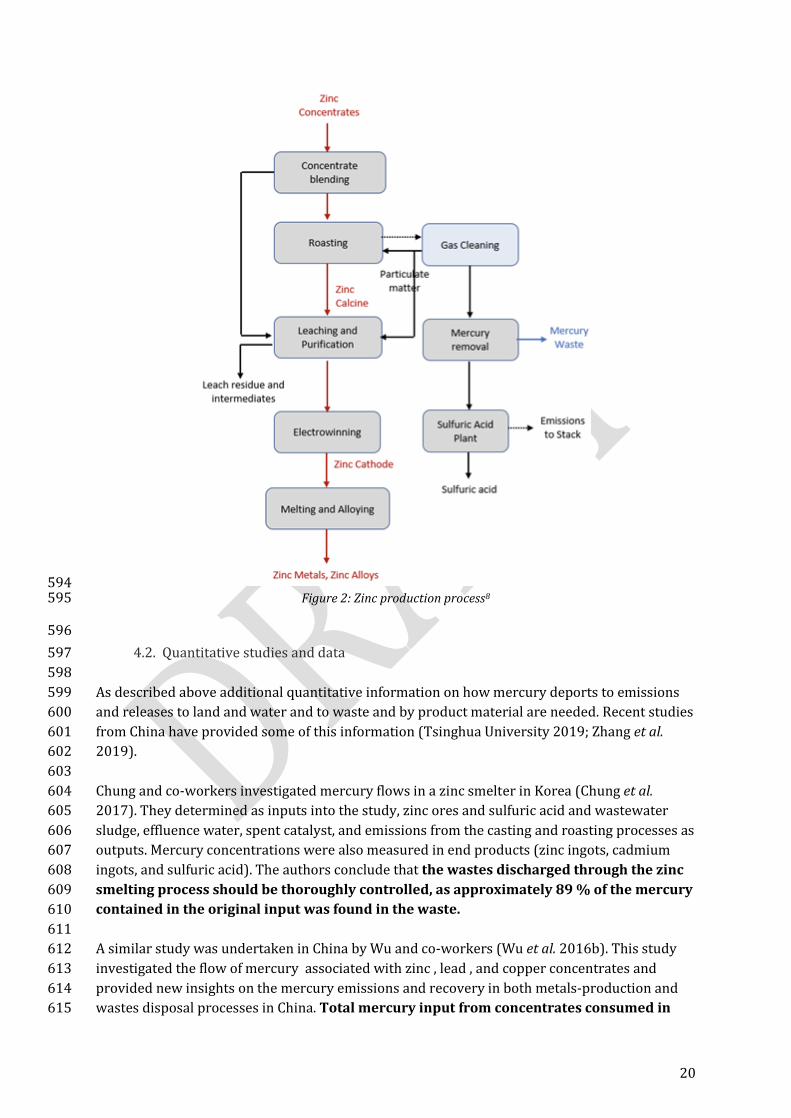
4.1.2. Zinc extraction and processing 577
578
As an example of the other non-ferrous metals, Figure 2 shows the major steps in zinc 579
processing8. The processing of other non-ferrous metals have similarities with that of zinc 580
(further details for lead and copper are given in the Minamata Convention BAT/BEP guidance 581
(UNEP 2019b). Mercury flows in zinc mining initially consist of the milling of zinc deposits and 582
separation from gangues by sulfide flotation. Most mercury will typically follow the zinc 583
concentrate. In the refining steps most of the mercury is recovered from the gas stream during 584
concentrate roasting. The mercury is then recovered as a waste acid or in a more concentrated 585
form from a mercury filter. Removal of mercury is required to achieve quality specification for 586
commercial sulfuric acid. 587
588
According to a recent International Zinc Association(IZA) survey, the total worldwide releases 589
and emissions of mercury to water and air are now less than 6t/year, representing a significant 590
decrease over the past decade due to more stringent regulations. 591
592
593
20
594 Figure 2: Zinc production process8 595
596
4.2. Quantitative studies and data 597
598
As described above additional quantitative information on how mercury deports to emissions 599
and releases to land and water and to waste and by product material are needed. Recent studies 600
from China have provided some of this information (Tsinghua University 2019; Zhang et al. 601
2019). 602
603
Chung and co-workers investigated mercury flows in a zinc smelter in Korea (Chung et al. 604
2017). They determined as inputs into the study, zinc ores and sulfuric acid and wastewater 605
sludge, effluence water, spent catalyst, and emissions from the casting and roasting processes as 606
outputs. Mercury concentrations were also measured in end products (zinc ingots, cadmium 607
ingots, and sulfuric acid). The authors conclude that the wastes discharged through the zinc 608
smelting process should be thoroughly controlled, as approximately 89 % of the mercury 609
contained in the original input was found in the waste. 610
611
A similar study was undertaken in China by Wu and co-workers (Wu et al. 2016b). This study 612
investigated the flow of mercury associated with zinc , lead , and copper concentrates and 613
provided new insights on the mercury emissions and recovery in both metals-production and 614
wastes disposal processes in China. Total mercury input from concentrates consumed in 615
21
China reached 1005.4 t, of which 31.7% was dumped as discarded slags and 2.3% was 616
stabilized (permanent storage). Approximately 202.1 t of mercury was directly emitted 617
to air, water, and soil. More specifically, metals production processes emitted 100.4 t mercury 618
to air. Wastes disposal processes contributed to an additional 47.8 t of atmospheric mercury 619
emissions and 32.7 and 21.3 t of mercury to water and soil, respectively. At the same time, out 620
of the 62.6 t of recovered mercury, 95.2% was reclaimed from acid slags. Interim storage of 621
398.9 t of mercury also highlights the significance of acid slags as potential mercury recovery 622
sources due to the global ban on primary mercury production. 623
624
The case studies appended to this report also contain useful information for specific processes 625
and mineral processing facilities. However obtaining accurate data on mercury concentration 626
and masses or volumes in the different stages of these complex processes is challenging. 627
628
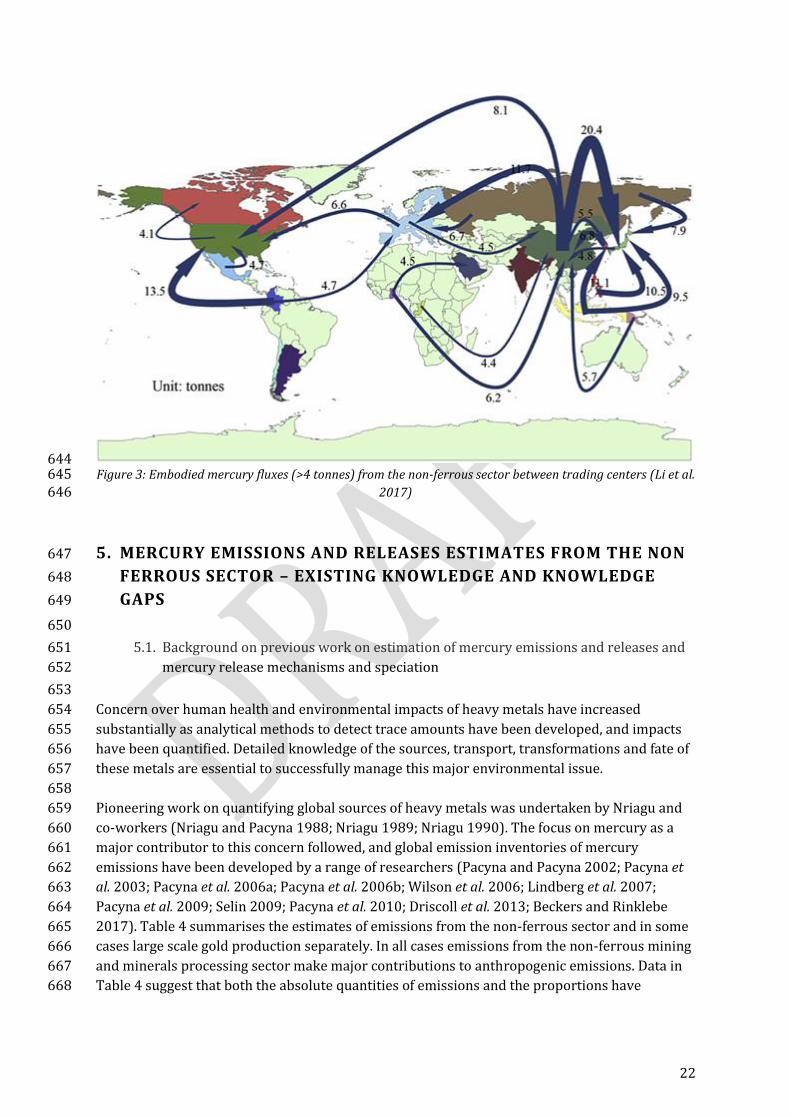
On a global scale, the study of Li and co-workers (Li et al. 2017) is very interesting and deserves 629
additional investigation. The authors claim that the inter-connected global economy that 630
features an intensive correlated supply chain has large impacts on mercury emissions. Global 631
non-ferrous metal related mercury emission flows (including ASGM) among 186 individual 632
economies for the year 2010 are tracked, by applying an empirically validated multi-regional 633
input-output (MRIO) model. The total amount of direct mercury emissions is 974 tonnes, to 634
which gold production contributed a dominant proportion. However, two thirds of mercury 635
emissions from non-ferrous metal production were effectively traded internationally, 636
primarily as exports from emerging economies such as mainland China and Colombia to 637
wealthy economies including the USA and Germany through global supply chains. This 638
paper therefore traces embodied mercury emissions flowing from the economy where they are 639
produced to other economies where the final consumption happens. These results for the 640
embodied mercury fluxes are presented in Figure 3. The authors conclude that understanding 641
the redistribution of mercury emissions along the global supply chains can facilitate 642
international efforts to reduce mercury emissions from non-ferrous metal production. 643
22
644 Figure 3: Embodied mercury fluxes (>4 tonnes) from the non-ferrous sector between trading centers (Li et al. 645
2017) 646
5. MERCURY EMISSIONS AND RELEASES ESTIMATES FROM THE NON 647
FERROUS SECTOR – EXISTING KNOWLEDGE AND KNOWLEDGE 648
GAPS 649
650
5.1. Background on previous work on estimation of mercury emissions and releases and 651
mercury release mechanisms and speciation 652
653
Concern over human health and environmental impacts of heavy metals have increased 654
substantially as analytical methods to detect trace amounts have been developed, and impacts 655
have been quantified. Detailed knowledge of the sources, transport, transformations and fate of 656
these metals are essential to successfully manage this major environmental issue. 657
658
Pioneering work on quantifying global sources of heavy metals was undertaken by Nriagu and 659
co-workers (Nriagu and Pacyna 1988; Nriagu 1989; Nriagu 1990). The focus on mercury as a 660
major contributor to this concern followed, and global emission inventories of mercury 661
emissions have been developed by a range of researchers (Pacyna and Pacyna 2002; Pacyna et 662
al. 2003; Pacyna et al. 2006a; Pacyna et al. 2006b; Wilson et al. 2006; Lindberg et al. 2007; 663
Pacyna et al. 2009; Selin 2009; Pacyna et al. 2010; Driscoll et al. 2013; Beckers and Rinklebe 664
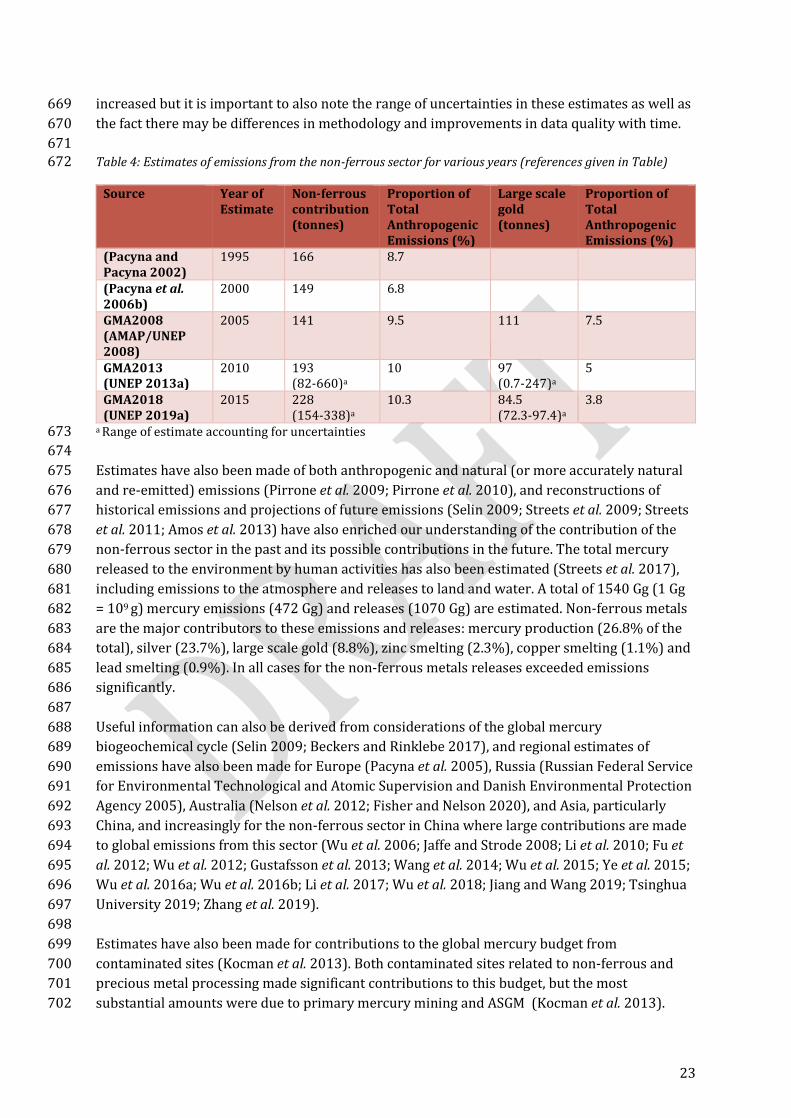
2017). Table 4 summarises the estimates of emissions from the non-ferrous sector and in some 665
cases large scale gold production separately. In all cases emissions from the non-ferrous mining 666
and minerals processing sector make major contributions to anthropogenic emissions. Data in 667
Table 4 suggest that both the absolute quantities of emissions and the proportions have 668
23
increased but it is important to also note the range of uncertainties in these estimates as well as 669
the fact there may be differences in methodology and improvements in data quality with time. 670
671 Table 4: Estimates of emissions from the non-ferrous sector for various years (references given in Table) 672
Source Year of Estimate
Non-ferrous contribution (tonnes)
Proportion of Total Anthropogenic Emissions (%)
Large scale gold (tonnes)
Proportion of Total Anthropogenic Emissions (%)
(Pacyna and Pacyna 2002)
1995 166 8.7
(Pacyna et al. 2006b)
2000 149 6.8
GMA2008 (AMAP/UNEP 2008)
2005 141 9.5 111 7.5
GMA2013 (UNEP 2013a)
2010 193 (82-660)a
10 97 (0.7-247)a
5
GMA2018 (UNEP 2019a)
2015 228 (154-338)a
10.3 84.5 (72.3-97.4)a
3.8
a Range of estimate accounting for uncertainties 673
674
Estimates have also been made of both anthropogenic and natural (or more accurately natural 675
and re-emitted) emissions (Pirrone et al. 2009; Pirrone et al. 2010), and reconstructions of 676
historical emissions and projections of future emissions (Selin 2009; Streets et al. 2009; Streets 677
et al. 2011; Amos et al. 2013) have also enriched our understanding of the contribution of the 678
non-ferrous sector in the past and its possible contributions in the future. The total mercury 679
released to the environment by human activities has also been estimated (Streets et al. 2017), 680
including emissions to the atmosphere and releases to land and water. A total of 1540 Gg (1 Gg 681
= 109 g) mercury emissions (472 Gg) and releases (1070 Gg) are estimated. Non-ferrous metals 682
are the major contributors to these emissions and releases: mercury production (26.8% of the 683
total), silver (23.7%), large scale gold (8.8%), zinc smelting (2.3%), copper smelting (1.1%) and 684
lead smelting (0.9%). In all cases for the non-ferrous metals releases exceeded emissions 685
significantly. 686
687
Useful information can also be derived from considerations of the global mercury 688
biogeochemical cycle (Selin 2009; Beckers and Rinklebe 2017), and regional estimates of 689
emissions have also been made for Europe (Pacyna et al. 2005), Russia (Russian Federal Service 690
for Environmental Technological and Atomic Supervision and Danish Environmental Protection 691
Agency 2005), Australia (Nelson et al. 2012; Fisher and Nelson 2020), and Asia, particularly 692
China, and increasingly for the non-ferrous sector in China where large contributions are made 693
to global emissions from this sector (Wu et al. 2006; Jaffe and Strode 2008; Li et al. 2010; Fu et 694
al. 2012; Wu et al. 2012; Gustafsson et al. 2013; Wang et al. 2014; Wu et al. 2015; Ye et al. 2015; 695
Wu et al. 2016a; Wu et al. 2016b; Li et al. 2017; Wu et al. 2018; Jiang and Wang 2019; Tsinghua 696
University 2019; Zhang et al. 2019). 697
698
Estimates have also been made for contributions to the global mercury budget from 699
contaminated sites (Kocman et al. 2013). Both contaminated sites related to non-ferrous and 700
precious metal processing made significant contributions to this budget, but the most 701
substantial amounts were due to primary mercury mining and ASGM (Kocman et al. 2013). 702
24
703
Specific estimates of emissions from the non-ferrous sector and considerations of global 704
mercury supply chains (Maxson 2005; Li et al. 2017) and global metal cycles (Rauch and Pacyna 705
2009) also provide useful information. Most recently estimates of emissions and releases 706
prepared for the UN Environment Global Mercury Assessments (AMAP/UNEP 2008; 707
AMAP/UNEP 2013; AMAP/UNEP 2019) have collected and used the best available estimation 708
techniques, and country specific data where that is available. The UN Environment Toolkit for 709
Identification and Quantification of Mercury Sources (UNEP 2005; UNEP 2017b) complements 710
the GMAs and enables country specific emissions and releases to be estimated. Both the GMA 711
and Toolkit include extensive background information on data for the non-ferrous sector and 712
the methodology for making the estimates. 713
714
It is beyond the scope of this report to repeat in detail or further analyse the detailed 715
information in these publications and reports but a consideration of the methodologies 716
employed and the knowledge gaps is useful for informing future studies and research on the 717
non-ferrous sector. These will be addressed in Section 5.2 below. 718
719
An understanding of mercury release from ores during smelting and other high temperature 720
processing is important for accurate estimates of mercury emissions and releases. Mercury 721
speciation as elemental mercury (Hg0), oxidized mercury (Hg2+), or particulate mercury (Hgp) is 722
also important for determining mercury fate in the atmosphere, water, soils and vegetation. 723
Hence knowledge of the forms of mercury in emissions and releases is crucial for modelling 724
mercury transport and fate. 725
726
Commercially non-ferrous metals are predominantly produced from sulfide ores. Mercury is 727
often present in such ores, albeit in highly variable concentrations. Emissions and releases of 728
mercury usually occur during high temperature processing of the ores, which typically consisit 729
of four stages: dehydration, smelting and/or roasting, extraction and refining (Wang et al. 2010; 730
Zhang et al. 2012; Wu et al. 2015; Zhang et al. 2016). The major releases occur during the 731
smelting or roasting of concentrates. 732
733
Temperatures exceed 800°C in smelting/roasting, extraction and refining (Wang et al. 2010) 734
and at these temperatures formation of elemental mercury (Hg0) is favoured (Hylander and 735
Herbert 2008) and release rates of mercury for non-ferrous metals apart from industrial gold 736
are almost complete (usually more than 98% (Zhang et al. 2016)). 737
738
In the case of industrial gold smelting, based on in situ measurements (Zhang et al. 2016) of a 739
gold concentrate roaster (at 600°C), release of only 85% of the mercury was observed. It has 740
been suggested (Zhang et al. 2016) that temperatures of more than 780°C are required to 741
release mercury from certain chemical associations in the gold ore. 742
743
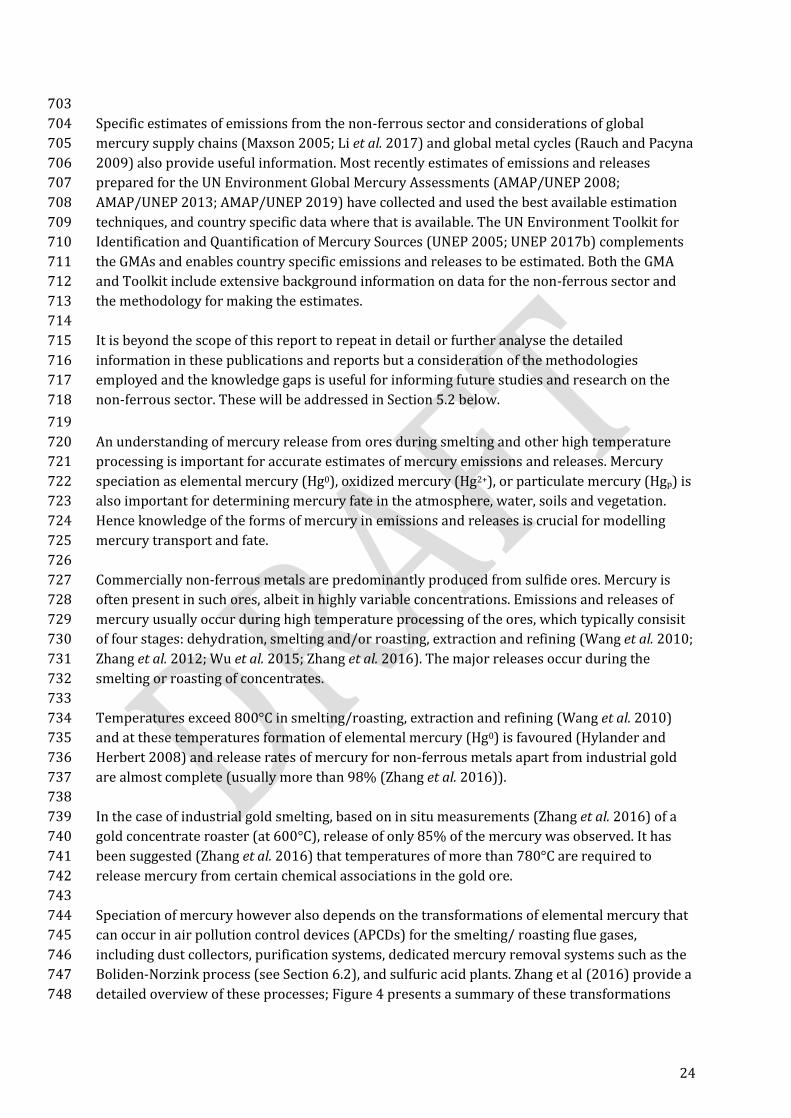
Speciation of mercury however also depends on the transformations of elemental mercury that 744
can occur in air pollution control devices (APCDs) for the smelting/ roasting flue gases, 745
including dust collectors, purification systems, dedicated mercury removal systems such as the 746
Boliden-Norzink process (see Section 6.2), and sulfuric acid plants. Zhang et al (2016) provide a 747
detailed overview of these processes; Figure 4 presents a summary of these transformations 748
25
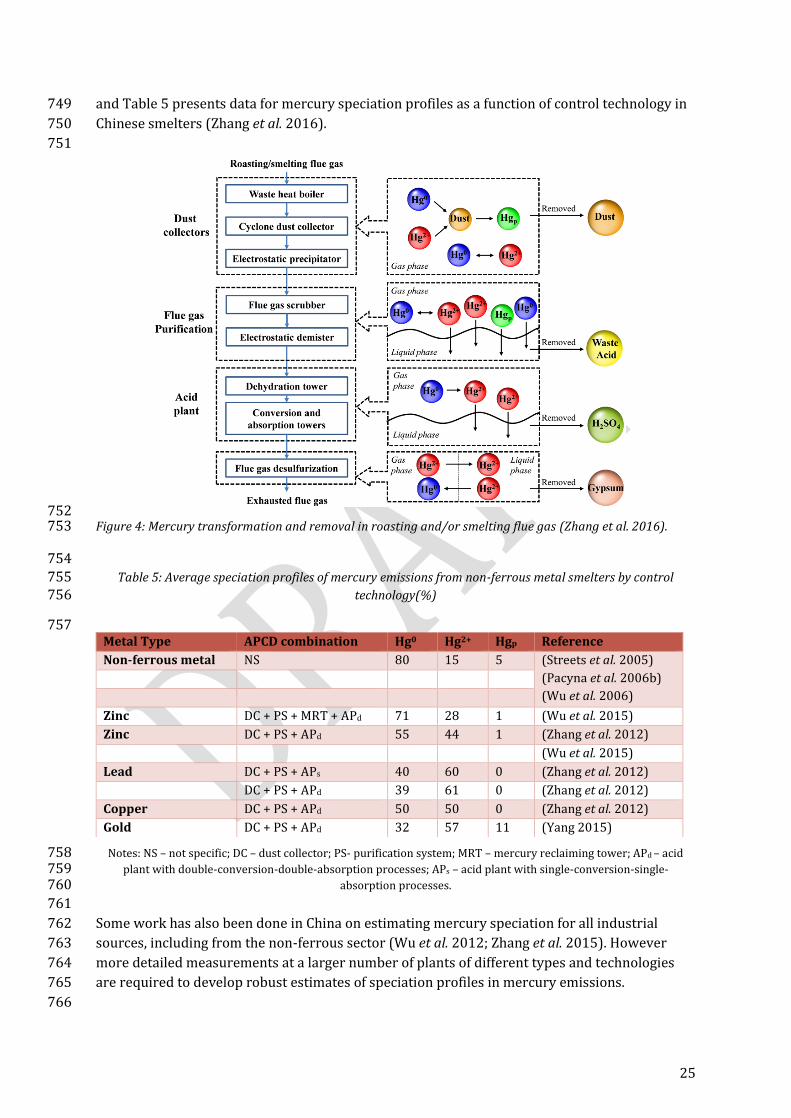
and Table 5 presents data for mercury speciation profiles as a function of control technology in 749
Chinese smelters (Zhang et al. 2016). 750
751
752 Figure 4: Mercury transformation and removal in roasting and/or smelting flue gas (Zhang et al. 2016). 753
754 Table 5: Average speciation profiles of mercury emissions from non-ferrous metal smelters by control 755
technology(%) 756
757
Notes: NS – not specific; DC – dust collector; PS- purification system; MRT – mercury reclaiming tower; APd – acid 758 plant with double-conversion-double-absorption processes; APs – acid plant with single-conversion-single-759
absorption processes. 760
761
Some work has also been done in China on estimating mercury speciation for all industrial 762
sources, including from the non-ferrous sector (Wu et al. 2012; Zhang et al. 2015). However 763
more detailed measurements at a larger number of plants of different types and technologies 764
are required to develop robust estimates of speciation profiles in mercury emissions. 765
766
Metal Type APCD combination Hg0 Hg2+ Hgp Reference
Non-ferrous metal NS 80 15 5 (Streets et al. 2005)
(Pacyna et al. 2006b)
(Wu et al. 2006)
Zinc DC + PS + MRT + APd 71 28 1 (Wu et al. 2015)
Zinc DC + PS + APd 55 44 1 (Zhang et al. 2012)
(Wu et al. 2015)
Lead DC + PS + APs 40 60 0 (Zhang et al. 2012)
DC + PS + APd 39 61 0 (Zhang et al. 2012)
Copper DC + PS + APd 50 50 0 (Zhang et al. 2012)
Gold DC + PS + APd 32 57 11 (Yang 2015)
26
5.2. Methodology for estimating emissions and releases from the non-ferrous sector – key 767
inputs and knowledge gaps 768
769
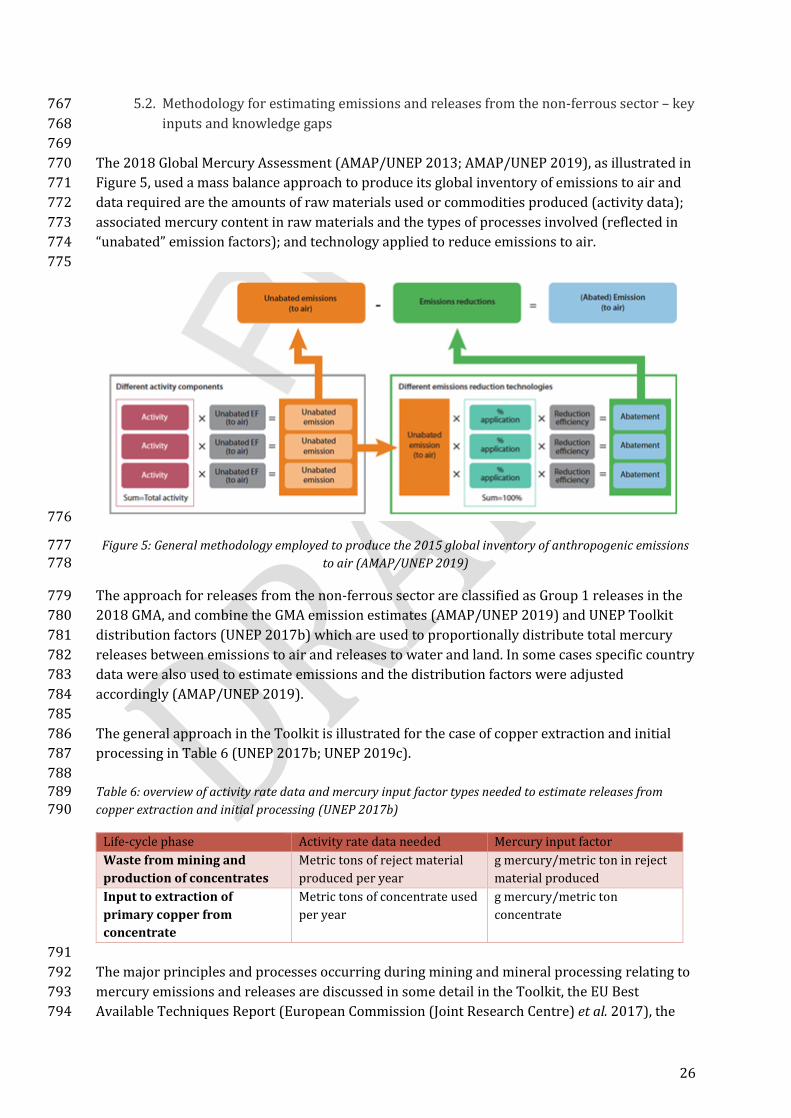
The 2018 Global Mercury Assessment (AMAP/UNEP 2013; AMAP/UNEP 2019), as illustrated in 770
Figure 5, used a mass balance approach to produce its global inventory of emissions to air and 771
data required are the amounts of raw materials used or commodities produced (activity data); 772
associated mercury content in raw materials and the types of processes involved (reflected in 773
“unabated” emission factors); and technology applied to reduce emissions to air. 774
775
776
Figure 5: General methodology employed to produce the 2015 global inventory of anthropogenic emissions 777 to air (AMAP/UNEP 2019) 778
The approach for releases from the non-ferrous sector are classified as Group 1 releases in the 779
2018 GMA, and combine the GMA emission estimates (AMAP/UNEP 2019) and UNEP Toolkit 780
distribution factors (UNEP 2017b) which are used to proportionally distribute total mercury 781
releases between emissions to air and releases to water and land. In some cases specific country 782
data were also used to estimate emissions and the distribution factors were adjusted 783
accordingly (AMAP/UNEP 2019). 784
785
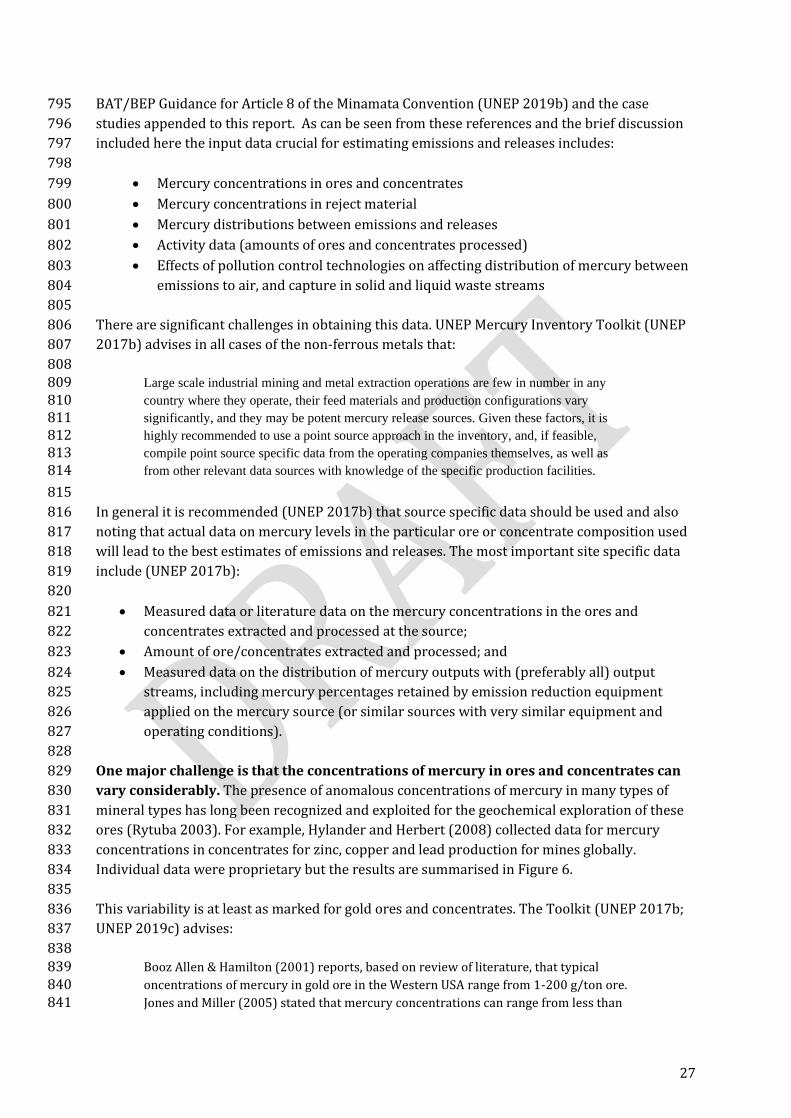
The general approach in the Toolkit is illustrated for the case of copper extraction and initial 786
processing in Table 6 (UNEP 2017b; UNEP 2019c). 787
788 Table 6: overview of activity rate data and mercury input factor types needed to estimate releases from 789 copper extraction and initial processing (UNEP 2017b) 790
Life-cycle phase Activity rate data needed Mercury input factor
Waste from mining and
production of concentrates
Metric tons of reject material
produced per year
g mercury/metric ton in reject
material produced
Input to extraction of
primary copper from
concentrate
Metric tons of concentrate used
per year
g mercury/metric ton
concentrate
791
The major principles and processes occurring during mining and mineral processing relating to 792
mercury emissions and releases are discussed in some detail in the Toolkit, the EU Best 793
Available Techniques Report (European Commission (Joint Research Centre) et al. 2017), the 794
27
BAT/BEP Guidance for Article 8 of the Minamata Convention (UNEP 2019b) and the case 795
studies appended to this report. As can be seen from these references and the brief discussion 796
included here the input data crucial for estimating emissions and releases includes: 797
798
• Mercury concentrations in ores and concentrates 799
• Mercury concentrations in reject material 800
• Mercury distributions between emissions and releases 801
• Activity data (amounts of ores and concentrates processed) 802
• Effects of pollution control technologies on affecting distribution of mercury between 803
emissions to air, and capture in solid and liquid waste streams 804
805
There are significant challenges in obtaining this data. UNEP Mercury Inventory Toolkit (UNEP 806
2017b) advises in all cases of the non-ferrous metals that: 807
808 Large scale industrial mining and metal extraction operations are few in number in any 809 country where they operate, their feed materials and production configurations vary 810 significantly, and they may be potent mercury release sources. Given these factors, it is 811 highly recommended to use a point source approach in the inventory, and, if feasible, 812 compile point source specific data from the operating companies themselves, as well as 813 from other relevant data sources with knowledge of the specific production facilities. 814
815
In general it is recommended (UNEP 2017b) that source specific data should be used and also 816
noting that actual data on mercury levels in the particular ore or concentrate composition used 817
will lead to the best estimates of emissions and releases. The most important site specific data 818
include (UNEP 2017b): 819
820
• Measured data or literature data on the mercury concentrations in the ores and 821
concentrates extracted and processed at the source; 822
• Amount of ore/concentrates extracted and processed; and 823
• Measured data on the distribution of mercury outputs with (preferably all) output 824
streams, including mercury percentages retained by emission reduction equipment 825
applied on the mercury source (or similar sources with very similar equipment and 826
operating conditions). 827
828
One major challenge is that the concentrations of mercury in ores and concentrates can 829
vary considerably. The presence of anomalous concentrations of mercury in many types of 830
mineral types has long been recognized and exploited for the geochemical exploration of these 831
ores (Rytuba 2003). For example, Hylander and Herbert (2008) collected data for mercury 832
concentrations in concentrates for zinc, copper and lead production for mines globally. 833
Individual data were proprietary but the results are summarised in Figure 6. 834
835
This variability is at least as marked for gold ores and concentrates. The Toolkit (UNEP 2017b; 836
UNEP 2019c) advises: 837
838 Booz Allen & Hamilton (2001) reports, based on review of literature, that typical 839 oncentrations of mercury in gold ore in the Western USA range from 1-200 g/ton ore. 840 Jones and Miller (2005) stated that mercury concentrations can range from less than 841
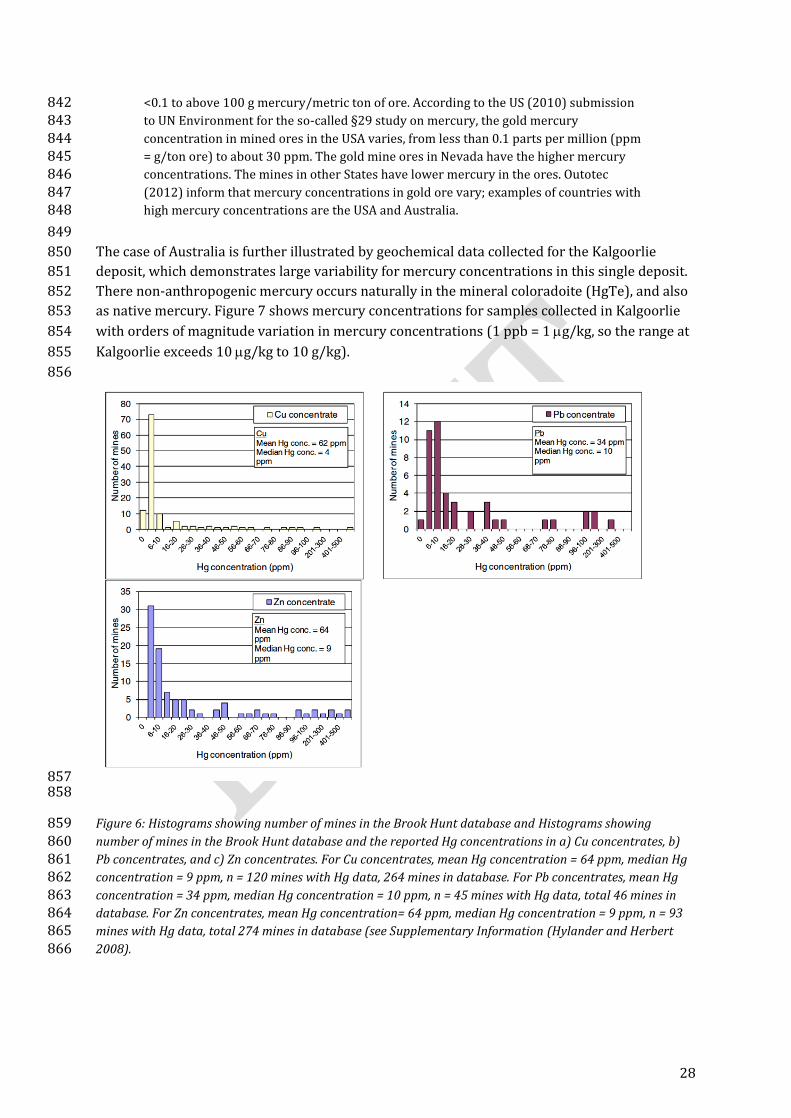
28
<0.1 to above 100 g mercury/metric ton of ore. According to the US (2010) submission 842 to UN Environment for the so-called §29 study on mercury, the gold mercury 843 concentration in mined ores in the USA varies, from less than 0.1 parts per million (ppm 844 = g/ton ore) to about 30 ppm. The gold mine ores in Nevada have the higher mercury 845 concentrations. The mines in other States have lower mercury in the ores. Outotec 846 (2012) inform that mercury concentrations in gold ore vary; examples of countries with 847 high mercury concentrations are the USA and Australia. 848
849
The case of Australia is further illustrated by geochemical data collected for the Kalgoorlie 850
deposit, which demonstrates large variability for mercury concentrations in this single deposit. 851
There non-anthropogenic mercury occurs naturally in the mineral coloradoite (HgTe), and also 852
as native mercury. Figure 7 shows mercury concentrations for samples collected in Kalgoorlie 853
with orders of magnitude variation in mercury concentrations (1 ppb = 1 g/kg, so the range at 854
Kalgoorlie exceeds 10 g/kg to 10 g/kg). 855
856
857 858
Figure 6: Histograms showing number of mines in the Brook Hunt database and Histograms showing 859 number of mines in the Brook Hunt database and the reported Hg concentrations in a) Cu concentrates, b) 860 Pb concentrates, and c) Zn concentrates. For Cu concentrates, mean Hg concentration = 64 ppm, median Hg 861 concentration = 9 ppm, n = 120 mines with Hg data, 264 mines in database. For Pb concentrates, mean Hg 862 concentration = 34 ppm, median Hg concentration = 10 ppm, n = 45 mines with Hg data, total 46 mines in 863 database. For Zn concentrates, mean Hg concentration= 64 ppm, median Hg concentration = 9 ppm, n = 93 864 mines with Hg data, total 274 mines in database (see Supplementary Information (Hylander and Herbert 865 2008). 866
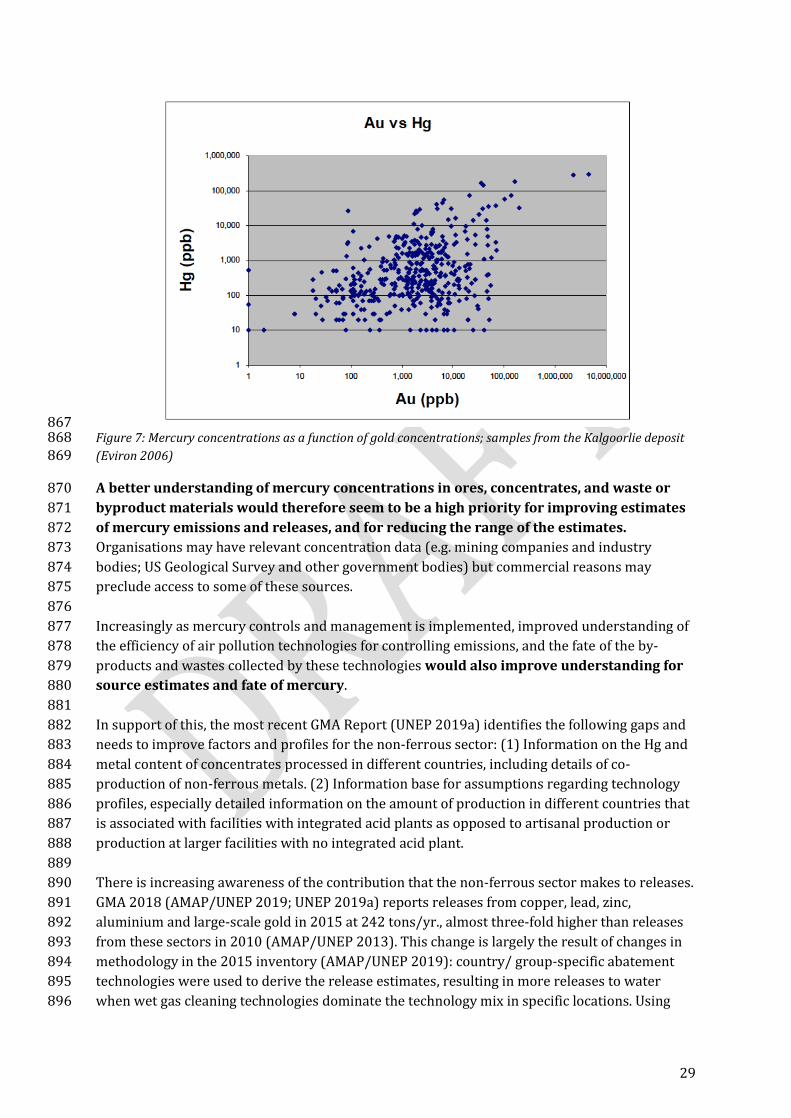
29
867 Figure 7: Mercury concentrations as a function of gold concentrations; samples from the Kalgoorlie deposit 868 (Eviron 2006) 869
A better understanding of mercury concentrations in ores, concentrates, and waste or 870
byproduct materials would therefore seem to be a high priority for improving estimates 871
of mercury emissions and releases, and for reducing the range of the estimates. 872
Organisations may have relevant concentration data (e.g. mining companies and industry 873
bodies; US Geological Survey and other government bodies) but commercial reasons may 874
preclude access to some of these sources. 875
876
Increasingly as mercury controls and management is implemented, improved understanding of 877
the efficiency of air pollution technologies for controlling emissions, and the fate of the by-878
products and wastes collected by these technologies would also improve understanding for 879
source estimates and fate of mercury. 880
881
In support of this, the most recent GMA Report (UNEP 2019a) identifies the following gaps and 882
needs to improve factors and profiles for the non-ferrous sector: (1) Information on the Hg and 883
metal content of concentrates processed in different countries, including details of co-884
production of non-ferrous metals. (2) Information base for assumptions regarding technology 885
profiles, especially detailed information on the amount of production in different countries that 886
is associated with facilities with integrated acid plants as opposed to artisanal production or 887
production at larger facilities with no integrated acid plant. 888
889
There is increasing awareness of the contribution that the non-ferrous sector makes to releases. 890
GMA 2018 (AMAP/UNEP 2019; UNEP 2019a) reports releases from copper, lead, zinc, 891
aluminium and large-scale gold in 2015 at 242 tons/yr., almost three-fold higher than releases 892
from these sectors in 2010 (AMAP/UNEP 2013). This change is largely the result of changes in 893
methodology in the 2015 inventory (AMAP/UNEP 2019): country/ group-specific abatement 894
technologies were used to derive the release estimates, resulting in more releases to water 895
when wet gas cleaning technologies dominate the technology mix in specific locations. Using 896
30
this new approach, the largest releases are associated with zinc production mostly in East and 897
Southeast Asia (58%), followed by large scale gold (25%), copper (8%) and aluminium (5%). 898
899
5.3. The impact of global trade in concentrates on the location of mercury emissions and 900
releases 901
902
Ores in the non-ferrous sector (apart from gold deposits) are commonly converted to 903
concentrates before smelting or roasting. The smelting or roasting may take place on the same 904
site or the concentrates may be transported to other places (including in other countries). 905
In some cases, the produced concentrate is transported to extraction plants, which may be 906
receiving concentrate from mines nearby, but also from the global market. For example, 907
historically (Environment Canada 2002) some plants in Canada received mainly concentrate 908
from local mines, while large parts of the concentrate processed in European zinc production 909
plants have been imported from the global market (European Commission (Joint Research 910
Centre) et al. 2017; UNEP 2017b). Similarly concentrates may be shipped long distances for 911
smelting in China (Wu et al. 2016b). 912
913
This is a potential knowledge gap in the location of mercury emissions which will have impacts 914
on country based inventories, and also on the modelling of mercury transport and deposition on 915
local and global scales. 916
917
Releases of mercury are similarly complex. Waste material from the initial mining and 918
concentrate producing operations may result in releases locally, but processing of the 919
concentrates at the receptor location will also potentially contribute to releases from waste and 920
by-products. 921
922
(Further input is invited to complement this section). 923
6. CONTROL OF MERCURY EMISSIONS AND RELEASES 924
925
Extensive work has been undertaken in the context of the Minamata Convention to identify the 926
best practices available in the management of metal production. Many of the practices are 927
common with other sectors of industry and the equipment used to control emissions should be 928
readily available in many countries. This work draws on many years of research and 929
development and highly efficient commercial processes are now available to minimize 930
emissions. For example, the USEPA Mercury Report to Congress reviews developments 931
available at its time of publication (USEPA 1997b). 932
933
More recently the European Commission and the Expert Group dealing with Article 8 of the 934
Minamata Convention have produced comprehensive reports on Best Available Technology/ 935
Best Environmental Practices (BAT/BEP) for the non-ferrous sector (UNECE 2013; European 936
Commission (Joint Research Centre) et al. 2017; UNEP 2019b) which include detailed process 937
descriptions and BAT/BEP approaches. 938
939
31
The NRDC report (Zhang et al. 2019) provides a detailed overview of pollution control options 940
and costs for Chinese smelters, and the Swedish Environmental Protection Agency has 941
undertaken a baseline study (Gustafsson et al. 2013) for the non-ferrous metal industry in 942
China. 943
944
The UNEP Toolkit (UNEP 2017b; UNEP 2019c) also provides some detailed background 945
discussion on mineral processing and control measures. 946
947
The process flow diagrams presented in Figure 1 and Figure 2 illustrate the complexities of the 948
mineral processing systems employed for the non-ferrous sector, and the reader is referred to 949
the references for BAT/BEP given above to obtain more detail on the control processes 950
employed. In this report some brief general comments are provided in Section 6.2. 951
952
With respect to releases to land and water as well as waste, BAT/BEP approaches are less well 953
developed globally, although the Toolkit (UNEP 2017b; UNEP 2019c) provides useful discussion 954
and the European Commission Report (European Commission (Joint Research Centre) et al. 955
2017) includes approaches to the management of wastewater and other waste streams. 956
957
This issue is also currently under discussion in the Minamata Convention Experts Group on 958
releases as discussed above27. The work program27 of this group of technical experts includes 959
the proposed categories of point sources of releases and a road map for the development of 960
guidance on best available techniques and best environmental practices. The Basel Convention 961
also adopted guidelines for the environmentally sound management of wastes consisting of 962
elemental mercury and wastes containing or contaminated with mercury28. 963
964
Information on the removal of mercury from sulfur-containing gases in order to produce 965
sulfuric acid is available on the website “Sulphuric Acid on the WebTM” which has been 966
developed by DKL Engineering. 967
968
6.1. Process Descriptions 969
970
Detailed general descriptions of the processes used for the metals included in Annex D of the 971
Minamata Convention (Lead, Zinc, Copper and Industrial Gold) are given in the Convention 972
BAT/BEP guidance document for Article 8 (UNEP 2019b). Figure 1 and Figure 2 give examples 973
of process flows for gold and zinc processing, and considerably more detail of processing is 974
given in the European Commission BAT/BEP report for the non-ferrous sector (European 975
Commission (Joint Research Centre) et al. 2017). 976
977
6.2. Emission Control Techniques 978
979
In the following sections the major mercury air emission abatement techniques relevant to the 980
non-ferrous roasting and smelting and refining sector are briefly described (these descriptions 981
27 http://www.mercuryconvention.org/Meetings/Intersessionalwork/tabid/8279/language/en-US/Default.aspx 28 http://www.basel.int/Implementation/MercuryWastes/TechnicalGuidelines/tabid/5159/Default.aspx
32
are drawn from the Article 8 BAT/BEP Guidance document (UNEP 2019b), and further details 982
can be found there). In general, these rely on some form of mercury oxidation and interactions 983
with materials such as mercury(II) chloride. 984
985
6.2.1. Boliden Norzink Process 986
987
The Boliden Norzink process (also called the Outotec chloride scrubber process or the Outotec 988
BN process) removes elemental mercury from waste gases of primary ore smelters by 989
converting mercury into mercury(I) chloride, Hg2Cl2 (also known as “calomel”). Calomel results 990
from the reaction of mercury with mercury(II) chloride, HgCl2. Mercury(II) chloride is then 991
recovered from some of the calomel by oxidation with chlorine and returned to the gas-cleaning 992
process. 993
994
Removal efficiency depends on the mercury content of the waste gas inlet and is typically 99.7 995
per cent. Typical mercury outlet concentration is 0.3–0.5 ppm (UNEP 2019b). 996
997
The calomel can be disposed of or used for elemental mercury production. This process like 998
other gas cleaning technologies reduces emissions to air but increases the generation of 999
mercury waste which in turn will require environmentally sound management or by-products 1000
requiring use, storage or disposal. 1001
1002
6.2.2. Selenium Filter 1003
1004
The selenium filter process removes low elemental mercury content from waste gases of 1005
primary ore smelters by converting selenious acid into red amorphous selenium, reacting with 1006
gaseous mercury to form mercury(II) selenide. The selenium filter is a fixed bed filter with a 1007
large surface area, designed to achieve an intimate contact with the active substance. A porous 1008
inert material similar to a catalyst support is used. 1009
1010
The red amorphous selenium reacts with the mercury in the gas to form mercury(II) selenide: 1011
Se + Hg0 => HgSe 1012
The selenium filter can produce virtually mercury-free waste gases from smelters. It can also be 1013
applied as a second waste gas treatment step to lower the mercury content before the gas 1014
enters a subsequent acid plant producing mercury-free acids. There are potential impacts on air 1015
and water due to vaporization of elemental or oxidized mercury from the production of solid 1016
mercury(II) selenide waste. The waste needs to be stabilized before further treatment. 1017
1018
6.2.3. Activated Carbon 1019
1020
Sulfur-impregnated activated carbon is a proven technology for removing pollutant gases from 1021
process streams in many contexts. In the case of the non-ferrous sector it is widely used in the 1022
industrial gold sector to control mercury air emissions. Activated carbon can be applied in 1023
either a fixed bed setting or through carbon injection. Mercury contained within the gaseous 1024
emissions reacts with the sulfur-impregnated carbon as it passes through the bed, forming 1025
mercury(II) sulfide (HgS). Activated carbon has the advantage of removing all types of mercury 1026
33
air emissions, including oxidized, particle-bound and elemental mercury. Spent mercury-loaded 1027
sulfur-impregnated carbon may require disposal as hazardous waste. 1028
1029
6.2.4. DOWA filter process 1030
1031
The lead(II) sulfide process is a dry media technique used to remove mercury from flue gases 1032
generated in non-ferrous metal smelters. The gases containing volatile mercury are passed 1033
through a tower packed with lead-sulfide-coated balls, such as granulated pumice, to make the 1034
gas contact effectively. Mercury, which has a high vapour pressure, is converted into its sulfide, 1035
which shows a very low vapour pressure, by contacting the gas with lead(II) sulfide. For the 1036
lead(II) sulfide process, a mercury removal efficiency of 99 per cent has been measured, 1037
resulting in mercury emission concentrations of 0.01-0.05 mg/Nm3. 1038
1039
6.2.5. Co-benefits of air pollution abatement technologies 1040
1041
Both wet and dry electrostatic precipitators (ESPs) are widely used in the non-ferrous metals 1042
sector as a primary stage of particulate matter removal. In dry ESPs, the dust that collects on the 1043
charged plates is removed by rapping or vibration. The dust is usually recycled in the smelter 1044
process. The use of bag filters is also common in the non-ferrous metals sector, as this technique 1045
provides the highest collection efficiency among the particulate control methods. 1046
1047
The non-ferrous metals sector regularly uses wet scrubbers, such as for cooling gases and 1048
removing particulate matter and impurities such as SO3, HCl and HF as part of the gas cleaning 1049
process prior to sulfuric acid production. 1050
1051
ESPs, bag filters and scrubbers are all effective at removing mercury from gas streams. 1052
1053
6.2.6. Acid plants in mercury control 1054
1055
The combination of gas cleaning equipment with sulfuric acid plants is a proven technology for 1056
sulfur emissions control in the non-ferrous metals industry and its use is common worldwide. A 1057
compilation of information29 on mercury removal systems from off gas cleaning systems in 1058
smelters is available. 1059
1060
Under certain conditions, operation of an acid plant with gas cleaning equipment has also been 1061
shown to be effective in capturing mercury from the gas stream through the use of traditional 1062
particulate matter control techniques that result in mercury removal efficiencies equivalent to 1063
the use of specific mercury BAT. A recent survey completed in Japan has shown that many 1064
companies are successfully relying on gas cleaning and sulfuric acid plants to remove the 1065
mercury from the flue gases in metal smelting facilities. The survey shows that mercury is being 1066
effectively captured with the use of this method at certain copper, lead and zinc smelters30. 1067
1068
29 http://www.sulphuricacid.com/techmanual/GasCleaning/gcl_hg.htm
30 [JMIA bulletin “Kozan (http://www.mmf.or.jp/) ” for the April 2015] Takashi Shimizu: Mercury Removal from the Nonferrous Smelter’s Off-gas in Japan.
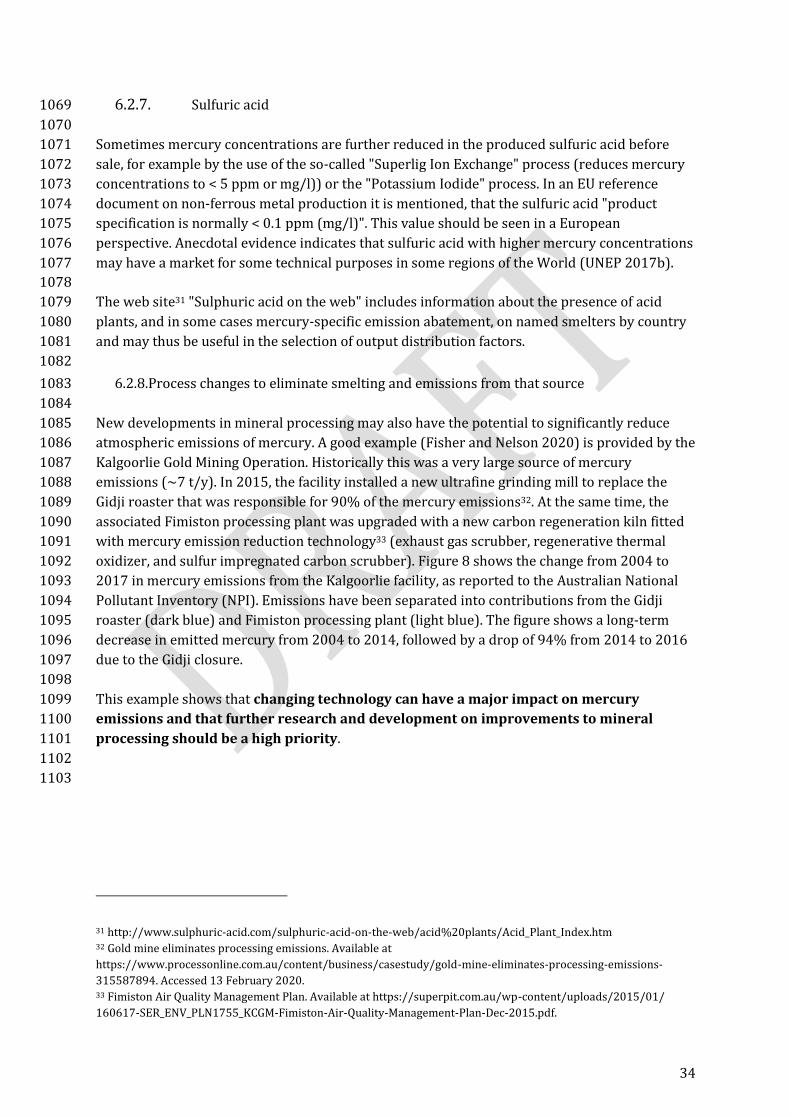
34
6.2.7. Sulfuric acid 1069
1070
Sometimes mercury concentrations are further reduced in the produced sulfuric acid before 1071
sale, for example by the use of the so-called "Superlig Ion Exchange" process (reduces mercury 1072
concentrations to < 5 ppm or mg/l)) or the "Potassium Iodide" process. In an EU reference 1073
document on non-ferrous metal production it is mentioned, that the sulfuric acid "product 1074
specification is normally < 0.1 ppm (mg/l)". This value should be seen in a European 1075
perspective. Anecdotal evidence indicates that sulfuric acid with higher mercury concentrations 1076
may have a market for some technical purposes in some regions of the World (UNEP 2017b). 1077
1078
The web site31 "Sulphuric acid on the web" includes information about the presence of acid 1079
plants, and in some cases mercury-specific emission abatement, on named smelters by country 1080
and may thus be useful in the selection of output distribution factors. 1081
1082
6.2.8. Process changes to eliminate smelting and emissions from that source 1083
1084
New developments in mineral processing may also have the potential to significantly reduce 1085
atmospheric emissions of mercury. A good example (Fisher and Nelson 2020) is provided by the 1086
Kalgoorlie Gold Mining Operation. Historically this was a very large source of mercury 1087
emissions (~7 t/y). In 2015, the facility installed a new ultrafine grinding mill to replace the 1088
Gidji roaster that was responsible for 90% of the mercury emissions32. At the same time, the 1089
associated Fimiston processing plant was upgraded with a new carbon regeneration kiln fitted 1090
with mercury emission reduction technology33 (exhaust gas scrubber, regenerative thermal 1091
oxidizer, and sulfur impregnated carbon scrubber). Figure 8 shows the change from 2004 to 1092
2017 in mercury emissions from the Kalgoorlie facility, as reported to the Australian National 1093
Pollutant Inventory (NPI). Emissions have been separated into contributions from the Gidji 1094
roaster (dark blue) and Fimiston processing plant (light blue). The figure shows a long-term 1095
decrease in emitted mercury from 2004 to 2014, followed by a drop of 94% from 2014 to 2016 1096
due to the Gidji closure. 1097
1098
This example shows that changing technology can have a major impact on mercury 1099
emissions and that further research and development on improvements to mineral 1100
processing should be a high priority. 1101
1102
1103
31 http://www.sulphuric-acid.com/sulphuric-acid-on-the-web/acid%20plants/Acid_Plant_Index.htm 32 Gold mine eliminates processing emissions. Available at
https://www.processonline.com.au/content/business/casestudy/gold-mine-eliminates-processing-emissions-
315587894. Accessed 13 February 2020. 33 Fimiston Air Quality Management Plan. Available at https://superpit.com.au/wp-content/uploads/2015/01/
160617-SER_ENV_PLN1755_KCGM-Fimiston-Air-Quality-Management-Plan-Dec-2015.pdf.
35
1104 1105
Figure 8: Trend in mercury emissions from gold processing in Kalgoorlie. 2004–2017 NPI-reported mercury 1106 emissions (kg yr–1) from the Kalgoorlie Consolidated Gold Mines, showing contributions from the Gidji 1107
roaster (dark blue) and the Fimiston processing plant (light blue). Note that emissions are reported to NPI 1108 on a July–June financial year basis; in the figure, the year given on the x-axis corresponds to the year for the 1109
start of the reporting period (e.g., “2004” refers to July 2004–June 2005). 1110 DOI:https://doi.org/10.1525/elementa.2020.070.f2 1111
From (Fisher and Nelson 2020). 1112
1113
6.3. Smelter/ roasting waste and by-product management and releases to land and water 1114
1115
The UNEP BAT/BEP guidance does not discuss these issues in detail but there are two recent 1116
studies from China which provide detailed information (Tsinghua University 2019; Zhang et al. 1117
2019) for specific plants in China and for the Chinese non-ferrous sector more broadly. See 1118
Section 4.2 for discussion of these studies. 1119
1120
The most comprehensive review of techniques to control releases from the non-ferrous sector 1121
to water and land, and to manage residues is given in Sections 2.8 and 2.9 of the EU Best 1122
available techniques (BAT) reference document for the non-ferrous metals industries. Industrial 1123
Emissions Directive 2010/75/EU (integrated pollution prevention and control) (European 1124
Commission (Joint Research Centre) et al. 2017). The production of non-ferrous metals by 1125
pyrometallurgical and hydrometallurgical methods is associated with the generation of different liquid 1126
effluents. The main sources of the most important effluent streams can be classified as shown in 1127
Figure 9. Standard water treatment techniques are used to treat these effluents to remove toxic metals 1128
including mercury. 1129
1130
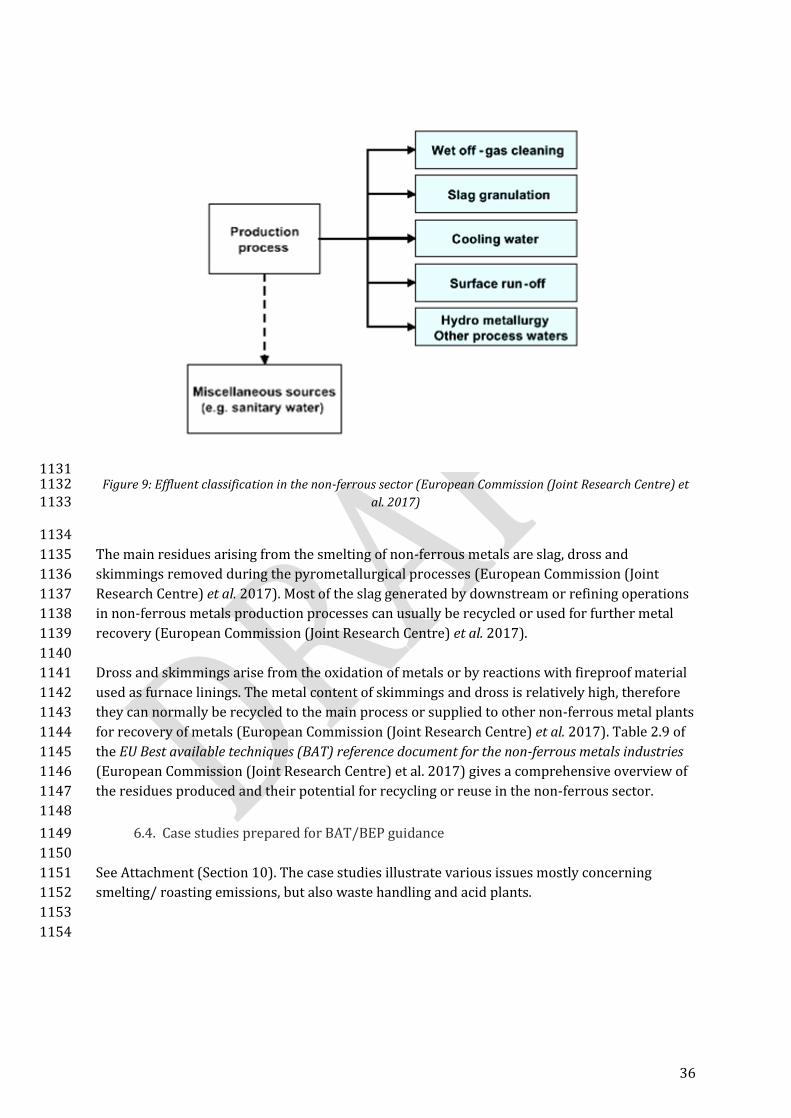
36
1131 Figure 9: Effluent classification in the non-ferrous sector (European Commission (Joint Research Centre) et 1132
al. 2017) 1133
1134
The main residues arising from the smelting of non-ferrous metals are slag, dross and 1135
skimmings removed during the pyrometallurgical processes (European Commission (Joint 1136
Research Centre) et al. 2017). Most of the slag generated by downstream or refining operations 1137
in non-ferrous metals production processes can usually be recycled or used for further metal 1138
recovery (European Commission (Joint Research Centre) et al. 2017). 1139
1140
Dross and skimmings arise from the oxidation of metals or by reactions with fireproof material 1141
used as furnace linings. The metal content of skimmings and dross is relatively high, therefore 1142
they can normally be recycled to the main process or supplied to other non-ferrous metal plants 1143
for recovery of metals (European Commission (Joint Research Centre) et al. 2017). Table 2.9 of 1144
the EU Best available techniques (BAT) reference document for the non-ferrous metals industries 1145
(European Commission (Joint Research Centre) et al. 2017) gives a comprehensive overview of 1146
the residues produced and their potential for recycling or reuse in the non-ferrous sector. 1147
1148
6.4. Case studies prepared for BAT/BEP guidance 1149
1150
See Attachment (Section 10). The case studies illustrate various issues mostly concerning 1151
smelting/ roasting emissions, but also waste handling and acid plants. 1152
1153
1154
37
7. MAJOR CONCLUSIONS AND IDENTIFIED NEEDS FOR FURTHER 1155
INVESTIGATION, RESEARCH AND COOPERATION 1156
1157
The present Study Report has been prepared for the Global Mercury Partnership on the 1158
issue of mercury in the non-ferrous sector. 1159
1160
The report was compiled from expert consultations, and open access sources of 1161
information, and presents a critical review of existing knowledge and information gaps 1162
concerning mercury from the non-ferrous sector, a showcase of the different reduction 1163
methods, and suggestions for further work including capacity development. 1164
1165
Non-ferrous metals are all metals apart from iron. The emphasis on this report is on copper, 1166
lead, zinc and large-scale gold which all have significant emissions and releases of mercury 1167
and are included in the Minamata Convention. It does not include consideration of the 1168
primary mining of mercury, or the use of mercury in artisanal and small-scale gold mining 1169
(ASGM). Currently the metals included in the Convention make the largest contributions to 1170
mercury emissions and releases, but this could change in the future as new products are 1171
developed. 1172
1173
Mining of non-ferrous ores does not make a major direct contribution to emissions and 1174
releases but mining spoil piles, tailings and stockpiles may result in releases to land and 1175
water. 1176
1177
The impact of deep-sea mining on mercury releases may require assessment. 1178
1179
Non-ferrous metal production is a large anthropogenic source of mercury emissions and 1180
estimated to account for around 10-15 per cent of global mercury emissions to the 1181
atmosphere (the third largest source of mercury emissions to air). 1182
1183
It is also the largest source of mercury releases to water after ASGM, responsible for 1184
roughly 40% of total releases to water. 1185
1186
Non-ferrous metals contribute large quantities of mercury to the land, waste production 1187
and storage; although these quantities are not as well understood it is probable based on 1188
existing estimates that they exceed emissions and releases to water. 1189
1190
Detailed measurements using mass balance techniques on smelters in China and Korea 1191
have quantified mercury fluxes in air emissions, land and water releases and waste 1192
materials; in some cases ~90% of the mercury deports to the waste. Additional 1193
quantitative information on how mercury partitions to emissions/ releases and wastes 1194
and by-products is needed. 1195
1196
A great deal remains unknown about this last pathway of mercury pollution, making it an 1197
important subject for future study. 1198
1199
38
The 2018 AMAP/UNEP Global Mercury Assessment report noted that estimates from non-1200
ferrous metals production had large uncertainties, with a range extending from 154 to 338 1201
tonnes/year for primary total emissions of aluminium, copper, lead, and zinc; and 72-97 1202
tonnes/year for large scale gold production. 1203
1204
Further work to reduce these uncertainties would improve understanding of this major 1205
source and assist global efforts to reduce the contribution from this sector. The data 1206
required to achieve this include: 1207
1208
• the need for more information on the mercury content in ores and concentrates, 1209
including at plant and country level 1210
• Mercury concentrations in reject material 1211
• Mercury distributions between emissions and releases 1212
• Activity data (amounts of ores and concentrates processed) 1213
• Effects of pollution control technologies on affecting distribution of mercury 1214
between emissions to air, and capture in solid and liquid waste streams. 1215
1216
One major challenge is that the concentrations of mercury in ores and concentrates can 1217
vary considerably not only between different ore bodies but also in the same ore body 1218
depending on its geological associations. 1219
1220
These variations need to better understood, and standard methods of ore sampling and 1221
analysis applied to determine mercury content in specific ores. 1222
1223
By-product mercury recovery from non-ferrous mining and processing operations is an 1224
important source of global mercury supply, estimated at about 15% in the 2017 UNEP 1225
Global Mercury Supply, Trade and Demand report. 1226
1227
Many countries generate by-product mercury but not all makes its way to market. 1228
Restrictions on mercury export (e.g. in the United States and Europe) reduce this source of 1229
supply but the available data is incomplete and should be enhanced. 1230
1231
Companies are increasingly treating by product mercury as waste and managing it by using 1232
long term secure storage facilities or permitted disposal facilities. 1233
1234
Given this, development of effective and sustainable regional solutions to secure sufficient 1235
capacity for the safe and long-term storage of mercury is a high priority. Innovative 1236
methods for the secure storage of mercury would also assist management of mercury by-1237
products and mercury containing wastes. 1238
1239
The non-ferrous sector is likely to grow considerably in the future as additional uses grow 1240
in infrastructure and devices. 1241
1242
Production of metals requires a long-term commitment to increased recycling and reuse. 1243
1244
There are geographical complexities to mercury flows in the non-ferrous sector. Mining 1245
and the initial production of concentrates may take place in one country but emissions 1246
39
and releases from concentrate processing in another. In addition, emissions from non-1247
ferrous metal production have been estimated to be effectively traded internationally, 1248
primarily as exports from emerging economies to wealthy economies through global 1249
supply chains. 1250
1251
Understanding the redistribution of mercury along global supply chains should be 1252
explored for its potential to facilitate international efforts to reduce mercury emissions 1253
and releases from non-ferrous metal production 1254
1255
Mercury speciation as elemental mercury (Hg0), oxidized mercury (Hg2+), or particulate 1256
mercury (Hgp) is important for determining mercury fate in the atmosphere, water, soils 1257
and vegetation. Improved knowledge of the forms of mercury in emissions and releases is 1258
crucial for modelling mercury transport and fate. 1259
1260
Recent work done in China on estimating mercury speciation for all industrial sources has 1261
enhanced understanding of speciation from the non-ferrous sector but more detailed 1262
measurements at a larger number of plants of different types and technologies are 1263
required to develop robust estimates of speciation profiles in mercury emissions. 1264
1265
Control techniques for mercury emissions to air from smelting are mature technologies 1266
but result in a re-partitioning of mercury from the air to by-products and waste which 1267
must be managed in an environmentally sound manner. 1268
1269
Control measures may involve mercury capture in the air pollution control devices 1270
associated with the sulfuric acid plants employed at smelters. 1271
1272
Standards for the levels of mercury in sulfuric acid may need to be established at national 1273
levels 1274
1275
Changing technology can have a major impact on mercury emissions and further research 1276
and development on improvements to mineral processing should be a high priority. 1277
1278
Capacity Development 1279
• A large number of countries are concerned about the fate of mercury and other 1280
impurities released during the mining and smelting of copper, lead and zinc, which 1281
belong to the top 5 largest internationally traded commodities 1282
• Large scale gold production is also a significant contributor to emissions and 1283
releases 1284
• Mineral deposits are increasingly being developed in South America, Africa and 1285
Asia and there will be a need further dissemination of information and awareness-1286
raising on existing best practices and case studies on the issue of mercury in the 1287
sector, mercury removal systems, including from off-gas cleaning systems in 1288
smelters, risks mitigation measures as well as options for environmentally sound 1289
interim storage and disposal of mercury (Sections 4.2, 5.1, 5.2, 6 and 10 (the case 1290
studies) address this). 1291
1292 1293
40
8. GUIDANCE ON BEST PRACTICES 1294
1295
8.1. Available guidance, tools and resources: 1296
1297
• The guidance document on Best Available Techniques and Best Environmental Practices 1298
adopted under the Minamata Convention34, which addresses the control options for 1299
mercury from smelting and roasting processes used in the production of non-ferrous 1300
metals (lead, zinc, copper and industrial gold); 1301
• EU Best available techniques (BAT) reference document for the non-ferrous metals 1302
industries (European Commission (Joint Research Centre) et al. 2017)35 1303
• The Basel Convention technical guidelines for the environmentally sound management 1304
of wastes consisting of elemental mercury and wastes containing or contaminated with 1305
mercury36, which is currently being updated; 1306
• The Minamata Convention guidelines on the environmentally sound interim storage of 1307
mercury other than waste mercury37; 1308
• The “Catalogue of Technologies and Services on Mercury Waste Management - 2020 1309
version” compiled by the leads of the Partnership area on mercury waste management, 1310
which highlights services provided by some partners of relevance to the sector38. 1311
• The development of a study for the German Environment Agency with mass balances for 1312
the national copper, lead, zinc (primary and secondary) industries, among others, which 1313
is expected to be published during the summer 2020. 1314
1315
34 http://mercuryconvention.org/Portals/11/documents/publications/BAT_BEP_E_interractif.pdf 35 https://op.europa.eu/en/publication-detail/-/publication/c0bc6046-651c-11e7-b2f2-01aa75ed71a1 36 http://www.basel.int/Implementation/MercuryWastes/TechnicalGuidelines/tabid/5159/Default.aspx 37 http://mercuryconvention.org/Portals/11/documents/formsguidance/English/2_5_e_Rev1_storage.pdf 38 https://web.unep.org/globalmercurypartnership/catalogue-technologies-and-services-mercury-waste-
management-2020-version
41
9. REFERENCES AND BIBLIOGRAPHY 1316
1317
AMAP/UNEP (2008). Technical Background Report to the Global Atmospheric Mercury 1318 Assessment, Arctic Monitoring and Assessment Programme/ UNEP Chemicals Branch, 1319 159 pp. 1320 http://www.chem.unep.ch/mercury/Atmospheric_Emissions/Technical_background_re1321 port.pdf; accessed 8th January 2009 1322
AMAP/UNEP (2013). Technical Background Report for the Global Mercury Assessment 2013, 1323 Arctic Monitoring and Assessment Programme/ UNEP Chemicals Branch, vi + 263pp. 1324
AMAP/UNEP (2019). Technical Background Report for the Global Mercury Assessment 2018., 1325 viii + 426 pp including E-Annexespp. 1326 https://web.unep.org/globalmercurypartnership/global-mercury-assessment-2018 1327
Amos, H. M., Jacob, D. J., Streets, D. G., Sunderland, E. M., 2013. Legacy impacts of all-time 1328 anthropogenic emissions on the global mercury cycle. Global Biogeochemical Cycles 27, 1329 410-421. 1330
Beckers, F., Rinklebe, J., 2017. Cycling of mercury in the environment: Sources, fate, and human 1331 health implications: A review. Critical Reviews in Environmental Science and 1332 Technology 47, 693-794. 1333
Bell, L., DiGangi, J., Weinberg, J. (2014). An NGO Introduction to Mercury pollution and the 1334 Minamata Convention on Mercury, International POPs Elimination Network (IPEN), 1335 214pp. https://ipen.org/documents/ngo-introduction-mercury-pollution-and-1336 minamata-convention-mercury 1337
Burton, M. E. H., Evers, D. C. (2019). Global Mercury Inventory Synthesis: An Initial Examination 1338 of the MIA Mercury Inventories. Portland, Maine, Biodiversity Research Institute., pp. 1339 https://www.briloon.org/uploads/BRI_Documents/Mercury_Center/UNEP%20Projects1340 /2019/Global%20Hg%20Synthesis%20Technical%20Report%2012-23-19.pdf 1341
Canadian Council of Ministers of the Environment (2000). Canada-wide standards for mercury 1342 emissions, 13pp. 1343 http://www.ccme.ca/files/Resources/air/mercury/mercury_emis_std_e1.pdf 1344
Chung, D., Choi, H.-H., Yoo, H.-Y., Lee, J.-Y., Shin, S.-K., Park, J. M., Kim, J., 2017. Mercury flows in a 1345 zinc smelting facility in South Korea. Journal of Material Cycles and Waste Management 1346 19, 46-54. 1347
Driscoll, C. T., Mason, R. P., Chan, H. M., Jacob, D. J., Pirrone, N., 2013. Mercury as a Global 1348 Pollutant: Sources, Pathways, and Effects. Environmental Science & Technology 47, 1349 4967-4983. 1350
Elshkaki, A., Graedel, T. E., Ciacci, L., Reck, B. K., 2018. Resource Demand Scenarios for the Major 1351 Metals. Environmental Science & Technology 52, 2491-2497. 1352
Environment Canada (2002). Multi-pollutant emission reduction analysis foundation (MERAF) 1353 for the base metal smelter sector. Prepared for Environment Canada and The Canadian 1354 Council of Ministers of Environment (CCME), Canada, Environment Canada, Minerals 1355 and Metals Division, National Office of Pollution Prevention, pp. 1356 https://www.ec.gc.ca/planp2-p2plan/default.asp?lang=En&n=4AE8C344-1357 1&offset=1&toc=hide. Accessed 20 January 2021 1358
European Commission (Joint Research Centre), Delgado Sancho, L., Roudier, S., Farrell, F., 1359 Cusano, G., Rodrigo Gonzalo, M. (2017). Best available techniques (BAT) reference 1360 document for the non-ferrous metals industries. Industrial Emissions Directive 1361 2010/75/EU (integrated pollution prevention and control), European Union, 1233pp. 1362 https://op.europa.eu/en/publication-detail/-/publication/c0bc6046-651c-11e7-b2f2-1363 01aa75ed71a1 1364
Eviron (2006). Public Environmental Review Fimiston Gold Mine Operations Extension (Stage 1365 3) and Mine Closure Planning for KCGM Pty Ltd. Appendix F1: Distribution of Tellurides 1366 and Mercury in Fimiston Open Pit (KCGM), 256pp. 1367
42
Fisher, J. A., Nelson, P. F., 2020. Atmospheric mercury in Australia: Recent findings and future 1368 research needs. Elementa: Science of the Anthropocene 8. 1369
Fu, X. W., Feng, X. B., Sommar, J., Wang, S. F., 2012. A review of studies on atmospheric mercury 1370 in China. Science of the Total Environment 421, 73-81. 1371
Giang, A., Selin, N. E., 2016. Benefits of mercury controls for the United States. Proceedings of the 1372 National Academy of Sciences of the United States of America 113, 286-291. 1373
Gustafsson, T., Munthe, J., Min, A., Kindbom, K., Sjödin, Å., Si, G. (2013). Mercury management in 1374 non-ferrous metal industry in China – a baseline study for the Swedish Environmental 1375 Protection Agency, 31pp. 1376
Hylander, L. D., Herbert, R. B., 2008. Global emission and production of mercury during the 1377 pyrometallurgical extraction of nonferrous sulfide ores Environmental Science & 1378 Technology 42, 5971-5977. 1379
Intergovernmental Forum on Mining Minerals Metals and Sustainable Development (IGF) 1380 (2018). Global Trends in Artisanal and Small-Scale Mining (ASM): A review of key 1381 numbers and issues. Winnepeg, The International Institute for Sustainable 1382 Development, 91pp. http://pubs.iied.org/G04266/?k=mining 1383
International Bank for Reconstruction and Development/The World Bank (2017). The Growing 1384 Role of Minerals and Metals for a Low Carbon Future, The World Bank, 112pp. 1385
Jaffe, D., Strode, S., 2008. Sources, fate and transport of atmospheric mercury from Asia. 1386 Environmental Chemistry 5, 121-126. 1387
Jiang, X., Wang, F., 2019. Mercury emissions in China: a general review. Waste Disposal & 1388 Sustainable Energy 1, 127-132. 1389
Kerfoot, W. C., Harting, S. L., Jeong, J., Robbins, J. A., Rossmann, R., 2004. Local, Regional, and 1390 Global Implications of Elemental Mercury in Metal (Copper, Silver, Gold, and Zinc) Ores: 1391 Insights from Lake Superior Sediments. Journal Of Great Lakes Research 30, 162-184. 1392
Kocman, D., Horvat, M., Pirrone, N., Cinnirella, S., 2013. Contribution of contaminated sites to the 1393 global mercury budget. Environmental Research 125, 160-170. 1394
Li, G. H., Feng, X. B., Li, Z. G., Qiu, G. L., Shang, L. H., Liang, P., Wang, D. Y., Yang, Y. K., 2010. 1395 Mercury emission to atmosphere from primary Zn production in China. Science of the 1396 Total Environment 408, 4607-4612. 1397
Li, J. S., Chen, B., Chen, G. Q., Wei, W. D., Wang, X. B., Ge, J. P., Dong, K. Q., Xia, H. H., Xia, X. H., 2017. 1398 Tracking mercury emission flows in the global supply chains: A multi-regional input-1399 output analysis. Journal of Cleaner Production 140, 1470-1492. 1400
Lindberg, S., Bullock, R., Ebinghaus, R., Engstrom, D., Feng, X. B., Fitzgerald, W., Pirrone, N., 1401 Prestbo, E., Seigneur, C., 2007. pac. Ambio 36, 19-32. 1402
Maxson, P. A., 2005. Global mercury production, use and trade. Dynamics of Mercury Pollution 1403 on Regional and Global Scales: Atmospheric Processes and Human Exposures around 1404 the World, 25-50. 1405
Nelson, P. F., Morrison, A. L., Malfroy, H. J., Cope, M., Lee, S., Hibberd, M. L., Meyer, C., McGregor, 1406 J., 2012. Atmospheric mercury emissions in Australia from anthropogenic, natural and 1407 recycled sources. Atmospheric Environment. 1408
Nriagu, J. O., 1989. A Global Assessment of Natural Sources of Atmsopheric Trace-Metals. Nature 1409 338, 47-49. 1410
Nriagu, J. O., 1990. Global metal pollution: poisoning the biosphere? Environment 32, 7-33. 1411 Nriagu, J. O., Pacyna, J. M., 1988. Quantative Assessment of Worldwide Contamination of Air, 1412
Water and Soils by Trace-Metals. Nature 333, 134-139. 1413 O’Neill, J. D., Telmer, K. (2017). Estimating Mercury Use and Documenting Practices in Artisanal 1414
and Small-scale Gold Mining (ASGM). ISBN 978-0-9939459-8-4. Geneva, Switzerland, 1415 UNEP, 196pp. 1416 https://wedocs.unep.org/bitstream/handle/20.500.11822/22892/ASGM_toolkit_eguid1417 e_EN_180216.compressed.pdf?sequence=1&isAllowed=y 1418
Pacyna, E. G., Pacyna, J. M., 2002. Global Emission of Mercury from Anthropogenic Sources in 1419 1995. Water, Air, and Soil Pollution 137, 149-165. 1420
43
Pacyna, E. G., Pacyna, J. M., Fudala, J., Strzelecka-Jastrzab, E., Hlawiczka, S., Panasiuk, D., 2006a. 1421 Mercury emissions to the atmosphere from anthropogenic sources in Europe in 2000 1422 and their scenarios until 2020. Science of the Total Environment 370, 147-156. 1423
Pacyna, E. G., Pacyna, J. M., Steenhuisen, F., Wilson, S., 2006b. wils. Atmospheric Environment 40, 1424 4048-4063. 1425
Pacyna, E. G., Pacyna, J. M., Sundseth, K., Munthe, J., Kindbom, K., Wilson, S., Steenhuisen, F., 1426 Maxson, P., 2010. amap. Atmospheric Environment 44, 2487-2499. 1427
Pacyna, J. M., Munthe, J., Larjava, K., Pacyna, E. G., 2005. Mercury emissions from anthropogenic 1428 sources: Estimates and measurements for Europe. Dynamics of Mercury Pollution on 1429 Regional and Global Scales: Atmospheric Processes and Human Exposures around the 1430 World, 51-64. 1431
Pacyna, J. M., Pacyna, E. G., Aas, W., 2009. Changes of emissions and atmospheric deposition of 1432 mercury, lead, and cadmium. Atmospheric Environment 43, 117-127. 1433
Pacyna, J. M., Pacyna, E. G., Steenhuisen, F., Wilson, S., 2003. Mapping 1995 global anthropogenic 1434 emissions of mercury. Atmospheric Environment 37, S109-S117. 1435
Pirrone, N., Cinnirella, S., Feng, X., Finkelman, R. B., Friedli, H. R., Leaner, J., Mason, R., Mukherjee, 1436 A. B., Stracher, G. B., Streets, D. G., Telmer, K., 2010. Global mercury emissions to the 1437 atmosphere from anthropogenic and natural sources. Atmospheric Chemistry and 1438 Physics 10, 5951-5964. 1439
Pirrone, N., Cinnirella, S., Feng, X. B., Finkelman, R. B., Friedli, H. R., Leaner, J., Mason, R., 1440 Mukherjee, A. B., Stracher, G., Streets, D. G., Telmer, K. 2009. Global Mercury Emissions 1441 to the Atmosphere from Natural and Anthropogenic Sources. Mercury Fate and 1442 Transport in the Global Atmosphere: Emissions, Measurements and Models. N. Pirrone 1443 and R. Mason: 3-49. 1444
Rauch, J. N., Pacyna, J. M., 2009. Earth's global Ag, Al, Cr, Cu, Fe, Ni, Pb, and Zn cycles. Global 1445 Biogeochemical Cycles 23. 1446
Russian Federal Service for Environmental Technological and Atomic Supervision, Danish 1447 Environmental Protection Agency (2005). Assessment of Mercury Releases from the 1448 Russian Federation. Prepared for the Arctic Council, 344pp. 1449
Rytuba, J. J., 2003. Mercury from mineral deposits and potential environmental impact. 1450 Environmental Geology 43, 326-338. 1451
Science for Environment Policy (2017). Tackling mercury pollution in the EU and worldwide. In-1452 depth Report 15 produced for the European Commission, DG Environment by the 1453 Science Communication Unit, UWE, Bristol, 72pp. http://ec.europa.eu/science-1454 environment-policy 1455
Selin, N. E., 2009. Global Biogeochemical Cycling of Mercury: A Review. Annual Review of 1456 Environment and Resources 34, 43-63. 1457
Streets, D. G., Devane, M. K., Lu, Z. F., Bond, T. C., Sunderland, E. M., Jacob, D. J., 2011. All-Time 1458 Releases of Mercury to the Atmosphere from Human Activities. Environmental Science 1459 & Technology 45, 10485-10491. 1460
Streets, D. G., Hao, J., Y., W., Jiang, J., Chan, M., Tian, H., Feng, X., 2005. Anthropogenic mercury 1461 emissions in China. Atmospheric Environment 39, 7789-7806. 1462
Streets, D. G., Horowitz, H. M., Jacob, D. J., Lu, Z., Levin, L., ter Schure, A. F. H., Sunderland, E. M., 1463 2017. Total Mercury Released to the Environment by Human Activities. Environmental 1464 Science & Technology. 1465
Streets, D. G., Zhang, Q., Wu, Y., 2009. Projections of Global Mercury Emissions in 2050. 1466 Environmental Science & Technology 43, 2983-2988. 1467
Tsinghua University (2019). Mercury emissions and release in zinc smelters in China. Natural 1468 Resources Defence Council Project, Natural Resources Defence Council Project, 42pp. 1469
UNECE (2013). Guidance document on best available techniques for controlling emissions of 1470 heavy metals and their compounds from the source categories listed in annex II to the 1471 Protocol on Heavy Metals, UN Economic Commission for Europe: Executive Body for the 1472 Convention on Long-range Transboundary Air Pollution, 33pp. 1473 https://unece.org/protocol-heavy-metals-0 1474
44
UNEP 2005. Toolkit for identification and quantification of mercury releases. Accessed at 1475 http://www.chem.unep.ch/mercury/Toolkit/UNEP-final-pilot-draft-toolkit-Dec05.pdf. 1476
UNEP, 2006. Guide for reducing major uses and releases of mercury. 1477 UNEP (2013a). Global Mercury Assessment 2013: Sources, emissions, releases, and 1478
environmental transport, United Nations Environment Program, 42pp. 1479 UNEP (2013b). Mercury Time to Act, 44pp. 1480
http://www.mercuryconvention.org/DNNAdmin/AllENGLISHNewsEntry/tabid/3444/a1481 rticleType/ArticleView/articleId/11318/language/en-US/Mercury-Time-to-act.aspx 1482
UNEP (2017a). Global mercury supply, trade and demand, UN Environment, 81pp. 1483 https://www.unep.org/resources/report/global-mercury-supply-trade-and-demand 1484
UNEP (2017b). Toolkit for Identification and Quantification of Mercury Releases Reference 1485 Report and Guideline for Inventory Level 2. Version 1.4. Geneva, Switzerland, UN 1486 Environment Chemicals Branch, 339 pp. 1487
UNEP (2019a). Global Mercury Assessment 2018. Geneva, Switzerland, UN Environment 1488 Programme, Chemicals and Health Branch, 60pp. 1489
UNEP (2019b). Guidance on best available techniques and best environmental practices. 1490 Minamata Convention on Mercury. Geneva, Switzerland, Secretariat of the Minamata 1491 Convention on Mercury, 193pp. 1492 http://mercuryconvention.org/Portals/11/documents/publications/BAT_BEP_E_interr1493 actif.pdf 1494
UNEP (2019c). Toolkit for Identification and Quantification of Mercury Releases Reference 1495 Report and Guideline for Inventory Level 2. Version 1.5. Geneva, Switzerland, UN 1496 Environment Chemicals Branch, 354pp. 1497 https://wedocs.unep.org/handle/20.500.11822/30684 1498
USEPA (1997a). Mercury Study Report to Congress. Fate and transport of mercury in the 1499 Environment, vol. III. Washington, DC, US Environmental Protection Agency, 376pp. 1500 http://www.epa.gov/mercury/report.htm 1501
USEPA (1997b). Mercury Study to Congress Volume VIII An Evaluation of Mercury Control 1502 Technologies and Costs, USEPA Office of Air Quality Planning and Standards and Office 1503 of Research and Development, pp. 1504
Wang, S. X., Song, J. X., Li, G. H., Wu, Y., Zhang, L., Wan, Q., Streets, D. G., Chin, C. K., Hao, J. M., 1505 2010. Estimating mercury emissions from a zinc smelter in relation to China’s mercury 1506 control policies. Environmental Pollution 158, 3347-3353. 1507
Wang, S. X., Zhang, L., Wang, L., Wu, Q. R., Wang, F. Y., Hao, J. M., 2014. A review of atmospheric 1508 mercury emissions, pollution and control in China. Frontiers of Environmental Science & 1509 Engineering 8, 631-649. 1510
Wilson, S. J., Steenhuisen, F., Pacyna, J. M., Pacyna, E. G., 2006. Mapping the spatial distribution of 1511 global anthropogenic mercury atmospheric emission inventories. Atmospheric 1512 Environment 40, 4621-4632. 1513
World Economic Forum (2010). Mining & Metals Scenarios to 2030, 48pp. 1514 World Economic Forum (2014). The Future Availability of Natural Resources: A New Paradigm 1515
for Global Resource Availability, 56pp. 1516 World Economic Forum (2015). Mining & Metals in a Sustainable World 2050, World economic 1517
Forum, 43pp. 1518 Wu, Q., Li, G., Wang, S., Liu, K., Hao, J., 2018. Mitigation options of atmospheric Hg emissions in 1519
China. Environmental Science & Technology. 1520 Wu, Q., Wang, S., Hui, M., Wang, F., Zhang, L., Duan, L., Luo, Y., 2015. New Insight into 1521
Atmospheric Mercury Emissions from Zinc Smelters Using Mass Flow Analysis. 1522 Environmental Science & Technology 49, 3532-3539. 1523
Wu, Q., Wang, S., Li, G., Liang, S., Lin, C.-J., Wang, Y., Cai, S., Liu, K., Hao, J., 2016a. Temporal Trend 1524 and Spatial Distribution of Speciated Atmospheric Mercury Emissions in China During 1525 1978–2014. Environmental Science & Technology. 1526
45
Wu, Q., Wang, S., Zhang, L., Hui, M., Wang, F., Hao, J., 2016b. Flow Analysis of the Mercury 1527 Associated with Nonferrous Ore Concentrates: Implications on Mercury Emissions and 1528 Recovery in China. Environmental Science & Technology, 1796-1803. 1529
Wu, Q. R., Wang, S. X., Zhang, L., Song, J. X., Yang, H., Meng, Y., 2012. Update of mercury emissions 1530 from China's primary zinc, lead and copper smelters, 2000-2010. Atmos. Chem. Phys. 12, 1531 11153-11163. 1532
Wu, Y., Wang, S., Streets, D. G., Hao, J., Chan, M., Jiang, J., 2006. Trends in Anthropogenic Mercury 1533 Emissions in China from 1995 to 2003. Environmental Science & Technology 40, 5312-1534 5318. 1535
Yang, M. (2015). Research on atmospheric mercury emission inventory and control technology 1536 of gold production in China, Postdoctoral work report. Beijing, Tsinghua University, pp. 1537
Ye, X., Hu, D., Wang, H., Chen, L., Xie, H., Zhang, W., Deng, C., Wang, X., 2015. Atmospheric 1538 mercury emissions from China's primary nonferrous metal (Zn, Pb and Cu) smelting 1539 during 1949–2010. Atmospheric Environment 103, 331-338. 1540
Zhang, L., Cao, S., Zhu, X., Zhou, P., Zhao, Y. (2019). Meeting Minamata: A Cost-Effective 1541 Compliance Roadmap for Mercury Pollution Control in China’s Non-Ferrous Metal (Zinc, 1542 Lead and Copper) Smelters. Prepared for the Natural Resources Defence Council, 1543 Nanjing University, 106pp. 1544
Zhang, L., Wang, S., Wang, L., Wu, Y., Duan, L., Wu, Q., Wang, F., Yang, M., Yang, H., Hao, J., Liu, X., 1545 2015. Updated Emission Inventories for Speciated Atmospheric Mercury from 1546 Anthropogenic Sources in China. Environmental Science & Technology 49, 3185-3194. 1547
Zhang, L., Wang, S., Wu, Q., Meng, Y., Yang, H., Wang, F., Hao, J., 2012. Were mercury emission 1548 factors for Chinese non-ferrous metal smelters overestimated? Evidence from onsite 1549 measurements in six smelters. Environmental Pollution 171, 109-117. 1550
Zhang, L., Wang, S., Wu, Q., Wang, F., Lin, C. J., Zhang, L., Hui, M., Yang, M., Su, H., Hao, J., 2016. 1551 Mercury transformation and speciation in flue gases from anthropogenic emission 1552 sources: a critical review. Atmos. Chem. Phys. 16, 2417-2433. 1553
1554
1555
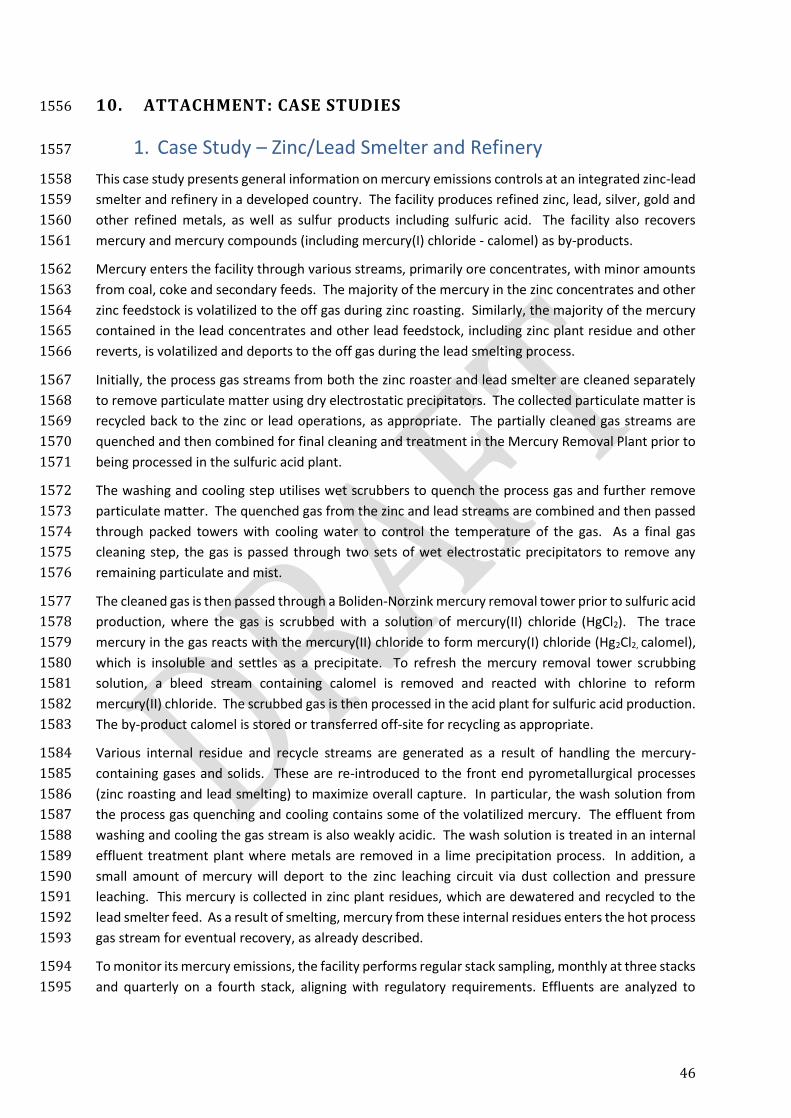
46
10. ATTACHMENT: CASE STUDIES 1556
1. Case Study – Zinc/Lead Smelter and Refinery 1557
This case study presents general information on mercury emissions controls at an integrated zinc-lead 1558
smelter and refinery in a developed country. The facility produces refined zinc, lead, silver, gold and 1559
other refined metals, as well as sulfur products including sulfuric acid. The facility also recovers 1560
mercury and mercury compounds (including mercury(I) chloride - calomel) as by-products. 1561
Mercury enters the facility through various streams, primarily ore concentrates, with minor amounts 1562
from coal, coke and secondary feeds. The majority of the mercury in the zinc concentrates and other 1563
zinc feedstock is volatilized to the off gas during zinc roasting. Similarly, the majority of the mercury 1564
contained in the lead concentrates and other lead feedstock, including zinc plant residue and other 1565
reverts, is volatilized and deports to the off gas during the lead smelting process. 1566
Initially, the process gas streams from both the zinc roaster and lead smelter are cleaned separately 1567
to remove particulate matter using dry electrostatic precipitators. The collected particulate matter is 1568
recycled back to the zinc or lead operations, as appropriate. The partially cleaned gas streams are 1569
quenched and then combined for final cleaning and treatment in the Mercury Removal Plant prior to 1570
being processed in the sulfuric acid plant. 1571
The washing and cooling step utilises wet scrubbers to quench the process gas and further remove 1572
particulate matter. The quenched gas from the zinc and lead streams are combined and then passed 1573
through packed towers with cooling water to control the temperature of the gas. As a final gas 1574
cleaning step, the gas is passed through two sets of wet electrostatic precipitators to remove any 1575
remaining particulate and mist. 1576
The cleaned gas is then passed through a Boliden-Norzink mercury removal tower prior to sulfuric acid 1577
production, where the gas is scrubbed with a solution of mercury(II) chloride (HgCl2). The trace 1578
mercury in the gas reacts with the mercury(II) chloride to form mercury(I) chloride (Hg2Cl2, calomel), 1579
which is insoluble and settles as a precipitate. To refresh the mercury removal tower scrubbing 1580
solution, a bleed stream containing calomel is removed and reacted with chlorine to reform 1581
mercury(II) chloride. The scrubbed gas is then processed in the acid plant for sulfuric acid production. 1582
The by-product calomel is stored or transferred off-site for recycling as appropriate. 1583
Various internal residue and recycle streams are generated as a result of handling the mercury-1584
containing gases and solids. These are re-introduced to the front end pyrometallurgical processes 1585
(zinc roasting and lead smelting) to maximize overall capture. In particular, the wash solution from 1586
the process gas quenching and cooling contains some of the volatilized mercury. The effluent from 1587
washing and cooling the gas stream is also weakly acidic. The wash solution is treated in an internal 1588
effluent treatment plant where metals are removed in a lime precipitation process. In addition, a 1589
small amount of mercury will deport to the zinc leaching circuit via dust collection and pressure 1590
leaching. This mercury is collected in zinc plant residues, which are dewatered and recycled to the 1591
lead smelter feed. As a result of smelting, mercury from these internal residues enters the hot process 1592
gas stream for eventual recovery, as already described. 1593
To monitor its mercury emissions, the facility performs regular stack sampling, monthly at three stacks 1594
and quarterly on a fourth stack, aligning with regulatory requirements. Effluents are analyzed to 1595
47
confirm effluent treatment performance and to monitor effluent released to the environment. 1596
Product sulfuric acid is analyzed prior to shipment to confirm mercury content. 1597
Overall, this facility achieves over 99.5% mercury capture based on inputs and recorded release in 1598
effluent and stacks. Mercury is recovered primarily as calomel but also as a minor amount of 1599
elemental mercury. The facility consistently produces sulfuric acid with mercury content well below 1600
1.0 ppm. 1601
1602
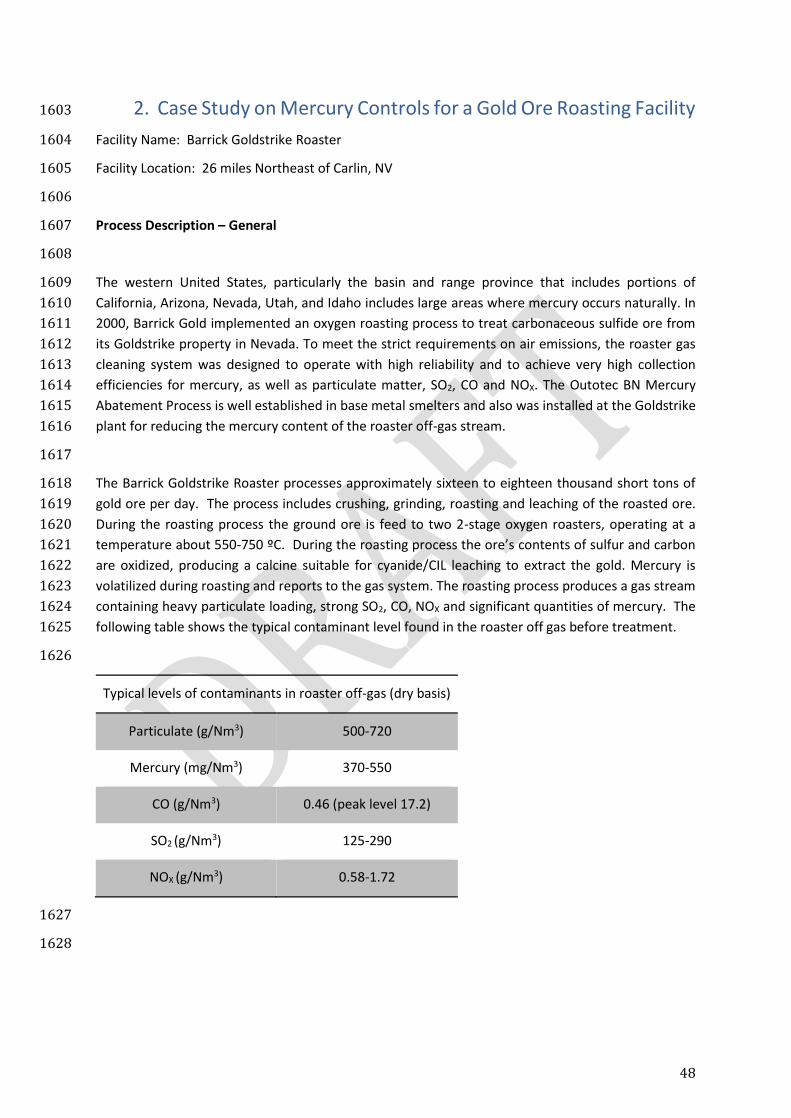
48
2. Case Study on Mercury Controls for a Gold Ore Roasting Facility 1603
Facility Name: Barrick Goldstrike Roaster 1604
Facility Location: 26 miles Northeast of Carlin, NV 1605
1606
Process Description – General 1607
1608
The western United States, particularly the basin and range province that includes portions of 1609
California, Arizona, Nevada, Utah, and Idaho includes large areas where mercury occurs naturally. In 1610
2000, Barrick Gold implemented an oxygen roasting process to treat carbonaceous sulfide ore from 1611
its Goldstrike property in Nevada. To meet the strict requirements on air emissions, the roaster gas 1612
cleaning system was designed to operate with high reliability and to achieve very high collection 1613
efficiencies for mercury, as well as particulate matter, SO2, CO and NOX. The Outotec BN Mercury 1614
Abatement Process is well established in base metal smelters and also was installed at the Goldstrike 1615
plant for reducing the mercury content of the roaster off-gas stream. 1616
1617
The Barrick Goldstrike Roaster processes approximately sixteen to eighteen thousand short tons of 1618
gold ore per day. The process includes crushing, grinding, roasting and leaching of the roasted ore. 1619
During the roasting process the ground ore is feed to two 2-stage oxygen roasters, operating at a 1620
temperature about 550-750 ºC. During the roasting process the ore’s contents of sulfur and carbon 1621
are oxidized, producing a calcine suitable for cyanide/CIL leaching to extract the gold. Mercury is 1622
volatilized during roasting and reports to the gas system. The roasting process produces a gas stream 1623
containing heavy particulate loading, strong SO2, CO, NOX and significant quantities of mercury. The 1624
following table shows the typical contaminant level found in the roaster off gas before treatment. 1625
1626
Typical levels of contaminants in roaster off-gas (dry basis)
Particulate (g/Nm3) 500-720
Mercury (mg/Nm3) 370-550
CO (g/Nm3) 0.46 (peak level 17.2)
SO2 (g/Nm3) 125-290
NOX (g/Nm3) 0.58-1.72
1627
1628
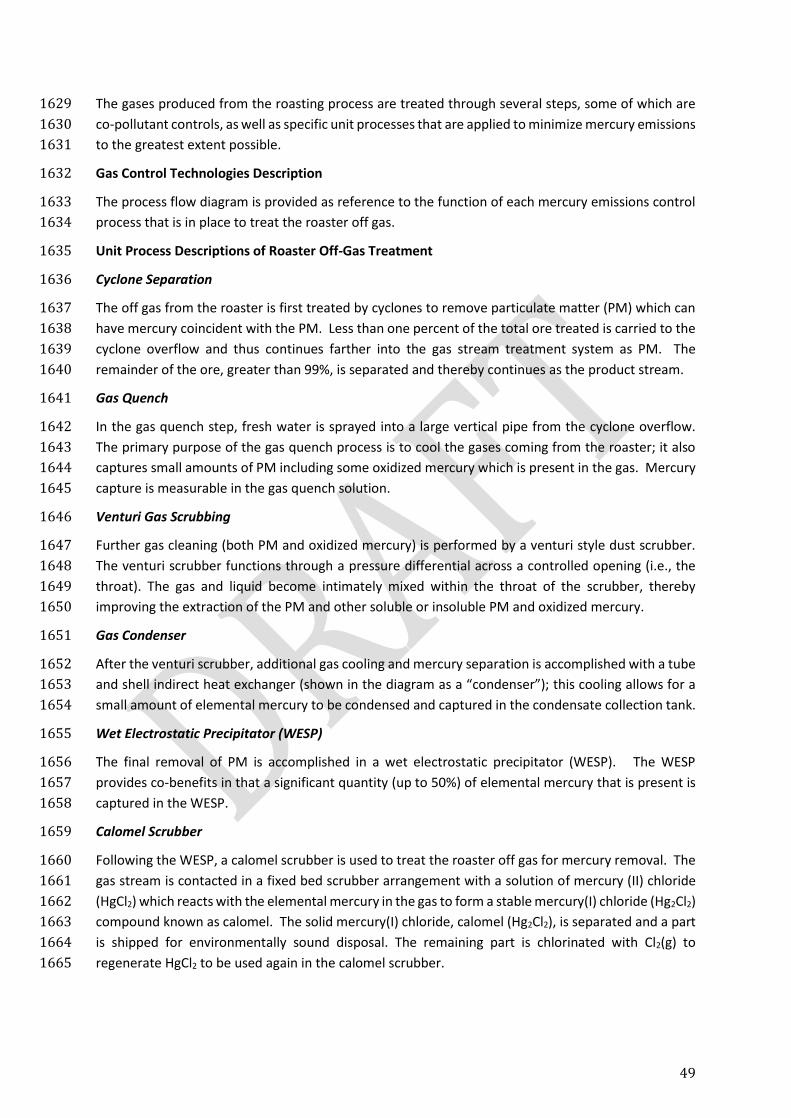
49
The gases produced from the roasting process are treated through several steps, some of which are 1629
co-pollutant controls, as well as specific unit processes that are applied to minimize mercury emissions 1630
to the greatest extent possible. 1631
Gas Control Technologies Description 1632
The process flow diagram is provided as reference to the function of each mercury emissions control 1633
process that is in place to treat the roaster off gas. 1634
Unit Process Descriptions of Roaster Off-Gas Treatment 1635
Cyclone Separation 1636
The off gas from the roaster is first treated by cyclones to remove particulate matter (PM) which can 1637
have mercury coincident with the PM. Less than one percent of the total ore treated is carried to the 1638
cyclone overflow and thus continues farther into the gas stream treatment system as PM. The 1639
remainder of the ore, greater than 99%, is separated and thereby continues as the product stream. 1640
Gas Quench 1641
In the gas quench step, fresh water is sprayed into a large vertical pipe from the cyclone overflow. 1642
The primary purpose of the gas quench process is to cool the gases coming from the roaster; it also 1643
captures small amounts of PM including some oxidized mercury which is present in the gas. Mercury 1644
capture is measurable in the gas quench solution. 1645
Venturi Gas Scrubbing 1646
Further gas cleaning (both PM and oxidized mercury) is performed by a venturi style dust scrubber. 1647
The venturi scrubber functions through a pressure differential across a controlled opening (i.e., the 1648
throat). The gas and liquid become intimately mixed within the throat of the scrubber, thereby 1649
improving the extraction of the PM and other soluble or insoluble PM and oxidized mercury. 1650
Gas Condenser 1651
After the venturi scrubber, additional gas cooling and mercury separation is accomplished with a tube 1652
and shell indirect heat exchanger (shown in the diagram as a “condenser”); this cooling allows for a 1653
small amount of elemental mercury to be condensed and captured in the condensate collection tank. 1654
Wet Electrostatic Precipitator (WESP) 1655
The final removal of PM is accomplished in a wet electrostatic precipitator (WESP). The WESP 1656
provides co-benefits in that a significant quantity (up to 50%) of elemental mercury that is present is 1657
captured in the WESP. 1658
Calomel Scrubber 1659
Following the WESP, a calomel scrubber is used to treat the roaster off gas for mercury removal. The 1660
gas stream is contacted in a fixed bed scrubber arrangement with a solution of mercury (II) chloride 1661
(HgCl2) which reacts with the elemental mercury in the gas to form a stable mercury(I) chloride (Hg2Cl2) 1662
compound known as calomel. The solid mercury(I) chloride, calomel (Hg2Cl2), is separated and a part 1663
is shipped for environmentally sound disposal. The remaining part is chlorinated with Cl2(g) to 1664
regenerate HgCl2 to be used again in the calomel scrubber. 1665
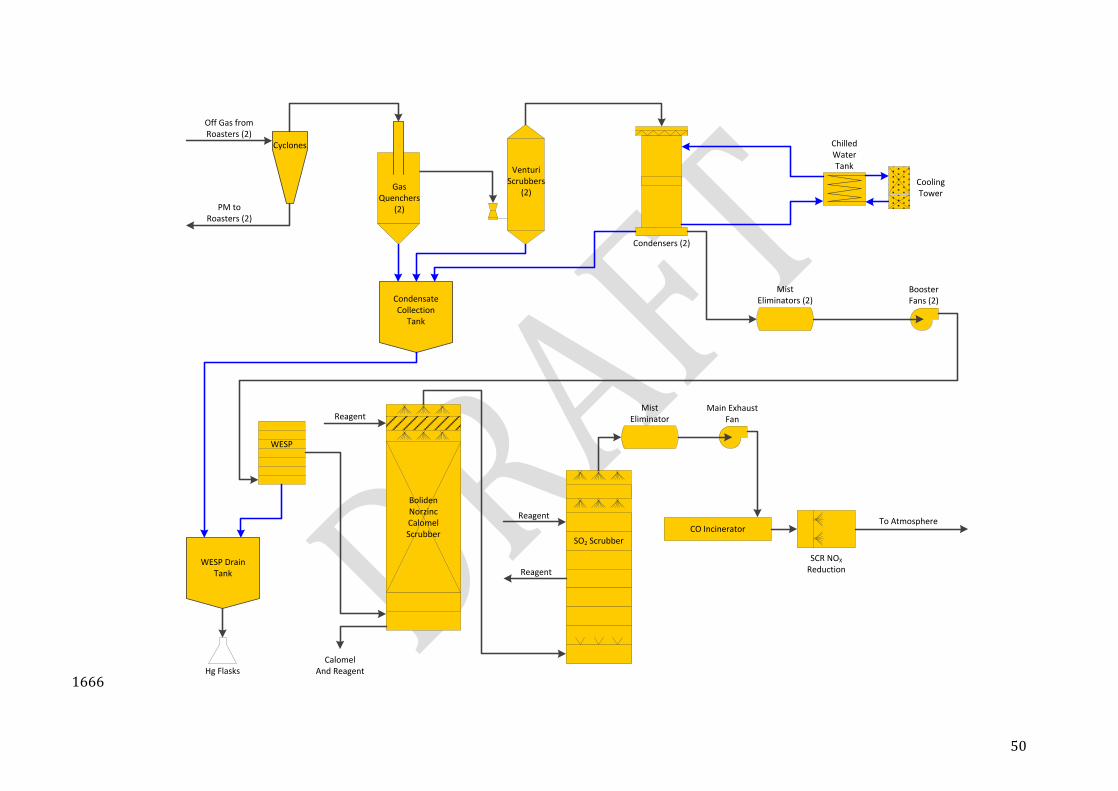
50
Cyclones
CondensateCollection
Tank
WESP DrainTank
CO Incinerator
GasQuenchers
(2)
VenturiScrubbers
(2)
Condensers (2)
ChilledWaterTank
CoolingTower
MistEliminators (2)
MistEliminator
WESP
BolidenNorzincCalomelScrubber
SO2 Scrubber
SCR NOX
Reduction
To Atmosphere
Reagent
CalomelAnd ReagentHg Flasks
Reagent
Reagent
BoosterFans (2)
Main ExhaustFan
Off Gas fromRoasters (2)
PM toRoasters (2)
1666
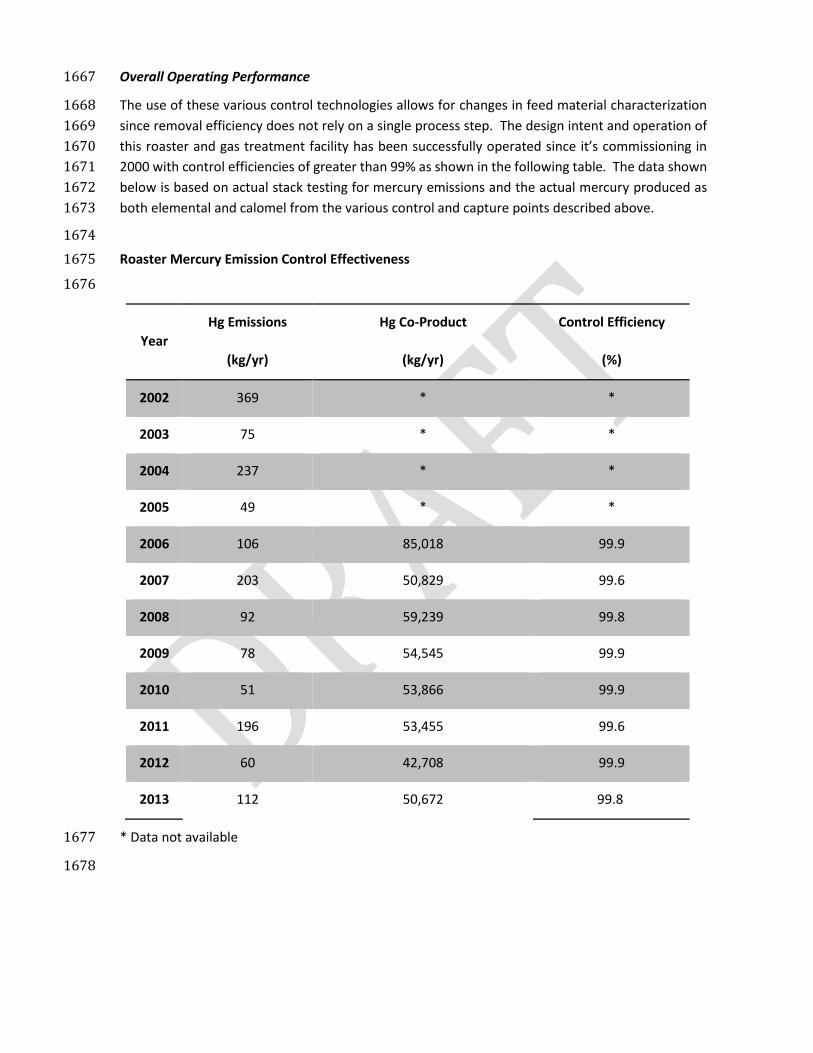
Overall Operating Performance 1667
The use of these various control technologies allows for changes in feed material characterization 1668
since removal efficiency does not rely on a single process step. The design intent and operation of 1669
this roaster and gas treatment facility has been successfully operated since it’s commissioning in 1670
2000 with control efficiencies of greater than 99% as shown in the following table. The data shown 1671
below is based on actual stack testing for mercury emissions and the actual mercury produced as 1672
both elemental and calomel from the various control and capture points described above. 1673
1674
Roaster Mercury Emission Control Effectiveness 1675
1676
Year
Hg Emissions Hg Co-Product Control Efficiency
(kg/yr) (kg/yr) (%)
2002 369 * *
2003 75 * *
2004 237 * *
2005 49 * *
2006 106 85,018 99.9
2007 203 50,829 99.6
2008 92 59,239 99.8
2009 78 54,545 99.9
2010 51 53,866 99.9
2011 196 53,455 99.6
2012 60 42,708 99.9
2013 112 50,672 99.8
* Data not available 1677
1678
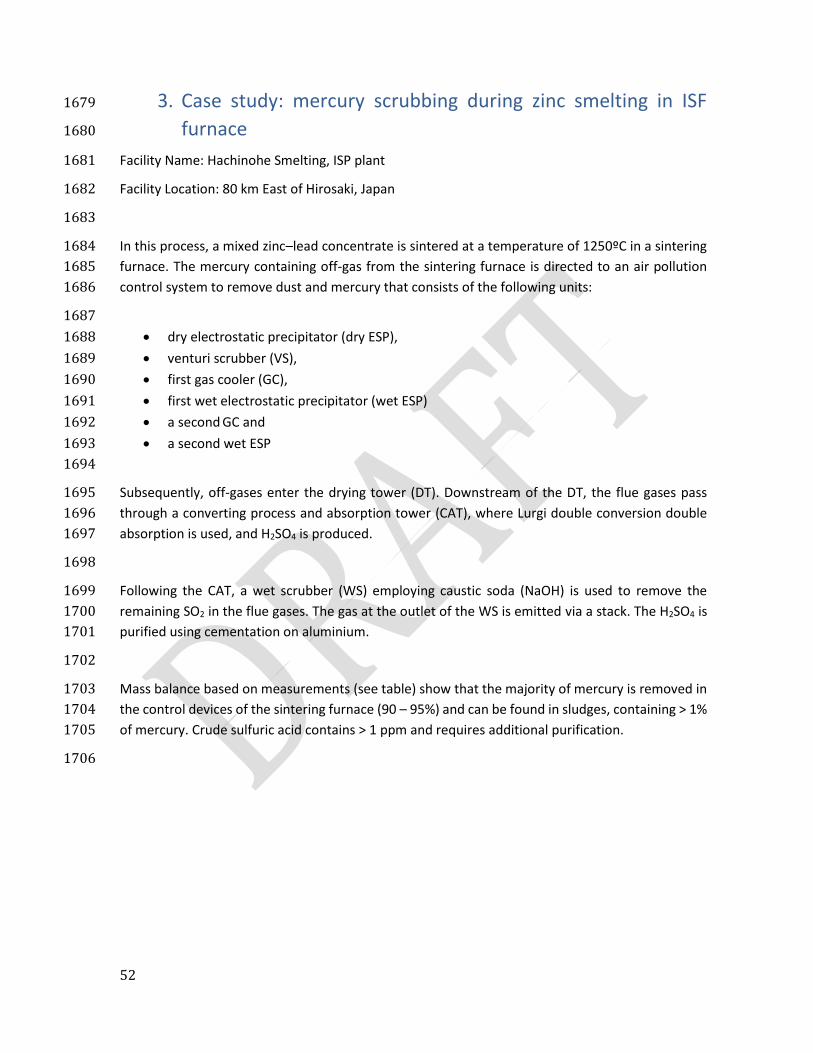
52
3. Case study: mercury scrubbing during zinc smelting in ISF 1679
furnace 1680
Facility Name: Hachinohe Smelting, ISP plant 1681
Facility Location: 80 km East of Hirosaki, Japan 1682
1683
In this process, a mixed zinc–lead concentrate is sintered at a temperature of 1250ºC in a sintering 1684
furnace. The mercury containing off-gas from the sintering furnace is directed to an air pollution 1685
control system to remove dust and mercury that consists of the following units: 1686
1687
• dry electrostatic precipitator (dry ESP), 1688
• venturi scrubber (VS), 1689
• first gas cooler (GC), 1690
• first wet electrostatic precipitator (wet ESP) 1691
• a second GC and 1692
• a second wet ESP 1693
1694
Subsequently, off-gases enter the drying tower (DT). Downstream of the DT, the flue gases pass 1695
through a converting process and absorption tower (CAT), where Lurgi double conversion double 1696
absorption is used, and H2SO4 is produced. 1697
1698
Following the CAT, a wet scrubber (WS) employing caustic soda (NaOH) is used to remove the 1699
remaining SO2 in the flue gases. The gas at the outlet of the WS is emitted via a stack. The H2SO4 is 1700
purified using cementation on aluminium. 1701
1702
Mass balance based on measurements (see table) show that the majority of mercury is removed in 1703
the control devices of the sintering furnace (90 – 95%) and can be found in sludges, containing > 1% 1704
of mercury. Crude sulfuric acid contains > 1 ppm and requires additional purification. 1705
1706
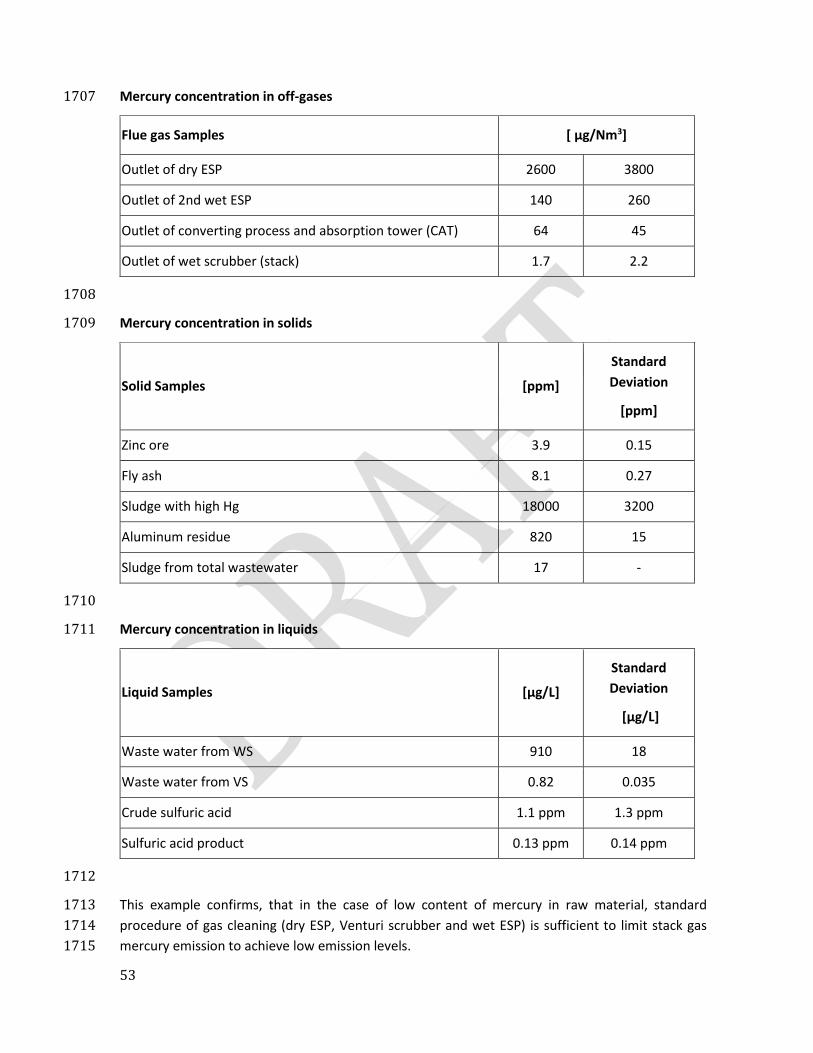
53
Mercury concentration in off-gases 1707
Flue gas Samples [ µg/Nm3]
Outlet of dry ESP 2600 3800
Outlet of 2nd wet ESP 140 260
Outlet of converting process and absorption tower (CAT) 64 45
Outlet of wet scrubber (stack) 1.7 2.2
1708
Mercury concentration in solids 1709
Solid Samples [ppm]
Standard
Deviation
[ppm]
Zinc ore 3.9 0.15
Fly ash 8.1 0.27
Sludge with high Hg 18000 3200
Aluminum residue 820 15
Sludge from total wastewater 17 -
1710
Mercury concentration in liquids 1711
Liquid Samples [μg/L]
Standard
Deviation
[μg/L]
Waste water from WS 910 18
Waste water from VS 0.82 0.035
Crude sulfuric acid 1.1 ppm 1.3 ppm
Sulfuric acid product 0.13 ppm 0.14 ppm
1712
This example confirms, that in the case of low content of mercury in raw material, standard 1713
procedure of gas cleaning (dry ESP, Venturi scrubber and wet ESP) is sufficient to limit stack gas 1714
mercury emission to achieve low emission levels. 1715
54
Reference 1716
Removal of mercury and sulfuric acid production in ISP zinc smelting, M. Takaoka, D. Hamaguchi, R. 1717
Shinmura, T. Sekiguchi, H. Tokuich, Japan, 2014. 1718
1719
55
4. Case study Zinc/lead/copper production at Boliden Rönnskär 1720
(Sweden) 1721
Description 1722
Boliden Rönnskär is the largest production site of the Boliden company. It was established in 1930. 1723
The main products are copper, lead, zinc clinker, gold and silver; by-products include sulfuric acid.39 1724
Copper and lead concentrates originate from Boliden´s own mines and from external mines. For 1725
many years it has been one of the world´s largest recyclers of electronic scrap. 1726
Smelting takes place in different types of furnaces, depending on the raw material. In 2014, Boliden 1727
Rönnskär produced 217 kt copper cathodes, processing 844 kt copper concentrates and secondary 1728
materials.40 1729
Technical description 1730
Copper production 1731
Boliden Rönnskär uses a Flash Furnace as well as a Fluidized Bed Roaster combined with an Electric 1732
Furnace for processing copper concentrates. Process gases from the bed roaster, smelting furnaces 1733
and converters are directed to the double contact/double absorption acid plants or a liquid SO2 1734
plant equipped with a Boliden Norzink technique, DOWA filter or selenium filters for mercury 1735
reduction. 1736
The output of the Fluidized Bed Roaster enters into an Electric Smelting Furnace (also processing 1737
secondary material). The mattes of the Electric Smelting Furnace and the Flash Furnace enter a 1738
Converter Aisle producing blister copper. 1739
Electronic scrap is fed to the TBRC Kaldo furnace (top-blown rotary converter) to produce crude 1740
copper containing precious metals. This “black copper” is fed to the converter. 1741
Blister copper produced in the converter is deoxidised with ammonia in the anode furnace followed 1742
by anode casting and finally electro-refined.41 1743
Lead production 1744
Boliden Rönnskär uses a TBRC Kaldo furnace (top-blown rotary converter) for processing lead 1745
concentrates. Besides lead concentrates, the Kaldo furnace is also used for melting electronic waste 1746
to black copper. The furnace is housed in an enclosure to contain secondary emissions; ventilation 1747
gases are treated in a bag filter. Process gases from the Kaldo furnace are treated either in a liquid 1748
SO2 plant (equipped with a selenium filter for mercury reduction) or a double contact/double 1749
absorption acid plants (equipped with a DOWA filter for mercury reduction). 42 43 1750
Zinc production 1751
39 Boliden Rönnskär Website, accessed 4.3.2015 http://www.boliden.com/Operations/Smelters/Ronnskar/ 40 Boliden Rönnskär Website, accessed 4.3.2015 http://www.boliden.com/Operations/Smelters/Ronnskar/ 41 Gas treatment at sulphuric acid plant, Rönnskär; presentation by M. Borell, Boliden, 2014 42 Gas treatment at sulphuric acid plant, Rönnskär; presentation by M. Borell, Boliden, 2014 43 EU NFM BREF, 2014 (p. 322)
56
Slag from the Electric Smelting Furnace enters a Fuming Furnace producing the input to the zinc 1752
clinker plant. No specific mercury reduction system is installed. 44 1753
1754
Mercury control techniques 1755
For mercury removal, Boliden Rönnskär uses dust cleaning techniques in combination with different 1756
specific mercury reduction techniques. For dust cleaning, electrostatic precipitators, bag filters and 1757
scrubbers are used; specific mercury reduction techniques applied are Boliden Norzink, DOWA Filter 1758
and Selenium Filter and injection of lime and activated carbon in combination with bag filters. 1759
Environmental performance and operational data 1760
Emission performance data is based on about 100 mercury measurements per year. Sampling time 1761
is between 1-14 days. Three methods are used: 1762
1) Standard periodic sampling method (European Standard EN 13211) 1763
2) Boliden periodic sampling method 1764
3) Semtech 2000 on-line monitoring method 1765
The Boliden method uses robust equipment, and the liquid is not as sensitive to cold weather 1766
conditions as when using EN 13211. It separates the sample into three fractions according to the 1767
mercury species and makes it possible to study the importance of different types of mercury: 1768
• Filter: Mercury adsorbed on particulate matter 1769
• H2SO4: Mercury ions (oxidized mercury as vapour) 1770
• Iodized activated coal: elemental mercury 1771
Semtech 2000 is an optical on-line measurement method (254 nm, UV). Boliden Rönnskär uses it 1772
only as an indicative measurement. It samples and measures elemental mercury. Ionic mercury (ion 1773
droplets) is not sampled (has to be converted into elemental mercury). The equipment does not 1774
sample mercury adsorbed on particulate matter. 1775
1776
Emissions from Flash Furnace (primary copper processing) 1777
1778
Process gases of the flash furnace (30 000 Nm3/h) are first cleaned from dust in an electrostatic 1779
precipitator (ESP) and a scrubber. Subsequently, off-gas passes to a Boliden Norzink mercury control 1780
before entering the double contact/double absorption acid plants. Mercury content of raw gas 1781
before the Boliden Norzink control varies from 42-1008 µg/Nm3 (periodic measurement). 1782
Accordingly, emission levels vary between 12-48 µg/Nm3, resulting in 71-95% mercury reduction. 1783
1784
Emissions from Fluidized Bed Roaster (primary copper processing) 1785
44 Gas treatment at sulphuric acid plant, Rönnskär; presentation by M. Borell, Boliden, 2014
57
1786
Process gases of the fluid bed roaster (80 000 Nm3/h) are first cleaned from dust in an electrostatic 1787
precipitator (ESP) and a bag filter. Bag filter dust containing As and Hg is sent to storage in a closed 1788
system. 1789
In a mixing tower, off-gas from the fluid bed roaster, the electric smelting furnace and the converter 1790
aisle are combined. The emissions from the mixing tower are either directed to the double 1791
contact/double absorption acid plants, equipped with a DOWA filter for mercury reduction) or to 1792
the liquid SO2 plant, equipped with a selenium filter for mercury control (performance levels are 1793
described below in the section on TBRC Kaldo furnace for primary lead). 1794
Emissions from Electric Furnace and Converter (primary and secondary copper 1795
processing) 1796
1797
Process gas of the electric furnace is first cleaned in an electrostatic precipitator before being 1798
directed to a mixing tower. Process gas of the converter is first cleaned in an electrostatic preci-1799
pitator. Subsequently it passes a quencher and a cooler before being directed to the mixing tower. 1800
In the mixing tower, off-gas from the fluid bed roaster, the electric smelting furnace and the PS 1801
converter aisle are combined in a mixing tower. The emissions from the mixing tower are either 1802
directed to the double contact/double absorption acid plants, equipped with a DOWA filter for 1803
mercury reduction) or to the liquid SO2 plant, equipped with a selenium filter for mercury control 1804
(performance levels are described below in the section on TBRC Kaldo furnace for primary lead). 1805
1806
Emissions from TBRC Kaldo furnace (primary lead smelting) 1807
1808
Ventilation gases of the Kaldo furnace enclosure (44 000 Nm3/h) are cleaned in a bag filter achieving 1809
dust emission levels in off-gas < 5 mg/Nm3 (continuous measurement). 1810
Process gases of the Kaldo furnace are first cleaned from dust in a wet electrostatic precipitator 1811
(ESP) and passed to a liquid SO2 plant, equipped with a selenium filter for mercury control. Mercury 1812
content of raw gas before the selenium filter (80 000 Nm3/h) varies from 42-1008 µg/Nm3 (periodic 1813
measurement). Accordingly, emission levels vary between 12-48 µg/Nm3, resulting in 71-95% 1814
mercury reduction. 1815
Process gases from TBRC Kaldo furnace can alternatively be directed to a dust cleaning with a wet 1816
ESP and the double contact/double absorption acid plants equipped with a DOWA filter for mercury 1817
control. Mercury content of raw gas before the DOWA filter (170 000 Nm3/h) varies from 10,5-50 1818
µg/Nm3. Accordingly, emission levels in off-gas vary between 1,2-1,4 µg/Nm3, resulting in 88-97% 1819
mercury reduction. 1820
1821
Emissions from TBRC Kaldo furnace (electronic scrap processing) 1822
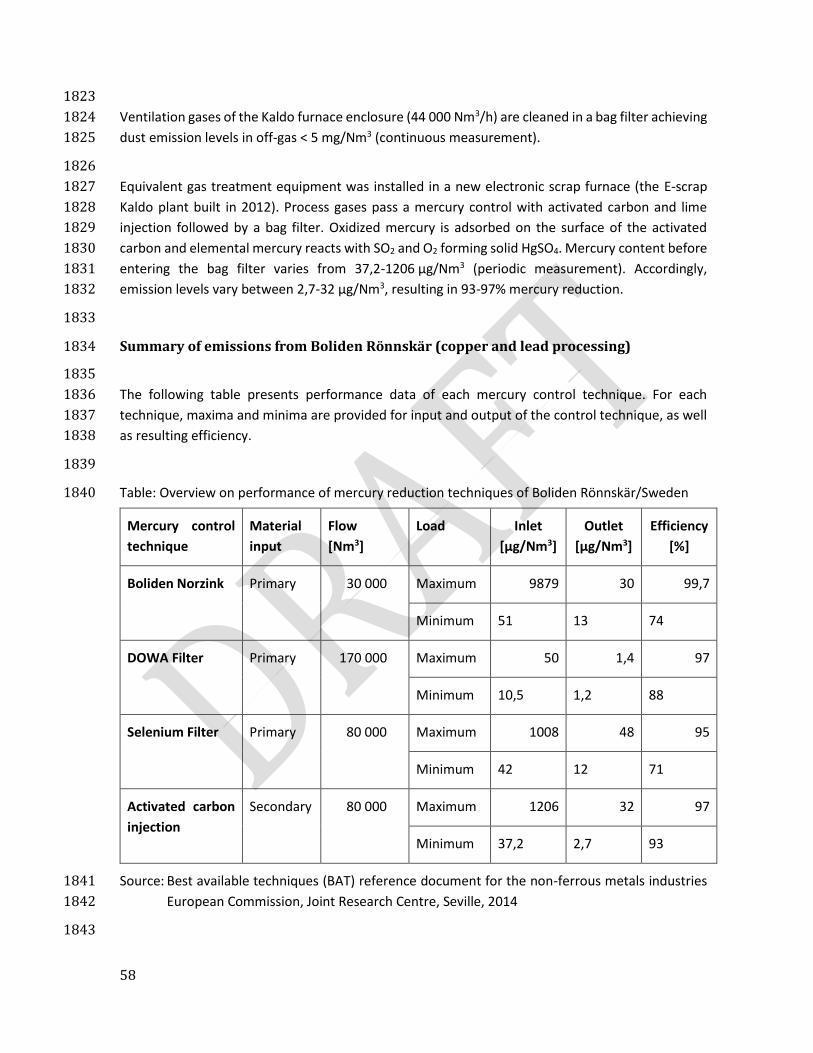
58
1823
Ventilation gases of the Kaldo furnace enclosure (44 000 Nm3/h) are cleaned in a bag filter achieving 1824
dust emission levels in off-gas < 5 mg/Nm3 (continuous measurement). 1825
1826
Equivalent gas treatment equipment was installed in a new electronic scrap furnace (the E-scrap 1827
Kaldo plant built in 2012). Process gases pass a mercury control with activated carbon and lime 1828
injection followed by a bag filter. Oxidized mercury is adsorbed on the surface of the activated 1829
carbon and elemental mercury reacts with SO2 and O2 forming solid HgSO4. Mercury content before 1830
entering the bag filter varies from 37,2-1206 µg/Nm3 (periodic measurement). Accordingly, 1831
emission levels vary between 2,7-32 µg/Nm3, resulting in 93-97% mercury reduction. 1832
1833
Summary of emissions from Boliden Rönnskär (copper and lead processing) 1834
1835
The following table presents performance data of each mercury control technique. For each 1836
technique, maxima and minima are provided for input and output of the control technique, as well 1837
as resulting efficiency. 1838
1839
Table: Overview on performance of mercury reduction techniques of Boliden Rönnskär/Sweden 1840
Mercury control
technique
Material
input
Flow
[Nm3]
Load Inlet
[µg/Nm3]
Outlet
[µg/Nm3]
Efficiency
[%]
Boliden Norzink Primary 30 000 Maximum 9879 30 99,7
Minimum 51 13 74
DOWA Filter Primary 170 000 Maximum 50 1,4 97
Minimum 10,5 1,2 88
Selenium Filter Primary 80 000 Maximum 1008 48 95
Minimum 42 12 71
Activated carbon
injection
Secondary 80 000 Maximum 1206 32 97
Minimum 37,2 2,7 93
Source: Best available techniques (BAT) reference document for the non-ferrous metals industries 1841
European Commission, Joint Research Centre, Seville, 2014 1842
1843
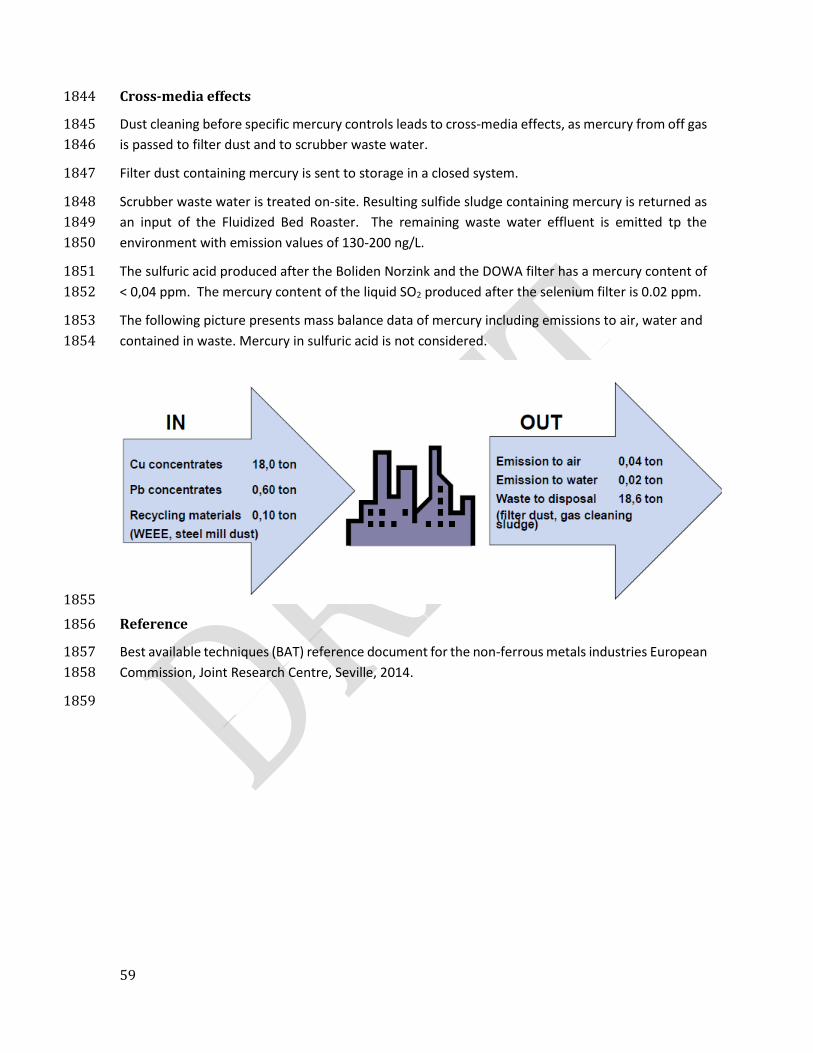
59
Cross-media effects 1844
Dust cleaning before specific mercury controls leads to cross-media effects, as mercury from off gas 1845
is passed to filter dust and to scrubber waste water. 1846
Filter dust containing mercury is sent to storage in a closed system. 1847
Scrubber waste water is treated on-site. Resulting sulfide sludge containing mercury is returned as 1848
an input of the Fluidized Bed Roaster. The remaining waste water effluent is emitted tp the 1849
environment with emission values of 130-200 ng/L. 1850
The sulfuric acid produced after the Boliden Norzink and the DOWA filter has a mercury content of 1851
< 0,04 ppm. The mercury content of the liquid SO2 produced after the selenium filter is 0.02 ppm. 1852
The following picture presents mass balance data of mercury including emissions to air, water and 1853
contained in waste. Mercury in sulfuric acid is not considered. 1854
1855
Reference 1856
Best available techniques (BAT) reference document for the non-ferrous metals industries European 1857
Commission, Joint Research Centre, Seville, 2014. 1858
1859
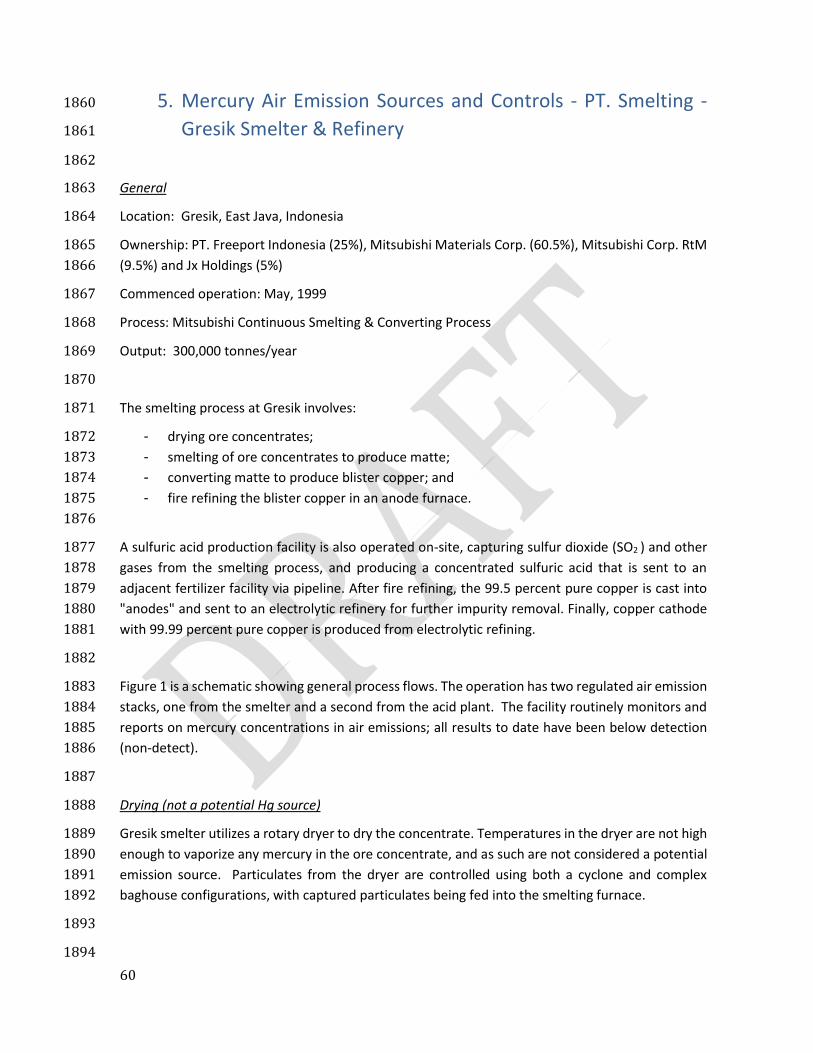
60
5. Mercury Air Emission Sources and Controls - PT. Smelting - 1860
Gresik Smelter & Refinery 1861
1862
General 1863
Location: Gresik, East Java, Indonesia 1864
Ownership: PT. Freeport Indonesia (25%), Mitsubishi Materials Corp. (60.5%), Mitsubishi Corp. RtM 1865
(9.5%) and Jx Holdings (5%) 1866
Commenced operation: May, 1999 1867
Process: Mitsubishi Continuous Smelting & Converting Process 1868
Output: 300,000 tonnes/year 1869
1870
The smelting process at Gresik involves: 1871
- drying ore concentrates; 1872
- smelting of ore concentrates to produce matte; 1873
- converting matte to produce blister copper; and 1874
- fire refining the blister copper in an anode furnace. 1875
1876
A sulfuric acid production facility is also operated on-site, capturing sulfur dioxide (SO2 ) and other 1877
gases from the smelting process, and producing a concentrated sulfuric acid that is sent to an 1878
adjacent fertilizer facility via pipeline. After fire refining, the 99.5 percent pure copper is cast into 1879
"anodes" and sent to an electrolytic refinery for further impurity removal. Finally, copper cathode 1880
with 99.99 percent pure copper is produced from electrolytic refining. 1881
1882
Figure 1 is a schematic showing general process flows. The operation has two regulated air emission 1883
stacks, one from the smelter and a second from the acid plant. The facility routinely monitors and 1884
reports on mercury concentrations in air emissions; all results to date have been below detection 1885
(non-detect). 1886
1887
Drying (not a potential Hg source) 1888
Gresik smelter utilizes a rotary dryer to dry the concentrate. Temperatures in the dryer are not high 1889
enough to vaporize any mercury in the ore concentrate, and as such are not considered a potential 1890
emission source. Particulates from the dryer are controlled using both a cyclone and complex 1891
baghouse configurations, with captured particulates being fed into the smelting furnace. 1892
1893
1894
61
1895
1896
Mitsubishi Process 1897
In the Mitsubishi Process, feedstock materials are continuously fed to a series of enclosed furnaces. 1898
The furnaces are stationary, tightly sealed, and interconnected by enclosed launders. Small 1899
ventilation hoods placed above the furnace inlets and outlets capture all fugitive emissions. 1900
1901
1. Smelting (a potential Hg source) 1902
1903
The smelting produces a copper matte by melting the hot ore concentrates with siliceous flux in a 1904
furnace (S-Furnace). The mattes produced by domestic smelters range from 35 to 65 percent 1905
copper. Smelting furnace technologies operate at temperatures well above the boiling point of 1906
mercury with operating ranges as high as 1200oC. 1907
1908
2. Slag Separation (copper slag) at CL-furnace 1909
1910
Mixtures of matte and slag from smelting furnace are transferred through an enclosed launder to 1911
the electric furnace (CL-furnace) to be separated by differences in specific gravity. Matte is 1912
continuously siphoned out to a converting furnace and the slag, referred to as CL-slag (copper slag), 1913
is overflowed from the furnace for water granulation. Granulated CL-slag is one of the salable by-1914
products from the copper smelter. 1915
1916
62
3. Converting (potential Hg source) 1917
The final step in the production of molten "blister" copper is converting. Converting eliminates 1918
remaining iron and sulfur impurities, leaving 65 to 98.5 percent pure copper (blister copper). 1919
Converting involves molten matte, limestone flux and scrap copper being charged to a furnace (C-1920
Furnace), where oxygen enriched air is blown from the top of the molten matte. 1921
1922
Blister copper is continuously siphoned out to the anode furnace via an enclosed launder. The 1923
molten converting slag formed in the converting furnace (C-furnace), is then water granulated, 1924
dried, and re-cycled to the S-furnace. Converting reactions are exothermic, therefore spent anode 1925
from the electrolytic refinery is utilized as a coolant to control the bath temperature. Off gas from 1926
the C-furnace is also delivered to the Sulfuric Acid Plant through a waste heat boiler and an 1927
electrostatic precipitator for cooling and de-dusting. 1928
1929
4. Anode Furnace (not a potential Hg source) 1930
Blister copper contains approximately 1.5% sulfur. This characteristic influences the electro-refining 1931
process due to the copper anode degrading to low purity and density. This blister copper is purified 1932
in the Anode Furnace in two stages, oxidation and reduction. Copper scrap of high copper grade is 1933
also treated in the Anode Furnace, then melted together with blister copper from the C-furnace. 1934
1935
In the oxidation stage, oxygen-enriched air is injected to oxidize the remaining sulfur to SO2 gas, and 1936
in the reduction stage, the excessive oxygen is reduced using natural gas or MDF. 1937
1938
The molten metal (around 99.4 % Cu) is cast as copper anode using a continuous casting machine 1939
and then delivered to the electro-refining process. The off gas from the anode furnace during the 1940
oxidation stage, is sent to the Acid Plant, while off gas from reduction is returned to the concentrate 1941
dryer, and finally discharged through the stack. 1942
1943
The gas stream to the sulfuric acid plant passes through a range of control devices, including at the 1944
Smelter: 1945
- Waste Heat Boiler 1946
- Electrostatic Precipitator (ESP) 1947
and at the Acid Plant: 1948
- Washing tower 1949
- Venturi Scrubber 1950
- Gas Cooler 1951
- Wet Electrostatic precipitator or Mist Precipitator. 1952
1953
63
These control devices remove metal impurities to prevent destruction of the catalyst in the acid 1954
plant. Any mercury volatilizing in the smelting furnace is captured and removed either in these 1955
multistage control systems or in the sulfuric acid plant. 1956
1957
Following treatment, the smelter stack has an air discharge that is continuously monitored for SO2, 1958
temperature and flow rate. Quarterly chemical analyses show no detectable mercury over the 13 1959
years period of monitoring (DL = 0.008 mg/Nm3). 1960
As the system is entirely enclosed, any mercury contained in the concentrate will be volatilized 1961
during the Mitsubishi Smelting process step, captured and directed toward the sulfuric acid plant. 1962
1963
Sulfuric Acid Plant (potential Hg source) 1964
1965
Data on sulfuric acid plant sludge show that the mercury is present in measurable concentrations. 1966
This sludge (containing mercury) is recycled back to the smelting and converter furnaces and 1967
vaporized again into the control system. This sets up an internal recycling loop for the mercury. 1968
1969
Acid plant off-gas passes through a scrubbing unit, and the final solution generated from gas 1970
absorbing process at the scrubbing unit is recycled to the acid production process in an absorption 1971
process, and finally discharged through the stack. 1972
1973
The stack is continuously monitored for SO2, temperature and flow rate. Quarterly monitoring data 1974
for the last 13 years show no detectable mercury (DL = 0.008 mg/Nm3 ). 1975