Embed Size (px)
Citation preview
IDEA Consult nv Tel: (+32) 02 282 17 10
Kunstlaan 1-2, bus 16 Fax: (+32) 02 282 17 15
B –1210 Brussel www.ideaconsult.be
Final Report
Disclaimer: Views expressed in this report do not neces-
sarily reflect the opinion or the position of the European
Commission
Research team:
IDEA Consult Isabelle De Voldere Griet Jans Eveline Durinck Ecorys NL Nora Plaisier Floor Smakman CIREM Daniel Mirza IWE Andrea Szalavetz
Brussels, March 2012
Study on the Competitiveness
of the EU fashion industries
Ref. Ares(2012)440645 - 11/04/2012Ref. Ares(2012)1040745 - 07/09/2012
Study on the Competitiveness of the EU fashion industries
March 2012 2
Table of Contents
p.
TABLE OF CONTENTS 2
1 INTRODUCTION 5
1.1 Background and objectives of the study _____________________ 5
1.1.1 Context ....................................................................................... 5
1.1.2 Objectives of the study ................................................................. 5
1.2 Analysing sectoral competitiveness: methodological approach ____ 5
1.3 Structure of the report ___________________________________ 7
2 DEFINITION OF FASHION INDUSTRIES AND SCOPE OF STUDY 8
2.1 Introduction ___________________________________________ 8
2.2 Defining fashion and fashion industries ______________________ 8
2.2.1 Fashion and fashion goods ............................................................. 8
2.2.2 Fashion industries ......................................................................... 9
2.2.3 Fashion content, creativity and design........................................... 11
2.2.4 Beyond traditional industry boundaries .......................................... 13
2.3 Fashion industries: business organisation and value chain ______ 17
2.3.1 From idea to final consumer and back: an internationally fragmented value chain ............................................................... 17
2.3.2 ‘Contextual knowledge’ as the key to upgrading through design ....... 18
2.3.3 Flexibility through new power balances and partnerships: the rise of fast fashion and mass-customisation ......................................... 19
2.3.4 The fashion industries’ value chain................................................ 20
2.4 Setting the scope for the further analysis ___________________ 23
2.4.1 Towards a workable definition of fashion industries ......................... 23
3 ANALYSIS OF THE EU FASHION INDUSTRIES’ ECONOMIC STRUCTURE AND
COMPETITIVE POSITION 26
3.1 Translating the framework for scoping the ‘fashion industries’
into quantitative analysis ________________________________ 26
3.2 Size and structure of the EU fashion industries _______________ 27
3.2.1 Total EU fashion industries........................................................... 27
3.2.2 Fashion manufacturing ................................................................ 28
3.2.3 Fashion distribution .................................................................... 35
3.2.4 Indirect economic impact of the EU fashion industries ..................... 40
3.3 Economic performance __________________________________ 41
3.3.1 Turnover ................................................................................... 41
3.3.2 Value added and productivity ....................................................... 42
3.3.3 Profitability ................................................................................ 47
3.3.4 Consumer market evolution ......................................................... 50
3.3.5 Conclusion ................................................................................. 51
Study on the Competitiveness of the EU fashion industries
March 2012 3
3.4 Global competitive position ______________________________ 52
3.4.1 Data description ......................................................................... 52
3.4.2 EU27 trade in Fashion industries: Facts and Figures ........................ 53
3.4.3 EU27 Fashion Trade across ‘quality’ segments ................................ 61
3.4.4 EU performance v/s that of its main competitors in the different segments of the fashion markets .................................................. 62
3.4.5 Increased competition from non EU-countries ................................ 66
3.4.6 Consolidation of the global fashion industry ................................... 68
3.4.7 Resulting adjustments in the EU fashion sector .............................. 69
3.4.8 Conclusion ................................................................................. 70
4 BUSINESS MODELS AND DIVERSIFICATION STRATEGIES 72
4.1 Luxury Fashion Brands __________________________________ 73
4.2 Premium Fashion Brands ________________________________ 76
4.3 Vertically Integrated Fashion Retailers ______________________ 1
4.4 Department Stores and Mass Retailers with Private Labels ______ 80
4.5 Independent actors (e.g. designers, manufacturers, retailers) ___ 82
4.5.1 Independent fashion designers ..................................................... 82
4.5.2 Independent fashion manufacturers .............................................. 83
4.5.3 Independent fashion retailers ...................................................... 84
4.6 Online retailing ________________________________________ 85
4.7 Summary of key developments in the fashion value chains ______ 87
5 THE INTERNAL DRIVERS OF COMPETITIVENESS FOR THE EU FASHION
INDUSTRIES 89
5.1 R&D and innovation ____________________________________ 89
5.1.1 Technological RDI trends and efforts ............................................. 91
5.1.2 Non-technological RDI efforts ....................................................... 95
5.1.3 Barriers to innovation.................................................................. 97
5.1.4 Policy initiatives to stimulate innovation ........................................ 98
5.2 Human capital and skills development ______________________ 99
5.2.1 Current employment profile ....................................................... 100
5.2.2 Main drivers of future skills demand in fashion industries............... 103
5.2.3 Challenges for EU fashion businesses to respond to (changing) skills needs .............................................................................. 105
5.3 Access to finance _____________________________________ 107
5.3.1 Potential market failure ............................................................. 107
5.3.2 Impact on EU fashion businesses ................................................ 108
5.3.3 (Policy) initiatives to facilitate access to finance ........................... 109
6 EXTERNAL DRIVERS INFLUENCING THE COMPETITIVENESS OF THE EU
FASHION INDUSTRIES 110
6.1 Access to new markets and trade policy ___________________ 110
6.1.1 Emerging consumer markets for fashion goods ............................ 110
6.1.2 Impact on fashion businesses .................................................... 116
6.2 Changing consumer behaviour ___________________________ 116
6.2.1 From functionality to experiences ............................................... 116
Study on the Competitiveness of the EU fashion industries
March 2012 4
6.2.2 The consumer as ‘prosumer’ ...................................................... 119
6.2.3 Impact of changing consumer behaviour on fashion businesses ...... 122
6.3 Technological developments ____________________________ 123
6.3.1 New production methods ........................................................... 123
6.3.2 New distribution methods - internet retailing ............................... 126
6.3.3 New materials development: the case of technical textiles ............. 131
6.3.4 Impact of new technological developments on fashion businesses .. 135
6.4 Sustainability ________________________________________ 137
6.4.1 Environmental challenges .......................................................... 137
6.4.2 Societal challenges ................................................................... 139
6.4.3 The road to sustainable fashion .................................................. 141
6.4.4 Impact of increased attention for sustainable growth on fashion businesses ............................................................................... 144
6.5 Raw materials and energy ______________________________ 147
6.5.1 Textile fibres ............................................................................ 147
6.5.2 Leather ................................................................................... 149
6.5.3 Energy .................................................................................... 151
6.5.4 Impact on fashion businesses .................................................... 154
6.6 Intellectual property rights (IPR) protection ________________ 155
6.6.1 The problem of counterfeiting and piracy in fashion ...................... 155
6.6.2 Existing mechanisms to protect IPR ............................................ 159
6.6.3 Impact of (violation of) IPR on fashion businesses ........................ 162
7 CONCLUSIONS 164
7.1 An industry at the heart of the structural transformation of
Europe’s economy ____________________________________ 164
7.2 The way forward? _____________________________________ 164
7.3 Different players with different challenges ahead ____________ 165
7.4 Priority areas for further action __________________________ 167
TABLE OF FIGURES 169
TABLE OF TABLES 172
TABLE OF BOXES 173
REFERENCES 174
ANNEX 1: DEFINITION FASHION INDUSTRIES 183
ANNEX 2: EXAMPLES OF HS6 PRODUCTS IN BACI DATASET, AGGREGATED TO THE 4 SUB-
CATEGORIES 185
Study on the Competitiveness of the EU fashion industries
March 2012 5
1 INTRODUCTION
1.1 Background and objectives of the study
1.1.1 Context
The fashion industries are situated at the crossroad between creative industries, well-established manufacturing industries and services industries. It is one of the industries where the promotion of interdisciplinary collaboration between creative industries and other industries/activities can contribute to further economic growth and a strengthening of the competitive position of the EU economy as a whole.
On the basis of the Communication on an Integrated Policy for the Globalisation Era Putting Competitiveness and Sustainability at Centre Stage1 and following the Green Paper on Unlocking the potential of the cultural and creative industries (2010)2, the European Commission plans to publish a Communication on the key aspects of the competitiveness of the EU fashion industries. The Communication will also propose strategic initiatives to refine the current industrial policy ap-proach towards the fashion industries in light of the Green Paper. However, up to date the Commission has not approached the fashion industries as such.
1.1.2 Objectives of the study
The main objective of the study is to clearly delineate the fashion industries and make a quantitative analysis of the EU fashion industries’ economic performance and competitiveness.
As part of this overall objective, the study will focus on the following activities (in order of importance):
• Study the concept of “fashion industries” and propose a relevant and workable definition;
• Make a quantitative analysis of the EU fashion industries’ structure, input factors, outcomes and competitive position vis-à-vis the rest of the world;
• Analyse the key drivers of competitiveness of the fashion industries.
The study will provide input to the European Commission when writing the Com-munication on the competitiveness of the EU fashion industries and formulating policy initiatives towards the industry.
1.2 Analysing sectoral competitiveness: methodological ap-
proach
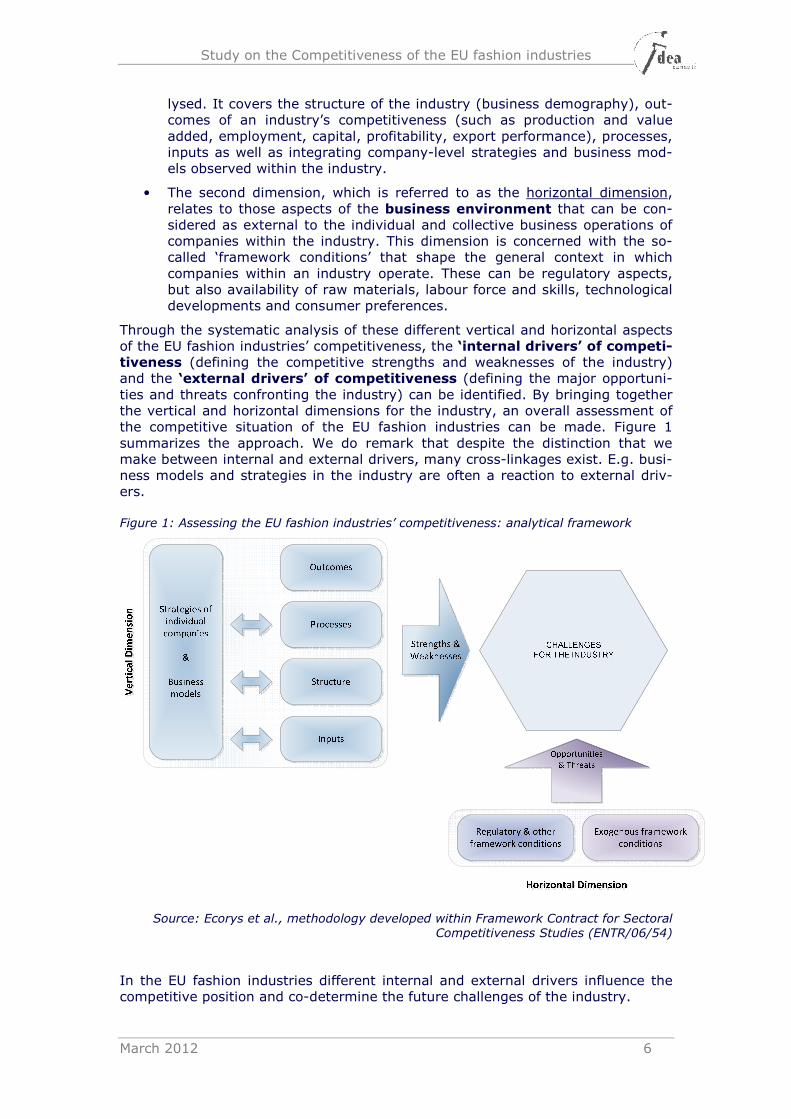
To assess the competitiveness of the EU fashion industries, this study will make use of the competitiveness model that has been developed within the context of the Framework Contract for Sectoral Competitiveness Studies (ENTR/06/54) for DG Enterprise & Industry of the European Commission. This approach is founded upon a distinction between two different dimensions of competitiveness:
• The first dimension, which is referred to as the vertical dimension, relates to the situation and internal dynamics within the industry being ana-
1 European Commission (2010a) 2 European Commission (2010b)
Study on the Competitiveness of the EU fashion industries
March 2012 6
lysed. It covers the structure of the industry (business demography), out-comes of an industry’s competitiveness (such as production and value added, employment, capital, profitability, export performance), processes, inputs as well as integrating company-level strategies and business mod-els observed within the industry.
• The second dimension, which is referred to as the horizontal dimension, relates to those aspects of the business environment that can be con-sidered as external to the individual and collective business operations of companies within the industry. This dimension is concerned with the so-called ‘framework conditions’ that shape the general context in which companies within an industry operate. These can be regulatory aspects, but also availability of raw materials, labour force and skills, technological developments and consumer preferences.
Through the systematic analysis of these different vertical and horizontal aspects of the EU fashion industries’ competitiveness, the ‘internal drivers’ of competi-
tiveness (defining the competitive strengths and weaknesses of the industry) and the ‘external drivers’ of competitiveness (defining the major opportuni-ties and threats confronting the industry) can be identified. By bringing together the vertical and horizontal dimensions for the industry, an overall assessment of the competitive situation of the EU fashion industries can be made. Figure 1 summarizes the approach. We do remark that despite the distinction that we make between internal and external drivers, many cross-linkages exist. E.g. busi-ness models and strategies in the industry are often a reaction to external driv-ers.
Figure 1: Assessing the EU fashion industries’ competitiveness: analytical framework
Source: Ecorys et al., methodology developed within Framework Contract for Sectoral Competitiveness Studies (ENTR/06/54)
In the EU fashion industries different internal and external drivers influence the competitive position and co-determine the future challenges of the industry.
Study on the Competitiveness of the EU fashion industries
March 2012 7
An example of an internal driver is the labour intensive character of the manufac-turing of apparel (cfr. ‘inputs’ in Figure 1). The high cost of labour in Europe vis-à-vis other parts of the world has been one of the driving forces behind the use of globally dispersed production chains by numerous EU fashion companies (as well as by fashion companies in other developed countries), with design, marketing and retail remaining in Europe (so-called “head-tail companies”) and manufactur-ing being relocated to low cost countries. Long term falling prices in markets for fashion goods exacerbate this situation.
An example of an external driver is technological developments in ICT and engi-neering or technical textiles. E-commerce e.g. allows producers to use consumer feedback to adopt their products within a very short time, leading to potentially mass customisation of fashion products. Web blogs, user reviews and social net-works are new sources for consumer feedback, that allow for short term reactions at the producer size. Also developments in technical textiles provide new oppor-tunities for the fashion industries to respond to new consumer trends, such as a growing awareness for health-related aspects (see also Box 2 on p. 24). These new technological developments imply a growing demand for highly skilled work-ers in the fashion industries. A lack of sufficiently qualified personnel in the EU might have a negative impact on the competitive position of the EU fashion indus-tries.
The above framework to assess an industry’s competitiveness allows us to ana-lyse the current competitive position of the EU fashion industries and the key drivers that have an influence on the competitiveness of the fashion industries in a systematic way.
1.3 Structure of the report
Following this introduction, chapter two of the report focuses on the definition of the fashion industries. The aim is to come to a workable definition of fashion in-dustries in light of the competitiveness analysis. Chapter three describes the eco-nomic structure of the EU fashion industries and makes a quantitative analysis of the current competitive position. Chapter four discusses the most common busi-ness models and strategic clusters in the industry. Chapters 5 and 6 focus on the main internal and external drivers that influence the competitiveness of the EU fashion industries, based on literature review, and reflect on the (potential) im-pact of these drivers on the fashion industries and different types of actors. Chap-ter 6 concludes the report.
Study on the Competitiveness of the EU fashion industries
March 2012 8
2 DEFINITION OF FASHION INDUSTRIES AND SCOPE
OF STUDY
2.1 Introduction
The analysis of an industry’s economic performance and competitive position starts from a clear definition of what exactly comprises the industry. This is also the case for the fashion industries. However, a number of elements contribute to making the definition phase for the fashion industries more complex:
- ‘fashion industries’ is not a term that is used in internationally recognized industry classifications and existing literature does not provide us with a single definition;
- The concept of ‘fashion’ is vague in itself. The intangible characteristics of ‘fashion’ contribute to a subjective appreciation of the concept. As a con-sequence, also the concept of ‘fashion goods’ is subject to discussion in existing literature.
At EU level, a number of recent policy documents do refer to the importance of fashion and fashion design in Europe’s competitiveness (e.g. COM(2010)1833, SEC(2009)5014). But a clear delineation of the industry is lacking at the moment, which prevents further economic analysis and industrial policy development.
A key aspect of this study is to evaluate possible definitions of the fashion indus-tries and suggest a workable definition, based on literature and an analysis of the different activities that should be included. Based on a review of the literature, first we will look at some of the general definitions of fashion and fashion indus-tries that can be found. Subsequently we turn to the activities that these fashion industries are seen to comprise and elaborate on the fashion industries’ produc-tion chain, as a conceptual framework for analysing the complex interactions be-tween different business activities and different industries.
Having thus set the stage we will propose a definition for the fashion industries, distinguishing between fashion goods industries and connected industries. The purpose of this exercise is to finally come up with a workable definition of fashion industries. The derived working definition and scope will provide the basis for fur-ther analysis of the fashion industries’ structure, business models, competitive position and key drivers of competitiveness.
2.2 Defining fashion and fashion industries
2.2.1 Fashion and fashion goods
According to the online encyclopaedia Wikipedia, the definition of fashion is:
“… a general term for a currently popular style or practice, especially in cloth-ing, footwear or accessories. Fashion references to anything that is the cur-
rent trend in look and dress up of a person.”
The online dictionary Dictionary.com5 defines fashion as:
- “The prevailing style or custom, as in dress or behavior: out of fashion.
3 European Commission (2010b) 4 European Commission (2009) 5 http://dictionary.reference.com/browse/fashion
Study on the Competitiveness of the EU fashion industries
March 2012 9
- Something, such as a garment, that is in the current mode: a swimsuit that is the latest fashion.
- The style characteristic of the social elite: a man of fashion.”
In many ways the concept of fashion carries within it different intangible qualities related to image, identity, social values, meaning or cultural expression. Fashion products therefore tend to have a symbolic value next to their strictly utilitarian value.
Despite the fact that there is no exact definition in the (scientific) literature on fashion and fashion goods, the majority of the consulted sources point to a num-ber of key characteristics:
• Fashion goods are consumer goods;
• Fashion is about personal dress and relates to personal image building. This last characteristic is not unique for fashion goods, but can also be found in e.g. luxury goods;
• Central to fashion is the combination of functionality with ‘symbolic
value’, a characteristic where we see links with cultural and creative goods and design goods;
• Critical factors in the creation of ‘symbolic value’ are creativity (in first in-stance translated in the design of fashion goods), branding and mar-
keting, often reinforced by artisan work in manufacturing;
• Fashion goods are highly trend sensitive.
Based on these characteristics the following categories of products can be
considered ‘fashion goods’:
• Apparel
• Footwear
• Accessories that are part of a person’s personal dress (e.g. hats, scarves, belts, handbags, jewellery)
2.2.2 Fashion industries
Just as it is difficult to capture the concept of fashion in one single definition, de-fining fashion industries is very hard and the literature consulted does not provide one clear and exclusive definition. We will therefore consider first what these in-dustries are seen to comprise in terms of companies, products and characteris-tics, after which we will take a closer look at the various activities related to fash-ion industries and how they are (inter-)linked in production chains (section 2.3).
Quite often the term fashion industry is used without a clear definition of what it does or does not comprise. However, in almost all instances, it is closely linked to the clothing industry (also referred to as garment or apparel industry). As Hauge (2004) argues:
“The fashion industry is closely related to the clothing industry, but (the two) are not synonymous. In the clothing industry it is the actual garment that is the end product, but in the fashion industry this is only, though vital, one of many inputs that will lead to a symbolically and aesthetically charged product of end consum-ers. One can say that image is the form and fashion is the function. An analysis of the fashion industry would nevertheless be ridden with major shortcomings, with-
Study on the Competitiveness of the EU fashion industries
March 2012 10
out a thorough understanding of how the clothing industry works.” (Hauge, 2004, p. 3)
As fashion products are seen to accentuate personal image or meaning, they are clearly not strictly confined to garments. For instance a fashion brand presenting its new collection will often do so using a number of different fashion products, including shoes, hand bags, belts or scarves.
Imagine..Creative Industries Research (2005) applies a broad definition, consid-ering fashion industries to include “producers of bags, shoes, jewellery and acces-sories in general” but also ”companies performing supportive activities such as PR agencies, model agencies, stylists and photographers [and] (w)holesalers and retailers”.
Two aspects of fashion industries that clearly stand out in the literature as defini-tive are the important role of design and branding in these industries. It is through design and branding that companies try to create fashion goods that re-flect an identity or image conveying e.g. prestige, exclusivity, quality, attitude, lifestyle, etc. recognised by (a specific group of) consumers, willing to pay a pre-mium based on this identity.
The process of producing garments and any other fashion products for that mat-ter usually begins with design. Designers may work for retailers, for producers or as independents / for specialised design houses. It is probably useful to distin-guish between three types of design(er)s: (1) original or trend-setting designs, by designers who anticipate and to a certain extent shape trends, (2) trend following designs, for which designers may pick up information from fashion fairs, catwalk shows, local street fashion, films, music videos and other media or trend analysts and (3) basic design, which could be provided by e.g. manufacturers’ designers, who may tailor such designs more specifically according to the collection of spe-cific retailers (often in collaboration with designers from the retailers).
As design and branding have become increasingly important features of competi-tiveness for fashion industries in developed regions in particular (such as the EU), many fashion companies in the EU have increasingly built up competencies to-wards the creative processes and activities such as design, marketing and sales. This strategy seems to have been applied by both EU producers, who increasingly integrated activities such as marketing, distribution and retailing into the business and by EU retailers, who have conversely increasingly integrated into, or strengthened their control over design processes (see e.g. Imagine..Creative In-dustries Research, 2005).
As has been pointed out by several authors (e.g. Hauge, 2004; Imagine..Creative Industries Research, 2005; Aspers, 2010) fashion industries are knowledge based industries, with knowledge relating to design, high quality production, marketing and sales providing the competitive asset of many EU fashion companies.
As Aspers (2010) explains, a key to successful branding of fashion goods is un-derstanding ‘what sells’ in a specific market, implying not just having design and high quality production capabilities, but also understanding how this is interpreted in specific cultures, i.e. what kind of meaning is attached to it, so fashion compa-nies may carve out niches in the market. In other words, successful brands com-bine aspects of design with corresponding production quality and marketing to create their identities. However, they may have to adjust their product and mar-keting mixes in different markets.
Study on the Competitiveness of the EU fashion industries
March 2012 11
From the (scientific) literature, the following elements can be extracted as key characteristics of the fashion industries:
• It is a set of companies who are directly active in the B-to-C production chain of fashion goods, starting with the design of fashion goods and ending with retail to the final customer.
• Design, high quality production, branding and marketing are differ-entiating business functions.
• Business activities are organised to respond to the strong “trend sensi-tivity” of fashion goods, resulting in a fast succession of new collections.
Companies that have their core business in these types of activities, can be seen as fashion companies, whatever their role in the production chain.
2.2.3 Fashion content, creativity and design
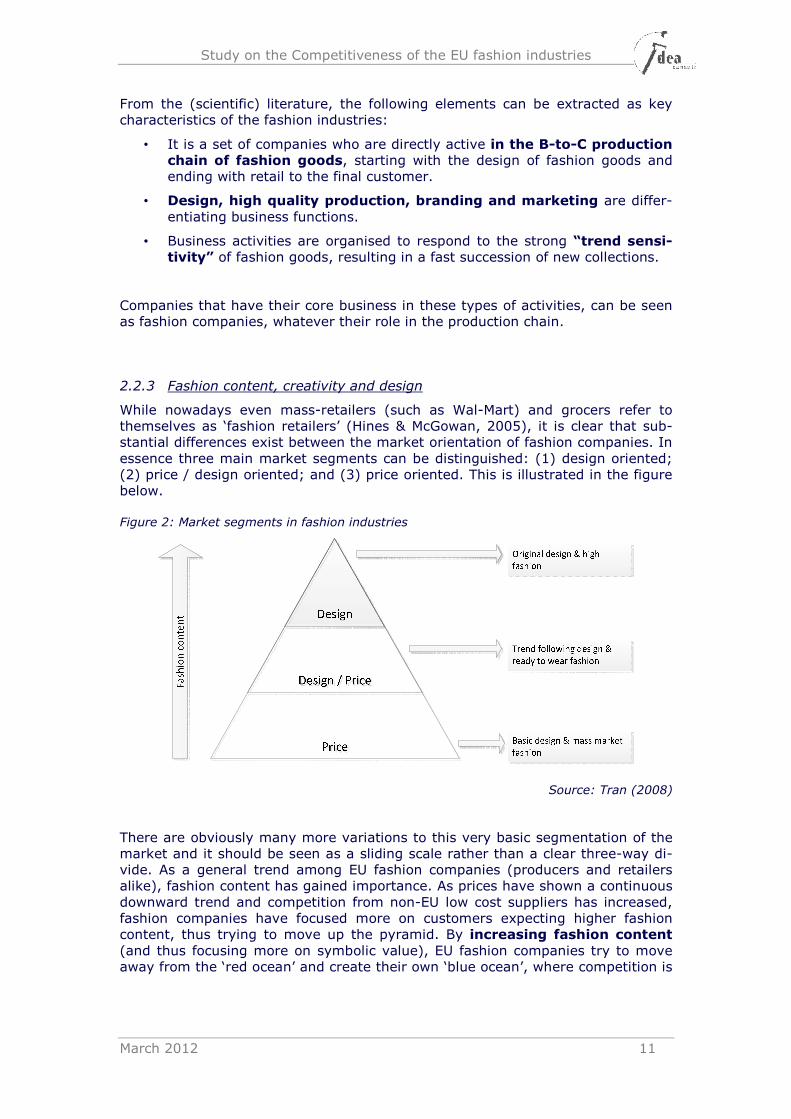
While nowadays even mass-retailers (such as Wal-Mart) and grocers refer to themselves as ‘fashion retailers’ (Hines & McGowan, 2005), it is clear that sub-stantial differences exist between the market orientation of fashion companies. In essence three main market segments can be distinguished: (1) design oriented; (2) price / design oriented; and (3) price oriented. This is illustrated in the figure below.
Figure 2: Market segments in fashion industries
Source: Tran (2008)
There are obviously many more variations to this very basic segmentation of the market and it should be seen as a sliding scale rather than a clear three-way di-vide. As a general trend among EU fashion companies (producers and retailers alike), fashion content has gained importance. As prices have shown a continuous downward trend and competition from non-EU low cost suppliers has increased, fashion companies have focused more on customers expecting higher fashion content, thus trying to move up the pyramid. By increasing fashion content (and thus focusing more on symbolic value), EU fashion companies try to move away from the ‘red ocean’ and create their own ‘blue ocean’, where competition is
Study on the Competitiveness of the EU fashion industries
March 2012 12
less fierce6. As a consequence, linkages with cultural and creative industries, and especially the design industry, have been strengthened over time.
2.2.3.1 Link with cultural and creative industries
The cultural and creative industries (CCI) cover a diverse group of disciplines such as e.g. visual arts, music, literature, film. One characteristic that unites this group, is the fact that their core ‘business’ is the creation of symbolic value through the provision of creative experiences (performing arts, visual arts), crea-tive content (audiovisual industry, music, film, books, games, fashion design) or creative services (design, architecture, advertising, new media) (HKU, 2010). As the importance of symbolic value has increased in the EU fashion industries, the interaction with the CCI has increased as well. An important trend over the last few years to increase fashion content in specific medium to lower-end segments, is to use the strengths of creative industries and attract high-end fashion design-ers to design special collections for lower-end brands (e.g. Karl Lagerfeld design-ing a collection for H&M). With these collaborations lower-end brands gain publici-ty, target new clients and try to obtain a competitive advantage vis-à-vis others.
Despite the close link with the CCI, Tran (2008) does remark that fashion goods are different from most CCI goods in the sense that fashion is a blend between a cultural and a functional product. Unlike most other CCI products (such as music, motion pictures, publishing, etc.), fashion goods offer a basic functional service to customers (clothing for keeping us warm, hats for protecting us from sun and rain, etc). However, the link with the CCI has become indispensable for the EU fashion industries to create economic value.
The growing potential of cultural and creative industries to contribute to the com-petitiveness of EU industries (such as fashion) and the EU’s overall competitive-ness has clearly been highlighted in the 2010 Green Paper on Cultural and Crea-tive Industries (EC, 2010b).
2.2.3.2 Link with design industries
Design is a very broad concept that involves not only aesthetic design but also includes functional design, e.g. to incorporate environmental (eco-design) or safety considerations. Design activities are widely used, both in high tech indus-tries (e.g. aerospace industry) and in medium to lower tech industries such as the furniture industry or fashion industries. Whereas parts of the design industry clearly belong to the CCI and/or fashion industries, other parts have less obvious links to both other industries.
Especially in more developed markets, design has become an important driver in creating a unique competitive advantage that helps to move away from pure price competition. This is not different in the fashion industries. Whereas design always has been at the centre of the production process of high-end and especially avant-garde fashion (where fashion content is central, see Figure 2), design gains significant importance across all fashion led market segments in the nowadays ‘experience economy’7.
6 Kim, W.C. and Mauborgne, R. (2005) – Whereas in a “red ocean strategy” companies compete head-
to-head with other suppliers for known customers in an existing industry, the “blue ocean strate-gy” tries to align innovation with utility, price and cost positions to create uncontested market space by reconstructing market boundaries and reaching beyond existing demand.
7 Cfr. Pine, J. and Gilmore, J. (1999) - The term ‘experience economy’ has been introduced by Pine and Gilmore to refer to an economy where the willingness to pay of customers (partly) depends on the experience that customers link to a product or service. Companies create added value by charging for the feeling that customers get by engaging it, not so much for the tangible good.
Study on the Competitiveness of the EU fashion industries
March 2012 13
2.2.4 Beyond traditional industry boundaries
The previous discussion implies that the fashion industries (i.e. the whole set of companies involved in the design, production and/or distribution of fashion goods) are “transversal” or “hybrid”, cross-cutting different traditionally (i.e. in existing official industry classifications such as NACE) defined industries. Both manufacturing and services sub-industries are part of the fashion industries. Within the services industries not only wholesale and retail industries are in-volved, but also part of the design industry (fashion design).
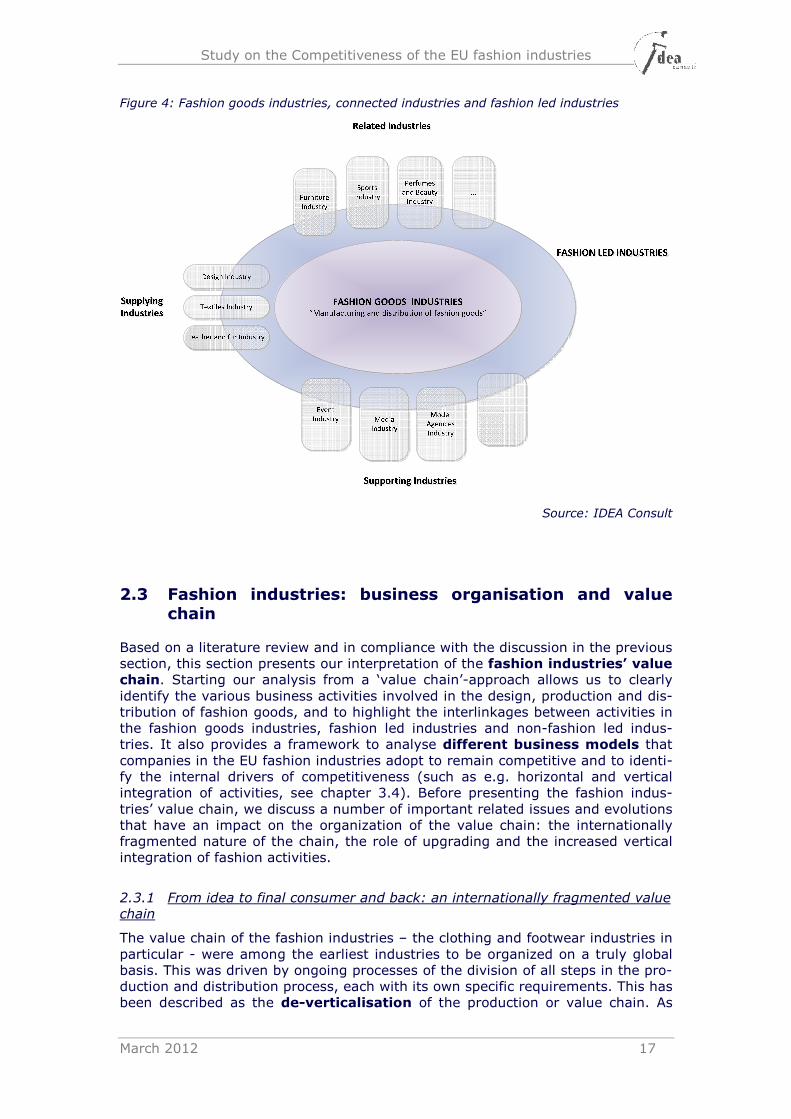
Next to the ‘traditional’ (i.e. as defined in official industry classifications) sub-industries that are directly - and as a whole8 - active in the design, production and/or distribution of fashion goods (we call them hereafter “fashion goods in-dustries” and include manufacturers and distributors of fashion goods), a num-ber of other sub-industries have (strong) connections with the above set of fash-ion goods industries. We distinguish three types of such “connected indus-tries”9 to the fashion goods industries: supplying industries, supporting indus-tries and related industries. In each of these connected industries we find compa-nies that directly interact with fashion goods companies (we call this part of these industries to be “fashion led”) and other companies that do not interact with fashion goods companies. In most of the connected industries however, the set of fashion led companies (i.e. those interacting with fashion goods companies) rep-resents only a minority (although in many – especially related - industries grow-ing (cfr. the “experience economy”)). Exceptions to this are the textiles, leather and fur industry (see further).
2.2.4.1 Supplying industries
Supplying industries are those industries that supply intermediate goods and ser-vices directly to the fashion goods manufacturers. The most important supplying industries are the textiles, leather and fur industries and the design industry10. The value added of these industries in the entire fashion business process is much higher than the value added of supplying industries in many other industries’ pro-duction chains. This is linked to the importance of the symbolic value, the aes-thetics and the image of fashion goods. While all production activities start from raw materials and intermediate goods to produce the final good, supplying indus-tries in the fashion value chain also put a substantial mark on the symbolic value of the final fashion goods. This is especially the case for the design, textiles, leather and fur industry, with whom the fashion goods industries have a strong two-way interaction to define fashion collections in terms of design, colours, ma-terial use and quality. Intermediary organisations can play an important role in stimulating this two-way interaction. Box 1 provides an illustration of such model of collaboration.
Examples of companies that strongly focus on creating experiences are e.g. Starbucks or Apple. Both companies successfully manage to charge a premium for the experience that consumers link to drinking a Starbucks coffee or working with a Mac.
8 i.e. the large majority of companies in those sub-industries are active in the design, production and/or distribution of fashion goods. We remark that each of these sub-industries also contain a (minor) set of companies that cannot be directly associated with ‘fashion goods’. E.g. manufac-turers of industrial clothing
9 Again ‘as defined in official industry classifications’ 10 In the meaning of ‘the group of companies whose core activity is designing goods or services’. The
design industry consists of fashion designers, interior designers, graphic designers, industrial de-signers and other specialised designers. Part of the design industry (namely fashion designers) provides services to the fashion industries. Do remark that in the fashion industries ‘fashion de-sign’ in the meaning of the fashion design activity is not only provides by the design industry, but is incorporated in many companies throughout the fashion value chain.
Study on the Competitiveness of the EU fashion industries
March 2012 14
Box 1: The role of Kopenhagen Studio to stimulate innovation and collaboration in the fashion industry
Denmark is the world's largest producer of mink skins with an annual production of around 14 million mink skins. A focal point in the trade of fur in Denmark is Kopenhagen Fur, a cooperative company owned by approximately 1,500 Danish fur breeders that hosts the largest fur auction house in the world. The auction house provides a key platform for fur breeders to get access to the international market for the trade of fur.
Apart from providing the link between fur farmers and traders, Kopenhagen Fur also plays an important role in enhancing the competitiveness of the fur
industry by stimulating collaboration and innovation across the fashion
value chain. In 2005 Kopenhagen Studio was established as Kopenhagen Fur's centre for creativity, innovation and craftsmanship. The aim of Kopenhagen Stu-dio is to explore new techniques to utilize fur, detect new niches for fur applica-tions, create product awareness with designers and to share market intelligence with all stakeholders. Employees at Kopenhagen Studio continuously interact and collaborate with breeders, furriers, designers, education institutes and other stakeholders to combine creative ideas and specialized skills to develop new products and to promote the use of fur.
Kopenhagen Studio’s main activities are:
• Gathering market intelligence: In order to give and gain inspiration, Kopenhagen Fur participates in leading fur fairs around the world, from Beijing Fur Fair to Mifur in Milan and Naffem in Toronto, Canada.
• Exploring and promoting new areas of use: Fur is traditionally re-garded as a material for clothing, but interior applications (furniture and other homewear items), footwear and other fashion accessories (belts, bags, jewellery) have become areas with growing opportunities. A broad range of these new applications have been developed at Kopenhagen Studio and been put into production by partners. Many other manufactur-ers have since chosen to focus on this addition to their traditional fur col-lections as well.
• International networking and collaboration to enhance knowledge
spill-overs and stimulate creativity: Kopenhagen Studio works contin-uously with everyone from students to leading design houses, striving to find new ways to use fur. Kopenhagen Studio invites representatives from some of the world's most prestigious fashion houses as well as other creative industries to come and develop new ideas and techniques for us-ing fur. Established as well as up-and-coming designers have the oppor-tunity to work with in-house furriers, who contribute with their profes-sional expertise. These collaborations challenge the traditional perceptions of what it is possible to make out of fur.
• Educating the next generation of furriers and designers: Kopenha-gen Studio invests a lot of time and resources into working with design schools and schools offering furrier education. Kopenhagen Studio also cooperates with the world's top design schools in the training of design-ers. In addition to Kopenhagen Studio in Copenhagen there is also a Ko-penhagen Studio at Tsinghua University in Beijing where fur designers are being educated in order to ensure an ongoing flow of highly-skilled fur de-signers into the fur trade.
Study on the Competitiveness of the EU fashion industries
March 2012 15
(Continue)
• Providing a platform to promote creative talent: Annually Kopenha-gen Fur organizes The Golden Fur Pin, one of Denmark's most prestigious design awards giving young, talented students the opportunity to work creatively with fur.
Through its activities, Kopenhagen Studio provides important linkages in the val-ue chain for many small SMEs to enhance their competitive position.
See also: http://www.kopenhagenfur.com
2.2.4.2 Supporting industries
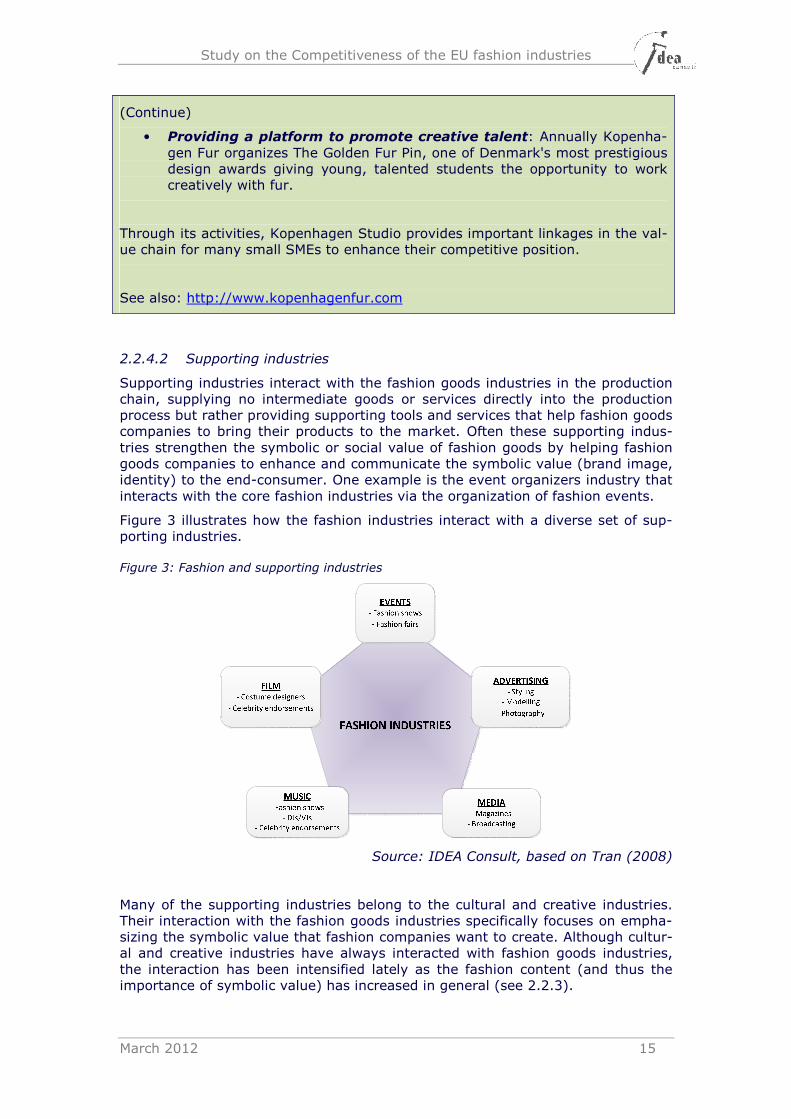
Supporting industries interact with the fashion goods industries in the production chain, supplying no intermediate goods or services directly into the production process but rather providing supporting tools and services that help fashion goods companies to bring their products to the market. Often these supporting indus-tries strengthen the symbolic or social value of fashion goods by helping fashion goods companies to enhance and communicate the symbolic value (brand image, identity) to the end-consumer. One example is the event organizers industry that interacts with the core fashion industries via the organization of fashion events.
Figure 3 illustrates how the fashion industries interact with a diverse set of sup-porting industries.
Figure 3: Fashion and supporting industries
Source: IDEA Consult, based on Tran (2008)
Many of the supporting industries belong to the cultural and creative industries. Their interaction with the fashion goods industries specifically focuses on empha-sizing the symbolic value that fashion companies want to create. Although cultur-al and creative industries have always interacted with fashion goods industries, the interaction has been intensified lately as the fashion content (and thus the importance of symbolic value) has increased in general (see 2.2.3).
Study on the Competitiveness of the EU fashion industries
March 2012 16
2.2.4.3 Related industries
Related industries are not directly or indirectly involved in the production and sales of fashion goods, but also bring goods to the market that consumers might buy to shape their image. Examples are the perfumes and beauty industry, car industry or wine industry. In all these industries we find companies that target specific segments (often the higher end segments) and appeal to customers in similar ways as the fashion goods industries. These fashion led parts of those re-lated industries often market goods that can be grouped under the umbrella of ‘luxury goods’.
A luxury good may be defined as a high quality product, sold at a high price and marketed under a prestigious brand name. Luxury goods are characterized by a high sensitivity to economic fluctuations, high profit margins and very tightly con-trolled brands. Although part of the fashion industries focuses on luxury goods (e.g. Dior, Delvaux), the fashion industries as a whole produce a much broader offer than only luxury goods. Conversely, the group of luxury goods is much broader than only fashion.
The global luxury goods industry is largely concentrated in Europe. Among the first 25 world-wide brands, 18 are European. To a large extent, they create, de-velop, design and manufacture their products in the EU11, and retail them all over the world. 70% of the production is exported. Of the worldwide luxury goods market, Bain & Company (2011) estimate that over 50% of total sales (or around 90 billion €) come from apparel, footwear and accessories, thus making the EU fashion industries a driving force of the luxury goods market.
2.2.4.4 Fashion goods industries and fashion led industries
As a concept, the term “fashion led” is not commonly used in the literature. How-ever, in the context of the delineation exercise on the fashion industries it is a useful concept to frame a number of issues when defining a hybrid industry and to come to the workable definition (see further).
Fashion led industries are industries of which at least part of the industry is connected to the fashion goods industries (as supplying, supporting or related industry), but where fashion does not necessarily take a central position in all companies that operate in the different sub-industries. Of all connected indus-tries, only that group of companies directly supplying, supporting or relating to the fashion goods industries is part of the fashion led industries. It is an aggre-gate that clearly surpasses traditional industry boundaries.
The relation between the concepts ‘fashion goods industries’, ‘connected indus-tries’ and ‘fashion led industries’ is illustrated in the following figure. We will refer to this framework when we will delineate the concept “fashion industries” and set the scope of the further analysis (see section 2.4).
11 Swatch (Switzerland) and Valentino (Italy) manufacture nearly all of their products in their respec-
tive countries, in-house. Hermes, LVMH produce the vast majority of the products in house (70%+) (Source: Wikinvest)
Study on the Competitiveness of the EU fashion industries
March 2012 17
Figure 4: Fashion goods industries, connected industries and fashion led industries
Source: IDEA Consult
2.3 Fashion industries: business organisation and value chain
Based on a literature review and in compliance with the discussion in the previous section, this section presents our interpretation of the fashion industries’ value chain. Starting our analysis from a ‘value chain’-approach allows us to clearly identify the various business activities involved in the design, production and dis-tribution of fashion goods, and to highlight the interlinkages between activities in the fashion goods industries, fashion led industries and non-fashion led indus-tries. It also provides a framework to analyse different business models that companies in the EU fashion industries adopt to remain competitive and to identi-fy the internal drivers of competitiveness (such as e.g. horizontal and vertical integration of activities, see chapter 3.4). Before presenting the fashion indus-tries’ value chain, we discuss a number of important related issues and evolutions that have an impact on the organization of the value chain: the internationally fragmented nature of the chain, the role of upgrading and the increased vertical integration of fashion activities.
2.3.1 From idea to final consumer and back: an internationally fragmented value chain
The value chain of the fashion industries – the clothing and footwear industries in particular - were among the earliest industries to be organized on a truly global basis. This was driven by ongoing processes of the division of all steps in the pro-duction and distribution process, each with its own specific requirements. This has been described as the de-verticalisation of the production or value chain. As
Study on the Competitiveness of the EU fashion industries
March 2012 18
transport and communication costs came down, the various business activities in the value chain were increasingly performed in different locations across the world, to fit best the special requirements of the specific process or step involved (see e.g. Smakman, 2004). While manufacturing activities in the clothing and footwear industries have been subject to relocation to low cost developing coun-tries since the 1960s, design and marketing activities were much less subject to relocation and are still mainly being managed by fashion companies that are con-centrated in developed countries, often in global cities where fashion trends are set. Consumption and production are thus often separated by (substantial) physi-cal distance.
Thus emerged, since the 1960s, increasingly global value chains (GVCs) in the fashion industries, which sometimes span tens of countries from the raw material sourcing to the final consumer. While they involve a network of different (often small and medium) companies, the chains remain largely driven by lead firms. Traditionally, these lead firms were the manufacturers, but over time, and espe-cially since the 1970s, the role and power of branded companies such as ADIDAS and retailers like C&A has grown significantly, to where it can be said that they have been the main driver in organising the industry over the last years. Recent-ly, different trends that influence the fashion industries (e.g. changing consumer behaviour pushing fashion companies towards the production of more collections and higher flexibility, role of fashion blogs and the active consumer (web 2.0)) push for a renewed relationship between manufacturing firms, retailers and con-sumers. It is clear that this renewed relationship influences the EU fashion indus-tries’ structure and competitive position. Also verticalisation and re-
verticalisation are features of European fashion industries.
2.3.2 ‘Contextual knowledge’ as the key to upgrading through design
To enhance the relative competitive position, fashion companies – manufacturers and retailers of fashion goods alike – have always tried (and will continue) to find ways to ‘upgrade’ their business and engage in activities with a higher value add-ed. In the fashion business, it means getting closer to brand manufacturing and/or moving into market niches with high entry barriers, away from those fash-ion segments where competition is fierce.
Aspers (2010) distinguishes four types of upgrading in the fashion business:
• upgrading of the work process • upgrading of the product • knowledge transfer from other industries and functional upgrading • move into the more value-adding (and often the more profitable) activities
such as design and marketing
For some manufacturers in the fashion industries, upgrading means to shift from assembly production to full package production, which includes the interpretation of designs, the making of samples, the sourcing of required inputs, the monitor-ing of product quality and so on. For others, who are already at this level, up-grading means the shift to the development of own brands.
The importance of upgrading is clearly illustrated in Gereffi and Memedovic (2003) where they investigated the prospects for upgrading by developing coun-tries. They pointed out that the key to East Asia’s success was the shift from mere assembly of imported inputs to a more domestically integrated and higher value-added form of exporting (the full-package supply or original equipment manufacturing, or OEM in short). In a next step, Japanese companies and some firms in the East Asian newly industrialized economies (NIEs) even moved on to the original brand name manufacturing (OBM), incorporating new value-adding
Study on the Competitiveness of the EU fashion industries
March 2012 19
activities like design and the sales of their own brands, both for their local market as well as for exporting abroad.
Up till now, the distinguishing activities for EU fashion companies lie in design, high quality (often small scale) production and branding. However, there is in-creasing Asian competition to move up the value chain through design as well. For the first time, a diverse group of designers originating from different Asian countries recently have attracted broad international attention in the fashion in-dustries (e.g. Jason Wu, Thakoon Panichgul). Further, a study of Grail Research (2009) shows the growing importance of other new emerging fashion markets worldwide, including South Africa, the United Arab Emirates, Singapore, India, Russia and Brazil. Important drivers of the fashion industry in these emerging countries are additional government support, an increased recognition of local designers, better awareness of international fashion brands and an increased de-mand for fashion apparel in these countries. As a consequence, the number of large fashion events has significantly increased in these countries over the last ten years. On the other hand, even though competition in these value-adding activities increases on a global scale, they are still highly concentrated in space, even localized within a specific region, city or even at the level of a city area (an area of a few ‘fashion’ blocks in New York and Tokyo) (Aspers, 2010).
Aspers (2010) does point out that the most difficult type of upgrading is upgrad-ing through design. Important in the upgrading process through design is the role of what Aspers calls ‘contextual knowledge’. Contextual knowledge consists of two elements: 1.) the consumers’ life-world, referring to what people take for granted (e.g. basic values, facts, culture,…) and 2.) the ‘province of meaning’ made up by the fashion community. Contextual knowledge stems from the interaction be-tween the global nature of the fashion production market and the access to global fashion trends, creating a global set of provinces of meaning on the one hand, and the local nature of the consumer market and consumers’ life-world on the other hand. It refers to the translation and interpretation by designers of these global fashion trends to own ideas based on their (and their consumers’) life-world, so that global fashion trends get a local interpretation. According to Aspers (2010) it is very difficult for designers to design fashion for consumer markets of which they lack the contextual knowledge. The necessary requirement of contex-tual knowledge impedes Asian manufacturers to completely take over the design from fashion companies in western economies (such as the EU). The specific type of upgrading through design is very difficult to realize if a designer is not familiar with the cultural and social values of the targeted market. And it is exactly this knowledge of what will succeed in the market that the offshore ‘factory’ designers generally lack.
2.3.3 Flexibility through new power balances and partnerships: the rise of fast fashion and mass-customisation
Hines & McGowan (2005) explored the nature of supply-chain strategies of UK high street multiple fashion retailers and their contracted suppliers. They exam-ined implications for sourcing strategies applied to fashion goods, looked at what each of the involved parties want from each other, and identified a number of important implications for fashion retailers and their suppliers, clustered under four core themes: power, process, partnership, and people.
They pointed out two contrasting evolutions in the relationship between fashion suppliers (manufacturing industries) and the retailers:
• On the one hand, fashion retailers are sourcing more and more off-
shore, as a consequence of lower input costs. This intensifies the coordi-nation of their supply chains, in order to ensure sufficient supply and to
Study on the Competitiveness of the EU fashion industries
March 2012 20
minimize the risks of losing sales through non-availability of the imported raw materials.
• On the other hand, the coordination towards the final consumers becomes more complex, since consumers have higher expectations with respect to the fashionable character of the products that they buy than historically has been the case. Therefore also the responsiveness towards the con-sumers, or the time to market, is a crucial element in optimizing their supply chain and sourcing operations.
Consequently, sourcing from two different types of fashion good manufacturers is recommended:
1. Those who can meet the low-cost requirement and are able to supply in large volume, which are mainly offshore suppliers.
2. Those who can quickly supply a selection of pieces, with a higher fashion-standard, in smaller volumes and as a quick response to the changes in fashion trends and consumers’ demand. These are often local/domestic suppliers, who can quickly deliver smaller volumes at low transport costs.
The increasing importance of quick responsiveness in the fashion industries is stressed in several studies (Swoboda et al., 2010; Faust, 2005 and Christopher, Lowson & Peck, 2004). Fifteen years ago, Richardson (1996) already pointed out that competition in the fashion industries is increasingly driven by timing and know-how, where vertically integrated firms have gained the lead, with even full vertical integration of the value chain including design, manufacturing and retail-ing. How fashion goods are subsequently distributed and sold also varies and is rapid-ly changing, with companies increasingly using various channels next to the tradi-tional retail store. This has been enabled by developments in ICT. These devel-opments have not just encouraged innovative new ways of shopping and market-ing (online and e-commerce), it also incorporates the potential to bring back some traditional practices, such as tailor made fashion goods, and make them available for larger scale production (sometimes referred to as mass-customization).
While further market segmentation and shortening of fashion cycles can be seen as demand / consumer driven (i.e. as a reaction to changing consumer prefer-ences), it should be noted that it has in part also been a process driven by delib-erate company strategies. As markets became saturated, prices were lower and competition from global competitors became fiercer, EU fashion companies have tried to tap into or to create new markets that were less price-sensitive. Through targeted product differentiation strategies EU fashion companies have tried to carve out niches, and to an extent to shorten fashion cycles, thus stimulating consumers to buy fashion goods more frequently and fragmenting markets fur-ther. By designing the appropriate marketing mix for each segment, fashion com-panies try to clearly position themselves in the market. We refer to section 3.4 for further discussion.
2.3.4 The fashion industries’ value chain
In section 2.2, we presented a definition of fashion goods industries and fashion led industries from a traditional industrial point of view. In addition, we highlight-ed some recent developments related to the entire fashion process in the previ-ous paragraphs, influencing the business dynamics of the value chain. The final step is to conceptualize the fashion industries in a value chain framework (looking at the different business activities that are involved), taking into account the in-formation from the previous sections.
Study on the Competitiveness of the EU fashion industries
March 2012 21
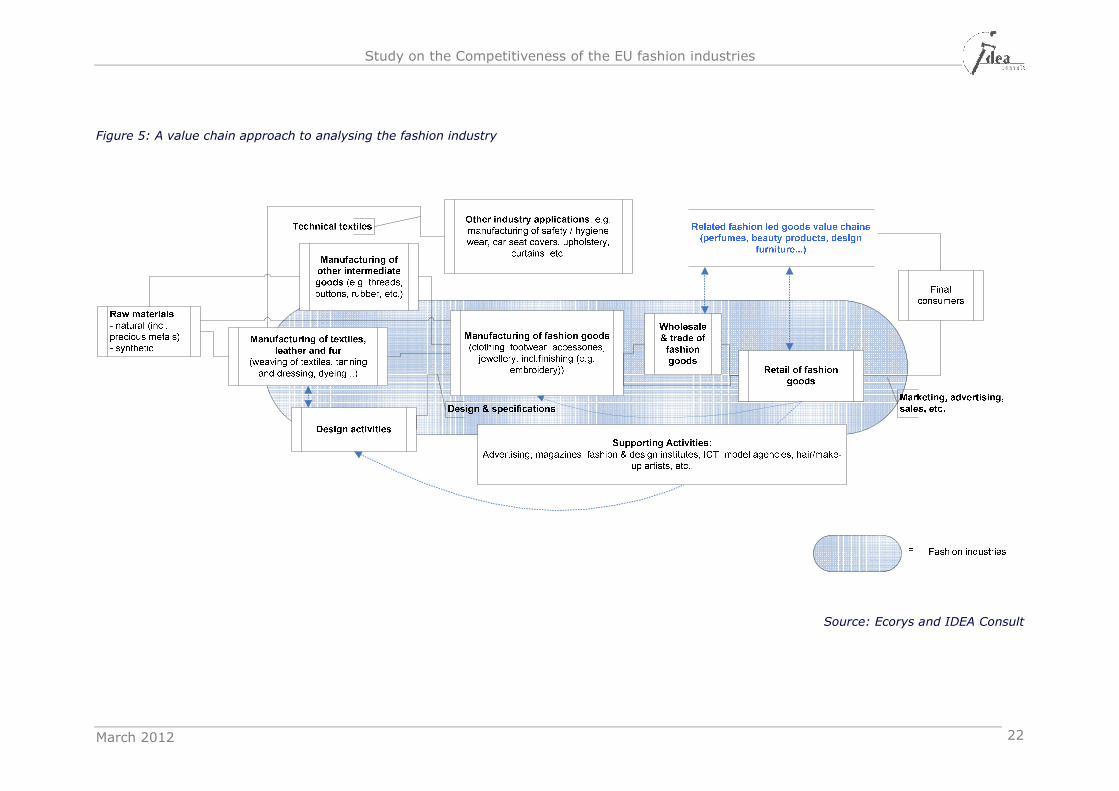
An industry value chain is a physical representation of the various business activi-ties or processes that are involved in producing goods and services, starting with raw materials and ending with the deliverance of the final product to the end-users. Screening the existing literature on fashion industries (e.g. Faust (2005), Swoboda et al. (2010), Hauge (2004), Gereffi and Memedovic (2003), Maskell P. (2005)), we found no unambiguous representation of the fashion industries’ value chain. Therefore, Figure 5 illustrates our vision on the fashion industries’ value chain, based on our broader concept of fashion goods industries and fashion led industries (see paragraph 2.2.3). As we indicated in paragraph 2.3.1, the various processes and activities described in this value chain can take place within the same company or be performed by different companies; they can take place in close proximity or be dispersed over several countries within the EU or globally. This will depend on the business strategies of fashion companies and the im-portance of elements such as time-to-market, cost sensitivity, availability of (skilled) labour etc. Different business models and strategies apply accordingly (cfr. chapter 3.4).
Although Figure 5 illustrates the fashion industries’ value chain as a rather linear process, it is clear that strong feedback loops exist between different activities. Especially information about trends and changes in consumer behaviour has gained importance over the years and feeds back into the retail business (e.g. influencing purchasing strategies), fashion design activities and even the manu-facturing of intermediate goods. Also the availability of raw materials has an im-pact on the design and manufacturing possibilities.
The value chain in Figure 5 only focuses on the activities of companies in the fashion industries and thus on economic actors. However, these economic actors do not operate in isolation and this value chain should be seen as part of a broad-er “eco-system”. Such ecosystem includes knowledge and training organizations that provide that necessary skills to the industry, coaching organizations, re-search institutes that work on relevant research for the fashion industries, net-work organizations that can facilitate the valorisation of knowledge transfer,… In a fragmented industry where many SMEs operate such as the EU fashion indus-try, these intermediary organisations play an important role in the knowledge creation process and thus in enhancing the competitiveness of the industry (see also Box 1).
Study on the Competitiveness of the EU fashion industries
March 2012 22
Figure 5: A value chain approach to analysing the fashion industry
Source: Ecorys and IDEA Consult
Study on the Competitiveness of the EU fashion industries
March 2012 23
2.4 Setting the scope for the further analysis
A clear and workable definition of the EU fashion industries is instrumental for a success-ful execution of the further analysis. As illustrated in sections 2.2 and 2.3, the fashion industries are a hybrid industry covering a complex cluster of activities that can be viewed at from very different angles.
2.4.1 Towards a workable definition of fashion industries
In this section we present our approach to delineate the fashion industries. To this end we refer to Figure 4 and Figure 5, where we distinguish the following clusters of indus-tries that are linked in the fashion value chain:
• fashion goods industries (see paragraph 2.2.3);
• fashion led connected industries (supplying, supporting, related) to the fashion goods industries (see paragraph 2.2.3);
• Other industries, i.e. those industries providing necessary input factors (such as energy) and support (such as IT-support) in the value chain, but where none of the activities are fashion led.
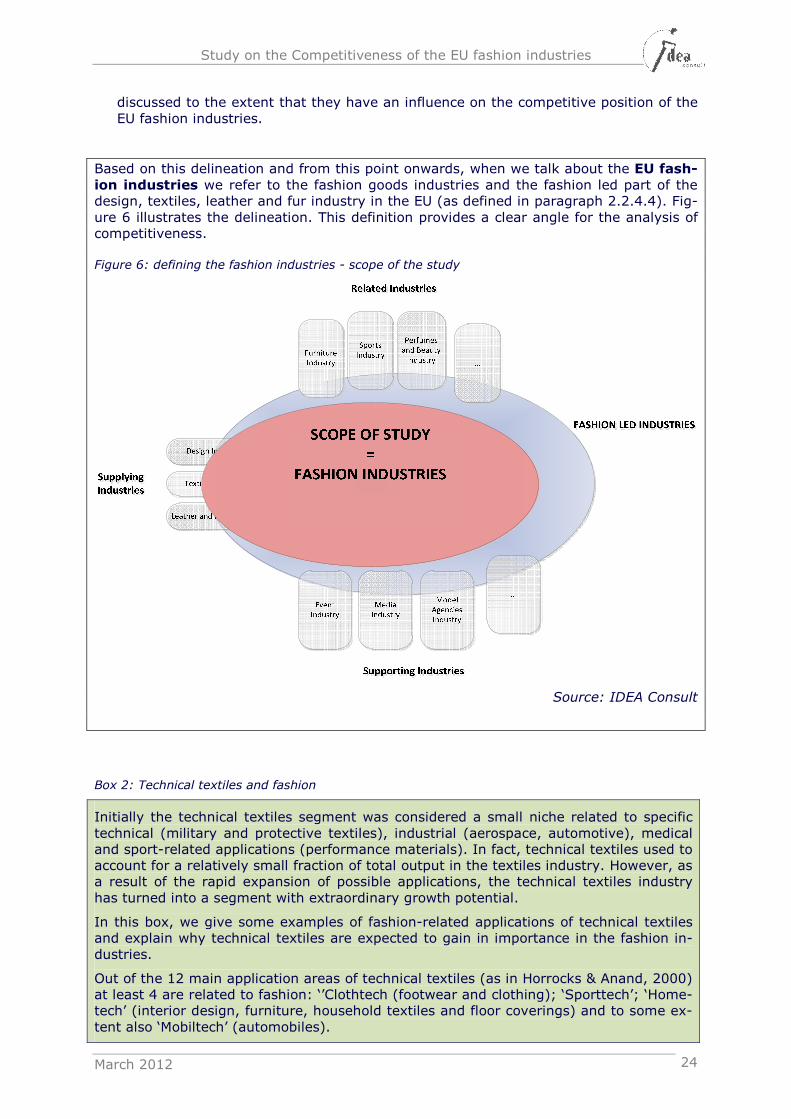
When we delineate the fashion industries, it is clear that the first group of sub-industries is part of it whereas the third group is not. As for the second group of sub-industries, the answer is not so clear-cut. Two arguments were at the basis of the here-after proposed delineation:
1. Although specific parts of the related industries (e.g. fashion led electronic de-vices industry) show similarities with the core fashion industries in terms of market approach, one could rather argue that companies within these industries have learned from the fashion industries (and visa versa) in terms of business strategies, while fashion companies can make use of goods from these related industries to comple-ment their own collection of fashion goods and as such to strengthen their brand im-age. However, this interaction does not make these related industries fashion indus-tries. We consider them to be no part of the fashion industries.
2. For the different supplying and supporting industries, ideally one could identify the set of firms that are fashion led and consider those as being part of the fashion indus-tries. However, such approach is not workable. A more pragmatic approach is to con-sider only those supplying and supporting industries where more than half of the in-dustry can be considered as fashion led and/or have a very strong direct impact on the final fashion good. To our knowledge, only the design, textiles, leather and fur in-dustry meet this argument. For the textiles industry, it is estimated that in the EU around 2/3rd of the textiles industry is fashion led12. Moreover, the textiles industry directly impacts and shapes the design of many fashion goods. Only the segment of technical textiles is considered to be largely non-fashion-led at the moment, although interesting spillover effects exist between the technical textiles segment and the homewear and clothing textiles segments when it comes to fashion (see Box 2). For the leather and fur industry, it is estimated that over 85% is fashion led (Cotance, IFTF, EFBA). Similar to textiles, also leather and fur influence the design of fashion goods. As for the design industry, we refer to paragraph 2.2.3.2 and previous discus-sions in this report to illustrate its strong link with the fashion goods industries.
To conclude, apart from the fashion led part of the design, textiles, leather and fur in-dustry none of the other fashion led supplying and supporting industries will be in-cluded in the remainder of the analysis on the EU fashion industries. They will only be
12 Based on the Industrial Fibre Consumption in tonnage using industry data (Cirfs) (Euratex)
Study on the Competitiveness of the EU fashion industries
March 2012 24
discussed to the extent that they have an influence on the competitive position of the EU fashion industries.
Based on this delineation and from this point onwards, when we talk about the EU fash-ion industries we refer to the fashion goods industries and the fashion led part of the design, textiles, leather and fur industry in the EU (as defined in paragraph 2.2.4.4). Fig-ure 6 illustrates the delineation. This definition provides a clear angle for the analysis of competitiveness.
Figure 6: defining the fashion industries - scope of the study
Source: IDEA Consult
Box 2: Technical textiles and fashion
Initially the technical textiles segment was considered a small niche related to specific technical (military and protective textiles), industrial (aerospace, automotive), medical and sport-related applications (performance materials). In fact, technical textiles used to account for a relatively small fraction of total output in the textiles industry. However, as a result of the rapid expansion of possible applications, the technical textiles industry has turned into a segment with extraordinary growth potential.
In this box, we give some examples of fashion-related applications of technical textiles and explain why technical textiles are expected to gain in importance in the fashion in-dustries.
Out of the 12 main application areas of technical textiles (as in Horrocks & Anand, 2000) at least 4 are related to fashion: ‘’Clothtech (footwear and clothing); ‘Sporttech’; ‘Home-tech’ (interior design, furniture, household textiles and floor coverings) and to some ex-tent also ‘Mobiltech’ (automobiles).
Study on the Competitiveness of the EU fashion industries
March 2012 25
The potential spillover effects of technical textiles for fashion are explained by the fact that there is a lot of potential for crossovers between designers and innovative technical textile firms. In fact, in the 21st century smart scientific fabrics constitute one of the key trends potentially shaping the evolution of fashion industries. New material properties allow designers flexibility in product implementation or enhance the uniqueness of the garment (e.g photochromatic dyes). The development of the physic-chemical and aes-thetic properties of materials extends the known boundaries of material behaviour – a key factor that fashion designers can rely on. Technical textiles permit that designers’ traditional activities be augmented by results of interdisciplinary experimentation with in-built (added) technologies (wearable electronics, wearable sensors, solar or electro-luminescent panels, actuators, logic circuits, micro-encapsulation etc.) and technologies that generate advanced intrinsic material properties (e.g. nanofabrics) like touch, han-dling, flexibility, texture, appearance etc.
Beyond luxury garment and outdoor (sports and leisure) clothing, other fashion related industries also contribute to a rapid commercialisation of research in technical textiles such as traditional fashion related ones like furniture, leather goods, etc.
Finally, another aspect that enhances the relevance of technical textiles for the fashion industries is sustainability. Environmental considerations represent a major challenge for the textiles industry and at the same time a major opportunity for technical textiles in general and for its crossovers with fashion in particular. The fact that research in tech-nical textiles has taken up and incorporated these sustainability aspects (durable, super washable products, solar panels, energy-efficiency etc.) will transfer this constituent of fashion to the mass market.
Study on the Competitiveness of the EU fashion industries
March 2012 26
3 ANALYSIS OF THE EU FASHION INDUSTRIES’ ECONOMIC
STRUCTURE AND COMPETITIVE POSITION
3.1 Translating the framework for scoping the ‘fashion indus-tries’ into quantitative analysis
The assessment of the EU fashion industries’ competitiveness will be based on both quantitative and qualitative data. Although the previous chapter presented a structured framework for a qualitative assessment of the EU fashion industries’ competitiveness, the quantitative sector analysis requires a more explicit selection of sub-industries that is linked to existing industry classifications. As data preferably come from sources providing harmonized and comparable statistics - such as Eurostat or OECD, the definition should be aligned to the classifications that official data providers use, namely the NACE rev.2 classification.
However, the hybrid EU fashion industries as we have defined above, does not corre-spond to any official sector classification. Moreover, the fashion industries also include sub-industries for which official data sources do not provide data of sufficient detail (fashion design industry, see further).
Annex 1 provides an overview of the different categories in the NACE rev.2 classification (and corresponding NACE rev. 1 code) that cover sub-industries that largely belong to the fashion industries. They relate to both manufacturing of intermediate goods, fashion goods and wholesale & retail activities.
The activity in the fashion value chain that is least well covered in the NACE rev.2 classi-fication (at 3 digit level13), relates to the intersection of fashion industries and creative industries, namely fashion design. Although fashion designers will be partly included in the figures on manufacturing and retail for those that work as employee in larger fashion companies, many more fashion designers work independently and will be categorized in the NACE classification under the NACE 74.1 category ‘specialised design activities’. How-ever, the current NACE rev.2 classification does not allow us to capture the group of fashion designers, as the NACE 74.1 category ‘specialised design activities’ covers all design disciplines, not only fashion design.
The quantitative data presented in this report therefore underestimate the contribution of design in the employment creation and economic performance of the EU fashion indus-tries. Similarly, it has been decided not to include NACE 13.9 ‘Manufacture of other tex-tile products’, although parts of this 3 digit category are relevant for the fashion indus-tries (namely NACE 13.91 ‘Manufacture of knitted and crocheted fabrics’). Conversely, a number of other categories will be overestimated in this report. Although the majority of production in the textiles and leather industry is geared towards the fashion goods indus-tries, some parts of these industries do not directly produce for the fashion goods indus-tries. Nevertheless, they have been incorporated in the data for the total. This e.g. is the case for NACE 14.1, which also includes ‘Manufacture of workwear’ although the fashion component in workwear is limited.
Despite these shortcomings, the data do provide a good basis for a quantitative analysis of the economic importance and performance of the EU fashion industries and evolution over time.
13 Data in Eurostat for most indicators for individual Member States are available only at the NACE 3 digit level,
thus limiting the potential level of detail of analysis to NACE 3 digit categories.
Study on the Competitiveness of the EU fashion industries
March 2012 27
3.2 Size and structure of the EU fashion industries
This section analyses the structure of the EU fashion industries in terms of employment, geographic concentration and size distribution. The analysis is based on Eurostat data. To the extent possible, we examined the data by sub-industry and over a timeframe of 5 years (2004-2009).
3.2.1 Total EU fashion industries
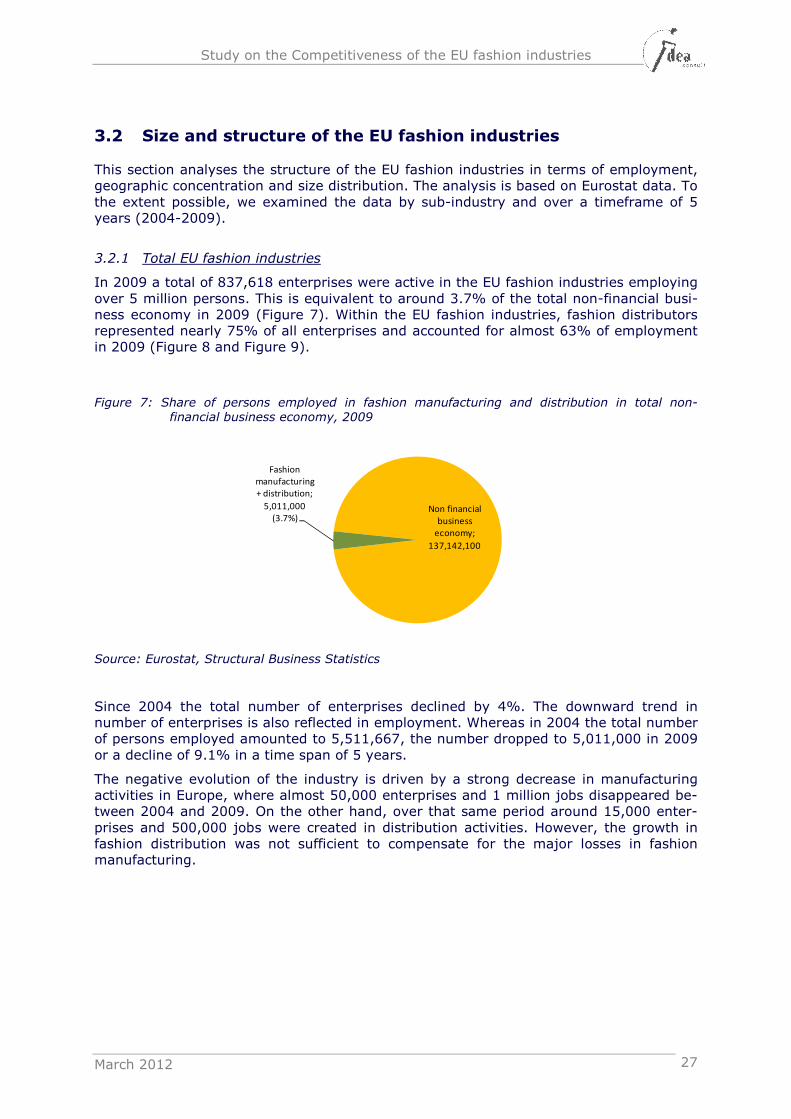
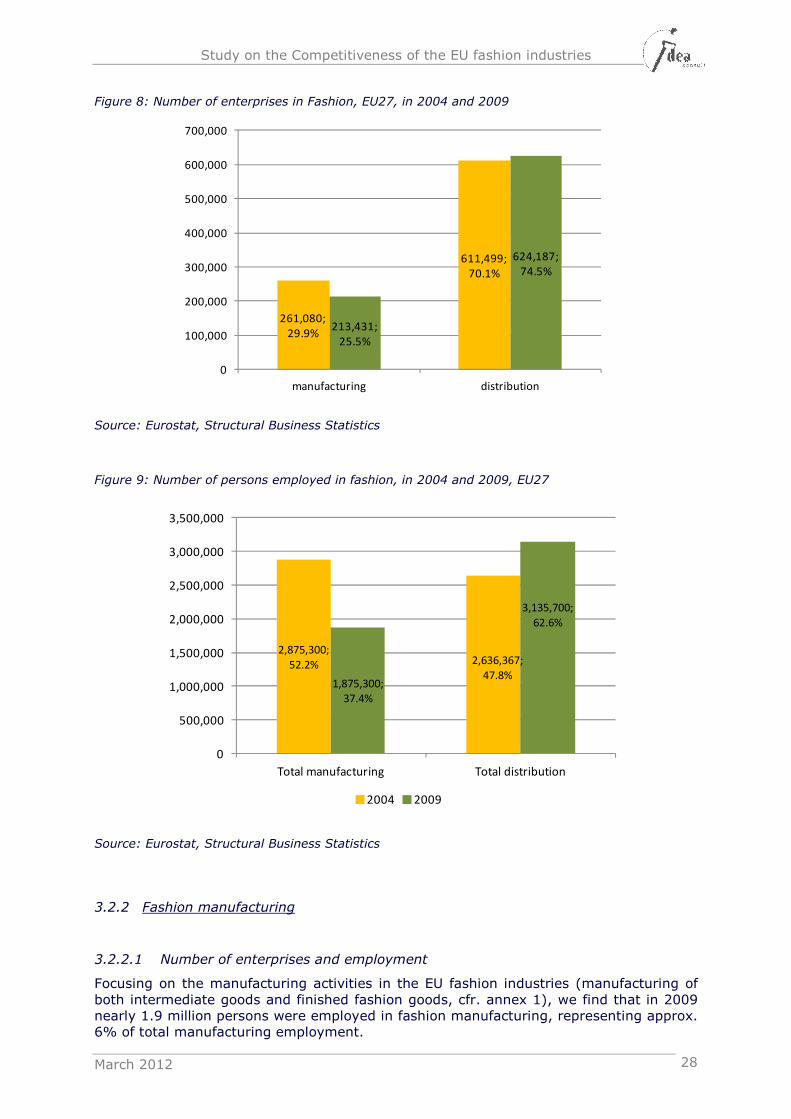
In 2009 a total of 837,618 enterprises were active in the EU fashion industries employing over 5 million persons. This is equivalent to around 3.7% of the total non-financial busi-ness economy in 2009 (Figure 7). Within the EU fashion industries, fashion distributors represented nearly 75% of all enterprises and accounted for almost 63% of employment in 2009 (Figure 8 and Figure 9).
Figure 7: Share of persons employed in fashion manufacturing and distribution in total non-financial business economy, 2009
Source: Eurostat, Structural Business Statistics
Since 2004 the total number of enterprises declined by 4%. The downward trend in number of enterprises is also reflected in employment. Whereas in 2004 the total number of persons employed amounted to 5,511,667, the number dropped to 5,011,000 in 2009 or a decline of 9.1% in a time span of 5 years.
The negative evolution of the industry is driven by a strong decrease in manufacturing activities in Europe, where almost 50,000 enterprises and 1 million jobs disappeared be-tween 2004 and 2009. On the other hand, over that same period around 15,000 enter-prises and 500,000 jobs were created in distribution activities. However, the growth in fashion distribution was not sufficient to compensate for the major losses in fashion manufacturing.
Non financial
business
economy;
137,142,100
Fashion
manufacturing
+ distribution;
5,011,000
(3.7%)
Study on the Competitiveness of the EU fashion industries
March 2012 28
Figure 8: Number of enterprises in Fashion, EU27, in 2004 and 2009
Source: Eurostat, Structural Business Statistics
Figure 9: Number of persons employed in fashion, in 2004 and 2009, EU27
Source: Eurostat, Structural Business Statistics
3.2.2 Fashion manufacturing
3.2.2.1 Number of enterprises and employment
Focusing on the manufacturing activities in the EU fashion industries (manufacturing of both intermediate goods and finished fashion goods, cfr. annex 1), we find that in 2009 nearly 1.9 million persons were employed in fashion manufacturing, representing approx. 6% of total manufacturing employment.
261,080;
29.9%
611,499;
70.1%
213,431;
25.5%
624,187;
74.5%
0
100,000
200,000
300,000
400,000
500,000
600,000
700,000
manufacturing distribution
2,875,300;
52.2% 2,636,367;
47.8%1,875,300;
37.4%
3,135,700;
62.6%
0
500,000
1,000,000
1,500,000
2,000,000
2,500,000
3,000,000
3,500,000
Total manufacturing Total distribution
2004 2009
Study on the Competitiveness of the EU fashion industries
March 2012 29
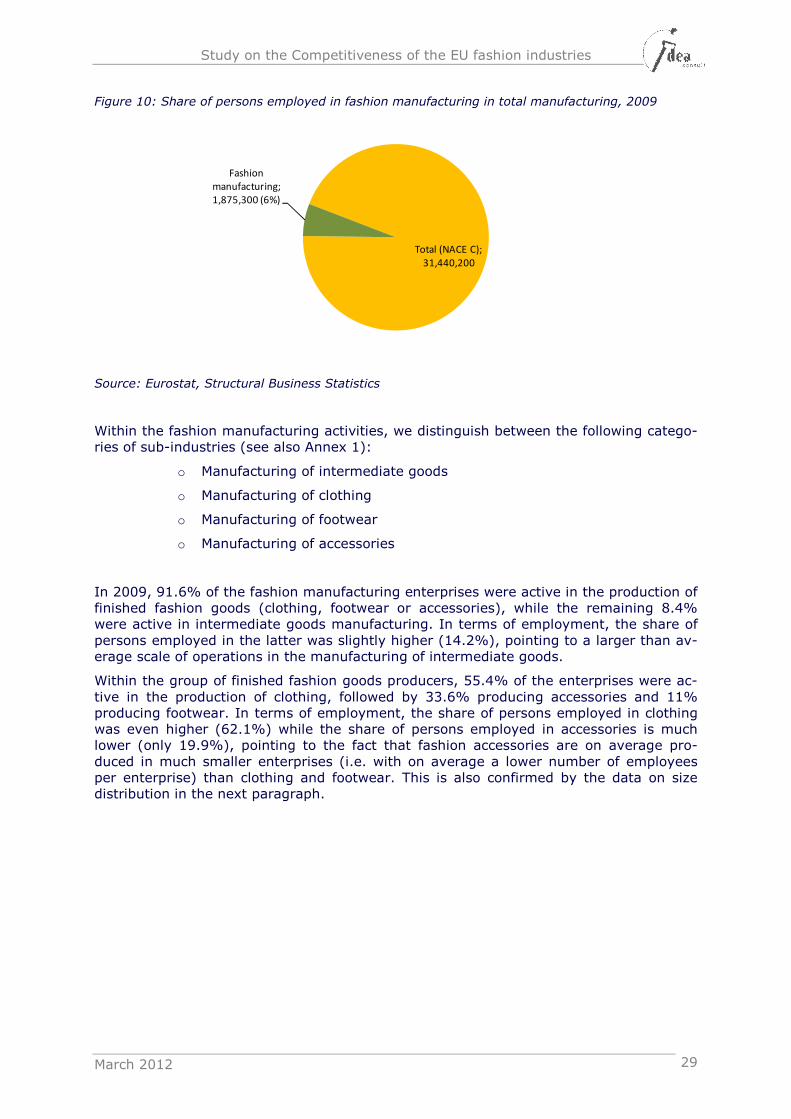
Figure 10: Share of persons employed in fashion manufacturing in total manufacturing, 2009
Source: Eurostat, Structural Business Statistics
Within the fashion manufacturing activities, we distinguish between the following catego-ries of sub-industries (see also Annex 1):
o Manufacturing of intermediate goods
o Manufacturing of clothing
o Manufacturing of footwear
o Manufacturing of accessories
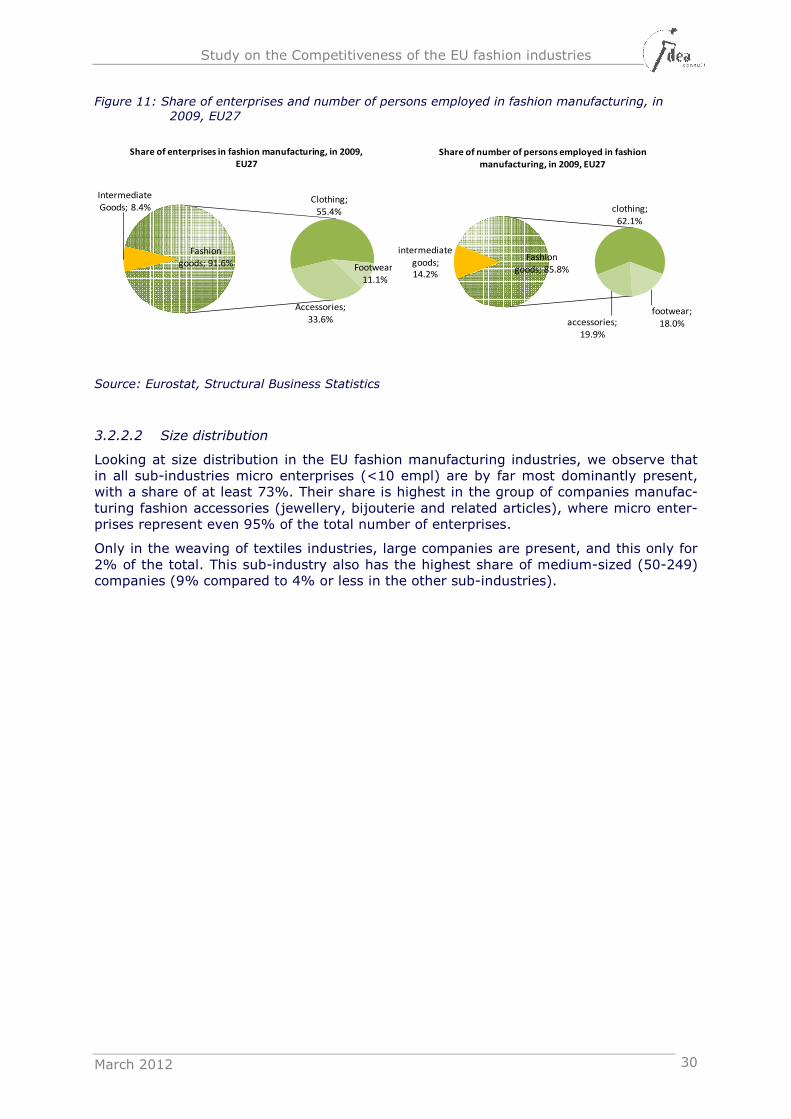
In 2009, 91.6% of the fashion manufacturing enterprises were active in the production of finished fashion goods (clothing, footwear or accessories), while the remaining 8.4% were active in intermediate goods manufacturing. In terms of employment, the share of persons employed in the latter was slightly higher (14.2%), pointing to a larger than av-erage scale of operations in the manufacturing of intermediate goods.
Within the group of finished fashion goods producers, 55.4% of the enterprises were ac-tive in the production of clothing, followed by 33.6% producing accessories and 11% producing footwear. In terms of employment, the share of persons employed in clothing was even higher (62.1%) while the share of persons employed in accessories is much lower (only 19.9%), pointing to the fact that fashion accessories are on average pro-duced in much smaller enterprises (i.e. with on average a lower number of employees per enterprise) than clothing and footwear. This is also confirmed by the data on size distribution in the next paragraph.
Total (NACE C);
31,440,200
Fashion
manufacturing;
1,875,300 (6%)
Study on the Competitiveness of the EU fashion industries
March 2012 30
Figure 11: Share of enterprises and number of persons employed in fashion manufacturing, in
2009, EU27
Source: Eurostat, Structural Business Statistics
3.2.2.2 Size distribution
Looking at size distribution in the EU fashion manufacturing industries, we observe that in all sub-industries micro enterprises (<10 empl) are by far most dominantly present, with a share of at least 73%. Their share is highest in the group of companies manufac-turing fashion accessories (jewellery, bijouterie and related articles), where micro enter-prises represent even 95% of the total number of enterprises.
Only in the weaving of textiles industries, large companies are present, and this only for 2% of the total. This sub-industry also has the highest share of medium-sized (50-249) companies (9% compared to 4% or less in the other sub-industries).
Intermediate
Goods; 8.4%Clothing;
55.4%
Footwear;
11.1%
Accessories;
33.6%
Fashion
goods; 91.6%
Share of enterprises in fashion manufacturing, in 2009,
EU27
intermediate
goods;
14.2%
clothing;
62.1%
footwear;
18.0%accessories;
19.9%
Fashion
goods; 85.8%
Share of number of persons employed in fashion
manufacturing, in 2009, EU27
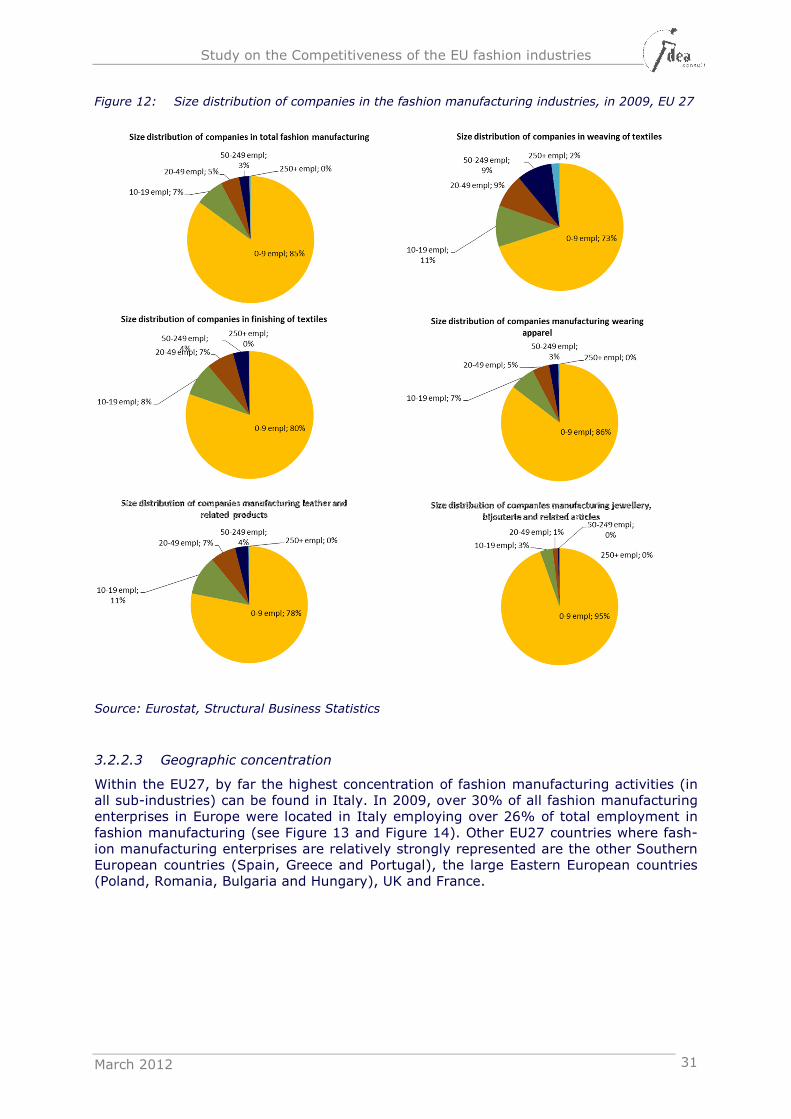
Study on the Competitiveness of the EU fashion industries
March 2012 31
Figure 12: Size distribution of companies in the fashion manufacturing industries, in 2009, EU 27
Source: Eurostat, Structural Business Statistics
3.2.2.3 Geographic concentration
Within the EU27, by far the highest concentration of fashion manufacturing activities (in all sub-industries) can be found in Italy. In 2009, over 30% of all fashion manufacturing enterprises in Europe were located in Italy employing over 26% of total employment in fashion manufacturing (see Figure 13 and Figure 14). Other EU27 countries where fash-ion manufacturing enterprises are relatively strongly represented are the other Southern European countries (Spain, Greece and Portugal), the large Eastern European countries (Poland, Romania, Bulgaria and Hungary), UK and France.
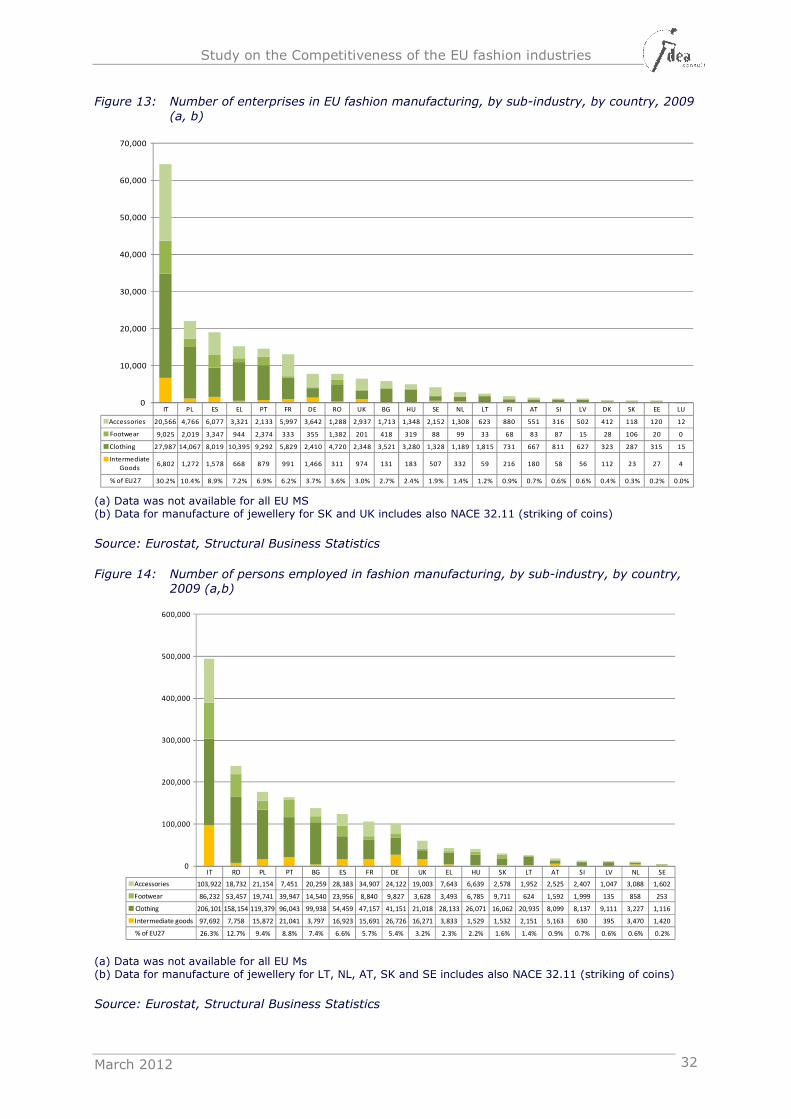
Study on the Competitiveness of the EU fashion industries
March 2012 32
Figure 13: Number of enterprises in EU fashion manufacturing, by sub-industry, by country, 2009
(a, b)
(a) Data was not available for all EU MS (b) Data for manufacture of jewellery for SK and UK includes also NACE 32.11 (striking of coins)
Source: Eurostat, Structural Business Statistics
Figure 14: Number of persons employed in fashion manufacturing, by sub-industry, by country, 2009 (a,b)
(a) Data was not available for all EU Ms (b) Data for manufacture of jewellery for LT, NL, AT, SK and SE includes also NACE 32.11 (striking of coins)
Source: Eurostat, Structural Business Statistics
IT PL ES EL PT FR DE RO UK BG HU SE NL LT FI AT SI LV DK SK EE LU
Accessories 20,566 4,766 6,077 3,321 2,133 5,997 3,642 1,288 2,937 1,713 1,348 2,152 1,308 623 880 551 316 502 412 118 120 12
Footwear 9,025 2,019 3,347 944 2,374 333 355 1,382 201 418 319 88 99 33 68 83 87 15 28 106 20 0
Clothing 27,987 14,067 8,019 10,395 9,292 5,829 2,410 4,720 2,348 3,521 3,280 1,328 1,189 1,815 731 667 811 627 323 287 315 15
Intermediate
Goods6,802 1,272 1,578 668 879 991 1,466 311 974 131 183 507 332 59 216 180 58 56 112 23 27 4
% of EU27 30.2% 10.4% 8.9% 7.2% 6.9% 6.2% 3.7% 3.6% 3.0% 2.7% 2.4% 1.9% 1.4% 1.2% 0.9% 0.7% 0.6% 0.6% 0.4% 0.3% 0.2% 0.0%
0
10,000
20,000
30,000
40,000
50,000
60,000
70,000
IT RO PL PT BG ES FR DE UK EL HU SK LT AT SI LV NL SE
Accessories 103,922 18,732 21,154 7,451 20,259 28,383 34,907 24,122 19,003 7,643 6,639 2,578 1,952 2,525 2,407 1,047 3,088 1,602
Footwear 86,232 53,457 19,741 39,947 14,540 23,956 8,840 9,827 3,628 3,493 6,785 9,711 624 1,592 1,999 135 858 253
Clothing 206,101 158,154 119,379 96,043 99,938 54,459 47,157 41,151 21,018 28,133 26,071 16,062 20,935 8,099 8,137 9,111 3,227 1,116
Intermediate goods 97,692 7,758 15,872 21,041 3,797 16,923 15,691 26,726 16,271 3,833 1,529 1,532 2,151 5,163 630 395 3,470 1,420
% of EU27 26.3% 12.7% 9.4% 8.8% 7.4% 6.6% 5.7% 5.4% 3.2% 2.3% 2.2% 1.6% 1.4% 0.9% 0.7% 0.6% 0.6% 0.2%
0
100,000
200,000
300,000
400,000
500,000
600,000
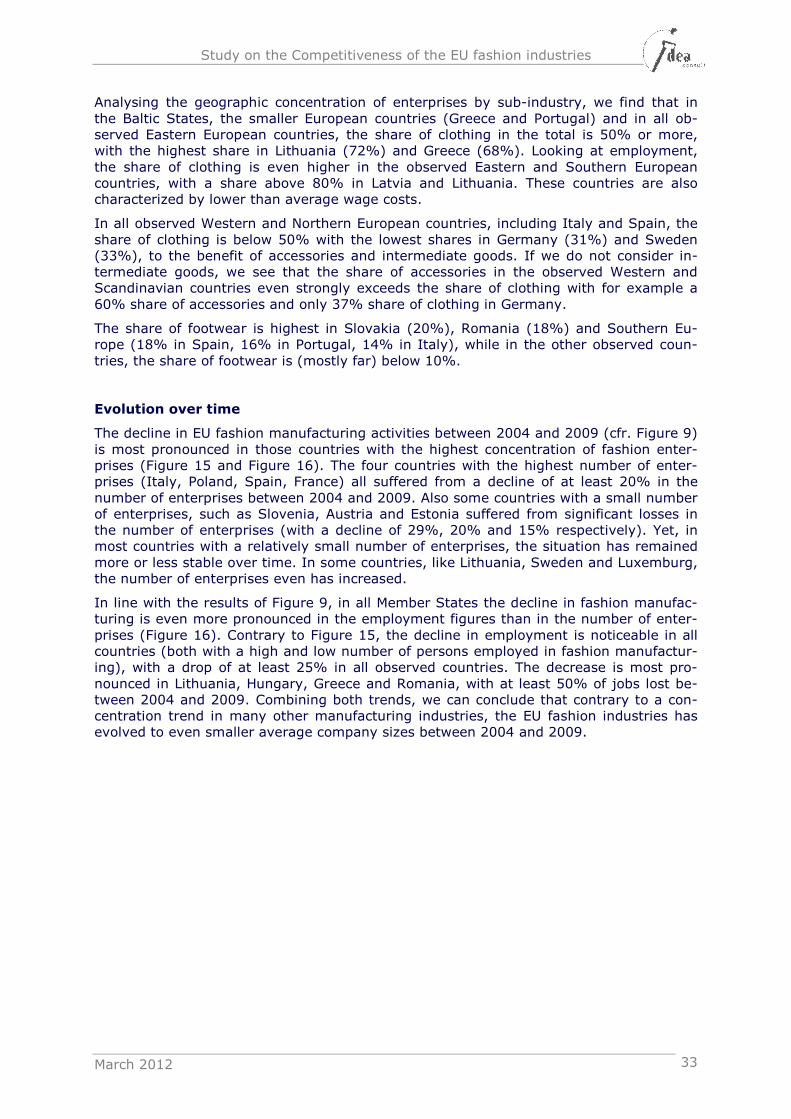
Study on the Competitiveness of the EU fashion industries
March 2012 33
Analysing the geographic concentration of enterprises by sub-industry, we find that in the Baltic States, the smaller European countries (Greece and Portugal) and in all ob-served Eastern European countries, the share of clothing in the total is 50% or more, with the highest share in Lithuania (72%) and Greece (68%). Looking at employment, the share of clothing is even higher in the observed Eastern and Southern European countries, with a share above 80% in Latvia and Lithuania. These countries are also characterized by lower than average wage costs.
In all observed Western and Northern European countries, including Italy and Spain, the share of clothing is below 50% with the lowest shares in Germany (31%) and Sweden (33%), to the benefit of accessories and intermediate goods. If we do not consider in-termediate goods, we see that the share of accessories in the observed Western and Scandinavian countries even strongly exceeds the share of clothing with for example a 60% share of accessories and only 37% share of clothing in Germany.
The share of footwear is highest in Slovakia (20%), Romania (18%) and Southern Eu-rope (18% in Spain, 16% in Portugal, 14% in Italy), while in the other observed coun-tries, the share of footwear is (mostly far) below 10%.
Evolution over time
The decline in EU fashion manufacturing activities between 2004 and 2009 (cfr. Figure 9) is most pronounced in those countries with the highest concentration of fashion enter-prises (Figure 15 and Figure 16). The four countries with the highest number of enter-prises (Italy, Poland, Spain, France) all suffered from a decline of at least 20% in the number of enterprises between 2004 and 2009. Also some countries with a small number of enterprises, such as Slovenia, Austria and Estonia suffered from significant losses in the number of enterprises (with a decline of 29%, 20% and 15% respectively). Yet, in most countries with a relatively small number of enterprises, the situation has remained more or less stable over time. In some countries, like Lithuania, Sweden and Luxemburg, the number of enterprises even has increased.
In line with the results of Figure 9, in all Member States the decline in fashion manufac-turing is even more pronounced in the employment figures than in the number of enter-prises (Figure 16). Contrary to Figure 15, the decline in employment is noticeable in all countries (both with a high and low number of persons employed in fashion manufactur-ing), with a drop of at least 25% in all observed countries. The decrease is most pro-nounced in Lithuania, Hungary, Greece and Romania, with at least 50% of jobs lost be-tween 2004 and 2009. Combining both trends, we can conclude that contrary to a con-centration trend in many other manufacturing industries, the EU fashion industries has evolved to even smaller average company sizes between 2004 and 2009.
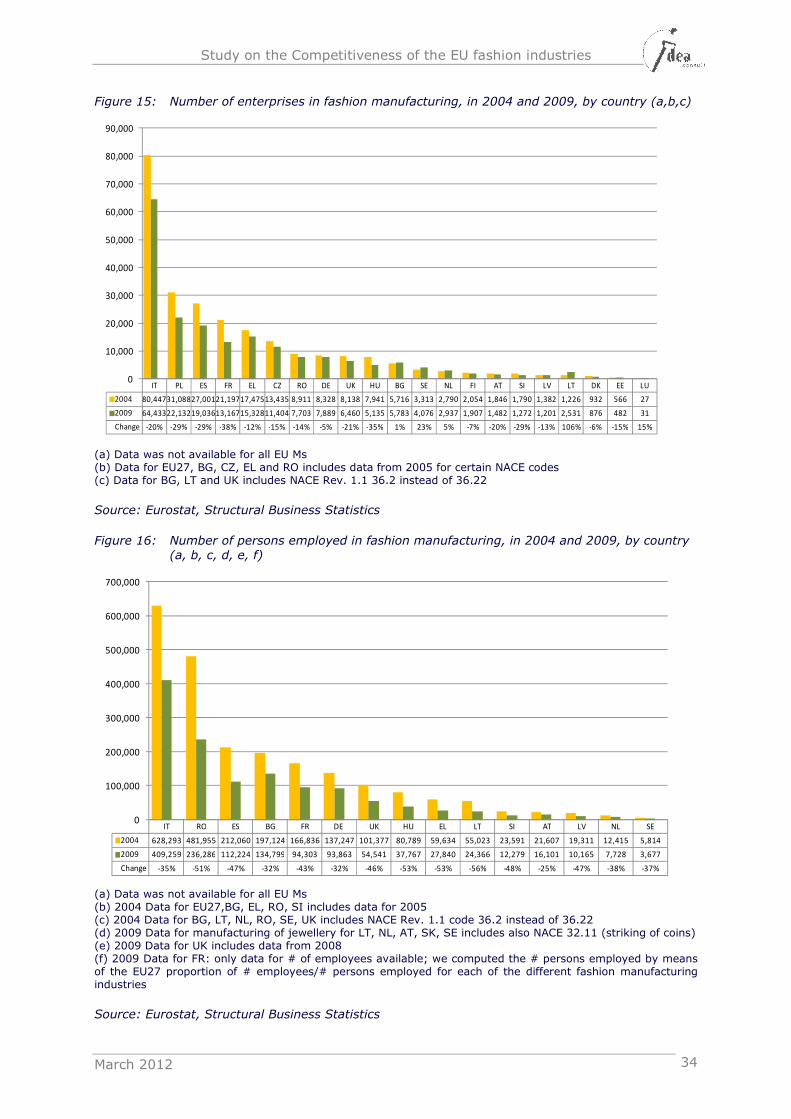
Study on the Competitiveness of the EU fashion industries
March 2012 34
Figure 15: Number of enterprises in fashion manufacturing, in 2004 and 2009, by country (a,b,c)
(a) Data was not available for all EU Ms (b) Data for EU27, BG, CZ, EL and RO includes data from 2005 for certain NACE codes (c) Data for BG, LT and UK includes NACE Rev. 1.1 36.2 instead of 36.22
Source: Eurostat, Structural Business Statistics
Figure 16: Number of persons employed in fashion manufacturing, in 2004 and 2009, by country (a, b, c, d, e, f)
(a) Data was not available for all EU Ms (b) 2004 Data for EU27,BG, EL, RO, SI includes data for 2005 (c) 2004 Data for BG, LT, NL, RO, SE, UK includes NACE Rev. 1.1 code 36.2 instead of 36.22 (d) 2009 Data for manufacturing of jewellery for LT, NL, AT, SK, SE includes also NACE 32.11 (striking of coins) (e) 2009 Data for UK includes data from 2008 (f) 2009 Data for FR: only data for # of employees available; we computed the # persons employed by means of the EU27 proportion of # employees/# persons employed for each of the different fashion manufacturing industries
Source: Eurostat, Structural Business Statistics
IT PL ES FR EL CZ RO DE UK HU BG SE NL FI AT SI LV LT DK EE LU
2004 80,44731,08827,00121,19717,47513,435 8,911 8,328 8,138 7,941 5,716 3,313 2,790 2,054 1,846 1,790 1,382 1,226 932 566 27
2009 64,43322,13219,03613,16715,32811,404 7,703 7,889 6,460 5,135 5,783 4,076 2,937 1,907 1,482 1,272 1,201 2,531 876 482 31
Change -20% -29% -29% -38% -12% -15% -14% -5% -21% -35% 1% 23% 5% -7% -20% -29% -13% 106% -6% -15% 15%
0
10,000
20,000
30,000
40,000
50,000
60,000
70,000
80,000
90,000
IT RO ES BG FR DE UK HU EL LT SI AT LV NL SE
2004 628,293 481,955 212,060 197,124 166,836 137,247 101,377 80,789 59,634 55,023 23,591 21,607 19,311 12,415 5,814
2009 409,259 236,286 112,224 134,799 94,303 93,863 54,541 37,767 27,840 24,366 12,279 16,101 10,165 7,728 3,677
Change -35% -51% -47% -32% -43% -32% -46% -53% -53% -56% -48% -25% -47% -38% -37%
0
100,000
200,000
300,000
400,000
500,000
600,000
700,000
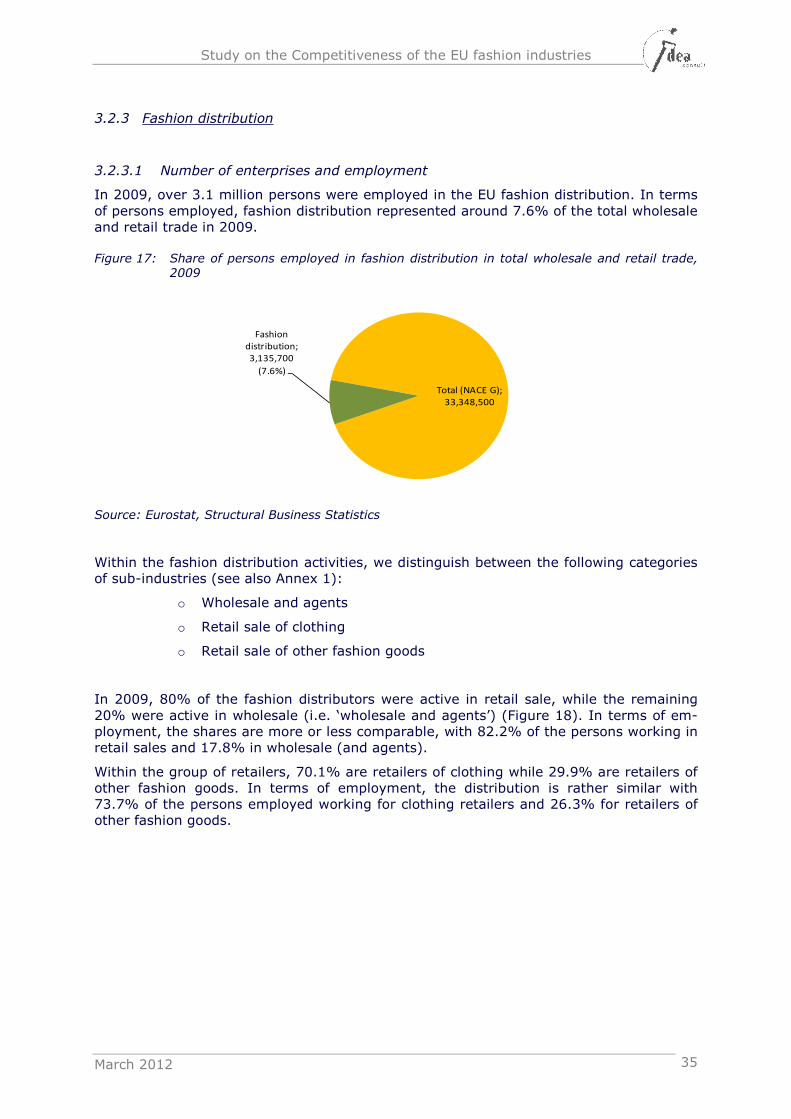
Study on the Competitiveness of the EU fashion industries
March 2012 35
3.2.3 Fashion distribution
3.2.3.1 Number of enterprises and employment
In 2009, over 3.1 million persons were employed in the EU fashion distribution. In terms of persons employed, fashion distribution represented around 7.6% of the total wholesale and retail trade in 2009.
Figure 17: Share of persons employed in fashion distribution in total wholesale and retail trade, 2009
Source: Eurostat, Structural Business Statistics
Within the fashion distribution activities, we distinguish between the following categories of sub-industries (see also Annex 1):
o Wholesale and agents
o Retail sale of clothing
o Retail sale of other fashion goods
In 2009, 80% of the fashion distributors were active in retail sale, while the remaining 20% were active in wholesale (i.e. ‘wholesale and agents’) (Figure 18). In terms of em-ployment, the shares are more or less comparable, with 82.2% of the persons working in retail sales and 17.8% in wholesale (and agents).
Within the group of retailers, 70.1% are retailers of clothing while 29.9% are retailers of other fashion goods. In terms of employment, the distribution is rather similar with 73.7% of the persons employed working for clothing retailers and 26.3% for retailers of other fashion goods.
Total (NACE G);
33,348,500
Fashion
distribution;
3,135,700
(7.6%)
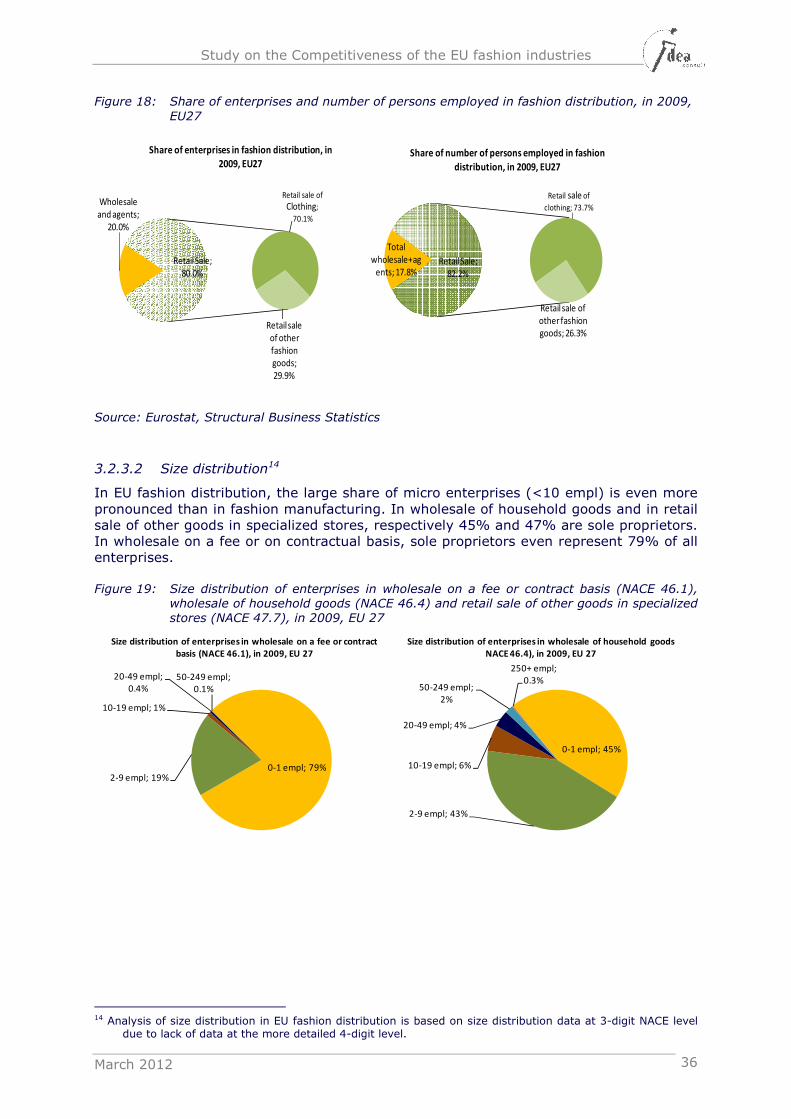
Study on the Competitiveness of the EU fashion industries
March 2012 36
Figure 18: Share of enterprises and number of persons employed in fashion distribution, in 2009,
EU27
Source: Eurostat, Structural Business Statistics
3.2.3.2 Size distribution14
In EU fashion distribution, the large share of micro enterprises (<10 empl) is even more pronounced than in fashion manufacturing. In wholesale of household goods and in retail sale of other goods in specialized stores, respectively 45% and 47% are sole proprietors. In wholesale on a fee or on contractual basis, sole proprietors even represent 79% of all enterprises.
Figure 19: Size distribution of enterprises in wholesale on a fee or contract basis (NACE 46.1), wholesale of household goods (NACE 46.4) and retail sale of other goods in specialized stores (NACE 47.7), in 2009, EU 27
14 Analysis of size distribution in EU fashion distribution is based on size distribution data at 3-digit NACE level
due to lack of data at the more detailed 4-digit level.
Wholesale
and agents;
20.0%
Retail sale of
Clothing;
70.1%
Retail sale
of other
fashion
goods;
29.9%
Retail Sale;
80.0%
Share of enterprises in fashion distribution, in
2009, EU27
Total
wholesale+ag
ents; 17.8%
Retail sale of
clothing; 73.7%
Retail sale of
other fashion
goods; 26.3%
Retail Sale;
82.2%
Share of number of persons employed in fashion
distribution, in 2009, EU27
0-1 empl; 79%2-9 empl; 19%
10-19 empl; 1%
20-49 empl;
0.4%
50-249 empl;
0.1%
Size distribution of enterprises in wholesale on a fee or contract
basis (NACE 46.1), in 2009, EU 27
0-1 empl; 45%
2-9 empl; 43%
10-19 empl; 6%
20-49 empl; 4%
50-249 empl;
2%
250+ empl;
0.3%
Size distribution of enterprises in wholesale of household goods
NACE 46.4), in 2009, EU 27
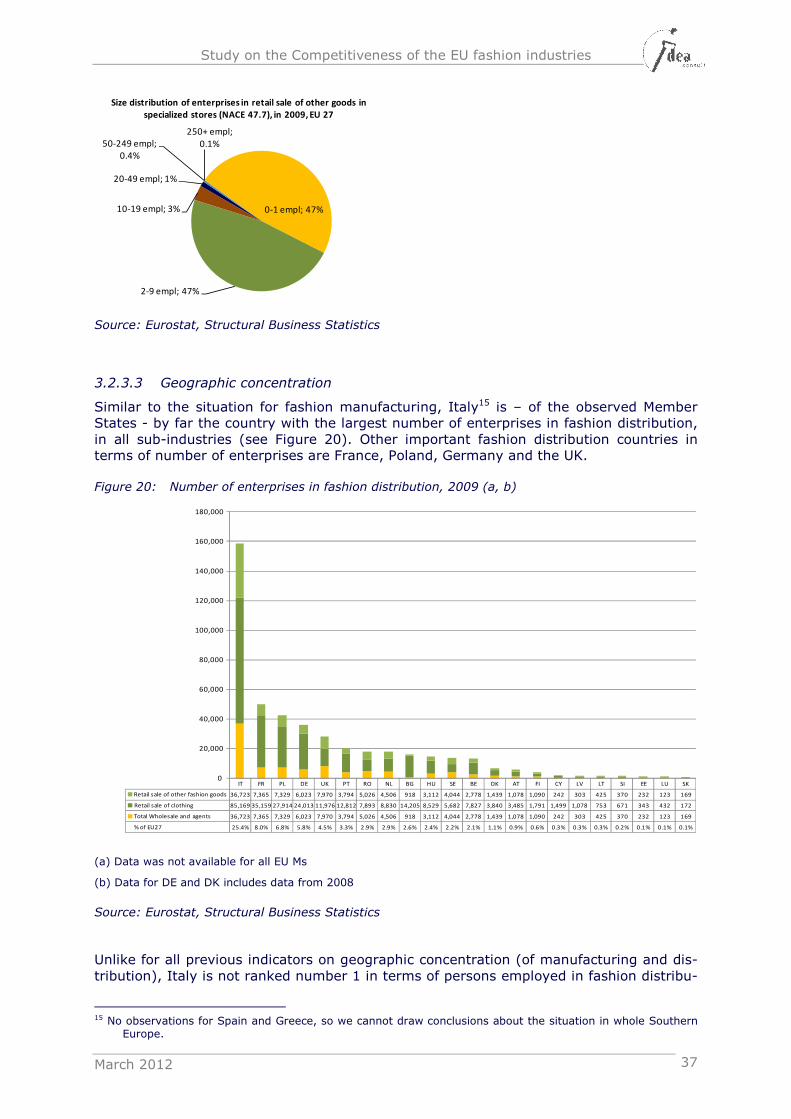
Study on the Competitiveness of the EU fashion industries
March 2012 37
Source: Eurostat, Structural Business Statistics
3.2.3.3 Geographic concentration
Similar to the situation for fashion manufacturing, Italy15 is – of the observed Member States - by far the country with the largest number of enterprises in fashion distribution, in all sub-industries (see Figure 20). Other important fashion distribution countries in terms of number of enterprises are France, Poland, Germany and the UK.
Figure 20: Number of enterprises in fashion distribution, 2009 (a, b)
(a) Data was not available for all EU Ms
(b) Data for DE and DK includes data from 2008
Source: Eurostat, Structural Business Statistics
Unlike for all previous indicators on geographic concentration (of manufacturing and dis-tribution), Italy is not ranked number 1 in terms of persons employed in fashion distribu-
15 No observations for Spain and Greece, so we cannot draw conclusions about the situation in whole Southern
Europe.
0-1 empl; 47%
2-9 empl; 47%
10-19 empl; 3%
20-49 empl; 1%
50-249 empl;
0.4%
250+ empl;
0.1%
Size distribution of enterprises in retail sale of other goods in
specialized stores (NACE 47.7), in 2009, EU 27
IT FR PL DE UK PT RO NL BG HU SE BE DK AT FI CY LV LT SI EE LU SK
Retail sale of other fashion goods 36,723 7,365 7,329 6,023 7,970 3,794 5,026 4,506 918 3,112 4,044 2,778 1,439 1,078 1,090 242 303 425 370 232 123 169
Retail sale of clothing 85,169 35,159 27,914 24,013 11,976 12,812 7,893 8,830 14,205 8,529 5,682 7,827 3,840 3,485 1,791 1,499 1,078 753 671 343 432 172
Total Wholesale and agents 36,723 7,365 7,329 6,023 7,970 3,794 5,026 4,506 918 3,112 4,044 2,778 1,439 1,078 1,090 242 303 425 370 232 123 169
% of EU27 25.4% 8.0% 6.8% 5.8% 4.5% 3.3% 2.9% 2.9% 2.6% 2.4% 2.2% 2.1% 1.1% 0.9% 0.6% 0.3% 0.3% 0.3% 0.2% 0.1% 0.1% 0.1%
0
20,000
40,000
60,000
80,000
100,000
120,000
140,000
160,000
180,000
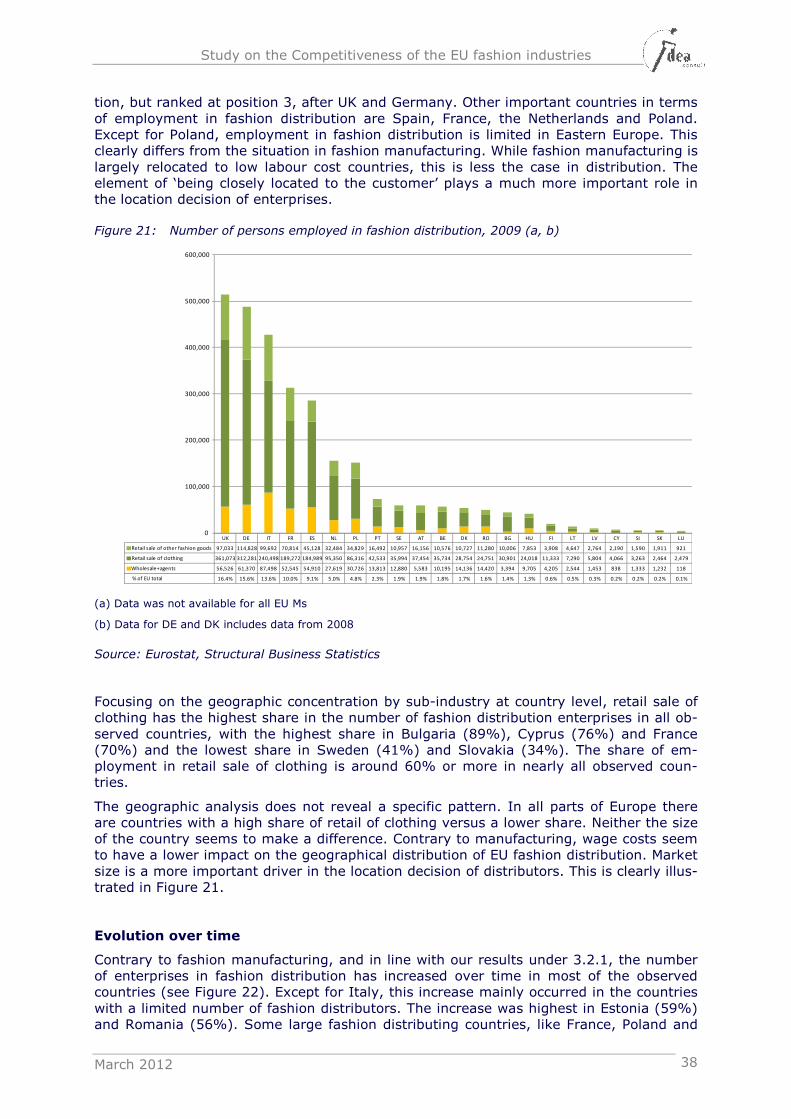
Study on the Competitiveness of the EU fashion industries
March 2012 38
tion, but ranked at position 3, after UK and Germany. Other important countries in terms of employment in fashion distribution are Spain, France, the Netherlands and Poland. Except for Poland, employment in fashion distribution is limited in Eastern Europe. This clearly differs from the situation in fashion manufacturing. While fashion manufacturing is largely relocated to low labour cost countries, this is less the case in distribution. The element of ‘being closely located to the customer’ plays a much more important role in the location decision of enterprises.
Figure 21: Number of persons employed in fashion distribution, 2009 (a, b)
(a) Data was not available for all EU Ms
(b) Data for DE and DK includes data from 2008
Source: Eurostat, Structural Business Statistics
Focusing on the geographic concentration by sub-industry at country level, retail sale of clothing has the highest share in the number of fashion distribution enterprises in all ob-served countries, with the highest share in Bulgaria (89%), Cyprus (76%) and France (70%) and the lowest share in Sweden (41%) and Slovakia (34%). The share of em-ployment in retail sale of clothing is around 60% or more in nearly all observed coun-tries.
The geographic analysis does not reveal a specific pattern. In all parts of Europe there are countries with a high share of retail of clothing versus a lower share. Neither the size of the country seems to make a difference. Contrary to manufacturing, wage costs seem to have a lower impact on the geographical distribution of EU fashion distribution. Market size is a more important driver in the location decision of distributors. This is clearly illus-trated in Figure 21.
Evolution over time
Contrary to fashion manufacturing, and in line with our results under 3.2.1, the number of enterprises in fashion distribution has increased over time in most of the observed countries (see Figure 22). Except for Italy, this increase mainly occurred in the countries with a limited number of fashion distributors. The increase was highest in Estonia (59%) and Romania (56%). Some large fashion distributing countries, like France, Poland and
UK DE IT FR ES NL PL PT SE AT BE DK RO BG HU FI LT LV CY SI SK LU
Retail sale of other fashion goods 97,033 114,828 99,692 70,814 45,128 32,484 34,829 16,492 10,957 16,156 10,576 10,727 11,280 10,006 7,853 3,908 4,647 2,764 2,190 1,590 1,911 921
Retail sale of clothing 361,073 312,281 240,498 189,272 184,989 95,350 86,316 42,533 35,994 37,454 35,734 28,754 24,751 30,901 24,018 11,333 7,290 5,804 4,066 3,263 2,464 2,479
Wholesale+agents 56,526 61,370 87,498 52,545 54,910 27,619 30,726 13,813 12,880 5,583 10,195 14,136 14,420 3,394 9,705 4,205 2,544 1,453 838 1,333 1,232 118
% of EU total 16.4% 15.6% 13.6% 10.0% 9.1% 5.0% 4.8% 2.3% 1.9% 1.9% 1.8% 1.7% 1.6% 1.4% 1.3% 0.6% 0.5% 0.3% 0.2% 0.2% 0.2% 0.1%
0
100,000
200,000
300,000
400,000
500,000
600,000
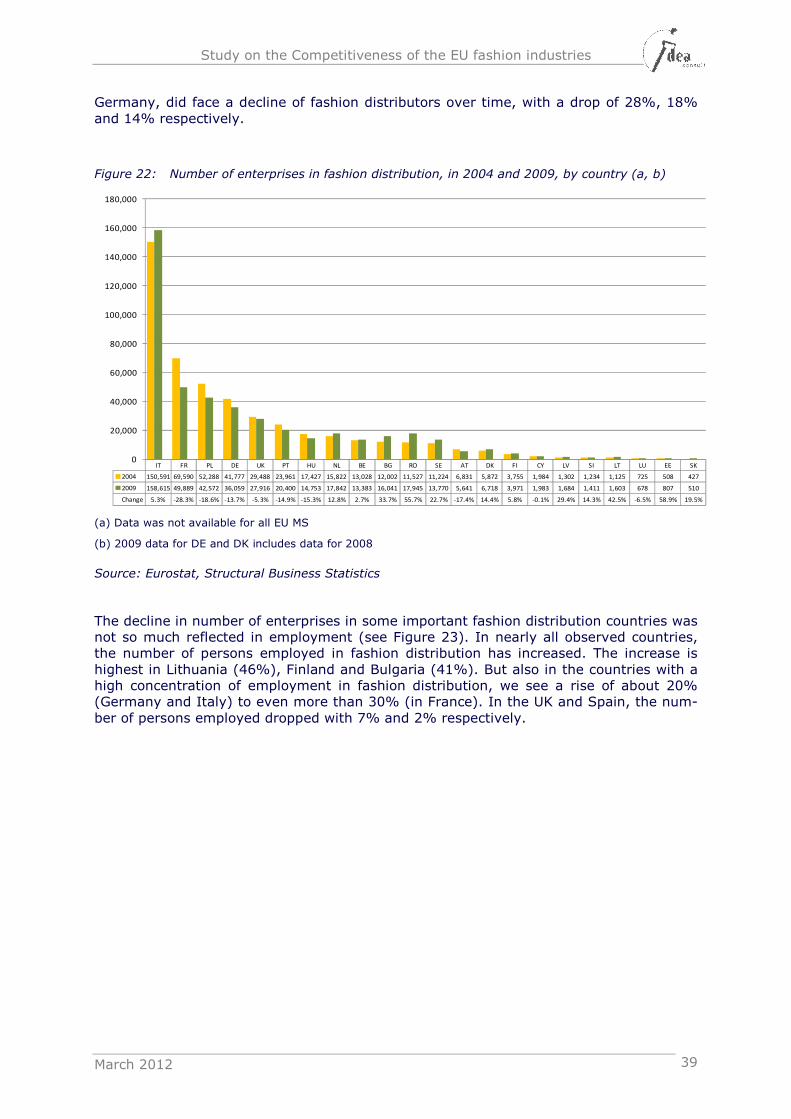
Study on the Competitiveness of the EU fashion industries
March 2012 39
Germany, did face a decline of fashion distributors over time, with a drop of 28%, 18% and 14% respectively.
Figure 22: Number of enterprises in fashion distribution, in 2004 and 2009, by country (a, b)
(a) Data was not available for all EU MS
(b) 2009 data for DE and DK includes data for 2008
Source: Eurostat, Structural Business Statistics
The decline in number of enterprises in some important fashion distribution countries was not so much reflected in employment (see Figure 23). In nearly all observed countries, the number of persons employed in fashion distribution has increased. The increase is highest in Lithuania (46%), Finland and Bulgaria (41%). But also in the countries with a high concentration of employment in fashion distribution, we see a rise of about 20% (Germany and Italy) to even more than 30% (in France). In the UK and Spain, the num-ber of persons employed dropped with 7% and 2% respectively.
IT FR PL DE UK PT HU NL BE BG RO SE AT DK FI CY LV SI LT LU EE SK
2004 150,591 69,590 52,288 41,777 29,488 23,961 17,427 15,822 13,028 12,002 11,527 11,224 6,831 5,872 3,755 1,984 1,302 1,234 1,125 725 508 427
2009 158,615 49,889 42,572 36,059 27,916 20,400 14,753 17,842 13,383 16,041 17,945 13,770 5,641 6,718 3,971 1,983 1,684 1,411 1,603 678 807 510
Change 5.3% -28.3% -18.6% -13.7% -5.3% -14.9% -15.3% 12.8% 2.7% 33.7% 55.7% 22.7% -17.4% 14.4% 5.8% -0.1% 29.4% 14.3% 42.5% -6.5% 58.9% 19.5%
0
20,000
40,000
60,000
80,000
100,000
120,000
140,000
160,000
180,000
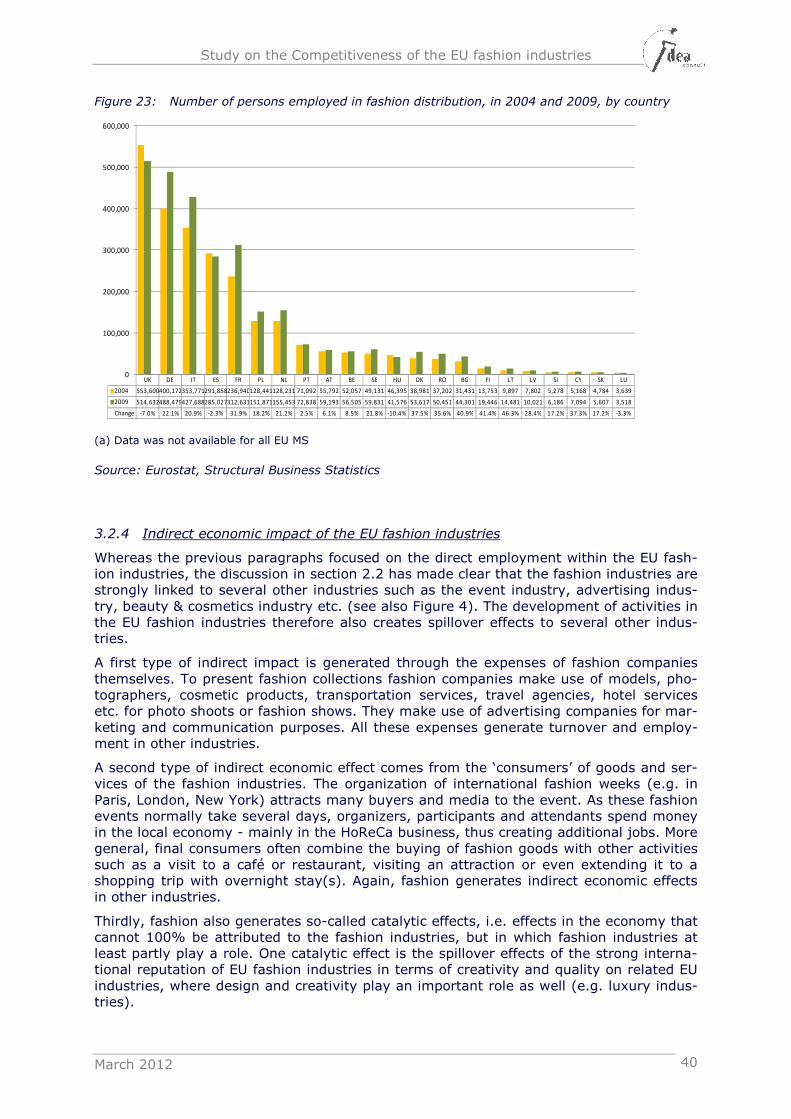
Study on the Competitiveness of the EU fashion industries
March 2012 40
Figure 23: Number of persons employed in fashion distribution, in 2004 and 2009, by country
(a) Data was not available for all EU MS
Source: Eurostat, Structural Business Statistics
3.2.4 Indirect economic impact of the EU fashion industries
Whereas the previous paragraphs focused on the direct employment within the EU fash-ion industries, the discussion in section 2.2 has made clear that the fashion industries are strongly linked to several other industries such as the event industry, advertising indus-try, beauty & cosmetics industry etc. (see also Figure 4). The development of activities in the EU fashion industries therefore also creates spillover effects to several other indus-tries.
A first type of indirect impact is generated through the expenses of fashion companies themselves. To present fashion collections fashion companies make use of models, pho-tographers, cosmetic products, transportation services, travel agencies, hotel services etc. for photo shoots or fashion shows. They make use of advertising companies for mar-keting and communication purposes. All these expenses generate turnover and employ-ment in other industries.
A second type of indirect economic effect comes from the ‘consumers’ of goods and ser-vices of the fashion industries. The organization of international fashion weeks (e.g. in Paris, London, New York) attracts many buyers and media to the event. As these fashion events normally take several days, organizers, participants and attendants spend money in the local economy - mainly in the HoReCa business, thus creating additional jobs. More general, final consumers often combine the buying of fashion goods with other activities such as a visit to a café or restaurant, visiting an attraction or even extending it to a shopping trip with overnight stay(s). Again, fashion generates indirect economic effects in other industries.
Thirdly, fashion also generates so-called catalytic effects, i.e. effects in the economy that cannot 100% be attributed to the fashion industries, but in which fashion industries at least partly play a role. One catalytic effect is the spillover effects of the strong interna-tional reputation of EU fashion industries in terms of creativity and quality on related EU industries, where design and creativity play an important role as well (e.g. luxury indus-tries).
UK DE IT ES FR PL NL PT AT BE SE HU DK RO BG FI LT LV SI CY SK LU
2004 553,600400,172353,771291,858236,940128,441128,231 71,092 55,792 52,057 49,131 46,395 38,981 37,202 31,431 13,753 9,897 7,802 5,278 5,168 4,784 3,639
2009 514,632488,479427,688285,027312,631151,871155,453 72,838 59,193 56,505 59,831 41,576 53,617 50,451 44,301 19,446 14,481 10,021 6,186 7,094 5,607 3,518
Change -7.0% 22.1% 20.9% -2.3% 31.9% 18.2% 21.2% 2.5% 6.1% 8.5% 21.8% -10.4% 37.5% 35.6% 40.9% 41.4% 46.3% 28.4% 17.2% 37.3% 17.2% -3.3%
0
100,000
200,000
300,000
400,000
500,000
600,000
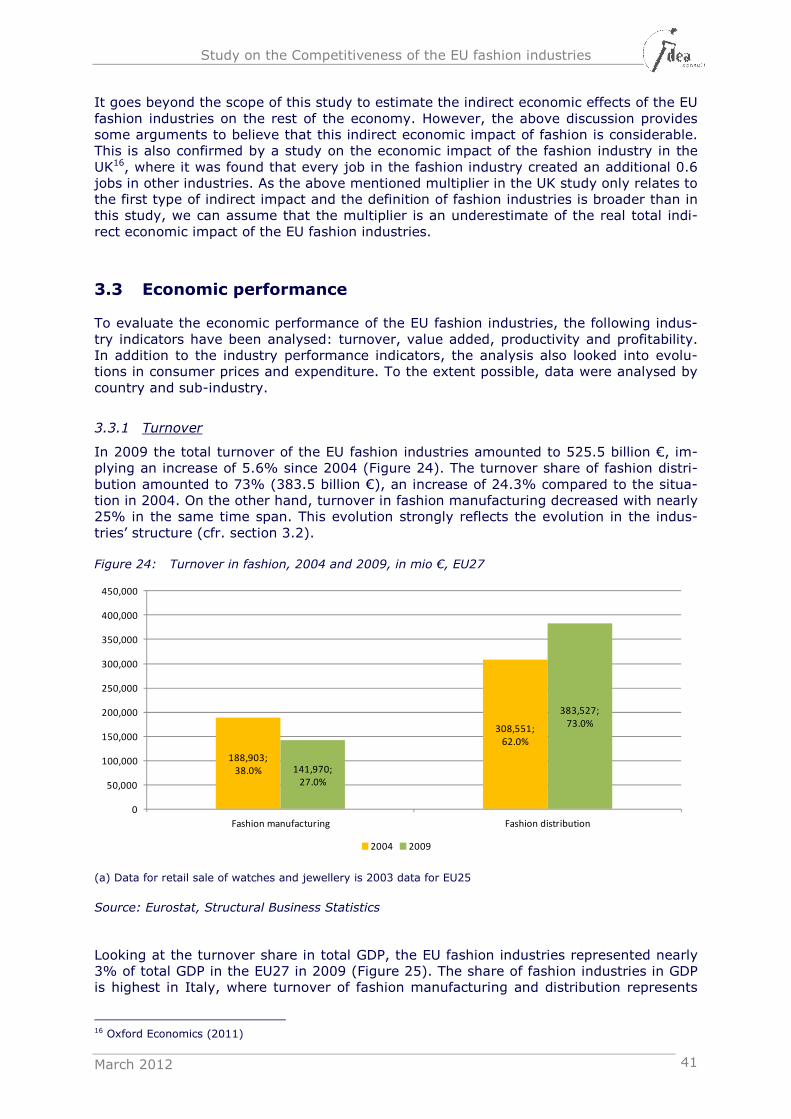
Study on the Competitiveness of the EU fashion industries
March 2012 41
It goes beyond the scope of this study to estimate the indirect economic effects of the EU fashion industries on the rest of the economy. However, the above discussion provides some arguments to believe that this indirect economic impact of fashion is considerable. This is also confirmed by a study on the economic impact of the fashion industry in the UK16, where it was found that every job in the fashion industry created an additional 0.6 jobs in other industries. As the above mentioned multiplier in the UK study only relates to the first type of indirect impact and the definition of fashion industries is broader than in this study, we can assume that the multiplier is an underestimate of the real total indi-rect economic impact of the EU fashion industries.
3.3 Economic performance
To evaluate the economic performance of the EU fashion industries, the following indus-try indicators have been analysed: turnover, value added, productivity and profitability. In addition to the industry performance indicators, the analysis also looked into evolu-tions in consumer prices and expenditure. To the extent possible, data were analysed by country and sub-industry.
3.3.1 Turnover
In 2009 the total turnover of the EU fashion industries amounted to 525.5 billion €, im-plying an increase of 5.6% since 2004 (Figure 24). The turnover share of fashion distri-bution amounted to 73% (383.5 billion €), an increase of 24.3% compared to the situa-tion in 2004. On the other hand, turnover in fashion manufacturing decreased with nearly 25% in the same time span. This evolution strongly reflects the evolution in the indus-tries’ structure (cfr. section 3.2).
Figure 24: Turnover in fashion, 2004 and 2009, in mio €, EU27
(a) Data for retail sale of watches and jewellery is 2003 data for EU25
Source: Eurostat, Structural Business Statistics
Looking at the turnover share in total GDP, the EU fashion industries represented nearly 3% of total GDP in the EU27 in 2009 (Figure 25). The share of fashion industries in GDP is highest in Italy, where turnover of fashion manufacturing and distribution represents
16 Oxford Economics (2011)
188,903;
38.0%
308,551;
62.0%
141,970;
27.0%
383,527;
73.0%
0
50,000
100,000
150,000
200,000
250,000
300,000
350,000
400,000
450,000
Fashion manufacturing Fashion distribution
2004 2009
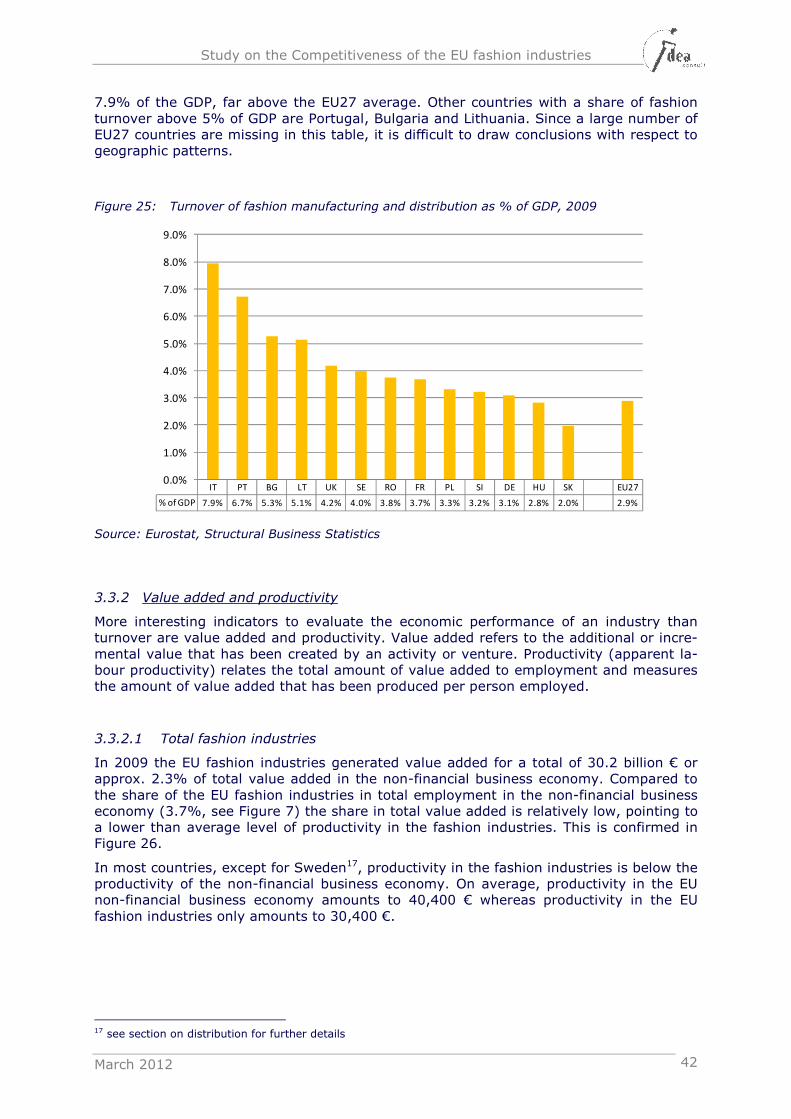
Study on the Competitiveness of the EU fashion industries
March 2012 42
7.9% of the GDP, far above the EU27 average. Other countries with a share of fashion turnover above 5% of GDP are Portugal, Bulgaria and Lithuania. Since a large number of EU27 countries are missing in this table, it is difficult to draw conclusions with respect to geographic patterns.
Figure 25: Turnover of fashion manufacturing and distribution as % of GDP, 2009
Source: Eurostat, Structural Business Statistics
3.3.2 Value added and productivity
More interesting indicators to evaluate the economic performance of an industry than turnover are value added and productivity. Value added refers to the additional or incre-mental value that has been created by an activity or venture. Productivity (apparent la-bour productivity) relates the total amount of value added to employment and measures the amount of value added that has been produced per person employed.
3.3.2.1 Total fashion industries
In 2009 the EU fashion industries generated value added for a total of 30.2 billion € or approx. 2.3% of total value added in the non-financial business economy. Compared to the share of the EU fashion industries in total employment in the non-financial business economy (3.7%, see Figure 7) the share in total value added is relatively low, pointing to a lower than average level of productivity in the fashion industries. This is confirmed in Figure 26.
In most countries, except for Sweden17, productivity in the fashion industries is below the productivity of the non-financial business economy. On average, productivity in the EU non-financial business economy amounts to 40,400 € whereas productivity in the EU fashion industries only amounts to 30,400 €.
17 see section on distribution for further details
IT PT BG LT UK SE RO FR PL SI DE HU SK EU27
% of GDP 7.9% 6.7% 5.3% 5.1% 4.2% 4.0% 3.8% 3.7% 3.3% 3.2% 3.1% 2.8% 2.0% 2.9%
0.0%
1.0%
2.0%
3.0%
4.0%
5.0%
6.0%
7.0%
8.0%
9.0%
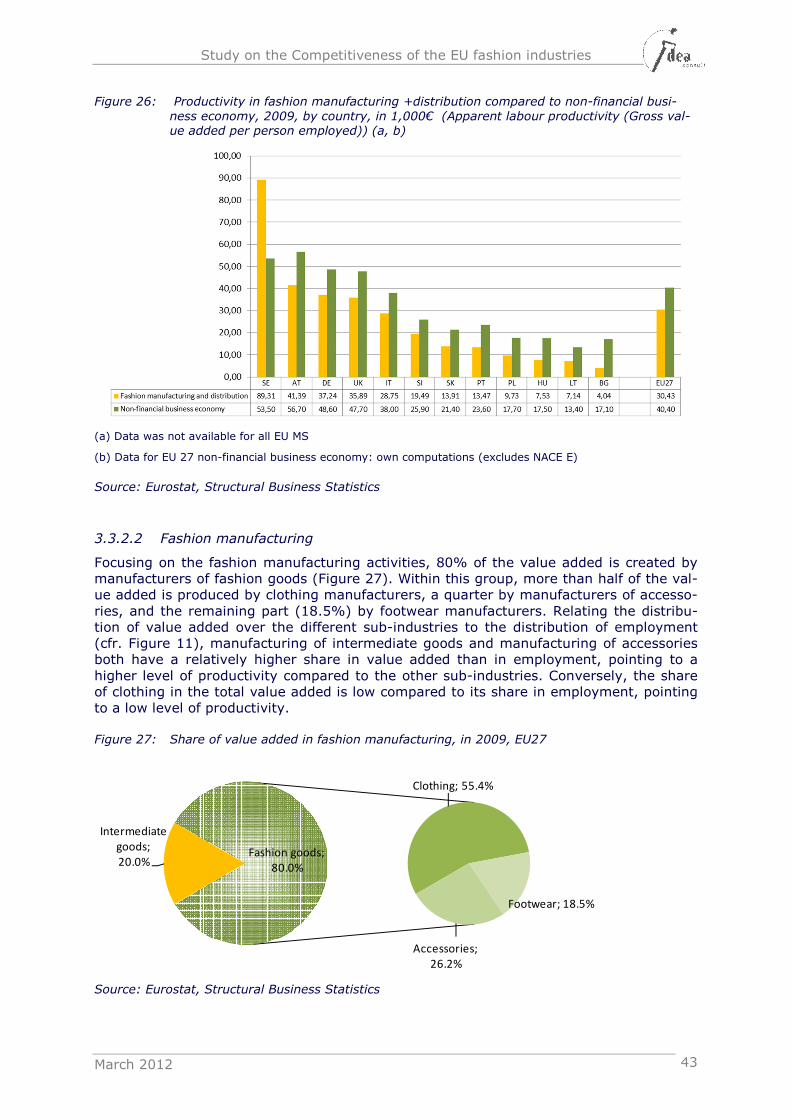
Study on the Competitiveness of the EU fashion industries
March 2012 43
Figure 26: Productivity in fashion manufacturing +distribution compared to non-financial busi-
ness economy, 2009, by country, in 1,000€ (Apparent labour productivity (Gross val-ue added per person employed)) (a, b)
(a) Data was not available for all EU MS
(b) Data for EU 27 non-financial business economy: own computations (excludes NACE E)
Source: Eurostat, Structural Business Statistics
3.3.2.2 Fashion manufacturing
Focusing on the fashion manufacturing activities, 80% of the value added is created by manufacturers of fashion goods (Figure 27). Within this group, more than half of the val-ue added is produced by clothing manufacturers, a quarter by manufacturers of accesso-ries, and the remaining part (18.5%) by footwear manufacturers. Relating the distribu-tion of value added over the different sub-industries to the distribution of employment (cfr. Figure 11), manufacturing of intermediate goods and manufacturing of accessories both have a relatively higher share in value added than in employment, pointing to a higher level of productivity compared to the other sub-industries. Conversely, the share of clothing in the total value added is low compared to its share in employment, pointing to a low level of productivity.
Figure 27: Share of value added in fashion manufacturing, in 2009, EU27
Source: Eurostat, Structural Business Statistics
Intermediate
goods;
20.0%
Clothing; 55.4%
Footwear; 18.5%
Accessories;
26.2%
Fashion goods;
80.0%
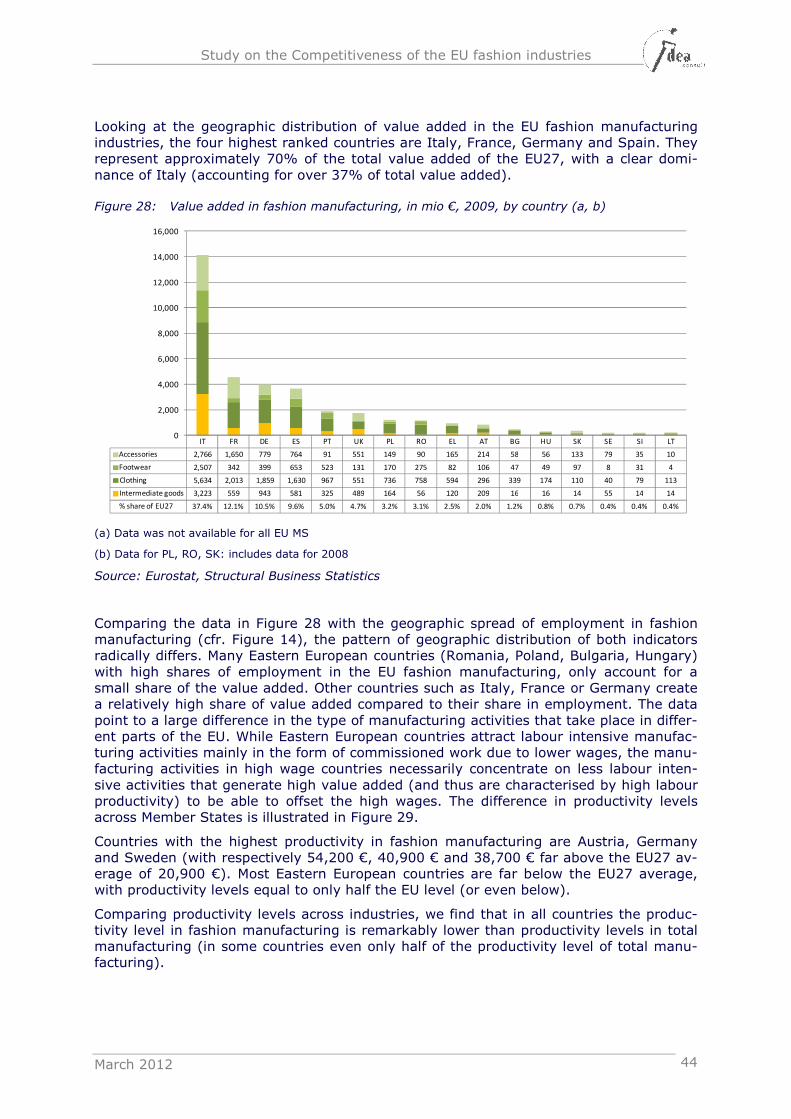
Study on the Competitiveness of the EU fashion industries
March 2012 44
Looking at the geographic distribution of value added in the EU fashion manufacturing industries, the four highest ranked countries are Italy, France, Germany and Spain. They represent approximately 70% of the total value added of the EU27, with a clear domi-nance of Italy (accounting for over 37% of total value added).
Figure 28: Value added in fashion manufacturing, in mio €, 2009, by country (a, b)
(a) Data was not available for all EU MS
(b) Data for PL, RO, SK: includes data for 2008
Source: Eurostat, Structural Business Statistics
Comparing the data in Figure 28 with the geographic spread of employment in fashion manufacturing (cfr. Figure 14), the pattern of geographic distribution of both indicators radically differs. Many Eastern European countries (Romania, Poland, Bulgaria, Hungary) with high shares of employment in the EU fashion manufacturing, only account for a small share of the value added. Other countries such as Italy, France or Germany create a relatively high share of value added compared to their share in employment. The data point to a large difference in the type of manufacturing activities that take place in differ-ent parts of the EU. While Eastern European countries attract labour intensive manufac-turing activities mainly in the form of commissioned work due to lower wages, the manu-facturing activities in high wage countries necessarily concentrate on less labour inten-sive activities that generate high value added (and thus are characterised by high labour productivity) to be able to offset the high wages. The difference in productivity levels across Member States is illustrated in Figure 29.
Countries with the highest productivity in fashion manufacturing are Austria, Germany and Sweden (with respectively 54,200 €, 40,900 € and 38,700 € far above the EU27 av-erage of 20,900 €). Most Eastern European countries are far below the EU27 average, with productivity levels equal to only half the EU level (or even below).
Comparing productivity levels across industries, we find that in all countries the produc-tivity level in fashion manufacturing is remarkably lower than productivity levels in total manufacturing (in some countries even only half of the productivity level of total manu-facturing).
IT FR DE ES PT UK PL RO EL AT BG HU SK SE SI LT
Accessories 2,766 1,650 779 764 91 551 149 90 165 214 58 56 133 79 35 10
Footwear 2,507 342 399 653 523 131 170 275 82 106 47 49 97 8 31 4
Clothing 5,634 2,013 1,859 1,630 967 551 736 758 594 296 339 174 110 40 79 113
Intermediate goods 3,223 559 943 581 325 489 164 56 120 209 16 16 14 55 14 14
% share of EU27 37.4% 12.1% 10.5% 9.6% 5.0% 4.7% 3.2% 3.1% 2.5% 2.0% 1.2% 0.8% 0.7% 0.4% 0.4% 0.4%
0
2,000
4,000
6,000
8,000
10,000
12,000
14,000
16,000
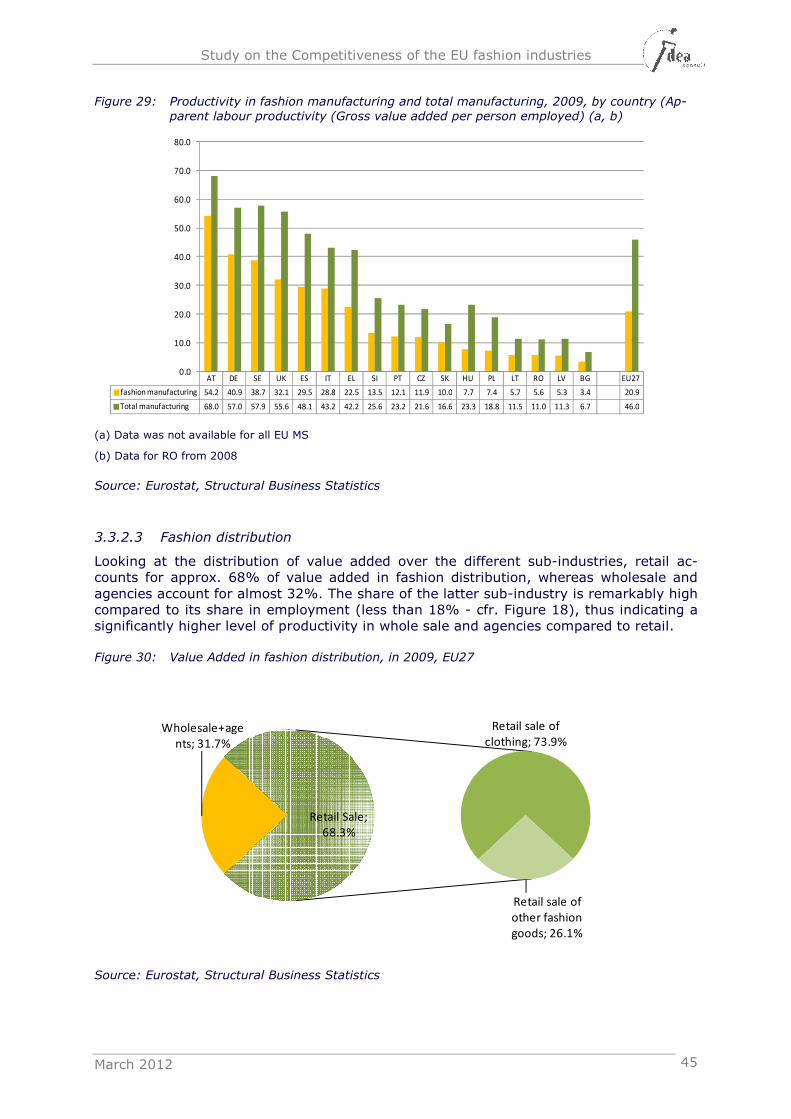
Study on the Competitiveness of the EU fashion industries
March 2012 45
Figure 29: Productivity in fashion manufacturing and total manufacturing, 2009, by country (Ap-
parent labour productivity (Gross value added per person employed) (a, b)
(a) Data was not available for all EU MS
(b) Data for RO from 2008
Source: Eurostat, Structural Business Statistics
3.3.2.3 Fashion distribution
Looking at the distribution of value added over the different sub-industries, retail ac-counts for approx. 68% of value added in fashion distribution, whereas wholesale and agencies account for almost 32%. The share of the latter sub-industry is remarkably high compared to its share in employment (less than 18% - cfr. Figure 18), thus indicating a significantly higher level of productivity in whole sale and agencies compared to retail.
Figure 30: Value Added in fashion distribution, in 2009, EU27
Source: Eurostat, Structural Business Statistics
AT DE SE UK ES IT EL SI PT CZ SK HU PL LT RO LV BG EU27
fashion manufacturing 54.2 40.9 38.7 32.1 29.5 28.8 22.5 13.5 12.1 11.9 10.0 7.7 7.4 5.7 5.6 5.3 3.4 20.9
Total manufacturing 68.0 57.0 57.9 55.6 48.1 43.2 42.2 25.6 23.2 21.6 16.6 23.3 18.8 11.5 11.0 11.3 6.7 46.0
0.0
10.0
20.0
30.0
40.0
50.0
60.0
70.0
80.0
Wholesale+age
nts; 31.7%
Retail sale of
clothing; 73.9%
Retail sale of
other fashion
goods; 26.1%
Retail Sale;
68.3%
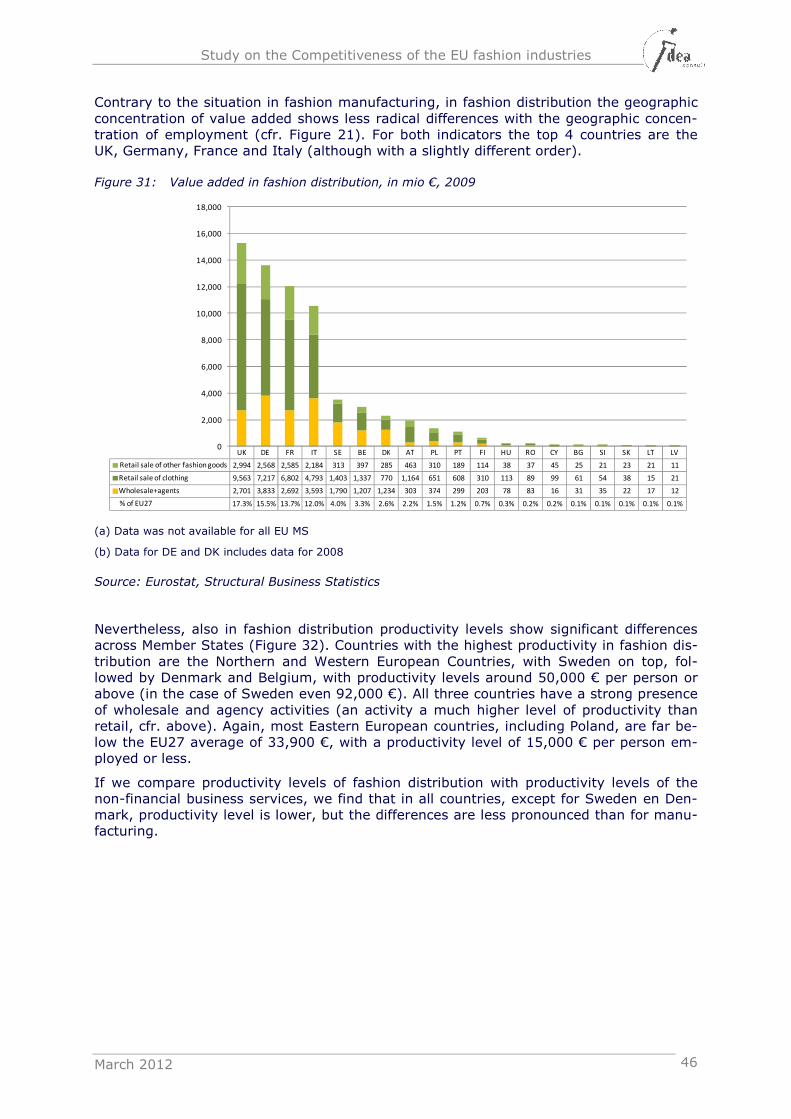
Study on the Competitiveness of the EU fashion industries
March 2012 46
Contrary to the situation in fashion manufacturing, in fashion distribution the geographic concentration of value added shows less radical differences with the geographic concen-tration of employment (cfr. Figure 21). For both indicators the top 4 countries are the UK, Germany, France and Italy (although with a slightly different order).
Figure 31: Value added in fashion distribution, in mio €, 2009
(a) Data was not available for all EU MS
(b) Data for DE and DK includes data for 2008
Source: Eurostat, Structural Business Statistics
Nevertheless, also in fashion distribution productivity levels show significant differences across Member States (Figure 32). Countries with the highest productivity in fashion dis-tribution are the Northern and Western European Countries, with Sweden on top, fol-lowed by Denmark and Belgium, with productivity levels around 50,000 € per person or above (in the case of Sweden even 92,000 €). All three countries have a strong presence of wholesale and agency activities (an activity a much higher level of productivity than retail, cfr. above). Again, most Eastern European countries, including Poland, are far be-low the EU27 average of 33,900 €, with a productivity level of 15,000 € per person em-ployed or less.
If we compare productivity levels of fashion distribution with productivity levels of the non-financial business services, we find that in all countries, except for Sweden en Den-mark, productivity level is lower, but the differences are less pronounced than for manu-facturing.
UK DE FR IT SE BE DK AT PL PT FI HU RO CY BG SI SK LT LV
Retail sale of other fashion goods 2,994 2,568 2,585 2,184 313 397 285 463 310 189 114 38 37 45 25 21 23 21 11
Retail sale of clothing 9,563 7,217 6,802 4,793 1,403 1,337 770 1,164 651 608 310 113 89 99 61 54 38 15 21
Wholesale+agents 2,701 3,833 2,692 3,593 1,790 1,207 1,234 303 374 299 203 78 83 16 31 35 22 17 12
% of EU27 17.3% 15.5% 13.7% 12.0% 4.0% 3.3% 2.6% 2.2% 1.5% 1.2% 0.7% 0.3% 0.2% 0.2% 0.1% 0.1% 0.1% 0.1% 0.1%
0
2,000
4,000
6,000
8,000
10,000
12,000
14,000
16,000
18,000
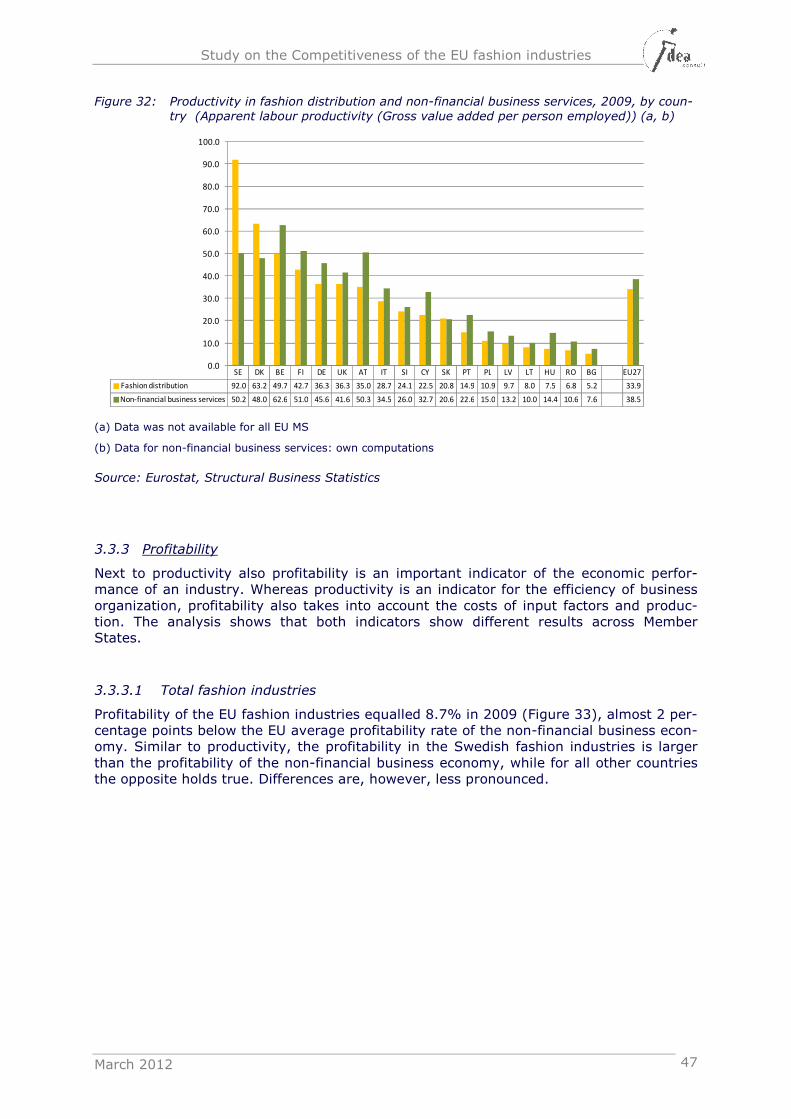
Study on the Competitiveness of the EU fashion industries
March 2012 47
Figure 32: Productivity in fashion distribution and non-financial business services, 2009, by coun-
try (Apparent labour productivity (Gross value added per person employed)) (a, b)
(a) Data was not available for all EU MS
(b) Data for non-financial business services: own computations
Source: Eurostat, Structural Business Statistics
3.3.3 Profitability
Next to productivity also profitability is an important indicator of the economic perfor-mance of an industry. Whereas productivity is an indicator for the efficiency of business organization, profitability also takes into account the costs of input factors and produc-tion. The analysis shows that both indicators show different results across Member States.
3.3.3.1 Total fashion industries
Profitability of the EU fashion industries equalled 8.7% in 2009 (Figure 33), almost 2 per-centage points below the EU average profitability rate of the non-financial business econ-omy. Similar to productivity, the profitability in the Swedish fashion industries is larger than the profitability of the non-financial business economy, while for all other countries the opposite holds true. Differences are, however, less pronounced.
SE DK BE FI DE UK AT IT SI CY SK PT PL LV LT HU RO BG EU27
Fashion distribution 92.0 63.2 49.7 42.7 36.3 36.3 35.0 28.7 24.1 22.5 20.8 14.9 10.9 9.7 8.0 7.5 6.8 5.2 33.9
Non-financial business services 50.2 48.0 62.6 51.0 45.6 41.6 50.3 34.5 26.0 32.7 20.6 22.6 15.0 13.2 10.0 14.4 10.6 7.6 38.5
0.0
10.0
20.0
30.0
40.0
50.0
60.0
70.0
80.0
90.0
100.0
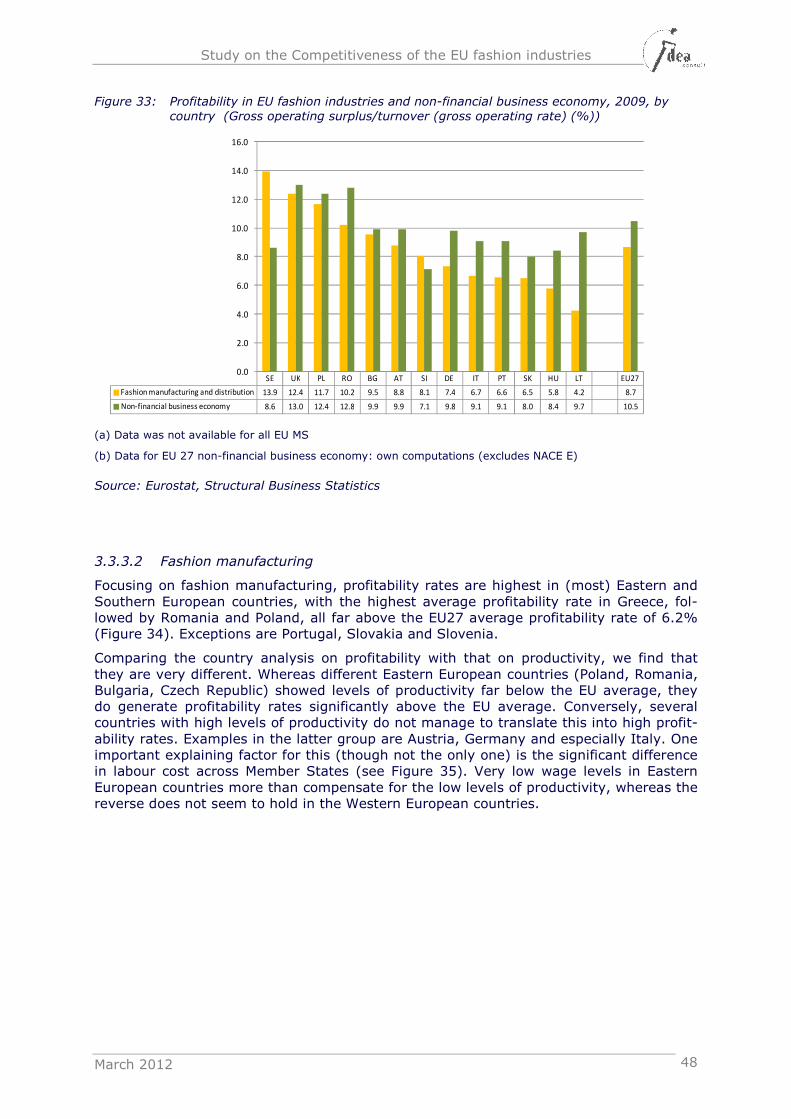
Study on the Competitiveness of the EU fashion industries
March 2012 48
Figure 33: Profitability in EU fashion industries and non-financial business economy, 2009, by
country (Gross operating surplus/turnover (gross operating rate) (%))
(a) Data was not available for all EU MS
(b) Data for EU 27 non-financial business economy: own computations (excludes NACE E)
Source: Eurostat, Structural Business Statistics
3.3.3.2 Fashion manufacturing
Focusing on fashion manufacturing, profitability rates are highest in (most) Eastern and Southern European countries, with the highest average profitability rate in Greece, fol-lowed by Romania and Poland, all far above the EU27 average profitability rate of 6.2% (Figure 34). Exceptions are Portugal, Slovakia and Slovenia.
Comparing the country analysis on profitability with that on productivity, we find that they are very different. Whereas different Eastern European countries (Poland, Romania, Bulgaria, Czech Republic) showed levels of productivity far below the EU average, they do generate profitability rates significantly above the EU average. Conversely, several countries with high levels of productivity do not manage to translate this into high profit-ability rates. Examples in the latter group are Austria, Germany and especially Italy. One important explaining factor for this (though not the only one) is the significant difference in labour cost across Member States (see Figure 35). Very low wage levels in Eastern European countries more than compensate for the low levels of productivity, whereas the reverse does not seem to hold in the Western European countries.
SE UK PL RO BG AT SI DE IT PT SK HU LT EU27
Fashion manufacturing and distribution 13.9 12.4 11.7 10.2 9.5 8.8 8.1 7.4 6.7 6.6 6.5 5.8 4.2 8.7
Non-financial business economy 8.6 13.0 12.4 12.8 9.9 9.9 7.1 9.8 9.1 9.1 8.0 8.4 9.7 10.5
0.0
2.0
4.0
6.0
8.0
10.0
12.0
14.0
16.0
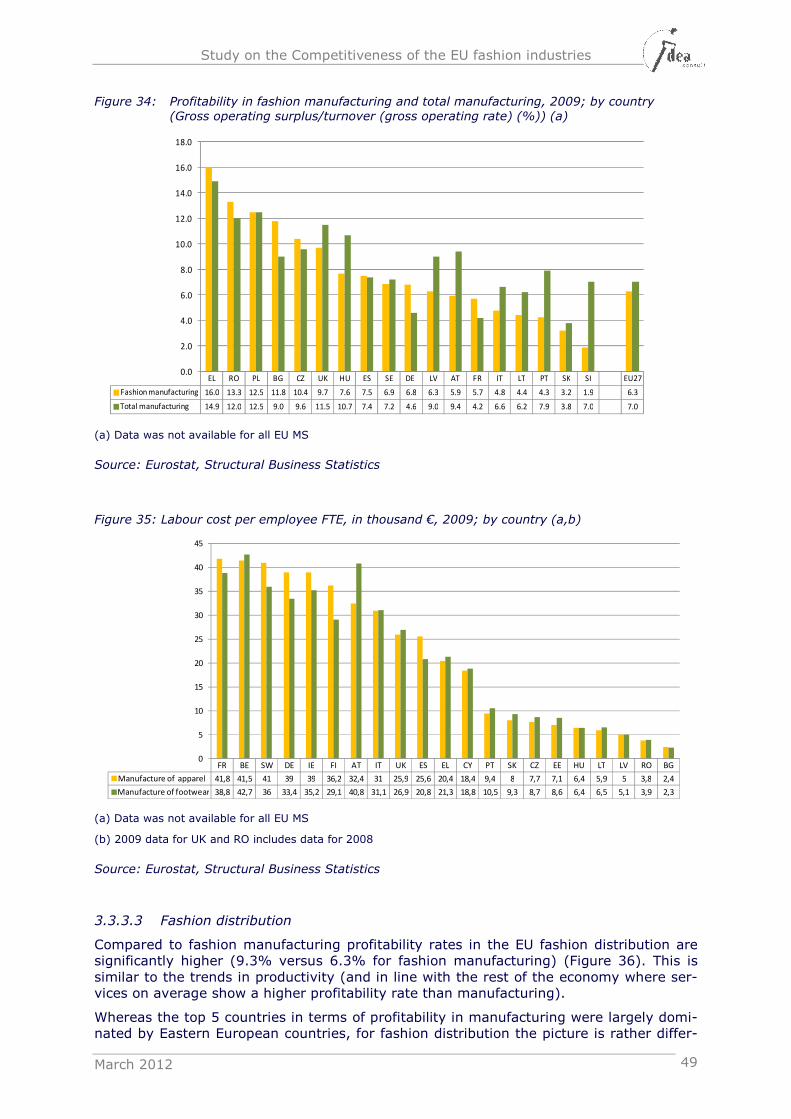
Study on the Competitiveness of the EU fashion industries
March 2012 49
Figure 34: Profitability in fashion manufacturing and total manufacturing, 2009; by country
(Gross operating surplus/turnover (gross operating rate) (%)) (a)
(a) Data was not available for all EU MS
Source: Eurostat, Structural Business Statistics
Figure 35: Labour cost per employee FTE, in thousand €, 2009; by country (a,b)
(a) Data was not available for all EU MS
(b) 2009 data for UK and RO includes data for 2008
Source: Eurostat, Structural Business Statistics
3.3.3.3 Fashion distribution
Compared to fashion manufacturing profitability rates in the EU fashion distribution are significantly higher (9.3% versus 6.3% for fashion manufacturing) (Figure 36). This is similar to the trends in productivity (and in line with the rest of the economy where ser-vices on average show a higher profitability rate than manufacturing).
Whereas the top 5 countries in terms of profitability in manufacturing were largely domi-nated by Eastern European countries, for fashion distribution the picture is rather differ-
EL RO PL BG CZ UK HU ES SE DE LV AT FR IT LT PT SK SI EU27
Fashion manufacturing 16.0 13.3 12.5 11.8 10.4 9.7 7.6 7.5 6.9 6.8 6.3 5.9 5.7 4.8 4.4 4.3 3.2 1.9 6.3
Total manufacturing 14.9 12.0 12.5 9.0 9.6 11.5 10.7 7.4 7.2 4.6 9.0 9.4 4.2 6.6 6.2 7.9 3.8 7.0 7.0
0.0
2.0
4.0
6.0
8.0
10.0
12.0
14.0
16.0
18.0
FR BE SW DE IE FI AT IT UK ES EL CY PT SK CZ EE HU LT LV RO BG
Manufacture of apparel 41,8 41,5 41 39 39 36,2 32,4 31 25,9 25,6 20,4 18,4 9,4 8 7,7 7,1 6,4 5,9 5 3,8 2,4
Manufacture of footwear 38,8 42,7 36 33,4 35,2 29,1 40,8 31,1 26,9 20,8 21,3 18,8 10,5 9,3 8,7 8,6 6,4 6,5 5,1 3,9 2,3
0
5
10
15
20
25
30
35
40
45
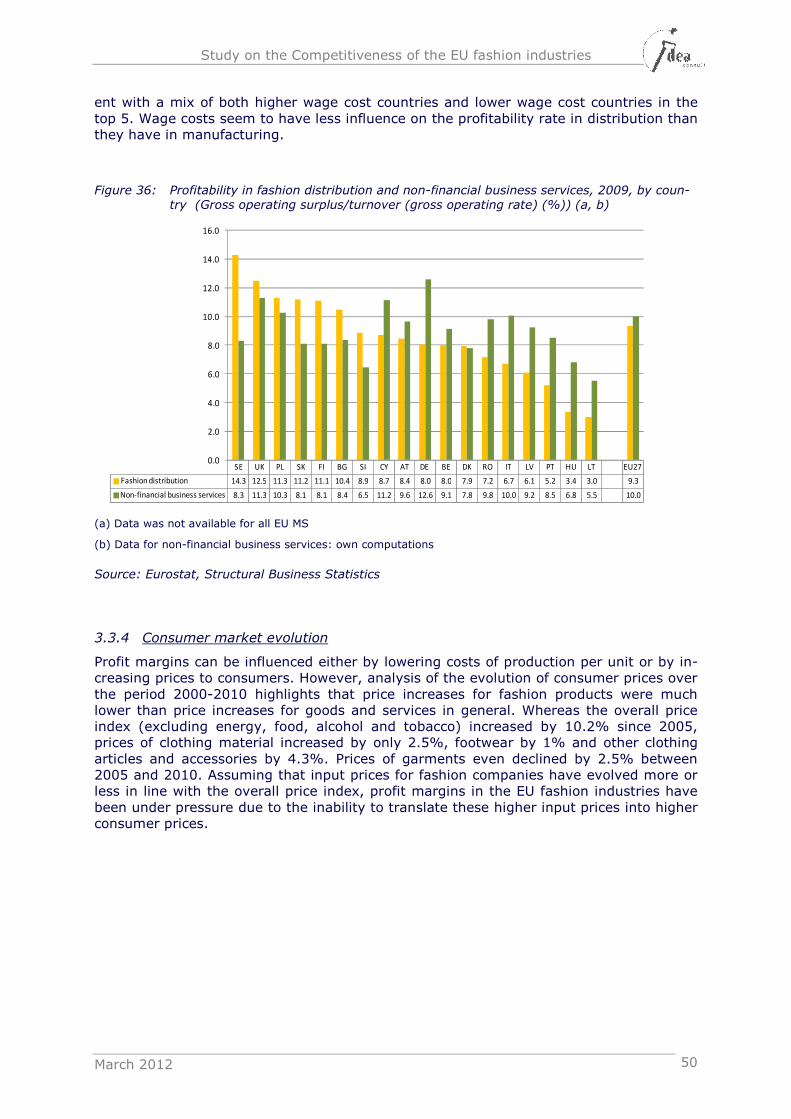
Study on the Competitiveness of the EU fashion industries
March 2012 50
ent with a mix of both higher wage cost countries and lower wage cost countries in the top 5. Wage costs seem to have less influence on the profitability rate in distribution than they have in manufacturing.
Figure 36: Profitability in fashion distribution and non-financial business services, 2009, by coun-try (Gross operating surplus/turnover (gross operating rate) (%)) (a, b)
(a) Data was not available for all EU MS
(b) Data for non-financial business services: own computations
Source: Eurostat, Structural Business Statistics
3.3.4 Consumer market evolution
Profit margins can be influenced either by lowering costs of production per unit or by in-creasing prices to consumers. However, analysis of the evolution of consumer prices over the period 2000-2010 highlights that price increases for fashion products were much lower than price increases for goods and services in general. Whereas the overall price index (excluding energy, food, alcohol and tobacco) increased by 10.2% since 2005, prices of clothing material increased by only 2.5%, footwear by 1% and other clothing articles and accessories by 4.3%. Prices of garments even declined by 2.5% between 2005 and 2010. Assuming that input prices for fashion companies have evolved more or less in line with the overall price index, profit margins in the EU fashion industries have been under pressure due to the inability to translate these higher input prices into higher consumer prices.
SE UK PL SK FI BG SI CY AT DE BE DK RO IT LV PT HU LT EU27
Fashion distribution 14.3 12.5 11.3 11.2 11.1 10.4 8.9 8.7 8.4 8.0 8.0 7.9 7.2 6.7 6.1 5.2 3.4 3.0 9.3
Non-financial business services 8.3 11.3 10.3 8.1 8.1 8.4 6.5 11.2 9.6 12.6 9.1 7.8 9.8 10.0 9.2 8.5 6.8 5.5 10.0
0.0
2.0
4.0
6.0
8.0
10.0
12.0
14.0
16.0
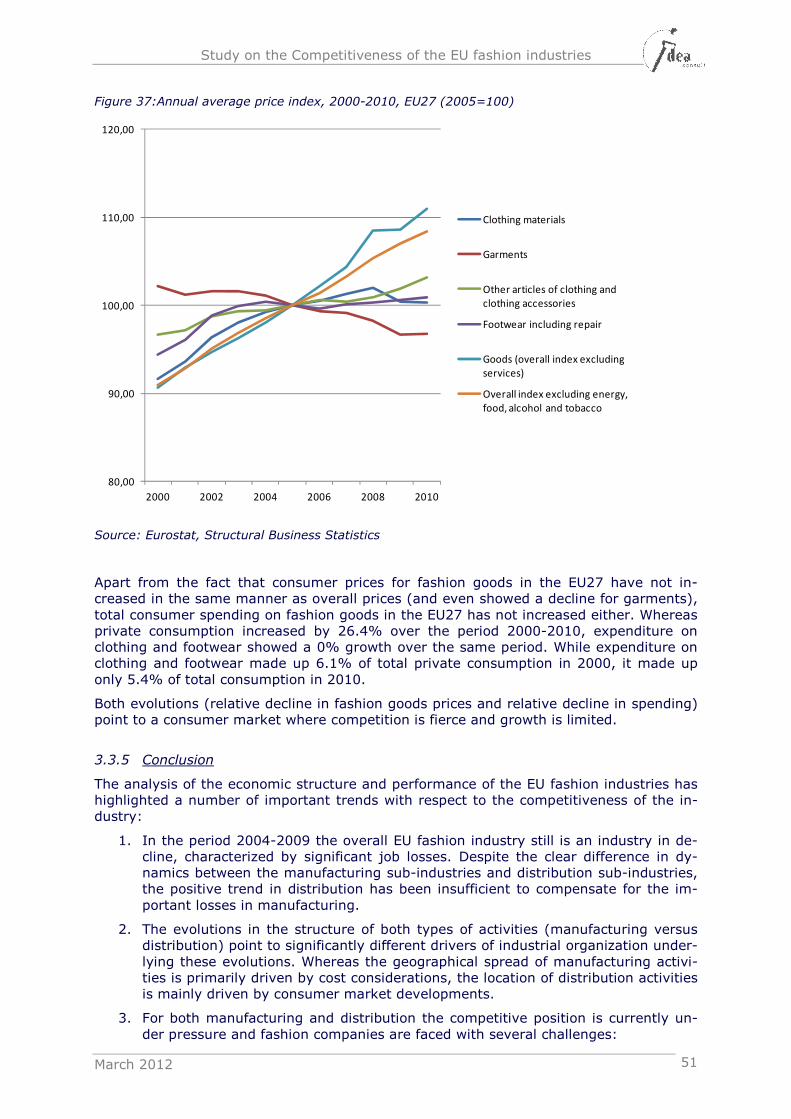
Study on the Competitiveness of the EU fashion industries
March 2012 51
Figure 37:Annual average price index, 2000-2010, EU27 (2005=100)
Source: Eurostat, Structural Business Statistics
Apart from the fact that consumer prices for fashion goods in the EU27 have not in-creased in the same manner as overall prices (and even showed a decline for garments), total consumer spending on fashion goods in the EU27 has not increased either. Whereas private consumption increased by 26.4% over the period 2000-2010, expenditure on clothing and footwear showed a 0% growth over the same period. While expenditure on clothing and footwear made up 6.1% of total private consumption in 2000, it made up only 5.4% of total consumption in 2010.
Both evolutions (relative decline in fashion goods prices and relative decline in spending) point to a consumer market where competition is fierce and growth is limited.
3.3.5 Conclusion
The analysis of the economic structure and performance of the EU fashion industries has highlighted a number of important trends with respect to the competitiveness of the in-dustry:
1. In the period 2004-2009 the overall EU fashion industry still is an industry in de-cline, characterized by significant job losses. Despite the clear difference in dy-namics between the manufacturing sub-industries and distribution sub-industries, the positive trend in distribution has been insufficient to compensate for the im-portant losses in manufacturing.
2. The evolutions in the structure of both types of activities (manufacturing versus distribution) point to significantly different drivers of industrial organization under-lying these evolutions. Whereas the geographical spread of manufacturing activi-ties is primarily driven by cost considerations, the location of distribution activities is mainly driven by consumer market developments.
3. For both manufacturing and distribution the competitive position is currently un-der pressure and fashion companies are faced with several challenges:
80,00
90,00
100,00
110,00
120,00
2000 2002 2004 2006 2008 2010
Clothing materials
Garments
Other articles of clothing and
clothing accessories
Footwear including repair
Goods (overall index excluding
services)
Overall index excluding energy,
food, alcohol and tobacco
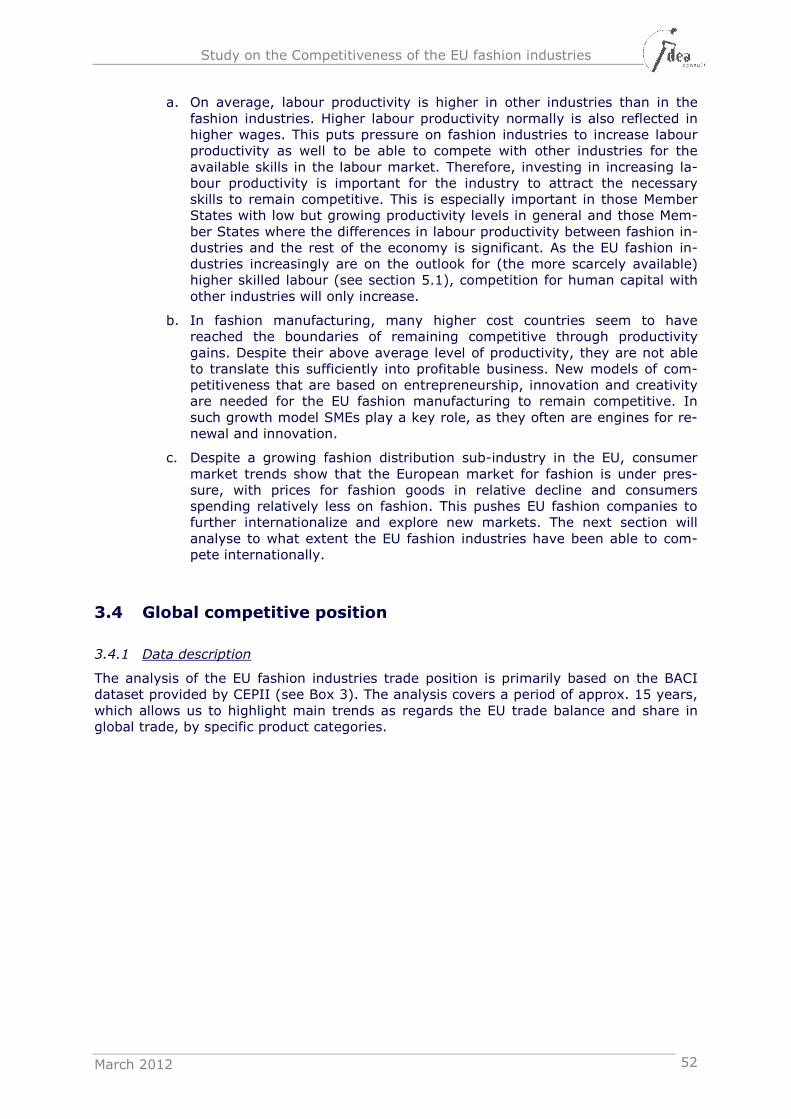
Study on the Competitiveness of the EU fashion industries
March 2012 52
a. On average, labour productivity is higher in other industries than in the fashion industries. Higher labour productivity normally is also reflected in higher wages. This puts pressure on fashion industries to increase labour productivity as well to be able to compete with other industries for the available skills in the labour market. Therefore, investing in increasing la-bour productivity is important for the industry to attract the necessary skills to remain competitive. This is especially important in those Member States with low but growing productivity levels in general and those Mem-ber States where the differences in labour productivity between fashion in-dustries and the rest of the economy is significant. As the EU fashion in-dustries increasingly are on the outlook for (the more scarcely available) higher skilled labour (see section 5.1), competition for human capital with other industries will only increase.
b. In fashion manufacturing, many higher cost countries seem to have reached the boundaries of remaining competitive through productivity gains. Despite their above average level of productivity, they are not able to translate this sufficiently into profitable business. New models of com-petitiveness that are based on entrepreneurship, innovation and creativity are needed for the EU fashion manufacturing to remain competitive. In such growth model SMEs play a key role, as they often are engines for re-newal and innovation.
c. Despite a growing fashion distribution sub-industry in the EU, consumer market trends show that the European market for fashion is under pres-sure, with prices for fashion goods in relative decline and consumers spending relatively less on fashion. This pushes EU fashion companies to further internationalize and explore new markets. The next section will analyse to what extent the EU fashion industries have been able to com-pete internationally.
3.4 Global competitive position
3.4.1 Data description
The analysis of the EU fashion industries trade position is primarily based on the BACI dataset provided by CEPII (see Box 3). The analysis covers a period of approx. 15 years, which allows us to highlight main trends as regards the EU trade balance and share in global trade, by specific product categories.
Study on the Competitiveness of the EU fashion industries
March 2012 53
Box 3: BACI database on trade
BACI is a world trade database which covers all bilateral trade flows at a very high level of product disaggregation. The original data comes from files that are sent by the cus-toms services of each declaring country --exporter or importer-- to the United Nations Statistical Division (COMTRADE database). The CEPII has developed an original proce-dure to reconcile the declarations of the exporters and the importers. By taking ad-vantage of mirror trade flows18, after adjusting all CIF declarations by their FOB equiva-lent and all unit measures by their tons’ equivalent, BACI extends considerably the number of pair of countries for which trade data are available, as compared to the UN dataset. BACI provides trade values and physical traded quantities (in tons) at the HS 6-digit product disaggregation (over 5,000 products), for pair of countries, involving more than 200 countries over the period 1995- 2010. It also provides physical traded quanti-ties (in tons or ton equivalents) from 1995 to 2009. Unit values are needed to construct high-quality, mid and low-quality market segments. As a consequence, in the section that describes market share trends across market segments, data runs only until 2009.
For the purpose of this report, an extraction of the lines of products that are directly linked to fashion has been made from BACI. The products have been then ranged into four sub-categories: Fashion-related Intermediary Products19, Clothing, Footwear and finally, a mixed category of Accessories and Jewellery20. These product categories more or less correspond to the goods produced by the four clusters of manufacturing sub-industries that have been used in the previous analysis (cfr. sections 3.2 and 3.3). Annex 2 provides some examples of those goods for which trade data are available. A look at the data enables us to count around 600 product lines involved under these aggregates.
Besides enabling to relate each of the products to a particular fashion sub-category, BACI also allows to compute unit values (i.e. prices per each shipped ton) from US dollar val-ues and physical volumes (in tons) that are observed. Unit values serve usually as a measure of quality in the literature21. This information allows ranging each of the fashion goods exported from one country to another into one of the 3 following market seg-ments: a High unit value segment, a Medium one and finally, a Low unit value segment. To do so, we compare for each market (defined by a couple “destination-HS6 product line”), the price (unit value) associated with a particular exporting country with the whole distribution of prices. Where the price falls below the first quartile of the distribution, the observed flow is ranged in the Low segment of the market. If on the contrary, the price lies above the 3rd quartile, the corresponding flow is ranged in the High segment of the market. When the price lies in between, the flow is ranged in the Medium-unit value segment.
3.4.2 EU27 trade in Fashion industries: Facts and Figures
Figure 38 reports the evolution of EU27 exports and imports with the rest of the world (called ‘RoW’ hereafter), along with that of the trade balance. From 1995 to 2008, keep-ing the post years crisis (2009 and 2010) aside, EU exports in Fashion products have increased by around 50%, thus moving-up at an average rate of about 3% per year, a rate more than two times higher than that of their collective GDP over the period (1.4%
18 Mirror flows are double declarations of bilateral flows, made available to the UN by both sides of the transac-
tion, the exporter and the importer. 19 Examples of intermediary inputs can be products like Sheep or lamb skin leather, Chamois, Chenille cotton
fabric, etc. 20 Examples of accessories can be handbags, gloves, etc. 21 Actually, within a particular HS6 and a destination market, differences in unit values inform about differences
in quality but also differences in production and shipping costs. We follow most of the literature to assume however that if a product from one origin country can still be sold in some destination country despite its high unit value, this product should be of a quality high enough to compensate the disadvantage it would have from a possible high cost of production and shipment.
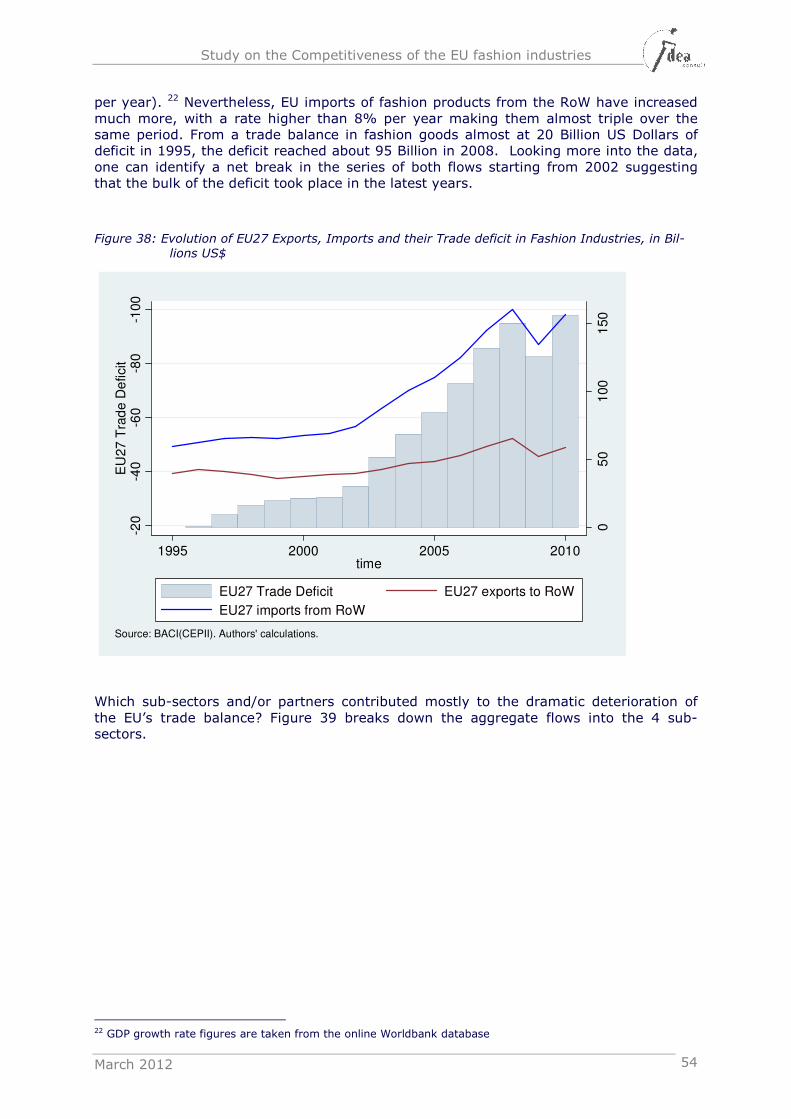
Study on the Competitiveness of the EU fashion industries
March 2012 54
per year). 22 Nevertheless, EU imports of fashion products from the RoW have increased much more, with a rate higher than 8% per year making them almost triple over the same period. From a trade balance in fashion goods almost at 20 Billion US Dollars of deficit in 1995, the deficit reached about 95 Billion in 2008. Looking more into the data, one can identify a net break in the series of both flows starting from 2002 suggesting that the bulk of the deficit took place in the latest years.
Figure 38: Evolution of EU27 Exports, Imports and their Trade deficit in Fashion Industries, in Bil-
lions US$
Which sub-sectors and/or partners contributed mostly to the dramatic deterioration of the EU’s trade balance? Figure 39 breaks down the aggregate flows into the 4 sub-sectors.
22 GDP growth rate figures are taken from the online Worldbank database
05
01
00
150-1
00
-80
-60
-40
-20
EU
27
Tra
de D
eficit
1995 2000 2005 2010time
EU27 Trade Deficit EU27 exports to RoW
EU27 imports from RoW
Source: BACI(CEPII). Authors' calculations.
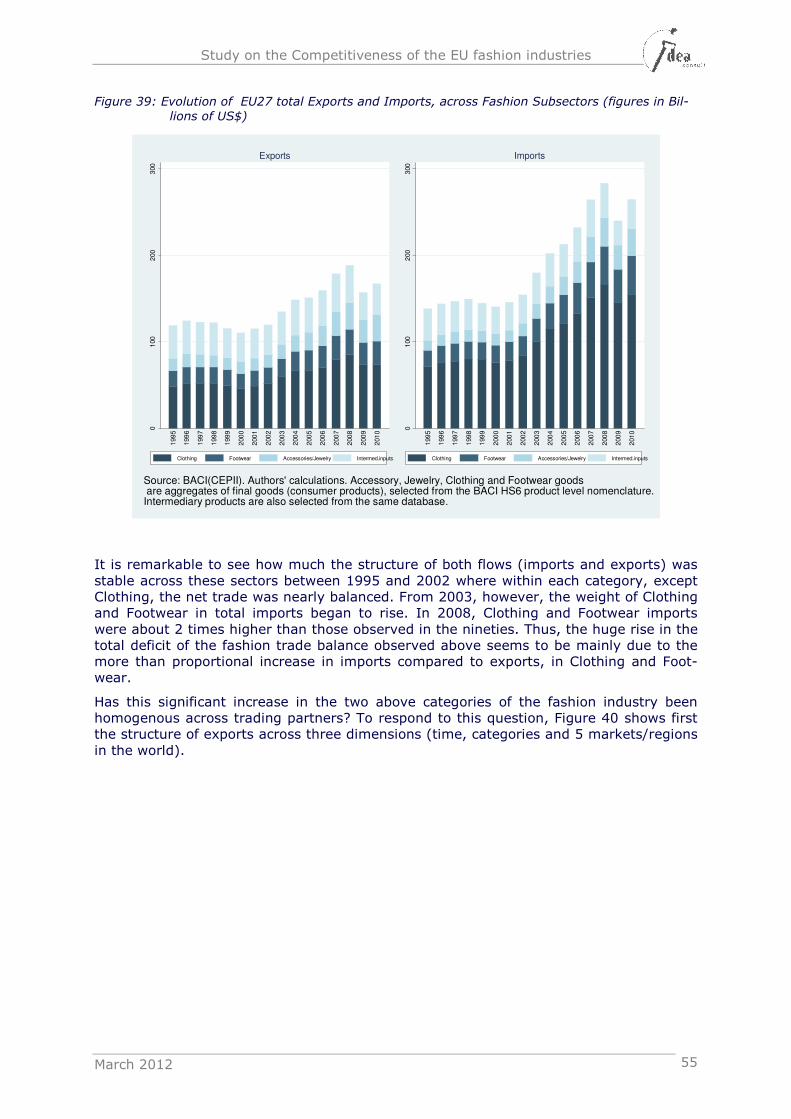
Study on the Competitiveness of the EU fashion industries
March 2012 55
Figure 39: Evolution of EU27 total Exports and Imports, across Fashion Subsectors (figures in Bil-
lions of US$)
It is remarkable to see how much the structure of both flows (imports and exports) was stable across these sectors between 1995 and 2002 where within each category, except Clothing, the net trade was nearly balanced. From 2003, however, the weight of Clothing and Footwear in total imports began to rise. In 2008, Clothing and Footwear imports were about 2 times higher than those observed in the nineties. Thus, the huge rise in the total deficit of the fashion trade balance observed above seems to be mainly due to the more than proportional increase in imports compared to exports, in Clothing and Foot-wear.
Has this significant increase in the two above categories of the fashion industry been homogenous across trading partners? To respond to this question, Figure 40 shows first the structure of exports across three dimensions (time, categories and 5 markets/regions in the world).
01
00
200
300
199
5
199
6
199
7
199
8
199
9
200
0
200
1
200
2
200
3
200
4
200
5
200
6
200
7
200
8
200
9
201
0
Exports
Clothing Footwear Accessories/Jewelry Intermed.inputs
01
00
200
300
199
5
199
6
199
7
199
8
199
9
200
0
200
1
200
2
200
3
200
4
200
5
200
6
200
7
200
8
200
9
201
0
Imports
Clothing Footwear Accessories/Jewelry Intermed.inputs
Source: BACI(CEPII). Authors' calculations. Accessory, Jewelry, Clothing and Footwear goods are aggregates of final goods (consumer products), selected from the BACI HS6 product level nomenclature.Intermediary products are also selected from the same database.
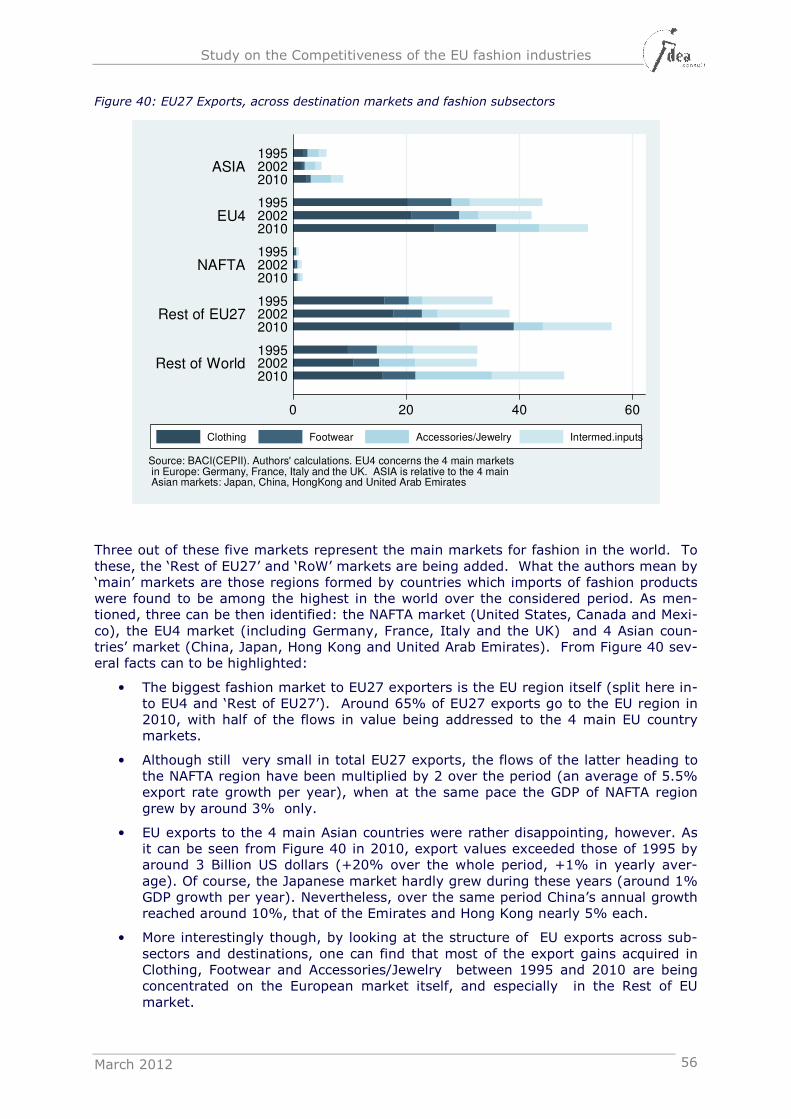
Study on the Competitiveness of the EU fashion industries
March 2012 56
Figure 40: EU27 Exports, across destination markets and fashion subsectors
Three out of these five markets represent the main markets for fashion in the world. To these, the ‘Rest of EU27’ and ‘RoW’ markets are being added. What the authors mean by ‘main’ markets are those regions formed by countries which imports of fashion products were found to be among the highest in the world over the considered period. As men-tioned, three can be then identified: the NAFTA market (United States, Canada and Mexi-co), the EU4 market (including Germany, France, Italy and the UK) and 4 Asian coun-tries’ market (China, Japan, Hong Kong and United Arab Emirates). From Figure 40 sev-eral facts can to be highlighted:
• The biggest fashion market to EU27 exporters is the EU region itself (split here in-to EU4 and ‘Rest of EU27’). Around 65% of EU27 exports go to the EU region in 2010, with half of the flows in value being addressed to the 4 main EU country markets.
• Although still very small in total EU27 exports, the flows of the latter heading to the NAFTA region have been multiplied by 2 over the period (an average of 5.5% export rate growth per year), when at the same pace the GDP of NAFTA region grew by around 3% only.
• EU exports to the 4 main Asian countries were rather disappointing, however. As it can be seen from Figure 40 in 2010, export values exceeded those of 1995 by around 3 Billion US dollars (+20% over the whole period, +1% in yearly aver-age). Of course, the Japanese market hardly grew during these years (around 1% GDP growth per year). Nevertheless, over the same period China’s annual growth reached around 10%, that of the Emirates and Hong Kong nearly 5% each.
• More interestingly though, by looking at the structure of EU exports across sub-sectors and destinations, one can find that most of the export gains acquired in Clothing, Footwear and Accessories/Jewelry between 1995 and 2010 are being concentrated on the European market itself, and especially in the Rest of EU market.
0 20 40 60
Rest of World
Rest of EU27
NAFTA
EU4
ASIA
201020021995
201020021995
201020021995
201020021995
201020021995
Source: BACI(CEPII). Authors' calculations. EU4 concerns the 4 main markets in Europe: Germany, France, Italy and the UK. ASIA is relative to the 4 main Asian markets: Japan, China, HongKong and United Arab Emirates
Clothing Footwear Accessories/Jewelry Intermed.inputs
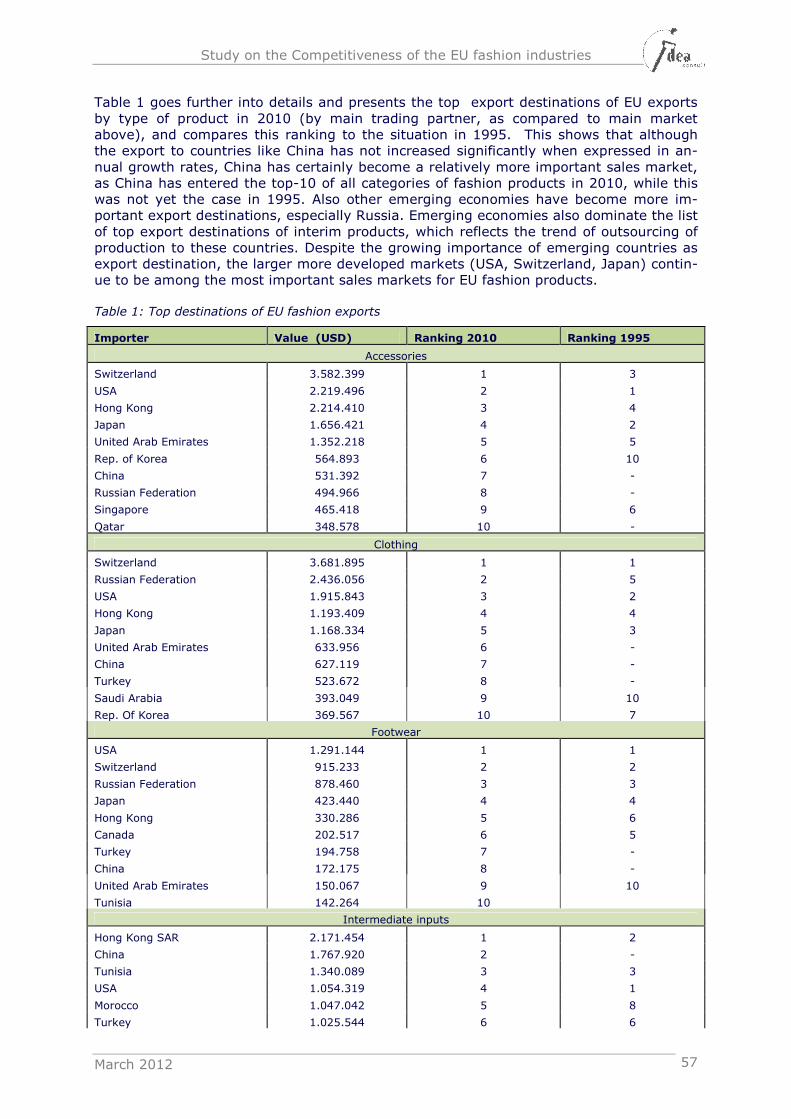
Study on the Competitiveness of the EU fashion industries
March 2012 57
Table 1 goes further into details and presents the top export destinations of EU exports by type of product in 2010 (by main trading partner, as compared to main market above), and compares this ranking to the situation in 1995. This shows that although the export to countries like China has not increased significantly when expressed in an-nual growth rates, China has certainly become a relatively more important sales market, as China has entered the top-10 of all categories of fashion products in 2010, while this was not yet the case in 1995. Also other emerging economies have become more im-portant export destinations, especially Russia. Emerging economies also dominate the list of top export destinations of interim products, which reflects the trend of outsourcing of production to these countries. Despite the growing importance of emerging countries as export destination, the larger more developed markets (USA, Switzerland, Japan) contin-ue to be among the most important sales markets for EU fashion products.
Table 1: Top destinations of EU fashion exports
Importer Value (USD) Ranking 2010 Ranking 1995
Accessories
Switzerland 3.582.399 1 3
USA 2.219.496 2 1
Hong Kong 2.214.410 3 4
Japan 1.656.421 4 2
United Arab Emirates 1.352.218 5 5
Rep. of Korea 564.893 6 10
China 531.392 7 -
Russian Federation 494.966 8 -
Singapore 465.418 9 6
Qatar 348.578 10 -
Clothing
Switzerland 3.681.895 1 1
Russian Federation 2.436.056 2 5
USA 1.915.843 3 2
Hong Kong 1.193.409 4 4
Japan 1.168.334 5 3
United Arab Emirates 633.956 6 -
China 627.119 7 -
Turkey 523.672 8 -
Saudi Arabia 393.049 9 10
Rep. Of Korea 369.567 10 7
Footwear
USA 1.291.144 1 1
Switzerland 915.233 2 2
Russian Federation 878.460 3 3
Japan 423.440 4 4
Hong Kong 330.286 5 6
Canada 202.517 6 5
Turkey 194.758 7 -
China 172.175 8 -
United Arab Emirates 150.067 9 10
Tunisia 142.264 10
Intermediate inputs
Hong Kong SAR 2.171.454 1 2
China 1.767.920 2 -
Tunisia 1.340.089 3 3
USA 1.054.319 4 1
Morocco 1.047.042 5 8
Turkey 1.025.544 6 6
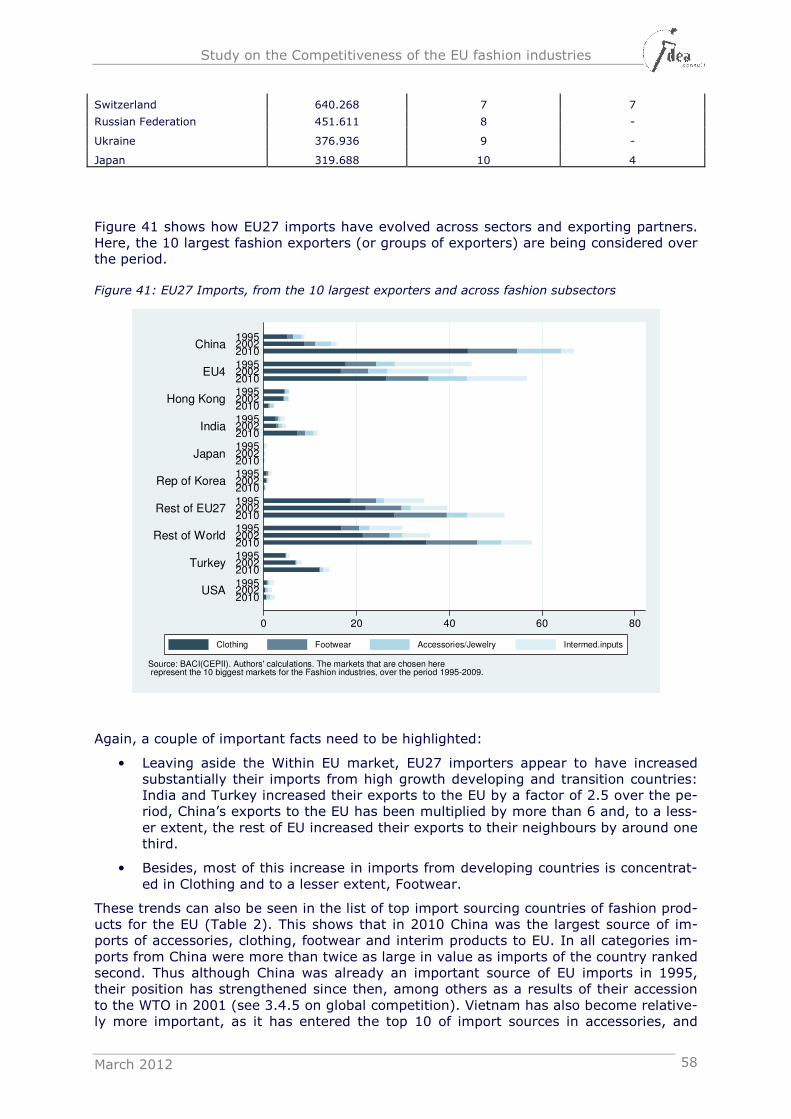
Study on the Competitiveness of the EU fashion industries
March 2012 58
Switzerland 640.268 7 7
Russian Federation 451.611 8 -
Ukraine 376.936 9 -
Japan 319.688 10 4
Figure 41 shows how EU27 imports have evolved across sectors and exporting partners. Here, the 10 largest fashion exporters (or groups of exporters) are being considered over the period.
Figure 41: EU27 Imports, from the 10 largest exporters and across fashion subsectors
Again, a couple of important facts need to be highlighted:
• Leaving aside the Within EU market, EU27 importers appear to have increased substantially their imports from high growth developing and transition countries: India and Turkey increased their exports to the EU by a factor of 2.5 over the pe-riod, China’s exports to the EU has been multiplied by more than 6 and, to a less-er extent, the rest of EU increased their exports to their neighbours by around one third.
• Besides, most of this increase in imports from developing countries is concentrat-ed in Clothing and to a lesser extent, Footwear.
These trends can also be seen in the list of top import sourcing countries of fashion prod-ucts for the EU (Table 2). This shows that in 2010 China was the largest source of im-ports of accessories, clothing, footwear and interim products to EU. In all categories im-ports from China were more than twice as large in value as imports of the country ranked second. Thus although China was already an important source of EU imports in 1995, their position has strengthened since then, among others as a results of their accession to the WTO in 2001 (see 3.4.5 on global competition). Vietnam has also become relative-ly more important, as it has entered the top 10 of import sources in accessories, and
0 20 40 60 80
USA
Turkey
Rest of World
Rest of EU27
Rep of Korea
Japan
India
Hong Kong
EU4
China
201020021995
201020021995
201020021995
201020021995
201020021995
201020021995
201020021995
201020021995
201020021995
201020021995
Source: BACI(CEPII). Authors' calculations. The markets that are chosen here represent the 10 biggest markets for the Fashion industries, over the period 1995-2009.
Clothing Footwear Accessories/Jewelry Intermed.inputs
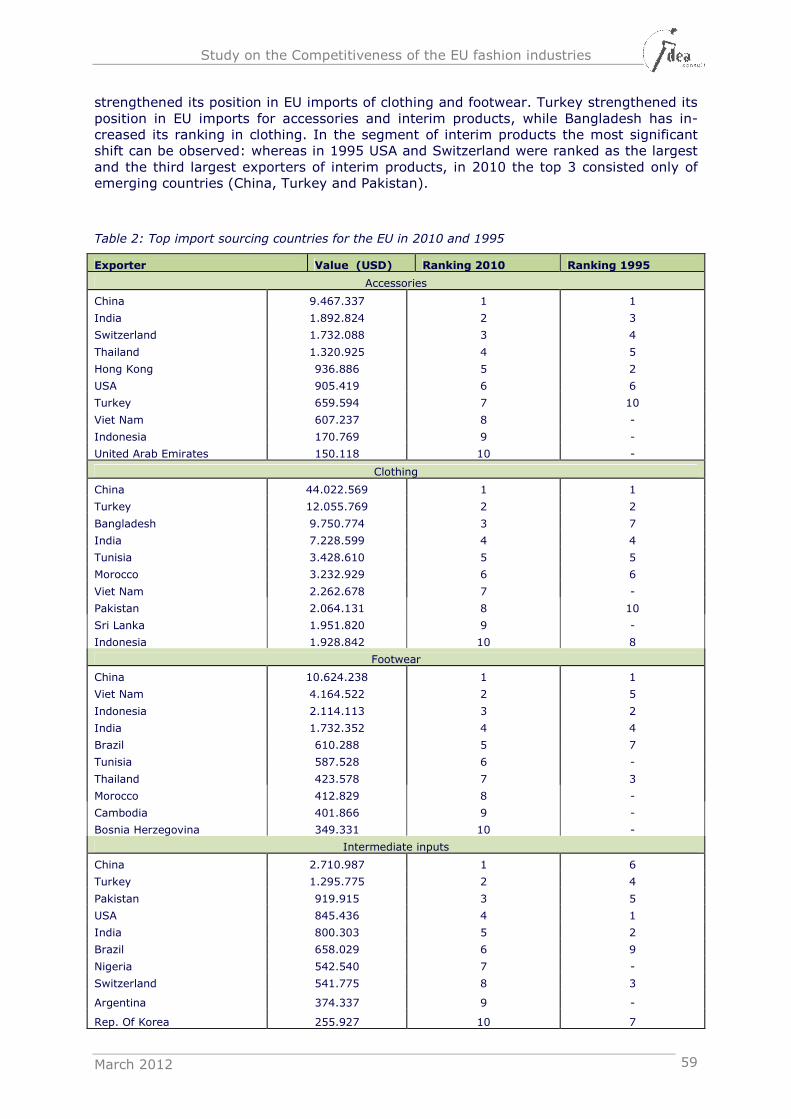
Study on the Competitiveness of the EU fashion industries
March 2012 59
strengthened its position in EU imports of clothing and footwear. Turkey strengthened its position in EU imports for accessories and interim products, while Bangladesh has in-creased its ranking in clothing. In the segment of interim products the most significant shift can be observed: whereas in 1995 USA and Switzerland were ranked as the largest and the third largest exporters of interim products, in 2010 the top 3 consisted only of emerging countries (China, Turkey and Pakistan).
Table 2: Top import sourcing countries for the EU in 2010 and 1995
Exporter Value (USD) Ranking 2010 Ranking 1995
Accessories
China 9.467.337 1 1
India 1.892.824 2 3
Switzerland 1.732.088 3 4
Thailand 1.320.925 4 5
Hong Kong 936.886 5 2
USA 905.419 6 6
Turkey 659.594 7 10
Viet Nam 607.237 8 -
Indonesia 170.769 9 -
United Arab Emirates 150.118 10 -
Clothing
China 44.022.569 1 1
Turkey 12.055.769 2 2
Bangladesh 9.750.774 3 7
India 7.228.599 4 4
Tunisia 3.428.610 5 5
Morocco 3.232.929 6 6
Viet Nam 2.262.678 7 -
Pakistan 2.064.131 8 10
Sri Lanka 1.951.820 9 -
Indonesia 1.928.842 10 8
Footwear
China 10.624.238 1 1
Viet Nam 4.164.522 2 5
Indonesia 2.114.113 3 2
India 1.732.352 4 4
Brazil 610.288 5 7
Tunisia 587.528 6 -
Thailand 423.578 7 3
Morocco 412.829 8 -
Cambodia 401.866 9 -
Bosnia Herzegovina 349.331 10 -
Intermediate inputs
China 2.710.987 1 6
Turkey 1.295.775 2 4
Pakistan 919.915 3 5
USA 845.436 4 1
India 800.303 5 2
Brazil 658.029 6 9
Nigeria 542.540 7 -
Switzerland 541.775 8 3
Argentina 374.337 9 -
Rep. Of Korea 255.927 10 7
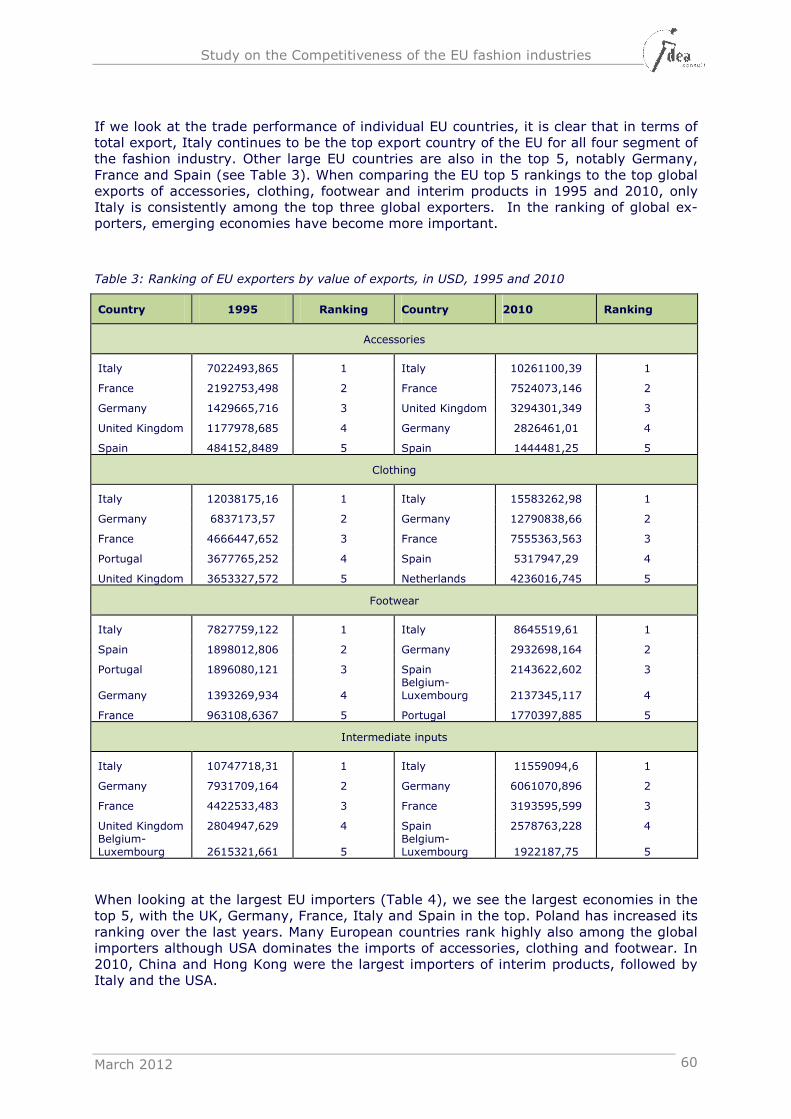
Study on the Competitiveness of the EU fashion industries
March 2012 60
If we look at the trade performance of individual EU countries, it is clear that in terms of total export, Italy continues to be the top export country of the EU for all four segment of the fashion industry. Other large EU countries are also in the top 5, notably Germany, France and Spain (see Table 3). When comparing the EU top 5 rankings to the top global exports of accessories, clothing, footwear and interim products in 1995 and 2010, only Italy is consistently among the top three global exporters. In the ranking of global ex-porters, emerging economies have become more important.
Table 3: Ranking of EU exporters by value of exports, in USD, 1995 and 2010
Country 1995 Ranking Country 2010 Ranking
Accessories
Italy 7022493,865 1 Italy 10261100,39 1
France 2192753,498 2 France 7524073,146 2
Germany 1429665,716 3 United Kingdom 3294301,349 3
United Kingdom 1177978,685 4 Germany 2826461,01 4
Spain 484152,8489 5 Spain 1444481,25 5
Clothing
Italy 12038175,16 1 Italy 15583262,98 1
Germany 6837173,57 2 Germany 12790838,66 2
France 4666447,652 3 France 7555363,563 3
Portugal 3677765,252 4 Spain 5317947,29 4
United Kingdom 3653327,572 5 Netherlands 4236016,745 5
Footwear
Italy 7827759,122 1 Italy 8645519,61 1
Spain 1898012,806 2 Germany 2932698,164 2
Portugal 1896080,121 3 Spain 2143622,602 3
Germany 1393269,934 4 Belgium-Luxembourg 2137345,117 4
France 963108,6367 5 Portugal 1770397,885 5
Intermediate inputs
Italy 10747718,31 1 Italy 11559094,6 1
Germany 7931709,164 2 Germany 6061070,896 2
France 4422533,483 3 France 3193595,599 3
United Kingdom 2804947,629 4 Spain 2578763,228 4 Belgium-Luxembourg 2615321,661 5
Belgium-Luxembourg 1922187,75 5
When looking at the largest EU importers (Table 4), we see the largest economies in the top 5, with the UK, Germany, France, Italy and Spain in the top. Poland has increased its ranking over the last years. Many European countries rank highly also among the global importers although USA dominates the imports of accessories, clothing and footwear. In 2010, China and Hong Kong were the largest importers of interim products, followed by Italy and the USA.
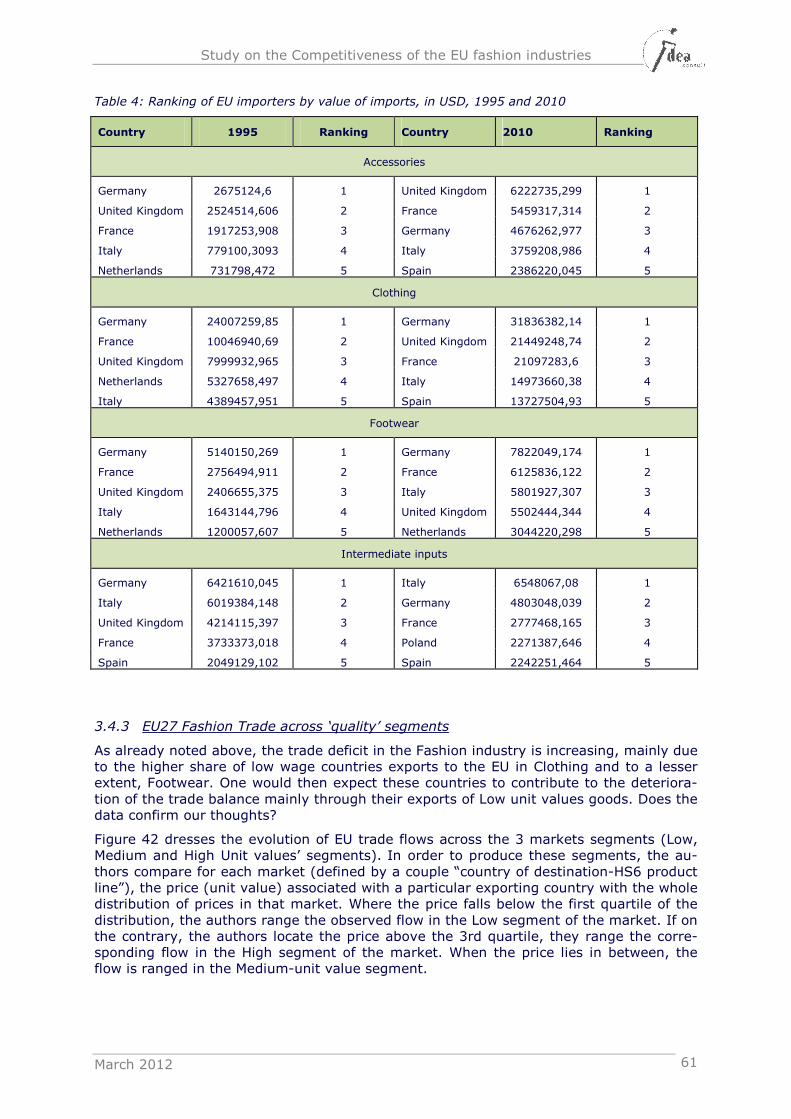
Study on the Competitiveness of the EU fashion industries
March 2012 61
Table 4: Ranking of EU importers by value of imports, in USD, 1995 and 2010
Country 1995 Ranking Country 2010 Ranking
Accessories
Germany 2675124,6 1 United Kingdom 6222735,299 1
United Kingdom 2524514,606 2 France 5459317,314 2
France 1917253,908 3 Germany 4676262,977 3
Italy 779100,3093 4 Italy 3759208,986 4
Netherlands 731798,472 5 Spain 2386220,045 5
Clothing
Germany 24007259,85 1 Germany 31836382,14 1
France 10046940,69 2 United Kingdom 21449248,74 2
United Kingdom 7999932,965 3 France 21097283,6 3
Netherlands 5327658,497 4 Italy 14973660,38 4
Italy 4389457,951 5 Spain 13727504,93 5
Footwear
Germany 5140150,269 1 Germany 7822049,174 1
France 2756494,911 2 France 6125836,122 2
United Kingdom 2406655,375 3 Italy 5801927,307 3
Italy 1643144,796 4 United Kingdom 5502444,344 4
Netherlands 1200057,607 5 Netherlands 3044220,298 5
Intermediate inputs
Germany 6421610,045 1 Italy 6548067,08 1
Italy 6019384,148 2 Germany 4803048,039 2
United Kingdom 4214115,397 3 France 2777468,165 3
France 3733373,018 4 Poland 2271387,646 4
Spain 2049129,102 5 Spain 2242251,464 5
3.4.3 EU27 Fashion Trade across ‘quality’ segments
As already noted above, the trade deficit in the Fashion industry is increasing, mainly due to the higher share of low wage countries exports to the EU in Clothing and to a lesser extent, Footwear. One would then expect these countries to contribute to the deteriora-tion of the trade balance mainly through their exports of Low unit values goods. Does the data confirm our thoughts?
Figure 42 dresses the evolution of EU trade flows across the 3 markets segments (Low, Medium and High Unit values’ segments). In order to produce these segments, the au-thors compare for each market (defined by a couple “country of destination-HS6 product line”), the price (unit value) associated with a particular exporting country with the whole distribution of prices in that market. Where the price falls below the first quartile of the distribution, the authors range the observed flow in the Low segment of the market. If on the contrary, the authors locate the price above the 3rd quartile, they range the corre-sponding flow in the High segment of the market. When the price lies in between, the flow is ranged in the Medium-unit value segment.
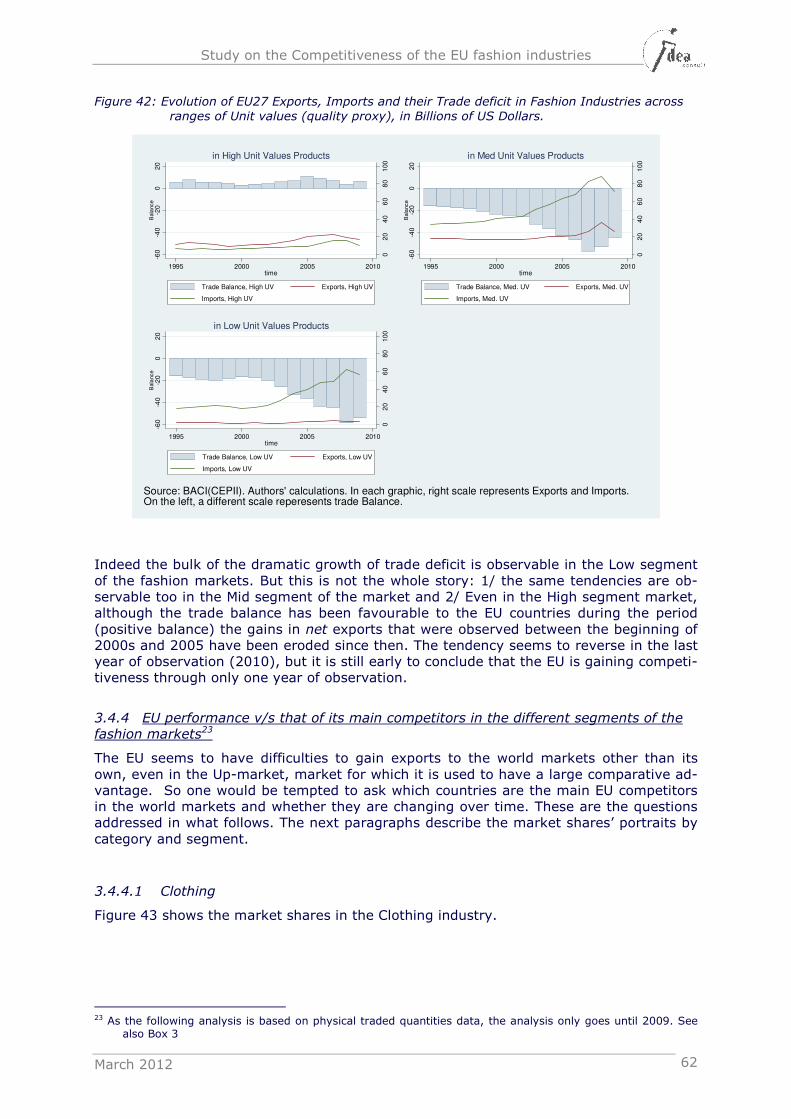
Study on the Competitiveness of the EU fashion industries
March 2012 62
Figure 42: Evolution of EU27 Exports, Imports and their Trade deficit in Fashion Industries across
ranges of Unit values (quality proxy), in Billions of US Dollars.
Indeed the bulk of the dramatic growth of trade deficit is observable in the Low segment of the fashion markets. But this is not the whole story: 1/ the same tendencies are ob-servable too in the Mid segment of the market and 2/ Even in the High segment market, although the trade balance has been favourable to the EU countries during the period (positive balance) the gains in net exports that were observed between the beginning of 2000s and 2005 have been eroded since then. The tendency seems to reverse in the last year of observation (2010), but it is still early to conclude that the EU is gaining competi-tiveness through only one year of observation.
3.4.4 EU performance v/s that of its main competitors in the different segments of the fashion markets23
The EU seems to have difficulties to gain exports to the world markets other than its own, even in the Up-market, market for which it is used to have a large comparative ad-vantage. So one would be tempted to ask which countries are the main EU competitors in the world markets and whether they are changing over time. These are the questions addressed in what follows. The next paragraphs describe the market shares’ portraits by category and segment.
3.4.4.1 Clothing
Figure 43 shows the market shares in the Clothing industry.
23 As the following analysis is based on physical traded quantities data, the analysis only goes until 2009. See
also Box 3
02
04
06
08
01
00
-60
-40
-20
02
0B
ala
nce
1995 2000 2005 2010time
Trade Balance, High UV Exports, High UV
Imports, High UV
in High Unit Values Products
02
04
06
08
01
00
-60
-40
-20
02
0B
ala
nce
1995 2000 2005 2010time
Trade Balance, Med. UV Exports, Med. UV
Imports, Med. UV
in Med Unit Values Products
02
04
06
08
01
00
-60
-40
-20
02
0B
ala
nce
1995 2000 2005 2010time
Trade Balance, Low UV Exports, Low UV
Imports, Low UV
in Low Unit Values Products
Source: BACI(CEPII). Authors' calculations. In each graphic, right scale represents Exports and Imports.On the left, a different scale reperesents trade Balance.
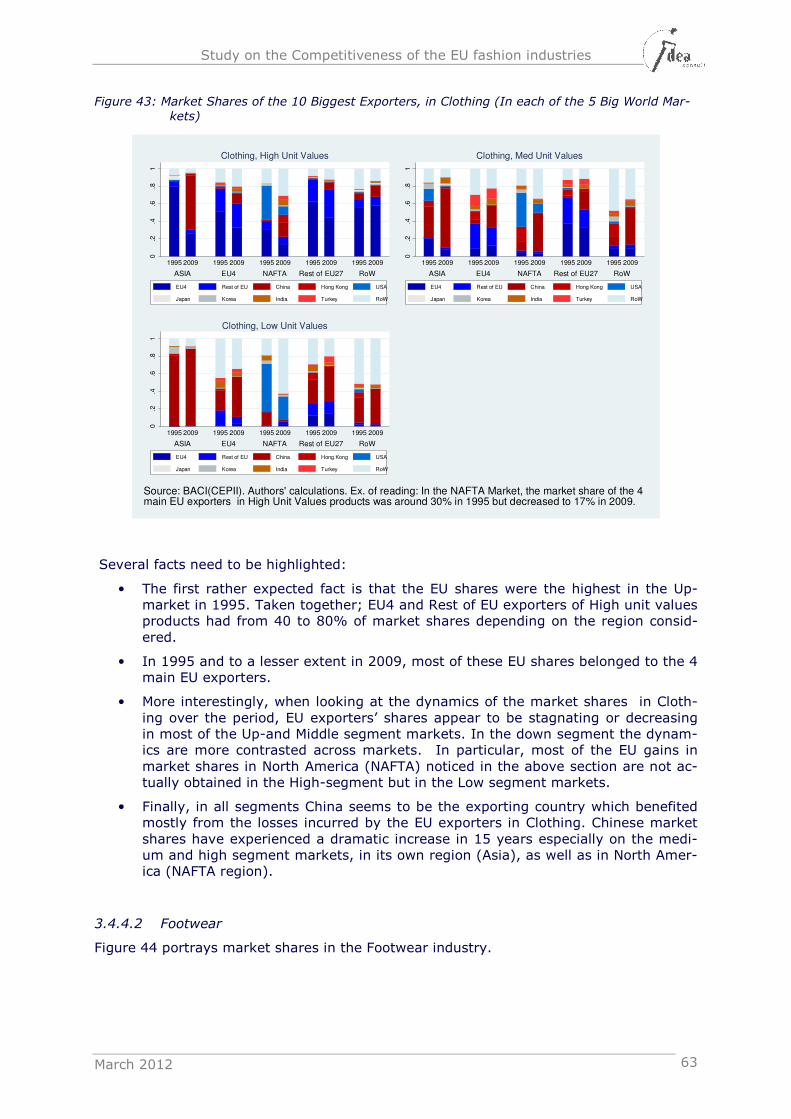
Study on the Competitiveness of the EU fashion industries
March 2012 63
Figure 43: Market Shares of the 10 Biggest Exporters, in Clothing (In each of the 5 Big World Mar-
kets)
Several facts need to be highlighted:
• The first rather expected fact is that the EU shares were the highest in the Up-market in 1995. Taken together; EU4 and Rest of EU exporters of High unit values products had from 40 to 80% of market shares depending on the region consid-ered.
• In 1995 and to a lesser extent in 2009, most of these EU shares belonged to the 4 main EU exporters.
• More interestingly, when looking at the dynamics of the market shares in Cloth-ing over the period, EU exporters’ shares appear to be stagnating or decreasing in most of the Up-and Middle segment markets. In the down segment the dynam-ics are more contrasted across markets. In particular, most of the EU gains in market shares in North America (NAFTA) noticed in the above section are not ac-tually obtained in the High-segment but in the Low segment markets.
• Finally, in all segments China seems to be the exporting country which benefited mostly from the losses incurred by the EU exporters in Clothing. Chinese market shares have experienced a dramatic increase in 15 years especially on the medi-um and high segment markets, in its own region (Asia), as well as in North Amer-ica (NAFTA region).
3.4.4.2 Footwear
Figure 44 portrays market shares in the Footwear industry.
0.2
.4.6
.81
ASIA EU4 NAFTA Rest of EU27 RoW
1995 2009 1995 2009 1995 2009 1995 2009 1995 2009
Clothing, High Unit Values
EU4 Rest of EU China Hong Kong USA
Japan Korea India Turkey RoW
0.2
.4.6
.81
ASIA EU4 NAFTA Rest of EU27 RoW
1995 2009 1995 2009 1995 2009 1995 2009 1995 2009
Clothing, Med Unit Values
EU4 Rest of EU China Hong Kong USA
Japan Korea India Turkey RoW
0.2
.4.6
.81
ASIA EU4 NAFTA Rest of EU27 RoW
1995 2009 1995 2009 1995 2009 1995 2009 1995 2009
Clothing, Low Unit Values
EU4 Rest of EU China Hong Kong USA
Japan Korea India Turkey RoW
Source: BACI(CEPII). Authors' calculations. Ex. of reading: In the NAFTA Market, the market share of the 4 main EU exporters in High Unit Values products was around 30% in 1995 but decreased to 17% in 2009.
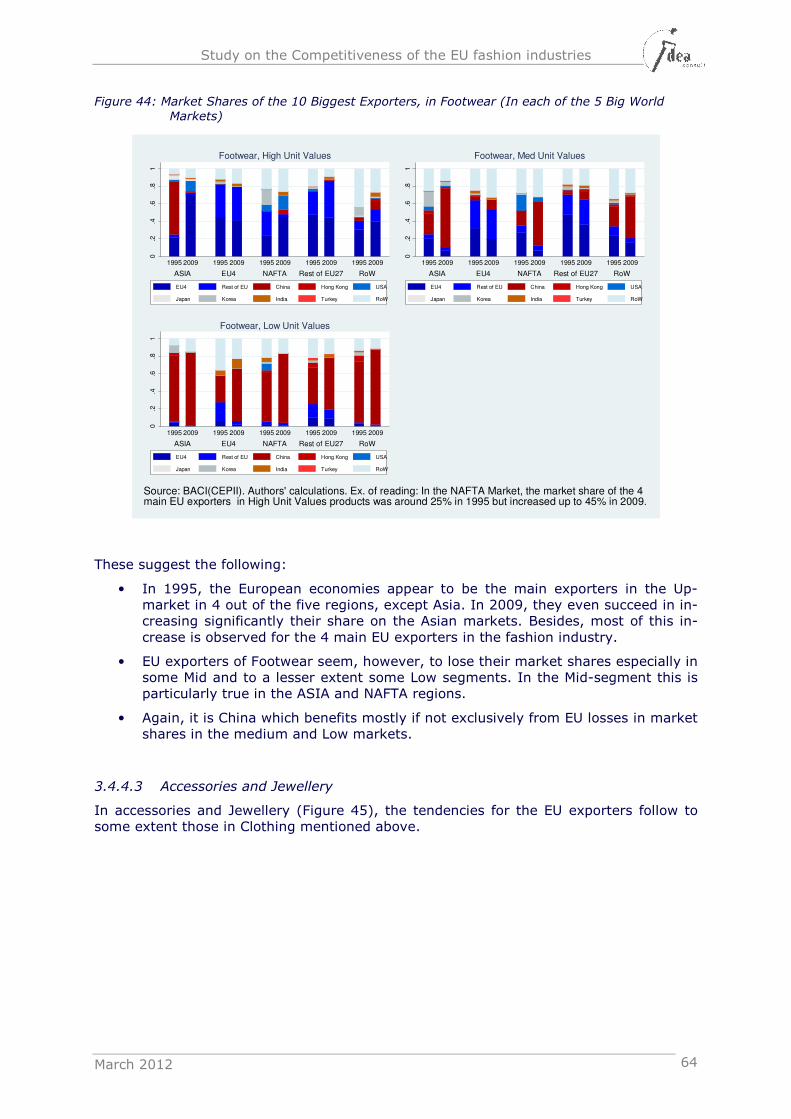
Study on the Competitiveness of the EU fashion industries
March 2012 64
Figure 44: Market Shares of the 10 Biggest Exporters, in Footwear (In each of the 5 Big World
Markets)
These suggest the following:
• In 1995, the European economies appear to be the main exporters in the Up-market in 4 out of the five regions, except Asia. In 2009, they even succeed in in-creasing significantly their share on the Asian markets. Besides, most of this in-crease is observed for the 4 main EU exporters in the fashion industry.
• EU exporters of Footwear seem, however, to lose their market shares especially in some Mid and to a lesser extent some Low segments. In the Mid-segment this is particularly true in the ASIA and NAFTA regions.
• Again, it is China which benefits mostly if not exclusively from EU losses in market shares in the medium and Low markets.
3.4.4.3 Accessories and Jewellery
In accessories and Jewellery (Figure 45), the tendencies for the EU exporters follow to some extent those in Clothing mentioned above.
0.2
.4.6
.81
ASIA EU4 NAFTA Rest of EU27 RoW
1995 2009 1995 2009 1995 2009 1995 2009 1995 2009
Footwear, High Unit Values
EU4 Rest of EU China Hong Kong USA
Japan Korea India Turkey RoW
0.2
.4.6
.81
ASIA EU4 NAFTA Rest of EU27 RoW
1995 2009 1995 2009 1995 2009 1995 2009 1995 2009
Footwear, Med Unit Values
EU4 Rest of EU China Hong Kong USA
Japan Korea India Turkey RoW
0.2
.4.6
.81
ASIA EU4 NAFTA Rest of EU27 RoW
1995 2009 1995 2009 1995 2009 1995 2009 1995 2009
Footwear, Low Unit Values
EU4 Rest of EU China Hong Kong USA
Japan Korea India Turkey RoW
Source: BACI(CEPII). Authors' calculations. Ex. of reading: In the NAFTA Market, the market share of the 4 main EU exporters in High Unit Values products was around 25% in 1995 but increased up to 45% in 2009.
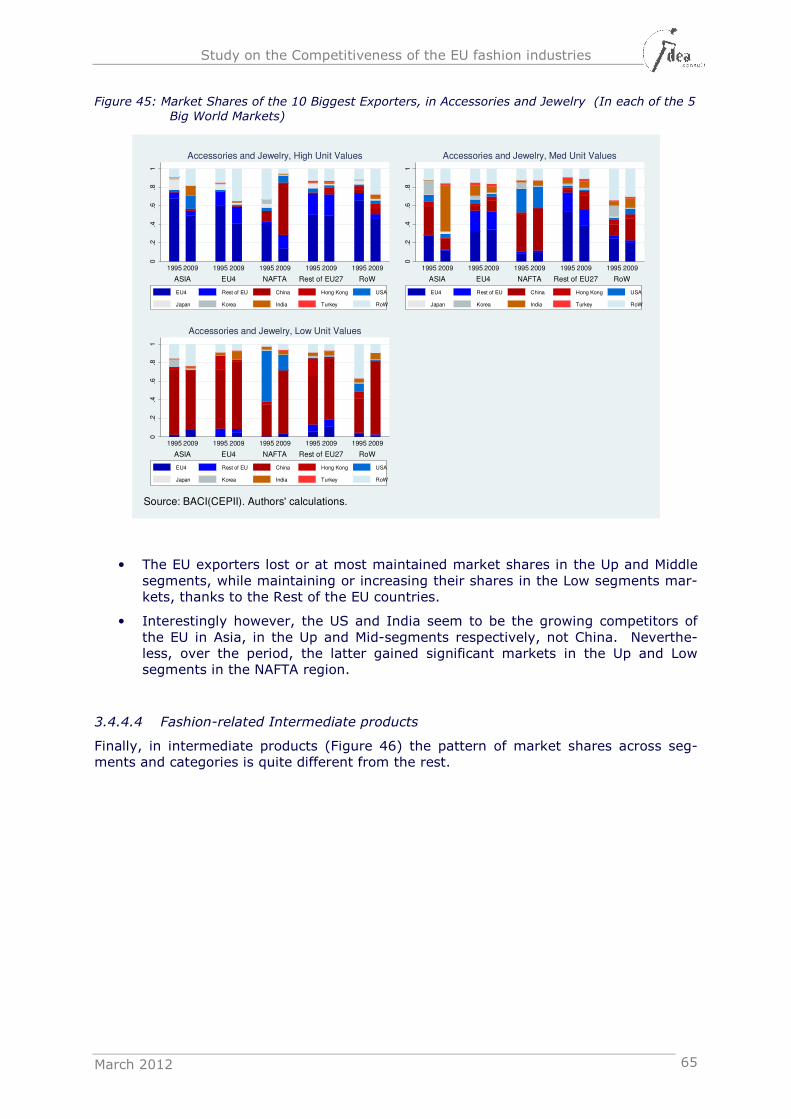
Study on the Competitiveness of the EU fashion industries
March 2012 65
Figure 45: Market Shares of the 10 Biggest Exporters, in Accessories and Jewelry (In each of the 5
Big World Markets)
• The EU exporters lost or at most maintained market shares in the Up and Middle segments, while maintaining or increasing their shares in the Low segments mar-kets, thanks to the Rest of the EU countries.
• Interestingly however, the US and India seem to be the growing competitors of the EU in Asia, in the Up and Mid-segments respectively, not China. Neverthe-less, over the period, the latter gained significant markets in the Up and Low segments in the NAFTA region.
3.4.4.4 Fashion-related Intermediate products
Finally, in intermediate products (Figure 46) the pattern of market shares across seg-ments and categories is quite different from the rest.
0.2
.4.6
.81
ASIA EU4 NAFTA Rest of EU27 RoW
1995 2009 1995 2009 1995 2009 1995 2009 1995 2009
Accessories and Jewelry, High Unit Values
EU4 Rest of EU China Hong Kong USA
Japan Korea India Turkey RoW
0.2
.4.6
.81
ASIA EU4 NAFTA Rest of EU27 RoW
1995 2009 1995 2009 1995 2009 1995 2009 1995 2009
Accessories and Jewelry, Med Unit Values
EU4 Rest of EU China Hong Kong USA
Japan Korea India Turkey RoW
0.2
.4.6
.81
ASIA EU4 NAFTA Rest of EU27 RoW
1995 2009 1995 2009 1995 2009 1995 2009 1995 2009
Accessories and Jewelry, Low Unit Values
EU4 Rest of EU China Hong Kong USA
Japan Korea India Turkey RoW
Source: BACI(CEPII). Authors' calculations.
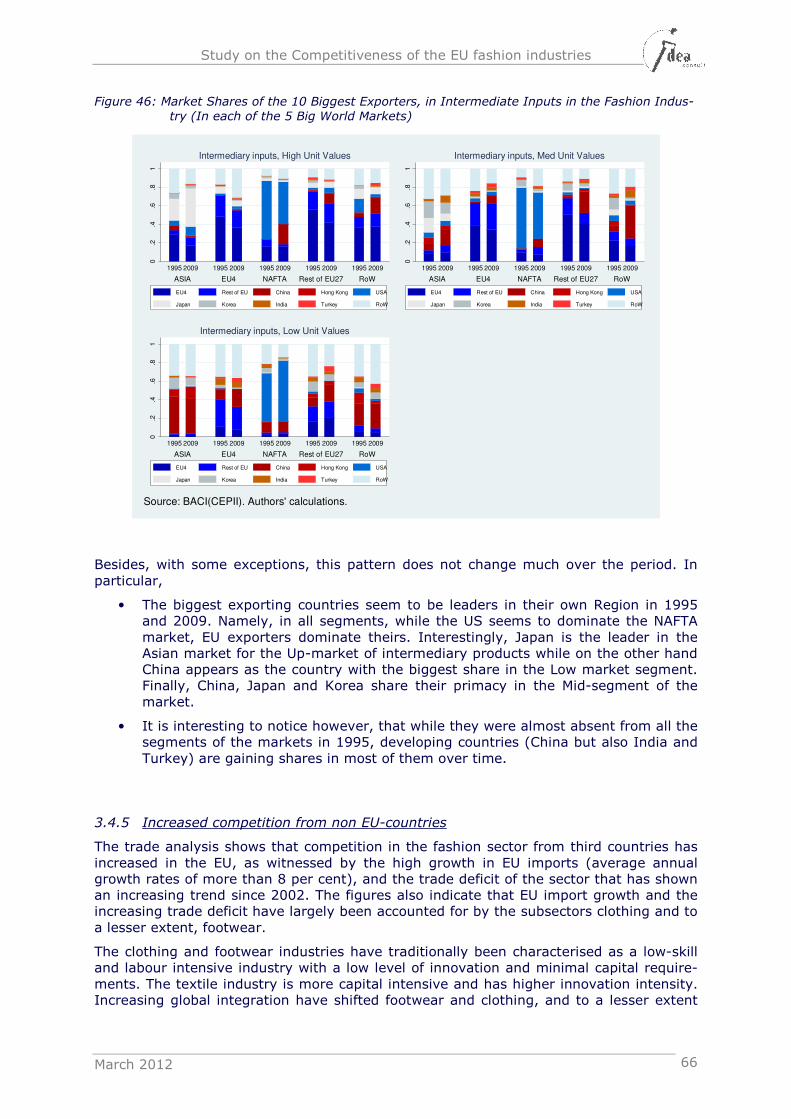
Study on the Competitiveness of the EU fashion industries
March 2012 66
Figure 46: Market Shares of the 10 Biggest Exporters, in Intermediate Inputs in the Fashion Indus-
try (In each of the 5 Big World Markets)
Besides, with some exceptions, this pattern does not change much over the period. In particular,
• The biggest exporting countries seem to be leaders in their own Region in 1995 and 2009. Namely, in all segments, while the US seems to dominate the NAFTA market, EU exporters dominate theirs. Interestingly, Japan is the leader in the Asian market for the Up-market of intermediary products while on the other hand China appears as the country with the biggest share in the Low market segment. Finally, China, Japan and Korea share their primacy in the Mid-segment of the market.
• It is interesting to notice however, that while they were almost absent from all the segments of the markets in 1995, developing countries (China but also India and Turkey) are gaining shares in most of them over time.
3.4.5 Increased competition from non EU-countries
The trade analysis shows that competition in the fashion sector from third countries has increased in the EU, as witnessed by the high growth in EU imports (average annual growth rates of more than 8 per cent), and the trade deficit of the sector that has shown an increasing trend since 2002. The figures also indicate that EU import growth and the increasing trade deficit have largely been accounted for by the subsectors clothing and to a lesser extent, footwear.
The clothing and footwear industries have traditionally been characterised as a low-skill and labour intensive industry with a low level of innovation and minimal capital require-ments. The textile industry is more capital intensive and has higher innovation intensity. Increasing global integration have shifted footwear and clothing, and to a lesser extent
0.2
.4.6
.81
ASIA EU4 NAFTA Rest of EU27 RoW
1995 2009 1995 2009 1995 2009 1995 2009 1995 2009
Intermediary inputs, High Unit Values
EU4 Rest of EU China Hong Kong USA
Japan Korea India Turkey RoW
0.2
.4.6
.81
ASIA EU4 NAFTA Rest of EU27 RoW
1995 2009 1995 2009 1995 2009 1995 2009 1995 2009
Intermediary inputs, Med Unit Values
EU4 Rest of EU China Hong Kong USA
Japan Korea India Turkey RoW
0.2
.4.6
.81
ASIA EU4 NAFTA Rest of EU27 RoW
1995 2009 1995 2009 1995 2009 1995 2009 1995 2009
Intermediary inputs, Low Unit Values
EU4 Rest of EU China Hong Kong USA
Japan Korea India Turkey RoW
Source: BACI(CEPII). Authors' calculations.
Study on the Competitiveness of the EU fashion industries
March 2012 67
textile production into countries with low cost labour24. Consequently both the number of companies and employment within the fashion industry have declined in Europe25 (see also section 3.2).
This shift of production by EU fashion companies to countries outside the EU has been caused by a decrease in transport and communication costs and been further fuelled by the EU’s elimination of subsidies, and a decrease in protection or any form of privileged status for the fashion industries. Protection has been reduced through agreements in the World Trade organisation (WTO) and through various bilateral and regional Free trade Agreements (FTA). Especially the textiles and clothing segments of the fashion industry experienced significant changes in market liberalisation, through the elimination of the Multi-Fibre Arrangement (MFA) and the WTO Agreement on Textiles and Clothing (ATC)26 in 1995. According to the agreement, MFA import quotas on textiles and clothing had to be gradually eliminated by 2005. The fact that China has become a member of the WTO in 2001 was also important for fashion trade.
Several studies have been carried out analysing the ex ante impact of trade liberalisation for both the EU and the rest of the world, most of them focusing on the elimination of the textile and clothing quotas of the MFA27 It has been estimated that the elimination of trade quotas would result in an increase in clothing exports of 70-190 per cent. The wel-fare gains derived from this increase in exports are likely to be mainly realised by import-ing countries as a consequence of lower prices; the effects on the exporting countries are more ambiguous28. For the EU one study estimated that the removal of trade quotas would increase EU imports by 20 percent.29 Asian countries, and especially China, would be the largest gainers in terms of shares of EU imports.
The predictions with respect to EU imports are largely confirmed by the figures of the trade analysis in section 3.4.2, which shows that China is the main source of fashion im-ports and also other developing countries have increased their share. This increase in EU imports from developing countries is concentrated in clothing and to a lesser extent footwear.
Liberalisation of clothing and textile trade has thus increased competition between the EU industry and foreign suppliers but also between the foreign suppliers themselves.30 For the EU this means increasing competition but also a change in the structure of its suppli-ers.
There are several publications (although mostly focusing on clothing and to a lesser ex-tent textiles), which report on the strong position of China in EU fashion imports, and to a lesser extent Turkey, India, Bangladesh, Vietnam, Pakistan, Indonesia and Tunisia (e.g. Gereffi and Frederick (2010), Gereffi (2010)). Although regional suppliers from North Africa and Eastern Europe are still important for the EU fashion industries, their market share has decreased because of the increased competition of low-wage countries. It is important to note that all leading fashion suppliers into the EU, with the exception of China and Hong Kong, receive either duty-free or preferential tariff treatment. Tunisia and Morocco are part of the Euro-Mediterranean Partnership, and Romania, Bulgaria, Poland, Hungary, and Turkey are part of the EU-27 or EU Customs Union. To varying de-grees, Indonesia, Thailand, Pakistan, Vietnam, India, Sri Lanka, and Bangladesh receive benefits from the Generalized System of Preferences (GSP) program.31
24 Taplin and Winterton ( 2004); Taplin (2006) 25 Taplin and Winterton (2004); Dunford; (2004) 26 Taplin and Winterton (2004); Keenan et al.,(2004); Taplin (2006); Stengg (2001) 27 Keenan et al. (2004); Stengg (2001); Audet (2007); Baleix (2005); Adhikari and Yamamoto (2007); Nordas
(2004) 28 Nordas (2004) 29 Baleix (2005) 30 Stengg (2001) 31 Gereffi and Frederick (2010)
Study on the Competitiveness of the EU fashion industries
March 2012 68
Box 4: Outward Processing Trade
An interesting element of EU fashion imports that is worth mentioning is Outward-processing trade (OPT). This is a common feature within the European clothing sectors. OPT refers to a situation where a European company exports fabrics to be further processed in a third country and then re-imports the finished garments back to Europe. Outward-processing trade is attractive for the Eu-ropean clothing industry as it reduces labour costs, which account for the majority of costs within the clothing industry. However, OPT is considered to accelerate the shift of apparel production to low-wage countries. This is discouraged by trade policies: when EU and non-EU fabrics are used under OPT, a 14 per cent tariff is levied on their re-imports, which offsets the advantage of lower production costs. Hong Kong SAR32 and China play a central role as OPT exporters to the Europe-an market but also neighbouring areas such as North Africa, Turkey, Eastern and Central Europe as well as former members of the Soviet Union are important.
Related to the surge of imports from developing countries that impacts the EU fashion industry, the EU has used trade defence instruments to protect the sector from unfair practices. In 2011, for example, the EC started an expiry review of the anti-dumping measures being imposed on Chamois leather from China since 2006.33 In 2006 the EC decided to impose anti-dumping duties on footwear products with uppers of leather from China and Vietnam. In 2011, these anti-dumping measures had expired.
3.4.6 Consolidation of the global fashion industry34
An analysis of trends in the globalisation of the fashion industry over the past two dec-ades has revealed that there has been a longer term process of global consolidation, whereby a handful of leading suppliers (countries and firms) has strengthened their posi-tions in the value chain, which has complicated the adjustment strategy of smaller or more vulnerable players.
On the country side, China has been the big winner as shown in the trade analysis. It has increased its dominant position in all of the major industrial economies, including the European Union. It has also diversified its export reach by gaining ground in many of the world’s top emerging economies as well, such as Russia for finished goods, and India, Brazil and Turkey for intermediate goods, such as textiles or leather. Other developing economies have also gained after elimination of the MFA quota system, such as Bangla-desh, India, Vietnam and Indonesia.
On the firm side, the quota phase-out and economic recession have accelerated the on-going shift to a rationalization of global supply chains. Major retailers, brand marketers, and brand manufacturers have been stressing their desire to work with fewer, larger, and more capable suppliers, strategically located around the world.35 The ability to offer “full-package-services” which include parts from production to tagging and packaging has be-come more important.36
As a result, sourcing strategies of lead companies have changed. On the demand side, retailers focus on marketing and branding and need suppliers (or agents) capable of bundling and selling the entire range of manufacturing and logistics activities. On the supply side, the need for coordination and networking has become more important due to the breadth and specialization of apparel products and the increasing number of coun-tries with advanced production capabilities. As a result of these needs, two groups emerged to provide the key links between producers and retailers: East Asian transna-tional manufacturers with established buyer relationships who set up and managed global production networks, and traders (import-export companies) and agents who emerged as intermediaries between established buyers and sellers in the apparel value chain. To re-
32 SAR= Self Administrated Region 33 DG Trade, http://trade.ec.europa.eu/tdi/ 34 It should be noted that most of the sources specifically discuss the clothing segment, but it seems that most
of the developments for this segment are also valid for other segments. 35 Gereffi (2010) 36 Keenan et al. (2004)
Study on the Competitiveness of the EU fashion industries
March 2012 69
duce cost and mitigate risk, many buyers established overseas sourcing offices in their main producing countries. Over the years retailers shifted more responsibilities to these overseas sourcing offices, to benefit from lower cost and the skills of the staff based there. Many are also moving product development and design offices closer to the manu-facturing process. Direct sourcing requires manufacturers to provide faster reaction times and better factory understanding of a retailer’s particular needs. 37
The removal of trade quotas has revealed the vulnerability of global business models based on a fragmented value chain.38 Countries that produce both textiles and clothing have become more competitive as they can save on transportation costs of inputs, and on time needed to access inputs. In fact, low production costs may not be as important as quick turnaround time is for achieving competitive advantage. In 2005, China, India, Turkey and the US who gained most in the EU fashion market all have an integrated tex-tile and clothing industry and thus the ability to meet short production and delivery commitments. It has also been argued that in the future access to high quality textiles or leather will be the single most important competitive factor in the post-quota period for exporting countries.39
3.4.7 Resulting adjustments in the EU fashion sector
Although the global shift in the fashion industry has reduced the number of companies and people active in manufacturing in the EU (see section 3.2), European fashion chains and consumers benefit from being able to source their inputs from the cheapest/best suppliers. It is also important to note that as a result of the strong bargaining power of retailer groups vis-à-vis (often small) producers in low-wage countries located relatively close to European markets, shifting manufacturing outside Europe has not only reduced manufacturing costs but also cut down lead times and increased flexibility within the supply chain. These lower costs contribute to the competitiveness of the European supply chains.
Nevertheless, the manufacturing part of the European fashion industry has been forced to increase its efficiency and focus on market segments which require higher skills levels to respond to the increased competition. Thus, the sector has become more focused on fashion segments which have higher added value and are not easily transferable (e.g. luxury brands which require specific designing)40. However even within the high quality segments production has been rationalised in terms of cost effectiveness because as shown in section 3.4 also in the high quality segments (as measured by the unit values) competition is fierce.
A higher level of efficiency has been gained through organisational restructuring which has included adoption of just-in-time production, quick response techniques and other computer controlled methods as well as systematic use of teamwork and multi-skilling41. Although these measures have increased labour productivity in Europe, the benefits from these increases are low given the high costs of labour42. Outsourcing and improvements in distribution channels have also increased the efficiency of the sector.43
Furthermore, increased efficiency has been gained in the EU through mergers and acqui-sitions which have led to a consolidation of the industry44. The concentration of the in-dustry is strongly related to the amount of international outsourcing45 and also increased the leverage of retailers over manufacturers in the fashion industry.46 Large retailers can demand lower costs, smaller amounts of varied goods and more sophisticated product
37 Gereffi and Frederick (2010) 38 Audet (2007) 39 Audet (2007) 40 Taplin and Winterton (2004); Keenan et al. (2004); Stengg (2001) 41 Taplin and Winterton (2004); Taplin (2006) 42 Stengg (2001) 43 Stengg (2001) 44 Taplin and Winterton (2004); Dunford (2001) 45 Dunford (2004) 46 Keenan et al. (2004)
Study on the Competitiveness of the EU fashion industries
March 2012 70
replenishment from their manufacturers and suppliers. Together with stronger price competition, shortened life cycle dimensions and difficulties with acquiring new technolo-gies these demands have caused many value added jobs to be offshored, production to be mechanized where possible and new innovative production technologies to be applied in manufacturing and supply47.
3.4.8 Conclusion
The analysis of the international trade position of the EU fashion industries has highlight-ed some important trends:
1- The EU deficit in the fashion industries has substantially increased in the last 15 years. The Clothing and Footwear products were those which contributed most to this deficit. Especially the low and middle segments of the fashion market are ac-countable for the bulk of the dramatic growth in the trade deficit.
2- Nevertheless, the EU27 and among them the biggest 4 EU economies seem to better resist to low wage countries competition than the US or Japan, in most of the markets and segments.
3- In some sectors and some regions like North America, EU’s share is increasing in the mid and low segments, thanks to the ‘rest of the EU countries’ shares.
4- The EU primacy in the fashion industry over most of the world markets in the up and mid segments still resists the competition from the rest of the world. Howev-er, it seems to be threatened since mid-2000s by exporters coming from develop-ing countries, mainly China.
The competitiveness of the EU fashion industries in the future will depend on innovation, research, fashion design, creation and quality, and the use of new technologies as well as positive industrial relations.48 In addition, development of know-how and skills through effective education and training is important in order to maintain competitiveness. We refer to part 5 for a more detailed discussion of these drivers of competitiveness.
One way for the European fashion companies to cope with the changing market has been to expand their geographical coverage. As income levels are rising in the emerging and developing countries, the demand for fashion items has increased within these markets49. The shift of fashion brand retailers to new markets has been further fuelled by a spread-ing understanding of brand images due to globalisation50. Push and pull factors influenc-ing the decision of fashion retailers to expand have been identified51. Push factors include among others domestic market maturity, a restrictive regulatory environment, hostile competitive environment, or poor economic conditions, whereas pull factors include an underdeveloped retail structure, favourable exchange rates, niche opportunities, an inno-vative retail culture, large market, good socio-economic conditions.
Indeed markets in Europe and North America are becoming increasingly saturated as a result of competition and especially luxury brand owners are looking for markets which are new and receptive to their brands52. According to the Retail Apparel Index created by T.A. Kearney in 2011, the most appealing emerging markets for apparel retailers includ-ed China, UAE, Kuwait, Russia, Saudi-Arabia, India, Brazil, Turkey, Vietnam and Chile. The top three countries have witnessed a sharp increase in the number of foreign fashion companies, especially within the luxury fashion segment. Locations such as Dubai which has established itself as “shopping capital” are able to attract large numbers of high-end fashion companies and thus have become highly competitive. Within the luxury segment European companies are competing against other European companies but also against
47 Taplin (2006) 48 Keenan et al. (2004) 49 The Economist (2011) 50 Moore et al. (2000) 51 Moore (1996) 52 Moore et al. (2000)
Study on the Competitiveness of the EU fashion industries
March 2012 71
the companies from US and local designers53. For example in China, a high level of com-petition is driving companies in opening stores in 3rd and 4th tier cities as opposed to only the main cities. Companies are also entering new fashion segments such as sports and expanding their online services. For the mid-market retailers the competition does not only stem from the EU and the US but also from places such as Hong-Kong and from lo-cal producers and retailers54.
53 T.A Kearney, (2011); Gail Research, (2009) 54 T.A Kearney, (2011); Gail Research, (2009)
Study on the Competitiveness of the EU fashion industries
March 2012 72
4 BUSINESS MODELS AND DIVERSIFICATION STRATEGIES
As already became clear from the general discussion in part 2 on the fashion industries and value chains, a host of different actors are active in the fashion industries and com-petition is fierce, especially in the price driven segments of the market. Companies in various parts of the value chain have therefore developed distinct business models and strategies, which are constantly being re-shaped and re-adjusted based on competitive pressures, technological developments, changing consumer demand, etc.
Business models depend largely on the markets that companies are looking to target (design oriented, price / design oriented or price oriented) and where their focus or core business activities lie. E.g. haute couture is mainly still entirely (or almost entirely) pro-duced by only a few companies in close proximity to the market; other companies, such as ZARA, have proven highly successful in marketing and retailing relatively cheap fash-ionable apparel, footwear and accessories, primarily made in the EU and neighbouring countries55.
EU fashion companies have adjusted activities and functions in response to changes in the competitive conditions for the industry and production companies have increasingly become knowledge companies. Core activities are increasingly related to design, market-ing and sales. Production companies have integrated such activities into their business models while outsourcing traditional production processes. Retailers have also increasing-ly focused on design, marketing and branding as core activities, while tightening their control over other parts further upstream in the value chain.
The fashion industry can broadly be divided into six different strategic clusters based on the company/brand characteristics and their business strategies. These clusters include:
1. Luxury Fashion Brands
2. Premium Fashion Brands
3. Vertically integrated Retailers
4. Department Stores and Mass Retailers with Private Labels
5. Independent actors (e.g. designers, manufacturers, retailers)
6. Online retailing
The following sections will take a deeper look into each of these clusters based on the available literature. After describing the typical actors active in each cluster and the type of products put on the market, the focus will turn to identifying the business models most commonly used within these clusters. In the context we will look at the design process, sourcing process, manufacturing process and distribution and retailing process56.
A number of remarks are important to keep in mind when reading this chapter. First of all, the fashion industry could also be divided differently; the six strategic clusters that are used in this study are only one way of categorisation57. Secondly, the clusters of business models are partly overlapping while at the same time there is variety within each cluster. This chapter describes the average actor in each cluster. Finally, it is im-portant to note that the amount of information included to the description reflects the amount of information available rather than the importance of this cluster for the overall fashion industry. E.g. the category of independent actors is much more important in
55 In 2009, about 76% of all products sold by ZARA were made in Europe. 56 The extent to which each process is described is limited by the availability of literature as well as limited by
the scope of the study. E.g going into detail on the mode of operation of different actors within one busi-ness model goes beyond the scope of this study.
57 See for example Fundacion Opti (2011) Horizonte 2015-2020: los retos futuros del sector calzado, which distinguishes shoe retailing by the presence in global market and extent of innovation.
Study on the Competitiveness of the EU fashion industries
March 2012 73
terms of number of companies and employees than the luxury brand segment in the EU, yet on the latter there is much more information to find.
4.1 Luxury Fashion Brands (High-end)
Luxury brands can be defined as brands with heightened status that affords an oppor-tunity for their owners to charge premium prices. They are considered desirable beyond their functionality and they provide their users with perceived status. The appeal and desirability of luxury brands is at least partly caused by their low availability and their association with certain social segments58. Luxury products are often associated with characteristics such as excellent quality, high price, scarcity and uniqueness, aesthetics and polysensuality59. These characteristics include recognizable symbols, iconic product designs, personality of the brands’ creators, locations, brand name and brand history60. In addition, luxury products are associated with top quality materials that translate the brand image (e.g. leather for Hermes or Gucci). Furthermore, luxury fashion brands can be distinguished by their global recognition, critical mass, high product quality and inno-vation and powerful advertising61.
Several critical success factors have been identified for luxury products62. These factors include emotional appeal, premium quality, craftsmanship, exclusivity, style and design, country of origin and uniqueness. A luxury product does not need to possess all these qualities but usually has several of them. For the luxury fashion products especially quali-ty, style and design, country of origin, craftsmanship and emotional appeal along with brand reputation and creation of life style are important63. Although increasing competi-tion is forcing luxury brand producers to take the efficiency of their operations and lead times into account, success in more mainstream segments factors, such as costs and efficiency, are rarely their key concerns. Understanding the critical success factors for luxury fashion products is crucial for luxury brand companies in order for them to create supply chains which are able to match product characteristics with customers’ require-ments. In addition to providing products which match with the critical success factors, supply chains must also be adaptable to the luxury fashion industry’s highly volatile and unpredictable selling volumes and product variability.
A specific feature within the luxury fashion segment is to have an umbrella company which owns a large number of different luxury brands. A good example of this type of company include Louis Vuitton Moet Hennessy (LVMH) which owns brands such as Louis Vuitton, Bvlgari, Fendi, Marc Jacobs, Givenchy, Dom Perignon and many others. The company also covers a variety of different luxury product categories such as fashion and leather goods, wines and spirits, perfumes and jewellery as well as lifestyle publica-tions64. Other well-known umbrella companies in the luxury fashion segment include PPR and Richemont.
Design process: Design is a core competency for luxury brands and is therefore often kept in-house65. Although some luxury products are considered timeless and classic, most product collections of luxury brands are constantly changing and innovation is cru-cial for the brands’ success66. Some luxury brands design haute couture products which refer to products that are exclusive and custom-fitted whereas others produce only ready-to-wear product lines which refer to products which can be produced in larger patches and are sold in finished condition. Haute couture business has however declined
58 Moore and Britwistle (2005) 59 Dubois et al. (2001) 60 Bruce and Kratz (2007) 61 Bruce and Kratz (2007) 62 Caniato et al.(2011) 63 Caniato et al. (2011); Brun and Castelli (2008) 64 LVMH (website) 65 Brun and Castelli (2008) 66 Cillo and Verona (2008)
Study on the Competitiveness of the EU fashion industries
March 2012 74
as the ready-to-wear lines have increased their popularity67. Luxury brands can be divid-ed into two categories based on their search for new designs. Brands which apply de-signer-driven search have a design process where the creation and development of new products always start from the designer. Designers have strong internal control over any changes that take place within the collection. On the other hand brands which apply market-driven search have a design processes which is triggered by continuous market sensing and understanding as well as market intelligence68. Another distinct design strat-egy for luxury brands is to design different categories of products based on their accessi-bility for consumers. Providing products which are perceived relatively inaccessible for consumers (because of high price, low production volume, limited distribution) keeps up the exclusive reputation of the brand. On the other hand, adding products which are rela-tively accessible, and often slightly cheaper, enables luxury brands to widen their con-sumer base69.
In order to further widen the consumer base luxury brands also design products which are specifically targeted for markets outside the traditional western markets. As an ex-ample Burberry has product lines which are designed only for the Japanese market70. Finally, many luxury fashion brands have diversified their product portfolio into covering products outside the traditional fashion product categories. Examples of these products include perfumes, wines and home decorations. In some cases the production of these items have been dedicated to different organizational entities under the same holding company71. Some luxury brands have been accessing external design skills and compe-tencies by hiring notable designers. Although well-known designers contribute to the de-sign of the products they also shape the brand image and are therefore closely connected to marketing and brand development strategies72. New designs are produced in time to meet the main seasonal events.
Sourcing process: Textiles industries, and to certain extent leather and fur industries are by far the most important suppliers of materials for luxury fashion products. The demand for premium quality is the underlying determinant of the sourcing strategies of most lux-ury fashion brands. In order to ensure high quality of final products, all materials and components must comply with high requirements. Thus fabrics and other inputs are sourced from suppliers who are known to be reliable73.
In general the sourcing strategy of luxury brands differs between standard and custom-ized components or materials. For customized pieces, small batches and strategic high quality materials brand companies collaborate intensively with suppliers and try to estab-lish common objectives and strategies. This includes involving important suppliers into new product development74. In addition to quality, the location of the suppliers may also be important in order to provide consumers with materials that are perceived authentic and comply with their expectations of the country of origin. For example, in order to guarantee authentic and superior quality, cashmere wool is often imported from India, leather from countries such as Italy, France or Spain and crocodile skin from countries such as Australia, United States or various African and Latin American countries. Thus, some materials are sourced globally but not in order to cut costs. Some luxury brands such as Louis Vuitton (under LVMH) have made significant investments in their suppliers in order to ensure access to top quality materials, as well as to gain knowledge and skills with regards to these materials75. Suppliers of less critical and standardized materials (such as small metal components) are usually chosen based on their cost/service level
67 Djelic and Ainamo (1999) 68 Cillo and Verona (2008) 69 Bruce and Kratz (2007); Moore and Britwistle, (2004); the Economist (2011) 70 Moore and Britwistle (2004) 71 Djelic and Ainamo (1999) 72 Bruce and Kratz (2007) 73 Caniato et al. (2011); Brun and Castelli (2008) 74 Luzzini and Ronchi (2009) 75 In 2011 LVMH purchased 51% of Singapore-based crocodile-leather tannery Heng Long International. The
value of the purchase was 124.2 million USD. Source: Telegraph (2011c) (website); Bloomberg Busi-nessweek (2011) (website)
Study on the Competitiveness of the EU fashion industries
March 2012 75
ratio. As luxury fashion brands are often large and well-known companies they have sig-nificant bargaining power over their suppliers which enables them to have a high level of control and to maintain long-term relationships with a large number of dedicated suppli-ers76. Fashion brands have also adopted internal quality control systems in order to en-sure high quality and performance as well as good relationships with their suppliers77.
Manufacturing process: As already mentioned the demand for individual luxury fashion products is highly unpredictable and subject to fashion trends which are driven by sea-sonal events. In addition, many fashion items have a very short maturity period. This implies that the supply chain must be efficient in producing relatively small volumes of products but also flexible in order to follow the demand patterns. Given the high unit costs of luxury fashion items, it is necessary for companies to avoid stocking their prod-ucts due to the risk of obsolescence. To reduce delivery times but also to respond to con-sumer preferences and to strengthen the brand image, manufacturing activities are often located near the main markets. Nevertheless, outsourcing is a common practice within the luxury fashion cluster. The motivation for outsourcing is to access special competen-cies and skills, rather than saving costs78. In order to maintain the high quality of the products and to keep the manufacturing process flexible, many luxury fashion brands maintain a high level of control over their suppliers and subcontractors and rely on strong coordination among various partners79. Suppliers are often small and fully dedi-cated to the brand80.
Distribution process: It is important for luxury fashion brands with a high symbolic value to align their distribution channels with their critical success factors such as emotional appeal, premium quality, exclusivity and style and design. Therefore luxury fashion brands pay special attention not only to the display, availability and variability of their products in their outlets but also to the shopping experience as a whole which includes personal service, outlet location and interior design81. In order to control for these factors downstream integration towards point of sale is common82. Luxury fashion brands hold tight control over their distribution channels which vary from company owned flagship stores to wholesale and licensee distribution channels83. Overall the recent trend among brand owners has been to open their own stores84. A common alternative for the fully owned store is selective distribution which permits manufacturers of luxury goods to supply only to authorized retailers who meet certain criteria in order to protect the image of the product85.
Another distinct part of the distribution strategy of luxury fashion brands is a different availability of products in different distribution locations. Typically flagship stores have a full product range at all times whereas the product range becomes more limited in regu-lar retail stores, department stores, designer outlets and specialty fashion stores. Many luxury fashion brands have also established online stores. Online stores allow the brand owner not only to increase its sales and profits but also to hold tight control over its products, prices, and presentation86. In addition, online sites play a key role as a com-munication tool between the brand and consumers87. Indeed communication and adver-tisement is crucial for luxury brands in order to create an image that appeals to consum-ers. Many brands spend large amounts on lavish advertisement campaigns which support their brand image. Fashion shows also play an important role in maintaining a certain brand image.
76 Caniato et al. (2011); Luzzini and Ronchi (2009) 77 Luzzini and Ronchi (2009) 78 Caniato et al. (2011) 79 Caniato et al.( 2011); Moore and Birtwistle (2004); Djelic and Ainamo (1999) 80 Brun and Castelli (2008) 81 Caniato et al.( 2011); Atwal and Williams (2009) 82 Brun and Castelli (2008) 83 The New York Times (2010); Buettner et al (2009) 84 Gereffi and Frederick (2010) 85 Clark et al. (2009) 86 The New York Times (2010) 87 Moore and Birtwistle (2004); Bruce and Kratz (2007)
Study on the Competitiveness of the EU fashion industries
March 2012 76
It should be noted that while the development of an online market has had many positive effects for luxury brands, it has also increased the amount of available counterfeit prod-ucts and thus has undermined the reputation and sales of the brands. Brands such as LV and Chanel as well as individual designers have raised successful court cases against sites selling counterfeit products as well as demanded search engines and social network-ing sites such as Google and Facebook to de-index or remove sites selling these products from their search results88. Court cases have also been raised against companies such as eBay89 which has bought keywords resembling those of the brand names in order to di-rect people who use these search names into eBay’s website. The ability of sites as eBay to offer both real brand products as well as counterfeit products with significantly lower prices than in actual stores is considered to be a major challenge for luxury brand’s repu-tation and sales90.
In this field, a new Regulation (Commission Regulation (EU) No 330/2010 of 20 April 2010 on the application of Article 101(3) of the Treaty on the Functioning of the Europe-an Union to categories of vertical agreements and concerted practices) and the related Guidelines on Vertical Restrains has been recently adopted. According to these rules, it is possible for the producers to restrict internet sales, under certain conditions, to distribu-tors operating a physical shop, and they may limit the distribution of their products via ‘third party platforms’ (online distributors) where such platforms are in strict compliance with the suppliers’ selective criteria.
As the number of wealthy people and therefore the demand for luxury fashion items has increased also in the emerging economies, many luxury brands have opened stores in an increasing number of locations91. For example, Louis Vuitton has been expanding its presence in China from first-tier to second-tier cities and has now 39 stores around the country92. Similarly, Gucci has increased its number of stores in mainland China from two in 1997 to 31 in 2010 and is planning on expanding its operations further93. Expansion of markets (both in terms of product variability and geography) requires more production capacity which has led to the use of increasingly sophisticated production equipment, standardization as well as more outsourcing94. There is a risk in this trend, however, as the brand owners run a risk of losing their luxury brand status when their products lose their exclusivity and uniqueness95.
Examples of luxury fashion brands include: Giorgio Armani, Burberry, Chanel, Dior, Er-menegildo Zegna, Gucci, Jil Sander, Jimmy Choo, Loewe, Louis Vuitton, Prada, Salvatore Ferragamo etc.
4.2 Premium Fashion Brands
Premium and luxury are often used as synonyms and therefore drawing a clear distinc-tion between premium fashion brands and luxury fashion brands is not straight forward. As described by Uche Okonkwo, the author of “Luxury Fashion Branding - Trends, Tac-tics, Techniques”, premium brands are brands which aspire to be luxury and prestige
88 Telegraph (2011); BBC (2011) 89 In October 2010, A Paris tribunal ordered Ebay to pay 200,000 euros in damages and 30,000 euros for the
court costs to Louis Vuitton (owned by LVMH) as Ebay was found to be harming Louis Vuitton’s trademark and domain name. Ebay had paid search engines such as Google and Yahoo to use miss-spelled versions of Louis Vuitton’s name as keywords directing users to Ebay. According to the tribunal, by using the miss-spelled brand names, Ebay was promoting its own website by using Louis Vuitton’s brand name and there-fore it was misleading the internet users. Ebay was further demanded to pay 1,000 euros in penalties eve-ry time it uses these keywords.
90 MSNBC (2010); BBC (2011b); Telegraph (2011b); Smartcompany (2012) 91 Nueno and Quelch (1998) 92 Louis Vuitton (website); Chinaapparel (2012); China Fashion Trends (2011) 93 PPR (2010) 94 Djelic and Ainamo (1999) 95 Nueno and Quelch (1998)
Study on the Competitiveness of the EU fashion industries
March 2012 77
brands but whose marketing strategies target (luxury) mass markets. Whereas the tradi-tional luxury products base their attractiveness on exclusivity and prestige, the premium products have distinct characteristics that focus around a more attainable and accessible point-of-entry experience available for everyone96. Premium brands are also referred to as mass-premium brands, mass-luxury brands, near-luxury brands, new luxury and high-end brands.97
In general premium products are perceived superior to normal goods both in terms of their quality and/or price. In many aspects, such as design, communication and adver-tisement, premium brands are imitating luxury brands. However they include less craftsmanship, and are often produced in larger volumes and distributed to a larger con-sumer base which is reflected by their lower prices98. In order to create a sense of luxu-ry, premium brands are placing more emphasis on the packaging and presentation of the product 99.
Many products that can be included into the premium fashion category are produced by brands whose main market category is either luxury or mid-market. For example, luxury brands, such as Armani, are offering less elitist lines. Mass-market brands such as Zara and H&M are adding more expensive and luxurious products which have been designed by high-end designers into their collections, although this only involves short-term ac-tions and no permanent product lines100. Mass-market brands entry to premium fashion category can at least partly be explained by their improved access to quality textiles and leathers which allows them to reach out to higher quality and price segments. The im-proved access is mainly due to the good performance of industries supplying high quality materials101. Both types of brands are trying to benefit by filling in the gap between luxu-ry and mid-market products and thus are competing within the same category. The trad-ing-up of mass-market brands and trading-down of luxury brands have been referred to as “democratization of luxury”102.
One of the recent trends for brands has been to create exclusive product lines for mass retailers who wish to offer unique merchandise. The brands together with retailers design and distribute a product line which is sold exclusively by the retailer rather than through multiple retail outlets103. Luxury brands expansion has also been called masstige which refers to downward expansion through own less exclusive product lines or through col-laboration with mid-market retailers104. Due to over-exposure some luxury brands have entirely fallen out of the luxury category into the premium category.
Similarly to luxury fashion brands, some companies focusing on premium fashion brands own several different brands. An example of this includes Max Mara which owns several different product lines. The lines close to the “Max Mara world” usually have names easily linked with the main brand name (e.g. Marella, Max & Co, Sportmax) whereas lines tar-geted for different markets and/or to increase market penetration without risking to be overexposed, have names which are not related to the main brand name (e.g. Marina Rinaldi, Pennyblack, and Persona)105. Overall Max Mara has approximately 30 different product lines targeted for different consumer ages, styles, bust-waist-hip sizes and cloth-ing types. The products are sold in more than 1000 company owned stores or franchises. This type of micro-segmentation has enabled Max Mara to offer niche lines and brands and to benefit from economies of scale in production, distribution and geographical ex-
96 Danzinger (2005); DeLise (2010) 97 Nguyen ( 2004); Silverstein and Fiske (2003); DeLise (2010); Okonkwo (website): 98 Edberg (2010) 99 DeLise (2010) 100 Heine (2011) 101 COTANCE 102 Heine (2011) 103 Gereffi and Frederick (2010) 104 Ginman et al.(2010) 105 Capello and Ravasi (2009)
Study on the Competitiveness of the EU fashion industries
March 2012 78
pansion. The company further reduces costs by locating its production in Central and Eastern Europe106.
Examples of premium brands are: Armani Jeans, Lacoste, Miu Miu, Paul Smith, Escada, Furla, Hugo Boss, Lancel, Donna Karan, Morris etc.
4.3 Vertically Integrated Fashion Retailers
A vertically integrated company can be defined as a company that owns assets, organiz-es activities or controls activities in successive stages of the value chain107. The degree of vertical integration can vary between full vertical integration through ownership to mar-ket exchanges which are based on mutual agreements108. Within the fashion industry vertical integration is a response to consumers’ new demands of speed, latest fashion trends and affordable prices, which have changed the dynamics of the fashion indus-try109.
During the last decades the fashion market, especially for the middle price range, has become highly competitive in addition to which the frequency of product changes has significantly increased. This trend has sometimes been described as the emergence of fast fashion which is characterised by low predictability, high impulse purchase, shorter life cycle, affordable prices and high volatility of market demand110. Fast fashion is driven by consumer demand and therefore requires quick response strategies which shorten buying cycles and reduce lead times for getting the produced items into stores111. The key element which enables quick responses is application of on-line electronic communi-cation of sales data from retailers to the upstream operations112.
In order to meet the requirements of fast fashion, retailers must meet several distinct requirements. First of all, retailers must be able to make fast connections between the demands of customers and upstream operations, such as design, manufacturing and sourcing. This has been done by designing new information channels which enable better transfer of hard data and information from retailers to designers and producers. Second-ly, improved communication and coordination must be accompanied by short product development cycles, rapid prototyping, small batches and large variety. Thirdly, an inte-grated, fast and responsive supply chain is a requirement for sufficiently frequent deliv-ery of products and materials. In order to reach the growing number of potential custom-ers retailers have set up an increasing number of stores worldwide113. In addition, in or-der to compress the response times retailers have reduced their number of suppliers in order to increase dedication and flexibility. Intermediaries who add relatively little value into the value chain have been eliminated. Quick response tools and techniques must be accompanied by good relationship management skills in order to make the supply chain truly flexible114.
In general, vertically integrated fashion retailers can be characterised by central man-agement, seeking to reduce costs and increase speed in all parts of their value chain. Due to the preference of consumers towards constantly changing trends, the sense of trend of the items is of high importance as is finding the best price/quality ratio. Given these characteristics, vertically integrated fashion retailers are highly global both in terms of their distribution as well as sourcing and manufacturing115. Typically, retailers are
106 Berg (2009) 107 Richardson, (1996) 108 Richardson (1996); Hines (2007) 109 Bhardwaj and Fairhurts ( 2010); Barnes and Lea-Greenwood (2006) 110 Bhardwaj and Fairhurts ( 2010); Hines (2007) 111 Barnes and Lea-Greenwood (2006) 112 Fiorito et al. (1995) 113 Tokatli( 2007) 114 Hines (2007) 115 Tokatli( 2007)
Study on the Competitiveness of the EU fashion industries
March 2012 79
looking for suppliers and distributors who can be considered as partners with shared in-terest in building profitable strategies116.
Given the global strategies of many vertically integrated fashion retailers, this type of retailers (although this is not exclusive for this business model) have received criticism regarding their social and environmental standards. Given the demands from the con-sumers, corporate social responsibility (CSR) campaigns and social advocacy groups re-garding responsibility and transparency, many companies have paid special attention to environmental compliance requirements, green initiatives as well as social issues117. We refer to section 6.4 for a more detailed discussion of this issue.
Design process: A specific characteristic for vertically integrated fashion retailers is their limited investment in design. Instead, their designs are inspired by trends spotted at the fashion shows as a well as by information collected from the mainstream consumers and customers visiting retail stores118. These trends are transformed quickly into products through in-house designers. Designs can also come from suppliers. In order to shorten the turnaround time between design concept and delivery of the product to store, de-signs are computerized and electronically transmitted to manufacturers. Representatives of manufacturers and suppliers are also often included into the design phase in order to ensure smooth transfers119.
Manufacturing process: Vertically integrated fashion retailers can be divided into two cat-egories based on whether they own manufacturing facilities or not120. Retailers who do not own manufacturing facilities outsource their manufacturing to other firms. An in-creasing amount of manufacturing is done by companies located in the partially indus-trialised countries where production costs are low121. In many cases subcontracted manu-facturers are working exclusively for their retailers122. Retailers who own their manufac-turing facilities, such as Benetton and Zara, have widely ranging manufacturing strate-gies in terms of locations. For example Benetton produces most of its items in Italy and relies on its ability to compensate for higher production costs by higher flexibility and lean inventories. On the other hand, Zara, who used to locate its production into Europe has gradually started shifting its manufacturing into cheaper countries such as Turkey and Morocco as well as Asian countries123.
Similarly to the design processes, manufacturing is electronically connected to other parts of the supply chain which enables flexible and fast responses to demand chang-es124. This has also entailed that manufacturers are taking on increasing responsibilities which have traditionally been born by the retailers. These types of manufacturers are increasingly becoming intermediaries establishing networks of global suppliers which are able to offer full-package services. These networks make products for multiple brands, based on the buyers’ requirements, and are able to offer services such as quality control, packaging, tagging and even product development, along with the traditional production capabilities125.
Sourcing process: Also sourcing processes must be organised in a way that small and medium volumes of fabrics and other materials can be delivered in a very short period of time. In order to reduce the delivery times and achieve better availability , many verti-cally integrated companies use garments designed of standard fabrics, such as stock or greige fabrics which can be easily dyed to match the demands of consumers126. Although
116 Barnes and Lea-Greenwood (2006) 117 Gereffi and Frederick (2010) 118 Tokatli (2007); Hines (2007) 119 Richardson (1996) 120 Tokatli( 2007); Richardson (1996) 121 Tokatli (2007) 122 Richardson (1996) 123 Tokatli (2007) 124 Hines (2007) 125 Barnes and Lea-Greenwood (2006); Hines (2007); Gereffi and Frederick (2010) 126 Hines (2007)
Study on the Competitiveness of the EU fashion industries
March 2012 80
the fabrics are not highly sophisticated, they need to be in line with the current trends. The requirement for fashionable materials, the ability to provide small volumes of prod-ucts and short delivery times have led many companies to look at sourcing locations for materials which are close to their manufacturers and markets but also where suppliers have an understanding of the fashion requirements. A country such as Turkey has be-come one of the emerging countries for delivering fast fashion products. Fabrics which are more lasting in terms of their popularity can still be bought from low cost locations such as China as the demand is more predictable and lead times do not play such an im-portant role127.
Distribution and retailing process: Typically vertically integrated companies hold a high level of control over their own stores and franchisers. All the stores carrying the name of the companies follow tight instructions on layout, pricing, presentation and merchandise mix. Point-of-sale (POS) data enable retailers to track their sales, order replacements and to drop items from their product line within a very short notice period. Retail stores are also in a central position with regards to informing other parts of the supply chain about consumer demands. Usually orders and deliveries are centrally managed and fran-chisers have a limited ability to influence what is offered in their stores128. Typically stores do not replenish stocks of products. Rather, when one type of product is sold out, the retailer substitutes it with the next fashion item. This strategy minimizes inventory but also encourages customers to visit the stores more often in order not to miss the most trendy and new items and therefore maximizes the sales129. Stores are typically located in all the major cities within clusters of other similar stores (malls, shopping are-as etc.)130.
Examples of vertically integrated retailers include: Adidas, Benetton, H&M, Zara, Next, Puma, etc.
4.4 Department Stores and Mass Retailers with Private Labels
There has been a sharp increase in the volume and diversity of retailer private labels in-troduced by department stores and mass retailers131. Offering private labels has several benefits for merchandisers, department stores and retailers.132 By offering private labels department stores and other mass retailers are able to offer unique products and a larger variety which attracts more customers. The use of private labels by these stores also often requires engaging in manufacturing to reduce costs133. By eliminating the middle man associated with national brands, retailers are able to shave costs and widen profit margins134. Having private labels department stores and large retailers are more able to respond faster to changes in consumer demand and have better control over the quality of their products. Finally, by being in charge of the design and production of their own products, these stores can better use the information they receive from their customers regarding the design and marketing of these products. It has been argued further that department stores and large retailers value private labels because they have full control over the positioning of their labels with respect to other brands135.
Indeed, private labels are often close substitutes for national brands which are brands sold nationwide by various retailers. Increased competition against national brands through private labels allows department stores and other mass retailers to negotiate better supply conditions with national brand manufacturers which further increases their
127 Barnes and Lea-Greenwood (2006) 128 Richardson (1996) 129 Hines (2007); Barnes and Lea-Greenwood (2006) 130 Richardson (1996) 131 Raju et al. (1995); Gereffi and Frederick (2010) 132 Sen (2008) 133 Morton and Zettelmeyr (2004) 134 Gereffi and Frederick (2010) 135 Morton and Zettelmeyer (2004)
Study on the Competitiveness of the EU fashion industries
March 2012 81
profitability136. In terms of product diversification, private labels offer competition not only for the fashion clothing items but especially for other related products such as ac-cessories, wines and spirits137.
When it comes to the quality and prices of the private labels, a number of observations can be made. In general private label products are priced lower than equivalent national brands138. An increasing number of supermarket chains, such as Walmart in the US and Tesco in the EU have developed their own private labels and as a result have been able to increase their share in fashion clothing retail trade139. Their shares have increased faster in terms of volume than in value which indicates that supermarkets are selling more for less and therefore their competitive advantage may be derived from price ra-ther than fashionability. As a consequence many retailers with well-known private labels, such as Marks&Spencer and C&A have been losing ground to supermarkets.140 Regarding the quality of private labels different observations have been made. Some have found that private labels are generally considered to have an inferior quality in comparison to brand products.141 It has, however, also been observed that in some cases the quality of private labels matches or even exceeds that of the designer brands. Similarly, in some more rare cases the prices of these products can be comparable to high-end products142. Many private labels are making efforts to develop their image as reliable brands to gain customer loyalty.
Similarly to vertically integrated retailers, it is common for department stores and other large retailers to apply quick response techniques into their supply chains. By using quick response systems department stores and retailers are able to convey the information they collect on the store level through online electronic communication to designers, manufacturers and marketing, and to optimise their product design and inventory based on the market demand143.
Design process: As mentioned above private label products have changed from standard-ized products into more fashionable items. Although many are imitating the designs of leading fashion designers some private label producers have hired well-known designers in order to boost their products’ appeal144 (e.g. C&A). It is common that private label products are designed by in-house design-teams145.
Manufacturing process: Although most private labels are producing their products off-shore in low-cost locations with long lead times, many have reshaped their manufactur-ing process to comply with the quick response approach146. This implies that products are ordered in small batches from manufacturers located close to where the products are sold in order to reduce their inventories. Similarly to the manufacturing process of verti-cally integrated fashion retailers, manufacturers of private label products are often in-cluding activities such as packaging, labelling and inserting price tickets into their opera-tions147. Manufacturing volumes are based on the online information coming from the retailers148.
Distribution process: By definition, private label brands are only sold by a single retail chain or group.
136 Morton and Zettelmeyer (2004); Soberman and Parker (2006) 137 Hines (2007b) 138 Soberman and Parker (2006) 139 Hines (2007) 140 Hines (2007 141 Ailawadi et al. (2001) 142 Kumar and Steenkamp (2007) 143 Friorito et al. (1995) 144 The New York Times (1988) 145 Gereffi and Frederick (2010); Chen et al. (2010) 146 The New York Times (1988) 147 Sen (2008) 148 Friorito et al. (1995)
Study on the Competitiveness of the EU fashion industries
March 2012 82
4.5 Independent actors (e.g. designers, manufacturers, retailers)
Although the foregoing text looks at business models covering the value chain of the fashion industry, it is important to realise that a large part of the sector is made up of independent actors, many of which are small. Although this group generally receives less attention in the literature than the other models, they play a vital role in the sector, at different levels: design, manufacturing of fashion products and retail. Actors within this group focus on various types of fashion products (sometimes overlapping with the fash-ion segments introduced in the previous sections, e.g. luxury or premium brands) and apply various business models. In the following paragraphs independent actors have been divided into independent fashion designers, independent manufacturers and inde-pendent fashion retailers and the main business models applied by each group will be introduced. The diversity of business models in this category should be stressed, as it ranges from traditional manufacturers and shops to innovative concepts, from retail chains to niche players, etc.
4.5.1 Independent fashion designers
The core competence of independent fashion designers is their ability to create unique designs. They exist in all types of fashion, ranging from luxury products to low-priced every-day casual clothing as well as accessories and other fashion related products. However, independent designers typically draw their competitive advantage from the creation of innovative fashion products. They often create items which push the bounda-ries and shape the next generation of fashion but which may not be highly commercially viable. Small size, limited commercialisation and independency are generally considered important to remain highly creative149. However, since these independent designers are usually small, they have a limited capital base and difficulties with accessing finance (see also section 5.3) can prevent these designers from growing their business150. Limited capital resources also make it difficult for especially small designers to meet consumers rapidly changing demands151. In general independent fashion designers can be separated into the four following groups based on their business models:
• Designers co-operating with high-street retailers: Given the limited resources and vis-ibility many often small designers seek to cooperate with high street designers in or-der to benefit from their expertise in mass-manufacturing processes and mass market distribution. Furthermore, collaborating with larger companies can give independent design enterprises access to stable supply and greater variety of raw materials, addi-tional production options and may even help them to enter new export markets152. Independent fashion designers have also benefited from branding themselves as the designers of fashion items that have been successfully imitated by the downstream mass market retailers153. Especially for the small designers of luxury fashion products, appearing in international fashion events and physical and virtual trade fairs are im-portant in order to gain orders from significant retailers.
• Designers co-operating with small retailers: As an alternative for large high street re-tailers, independent designers may sell their products through small retailers and boutiques. As smaller retailers are often more flexible and order smaller volumes, it allows small, and especially new, fashion designers to learn how quickly they are able to produce their products and how to structure their orders154. As the small retailers do not have the resources of larger retailers, designers are still in charge of organis-
149Lin,(http://www.fashion.arts.ac.uk/media/research/documents/Shuyu%20Lin%20-
%20Sources%20of%20Creativity.pdf) 150 McRobbie (2002) 151 Karra (2008) 152 Rabino et al. (2008). An example of such collaboration is the co-operation between Belgian fashion designer
Walter Van Beirendonck and retail chain JBC for the design of their ’Van Beirendonck’ kids collection. 153Lin(http://www.fashion.arts.ac.uk/media/research/documents/Shuyu%20Lin%20-
%20Sources%20of%20Creativity.pdf) 154 CNNmoney (2009) (website)
Study on the Competitiveness of the EU fashion industries
March 2012 83
ing the production of their designs. Good relationships are considered as a crucial success factor also in the upstream part of the value chain155. Finding a good and reli-able manufacturer is a major challenge for most designers and therefore developing good and sustainable relationships with manufacturers is essential156. Some of the key issues creating problems between designers and manufacturers include on-time delivery, high costs associated with small orders, payment terms, lack of specific skills and trust issues. In order to keep the sourcing process flexible and maintain close re-lationships with their suppliers many independent designers often source their prod-ucts locally. However, it is not uncommon that even the small independent designers manufacture in more than one country157.
• Designers with own stores: Alternatively to depending on retailers, independent de-signers may also choose to sell their designs in their own stores. In the smallest en-terprises the designer is also an entrepreneur who is in charge of the sales and man-aging the shop158. Owning a store allows designers to communicate with customers and to get regular feedback on their products and ideas159. Previous research regard-ing small designers in UK found that close relationships with relevant customer and lifestyle groups was crucial for small designers160. Similarly to many designers co-operating with small retailers, designers with their own stores are fully in charge of their production and sourcing and therefore building reliable relationships with the up-stream suppliers and producers is of crucial importance.
• Designers engaged in online retailing: An increasing amount of independent designers are turning into online retailing as it enables designers to gain higher margins for their products as well as to access better customer information161. Designers may choose to sell finished products either through their own website or other channels such as auction channels like eBay. Designers can also choose the extent to which they allow consumers to be involved in the designing process of the product and de-sign (for more information of the online customized retailing see 4.6)
4.5.2 Independent fashion manufacturers
In addition to independent designers and retailers, the fashion industry includes a large number of independent and often small and medium sized manufacturers who are en-gaged in fashion manufacturing. These manufacturers can be further divided into six dif-ferent categories each with their specific business models 162:
• Cut-Make-and-Trim (CTM) manufacturers, which produce fashion items out of cloth and designs which have been provided by their customer (e.g. designer or retailer). This type of manufacturers often rely on a single retailer group but of-ten without legally bounding contracts. CTM manufacturers commonly pre-book capacity and they require flexibility to change their production at short notice.
• Contractor manufacturers, which produce items under strict instructions of their customers but can source their own cloth and design. When sufficiently flexible, contractor manufacturers are able to provide some diversity in their products and to serve even suddenly changing orders.
• Captive suppliers, which typically work only for one customer in an often mutual-ly beneficial relationship which resembles a partnership. Although mutually bene-ficial the supplier can be locked into the relationship as the costs of switching can
155 Malen (2008); Crewe and Forster (1992) 156 Crewe and Forster (1992) 157 Karro (2008) 158 Malen (2008) 159 Crewe and Foster (1992) 160 Raffo et al (2000) 161 Karro (2008) 162 Lowson (1998)
Study on the Competitiveness of the EU fashion industries
March 2012 84
be too high. Captive suppliers are often expected to be able to react to changes in demand within very short notice.
• Full package suppliers which produce fashion items but also offer other services such as sourcing of required inputs, the making of samples, quality control as well as labeling and ticketing163.
• Independent Manufacturers, which manufacture their own designs under own or private label. This type of designers/manufacturers often has a number of outlets and customers and thus is less dependent on single retailer groups.
• Independent Manufacturers or Marketers, which are similar to Independent Manufacturers but with an addition of a brand. They are able to switch between brand and “own” label and are highly independent. Due to their independence, these manufacturers/marketers are highly exposed to the volatility of demand and other risk factors, such as failure of new product development. Independent manufacturers/marketers are often more capital intensive than the other types of small manufacturers.
The last two types of manufacturers clearly overlap with independent designers and therefore making a clear distinction between manufacturers and designers is sometimes difficult.
Due to their small size, SME manufacturers are often able to meet the speed, volume and variability requirements of fast fashion and quick response approaches. As retailers are transferring an increasing amount of responsibility and risk to manufacturers, many are adopting more integrated operating models and better use of new information technolo-gy/information sharing. Thus it is no longer necessary for manufacturers to hold large inventories but instead they are directly connected to both up- and downstream parts of the value chain and are therefore able to improve their efficiency. However it should be noted that transformation to integrated operations is sometimes a slow process, which may affect the efficiency of independent manufacturers vis-à-vis fully integrated manu-facturers.164
4.5.3 Independent fashion retailers
In general fashion retailers can be divided into two separate (although in some occasions overlapping) groups, namely retailers with physical stores and retailers without physical stores. Within this chapter we focus on looking at small retailers with or without physical stores, although one can apply the retailer distinction also in larger retailer chains, luxury brands, factory shops, mail-order and online retailers, etc.
• Retailers with physical stores cover a wide range of different actors. Larger com-panies in this category include the fashion retail chains, and non-specialised re-tailers like department stores and supermarkets (although the chain stores of su-permarkets are also often smaller stores, for example through franchising). In ad-dition, there are factory outlets and independent multi-brand fashion retailers, with the latter selling brands on the basis of an exclusive sales agreement with the brand. The products sold by these retailers may range from clothing and footwear to other fashion products such as accessories165. In order to distinguish themselves from large retailers, small fashion retailers with stores are often spe-cialized and include for example retailers concentrating on alternative fashion la-bels and unique designs (possibly including their own design, see the part on in-dependent fashion designers) and thus cater small niche markets166. Furthermore, this category includes retailers focusing on second-hand fashion items and “vin-
163 Euratex 164 Lowson (1998) 165 AEDT 166 Law et al (2004)
Study on the Competitiveness of the EU fashion industries
March 2012 85
tage” products167. Thus, not all the small retailers are focused on specialized fash-ion niches or brands, instead many pay attention to popular design trends and apply them in more down to earth, more affordable and attractively priced ver-sions which attract fashion sensitive young consumers168. Especially in Southern and Eastern Europe, small and independent shops still have a significant part of the market and are also focused more on mainstream products. In addition to the products themselves, customer care and shopping experience are found to be im-portant for independent retailers with stores, which is reflected into staff training and store layout and interior169.
• Perhaps the simplest form of small retailers without physical stores are hawkers who often sell products which are easily transportable to new sale areas. Hawkers are commonly located on street markets and tourist attractions. In addition to hawkers, retailers without physical stores include mail-order companies and online retailers who allow customers to place their order through mail, phone or internet and then deliver the product through mail. Online retailing may take the form of a website selling multiple brands, private shopping clubs, auction sites and group-buying sites. For small retailers, online retailing can provide an affordable solution for reaching large consumer base in a wide geographical area. The next section devotes special attention to online retailing as business model.
It should be noted that given the large heterogeneity of independent retailers, there is also a variety of different sourcing strategies. The four main sourcing strategies applied are 1) purchase of finished goods; 2) manufacturing own products (factories are owned by retailers); 3) sub-contracting and 4) co-contracting.170
4.6 Online retailing
Online retailing, also known as etailing, is a growing model of business among companies focusing on fashion products. Therefore, it deserves some special attention, although many of the business models described in this chapter also apply online retailing in their strategy.
As the technological features of internet and other software have become more sophisti-cated, fashion retailers are able to provide detailed information over their products online and make the shopping experience more equivalent to physical shopping. Online retailing has many advantages to the retailers, such as lower costs in comparison to physical store, ability to reach customers who would otherwise not be reached and possibility for collecting important information over consumers’ interests.
Online retailing can take many forms. For some companies online retailing is an addition-al channel of retailing which complements the physical retailing, whereas other compa-nies are fully focused on online activities. In addition to single brand retailers, online re-tailers may also be multi-brand retailers, auction sites such as eBay or group buying sites, all with their different business models. Furthermore, there are great differences to which extent companies are using the opportunities that online retailing entails. Whereas some companies provide only a limited range of their products in their online stores, oth-ers go as far as allowing customers to create their own product by being involved in the design process.
Online retailing as well as traditional retailing has also taken advantage of online services in their sourcing processes. Already there are several virtual trade fairs which combine virtual fairs with online business-to-business showrooms. Virtual trade fairs are often
167 AEDT 168 Law et al (2004) 169 Crewe and Foster (1992) 170 AEDT
Study on the Competitiveness of the EU fashion industries
March 2012 86
organized simultaneously with traditional trade fairs, but they allow buyers to view the items presented in the traditional trade often even a month after the fair171.
In the following sections the business model of online customised retailing is de-scribed in more detail. Although this is only one of the many online business models, it serves special attention given the models’ significant expansion over the last two dec-ades.
The growth of online customised retailing can be attributed to consumers increasing in-terest in individual and unique products which has led many online retailers to take ad-vantage of additional opportunities that internet offers and to started focusing on provid-ing customised fashion items where consumers are involved in the design, production and/or delivery process even before the actual purchase has taken place172 . Online cus-tomisation enables companies to provide customers who are looking for specific, individ-ually fitted products, with new assets, but it also reduces costs for retailers and encour-ages customers to overcome their reluctance for online shopping. According to a recent study, if a consumer is involved in the customisation process, 72% of the time the same consumer will buy the product, as opposed to 23% of the time for the fashion business in general173. Online customisation further provides opportunities for costs saving through better planning conditions, a reduction of fashion risks, a drop in distribution stock-keeping and higher customer loyalty174. Furthermore, internet allows online retailers to collect valuable information about the potential consumers’ consumption habits and pref-erences as well as to interact with them through various online tools, such as emails, consumer forums as well as social media175.
Design process: Involving the customer into the design process (customisation) is at the core of online customised retailing. In the literature the provision of customised products has often been referred to as mass customisation. Although customers are involved in co-designing the product according to their needs, their choices are often limited within a fixed solution space offered by the retailer. Keeping consumers choices limited allows for stable and responsive processes but maintains costs associated with customisation at a level which does not force retailers to switch to an upper market segment176. In its sim-plest forms customisation may refer to choosing a colour of a T-shirt whereas in the more complex processes the consumer is able to design highly individual items by choos-ing for example the size, colour, fabric and print/design.
Production process: In the most complex processes new technologies such as 3D-bodyscanning is used in order to create products which fit the exact body type of the cus-tomer. Throughout the production chain, companies focusing on mass customisation take advantage of information technology, flexible processes and organisational structures. The production processes are often highly integrated and flexibility is further improved by applying systems such as computer-aided-design (CAD) and computer-aided-manufacturing (CAM) systems177.
Retail process: Although customised products are not necessarily associated with premi-um prices, in many cases consumers’ willingness to pay extra is reflected into their pric-es178. In addition to companies which focus purely on online retailing, many brand prod-ucts, including luxury brands, have started providing their own customisation services. As an example, Nike and Vans have for long offered their customers the opportunity to co-design their shoes. In the luxury fashion segment, customisation offers brands an oppor-tunity to offer their customers the most unique and exclusive products, which is one of the key features within the segment. Brands such as Hermes, Moet & Chandon and Ralph
171 AEDT 172 Kamali and Loker (2002) 173 US Today (2007) (website) 174 Pillar (2005) 175 Kamali and Loker (2002) 176 Piller (2005) 177 Bae and May-Plumlee (2005) 178 Pillar (2005)
Study on the Competitiveness of the EU fashion industries
March 2012 87
Lauren are all offering customised products179. Thus, businesses from various fashion segments use online customisation services as an alternative retailing channel. It should be noted that the sourcing and manufacturing strategies differ between the companies depending on the extent of their customisation services and the type of the company.
Examples of online fashion retailers include: Yoox, Net-a-Porter, Asos, Shopbop, leBa-zarParisien
4.7 Summary of key developments in the fashion value chains
The roles and relationships among national and global lead firms, apparel manufacturers, and intermediaries have become increasingly blurry in recent years. Based on the forego-ing analysis, there are a number of key developments in the sector that we would like to emphasise, and that are relevant to several business models. The following are trends in buyers’ strategies and long-term objectives:180
• The growing importance of the materials in fashion goods.
o High quality or exclusive textiles or leathers increasingly make the difference of top brands against their lower value competitors. Similarly, access to high-quality materials enables brands to upgrade their quality and price-segment181. In addition to being one of the determining factors for the brands fashion segment, having access to high quality materials with competitive prices may give brands a competitive edge against other brands within their own fashion segment.
• The growing importance of intermediaries in the value chain, where:
o Full-package manufacturers become intermediaries: Instead of expanding manufacturing operations, manufacturers are establishing a network of global suppliers. There are many firms in countries around the world that make products for multiple brands, based on the buyers’ requirements, providing full-package services along with production capabilities.
o Intermediaries/agents are expanding their roles to include a range of services to buyers, including design, product development, and quality control in addi-tion to providing a network of suppliers and logistics.
Related to the trend of the use of intermediaries is the trend towards reduc-ing/consolidating the number of traders and suppliers by developing long term rela-tionships with them. At the same time firms aim to maintain diversified sources of supply, so as to reduce dependency on specific countries (e.g. China) or suppliers.
• Further diversification of the fashion market as witnessed by:
o Increase in private-label brands: There has been a sharp increase in the vol-ume and diversity of retailer private labels. Retailers that develop proprietary brands use in-house design teams and outsourced manufacturing capacity, of-ten by direct foreign product sourcing. By eliminating the middleman associat-ed with national brands, retailers can shave costs and widen profit margins.
o Brand marketers creating exclusive product lines with mass retailers: Exclu-sive product lines are a way for mass retailers’ merchants to offer unique mer-chandise. Retailers are striking agreements with brand marketers to develop and distribute brands that are sold exclusively through the retailer’s stores in-stead of the traditional brand marketer model in which goods are sold via mul-tiple retail outlets.
179 The Guardian (2010) (website) 180 As partly identified by Gereffi and Frederick (2010) 181 COTANCE
Study on the Competitiveness of the EU fashion industries
March 2012 88
Increasing number of strategic alliances between (high-end) brands and sup-
pliers of exclusive textiles and leathers: Strategic alliances allow brands to en-sure their access to specific materials, control for the quality of these materials as well as to gain improved know-how in this field.
• New sales channels, notably reflected by:
o Growing importance of online sales of fashion items. Related to this is also the importance of online promotion tools like fashion blogs, or social networks like facebook and twitter, to promote certain products, trends or styles and to be in direct contact with (potential) customers.
o Brand owners becoming specialty retailers: Brand manufacturers and market-ers are increasingly opening their own stores.
• The use of dual sourcing strategies - quick response and fast fashion: Buyers tend to source fashion-sensitive products from suppliers that can deliver in a flexible and speedy manner, while basic products are sourced from the lowest-cost countries. This leads to the distinction between fast fashion and quick response. Quick response is associated with replenishment purchases for basic products. Fast fashion is quick response in new merchandise (with little or no replenishment), involving shipping fewer pieces, in a great variety of styles, and more often. Fast fashion has not led to more local sourcing, as Asian suppliers have adapted the capabilities to serve fast-fashion buyers, including reducing minimum-run requirements at lower cost of goods.
Study on the Competitiveness of the EU fashion industries
March 2012 89
5 THE INTERNAL DRIVERS OF COMPETITIVENESS FOR THE
EU FASHION INDUSTRIES
While chapter 3 provides a quantitative analysis of the structure and performance of the EU fashion industries and an evaluation of the current position of the EU fashion indus-tries vis-à-vis global competitors, this part focuses on the underlying internal drivers that contribute to the performance of the EU fashion industries: R&D and innovation, human capital and access to finance. They relate to the internal dynamics of the EU fashion in-dustries and can correspond to either strengths or weaknesses of the EU fashion indus-tries (cfr. section 1.2). All three internal drivers are crucial for the EU fashion industries to remain competitive.
5.1 R&D and innovation
Classified as non-research-intensive and low-tech, the importance of research, develop-ment and innovation in fashion industries is underestimated. Although the OECD-Eurostat classification of technology-intensity (OECD and Eurostat, 2005), calculated by the ratio of R&D expenditures to output provides an easy-to-measure scheme, it neglects (at least) three important factors, which has resulted in the above misleading conclusion:
1. This classification scheme does not consider the fact that industries are not homoge-neous: each industry (even high-tech ones) incorporates some non-research-intensive segments, while low-tech industries encompass some high-tech, research-intensive segments. The point of departure of this section is that fashion drivenness is strongly correlated with research-intensity: the more fashion-driven a segment of the otherwise low-tech textile, clothing, leather and footwear industries is the higher re-search-intensity it features.
2. The simplistic application of the OECD-Eurostat scheme considers only R&D invest-ments and neglects investments into intangible capital – even though this latter type of investments is one of the main drivers of competitiveness in the fashion industries.
3. This classification considers only innovation generation but disregards technology adoption (cf. learning by using).182 Fashion industries serve as a perfect example for innovativeness in terms of technology adoption and use. Inter-industry interdepend-encies and the interaction of new and old technologies can also be clearly demon-strated with the example of fashion industries.183 In fact, these industries integrate and exploit innovations developed in other sectors or industries: they represent the demand side for innovations generated elsewhere. Thereby they are key markets for technology since they can relatively easily be integrated with other materials and em-bed the technologies’ attributes of which add to the aesthetic and functional features of their products. Fashion industries try to differentiate their products and enhance their value added by adopting the scientific results and technologies developed in sci-entific disciplines as diverse as materials science, chemistry, physics, ICT, electronics & microsystems, biotechnology, nanotechnology, fibre optics, and engineering & pro-cess technologies (see also section 6.3).
The example of fashion industries is frequently mentioned when trying to demonstrate the irrelevance of classifications of innovativeness along “low-tech – high-tech” taxono-mies.184
This section analyses the fashion industries related research trends and efforts. Our anal-ysis is based on data of the international textile and clothing research registers covering the years of 2008, 2009, 2010 (International Journal of Clothing Science and Technolo-
182
Pavitt (1984) 183 Hirsch-Kreinsen (2008); Mendonça (2009); Hansen and Winther (2011) 184 Cf. von Tunzelmann and Acha (2005)
Study on the Competitiveness of the EU fashion industries
March 2012 90
gy). The annual special issues of this journal compile and publish the research undertak-ings of industry stakeholders of the given year: list the research projects, the associated funding, the key participants and stakeholders, the purposes and the results (delivera-bles and publications) of the given projects, as well as their implications.
These inventories, together with the analysis of European fashion industries related re-search programmes185 and the U.S. National Textile Center’s programmes (www.ntcresearch.org) help to identify major research trends, and hot topics in the tex-tile and clothing industries. It will be shown that the main RDI trends can be classified into two categories: technological and non-technological186.
The quality-based competitiveness of fashion products (similarly to all other finished products) is influenced by 1) material properties and function value, 2) process parame-ters and manufacturing practices, 3) design and symbolic or emotional value including also brand value. Technological innovations concern the first and second items: they are manifested in the products’ new attributes, and in the transformed and enhanced produc-tion process. Through the development of new materials, and new (non-conventional) or enhanced conventional manufacturing processes187 technological innovations integrate emerging and key enabling technologies into traditional manufacturing technologies and into traditional products. New fabrication technologies and smart materials with en-hanced functionality promise to revolutionize and rejuvenate mature fashion industries.
However, it is recalled that innovations may take place in any part of the value chain. Non-technological innovations may refer to innovations in the business model188, in com-panies’ organisation, supply chain management, marketing, branding, or in other busi-ness processes. Innovations that increase the intangible value of products, or result in the development of new or improved product services, new patterns of innovation co-operation, new delivery or sales systems, new marketing concepts, new brand images, smart organisations, etc. are all classified as non-technological innovations. This far from all-encompassing list makes it obvious that non-technological innovations constitute a much broader category than the third item of the above list.
Following the analysis of the main technological and non-technological RDI trends in fashion industries, and the evaluation of Europe’s competitiveness in these respects, we scrutinise the main barriers to innovation and conclude with some policy recommenda-tions on the ways to increase European fashion industries’ innovation-driven competi-tiveness.
185 For a list of EU co-funded textile research projects and related technology platforms see: http://www.textile-
platform.eu/links/ 186 The first time the Oslo Manual (OECD and Eurostat, 2005) has moved beyond the traditional definition of
innovation (restricted to product and process innovation) and included non-technological innovations as well, was its third edition, published in 2005. The third edition complemented the standard concept with new types of innovation: organizational and marketing innovation as follows: “An innovation is the imple-mentation of a new or significantly improved product (good or service), or process, a new marketing method, or a new organisational method in business practices, workplace organisation or external rela-tions.” The revised definition of innovation allows to better capture the innovation activities in ‘low-tech’ industries, such as e.g. many services industries or the fashion industries.
187 For example development of unconventional spinning, weaving, knitting, braiding, finishing and nonwoven technologies or enhancement of factory automation, robotic sewing, or development of efficient manufac-turing solutions, that allow customisation (e.g. digital printing, 3D printing, 3D body measurement, body scanning, rapid manufacturing, etc.).
188 Although we do not discuss here research on, or rather experimentation with business models, marketing methods and organizational solutions, we firmly believe that the concept of fashion is similar to that of in-novation. Similarity refers on the one hand to the disruptive properties of fashion cycles: fashion − just like innovation − is about creative destruction (cf. Potts, J. [2007]: Fashionomics. Policy, vol. 23, No. 4).
Study on the Competitiveness of the EU fashion industries
March 2012 91
5.1.1 Technological RDI trends and efforts
5.1.1.1 Nanotechnology
Although according to Just-style’s “Global market review of technical textiles in apparel - forecasts to 2011” (2007 edition) no fundamentally new189 fibres have been developed since the mid-1970s which means that industry actors’ RDI efforts target existing mate-rials,190 nanotechnology-based research efforts are in the process of changing this situa-tion.
In fact, one major fashion-related research field is nanotechnology.191 Nanotechnology is applied in various segments of the fashion value chain ranging from materials production, to processing and finishing, as well as to design.
By far the largest and most rapidly expanding field of nanotechnology application is con-ventional textile processing (finishing, coating and dyeing). Another field that is currently subject to intensive research is the development of nanocomposite fibres and nanofibres, which promises the long-awaited change of new material development (new fibres and new fabrics).192
A third research direction is nanotechnology enabled in-built technologies including mi-croencapsulation and nano-electronics embedded (smart) garments (discussed under the heading of smart textiles).
A related research field is dedicated to the risks (e.g. for the health and the environment) posed by engineered nanomaterials in consumer products.193
Applied initially in industrial and military niches, nanotechnology-based textile enhance-ments have rapidly penetrated into the processes and products of performance clothing and mainstream apparel manufacturing, since along with aesthetic properties consumers’ expect also improved functionality, such as easy-care (fade/wrinkle resistance, stain and dirt resistance); breathability; odour absorbance; heat/cold resistance, UV protection, water repellence, tear-strength, etc. This has led to the proliferation of multi-purpose apparel including also casual or designer’s clothing194: a marriage of function and fashion.
As for microencapsulation (when perfumes, cosmetics, dyes, phase changing materials etc.195 are entrapped in thin coatings of polymers forming microcapsules196 for later re-lease under controlled conditions) the number of fashion-related applications is steadily increasing197 and a plethora of innovative new products198 is in the process of transform-ing the life cycle trends of these industries.
189 Fundamentally new is a question of definition though. Professional papers from time to time report about the
development of new fibres with fashion related applications (among others). A recent example is a new polyester fiber with modified cross-section: with eight projections aligned in a radial pattern around a hol-low fiber. The new fiber offers rapid sweat absorption and drying, low weight, and heat shielding (insula-tion). It is marketed for innerwear, fashion apparel and many other uses. http://specialtyfabricsreview.com/articles/120211_polyester_fiber.html
190 Cf. the claim that „Low-tech industries are capable to carry out incremental innovation at best” (e.g. Hirsch-Kreinsen, 2008).
191 “Nanotechnology deals with the science and technology at dimensions of roughly 1 to 100 nanometres (1 nm = 10−9 m). Nanotechnology is concerned with materials whose structures exhibit significantly novel and improved physical, chemical and biological properties, phenomena and functionality due to their nanoscale size.” (Joshi and Bhattacharyya, 2011, p. 156). According to the cited authors, the textile industry was one of the first industries to demonstrate the applications of nanotechnology for consumer usage.
192 In contrast to nanotechnology enhanced textiles (i.e. nanotechnology applications in textile processing), the application of nanofibres and nanocomposite fibres is currently restricted to functional apparel: protective, military, industrial and health applications. It will take several years for their fashion related applications to become prevalent.
193 See e.g. the survey by Som et al. (2011) 194 According to Hinestroza (2007), the assembly of nanoparticles over textile fibres allows designers the ability
to control colours in fabric in a tunable fashion (without using any dyes!) and at the same time the tech-nology adds to the functionality of clothes.
195 Only fashion related applications are listed here. At the same time microencapsulation technology offers a wide range of medical applications as well.
196 In contrast to coatings, microencapsulation “works” inside the fabric. 197 Microencapsulation methods were developed already in the 1940s, but their application in the textile indus-
try started only in the 1990s. Application possibilities were multiplied with the advent of nanotechnology.
Study on the Competitiveness of the EU fashion industries
March 2012 92
In summary, nanotechnology applications enhancing the performance characteristics and functional features of the raw materials of fashion industries have transformed the input-manufacturing segments of the surveyed industries. They triggered rapid knowledge and innovation-driven growth, due to their tremendous functional benefits that promise to improve consumers’ quality of life. Raw material production for fashion industries have turned into an emerging industry segment with exponentially increasing number of new products in the developmental and in the market introduction phases.
According to the report “Nanotechnology and Textiles: Market and Applications to 2015” (www.nanoposts.com), the global market for nanotechnology in the textiles industry was around USD 480 million in 2007 and is expected to increase up to USD 4.9 billion by 2015, a tenfold increase within less than a decade – albeit from a low basis. Nanoposts expects that 24.6 % of all textiles products available in 2015 will incorporate some form of nanotechnology.
Woodrow Wilson International Centre for Scholars’ project on emerging nanotechnologies resulted in a compilation of (regularly updated) inventories of nanotechnology-based consumer products in the market. The latest inventory published in March, 2011 con-tained 1317 nanotechnology enhanced consumer products. The heading of “clothing” contained 182 items, that of “sporting goods” 119 items. The breakdown of products by region indicated a clear leadership role of the U.S. with 587 products (including non-fashion related ones). Europe was distant second with 367 products followed by East Asia with 261 products199.
In their survey on nanotechnology-based RDI in the textile industry Joshi and Bhattacharyya (2011) list 14 functional nanofinishes commercially available in 2008, to-gether with the properties they ensure (i.e. the main applications) and the names of the IP-holder companies. The 14 nanofinishes pertained to 12 global companies: the head-quarters of seven of them are in the US; one in Canada; two in Europe (Germany and UK); one in Japan and one in China. Although 2008 data may seem already outdated in 2011 in this research- and intellectual property instruments-intensive technological field, this distribution may well reflect Europe’s lagging competitiveness vis á vis the USA, in the textiles-related nanofinishes.200
The main barrier to commercialisation of nanotechnology enhanced products – an im-portant RDI issue in itself – is that manufacturing costs (especially costs related to spe-cialized machineries; raw material costs and the costs of human resources) are still quite high. A breakthrough in this respect is equally important for competitiveness than break-throughs in the research related to materials properties. Moreover, the lack of compre-hensive legislation is still hindering major investments into the commercialisation of ex-isting inventions, which calls for further research of the risks posed by engineered nano-materials in consumer products, and for the development of related scientific testing methods.
5.1.1.2 Making fashion products smart
Technological developments enhancing the “intelligence” of fashion industries’ traditional products were first manifest in the development and diffusion of smart textiles. Smart or intelligent textiles are functional textiles, which can sense and interact with their envi-ronment. They are part of the so-called ambient intelligence: intelligent devices embed-
198 An example is an innovative start-up company that introduced “slimming leggings” in the market, the mate-
rial of which has micro-massaging properties, and is embedded with encapsulated extracts that have slimming and anti-cellulite effects, such as green tea. (Source: Entrepreneur Shazia Awan launches inno-vative slimming garments. Wales Online, 02/12/2009)
199 http://www.nanotechproject.org/inventories/consumer/analysis_draft/ 200 According to WIPO’s most recent data on patent applications by technological field and country of origin
(2003-2007 total) Japan is the clear leader in surface technology and coating – a field of technology that is much wider than the above-analyzed nanofinishes (and not necessarily textiles-related). The US ac-counted for 32,061 patents in the surveyed period, while the respective data for the European Union was 21,970, for China: 8264, and for Japan: 51,174 (!)
Study on the Competitiveness of the EU fashion industries
March 2012 93
ded in peoples’ ambience to provide various services. Smart textiles respond to external triggers e.g. to temperature, noise, and light.201 Responses include changes in colour and/or shape; emission of light; release of substances (e.g. fragrances) or, in the case of in-built thermal actuators: heating/cooling etc. Moreover, examples for in-built function-ality include data processing and communication (wearable computing), energy harvest-ing and power storing functions (e.g. solar panels, in-built batteries). From this account it is obvious that smartness is a broader term than e-textiles, this latter concerns only the integration of electronic and computational elements into fabric.
The global market for smart textile applications (wearable systems) is estimated today at EUR 500M (and an additional EUR 50M for stretchable electronics) but rapid growth is projected (12-17 % annually). The share of the EU (currently somewhat below 40 %) is predicted to increase up to 40 %, provided its commercialisation performance be im-proved.202
Although fashion industries currently account for a relatively small fragment of smart textiles applications, the scope of fashion related applications keeps expanding. Restrict-ed initially to sport and performance wear203 within fashion industries, nowadays we find smart textiles applications204 in fashion products such as shape/colour changing and light-emitting garments, wearable LED solutions e.g. in motorcycle jackets, haute cou-ture garments, fashion accessories, e.g. handbags etc. Other examples include integrat-ed panels in jackets for operating MP3 players or mobile phones; heated textile products and footwear, intelligent shoes205 etc.
Box 5: Some high-flying smart fashion companies
Diffus, a Danish design company exemplifies the integration of sustainability (eco-function) in techno-chic fashion. It designed glittering solar-powered handbags that use miniature photovoltaic cells as a design element. Solar panels allow charging cell phones and power the fibre optics integrated in the inside of the bag. Once opened, the bag lights up, illuminates the inside, which facilitates the spotting of small objects even in darkness.
The German Interactive Wear is a vertically integrated company specialised in practically every function along the value chain: from research and custom development, to the design and implementation of specific production solutions. An electronics specialist for the textile industry, Interactive Wear qualifies, tests and certifies its solutions, including garment heating and lighting systems, textile interconnection components, entertain-ment and communication systems (such as iPod).
The French LumiGram SARL uses luminous technologies (not only LEDs, recyclable bat-teries and on/off switches but also fibre optics fabric made of ultra-thin optical fibres, directly woven with synthetic fibres) in fashion clothing and home interior items such as table cloths, bedspreads, pillows, curtains, wall covering. Its fashion clothing, e.g. jack-ets, tops, or dresses glow for up to 12 hours, producing luminous effect in darkness. Garments are washable after removal of batteries.
201 Only fashion related stimuli are listed here. Smart textiles in medical or military applications or in work-wear
respond to various other external triggers including moisture, pressure, electricity, chemicals, radiation, magnetic fields etc.
202 Source: PASTA project, Newsletter 1, July, 2011, www.pasta-project.eu 203 Systex Vision Paper provides a table (p. 18-19) of the main companies and their smart products introduced
in the sport and wellness markets. SYSTEX Vision Paper for fostering commercialization of smart textiles in European in lead markets. http://www.esma.com/en/esma-news/50-articles/373-systex-vision-paper
204 Systex (op. cit.) lists the commercialized products and related companies in the interactive clothing market (p. 19-20)
205 For example shoes that provide real time user localisation, or shoes equipped with a) automatically adjusting cushioning with the help of in-built sensors and computer chips; b) sensors that compile, store and send information about running (speed, total distance etc.) and transmit data to the wearer’s iPod.
Study on the Competitiveness of the EU fashion industries
March 2012 94
In their survey on the state-of-the-art and future directions of smart textiles, Schwartz et al. (2010) review the main smart textiles related European research projects.206 From the survey it turns out that these projects try to respond to societal needs and finance re-search in the field of health monitoring, safety and civil protection, or try to contribute to technology transfer and inter-firm networking. Fashion industry related applications are spillovers from the results of publicly sponsored projects.207
At the same time the authors of all cited surveys208 acknowledge that there are still few products on the market, i.e. the commercialization of research results is inferior to ex-pectations. As for fashion industry applications, fashion news abound in items that inform about the creation of prototypes in which fashion and function are aligned but they re-main in the prototype phase of commercial introduction without a chance for scaled-up production.
According to Ariyatum et al. (2005), smart consumer products still feature selected defi-ciencies that hinder consumers’ uptake of the novelties. These products are manufac-tured in small production batches and are prohibitively expensive. In fact, „the process for mass producing traditional textiles does not translate well to smart textiles: cutting patterns from rolls of cloth and sewing them together to make garments breaks electron-ic connections in an uncontrolled manner. Because of this, smart fabric elements are generally integrated by hand into textiles produced by standard methods” (Simon et. al. (op. cit. p. 7). Some newly developed products are not comfortable / wearable: the care-ful balance between function and design is not stricken. Matching smart functions and fashionable design so that they break out of their “niche solution” status and enter the mass market is a demanding task, since in contrast to fashion products, functional cloth-ing has long lifecycle.
In summary, smart textile products are still in the technology-push phase. Transition to market-pull development will intensify commercialisation. One precondition of successful commercialisation of smart textiles and wearable technologies by the fashion industries is that aesthetics and design transcend the currently prevalent technology-focused and functionality-minded approach. Instead of l’art pour l’art futuristic technological solutions, functions rather ought to enhance expressiveness otherwise barriers to consumers’ ac-ceptance cannot be overcome.
Other practical barriers include problems with wash ability and maintenance. This would subject the smart elements to water and chemical immersion, while washing machines expose the fabric to physical stress, and to extreme temperatures – wearable electronics cannot withstand this treatment.
According to the consensus finding of the cited surveys, the European Union is a clear leader in smart fashion products in terms of both R&D inputs and outputs. European companies’ good competitive position is due to the fact that they can benefit from non-negligible R&D funding provided by the European Commission’s 6th and 7th framework programmes: they co-operate with universities and public research organisations and are ahead of their American counterparts in the commercialisation of the results. This ad-vantage should however be assessed in the context of a meagre overall commercialisa-tion performance and the threat of rapidly emerging Chinese and other Southeast Asian competitors209 in the high-value technological segments of the fashion industries.
206 Another list of smart textiles research projects including also some publicly funded projects in the U.S. are
provided by Simon, C, Potter, E., McCabe, M. and Baggerman, C. (2010): Smart Fabrics Technology De-velopment. Final Report. A NASA Innovation Fund Project. http://ntrs.nasa.gov/archive/nasa/casi.ntrs.nasa.gov/20100042366_2010045164.pdf (accessed: 21.11.2011)
207 Military and space related technical textiles research projects also provide extensive opportunities for fashion related spillovers.
208 See also Dunne (2010) 209 Asian fashion industry actors can benefit from a large and rapidly expanding internal consumer market in
general and the rapid expansion of the luxury segment in particular. „According to the statistics of World Luxury Association, by the end of 2009, China’s consumption of luxury goods totalled USD 9.4 billion, accounting for 27.5 % in global sales of luxury goods. China has surpassed the United States and be-
Study on the Competitiveness of the EU fashion industries
March 2012 95
5.1.1.3 ICT and process development
Trade fairs such as ITMA or Texprocess where in addition to innovative products new technologies and new high-tech solutions for the fashion industries are presented clearly demonstrate not only the importance of fashion industries as markets for technology, but also the fact that ICT is ubiquitous, embedded in
• manufacturing processes,210 • high-tech equipments (e.g. computer-monitored and managed flexible handling
systems), • products, • a variety of fashion companies’ corporate functions.
While the previous section detailed ICT-enhanced product solutions, and section 5.3 pro-vides insights into recent trends in ICT-enabled production processes, this section will briefly summarise the importance of ICT for fashion companies’ selected corporate func-tions. ICT-solutions (e.g. enterprise resource planning and supply chain management systems) enhance the productivity of supply chain management: a key element lead fashion companies’ competitiveness. Similarly to other industries the importance of ICT-solutions for logistics and retail, marketing can hardly be underestimated.211 ICT has be-come key enabler of integrated business planning, and product lifecycle management.212
5.1.2 Non-technological RDI efforts
Though seemingly obvious, the claim that design is one of the key constituents of RDI in fashion industries was only recently formally acknowledged, when non-technological in-vestments (investment into knowledge) were recognised as being part of R&D and the creation of new design was recognised as innovation.
Though the significance of products’ appearance, and of consumers’ perception with re-spect to products’ social and symbolic value have been widely researched213 and been identified as factors of competitive advantage, the definition of R&D traditionally restrict-ed to investments in scientific research214 and that of innovation traditionally limited to “technological innovation” were slow to change. It was only in the mid-2000s – with an ever-increasing portion of firms’ investments linked to the aesthetic and symbolic ele-ments of their products and services – that scholars investigating the extent and eco-nomic importance of investments in intangible capital215 have managed to convince poli-cy-makers and statisticians that the concept of R&D is much broader than what can be captured by traditional R&D indicators.
Cappetta et al. (2006) have developed the concept of stylistic innovation. Stylistic inno-vations generate novelties not in products’ tangible features but in their aesthetic charac-
come the world’s second largest consumer of luxury goods.” Global luxury goods sales are expected to amount to EUR 185 billion by the end of 2011. (China Luxury Market Report http://www.china-online-marketing.com/news/china-market-news/china-luxury-market-report/, ac-cessed 23.11.2011).
210 With computer-aided design and –manufacturing (CAD-CAM technology) various fabric weaves and designs are easily created and simulated into the virtual fabric in a range of colour combinations. This technology increases productivity and adds value to the products. CAD facilitates made-to-measure solutions and en-hances thereby customisation and product individualisation.
211 Recall the new trend, that of digital interactions with customers, with the help of 3D visualisation (body scanning and simulation) systems. Another target of visualisation is the store itself: instead of browsing lengthy product catalogues customers shop in virtual stores, pick items and access relevant data in an in-teractive, user-friendly manner.
212 PLM software ensures continuity in collection development. 213 One of the classical citations is Veblen (1964) 214 For example in the UK up till 2007, R&D surveys have specifically excluded fashion industry related design
activities (“design costs to meet changes of fashion and artistic design work”) from survey questions. (Galindo-Rueda et al., 2010)
215 E.g. Jarboe (2007); Van Ark et al. (2009)
Study on the Competitiveness of the EU fashion industries
March 2012 96
teristics or more broadly: in their intangible meanings. Alcaide-Marzal and Tortajada-Esparza (2007) use the concept of aesthetic innovation defining it as innovation that “does not provide new functionality to the product; does not alter the way a product is used; may make use of new technologies or materials, but not necessarily; and increases the perceived value of the product and satisfies customer demands concerning taste, social image and preference for novelty.” FIT4U and DOROTHY are only some research examples in the leather industry that target consumer centred product and process de-sign such as technologies for consumer virtual profile creation and product personaliza-tion, customer co-design.216
The particular importance of customer focus in fashion industries places the concept of user-driven innovation to centre stage of any analysis of non-technological innovations. Advanced originally by von Hippel (1986, 2005), the concept of user-driven innovation has gained universal acceptance in academic research on the drivers of innovation. As for business practice, fashion firms started to rely systematically on customers as sources and co-creators of innovative ideas with some time-lag, following the publication of the first theoretical academic papers. Customer involvement and customer co-creation were facilitated by ICT and other technological developments.217 Customers participate in the design and creation of their own fashion items with the help of 3D visualisation, and vir-tual try-on. Increased customer involvement was manifest also in the role bloggers and other online communities (social media) started to play in shaping fashion trends. Tech-nological developments have contributed to the transformation of fashion industries’ business processes: from mass production to user-centred production.
Beyond increased customer involvement in the co-creation of innovations, dominant part of user-centred innovations in the fashion industries concern efforts to uncover and un-derstand consumers’ needs, and the impact of changes in consumer lifestyles on their purchasing choices and preferences. In fact, user-centred innovation efforts are charac-terised by a systematic and scientific approach (research methods are borrowed from various social sciences including psychology, sociology, anthropology, etc.) to identify fashion-related preferences of selected segments of the society. While this type of user-centred research is supported by non-negligible public funding in the U.S.,218 European fashion companies tend to finance similar research from own funds, which puts these firms at relative disadvantage.
216 In addition FIT4U project includes several technological objectives related to innovative materials and new
production technologies, as well as process engineering tools. 217 This exemplifies the interdependence of technological and non-technological innovations. Another example
for this interdependence is the enhanced role of sustainability aspects. Incorporating sustainability in fash-ion products enhances their intangible value, together with brand image: typical example of non-technological innovation. However, the implementation of enhanced sustainability i.e. the reduction of fashion industries’ negative impact on the environment requires non-negligible technological RDI. Re-search efforts target the reduction of the environmental footprint all along the value chain. e.g. the devel-opment of processing and finishing methods that require a minimum use of chemicals (organic textiles & clothes); development of innovative solutions to reduce water and energy use; methods to increase recy-cling and materials re-use, methods to reduce the environmental impact of clothes cleaning, etc. UK’s De-fra (Department for Environment Food and Rural Affairs) established and implemented a „Sustainable Clothing Roadmap” in 2007 with the aim of improving the sustainability of clothing across its lifecycle, from the crops that are grown to make the fabrics, to the design and manufacture of the garment, retail, use and end of life. The progress Report issued in 2011 lists the actions taken by the main stakeholders involved in the programme. http://www.defra.gov.uk/publications/files/pb13461-clothing-actionplan-110518.pdf. MISTRA, the Swedish Foundation for Strategic Environmental Research has sponsored a re-search programme to survey the ongoing Swedish and European sustainable fashion related research and identify future research needs. Their report published in 2010 (http://www.proenviro.se/download/18.5004bd9712b572e3de6800037403/Mistra+Future+Fashion+Background+paper.pdf) lists several international research programmes that focus on the sustainability of fash-ion industries.
218 One of the U.S. National Textile Center’s key research areas with respect to which call for proposals are announced each year is “systems” (in addition to areas such as chemical applications, fabrication, and ma-terials). “Systems” concern research in the management of product design, sourcing, production, distribu-tion and consumption systems. Examples for publicly funded user-centred RDI projects include: “Mascu-line fashion choices – shifting identities”; Hispanic characterisation systems”; research on brand personali-ties; on the impact of brand image on customers’ attitudes; gathering social, psychological and behaviour-al data of plus-sized tweens, etc. (www.ntcresearch.org)
Study on the Competitiveness of the EU fashion industries
March 2012 97
Marketing and branding are other elements of non-technological innovation efforts: by shaping consumer needs they constitute key drivers of the competitiveness of fashion industries. Marketing as well as changes in business models respond partly to increased speed-to-market requirements and to the accelerated dynamics of fashion industries (small collections, increased number of seasons, shorter life-cycles, reduced mark-down periods and merchandise volumes).
Other non-technological innovation efforts are centred around the development of smart organisations, innovative business models, collaborations and networking. They include e-business and management research (innovative supply chain solutions, intelligent lo-gistics and distribution), and research & development of virtual partnerships (e.g. virtual co-design, co-engineering, knowledge sharing and virtual prototyping).
Efforts related to innovative management and business model solutions have turned away from focusing mainly on the cost efficiency of manufacturing and started to re-search rather the ways to increase profit margins. A major business model type of inno-vation was the shift from producer-driven to buyer-driven chains.219 A recent solution, still in the process of continuous improvement, is fast fashion (rapid adoption of new trends in products’ design and reduction of the time gap between design and consump-tion). UK retailers are considered to be the first to develop and apply this business mod-el, albeit global imitators were quick to react.220
The above-listed non-technological innovation efforts have one common feature: in con-trast to technological research efforts, substantial part of which can benefit from public funding, non-technological innovation efforts are mostly privately funded. Exceptions include some EU-funded programmes that envisage collaboration and knowledge sharing relevant to the fashion industries, e.g. CoReNet, CrossTexNet, Enviro-Tex-Design, eBIZ-TCF, or various European Technology Platforms (ETPs) related to fashion industries. In particular, the project PROsumer.NET, aims at roadmapping and promoting the network-ing among the participants of various consumer goods related ETPs. Other non-technological innovation related, publicly funded research concerns national level design-related creative industry strategies.221
5.1.3 Barriers to innovation
The above-listed descriptions of the main technological and non-technological innovation efforts make it clear that several technological and non-technological innovations have shaped the evolution of the industry. A major explanatory factor of industry actors’ com-petitiveness is their ability to generate or at least take up these innovations. However, according to CIS4 data, only 36.1 % of textiles and 17.4 % of all clothing firms are inno-vative (conduct R&D activities in-house, or contract out research, or innovate through technology adoption) – much below the manufacturing average of 54.5 %. The share of enterprises introducing marketing innovations seems also quite low (11.4 % in textiles and 5.6 % in clothing).222
CIS data can hardly be compared with similar data in EU’s main competitors. For exam-ple, according to U.S. National Science Fund’s (NSF) statistics, 19 % of the textiles, ap-parel and leather companies reported about having performed product or services inno-vations (versus 22 % of the average of all enterprises) and 18 % of them have generat-ed process innovations over the period of 2006-2008.223 Nevertheless NSF data can hard-ly be compared with CIS data (this would be comparison of apples to oranges). The U.S. National Science Fund surveys enterprises (by industry) with product or process innova-
219 Gereffi (1999); Dicken (2003) 220 Bhardwaj and Fairhurst (2010) 221 Cf. Cunningham’s survey and international comparison of advanced economies’ creative industry policies
Cunningham (2009); Foord (2008) 222 Calculations made by Dachs and Zahradnik (2010) 223 The share of companies in manufacturing industries reporting process innovations was also 22 % in the U.S.
Source: Boroush, M. (2010): NSF Releases: New Statistics on Business Innovation. http://www.nsf.gov/statistics/infbrief/nsf11300/
Study on the Competitiveness of the EU fashion industries
March 2012 98
tions, whereas CIS surveys cover the industry-level shares of enterprises that are en-gaged in innovative activities.
This difference is highly important not only from the point of view of the resulting fuzzi-ness of EU – U.S. comparisons. In fact, if similar innovation output indicators were avail-able in Europe as in the U.S. this would reveal a worrying deficiency of European innova-tive actors: irrespective of the non-negligible share of European textiles and clothing firms engaged in innovative activities, European firms have important shortcomings in technology transfer, i.e. in turning scientific results into business success.
Intra-EU comparisons i.e. with the respective CIS-data in other European industries re-veal a particularly meagre innovation performance of apparel industries. One reason is the overwhelming weight of micro companies, employing less than 5 persons. Average European textile and clothing firms face serious difficulties in innovation financing, but the lack of funds hampers most seriously micro- and small enterprises’ innovation efforts. Another barrier to innovation identified by Europe INNOVA is the shortage of qualified personnel. Since qualified personnel are key condition of innovation adoption, this defi-ciency also proves to be a serious barrier to innovation. Moreover, according to Europe INNOVA’s analysis, European clothing enterprises invest much less into employees’ train-ing than the manufacturing average. On the one hand this can be explained by lack of funds and deficient capital accumulation capability, but on the other hand shortcomings in the financing of training, together with the relatively low intensity of external knowledge acquisition (both embodied and disembodied) hamper the improvement of the sector’s innovation performance.
5.1.4 Policy initiatives to stimulate innovation
Both policy and business stakeholders in the fashion industries of advanced (and increas-ingly also in catching-up) economies have long recognised that the traditional segments of fashion driven industries face irresistible competitive threat by producers of low-wage economies. Unless the value added of fashion products continuously increases, fashion industry jobs and capacity will progressively get lost.
One way to increase value added is through intangible investments into brand value, marketing, design, and innovative organisational solutions. The other way is through im-proving fashion products’ material properties and achieving enhanced functionality by means of science-based research. European companies can benefit from developed re-search and education infrastructure224 as well as from a number of publicly financed pro-grammes that support R&D efforts both at national/regional and at EU level.225 Neverthe-less, an important competitive deficiency manifest in European companies’ relatively poor commercialisation performance is that both EU-level and national support are excessively focused on scientific research. Support schemes for market introduction and growth are lacking, and even existing industry-university co-operation schemes do not deliver in terms of the introduction of new innovative and creative products to the market.
224 In Germany alone there are 16 research institutes engaged in textile-based research. (Deutsche Bank Re-
search: Heymann, E. (2011). Textranet, the European Network of Research Organisations has 32 mem-bers (and 3 associated members) while AUTEX the network textile universities of Europe has 31 members (including Turkish universities).
225 Note however, that according to Euratex, textile and clothing industry participation in EU research pro-grammes keeps declining since FP4 (Euratex Position Paper, 18.05.2011), which is worrying despite the fact that the declining participation of industry in successive editions of the Framework Programme is not specific for the textile and clothing sector but a general trend.
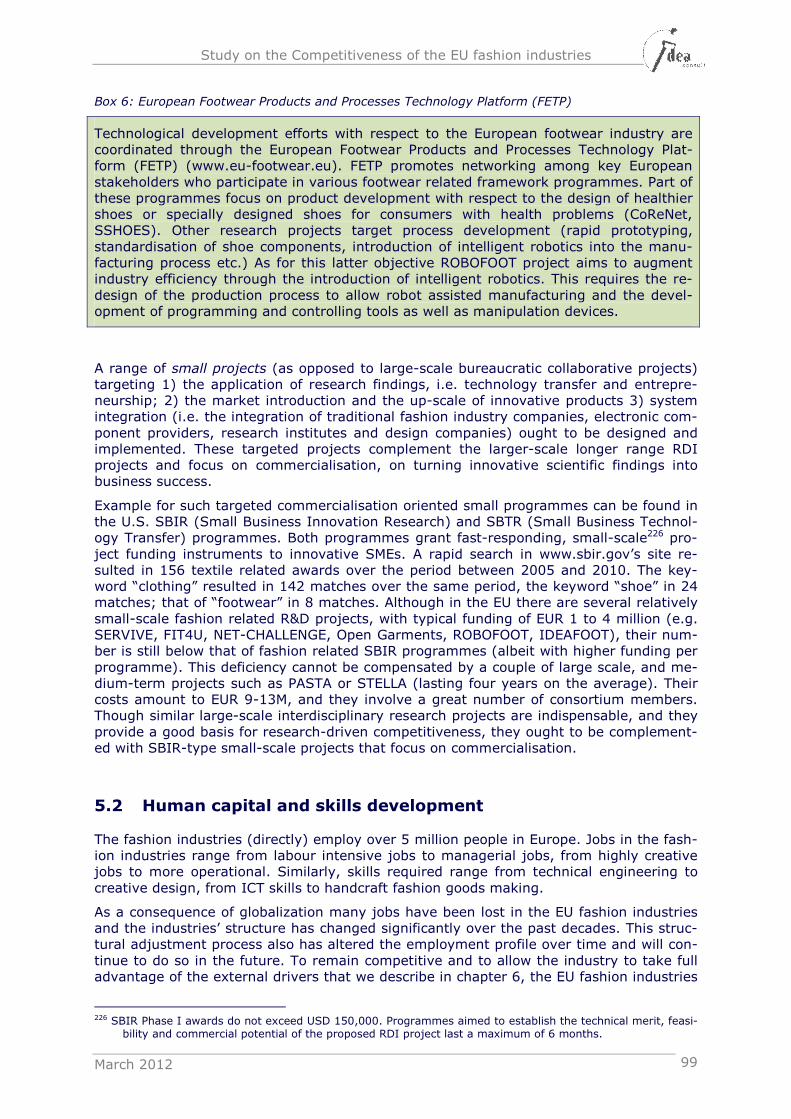
Study on the Competitiveness of the EU fashion industries
March 2012 99
Box 6: European Footwear Products and Processes Technology Platform (FETP)
Technological development efforts with respect to the European footwear industry are coordinated through the European Footwear Products and Processes Technology Plat-form (FETP) (www.eu-footwear.eu). FETP promotes networking among key European stakeholders who participate in various footwear related framework programmes. Part of these programmes focus on product development with respect to the design of healthier shoes or specially designed shoes for consumers with health problems (CoReNet, SSHOES). Other research projects target process development (rapid prototyping, standardisation of shoe components, introduction of intelligent robotics into the manu-facturing process etc.) As for this latter objective ROBOFOOT project aims to augment industry efficiency through the introduction of intelligent robotics. This requires the re-design of the production process to allow robot assisted manufacturing and the devel-opment of programming and controlling tools as well as manipulation devices.
A range of small projects (as opposed to large-scale bureaucratic collaborative projects) targeting 1) the application of research findings, i.e. technology transfer and entrepre-neurship; 2) the market introduction and the up-scale of innovative products 3) system integration (i.e. the integration of traditional fashion industry companies, electronic com-ponent providers, research institutes and design companies) ought to be designed and implemented. These targeted projects complement the larger-scale longer range RDI projects and focus on commercialisation, on turning innovative scientific findings into business success.
Example for such targeted commercialisation oriented small programmes can be found in the U.S. SBIR (Small Business Innovation Research) and SBTR (Small Business Technol-ogy Transfer) programmes. Both programmes grant fast-responding, small-scale226 pro-ject funding instruments to innovative SMEs. A rapid search in www.sbir.gov’s site re-sulted in 156 textile related awards over the period between 2005 and 2010. The key-word “clothing” resulted in 142 matches over the same period, the keyword “shoe” in 24 matches; that of “footwear” in 8 matches. Although in the EU there are several relatively small-scale fashion related R&D projects, with typical funding of EUR 1 to 4 million (e.g. SERVIVE, FIT4U, NET-CHALLENGE, Open Garments, ROBOFOOT, IDEAFOOT), their num-ber is still below that of fashion related SBIR programmes (albeit with higher funding per programme). This deficiency cannot be compensated by a couple of large scale, and me-dium-term projects such as PASTA or STELLA (lasting four years on the average). Their costs amount to EUR 9-13M, and they involve a great number of consortium members. Though similar large-scale interdisciplinary research projects are indispensable, and they provide a good basis for research-driven competitiveness, they ought to be complement-ed with SBIR-type small-scale projects that focus on commercialisation.
5.2 Human capital and skills development
The fashion industries (directly) employ over 5 million people in Europe. Jobs in the fash-ion industries range from labour intensive jobs to managerial jobs, from highly creative jobs to more operational. Similarly, skills required range from technical engineering to creative design, from ICT skills to handcraft fashion goods making.
As a consequence of globalization many jobs have been lost in the EU fashion industries and the industries’ structure has changed significantly over the past decades. This struc-tural adjustment process also has altered the employment profile over time and will con-tinue to do so in the future. To remain competitive and to allow the industry to take full advantage of the external drivers that we describe in chapter 6, the EU fashion industries
226 SBIR Phase I awards do not exceed USD 150,000. Programmes aimed to establish the technical merit, feasi-
bility and commercial potential of the proposed RDI project last a maximum of 6 months.
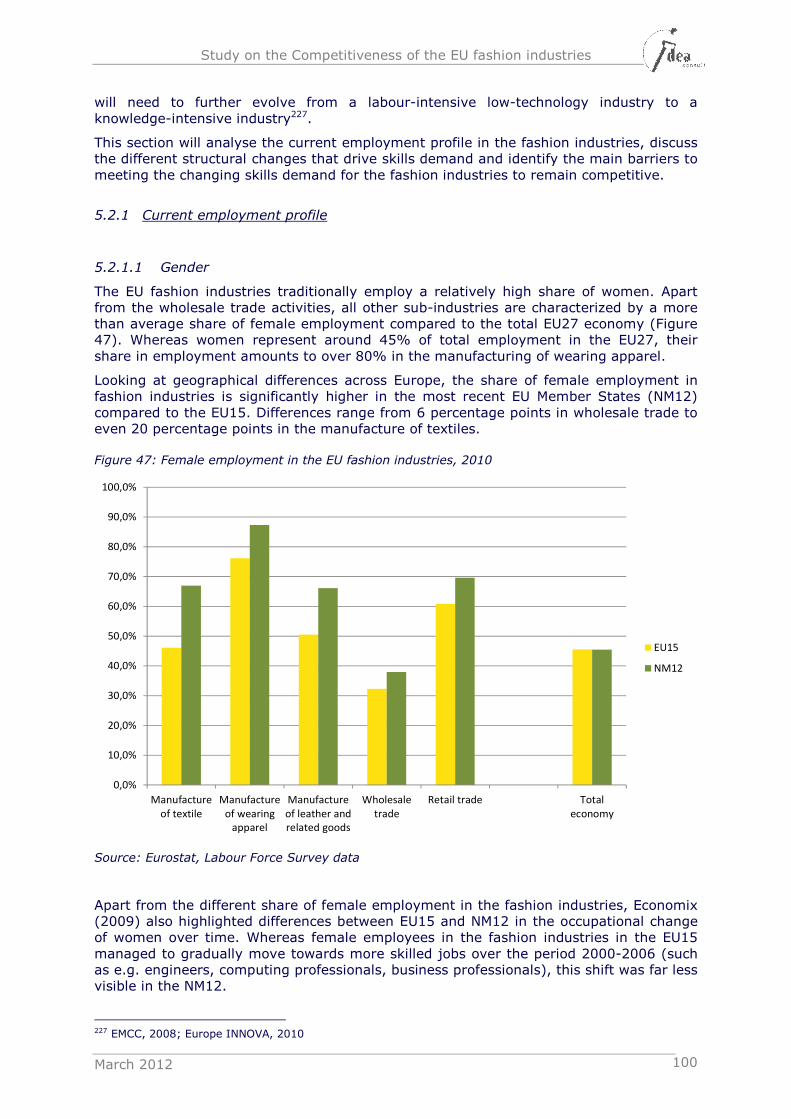
Study on the Competitiveness of the EU fashion industries
March 2012 100
will need to further evolve from a labour-intensive low-technology industry to a knowledge-intensive industry227.
This section will analyse the current employment profile in the fashion industries, discuss the different structural changes that drive skills demand and identify the main barriers to meeting the changing skills demand for the fashion industries to remain competitive.
5.2.1 Current employment profile
5.2.1.1 Gender
The EU fashion industries traditionally employ a relatively high share of women. Apart from the wholesale trade activities, all other sub-industries are characterized by a more than average share of female employment compared to the total EU27 economy (Figure 47). Whereas women represent around 45% of total employment in the EU27, their share in employment amounts to over 80% in the manufacturing of wearing apparel.
Looking at geographical differences across Europe, the share of female employment in fashion industries is significantly higher in the most recent EU Member States (NM12) compared to the EU15. Differences range from 6 percentage points in wholesale trade to even 20 percentage points in the manufacture of textiles.
Figure 47: Female employment in the EU fashion industries, 2010
Source: Eurostat, Labour Force Survey data
Apart from the different share of female employment in the fashion industries, Economix (2009) also highlighted differences between EU15 and NM12 in the occupational change of women over time. Whereas female employees in the fashion industries in the EU15 managed to gradually move towards more skilled jobs over the period 2000-2006 (such as e.g. engineers, computing professionals, business professionals), this shift was far less visible in the NM12.
227 EMCC, 2008; Europe INNOVA, 2010
0,0%
10,0%
20,0%
30,0%
40,0%
50,0%
60,0%
70,0%
80,0%
90,0%
100,0%
Manufacture
of textile
Manufacture
of wearing
apparel
Manufacture
of leather and
related goods
Wholesale
trade
Retail trade Total
economy
EU15
NM12
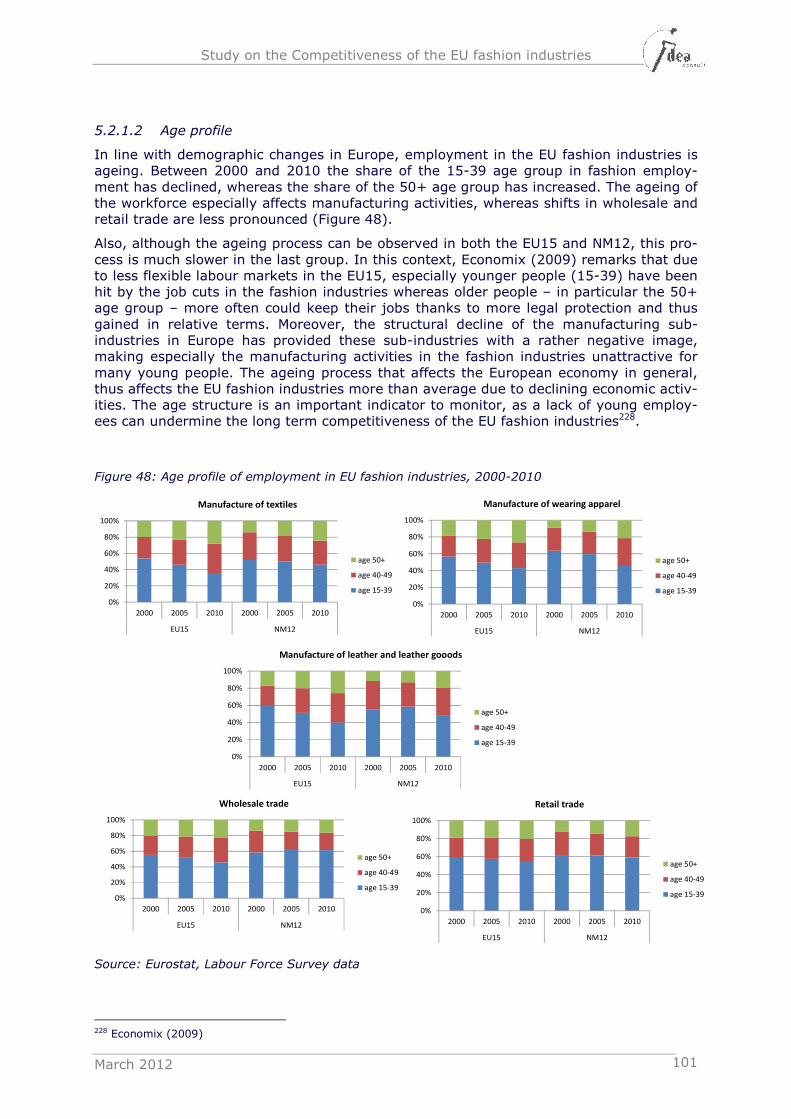
Study on the Competitiveness of the EU fashion industries
March 2012 101
5.2.1.2 Age profile
In line with demographic changes in Europe, employment in the EU fashion industries is ageing. Between 2000 and 2010 the share of the 15-39 age group in fashion employ-ment has declined, whereas the share of the 50+ age group has increased. The ageing of the workforce especially affects manufacturing activities, whereas shifts in wholesale and retail trade are less pronounced (Figure 48).
Also, although the ageing process can be observed in both the EU15 and NM12, this pro-cess is much slower in the last group. In this context, Economix (2009) remarks that due to less flexible labour markets in the EU15, especially younger people (15-39) have been hit by the job cuts in the fashion industries whereas older people – in particular the 50+ age group – more often could keep their jobs thanks to more legal protection and thus gained in relative terms. Moreover, the structural decline of the manufacturing sub-industries in Europe has provided these sub-industries with a rather negative image, making especially the manufacturing activities in the fashion industries unattractive for many young people. The ageing process that affects the European economy in general, thus affects the EU fashion industries more than average due to declining economic activ-ities. The age structure is an important indicator to monitor, as a lack of young employ-ees can undermine the long term competitiveness of the EU fashion industries228.
Figure 48: Age profile of employment in EU fashion industries, 2000-2010
Source: Eurostat, Labour Force Survey data
228 Economix (2009)
0%
20%
40%
60%
80%
100%
2000 2005 2010 2000 2005 2010
EU15 NM12
Manufacture of textiles
age 50+
age 40-49
age 15-39
0%
20%
40%
60%
80%
100%
2000 2005 2010 2000 2005 2010
EU15 NM12
Manufacture of wearing apparel
age 50+
age 40-49
age 15-39
0%
20%
40%
60%
80%
100%
2000 2005 2010 2000 2005 2010
EU15 NM12
Manufacture of leather and leather gooods
age 50+
age 40-49
age 15-39
0%
20%
40%
60%
80%
100%
2000 2005 2010 2000 2005 2010
EU15 NM12
Wholesale trade
age 50+
age 40-49
age 15-39
0%
20%
40%
60%
80%
100%
2000 2005 2010 2000 2005 2010
EU15 NM12
Retail trade
age 50+
age 40-49
age 15-39
Study on the Competitiveness of the EU fashion industries
March 2012 102
5.2.1.3 Level of education in fashion manufacturing
Focusing on the level of education of the workforce in the EU fashion manufacturing, there is a clear difference between the EU15 and the NM12.
Labour Force Survey data from 2006 show that in the EU15 most employees in fashion manufacturing (57.6%) have a low level of education (ISCED 1, 2) and only 33.2% has a medium level of education (ISCED 3, 4)229. Moreover, the share of employees with a low level of education is higher in fashion than in other manufacturing activities. This lower level of education in fashion has been confirmed by more recent data from the UK, where it was found that in fashion and textiles 20% hold no qualifications compared to 10% across the wider economy230.
The picture is rather different in the Eastern European and Baltic countries. In those Member States only 13.1% of the employees have a low level of education, whereas the majority (81.1%) has a medium level of education.
We do remark that this significant difference between both groups of countries can not only be observed in fashion manufacturing, but can be seen throughout all manufacturing activities (Economix, 2009). The large difference in level of education is influenced by country differences in educational systems and a lack of common definition of education-al levels. The higher level of education in the NM12 that we observe in the statistical data however, is not translated into more high-skilled occupations (cfr. next paragraph).
5.2.1.4 Occupational shift in fashion manufacturing
The structural adjustment process that has affected the EU fashion industries – especially fashion manufacturing - is also translated into an occupational shift within the fashion manufacturing industry. Between 2000 and 2006, the share of managers and profession-als increased in the EU15 while production-related occupations decreased together with service and administrative work231. In the Eastern European and Baltic countries on the other hand, especially the number of jobs for skilled production workers and assemblers increased. These shifts reflect the gradual specialization of the EU15 on more knowledge-intensive activities, while the Eastern European and Baltic countries specialize in (stand-ardized) production activities.
229 Economix (2009) 230 Skillset (2011) 231 Economix (2009), based on Eurostat Labour Force Survey Data
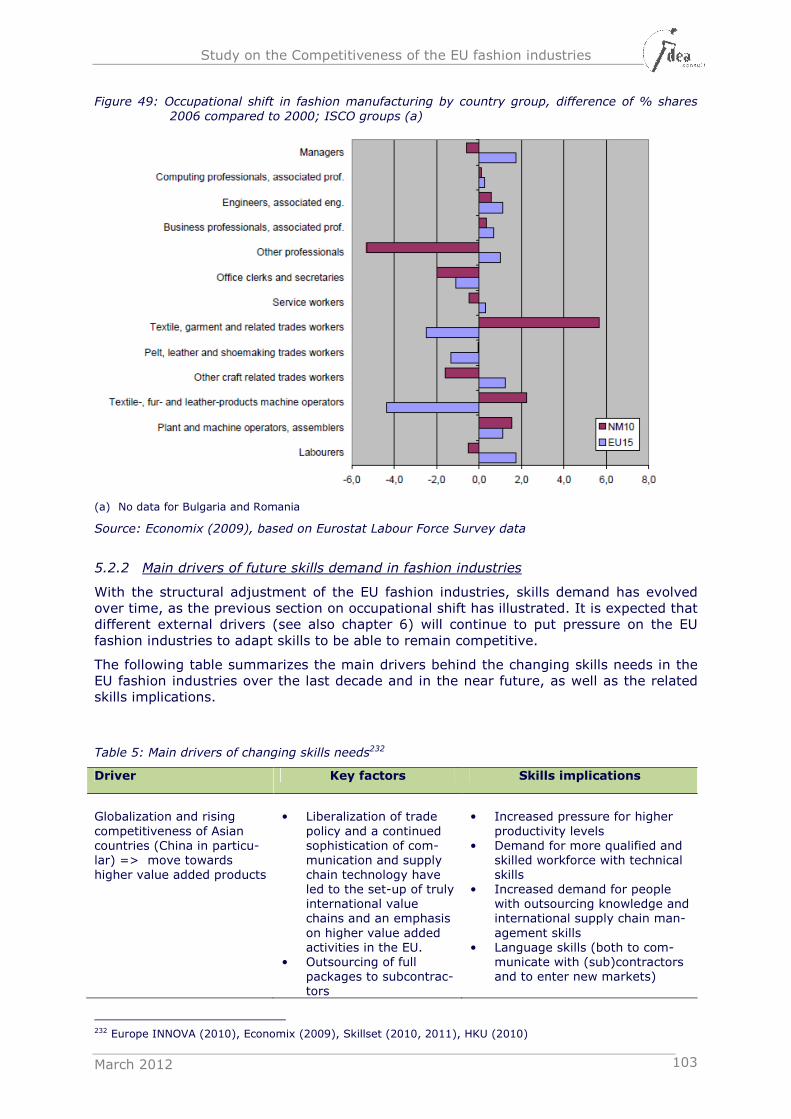
Study on the Competitiveness of the EU fashion industries
March 2012 103
Figure 49: Occupational shift in fashion manufacturing by country group, difference of % shares
2006 compared to 2000; ISCO groups (a)
(a) No data for Bulgaria and Romania
Source: Economix (2009), based on Eurostat Labour Force Survey data
5.2.2 Main drivers of future skills demand in fashion industries
With the structural adjustment of the EU fashion industries, skills demand has evolved over time, as the previous section on occupational shift has illustrated. It is expected that different external drivers (see also chapter 6) will continue to put pressure on the EU fashion industries to adapt skills to be able to remain competitive.
The following table summarizes the main drivers behind the changing skills needs in the EU fashion industries over the last decade and in the near future, as well as the related skills implications.
Table 5: Main drivers of changing skills needs232
Driver Key factors Skills implications
Globalization and rising competitiveness of Asian countries (China in particu-lar) => move towards higher value added products
• Liberalization of trade policy and a continued sophistication of com-munication and supply chain technology have led to the set-up of truly international value chains and an emphasis on higher value added activities in the EU.
• Outsourcing of full packages to subcontrac-tors
• Increased pressure for higher productivity levels
• Demand for more qualified and skilled workforce with technical skills
• Increased demand for people with outsourcing knowledge and international supply chain man-agement skills
• Language skills (both to com-municate with (sub)contractors and to enter new markets)
232 Europe INNOVA (2010), Economix (2009), Skillset (2010, 2011), HKU (2010)
Study on the Competitiveness of the EU fashion industries
March 2012 104
Driver Key factors Skills implications
A redefined sector General decline in manufac-turing activities but also development of new strate-gies (often in specific nich-es), particularly in the man-ufacturing sub-sector.
• Relocation of machine operating and assembling functions
• Increased demand for high-level technical and scientific skills
• A need for individuals capable of developing and commercializ-ing new, innovative products and processes, increased need for marketing skills
New technological advances and digitalization (see also section 6.3)
• Development of new B-to-B technical markets
• (Recent) ICT develop-ments allowing for new production methods or new models of distribu-tion to emerge
• Introduction of new materials into fashion, such as technical tex-tiles
• Challenge for businesses and training providers to keep up with technological advances to ensure that the workforce is appropriately skilled
• Increased demand for high-level technical and scientific skills
• Technology and application ori-ented engineering in specialty textiles
• Managerial skills in open inno-vation setting
• Fashion occupations with a combination of both creative ideas and technical skills
• A growing need for IT skills and multi-platform skills233
Fast fashion (quickly re-sponding to changing con-sumer demands)
Increasing pressures on companies to supply their retail markets and a need to ensure that products are suited to the latest fashions and styles
• Need for individuals that under-stand sourcing, production lead times and consumers, facilitated by good customer facing skills
• Need for creative design skills and flexible and efficient pro-duction practices
• Increased need for CRM (con-sumer relationship manage-ment) skills and marketing skills
The experience economy and changing consumer behavior (see also section 6.2)
Importance of storytelling, the upcoming ‘prosumer’, focus on niche products, increased search for uniqueness
• Increased demand for market-ing and sales skills, brand man-agement skills
• Increased focus on creative and innovative skills
• Increased importance of strate-gic market intelligence
• Growing need for more mana-gerial skills in creative busi-nesses
Sustainable growth objec-tives
Environmental costs and concerns, legislation, the sustainability agenda and ethical standards.
• Increased demand for a diverse set of skills on environmental issues (technological knowledge, legal expertise, product life cycle knowledge)
• Increased need for global moni-toring capabilities across the
233 Multi-platform skills: the creative and technical skills to develop and produce creative content for distribution
across all potential platforms, and the ability to understand and exploit technological advances.
Study on the Competitiveness of the EU fashion industries
March 2012 105
Driver Key factors Skills implications
value chain to safeguard sus-tainable business development (ethical sourcing, environmen-tally friendly production, waste management)
• Innovative and creative individ-uals that can help businesses to effectively respond to these demands
Policy focus on stimulating growth of SMEs
Recognition of important role of SMEs in regional economic growth. Several policy measures to more actively support SMEs to grow and become interna-tionally active
• Growing need for more mana-gerial skills in SMEs
• Increased need for skills to manage the position of SMEs within global value chains
• Increased need for more “hy-brid skills” combining effective leadership with innovation, cre-ativity and understanding of technology, and the analytical skills to understand audience interests and translate it into business intelligence
Finding adequate answers to the shortages and gaps in specific skills that have been identified in Table 5, is a major challenge for the EU fashion industries as these skills can contribute to improving the industry’ productivity and its overall competitive position.
5.2.3 Challenges for EU fashion businesses to respond to (changing) skills needs
The above discussed drivers of changing skills needs have a wide impact on the EU fash-ion industries. They affect both small and large companies, manufacturing and retail companies and include diverse sets of skills as the challenges are wide ranging as well. Having the right skills are at the heart of any industry’s adjustment process, also in the EU fashion industries. To be able to effectively respond to the changing business environment and to exploit the opportunities to strengthen the competitive position, the EU fashion industries have to overcome a number of barriers in the supply of skills. Initiatives to overcome three im-portant barriers relate to:
o Safeguarding and building up essential knowledge and skills in the industry o Promoting entrepreneurship in SMEs o Increasing management skills in creative businesses
5.2.3.1 Safeguarding and building up essential knowledge and skills in the industry
The EU fashion industries – especially fashion manufacturing – face problems in finding the right skills. As already stated in paragraph 5.2.1.2, the industry is confronted with a loss of skills when people retire, particularly traditional and technical skills, and a lack of young people entering the sector. Consequently, some of these skills might not be re-placed and activities that relate to these specific skills could disappear in Europe. Espe-cially the special knowledge and (craftsmen’s) skills in SMEs that currently play an essen-tial role in the competitiveness of the EU fashion industries, is very vulnerable due to a lack of knowledge transfer in many SMEs when entrepreneurs retire or SMEs stop their activities.
Study on the Competitiveness of the EU fashion industries
March 2012 106
To attract new talent, the EU fashion industry needs to improve the image towards po-tential employees. The industry is to some extent an 'invisible' industry. Many potential employees are unaware of the broad range of jobs and careers in the fashion industry (potential new entrants have little knowledge about working in the industry and even less about how to enter), together with a poor perception of parts of the sector234.
Specifically for higher skilled labour, the fashion industries face strong competition from other industries to attract scientists, engineers or other highly skilled workforce. Due to the lower levels of productivity (cfr. section 3.3.2), the fashion industries pay lower wag-es compared to many other high tech manufacturing industries.
Unlike the more technical, operational or high skilled jobs, the more creative jobs (de-sign, marketing) are far less affected by such negative impact. In general, they are not confronted with a shortage of candidate employees willing to work in this type of func-tion. But for the EU fashion industries to remain competitive, creative talent needs to be supplemented by other specialized talent. Initiatives are needed to create awareness about other job opportunities in the industry next to creative jobs.
Recently, the European social partners of the textiles, clothing and leather industries (EURATEX, COTANCE, ETUF:TCL) have taken the initiative to create the first sectoral Eu-ropean Skills Council, with the financial support of the European Commission- Directorate General for Employment and Social Affairs.
Based on a networking of several existing national observatories dedicated to education, training and employment (FORTHAC (FR), COBOT (BE), IVOC (BE), Skillset(UK)) and other key players from these industries (national sectoral organisations, universities, re-search centres, trade unions, etc.) the European TCL Skills Council aims at improving the quality of the European labour force of these industries, and to assist enterprises to be better prepared in meeting changing competitive demand235.
5.2.3.2 Promoting entrepreneurship in SMEs
As highlighted in the analysis of the industry’s structure in section 3.2, SMEs are the backbone of the EU fashion industries. A large majority of these SMEs are enterprises with less than 10 employees. As entry barriers are low in most fashion sub-industries, it is relatively easy to start a fashion business. However, many enterprises are run by peo-ple with limited or no education or training in entrepreneurship. They often lack manage-rial and leadership skills, have limited or no knowledge about innovation or their potential position in (global) fashion value chains.
For SMEs to be the growth engine of the EU economy, the European Commission has already taken several measures to support SMEs in their further development (cfr. EC Small Business Act). However, continued efforts are needed to reach all SMEs and to cre-ate sufficient awareness of the importance of entrepreneurship, innovation and interna-tionalization for growth, and how it can be translated into the daily business. Knowledge and training organizations, coaching and networking organizations can play an important role to create awareness and provide specific training.
5.2.3.3 Increasing management skills in creative businesses
As the EC underlined in the Green Paper on Cultural and Creative Industries (CCI)236, creativity and innovation are at the centre of a new economic growth model and cultural and creative industries still have a lot of untapped potential to create jobs and growth in Europe. To consolidate its competitive position, also the EU fashion industries must ex-
234 Skillset (2011) 235 See also www.europeanskillscouncil.t-c-l.eu 236 European Commission (2010b)
Study on the Competitiveness of the EU fashion industries
March 2012 107
plore new ways of creating value-added, building on the strengths of the EU cultural and creative industries. European creativity and design in fashion is unique in the world and highly praised internationally.
However, for creative companies to play the role that policy makers envisage, the Green Paper identifies a number of challenges with respect to the further development of crea-tive companies. One of these challenges specifically relates to skills. Different studies have identified a lack of managerial and commercial skills, e-skills and financial skills to mobilise potential investors, as a barrier to fully exploit the potential of CCIs in Europe (e.g. HKU (2010), Skillset (2010), Guiette et al. (2011)). Many educational programmes for fashion design across Europe have a very strong (international) reputation when it comes to developing creative skills. However, topics such as entrepreneurship or financial management can hardly be found in the curriculum of arts schools. Conversely, only few business schools offer specific management programmes directed towards creative en-trepreneurs.
Unless specific actions are implemented, there is the risk that skills shortages, mis-matches and gaps will prevent Europe from using the full potential of CCIs237. As the ma-jority of creative businesses are also SMEs (often even micro enterprises), initiatives to increase management skills in creative fashion companies should be aligned to measures to support entrepreneurship in fashion SMEs.
5.3 Access to finance
Access to finance is a key determinant for the start-up, development and growth of busi-nesses in the fashion industry (as for any business). Access to finance requires a bank, business angel or other type of investor who is willing to take the risk to financially sup-port the business in exchange for financial reward later on. Potential investors depend their investment decision on a risk assessment of the specific investment project, gener-ally taking into account different elements such as management profile and experience, sector, company size, assets or sales.
5.3.1 Potential market failure
A number of characteristics that relate to the fashion industries result in potentially re-duced access to finance for many businesses in the industry.
A first element relates to the average size of enterprises in the EU fashion industries. The quantitative analysis has shown that the industry is predominantly populated with micro enterprises, i.e. enterprises with less than 10 employees or even sole proprietors. Different studies already have underlined the vulnerability of SMEs in obtaining sufficient financing to invest in innovation and growth (e.g. OECD (2006)238, ECB (2011)239). SMEs tend by their very nature to show a far more volatile pattern of growth and earnings, with greater fluctuations, than larger companies. Their survival rate is lower than for larger companies. Banks and other traditional sources of credit may decide that SMEs represent a greater risk than larger companies, and respond by charging higher interest rates (OECD, 2006). The OECD does remark that the problem of access to finance for SMEs in general should not be overestimated. As OECD countries have competitive finan-cial markets, banks perceive SME finance as an attractive line of business and are devel-oping, or have developed, effective techniques to deal with them. They are replacing their traditional risk assessment models with new techniques to distinguish high- and low-risk SME borrowers, and to identify those likely to expand and survive. A particular group of SMEs that does face particular problems when attempting to access financing in most OECD countries, are innovative SMEs as they mostly represent a higher risk than traditional SMEs or large firms.
237 European Commission (2010b) 238 OECD (2006) 239 ECB (2011)
Study on the Competitiveness of the EU fashion industries
March 2012 108
Another element that negatively influences the willingness to invest is the type of activ-ity in which fashion businesses are active. Especially those enterprises being active in fashion design are considered to have an above average risk profile, due to two specific characteristics of their business: high uncertainty about the demand for their products and services, and lack of business assets. Their business shows a number of similarities with innovative companies. But contrary to innovative businesses in technological fields, the immaterial assets of CCIs have no recognised value in balance sheets and their in-vestments in developing new talents and creative ideas are not in line with the standard concept of “research and development”. Similar to other parts of the cultural and creative industries (CCI)240, fashion design companies are confronted with two specific types of market failure with respect to access to finance (Caves, 2000) 241:
• Problem of adverse selection: with banks and other investors being risk averse, high uncertainty about the business success and economic valuation of the crea-tive process potentially leads to underinvestment in fashion design companies
• Problem of moral hazard: this problem arises when the interests of the entrepre-neur are not aligned to the interests of the investor. Many investors fear that cre-ative business owners are more motivated by the creative process than by inves-tor targets242
According to Tooth (2010) some fundamental issues that investors consider while invest-ing in creative businesses, are:
• The entrepreneur and management team: The quality of the team who is running the business is critical for any investor. But often the creative individual or group lack strategic management, finance and marketing skills or experience to successfully manage the growth of the business (see also section 5.2 on skills).
• Capacity to present the investment opportunity to investors: Due to the lack of management and marketing skills, creative entrepreneurs often are unable to sufficiently present their business proposition and investment opportunities to investors.
• Relevant Business Model: (Creative) entrepreneurs often lack a business plan that provides investors with solid information about revenue generation or turno-ver, to provide sufficient assurance of loan/debt repayment. For many creative businesses, especially those in the services areas such as fashion design, the business model for revenue generation and sales is frequently complex making them very difficult to value for investment.
• Scalability and Valuation: Many creative businesses (as well as SMEs in gen-eral) fail access to industry or market intelligence about other similar businesses or sector trends or to monitor their competitors as reference points. However, this is critical information to support the investment proposal.
• Intellectual Property Protection: Understanding IP and how to protect your business is a core requirement of any access to finance support scheme. We refer to section 6 for further discussion of the IPR issues in the context of the fashion industries. In light of attracting external investors, legal and financial advice may be necessary to sufficiently protect IP and select the right corporate structure that provides sufficient security to potential investors and is tax efficient.
5.3.2 Impact on EU fashion businesses
A direct consequence of the market failure is that investors either refrain from investing or are more likely to ask for collateral. Fraser and Lomax (2011) found that the availabil-ity of collateral is a greater issue for access to finance among creative businesses than in non-creative businesses. They also found that due to the ever returning uncertainty
240 See KEA (2006), European Commission (2010b) 241 Caves (2000) 242 Fraser and Lomax (2011)
Study on the Competitiveness of the EU fashion industries
March 2012 109
about the market success of new creative products (such as a new fashion collection), longer financial relationships did not reduce the likelihood of rejecting investment pro-posals in the same way as it did in other industries. Investors do not see past success as an indicator for future success in creative businesses as they do in non-creative busi-nesses. Looking at the different business types in the fashion industry (see chapter 3.4), all companies in the fashion industries can be affected by limited access to finance given the nature of the activities and the related potential market failure (cfr. above). But es-pecially SMEs and fashion design companies whose main assets are intangible are vul-nerable for limited access to finance.
Whereas access to finance already was a problem for the EU fashion industries before 2008, one effect of the financial and economic crisis is an even reduced access to fi-nance, especially for SMEs. For each of the manufacturing industries within the fashion industries (leather tanning and leather goods, footwear, textiles, apparel and accesso-ries) the EC has forecasted a reduced access to credit in its 2009 sectoral overview243.
Specifically for creative businesses, Fraser and Lomax (2011) did find that in the UK in-vestors were significantly more risk averse towards creative businesses than non-creative businesses at the beginning of the financial crisis (2008). However, the difference be-tween both disappeared as of 2009 when all businesses were confronted with reduced access to credit.
5.3.3 (Policy) initiatives to facilitate access to finance
At the European level one of the key priorities set out in the Europe 2020 strategy, as well as in the Commission's Single Market Act and the Small Business Act is to facilitate access to finance for SMEs. In December 2011, the EC has presented its Action Plan to improve access to finance for SMEs which contains various policies that it is pursuing to facilitate access to finance for SMEs in the EU. Also several Member States have taken initiatives to facilitate access to finance for SMEs as well as for creative businesses (e.g. Cultuurinvest and St’Art - Belgium, European Venture Fund for CI – Finland) 244. At sector level, in Italy specific sectoral “credit assurance” systems exist (called ‘Confidi’ – Consorzi di garanzia collettiva fidi) that help member firms to get access to credit. The confidi sets up a collective loan guarantee fund with contributions of member firms which can be used towards banks when member firms need guarantees to get access to credit. An ex-ample of such confidi can be found in the Italian leather industry.
Different studies245 underline that to overcome the problem of access to finance, it is not sufficient to improve only the supply of finance. Additional initiatives should be taken to make both fashion companies and investors more “investment ready”. On the supply side, this means that investors build up sufficient industry intelligence about the fashion industries and investment opportunities, as well as about valuation techniques to better assess investment risks. On the demand side, Tooth (2010) highlights that there are a wide range of investment readiness schemes to provide support to businesses (e.g. in business plan writing). Most of these schemes are more generic business support schemes, not specifically focused on the fashion industries. A few dedicated investment readiness schemes do exist for creative businesses in several Member States, which also focus on fashion businesses (e.g. Creative Business Accelerator (UK))246.
243 European Commission (2009) 244 See Tooth (2010), Annex 2 for more examples. These ‘creative industries’ specific funds possess the sector
specific knowledge to assess the investment risks more adequately. The investor is more “investment ready”, see next paragraph. Ideally, they also provide support to the creative businesses in making them more “investment ready”.
245 See e.g. Fraser and Lomax (2011), Tooth (2010) 246 See Tooth (2010), Annex 1
Study on the Competitiveness of the EU fashion industries
March 2012 110
6 EXTERNAL DRIVERS INFLUENCING THE COMPETITIVE-
NESS OF THE EU FASHION INDUSTRIES
Whereas the previous chapter focused on the main internal drivers that contribute to the performance of the EU fashion industries, this chapter discussed a number of trends in the business environment that can be considered external to the operations of enterpris-es in the fashion industries, but nonetheless have an impact on the competitiveness of the industry. We will discuss access to new markets, changes in consumer behaviour, technological developments impacting the fashion business, sustainable development, access to raw materials and counterfeiting and IPR issues. The external drivers can pose either an opportunity or a threat for the competitiveness of the EU fashion industries (cfr. section 1.2).
6.1 Access to new markets and trade policy
6.1.1 Emerging consumer markets for fashion goods
As illustrated in the previous sections, globalisation has influenced the fashion industries profoundly over the last four decades. Being a labour-intensive industry, the manufacture of apparel has been one of the first industries to make use of global restructuring to take advantage of international differences in labour cost. And also the other segments of the fashion sector reflect this trend. Until now, the dominant model of geographical division of activities has been one where design and retail are concentrated in developed coun-tries whereas manufacturing (for consumer markets in developed countries) takes place in low cost countries.
But with rising income levels in countries such as China, India, Russia or Brazil, consum-er markets for fashion goods are no longer uniquely concentrated in the economic “triad” (i.e. US, Japan, Europe). Many emerging countries have changed their status within the fashion industries from ‘low-cost manufacturing location’ to ‘consumer markets with high growth potential’. The development of new markets for fashion has been mainly driven by increasing demand for luxury fashion247 (see also Box 7).
Box 7: China’s demand for fur important driver of price increases
From 2006-7 to 2010-2011, the average price for mink pelts at Kopenhagen Fur, the world’s largest fur auction house, increased from 240DKK (€32.29) to 401DKK (€53.95). Saga Furs, another major European fur auction based in Finland, has seen sales increase from €297 million in 2004/5 to €594.7 million in 2010/11.248 According the International Fur Trade Association, this increase is the direct result of the rise in the popularity of furs in emerging markets, and particularly China. According the IFTU, about one third of Danish exports to China currently consists of mink skins, despite the Chinese duty of 15 percent of raw mink pelts.
Access to these emerging markets is strategically important for the EU clothing industry given that these are highly quality-conscious markets where EU has the highest compar-ative advantage249.
For the EU fashion industries to be able to compete on these new emerging markets, issues such as the need for understanding of cultures and consumers in these third coun-
247 Bruce and Kratz (2007) 248 As reported by the International Fur Trade Federation (IFTF) 249 http://ec.europa.eu/enterprise/sectors/textiles/external-dimension/trade-issues/index_en.htm - European
Commission: Textiles and Clothing Trade Issues
Study on the Competitiveness of the EU fashion industries
March 2012 111
try markets are important. Box 8 below describes shortly the growth of the fashion in-dustries and consumer characteristics in each of the BRIC countries, namely China, India, Russia and Brazil. Although there are several other emerging markets, such as those in the Middle East, South East Asia and in the countries surrounding EU, BRIC countries are important for the fashion industry given their large and young populations and significant economic growth. BRIC countries also provide a good example of the impact of cultural differences and consumer approaches on fashion.
Box 8: Characteristics of apparel markets in the BRIC countries250
China
With a population of 1.3 billion (2011) and an annual economic growth of 10.3 per cent (2010), China has become one of the largest markets in the world. Globalization together with increasing incomes and changing consumption habits has led China to become the second largest apparel market in the world with a value of 110 billion USD in 2009. The Chinese apparel market is also the fastest growing apparel market within BRIC countries - during the past five years the apparel market has grown by 16 per cent and is projected to continue growing at the rate of 11 per cent during the coming years. The growth is fastest in the luxury/high-end product market where spending on apparel has been estimated to grow by 30 per cent annually.
Traditionally Chinese consumers have been wearing very similar outfits to all occasions, which have limited their interest in niche fashion categories. However during the past years fashion has been shifting towards a more occasion-based dressing where clothes are chosen differently for work, social occasion and home which has led to a sharp increase in the sales of the casual wear segment. The fashion market is driven by young consumers with preference towards up-scale casual and sportswear. Chinese consumers are increasingly aware of foreign brands, yet they have low brand loyalty and only a quarter believe foreign brands to be superior to local ones in terms of their value/quality. Instead Chinese consumers are highly price conscious and base their buying decisions as well as valuations of quality on the price of the product. Chinese consumers are also found to value promotions and quality/design of products more than customer service or store layout.
Department stores are the most successful format of retail in China and account for 30 per cent of the apparel sold. However all forms of retail, ranging from flagship stores, street boutiques, stores-in-stores, department store counters, franchising and online shops, are present in China and address different consumer needs.
India
Similarly to China, India’s economic growth reached 10.4 per cent (2010) and it had a growing population of 1.2 billion (2011). The apparel market represents 10 per cent of India’s total retail market and was estimated to have a total value of 25 billion USD in 2010. The apparel market has been growing by more than 10 per cent over the last five years which is more than the growth of other retail sectors. The luxury segment has been estimated to grow by 30-32 per cent. The growth is expected to continue over the coming years and the market is likely to nearly double by 2015.
250 McKinsey (2007); Mishra (2010); McKinsey report: “From Mao to Wow: Winning in China's booming apparel market”, http://csi.mckinsey.com/Knowledge_by_region/Asia/China/chinaapparel; McKinsey report: “India’s fast-growing apparel market”, http://csi.mckinsey.com/Home/Knowledge_by_region/Asia/India/Indias_fast_growing_apparel_market.aspx; McKinsey report: “Dress for success: Cracking Russia’s apparel market” http://csi.mckinsey.com/Home/Knowledge_by_region/Europe_Africa_Middle_East/Cracking_Russian_apparel_market.aspx; CIA World Factbook India/China
Study on the Competitiveness of the EU fashion industries
March 2012 112
(continue)
Mostly the growth of the Indian apparel market has been attributed on the rising income levels, increasing variety of clothing suitable for different occasions, growth in women’s clothing segment and increasing fashion sense of Indian consumers (inspired by television, films and internet) and their desire to express themselves through clothing. In addition, the market is expected to grow, as in the coming 20 years India’s urban population is expected to grow by 300 million. Most of these new urban citizens are young and thus more likely to consume more on fashion that fits with their urban lifestyle. Another key factor is growth of organized retailing. In 2010 the apparel market was still dominated by small family-run shops and only 20 per cent of products was bought from organized retailers. Over the past few years shopping malls have opened in the largest cities and the trend is likely to continue. Discounters, international franchises, hypermarkets, and luxury European boutiques are new arrivals in the Indian market. Large European retailers such as Zara are only just entering the Indian apparel market.
A distinct feature of Indian fashion consumption is that most new items are bought for special occasions such as weddings. Most Indian’s always do their shopping with family and consider it as the best way to spend time together. Although women usually choose the items bought, men choose the store which will be visited. Thus retailers in India have to consider the demand for clothing suitable for the special occasions but they must also make the shopping experience suita-ble for the entire family. Indians are also considered to be one of the world’s most brand con-scious consumers.
Russia
By the end of 2011 the Russian apparel market has been estimated to be worth 50 billion USD. The market has been hit by the global economic downturn and therefore growth has been modest since 2008. However, the market has been estimated to grow by 8 per cent per year until 2015. The growth is slightly more than that of income growth. The fastest growing segments are men’s and children’s clothes. Also, the majority of consumers are interested in premium brands. Howev-er, most sales come from the mid-market items.
Overall, Russian retail is still relatively limited and still in 2011, 45 per cent of apparel was sold in open-air markets and 26 per cent in old-fashioned department stores. However, both forms of retail are showing signs of decline with increasing demand for more sophisticated and modern retail options. Single-brand clothing, footwear and accessories chains have been estimated to grow by 15 per cent annually. The top 10 apparel retailers account for 7 per cent of Russia’s ap-parel sales.
Russian consumers have traditionally been prioritizing quality over other product characteristics. Although Russians have a relatively good knowledge of brands, most consumers state that brands do not affect their buying decision. This can be partly due to high prevalence of counterfeit apparel sold in the Russian market.
Brazil
In 2010, Brazil’s textile and apparel chains earned 52 billion USD which was approximately 10 per cent more than in 2009. It has been estimated that the apparel market will continue to grow by 7 per cent annually. Although some multinational retailers, such as Zara and Mango, have entered the Brazilian market, in general very few international chains are competing in the mass market which is dominated by local shops and large single-format retailers.
Brazilian consumers are keen on fashion trends but their product demands differ to some extent from those of western markets and there is a strong preference for local fashion. Fashion trends are strongly determined by local (television) celebrities which makes it easier for local retailers to provide mass market segments with these products. 81 per cent of Brazilian consumers were found to state that they trust local brands and only 11 per cent agreed that foreign brands provide higher quality than local brands. Brazilian consumers were also more willing to buy apparel with credit than consumers in other BRIC countries. Due to underdeveloped credit systems many re-tailers were offering their own credit cards either through their own financial operations or jointly with banks. Brazilian retailers also use attractive credit offerings as a marketing/promotion strate-gy.
Study on the Competitiveness of the EU fashion industries
March 2012 113
In addition to having significant cultural differences which may have an impact on the valuation and demand by local consumers of various fashion items, many emerging countries have a growing middle class which has stimulated the development of domestic fashion industries that are able to become trendsetters themselves. In countries such as Brazil, consumers have a clear preference for local brands which gives them a competi-tive advantage, whereas for example in China the government has made an investment plan for the textile and apparel industry which includes providing funds to encourage do-mestic companies to focus on domestic demand and on the cultivation of domestic brands that may be exported in the future. Some of the domestic companies from emerging markets have indeed been internationally successful and have already expand-ed globally. In addition to benefiting from consumer (or government) preferences, do-mestic competitors in many countries have a cost advantage over their foreign counter-parts and are quickly learning marketing techniques from foreign retailers251.
6.1.2 Market access and trade barriers
In 2010 European Union was the second largest exporter of textiles and clothing as well as footwear252. However, EU’s access to several of the developing and emerging markets is limited by both tariff barriers and non-tariff barriers and measures (NTMs/NTBs). For years textile and clothing sector has been excluded from the general trend of trade liber-alization in several countries. During the past years, progress with regards to trade barri-ers has been made but several issues still remain253.
Tariff barriers, which can be defined as a tax for imports or exports, are one of the main forms of trade barriers. Although the trend has been decreasing over years, tariff barriers still disrupt trade in several major markets and in some markets are even increasing. Between the emerging markets large differences exist between the amount of tariffs for various sectors related to fashion. For example in India tariffs for textiles, clothing, foot-wear, leather and several skins have been decreasing for several years and in 2008 the average ad valorem tariff was between zero and 10 percent depending on the product254. On the other hand, in Brazil, the government decided on a tariff increase for imports of textiles and footwear in 2007255. In 2011, the average tariffs for a number of women’s, men’s and children’s clothing items as well as footwear products reached 35 percent256. The impact of the respective tariff increase for the European exporters is considered sig-nificant both in terms of lost opportunities as well as additional costs257. Similarly, in Chi-na, the overall average high tariffs and tariff peaks for textiles and clothing are reducing the competitiveness of European exporters, especially in certain luxury items, apparel and footwear258. Given the significance of tariff barriers for the European exports, the EU has proposed a compression mechanism under the Doha negotiations in the WTO which aims in eliminating tariff peaks and high tariffs, and significantly reducing tariff escala-tion. The proposal pays special attention to the clothing and textiles sectors where tariffs in all WTO Member countries are proposed to be compressed as close to zero as possi-ble259. Although the Doha negotiations have not been moving forward over the past
251 Frederick and Gereffi (2009); Vincent (2007) 252 European Commission (http://ec.europa.eu/trade/creating-opportunities/economic-sectors/industrial-
goods/textiles-and-footwear/) 253 European Commission (http://ec.europa.eu/enterprise/sectors/textiles/external-dimension/trade-
issues/index_en.htm) 254 World Trade Organisation , for detailed tariff information see
http://tariffdata.wto.org/ReportersAndProducts.aspx 255 European Commission, Market Access Database
(http://madb.europa.eu/madb_barriers/barriers_details.htm?barrier_id=085175&version=2) 256 World Trade Organisation, for detailed tariff information see
http://tariffdata.wto.org/ReportersAndProducts.aspx 257 European Commission, Market Access Database
(http://madb.europa.eu/madb_barriers/barriers_details.htm?barrier_id=085175&version=2) 258 European Commission, Market Access Database
(http://madb.europa.eu/madb_barriers/barriers_details.htm?barrier_id=960019&version=2) 259 European Commission (http://ec.europa.eu/trade/creating-opportunities/trade-topics/european-
competitiveness/tariff-barriers/)
Study on the Competitiveness of the EU fashion industries
March 2012 114
years, and the EU has to find other (additional) ways to address these barriers, this pro-posal provides an indication of the importance of these barriers to the EU.
In addition to tariff measures, a significant issue limiting the entry of the EU fashion in-dustry into the markets of emerging and developing countries is the growing presence of non-tariff measures and barriers (NTMs/NTBs) which can be defined as any measure oth-er than tariffs that distort trade. The entry of the European textile and clothing industry into many export markets has been found to be limited by the existence of various NTBs which can undermine reductions in tariffs that have been agreed upon over the past dec-ades.260 NTBs cause a significant disincentive especially for small and medium size enter-prises to take part in international trade261. According to EURATEX most damageable measures limiting market access for the European textile and clothing industry include additional tariffs and taxes, intellectual property right issues, custom documentation and certification and technical barriers. In addition, especially SMEs were suffering from com-plex labelling requirements, time consuming customs clearance, pre- and post-shipment inspections and security checks, restrictions to distribution as well as export restrictions. Priority export markets where tariffs and non-tariff measures were found to cause hur-dles for the EU textile and clothing industry include the BRIC countries as well as Mexico and the US. Non-tariff measures were found to hamper EU’s export development in In-donesia, Malaysia, Argentina, Egypt, Pakistan, South-Africa, South-Korea, Taiwan and Thailand262.
Frederick and Gereffi (2009) further argue that in addition to trade procedures, non-tariff barriers may come in the form of lack of social and environmental compliance, or non-compliance with the GSP, and the Government Procurement Agreement. Social and envi-ronmental compliance refers to a situation where a country relaxes or does not comply with the common regulations and therefore reduces costs for domestic operators. Alt-hough GSP and Government Procurement Agreement have been designed to encourage international trade, they have mechanisms which can be used to promote domestic con-sumption and thus need to be monitored. It has been found that in recent years trade protection has been shifting from the developed to developing countries. It has also been pointed out that protection is moving away from apparel and more towards textiles and raw materials. In general Frederick and Gereffi found no significant upward trend for non-tariff measures especially in comparison to the total amount of trade protection ac-tivities263.
Within the context of textile and clothing trade the European Commission has empha-sised harmonisation and more transparency on barriers such as regulatory issues, label-ling, certification of conformity procedures, export restrictions, importers' registration and complex taxation systems264. Often these requirements are presented as methods to protect and inform consumers. However they cause delays and increase the financial burden for the European exporters. Especially in the emerging markets such as India, China and Brazil, European exports are not considered competitive and high duties fur-ther decrease their attractiveness for the local consumers. In addition, entry of the Euro-pean companies to some emerging markets have been complicated through direct limita-tions to investments in establishing retail outlets or distribution services. In some coun-tries entry to market is conditional on setting up a joint venture with a local partner265. More recently, there has been attention to the access of raw materials. Especially the leather goods sector is widely affected by export taxes and export restrictions,266 but
260 European Commission: Industrial Goods, Textiles and Footwear - http://ec.europa.eu/trade/creating-
opportunities/economic-sectors/industrial-goods/textiles-and-footwear/; European Apparel and Textile Or-ganisation (2005)
261 http://ec.europa.eu/enterprise/sectors/textiles/external-dimension/trade-issues/index_en.htm - European Commission: Textiles and Clothing Trade Issues
262 European Apparel and Textile Organisation (2005) 263 Frederick and Gereffi (2009) 264 European Commission (2011); http://ec.europa.eu/enterprise/sectors/textiles/external-dimension/trade-
issues/index_en.htm - European Commission: Textiles and Clothing Trade Issues 265 European Commission (2011) 266 Kim (2010) finds that products made of leather, hide and skin is one of the sectors in which export re-
strictions are particularly prevalent.
Study on the Competitiveness of the EU fashion industries
March 2012 115
there have also been examples of export restrictions on raw cotton and cotton yarn267. The restrictions range from export duties, to licenses and even total export bans, and reduce the supply (and thus increase prices) of intermediate products in the fashion in-dustry. According to COTANCE, almost 50 percent of world production of raw hides and skins was subject to this kind of export restrictions.
One of the largest issues for the EU industry is the violation of Intellectual Property Rights. It has been estimated that the share of fake products in global trade amounts to 8 percent.268 In a number of countries access to enforcement measures, such as effective remedies or criminal sanctions has remained limited despite the fact that copying of fash-ion items remains a common practice. Illegal copying is especially an issue for high-end products of which the value in emerging markets decreases as the availability of cheaper copies increases269. Intellectual property rights are also an issue with products under ge-ographic indicator classification which includes product traditional for a certain location, such as Cashmere for Mongolia270. It is important to note that non-tariff barriers can take a variety of forms which can be country and fashion segment specific. For example in India, the entry of luxury fashion companies to the market has been limited due to a lack of store space suitable for their image. The rents were also found to be disproportionally high.271
Market access has become a priority in the European Community trade policy for the tex-tile and clothing sector, as well as the footwear sector. The aim is to establish trade rela-tions which work in both directions. In order for a country to gain more access to the EU market it must be willing to liberalise its own market. The European Union monitors the policies and practices of its trading partners to ensure compliance with the requirements. The European Union has also committed itself to anti-dumping and anti-subsidy policies which comply with the rules and disciplines of world trade and expects the same from its partners272. Overcoming the high duties and other charges in key markets, such as India and Brazil, is of primary importance for the European Union. As there are a number of non-tariff barriers which can be country specific, the EU applies multiple and adaptable trade tools, such as dialogues, negotiations, markets access tools and enforcement pro-cedures. The first forum for the EU to tackle trade barriers are multilateral negotiations which are done in the framework of the Doha Development Agenda (DDA). In addition to the multilateral level, bilateral trade negotiations are one of the key trade tools. The Eu-ropean Union’s Market Access Strategy is an alternative offensive trade approach for ad-dressing trade related problems in the framework of the on-going dialogue.273 The strat-egy provides tools for regular monitoring and supports information exchange between Commission, Member States and business. Market Access Teams which are trade diplo-matic networks that have been created in order to target specific non-tariff barriers in third countries play a key role in the Market Access Strategy and provide assistance for addressing ad hoc issues in the short term through the means of soft policy tools274. Un-der this Market Access Strategy, there are also working groups on specific sectors, in which business, member states and the EC work together with the aim to reduce or re-move these barriers. In 2009, a working group for textiles started, and in 2010 a working group for leather was initiated. This shows that the EC aims to tackle the trade barriers to the EU fashion exports from various sides.
267 In the second half of 2010, India imposed restrictions of cotton exports to protect its domestic textile indus-
try from rising raw material prices. The restrictions were lifted again in the summer of 2011, http://www.fibre2fashion.com/news/textile-news/newsdetails.aspx?News_id=101566
268 http://ec.europa.eu/enterprise/sectors/textiles/external-dimension/trade-issues/index_en.htm - European Commission: Textiles and Clothing Trade Issues
269 European Commission (2011) 270 Rangnekar (2004) 271 Mishra (2010) 272 http://ec.europa.eu/enterprise/sectors/textiles/external-dimension/trade-issues/index_en.htm - European
Commission: Textiles and Clothing Trade Issues 273 European Commission (2011) 274 Tiedemann (2009); European Commission (2011)
Study on the Competitiveness of the EU fashion industries
March 2012 116
6.1.3 Impact on fashion businesses
The fashion industry has expanded its business outside the EU over the last decades and would thus benefit from increased market access. Exports or foreign direct investments take place in nearly all business models. It is for example not only the luxury brands that sell their products in places like Dubai, but also vertically integrated retailers like H&M, that have opened up stores outside the EU. Mainly larger brands/companies seek to ex-pand their business outside the EU, although some niche products or players may also export outside the EU.
6.2 Changing consumer behaviour
Being active in the consumer goods market, it is very important for fashion businesses to closely monitor consumer trends to remain competitive. Changes in consumer behaviour have to be taken into consideration when evaluating existing or setting up new business strategies. Changing consumer trends point to falling and rising demand for existing products and services but also new demand that creates new business opportunities. Factors influencing consumption patterns include gender, age, ethnicity and income level. Consumers may choose products and services based on considerations such as conven-ience, value for money or pleasure.
According to EMCC (2008) changes in the constellation of the consumer base will lead to a new type of average fashion consumer. Recent evolutions that significantly affect the consumer base for the EU fashion industries are:
• Demographic change in Europe: Europe faces a declining birth rate in combi-nation with improved health. European population (and thus the European con-sumer base) is reducing in size and at the same time growing older.
• Increased purchasing power: The purchasing power of especially young people has significantly increased over time. Young people also have become more ac-tively involved in families’ buying decisions.
• New upcoming markets: Referring to the previous section, stable economic growth in several large markets provides a growing potential consumer base for EU fashion enterprises.
Besides the changes in constellation, there are also more general changes in the behav-iour of the fashion consumer base. Globalization, fiercer competition, decreasing search costs and increased purchasing power provide consumers with more options to explore different fashion segments and to optimize the purchasing process. As a consequence, over time, the fashion consumer has acquired a more central and determining position. The following trends in consumer behaviour have already had and most likely will have further impact on the EU fashion industries:
• From functionality to experiences
• The consumer as ‘prosumer’
6.2.1 From functionality to experiences
In the current “experience economy” (see also section 2.2.3), the buying process for many goods has shifted from functional buying to buying lifestyles. The experience econ-omy is one of the strongest forces behind the booming fashion and personal luxury goods industries. Fashion goods are perceived as lifestyle goods, similar to other personal luxu-ry goods such as mobile phones, travel or home furniture: “you are what you wear”. Moreover, with raising income levels in many consumer markets, especially young people spend increasing amounts to fashion goods to create their own “unique” personal identi-ty. Fashion goods create a wordless means of communication to identify to which social group one belongs. The symbolic value of fashion is so high that it keeps people buying even when they do not have a need (Tran, 2008). It is an evolution from status symbols
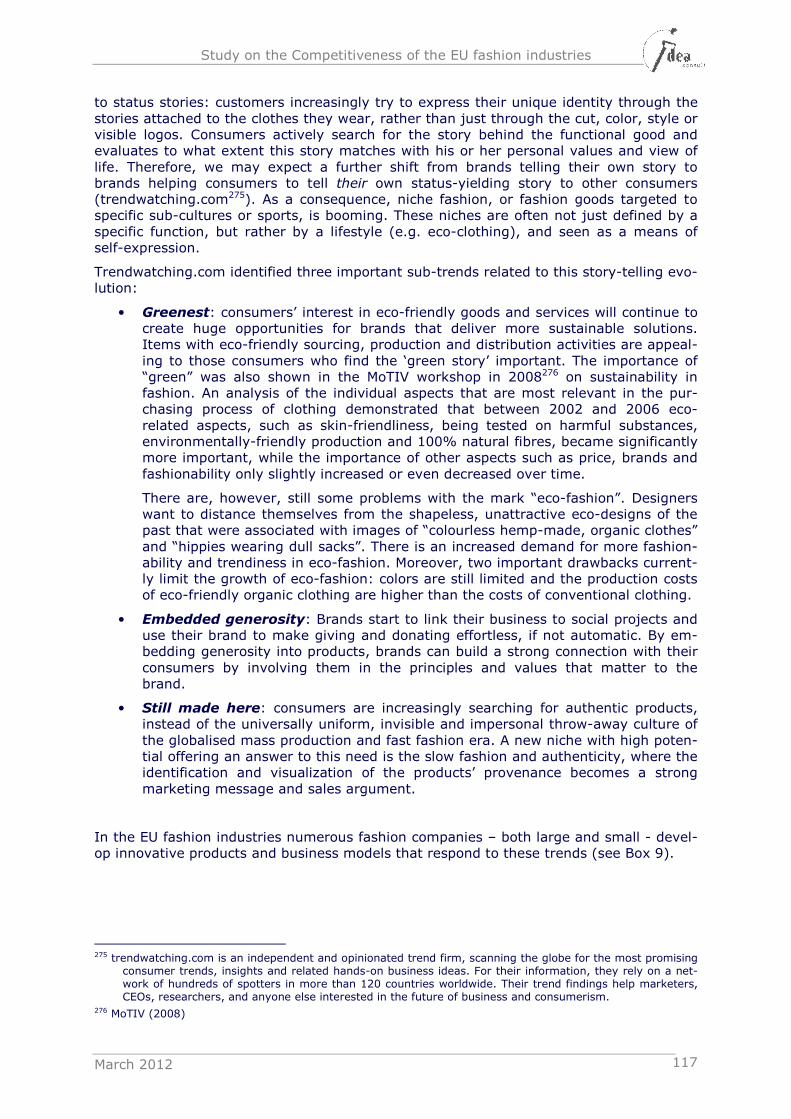
Study on the Competitiveness of the EU fashion industries
March 2012 117
to status stories: customers increasingly try to express their unique identity through the stories attached to the clothes they wear, rather than just through the cut, color, style or visible logos. Consumers actively search for the story behind the functional good and evaluates to what extent this story matches with his or her personal values and view of life. Therefore, we may expect a further shift from brands telling their own story to brands helping consumers to tell their own status-yielding story to other consumers (trendwatching.com275). As a consequence, niche fashion, or fashion goods targeted to specific sub-cultures or sports, is booming. These niches are often not just defined by a specific function, but rather by a lifestyle (e.g. eco-clothing), and seen as a means of self-expression.
Trendwatching.com identified three important sub-trends related to this story-telling evo-lution:
• Greenest: consumers’ interest in eco-friendly goods and services will continue to create huge opportunities for brands that deliver more sustainable solutions. Items with eco-friendly sourcing, production and distribution activities are appeal-ing to those consumers who find the ‘green story’ important. The importance of “green” was also shown in the MoTIV workshop in 2008276 on sustainability in fashion. An analysis of the individual aspects that are most relevant in the pur-chasing process of clothing demonstrated that between 2002 and 2006 eco-related aspects, such as skin-friendliness, being tested on harmful substances, environmentally-friendly production and 100% natural fibres, became significantly more important, while the importance of other aspects such as price, brands and fashionability only slightly increased or even decreased over time.
There are, however, still some problems with the mark “eco-fashion”. Designers want to distance themselves from the shapeless, unattractive eco-designs of the past that were associated with images of “colourless hemp-made, organic clothes” and “hippies wearing dull sacks”. There is an increased demand for more fashion-ability and trendiness in eco-fashion. Moreover, two important drawbacks current-ly limit the growth of eco-fashion: colors are still limited and the production costs of eco-friendly organic clothing are higher than the costs of conventional clothing.
• Embedded generosity: Brands start to link their business to social projects and use their brand to make giving and donating effortless, if not automatic. By em-bedding generosity into products, brands can build a strong connection with their consumers by involving them in the principles and values that matter to the brand.
• Still made here: consumers are increasingly searching for authentic products, instead of the universally uniform, invisible and impersonal throw-away culture of the globalised mass production and fast fashion era. A new niche with high poten-tial offering an answer to this need is the slow fashion and authenticity, where the identification and visualization of the products’ provenance becomes a strong marketing message and sales argument.
In the EU fashion industries numerous fashion companies – both large and small - devel-op innovative products and business models that respond to these trends (see Box 9).
275 trendwatching.com is an independent and opinionated trend firm, scanning the globe for the most promising
consumer trends, insights and related hands-on business ideas. For their information, they rely on a net-work of hundreds of spotters in more than 120 countries worldwide. Their trend findings help marketers, CEOs, researchers, and anyone else interested in the future of business and consumerism.
276 MoTIV (2008)
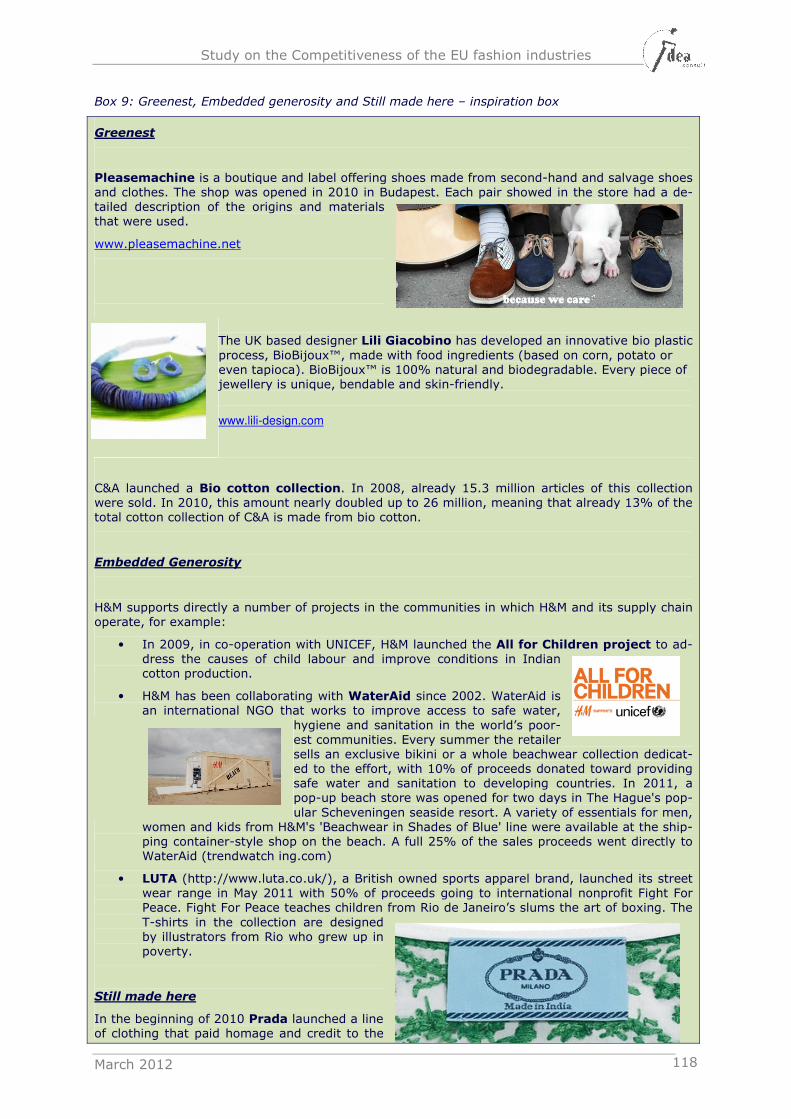
Study on the Competitiveness of the EU fashion industries
March 2012 118
Box 9: Greenest, Embedded generosity and Still made here – inspiration box
Greenest
Pleasemachine is a boutique and label offering shoes made from second-hand and salvage shoes and clothes. The shop was opened in 2010 in Budapest. Each pair showed in the store had a de-tailed description of the origins and materials that were used.
www.pleasemachine.net
The UK based designer Lili Giacobino has developed an innovative bio plastic process, BioBijoux™, made with food ingredients (based on corn, potato or even tapioca). BioBijoux™ is 100% natural and biodegradable. Every piece of jewellery is unique, bendable and skin-friendly.
www.lili-design.com
C&A launched a Bio cotton collection. In 2008, already 15.3 million articles of this collection were sold. In 2010, this amount nearly doubled up to 26 million, meaning that already 13% of the total cotton collection of C&A is made from bio cotton.
Embedded Generosity
H&M supports directly a number of projects in the communities in which H&M and its supply chain operate, for example:
• In 2009, in co-operation with UNICEF, H&M launched the All for Children project to ad-dress the causes of child labour and improve conditions in Indian cotton production.
• H&M has been collaborating with WaterAid since 2002. WaterAid is an international NGO that works to improve access to safe water,
hygiene and sanitation in the world’s poor-est communities. Every summer the retailer sells an exclusive bikini or a whole beachwear collection dedicat-ed to the effort, with 10% of proceeds donated toward providing safe water and sanitation to developing countries. In 2011, a pop-up beach store was opened for two days in The Hague's pop-ular Scheveningen seaside resort. A variety of essentials for men,
women and kids from H&M's 'Beachwear in Shades of Blue' line were available at the ship-ping container-style shop on the beach. A full 25% of the sales proceeds went directly to WaterAid (trendwatch ing.com)
• LUTA (http://www.luta.co.uk/), a British owned sports apparel brand, launched its street wear range in May 2011 with 50% of proceeds going to international nonprofit Fight For Peace. Fight For Peace teaches children from Rio de Janeiro’s slums the art of boxing. The T-shirts in the collection are designed by illustrators from Rio who grew up in poverty.
Still made here
In the beginning of 2010 Prada launched a line of clothing that paid homage and credit to the
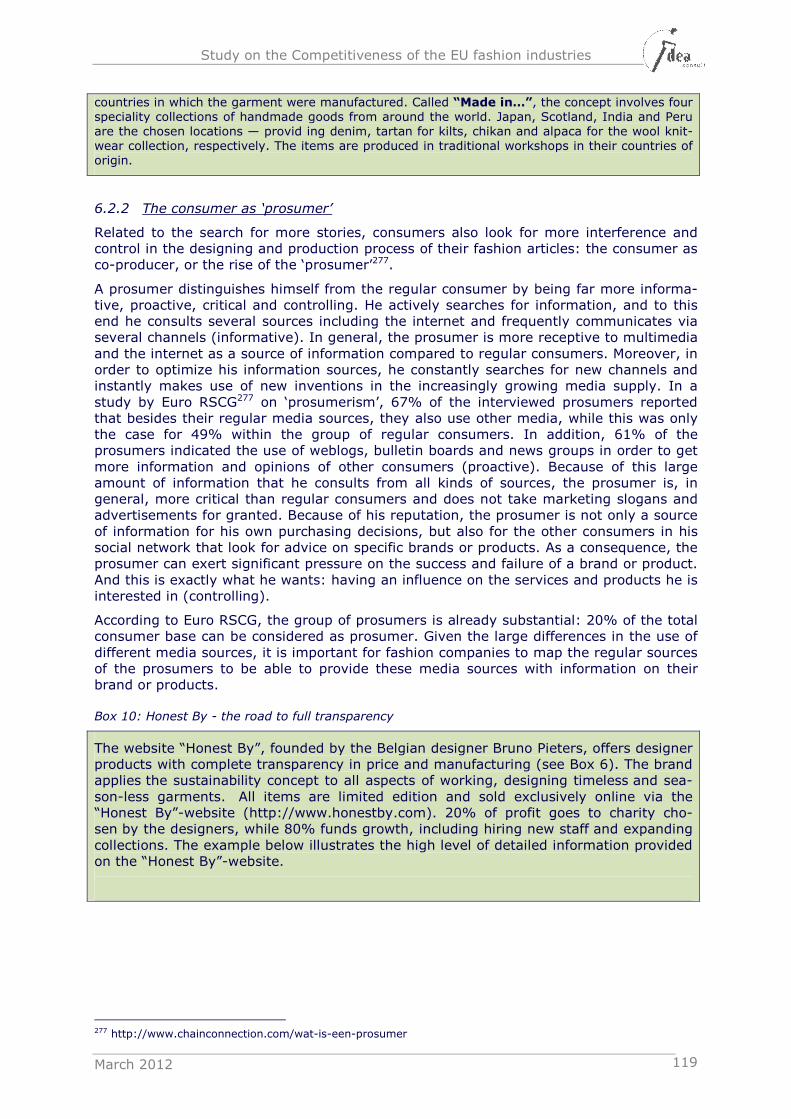
Study on the Competitiveness of the EU fashion industries
March 2012 119
countries in which the garment were manufactured. Called “Made in…”, the concept involves four speciality collections of handmade goods from around the world. Japan, Scotland, India and Peru are the chosen locations — provid ing denim, tartan for kilts, chikan and alpaca for the wool knit-wear collection, respectively. The items are produced in traditional workshops in their countries of origin.
6.2.2 The consumer as ‘prosumer’
Related to the search for more stories, consumers also look for more interference and control in the designing and production process of their fashion articles: the consumer as co-producer, or the rise of the ‘prosumer’277.
A prosumer distinguishes himself from the regular consumer by being far more informa-tive, proactive, critical and controlling. He actively searches for information, and to this end he consults several sources including the internet and frequently communicates via several channels (informative). In general, the prosumer is more receptive to multimedia and the internet as a source of information compared to regular consumers. Moreover, in order to optimize his information sources, he constantly searches for new channels and instantly makes use of new inventions in the increasingly growing media supply. In a study by Euro RSCG277 on ‘prosumerism’, 67% of the interviewed prosumers reported that besides their regular media sources, they also use other media, while this was only the case for 49% within the group of regular consumers. In addition, 61% of the prosumers indicated the use of weblogs, bulletin boards and news groups in order to get more information and opinions of other consumers (proactive). Because of this large amount of information that he consults from all kinds of sources, the prosumer is, in general, more critical than regular consumers and does not take marketing slogans and advertisements for granted. Because of his reputation, the prosumer is not only a source of information for his own purchasing decisions, but also for the other consumers in his social network that look for advice on specific brands or products. As a consequence, the prosumer can exert significant pressure on the success and failure of a brand or product. And this is exactly what he wants: having an influence on the services and products he is interested in (controlling).
According to Euro RSCG, the group of prosumers is already substantial: 20% of the total consumer base can be considered as prosumer. Given the large differences in the use of different media sources, it is important for fashion companies to map the regular sources of the prosumers to be able to provide these media sources with information on their brand or products.
Box 10: Honest By - the road to full transparency
The website “Honest By”, founded by the Belgian designer Bruno Pieters, offers designer products with complete transparency in price and manufacturing (see Box 6). The brand applies the sustainability concept to all aspects of working, designing timeless and sea-son-less garments. All items are limited edition and sold exclusively online via the “Honest By”-website (http://www.honestby.com). 20% of profit goes to charity cho-sen by the designers, while 80% funds growth, including hiring new staff and expanding collections. The example below illustrates the high level of detailed information provided on the “Honest By”-website.
277 http://www.chainconnection.com/wat-is-een-prosumer
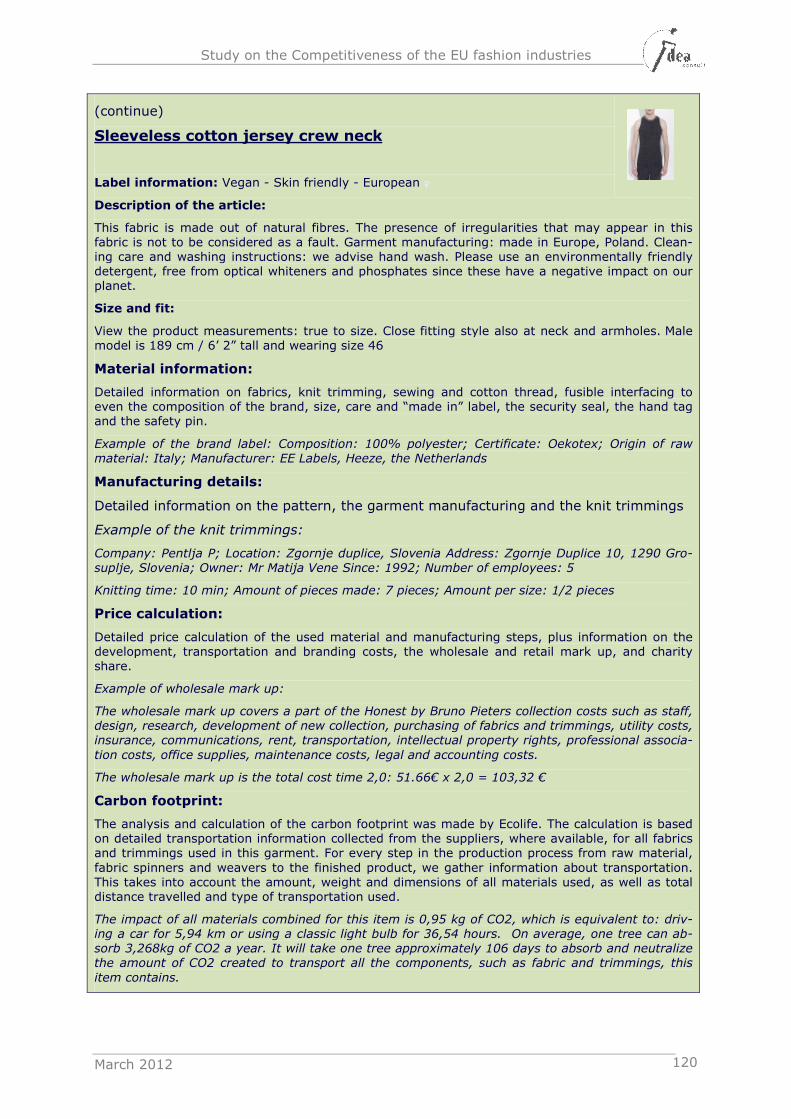
Study on the Competitiveness of the EU fashion industries
March 2012 120
(continue)
Sleeveless cotton jersey crew neck
Label information: Vegan - Skin friendly - European
Description of the article:
This fabric is made out of natural fibres. The presence of irregularities that may appear in this fabric is not to be considered as a fault. Garment manufacturing: made in Europe, Poland. Clean-ing care and washing instructions: we advise hand wash. Please use an environmentally friendly detergent, free from optical whiteners and phosphates since these have a negative impact on our planet.
Size and fit:
View the product measurements: true to size. Close fitting style also at neck and armholes. Male model is 189 cm / 6’ 2” tall and wearing size 46
Material information:
Detailed information on fabrics, knit trimming, sewing and cotton thread, fusible interfacing to even the composition of the brand, size, care and “made in” label, the security seal, the hand tag and the safety pin.
Example of the brand label: Composition: 100% polyester; Certificate: Oekotex; Origin of raw material: Italy; Manufacturer: EE Labels, Heeze, the Netherlands
Manufacturing details:
Detailed information on the pattern, the garment manufacturing and the knit trimmings
Example of the knit trimmings:
Company: Pentlja P; Location: Zgornje duplice, Slovenia Address: Zgornje Duplice 10, 1290 Gro-suplje, Slovenia; Owner: Mr Matija Vene Since: 1992; Number of employees: 5
Knitting time: 10 min; Amount of pieces made: 7 pieces; Amount per size: 1/2 pieces
Price calculation:
Detailed price calculation of the used material and manufacturing steps, plus information on the development, transportation and branding costs, the wholesale and retail mark up, and charity share.
Example of wholesale mark up:
The wholesale mark up covers a part of the Honest by Bruno Pieters collection costs such as staff, design, research, development of new collection, purchasing of fabrics and trimmings, utility costs, insurance, communications, rent, transportation, intellectual property rights, professional associa-
tion costs, office supplies, maintenance costs, legal and accounting costs.
The wholesale mark up is the total cost time 2,0: 51.66€ x 2,0 = 103,32 €
Carbon footprint:
The analysis and calculation of the carbon footprint was made by Ecolife. The calculation is based on detailed transportation information collected from the suppliers, where available, for all fabrics and trimmings used in this garment. For every step in the production process from raw material, fabric spinners and weavers to the finished product, we gather information about transportation. This takes into account the amount, weight and dimensions of all materials used, as well as total distance travelled and type of transportation used.
The impact of all materials combined for this item is 0,95 kg of CO2, which is equivalent to: driv-ing a car for 5,94 km or using a classic light bulb for 36,54 hours. On average, one tree can ab-sorb 3,268kg of CO2 a year. It will take one tree approximately 106 days to absorb and neutralize the amount of CO2 created to transport all the components, such as fabric and trimmings, this
item contains.
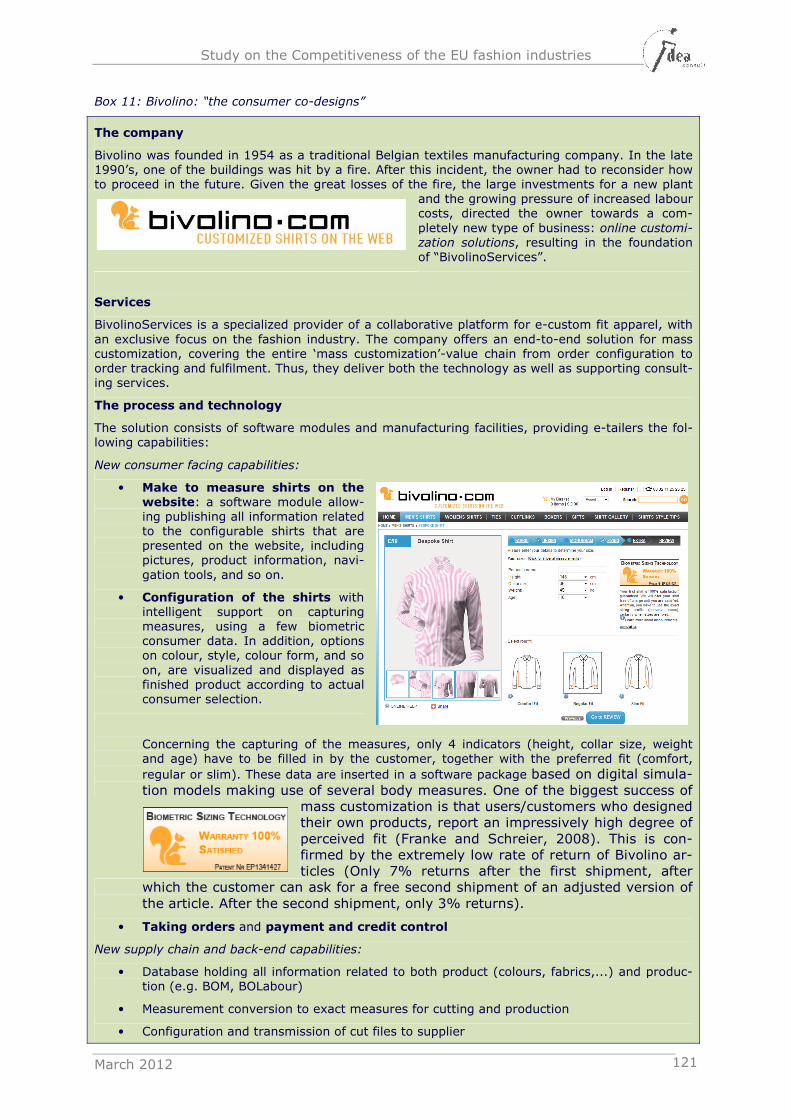
Study on the Competitiveness of the EU fashion industries
March 2012 121
Box 11: Bivolino: “the consumer co-designs”
The company
Bivolino was founded in 1954 as a traditional Belgian textiles manufacturing company. In the late 1990’s, one of the buildings was hit by a fire. After this incident, the owner had to reconsider how to proceed in the future. Given the great losses of the fire, the large investments for a new plant
and the growing pressure of increased labour costs, directed the owner towards a com-pletely new type of business: online customi-zation solutions, resulting in the foundation of “BivolinoServices”.
Services
BivolinoServices is a specialized provider of a collaborative platform for e-custom fit apparel, with an exclusive focus on the fashion industry. The company offers an end-to-end solution for mass customization, covering the entire ‘mass customization’-value chain from order configuration to order tracking and fulfilment. Thus, they deliver both the technology as well as supporting consult-ing services.
The process and technology
The solution consists of software modules and manufacturing facilities, providing e-tailers the fol-lowing capabilities:
New consumer facing capabilities:
• Make to measure shirts on the
website: a software module allow-ing publishing all information related to the configurable shirts that are presented on the website, including pictures, product information, navi-gation tools, and so on.
• Configuration of the shirts with intelligent support on capturing measures, using a few biometric consumer data. In addition, options on colour, style, colour form, and so on, are visualized and displayed as finished product according to actual consumer selection.
Concerning the capturing of the measures, only 4 indicators (height, collar size, weight and age) have to be filled in by the customer, together with the preferred fit (comfort,
regular or slim). These data are inserted in a software package based on digital simula-tion models making use of several body measures. One of the biggest success of
mass customization is that users/customers who designed their own products, report an impressively high degree of perceived fit (Franke and Schreier, 2008). This is con-firmed by the extremely low rate of return of Bivolino ar-ticles (Only 7% returns after the first shipment, after
which the customer can ask for a free second shipment of an adjusted version of the article. After the second shipment, only 3% returns).
• Taking orders and payment and credit control
New supply chain and back-end capabilities:
• Database holding all information related to both product (colours, fabrics,...) and produc-tion (e.g. BOM, BOLabour)
• Measurement conversion to exact measures for cutting and production
• Configuration and transmission of cut files to supplier
Study on the Competitiveness of the EU fashion industries
March 2012 122
• Configuration and sending lot size 1/n orders to supplier
• Order tracking and supplier integration
• Demand planning, enabling forecasting of future sales
Functionality and aesthetics
BivolinoServices does not only focus on functionality and fit, but also on aesthetics and personali-ty. For one of their temporary actions, they asked some famous artists to design a ‘shirt-painting’. These prints were added to the website, so that the customer could not only construct a fitting shirt, but could also add a rather unique design.
Personnel
Nearly all employees from the 15-headed staff are IT-ers. The required skills are only limitedly connected to fashion. For the design activities and clothing aesthetics, they make an appeal on external experts.
Clients
In its B2B-channel, BivolinoServices has over 50 customers, including well known retail brand and large international e-tailers. As an example, the Marks&Spencer Made to Measure Shirts – applica-tion is fully run on the Bivolino-platform. Besides, BivolinoServices also offers a limited own collec-tion (mainly personalized shirts, both for men and women, but also personalized boxers, and a complementary collection of cufflinks and ties) on its website as a B2C-supplier.
6.2.3 Impact of changing consumer behaviour on fashion businesses
The growing importance of niche markets and fashion as a means of self-expression leads to a growing fragmentation in the fashion and clothing market, which has a twofold impact on EU fashion companies (Europe INNOVA, 2010).
Those business models that strongly focus on ‘storytelling’, image building, uniqueness and authenticity are clearly in pole position to take advantage of the changing consumer demand. This is especially the case for luxury brands, independent (avant-garde) fashion designers and other small independent actors that focus on specific niches and often pro-vide unique and authentic fashion items with high symbolic value.
Some vertically integrated fashion retailers and department stores also try to anticipate on these changing consumer trends, by introducing temporary ‘exclusive’ product lines. However, under these business strategies, companies are far more limited to take ad-vantage of these changes.
The transformation from mass production to mass customization278 poses a (logistical) challenge to the major international brands. Business models that are mainly focused on efficient production and high volumes, are challenged to find a right balance between cost cutting and standardized production on the one hand, and customization on the oth-er hand.
Besides the perceived uniqueness of a self-designed product, mass customization is also driven by the demand for products that are better adapted to individual customer’s size and functional preferences (Franke and Schreier, 2008). Tools that help the customer to design a product that suits his or her preferences does not only refer to the design and the aesthetics, but also to the fit and functionality. This goes beyond a simple indication of size in terms of characters (XS, S,…, XXL) or numbers (36, 38,…), but makes use of digital simulation models making use of several body measures.
Some companies that offer (online) mass customization services only limit their offer to the functionality part. Others, such as Bivolino (see
278 The core idea behind mass customization is to provide the customer with a kind of user toolkit (in practice,
mostly web-based) that allows the individual to design a product that suits his or her personal preferences and in addition seems to be exclusively produced for him or her.
Study on the Competitiveness of the EU fashion industries
March 2012 123
Box 11), also allow the customization of aesthetics and design. Mass customization is, however, only a promising strategy in case customers have sound preference insights, if preferences are heterogeneous and if production technology is able to facilitate small lot sizes at almost mass production costs (Franke and Schreier, 2008).
To meet the needs of the prosumer for more information and control, fashion companies will be challenged to provide transparent information about the products that they offer, the materials that they have used and the production processes behind the product. Es-pecially for those fashion companies that coordinate global value chains, it is a challenge to set up the necessary information and monitoring systems to cover the whole value chain and all (sub)contractors involved in the production process. A number of fashion companies has already started to adapt or set up specific business models with an explic-it focus on making information more transparent. They actively support the prosumer in the search for better and more reliable information (see Box 9 and Box 6).
6.3 Technological developments
Although the fashion industries are not considered as a high tech industry in itself (see also section 5.1), the industry has always been an adopter of new technological devel-opments in other industries. Technological developments in ICT have been introduced in the fashion industries as of the 70’s and played (and still play) a critical role in managing global production networks, building large customer relation management systems or developing new business models (e.g. e-commerce).
A number of ongoing technological developments in different industries have the ability to provide (partial) answers to a number of the challenges that EU fashion industries face. They thus might have an important influence on the competitiveness of the EU fashion industries.
Based on existing literature (e.g. Europe INNOVA, 2010; EMCC, 2008) we have identified three fields where technological developments are likely to influence the fashion indus-tries over the coming years:
• New production methods
• New distribution methods
• New materials development
6.3.1 New production methods
New production methods such as Rapid Manufacturing, new recycling techniques or changes in colouring and bleaching procedures, have the ability to make the production of fashion goods less labour and energy intensive as well as more flexible.
6.3.1.1 Rapid Manufacturing in fashion
from Rapid prototyping (RP)…
A number of Rapid Prototyping (RP) technologies allow the direct fabrication of 3D parts from a 3D computer aided drawing (CAD) model. These technologies use an additive fab-rication approach in which a three dimensional (3D) object is directly produced. The main purpose of RP software is to generate computer aided manufacturing (CAM) data that are used in the production phase. (Yarkinoglu O., 2007279).
279 http://etd.lib.metu.edu.tr/upload/12608834/index.pdf
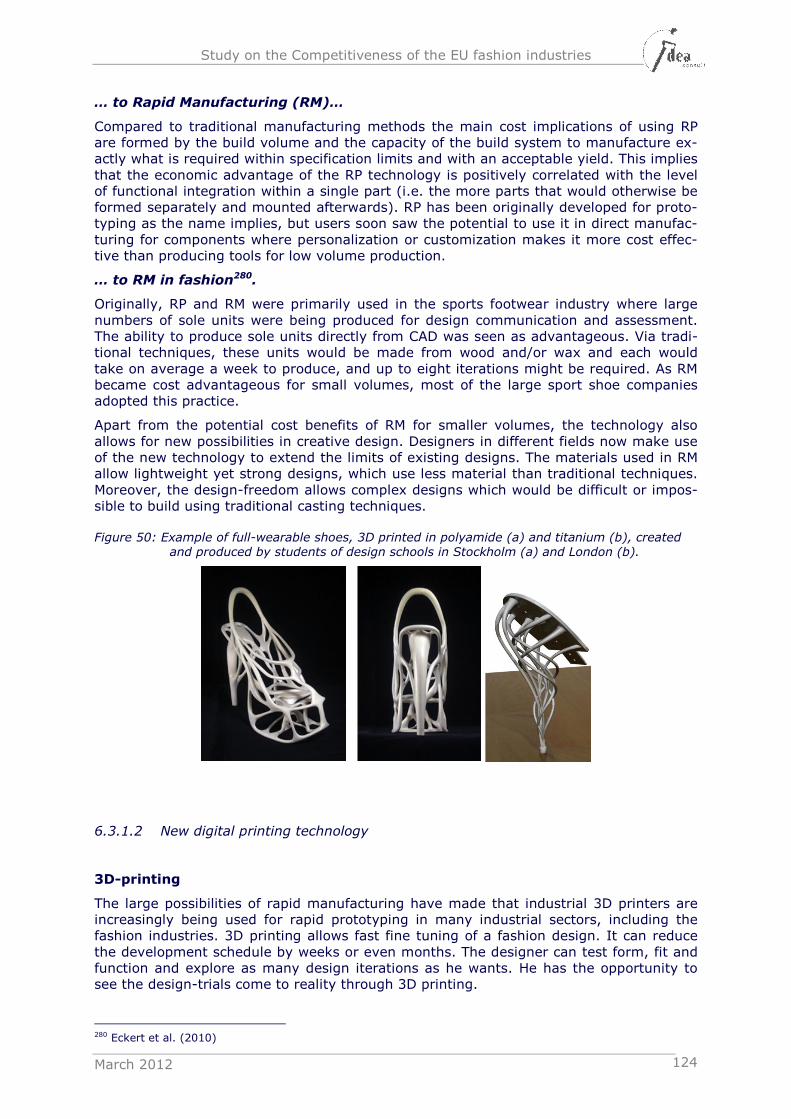
Study on the Competitiveness of the EU fashion industries
March 2012 124
… to Rapid Manufacturing (RM)…
Compared to traditional manufacturing methods the main cost implications of using RP are formed by the build volume and the capacity of the build system to manufacture ex-actly what is required within specification limits and with an acceptable yield. This implies that the economic advantage of the RP technology is positively correlated with the level of functional integration within a single part (i.e. the more parts that would otherwise be formed separately and mounted afterwards). RP has been originally developed for proto-typing as the name implies, but users soon saw the potential to use it in direct manufac-turing for components where personalization or customization makes it more cost effec-tive than producing tools for low volume production.
… to RM in fashion280.
Originally, RP and RM were primarily used in the sports footwear industry where large numbers of sole units were being produced for design communication and assessment. The ability to produce sole units directly from CAD was seen as advantageous. Via tradi-tional techniques, these units would be made from wood and/or wax and each would take on average a week to produce, and up to eight iterations might be required. As RM became cost advantageous for small volumes, most of the large sport shoe companies adopted this practice.
Apart from the potential cost benefits of RM for smaller volumes, the technology also allows for new possibilities in creative design. Designers in different fields now make use of the new technology to extend the limits of existing designs. The materials used in RM allow lightweight yet strong designs, which use less material than traditional techniques. Moreover, the design-freedom allows complex designs which would be difficult or impos-sible to build using traditional casting techniques.
Figure 50: Example of full-wearable shoes, 3D printed in polyamide (a) and titanium (b), created and produced by students of design schools in Stockholm (a) and London (b).
6.3.1.2 New digital printing technology
3D-printing
The large possibilities of rapid manufacturing have made that industrial 3D printers are increasingly being used for rapid prototyping in many industrial sectors, including the fashion industries. 3D printing allows fast fine tuning of a fashion design. It can reduce the development schedule by weeks or even months. The designer can test form, fit and function and explore as many design iterations as he wants. He has the opportunity to see the design-trials come to reality through 3D printing.
280 Eckert et al. (2010)
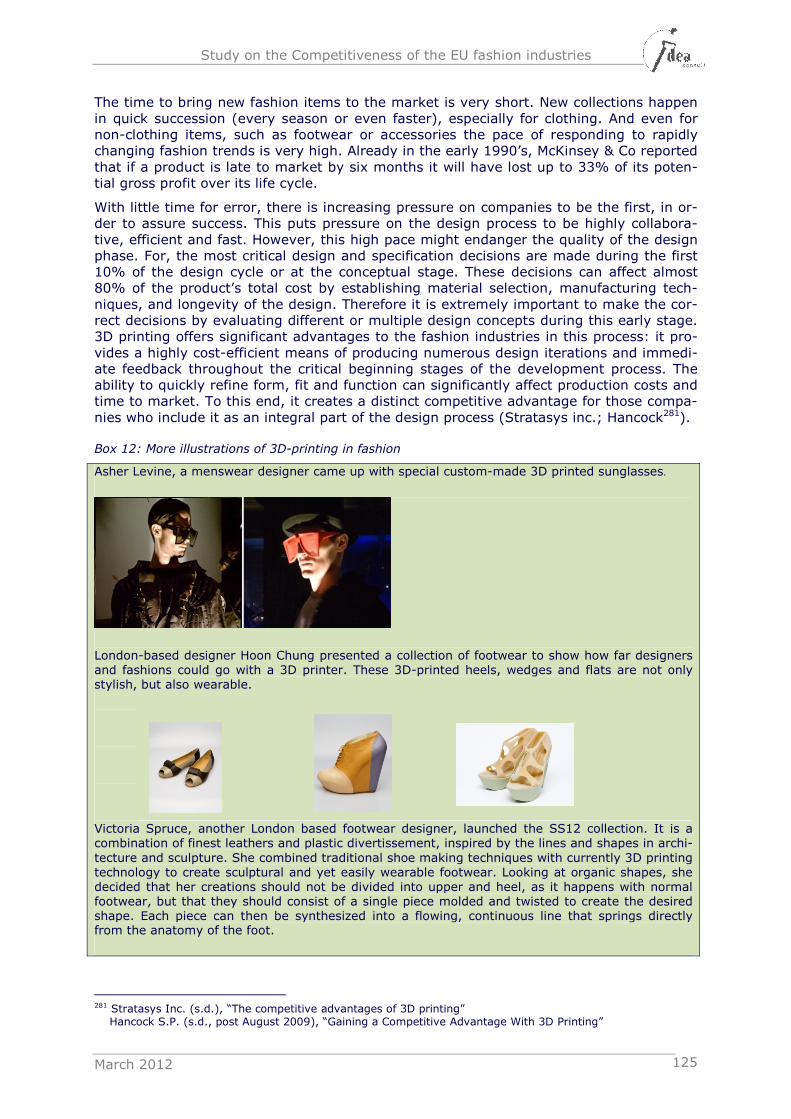
Study on the Competitiveness of the EU fashion industries
March 2012 125
The time to bring new fashion items to the market is very short. New collections happen in quick succession (every season or even faster), especially for clothing. And even for non-clothing items, such as footwear or accessories the pace of responding to rapidly changing fashion trends is very high. Already in the early 1990’s, McKinsey & Co reported that if a product is late to market by six months it will have lost up to 33% of its poten-tial gross profit over its life cycle.
With little time for error, there is increasing pressure on companies to be the first, in or-der to assure success. This puts pressure on the design process to be highly collabora-tive, efficient and fast. However, this high pace might endanger the quality of the design phase. For, the most critical design and specification decisions are made during the first 10% of the design cycle or at the conceptual stage. These decisions can affect almost 80% of the product’s total cost by establishing material selection, manufacturing tech-niques, and longevity of the design. Therefore it is extremely important to make the cor-rect decisions by evaluating different or multiple design concepts during this early stage. 3D printing offers significant advantages to the fashion industries in this process: it pro-vides a highly cost-efficient means of producing numerous design iterations and immedi-ate feedback throughout the critical beginning stages of the development process. The ability to quickly refine form, fit and function can significantly affect production costs and time to market. To this end, it creates a distinct competitive advantage for those compa-nies who include it as an integral part of the design process (Stratasys inc.; Hancock281).
Box 12: More illustrations of 3D-printing in fashion
Asher Levine, a menswear designer came up with special custom-made 3D printed sunglasses.
London-based designer Hoon Chung presented a collection of footwear to show how far designers and fashions could go with a 3D printer. These 3D-printed heels, wedges and flats are not only stylish, but also wearable.
Victoria Spruce, another London based footwear designer, launched the SS12 collection. It is a combination of finest leathers and plastic divertissement, inspired by the lines and shapes in archi-tecture and sculpture. She combined traditional shoe making techniques with currently 3D printing technology to create sculptural and yet easily wearable footwear. Looking at organic shapes, she decided that her creations should not be divided into upper and heel, as it happens with normal footwear, but that they should consist of a single piece molded and twisted to create the desired shape. Each piece can then be synthesized into a flowing, continuous line that springs directly from the anatomy of the foot.
281 Stratasys Inc. (s.d.), “The competitive advantages of 3D printing” Hancock S.P. (s.d., post August 2009), “Gaining a Competitive Advantage With 3D Printing”
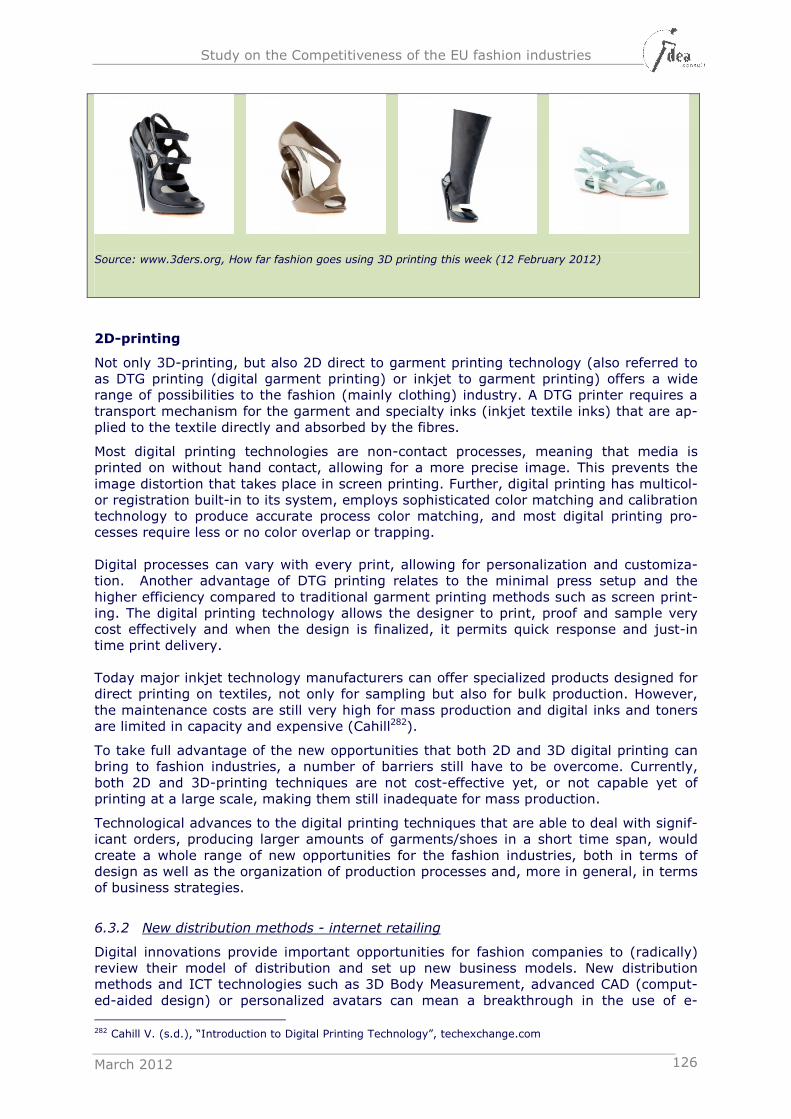
Study on the Competitiveness of the EU fashion industries
March 2012 126
Source: www.3ders.org, How far fashion goes using 3D printing this week (12 February 2012)
2D-printing
Not only 3D-printing, but also 2D direct to garment printing technology (also referred to as DTG printing (digital garment printing) or inkjet to garment printing) offers a wide range of possibilities to the fashion (mainly clothing) industry. A DTG printer requires a transport mechanism for the garment and specialty inks (inkjet textile inks) that are ap-plied to the textile directly and absorbed by the fibres.
Most digital printing technologies are non-contact processes, meaning that media is printed on without hand contact, allowing for a more precise image. This prevents the image distortion that takes place in screen printing. Further, digital printing has multicol-or registration built-in to its system, employs sophisticated color matching and calibration technology to produce accurate process color matching, and most digital printing pro-cesses require less or no color overlap or trapping. Digital processes can vary with every print, allowing for personalization and customiza-tion. Another advantage of DTG printing relates to the minimal press setup and the higher efficiency compared to traditional garment printing methods such as screen print-ing. The digital printing technology allows the designer to print, proof and sample very cost effectively and when the design is finalized, it permits quick response and just-in time print delivery. Today major inkjet technology manufacturers can offer specialized products designed for direct printing on textiles, not only for sampling but also for bulk production. However, the maintenance costs are still very high for mass production and digital inks and toners are limited in capacity and expensive (Cahill282).
To take full advantage of the new opportunities that both 2D and 3D digital printing can bring to fashion industries, a number of barriers still have to be overcome. Currently, both 2D and 3D-printing techniques are not cost-effective yet, or not capable yet of printing at a large scale, making them still inadequate for mass production.
Technological advances to the digital printing techniques that are able to deal with signif-icant orders, producing larger amounts of garments/shoes in a short time span, would create a whole range of new opportunities for the fashion industries, both in terms of design as well as the organization of production processes and, more in general, in terms of business strategies.
6.3.2 New distribution methods - internet retailing
Digital innovations provide important opportunities for fashion companies to (radically) review their model of distribution and set up new business models. New distribution methods and ICT technologies such as 3D Body Measurement, advanced CAD (comput-ed-aided design) or personalized avatars can mean a breakthrough in the use of e-
282 Cahill V. (s.d.), “Introduction to Digital Printing Technology”, techexchange.com
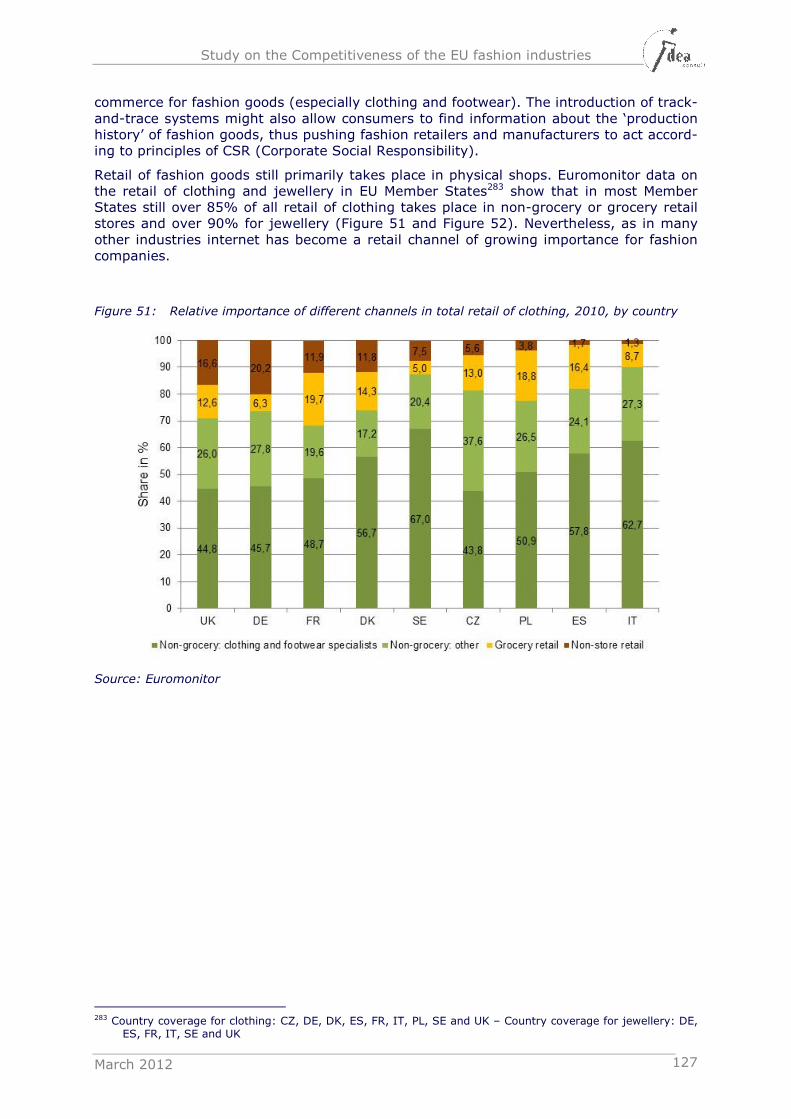
Study on the Competitiveness of the EU fashion industries
March 2012 127
commerce for fashion goods (especially clothing and footwear). The introduction of track-and-trace systems might also allow consumers to find information about the ‘production history’ of fashion goods, thus pushing fashion retailers and manufacturers to act accord-ing to principles of CSR (Corporate Social Responsibility).
Retail of fashion goods still primarily takes place in physical shops. Euromonitor data on the retail of clothing and jewellery in EU Member States283 show that in most Member States still over 85% of all retail of clothing takes place in non-grocery or grocery retail stores and over 90% for jewellery (Figure 51 and Figure 52). Nevertheless, as in many other industries internet has become a retail channel of growing importance for fashion companies.
Figure 51: Relative importance of different channels in total retail of clothing, 2010, by country
Source: Euromonitor
283 Country coverage for clothing: CZ, DE, DK, ES, FR, IT, PL, SE and UK – Country coverage for jewellery: DE,
ES, FR, IT, SE and UK
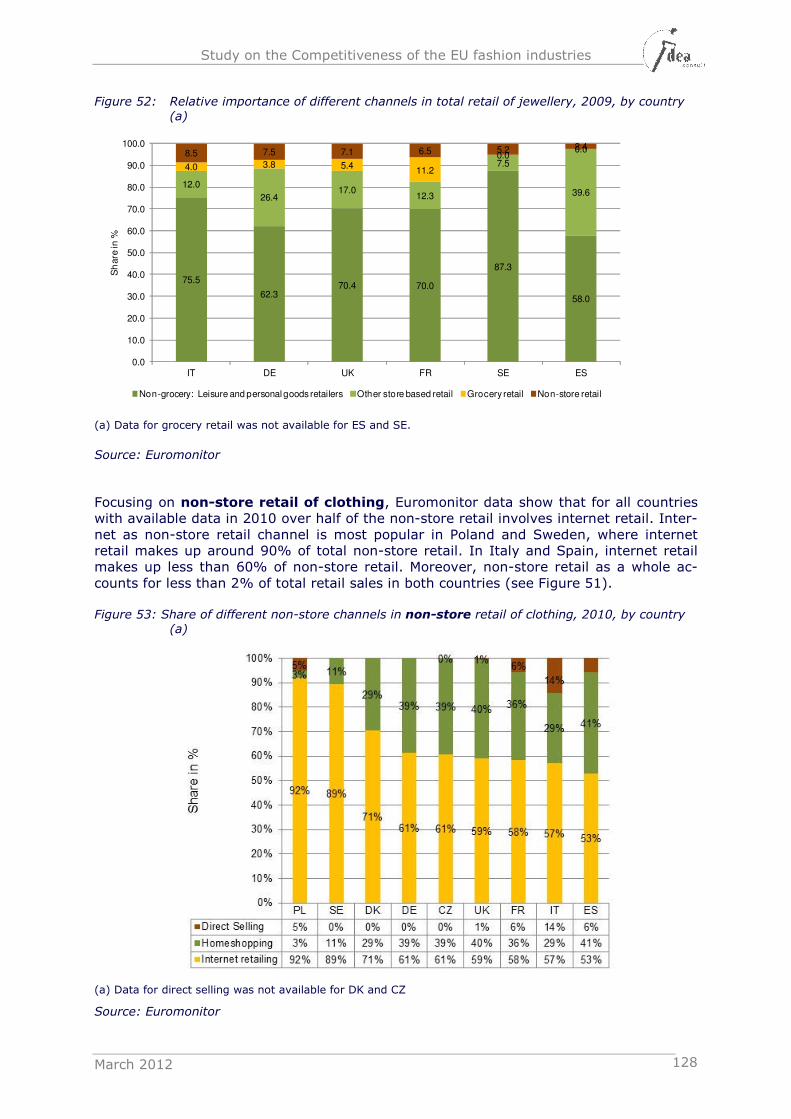
Study on the Competitiveness of the EU fashion industries
March 2012 128
Figure 52: Relative importance of different channels in total retail of jewellery, 2009, by country
(a)
(a) Data for grocery retail was not available for ES and SE.
Source: Euromonitor
Focusing on non-store retail of clothing, Euromonitor data show that for all countries with available data in 2010 over half of the non-store retail involves internet retail. Inter-net as non-store retail channel is most popular in Poland and Sweden, where internet retail makes up around 90% of total non-store retail. In Italy and Spain, internet retail makes up less than 60% of non-store retail. Moreover, non-store retail as a whole ac-counts for less than 2% of total retail sales in both countries (see Figure 51).
Figure 53: Share of different non-store channels in non-store retail of clothing, 2010, by country (a)
(a) Data for direct selling was not available for DK and CZ
Source: Euromonitor
75.5
62.370.4 70.0
87.3
58.0
12.0
26.417.0
12.3
7.5
39.6
4.0 3.8 5.411.2
0.00.08.5 7.5 7.1 6.5 5.2 2.4
0.0
10.0
20.0
30.0
40.0
50.0
60.0
70.0
80.0
90.0
100.0
IT DE UK FR SE ES
Sh
are
in %
Non-grocery: Leisure and personal goods retailers Other store based retail Grocery retail Non-store retail
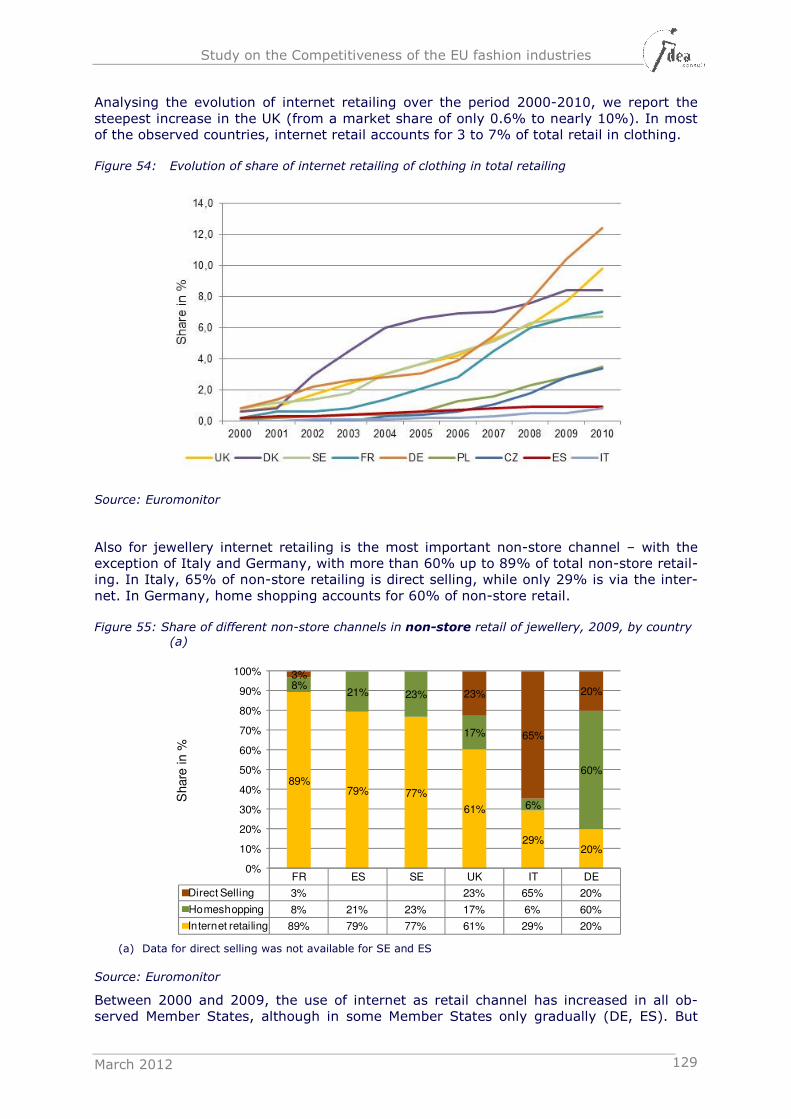
Study on the Competitiveness of the EU fashion industries
March 2012 129
Analysing the evolution of internet retailing over the period 2000-2010, we report the steepest increase in the UK (from a market share of only 0.6% to nearly 10%). In most of the observed countries, internet retail accounts for 3 to 7% of total retail in clothing.
Figure 54: Evolution of share of internet retailing of clothing in total retailing
Source: Euromonitor
Also for jewellery internet retailing is the most important non-store channel – with the exception of Italy and Germany, with more than 60% up to 89% of total non-store retail-ing. In Italy, 65% of non-store retailing is direct selling, while only 29% is via the inter-net. In Germany, home shopping accounts for 60% of non-store retail.
Figure 55: Share of different non-store channels in non-store retail of jewellery, 2009, by country (a)
(a) Data for direct selling was not available for SE and ES
Source: Euromonitor
Between 2000 and 2009, the use of internet as retail channel has increased in all ob-served Member States, although in some Member States only gradually (DE, ES). But
FR ES SE UK IT DE
Direct Selling 3% 23% 65% 20%
Homeshopping 8% 21% 23% 17% 6% 60%
Internet retailing 89% 79% 77% 61% 29% 20%
89%79% 77%
61%
29%20%
8%21% 23%
17%
6%
60%
3%
23%
65%
20%
0%
10%
20%
30%
40%
50%
60%
70%
80%
90%
100%
Share
in %
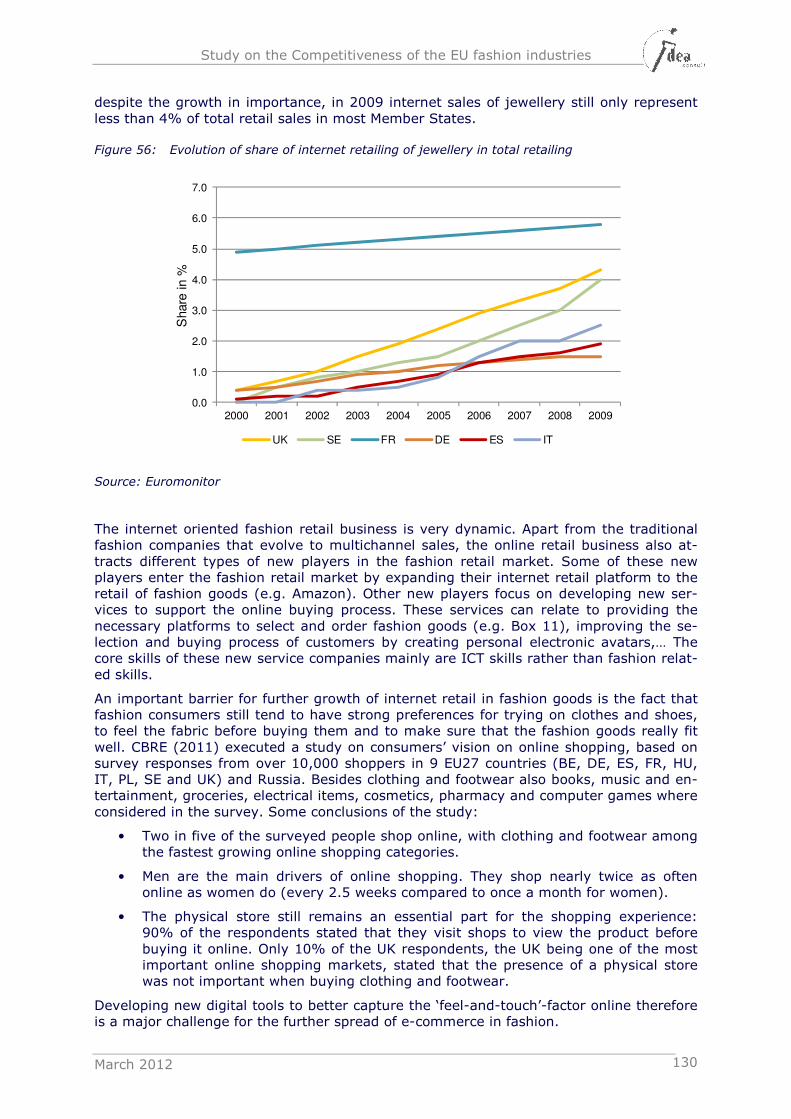
Study on the Competitiveness of the EU fashion industries
March 2012 130
despite the growth in importance, in 2009 internet sales of jewellery still only represent less than 4% of total retail sales in most Member States.
Figure 56: Evolution of share of internet retailing of jewellery in total retailing
Source: Euromonitor
The internet oriented fashion retail business is very dynamic. Apart from the traditional fashion companies that evolve to multichannel sales, the online retail business also at-tracts different types of new players in the fashion retail market. Some of these new players enter the fashion retail market by expanding their internet retail platform to the retail of fashion goods (e.g. Amazon). Other new players focus on developing new ser-vices to support the online buying process. These services can relate to providing the necessary platforms to select and order fashion goods (e.g. Box 11), improving the se-lection and buying process of customers by creating personal electronic avatars,… The core skills of these new service companies mainly are ICT skills rather than fashion relat-ed skills.
An important barrier for further growth of internet retail in fashion goods is the fact that fashion consumers still tend to have strong preferences for trying on clothes and shoes, to feel the fabric before buying them and to make sure that the fashion goods really fit well. CBRE (2011) executed a study on consumers’ vision on online shopping, based on survey responses from over 10,000 shoppers in 9 EU27 countries (BE, DE, ES, FR, HU, IT, PL, SE and UK) and Russia. Besides clothing and footwear also books, music and en-tertainment, groceries, electrical items, cosmetics, pharmacy and computer games where considered in the survey. Some conclusions of the study:
• Two in five of the surveyed people shop online, with clothing and footwear among the fastest growing online shopping categories.
• Men are the main drivers of online shopping. They shop nearly twice as often online as women do (every 2.5 weeks compared to once a month for women).
• The physical store still remains an essential part for the shopping experience: 90% of the respondents stated that they visit shops to view the product before buying it online. Only 10% of the UK respondents, the UK being one of the most important online shopping markets, stated that the presence of a physical store was not important when buying clothing and footwear.
Developing new digital tools to better capture the ‘feel-and-touch’-factor online therefore is a major challenge for the further spread of e-commerce in fashion.
0.0
1.0
2.0
3.0
4.0
5.0
6.0
7.0
2000 2001 2002 2003 2004 2005 2006 2007 2008 2009
Share
in %
UK SE FR DE ES IT
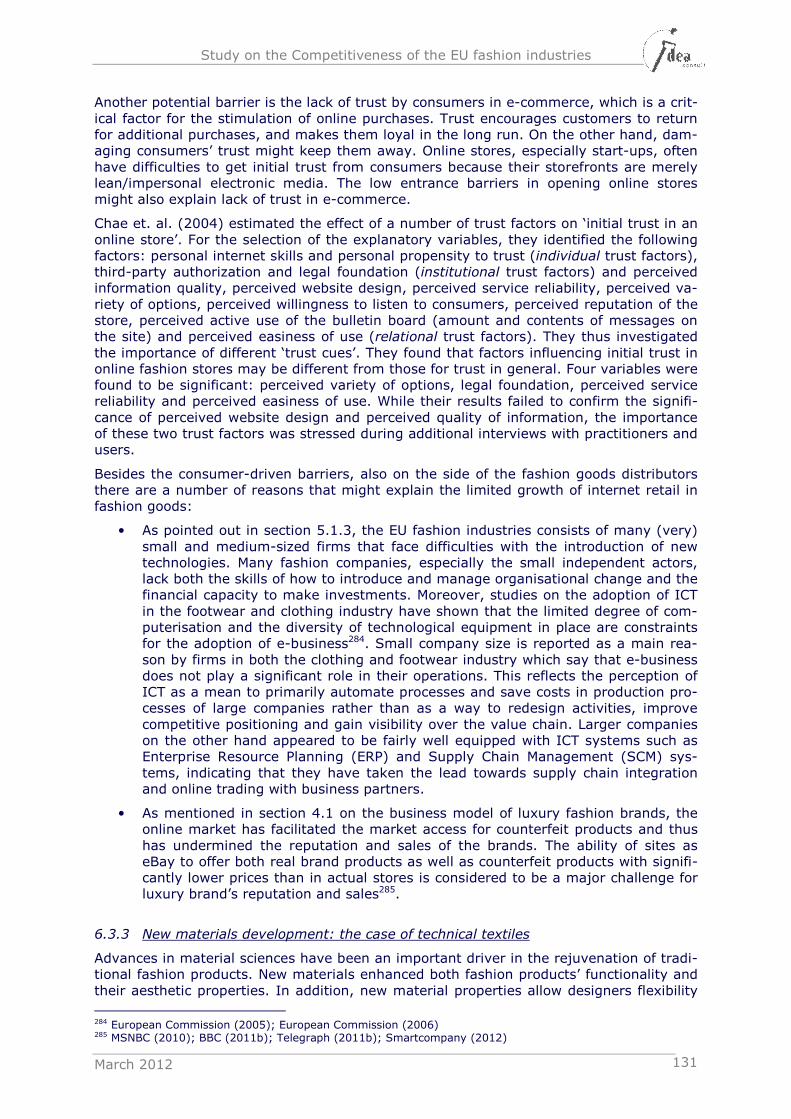
Study on the Competitiveness of the EU fashion industries
March 2012 131
Another potential barrier is the lack of trust by consumers in e-commerce, which is a crit-ical factor for the stimulation of online purchases. Trust encourages customers to return for additional purchases, and makes them loyal in the long run. On the other hand, dam-aging consumers’ trust might keep them away. Online stores, especially start-ups, often have difficulties to get initial trust from consumers because their storefronts are merely lean/impersonal electronic media. The low entrance barriers in opening online stores might also explain lack of trust in e-commerce.
Chae et. al. (2004) estimated the effect of a number of trust factors on ‘initial trust in an online store’. For the selection of the explanatory variables, they identified the following factors: personal internet skills and personal propensity to trust (individual trust factors), third-party authorization and legal foundation (institutional trust factors) and perceived information quality, perceived website design, perceived service reliability, perceived va-riety of options, perceived willingness to listen to consumers, perceived reputation of the store, perceived active use of the bulletin board (amount and contents of messages on the site) and perceived easiness of use (relational trust factors). They thus investigated the importance of different ‘trust cues’. They found that factors influencing initial trust in online fashion stores may be different from those for trust in general. Four variables were found to be significant: perceived variety of options, legal foundation, perceived service reliability and perceived easiness of use. While their results failed to confirm the signifi-cance of perceived website design and perceived quality of information, the importance of these two trust factors was stressed during additional interviews with practitioners and users.
Besides the consumer-driven barriers, also on the side of the fashion goods distributors there are a number of reasons that might explain the limited growth of internet retail in fashion goods:
• As pointed out in section 5.1.3, the EU fashion industries consists of many (very) small and medium-sized firms that face difficulties with the introduction of new technologies. Many fashion companies, especially the small independent actors, lack both the skills of how to introduce and manage organisational change and the financial capacity to make investments. Moreover, studies on the adoption of ICT in the footwear and clothing industry have shown that the limited degree of com-puterisation and the diversity of technological equipment in place are constraints for the adoption of e-business284. Small company size is reported as a main rea-son by firms in both the clothing and footwear industry which say that e-business does not play a significant role in their operations. This reflects the perception of ICT as a mean to primarily automate processes and save costs in production pro-cesses of large companies rather than as a way to redesign activities, improve competitive positioning and gain visibility over the value chain. Larger companies on the other hand appeared to be fairly well equipped with ICT systems such as Enterprise Resource Planning (ERP) and Supply Chain Management (SCM) sys-tems, indicating that they have taken the lead towards supply chain integration and online trading with business partners.
• As mentioned in section 4.1 on the business model of luxury fashion brands, the online market has facilitated the market access for counterfeit products and thus has undermined the reputation and sales of the brands. The ability of sites as eBay to offer both real brand products as well as counterfeit products with signifi-cantly lower prices than in actual stores is considered to be a major challenge for luxury brand’s reputation and sales285.
6.3.3 New materials development: the case of technical textiles
Advances in material sciences have been an important driver in the rejuvenation of tradi-tional fashion products. New materials enhanced both fashion products’ functionality and their aesthetic properties. In addition, new material properties allow designers flexibility
284 European Commission (2005); European Commission (2006) 285 MSNBC (2010); BBC (2011b); Telegraph (2011b); Smartcompany (2012)
Study on the Competitiveness of the EU fashion industries
March 2012 132
in product implementation and enhance the uniqueness of fashion products (e.g photochromatic dyes, or nanoengineered surfaces that allow changes in colour; emission of light, etc.). The development of the physic-chemical and aesthetic properties of mate-rials extends the known boundaries of material behaviour – a key factor, fashion designers can rely on.
New materials penetrated the fashion industries as
• Basic constituents of the products themselves that generate advanced intrinsic material properties like touch, handling, flexibility, texture, appearance etc.,286 e.g. new rubber surface patterns for footwear soles to prevent slip-related falls, new plastics materials for lightweight shoes, materials that provide enhanced shock absorption properties in shoe soles, textiles which have metal or optical fi-bres, or conductive polymers integrated into their structure, which allows for sensing capabilities and data transmission, etc.
• New layers (coating) on traditional materials that add to the traditional materials’ functional properties, e.g. nanofinishes, nanodyes, etc. Thereby fashion products offer enhanced functional properties, such as odour absorbance, water repellence, easy-care, i.e. fade/wrinkle resistance, stain and dirt resistance, etc., displayed previously only by specific niche products (e.g. performance wear).
• Embedded systems that enhance the products’ functionality (e.g. power genera-tion and storage, human interfaces, biosensing, monitoring, radio frequency, etc.) or appearance. In-built (added) technologies include wearable electronics, weara-ble sensors, solar or electroluminescent panels, actuators, logic circuits, and mi-cro-encapsulation.287 Smart fabrics with embedded systems are frequently used in fashion accessories as well, e.g. in the case of handbags with embedded solar cells.
Among the range of new materials with potential for the fashion industries, technical tex-tiles (TT) stand out in importance. This fast growing segment of the textile industry can be labelled not only ‘emerging’, innovative, investment- and research-intensive: it also becomes gradually devoid of its niche characteristics, and permeates into several seg-ments of the fashion industries. While initially the use of TT was considered only in spe-cific industry niches (military and protective textiles; industrial, aerospace, automotive, medical and sport-related applications, etc.) – fashion applications are currently driving a convergence between TT’s various application segments. The remainder of this section will specifically focus on the role of TT in fashion.
TT are traditionally defined as textiles in the case of which the physical properties and the performance of the material are more important than its aesthetics288. Over time, this definition has become increasingly misleading as a consequence of the penetration of TT into mainstream apparel and other fashion industry segments. The exclusion of fashion applications of TT was already criticised a decade later by OECD (OECD, 2004).
6.3.3.1 Technical textiles: a growth segment
For decades, advanced economies’ textile and clothing industries have been undergoing rapid structural change, marked by plant closures and a geographical shift of production to low-wage countries, which trend intensified following the phase-out of quota controls that governed trade in the textile and clothing sector. Although the global crisis enhanced output and employment contraction in advanced economies – recovery started in 2010 and gained further impetus in 2011 albeit with significant inter-country differences.
286 Consider the case of appearance changing garments, shape memory garments etc. 287 Microcapsules are tiny containers that release their content (e.g. thermochromic and photochromic dyes,
fragrance, climate control materials etc.) under controlled conditions (cosmeto-textiles). See additional details in section 5.1.
288 Definition adopted in 1994 by the Textile Institute (Textile Institute, Textile terms and definitions, Tenth Edition, Textile Institute Manchester, 1994, quoted by OECD, 2004, p. 146)
Study on the Competitiveness of the EU fashion industries
March 2012 133
In contrast to a contraction of output in advanced economies in the traditional labour-intensive segments of the textile and clothing industries, the production of TT fabrics and related products kept increasing − driven by steadily increasing global demand.289 Be-tween 1995 and 2010 the volume of global technical textiles consumption (in tons) in-creased by 70 %, to 23.77 million tons.290
Out of the 12 main application areas of TT291 the three most fashion related ones are ‘’Clothtech (footwear and clothing); ‘Sporttech’; and ‘Hometech’ (home & interior textiles and floor coverings). Growth in consumption in these three segments over the same pe-riod amounted to 54.5 %; 64 % and 53 %, respectively. These fashion related applica-tions accounted for 24.8 % of total technical textile consumption (in tons) in 2010.292
The rapid, unabated expansion of possible applications has granted the TT segment ex-traordinary growth potential.293 Though estimates of the global market for TT vary in our surveyed literature, most of the analyses and forecasts calculate with a global market size amounting to approximately EUR 100 billion in 2010-2011 and with increasing share of TT within total industry output. Although TT constitute a complex and fragmented in-dustry segment, and the segment’s definition varies from country to country294 rendering statistical quantifications and international comparisons quite difficult,295 all existing es-timates emphasize that the weight of TT within total textile output, and value added will progressively increase. This is in line with the shift to higher value adding, innovative products in advanced economies’ textile and clothing industries. In Germany for example, the share of TT in total textiles sales was above 50 % (in 2009-2010) up from 30-35 % in the mid-1990s.296 In France this share is still much lower: 27 %, but steadily increas-ing,297 in Canada 23 % (in 2007),298 in China 20 % (foreseen to increase to 25 % by 2015.299 In India the targeted and predicted share of technical textiles within total tex-
289 According to demand-driven structural change models (see e.g. Pasinetti, 1981) consumption across differ-
ent goods expands along a hierarchy of needs. Differential income elasticities of demand lead to demand-driven structural change. The consumption of the traditional segments of textile and clothing industries follows this textbook thesis and above a threshold development level it shows a continuous relative de-cline. In contrast, the consumption of technical textiles is positively related to the growth of per capita in-come, moreover, according to Chugan’s (2011) estimates, this correlation is quite strong.
290 Data published by the Knowledge Centre of Textile Exchange, Global B2B Marketplace for Textile Industry Manufacturers, www.teonline.com
291 These application areas include agriculture; construction industry; clothing & fashion industries; geotextiles (separation, filtration, soil reinforcement, fluid transmission); home textiles; industrial textiles; medical textiles; transportation (automotive & aerospace industries); environmental industries; packaging; protec-tive textiles; and sports and leisure (performance textiles). These application areas are referred to as Agrotech, Buildtech, Clothtech, Geotech, Hometech, Indutech, Medtech, Mobiltech, Oekotech, Packtech, Protech, and Sporttech respectively (see Horrocks, A. and Anand, S., 2000)
292 Source: author’s calculations based on the data published by the Knowledge Centre of Textile Exchange, Global B2B Marketplace for Textile Industry Manufacturers, www.teonline.com
293 Deutsche Bank Research forecasts 5 % annual growth in global demand for technical textiles (Heymann, E., 2011)
294 There is neither a complete nor a universally accepted definition of technical textiles. Definitions based on the descriptions of the product or process characteristics get rapidly outdated with TT’s continuously ex-panding application fields. Consequently the currently applied definitions cover a continuously decreasing part of TT varieties. Moreover, technical textiles are often “hidden” under statistical codes other than tex-tile or clothing.
295 The definition of ‘Clothtech’ for example includes only segments that are not really fashion-related: shoe laces, interlining, zip fasteners, labels, hook and loop tapes, sewing threads etc. There is no separate cat-egory (nor are statistical data compiled) of intelligent fabrics for apparel, or fabrics with nanoengineered surface for apparel, etc. In this vein statistics of the production and consumption of ‘Clothtech’ are distinct from fashion related TT production/consumption. Similarly, ‘Sporttech’ includes among others items such as artificial turf, parachute fabrics, ballooning fabrics, sleeping bags, sport nets, sport shoe components, tents etc.
296 Heymann (2011) 297 Source: Los textiles técnicos, un mercado con un inmenso potencial, Redacción Interempresas, 08.03. 2011,
www.interempresas.net 298 A Technology Roadmap for the Canadian Textile industry. Innovation Through Partnership. A CTT Group
Publication, 2008. For the U.S. we have data for the production share (in tons) of TT (referred to as spe-cialty fabrics): it was 45 % in 2008 (source: IFAI).
299 Kunyuan (2011); China’s 12th Five Year Plan strongly focuses among others on China’s textile and apparel sector envisaging a shift to increasing value adding activities such as TT, imposing investments in related research as well as in machinery and equipment.
Study on the Competitiveness of the EU fashion industries
March 2012 134
tiles industry is 10 % by 2015.300 A consensus finding of all our surveyed analyses is that Asia in general and China, India, Japan, Korea, and Taiwan in particular are driving the expansion of global consumption.301 Asian TT companies are in the process of intensive technology accumulation in order to upgrade and expand domestic TT production. Profes-sional newspapers frequently report about licensing, subcontracting and outsourcing agreements between Asian TT companies and their European or U.S. counterparts.302 This demonstrates though, that the main manufacturers of advanced TT as well as of modern TT manufacturing equipment303 are still European, U.S. and Japanese companies. According to Deutsche Bank Research304 German producers account for 45% of world TT market, followed by the U.S. and Japan.
6.3.3.2 Factors that drive the growth in TT
The factors that drive the evolution of TT are of both market-pull and technology-push type: a continuously increasing market demand and a wave of new innovations creating new market & application segments. Among the non-institutional (not public procurement related) and non-military demand factors that shape the evolution of this industry seg-ment the following ones stand out: growing and aging population, increased purchasing power, increased health and safety awareness, quality of life considerations, regulations and environmental concerns.
Next to the market-pull and technology-push drivers, an additional important factor shaping the evolution of TT is public support. Though analyses of public support tend to be restricted to international comparisons of publicly funded R&D programmes, develop-mental interventions are much more diversified, especially in selected developing econo-mies. Beyond science and technology (S&T) policy measures, support programmes in-clude institutional development305, strategy design, trade promotion, awareness and im-age building and various fiscal measures.
Developing countries frequently adopt direct fiscal support measures e.g. interest reim-bursement and capital subsidy for investments in TT-related technology upgrading, sup-port to investments into testing infrastructure, establishment of incubation centres, or of national facilities for development of prototypes.
Some developing countries (particularly China and India) have adopted conscious and all encompassing developmental strategies that target the TT segment. They aim to become strong global contenders of advanced economies’ TT actors. So far, developmental inter-ventions have substantially increased these economies’ competitive advantage mainly in commodity-type TT, but their massive current publicly (co-)financed investments in R&D underpins their catching-up in relatively more sophisticated TT segments as well. While advanced economies still feature major advantages in the most research-intensive seg-ments of TT, supported by considerable public (national and EU-level) grants allocated to R&D and to R&D-based collaboration, policy-makers do not devise mid-term develop-mental strategies that target specifically this segment.
In advanced economies the main focus of public support is R&D, complemented by sev-eral related S&T policy measures including the stimulation of horizontal and vertical col-laborations within the TT segment, commercial assistance projects for the SME sector,
300 Chugan (2011) 301 Russia and Turkey are also emerging as important markets. 302 www.fibre2fashion.com; www.just-style.com; www.specialtyfabricsreview.com, etc. 303 Germany is particularly active in marketing its textiles machinery and related technologies in catching-up
developing economies. German TT and conventional textiles machinery manufacturing companies and in-dustry associations regularly organise conferences (and business meetings) in selected emerging econo-mies with titles: “German technology for the Vietnamese/Indian/Brazilian etc. textile industry”.
304 Heymann (2011) 305 TT-related institutional development is relatively more important in emerging economies since advanced
economies usually have a developed and dense institutional network consisting of industry associations, professional societies, research networks, centres of excellence, and interest representation bodies. See http://www.texi.org/Links/europe.htm for a list of European federations and associations in the textile and fashion industries.
Study on the Competitiveness of the EU fashion industries
March 2012 135
start-up promotion, support measures aimed to facilitate access to finance in technology-oriented companies etc.306
While the amount of direct national support available to EU member states’ TT companies is dwarfed by the one available to their competitors in selected emerging economies, especially in China, there are various EU-level programmes that complement nationally available sources of funding. They include programmes that support R&D and innovative stakeholders’ collaboration307 and specific initiatives such as the European lead market initiative targeting protective textiles. (see footnote 185 in section 5.1). In fact, the main benefit of these EU-level programmes is not that member states’ TT stakeholders can get access to additional funding that complements the resources available at the national level, but rather that these programmes provide opportunities for co-operation among various industry-university/academia networks. Inter-network collaborations allow for new ways of bundling distributed knowledge-bases and enhance thereby the inter-TT-segment spillover of scientific results. This type of ‘transdisciplinarity’ contributes to the rapid expansion of TT’s market applications.
In addition to national and supra-national R&D and networking programmes another im-portant factor shaping the development of TT is the market for technology. Institutional buyers in sectors like the military, aerospace, fire fighting, and healthcare are the key actors. Beyond their public procurement, in selected countries these large institutional buyers occasionally sponsor TT related research as well. Although the TT-segments that can benefit from this type of demand include the military (and space related), the protec-tive, the medical and the environmental ones, fashion industry actors often embrace the scientific results and contribute to technology transfer by incorporating them into fashion products.
6.3.4 Impact of new technological developments on fashion businesses
6.3.4.1 ICT developments
The possibilities that internet and new ICT developments offer to set up new types of relationships with customers, affect all businesses that are active in retail. E-commerce, although still limited in importance compared to shopping retail, has been adopted by luxury brands, vertically integrated retailers and mass retailers alike. Technological de-velopments to further adapt e-commerce tools to the specific needs of fashion consum-ers, therefore are of interest to the whole retail business as they provide opportunities to enlarge their market reach.
The new ICT developments do provide specific opportunities for new types of businesses – often small ICT driven companies - to emerge in the fashion value chain. Different small en-terprises have entered the fashion industries with specific services to either fashion
goods companies or customers, the example of BivolinoServices being illustrative for this evolution (see
Box 11). These small actors are often highly innovative and have (strong) links with re-search institutes. However, the challenge for these small actors is to find an economically viable business model where either customers or fashion goods companies are willing to pay for the services offered.
However in general, fashion businesses are rather late adopters of e-commerce than they are early adopters. A precondition to take advantage of the new technological develop-ments is the ability of EU fashion companies to absorb these new developments into their
306 In addition, economic policy decision-makers in advanced economies tend to focus increasingly consciously
and systematically on the design-related, creative segments of the economy. Cf. Cunningham’s survey and international comparison of advanced economies’ creative industry policies (Cunningham, 2009).
307 Examples for collaboration-oriented programmes include technology platform programmes and networking programmes (such as SmartNet, ProsumerNet).
Study on the Competitiveness of the EU fashion industries
March 2012 136
daily business to develop new products, new production processes or completely new business models. However, as has already been stated in the discussion on the barriers to R&D and innovation, the EU fashion industries with many (very) small and medium-sized firms face difficulties with the introduction of new technologies (see section 5.1.3).
Many fashion companies, especially the small independent actors, lack both the skills of how to introduce and manage organisational change and the financial capacity to make investments. Moreover, studies on the adoption of ICT in the footwear and clothing in-dustry have shown that the limited degree of computerisation and the diversity of tech-nological equipment in place are constraints for the adoption of e-business308. Small company size is reported as a main reason by firms in both the clothing and footwear industry which say that e-business does not play a significant role in their operations. This reflects the perception of ICT as a mean to primarily automate processes and save costs in production processes of large companies rather than as a way to redesign activi-ties, improve competitive positioning and gain visibility over the value chain. Larger companies on the other hand appeared to be fairly well equipped with ICT systems such as Enterprise Resource Planning (ERP) and Supply Chain Management (SCM) systems, indicating that they have taken the lead towards supply chain integration and online trad-ing with business partners.
6.3.4.2 Other new technological developments and new materials
Whereas ICT developments and e-commerce have a broad influence on all types of fash-ion industry businesses, the adoption of the other new technological developments that have been discussed (digital printing techniques, technical textiles) at this moment is only limited to specific types of businesses whose competitive advantage lies in bringing innovative fashion products to the market or in bringing fashion products to the market in a highly innovative way. Such early adopters of innovation can be especially found in the group of small independent actors (e.g. creative fashion designers experimenting with new materials and new printing techniques), the luxury fashion brands (e.g. use of technical textiles in haute couture) and niches such as sportswear (especially focusing on exploring the different functionalities of new materials). The high costs that are still re-lated to implementing these new technologies or materials, as well as the fact that many of these developments are still in an experimental phase, currently prevent especially those types of fashion businesses that are concentrated on cost efficiency from investing in these new developments.
308 European Commission (2005), European Commission (2006)
Study on the Competitiveness of the EU fashion industries
March 2012 137
6.4 Sustainability
Environmental protection and the importance of sustainable economic growth have be-come major issues in socio-economic discussions and policy making. This has increased the ecological and social awareness of consumers. Consumers increasingly take into ac-count the (potential) negative impacts of the products they buy in relation to the envi-ronment (working conditions, animal rights, etc.).
According to Skov (2008), consumers generally do not relate the fashion industries to sustainability in a positive way. Skov identified five ethical controversies that lay at the basis of this negative image: environmental concerns (e.g. waste disposal), fakes and counterfeits, poor working conditions, animal rights and idealized gender and body imag-es. As a reaction to this image, sustainable fashion consumption increasingly becomes an important trend in developed regions, including the EU. Corporate Social Responsibility (CSR) and ethical sourcing become vital elements of business strategies in fashion goods, leather and textiles industries (EMCC, 2008).
The increased ecological and societal awareness of customers provides opportunities for the EU fashion industries to create new niche markets in for example ‘green clothing’, as well as challenges to review traditional production and sourcing methods. The increased awareness might also lead to lower consumer adoption of specific technological develop-ments (e.g. in nano- and biotechnology) due to uncertainty about health and environ-ment effects.
The remainder of this section will focus on the major ecological and societal challenges that the EU fashion industries face309, the need for more sustainability in fashion and the possibilities for policy intervention to support the EU fashion industries in adopting more sustainable practices.
6.4.1 Environmental challenges
The fashion industries are diverse, both in terms of the raw materials that are being used as in terms of the different techniques being used throughout the production process. At each of the stages from production to consumption of fashion goods, the negative im-pacts on the environment are as numerous as they are varied. The following list presents some major causes of environmental damage related to the fashion industries310:
• The use of pesticides and toxic chemicals during the cultivation of textile fibres such as cotton, but also in many manufacturing stages such as pre-treatment, bleaching, dyeing and printing harm nature and wildlife, and via water disposal they contaminate soil.
• Animal products used in clothing include fur, leather, silk and wool. The valorisa-tion of animal by-products is often associated by animal rights and can go hand in hand with intensive farming practises that damage the environment.
• Synthetic fibres such as polyester, spandex or Lycra are increasingly being used in the production of fashion goods. The manufacture of synthetic fibres is envi-ronmentally damaging. Moreover, at the end of the life cycle they are hard to re-cycle (with nylon taking 30 to 40 years to decompose).
• The fashion industry is an energy-intensive sector that requires large quantities of burning fossil fuel to create electricity for the heating of water and air in laun-dering. Other major energy-flows are the provision of fuel to agricultural machin-ery and the provision of electricity to production plants.
• Many textile machineries cause noise, sound and air pollution.
• Over-usage of natural resources like plants and water depletes or disturbs ecological balance. Water consumption, especially in cotton crop cultivation, is
309 except for the problem of fakes and counterfeits, which will be discusses in section 0 310 Cfr. Challa (2010), Allwood et al. (2006)
Study on the Competitiveness of the EU fashion industries
March 2012 138
very high. Also manufacturing processes as dyeing and printing consume vast amounts of water.
• Waste volumes are high and even growing with the advent of fast fashion. For example, UK consumers send, on average, 30 kg of clothing and textiles per capi-ta to landfill each year. Only one eight of their consumption is sent for re-use through charities.
• The high negative environmental impact of transportation in the global value chain of fashion goods.
Figure 57 illustrates the evolution of water pollution by the textiles industry in the period 1996 to 2006 for most EU 27 countries. A distinction is made between the Western Euro-pean and Scandinavian countries on the one hand (first graph) and the Eastern and Southern European countries on the other hand (second graph). In the first group of countries, pollution shares range between 2 and 10% and decline over time. By 2006, water pollution shares in these countries have dropped below 6%. Some countries, like Ireland and the UK, show major improvements in the level of water pollution.
The second graph shows the results for the Eastern and Southern European countries; both regions on average performing worse in terms of water pollution compared to the first group of countries. Moreover, improvements over time are less promising. In some countries, such as Portugal or Slovenia the textile industry did some noticeable efforts to decrease the level of water pollution, in a number of other countries the situation stabi-lized between 7 and 13% (e.g. Spain, Poland), while in some countries the situation even deteriorated with a significant increase of the water pollution level until 2004 to nearly 30% (e.g. Romania and Bulgaria).
Figure 57: Water pollution, textile industry (% of total BOD emissions311), 1996-2006
311 Industry shares of emissions of organic water pollutants refer to emissions from manufacturing activities as
defined by two-digit divisions of the International Standard Industrial Classification (ISIC), revision 2: tex-tiles (32). Emissions of organic water pollutants are measured by biochemical oxygen demand, which re-fers to the amount of oxygen that bacteria in water will consume in breaking down waste. This is a stand-ard water-treatment test for the presence of organic pollutants.
0.0
2.0
4.0
6.0
8.0
10.0
12.0
1996 1997 1998 1999 2000 2001 2002 2003 2004 2005 2006
BE UK IE FR AT LU
FI NL DE DK SE
Study on the Competitiveness of the EU fashion industries
March 2012 139
Source: IDEA Consult based on World Bank statistics
The negative environmental impact of fashion goods however, is not limited to the manu-facturing phase alone. During the total life cycle of a garment, also the consumer care phase (washing, laundry,…) has a significant environmental cost, as illustrated in Table 6. It is clear that the fashion industry has a shared responsibility with e.g. manufacturers of washing and laundry machines, manufacturers of laundry powder and fabric softeners and consumers themselves to lower the total environmental cost over the life cycle of fashion goods.
Table 6: Environmental cost of each stage in the lifecycle of a cotton t-shirt (US$ per t-shirt)
Conventional cotton Organic cotton
Growing 0.67 0.33
Ginning 0.02
Processing 0.02
Distribution 0.08
Transportation 0.32
Consumer care 2.69
Total cost 3.79 3.45
Source: Fletcher K. (2008), “Sustainable Fashion and Textiles: design journeys, Earthscan”
6.4.2 Societal challenges
Apart from the environmental and ecological challenges, also important societal concerns relate to the fashion industries. They range from poor working conditions to eating disor-ders and idealized gender and body images (MoTIV, 2008). The societal issues – alt-hough a concern for every company in the industry – especially affect the large multina-tional brand companies that operate in global value chains and have a wide ranging im-pact on the image a fashion. They range from the major luxury fashion brands (e.g. LVMH) and premium fashion brands to vertically integrated retailers (e.g. Puma, Decath-lon).
0.0
5.0
10.0
15.0
20.0
25.0
30.0
35.0
40.0
1996 1997 1998 1999 2000 2001 2002 2003 2004 2005 2006
PT LT RO EE BG MT SL
IT LV PL CZ ES SK HU
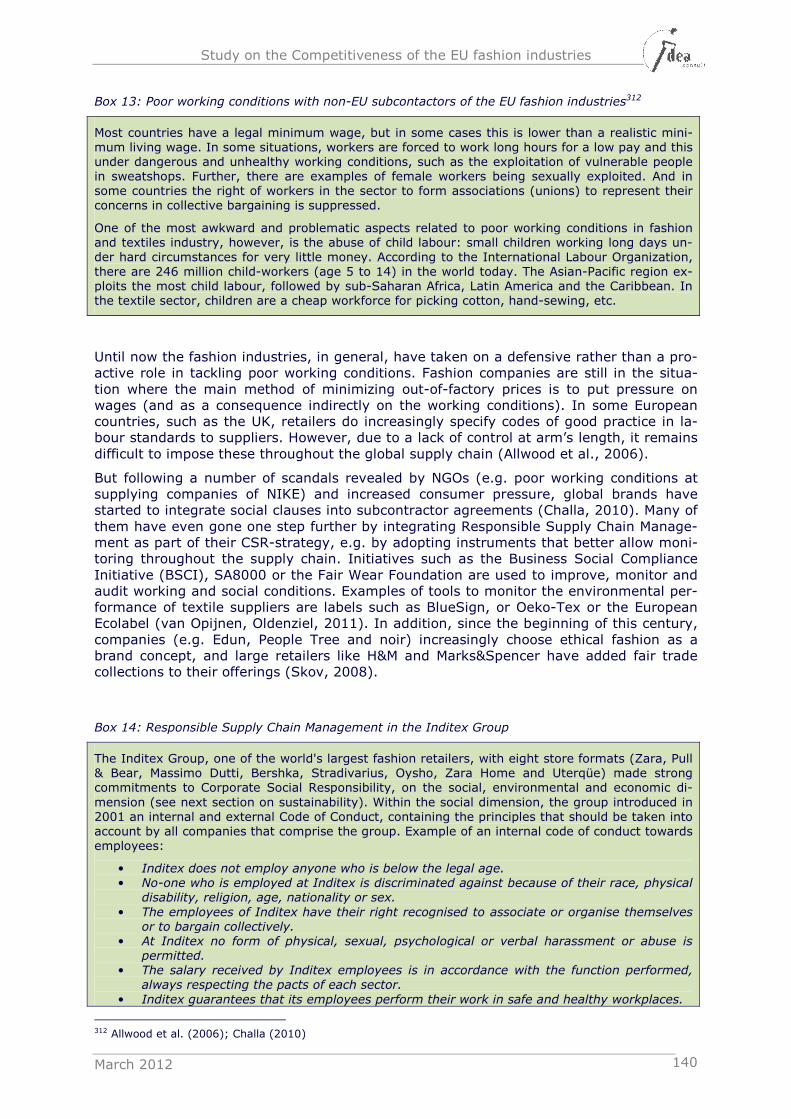
Study on the Competitiveness of the EU fashion industries
March 2012 140
Box 13: Poor working conditions with non-EU subcontactors of the EU fashion industries312
Most countries have a legal minimum wage, but in some cases this is lower than a realistic mini-mum living wage. In some situations, workers are forced to work long hours for a low pay and this under dangerous and unhealthy working conditions, such as the exploitation of vulnerable people in sweatshops. Further, there are examples of female workers being sexually exploited. And in some countries the right of workers in the sector to form associations (unions) to represent their concerns in collective bargaining is suppressed.
One of the most awkward and problematic aspects related to poor working conditions in fashion and textiles industry, however, is the abuse of child labour: small children working long days un-der hard circumstances for very little money. According to the International Labour Organization, there are 246 million child-workers (age 5 to 14) in the world today. The Asian-Pacific region ex-ploits the most child labour, followed by sub-Saharan Africa, Latin America and the Caribbean. In the textile sector, children are a cheap workforce for picking cotton, hand-sewing, etc.
Until now the fashion industries, in general, have taken on a defensive rather than a pro-active role in tackling poor working conditions. Fashion companies are still in the situa-tion where the main method of minimizing out-of-factory prices is to put pressure on wages (and as a consequence indirectly on the working conditions). In some European countries, such as the UK, retailers do increasingly specify codes of good practice in la-bour standards to suppliers. However, due to a lack of control at arm’s length, it remains difficult to impose these throughout the global supply chain (Allwood et al., 2006).
But following a number of scandals revealed by NGOs (e.g. poor working conditions at supplying companies of NIKE) and increased consumer pressure, global brands have started to integrate social clauses into subcontractor agreements (Challa, 2010). Many of them have even gone one step further by integrating Responsible Supply Chain Manage-ment as part of their CSR-strategy, e.g. by adopting instruments that better allow moni-toring throughout the supply chain. Initiatives such as the Business Social Compliance Initiative (BSCI), SA8000 or the Fair Wear Foundation are used to improve, monitor and audit working and social conditions. Examples of tools to monitor the environmental per-formance of textile suppliers are labels such as BlueSign, or Oeko-Tex or the European Ecolabel (van Opijnen, Oldenziel, 2011). In addition, since the beginning of this century, companies (e.g. Edun, People Tree and noir) increasingly choose ethical fashion as a brand concept, and large retailers like H&M and Marks&Spencer have added fair trade collections to their offerings (Skov, 2008).
Box 14: Responsible Supply Chain Management in the Inditex Group
The Inditex Group, one of the world's largest fashion retailers, with eight store formats (Zara, Pull & Bear, Massimo Dutti, Bershka, Stradivarius, Oysho, Zara Home and Uterqüe) made strong commitments to Corporate Social Responsibility, on the social, environmental and economic di-mension (see next section on sustainability). Within the social dimension, the group introduced in 2001 an internal and external Code of Conduct, containing the principles that should be taken into account by all companies that comprise the group. Example of an internal code of conduct towards employees:
• Inditex does not employ anyone who is below the legal age. • No-one who is employed at Inditex is discriminated against because of their race, physical
disability, religion, age, nationality or sex.
• The employees of Inditex have their right recognised to associate or organise themselves or to bargain collectively.
• At Inditex no form of physical, sexual, psychological or verbal harassment or abuse is permitted.
• The salary received by Inditex employees is in accordance with the function performed, always respecting the pacts of each sector.
• Inditex guarantees that its employees perform their work in safe and healthy workplaces.
312 Allwood et al. (2006); Challa (2010)
Study on the Competitiveness of the EU fashion industries
March 2012 141
A second step was the introduction of the “Internal Guidelines for Responsible Practices of the Inditex's Group Personnel” in 2006. They guide the behaviour expected by the company of its employees, thus providing a mechanism of complaints allowing employees to report, in a confi-dential manner, any potentially relevant irregularities that they might consider to be a breach of these Guidelines. In order to verify whether the companies comply with these guidelines, the group also introduced an internal audit charter and internal audit regulations: external manufac-turers, suppliers and their subcontractors shall authorize Inditex and/or any third parties the for-mer might appoint, to carry out inspections and audits in order to verify the appropriate enforce-ment of the Code.
Box 15: Social and environmental reporting in the EU leather industry
Since 2000, the EU tanning Industry has embarked in a process of continuing progress in social accountability and environmental performance. The social partners of the leather/tanning industry at European level (Cotance, ETUP:TCL) signed in 2000 an ambitious Social Code of Conduct for the sector and in 2008 a Framework Agreement on Social & Environmental Reporting. This docu-ment introduced a standard for reporting Social and Environmental parameters relevant for the sector's SME's. The Reporting Standard allows companies to draw up their Social Declaration in a harmonised fashion. Being a Standard reporting guide, it will allow at term to prepare a European Report on Social and Environmental performance.
6.4.3 The road to sustainable fashion
Sustainable or socially responsible entrepreneurship is a necessary condition to secure our planet for future generations. For fashion companies, sustainable development means the integration of economic, ecological and social aspects in the entire production chain and in all production steps (development, production and marketing of (new) fash-ion products and during the post-production steps, such as maintenance and recy-cling)313. The UK based industry body for sustainable fashion Ethical Fashion Forum (EFF) refers to it as ethical fashion: “ethical fashion represents an approach to the design, sourcing and manufacture of clothing which maximises benefits to people and communi-ties while minimising impact on the environment”. At the basis of sustainable or ethical fashion lies the “triple bottom line” that needs to be incorporated at the core of fashion business practices314:
1. Social: Increasing the capacity and wellbeing of the people and communities be-hind fashion. Any fashion business depends on the people behind it. In a broader context, poverty and exploitation of the human workforce behind fashion affects the stability of the industry itself.
2. Environmental: Minimising the environmental impact of all business operations, throughout the supply chain. Creating and acting upon opportunities to reduce environmental issues beyond the immediate operations- such as awareness rais-ing, investment in and support of environmental initiatives.
3. Commercial: Without a robust financial business model, none of the above can be achieved. A sustainable approach includes quality products or services that meet market needs and demands and are fairly marketed.
313 Cfr. website Centexbel, “expertise Sustainabilty” 314 http://www.ethicalfashionforum.com/the-issues/ethical-fashion
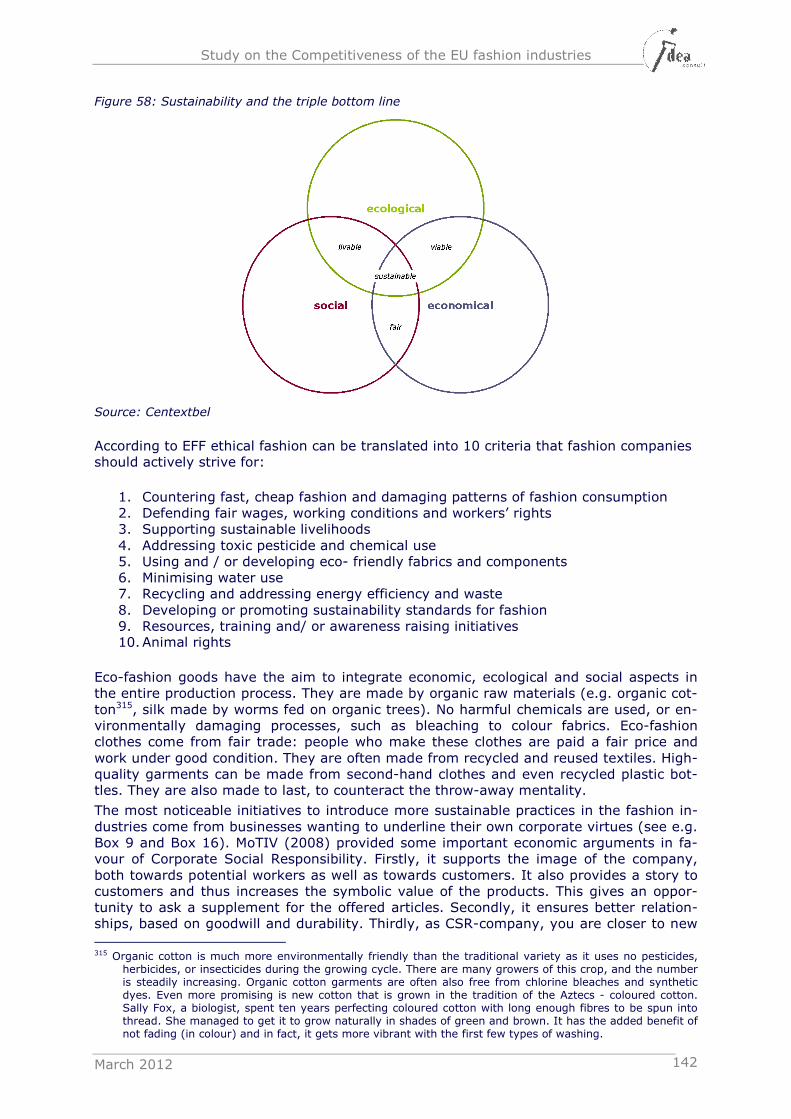
Study on the Competitiveness of the EU fashion industries
March 2012 142
Figure 58: Sustainability and the triple bottom line
Source: Centextbel
According to EFF ethical fashion can be translated into 10 criteria that fashion companies should actively strive for:
1. Countering fast, cheap fashion and damaging patterns of fashion consumption 2. Defending fair wages, working conditions and workers’ rights 3. Supporting sustainable livelihoods 4. Addressing toxic pesticide and chemical use 5. Using and / or developing eco- friendly fabrics and components 6. Minimising water use 7. Recycling and addressing energy efficiency and waste 8. Developing or promoting sustainability standards for fashion 9. Resources, training and/ or awareness raising initiatives 10. Animal rights
Eco-fashion goods have the aim to integrate economic, ecological and social aspects in the entire production process. They are made by organic raw materials (e.g. organic cot-ton315, silk made by worms fed on organic trees). No harmful chemicals are used, or en-vironmentally damaging processes, such as bleaching to colour fabrics. Eco-fashion clothes come from fair trade: people who make these clothes are paid a fair price and work under good condition. They are often made from recycled and reused textiles. High-quality garments can be made from second-hand clothes and even recycled plastic bot-tles. They are also made to last, to counteract the throw-away mentality.
The most noticeable initiatives to introduce more sustainable practices in the fashion in-dustries come from businesses wanting to underline their own corporate virtues (see e.g. Box 9 and Box 16). MoTIV (2008) provided some important economic arguments in fa-vour of Corporate Social Responsibility. Firstly, it supports the image of the company, both towards potential workers as well as towards customers. It also provides a story to customers and thus increases the symbolic value of the products. This gives an oppor-tunity to ask a supplement for the offered articles. Secondly, it ensures better relation-ships, based on goodwill and durability. Thirdly, as CSR-company, you are closer to new
315 Organic cotton is much more environmentally friendly than the traditional variety as it uses no pesticides,
herbicides, or insecticides during the growing cycle. There are many growers of this crop, and the number is steadily increasing. Organic cotton garments are often also free from chlorine bleaches and synthetic dyes. Even more promising is new cotton that is grown in the tradition of the Aztecs - coloured cotton. Sally Fox, a biologist, spent ten years perfecting coloured cotton with long enough fibres to be spun into thread. She managed to get it to grow naturally in shades of green and brown. It has the added benefit of not fading (in colour) and in fact, it gets more vibrant with the first few types of washing.
Study on the Competitiveness of the EU fashion industries
March 2012 143
evolutions in society, in a more leading role, anticipating new legislation.
The use of ‘CSR’-labels supports this evolution, so consumers will know if the fashion goods that they purchase meet their social and environmental standards. The more con-sumers know about the content of their fashion items, the more they may become aware of the total "lifecycle" of the product. The eco fashion movement, on a small or large scale, is about drawing the connections between consumers and their clothing, moving away from a disposable mentality, which might imply a major shift for a generation ac-customed to buying fashion goods without limitations (Belli, 2007). Examples of such sustainability labels are e.g. the European Ecolabel or the Italian standard of UNI for ‘eco-leather’. However, the MoTIV study also presented some challenges and bottlenecks related to the use of CSR-related labels. First, there is the strong proliferation of labels leading to more indistinctness with respect to the selection criteria, the meaning and limitations of these labels, and the measurability and comparability of different labels. Second, the familiarity with a specific label (reputation) strongly depends on the geo-graphic location. In addition, also the scope of the schemes might differ: some cover both environmental and social conditions, others only focus on environmental or only on social conditions.
An answer to the first two challenges is further ‘promoting’ the use of the European Eco-label, established in 1992 to encourage businesses to market products and services that are kinder to the environment. The criteria are agreed at European level, following wide consultation with experts, and the label itself is only awarded after verification that the product meets these high environmental and performance standards. Products and ser-vices awarded the Ecolabel carry the flower logo, allowing consumers (including public and private purchasers) to identify them easily. Products bearing the logo can be mar-keted throughout the European Union and the EEA countries (Norway, Iceland and Liech-tenstein). Because of the voluntary nature of the scheme, it does not create barriers to trade. On the contrary, many producers argue that it gives them a competitive ad-vantage.
Box 16: CSR initiatives in fashion
The Better Cotton Initiative (BCI)
“Just 2.4 percent of the world’s arable land is planted with cotton yet cotton accounts for 24 per-
cent of the world’s insecticide market and 11 percent of the sale of global pesticides. 73 percent of global cotton harvest comes from irrigated land.” (WWF, 2003)
The Better Cotton Initiative was founded in 2005 by adidas, Gap Inc., H&M, ICCO, IFAP, IFC, IKEA, Organic Exchange, Oxfam, PAN UK, and WWF. It aims to promote measurable improve-ments in the key environmental and social impacts of cotton cultivation worldwide to make it more economically, environmentally, and socially sustainable. Since 2005, the BCI has been working with organisations from across the cotton supply chain and interested stakeholders to facilitate a solution for the mainstream cotton sector. The BCI's philosophy is to develop a market for a new mainstream commodity: ‘Better Cotton’ and thereby transform the cotton commodity to bring long-term benefits for the environment, farmers and other people dependent on cotton for their livelihood (www.bettercotton.org).
The Leather Working Group (LWG)
The objective of LWG is to develop and maintain a protocol that assesses the compliance and envi-ronmental performance of tanners and promotes sustainable and appropriate environmental busi-ness practices within the leather industry. The group seeks to improve the tanning industry by creating alignment on environmental priorities, bringing visibility to best practices and providing suggested guidelines for continual improvement. LWG is a multi-stakeholder group, involving brands, suppliers, retailers, leading technical experts within the leather industry, NGOs and other stakeholder organisations. Currently there are over a 140 member companies from 21 different countries participating in the program.
The Leather Working Group is now in its sixth year of operation and is considered by many as one
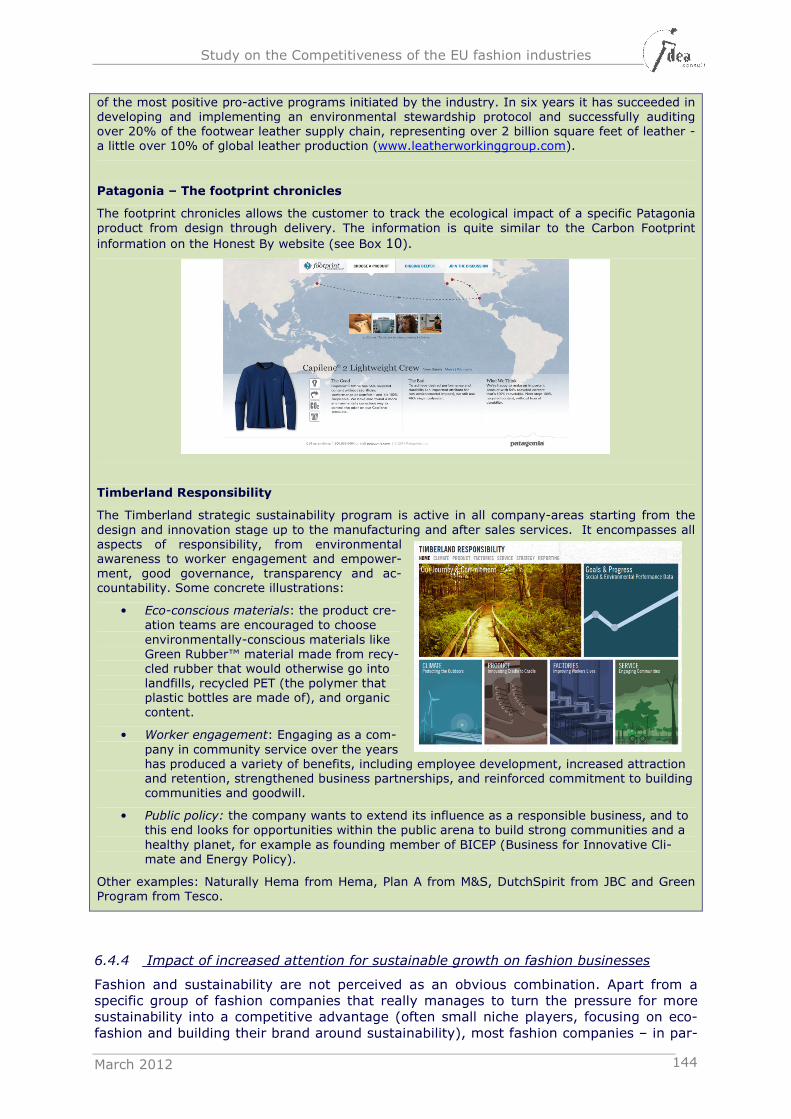
Study on the Competitiveness of the EU fashion industries
March 2012 144
of the most positive pro-active programs initiated by the industry. In six years it has succeeded in developing and implementing an environmental stewardship protocol and successfully auditing over 20% of the footwear leather supply chain, representing over 2 billion square feet of leather - a little over 10% of global leather production (www.leatherworkinggroup.com).
Patagonia – The footprint chronicles
The footprint chronicles allows the customer to track the ecological impact of a specific Patagonia product from design through delivery. The information is quite similar to the Carbon Footprint
information on the Honest By website (see Box 10).
Timberland Responsibility
The Timberland strategic sustainability program is active in all company-areas starting from the design and innovation stage up to the manufacturing and after sales services. It encompasses all aspects of responsibility, from environmental awareness to worker engagement and empower-ment, good governance, transparency and ac-countability. Some concrete illustrations:
• Eco-conscious materials: the product cre-ation teams are encouraged to choose environmentally-conscious materials like Green Rubber™ material made from recy-cled rubber that would otherwise go into landfills, recycled PET (the polymer that plastic bottles are made of), and organic content.
• Worker engagement: Engaging as a com-pany in community service over the years has produced a variety of benefits, including employee development, increased attraction and retention, strengthened business partnerships, and reinforced commitment to building communities and goodwill.
• Public policy: the company wants to extend its influence as a responsible business, and to this end looks for opportunities within the public arena to build strong communities and a healthy planet, for example as founding member of BICEP (Business for Innovative Cli-mate and Energy Policy).
Other examples: Naturally Hema from Hema, Plan A from M&S, DutchSpirit from JBC and Green Program from Tesco.
6.4.4 Impact of increased attention for sustainable growth on fashion businesses
Fashion and sustainability are not perceived as an obvious combination. Apart from a specific group of fashion companies that really manages to turn the pressure for more sustainability into a competitive advantage (often small niche players, focusing on eco-fashion and building their brand around sustainability), most fashion companies – in par-
Study on the Competitiveness of the EU fashion industries
March 2012 145
ticular the established international brands – generally are not perceived as frontrunners in the sustainability debate. Especially regulation and public opinion put pressure on fashion businesses to evolve to a more sustainable practice.
Box 17: EU legislation on sustainability: stimulus or burden for a more competitive EU fashion in-dustry?
Compared to other regions in the world, the European Union is known to have an exten-sive and rather stringent legal framework to reduce the negative environmental impact of industrial activities. The current legal framework to stimulate more sustainable eco-nomic development - including e.g. the REACH-regulation, IPPC regulations, Framework for Community action in the field of water policy, Scheme for greenhouse gas emis-sions316, complemented by some voluntary schemes like EG EMAS317 and ISO 14000 - has resulted in demanding rules and framework conditions with which companies in the EU, including those in the fashion industries, have to comply. The more stringent EU legal framework and environmental regulation can be seen as both a challenge/threat and an opportunity. A potential negative effect of the stringent legal framework on the EU fashion industries is a further relocation of certain produc-tion/manufacturing companies to areas where environmental standards are lower. On the other hand, environmental regulations also provide an incentive to invest in R&D to improve energy efficiency and to decrease the share of energy in total production costs. However, the adaption process takes time and requires significant entrepreneurial en-deavor, which is very demanding and risky, in particular for the many SMEs in EU fash-ion manufacturing.
This pressure is felt in the first place by those fashion companies that operate in or con-trol international value chains (luxury fashion brands, premium fashion brands, vertically integrated retailers), and those companies that work with raw materials that are under discussion from a sustainability point of view (especially in luxury fashion brands and to some extent also premium fashion brands):
• Operating and controlling global value chains, first of all brings along a high social responsibility to the international brands to closely monitor working conditions throughout the value chain (including subcontractors). Many globally active fash-ion companies now have established systems to monitor and audit all parts in the value chain (e.g. Inditex). Secondly, the growing pressure to explicitly account for the high negative environmental impact of transportation in the global value chain in the total cost of fashion goods, provides globally organized fashion companies (especially those businesses with a strong cost-efficiency focus, such as the verti-cally integrated retailers) with a challenge to potentially reconfigure the value chain over time for efficiency reasons. From an environmental point of view, cur-rent low wage countries in Asia might lose part of their attractiveness in favour of countries closer to the large European consumer market. This could provide new opportunities for manufacturers in Europe.
• A second challenge for fashion companies that arises from the sustainability de-bate, relates to the use of a number of more exclusive raw materials. Ethical dis-
316 Proposal for a regulation concerning the Registration, Evaluation, Authorisation and restriction of Chemicals
(REACH) and establishing a European chemicals agency; Directive 96/61//EC on Integrated Pollution Pre-vention and Control (IPPC); Directive 2000/60/EC of the European Parliament and of the Council of 23 Oc-tober 2000, establishing a framework for Community action in the field of water policy; Directive 2003/87/EC establishing a scheme for greenhouse gas emission allowance trading within the Community
317 Regulation (EEC) No 761/2001 of the European Parliament and of the Council of 19 March 2001 allowing voluntary participation by organisations in a Community eco-management and audit scheme (EMAS) and
Study on the Competitiveness of the EU fashion industries
March 2012 146
cussions about animal rights, but also discussions on biodiversity and the use of environmentally friendly production processes, puts pressure on the use of mate-rials such as fur, exotic leather or silk in fashion goods. This is especially relevant for the luxury fashion brands that are the main users of this type of materials. The other side of the coin is that luxury fashion brands are triggered to invest in find-ing new and more sustainable exclusive materials such as technical textiles.
Apart from the pressure for more sustainable business development in multinational fashion companies, fashion companies that are active in the manufacturing process are pushed to introduce new production techniques that are less harmful for the environ-ment. Regulation often is an important driver behind the introduction of more sustainable production techniques. Numerous R&D projects in the fashion industries are focused on the development of more environmentally friendly production methods (e.g. Box 18).
Box 18: R&D efforts in the leather industry to lower environmental impact of tanning
The production of durable leather from animal skin is time consuming (up to 70 process steps) and environmentally damaging (one ton of leather causes 60 tons of wastewater and non-negligible amount of solid waste as well).318 An important research direction is the development of commercially viable alternatives to the traditional tanning methods based on metals (such as chrome, accounting for 85% of leather produced). Sustainabil-ity-minded research efforts also target environmentally friendly dye technologies, and the development of green substitutes for environmentally damaging additives used in the tanning and finishing processes.
Results that reduce the pollution load of the tanning process demonstrate that currently stakeholders experiment with several research directions319, including cleaner process and end-of-pipe technologies. As for the former research direction, Fraunhofer Institute for Environmental Safety and Energy Technology (Umsicht, Germany) experimented with compressed carbon dioxide, which reduced tanning time from 30 hours to 3 to 5 hours. At the same time the amount of wastewater was reduced by 90 % (www.fraunhofer.de). The Italian Conciaricerca s.r.l. developed a new technology: “TANFAST”, that allows for rapid, continuous tanning and low wastewater discharge, significantly reduced water, chemicals and energy consumption etc. At the same time the new technology improves flexibility as it facilitates a quick response to consumers’ changing preferences.
Whereas several fashion companies are challenged to adapt their business models to-wards more sustainable practices, for other businesses the focus on sustainability pro-vides new opportunities to build a unique selling proposition. Especially small niche play-ers in the fashion industries are at the forefront in experimenting with more sustainable business models. Also vertically integrated fashion retailers and department stores in-creasingly acknowledge the competitive benefits of incorporating sustainability in their business strategies. A major challenge for the coming years is to find the right balance between sustainable practices and economic viability.
318 Source: Fraunhofer Institute for Environmental Safety and Energy Technology, Umsicht, Germany 319 Consequently, parallel research is necessary to develop tools to assess and compare the environmental
impact from different processes
Study on the Competitiveness of the EU fashion industries
March 2012 147
6.5 Raw materials and energy
Strongly related to the discussion in the previous section on sustainable economic growth is the problem of access to raw materials. Recent price increases of both energy and raw materials have highlighted the scarcity of a number of input factors that are important for the fashion industries and its supplying industries. Scarcity in raw materials and in-creasing prices for raw materials urge fashion companies to invest in finding alternatives. In addition, the environmental goals that have been set at EU policy level push the EU fashion industries to focus on new techniques and new business models that allow for more resource efficient production mechanisms.
The next paragraphs discuss price evolutions of a number of important raw materials for the fashion industries, as well as of energy products. Only for a limited number of raw materials (e.g. flax) the EU controls the market. For most raw materials the EU strongly depends on international markets and thus is a price taker.
6.5.1 Textile fibres
6.5.1.1 Natural fibres
Among the natural fibres, cotton and wool are the most commonly used. Figure 59 and Figure 60 present the average spot prices of cotton and wool (both fine and coarse) from January 1980 up to December 2011.
Prices of cotton have been characterised by a downward trend in the mid-1980’s, fol-lowed by a gradual and fluctuating increase until 1996, where prices reached a level above 100 cents per Pound, after which they more or less stabilised around 60-70 cents per Pound. But in 2010-2011 prices have peaked exceptionally (to over 200 cents per Pound) 320. Currently, the price has reached its normal level again, but the worldwide trade of cotton might become more and more volatile in the future due to more extreme weather conditions.
320 Reasons for this high peak were the bad weather conditions and floods in some major cotton producing
areas (Australia, Pakistan, China and India), but also the consequential ‘panic buying’ by cotton mills and export restrictions in order to protect local manufacturers (e.g. India). White G. (2011), “Cotton price causes 'panic buying' as nears 150-year high”), The Telegraph - 4 February 2011
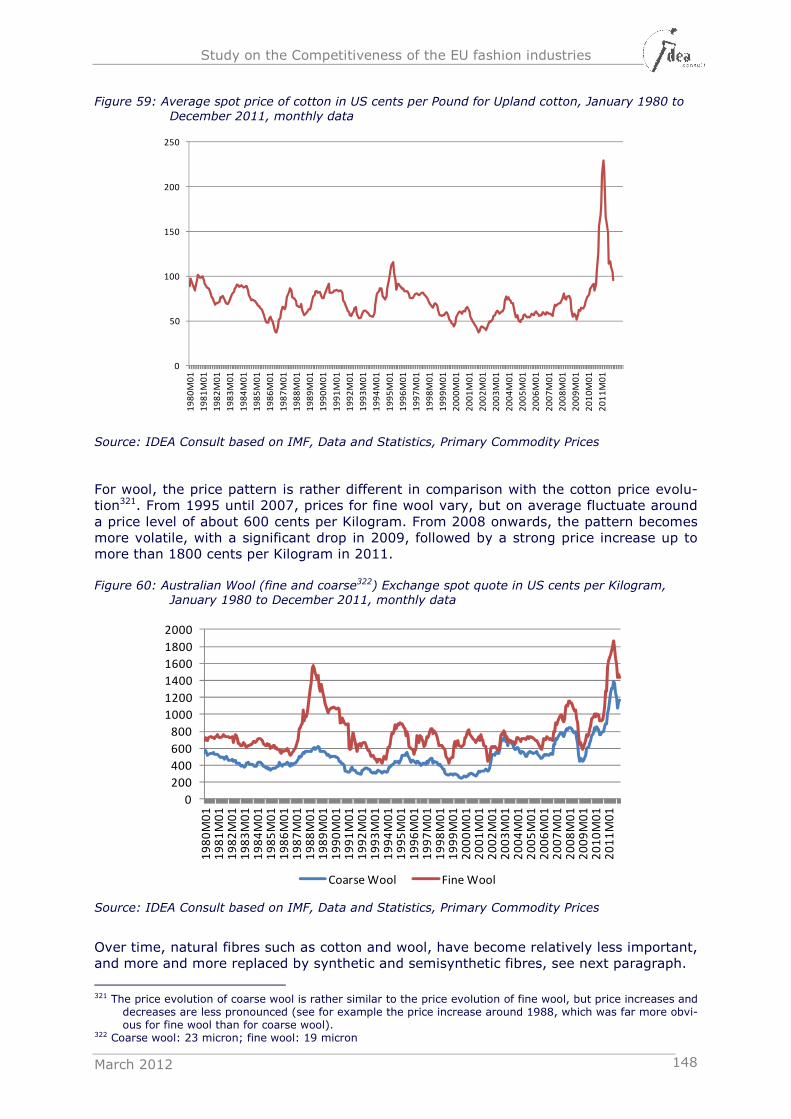
Study on the Competitiveness of the EU fashion industries
March 2012 148
Figure 59: Average spot price of cotton in US cents per Pound for Upland cotton, January 1980 to
December 2011, monthly data
Source: IDEA Consult based on IMF, Data and Statistics, Primary Commodity Prices
For wool, the price pattern is rather different in comparison with the cotton price evolu-tion321. From 1995 until 2007, prices for fine wool vary, but on average fluctuate around a price level of about 600 cents per Kilogram. From 2008 onwards, the pattern becomes more volatile, with a significant drop in 2009, followed by a strong price increase up to more than 1800 cents per Kilogram in 2011.
Figure 60: Australian Wool (fine and coarse322) Exchange spot quote in US cents per Kilogram, January 1980 to December 2011, monthly data
Source: IDEA Consult based on IMF, Data and Statistics, Primary Commodity Prices
Over time, natural fibres such as cotton and wool, have become relatively less important, and more and more replaced by synthetic and semisynthetic fibres, see next paragraph.
321 The price evolution of coarse wool is rather similar to the price evolution of fine wool, but price increases and
decreases are less pronounced (see for example the price increase around 1988, which was far more obvi-ous for fine wool than for coarse wool).
322 Coarse wool: 23 micron; fine wool: 19 micron
0
50
100
150
200
250
19
80
M0
1
19
81
M0
1
19
82
M0
1
19
83
M0
1
19
84
M0
1
19
85
M0
1
19
86
M0
1
19
87
M0
1
19
88
M0
1
19
89
M0
1
19
90
M0
1
19
91
M0
1
19
92
M0
1
19
93
M0
1
19
94
M0
1
19
95
M0
1
19
96
M0
1
19
97
M0
1
19
98
M0
1
19
99
M0
1
20
00
M0
1
20
01
M0
1
20
02
M0
1
20
03
M0
1
20
04
M0
1
20
05
M0
1
20
06
M0
1
20
07
M0
1
20
08
M0
1
20
09
M0
1
20
10
M0
1
20
11
M0
1
0
200
400
600
800
1000
1200
1400
1600
1800
2000
19
80
M0
11
98
1M
01
19
82
M0
11
98
3M
01
19
84
M0
11
98
5M
01
19
86
M0
11
98
7M
01
19
88
M0
11
98
9M
01
19
90
M0
11
99
1M
01
19
92
M0
11
99
3M
01
19
94
M0
11
99
5M
01
19
96
M0
11
99
7M
01
19
98
M0
11
99
9M
01
20
00
M0
12
00
1M
01
20
02
M0
12
00
3M
01
20
04
M0
12
00
5M
01
20
06
M0
12
00
7M
01
20
08
M0
12
00
9M
01
20
10
M0
12
01
1M
01
Coarse Wool Fine Wool
Study on the Competitiveness of the EU fashion industries
March 2012 149
6.5.1.2 Synthetic fibres
Many synthetic fibres, such as nylon, polyester and acrylic, are made from petrochemi-cals. As oil prices have been increasing at a steady pace, this is reflected in the costs for synthetic fibres as well. Moreover and even more important when it comes to access to raw materials, the worldwide stock of petroleum is limited and will phase out over time. Some studies even expect this to happen in 10 to 40 years (Sorrell et al., 2009; Connor, 2009). This puts a major constraint to the use of synthetic fibres in the fashion industries in the longer run.
6.5.1.3 Organic fibres
Although fashion companies show a growing interest in using organic fibres, especially smaller companies are still faced with a limited supply of organic fibres. Whereas major labels can order large quantities of organic cotton for a mainstream clothing line, most mills are not interested in producing specialty fabrics in small quantities, forcing design-ers to use an extremely limited colour palette (those olive greens, burlap browns and dusty off-whites) or find creative alternatives from recycling fabrics to making one-of-a-kind pieces (Challa, 2010).
6.5.2 Leather
First mid 2011, the Wall Street Journal published prices and demand for leather in the fashion industry. In that period cattle-hide prices were at their highest level in almost a decade (24% price increase between 2010 and 2011). The U.S., ranked third in annual cattle-hide production (China is first, followed by Brazil), had witnessed an increase in demand, partly explained by the growing middle class in countries as China and Vietnam, combined with shrinking supplies, putting serious pressure on hide prices. Besides the cattle-hides also the demand for exotic skins increased, because of a “rebound in high-end consumption.” Some fashion companies even expect further increases in primary materials in the future (Celeste, 2011). The following figure shows the general monthly indices for raw hides and skin prices from March 2009 to September 2010.
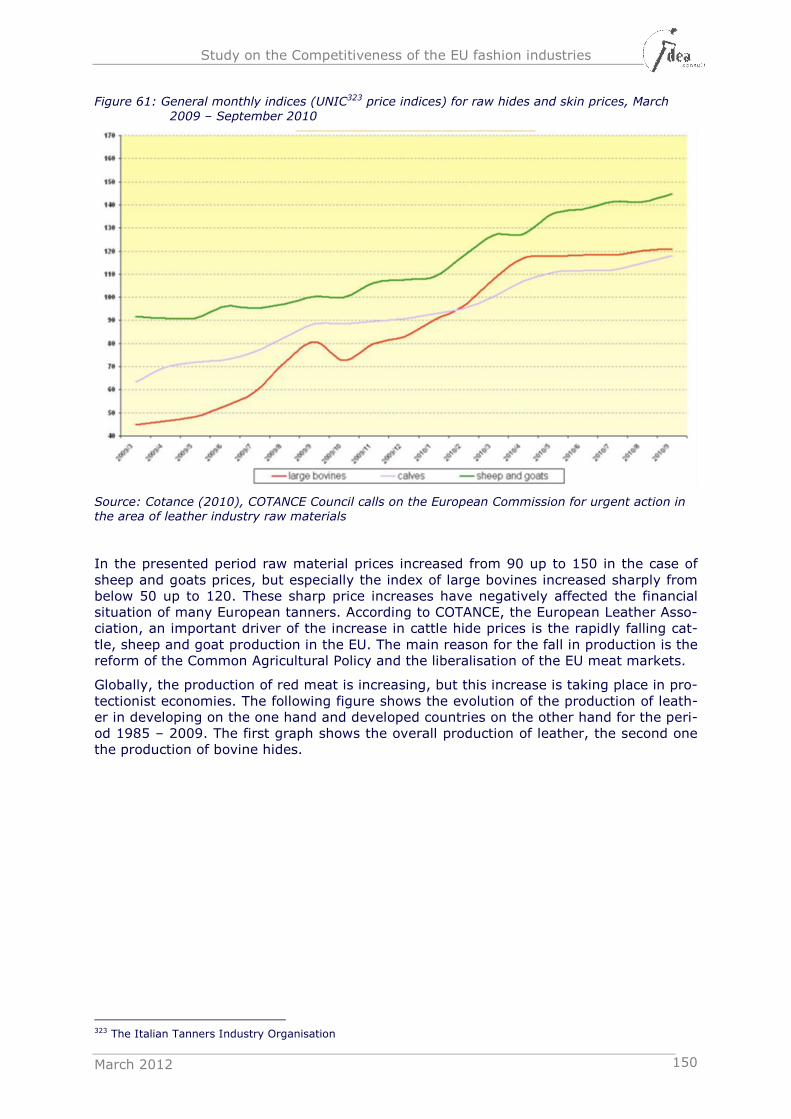
Study on the Competitiveness of the EU fashion industries
March 2012 150
Figure 61: General monthly indices (UNIC323 price indices) for raw hides and skin prices, March
2009 – September 2010
Source: Cotance (2010), COTANCE Council calls on the European Commission for urgent action in the area of leather industry raw materials
In the presented period raw material prices increased from 90 up to 150 in the case of sheep and goats prices, but especially the index of large bovines increased sharply from below 50 up to 120. These sharp price increases have negatively affected the financial situation of many European tanners. According to COTANCE, the European Leather Asso-ciation, an important driver of the increase in cattle hide prices is the rapidly falling cat-tle, sheep and goat production in the EU. The main reason for the fall in production is the reform of the Common Agricultural Policy and the liberalisation of the EU meat markets.
Globally, the production of red meat is increasing, but this increase is taking place in pro-tectionist economies. The following figure shows the evolution of the production of leath-er in developing on the one hand and developed countries on the other hand for the peri-od 1985 – 2009. The first graph shows the overall production of leather, the second one the production of bovine hides.
323 The Italian Tanners Industry Organisation
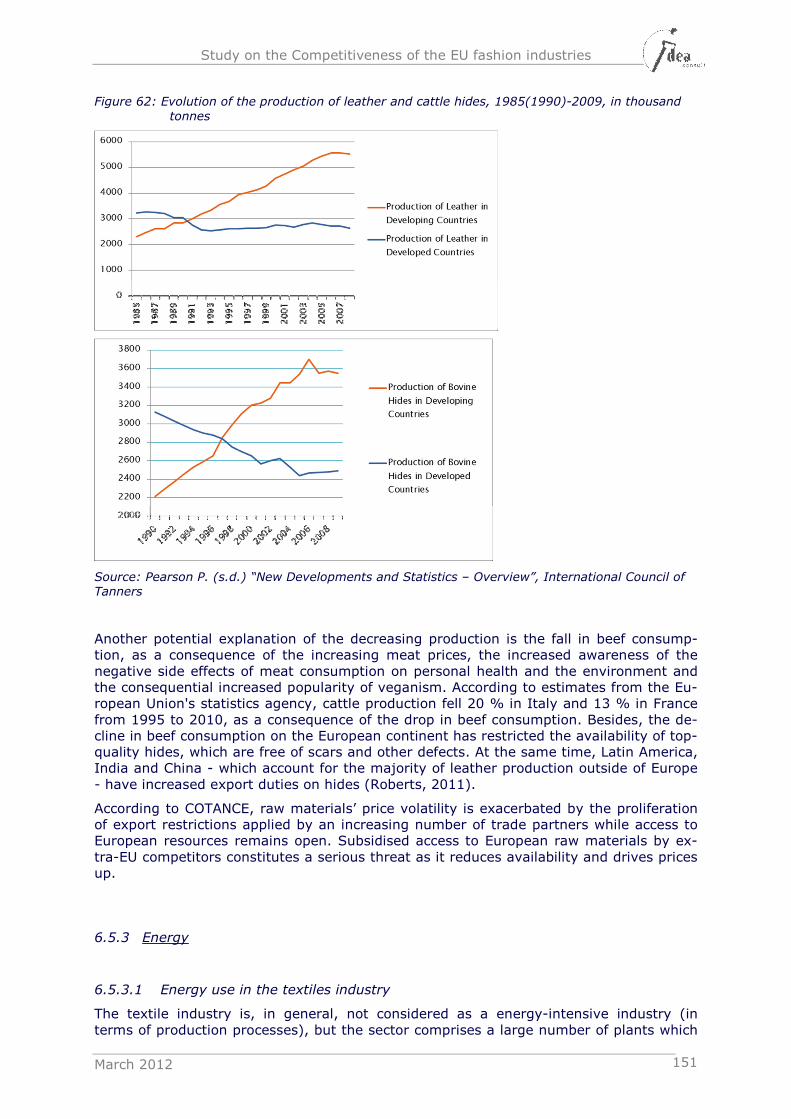
Study on the Competitiveness of the EU fashion industries
March 2012 151
Figure 62: Evolution of the production of leather and cattle hides, 1985(1990)-2009, in thousand
tonnes
Source: Pearson P. (s.d.) “New Developments and Statistics – Overview”, International Council of Tanners
Another potential explanation of the decreasing production is the fall in beef consump-tion, as a consequence of the increasing meat prices, the increased awareness of the negative side effects of meat consumption on personal health and the environment and the consequential increased popularity of veganism. According to estimates from the Eu-ropean Union's statistics agency, cattle production fell 20 % in Italy and 13 % in France from 1995 to 2010, as a consequence of the drop in beef consumption. Besides, the de-cline in beef consumption on the European continent has restricted the availability of top-quality hides, which are free of scars and other defects. At the same time, Latin America, India and China - which account for the majority of leather production outside of Europe - have increased export duties on hides (Roberts, 2011).
According to COTANCE, raw materials’ price volatility is exacerbated by the proliferation of export restrictions applied by an increasing number of trade partners while access to European resources remains open. Subsidised access to European raw materials by ex-tra-EU competitors constitutes a serious threat as it reduces availability and drives prices up.
6.5.3 Energy
6.5.3.1 Energy use in the textiles industry
The textile industry is, in general, not considered as a energy-intensive industry (in terms of production processes), but the sector comprises a large number of plants which
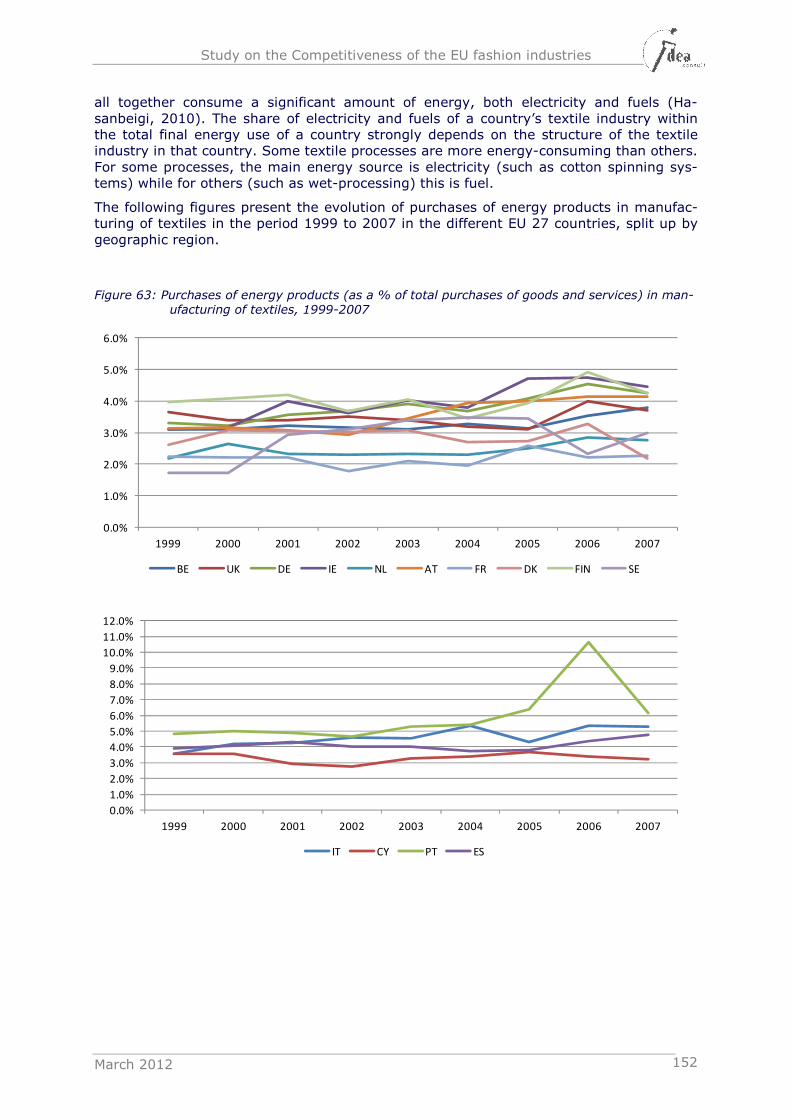
Study on the Competitiveness of the EU fashion industries
March 2012 152
all together consume a significant amount of energy, both electricity and fuels (Ha-sanbeigi, 2010). The share of electricity and fuels of a country’s textile industry within the total final energy use of a country strongly depends on the structure of the textile industry in that country. Some textile processes are more energy-consuming than others. For some processes, the main energy source is electricity (such as cotton spinning sys-tems) while for others (such as wet-processing) this is fuel.
The following figures present the evolution of purchases of energy products in manufac-turing of textiles in the period 1999 to 2007 in the different EU 27 countries, split up by geographic region.
Figure 63: Purchases of energy products (as a % of total purchases of goods and services) in man-ufacturing of textiles, 1999-2007
0.0%
1.0%
2.0%
3.0%
4.0%
5.0%
6.0%
1999 2000 2001 2002 2003 2004 2005 2006 2007
BE UK DE IE NL AT FR DK FIN SE
0.0%
1.0%
2.0%
3.0%
4.0%
5.0%
6.0%
7.0%
8.0%
9.0%
10.0%
11.0%
12.0%
1999 2000 2001 2002 2003 2004 2005 2006 2007
IT CY PT ES
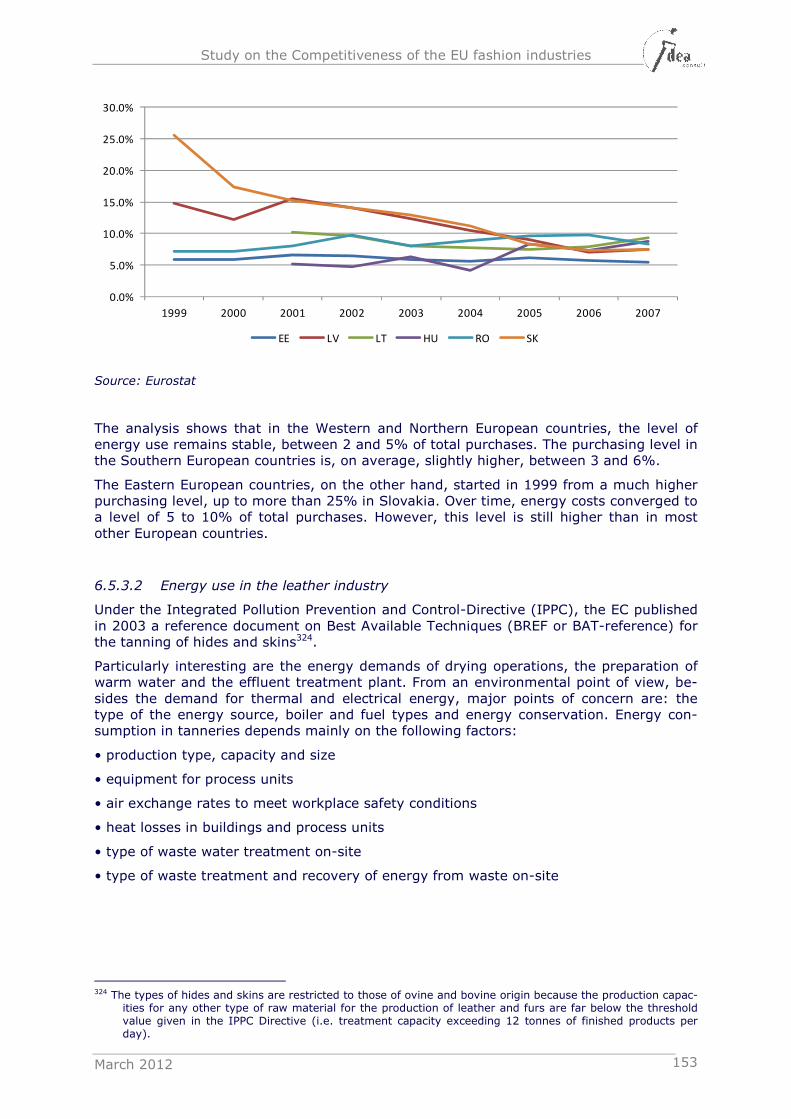
Study on the Competitiveness of the EU fashion industries
March 2012 153
Source: Eurostat
The analysis shows that in the Western and Northern European countries, the level of energy use remains stable, between 2 and 5% of total purchases. The purchasing level in the Southern European countries is, on average, slightly higher, between 3 and 6%.
The Eastern European countries, on the other hand, started in 1999 from a much higher purchasing level, up to more than 25% in Slovakia. Over time, energy costs converged to a level of 5 to 10% of total purchases. However, this level is still higher than in most other European countries.
6.5.3.2 Energy use in the leather industry
Under the Integrated Pollution Prevention and Control-Directive (IPPC), the EC published in 2003 a reference document on Best Available Techniques (BREF or BAT-reference) for the tanning of hides and skins324.
Particularly interesting are the energy demands of drying operations, the preparation of warm water and the effluent treatment plant. From an environmental point of view, be-sides the demand for thermal and electrical energy, major points of concern are: the type of the energy source, boiler and fuel types and energy conservation. Energy con-sumption in tanneries depends mainly on the following factors:
• production type, capacity and size
• equipment for process units
• air exchange rates to meet workplace safety conditions
• heat losses in buildings and process units
• type of waste water treatment on-site
• type of waste treatment and recovery of energy from waste on-site
324 The types of hides and skins are restricted to those of ovine and bovine origin because the production capac-
ities for any other type of raw material for the production of leather and furs are far below the threshold value given in the IPPC Directive (i.e. treatment capacity exceeding 12 tonnes of finished products per day).
0.0%
5.0%
10.0%
15.0%
20.0%
25.0%
30.0%
1999 2000 2001 2002 2003 2004 2005 2006 2007
EE LV LT HU RO SK
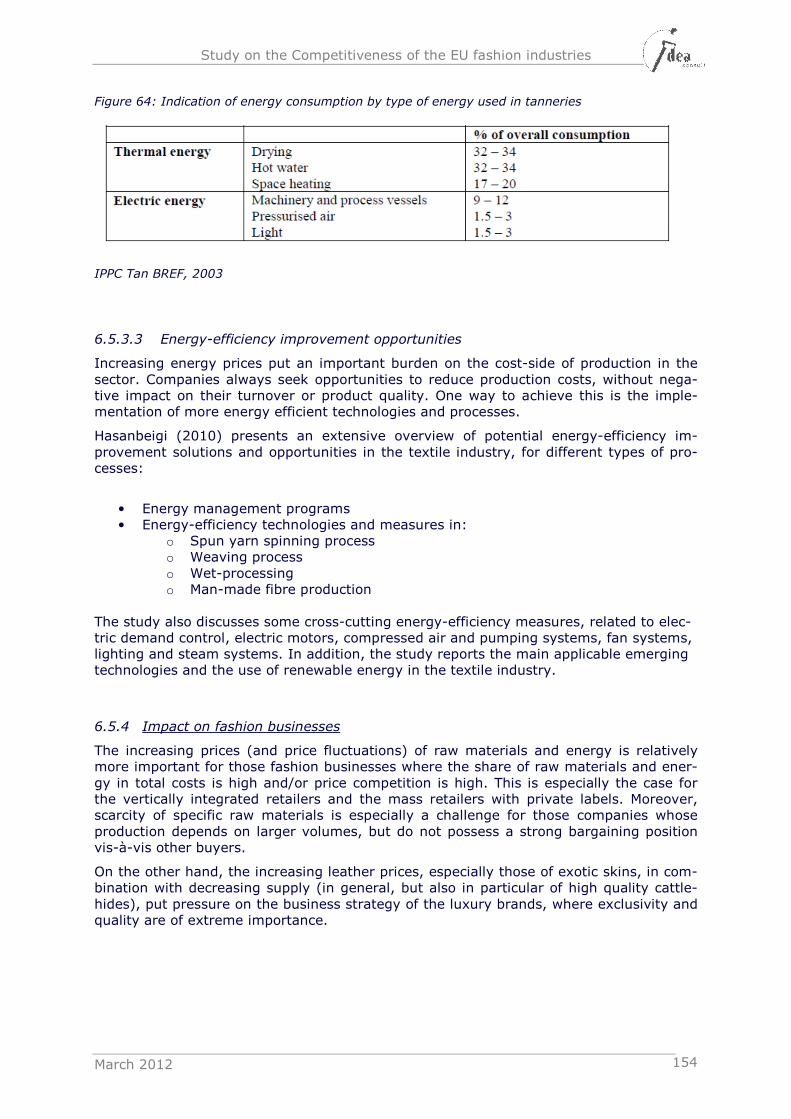
Study on the Competitiveness of the EU fashion industries
March 2012 154
Figure 64: Indication of energy consumption by type of energy used in tanneries
IPPC Tan BREF, 2003
6.5.3.3 Energy-efficiency improvement opportunities
Increasing energy prices put an important burden on the cost-side of production in the sector. Companies always seek opportunities to reduce production costs, without nega-tive impact on their turnover or product quality. One way to achieve this is the imple-mentation of more energy efficient technologies and processes.
Hasanbeigi (2010) presents an extensive overview of potential energy-efficiency im-provement solutions and opportunities in the textile industry, for different types of pro-cesses:
• Energy management programs • Energy-efficiency technologies and measures in:
o Spun yarn spinning process o Weaving process o Wet-processing o Man-made fibre production
The study also discusses some cross-cutting energy-efficiency measures, related to elec-tric demand control, electric motors, compressed air and pumping systems, fan systems, lighting and steam systems. In addition, the study reports the main applicable emerging technologies and the use of renewable energy in the textile industry.
6.5.4 Impact on fashion businesses
The increasing prices (and price fluctuations) of raw materials and energy is relatively more important for those fashion businesses where the share of raw materials and ener-gy in total costs is high and/or price competition is high. This is especially the case for the vertically integrated retailers and the mass retailers with private labels. Moreover, scarcity of specific raw materials is especially a challenge for those companies whose production depends on larger volumes, but do not possess a strong bargaining position vis-à-vis other buyers.
On the other hand, the increasing leather prices, especially those of exotic skins, in com-bination with decreasing supply (in general, but also in particular of high quality cattle-hides), put pressure on the business strategy of the luxury brands, where exclusivity and quality are of extreme importance.
Study on the Competitiveness of the EU fashion industries
March 2012 155
6.6 Intellectual property rights (IPR) protection
One of the main competitive strengths of the EU fashion industries lies in the intangible assets of the fashion goods, such as their unique design and successful branding. An ad-equate legal framework to protect IPR as well as an effective enforcement therefore is very important for a competitive EU fashion industries.
In what follows, we estimate the importance of the problem of counterfeiting and piracy for the EU fashion industries’ competitiveness and we present the most important exist-ing mechanisms to protect IPR.
6.6.1 The problem of counterfeiting and piracy in fashion
According to the OECD (2008) and the European Commission (2008), fashion items such as clothing, jewellery, accessories, footwear still account for the largest part of piracy and counterfeit trade. For design, the most infringed rights are illegal copies (piracy), mainly for SMEs. But also the share of counterfeit products (the violating of the trademark), is relatively high in the fashion industries and negatively affects the demand for EU fashion goods. The OECD calculated a counterfeiting factor of 8 for articles of apparel and cloth-ing accessories in the OECD: the ratio of seized counterfeit products to legitimate traded products is for this product group more than eight times higher than in total trade (OECD, 2008). The increasing globalisation has made the problem of counterfeiting even worse (King et al., s.d.).
Textile, clothing and footwear were responsible for 55.8% of the total number of inter-ventions by European Customs in 2008, followed by a 10.4% for jewellery. In terms of detained articles, textile, clothing and footwear were only responsible for 9.9% of the total, and jewellery for less than 1%. Most of detained articles relate to the music indus-try -cassettes, CD’s and DVD- (44% of the total) and cigarettes (23% of the total).
More recent figures of 2010 (EC-Taxation and Customs Unit, 2010) confirm the large share of custom interventions in terms of cases (see figure below): while clothing was representing only 6.7% of the total articles seized (with nearly 7.8 million articles seized in 2010, against 6 million in 2009), clothing and footwear products are by far the prod-ucts that generate the highest number of customs procedures (around 60% of the total procedures for the year 2010).
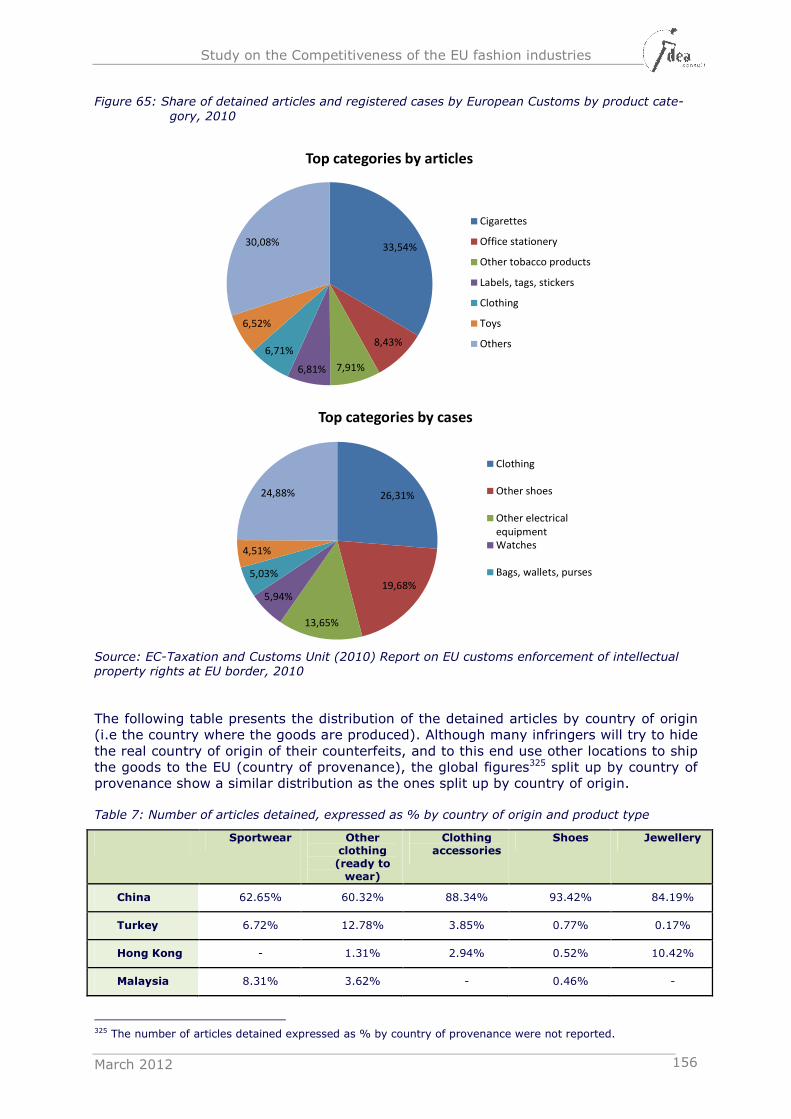
Study on the Competitiveness of the EU fashion industries
March 2012 156
Figure 65: Share of detained articles and registered cases by European Customs by product cate-
gory, 2010
Source: EC-Taxation and Customs Unit (2010) Report on EU customs enforcement of intellectual property rights at EU border, 2010
The following table presents the distribution of the detained articles by country of origin (i.e the country where the goods are produced). Although many infringers will try to hide the real country of origin of their counterfeits, and to this end use other locations to ship the goods to the EU (country of provenance), the global figures325 split up by country of provenance show a similar distribution as the ones split up by country of origin.
Table 7: Number of articles detained, expressed as % by country of origin and product type
Sportwear Other
clothing (ready to wear)
Clothing accessories
Shoes Jewellery
China 62.65% 60.32% 88.34% 93.42% 84.19%
Turkey 6.72% 12.78% 3.85% 0.77% 0.17%
Hong Kong - 1.31% 2.94% 0.52% 10.42%
Malaysia 8.31% 3.62% - 0.46% -
325 The number of articles detained expressed as % by country of provenance were not reported.
33,54%
8,43%
7,91%6,81%
6,71%
6,52%
30,08%
Top categories by articles
Cigarettes
Office stationery
Other tobacco products
Labels, tags, stickers
Clothing
Toys
Others
26,31%
19,68%
13,65%
5,94%
5,03%
4,51%
24,88%
Top categories by cases
Clothing
Other shoes
Other electrical
equipment
Watches
Bags, wallets, purses
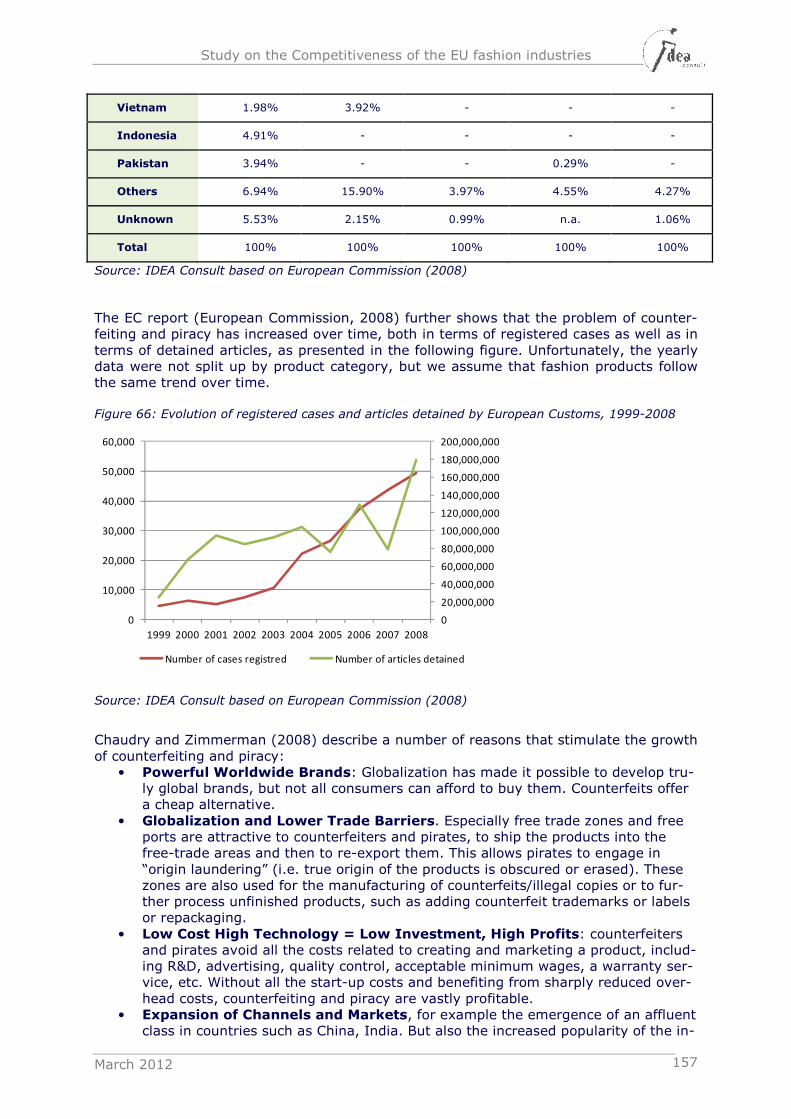
Study on the Competitiveness of the EU fashion industries
March 2012 157
Vietnam 1.98% 3.92% - - -
Indonesia 4.91% - - - -
Pakistan 3.94% - - 0.29% -
Others 6.94% 15.90% 3.97% 4.55% 4.27%
Unknown 5.53% 2.15% 0.99% n.a. 1.06%
Total 100% 100% 100% 100% 100%
Source: IDEA Consult based on European Commission (2008)
The EC report (European Commission, 2008) further shows that the problem of counter-feiting and piracy has increased over time, both in terms of registered cases as well as in terms of detained articles, as presented in the following figure. Unfortunately, the yearly data were not split up by product category, but we assume that fashion products follow the same trend over time.
Figure 66: Evolution of registered cases and articles detained by European Customs, 1999-2008
Source: IDEA Consult based on European Commission (2008)
Chaudry and Zimmerman (2008) describe a number of reasons that stimulate the growth of counterfeiting and piracy:
• Powerful Worldwide Brands: Globalization has made it possible to develop tru-ly global brands, but not all consumers can afford to buy them. Counterfeits offer a cheap alternative.
• Globalization and Lower Trade Barriers. Especially free trade zones and free ports are attractive to counterfeiters and pirates, to ship the products into the free-trade areas and then to re-export them. This allows pirates to engage in “origin laundering” (i.e. true origin of the products is obscured or erased). These zones are also used for the manufacturing of counterfeits/illegal copies or to fur-ther process unfinished products, such as adding counterfeit trademarks or labels or repackaging.
• Low Cost High Technology = Low Investment, High Profits: counterfeiters and pirates avoid all the costs related to creating and marketing a product, includ-ing R&D, advertising, quality control, acceptable minimum wages, a warranty ser-vice, etc. Without all the start-up costs and benefiting from sharply reduced over-head costs, counterfeiting and piracy are vastly profitable.
• Expansion of Channels and Markets, for example the emergence of an affluent class in countries such as China, India. But also the increased popularity of the in-
0
20,000,000
40,000,000
60,000,000
80,000,000
100,000,000
120,000,000
140,000,000
160,000,000
180,000,000
200,000,000
0
10,000
20,000
30,000
40,000
50,000
60,000
1999 2000 2001 2002 2003 2004 2005 2006 2007 2008
Number of cases registred Number of articles detained
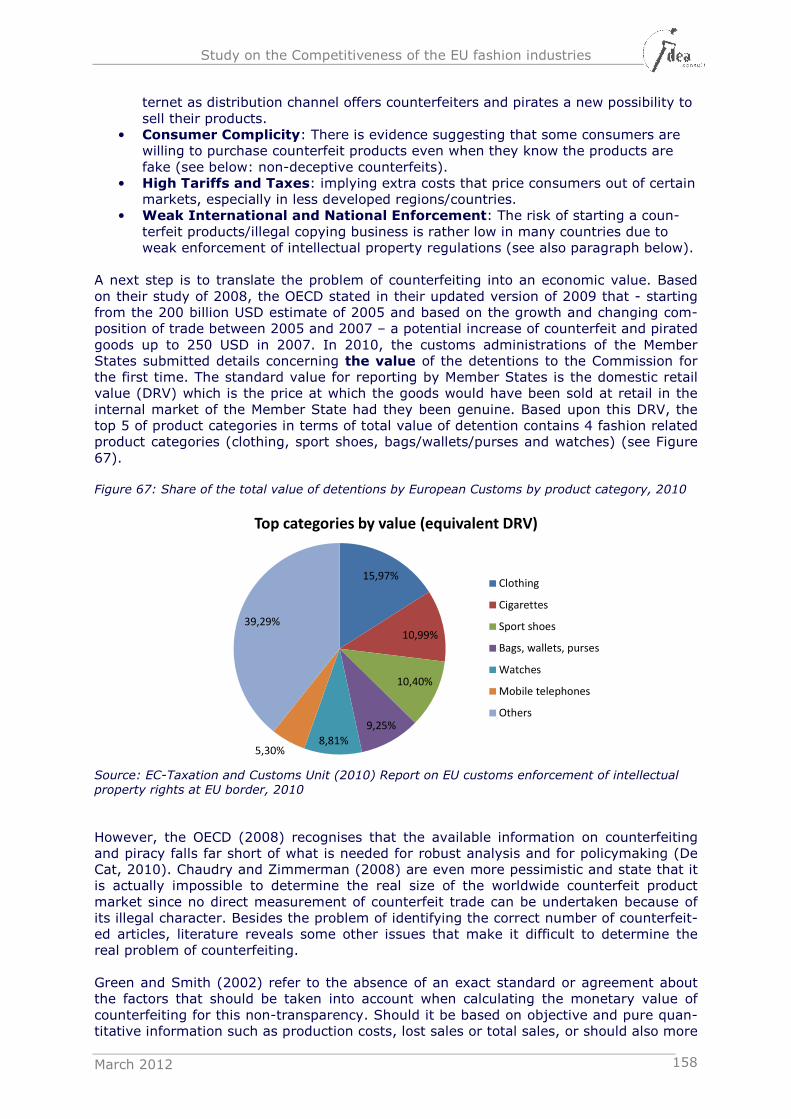
Study on the Competitiveness of the EU fashion industries
March 2012 158
ternet as distribution channel offers counterfeiters and pirates a new possibility to sell their products.
• Consumer Complicity: There is evidence suggesting that some consumers are willing to purchase counterfeit products even when they know the products are fake (see below: non-deceptive counterfeits).
• High Tariffs and Taxes: implying extra costs that price consumers out of certain markets, especially in less developed regions/countries.
• Weak International and National Enforcement: The risk of starting a coun-terfeit products/illegal copying business is rather low in many countries due to weak enforcement of intellectual property regulations (see also paragraph below).
A next step is to translate the problem of counterfeiting into an economic value. Based on their study of 2008, the OECD stated in their updated version of 2009 that - starting from the 200 billion USD estimate of 2005 and based on the growth and changing com-position of trade between 2005 and 2007 – a potential increase of counterfeit and pirated goods up to 250 USD in 2007. In 2010, the customs administrations of the Member States submitted details concerning the value of the detentions to the Commission for the first time. The standard value for reporting by Member States is the domestic retail value (DRV) which is the price at which the goods would have been sold at retail in the internal market of the Member State had they been genuine. Based upon this DRV, the top 5 of product categories in terms of total value of detention contains 4 fashion related product categories (clothing, sport shoes, bags/wallets/purses and watches) (see Figure 67).
Figure 67: Share of the total value of detentions by European Customs by product category, 2010
Source: EC-Taxation and Customs Unit (2010) Report on EU customs enforcement of intellectual property rights at EU border, 2010
However, the OECD (2008) recognises that the available information on counterfeiting and piracy falls far short of what is needed for robust analysis and for policymaking (De Cat, 2010). Chaudry and Zimmerman (2008) are even more pessimistic and state that it is actually impossible to determine the real size of the worldwide counterfeit product market since no direct measurement of counterfeit trade can be undertaken because of its illegal character. Besides the problem of identifying the correct number of counterfeit-ed articles, literature reveals some other issues that make it difficult to determine the real problem of counterfeiting. Green and Smith (2002) refer to the absence of an exact standard or agreement about the factors that should be taken into account when calculating the monetary value of counterfeiting for this non-transparency. Should it be based on objective and pure quan-titative information such as production costs, lost sales or total sales, or should also more
15,97%
10,99%
10,40%
9,25%
8,81%5,30%
39,29%
Top categories by value (equivalent DRV)
Clothing
Cigarettes
Sport shoes
Bags, wallets, purses
Watches
Mobile telephones
Others
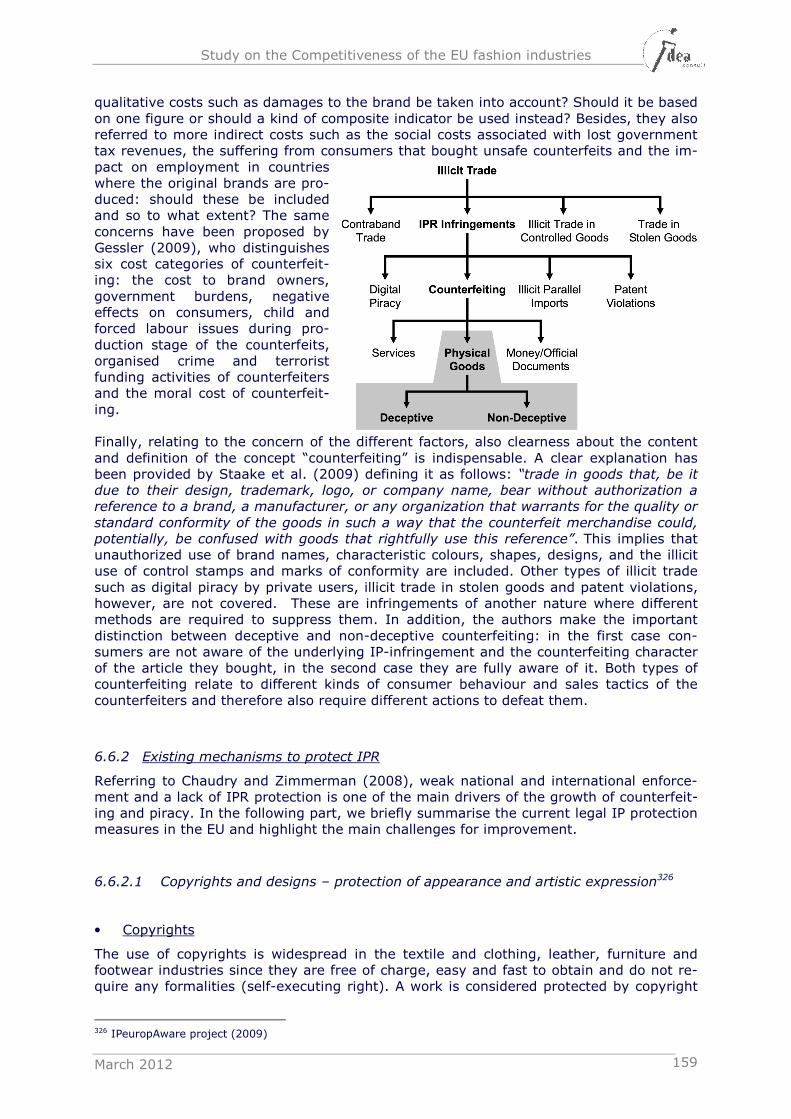
Study on the Competitiveness of the EU fashion industries
March 2012 159
qualitative costs such as damages to the brand be taken into account? Should it be based on one figure or should a kind of composite indicator be used instead? Besides, they also referred to more indirect costs such as the social costs associated with lost government tax revenues, the suffering from consumers that bought unsafe counterfeits and the im-pact on employment in countries where the original brands are pro-duced: should these be included and so to what extent? The same concerns have been proposed by Gessler (2009), who distinguishes six cost categories of counterfeit-ing: the cost to brand owners, government burdens, negative effects on consumers, child and forced labour issues during pro-duction stage of the counterfeits, organised crime and terrorist funding activities of counterfeiters and the moral cost of counterfeit-ing. Finally, relating to the concern of the different factors, also clearness about the content and definition of the concept “counterfeiting” is indispensable. A clear explanation has been provided by Staake et al. (2009) defining it as follows: “trade in goods that, be it due to their design, trademark, logo, or company name, bear without authorization a reference to a brand, a manufacturer, or any organization that warrants for the quality or
standard conformity of the goods in such a way that the counterfeit merchandise could, potentially, be confused with goods that rightfully use this reference”. This implies that unauthorized use of brand names, characteristic colours, shapes, designs, and the illicit use of control stamps and marks of conformity are included. Other types of illicit trade such as digital piracy by private users, illicit trade in stolen goods and patent violations, however, are not covered. These are infringements of another nature where different methods are required to suppress them. In addition, the authors make the important distinction between deceptive and non-deceptive counterfeiting: in the first case con-sumers are not aware of the underlying IP-infringement and the counterfeiting character of the article they bought, in the second case they are fully aware of it. Both types of counterfeiting relate to different kinds of consumer behaviour and sales tactics of the counterfeiters and therefore also require different actions to defeat them.
6.6.2 Existing mechanisms to protect IPR
Referring to Chaudry and Zimmerman (2008), weak national and international enforce-ment and a lack of IPR protection is one of the main drivers of the growth of counterfeit-ing and piracy. In the following part, we briefly summarise the current legal IP protection measures in the EU and highlight the main challenges for improvement.
6.6.2.1 Copyrights and designs – protection of appearance and artistic expression326
• Copyrights
The use of copyrights is widespread in the textile and clothing, leather, furniture and footwear industries since they are free of charge, easy and fast to obtain and do not re-quire any formalities (self-executing right). A work is considered protected by copyright
326 IPeuropAware project (2009)
Study on the Competitiveness of the EU fashion industries
March 2012 160
as of the date of creation. You just have to be able to prove a certain date of creation and the originality or novelty of your creation.
The original creators of works protected by copyright have the exclusive right to use or authorise others to use the work under certain terms. The creator of a work can prohibit or authorise its reproduction in various forms, such as printed publication, the initial dis-tribution to the public through sale and other transfer of ownership in tangible copies, rental of copies to the public and translations into other languages or adaptation. Copy-right is usually limited to 50 years after the creator’s death (70 years for Europe), though national differences occur.
An important disadvantage of the current copyright protection is the lack of harmonisa-tion across Europe: protection of the creation under the copyright legislation in one coun-try does not guarantee the same protection by copyright legislation in another country (difference in the criteria). For example, the German copyright legislation does not allow the protection of three-dimensional design (dress, shoe or chair).
• Design rights
In the EU, design can be protected as a registered industrial property right at national level by filing a design at a national office under individual national laws, or at Communi-ty level by virtue of the Community design.
In 1998, the Design Directive327 has been established to harmonise the design right law of the different EU member states. The Design Directive requires all EU countries to enact laws to protect designs by registration and to confer exclusive rights on holders for a period of 5 years from filing, which even could be renewed for additional periods of 5 years, up to 25 years of protection. Further, the Directive left the specific mechanism for protection to cumulate legal protections for designs (Monseau, 2011).
But even after the enforcement of the Design Directive, substantial differences in the legal framework to protect designs remained between EU member states. This has led to the introduction of the Council Regulation on Community designs: Council Regulation (EC) No 6/2002 of 12 December 2001 on Community designs OJ L 3, 5.1.2002, p. 1–24. This regulation provides European citizens with two EU-wide legal rights that protect designs, without the need for the enactment of individual national laws (Monseau, 2011):
Registered design rights
A design that is registered with the Office of Harmonization for the International Market (OHIM) falls under this regime. The rights are similar to those that were established in the Design Directive. A registered design confers on its holder the exclusive right to use the design and to prevent any third party not having his consent from using it across the European Union. So there is no need to provide evidence of copying. Requirements to register a design are:
• The design must be new. Details of it must not have been publicly dis-closed prior to filing the application unless a grace period is permitted.
• The design must have individual character i.e. an informed observer would readily form the overall impression that it can be distinguished from earlier designs.
The registration of a design helps the owner to prevent all others from exploiting its new or original ornamental or aesthetic aspects, which may relate to a 3-dimensional feature (shape of a hat) or 2-dimensional feature (textile print). How-ever, in practice, only little use is made of it: it takes a lot of time and considera-ble financial costs are involved, making it often not worthy because of the short
327 Directive 98/71/EC of the European Parliament and of the Council of 13 October 1998 on the legal protection
of designs
Study on the Competitiveness of the EU fashion industries
March 2012 161
product life cycle (often no more than one six-to-twelve month season) that does not justify these efforts, or simply because small organisation cannot bear these efforts.
Unregistered design rights
Until the Directive, there was no formal protection at EU-level for unregistered de-signs. Since 1998, new designs can be protected Europe-wide, which is an ad-vantage compared to copyrights where the level of protection might differ be-tween countries, for a period of 3 years without registration, which is an ad-vantage compared to the registered design rights where protection is only secured after registration. The protection starts from the date of first ‘publication’ of the design, i.e. when the product is placed on the market. However, in comparison to registered design, copying of spare parts of unregistered design for e.g. repair purposes does not infringe such rights. In addition, unregistered design is only protected in Europe.
Design rights only protect against identical or virtually identical copies of a design, such as copies made by counterfeiters or knockoff artists. They are not authorised to prohibit the derivative work of lower-end retailers where for example obvious changes to colours and/or patterns are made. Contrary to the design patents in the US, however, that only protect the ornamental elements of the design (see below), the Council Regulation de-fines design as “the appearance of the whole or part of a product resulting from the fea-tures of, in particular, the lines, contours, colours, shape, texture and/or materials of the product itself and/or its ornamentation”.
6.6.2.2 Patents and utility models – protection of innovation in functional design
Patents are intellectual property rights that guarantee ownership of an invention. They are concerned with the functional and technical aspects of products, processes, and uses. To qualify for patent protection, an invention must meet the criteria of novelty, inven-tiveness and ‘patentability’ (industrial applicability). Patents are usually valid for 20 years, depending on the relevant jurisdiction, in return for a full disclosure of the inven-tion.
The core business of the textile, leather and footwear industries is not based on patents, but rather on design rights, trademarks and copyright. Nonetheless, they are used in these sectors, especially in the field of technical textiles. But applying for a patent is time consuming and costly, which is an important barrier for SMEs to make use of it.
Utility Models provide an inventor with an exclusive right granted for an invention, which allows the right holder to prevent others from commercially using the protected inven-tion, without his or her authorisation, for a limited period of time. There are two major differences with patent-protection. Firstly, the technological progress demanded to obtain a utility model for the invention is less. They can be granted without prior examination of the patentability criteria relating to novelty and usefulness. Secondly, the maximum du-ration of protection is shorter. The period of protection of a short term patent is a maxi-mum of ten years which should suit less technologically complex inventions or inventions not having very long life cycles. As a consequence, utility models are a more flexible and less costly way of protection than patents: they are faster and easier to obtain and cheaper to maintain.
6.6.2.3 Trademarks – protection of goodwill and reputation
A trademark can be any sign that serves as a “marker” for a given product or service. It protects the owner of the mark by ensuring the exclusive right to use it to identify goods
Study on the Competitiveness of the EU fashion industries
March 2012 162
or services or to licence another to use it in return for payment. In addition, it helps con-sumers to identify a product or service on the basis of its nature and quality, indicated by its unique trademark.
The sign can be a particular word, such as a personal name, letters, numbers, stylistic elements, specific colours, as well as a combination of these various stylistic elements. Essentially, it needs to be a sign that makes your product or service visually distinctive from other products or services.
Trademarks can be individual or collective depending on the ownership of the IPR. Collec-tive trademarks are typically owned by trade associations or cooperatives for the benefit of their members and identify a particular product with distinct characteristics, such as e.g. the “Leathermark”.
Depending on whether a company decides to file at the national, regional, European or international level, it has to file for trademark protection under all appropriate class(es) that are relevant for the product that needs protection (e.g. the class of ‘bags’, ‘cloth-ing’,…). The most common system at the international level is the Nice classification sys-tem for trademarks.
6.6.3 Impact of (violation of) IPR on fashion businesses
Counterfeiting and piracy concern all design oriented companies in the fashion industry. Especially those companies whose business model is built around a strong (international-ly renowned) design and/or brand and where price competition is relatively low (as only premium margins make counterfeiting and piracy worthwhile) are interesting targets for counterfeiters and pirates (e.g. luxury fashion brands, premium fashion brands, designs from renowned independent designers). Both large multinationals and small SMEs are affected by it. However, a major difference between both is the ability to act upon viola-tions of IPR. Whereas the international fashion brands often have dedicated resources in place to better protect IP in the first place and to fight violations (conditional to the fact that it is traced!) when needed, SMEs often lack the knowledge and resources to ade-quately protect and monitor IP (e.g. NetFinTex, 2006). Awareness creation and train-ing on the importance of proper IP protection towards SMEs is very important in this re-spect.
An important initiative at EU level to increase the awareness about IPR is the IPeuropAware project that aims to ‘promote the benefits of greater knowledge and more effective management of Intellectual Assets’ (http://www.ipeuropaware.eu). Euratex, the European Apparel and Textile Organisation, is one of the 8 official partners of the project (and the only sector organisation in the consortium), besides the 20 national patent of-fices that are involved. Some of the activities that will be developed by the IPeuropAware consortium are:
- The development of SME awareness strategies for IPR usage and enforcement at the EU and local levels, bringing together the main existing institutions and ser-vices;
- Preparation of multilingual manuals, training materials and SME workshops for de-sign industries to raise SME awareness on IPR and enforcement issues, both with-in and outside the EU;
- Delivery of awareness workshops, especially on counterfeiting and with a particu-lar focus on the design and fashion industries;
- The development of a toolbox of materials on IPR and enforcement issues, includ-ing manuals and training materials;
- The provision of training for multipliers, in particular to the business and innova-tion network, a wide range of SME awareness and enforcement actions; and sup-port for SME advice services;
Study on the Competitiveness of the EU fashion industries
March 2012 163
- IPR support to potential beneficiaries of CIP and RTD Framework Programme ac-tions (IPR Helpdesk);
- Capacity building, the creation of national and regional networks and synergies and enhanced European-wide cooperation in the IP and innovation field
Apart from a lack of awareness about IPR in many fashion companies, a second im-portant problem relates to enforcement. If IPR would be violated, the current systems (and resources) do not allow for efficient enforcement. Courts deciding on infringe-ment cases often lack the specific technical expert knowledge e.g. to adequately judge whether it is a real infringement versus the outing of a new trend which is legal. Also custom offices are currently insufficiently equipped (both in terms of numbers of staff and specific skills required) to adequately control for infringements on counterfeiting and piracy at the border. In addition, it is difficult to implement a strong IP protection due to continuous innovation in combination with a highly fragmented industry structure (King et al., s.d.). While the reduction of counterfeiting to zero is not likely, an effective IPR strategy in combination with improved customs procedures and public awareness can help to reduce counterfeiting to an acceptable level (Berden et al., 2009; NetFinTex, 2006; OECD, 2008).
An important initiative to come to more effective enforcement is the European Observa-tory on Counterfeiting and Piracy328 that was created in order to encourage greater col-laboration. It serves as a platform to join forces, to exchange experiences and infor-mation and to share best practices on enforcement. The Observatory also functions as a central resource for gathering, monitoring and reporting crucial information that will im-prove our knowledge about the dangerous phenomenon of counterfeiting and piracy, and will allow us to better target enforcement resources.
328 http://ec.europa.eu/internal_market/iprenforcement/observatory/index_en.htm
Study on the Competitiveness of the EU fashion industries
March 2012 164
7 CONCLUSIONS
7.1 An industry at the heart of the structural transformation of
Europe’s economy
Looking at the EU fashion industries as a monolith, we see an industry that represents nearly 840,000 companies and directly provides jobs to over 5 million people in 2009. It is a declining industry that is characterized by major job losses over the last decades, and between 2004 and 2009 another half a million jobs were lost. Both productivity and profitability in the industry are below the average in the EU economy. The EU trade defi-cit is growing rapidly since 2002, especially due to major import flows from China.
But the EU fashion industries are far from being a monolith. It is a hybrid industry cover-ing a broad range of very diverse activities. Creative design companies, manufacturing companies, retail companies and other services companies operate next to each other. Moreover, the industry produces a wide variety of products for a very diverse customer base. Underlying the statistics of a declining industry, very different dynamics can be observed.
The overall decline in the industry is solely driven by the decrease in manufacturing ac-tivities. Major labour cost disadvantages in combination with new ICT possibilities have led to a massive relocation of labour intensive manufacturing activities to lower wage countries over the last decades to remain competitive. Remaining manufacturing activi-ties in Europe focus on smaller volumes and high added value production.
Contrary to the negative evolutions in manufacturing, fashion distribution activities have been growing over time. In the period 2004-2009 around 500,000 jobs have been creat-ed, market demand being the main driver of this increase.
Combining both dynamics, the EU fashion industries are a ‘model’ illustration of the de-industrialisation of the EU economy by focusing on growth in services and relocation of especially labour intensive, low tech manufacturing activities. This international division of labour has resulted in the configuration of global value chains in which Europe’s strengths in design, creativity and marketing are in most cases combined with low cost production in other parts of the world.
7.2 The way forward?
The international division of labour and the current global value chains are a logical re-sponse to a (simplistically sketched) reality in which the market for EU fashion companies is largely concentrated in Europe, production costs (and prices) are primarily driven by labour costs and consumer behaviour is driven by prices. However, the study has identi-fied different trends and drivers that make this reality much more complicated and will continue to do so in the future:
- With increasing income levels in major emerging markets (e.g. China, Russia, Middle East), the market for fashion goods is growing. Although the EU market remains the lead market for the consumption of EU fashion goods, these emerging markets push EU fashion companies to explore the growing international opportu-nities.
- The sustainability debate, social media and the experience economy, have made a growing part of European consumers to look beyond prices and to become more critical and selective consumers. Authenticity, creativity and the story behind fashion goods have gained importance.
- Although production costs currently reflect only purchases of goods and services, and labour costs, there is increased pressure from legislation (and consumer
Study on the Competitiveness of the EU fashion industries
March 2012 165
awareness) for prices that more reflect societal and environmental costs as well. This way of economic thinking has the potential to change the current industrial organization considerably in the longer run.
- New technologies are being developed that can provide new opportunities for cus-tomisation and smaller scale production.
These trends and drivers influence the economic environment in which EU fashion com-panies operate and provide new opportunities and challenges for the industry, albeit not in a homogeneous way.
7.3 Different players with different challenges ahead
As highlighted at different occasions in the study, the fashion industries consist of a wide variety of actors ranging from independent workers to large multinational companies, providing a diversity of jobs to both lower and higher skilled people. Although the trends and drivers that have been discussed in the study affect all fashion companies to some extent, they do affect the actors in different ways. We highlight the main challenges and opportunities for the different types of business models to remain competitive in the fol-lowing table.
Business model Key opportunities and challenges to remain competitive
Luxury fashion brands and premium fashion brands
• Luxury fashion brands characterised by very strong position-
ing, strong ‘story’ through focus on design, authenticity, uniqueness. Challenge for premium fashion brands to define a strong position themselves, not to be seen as ‘second best option’ or ‘would be’ luxury fashion brand
• Focus on quality and craftsmanship rather than price. Im-portant role to push forward sustainable business develop-ment that combines social, environmental and economic sus-tainability
• Early adopters of new technological developments, with fo-cus on product and marketing innovation
• Strong growth in demand in emerging markets, especially for luxury goods. Good access to international markets very im-portant to benefit from growing international markets
• Access to high quality raw materials critical to deliver high quality products
• Efficient IPR protection needed to safeguard strong brand position
• Quality and craftsmanship critically depend on adequate (specialised) skills in manufacturing, often concentrated in SMEs
Vertically integrated retailers
• Focus on production of large volumes at low costs -> large ICT systems critical to efficiently manage global value chains
• Focus on process innovation rather than product innovation • Global level playing field very important, as well as access to
international markets • Increasing demand for customisation and fast fashion ->
challenge to find right balance between flexibility and stand-
Study on the Competitiveness of the EU fashion industries
March 2012 166
Business model Key opportunities and challenges to remain competitive
ard production of large volumes • Sustainability debate puts important pressure on current
business practice (working conditions, raw material use, transportation costs) -> challenge to find right balance be-tween economic sustainability and social and environmental sustainability, need for transparent monitoring systems to monitor global value chains at different levels
Department stores and mass retailers with private brands
• Control over own positioning, but challenge to create ‘clear
message’ to consumer • Systems in place often less effective to follow up on trends
as quickly as vertically integrated retailers can -> challenge to 1) gather right market intelligence and 2) comply with changing consumer demand
Independent design-ers
• Increased market demand for design • Challenge to complement creative skills with managerial
skills – importance of entrepreneurship to build sustainable businesses. Need for increased awareness on the importance of strategic thinking about new business models, branding and market positioning
• Importance of networking and collaboration to bring products to market, exchange best practices, acquire market intelli-gence
• Access to finance necessary to support growth. Sufficient business plan writing and financial management skills ele-mentary to attract right investors
• Right legal framework needed to provide necessary (and af-fordable for SMEs) IP protection
• Access to international markets important to enlarge con-sumer base
Independent manu-facturers
• Need for increased productivity to remain competitive – in-
vestments in training very important • Increased investments in ICT critical to reach (new) markets
and customers. Especially for niche producers, focusing only on local markets is not economically sustainable
• Importance of entrepreneurship and innovation to build sus-tainable businesses. Need for increased awareness on the importance of strategic thinking about new business models, new niche markets, role in the value chain
• Major challenge to attract (and keep) the right skills • Challenge for SMEs to get access to adequate market intelli-
gence • Importance of networking and collaboration to bring products
to market, to enlarge own capacity, to acquire market intelli-gence,…
• Access to finance remains challenging. Sufficient business plan writing and financial management skills elementary to attract right investors
• Access to and costs of raw materials
Study on the Competitiveness of the EU fashion industries
March 2012 167
Business model Key opportunities and challenges to remain competitive
Independent retail-ers
• Challenge for SMEs to get access to relevant market intelli-
gence • Critical and informed customer -> need to critically evaluate
added value of services offered to consumer • Need for increase productivity to remain competitive – in-
vestments in training and (services) innovation important • Challenge for many SMEs to incorporate latest relevant ICT
developments to better reach (and enlarge) customer base and set up/manage adequate CRM systems
• Mix of retail channels? • Retail characterised by low entry barriers. Generates jobs to
many lower skilled people – Need for stronger entrepreneur-ship skills
Online customised retailing
• Model meets increased consumer demand for more customi-
sation and flexibility • Sufficient knowledge and skills needed to be able to combine
industry insights with services innovation and technological developments - specialised ICT skills critical, but strong competition with other industries for skills
• Challenge to find economically sustainable business models • Need to further invest in development of tools that allow ’im-
itation’ of real shopping experience online
7.4 Priority areas for further action
For the fashion industry to effectively tackle the above specified challenges to remain competitive, the primary responsibility lies with the fashion companies themselves. The exploration of international markets, innovation, investments in training, … start with the entrepreneurial ambitions of companies.
But to support and stimulate fashion companies to effectively take action, stakeholders at different levels play an important role by creating awareness about recent sector devel-opments, providing the right training and education, establishing a correct legal frame-work, …. Especially in the fashion industry that is characterised by fragmentation and a high percentage of very small SMEs, stakeholder organisations play a critical role to cre-ate platforms for collaboration and interaction, transfer relevant market intelligence, monitor the skills base,… These stakeholders range from sector associations to education & research institutes and public authorities at national and EU level.
It goes beyond the scope of this study to elaborate a strategic action plan towards these different stakeholders to support the fashion industries to remain competitive. This will be further developed by the EC in close collaboration with different industry stakeholders in the coming months. However in our view, for the EU fashion industries to effectively tackle the different challenges and opportunities, specific attention should go to formulat-ing supporting actions in the following fields:
� Transforming the skills base and attracting new skills are the basis for any successful
transition process in the industry. Guiding this process (through e.g. adequate in-
Study on the Competitiveness of the EU fashion industries
March 2012 168
vestments in training and education, awareness campaigns on job opportunities, mo-
bility of workers,…) should receive the highest priority.
� Ensuring an IP framework and enforcement system that adequately rewards invest-
ments in creativity and innovation.
� Promoting and supporting (non-technological) innovation and entrepreneurship
throughout the EU fashion value chain. Creating awareness about the importance of
innovation in any type of business (also SMEs) to remain competitive.
� Ensuring access to international markets and a level playing field that allows truly
global competition.
� Continuing efforts to create awareness with consumers and industry actors for sus-
tainable growth.
� Encouraging sufficient spill-over effects between the creative industries and other
parts of the fashion industries through networking and collaboration.
We invite the European Commission and the different industry stakeholders that are in-volved in the preparation of the Communication of the EU fashion industries, to take the-se fields of action into account when identifying future (policy) actions to support the competitiveness of the industry.
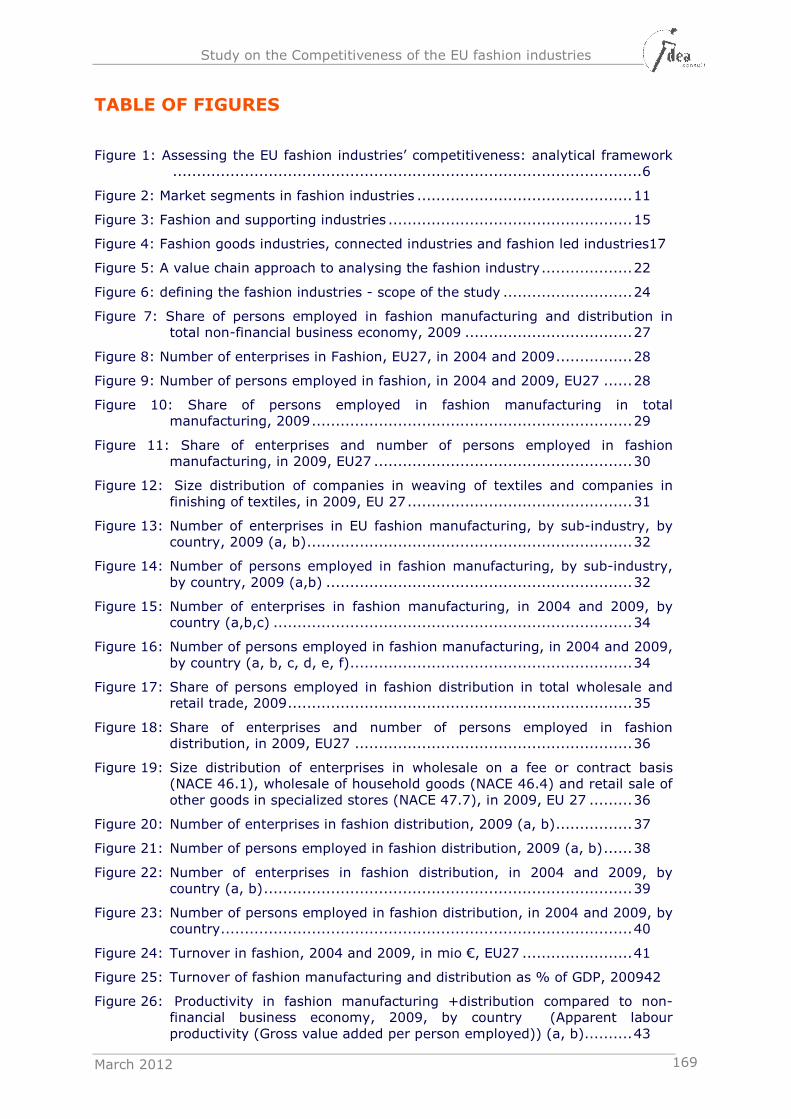
Study on the Competitiveness of the EU fashion industries
March 2012 169
TABLE OF FIGURES
Figure 1: Assessing the EU fashion industries’ competitiveness: analytical framework .................................................................................................. 6
Figure 2: Market segments in fashion industries ............................................. 11
Figure 3: Fashion and supporting industries ................................................... 15
Figure 4: Fashion goods industries, connected industries and fashion led industries17
Figure 5: A value chain approach to analysing the fashion industry ................... 22
Figure 6: defining the fashion industries - scope of the study ........................... 24
Figure 7: Share of persons employed in fashion manufacturing and distribution in total non-financial business economy, 2009 ................................... 27
Figure 8: Number of enterprises in Fashion, EU27, in 2004 and 2009 ................ 28
Figure 9: Number of persons employed in fashion, in 2004 and 2009, EU27 ...... 28
Figure 10: Share of persons employed in fashion manufacturing in total manufacturing, 2009 ................................................................... 29
Figure 11: Share of enterprises and number of persons employed in fashion manufacturing, in 2009, EU27 ...................................................... 30
Figure 12: Size distribution of companies in weaving of textiles and companies in finishing of textiles, in 2009, EU 27 ............................................... 31
Figure 13: Number of enterprises in EU fashion manufacturing, by sub-industry, by country, 2009 (a, b) .................................................................... 32
Figure 14: Number of persons employed in fashion manufacturing, by sub-industry, by country, 2009 (a,b) ................................................................ 32
Figure 15: Number of enterprises in fashion manufacturing, in 2004 and 2009, by country (a,b,c) ........................................................................... 34
Figure 16: Number of persons employed in fashion manufacturing, in 2004 and 2009, by country (a, b, c, d, e, f) ........................................................... 34
Figure 17: Share of persons employed in fashion distribution in total wholesale and retail trade, 2009 ........................................................................ 35
Figure 18: Share of enterprises and number of persons employed in fashion distribution, in 2009, EU27 .......................................................... 36
Figure 19: Size distribution of enterprises in wholesale on a fee or contract basis (NACE 46.1), wholesale of household goods (NACE 46.4) and retail sale of other goods in specialized stores (NACE 47.7), in 2009, EU 27 ......... 36
Figure 20: Number of enterprises in fashion distribution, 2009 (a, b) ................ 37
Figure 21: Number of persons employed in fashion distribution, 2009 (a, b) ...... 38
Figure 22: Number of enterprises in fashion distribution, in 2004 and 2009, by country (a, b) ............................................................................. 39
Figure 23: Number of persons employed in fashion distribution, in 2004 and 2009, by country ...................................................................................... 40
Figure 24: Turnover in fashion, 2004 and 2009, in mio €, EU27 ....................... 41
Figure 25: Turnover of fashion manufacturing and distribution as % of GDP, 200942
Figure 26: Productivity in fashion manufacturing +distribution compared to non-financial business economy, 2009, by country (Apparent labour productivity (Gross value added per person employed)) (a, b).......... 43
Study on the Competitiveness of the EU fashion industries
March 2012 170
Figure 27: Share of value added in fashion manufacturing, in 2009, EU27 ......... 43
Figure 28: Value added in fashion manufacturing, in mio €, 2009, by country (a, b) ................................................................................................ 44
Figure 29: Productivity in fashion manufacturing and total manufacturing, 2009, by country (Apparent labour productivity (Gross value added per person employed) (a, b) ........................................................................ 45
Figure 30: Value Added in fashion distribution, in 2009, EU27.......................... 45
Figure 31: Value added in fashion distribution, in mio €, 2009 ......................... 46
Figure 32: Productivity in fashion distribution and non-financial business services, 2009, by country (Apparent labour productivity (Gross value added per person employed)) (a, b) ............................................................. 47
Figure 33: Profitability in EU fashion industries and non-financial business economy, 2009, by country (Gross operating surplus/turnover (gross operating rate) (%)).................................................................................. 48
Figure 34: Profitability in fashion manufacturing and total manufacturing, 2009; by country (Gross operating surplus/turnover (gross operating rate) (%)) (a) ................................................................................................ 49
Figure 35: Labour cost per employee FTE, in thousand €, 2009; by country (a,b)49
Figure 36: Profitability in fashion distribution and non-financial business services, 2009, by country (Gross operating surplus/turnover (gross operating rate) (%)) (a, b) ......................................................................... 50
Figure 37:Annual average price index, 2000-2010, EU27 (2005=100)............... 51
Figure 38: Evolution of EU27 Exports, Imports and their Trade deficit in Fashion Industries, in Billions US$ ............................................................ 54
Figure 39: Evolution of EU27 total Exports and Imports, across Fashion Subsectors (figures in Billions of US$) ........................................................... 55
Figure 40: EU27 Exports, across destination markets and fashion subsectors ..... 56
Figure 41: EU27 Imports, from the 10 largest exporters and across fashion subsectors ................................................................................. 58
Figure 42: Evolution of EU27 Exports, Imports and their Trade deficit in Fashion Industries across ranges of Unit values (quality proxy), in Billions of US Dollars. ..................................................................................... 62
Figure 43: Market Shares of the 10 Biggest Exporters, in Clothing (In each of the 5 Big World Markets) ..................................................................... 63
Figure 44: Market Shares of the 10 Biggest Exporters, in Footwear (In each of the 5 Big World Markets) ..................................................................... 64
Figure 45: Market Shares of the 10 Biggest Exporters, in Accessories and Jewelry (In each of the 5 Big World Markets) .................................................. 65
Figure 46: Market Shares of the 10 Biggest Exporters, in Intermediate Inputs in the Fashion Industry (In each of the 5 Big World Markets) ................... 66
Figure 47: Female employment in the EU fashion industries, 2010 .................. 100
Figure 48: Age profile of employment in EU fashion industries, 2000-2010 ...... 101
Figure 49: Occupational shift in fashion manufacturing by country group, difference of % shares 2006 compared to 2000; ISCO groups (a) .................. 103
Figure 50: Example of full-wearable shoes, 3D printed in polyamide (a) and titanium (b), created and produced by students of design schools in Stockholm (a) and London (b). ........................................................................ 124
Study on the Competitiveness of the EU fashion industries
March 2012 171
Figure 51: Relative importance of different channels in total retail of clothing, 2010, by country ............................................................................... 127
Figure 52: Relative importance of different channels in total retail of jewellery, 2009, by country (a) .......................................................................... 128
Figure 53: Share of different non-store channels in non-store retail of clothing, 2010, by country (a) ................................................................. 128
Figure 54: Evolution of share of internet retailing of clothing in total retailing .. 129
Figure 55: Share of different non-store channels in non-store retail of jewellery, 2009, by country (a) ................................................................. 129
Figure 56: Evolution of share of internet retailing of jewellery in total retailing . 130
Figure 57: Water pollution, textile industry (% of total BOD emissions), 1996-2006 .............................................................................................. 138
Figure 58: Sustainability and the triple bottom line ....................................... 142
Figure 59: Average spot price of cotton in US cents per Pound for Upland cotton, January 1980 to December 2011, monthly data ............................ 148
Figure 60: Australian Wool (fine and coarse) Exchange spot quote in US cents per Kilogram, January 1980 to December 2011, monthly data ............. 148
Figure 61: General monthly indices for raw hides and skin prices, March 2009 – September 2010 ....................................................................... 150
Figure 62: Evolution of the production of leather and cattle hides, 1985(1990)-2009 .............................................................................................. 151
Figure 63: Purchases of energy products (as a % of total purchases of goods and services) in manufacturing of textiles, 1999-2007 ......................... 152
Figure 64: Indication of energy consumption by type of energy used in tanneries154
Figure 65: Share of detained articles and registered cases by European Customs by product category, 2010 ............................................................. 156
Figure 66: Evolution of registered cases and articles detained by European Customs, 1999-2008 ............................................................................... 157
Figure 67: Share of the total value of detentions by European Customs by product category, 2010 ......................................................................... 158
Study on the Competitiveness of the EU fashion industries
March 2012 172
TABLE OF TABLES
Table 1: Top destinations of EU fashion exports.............................................. 57
Table 2: Top import sourcing countries for the EU in 2010 and 1995 ................. 59
Table 3: Ranking of EU exporters, 1995 and 2010 .......................................... 60
Table 4: Ranking of EU importers, 1995 and 2010 .......................................... 61
Table 5: Main drivers of changing skills needs .............................................. 103
Table 6: Environmental cost of each stage in the lifecycle of a cotton t-shirt (US$ per t-shirt) .................................................................................... 139
Table 7: Number of articles detained, expressed as % by country of origin and product type ............................................................................ 156
Study on the Competitiveness of the EU fashion industries
March 2012 173
TABLE OF BOXES
Box 1: The role of Kopenhagen Studio to stimulate innovation and collaboration in the fashion industry .......................................................................... 14
Box 2: Technical textiles and fashion ............................................................ 24
Box 3: BACI database on trade .................................................................... 53
Box 4: Outward Processing Trade ................................................................. 68
Box 5: Some high-flying smart fashion companies .......................................... 93
Box 6: European Footwear Products and Processes Technology Platform (FETP) . 99
Box 7: China’s demand for fur important driver of price increases .................. 110
Box 8: Characteristics of apparel markets in the BRIC countries ..................... 111
Box 9: Greenest, Embedded generosity and Still made here – inspiration box .. 118
Box 10: Honest By - the road to full transparency ........................................ 119
Box 11: Bivolino: “the consumer co-designs” ............................................... 121
Box 12: More illustrations of 3D-printing in fashion ....................................... 125
Box 13: Poor working conditions with non-EU subcontactors of the EU fashion industries................................................................................. 140
Box 14: Responsible Supply Chain Management in the Inditex Group .............. 140
Box 15: Social and environmental reporting in the EU leather industry ............ 141
Box 16: CSR initiatives in fashion ............................................................... 143
Box 17: EU legislation on sustainability: stimulus or burden for a more competitive EU fashion industry? ................................................................. 145
Box 18: R&D efforts in the leather industry to lower environmental impact of tanning .............................................................................................. 146
Study on the Competitiveness of the EU fashion industries
March 2012 174
REFERENCES
Adhikari and Yamamoto (2007), “The textile and clothing Industry: Adjusting to the post-quota world”, Industrial Development for the 21st Century: Sustainable Development Perspectives. New York: United Nations, pp. 183–234
Ailawadi K. L., Neslin S. A. and Gedenk K. (2001), “Pursuing the Value-Conscious Consumer: Store Brands versus National Brand Promotions”, Journal of Marketing, Vol. 65, No. 1, (2001), pp. 71-89
Alcaide-Marzal, J. and Tortajada-Esparza, E. (2007), “Innovation assessment in traditional indus-tries. A proposal of aesthetic innovation indicators”, Scientometrics, vol. 72, No. 1, p. 41.
Allwood J.M., Laursen S.E., de Rodríguez C.M. and Bocken N.M.P. (2006), “Well dressed? The pre-sent and future sustainability of clothing and textiles in the United Kingdom”, University of Cambridge, institutes for Manufacturing
Ariyatum, B., Holland, R., Harrison, D. and Kazi, T. (2005), “The future direction of smart clothing development”, Journal of the Textile Institute, vol. 96, No.4
Aspers, P. (2010), “Using design for upgrading in the fashion industry”, Journal of Economic Geog-raphy 10 (2010), pp. 189-207
Atwal G. and Williams A. (2009), “Luxury brand marketing – The experience is everything!”, Jour-nal of Brand Management, 16, pp. 338–346
Audet D. (2007), “Smooth as silk? A first look at the post MFA textiles and clothing landscape”, Journal of International Economic Law, 10(2), pp. 267–284
Baden S. (2002), “Trade policy, retail markets and value chain restructuring in the EU clothing sector”, Poverty Research Unit at Sussex, University of Sussex, Working Paper No 9
Bae J. and May-Plumlee T (2005), Customer focused textile and apparel manufacturing systems: toward an effective e-commerce model, Journal of Textile, Apparel Technology and Manage-ment, Vol 4, Issue 4, 2005
Bain & Company (2011), “Worldwide Luxury Markets Monitor – Spring 2011 Update”, report on behalf of Fondazione Altagamma
Baleix J. M. (2005), “Quotas on Clothing Imports: Impact and Determinants of EU Trade Policy”, Review of International Economics, 13(3), (2005) pp. 445–460
Barnes L. and Lea Greenwood G. (2006), “Fast fashioning the supply chain: shaping the research agenda”, Journal of Fashion Marketing and Management, Vol. 10 No. 3, 2006, pp. 259-271
Berden, K., Francois, J., Tamminen, S., Thelle, M., and Wymenga, P. (2009), “Non tariff measures to EU-US trade and investment - An economic analysis”, Ecorys, 2009.
Berg J. (2009) Growing in mature economies by developing innovative business models, Estin & Co publication (2009), retrieved from http://www.estin.com/pdf/publications/Growingeconomies.pdf
Bhardwaj V. and Fairhurst A. (2010), “Fast fashion: response to changes in the fashion industry”, International Review of Retail, Distribution and Consumer Research, 20:1, pp. 165-173
Bruce M. and Kratz C. (2007), “Competitive marketing strategies of luxury fashion companies”, published in Fashion Marketing Contemporary Issues, second edition, ISBN–13: 978-0-7506-6897-2
Brun A. and Castelli C. (2008), “Supply chain strategy in the fashion industry: Developing a portfo-lio model depending on product, retail channel and brand”, International Journal of Production Economics, 116(2008), pp. 169–181
Buettner T., Coscelli A., Verge T., and Winter R. A. (2009), Selective Distribution by Lux-ury Goods Suppliers: A Response to Kinsella et al, European Competition Journal, Volume 5, Number 2, August (2009) , pp. 613-621
Caniato F., Caridi M., Castelli C. and Colini R. (2011), “Supply chain management in the luxury industry: A first classification of companies and their strategies”, International Journal of Pro-duction Economics, 133(2011), pp. 622–633
Study on the Competitiveness of the EU fashion industries
March 2012 175
Capello V. C. and Ravali D. (2009), The Variety and the Evolution of Business Models and Organiza-tional Forms in the Italian Fashion Industry, Business and Economic History online, Vol 7. re-trieved from http://www.thebhc.org/publications/BEHonline/2009/capelloandravasi.pdf
Cappetta, R., Cillo, P. and Ponti, A. (2006), “Convergent designs in fine fashion: An evolutionary model for stylistic innovation”, Research Policy, vol. 35, No. 9
Caves, R. (2000), Creative industries: contracts between art and commerce, Harvard University Press
Celeste S. (2011), “Leather Costs Hit by Supply Squeeze”, Wall Street Journal, March 8 2011
Challa L. (2010), “Impact of Textiles and Clothing Industry on the Environment: Approach Towards Eco-Friendly Textiles”, Bangalore University
Chaudry, P. and Zimmerman, A. (2008), The Economics of Counterfeit Trade: Governments, Con-sumers, Pirates and Intellectual Property Rights, Berlin: Springer
Chen J., Om Narasimhan G. J. and Dhar T. (2010), “An Empirical Investigation of Private Label Supply by National Label Producers”, Marketing Science, Vol. 29, No. 4, July–August 2010, pp. 738–755
Christopher M., Lowson R. and Peck H. (2004), “Creating Agile Supply Chains in the Fashion Indus-try”
Chugan, P.K. (2011), “Diversification into Technical Textiles: A Forward Momentum for Sustainable Recovery. A Case of Indian Textiles Industry”, Available at SSRN: http://ssrn.com/abstract=1836283
Cillo P. and Verona G. (2008), “Search Styles in Style Searching: Exploring Innovation Strategies in Fashion Firms”, Long Range Planning, 41 (2008), pp. 650-671
Clark E., Hughes M., Waelboeck D. and Ashurst LLP (2009), Selective Distribution and Luxury Goods: The Challenge of the Internet?, GCP The online magazine for global com-petition poli-cy, Release 1, August (2009)
Claudio, L. (2007), “Waste couture: environmental impact of the clothing industry”, Environmental Health Perspectives, Vol.115 (9), September 2007
Comité Colbert (2008), “Le luxe, un atout de croissance pour l’Europe du XXIème siècle”, Decem-ber 2008, 31 p
Connor S. (2009), “Warning: Oil supplies are running out fast. Catastrophic shortfalls threaten economic recovery, says world's top energy economist”, The Independent, August 3 2009
Crewe L. and Forster Z. (1992), “Markets, design, and local agglomeration: the role of the small independent retailer in the workings of the fashion system”, Environment and Planning, Socie-ty and Space, 1992, volume 11, pp. 213-229
Cunningham, Stuart D. (2009), “Trojan Horse or Rorschach Blot? Creative industries discourse around the world”, International Journal of Cultural Policy, vol. 15, No. 4
Chae M., Park Y. and Lee B. (2004), “Strategy for building initial trust in click-only online fashion stores”, Journal of Electronic Science and Technology of China, Vol. 2. No. 3
Dachs, B. and Zahradnik, G. (2010), “Sectoral Innovation Performance in the Textiles and Clothing Sector”, Europe Innova, Sectoral Innovation Watch, http://www.europe-innova.eu/c/document_library/get_file?folderId=696707&name=DLFE-13319.pdf
Danzinger P. N. (2005), Let them eat cake: marketing luxury to the masses-as well as the classes, ISBN 0-7931-9307-9
De Cat, D. (2010), “Counterfeiting and consumer behavior”, Master thesis Ghent University, 109 p
DeLise J. (2010), “Mass with Class - Masstige transcends categories and consumer demographics to deliver premium products at affordable prices…it’s luxury for the masses!”, Zunda Group, published online Oct 14th 2010, retrieved from http://www.zundagroup.com/documents/file/pressreleases/MassWithClass_E-Newsletter.pdf
Dicken, P. (2003), The global shift: reshaping the global economic map in the 21st century, Fourth edition, London, Sage Publications
Djelic M.A. and Ainamo A. (1999), “The Coevolution of New Organizational Forms in the Fashion Industry: A Historical and Comparative Study of France, Italy, and the United States, Organi-
Study on the Competitiveness of the EU fashion industries
March 2012 176
zation Science, Vol. 10, No. 5, Focused Issue: Coevolution of Strategy and New Organizational Forms (Sep. - Oct., 1999), pp. 622-637
Dubois B., Laurent G. and Czellar S. (2001), “Consumer rapport to luxury: Analysing complex and ambivalent attitudes”, Working paper 736, HEC School of Management, Jouy-en- Josas, France.
Dunford, M. (2004), “The changing profile and map of the EU textile and clothing industry, Europe-an Industrial Restructuring in a Global Economy”
Dunne, L. (2010), “Smart Clothing in Practice: Key Design Barriers to Commercialization”, Fashion Practice, vol. 2, No. 1
ECB (2011), “Survey on access to finance for SMEs”
Eckert, C. M., Delamore, P. and Bell, C. (2010), “Dialogue across design domains: rapid prototyp-ing in aerospace and fashion”, In: the 11th International Design Conference DESIGN 2010, 17-20 May 2010, Cavtat-Dubrovnik, Croatia.
Economix (2009), “Skills scenarios for the textiles, wearing apparel and leather products sector in the European Union”
Edberg J. (2010), “A walk through Luxury land - an analysis of the identity and image of high level brands”, The Swedish School of Textiles, University of Boras, Report no. 2010.13.13
EMCC (2008), “Trends and drivers of change in the European textiles and clothing sector: Mapping report”, European Foundation for the Improvement of Living and Working Conditions
EMCC (2008), “EU textiles and clothing sector: Location decisions”, 12 p.
European Apparel and Textiles Organisation (2003), Updated non-tariff barriers in the textile and clothing market for selected countries, retrieved from http://www.euratex.org/content/updated-non-tariff-barriers-textile-and-clothing-market-selected-countries
European Apparel and Textile Organisation (2005), “Where does Europe’s Textile & Clothing indus-try stand today?”, http://www.euratex.org/system/files/attached-files/euratex_position_paper_on_nama_negotiations_for_hk_ministerial.pdf
European Commission (2011), The textile and Clothing sector and EU trade policy, retrieved from trade.ec.europa.eu/doclib/html/148259.htm
European Commission (2010a), “An Integrated Industrial Policy for the Globalisation Era Putting Competitiveness and Sustainability at Centre Stage”, Communication from the Commission to the European Parlement, the Council, the European Economic and Social Committee and the Committee of the Regions, COM(2010) 614
European Commission (2010b), “Unlocking the potential of the Cultural and Creative Industries”, Green Paper, COM(2010) 183
European Commission (2009), “Design as a driver of user-centred innovation”, Commission Staff Working Document, SEC(2009)501
European Commission (2008), “Report on EU Customs Enforcement of Intellectual Property Rights: Results at the European Border”, February 2008.
European Commission (2006), “ICT and e-Business in the Footwear Industry: ICT adoption and e-business activity in 2006”, E-Business W@tch Sector Report No. 2/2006
European Commission (2005), “ICT and Electronic Business in The Textile and Clothing Industry ICT adoption and e-business activity”, E-Business W@tch Sector Impact Study No. 02;
Europe INNOVA (2008), “Sectoral innovation systems in Europe: Textiles”, WIFO, Vienna, May 2008
Europe INNOVA Innovation Watch (2010), “Sectoral innovation foresight: textiles and clothing”
Faust M. (2005), “Reorganisation and relocation in the German Fashion Industry: Organisational Configurations and Locational Choices of Firms: Responses to Globalisation in Different Indus-try and Institutional Environments”, University of Cambridge
Foord, J. (2008), “Strategies for creative industries: An international review”, Creative Industries Journal, vol. 1, No. 2
Study on the Competitiveness of the EU fashion industries
March 2012 177
Franke N. and Schreier M. (2008), “Product uniqueness as a driver of customer utility in mass customization”, Marketing Letters, Volume 19, Number 2, 93-107
Fraser S. and S. Lomax (2011), “Access to finance for creative industry businesses”, report pre-pared for BIS and DCMS
Friorito S., May E. and Straughn K. (1995), “Quick response in retailing: components and imple-mentation”, International Journal of Retail & Distribution Management, Volume 23, Number 5, (1995), pp. 12–21
Fundacion Opti (2011), Horizontes 2015-2020: Los retos futuros del sector calzado, Documento sintesis, 10 de mayo de 2011
Galindo-Rueda, F., Haskel, J. and Pesole, A. (2010), “How much does the UK employ, spend and invest in design?”, www.ceriba.org.uk
Ginman C., Lundell C. and Turek C. (2010), “Luxury for the Masses, A Study of the H&M Luxury Collaborations with Focus on the Images of the Luxury Designer Brands”, Uppsala University, Department of Business Studies
Gereffi G. and Frederick S. (2010), The Global apparal value chain, trade and the crisis, challenges and opportunities for developing countries, World Bank Policy and Research paper No. 5281
Gereffi G. and Federick S. (2009), Review and Analysis of Protectionist Actions in the Textile & Ap-parel Industries, Paper prepared for the World Bank and the Center for Economic Policy Re-search (CEPR)
Gereffi G. and Memedovic O. (2003) “The Global Apparel Value Chain: What Prospects for Upgrad-ing by Developing Countries”, UNIDO Sectoral Studies Series
Gereffi, G. (1999), “International trade and industrial upgrading in the apparel commodity chain”, Journal of International Economics, Vol. 48, No. 1
Grail Research (2009), “The Global Fashion Industry – Growth in Emerging Markets”, September 2009, retrieved from http://grailresearch.com/pdf/ContenPodsPdf/Global_Fashion_Industry_Growth_in_Emerging_Markets.pdf
Green, R.T. and Smith, T. (2002), “Executive Insights: Countering Brand Counterfeiters,” Journal of International Marketing, Vol. 10, No. 4, 89-106Guiette, A., Jacobs, S., Schramme, A. and Vanden Bempt, K. (2011), “Creatieve industrieën in Vlaanderen: mapping en bedrijfsecono-mische analyse”, FlandersDC Research Report
Hansen, T. and Winther, L. (2011), “Innovation, regional development and relations between high- and low-tech industries”, European Urban and Regional Studies, vol. 18, No. 3
Hasanbeigi A. (2010), “Energy-efficiency improvement opportunities for the textile industry”, Ern-est Orlando Lawrence Berkely National Laboratory, China Energy Group, Energy Analysis De-partment, Environmental Energy Technologies Division
Hauge, A. (2004), “The Learning Dynamics and Competitiveness of Swedish Fashion: a theoretical framework”, Uppsala University, November 2004
Heine K. (2011), The concept of luxury brands, Technische Universitat Berlin, retrieved from www.conceptofluxurybrands.com
Heymann, E. (2011), “Textil- und Bekleidungsindustrie: Innovationen und Internationalisierung als Erfolgsfaktoren“, Aktuelle Themen No. 519, 06.07.2011, Deutsche Bank Research
Hines, T. (2007), “Supply chain strategies, structures and relationships”, published in Fashion Marketing Contemporary Issues, second edition, ISBN–13: 978-0-7506-6897-2
Hines, T. and McGowan, P. (2005), “Supply Chain Strategies in the UK Fashion Industry—The Rhetoric of Partnership and Realities of Power”, International Entrepreneurship and Manage-ment Journal, Volume 1, Number 4, 519-537
Hinestroza, J.P. (2007), “Can nanotechnology be made fashionable?”, Materials Today, vol. 10, No. 9
Hirsch-Kreinsen, H. (2008), “Low-tech” Innovations. Industry and Innovation, vol. 15, No. 1
HKU (2010), “The entrepreneurial dimension of the cultural and creative industries”, Hogeschool voor de Kunsten Utrecht, Utrecht
Horrocks, A. and Anand, S. [2000]: Handbook of Technical Textiles. Manchester: Textile Institute
Study on the Competitiveness of the EU fashion industries
March 2012 178
ILO (1996), Globalization of the Footwear, Textiles and Clothing Industries, International Labour Organization, Geneva
Imagine.. Creative Industries Research (2005), “A Mapping of Danish Fashion Industry”, Copenha-gen Business School, March 2005
IPeuropAware project (2009), “Intellectual Property, A business tool for SMEs” - A Guide for the Textile and Clothing Industry, the Footwear Industry, the Leather Industry – url: http://www.innovaccess.eu/handbooks_lang.html
Jarboe, K.P. (2007), “Measuring Intangibles. A summary of recent activity”, Athena Alliance Work-ing Paper, No. 2
Joshi, M. and Bhattacharyya, A. (2011), “Nanotechnology – a new route to high performance func-tional textiles”, Textile Progress, vol. 43, No. 3
Kamali N. and Loker S. (2002), Mass Customization: On-line Consumer Involvement in Product Design, Journal of Computer Mediated Communication 7 (4), 2002
Karra N. (2008) The UK Designer Fashion Economy Value relationships – identifying barriers and creating opportunities for business growth, Centre for Fashion Enterprise (CFE) report for NESTA, December (2008)
KEA (2006), “The economy of culture”, study on behalf of the European Commission
Kim, J. (2010), “Recent Trends in Export Restrictions”, OECD Trade Policy Working Papers, No. 101, OECD Publishing
Kim, W.C. and Mauborgne, R. (2005), The blue ocean strategy, Harvard Business School Press, p. 256
King A., Di Stefano G., Verona G. (s.d.), “Protecting innovation in low-IPR regimes: the case of fine fashion”, Universita’ Commerciale L. Bocconi
Kumar N. and Steenkamp J. B. (2007), Private label strategy – How to meet the store brand chal-lenge?, Harvard Business School Press, ISBN-10: 1-4221-0167-3
Kunyuan, X. (Vice Chairman, China National Textile and Apparel Council) (2011), “Major tasks for China Textile Industry during the 12th Five Year Plan Period”, PPT presentation at China Inter-national Textile Feedstock Market Forum, 26-27 May, Shanghai, http://www.ccfei.net/UpFile/Conference/201106241629586440679.pdf
Law K. M., Zhang Z.M. and Leung C.S (2004), “Fashion change and fashion consumption: the cha-otic perspective”, Journal of Fashion Marketing and Management, Vol. 8 No. 4, (2004), pp. 362-374
Lin S., “Investigating Sources of Creativity in the UK Fashion Industry: A Resource-Based View”, Manchester Metropolitan University, United Kingdom, retrieved from: http://www.fashion.arts.ac.uk/media/research/documents/Shuyu%20Lin%20-%20Sources%20of%20Creativity.pdf
Lowson, B. (1998), “The Role of the SME and the Outlook for its Future Prospects in the Manufac-ture and Distribution of Textiles and Clothing”, Journal of the Textile Institute, 89:2, 169-186
Luzzini D. and Ronchi S. (2009), “Purchasing management in the luxury industry: organisation and practices”, Operations Management Research, Volume 3, Numbers 1-2, pp. 7-21
Malen W. (2008), “Fashion designers as business: London”, Journal of Fashion Marketing and Man-agement, Vol. 12 No. 3, (2008), pp. 398-414
Maskell P. (2005), “A Mapping of Danish Fashion Industry”, published by IMAGINE. Creative Indus-tries Research at Copenhagen Business School, CBS
McKinsey & Company (2007), “How half the world shops: Apparel in Brazil, China, and India”, McKinsey Quarterly, 2007, No 4.
McRobbie A. (2002), “Fashion Culture: Creative Work, Female Individualization”, Feminist Review, No. 71, Fashion and Beauty (2002), pp. 52-62
Mendonça, S. (2009), “Brave old world: Accounting for ‘high-tech’ knowledge in ‘low-tech’ indus-tries”, Research Policy, vol. 38, No. 3
Mishra, S. (2010), “Luxury and Lifestyle Retail in India: A Multifaceted Market”, International Jour-nal of Arts and Sciences 3(7), pp. 267 - 277
Study on the Competitiveness of the EU fashion industries
March 2012 179
Monseau, S. (2011), “European Design Rights: A Model for the Protection of All Designers from Piracy”, American Business Law Journal, Volume 48, Issue 1, pages 27–76, Spring 2011Moore C. M. and Birtwistle G. (2004), “The Burberry business model: creating an international luxury fashion brand”, International Journal of Retail & Distribution Management, Volume 32, Num-ber 8 , (2004), pp. 412-422
Moore C. M. and Birtwistle G. (2005), “The nature of parenting advantage in luxury fashion retail-ing – the case of Gucci group NV”, International Journal of Retail & Distribution Management, Vol. 33 No. 4, (2005), pp. 256-270
Moore C. M. and Birtwistle G. (2004), “The Burberry business model: creating an international lux-ury fashion brand”, International Journal of Retail & Distribution Management, Volume 32, Number 8 , (2004), pp. 412-422
Moore, C. M., Fernie, J. and Burt S. (2000), “Brands without boundaries - The internationalisation of the designer retailer’s brand”, European Journal of Marketing, Vol. 34 No. 8, (2000), pp. 919-937.
Morton F. S. and Zettelmeyer F. (2004), ”The Strategic Positioning of Store Brands in Retailer–Manufacturer Negotiations”, Review of Industrial Organization 24, (2004), pp.161–194
MoTIV (2008), “Wat betekend duurzaamheid voor fashion?” (What does sustainability mean for fashion?), MoTIV workshop
NetFinTex (2006), “Business models and IPR strategies”, Europe INNOVA, July 2006
Nguyen V. (2004), “Analysis of the Luxury Goods & Apparel and Footwear Industries”, retrieved from http://uwlax.edu/urc/JUR-online/PDF/2004/nguyen.pdf
Nordas, H. K. (2004), “The Global Textile and Clothing Industry post the Agreement on Textiles and Clothing”, World Trade Organization, Discussion Paper No 5.
Nueno J. L. and Quelch J. A. (1998), “The Mass Marketing of Luxury, Business Horizons”, Volume: 41, Issue: 6, pp. 61-68
OECD and Eurostat (2005), “Oslo Manual - Proposed Guidelines for Collecting and Interpreting Technological Innovation Data”, 3rd Edition, Paris, p. 46
OECD (2008), The Economic Impact of Counterfeiting and Piracy, OECD, Paris, June 2008, 397 p
OECD (2006), “Financing SMEs and entrepreneurs”, OECD Policy Brief, Nov. 2006
OECD (2004), A New World Map in Textile and Clothing, Adjusting to Change, OECD, Paris
Oxford Economics (2011), “The value of the UK fashion industry”, report on behalf of the British Fashion Council, London, 108 pp
Pasinetti, L.L. (1981), Structural Change and Economic Growth: A Theoretical Essay of the Dynam-ics of the Wealth of Nations, Cambridge: Cambridge University Press
Pavitt, K. (1984), “Sectoral patterns of technical change: Towards a taxonomy and a theory”, Re-search Policy, vol. 13, No. 6
Piller, F. (2005), “Mass Customization: Reflections on the State of the Concept”, International Jour-nal of Flexible Manufacturing Systems, 16, 313–334, 2004
Pine, J. and Gilmore, J. (1999), The Experience Economy, Harvard Business School Press, Boston, 1999
Rabiano S., Simoni C. and Zanni L. (2008), “Small & Medium Gold & Fashion Enterprises (SMEs) in Arezzo, Italy: Competitive Challenges and Strategic Implications”, Journal of Global Marketing, 21:2, pp. 141-159
Raffo C., Lovatt A., Banks M., and O’Connor J. (2000), “Teaching and learning entrepre-neurship for micro and small businesses in the cultural industries sector”, Education & Training, Vol 42 No. 6, pp. 356-364
Raju J., Sethuraman R. and Dhar S. (1995), “The Introduction and Performance of Store Brands”, Management Science, Vol. 41, No. 6 (1995), pp. 957-978
Rangnekar D. (2004), “Demanding stronger protection for geographical indications: the relation-ship between local knowledge, information and reputation”, Discussion paper series, United Nations University, Institute for New Technologies
Study on the Competitiveness of the EU fashion industries
March 2012 180
Richardson J. (1996), “Vertical Integration and Rapid Response in Fashion Apparel”, Organization Science, Vol. 7, No. 4 (1996), pp. 400-412
Roberts A. (2011), “Luxury brands scrambling as cost of leather soars”, The San Francisco Chroni-cles, Bloomberg Business Week, September 19 2011
Sen A. (2008), “The U.S. fashion industry: a supply chain review”, International Journal of Produc-tion Economics, Volume 114, Issue 2, (2008), pp. 571-593
Silverstein M. J. and Fiske N. (2003), “Luxury for the masses”, Harvard Business Review, vol. 81, no. 4, April, pp. 48-57
Skillset (2011), “Sector Skills Assessment for the Fashion and Textiles Sector in the UK”, January 2011, 123 p
Skillset (2010), “Strategic Skills Assessment for the Fashion and Textiles Sector in the UK”, Febru-ary 2010, 85 p
Skov L. (2008), “Creativity at Work: Ethics and the fashion industry in West Europe”, Creative En-counters Working Papers, No. 18
Smakman, F. (2004), “Local Industry in Global Networks. Competitive Adjustment, Corporate Strategies and Pathways of Development in Singapore and Malaysia’s Garment Industry”, PhD Thesis, Utrecht University, The Netherlands. Rozenberg: Amsterdam
Soberman A. J. and Parker P. M. (2006), “The economics of quality-equivalent store brands”, In-ternational Journal of Research in Marketing, 23, (2006), pp. 125–139
Som, C., Wick, P., Krug, H. and Nowack, B. (2011), “Environmental and health effects of nano-materials in nanotextiles and façade coatings”, Environment International (forthcoming, in press)
Sorrell S., Speirs J., Bentley R., Brandt A., Miller R. (2009), “An assessment of the evidence for a near-term peak in global oil production”, Technology and Policy Assessment function of the UK Energy Research Centre;
Staake, T., Thiesse F. and Fleisch, E. (2009), “The Emergence of Counterfeit Trade: A Literature Review”, European Journal of Marketing, Vol. 43, No. 3-4, 320-349
Stengg W. (2001), “The textile and clothing industry in the EU - A survey”, European Commission Enterprise Directorate-General, Enterprise Papers No 2 – 2001, prepared for the European Commission Enterprise Directorate-General
Schwarz A., Van Langenhove L., Guermonprez, P, Deguillemont, D. (2010), “A roadmap on smart textiles”, Textile Progress, vol. 42, No. 2
Swoboda B., Pop N. A. and Dabija D.C. (2010), “Vertical Alliances between Retail and Manufacturer Companies in the Fashion Industry”, Amfiteatru Economic
T.A. Kearney (2011), “Retail Global Expansion: A portfolio of opportunities, The 2011 T.A. Kearney Global Retail Development Index”
Taplin I. M. (2006), “Restructuring and reconfiguration, The EU textile and clothing industry adapts to Change”, European Business Review, Vol. 18 No. 3, 2006, pp. 172-186
Taplin I. M. and Winterton J. (2004), “The European clothing industry Meeting the competitive chal-lenge”, Journal of Fashion Marketing and Management Vol. 8 No. 3, 2004 pp. 256-261
Tiedemann A. (2009), “EU Market Access Teams: New Instruments to Tackle Non-tariff Barriers to Trade”, EU Diplomacy Papers 9/2009, Department of EU International Relations and Diplomacy Studies
Tokatli, N. (2007), “Global sourcing: insights from the global clothing industry—the case of Zara, a fast fashion retailer”, Journal of Economic Geography, 8 (2008), pp. 21–38
Tooth, J. (2010), “Mini-study on access to finance activities of the European Creative Industry Alli-ance”, report on behalf of the European Commission DG ENTR, Angel Capital Group and Greater London Enterprise, January 2010
Tran, Y. (2008), “Fashion in the Danish experience economy. Challenges for growth”, Samfundslit-teratur, Denmark
Van Ark, B., Hao, J.X., Corrado, C. and Hulten, C. (2009), “Measuring intangible capital and its contribution to economic growth in Europe”, EIB Papers, vol. 14, No. 1
Study on the Competitiveness of the EU fashion industries
March 2012 181
Van Opijnen M. (CREM), Oldenziel J. (SOMO) (2011), “Responsible Supply Chain Management: potential success factors and challenges for addressing prevailing human rights and other CSR issues in supply chains of EU-based companies”, Centre for Research on Multinational Corpora-tions.
Veblen, T. (1964), “The economic theory of woman’s dress”, in Ardzrooni, L. (ed.), Essays in our changing order: Thorstein Veblen (pp. 65–77). New Jersey: Transaction Publishers
Vincent I. (2007), “It’s all about Amazon chic now”, Maclean's, Volume 120 Issue 39, (2007) pp. 90
von Tunzelmann, N. and Acha, V. (2005), “Innovation in ‘low-tech’ industries”. In: Fagerberg, J., Mowery, D.C. and Nelson, R.R. (eds.) The Oxford Handbook of Innovation. Oxford: Oxford University Press, pp. 407-432
WWF (2003), “Thirsty Crops: Our food and clothes: eating up nature and wearing out the environ-ment?”
Zigmantavičienė A. and Snieška V. (2006), “Methods of measurement of non-tariff barriers in the international textile trade”, Engineering Economics, No 1 (46), 2006
Websites
BBC (2011), Judge orders Google and Facebook to remove fake sites, http://www.bbc.co.uk/news/technology-15959882
BBC (2011b), eBay 'may be liable' for sale of fake goods, court says http://www.bbc.co.uk/news/business-14127465
Bloomberg Businessweek (2011), Heng Long, Noble Group, Tiong Woon: Singapore Stocks Pre-view, October 9th 2011, retrieved from http://www.businessweek.com/news/2011-10-09/heng-long-noble-group-tiong-woon-singapore-stocks-preview.html
CIA World Factbook: India
https://www.cia.gov/library/publications/the-world-factbook/geos/in.html
CIA World Factbook: China
https://www.cia.gov/library/publications/the-world-factbook/geos/ch.html
China Apparel (2012), International brand’s expansion in China, retrieved from http://www.chinaapparel.net/topic/81/
China Fashion Trends (2011), Speed bumps on the path into China’s luxury market, August 24th 2011, retrieved from http://www.chinafashiontrends.com/2011/08/24/speed-bumps-on-the-path-into-chinas-luxury-market/
CNN Money (2009) How fashion designers break into boutiques, January 15th 2009, retrieved from http://smallbusiness.blogs.cnnmoney.cnn.com/2009/01/15/how-fashion-designers-break-into-boutiques/
European Commission (a): Textiles and Clothing Trade Issues http://ec.europa.eu/enterprise/sectors/textiles/external-dimension/trade-issues/index_en.htm
European Commission (b): Industrial Goods, Textiles and Footwear
http://ec.europa.eu/trade/creating-opportunities/economic-sectors/industrial-goods/textiles-and-footwear/
European Commission ( c): European Competitiveness – Trade Barriers http://ec.europa.eu/trade/creating-opportunities/trade-topics/european-competitiveness/tariff-barriers/
European Commission; Market Access Database; http://madb.europa.eu/mkaccdb2/indexPubli.htm
Louis Vuitton website http://www.louisvuitton.eu/front/#/eng_E1/Homepage
LVMH website www.lvmh.com/the-group/lvmh-companies and brands/
Study on the Competitiveness of the EU fashion industries
March 2012 182
McKinsey & Company (a): From Mao to Wow: Winning in China's booming apparel market, http://csi.mckinsey.com/Knowledge_by_region/Asia/China/chinaapparel
McKinsey & Company (b): India’s fast-growing apparel market http://csi.mckinsey.com/Home/Knowledge_by_region/Asia/India/Indias_fast_growing_apparel_market.aspx
McKinsey & Company ( c): Dress for success: Cracking Russia’s apparel market
http://csi.mckinsey.com/Home/Knowledge_by_region/Europe_Africa_Middle_East/Cracking_Russian_apparel_market.aspx
MSNBC (2010), EBay found liable in Louis Vuitton suit, http://www.msnbc.msn.com/id/35354172/ns/business-world_business/
Okonkwo U. Brand Papers - Redefining the Luxury Concept, retrieved from: http://www.brandchannel.com/papers_review.asp?sp_id=485
PPR (2010), Gucci Group furthers its expansion in China, June 23rd 2010, retrieved from http://www.ppr.com/en/magazine/issue/40/gucci-group-furthers-its-expansion-china
Smartcompany (2012), How eBay and Amazon keep revolutionising retail, http://www.smartcompany.com.au/retail/how-ebay-and-amazon-keep-revolutionising-retail.html
Telegraph (2011), Tory Burch wins $164million in anti-counterfeit suit, http://fashion.telegraph.co.uk/news-features/TMG8572917/Tory-Burch-wins-164million-in-anti-counterfeit-suit.html
Telegraph (2011b), eBay liable for counterfeits sold on its site, http://fashion.telegraph.co.uk/news-features/TMG8632712/eBay-liable-for-counterfeits-sold-on-its-site.html
Telegraph (2011c), LVMH snap up a crocodile tannery, October 10th 2011, retrieved from http://fashion.telegraph.co.uk/news-features/TMG8818802/LVMH-snap-up-a-crocodile-tannery.html
The Economist (2011), The fashion industry, The glossy posse - Catwalks in the West, action in the East, The Economist, Oct 1st 2011, retrieved from http://www.economist.com/node/21530989
The Guardian (2010), Fashion Statement: Is customisation the future of fashion?, November 11th 2010, retrieved from http://www.guardian.co.uk/lifeandstyle/2010/nov/10/fashion-statement-customisation-burberry
The New York Times (1988), Fashion; private means, The New York Times, April 10th 1988, re-trieved from http://www.nytimes.com/1988/04/10/magazine/fashion-private-means.html?pagewanted=all&src=pm
The New York Times (2004), Do-It-Yourself Design: Just Point and Click, October 24th 2004, http://www.nytimes.com/2004/10/24/fashion/24CUST.html?pagewanted=2&_r=1
The New York Times, (2010), High Fashion Relents to Web’s Pull, The New York Times, July 11th 2010, retrieved from http://www.nytimes.com/2010/07/12/business/12luxury.html
USA Today (2007), Online shopping: Now it's personal, January 8th 2007, retrieved from http://www.usatoday.com/life/lifestyle/fashion/2007-07-31-online-shopping_N.htm
WTO Tariff Downloading Facility http://tariffdata.wto.org/ReportersAndProducts.aspx
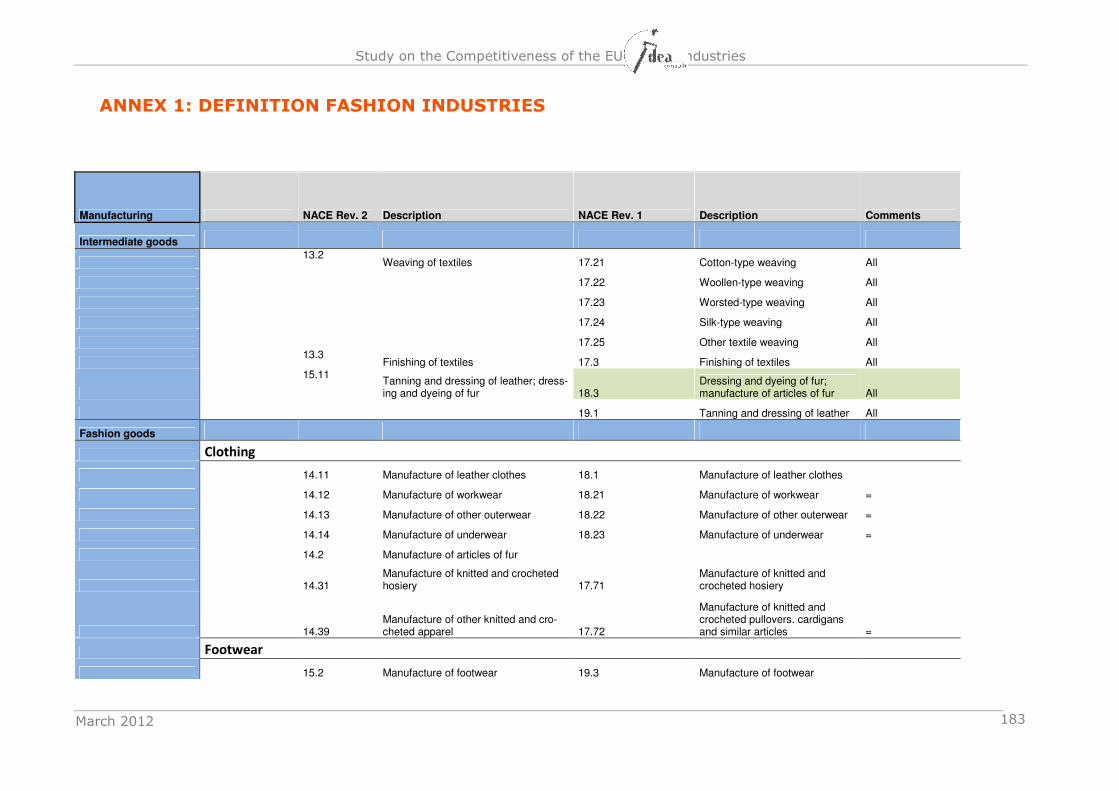
Study on the Competitiveness of the EU fashion industries
March 2012
183
ANNEX 1: DEFINITION FASHION INDUSTRIES
Manufacturing NACE Rev. 2 Description NACE Rev. 1 Description Comments
Intermediate goods
13.2 Weaving of textiles 17.21 Cotton-type weaving All
17.22 Woollen-type weaving All
17.23 Worsted-type weaving All
17.24 Silk-type weaving All
17.25 Other textile weaving All
13.3 Finishing of textiles 17.3 Finishing of textiles All
15.11 Tanning and dressing of leather; dress-ing and dyeing of fur 18.3
Dressing and dyeing of fur; manufacture of articles of fur All
19.1 Tanning and dressing of leather All
Fashion goods
Clothing
14.11 Manufacture of leather clothes 18.1 Manufacture of leather clothes
14.12 Manufacture of workwear 18.21 Manufacture of workwear =
14.13 Manufacture of other outerwear 18.22 Manufacture of other outerwear =
14.14 Manufacture of underwear 18.23 Manufacture of underwear =
14.2 Manufacture of articles of fur
14.31 Manufacture of knitted and crocheted hosiery 17.71
Manufacture of knitted and crocheted hosiery
14.39 Manufacture of other knitted and cro-cheted apparel 17.72
Manufacture of knitted and crocheted pullovers. cardigans and similar articles =
Footwear
15.2 Manufacture of footwear 19.3 Manufacture of footwear
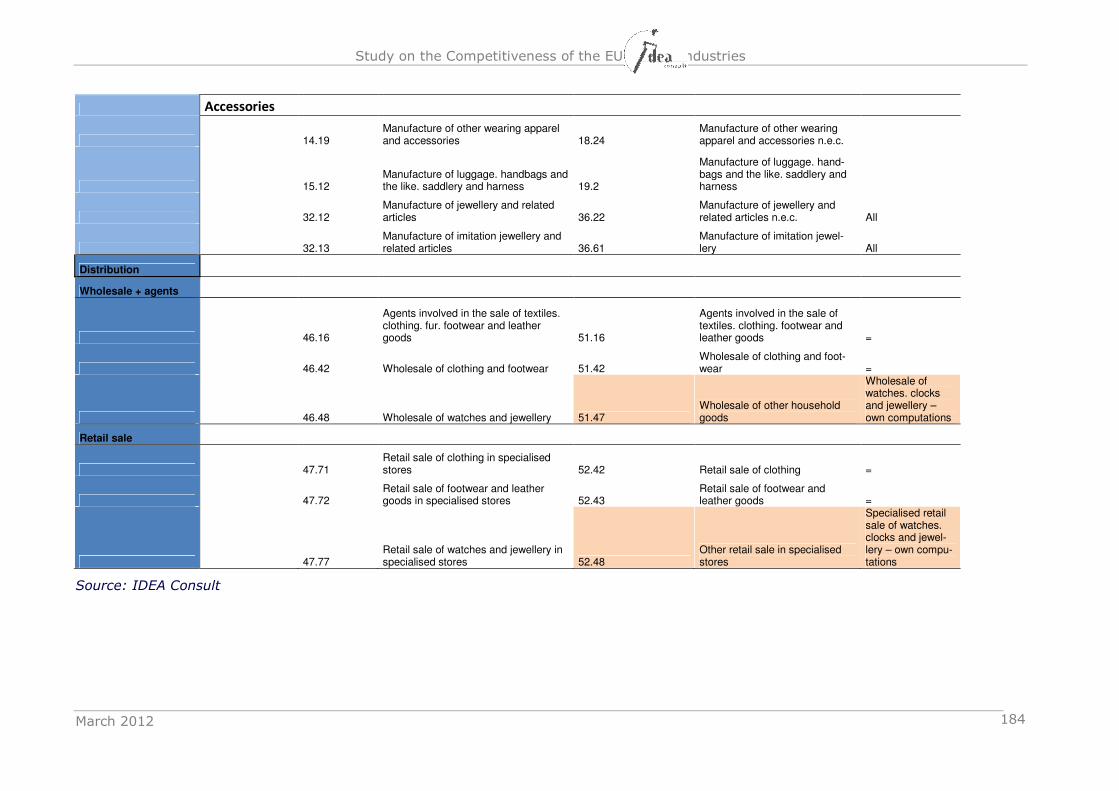
Study on the Competitiveness of the EU fashion industries
March 2012
184
Accessories
14.19 Manufacture of other wearing apparel and accessories 18.24
Manufacture of other wearing apparel and accessories n.e.c.
15.12 Manufacture of luggage. handbags and the like. saddlery and harness 19.2
Manufacture of luggage. hand-bags and the like. saddlery and harness
32.12 Manufacture of jewellery and related articles 36.22
Manufacture of jewellery and related articles n.e.c. All
32.13 Manufacture of imitation jewellery and related articles 36.61
Manufacture of imitation jewel-lery All
Distribution
Wholesale + agents
46.16
Agents involved in the sale of textiles. clothing. fur. footwear and leather goods 51.16
Agents involved in the sale of textiles. clothing. footwear and leather goods =
46.42 Wholesale of clothing and footwear 51.42 Wholesale of clothing and foot-wear =
46.48 Wholesale of watches and jewellery 51.47 Wholesale of other household goods
Wholesale of watches. clocks and jewellery – own computations
Retail sale
47.71 Retail sale of clothing in specialised stores 52.42 Retail sale of clothing =
47.72 Retail sale of footwear and leather goods in specialised stores 52.43
Retail sale of footwear and leather goods =
47.77 Retail sale of watches and jewellery in specialised stores 52.48
Other retail sale in specialised stores
Specialised retail sale of watches. clocks and jewel-lery – own compu-tations
Source: IDEA Consult
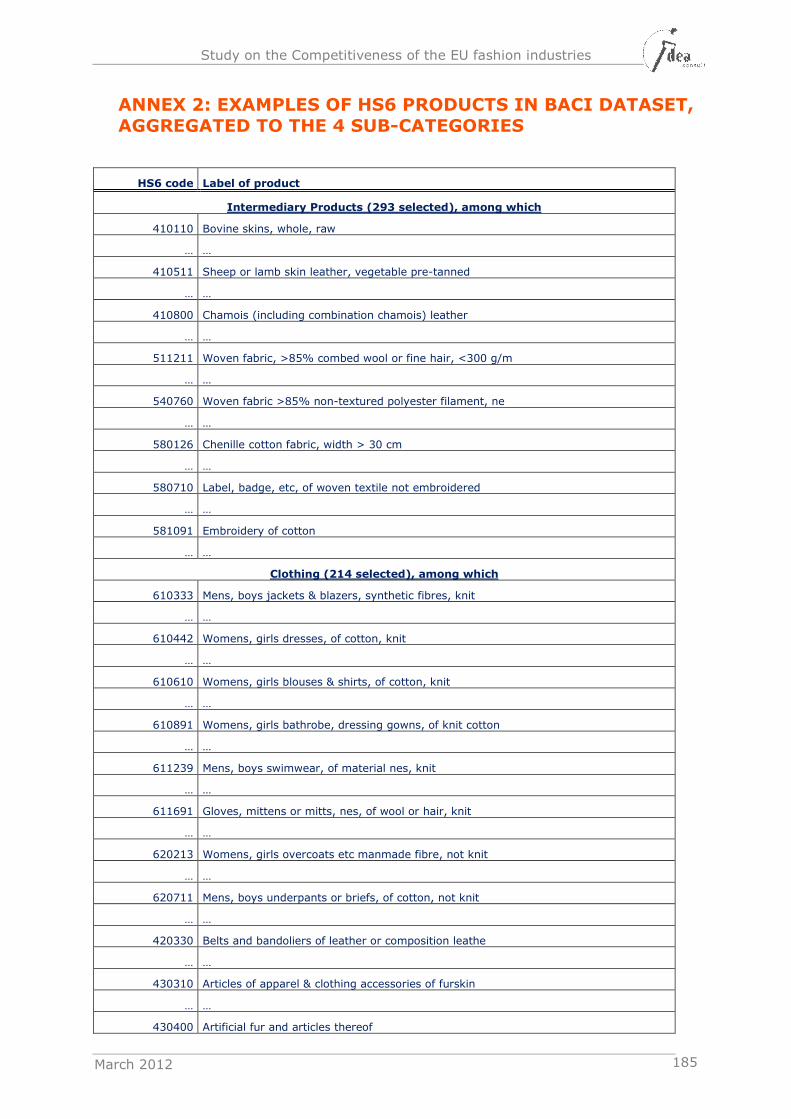
Study on the Competitiveness of the EU fashion industries
March 2012 185
ANNEX 2: EXAMPLES OF HS6 PRODUCTS IN BACI DATASET,
AGGREGATED TO THE 4 SUB-CATEGORIES
HS6 code Label of product
Intermediary Products (293 selected), among which
410110 Bovine skins, whole, raw
… …
410511 Sheep or lamb skin leather, vegetable pre-tanned
… …
410800 Chamois (including combination chamois) leather
… …
511211 Woven fabric, >85% combed wool or fine hair, <300 g/m
… …
540760 Woven fabric >85% non-textured polyester filament, ne
… …
580126 Chenille cotton fabric, width > 30 cm
… …
580710 Label, badge, etc, of woven textile not embroidered
… …
581091 Embroidery of cotton
… …
Clothing (214 selected), among which
610333 Mens, boys jackets & blazers, synthetic fibres, knit
… …
610442 Womens, girls dresses, of cotton, knit
… …
610610 Womens, girls blouses & shirts, of cotton, knit
… …
610891 Womens, girls bathrobe, dressing gowns, of knit cotton
… …
611239 Mens, boys swimwear, of material nes, knit
… …
611691 Gloves, mittens or mitts, nes, of wool or hair, knit
… …
620213 Womens, girls overcoats etc manmade fibre, not knit
… …
620711 Mens, boys underpants or briefs, of cotton, not knit
… …
420330 Belts and bandoliers of leather or composition leathe
… …
430310 Articles of apparel & clothing accessories of furskin
… …
430400 Artificial fur and articles thereof
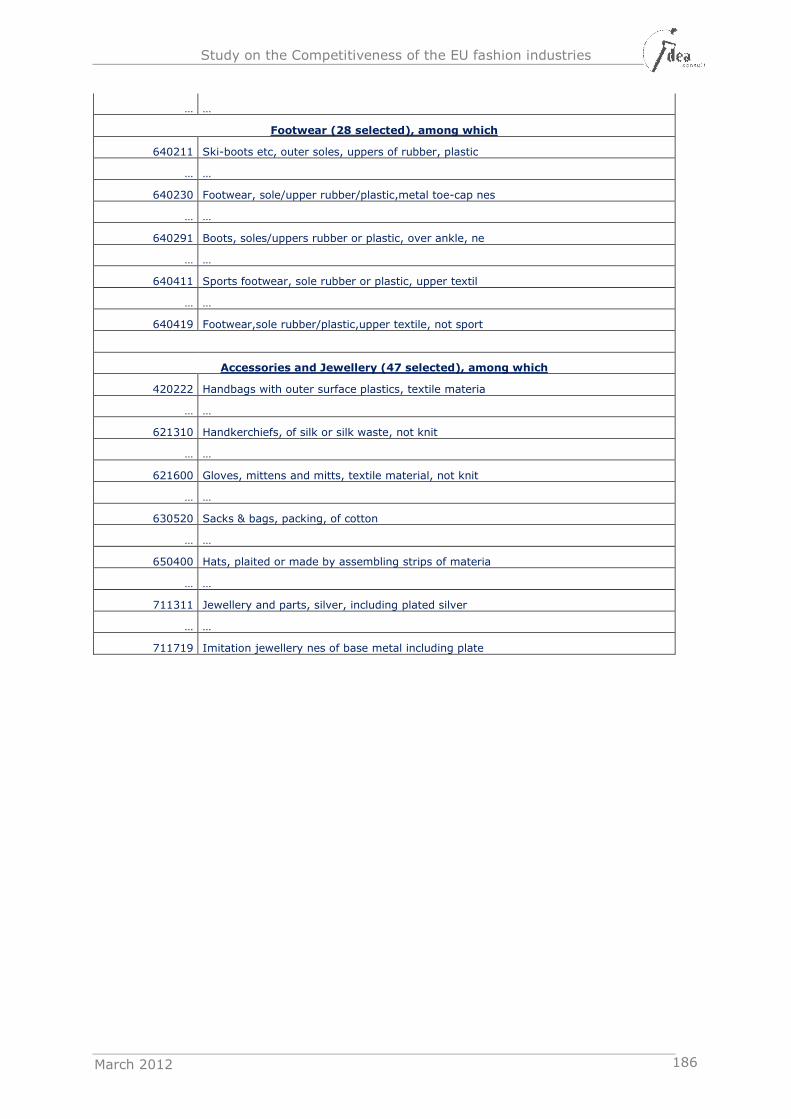
Study on the Competitiveness of the EU fashion industries
March 2012 186
… …
Footwear (28 selected), among which
640211 Ski-boots etc, outer soles, uppers of rubber, plastic
… …
640230 Footwear, sole/upper rubber/plastic,metal toe-cap nes
… …
640291 Boots, soles/uppers rubber or plastic, over ankle, ne
… …
640411 Sports footwear, sole rubber or plastic, upper textil
… …
640419 Footwear,sole rubber/plastic,upper textile, not sport
Accessories and Jewellery (47 selected), among which
420222 Handbags with outer surface plastics, textile materia
… …
621310 Handkerchiefs, of silk or silk waste, not knit
… …
621600 Gloves, mittens and mitts, textile material, not knit
… …
630520 Sacks & bags, packing, of cotton
… …
650400 Hats, plaited or made by assembling strips of materia
… …
711311 Jewellery and parts, silver, including plated silver
… …
711719 Imitation jewellery nes of base metal including plate


