Embed Size (px)
Citation preview

Centre for Biofield Sciences
Kundalini Research Project
Protocol Number: 070115

2
KUNDALINI RESEARCH PROJECT SUMMARY
PRINCIPLE INVESTIGATOR: Kimberly Schipke, M.S. SUB-INVESTIGATORS: Dr. Avinash S. Chafekar Dr. Subrata Kabiraj
Thornton Streeter RESEARCH COORDINATORS: Sudhir Neurgoankar
Swami Mournamurti RESEARCH ASSISTANTS: Dr. Bhagyashree Nilkanth
Kedar Moore Suyash Pandekar STUDY TITLE: Study of the effects of raising kundalini with modern subtle energy technology compared to a non-meditator STUDY OBJECTIVE: To assess the effects of raising kundalini with modern subtle energy technology TIME PERIOD OF THE STUDY: January 7-9, 2015 (3 days) PRIMARY DATA COLLECTION: Centre for Biofield Sciences World Peace Centre at Maharashtra Institute of Technology Paud Rd., Kothrud Pune, India 411038 STUDY DESIGN: Double participant study to evaluate the subtle changes with occur with raising kundalini compared to a non-meditator CONTACT INFORMATION: Name: Centre for Biofield Sciences Address: World Peace Centre MIT College Paud Road, Kothrud Pune, India 411 038 Phone: +64 9 833 1077 +91 (0) 20 2545 8748 Email: [email protected] Website: www.biofieldsciences.com
3
ABSTRACT Kundalini research has been performed for several decades, however, the collection of data using modern subtle energy technologies at the Centre for Biofield Sciences in Pune allows for current data and deeper insights into the subtle effects of raising kundalini. One person was recommended for research by the Kundalini Research Project as he claimed he can raise his kundalini at will and was compared against a control participant who is not a regular meditator. They were scanned with Biofield Viewer with Biofield Recording Visualization, Gas Discharge Visualization, ES-Complex and infrared imaging before, after, and in some cases during a kundalini raising event. Overall, the subtle changes were evaluated between the experimental participant and the control participant. No significant changes were recorded using the Biofield Viewer, Gas Discharge Visualization or infrared imaging; however, various changes were measured with the ES Complex for both participants. Further research is suggested with additional research subjects and longer duration for a more in depth study of kundalini.

4
TABLE OF CONTENTS Kundalini Research Project Summary ……………………………………………………. 2 Abstract ………………………………………………………………...…….…………...…. 3 Table of Contents …………………………………………………………………………… 4 Introduction ………………………………………………………………...……….……….. 5 Kundalini Background ………………………………………………...….………… 5
Biofield Background ..……………………………………………...………………. 6 Biofield Viewer with Biofield Recording Visualization .………......... …...…….. 7
Gas Discharge Visualization ………..…………………………………...……….... 8 ES Complex ……………..…..…………………………………………..……….…. 9 Infrared Imaging ……………………………………………………………………. 12 Specific Aim ………………………………………………………………………………….13 Methods ………………………………………………………………………………………13 Results ………………………………………………………………………………............ 14 Discussion …………………………………………………………………………………... 23 Conclusion …………………………………………………………………………………... 24 Appendix: Participant Informed Consent Form …………………………………………. 25 References ………………………………………………………………………………….. 30

5
INTRODUCTION
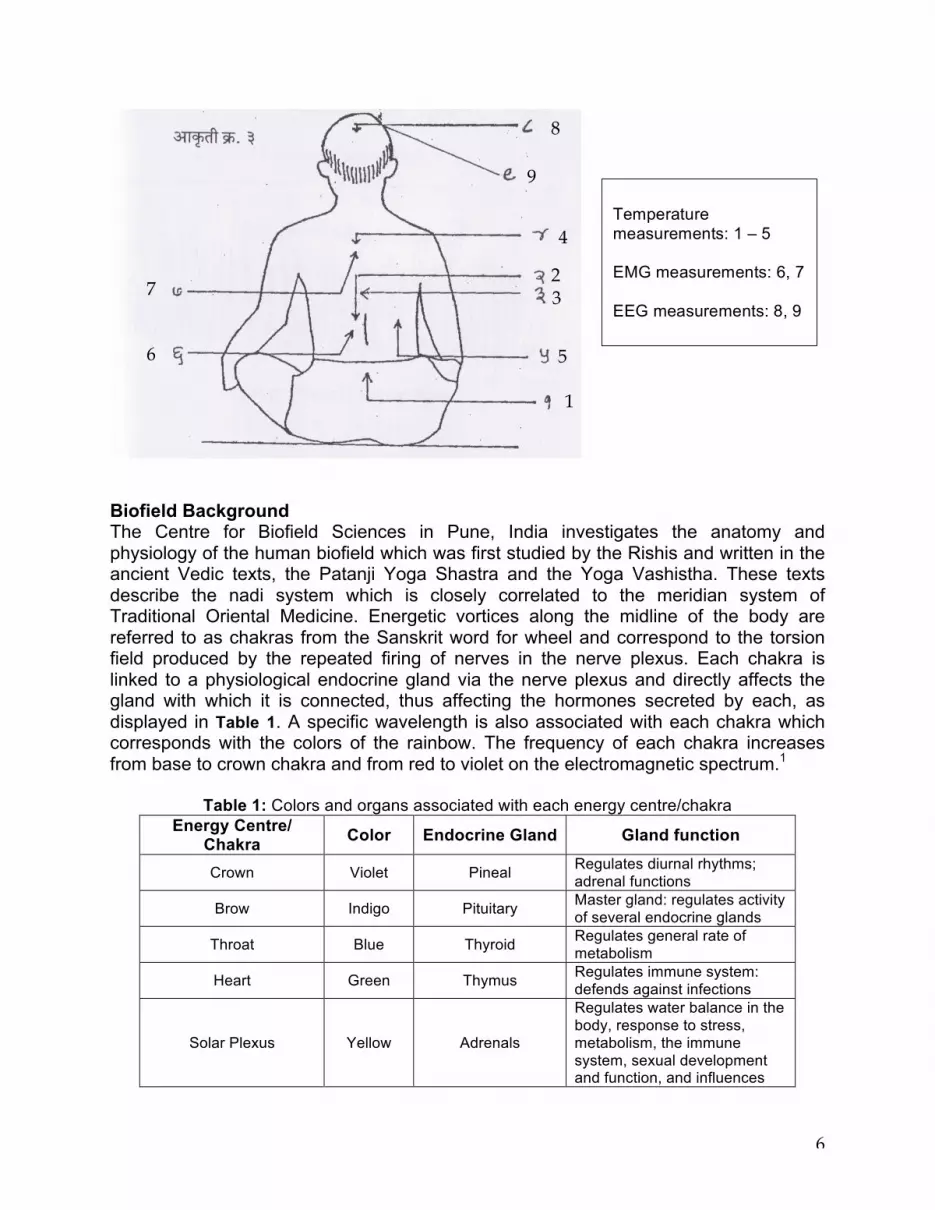
Kundalini Background In Sanskrit, kunda means means “pit or cavity” which is where the fire used during the ceremony of initiation is kindled. In Sir John Woodroffe’s book The Serpent Power, he shares the traditional descriptions of kundalini awakening. It is said that kundalini resides in the mooladhara in the form of a coiled snake and when the snake awakens it uncoils and shoots up through sushumna (the psychic passage in the center of the spinal cord), opening the other chakras as it goes. Brahmachari Swami Vyasdev, in his book Science of the Soul, describes the awakening of kundalini in the following way: “Sadhakas have seen the sushmna in the form of a luminous rod or pillar, a golden yellow snake, or sometimes as a shining black snake about ten inches long with blood red eyes like smouldering charcoal, the from part of the tongue vibrating and shining like lightning, ascending the spinal column.” The meaning of the coils of the serpent is as follows: The 3 coils represent the 3 matras of Om, which relate to past, present and future; to the gunas: tamas, rajas and sattva; to experience: subjective experience, sensual experience and absence of experience. The ½ coil represents the state of transcendence, where there is neither waking, sleeping nor dreaming. So the 3 ½ coils signify the total experience of the universe and the experience of transcendence. In recent decades more in depth scientific research has been done to evaluate these changes in the human body and biofield during the process of kundalini rising with various research tools and medical diagnostics. The Centre for Biofield Sciences is honored to have Dr. Avinash Chafekar as a member of their research team who performed some of the early kundalini research in the 1970s in Kaivaliadam, India. In his book Kundalini Shakti, he explains the details of his research. The parameters he measured were electroencephalogram (EEG), electromyogram (EMG), continuous skin temperature measurements and breathing activity. The diagram below shows the placement of electrodes and location of physiological measurements he used in the 1970s. The Centre for Biofield Sciences intends to re-create various aspects of this important foundational research to continue to build on past studies using the latest subtle energy technologies available in collaboration with the Kundalini Research Project who has put forward participants they feel worthy of research. The Kundalini Research Project has stated their mission objective is to: “Conduct a thorough scientific research on Kundalini Awakening to explore its positive impacts on physiology, biochemical, biophysical, genetic, psychological and overall wellness levels on individuals and the collective.”
6
Biofield Background The Centre for Biofield Sciences in Pune, India investigates the anatomy and physiology of the human biofield which was first studied by the Rishis and written in the ancient Vedic texts, the Patanji Yoga Shastra and the Yoga Vashistha. These texts describe the nadi system which is closely correlated to the meridian system of Traditional Oriental Medicine. Energetic vortices along the midline of the body are referred to as chakras from the Sanskrit word for wheel and correspond to the torsion field produced by the repeated firing of nerves in the nerve plexus. Each chakra is linked to a physiological endocrine gland via the nerve plexus and directly affects the gland with which it is connected, thus affecting the hormones secreted by each, as displayed in Table 1. A specific wavelength is also associated with each chakra which corresponds with the colors of the rainbow. The frequency of each chakra increases from base to crown chakra and from red to violet on the electromagnetic spectrum.1
Table 1: Colors and organs associated with each energy centre/chakra Energy Centre/
Chakra Color Endocrine Gland Gland function
Crown Violet Pineal Regulates diurnal rhythms; adrenal functions
Brow Indigo Pituitary Master gland: regulates activity of several endocrine glands
Throat Blue Thyroid Regulates general rate of metabolism
Heart Green Thymus Regulates immune system: defends against infections
Solar Plexus Yellow Adrenals
Regulates water balance in the body, response to stress, metabolism, the immune system, sexual development and function, and influences
8
9
4
2 3
5
1
6
7
Temperature measurements: 1 – 5 EMG measurements: 6, 7 EEG measurements: 8, 9

7
digestion and urinary system
Navel Orange Pancreas Regulates glucose to produce and maintain stores of energy.
Base Red Gonads Regulates sexual hormones
Nadis (or possibly meridians in Traditional Chinese Medicine) were physically discovered in 1963 by Professor Bonghan Kim. Thin fibers known as bonghan ducts have been found throughout the lymphatic, circulatory, and nervous system, and create web-like structures across the surface of internal organs.2-7 Figure 1 shows the anatomy of bonghan ducts and corpuscles as seen through stereoscopic microscopy.7 Within bonghan ducts, scientists have found granules of approximately 1µm in diameter which contain DNA and are proposed to be utilized in the cell repair process.2,8 These newly discovered fibers are thought to be the physical anatomy of the Nadi/meridian system and could possibly be involved in creating the energetic vortices within the biofield. As more scientists begin to explore the bonghan system and its function in the body, more doctors will gain insight into the application of the Nadi/meridian system to optimize the healing process utilizing this newly found system and now recently renamed in the scientific community as the Primo-Vascular system.
Figure 1: Stereoscopic microscope image of bonghan ducts attached to a corpuscle above the liver.7
Biofield Viewer with Biofield Recording Visualization Biofield Viewer (BV) is an advanced scanning technology that reveals light interference patterns on the skin’s surface. The participant is exposed to a standardized, full-spectrum lighting environment and should be de-robed with all jewelry removed to maximize skin exposure and minimize image artifacts.22A white, matte wall provides a monochromatic background against which the BV colors are most clearly highlighted. A digital camera is used to detect the interference of biophotons emanating from the

8
subject with the light produced from the standardized lighting system. The BV software measures the absorption and reflection of light on the skin’s surface and surroundings then displays a composite image of the accentuated interference gradations on the screen.23A second set of biofield images are placed through a filtering software called Chakra Viewer to see the overall light distribution on the body. Along the midline of the body, patterns appear on the body which corroborates with the anatomical feature of the ‘chakras’ as recorded in the Patanji Yoga Shastra and the Yoga Vashistha. The red, blue and green color distribution of the images correlate to light intensity. Changes in these parameters were compared before and after kundalini events over three days with the control participant sitting quietly with eyes open. The Biofield Recording Visualization (BRV) system with its ultra-low input referred noise scheme at 0.5µVRMS across the biofield spectral bandwidth can detect, measure and display in real-time the state of the bioelectric signals of the subject’s biofield by analyzing the frequency, phase and amplitude components at each chakra point. This data can be used to detect disruptions or anomalies in biofield patterns, which may be useful for further clinical study. The BRV system or an external visualization system can characterize the state of bioelectric signals in the subject’s biofield through multidimensional analysis at each chakra location with 3D surface plots, coherent plots and spectrograms. Additionally all chakra points’ signals can be displayed together on a single composite plot to view the activity of the seven chakra system. The BRV system is a modern version of the sensitive polygraph instruments used to measure subtle changes in EMG activity of the chakras as previously studied in Kaivaliadam Yoga Institute in Lonavala, India. Electrodes were placed on either side of the chakras to produce 14 points for EMG measurements to give more in-depth knowledge of full chakra functioning. This recording was made away from power lines and other high electrical interference machines. Gas Discharge Visualization Gas Discharge Visualization (GDV), also known as Electro-Photon Imaging, is an advanced form of Kirlian photography developed by Dr. Konstantin Korotkov. An electric impulse stimulates a biological subject and generates a response of the subject in the form of photon & electron emission. The glow of the photon radiation owing to the gas discharge generated in electromagnetic field is transformed by optical and charge couple device systems into a computer file.9,24 Participants will be required to put each finger tip on a quartz plate and an image displaying the photons emissions is then analyzed according to the Korean Su Jok meridian system, which is possibly related to the bonghan system previously described.9,24-27Figure 2 shows an image of a finger print and the corresponding aura as produced by the EPI software. The photonic emissions of the ten finger tips are analyzed by the software as shown in Figure 3. For this study, the symmetry and area of the corona discharge were analyzed for balance and vibrancy.

9
Figure 2: Example of EPI: (A) photonic emissions captured from a finger tip (B) photonic emission interpretation by EPI software (C) aura analysis based on photonic discharge and the Korean Su Jok meridian system. Figure 3: Software analysis of photonic emissions with respect to the Su Jok meridian system
. ES Complex Bioelectric impedance measurements (BIM) represents a wide range of old and new non-invasive technologies and methods where a very small electric current is applied to the body via one or more surface electrode and the resultant current passing through
1R1L
2R2L
3R3L
4R4L
5R5L
Head Zone Head Zone
Eye EyeNose, Ear
Jaw Jaw
Eye
Jaw
Eye
JawThroat, Tonsils, TharoidThroat, Tonsils, Tharoid
Transverse Transverse
Ascending
AppendixCeccum
CoccyxSacralSacral
Lumbar SpineDorsal Spine
Cervical SpineDescending
Sigmoid
Rectum
Head Zone Head Zone
Thorax Zone
LymphAbdominal Zone
Kidney LiverHeart
BloodCirculation
BloodCirculation
Heart
Pineal Gland Pineal Gland
EndocrineSystem
SpleenSpleen
Uro-Genital System Uro-Genital System
Coronary Vessels Coronary Vessels
Ileum DuodenumHeart
KidneyJejunum
Respiratory System
Small intestineHeart
Kidney
Respiratory System
Kidney Liver
A B C

10
the body is detected at other surface electrodes placed elsewhere on the body. A drop in voltage occurs as the current encounters impedance or resistance inherent in the fluids and tissues it passes through as it courses through the various physiological “compartments” of the body. These compartments include the bloodstream, the intracellular space, the lymphatic system, the interstitial space, and others. This drop in voltage provides indirect information about the physical and chemical properties of the compartment(s) that the current passes through. ES Complex is a programmable electro medical system, which is scientifically proven and clinically validated as an efficient and non-invasive medical device that measures physiological parameters and produces detail reports with 89 % repeatable accuracy. It measures conductivity of interstitial fluid between the cells. The bio impedance technology is very similar to ECG and EEG, but instead of supplying information for brain or heart only, ES Complex measures electro-physiological properties of 22 different volumes within the body and produces data for 69 different physiological parameters. Successive measurements are made with weak current low frequency (700 Hz) between six tactile electrodes placed symmetrically on the forehead, hands, and feet of the subject. Each electrode is alternatively cathode and anode (bipolar mode from anode to cathode), which permits the recording of the resistance (Law of Ohm) of 22 segments of the human body.9The weak current with low frequency (700 Hz) specifically passes through the interstitial fluid compartment. The interstitial fluid (or tissue fluid) compartment represents approximately 16% of the body’s total water. Interstitial fluid is extracellular water and solutes surrounding cells, but is located outside the bloodstream and lymphatic system. Interstitial fluid forms the microscopic interface between cells and capillaries and presents a specific biochemical composition and a low protein concentration. In one second, each of the body’s 22 segments are measured 32 times with a Start Point Average (SPA) and an End Point Average (EPA). Therefore, the total data is 704 pulses per measurement. The measured resistances are transmitted with a numeric form for each segment, to an informative program. The EPA resistance values are converted to conductivity (C = 1/R), incorporated in a graph of the conductivity of the 22 segments called an Electro Scan Gram (ESG), shown in Figure 4. The ESG was converted to the second derivative ESG (SDESG) graph displayed in Figure 5.The mathematical calculation of the standard deviation of the conductivities (SDC) is related to the tissue fluid Na+ concentration, according to the Electrode Polarization Impedance (EPI) technique.

11
Figure 4: The abscissa is corresponding to the conductivity in numeric form in scale 0-100 (KOhms, µA and µSiemens) The ordinate is corresponding to the 22 measured segments of the human body.
Figure 5: SDESG graph showing the average value of the 22 segments of the ESG graph at point 0 on a scale of -100/+100 (KOhm, µA, and µSiemens) The difference between EPA and SPA is the electrical dispersion of the current into the tissue. It corresponds to the morphology of the interstitial fluid and increases in cases of swelling from the cells or from the blood vessel. Therefore:
EPA –SPA = Interstitial Fluid Volume (IFV) Elevated IFV is found in cases of ischemia/hypoxia, acute inflammation and tissue destruction. Low IFV occurs in cases of cells growth or relative tissue density increased (swelling). An SpO2 monitor is placed on the fingertip to detect changes in heart rate, oxygen levels, as well as, cardiac output. The ES Complex produces a complex Lifestyle Score which was compared throughout the experiment between the participants. This score encompasses various aspects of the health including oxidative stress, pH, nitric oxide, activity level, metabolic activity,

12
heart rate variability, as well as cortisol levels. In this experiment, neurological activity was also evaluated between participants including:
- Cerebral neurotransmitters and thyroid response - Cerebral serotonin response - Cerebral dopamine and noradrenaline response - Cerebral GABA responses - Thyroid response
Infrared Imaging
Kinetic theory states that molecules are in constant motion, the velocity of which is directly proportional to the Kelvin temperature. The exact vibratory frequency of a molecule is determined by the strengths of the bonds involved and the mass of the component atoms. Transitory states between vibrational energies may be induced by absorption of infrared radiation. Figure 6 shows typical frequencies for particular molecular bonds. In instances of covalent bonds, the greater the change in charge distribution, the stronger the absorption in the infrared spectrum. Also, bonds to hydrogen have higher frequencies due to its lower molecular mass.
Figure 6: Molecular bonding frequencies within the infrared range across upper x-axis and corresponding bonding frequencies.
Exothermic reactions, such as those involved in inflammation, release energy in the form of heat, light, or sound. These reactions result in higher entropy (∆𝑆 > 0), negative heat flow (heat loss to environment), decrease in enthalpy (∆𝐻 < 0) and may occur spontaneously. Endothermic reactions, such as photosynthesis, require energy to exchange bonds. These reactions result in positive heat flow (into the reaction) and increase in enthalpy (∆𝐻 > 0). Chemical reaction rates are roughly doubled with a 10⁰K increase in temperature, which means they are quadrupled at a 20⁰K increase. Inflammatory proteins are involved in exothermic reactions and include interleukins, soluble vascular and intracellular adhesion molecules (sVCAM-1, sICAM-1), plasma soluble selectins (e-selectin), and C-reactive protein (CRP). When the body initiates an

13
inflammatory response, these proteins begin to react and produce heat as a byproduct. The body has a method of controlling this heat via preganglionic nerve fibers in conjunction with blood vessel dilation. These fibres innervate at the skin’s surface and hyperthermic patterns are observed using medical thermal imaging calibrated to the normal human range.
Thermal diagnostics was first used by Hippocrates who would use the rate at which mud dried on the skin to evaluate a person’s health. Infrared imaging was declassified by the United States military in the 1960s and was soon used in medical research. Temperature measurements of the skin’s surface has been used in kundalini research for decades. Infrared imaging will allow for thermal energy to be monitored as the kundalini is rising to determine if a significant change has occurred. Other information regarding inflammation within the body will also be examined to see where participants may be experiencing pain or irritation. These areas were monitored to determine if a reduction of inflammation occurs. Skin temperature measurements in the areas associated with the chakras will be taken and compared between research participants throughout the study. Infrared video was also taken during a kundalini experience to monitor changes in thermal energy throughout the body.
SPECIFIC AIM
The aim of this study was to utilize the subtle energy technologies available at the Centre for Biofield Sciences to measure and visually capture the changes which occur when kundalini rises in a trained professional put forward by the Kundalini Research Project as compared to a control participant.
METHODOLOGY
A research participant referred to the Centre for Biofield Sciences by the Kundalini Research Project was tested using subtle energy technologies to monitor a raising of kundalini and was compared to a non-meditator. The Royal Ethics Committee (Pune, India) approved the protocol submitted by the Centre for Biofield Siences after review to allow the initiation of the study. A member of the research team had verbally explained the study and given participants the Informed Consent Form (ICF), shown in the APPENDIX, prior to the initiation of the screening. Each individual was given an identification code to allow for protection of confidential information collected throughout the study. To be included in the study, participants must have been 18 years of age or older and under the age of 80, not be pregnant or nursing, and must have signed the ICF. The Centre for Biofield Sciences used Clean Sweep®, a product developed and studied by Professor Joie Jones at the University of California at Irvine which helps reduce the potential effects of electromagnetic interference from computers, wireless internet, electrical wiring, etc. This procedure is necessary when studying subtle energy of the human body due to the sensitivity of the assessment process.

14
Day One: 1. Baseline data was collected from four technologies:
§ Biofield Viewer § Gas Discharge Visualization § ES Complex § Infrared Imaging
2. The experimental participant was asked to raise his kundalini and video recordings of the Biofield Viewer and infrared imaging were captured during a kundalini rising. The non-meditator sat in front of the same technologies with eyes open for the length of time to collect the control data.
3. After the kundalini rising was finished and the experimental participant felt able, he and the non-meditator were again screened with the same four technologies used to collect baseline data.
Day Two:
1. Baseline data was collected from four technologies: § Biofield Viewer § Gas Discharge Visualization § ES Complex § Infrared Imaging
2. As the Biofield Recording Visualization requires an absence of electric fields, both participants were re-located to an area behind CBS which was free from power lines and interference.
3. Chakra measurements of the experimental participant were collected while he attempted to raise his kundalini. The non-meditator sat with eyes open and chakra data was collected.
4. After the kundalini rising was finished and the experimental participant felt able, he and the non-meditator were again screened with the same four technologies used to collect baseline data.
Day Three: 1. Baseline data was collected from four technologies:
§ Biofield Viewer § Gas Discharge Visualization § ES Complex § Infrared Imaging
2. The experimental participant was asked to raise his kundalini and video recordings of the Biofield Viewer and infrared imaging were captured during a kundalini rising. The non-meditator sat in front of the same technologies with eyes open for the length of time to collect the control data.
3. After the kundalini rising was finished and the experimental participant felt able, he and the non-meditator were again screened with the same four technologies used to collect baseline data.
RESULTS The results of the scans were not shared with participants until the end of the study and were analyzed by an independent statistician for significance.

15
Biofield Viewer with Biofield Recording Visualization Photoshop was utilized to analyze the red and green color distribution of each image to measure the amount of red/low energy versus green/balanced energy within a person’s field. Each color in the Biofield Viewer images indicates a different intensity of light. Changes in light intensity in the environment with and without the participant were noted, as well as, changes from raising kundalini. Video was also recorded using Biofield Viewer during the kundalini raising events to observe any changes which may have occurred in light interference within the research environment. With significance levels set for p-values < 0.05, the results showed no significant changes in color distribution for the kundalini participant nor the non-meditator during the three-day experiment. Signal measurements with the Biofield Recording Visualization were sent to the manufacturer for independent analysis. He reported a defect in the sensors possibly due to exposure of extreme heat; therefore, this data was dismissed. Gas Discharge Visualization The area and symmetry of bio-photonic emissions from the fingertip were analyzed for significance. A 5% shift in these parameters with a filter or 10% shift, without a filter are considered significant. Area and symmetry were compared between the experimental participant and the non-meditator to determine if kundalini rising increases, decreases or has no effect on the corona discharge around the fingertips and acupuncture points. The GDV readings are displayed in Table 2. Table 2: GDV area and symmetry measurements for both experimental and control participants.
Experimental Participant Control Participant Day 1
Before After Before After Without
Filter Filter Without
Filter Filter Without
Filter Filter Without
Filter Filter
Area 12617 11735 10212 11174 Area 11625 10220 10670 8826 Symmetry 91.30 95.90 93.50 95.40 Symmetry 98.10 97.30 96.70 95.70
Day 2 Before After Before After
Without Filter
Filter Without Filter
Filter Without Filter
Filter Without Filter
Filter
Area 8799 12591 9965 13152 Area 10591 8887 10302 9822 Symmetry 91.60 96.30 92.90 96.40 Symmetry 97.60 93.40 98.00 94.20
Day 3 Before After Before After
Without Filter
Filter Without Filter
Filter Without Filter
Filter Without Filter
Filter
Area 11851 12531 11670 12264 Area 9166 8712 10500 9094 Symmetry 94.20 95.90 95.10 94.70 Symmetry 97.00 98.00 96.30 93.60 *Note: Without Filter (WF) is emotional parameter. Filter (F) is physical parameter Experimental Day 1: Mixed Change Decrease in area in both parameters (WF & F)

16
Increase in symmetry in both parameters (WF & F) Day 2: Positive Change Increase in area in both parameters (WF & F)
Increase in symmetry in both parameters (WF & F) Day 3: Mixed Change Decrease in area in both parameters (WF & F) Decrease in symmetry F parameter
Increase in symmetry in WF parameter Control Day 1: Negative Change Decrease in area in both parameters (WF & F) Decrease in symmetry in both parameters (WF & F) Day 2: Mixed Change Decrease in area in WF parameter Increase in area in F parameter Increase in symmetry in both parameters (WF & F) Day 3: Mixed Change Increase in area in both parameters (WF & F) Decrease in symmetry in both parameters (WF & F) ES Complex The ES Complex produces a complex Lifestyle Score which was compared throughout the experiment between the participants. This score encompasses various aspects of the health including oxidative stress, pH, nitric oxide, activity level, metabolic activity, heart rate variability, as well as cortisol levels. In this experiment, neurological activity will also be evaluated between participants including:
- Cerebral neurotransmitters and thyroid response - Cerebral serotonin response - Cerebral dopamine and noradrenaline response - Cerebral GABA responses - Thyroid response
These values were compared between participants throughout the study to determine if physiological improvements were measured as a result of raising kundalini. Experimental Participant
Acid Base Balance Score Day 1: Before
Day 1: After
Day 2: Before

17
Day 2: After
Day 3: Before
Day 3: After
Estimated Cortisol Day 1: Before
Day 1: After
Day 2: Before
Day 2: After
Day 3: Before
Day 3: After
Lifestyle Score Day 1: Before Day 1: After
Oxidative Stress Class: 5 pH Class: 4
Oxidative Stress Class: 5 pH Class: 3

18
Neurological Activity Day 1: Before
Day 1: After
Day 2: Before
NO Class: 5 Level Activity: 3
Metabolic Rate Class: 4 Heart Rate Variability: 2
FM Class: 3 Lifestyle Score: 22
NO Class: 5 Level Activity: 3
Metabolic Rate Class: 4 Heart Rate Variability: 2
FM Class: 3 Lifestyle Score: 21
Day 2: Before Day 2: After Oxidative Stress Class: 5
pH Class: 3 NO Class: 4
Level Activity: 3 Metabolic Rate Class: 4 Heart Rate Variability: 4
FM Class: 3 Lifestyle Score: 22
Oxidative Stress Class: 5 pH Class: 3 NO Class: 4
Level Activity: 3 Metabolic Rate Class: 4 Heart Rate Variability: 2
FM Class: 3 Lifestyle Score: 20
Day 3: Before Day 3: After Oxidative Stress Class: 5
pH Class: 3 NO Class: 4
Level Activity: 3 Metabolic Rate Class: 4 Heart Rate Variability: 4
FM Class: 3 Lifestyle Score: 22
Oxidative Stress Class: 5 pH Class: 4 NO Class: 5
Level Activity: 3 Metabolic Rate Class: 5 Heart Rate Variability: 2
FM Class: 3 Lifestyle Score: 23

19
Day 2: After
Day 3: Before
Day 3: After
Control Participant
Acid Base Balance Score Day 1: Before
Day 1: After
Day 2: Before

20
Day 2: After
Day 3: Before
Day 3: After
Estimated Cortisol Day 1: Before
Day 1: After
Day 2: Before
Day 2: After
Day 3: Before
Day 3: After
Lifestyle Score
Day 1: Before Day 1: After Oxidative Stress Class: 1
pH Class: 2 Oxidative Stress Class: 1
pH Class: 2

21
Neurological Activity
Day 1: Before
Day 1: After
Day 2: Before
NO Class: 2 Level Activity: 2
Metabolic Rate Class: 5 Heart Rate Variability: 1
FM Class: 5 Lifestyle Score: 16
NO Class: 2 Level Activity: 2
Metabolic Rate Class: 5 Heart Rate Variability: 1
FM Class: 5 Lifestyle Score: 16
Day 2: Before Day 2: After Oxidative Stress Class: 2
pH Class: 2 NO Class: 3
Level Activity: 2 Metabolic Rate Class: 5 Heart Rate Variability: 1
FM Class: 5 Lifestyle Score: 17
Oxidative Stress Class: 1 pH Class: 2 NO Class: 2
Level Activity: 2 Metabolic Rate Class: 5 Heart Rate Variability: 1
FM Class: 5 Lifestyle Score: 16
Day 3: Before Day 3: After Oxidative Stress Class: 2
pH Class: 2 NO Class: 3
Level Activity: 2 Metabolic Rate Class: 5 Heart Rate Variability: 3
FM Class: 5 Lifestyle Score: 19
Oxidative Stress Class: 1 pH Class: 2 NO Class: 3
Level Activity: 2 Metabolic Rate Class: 5 Heart Rate Variability: 3
FM Class: 5 Lifestyle Score: 18

22
Day 2: After
Day 3: Before
Day 3: After
Infrared Imaging Temperature changes on the surface of the body were monitored before, during, and after the raising of kundalini. The body was also examined to see where participants may be experiencing pain or irritation. These areas were monitored to determine if a reduction of inflammation occurs. Skin temperature measurements in the areas associated with the chakras were taken and compared between research participants throughout the study. Infrared video was also taken during a kundalini experience to observe changes in thermal energy throughout the body. For this study, the parameters for mean, minimum, and maximum temperatures for the areas mentioned above were measured and analyzed for comparison between thermal changes observed in the participant raising his kundalini compared to the non-meditator. With assumed level of significance of p-values < 0.5, the results are displayed in Table 3 below. Table 3: Significance of temperature changes for both experimental and control participants.
Minimum Mean Maximum

23
Day 1 Non-Significant Non-Significant Non-Significant Day 2 Non-Significant Non-Significant Non-Significant Day 3 Non-Significant Non-Significant Non-Significant
DISCUSSION Biofield Viewer: There was no significant difference in changes in light intensity according to the red and green color distribution in the Biofield Viewer images of the experimental and control participants throughout the three-day study. A reduction in red pixels would indicate less energetic congestion in the participants as a result of raising kundalini or sitting quietly, whereas an increase in green pixels would indicate more balanced energy throughout the body and environment. Significant changes in pixel count were not measured for either participant throughout the three-day study. Unfortunately the malfunctioned sensors do not allow for analysis with the Biofield Recording Visualization as the information could not be verified as accurate, possibly due to heat damage which will be avoided in all future studies. Gas Discharge Visualization: There were mixed results in both the experimental and control participants. The experimental participant had an improvement in both area and symmetry on Day Two but not large enough to be considered significant. The control participant had a reduction in area and symmetry on Day One but also not large enough to be considered significant. These minor fluctuations could be due to daily changes in diet, environment, and exercise and not necessarily due to kundalini events. Significant changes would occur with a 5% and 10% change in area and symmetry with and without filter, respectively. Neither participant had significant changes in area or symmetry throughout the study. ES Complex: Experimental After kundalini was raised for three days, normalcy in the acid base balance can be seen in the Day 3 After scan. No significant change in the cortisol level (stress indicator) was measured over the three days. The Lifestyle Score reduced after kundalini rising on Day 1 and Day 2; however, it improved on Day 3. The neurological response was as follows:
• Serotonin – Lower levels than normal were measured at baseline which indicates stress pattern. After the kundalini rises, the levels of serotonin response increased to higher levels than normal. These changes in the serotonin levels continued throughout Day 2 and Day 3 showing higher levels than normal.
• Dopamine - Higher levels than normal were measured at baseline which indicates hyperactivity and mood swings. After the kundalini rises, the levels of dopamine decreased to lower levels than normal. These changes in the dopamine levels were observed throughout Day 2 and Day 3 with lower than normal levels.
• GABA response – Higher levels than normal were measured at baseline and are within normal range after kundalini awakening. Lower than normal levels of GABA response

24
were measured throughout Day 2. On Day 3 the levels were within normal range then decrease to lower than normal levels after the kundalini rises.
• Thyroid response – Normal levels were measured throughout Day 1. On Day 2 and Day 3, normal levels were measured and after kundalini rises the thyroid response increases above normal range.
Control The pH values remained below normal throughout the experiment. On Day 2 and Day 3 the pH decreased after sitting quietly with eyes open which is farther from normal values. Higher than normal cortisol levels were measured on Day 1 and Day 2 with no change after sitting quietly with eyes open. Normal levels of cortisol were measured on Day 3 with no change after sitting quietly with eyes open. No change in Lifestyle Score was seen in Day 1. Lifestyle Scores were better than Day 1 but decreased after sitting quietly with eyes open on Day 2 and Day 3. Overall there was an improvement in Lifestyle Score over the length of the experiment. The neurological response was as follows:
• Serotonin – Higher than normal levels were measured throughout Day 1 and Day 2. Lower than normal levels were measured throughout Day 3.
• Dopamine - Lower than normal levels are measured throughout Day 1 and Day 2. Higher than normal levels were measured throughout Day 3.
• GABA response - Lower than normal levels were measured throughout Day 1 and Day 2. Much higher than normal levels were measured throughout Day 3.
• Thyroid response – Normal levels were measured throughout Day 1. On Day 2, much higher levels were initially measured then returned to normal after participant sat quietly with eyes open. Normal levels were measured throughout Day 3.
Infrared Imaging: According to scientific literature a one-degree shift in temperature is considered significant; therefore, increases in temperature, which are this extreme or greater indicate a meaningful change in the human biofield. The minimum, mean, and maximum temperatures in the areas of the body associated with the chakras were analyzed before and after raising kundalini of the experimental participant and no significant difference in temperature was measured. No significant change was also reported for the control participant throughout the study. A longer length study may be required for physiological changes to be detected by infrared camera. More subtle thermal sensors may be necessary to study the changes in temperature during a kundalini event and would be recommended for future research.
CONCLUSION
The Biofield Viewer, Gas Discharge Visualization and infrared imaging did not show significant results when comparing before and after raising kundalini with the use of a control participant. Normalcy was attained for acid base balance by the end of the study in the experimental participant. The readings taken for the control participant showed improvement in the Lifestyle Score with a normal cortisol level by the end of the experiment. Neurological activity varied throughout the study in both participants,

25
however, they were not consistent throughout the three days. Additional experimental and control participants would need to be performed before these neurological changes could be attributed to raising kundalini. Further studies using the Biofield Recording Visualization device is recommended as unfortunately the data was not valid for this study but it would be a valuable research tool for further studies. Additional study of kundalini with modern subtle energy devices will provide greater insights into the capabilities of the human body and the movement of energy during heightened meditation experiences. Since kundalini operates on an energetic level along the chakras and nadis/meridians, more time may be necessary for the energetic shift to appear as a physical or physiological change. Long-term studies of persons who are untrained in kundalini techniques may be interesting to study as they may produce profound changes over a period of time learning how to move energy throughout their body. Trained experts who are already operating at a high energy level do not have as far to shift into a more optimum state. For these reasons, further follow up will be useful to see the effects of long-term meditation and kundalini. In addition, research with a greater number of subjects who can raise their kundalini should be studied to deepen the world’s understanding of the ancient Vedas and the power of the mind.
APPENDIX
Participant Informed Consent Form
INFORMED CONSENT FORM AND WAIVER Study Name: Kundalini Research Project Co-Sponsors: Centre for Biofield Sciences/Kundalini Research Project
Thornton Streeter, D.Sc. /Swami Mounamurti [email protected]/[email protected]
Principal Investigator: Kimberly Schipke, M.S. Address: Centre for Biofield Sciences
World Peace Centre MIT College Puad Road, Kothrud, PUNE 411-038 INDIA
Phone: +91 (0) 20 2545 8748 Email: [email protected] Website: www.biofieldsciences.com I AM BEING ASKED TO READ THE FOLLOWING MATERIAL TO ENSURE THAT I AM INFORMED OF THE NATURE OF THIS PROJECT AND OF HOW I WILL PARTICIPATE, IF I CONSENT TO DO SO. SIGNING THIS FORM WILL INDICATE THAT I HAVE BEEN SO INFORMED AND THAT I GIVE MY CONSENT.
26
IT IS THE INTENT OF THIS CONSENT, PRIOR TO MY PARTICIPATION IN THIS PROJECT THAT I CAN KNOW THE NATURE AND RISKS OF MY PARTICIPATION AND CAN DECIDE TO PARTICIPATE OR NOT IN A FREE AND INFORMED MANNER. THE CENTRE FOR BIOFIELD SCIENCES AS WELL MAY ALSO TERMINATE MY PARTICIPATION AT ANY TIME.
1. WHAT IS THE PURPOSE OF THE STUDY?
This is a research study to monitor the subtle energetic effects of raising kundalini. This study is sponsored by the Centre for Biofield Sciences and the Kundalini Research Project partnership. The purpose of this study is to investigate the effects of raising kundalini and the results seen by testing individuals using different subtle energy devices.
SELECTION CRITERIA You are being asked to voluntarily participate in this two (2) person study because you are in good health, between the ages of 18 and 70, and have been put forward by the Kundalini Research Project as someone who can raise their kundalini at will or consider yourself a non-meditator. 2. DESCRIPTION OF STUDY PROCEDURES If you agree to participate, you will be asked to consent to the following:
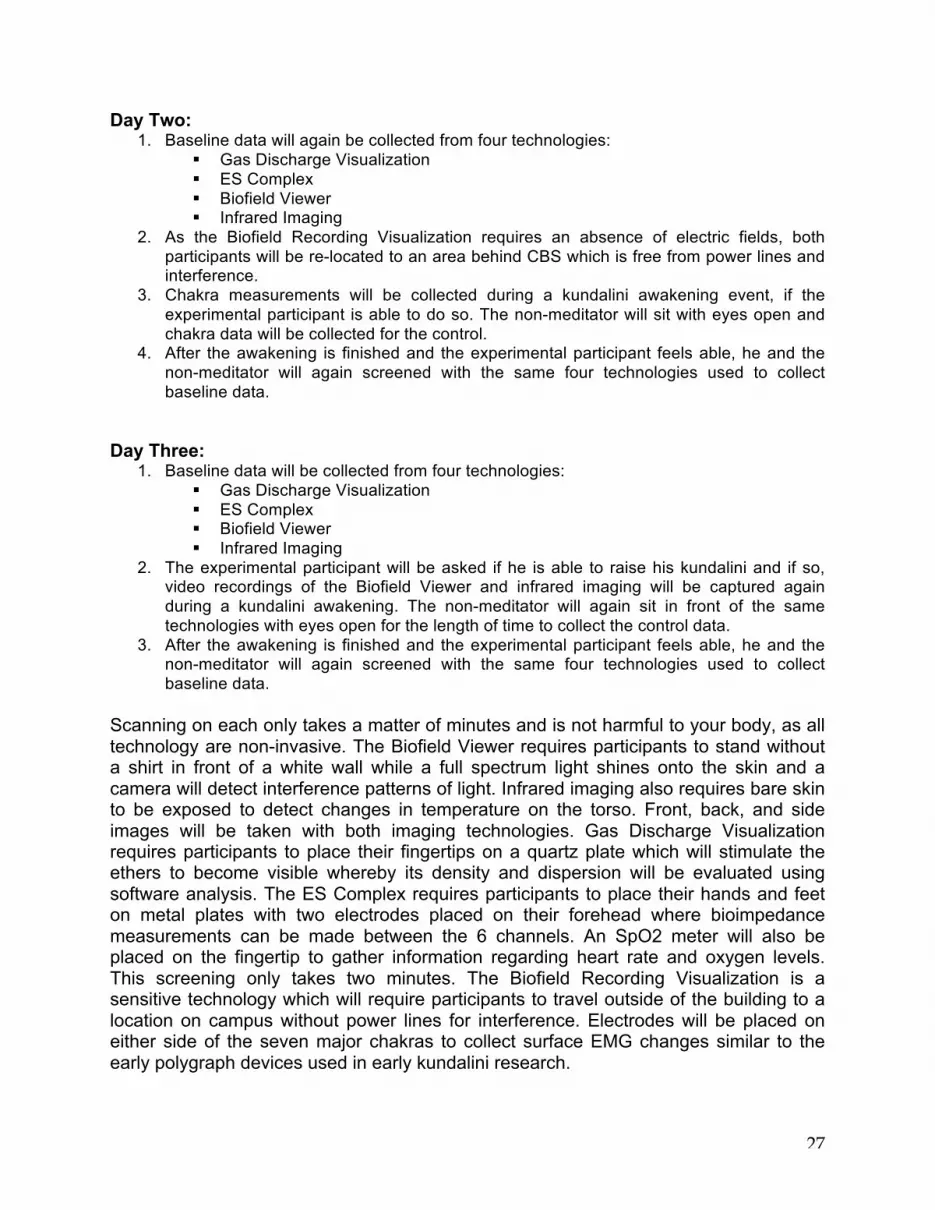
After enrolling in the study and signing this informed consent, you will be asked to return to CBS for three days of data collection. Each day will consist of being scanned by different instruments before, during, and after a kundalini rising event as outlined below:
Day One: 1. Baseline data will be collected from four technologies:
§ Gas Discharge Visualization § ES Complex § Biofield Viewer § Infrared Imaging
2. A yajna ceremony will be performed by the experimental participant, whereas the non-meditator will not participate. During the ceremony, video recordings of the Biofield Viewer and infrared imaging will be captured so energetic changes can be monitored live. The non-meditator will simply sit in front of the same technologies with eyes open for the same length of time to collect the control data.
3. The experimental participant will be asked if he is able to raise his kundalini and if so, video recordings of the Biofield Viewer and infrared imaging will be captured during a kundalini awakening. The non-meditator will again sit in front of the same technologies with eyes open for the length of time to collect the control data.
4. After the awakening is finished and the experimental participant feels able, he and the non-meditator will again screened with the same four technologies used to collect baseline data.
27
Day Two: 1. Baseline data will again be collected from four technologies:
§ Gas Discharge Visualization § ES Complex § Biofield Viewer § Infrared Imaging
2. As the Biofield Recording Visualization requires an absence of electric fields, both participants will be re-located to an area behind CBS which is free from power lines and interference.
3. Chakra measurements will be collected during a kundalini awakening event, if the experimental participant is able to do so. The non-meditator will sit with eyes open and chakra data will be collected for the control.
4. After the awakening is finished and the experimental participant feels able, he and the non-meditator will again screened with the same four technologies used to collect baseline data.
Day Three: 1. Baseline data will be collected from four technologies:
§ Gas Discharge Visualization § ES Complex § Biofield Viewer § Infrared Imaging
2. The experimental participant will be asked if he is able to raise his kundalini and if so, video recordings of the Biofield Viewer and infrared imaging will be captured again during a kundalini awakening. The non-meditator will again sit in front of the same technologies with eyes open for the length of time to collect the control data.
3. After the awakening is finished and the experimental participant feels able, he and the non-meditator will again screened with the same four technologies used to collect baseline data.
Scanning on each only takes a matter of minutes and is not harmful to your body, as all technology are non-invasive. The Biofield Viewer requires participants to stand without a shirt in front of a white wall while a full spectrum light shines onto the skin and a camera will detect interference patterns of light. Infrared imaging also requires bare skin to be exposed to detect changes in temperature on the torso. Front, back, and side images will be taken with both imaging technologies. Gas Discharge Visualization requires participants to place their fingertips on a quartz plate which will stimulate the ethers to become visible whereby its density and dispersion will be evaluated using software analysis. The ES Complex requires participants to place their hands and feet on metal plates with two electrodes placed on their forehead where bioimpedance measurements can be made between the 6 channels. An SpO2 meter will also be placed on the fingertip to gather information regarding heart rate and oxygen levels. This screening only takes two minutes. The Biofield Recording Visualization is a sensitive technology which will require participants to travel outside of the building to a location on campus without power lines for interference. Electrodes will be placed on either side of the seven major chakras to collect surface EMG changes similar to the early polygraph devices used in early kundalini research.

28
4. WHAT ARE THE RISKS OF PARTICIPATING? The potential health risks from participation in this study will be very minimal and are usually limited to allergic skin rashes caused by the FDA approved medical adhesive, which is made by the 3M Company. If the adhesive used in the electrodes used for ES-Complex or the Biofield Recording Visualization does cause significant irritation to your skin at the location of application, the patch should be removed and the skin area washed with soap and water and you the study doctor will discontinue your participation in the study. If at any time, you experience any further irritation or symptoms you feel may be due to your participation in this study; please inform a member of the research staff immediately. At any time during this study you can refuse to continue participating for any reason without any negative consequences. Please let research staff know as soon as possible if you would like to end your participation. Also remember that if you have any questions, to ask the researchers. You have a right to have all of your questions answered.
5. WHAT ARE MY BENEFITS FOR PARTICIPATING? There is no medical benefit to you. Your participation in this study may help people in the future who could benefit from the insights of raising kundalini. You may or may not experience positive results by the end of the study. You will not be paid for your participation in this study.
6. WITHDRAWING FROM THE STUDY You are free to withdraw from this study at any time for any reason. We only ask that you tell the research staff. If you refuse to participate in this study, you will not be penalized or lose any benefits to which you would normally be entitled.
The research staff may decide to remove you or end the study for any reason.
7. HOW WILL MY CONFIDENTIALITY BE MAINTAINED? Records from this study, which identify you, will be kept confidential. Only select authorized personnel may view documents that identify you directly. This may include KRP research committee or Centre for Biofield Sciences site personnel. Regulatory authorities, such as the FDA may inspect confidential data that identifies you by name. All your records will be kept in a locked area that can only be accessed by authorized staff. Your demographic information will be kept in a locked file under the possession of the primary researcher and in all other documents you will be identified only by an ID number. Video captured throughout the experiment may be used in various media outlets including internet, film, television, as well as others. Your face will be visible, however, your name, address, phone number and e-mail address will not be shared with external third parties

29
6. PERSONS TO CONTACT If at any time you have questions about this project, or any concerns, you should contact either of the two researchers listed on the front page of this Informed Consent. They can be reached by e-mail or by phone. 7. VOLUNTARY CONSENT I AGREE THAT BEFORE GIVING CONSENT BY SIGNING THIS FORM THAT THE METHODS, INCONVIENCES, RISKS AND BENEFITS HAVE BEEN EXPLAINED TO ME AND MY QUESTIONS HAVE BEEN ANSWERED. I CONFIRM THAT TO THE BEST OF MY KNOWLEDGE, ALL THE INFORMATION I HAVE GIVEN THE STUDY DOCTOR IS ACCURATE. IT IS MY RESPONSIBILITY TO TELL THE STUDY DOCTOR ABOUT ANY CHANGES IN MY PHYSICAL OR MENTAL HEALTH DURING THE STUDY. I UNDERSTAND THAT I MAY ASK QUESTIONS AT ANY TIME AND I AM FREE TO WITHDRAW FROM THE STUDY AT ANY TIME WITHOUT CAUSING BAD FEELINGS OR AFFECTING MY RELATIONSHIP WITH THE INVESTIGATOR. I AGREE TO PARTICPATE IN THIS RESEARCH STUDY. YOU WILL RECEIVE A SIGNED COPY OF THIS FORM FOR YOUR RECORDS. SIGNATURES: ________________________________________________________________ Subject’s Signature Date ________________________________________________________________ Subject’s Printed Name ________________________________________________________________ Witness Signature Date ________________________________________________________________ Witness Printed Name As a representative of this study, I have explained the purpose, the procedures, the possible benefits and risks that are involved in this research study. Any questions that have been raised have been answered to the individual's satisfaction. Signature of Person Obtaining Consent Date Signature of Principal Investigator Date

30
REFERENCES
1. Streeter TWJ. One Year Diploma Course - Anatomy and Physiology of the Human Biofield. The Centre for Biofield Sciences; 2005.
2. Kim B. On the Kyungrak system. J Acad Med Sci DPR Korea 1963;1-41.
3. Lee BC, Yoo JS, Baik KY, Kim KW, Soh KS. Novel threadlike structures (Bonghan ducts) inside lymphatic vessels of rabbits visualized with a Janus Green B staining method. Anat.Rec.B New Anat. 2005 Sep;286(1):1-7.
4. Lee BC, Soh KS. Contrast-enhancing optical method to observe a Bonghan duct floating inside a lymph vessel of a rabbit.Lymphology 2008 Dec;41(4):178-85.
5. Lee BC, Jhang SU, Choi JH, Lee SY, Ryu PD, Soh KS. DiI staining of fine branches of Bonghan ducts on surface of rat abdominal organs. J.Acupunct.Meridian.Stud. 2009 Dec;2(4):301-5.
6. Ogay V, Bae KH, Kim KW, Soh KS. Comparison of the characteristic features of Bonghan ducts, blood and lymphatic capillaries.J.Acupunct.Meridian.Stud. 2009 Jun;2(2):107-17.
7. Shin HS, Johng HM, Lee BC, Cho SI, Soh KS, Baik KY, Yoo JS, Soh KS. Feulgen reaction study of novel threadlike structures (Bonghan ducts) on the surfaces of mammalian organs.Anat.Rec.B New Anat. 2005 May;284(1):35-40.
8. Lee BC, Bae KH, Jhon GJ, Soh KS. Bonghan system as mesenchymal stem cell niches and pathways of macrophages in adipose tissues.J.Acupunct.Meridian.Stud. 2009 Mar;2(1):79-82.
9. Konstantin Korotkov. Measuring Energy Fields: State of the Art. Backbone Publishing Co.; 2004. 270 p.
10. Ragnar P, Schmidt D, Haltiwanger S. The LifeWave Experience to a New You!: The Official Handbook. Asheville, NC: Roaring Lion Publishing Corp.; 2007.
11. Austin T, Nazeran H. IceWave Patches Reduce Quantitative and Qualitative Measures of Pain. 2009. Available from: With permission from LifeWave.
12. Blake-Greenberg S, Nazeran H. Glutathione Patches Improve Cellular Physiologic Functional Status in Different Organs. 2008 Nov. Available from: With permission from LifeWave.
13. Blake-Greenberg S, Nazeran H. Application of Carnosine Patch Improves Cellular Physiological Status in Different Organs. 2009 Jan. Available from: With permission from LifeWave.

31
14. Clark D. Performance Testing: Infrared Imaging. 2010. Available from: With permission from LifeWave.
15. Haltiwanger S. A New Way to Increase Glutatione Levels in the Body. 2005. Available from: With permission from LifeWave.
16. Miller T, Erianne J. Clinical Evaluation of an Anti-acne Test System of Glutathione Patches and LifeWave Homeopathic Spray. 2009 Nov. Available from: With permission of LifeWave.
17. Miller T, Hollenback A. A Double-Blind, Placebo Controlled Clinical Efficacy Evaluation of a Patch to Soothe Knee Pain. 2010. Available from: With permission from LifeWave.
18. Nilkanth B. LifeWave Research Study. 2009 Dec. Available from: With permission from LifeWave.
19. Nilkanth B. LifeWave Research Study. 2009 May. Available from: With permission from LifeWave.
20. Samaniego I. Double Blind Randomized Controlled Trial Comparing Icewave Pain Patches vs. Placebo Patches as an Analgesic in Adult Filipinos Diagnosed to Have Active Osteoarthritis of the Major Joints. 2010. Available from: With permission of LifeWave.
21. Tully L, Lange A, Shade C. Report for Human Clinical Pilot Study. 2009 Dec. Available from: With permission from LifeWave.
22. Solomon J, Solomon G. Harry Oldfield's Invisible Universe. Revised ed. Waltham Abbey: Campion Books; 2003.
23. Zafar S, Streeter TWJ. Effects of aroma oils on the Human Energy Field as shown by PIP Energy Field Imaging. In: Khan IA, Khanum A, editors. Role of Biotechnology in Medicinal and Aromatic Plants.Ukaaz Publications; 2004. p. 226.
24. Konstantin Korotkov. Human Energy Field: Study with GDV Bioelectrography. 2002. 360 p.
25. Korotkov K, Williams B, Wisneski LA. Assessing biophysical energy transfer mechanisms in living systems: the basis of life processes. J.Altern.Complement Med. 2004 Feb;10(1):49-57.
26. Korotkov KG, Popechitelev EP. [Method for gas-discharge visualization and automation of the system of realizing it in clinical practice].Med.Tekh. 2002 Jan;(1):21-5.

32
27. Korotkov KG, Matravers P, Orlov DV, Williams BO. Application of electrophoton capture (EPC) analysis based on gas discharge visualization (GDV) technique in medicine: a systematic review. J.Altern.Complement Med. 2010 Jan;16(1):13-25.
28. Chafekar, AS, Vidnyanachya Drushtikonatun (Kundalini Shakti). 1st Ed. Usha-Anil Prakashan. Pune, India. Apr 2011.