Embed Size (px)
Citation preview
3 4
Biochimica et Biophysica Acta, 466 (1977 ) 34--43 © Elsevier /North-Hol land Biomedical Press
BBA 77672
STUDIES ON SPIN-LABELLED EGG LECITHIN DISPERSIONS
L A R R Y M. G O R D O N * and R I C H A R D D. S A U E R H E B E R *
Department o f Chemistry, San Diego State University, San Diego, Calif. 92182 and the California Metabolic Research Foundation, La Jolla, Calif. 9203 7 (U.S.A.)
(Received August 16th, 1976)
Summary
ESR spectra of egg lecithin dispersions labelled with 5-nitroxide stearic acid are recorded with a 50 G field sweep, and also with a new technique which "expands" the spectrum by (1) recording pairs of adjoining peaks with a smaller field sweep and (2) superposing the common peaks. The expansion technique improves the precision of the order parameters determined from the hyperfine splitting measurements, and may prove useful in future spin label membrane studies.
Approximate order parameters are derived to describe the fluidity of fat ty acid spin-labelled membranes in those cases where either the inner or outer hyperfine extrema are not well defined. The ability of these expressions to measure the fluidity of labelled egg lecithin dispersions for the temperature range 14--42°C is examined.
Introduct ion
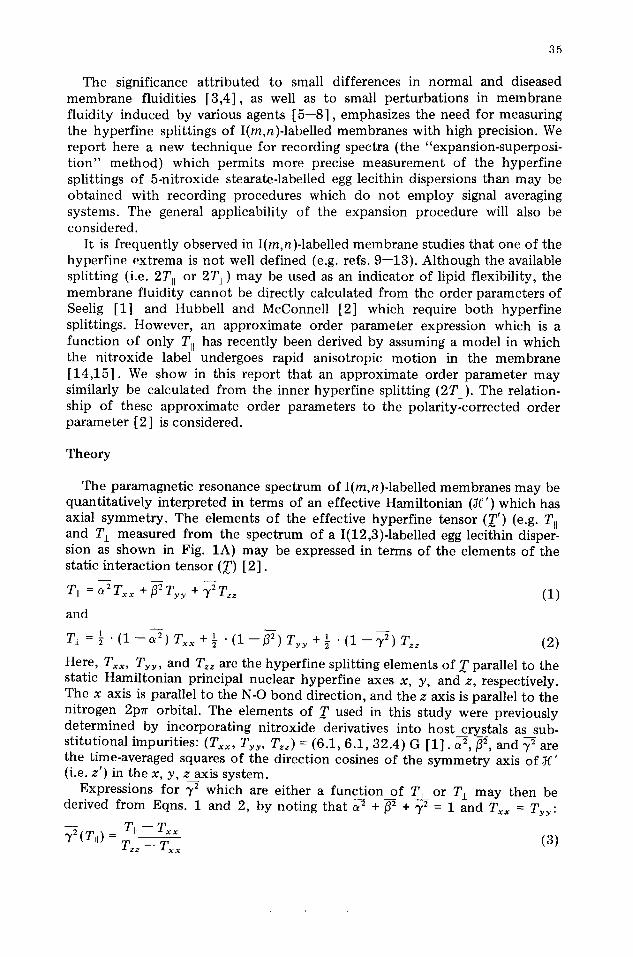
Extrinsic spin probes which share the following formula
o N - - O "
C H 3 - - ( C H 2 ) m - - C - - (CH2)n-- CO0 X I(m,n)
have proven to b e valuable in the study of numerous model and biological membranes. An order parameter which measures the flexibility of the lipid chains may be calculated from the outer and inner hyperfine splittings (i.e. 2T, and 2T~ ) of I(m,n)-labelled membrane spectra [1,2]. The measurement of the order parameter (S) of a labelled membrane system therefore permits a direct determination of the fluidity of the bilayer.
* P r e s e n t a d d r e s s : D i v i s i o n o f D i a b e t e s a n d E n d o c r i n o l o g y , S c r i p p s C l in i c a n d R e s e a r c h F o u n d a t i o n , 4 7 6 P r o s p e c t S t . , L a do l l a , Ca l i f . 9 2 0 3 7 . A d d r e s s c o r r e s p o n d e n c e to e i t h e r a u t h o r .
35
The significance attributed to small differences in normal and diseased membrane fluidities [3,4], as well as to small perturbations in membrane fluidity induced by various agents [5--8], emphasizes the need for measuring the hyperfine splittings of I(m,n)-labelled membranes with high precision. We report here a new technique for recording spectra (the "expansion-superposi- t ion" method) which permits more precise measurement of the hyperfine splittings of 5-nitroxide stearate-labelled egg lecithin dispersions than may be obtained with recording procedures which do not employ signal averaging systems. The general applicability of the expansion procedure will also be considered.
It is frequently observed in I(m,n)-labelled membrane studies that one of the hyperfine extrema is not well defined (e.g. refs. 9--13). Although the available splitting (i.e. 2Ttt or 2T~ ) may be used as an indicator of lipid flexibility, the membrane fluidity cannot be directly calculated from the order parameters of Seelig [1] and Hubbell and McConnell [2] which require both hyperfine splittings. However, an approximate order parameter expression which is a function of only TIt has recently been derived by assuming a model in which the nitroxide label undergoes rapid anisotropic motion in the membrane [14,15]. We show in this report that an approximate order parameter may similarly be calculated from the inner hyperfine splitting (2T~). The relation- ship of these approximate order parameters to the polarity-corrected order parameter [2] is considered.
Theory
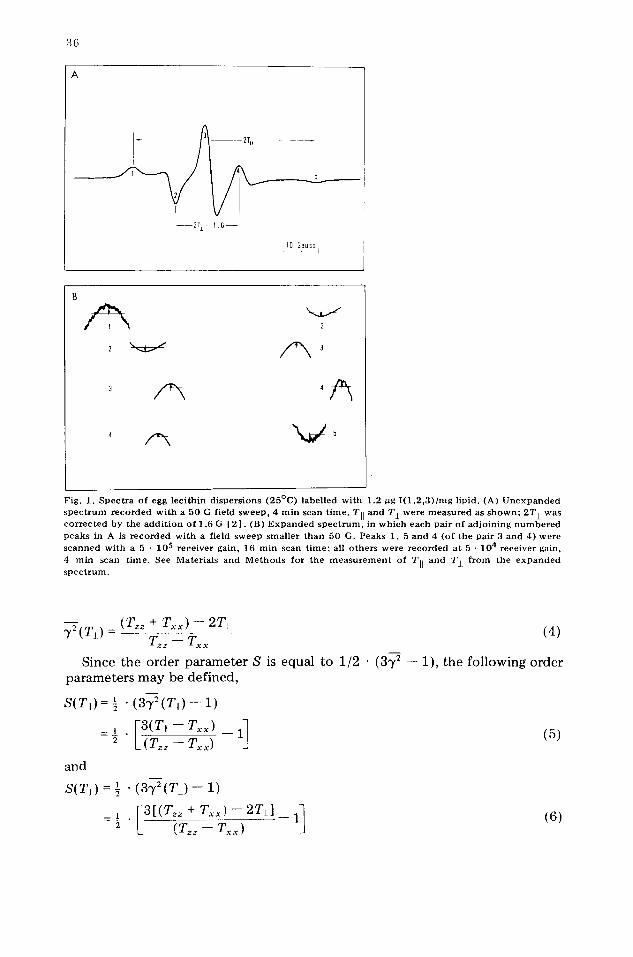
The paramagnetic resonance spectrum of I(m,n)-labelled membranes may be quantitatively interpreted in terms of an effective Hamiltonian (~ ' ) which has axial symmetry. The elements of the effective hyperfine tensor (T') (e.g. TII and T~ measured from the spectrum of a I(12,3)-labelled egg lecithin disper- sion as shown in Fig. 1A) may be expressed in terms of the elements of the static interaction tensor (T) [2].
Tit = ~2Txx + ~2Tyy + 7:Tzz
and
' " (1 --c~:) Txx + Tl : ~ ' " ( 1 - - ~ ) T y y
(1)
' " (1- -72)~ . (2) +~
Here, Txx, Tyy, and Tzz are the hyperfine splitting elements of T parallel to the static Hamiltonian principal nuclear hyperfine axes x, y, and z, respectively. The x axis is parallel to the N-O bond direction, and the z axis is parallel to the nitrogen 2p~ orbital. The elements of T used in this study were previously determined by incorporating nitroxide derivatives into host crystals as sub- stitutional impurities: (Txx, Tyy, Tzz) = (6.1, 6.1, 32.4) G [1]. a:, fl:, and 7 ~ are the time-averaged squares of the direction cosines of the symmetry axis of ~ ' (i.e. z') in the x, y, z axis system.
Expressions for 7: which are either a function of T,, or T l may then be derived from Eqns. 1 and 2, by noting that ~-~ + fi-~ + ~ = 1 and Txx = T y y :
7-~(Tit) _ TH -- T~x T~z -- Txx (3)
3 6
A
L 10 Gauss
k 4
2
Fig . 1. S p e c t r a of egg lec i th in d i spe r s ions ( 2 5 ° C ) label led w i t h 1.2 ~g I ( 1 , 2 , 3 ) / m g l ipid. (A) U n e x p a n d e d s p e c t r u m r e c o r d e d w i t h a 50 G field sweep , 4 m i n scan t ime . TI[ and T i were m e a s u r e d as s h o w n ; 2T± was c o r r e c t e d by the a d d i t i o n o f 1.6 G [ 2 ] . (B) E x p a n d e d s p e c t r u m , in w h i c h each pa i r o f a d j o i n i n g n u m b e r e d peaks in A is r e c o r d e d w i t h a f ield sweep sma l l e r t h a n 50 G. Peaks 1, 5 and 4 (o f the pa i r 3 and 4) were s cann ed wi th a 5 - 105 r ece ive r gain, 16 rain scan t i m e ; all o the r s were r e c o r d e d at 5 • 104 r ece ive r gain,
4 ra in scan t ime . See Mater ia ls and M e t h o d s for the m e a s u r e m e n t of TI[ and Tj. f r o m the e x p a n d e d s p e c t r u m .
72(T~) = (Tzz + T~x) 2 T l (4) Tzz--Txx
Since the o rder p a r a m e t e r S is equal to 1/2 • (372 - - 1), the fo l lowing o rder p a r a m e t e r s m a y be def ined ,
l S ( T , ) = ~ • (372(T1,)- - 1)
, . [3(TI,- Tx~) 17 --~ L(T. T~x)--
and 1 S(TI) = ~ • (37:(T,) -- I)
1 I 3 [ ( T ~ z + T ' ~ x ) - - 2 T i ] 1 =~ " (Tzz - - Txx) - - 1
(5)
(6)
37
It should be noted that S(Ttl ) has previously been derived for nitroxide labels undergoing rapid anisotropic mot ion in the membrane [ 14,15].
Eqns. 1 and 2, and the expressions for S(T , ) and S(TI) , may be used to evaluate the average mot ion of the spin label in the membrane if: (1) the probe undergoes rapid rotational and segmented mot ion so that ~7' is axially symmetric; (2) the polarity of the environment of the probe is identical to the corresponding polarity of the host crystal; and (3) "magnetically" dilute label concentrations are employed, since higher order terms representing probe- probe interactions are not included in ~ ' . If any of the above conditions are no t satisfied, S(TII ) and S(T±) will not, in general, be equal, and the respective order parameters will serve only as approximate indicators of membrane fluidity.
However, an order parameter which corrects for polarity differences between the membrane and reference crystal may be calculated if both hyperfine splittings are available. Appropriate corrections to S(Ttt ) and S(T±) may be applied by noting that the isotropic hyperfine coupling constant (an) is sensitive to the polarity of the environment of the nitroxide radical. Here, a~ and an are the isotropic hyperfine coupling constants for the probe in the membrane and crystal state, respectively:
= ~ • (Tzz + 2Txx) (7) aN 5
aN, = ~1 . (T, + 2T±) (8)
Let us assume that changes in the polarity of the environment affect Txx and Tzz in the same way. Eqns. 5 and 6 may then be corrected by dividing the elements of T (and T') by their respective isotropic hyperfine coupling con- stants aN (and a~). Performing this operation on either S(TII ) or S(TI) yields the polarity-corrected order parameter (S) initially derived by Hubbell and McConnell [2] :
( Tt, -- TI ) (aN] (9) S= Tz z Txx \aN/
Materials and Methods
Materials. We obtained the N-oxyl-4' ,4 '-dimethyloxazolidine derivative of 5- ketostearic acid, I(12,3), from Syva Co., Palo Alto, Calif. Egg yolk lecithin was purchased from General Biochemicals, Chagrin Falls, Ohio, and sucrose was from Calbiochem, La Jolla, Calif. All other chemicals were from Sigma Chemical Co., St. Louis, Mo.
Preparation of egg yolk lecithin liposomes. Crude dispersions of the phos- pholipid were prepared by vortexing in 8% sucrose, 5 mM Tris • HC1 (pH 7.6) at room temperature. The lecithin concentrat ion was 20 mg lipid/ml buffer.
Spin labelling. The I(12,3) probe was dissolved in ethanol (10 -3 M) and 7.5 pl aliquots were dried with a stream of dry N2 gas. Samples of egg lecithin (120 #1) were then added to the probe and gently vortexed for several min at room temperature. Spectra were recorded in an aqueous cell with a Varian E-3 ESR spectrometer equipped with a variable temperature accessory. The temperature
3~
was calibrated for the range 12--42~C with a thermocouple placed m the resonant cavity. Low microwave powers were employed [111.
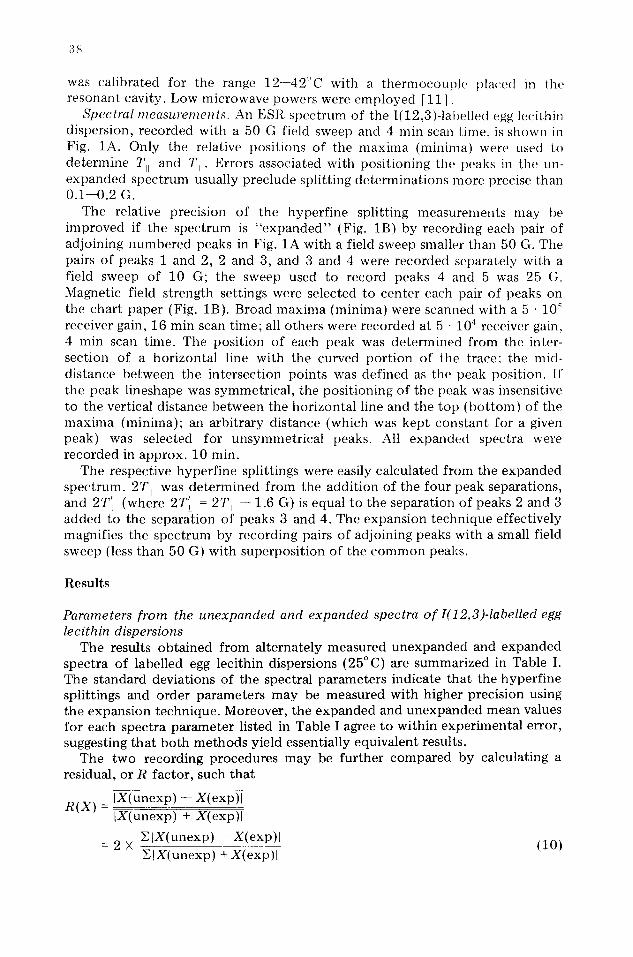
Spectral measurements. An ESR spectrum of the I(12,3)-labelled egg lecithin dispersion, recorded with a 50 G field sweep and 4 min scan time, is shown in Fig. 1A. Only the relative positions of the maxima (minima) were used to determine Tii and T L. Errors associated with positioning the peaks in the un- expanded spectrum usually preclude splitting determinations more precise than 0.1--0.2 G.
The relative precision of the hyperfine splitting measurements may be improved if the spectrum is "expanded" (Fig. 1B) by recording each pair of adjoining numbered peaks in Fig. 1A with a field sweep smaller than 50 G. The pairs of peaks 1 and 2, 2 and 3, and 3 and 4 were recorded separately with a field sweep of 10 G; the sweep used to record peaks 4 and 5 was 25 G. Magnetic field strength settings were selected to center each pair of peaks on the chart paper (Fig. 1B). Broad maxima (minima) were scanned with a 5 • 10 s receiver gain, 16 min scan time; all others were recorded at 5 - 104 receiver gain, 4 rain scan time. The position of each peak was determined from the inter- section of a horizontal line with the curved portion of the trace; the mid- distance between the intersection points was defined as the peak position. If the peak lineshape was symmetrical, the positioning of the peak was insensitive to the vertical distance between the horizontal line and the top (bottom) of the maxima (minima); an arbitrary distance (which was kept constant for a given peak) was selected for unsymmetrical peaks. All expanded spectra were recorded in approx. 10 min.
The respective hyperfine splittings were easily calculated from the expanded spectrum. 2TII was determined from the addition of the four peak separations, and 2T I (where 2T' l = 2T l -- 1.6 G) is equal to the separation of peaks 2 and 3 added to the separation of peaks 3 and 4. The expansion technique effectively magnifies the spectrum by recording pairs of adjoining peaks with a small field sweep (less than 50 G) with superposition of the common peaks.
Resul ts
Parameters from the unexpanded and expanded spectra o f I(12,3)-labelled egg lecithin dispersions
The results obtained from alternately measured unexpanded and expanded spectra of labelled egg lecithin dispersions (25°C) are summarized in Table I. The standard deviations of the spectral parameters indicate that the hyperfine splittings and order parameters may be measured with higher precision using the expansion technique. Moreover, the expanded and unexpanded mean values for each spectra parameter listed in Table I agree to within experimental error, suggesting that both methods yield essentially equivalent results.
The two recording procedures may be further compared by calculating a residual, or R factor, such that
[X(unexp) -- X(exp)L R ( X ) =
IX(unexp) + X(exp)l
E LX(unexp) -- X(exp)[ = 2 X (10)
Y~LX(unexp) + X(exp)l
39
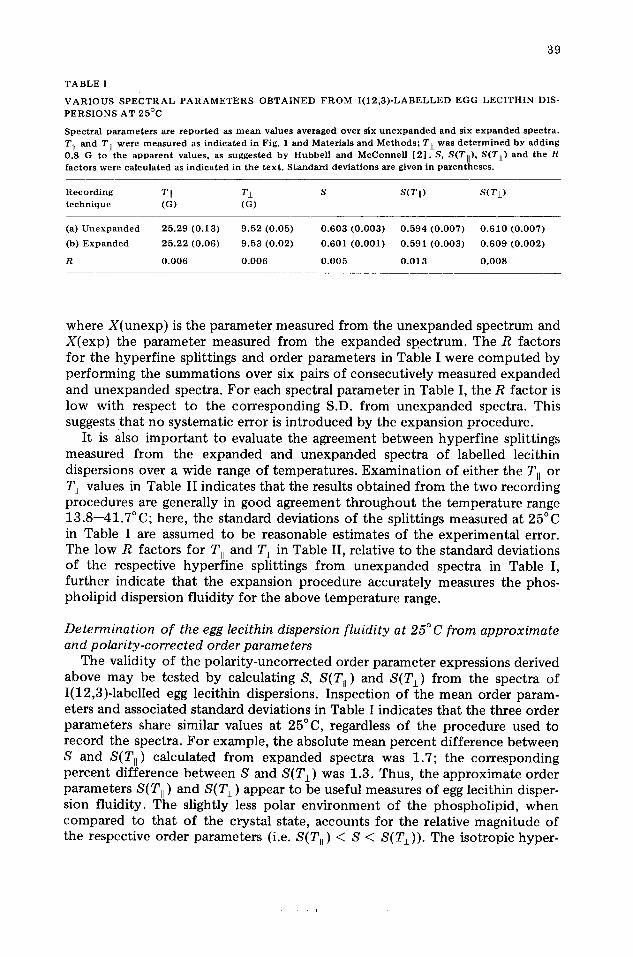
T A B L E I
V A R I O U S S P E C T R A L P A R A M E T E R S O B T A I N E D F R O M I ( 1 2 , 3 ) - L A B E L L E D E G G L E C I T H I N DIS- P E R S I O N S A T 2 5 ° C
S p e c t r a l p a r a m e t e r s are r e p o r t e d as m e a n va lues a v e r a g e d over six u n e x p a n d e d a n d six e x p a n d e d s p e c t r a . TII a n d T j_ we re m e a s u r e d as i n d i c a t e d in Fig. 1 a n d Mate r i a l s a n d M e t h o d s ; T± w a s d e t e r m i n e d b y a d d i n g 0 .8 G to the a p p a r e n t va lues , as s u g g e s t e d b y H u b b e l l a n d M c C o n n e l l [ 2 ] . S, S(TI]), S(Tj_) a n d the R f a c t o r s were c a l c u l a t e d as i n d i c a t e d in t he t e x t . S t a n d a r d d e v i a t i o n s are given in p a r e n t h e s e s .
R e c o r d i n g T [I T± S S(T[[) S ( T I ) t e c h n i q u e (G) (G)
(a) U n e x p a n d e d 2 5 . 2 9 ( 0 . 1 3 ) 9 . 5 2 (0 .05 ) 0 . 6 0 3 ( 0 . 0 0 3 ) 0 . 5 9 4 ( 0 . 0 0 7 ) 0 . 6 1 0 ( 0 . 0 0 7 )
(b) E x p a n d e d 2 5 . 2 2 (0 .06 ) 9 .53 (0 .02 ) 0 . 6 0 1 ( 0 . 0 0 1 ) 0 . 5 9 1 ( 0 . 0 0 3 ) 0 . 6 0 9 ( 0 . 0 0 2 )
R 0 . 0 0 6 0 . 0 0 6 0 . 0 0 5 0 . 0 1 3 0 . 0 0 8
where X(unexp) is the parameter measured from the unexpanded spectrum and X(exp) the parameter measured from the expanded spectrum. The R factors for the hyperfine splittings and order parameters in Table I were computed by performing the summations over six pairs of consecutively measured expanded and unexpanded spectra. For each spectral parameter in Table I, the R factor is low with respect to the corresponding S.D. from unexpanded spectra. This suggests that no systematic error is introduced by the expansion procedure.
It is also important to evaluate the agreement between hyperfine splittings measured from the expanded and unexpanded spectra of labelled lecithin dispersions over a wide range of temperatures. Examination of either the Tit or T~ values in Table II indicates that the results obtained from the two recording procedures are generally in good agreement throughout the temperature range 13.8--41.7 °C; here, the standard deviations of the splittings measured at 25°C in Table I are assumed to be reasonable estimates of the experimental error. The low R factors for Ttt and T l in Table II, relative to the standard deviations of the respective hyperfine splittings from unexpanded spectra in Table I, further indicate that the expansion procedure accurately measures the phos- pholipid dispersion fluidity for the above temperature range.
Determination of the egg lecithin dispersion fluidity at 25°C from approximate and polarity-corrected order parameters
The validity of the polarity-uncorrected order parameter expressions derived above may be tested by calculating S, S(T, ) and S(T~) from the spectra of I(12,3)-labelled egg lecithin dispersions. Inspection of the mean order param- eters and associated standard deviations in Table I indicates that the three order parameters share similar values at 25°C, regardless of the procedure used to record the spectra. For example, the absolute mean percent difference between S and S(Til ) calculated from expanded spectra was 1.7; the corresponding percent difference between S and S(T±) was 1.3. Thus, the approximate order parameters S(Ttl ) and S(T±) appear to be useful measures of egg lecithin disper- sion fluidity. The slightly less polar environment of the phospholipid, when compared to that of the crystal state, accounts for the relative magnitude of the respective order parameters (i.e. S(Tll ) < S < S(T±)). The isotropic hyper-
40
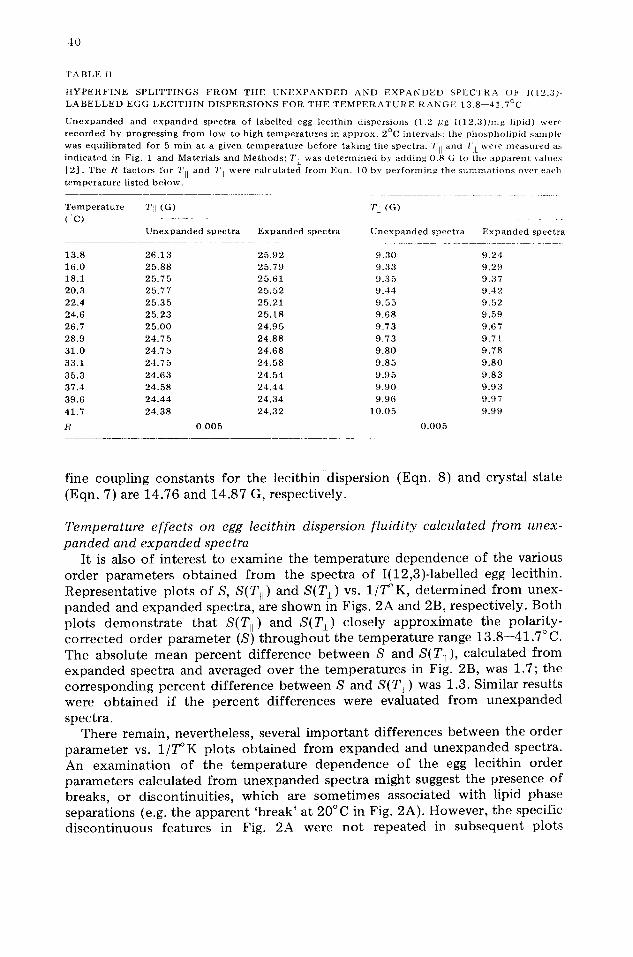
' F A B L E II
H Y P E R F I N E S P L I T T I N G S F R O M T H E U N E X P A N D E D A N D E X P A N D E D S P E C T R A O t c ] ( [ 2 , ' 3 ) - L A B E L L E D E G G L E C I T H I N D I S P E R S I O N S F O R T H E T E M P E R A T U R E R A N G E 1 3 . 8 - - 4 ] . 7 ° C
U n e x p a n d e d and e x p a n d e d spectra o f label led egg lec i th in dispersions ( l . 2 pg l ( 1 2 , 3 ) / m g l ipid) wer , ' recorded by progress ing f r o m tow to high t e m p e r a t u r e s in approx . 2°C intervals: the phosphol ip id s a m p l e
was equi l ibrated for 5 m in at a given t e m p e r a t u r e be fore taking the spectra. TII and T I w e r e m e a s u r e d as indicated in F i g . 1 and Materials and M e t h o d s ; T [ was d e t e r m i n e d by adding 0 .8 ( i to the apparent v a l u e s
[ 2 ] . T h e R fac tors for TII and 7'] were ca lculated f rom E q n . I 0 b y per forming the s u m m a t i o n s o v e r e a c h
t e m p e r a t u r e l isted b e l o w .
T e m p e r a t u r e TII ( G )
( C ) U n e x p a n d e d spectra E x p a n d e d spectra
' I ' ] ( G )
U n e x p a n d e d spectra E x p a n d e d spectra
1 3 . 8 2 6 . 1 3 2 5 , 9 2 9 . 3 0 9 . 2 4 1 6 . 0 2 5 . 8 8 2 5 . 7 9 9 . 3 3 9 . 2 9 18 .1 2 5 . 7 5 2 5 . 6 1 9 . 3 5 9 . 3 7 2 0 . 3 2 5 . 7 7 2 5 , 5 2 9 . 4 4 9 . 4 2
2 2 . 4 2 5 . 3 5 2 5 . 2 1 9 . 5 5 9 . 5 2 2 4 . 6 2 5 . 2 3 2 5 . 1 8 9 . 6 8 9 . 5 9
2 6 . 7 2 5 . 0 0 2 4 . 9 5 9 . 7 3 9 . 6 7
2 8 . 9 2 4 . 7 5 2 4 . 8 8 9 . 7 3 9 . 7 1 3 1 . 0 2 4 . 7 5 2 4 . 6 8 9 . 8 0 9 . 7 8
3 3 . 1 2 4 . 7 5 2 4 . 5 8 9 . 8 5 9 . 8 0
3 5 . 3 2 4 . 6 3 2 4 . 5 4 9 , 9 5 9 . 8 3
3 7 . 4 2 4 . 5 8 2 4 . 4 4 9 . 9 0 9 . 9 3
3 9 . 6 2 4 . 4 4 2 4 . 3 4 9 . 9 6 9 . 9 7
4 1 . 7 2 4 . 3 8 2 4 . 3 2 1 0 . 0 5 9 . 9 9
R 0 . 0 0 5 0 . 0 0 5
fine coupling constants for the lecithin dispersion (Eqn. 8) and crystal state (Eqn. 7) are 14.76 and 14.87 G, respectively.
Temperature effects on egg lecithin dispersion fluidity calculated from unex- panded and expanded spectra
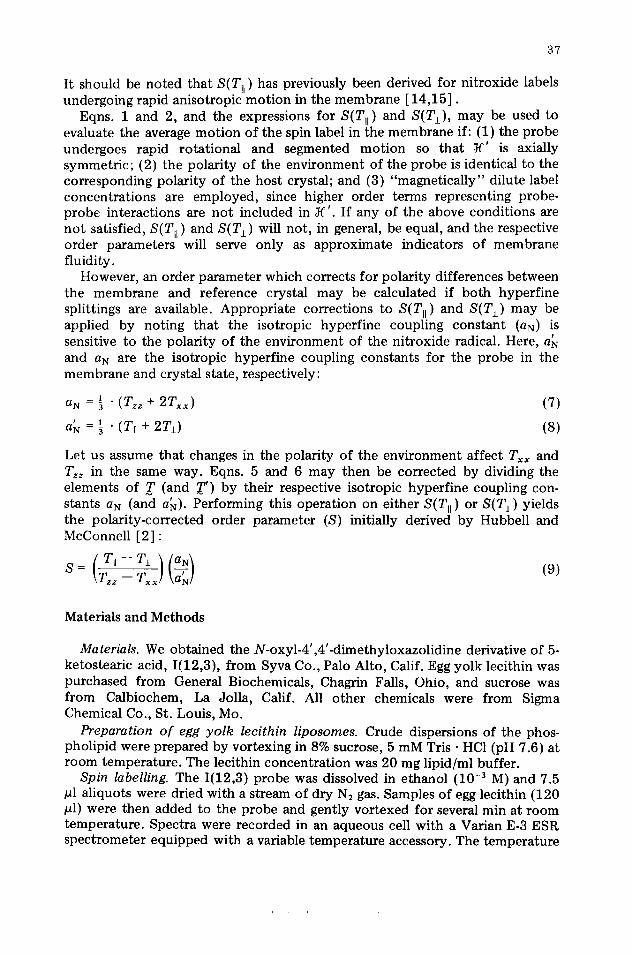
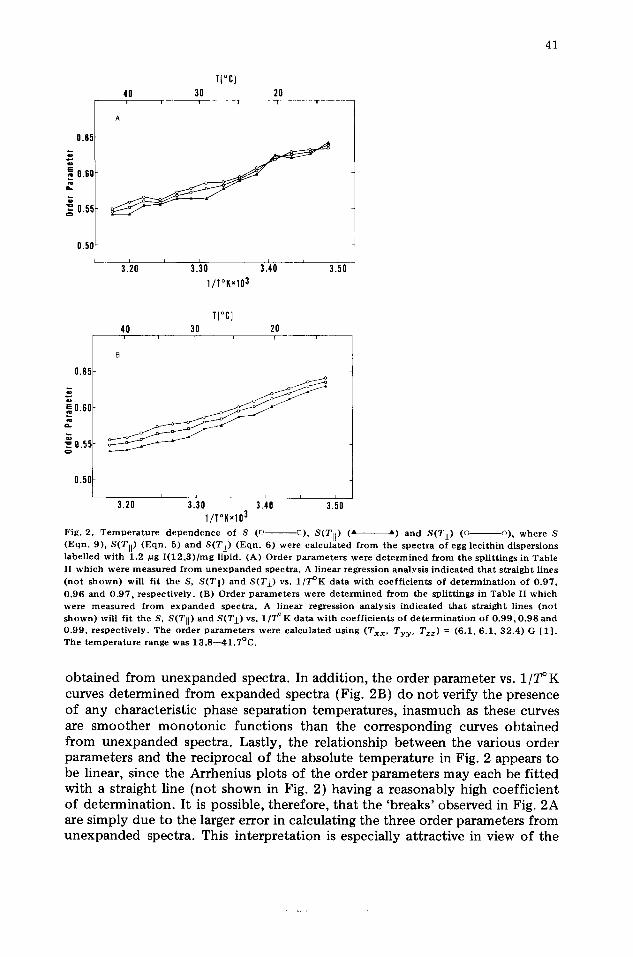
It is also of interest to examine the temperature dependence of the various order parameters obtained from the spectra of I(12,3)-labelled egg lecithin. Representative plots of S, S(Ttl) and S(TI) vs. 1/T°K, determined from unex- panded and expanded spectra, are shown in Figs. 2A and 2B, respectively. Both plots demonstrate that S(Tll) and S(Tt) closely approximate the polarity- corrected order parameter (S) throughout the temperature range 13.8--41.7 ° C. The absolute mean percent difference between S and S(T11), calculated from expanded spectra and averaged over the temperatures in Fig. 2B, was 1.7; the corresponding percent difference between S and S(T~) was 1.3. Similar results were obtained if the percent differences were evaluated from unexpanded spectra.
There remain, nevertheless, several important differences between the order parameter vs. 1/T°K plots obtained from expanded and unexpanded spectra. An examination of the temperature dependence of the egg lecithin order parameters calculated from unexpanded spectra might suggest the presence of breaks, or discontinuities, which are sometimes associated with lipid phase separations (e.g. the apparent 'break' at 20°C in Fig. 2A). However, the specific discontinuous features in Fig. 2A were not repeated in subsequent plots
41
0.65
~0.60 g.
0.55
0.50
T{°C} 40 30 20
i i i I l
3.'2o ' 3.'30 ' 3. 0 1/T°KxlO 3
3.150
0.65
~ 0.60 e~
o .
0.55 o
0.50
TI°C) 40 30 20
i i I i
L I
3.20 ' 3. 0 3 . ,0 ' 3.50 1/T°KxlO 3
Fig. 2. T e m p e r a t u r e d e p e n d e n c e o f S (l~ ~), S(TII) (A A) a n d S(Tj_) (G o), w h e r e S ( E q n . 9) , S(TI]) ( E q n . 5) a n d S(T±) ( E q n . 6) were c a l c u l a t e d f r o m the s p e c t r a o f egg l ec i th in d i s p e r s i o n s l abe l l ed w i t h 1.2 p g I ( 1 2 , 3 ) / m g l ip id . (A) O r d e r p a r a m e t e r s we re d e t e r m i n e d f r o m the sp l i t t i ngs in Tab le II w h i c h w e r e m e a s u r e d f r o m u n e x p a n d e d spec t r a . A l inea r r eg re s s ion a n a l y s i s i n d i c a t e d t h a t s t r a i g h t l ines ( n o t s h o w n ) will fi t the S, S(Tli) a n d S(Tj_) vs. 1 / T ° K d a t a w i t h c o e f f i c i e n t s o f d e t e r m i n a t i o n o f 0 . 9 7 , 0 . 9 6 a n d 0 . 9 7 , r e spec t i ve ly . (B) O r d e r p a r a m e t e r s were d e t e r m i n e d f r o m the sp l i t t ings in Tab le II w h i c h were m e a s u r e d f r o m e x p a n d e d s p e c t r a . A l inea r r eg res s ion ana lys i s i n d i c a t e d t h a t s t r a i g h t l ines ( n o t s h o w n ) will f i t the S, S(TII) a n d S(T±) vs. 1 / T ° K d a t a w i th c o e f f i c i e n t s o f d e t e r m i n a t i o n o f 0 . 9 9 , 0 . 9 8 a n d 0 . 9 9 , r e spec t i ve ly . The o r d e r p a r a m e t e r s were c a l c u l a t e d us ing (Txx, Tyy , Tzz) = (6 .1 , 6 . 1 , 3 2 . 4 ) G [ 1 ] . The t e m p e r a t u r e r ange was 1 3 . 8 - - 4 1 . 7 ° C .
obtained from unexpanded spectra. In addition, the order parameter vs. 1/T°K curves determined from expanded spectra (Fig. 2B) do not verify the presence of any characteristic phase separation temperatures, inasmuch as these curves are smoother monotonic functions than the corresponding curves obtained from unexpanded spectra. Lastly, the relationship between the various order parameters and the reciprocal of the absolute temperature in Fig. 2 appears to be linear, since the Arrhenius plots of the order parameters may each be fitted with a straight line (not shown in Fig. 2) having a reasonably high coefficient of determination. It is possible, therefore, that the 'breaks' observed in Fig. 2A are simply due to the larger error in calculating the three order parameters from unexpanded spectra. This interpretation is especially attractive in view of the
,i 2
egg lecithin calorimetry studies of Chapman [16] which did not find a phase, separation occurring within the temperature range 13--42 ° C.
The relative magnitude of the respective order parameters at 13.8 and 20°C in Fig. 2A (i.e. S(T~) < S < S(T,!)) was different than that noted at other temperatures (i.e. S(Ti, ) < S < S(T~ )) because the measured polarity of the phospholipid exceeded that of the crystal state only at 13.8 and 20°C. The inversion in the relative magnitude of the order parameters was responsible for the intersections seen in the curves obtained from unexpanded spectra in Fig. 2A. No such intersections occurred in the order parameters vs. 1/T°K curves obtained from expanded spectra (Fig. 2B), since the observed phospholipid dispersion polarity was consistently less than that of the reference crystal state.
Discussion
The expansion-superposition method permit ted more precise measurement of the fluidity of I(12,3)-labelled egg lecithin dispersions than was obtained from conventionally recorded spectra. We suggest that the expansion procedure may be of general use in membrane ESR studies. For example, the expansion technique has recently been employed to study the effects of various I(12,3) probe concentrations on the spectra of liver and heart plasma membranes [ 17] . The precision of the hyperfine splittings obtained with this method is certainly comparable to the corresponding precision obtained with a signal averaging system in a I(12,3)-labelled lymphocyte study [18] . An advantage of the expansion technique is that a spectrum may be measured in 10 min, while signal averaging systems may require considerably longer to record a spectrum. Thus, the expansion technique may be of use in those I(m,n)-labelled membrane studies where the ESR signal decreases with time [11 ,19 ,20] . Furthermore, the expansion method may be suitably modified if the membrane ESR spectra cannot be recorded as indicated in Fig. 1. For example, if peak 4 (Fig. 1A) is not well defined (e.g. refs. 12, 13 and 17), T,! may be measured with the expansion technique by choosing the minima located between peaks 3 and 4 as a common superposition peak.
The approximate order parameters S(Tll ) and S(Tj ) were found to accurately estimate the fluidity of I(12,3)-labelled egg lecithin dispersions over a wide range of temperatures. Although S(Tli) and S(TI) may prove to be generally useful for those spin label membrane studies in which only one hyperfine splitting is available, it is important to recognize the limitations that these approximate order parameters have in the measurement of the membrane fluidity. Tll and T~ are functions of both the fluidity and polarity of the membrane. Thus, no unequivocal s tatement can be made about the membrane fluidity from the determination of a polari ty-uncorrected order parameter. The estimation of the membrane fluidity from S(T~) is further complicated since the values of T l from computer-simulated spectra differ slightly from the corresponding experimentally observed values [ 2,21 ].
The possibility that Tit and/or T~ may be affected by the I(m,n) probe con- centration introduces uncertainty into the membrane fluidity, whether measured by S, S(Ttl ), or S(TI). Recent studies of I(12,3)-labelled ery throcyte membranes indicate that either Trl [22] or T l [23] may increase with the
43
probe concentrat ion at high probe : lipid ratios. In addition, we have observed a probe concentrat ion-dependent broadening of the inner hyperfine splittings of I(12,3)-labelled rat liver and heart plasma membranes [17] . Therefore, meaningful order parameter measurements for a given membrane system may be made only if experimentally determined low probe : lipid ratios are employed.
Acknowledgments
The authors wish to thank Dr. Arne N. Wick for the use of his facilities and for his encouragement. We also wish to acknowledge Judy A. Esgate for her technical assistance. This s tudy was supported in part by U.S. Public Health Service Grant 5685-12 to Dr. Arne N. Wick and a grant to L.M.G. and R.D.S. from the American Diabetes Association, Southern California Affiliate, Inc. L.M.G. was sponsored by a postdoctoral fellowship from the San Diego County Heart Association.
References
1 Seelig, J. (1970) J. Am. Chem. Soc. 92, 3881--3887 2 Hubbell, W. and McConnell, H.M. (1971) J. Am. Chem. Soc. 93 ,314- -326 3 Barnett, R., Furcht, L. and Scott, R. (1974) Proc. Natl. Acad. Sci. U.S. 71, 1992--1994 4 Butterfield, D., Roses, A., Cooper, M., Appel, S. and Chesnut, D.B. (1974) Biochemistry 13, 5078--
5082 5 Huestis, W.H. and McConnell, H.M. (1974) Biochem. Biophys. Res. Commun. 57 ,726- -732 6 Kury, P.G. and McConnell, H.M. (1975) Biochemistry 14, 2798--2803 7 Sauerheber, R.D.and Gordon, L.M. (1975) Proc. Soc. Exp. Biol. Med. 150, 28--31 8 Ehrstrom, M., Eriksson, L., Israelachvili, J. and Ehrenberg, A. (1973) Biochem. Biophys. Res. Com-
mun. 55, 396--402 9 Schummer, D., Hegner, D., Sehnepel, G. and Wellhoner, H. (1975) Biochim. Biophys. Acta 394, 93--
101 10 Chevion, M., Panos, C. and Paxton, J. (1976) Biochim. Biophys. Aeta 426 ,288- -301 11 Gaffney, B.J. (1975) Proc. Natl. Acad. Sci. U.S. 72 ,664- -668 12 Rot tem, S. and Samuni, A. (1973) Biochim. Biophys. Acta 298, 32--38 13 Chignell, C.F. and Chignell, D.A. (1975) Biochem. Biophys. Res. Commun. 62, 136--143 14 Israelachvili, J., Sjosten, J., Eriksson, L., Ehrstrom, M., Graslund, A. and Ehrenberg, A. (1974) Bio-
chim. Biophys. Acta 339, 164--172 15 Griffith, O.H. and Jost, P.C. (1976) in Spin Labeling (Berliner, L.J., ed.), pp. 453--523, Academic
Press, New York 16 Chapman, D. (1975) Q. Rev. Biophys. 8 ,185- -235 17 Sauerheber, R.D., Gordon, L.M., Crosland, R.D. and Kuwahaxa, M.D. (1977) J. Membrane Biol., in the
press 18 Dodd, N.J.F. (1975) Nature 257 ,827- -828 19 Schroit, A.J., Rot tem, S. and Gallily, R. (1976) Biochim. Biophys. Acta 426 , 499 - -512 20 Kaplan, J., Canonico, P.G. and Caspary, W.J. (1973) Proc. Natl. Acad. Sci. U.S. 70, 66--70 21 Gaffney, B.J. (1976) in Spin Labeling (Berliner, L.J., ed.), pp. 567--571, Academic Press, New York 22 Verma, S. and Wallach, D.F.H. (1975) Biochim. Biopliys. Acta 382, 73--82 23 Butterfield, D.A., Whisnant, C.C. and Chesnut, D.B. (1976) Biochim. Biopbys. Acta 426 , 697 - -702


