Embed Size (px)
Citation preview

PHYSICAL REVIEW B, VOLUME 65, 024517
Structural studies of impurity-helium solids
S. I. Kiselev, V. V. Khmelenko, and D. M. LeeLaboratory of Atomic and Solid State Physics, Cornell University, Ithaca, New York 14853-2501
V. KiryukhinDepartment of Physics and Astronomy, Rutgers University, Piscataway, New Jersey 08854
R. E. Boltnev and E. B. GordonInstitute of Energy Problems of Chemical Physics, Chernogolovka, 142432, Russia
B. KeimerMax-Planck-Institute fu¨r Festkorperforschung, D-70569 Stuttgart, Germany
~Received 29 August 2001; published 19 December 2001!
We have used x-ray diffraction and ultrasound techniques to study the structure of mesoporous impurity–helium solids created after the injection of impurity particles (D2, Ne, N2, Kr! into a volume of superfluid4He.Clusters of impurities with size of order 50620 Å and density;1020 impurities/cm3 were observed by x-raydiffraction. The presence of a wide distribution of pore sizes in Im–He solids was revealed by ultrasound~80to 8600 Å) and by small-angle x-ray scattering~80 to.400 Å). Both x-ray and ultrasound methods detectedirreversible structural changes when samples were warmed aboveTl52.17 K. This is ascribed to the aggre-gation of small clusters caused by thermally activated diffusion. In addition to being of fundamental interest,the properties of the unique porous media studied in this work may be relevant to investigations of lowtemperature chemical reactions, storage of free radicals, matrix isolation spectroscopy, and superfluid4Hecontained in the pores of an extremely compliant medium.
DOI: 10.1103/PhysRevB.65.024517 PACS number~s!: 67.40.Yv, 67.40.Mj, 61.10.Eq, 61.46.1w
dlele
olgle
aurin
rixivn
agasugo
be
haf
ucce
g
ine
eac-rix
nton-byni-
to
esombyug-olids,bybleof
itysultatedges
chbulkforlose
arst of
I. INTRODUCTION
The investigation of nanostructured materials is a rapideveloping research field. A great deal of progress has bachieved in studies of isolated neutral atoms or molecuand nanoclusters of atoms and molecules in liquid and shelium.1–4 Studies of the spectral characteristics of sinatoms or molecules have provided a great deal of informtion about the structure of helium surrounding these impties. The impurities can be divided into two classes accordto the sign of the chemical potential inside the helium matIt is positive for alkali atoms and electrons and it is negatfor most other particles, in particular inert gas atoms amore complex molecules such as D2 and N2. Alkali–heliumpotentials have a more extended repulsive core and a weattractive tail than the rare gas–helium potential. Rareatoms as well as N2 and D2 molecules tend to compreshelium atoms in shells around the impurity. It has been sgested by a number of authors that the first two layerslocalized helium around a spherical impurity particle canthought of as a solid in the radial direction but that the hlium atoms are relatively free to translate in the azimutdirection. The same general behavior could be expectednonspherical particles.5
When inert gases or gases such as nitrogen are introdas impurity particles into liquid helium, we can produstable impurity–helium~Im–He! clusters, which make itpossible to create macroscopic Im–He samples consistinimpurity atoms isolated by localized helium.6–9 There is thepossibility of observing collective effects caused by theteraction between stabilized impurity particles in Im–H
0163-1829/2001/65~2!/024517~12!/$20.00 65 0245
yens
id
-i-g.ed
kers
-f
e-lor
ed
of
-
samples and also the opportunity to observe chemical rtions in a solid matrix when the behavior of the solid matis determined by zero-point motion.10–12 Introducing theproducts of a nitrogen–helium radiofrequency discharge isuperfluid helium permits production of Im–He samples cotaining N atoms with relative concentrations unattainableother techniques. For example, relative concentrations oftrogen atoms isolated by localized helium~@N#/@He#! in thesolid matrix can be as high as approximately 4%.7,9 The en-ergy density stored in this Im–He sample is comparablethat of chemical explosives.13
Macroscopic solid samples formed by injecting impuritiinto superfluid helium are metastable solid phases built frcoalescing clusters of the impurity particles surroundedsolidified helium layers. The preponderance of evidence sgests that aggregates of these clusters are mesoporous ssimilar to extremely porous aerogels. Both are formeddiffusion limited aggregation processes. It is quite reasonathat highly branching structures are formed for the caseIm–He solids. The helium layers surrounding each impurparticle or cluster are expected to be quite thin. They refrom the strong van der Waals attractive pressure associwith each impurity particle or cluster. At a sufficiently londistance from the impurity, the effective pressure becomsmaller than the bulk solidification pressure of helium whiis greater than 25 atmospheres. Therefore the model ofsolid helium with embedded impurities does not applyIm–He solids except under compression. Instead, the cproximity of liquid helium to every impurity or impuritycluster favors a porous branching structure. In recent yesuperfluid helium in porous materials has been a subjec
©2001 The American Physical Society17-1
ientho
papetaatimua
ir
einav
nenes
this
burfuatthplpl
indu
gyu
fuththa
weHeto
ay
alltin-1
ul-
ithket
atap-uidich
ofby
fun-ntoas
pichisa
If
helowigh
s.
plecell.
ed
asgs,wassed
m
S. I. KISELEV et al. PHYSICAL REVIEW B 65 024517
active theoretical and experimental investigations.14,15 Finitesize effects can shift or smear the superfluid transitionliquid helium. Various porous materials affect the critical bhavior of helium nearTl . Furthermore, sound propagatioin superfluid helium has been extensively used in probingstructure of a number of porous materials, including vycand different porosity aerogels.16–18The sound attenuation inliquid helium absorbed in a porous solid reflects the dissition in the system, and its temperature and frequency dedence is related to the characteristic pore size. The imporfeature of Im–He solids as compared to other porous mrials is that the interaction potential between helium andpurities is well characterized. They also give us a uniqopportunity to observe the properties of liquid helium inporous medium consisting partially of localized helium.
Our previous reports on sound attenuation in heliumIm–He solids point to the presence of a distribution of posizes in Im–He samples.19,20 In the present work we havemployed ultrasound propagation and x-ray diffraction tovestigate the structural properties of Im–He solids. We hconcentrated on molecular impurities such as N2 and D2, andinert gas impurities such as Ne and Kr in these experimeWe have found that both x-ray and ultrasound measuremlead to a consistent description of the properties of thsolids.
It was determined that Im–He (Im5Ne, N2) samplesconsist of the clusters of impurities of order 50620 Å andcharacteristic impurity density of;1020 cm23. This is con-sistent with the previous set of x-ray experiments wherewas determined that for a freshly prepared Ne-He samplecharacteristic size of a constituent building blocks of tporous material is 60620 Å.21 This does not rule out thepossibility that smaller clusters or single molecules maypresent in the sample. In the present work, x-ray measments monitored the aggregation of the impurities via difsion during the warming of the sample. X-ray powder pterns of the clusters of impurities were observed asclusters increased in size during the warming of the samDrastic irreversible changes were observed when samwere heated above theTl of bulk helium. This is explainedby the speeding up of the thermally activated diffusionthat temperature regime because of the poor thermal contivity of liquid helium.
In a different set of experiments, this process of aggretion of impurities during the warm-up was monitored bsound attenuation measurements using 1, 3, and 5 MHztrasound via a pulse time-of-flight technique. Other useinformation regarding Im–He solids was also obtained inultrasound experiments. For example, the distribution ofpore sizes in the samples was found to be between 808600 Å. This is consistent with the pore size distributionobtained from small-angle x-ray scattering in a Ne–sample, which was determined to range from 80 Å.400 Å.
II. EXPERIMENTAL METHOD
A. Preparation of porous impurity –helium solids
The technique for creating impurity–helium solids involume of superfluid4He was similar to that developed b
02451
n-
er
-n-nte--e
ne
-e
ts.tse
ithe
ee---ee.es
c-
a-
l-leend
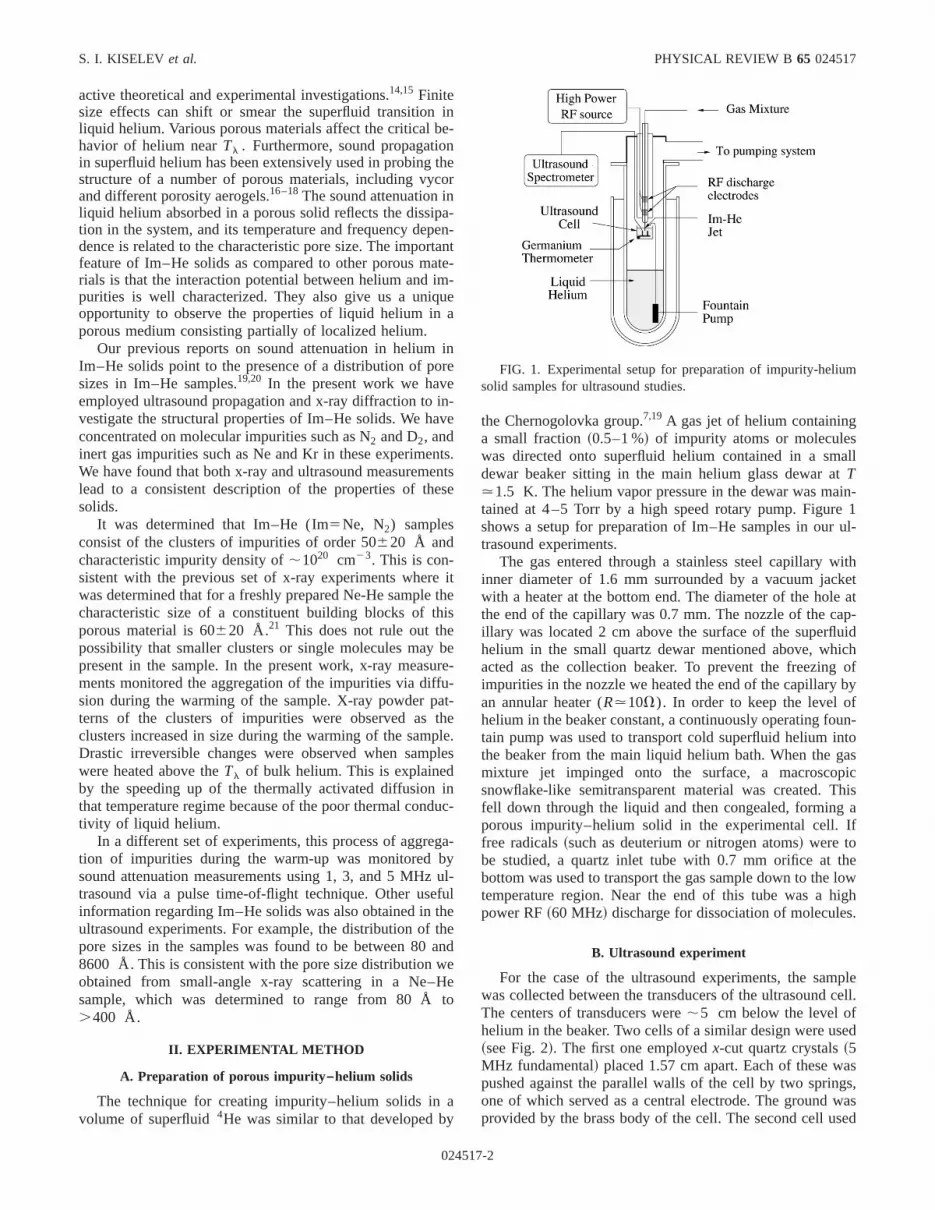
the Chernogolovka group.7,19 A gas jet of helium containinga small fraction~0.5–1 %! of impurity atoms or moleculeswas directed onto superfluid helium contained in a smdewar beaker sitting in the main helium glass dewar aT.1.5 K. The helium vapor pressure in the dewar was matained at 4–5 Torr by a high speed rotary pump. Figureshows a setup for preparation of Im–He samples in ourtrasound experiments.
The gas entered through a stainless steel capillary winner diameter of 1.6 mm surrounded by a vacuum jacwith a heater at the bottom end. The diameter of the holethe end of the capillary was 0.7 mm. The nozzle of the cillary was located 2 cm above the surface of the superflhelium in the small quartz dewar mentioned above, whacted as the collection beaker. To prevent the freezingimpurities in the nozzle we heated the end of the capillaryan annular heater (R.10V). In order to keep the level ohelium in the beaker constant, a continuously operating fotain pump was used to transport cold superfluid helium ithe beaker from the main liquid helium bath. When the gmixture jet impinged onto the surface, a macroscosnowflake-like semitransparent material was created. Tfell down through the liquid and then congealed, formingporous impurity–helium solid in the experimental cell.free radicals~such as deuterium or nitrogen atoms! were tobe studied, a quartz inlet tube with 0.7 mm orifice at tbottom was used to transport the gas sample down to thetemperature region. Near the end of this tube was a hpower RF~60 MHz! discharge for dissociation of molecule
B. Ultrasound experiment
For the case of the ultrasound experiments, the samwas collected between the transducers of the ultrasoundThe centers of transducers were;5 cm below the level ofhelium in the beaker. Two cells of a similar design were us~see Fig. 2!. The first one employedx-cut quartz crystals~5MHz fundamental! placed 1.57 cm apart. Each of these wpushed against the parallel walls of the cell by two sprinone of which served as a central electrode. The groundprovided by the brass body of the cell. The second cell u
FIG. 1. Experimental setup for preparation of impurity-heliusolid samples for ultrasound studies.
7-2

eidceanhee
ndityfse-l
n
mtio
eddlswn
taoedn
wo
em-
l,
ee-nalthend
iumthe
lsesthe
tra-mup-est
am-atro-
asntstry.offorpleex-col-
uld
e-of
rma-eri-um
25,
er-
STRUCTURAL STUDIES OF IMPURITY-HELIUM SOLIDS PHYSICAL REVIEW B65 024517
LiNbO3 transducers~1 MHz fundamental! placed 1.47 cmapart. For more effective collection of the sample betwetransducers in the cell, we used a quartz funnel with two splates which was placed between the endplates of theWe could monitor the presence of the sample in the cellits homogeneity visually through slits on the sides of tglass dewars. In these experiments the impurities used wNe, Kr and molecular D2 and/or N2. Gas mixtures ofIm:He51:100 were used to dilute the impurity particles atherefore prevent them from forming macroscopic impurgranules as they passed from the source to the surface oliquid helium. The total flux of the gas mixtures wa(4 –6)31019 particles/s. Samples with a visible volume btween 1.2 and 1.7 cm3 were usually employed. In generathe samples extended through the entire distance betweetransducers.
The ultrasonic measurements were made using a hodyne phase-sensitive spectrometer. A continuously operaoscillator was gated to providing transmitter pulses4 –12 ms. The amplitude of the input signal could be varifrom 1 to 100 V at the resonant frequency or at the oharmonics of the transmitting crystal. The ultrasonic puwas received by a receiver crystal, amplified and split in tparts, one of which was used to directly measure the atteation by recording the amplitude of the signal on a digioscilloscope. The attenuation was determined by the ratithe signal voltageU at the receiving transducer to the applivoltage at the transmitterU0. ~We assume a linear relatio
FIG. 2. Experimental cell: 1, Atomic and molecular source;impurity–helium jet; 3, surface of liquid helium; 4, quartz dewar;quartz funnel; 6, impurity–helium solid; 7, ultrasound cell; 8, gmanium thermometer~Ref. 20!.
02451
nell.d
re
the
the
o-ngf
deou-lof
between the voltage and the vibration amplitudes.! Accord-ing to the definition of attenuationa,
a~dB/cm!5~20/l !• logU0
U, ~1!
wherel is the length of the cell.The second part of the signal was split again into t
parts to obtain the 0° and 90° components,A0° and A90° .They where used to determine the phase of the signalf:
tan~f!5A0° /A90° . ~2!
Once the initial speed of sound was measured at the tperatureT0 from the pulse transit timet0, changes in veloc-ity were calculated from the phase of the received signa
Dv5 l Y S t01f~T!2f~T0!
v D , ~3!
where l is the length of the cell. With typical samples thchanges in velocity of a few parts per million could be rsolved. A second oscilloscope was used to display the sigon a longer time scale. It registered up to 12 echoes ofsignal in the first cell but only three echoes in the secoone.
For temperature measurements, a calibrated germanresistor was used. The thermometer was located insidebase of the cell just outside the path of the ultrasonic puso that the effect of the temperature difference betweenthermometer site and the sound path was minimized. Ulsound measurements were performed during a slow warwith a rate of 1024–1026 K/s. The warmup rate was controlled by constricting the pumping line and was the slownear theTl .
C. X-ray scattering measurements
X-ray scattering measurements were carried out on beline X20A at the National Synchrotron Light SourceBrookhaven National Laboratory. Im–He samples were pduced inside a pumped helium cryostat (T51.4–300 K) de-signed for x-ray diffraction measurements. The cryostat wmounted on a two-circle goniometer, and the experimewere performed in a standard horizontal scattering geomeThe energy of x rays was 8 keV. Figure 3 shows a diagramthe insert for a variable temperature cryostat designedx-ray diffraction measurements. The technique of sampreparation was identical to that used in the ultrasoundperiments. The only difference was that the sample waslected in a beryllium can.21
After the sample collection was finished, the sample cobe maintained in liquid helium atT51.5–4.2 K, or liquidhelium could be drained from the cell. The latter corrsponded to a ‘‘dry’’ sample. In this case the temperaturethe insert could be controlled in the rangeT51.5–300 K.For the temperature measurements, we used the same genium thermometer that was used in the ultrasound expments. In this case it was placed just outside of the beryllican ~see Fig. 3!.
,
7-3

eddrno-.gl
dmHpdar
pleera-cellrin
’’from
of
nd-re-hes of-
eeakheall.
as-
col--nlidrec-. Ineres
at
or4lethe
thows
S. I. KISELEV et al. PHYSICAL REVIEW B 65 024517
Im–He samples studied in our experiments containsmall clusters of impurity atoms with randomly distributeorientations.21 Therefore, the diffraction patterns produceby these samples are essentially powder diffraction patteand standardu –2u scans were used for data collection. Mmentum transfers from 0.4 Å21 to 2.8 Å21 were accessedWe have also carried out studies at smaller scattering anin which data at momentum transfers as small as 0.015 Å21
were collected. For the subsequent data analysis, stancorrections for solid angle, polarization, and sample voluwere made. To isolate the scattering due to the Im–samples from the scattering due to liquid helium, the samcell, and the cryostat windows, each experiment consistetwo sets of measurements. First, the sample was prep
FIG. 3. The diagram of insert for a variable temperature Oxfcryostat: 1, vacuum jacket; 2, capillary; 3, calibrated orifice;heater; 5, dielectric screen; 6, beryllium can with Im–He sampand germanium thermometer; 7, rods for vertical movement ofcan; 8, stainless steel protective tube with a hole for x-ray acc~9!; 10, fountain pump.
02451
d
s,
es,
ardeeleofed
and x-ray measurements were carried out. Then, the samwas evaporated by heating the sample cell to a high tempture, and the measurements were repeated both for thefilled with liquid helium, and for the empty cell. The forme‘‘background’’ scans were used for the samples immersedliquid helium, while the latter were used for the ‘‘drysamples. These background x-ray scans were subtractedthe Im–He data.
III. RESULTS
A. X-ray data and interpretation of x-ray results
In this section, we report x-ray diffraction studiesN2, Ne, and D2 impurity–helium solids. In a previouspaper,21 we have reported x-ray studies of Ne samples apreliminary results for the N2 and Kr samples. Here we extend the investigation of the Ne–He solids to samples ppared under different initial conditions, and also report tresults of small-angle scattering experiments. The analysithe N2 data is given, and the D2 samples are briefly discussed.
X-ray diffraction patterns produced by the Im–Hsamples contain broad diffraction peaks at the Bragg ppositions characteristic of the bulk crystal structure of tpure Im solids. These broad peaks indicate that very smclusters of the impurity atoms are present in our samples21
Figure 4 shows the diffraction data for the N2–He sampleat T51.5 K. Before the data collection, the sample wcompressed by heating aboveTl . The sample was surrounded by liquid helium at all times. The liquid heliumsignal has been subtracted from the data. The data werelected in the vicinity of the~111! and~200! peaks characteristic of cubic solid nitrogen. As in all the x-ray figures showbelow, Fig. 4 shows the intensity scattered into the soangle corresponding to a chosen momentum transfer; cortions for polarization and sample volume were also madeaddition, the intensity is normalized by the division by thsquare of the atomic factor of nitrogen. The notable featuof the data of Fig. 4 are a broad peak at the~111! position(ka'10.88), and theabsenceof the peak at the~200! posi-tion (ka'12.57). As was shown in Ref. 21, this means th
d,;ess
FIG. 4. X-ray diffraction pattern for the N2–He sample im-mersed in liquid helium atT51.5 K. Liquid helium signal is sub-tracted.k is momentum transfer,a is the lattice constant of solid N2.The solid line is the result of the calculation for 50 Å cluster wifour stacking faults, as discussed in the text. The dashed line shthe calculation made for a 30 Å ideal fcc cluster.
7-4

thle
ro
tivhe
fc, aorac
-en
l,le-
rdt
fcm
fot-dtuerten
tic
n
eineo
rers
bm
e-dedtex
fiv
-
iatedofedlergenner-a
sur-ys-
thein-
b-1n-lsoNeara-l asis-werec-ect-ors.nd,thatthe
eontheva-on-
blelesingtary
ub-ows
as
e
STRUCTURAL STUDIES OF IMPURITY-HELIUM SOLIDS PHYSICAL REVIEW B65 024517
the N2 clusters in our Im–He samples do not possessideal fcc structure of the bulk N2, but contain a substantianumber of defects. This observation is also in agreemwith earlier electron diffraction studies of free clusters pduced in supersonic jets.22,23
In the presence of defects, there is no simple quantitarelation between the width of the diffraction profiles and tcluster size. To determine the typical N2 cluster size in oursamples, we follow the analysis of Ref. 21. We considerclusters containing a specified number of stacking faultsdiscussed in Ref. 21. The intensity at the scattering vectkfrom a collection of such clusters randomly oriented in spis given by the Debye scattering equation24
I 5I 0(m
(n
f 2~k!sin~krmn!
krmn. ~4!
Here r mn is the distance between themth andnth atoms,and f (k) is the atomic form factor of nitrogen. The calculated diffraction patterns were averaged over the differpositions of the stacking faults in the cluster.
Model calculations for the N2–He samples are, in generamore complicated than the calculations for Ne–He sampconsidered in Ref. 21 because N2 molecules possess rotational degrees of freedom, and therefore the rotational oof these molecules has to be considered. To addressproblem, we have carried out calculations for the idealclusters using both the actual positions of the nitrogen atoin the crystal structure, and also in the approximationwhich the N2 molecules were replaced by two nitrogen aoms located at the center of mass of the molecule. Theference between the calculated results in the momentransfer range of Fig. 4 was much smaller than the expmental errors. Therefore, in the calculations for the cluswith faults, we used the simplified model with two nitrogeatoms located at each point of the corresponding fcc latwith stacking fault defects.
The best agreement with the experimental data showFig. 4 was obtained for clusters consisting of;2500 mol-ecules~diameter;50 Å). The solid line in Fig. 4 shows thcalculation made for a cluster with 2352 molecules containg four stacking faults of the deformation type. The dashline shows the calculation made for an ideal fcc cluster450 molecules~diameter ;30 Å). The latter calculationgives the low limit on the cluster size because disordeclusters always produce broader peaks than ideal clustethe same size. The upper limit on the cluster size canestimated from the calculation for clusters with randoclosely packed structure~the number of faults equals thnumber of closely packed layers!. Such calculations averaged over a large number of random distributions of thefects produce a peak width similar to the experimental wifor clusters 80 Å in diameter. The agreement with theperimental data in this case, however, is much worse thanthe calculation shown in Fig. 4. Therefore, a conservatestimate for the typical cluster size in the N2 sample of Fig.4 is 50620 Å. The minimum number of stacking faults required to explain the experimental data is three.
02451
e
nt-
e
cs
e
t
s
erhiscs
r
if-mi-rs
e
in
-df
dofe
-h-ore
There are several sources of systematic errors assocwith our determination of the characteristic cluster size50 Å. Lattice dynamics effects, for example, were ignorin our calculation. A rough estimate of the Debye–Walfactor based on the Debye temperature of bulk solid nitro(Tu'79 K) indicates that the Debye–Waller correctiodoes not change results of our calculations. However, thmal vibrations in our highly disordered samples in whichsubstantial fraction of molecules reside near the clusterfaces are likely to be larger. Another possible source for stematic errors is the restriction of the trial structures tofcc type. More complex atomic arrangements can, in prciple, be realized.
The prevalent cluster size of the N2 sample discussedabove, 50 Å, is similar to the size of the Ne clusters otained in Ref. 21. The nitrogen atom density of31020 cm23 determined from the comparison of the intesities of the nitrogen peaks to the liquid helium signal is asimilar to the density of the previously characterizedsamples. However, samples grown under different preption conditions exhibited different sample densities as weldifferent widths of the diffraction peaks. The samples dcussed above exhibited some of the broadest peaks thatdetected reliably. Samples with significantly broader diffration peaks, even if successfully prepared, would be undetable in our experiments because of large experimental err
Samples with narrower peaks were, on the other hafrequently obtained. Figure 5 demonstrates, for example,neon samples with diffraction peaks 2 times as narrow asone in Fig. 4 were observed. This corresponds to the ncluster size roughly twice as large as that obtained fromdata of Fig. 4. We conclude that large variations of the prelent cluster size can be achieved by varying preparation cditions.
The x-ray techniques employed in this work are not ato identify very small clusters or single atoms and molecuin the Im–He solids. Magnetic resonance methods now bedeveloped at Cornell are expected to provide complemeninformation on these very small units.
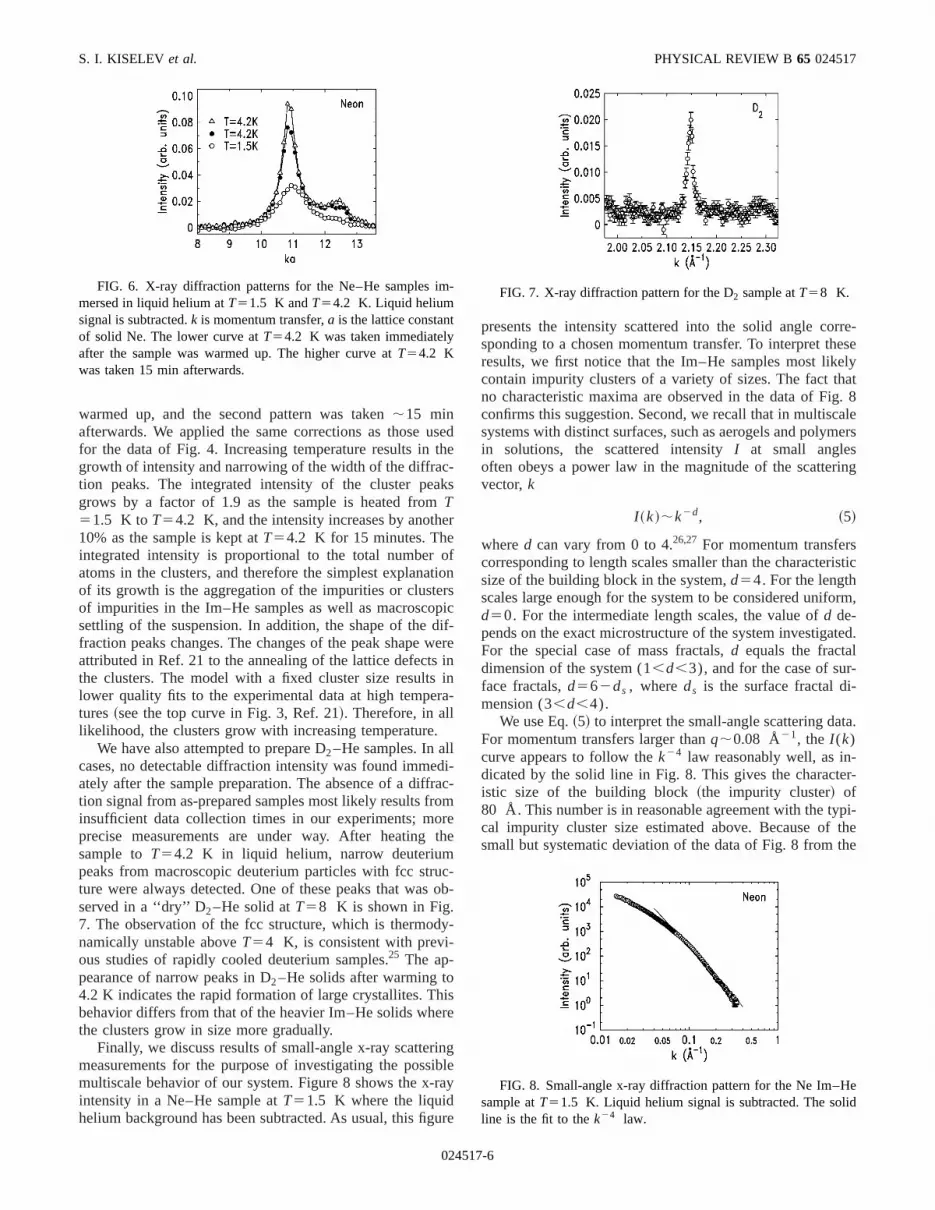
Raising the temperature of the sample also results in sstantial changes in the sample structure. Figure 6 shx-ray diffraction patterns for a Ne–He sample atT51.5 K,and subsequent patterns taken atT54.2 K. The first patternat T54.2 K was taken immediately after the sample w
FIG. 5. X-ray diffraction pattern for the different Ne–Hsamples after preparation in liquid helium atT51.5 K. Liquid he-lium signal is subtracted.
7-5
usthc-ak
e
otirpdiwii
ra
.
draomret
uco
dy
isre
inibra
gu
rre-ese
elyat. 8aleers
ing
istic
rm,
ted.
-
ta.
er-
pi-thehe
m-
t
eid
S. I. KISELEV et al. PHYSICAL REVIEW B 65 024517
warmed up, and the second pattern was taken;15 minafterwards. We applied the same corrections as thosefor the data of Fig. 4. Increasing temperature results ingrowth of intensity and narrowing of the width of the diffration peaks. The integrated intensity of the cluster pegrows by a factor of 1.9 as the sample is heated fromT51.5 K toT54.2 K, and the intensity increases by anoth10% as the sample is kept atT54.2 K for 15 minutes. Theintegrated intensity is proportional to the total numberatoms in the clusters, and therefore the simplest explanaof its growth is the aggregation of the impurities or clusteof impurities in the Im–He samples as well as macroscosettling of the suspension. In addition, the shape of thefraction peaks changes. The changes of the peak shapeattributed in Ref. 21 to the annealing of the lattice defectsthe clusters. The model with a fixed cluster size resultslower quality fits to the experimental data at high tempetures~see the top curve in Fig. 3, Ref. 21!. Therefore, in alllikelihood, the clusters grow with increasing temperature
We have also attempted to prepare D2–He samples. In allcases, no detectable diffraction intensity was found immeately after the sample preparation. The absence of a difftion signal from as-prepared samples most likely results frinsufficient data collection times in our experiments; moprecise measurements are under way. After heatingsample toT54.2 K in liquid helium, narrow deuteriumpeaks from macroscopic deuterium particles with fcc strture were always detected. One of these peaks that wasserved in a ‘‘dry’’ D2–He solid atT58 K is shown in Fig.7. The observation of the fcc structure, which is thermonamically unstable aboveT54 K, is consistent with previ-ous studies of rapidly cooled deuterium samples.25 The ap-pearance of narrow peaks in D2–He solids after warming to4.2 K indicates the rapid formation of large crystallites. Thbehavior differs from that of the heavier Im–He solids whethe clusters grow in size more gradually.
Finally, we discuss results of small-angle x-ray scattermeasurements for the purpose of investigating the possmultiscale behavior of our system. Figure 8 shows the x-intensity in a Ne–He sample atT51.5 K where the liquidhelium background has been subtracted. As usual, this fi
FIG. 6. X-ray diffraction patterns for the Ne–He samples imersed in liquid helium atT51.5 K andT54.2 K. Liquid heliumsignal is subtracted.k is momentum transfer,a is the lattice constanof solid Ne. The lower curve atT54.2 K was taken immediatelyafter the sample was warmed up. The higher curve atT54.2 Kwas taken 15 min afterwards.
02451
ede
s
r
fonsicf-erenn-
i-c-
he
-b-
-
gley
re
presents the intensity scattered into the solid angle cosponding to a chosen momentum transfer. To interpret thresults, we first notice that the Im–He samples most likcontain impurity clusters of a variety of sizes. The fact thno characteristic maxima are observed in the data of Figconfirms this suggestion. Second, we recall that in multiscsystems with distinct surfaces, such as aerogels and polymin solutions, the scattered intensityI at small anglesoften obeys a power law in the magnitude of the scattervector,k
I ~k!;k2d, ~5!
whered can vary from 0 to 4.26,27 For momentum transferscorresponding to length scales smaller than the charactersize of the building block in the system,d54. For the lengthscales large enough for the system to be considered unifod50. For the intermediate length scales, the value ofd de-pends on the exact microstructure of the system investigaFor the special case of mass fractals,d equals the fractaldimension of the system (1,d,3), and for the case of surface fractals,d562ds , whereds is the surface fractal di-mension (3,d,4).
We use Eq.~5! to interpret the small-angle scattering daFor momentum transfers larger thanq;0.08 Å21, the I (k)curve appears to follow thek24 law reasonably well, as in-dicated by the solid line in Fig. 8. This gives the charactistic size of the building block~the impurity cluster! of80 Å. This number is in reasonable agreement with the tycal impurity cluster size estimated above. Because ofsmall but systematic deviation of the data of Fig. 8 from t
FIG. 7. X-ray diffraction pattern for the D2 sample atT58 K.
FIG. 8. Small-angle x-ray diffraction pattern for the Ne Im–Hsample atT51.5 K. Liquid helium signal is subtracted. The solline is the fit to thek24 law.
7-6
erinnis
alenta
nthge
c
thin.
aplinanns
anp
sud
tsib
re
-
m
H
no
idsthi-reninrg
inpe-
ar-ngor ofesethei-
heickhiscles
byesityndus
lid.ar-byceidstheestol-
ol-srs
redWe
m
STRUCTURAL STUDIES OF IMPURITY-HELIUM SOLIDS PHYSICAL REVIEW B65 024517
k24 law, it is difficult to determine the exact crossovpoint, and therefore the error of the estimate of the buildblock size from the small-angle data is probably significa
Another important feature of the data shown in Fig. 8the absence of saturation (d50 regime! at small values ofk.This means that the system is not uniform up to length scof 400 Å, and therefore pores larger than 400 Å are presin the system.27 ~We can exclude the presence of a significafraction of impurity clusters of such a large size from dacollected at larger momentum transfers, see Fig. 6.! In theintermediate regime (0.015,k,0.08), it is tempting to fitthe data to Eq.~5! and try to extract the fractal dimensiocharacteristic to our Im–He samples. We note, however,the range ofk accessible in our experiments is not larenough to make a meaningful estimate ofd. We leave, there-fore, the question of whether our samples possess a frastructure as a subject of future work.
In summary, the x-ray data described above suggestthe microstructure of the Im–He samples consists of buildblocks ~impurity clusters! with a distribution of block sizesThe typical building block size in the Ne and N2 Im–Hesamples is 50–60 Å. Clusters significantly larger th100 Å are not present in as-prepared samples. The samhowever, contain a pore distribution from 80 Å to 400 Ådiameter, or even larger. Samples with different densitiesdifferent typical block sizes can be grown under differepreparation conditions. In particular, Ne clusters with sizetimes larger than those described above can be grown. Wincreasing temperature, the density of the Ne–HeN2–He samples grows because of the aggregation of imrities as well as because of macroscopic settling of thepension. The cluster size grows and the cluster structurefects anneal as the temperature increases. These resulfurther confirmed by the ultrasound measurements descrin the next section.
B. Ultrasound data and interpretation
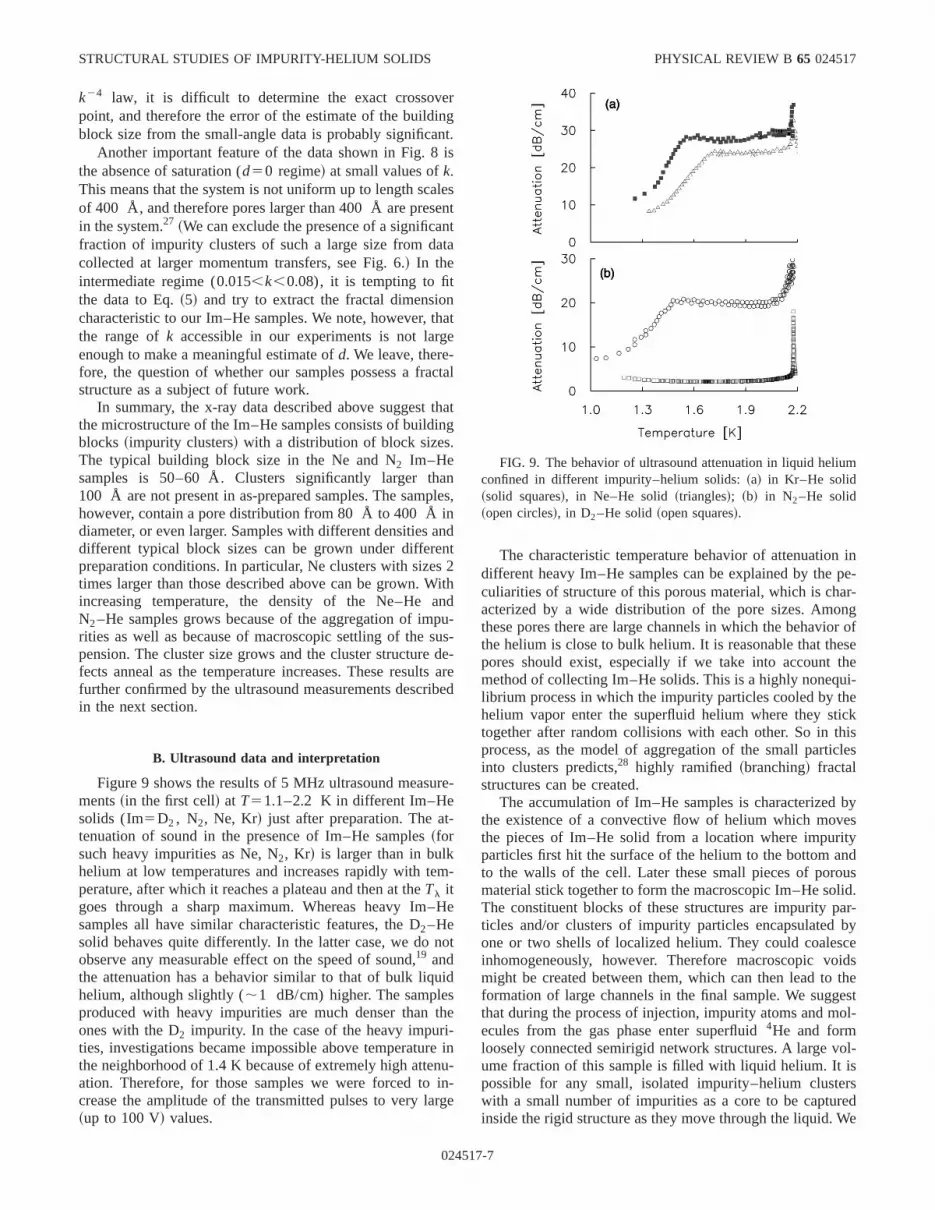
Figure 9 shows the results of 5 MHz ultrasound measuments~in the first cell! at T51.1–2.2 K in different Im–Hesolids (Im5D2, N2, Ne, Kr! just after preparation. The attenuation of sound in the presence of Im–He samples~forsuch heavy impurities as Ne, N2, Kr! is larger than in bulkhelium at low temperatures and increases rapidly with teperature, after which it reaches a plateau and then at theTl itgoes through a sharp maximum. Whereas heavy Im–samples all have similar characteristic features, the D2–Hesolid behaves quite differently. In the latter case, we doobserve any measurable effect on the speed of sound,19 andthe attenuation has a behavior similar to that of bulk liquhelium, although slightly (;1 dB/cm) higher. The sampleproduced with heavy impurities are much denser thanones with the D2 impurity. In the case of the heavy impurties, investigations became impossible above temperatuthe neighborhood of 1.4 K because of extremely high atteation. Therefore, for those samples we were forced tocrease the amplitude of the transmitted pulses to very la~up to 100 V! values.
02451
gt.
esntt
at
tal
atg
nes,
dt2ithdu-s-e-are
ed
-
-
e
t
e
inu--e
The characteristic temperature behavior of attenuationdifferent heavy Im–He samples can be explained by theculiarities of structure of this porous material, which is chacterized by a wide distribution of the pore sizes. Amothese pores there are large channels in which the behavithe helium is close to bulk helium. It is reasonable that thpores should exist, especially if we take into accountmethod of collecting Im–He solids. This is a highly nonequlibrium process in which the impurity particles cooled by thelium vapor enter the superfluid helium where they sttogether after random collisions with each other. So in tprocess, as the model of aggregation of the small partiinto clusters predicts,28 highly ramified ~branching! fractalstructures can be created.
The accumulation of Im–He samples is characterizedthe existence of a convective flow of helium which movthe pieces of Im–He solid from a location where impurparticles first hit the surface of the helium to the bottom ato the walls of the cell. Later these small pieces of poromaterial stick together to form the macroscopic Im–He soThe constituent blocks of these structures are impurity pticles and/or clusters of impurity particles encapsulatedone or two shells of localized helium. They could coalesinhomogeneously, however. Therefore macroscopic vomight be created between them, which can then lead toformation of large channels in the final sample. We suggthat during the process of injection, impurity atoms and mecules from the gas phase enter superfluid4He and formloosely connected semirigid network structures. A large vume fraction of this sample is filled with liquid helium. It ipossible for any small, isolated impurity–helium clustewith a small number of impurities as a core to be captuinside the rigid structure as they move through the liquid.
FIG. 9. The behavior of ultrasound attenuation in liquid heliuconfined in different impurity–helium solids:~a! in Kr–He solid~solid squares!, in Ne–He solid~triangles!; ~b! in N2–He solid~open circles!, in D2–He solid~open squares!.
7-7
esas
ticro
un-ri-i
nal
iso
ar
heeoa
le
ddn
Horsththartglltbt
shehellethto
ent
em
tio
le
mfromhecanaseoutenotthe
at--e-
theord-dre
rgewill
r a
nce
e-
See
n
S. I. KISELEV et al. PHYSICAL REVIEW B 65 024517
should notice that this Im–He solid preserves its form unlremoved from the liquid helium. In this latter case it hbeen observed visually to compress by up to 60%.9
The motion of a fluid in a porous medium during acousmeasurements depends on the pore size and the fluid’s perties. Biot created the basic theoretical framework for sopropagation in porous materials.29 It was successfully applied to ultrasound experiments in superfluid helium in vaous porous media,18 including light aerogel. The main parameter used to describe the behavior of sound in liquidporous materials is the viscous penetration depth
dvisc5~2h/vrn!1/2, ~6!
where h is the viscosity of 4He, rn is the density of thenormal component, andv is the frequency of ultrasound. Isuperfluid helium the normal fluid fraction changes frommost zero to one between 1.0 K and 2.17 K, causingdvisc tochange from 1500 nm to 100 nm for 5 MHz sound. Thallows us to give a qualitative explanation of the behaviorthe attenuation of sound in Im–He samples, whichthought to be similar to very porous aerogels.
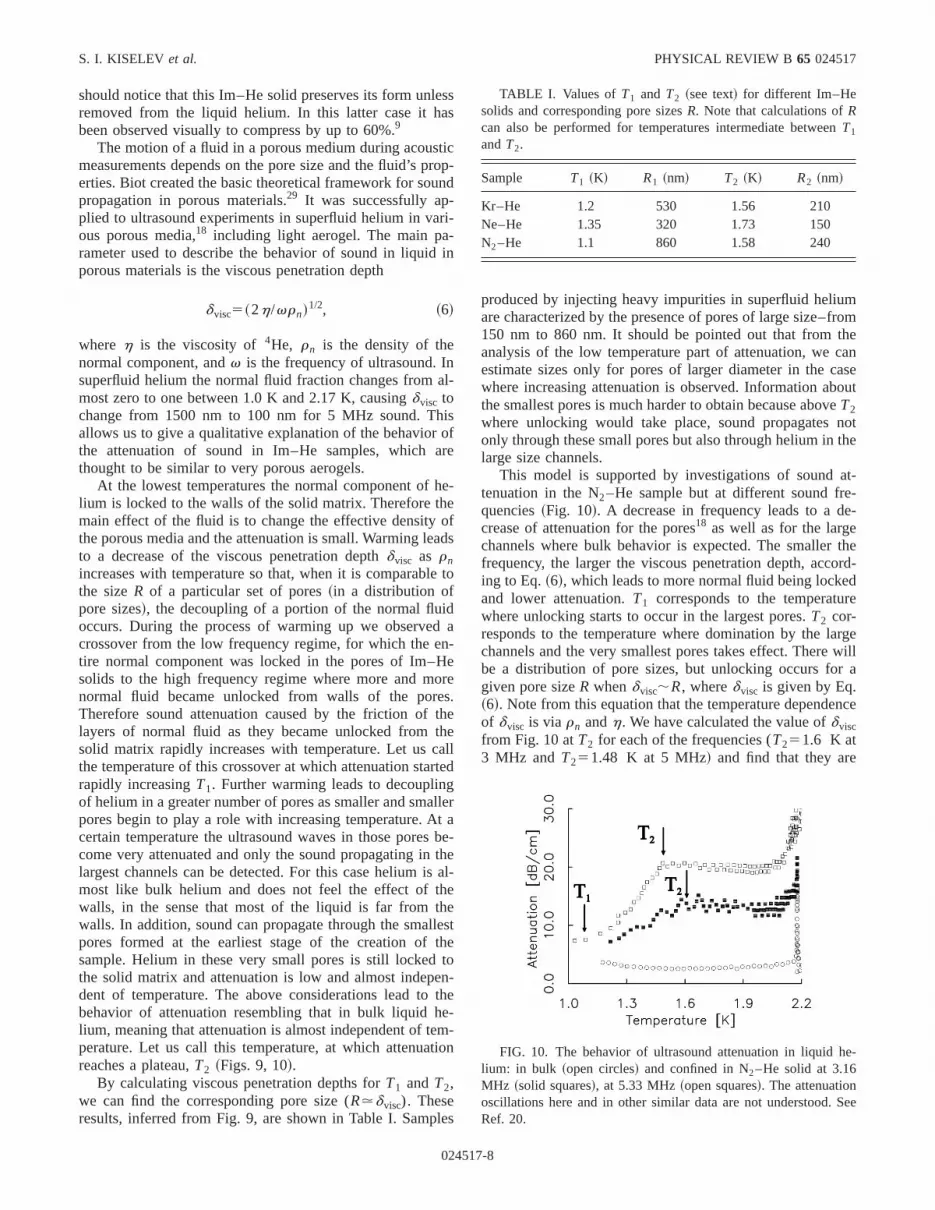
At the lowest temperatures the normal component oflium is locked to the walls of the solid matrix. Therefore thmain effect of the fluid is to change the effective densitythe porous media and the attenuation is small. Warming leto a decrease of the viscous penetration depthdvisc as rnincreases with temperature so that, when it is comparabthe sizeR of a particular set of pores~in a distribution ofpore sizes!, the decoupling of a portion of the normal fluioccurs. During the process of warming up we observecrossover from the low frequency regime, for which the etire normal component was locked in the pores of Im–solids to the high frequency regime where more and mnormal fluid became unlocked from walls of the poreTherefore sound attenuation caused by the friction oflayers of normal fluid as they became unlocked fromsolid matrix rapidly increases with temperature. Let us cthe temperature of this crossover at which attenuation starapidly increasingT1. Further warming leads to decouplinof helium in a greater number of pores as smaller and smapores begin to play a role with increasing temperature. Acertain temperature the ultrasound waves in those porescome very attenuated and only the sound propagating inlargest channels can be detected. For this case helium imost like bulk helium and does not feel the effect of twalls, in the sense that most of the liquid is far from twalls. In addition, sound can propagate through the smapores formed at the earliest stage of the creation ofsample. Helium in these very small pores is still lockedthe solid matrix and attenuation is low and almost indepdent of temperature. The above considerations lead tobehavior of attenuation resembling that in bulk liquid hlium, meaning that attenuation is almost independent of teperature. Let us call this temperature, at which attenuareaches a plateau,T2 ~Figs. 9, 10!.
By calculating viscous penetration depths forT1 andT2,we can find the corresponding pore size (R.dvisc). Theseresults, inferred from Fig. 9, are shown in Table I. Samp
02451
s
p-d
-
n
-
fe
-
fds
to
a-ee.eelled
erae-
heal-
ste
-he--n
s
produced by injecting heavy impurities in superfluid heliuare characterized by the presence of pores of large size–150 nm to 860 nm. It should be pointed out that from tanalysis of the low temperature part of attenuation, weestimate sizes only for pores of larger diameter in the cwhere increasing attenuation is observed. Information abthe smallest pores is much harder to obtain because abovT2where unlocking would take place, sound propagatesonly through these small pores but also through helium inlarge size channels.
This model is supported by investigations of soundtenuation in the N2–He sample but at different sound frequencies~Fig. 10!. A decrease in frequency leads to a dcrease of attenuation for the pores18 as well as for the largechannels where bulk behavior is expected. The smallerfrequency, the larger the viscous penetration depth, accing to Eq.~6!, which leads to more normal fluid being lockeand lower attenuation.T1 corresponds to the temperatuwhere unlocking starts to occur in the largest pores.T2 cor-responds to the temperature where domination by the lachannels and the very smallest pores takes effect. Therebe a distribution of pore sizes, but unlocking occurs fogiven pore sizeR whendvisc;R, wheredvisc is given by Eq.~6!. Note from this equation that the temperature dependeof dvisc is via rn andh. We have calculated the value ofdviscfrom Fig. 10 atT2 for each of the frequencies (T251.6 K at3 MHz andT251.48 K at 5 MHz! and find that they are
FIG. 10. The behavior of ultrasound attenuation in liquid hlium: in bulk ~open circles! and confined in N2–He solid at 3.16MHz ~solid squares!, at 5.33 MHz~open squares!. The attenuationoscillations here and in other similar data are not understood.Ref. 20.
TABLE I. Values of T1 and T2 ~see text! for different Im–Hesolids and corresponding pore sizesR. Note that calculations ofRcan also be performed for temperatures intermediate betweeT1
andT2.
Sample T1 ~K! R1 ~nm! T2 ~K! R2 ~nm!
Kr–He 1.2 530 1.56 210Ne–He 1.35 320 1.73 150N2–He 1.1 860 1.58 240
7-8
ern
at.
ieasuio
ussuheprethasoste
rute
rsb
iu
z-ron
a0l-
n-th
rauom
a
nys tofter
e asons
hdDtionrm-
s-
re-
at ofeenofof
s toofby
STRUCTURAL STUDIES OF IMPURITY-HELIUM SOLIDS PHYSICAL REVIEW B65 024517
both equal to 240 nm. Note that for a given value ofR;dvisc, T2 will occur at a higher temperature for the lowfrequency~3 MHz! as can be seen by equating the right-hasides of Eq.~6! for the two frequencies. Note thatT2 for theultrasound data at 3 MHz is slightly obscured by smalltenuation oscillations, which are not presently understoodsimilar comparison was not possible for the case ofT1 be-causeT1 is not well defined in the 3 MHz data.
Im–He samples formed in our experiments have a varof different ratios between the volumes of the porous pand the large channels. Compressing these samples leaddecrease in the volume of the large channels, which in tincreases the attenuation, as was detected in prevexperiments.19
Analysis of sound propagation in Im–He solids thshows a distribution of the sizes of channels containingperfluid helium, including very large channels, in which thelium behavior is close to that of bulk helium. The aproach used above can only give information about the pence of relatively large pores with size comparable toviscous penetration depth at temperatures between 1.12.17 K. In order to obtain information about the smallepores in which normal helium is locked to the surfaceIm–He solid through most of the temperature range invegated, we determined the width of the attenuation peak nthel point. This attenuation peak corresponds to the desttion of superfluidity in the smallest pores in the immedianeighborhood of thel point. The onset of this peak occuwhen the correlation length in helium becomes comparato the pore size. Josephson’s relation30 for helium gives thetemperature dependence of the correlation length in helnearTl :
j~ t !5j0utu2z5kBTcm
2
\2rs~ t !, ~7!
wherem, kB , and\ are the mass of a helium atom, Boltmann’s constant and Planck’s constant, respectively. FFig. 9 we can say that the onset of broadening of the atteation peak for the N2–He sample studied is atT.2.1 K,which gives the characteristic size of the pores from thegument above as;80 Å. This is reasonably close to 5620 Å, the size of the clusters from which our Im–He soids are built, as obtained from x-ray studies.
Under certain favorable circumstances we were ableproduce D2–N2–He samples without any of the large chanels and in this case we did not observe the plateau intemperature dependence of the attenuation.20 We are plan-ning further investigations of this phenomenon.
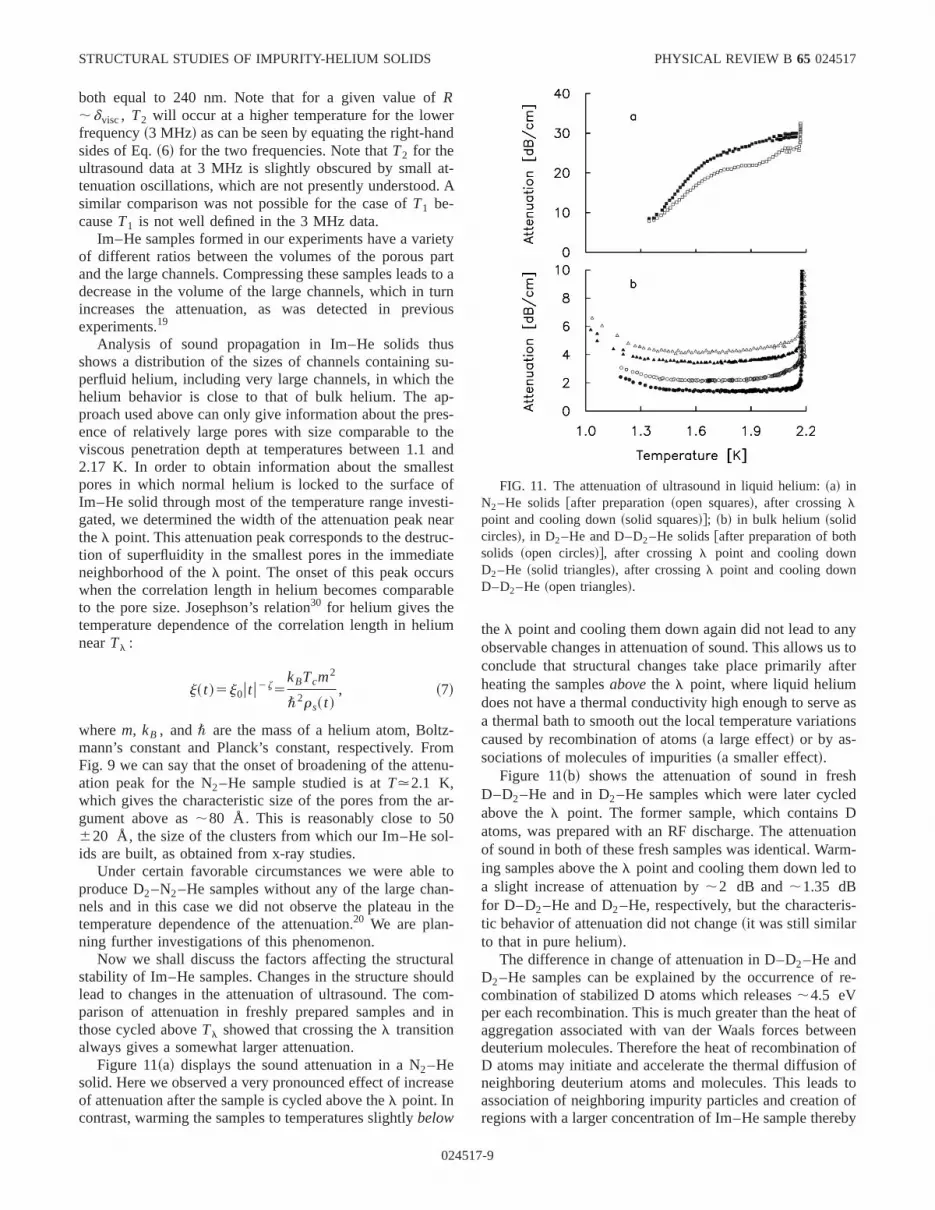
Now we shall discuss the factors affecting the structustability of Im–He samples. Changes in the structure sholead to changes in the attenuation of ultrasound. The cparison of attenuation in freshly prepared samples andthose cycled aboveTl showed that crossing thel transitionalways gives a somewhat larger attenuation.
Figure 11~a! displays the sound attenuation in a N2–Hesolid. Here we observed a very pronounced effect of increof attenuation after the sample is cycled above thel point. Incontrast, warming the samples to temperatures slightlybelow
02451
d
-A
tyrtto arnus
-
-s-endtfi-arc-
le
m
mu-
r-
to
e
lld
-in
se
thel point and cooling them down again did not lead to aobservable changes in attenuation of sound. This allows uconclude that structural changes take place primarily aheating the samplesabovethe l point, where liquid heliumdoes not have a thermal conductivity high enough to serva thermal bath to smooth out the local temperature variaticaused by recombination of atoms~a large effect! or by as-sociations of molecules of impurities~a smaller effect!.
Figure 11~b! shows the attenuation of sound in fresD–D2–He and in D2–He samples which were later cycleabove thel point. The former sample, which containsatoms, was prepared with an RF discharge. The attenuaof sound in both of these fresh samples was identical. Waing samples above thel point and cooling them down led toa slight increase of attenuation by;2 dB and;1.35 dBfor D–D2–He and D2–He, respectively, but the characteritic behavior of attenuation did not change~it was still similarto that in pure helium!.
The difference in change of attenuation in D–D2–He andD2–He samples can be explained by the occurrence ofcombination of stabilized D atoms which releases;4.5 eVper each recombination. This is much greater than the heaggregation associated with van der Waals forces betwdeuterium molecules. Therefore the heat of recombinationD atoms may initiate and accelerate the thermal diffusionneighboring deuterium atoms and molecules. This leadassociation of neighboring impurity particles and creationregions with a larger concentration of Im–He sample there
FIG. 11. The attenuation of ultrasound in liquid helium:~a! inN2–He solids@after preparation~open squares!, after crossinglpoint and cooling down~solid squares!#; ~b! in bulk helium ~solidcircles!, in D2–He and D–D2–He solids@after preparation of bothsolids ~open circles!#, after crossingl point and cooling downD2–He ~solid triangles!, after crossingl point and cooling downD–D2–He ~open triangles!.
7-9

e
aexin
t oreu
tioivo
de
io
aninll
dthlk
hith
io
afo-anth
th
rot
thunntin
ar
e
smolm
tiondsd tors
withtheine
uc-ndnd-
orersnd.bledn-toison
diessisentu-0m-arecat-rom
ofm-
S. I. KISELEV et al. PHYSICAL REVIEW B 65 024517
leading to increased attenuation. This is similar to the effobserved in the heavier Im–He solids.
The difference of the characteristic behavior of soundtenuation in D2–He and heavier Im–He samples can beplained by the difference in rigidity of these samples. Onlythe case of heavier impurities is it possible, as a resullarger Im–Im and Im–He van der Waals interactions, to cate a rather rigid, although still somewhat compliant, porostructure. That is why we observe the additional attenuadue to sloshing of the normal component of helium relatto the normal helium viscously clamped to the semirigid prous network. In the case of deuterium impurities, vanWaals forces associated with the D2–D2 and D2–He interac-tions are much smaller and closer to the He–He interactAs a result very compliant D2–He solids can be formed inthe superfluid helium. In fact, zero point energy plays a mjor role in determining the properties of Im–He solids cotaining the lightest impurities. Hence these Im–He solidsvolving light impurities are quantum solids. The smaincrease of sound attenuation in D2–He samples comparewith bulk helium can be explained by an increase ineffective density of the medium compared with pure buhelium. But there is no clear evidence of viscous lossesthe surface layers of liquid helium in the sample pores in tcase, as opposed to results in the Im–He solids involvingheavier impurities.
Finally, we consider the behavior of the sound attenuatin helium in Im–He solids near thel point. The results ofmeasurements of attenuation near theTl for Im–He samples(Im5Ne, N2, Kr! shows that the maxima of attenuation nethe l point for these samples are much broader thanliquid helium ~see Figs. 9 and 10!, making the precise determination of the position of the maxima impossible. We cconclude from this data that there is no significant shift ofl point for helium-filled porous heavy Im–He solids.
On the other hand, Fig. 12 shows the behavior ofvelocity and attenuation of ultrasound~only 5 MHz data ispresented! in the mixed D2–N2–He solids. The width of at-tenuation peak nearl point is only slightly broader than fopure helium. That makes it possible to determine the mprecise position of the center of the peak. It appears thatshift of peak with respect to bulk helium is;0.2 mK, but atthe same time the reproducibility of the measurements ofsound attenuation maximum in liquid helium from run to ris about;0.1 mK. Therefore based on these experimewe can say that the shift in the onset of superfluidyD2–N2–He solids is on the order of 0.2 mK, which is similto that for a very light aerogel (;0.3 mK in 0.5% densesilica arogel15!. Note that Fig. 12 reflects the fact that thattenuation peak in bulk helium is;0.08 mK below thelpoint.31
IV. DISCUSSION AND CONCLUSION.
Im–He solids have opened up a variety of intriguing posibilities for experimental investigations of the quantuproperties of helium, as well as for studying atoms, mecules and small clusters stabilized in solidified heliu
02451
ct
t--
f-sn
e-r
n.
---
e
inse
n
rr
e
e
rehe
e
s
-
-.
These studies provide a new perspective for matrix isolain solidified helium. The big advantage of the Im–He soliis that a large variety of atoms or molecules can be usebuild the ‘‘backbone’’ of the Im–He samples. It also appeathat, depending on the preparation conditions, samplesdifferent nanostructures can be prepared. To understandproperties of the Im–He samples it is necessary to determtheir microscopic structure.
In the present work, we have been investigating the strture of the porous Im–He solids by means of ultrasoupropagation through liquid helium contained in the pores avia x-ray diffraction studies. Upon the introduction of impurity particles in superfluid helium the single impuritiessmall clusters of impurities surrounded by a couple of layof localized helium play a dominant role. The early ESR aoptical spectroscopy data7,10 are consistent with this ideaThese small Im–He clusters are believed to be asseminto a highly porous structure consisting of clumps conected by strands. If the impurity clusters are very closeone another, then a fairly rigid structure might exist. Thporous structure would then have some features in commwith aerogel, which has been extensively used in the stuof superfluid helium in constricted geometries. Our analyof the x-ray and ultrasound data in this work is consistwith the above description. We found that the heavier imprities ~Ne, N2, Kr! tend to create clusters of order 5620 Å to form mesoporous material with an estimated ipurity density;1020 cm23. In our ultrasound experimentswide distribution of the pore sizes from 80 to 8600 Å weobserved. This data was confirmed by small-angle x-ray stering, where we established the presence of the pores f80 Å to .400 Å.
Irreversible changes in attenuation upon heatingIm–He samples and in diffraction patterns during the war
FIG. 12. The behavior of attenuation~a! and velocity ~b! ofultrasound in liquid helium nearl point: in bulk ~open circles!, inD2–N2–He solid ~open triangles!. For the D2– N2–He solid theattenuation is shifted up by 10 dB/cm.
7-10

eureisp
icahral
ti-
rib-, au-de
attimewn
ryina-con-slyee
ereoryofal
per
rlyatex-lsope-
ng
tot ofofof
en-vsing
h.P.
00er,eful
um
atum
n
STRUCTURAL STUDIES OF IMPURITY-HELIUM SOLIDS PHYSICAL REVIEW B65 024517
ing above Tl are attributed to thermal diffusion: As thsamples warm, thermal diffusion of helium atoms in the srounding coatings and of the impurities themselves speup. The impurity clusters slowly grow in size. This effectenhanced by release of the heat of aggregation of the imrity clusters. This effect has also been studied by optspectroscopy belowTl .10 A dramatic increase in the growtrate of the impurity clusters is expected to occur for tempetures above the superfluid transitionTl because the therma
FIG. 13. The model of Im–He solid formation:~A!. On forma-tion, the impurities are mainly isolated from one another by heliatoms in the solid~black circles!. Superfluid liquid helium con-tained in the pores~gray circles! transports heat efficiently.~B! Asthe sample is warmed up, diffusion allows impurities to aggregslowly. The associated heat is carried away by superfluid heli~C!. As the sample is warmed above theTl , the diffusion rateincreases. Larger aggregates form. The heat of aggregation calonger be carried away by liquid helium forT.Tl . More diffusiontakes place and even larger aggregates form.
02451
-ds
u-l
-
conductivity of liquid helium in the pores becomes dramacally smaller as the sample is heated throughTl . Thus theheat of aggregation can lead to local hot spots which contute to higher diffusion rates in these localized regionssituation which is favorable to the formation of larger imprity clusters. It is therefore to be expected from this crumodel that heating the sample aboveTl and then coolingback would lead to irreversible behavior. This is exactly whhas been observed in the present work. The expectedevolution according to this model for a sample is shoschematically in Fig. 13.
For the case of atomic free radical impurities, the velarge amount of heat released during molecular recombtion enhances the effects described above. For very highcentrations of free radicals, the sample will spontaneouexplode. Theoretical studies of the stability of atomic frradicals~such as N atoms! in a molecular solid (N2) werereviewed by Jackson many years ago.32 A static statisticaltheory showed that radical concentrations up to 10% wpossible. On the other hand, a dynamical statistical theinvolving chain reactions gave maximum concentrationsN in solid N2 of less than 0.1%. Further analysis of thermstability of small specimens~size ,1 mm) of molecularnitrogen which contain trapped nitrogen atoms gave an uplimit of 1% for concentration of N atoms.33 The Im–He sol-ids greatly exceed this latter limit, as mentioned above.
The importance of this work is that it shows quite cleathe necessity of maintaining the impurity–helium solidstemperatures below the lambda temperature to preventcessive recombination for the free radical impurities and ato prevent structural changes in all samples. This is escially significant for purposes of any applications requirienergy storage.
The work described herein provides new opportunitiesexplore various types of interesting behavior for a new seporous materials. For example, the superfluid transitionhelium can be studied within the constrained geometriesthe impurity–helium solids. We observed a definite broading in the l peak in measurements of sound attenuationtemperature. This broadening increases with increassample density. A small shift of thel transition temperature(DT;0.2 mK) was first noted for D2–N2–He samples.
ACKNOWLEDGMENTS
We would like to thank NASA for its support througgrant NAG 8-1445. This work was also supported by ASloan Foundation~V.K.!, RFBR grant 99-03-33261~R.E.B.!and Leading Scientific Group Support grant 00-15-974~E.B.G.!. We also wish to thank John Beamish, Drew GellGavin Lawes, Jeevak Parpia, and John Reppy for very ussuggestions and discussions.
e.
no
y,
1B. Tabbert, H. Gunter, and G. zu Putlits, J. Low Temp. Phys.109,653 ~1997!.
2J.P. Toennies and A.F. Vilesov, Annu. Rev. Phys. Chem.49, 1~1998!.
3S.I. Kanorsky and A. Weis, Adv. At., Mol., Opt. Phys.38, 87~1998!.
4E.B. Gordon, A.F. Shestakov, Low Temp. Phys.26, 1 ~2000!.5Y. Kwon, P. Huang, M.V. Patel, D. Blume, and K.B. Whale
7-11

el
nd
.F
vow
a,ta
o,p.
l-
u
an
d
s.
V.
p.
,
.V.
S. I. KISELEV et al. PHYSICAL REVIEW B 65 024517
Chem. Phys.113, 6469 ~2000!; Y. Kwon, D.M. Ceperley, andK.B. Whaley, ibid. 104, 2341 ~1996!; F. Dalfovo, Z. Phys. D:At., Mol. Clusters29, 61 ~1994!.
6E.B. Gordon, A.A. Pelmenev, O.F. Pugachev, and V.V. Khmenko, JETP Lett.37, 282 ~1983!.
7E.B. Gordon, V.V. Khmelenko, E.A. Popov, A.A. Pelmenev, aO.F. Pugachev, Chem. Phys. Lett.155, 301 ~1989!.
8E.B. Gordon, V.V. Khmelenko, A.A. Pelmenev, E.A. Popov, OPugachev, and A.F. Shestakov, Chem. Phys.170, 411 ~1993!.
9R.E. Boltnev, E.B. Gordon, I.N. Krushinskaya, A.A. PelmeneE.A. Popov, O.F. Pugachev, and V.V. Khmelenko, Sov. J. LTemp. Phys.18, 576 ~1992!.
10R.E. Boltnev, E.B. Gordon, V.V. Khmelenko, I.N. KrushinskayM.V. Martynenko, A.A. Pelmenev, E.A. Popov, and A.F. Sheskov, Chem. Phys.189, 367 ~1994!.
11R.E. Boltnev, E.B. Gordon, I.N. Krushinskaya, M.V. MartynenkA.A. Pelmenev, E.A. Popov, and V.V. Khmelenko, Low TemPhys.23, 567 ~1997!.
12R.E. Boltnev, I.N. Krushinskaya, A.A. Pelmenev, D.Yu. Stoyarov, and V.V. Khmelenko, Chem. Phys. Lett.305, 217~1999!.
13B. Palaszewski, L.S. Ianovski, and Patrick Carrik, J. PropPower14, 641 ~1998!.
14J.D. Reppy, J. Low Temp. Phys.87, 205 ~1992!; L.S. Goldner,N. Mulders, and G. Ahlers,ibid. 93, 131 ~1993!.
15J. Yoon, D. Sergatskov, J. Ma, N. Mulders, and M.H.W. ChPhys. Rev. Lett.80, 1461~1998!.
16K.L. Warner and J.R. Beamish, Phys. Rev. B36, 5698~1987!.17N. Mulders and J.R. Beamish, Phys. Rev. Lett.62, 438 ~1989!.18K. Warner and J.R. Beamish, Phys. Rev. B50, 15 896~1994!.
02451
-
.
,
-
l.
,
19S.I. Kiselev, V.V. Khmelenko, D.A. Geller, J.R. Beamish, anD.M. Lee, J. Low Temp. Phys.119, 357 ~2000!.
20S.I. Kiselev, V.V. Khmelenko, and D.M. Lee, Low Temp. Phy26, 641 ~2000!.
21V. Kiryukhin, B. Keimer, R.E. Boltnev, V.V. Khmelenko, andE.B. Gordon, Phys. Rev. Lett.79, 1774~1997!.
22G. Torchet, J. Farges, M. F. de Feraudy, and B. Raoult, inTheChemical Physics of Atomic and Molecular Clusters, edited byG. Scoles~North-Holland, New York, 1990!, pp. 513–542.
23S.I. Kovalenko, D.D. Solnyshkin, E.T. Verkhovtseva, and V.Eremenko, Chem. Phys. Lett.250, 309 ~1996!.
24B.E. Warren,X-ray Diffraction ~Addison-Wesley, Reading, MA,1969!.
25J.L. Yarnell, R.L. Mills, and A.F. Schouch, Sov. J. Low TemPhys.1, 366 ~1975!.
26D.W. Schaefer and K.D. Keefer, Mater. Res. Soc. Symp. Proc.32,1 ~1984!. H.D. Bale, and P.W. Schmidt, Phys. Rev. Lett.53, 596~1984!.
27D.W. Schaefer and K.D. Keefer, Phys. Rev. Lett.56, 2199~1986!.28P. Meakin, Annu. Rev. Phys. Chem.39, 237 ~1988!.29M.A. Biot, J. Am. Chem. Soc.28, 168 ~1956!; 28, 179 ~1956!.30B.D. Josephson, Phys. Lett.21, 608 ~1966!.31C.E. Chase, Phys. Fluids1, 3 ~1958!.32J.L. Jackson,Formation and Trapping of Free Radicals, edited by
A.M. Bass, and H.P. Broida~Academic, New York and London1960!, p. 327.
33E.B. Gordon, L.P. Mezhov-Deglin, O.F. Pugachev, and VKhmelenko, Sov. Phys. JETP46, 502 ~1977!.
7-12


![Quantum Monte Carlo study of the H[sup −] impurity in small helium clusters](https://img.dokumen.tips/doc/110x75/634990351425b1cb71069642/quantum-monte-carlo-study-of-the-hsup-impurity-in-small-helium-clusters.jpg)