Embed Size (px)
Citation preview

Structural modelling and monitoring of corrosion Antonio BOSSIO Ph.D., Dept. of Materials and Production Engineering, University of Naples “Federico II”, Italy Mario MONTUORI Post doc researcher, Dept. of Materials and Production Engineering, University of Naples “Federico II”, Italy Francesco BELLUCCI Full Professor, Dept. of Materials and Production Engineering, University of Naples “Federico II”, Italy Gian Piero LIGNOLA Assistant Professor, Dept. of Structural Engineering, University of Naples “Federico II”, Italy Andrea PROTA Associate Professor, Dept. of Structural Engineering, University of Naples “Federico II”, Italy Edoardo COSENZA Full Professor, Dept. of Structural Engineering, University of Naples “Federico II”, Italy Gaetano MANFREDI Full Professor, Dept. of Structural Engineering, University of Naples “Federico II”, Italy ABSTRACT: Evaluation of RC structures cannot leave aside from adequate structural monitoring, as clearly stated in main international building codes. Internal reinforcement corrosion due to carbonation, chlorides and sulphides attacks is one of the main causes of degradation of RC structures. An adequate monitoring of corrosion process requires minimally invasive non destructive tests (NDT) to evaluate level of degradation reached by the materials composing the structures. This experimental phase should be coupled with specific theoretical models, herein proposed. Present analytical model allows to evaluate the crack initiation, thus to schedule maintenance operations avoiding the appearance of the effects of corrosion, thus leading to obvious economic and programmatic benefits. Conversely, in the case of existing/deficient structures, presenting corrosion effect, the analytical model can be coupled with NDT to estimate the corrosion degree and concrete degradation, for effective safety evaluations. Measurement of corrosion rate and open circuit potential are minimally invasive monitoring techniques, leading to adequate knowledge level to perform structural analyses, including efficiently the effect of corrosion. Keywords: concrete cracks, corrosion, FEM analyses 1. INTRODUCTION Sustainability and durability are main issues of 21st century industries. So it is very important to build durable structures, too. Performing a rehabilitation program, one of the most important issues is to perform a good plan of diagnostic tests. It is important to investigate about structural and electrochemical parameters influencing reinforced concrete structures. To know concrete and reinforcement degradation is important in order to perform a rehabilitation project. The most common analyses focus on feasible loads and static or dynamic behavior of structures. The formulation of a restoration design needs information about the geometry of the structure, the applied loads, the characteristics of the materials and exposure class of the structure. The removal of several samples to be submitted to laboratory destructive tests could solve the problem, but Non Destructive Tests (NDT) techniques can be adopted, because of their easy applicability.
The aim of this work is to correlate external crack widths in Reinforced Concrete (RC) members to bar cross sectional area reduction, focusing on analytical modeling, comparing real concrete member geometry with cylindrical samples, usually adopted during laboratory tests. Corrosion process, leading to oxide volumetric expansion, leads to external cracks. Minimally invasive investigative techniques, such as mapping of bars potential, linear polarization and NDT on concrete deepen the knowledge on structural degradation. The present work aims to correlate such consolidated techniques with analytical novel model, to sharpen evaluation on crack opening due to corrosion process. The paper shows how, starting from external crack width, it is possible to estimate the value of bar section lost due to corrosion and, consequently, the residual value of the load-bearing capacity of the structure. Two different models have been considered. The first one represents Finite Element Method (FEM) results for a

real geometry, while the other one represents a typical “cylindrical sample” single bar test geometry [1], in order to evaluate the possibility to compare experimental geometry (single bar in a concrete cylinder) with real geometry (a corner bar in a rectangular concrete member). Considering the two models, the approaches, based on FEM analysis results, give simple formulations about relationship between external crack widths, wc, and corrosion penetration, x. 2. FEM ANALYSIS To simulate old structures affected by crack opening due to corrosion process, more than 100 FEM analyses were performed considering the variability of concrete cover, cc, bar radius, R0, and concrete Young’s modulus, Ec. A displacement was imposed to concrete along the bar perimeter to simulate oxide expansion and crack opening on external surface of (pre cracked) concrete cover was recorded. FEM analyses have been performed using the TNO DIANA 9.4 code [2]. Concrete is initially assumed elastic in compression and in tension, deformability of steel and oxide is neglected. However, to analyze the effect of concrete non-linear behavior, some analyses focused on the effect of a high level of corrosion of reinforcement inducing a high stress fields, and concrete nonlinearity was also included. Figure 1 shows main geometric parameters investigated by means of FEM analyses in order to simulate single bar “cylindrical model” (fig. 1a) and “rectangular model” considering an external bar (fig. 1b), i.e. close to corners of cross sections.
2.1 Rectangular Model In order to simulate reinforcement bars, more than about 100 FEM analyses were performed. Three different values of bar radius, R0, (namely 5, 8 and 10 mm) and concrete cover, cc, (namely 10, 30 and 50 mm) were considered. Results have been related to be, (distance between bar axis and external surface of concrete) ranging between 35 and 130 mm. Furthermore, in this case, it is implicitly assumed that cc ≤ be, otherwise a crack opening can be expected on the orthogonal side. From a numerical point of view, boundary conditions for the FEM are given by a free edge of the lateral concrete surface. Figures 2a) and 2b) show that the higher are bar diameters, 2∙R0, or the lower are concrete cover, cc, (fig. 2a) then the higher is crack opening. Concrete cracks are usually increasing moving in the outward direction, or in other words, cracks are wider on the external concrete surface than close to the bar. The ratio wc/y was related (fig. 3a) to the distance between bar and external surface of concrete, be, while dependency on concrete cover, cc, (marker shape and color) and bar diameter, 2 ∙ R0, (marker size) was negligible and there was no dependency on Young’s modulus of concrete, Ec. An analytical correlation has been found grouping FEM results according to the concrete cover values, cc, (for every considered bar diameter) and plotted in figure 3a. The correlation was found in the form: ⁄ = ∙ (1)
w
bc
c
2R0
e
2R
c
0
wc
a)
yy yy
b)
Fig. 1 geometric parameters of FEM analyses: a) cylindrical model, b) rectangular model.

a) cc=10 mm – R0=5 mm – be=125 mm
b) cc=50 mm – R0=10 mm – be=80 mm
Fig. 2 Rectangular model FEM deformed shape
where both A and B coefficients depend on concrete cover values, cc. A linear interpolation provides satisfactory agreement for A, while logarithmic interpolation provides best results for B (fig. 3b). Fitting curves, considering variability of cc and be, but neglecting R0, can then be expressed by equation (2) as reported in fig 3a: = . ∙ ∙ ∙ . . ∙ ( )
(2)
where, wc : crack width [µm]; y : oxide layer width [µm]; cc : concrete cover [mm] be : crack distance from external concrete [mm]
2.2 Cylindrical model (linear elasticity) FEM analyses have been performed considering a cylindrical model in order to analyze typical laboratory tests results and to correlate them with real RC member behavior. Three different values of bar radius, R0, (namely 5, 8 and 10 mm) and concrete cover, cc, (namely 10, 30 and 50 mm) were considered, too. Crack opening, wc, was related to concrete cover, cc, (fig. 4), (marker shape and color) and bar diameter, 2∙R0, (marker size). In this case the dependency with these two parameters was almost negligible; furthermore there was no dependency again on Young’s modulus of concrete, Ec. Figure 4 shows that bar diameter, 2∙R0, has a negligible effect on crack opening. A correlation between oxide layer thickness in this case of linear cylindrical model, ylin, (thus y has a subscript lin to recall the elasticity behavior of concrete) and crack opening, wc, has been found by using FEM results. A proper linear interpolation is available directly on figure 4, however for the sake of simplicity a constant ratio can be practically used, according to following equation (5): = 8.84 ∙ (3) where, ylin : oxide layer thickness in case of linear FEM analyses [µm]; wc : crack width [µm]; Table 1 shows FEM results in case of rectangular RC member and single bar cylindrical model, considering variability of concrete cover, cc, and bar radius, R0. For comparison purpose, the rectangular RC member has been modeled assuming, according to eq. (2), be equal to cc. This analysis shows that in the case of concrete covers smaller than about 30 mm, the single bar cylindrical model approximates well the behavior of a corner bar in rectangular members having cc = be.
a)
b)
Fig. 3 Rectangular model: a) FEM results and b) fitting curves related to be and cc.
A =(34+3.6cc)/50
1.0
4.5
0 30 60
Coe
ffici
ent A
cc [mm]
B =0.6 -0.39ln(cc)
-1.0
0.00 30 60
Coe
ffic
ient
B
cc [mm]
0.00
0.10
0.20
0.30
0.40
0.50
30 55 80 105 130
(wc/y
)/cc [1
/mm
]
be [mm]
eq. (1-2) cc=10 mm
eq. (1-2) cc=30 mm
eq. (1-2) cc=50 mm
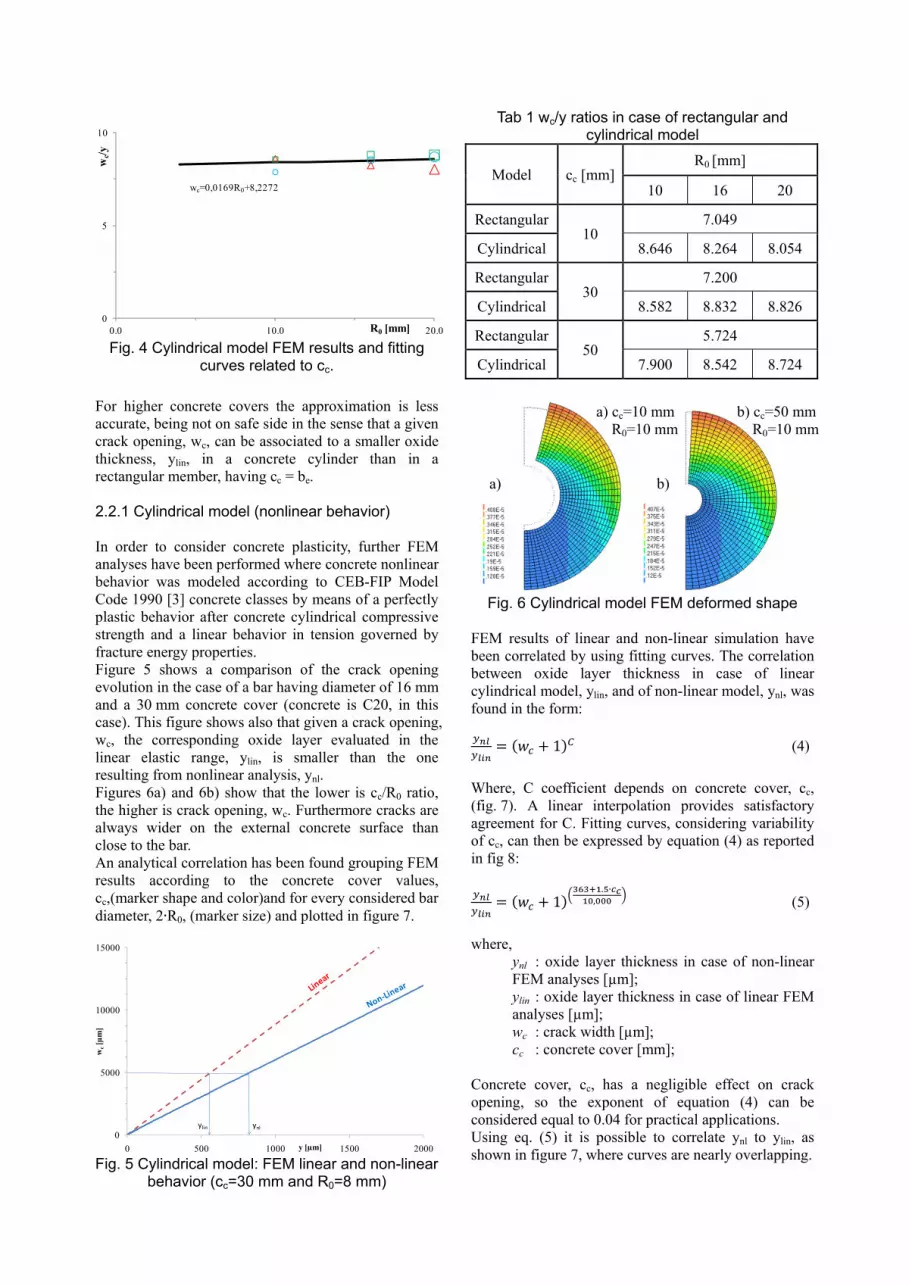
Fig. 4 Cylindrical model FEM results and fitting
curves related to cc.
Tab 1 wc/y ratios in case of rectangular and cylindrical model
Model cc [mm]R0 [mm]
10 16 20
Rectangular 10
7.049
Cylindrical 8.646 8.264 8.054
Rectangular 30
7.200
Cylindrical 8.582 8.832 8.826
Rectangular 50
5.724
Cylindrical 7.900 8.542 8.724
For higher concrete covers the approximation is less accurate, being not on safe side in the sense that a given crack opening, wc, can be associated to a smaller oxide thickness, ylin, in a concrete cylinder than in a rectangular member, having cc = be. 2.2.1 Cylindrical model (nonlinear behavior) In order to consider concrete plasticity, further FEM analyses have been performed where concrete nonlinear behavior was modeled according to CEB-FIP Model Code 1990 [3] concrete classes by means of a perfectly plastic behavior after concrete cylindrical compressive strength and a linear behavior in tension governed by fracture energy properties. Figure 5 shows a comparison of the crack opening evolution in the case of a bar having diameter of 16 mm and a 30 mm concrete cover (concrete is C20, in this case). This figure shows also that given a crack opening, wc, the corresponding oxide layer evaluated in the linear elastic range, ylin, is smaller than the one resulting from nonlinear analysis, ynl. Figures 6a) and 6b) show that the lower is cc/R0 ratio, the higher is crack opening, wc. Furthermore cracks are always wider on the external concrete surface than close to the bar. An analytical correlation has been found grouping FEM results according to the concrete cover values, cc,(marker shape and color)and for every considered bar diameter, 2∙R0, (marker size) and plotted in figure 7.
Fig. 5 Cylindrical model: FEM linear and non-linear
behavior (cc=30 mm and R0=8 mm)
Fig. 6 Cylindrical model FEM deformed shape
FEM results of linear and non-linear simulation have been correlated by using fitting curves. The correlation between oxide layer thickness in case of linear cylindrical model, ylin, and of non-linear model, ynl, was found in the form: = ( + 1) (4)
Where, C coefficient depends on concrete cover, cc, (fig. 7). A linear interpolation provides satisfactory agreement for C. Fitting curves, considering variability of cc, can then be expressed by equation (4) as reported in fig 8: = ( + 1) . ∙, (5)
where, ynl : oxide layer thickness in case of non-linear
FEM analyses [µm]; ylin : oxide layer thickness in case of linear FEM
analyses [µm]; wc : crack width [µm]; cc : concrete cover [mm]; Concrete cover, cc, has a negligible effect on crack opening, so the exponent of equation (4) can be considered equal to 0.04 for practical applications. Using eq. (5) it is possible to correlate ynl to ylin, as shown in figure 7, where curves are nearly overlapping.
0
5
10
0.0 10.0 20.0
wc/y
R0 [mm]
wc=0,0169R0+8,2272
0
5000
10000
15000
0 500 1000 1500 2000
wc[µ
m]
y [µm]
ylin ynl
a) cc=10 mm R0=10 mm
b) cc=50 mm R0=10 mm
a) b)

Fig. 7 FEM Non-linear cylindrical model: a) ylin / ynl as a function of wc; b) fitting curve related to cc
Fig. 8 Cylindrical model. FEM results in case of a)
cc=10 mm, b) cc=30 mm and c) cc=50 mm. Figures 8 show the increasing factor, ynl/ylin, due to nonlinear concrete behavior in curves plotted grouped according to cc. It can be easily noticed that this factor is almost independent on bar diameter, however highest deviation is found when ratio cc/R0 is lower than one, thus representing cases where relative cover is very thin. From a practical point of view the factor, ynl/ylin, can be on safe side assumed equal to 1.5.
3. CORROSION PENETRATION AND OXIDE EXPANSION
Previous models gave a correlation between wc/y ratio and be (with be=cc) and between wc and ylin or ynl depending on concrete cover, cc, and neglecting bar radius, R0. In reality, corrosion penetration, x, more than bar expansion (due to oxide production), is of interest, e.g. to evaluate residual strength capacity of internal reinforcement, to correlate corrosion rate with penetration and thus to estimate corrosion initiation or future corrosion evolution with time. Strength capacity, for instance, is related to cross section of bars. Presented models give the wc value related to oxide layer thickness, ylin or ynl, however it is still possible to relate ylin or ynl, or more generally y to corrosion penetration, x, (fig. 9a) by means of volumetric expansion coefficient of oxide, n, generated by corrosion process. Such coefficient usually ranges between 2 and 6 [4]. A simple continuity equation [5], allows to correlate x and y: π ∙ (R + y) − (R − x) = n ∙ π ∙ R −(R − x) (6) where, R0 : bar radius [mm]; y : oxide layer thickness [mm]; x : corrosion penetration [mm]; n : volumetric expansion factor of oxide; hence to evaluate directly y values: y = (1 − n) ∙ (R − x) + n ∙ R − R (7) Equation (6) represents the continuity equation where the volume of produced oxide π·[(R0+y)2-(R0-x)2] is equal to n times the volume of bar consumed π·[R0
2-(R0-x)2]. A further simplification is given by normalization of y and x with respect to R0, in fact equation (7) becomes: = (1 − n) ∙ 1 − + n − 1 (8)
0.00
0.25
0.50
0.75
1.00
1.25
1.50
0 5,000 10,000 15,000
y nl/y
lin[-]
wc [µm]
eq. (5) cc=10 mmeq. (5) cc=30 mmeq. (5) cc=50 mm
.000
.025
.050
0 30 60
Coe
ffici
ent C
cc [mm]
C= (363+1.5cc )/10,000
b)
-
0.80
1.60
0 7,500 15,000
y nl/y
lin
wc [µm]
a)
cc=10 mm
R0=8 mm
R0=5 mm
R0=10 mm
-
0.80
1.60
0 7,500 15,000
y nl/y
lin
wc [µm]
b)
cc=30 mm
R0=8 mm
R0=5 mm
R0=10 mm
-
0.80
1.60
0 7,500 15,000
y nl/y
lin
wc [µm]
cc=50 mm
c)
R0=10 mm
R0=8 mm
R0=5 mm

Fig. 9 a) Geometric scheme of oxide expansion; b) y/R0 vs. x/R0 and fitting curve.
Fig. 10 Design chart: external bar - wc/y ratio or wc/x (y/x simplified n=2.5) vs. be
Typical values of x/R0 are usually lower than 0.2 (this means a corrosion penetration of about 2 mm in radial direction on a bar having R0=10 mm, or in other words a heavy reduction of cross section of about 35%). The curve given by equation (8) can be easily approximated by a linear equation, thus by a simple y=F·x relationship. This approximation simplifies the correlation of x with wc. In figure 9b) variability of volumetric expansion coefficient of oxide, n, is considered. It is observed that the higher is n, the greater is oxide expansion, y/R0, ratio for a given corrosion penetration, x/R0, ratio. A simplified linear relation between x and y, according to fitting curves reported in figure 9b) is given by equation (9), neglecting dependency on R0: ≅ (0.95 ∙ n − 1) ∙ x ≅ ( . ∙ ) (9)
4. DESIGN CHARTS Design charts can be easily provided for external bars in RC members – i.e. equations (2) - to correlate crack opening on concrete surface and oxide expansion. The dependency is limited only to concrete cover, cc, and
crack distance from cross section corner, be. Figure 10 shows wc/y ratio vs. be, considering variability of cc and linear elasticity [6]. The wc/y ratio seems to be less dependent on concrete cover, cc. Design chart is based on two parameters, concrete cover, cc, and crack distance, be almost easily assessable. Even if simplified equation (9) suggests that, given a volumetric expansion factor of oxide, n, there is no strict dependency on bar radius, R0.
Fig. 11 Direct evaluation wc vs. x in case of external bar (refined model and be=50 mm).
y y2R0
x x
y = 0.95x - 1
0.5
5.0
2 3 4 5 6
Coe
ffic
ient
F
n
y/R0n=2 = 0.900x/R0y/R0n=2,5 = 1.375x/R0
y/R0n=3 = 1.850x/R0
y/R0n=4= 2.800x/R0
y/R0n=5 = 3.750x/R0y/R0n=6= 4.700x/R0
0.00
0.16
0.0 0.1 0.2
y/R
0
x/R0
0.00
1.00
2.00
3.00
4.00
5.00
6.00
7.00
8.00
9.00
0.00
1.00
2.00
3.00
4.00
5.00
6.00
7.00
0 50 100 150
wc/x
Sim
plifi
ed M
odel
(n=2
.5)
wc/y
R
efin
ed M
odel
be [mm]
0,00
0,25
0,50
0,75
1,00
0,00 0,05 0,10 0,15
wc[m
m]
x [mm]
cc=30 mm cc=50 mm
cc=10 mm
n=2.5

Refined equation (7), accounting for R0, shows that knowledge of bar radius is less relevant than knowledge of concrete cover and crack distance be. In fact figure 11 shows directly the relation between wc and x, by means of refined models (equations (2) to evaluate wc/y, equation (5) to account for nonlinearity and equation (6) to evaluate x). In this evaluation a low value for n is assumed, e.g. n=2.5, on safe side (because it leads to higher corrosion penetrations). This plot confirms that dependency on R0 is almost negligible. It is an important outcome, in fact, bar radius is not easily assessable without removing concrete cover. 4.1. Illustrative example Given, for instance, a crack on the external side of a RC column or beam, spacing about be=cc=50 mm, (but the same can be repeated for other concrete covers, e.g. 10 mm and 30 mm, respectively), a value of wc/y ratio is found on Design Chart, figure 10, or in the same way from equation (2), equal to 5.72 (7.20 or 7.05 for other covers, respectively). Then the estimation of internal bar radius allows to move from oxide expansion, y, to corrosion penetration, x. Figure 12 shows the correlation between crack opening, wc, and oxide layer thickness including nonlinearity of concrete, ynl, and between ynl and corrosion penetration, x. Given a crack opening, wc=0.500 mm, considering cc=30 mm and n=2.5, ynl is about 0.072 mm and finally, considering R0=8, corrosion penetration, x, is about 0.049 mm.
Fig 12 Illustrative example, rectangular model: wc-x
in the case of n=2.5 (Eqs. 5+6). The same example is repeated in table 2, considering wc=0.300 mm and every considered concrete cover, cc, and bar radius, R0. Results about ylin and yrett, are shown, too. The table reports directly the prediction of corrosion penetration, x, according to different methods, namely
FEM simulation of nonlinear cylinder based on refined equation (6) to evaluate x. This analysis is assumed as reference, and then other linear and nonlinear models are evaluated. In particular there are two linear analyses on cylinders based, the former on FEM results for wc/y and then on refined equation (6) to evaluate x, the latter is based on simplified wc/y=8.84, equation (3) and approximate evaluation of x based on equation (9). Similarly the nonlinearity in the cylindrical model is inserted based on simplified evaluation of equation (3), but in the first case the refined equations (5) and (6) lead to evaluations of x, while in the second case two proposed approximate equations are adopted, the equation (5) assuming directly the power equal to 0.04 (so called 5*), and equation (9). A further comparison is also performed considering the same bar but supposed as corner bar in a rectangular RC member, having be=cc) . In both cases refined equation (2) is coupled in nonlinear field with the equations (5) and (6) in a first case to have a refined evaluation of x and equations (5*) and (9) to provide a more direct, but more approximate evaluation of x. Table 2 reports also, as subscript, the percentage variation with respect to FEM reference results. It is clear that proposed models for nonlinear concrete cylinders match very well the FEM nonlinear results and in general equation (9) leads to less sharp results than equation (7). If a linear approach is used, effective corrosion is usually underestimated of about 20%. A different conclusion can be drawn in the case of rectangular models considering a corner bar: in general the equivalent cylinder is representative of the real case for small concrete covers. In any case refined model leads to closer results, even if approximate model in this case is on safe side, but the average scatter is about 40%. However even a maximum scatter not always negligible, in authors’ opinion, is fully reasonable if compared to uncertainties in the measurement of crack opening and the development of corrosion process. For instance a refined measure on a high definition 25X enlargement of crack opening, as in the case depicted in figure 13, is out of the ordinary during onsite assessment, being field precision in the order of tenth or, at best, hundredth of millimeter.
Fig 13 Refined assessment of crack opening, 25X
high definition photo enlargement
0,000
0,075
0,150
x [m
m]
0,000
0,500
1,000
0,000 0,075 0,150
wc [
mm
]
ynl [mm]

5. CONCLUSIONS Analytical correlations between crack opening, as it can be measured on concrete surface of degraded RC structural members, and corrosion penetration on internal reinforcement bars are discussed. Different sets of equations are provided: simple ones, for fast onsite estimations, and refined ones for accurate assessments. Most common RC member configurations were covered including a wide range of geometrical parameters. The development of the equations takes into account the influence of uncertainty on input parameters which are difficult to assess onsite: namely bar diameter is the most difficult to evaluate, but its influence is practically negligible. Than the influence of concrete cover is analyzed; its thickness is still not always easily available onsite. The analysis covers not only onsite assessment, but also design phase and possible experimental activity, specific for corrosion
evaluation. To this aim, the comparison is also performed trying to evaluate how single bar cylinders are able to reproduce the behavior of real corner bars in rectangular RC members. Numerical comparisons showed that for relatively small covers, namely less than about 30 mm, the cylinders can be satisfactorily used, while for higher covers, the cylinders tend to provide less accurate and unsafe results. Simplified equations for onsite practical assessment, for the cases analyzed, provided the highest scatters, but still compatible with the scope of a quick evaluation. Conversely refined equations, to be used in initial design or corrosion monitoring phases, especially including nonlinearity of concrete, were able to provide satisfactory results. A maximum scatter, lower than about 18%, was found, nevertheless it is considered reasonable because of ordinary uncertainties in crack opening evolution and corrosion process, in general.
Table 2 Corrosion penetration x (in µm) according to different models (n=2.5; be=cc and wc=300 µm)
cc [mm] 10 30 50
R0 [mm] 5 8 10 5 8 10 5 8 10
Rectangular
Model
(nonlinear)
eqs (2)+(5)+(6) 28.6
-1.0%
28.5
-5.6%
28.5
-8.4%
28.0
-5.4%
27.9
-3.1%
27.9
-3.1%
35.2
7.6%
35.2
16.6%
35.1
18.2%
eqs
(2)+(5*)+(9)
38.9
34.6%
38.9
28.8%
38.9
25.1%
38.1
28.7%
38.1
32.3%
38.1
32.3%
47.9
46.5%
47.9
58.6%
47.9
61.3%
Linear
cylindrical
model
FEM+eq (6) 23.3
-19.4%
24.2
-19.9%
25.0
-19.6%
23.4
-20.9%
22.7
-21.2%
22.7
-21.2%
25.4
-22.3%
23.5
-22.2%
23.0
-22.6%
eqs (3)+(9) 24.7
-14.5%
24.7
-18.2%
24.7
-20.6%
24.7
-16.6%
24.7
-14.2%
24.7
-14.2%
24.7
-24.5%
24.7
-28.2%
24.7
-16.8%
Nonlinear
cylindrical
model
FEM+eq (6) 28.9 30.2 31.1 29.6 28.8 28.8 32.7 30.2 29.7
eqs (3)+(5)+(6) 28.3
-2.1%
28.3
-6.3%
28.3
-9.0%
28.8
-2.7%
28.8
0.0%
28.8
0.0%
29.3
-10.4%
29.3
-3.0%
29.3
-1.3%
Eqs
(3)+(5*)+(9)
31.2
8.0%
31.2
3.3%
31.2
0.3%
31.2
5.4%
31.2
8.3%
31.2
8.3%
31.2
-4.6%
31.2
3.3%
31.2
5.1%
* ((363+1.5cc)/10,000)=0.04
REFERENCES 1. Zhao Y., Yu J., Hu B. & Jin W. “Crack shape and
rust distribution in corrosion-induced cracking concrete”, Corrosion science 55, Elsevier, 2012, pp 385-393.
2. Manie J. & Kikstra W.P. “DIANA 9.4.4 User’s Manual”, TNO DIANA BV. 2012.
3. CEB-FIP “Model Code. Design Code”. 1990. Comité Euro-Internationale du Béton, Lausanne, Switzerland, Thomas Telford
4. Pedeferri P. & Bertolini L. “La durabilità del calcestruzzo armato” McGraw-Hill, 2000. Milano, Italy (in italian).
5. Bossio A., Montuori M., Bellucci F., Lignola G.P.
Prota A., Cosenza E. & Manfredi G. “Analytical modeling of reinforcement corrosion effects on RC members degradation”, Imready, 2011, pp 205-213 Ancona, Italy, 2nd Workshop The new boundaries of structural concrete.
6. Bossio A., Montuori M., Bellucci F., Lignola G.P. Prota A., Cosenza E. & Manfredi G. “Indirect measure of corrosion level based on crack opening”, in press, 2012, Wroclaw, Poland, 8th International Conference of Structural Analysis of Historical Construction.


